As filed with the SEC on January 9, 2006.
UNITED STATES
SECURITIES AND EXCHANGE COMMISSION
Washington, D.C. 20549
FORM N-CSR
CERTIFIED SHAREHOLDER REPORT OF REGISTERED
MANAGEMENT INVESTMENT COMPANIES
Investment Company Act file number | 811-4556 |
|
TRANSAMERICA IDEX MUTUAL FUNDS |
(Exact name of registrant as specified in charter) |
|
570 Carillon Parkway, St. Petersburg, Florida | | 33716 |
(Address of principal executive offices) | | (Zip code) |
|
John K. Carter, Esq. P.O. Box 9012, Clearwater, Florida 33758-9771 |
(Name and address of agent for service) |
|
Registrant’s telephone number, including area code: | (727) 299-1800 | |
|
Date of fiscal year end: | October 31 | |
|
Date of reporting period: | November 1, 2004 - October 31, 2005 | |
| | | | | | | | | |
Form N-CSR is to be used by management investment companies to file reports with the Commission not later than 10 days after the transmission to stockholders of any report that is required to be transmitted to stockholders under Rule 30e-1 under the Investment Company Act of 1940 (17 CFR 270.30e-1). The Commission may use the information provided on Form N-CSR in its regulatory, disclosure review, inspection, and policymaking roles.
A registrant is required to disclose the information specified by Form N-CSR, and the Commission will make this information public. A registrant is not required to respond to the collection of information contained in Form N-CSR unless the Form displays a currently valid Office of Management and Budget (“OMB”) control number. Please direct comments concerning the accuracy of the information collection burden estimate and any suggestions for reducing the burden to Secretary, Securities and Exchange Commission, 450 Fifth Street, NW, Washington, DC 20549-0609. The OMB has reviewed this collection of information under the clearance requirements of 44 U.S.C. §3507.
Item 1: Report(s) to Shareholders.

Annual Report
October 31, 2005
www.transamericaidex.com
Investor Services 1-888-233-IDEX (4339)
P.O. Box 9012 • Clearwater, FL 33758-9012
Distributor: AFSG Securities Corporation, Member NASD
Dear Shareholder,
On behalf of Transamerica IDEX Mutual Funds, I would like to thank you for your continued support and confidence in our products as we look forward to continuing to serve you and your financial advisor in the future. We value the trust you have placed in us.
This annual report is provided to you with the intent of presenting a comprehensive review of the investments of each of your funds. The Securities and Exchange Commission requires that an annual report be sent to all shareholders, and we believe it to be an important part of the investment process. In addition to providing a comprehensive review, this report also provides a summary of significant accounting policies followed by the Fund in the preparation of the financial statements, and includes matters presented to shareholders that may have required their vote.
We believe it is important to recognize and understand current market conditions in order to provide a context for reading the contents of this report. During the past six months, the market environment has been closely tied to investor expectations of inflation and oil prices. Hurricanes Katrina and Rita have exerted additional pressure on oil prices, increased concern over consumer spending patterns, and have lowered expectations for Gross Domestic Product (GDP) growth in the near term. The Federal Reserve has continued to raise interest rates, which has raised investor fears of a slowdown in the economy. While economic growth continues to remain positive, creating investment opportunities, given this economic backdrop it is prudent to maintain a diversified portfolio and avoid speculation as investment returns have been historically difficult to predict.
In addition to your active involvement in the investment process, we firmly believe that a financial professional is the key resource to help you build a comprehensive picture of your current and future financial needs. In addition, financial advisors are familiar with the market's history, including long-term returns and volatility of various asset classes.
With your financial advisor, you can develop an investment program that incorporates factors such as your goals, your investment timeline, and your risk tolerance.
Please contact your financial advisor if you have any questions about the contents of this report, and thanks again for the confidence you have placed in us.
Sincerely,
Brian C. Scott
President
Transamerica IDEX Mutual Funds | | Christopher Staples
Vice President – Investment Management
Transamerica IDEX Mutual Funds | |
|
The views expressed in this report reflect those of the portfolio managers only and may not necessarily represent the views of Transamerica IDEX Mutual Funds. These views are subject to change based upon market conditions. These views should not be relied on as investment advice and are not indicative of a trading intent on behalf of the Transamerica IDEX Mutual Funds.
TA IDEX American Century International
MARKET ENVIRONMENT
Many of the world's equity markets advanced during the twelve months ended October 31, 2005, demonstrating their resilience in the face of: surging prices for commodities, especially oil; a terrorist attack in London; destructive hurricanes; and numerous interest-rate increases by the Federal Reserve Board ("Fed").
Against this backdrop, the portfolio advanced but underperformed its benchmark, the Morgan Stanley Capital International EAFE Index ("MSCI-EAFE"). Each of the ten sectors in which we were invested advanced, with our complement of financial holdings, the portfolio's heaviest sector stake, posting the largest contribution to absolute return.
On a relative basis, the portfolio's consumer discretionary and telecommunication services sectors contributed most. But several sectors, notably materials and consumer staples, underperformed the MSCI-EAFE, ultimately causing the portfolio to lag the benchmark.
PERFORMANCE
For the year ended October 31, 2005, TA IDEX American Century International, Class A returned 15.17%. By comparison its benchmark, the MSCI-EAFE returned 18.59%.
STRATEGY REVIEW
Financials contributed most to absolute return. The portfolio's position in commercial banks led the gains. Anglo Irish Bank Company plc made one of the period's largest contributions to total return. The bank reported record growth in lending during the period, partly due to strong loan demand in Ireland. Financials, however, lagged the MSCI-EAFE, due mostly to companies in the capital markets industry.
Our complement of holdings in the industrials sector made the second-largest contribution to absolute return. Companies in construction and engineering led the advance. Pacing the gains were Spain's Grupo Ferrovial S.A. ("Grupo"), one of Spain's largest construction companies, and Vinci SA ("Vinci"), a French construction company. Vinci benefited from concessions that manage parking lots, toll-road operations, and numerous construction projects in France and elsewhere. The industrials sector also made the period's third-largest relative contribution, outperforming the MSCI-EAFE partly on the strength of our overweight positions in Grupo and Vinci. Grupo was among the securities contributing most to absolute and relative performance during the period.
The portfolio's holdings in the consumer discretionary sector delivered the best performance against the MSCI-EAFE, due mostly to effective security selection among specialty retail companies. The portfolio's overweight position in electronics retailer Yamada Denki, Co., Ltd. ("Yamada") led the advance in the specialty retail industry. Japan's Yamada, which benefited from strong sales of thin-panel televisions, contributed more than any other security to relative performance, and also contributed most to absolute return. Our position in the household durables industry also beat the benchmark, partly due to lack of exposure to several Japanese electronics makers that detracted from the MSCI-EAFE.
The consumer discretionary sector, however, also included the position that detracted more than any other security from the portfolio's relative and absolute performance – Next PLC ("Next"). One of the largest clothing retailers in the United Kingdom ("U.K."), Next declined partly because of a slump in consumer spending in the U.K.
Our position in the telecommunications services sector made the second largest contribution to relative performance, mostly due to effective security selection in the wireless telecommunication services industry. We benefited from a portfolio-only position in America Movil, S.A. de C.V. ("America Movil"), Latin America's biggest mobile-phone company. America Movil topped the list of contributors in the wireless industry, and was also among the ten securities contributing most to performance against the MSCI-EAFE.
The materials sector detracted most from the portfolio's relative performance. Holdings in the construction materials industry did much of the damage, with France's Lafarge S.A. ("Lafarge"), one of the world's biggest cement makers, declining after reporting a drop in North American demand and a slowdown in German construction. The containers and packaging industry also declined. Australian packing company Amcor Limited ("Amcor") retreated after announcing that rising materials costs were cutting into profits. Both Lafarge and Amcor were among the securities that detracted most from our performance against the MSCI-EAFE during the period.
The portfolio's consumer staples holdings also detracted from relative performance. Overweight positions in the food staples and retailing, food products and household products industries all lagged the benchmark.
Regarding countries, investments in France, Ireland and Mexico made the largest contribution relative to the MSCI-EAFE, while those in the United Kingdom, Japan and Germany detracted most.
Keith Creveling, CFA
Michael Perelstein
Co-Fund Managers
American Century Global Investment Management, Inc.
Transamerica IDEX Mutual Funds
Annual Report 2005
1
TA IDEX American Century International
Comparison of change in value of $10,000 investment in Class A shares and its comparative index.

Average Annual Total Return for Periods Ended 10/31/05
| | | 1 year | | 5 years | | From
Inception | | Inception
Date | |
| Class A (NAV) | | | 15.17 | % | | | (2.25 | )% | | | 1.97 | % | | 2/1/97 | |
| Class A (POP) | | | 8.84 | % | | | (3.35 | )% | | | 1.31 | % | | 2/1/97 | |
| MSCI-EAFE1 | | | 18.59 | % | | | 3.42 | % | | | 5.92 | % | | 2/1/97 | |
| Class B (NAV) | | | 14.41 | % | | | (2.88 | )% | | | 1.32 | % | | 2/1/97 | |
| Class B (POP) | | | 9.41 | % | | | (3.06 | )% | | | 1.32 | % | | 2/1/97 | |
| Class C (NAV) | | | 14.36 | % | | | – | | | | 12.78 | % | | 11/11/02 | |
| Class C (POP) | | | 13.36 | % | | | – | | | | 12.78 | % | | 11/11/02 | |
NOTES
1 The Morgan Stanley Capital International-Europe, Australasia, and Far East (MSCI-EAFE) Index is a widely recognized unmanaged index used as a general measure of market performance. Calculations assume dividends and capital gains are reinvested and do not include any managerial expenses. From inception calculation is based on life of Class A shares. Source: Standard & Poor's Micropal®© Micropal, Inc. 2005 – 1-800-596-5323 – http://www.funds-sp.com.
The performance data presented represents past performance, future results may vary. Performance data does not reflect the deduction of taxes that would be paid on fund distributions or the redemption of fund shares. Investment return and principal value will fluctuate so that an investor's shares, when redeemed, may be worth more or less than their original cost. Current performance may be lower or higher than performance quoted. Please see www.transamericaidex.com for performance data current to the most recent month-end.
Public Offering Price (POP) returns include the reinvestment of dividends and capital gains and reflect the maximum sales charge of 5.5% for A shares or the maximum applicable contingent deferred sales charge (5% in the 1st year, decreasing to 0% after 6 years) for Class B shares and 1% (during the first 12 months) for Class C shares. Shares purchased prior to March 1, 2004 are subject to a maximum applicable contingent deferred sales charge (5% in the 1st year, decreasing to 0% after 7 years) for Class B shares and (2% in the 1st year, decreasing to 0% after 2 years) for Class C shares. Net Asset Value (NAV) returns include the reinvestment of dividends and capital gains but do not reflect any sales charges.
International investing involves special risks including currency fluctuations, political instability, and different financial accounting standards.
This material must be preceded or accompanied by a current prospectus, which includes specific contents regarding the investment objectives and policies of this fund.
Transamerica IDEX Mutual Funds
Annual Report 2005
2
TA IDEX American Century International
UNDERSTANDING YOUR FUND'S EXPENSES
(unaudited)
SHAREHOLDER EXPENSES
Fund shareholders may incur two types of costs: (1) transaction costs, including sales charges (loads) on purchases, contingent deferred sales charges on redemptions and redemption fees; and (2) ongoing costs, including management fees, 12b-1 distribution and service fees, and other fund expenses.
The following Example is intended to help you understand your ongoing costs (in dollars and cents) of investing in a Fund and to compare these costs with the ongoing costs of investing in other funds.
The Example is based on an investment of $1,000 invested at May 1, 2005 and held for the entire period until October 31, 2005.
ACTUAL EXPENSES
The first line in the table below provides information about actual account values and actual expenses. You may use the information in this line, together with the amount you invested, to estimate the expenses that you paid over the period. Simply divide your account value by $1,000 (for example, an $8,600 account value divided by $1,000 = 8.6), then multiply the result by the number in the first line of your Fund under the heading entitled "Expenses Paid During Period" to estimate the expenses you paid on your account during this period. If your account is an IRA, your expenses could have included a $15 annual fee. The amount of any fee paid through your account would increase the estimate of expenses you paid during the period and decrease your ending account value.
HYPOTHETICAL EXAMPLE FOR COMPARISON PURPOSES
The second line in the table below provides information about hypothetical account values and hypothetical expenses based on the Fund's actual expense ratio and an assumed rate of return of 5% per year before expenses, which is not the Fund's actual return. The hypothetical account values and expenses may not be used to estimate the actual ending account balance or expenses you paid for the period. You may use this information to compare the ongoing costs of investing in your Fund and other funds. To do so, compare this 5% hypothetical example with the 5% hypothetical examples that appear in the shareholder reports of the other funds. As in the case of the actual expense example, if your account is subject to an IRA fee, the amount of the fee paid through your account would increase the hypothetical expenses you would have paid during the period and decrease the hypothetical ending account value.
Please note that the expenses shown in the table are meant to highlight your ongoing costs only and do not reflect any transactional costs, such as sales charges, redemption fees, brokerage commissions paid on purchases and sales of fund shares. Therefore, the second line under the Fund in the table is useful in comparing ongoing costs only, and will not help you determine the relative total costs of owning different funds. If any of these transaction costs were included, your costs would be higher. The expenses shown in the table do not reflect any fees that may be charged to you by brokers, financial intermediaries or other financial institutions.
| | | Beginning
Account
Value | | Ending
Account
Value | | Annualized
Expense
Ratio | | Expenses Paid
During Period (a) | |
| Class A | |
| Actual | | $ | 1,000.00 | | | $ | 1,074.90 | | | | 1.78 | % | | $ | 9.31 | | |
| Hypothetical (b) | | | 1,000.00 | | | | 1,016.23 | | | | 1.78 | | | | 9.05 | | |
| Class B | |
| Actual | | | 1,000.00 | | | | 1,071.30 | | | | 2.33 | | | | 12.16 | | |
| Hypothetical (b) | | | 1,000.00 | | | | 1,013.46 | | | | 2.33 | | | | 11.82 | | |
| Class C | |
| Actual | | | 1,000.00 | | | | 1,071.90 | | | | 2.33 | | | | 12.17 | | |
| Hypothetical (b) | | | 1,000.00 | | | | 1,013.46 | | | | 2.33 | | | | 11.82 | | |
(a) Expenses are calculated using each Fund's annualized expense ratio (as disclosed in the table), multiplied by the average account value for the period, multiplied by number of days in the period (184 days), and divided by the number of days in the year (365 days).
(b) 5% return per year before expenses.
GRAPHICAL PRESENTATION OF SCHEDULE OF INVESTMENTS
By Region
At October 31, 2005
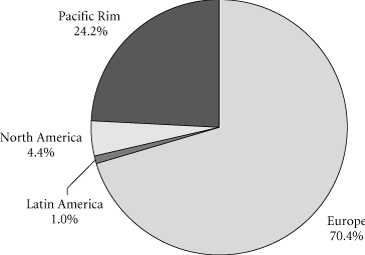
This chart shows the percentage breakdown by region of the Fund's total investment securities.
Transamerica IDEX Mutual Funds
Annual Report 2005
3
TA IDEX American Century International
SCHEDULE OF INVESTMENTS
At October 31, 2005
(all amounts except share amounts in thousands)
| | | Shares | | Value | |
| COMMON STOCKS (98.6%) | |
| Australia (3.3%) | |
| BHP Billiton, Ltd. | | | 99,704 | | | $ | 1,547 | | |
| Macquarie Infrastructure Group (a) | | | 247,740 | | | | 635 | | |
| National Australia Bank, Ltd. | | | 41,110 | | | | 1,014 | | |
| Austria (1.1%) | |
Erste Bank der Oesterreichischen
Sparkassen AG | | | 20,492 | | | | 1,066 | | |
| Belgium (1.2%) | |
| KBC Groupe (a) | | | 14,810 | | | | 1,207 | | |
| Canada (1.4%) | |
| Canadian Pacific Railway, Ltd. | | | 6,380 | | | | 262 | | |
| Shoppers Drug Mart Corp. | | | 9,870 | | | | 329 | | |
| Thomson Corp. (The) | | | 23,480 | | | | 798 | | |
| China (0.6%) | |
| China Construction Bank–Class H ‡ | | | 1,814,427 | | | | 550 | | |
| Denmark (0.5%) | |
| Novo Nordisk A/S–Class B | | | 9,740 | | | | 499 | | |
| Finland (0.2%) | |
| Nokia OYJ | | | 10,620 | | | | 177 | | |
| France (15.5%) | |
| Accor SA | | | 19,260 | | | | 962 | | |
| AXA | | | 57,908 | | | | 1,677 | | |
Cie Generale D'Optique Essilor
International SA | | | 10,110 | | | | 833 | | |
| France Telecom SA | | | 40,560 | | | | 1,054 | | |
| Lafarge SA | | | 5,800 | | | | 477 | | |
| Pernod-Ricard | | | 3,020 | | | | 528 | | |
| PPR SA | | | 8,950 | | | | 940 | | |
| Sanofi-Aventis † | | | 12,630 | | | | 1,011 | | |
| Schneider Electric SA | | | 8,930 | | | | 734 | | |
| Societe Generale–Class A | | | 12,817 | | | | 1,463 | | |
| Total SA | | | 11,020 | | | | 2,766 | | |
| Veolia Environnement | | | 15,040 | | | | 626 | | |
| Vinci SA | | | 13,726 | | | | 1,073 | | |
| Vivendi Universal SA | | | 31,780 | | | | 1,001 | | |
| Germany (4.8%) | |
| Adidas-Salomon AG | | | 2,130 | | | | 357 | | |
| BASF AG | | | 13,500 | | | | 973 | | |
| Continental AG | | | 14,110 | | | | 1,079 | | |
| Deutsche Telekom AG | | | 10,690 | | | | 189 | | |
| E.ON AG | | | 8,740 | | | | 792 | | |
| Fresenius Medical Care AG † | | | 10,708 | | | | 963 | | |
| Metro AG | | | 6,940 | | | | 316 | | |
| | | Shares | | Value | |
| Greece (3.3%) | |
Hellenic Telecommunications
Organization SA ‡ | | | 44,120 | | | $ | 911 | | |
| National Bank of Greece SA | | | 37,980 | | | | 1,481 | | |
| OPAP SA | | | 29,414 | | | | 848 | | |
| Ireland (2.7%) | |
| Anglo Irish Bank Corp. PLC | | | 56,100 | | | | 761 | | |
| Bank of Ireland | | | 55,710 | | | | 849 | | |
| Ryanair Holdings PLC, ADR ‡† | | | 20,010 | | | | 992 | | |
| Italy (2.6%) | |
| Banco Popolare di Verona e Novara Scrl | | | 56,340 | | | | 1,040 | | |
| ENI-Ente Nazionale Idrocarburi SpA | | | 33,860 | | | | 907 | | |
| Saipem SpA | | | 39,180 | | | | 560 | | |
| Japan (20.5%) | |
| Advantest Corp. † | | | 6,200 | | | | 445 | | |
| Astellas Pharma, Inc. | | | 29,100 | | | | 1,038 | | |
| Bank of Yokohama, Ltd. (The) | | | 74,000 | | | | 600 | | |
| Daikin Industries, Ltd. | | | 34,400 | | | | 893 | | |
| East Japan Railway Co. | | | 200 | | | | 1,186 | | |
| Eisai Co., Ltd. | | | 22,000 | | | | 858 | | |
| Fuji Photo Film Co., Ltd. | | | 5,900 | | | | 186 | | |
| Honda Motor Co., Ltd. | | | 19,300 | | | | 1,052 | | |
| Hoya Corp. | | | 15,856 | | | | 550 | | |
| KDDI Corp. | | | 170 | | | | 970 | | |
| Keyence Corp. | | | 2,100 | | | | 481 | | |
| Komatsu, Ltd. | | | 38,000 | | | | 502 | | |
| Matsushita Electric Industrial Co., Ltd. | | | 72,000 | | | | 1,309 | | |
| Mitsubishi Tokyo Financial Group, Inc. | | | 80 | | | | 997 | | |
| Murata Manufacturing Co., Ltd. | | | 20,200 | | | | 1,002 | | |
| NGK Insulators, Ltd. | | | 12,000 | | | | 142 | | |
| Nippon Express Co., Ltd. | | | 18,000 | | | | 98 | | |
| Omron Corp. | | | 4,500 | | | | 106 | | |
| ORIX Corp. (a) | | | 6,300 | | | | 1,173 | | |
| Osaka Gas Co., Ltd. | | | 264,000 | | | | 964 | | |
| Shin-Etsu Chemical Co., Ltd. | | | 20,300 | | | | 967 | | |
| Taisei Corp. | | | 254,000 | | | | 1,120 | | |
| Takefuji Corp. | | | 12,420 | | | | 866 | | |
| Toray Industries, Inc. | | | 134,000 | | | | 742 | | |
| Toshiba Corp. | | | 62,000 | | | | 286 | | |
| Yamada Denki Co., Ltd. | | | 16,600 | | | | 1,451 | | |
| Mexico (1.0%) | |
| America Movil SA de CV–Class L, ADR | | | 26,931 | | | | 707 | | |
| Cemex SA de CV, Sponsored ADR | | | 4,820 | | | | 251 | | |
| Netherlands (2.9%) | |
| ASML Holding NV ‡ | | | 47,090 | | | | 796 | | |
| ING Groep NV | | | 38,544 | | | | 1,111 | | |
| Royal Numico NV ‡† | | | 23,360 | | | | 946 | | |
The notes to the financial statements are an integral part of this report.
Transamerica IDEX Mutual Funds
Annual Report 2005
4
TA IDEX American Century International
SCHEDULE OF INVESTMENTS (continued)
At October 31, 2005
(all amounts except share amounts in thousands)
| | | Shares | | Value | |
| Norway (1.7%) | |
| DnB Nor ASA | | | 43,580 | | | $ | 446 | | |
| Telenor ASA | | | 120,030 | | | | 1,173 | | |
| South Korea (0.5%) | |
| Samsung Electronics Co., Ltd. | | | 900 | | | | 478 | | |
| Spain (3.9%) | |
| Banco Popular Espanol SA | | | 86,930 | | | | 1,055 | | |
Cintra Concesiones de Infraestructuras
de Transporte SA ‡ | | | 47,091 | | | | 558 | | |
| Grupo Ferrovial SA | | | 13,289 | | | | 981 | | |
| Inditex SA | | | 11,320 | | | | 335 | | |
| Telefonica SA | | | 53,753 | | | | 858 | | |
| Switzerland (8.6%) | |
| ABB, Ltd. ‡ | | | 13,120 | | | | 100 | | |
Compagnie Financiere Richemont
AG–Class A | | | 20,300 | | | | 771 | | |
| Credit Suisse Group | | | 13,610 | | | | 601 | | |
| Lonza Group AG | | | 10,730 | | | | 618 | | |
| Nestle SA | | | 4,820 | | | | 1,434 | | |
| Novartis AG | | | 31,290 | | | | 1,681 | | |
| Roche Holding AG-Genusschein | | | 9,417 | | | | 1,405 | | |
| Swiss Life Holding | | | 6,270 | | | | 969 | | |
| UBS AG | | | 9,876 | | | | 838 | | |
| United Kingdom (21.7%) | |
| AstraZeneca PLC | | | 38,710 | | | | 1,736 | | |
| BAA PLC | | | 76,820 | | | | 834 | | |
| BG Group PLC | | | 88,950 | | | | 781 | | |
| BP PLC | | | 243,521 | | | | 2,691 | | |
| British American Tobacco PLC | | | 47,990 | | | | 1,056 | | |
| Diageo PLC | | | 81,900 | | | | 1,211 | | |
| GlaxoSmithKline PLC | | | 96,250 | | | | 2,503 | | |
| Legal & General Group PLC | | | 153,860 | | | | 292 | | |
| Man Group PLC | | | 30,360 | | | | 828 | | |
| National Grid PLC | | | 60,854 | | | | 557 | | |
| Next PLC | | | 19,850 | | | | 469 | | |
| Reckitt Benckiser PLC | | | 31,583 | | | | 955 | | |
| Reed Elsevier PLC | | | 83,830 | | | | 766 | | |
| Royal Bank of Scotland Group PLC | | | 48,908 | | | | 1,354 | | |
| Smith & Nephew PLC | | | 87,765 | | | | 743 | | |
| Tesco PLC | | | 195,190 | | | | 1,039 | | |
| Unilever PLC | | | 128,920 | | | | 1,308 | | |
| Vodafone Group PLC | | | 540,050 | | | | 1,418 | | |
| WPP Group PLC | | | 67,740 | | | | 666 | | |
| United States (0.6%) | |
| iShares MSCI EAFE Index Fund | | | 10,000 | | | | 563 | | |
| Total Common Stocks (cost: $85,921) | | | | | | | 96,113 | | |
| | | Principal | | Value | |
| SECURITY LENDING COLLATERAL (3.6%) | |
| Debt (3.3%) | |
| Bank Notes (0.2%) | |
Bank of America
3.81%, due 06/07/2006 * | | $ | 98 | | | $ | 98 | | |
| 3.81%, due 08/10/2006 * | | | 98 | | | | 98 | | |
Credit Suisse First Boston Corp.
4.11%, due 03/10/2006 * | | | 20 | | | | 20 | | |
| Certificates of Deposit (0.2%) | |
Canadian Imperial Bank of Commerce
4.07%, due 11/04/2005 * | | | 78 | | | | 78 | | |
Harris Trust & Savings Bank
3.80%, due 11/04/2005 * | | | 62 | | | | 62 | | |
Rabobank Nederland
4.03%, due 05/31/2006 * | | | 98 | | | | 98 | | |
| Commercial Paper (0.7%) | |
Ciesco LLC
4.00%, due 11/03/2005 | | | 97 | | | | 97 | | |
General Electric Capital Corp.
3.96%, due 12/05/2005 | | | 78 | | | | 78 | | |
Paradigm Funding LLC–144A
4.01%, due 11/07/2005 | | | 78 | | | | 78 | | |
Park Avenue Receivables Corp.–144A
4.03%, due 12/02/2005 | | | 77 | | | | 77 | | |
Preferred Receivables Corp.–144A
4.04%, due 12/05/2005 | | | 59 | | | | 59 | | |
Ranger Funding Co. LLC–144A
3.99%, due 11/15/2005 | | | 58 | | | | 58 | | |
Sheffield Receivables Corp.–144A
4.01%, due 11/08/2005 | | | 59 | | | | 59 | | |
Yorktown Capital LLC
3.97%, due 11/09/2005
3.93%, due 11/17/2005 | | | 97
97 | | | | 97
97 | | |
| Euro Dollar Overnight (0.8%) | |
Bank of Montreal
3.79%, due 11/01/2005 | | | 59 | | | | 59 | | |
Barclays
3.80%, due 11/04/2005 | | | 78 | | | | 78 | | |
BNP Paribas
3.83%, due 11/02/2005 | | | 117 | | | | 117 | | |
Deutsche Bank
3.80%, due 11/02/2005 | | | 195 | | | | 195 | | |
HSBC Banking/Holdings PLC
3.84%, due 11/07/2005 | | | 59 | | | | 59 | | |
Royal Bank of Scotland
3.76%, due 11/01/2005 | | | 78 | | | | 78 | | |
The notes to the financial statements are an integral part of this report.
Transamerica IDEX Mutual Funds
Annual Report 2005
5
TA IDEX American Century International
SCHEDULE OF INVESTMENTS (continued)
At October 31, 2005
(all amounts except share amounts in thousands)
| | | Principal | | Value | |
| Euro Dollar Overnight (continued) | |
Svenska Handlesbanken
4.03%, due 11/01/2005 | | $ | 100 | | | $ | 100 | | |
UBS AG
3.80%, due 11/03/2005 | | | 78 | | | | 78 | | |
| Euro Dollar Terms (0.3%) | |
Royal Bank of Scotland
4.00%, due 12/12/2005 | | | 78 | | | | 78 | | |
UBS AG
4.02%, due 12/01/2005 | | | 78 | | | | 78 | | |
Wells Fargo
3.96%, due 11/14/2005 | | | 117 | | | | 117 | | |
| Promissory Notes (0.1%) | |
Goldman Sachs Group, Inc.
4.02%, due 12/28/2005 | | | 82 | | | | 82 | | |
| Repurchase Agreements (1.0%) †† | |
Credit Suisse First Boston Corp.
4.10%, dated 10/31/2005 to be repurchased
at $133 on 11/01/2005 | | | 133 | | | | 133 | | |
Goldman Sachs Group, Inc. (The)
4.10%, dated 10/31/2005 to be repurchased
at $332 on 11/01/2005 | | | 332 | | | | 332 | | |
Lehman Brothers, Inc.
4.10%, dated 10/31/2005 to be repurchased
at $9 on 11/01/2005 | | | 9 | | | | 9 | | |
| | | Principal | | Value | |
| Repurchase Agreements (continued) | |
Merrill Lynch & Co. 4.10%, dated
10/31/2005 to be repurchased at $390 on
11/01/2005 | | $ | 390 | | | $ | 390 | | |
Morgan Stanley Dean Witter & Co.
4.17%, dated 10/31/2005 to be repurchased
at $117 on 11/01/2005 | | | 117 | | | | 117 | | |
| | | Shares | | Value | |
| Investment Companies (0.3%) | |
| Money Market Funds (0.3%) | |
American Beacon Fund
| |
| 1-day yield of 3.81% | | | 84,141 | | | $ | 84 | | |
Barclays Global Investors Institutional
Money Market Fund
1-day yield of 3.92% | | | 78,058 | | | | 78 | | |
Goldman Sachs Financial Square Prime
Obligations Fund
1-day yield of 3.79% | | | 12,159 | | | | 12 | | |
Merrimac Cash Fund, Premium Class
| |
| 1-day yield of 3.70% @ | | | 77,195 | | | | 77 | | |
| Total Security Lending Collateral (cost: $3,505) | | | | | | | 3,505 | | |
| Total Investment Securities (cost: $89,426) | | | | | | $ | 99,618 | | |
| SUMMARY: | |
| Investment securities, at value | | | 102.2 | % | | $ | 99,618 | | |
| Liabilities in excess of other assets | | | (2.2 | )% | | | (2,156 | ) | |
| Net assets | | | 100.0 | % | | $ | 97,462 | | |
NOTES TO SCHEDULE OF INVESTMENTS:
‡ Non-income producing.
† At October 31, 2005, all or a portion of this security is on loan (see Note 1). The value at October 31, 2005, of all securities on loan is $3,349.
* Floating or variable rate note. Rate is listed as of October 31, 2005.
†† Cash collateral for the Repurchase Agreements, valued at $1,000, that serve as collateral for securities lending are invested in corporate bonds with interest rates and maturity dates ranging from 0.00%–9.86% and 12/31/2005–11/15/2096, respectively.
@ Regulated investment company advised by Investors Bank and Trust Co. ("IBT"). IBT is also the accounting, custody and lending agent for the Fund.
(a) Passive Foreign Investment Company.
DEFINITIONS:
144A 144A Securities are registered pursuant to Rule 144A of the Securities Act of 1933. These securities are deemed to be liquid for purposes of compliance limitations on holdings of illiquid securities and may be resold as transactions exempt from registration, normally to qualified institutional buyers. At October 31, 2005, these securities aggregated $331 or 0.3% of the net assets of the Fund.
ADR American Depositary Receipt
The notes to the financial statements are an integral part of this report.
Transamerica IDEX Mutual Funds
Annual Report 2005
6
TA IDEX American Century International
SCHEDULE OF INVESTMENTS (continued)
At October 31, 2005
(all amounts except share amounts in thousands)
| | | Percentage of
Net Assets | | Value | |
| INVESTMENTS BY INDUSTRY: | |
| Commercial Banks | | | 15.7 | % | | $ | 15,323 | | |
| Pharmaceuticals | | | 11.0 | % | | | 10,733 | | |
| Telecommunications | | | 7.5 | % | | | 7,279 | | |
| Petroleum Refining | | | 5.6 | % | | | 5,456 | | |
| Life Insurance | | | 3.8 | % | | | 3,757 | | |
| Chemicals & Allied Products | | | 3.6 | % | | | 3,512 | | |
| Food & Kindred Products | | | 2.4 | % | | | 2,380 | | |
| Electronic Components & Accessories | | | 2.4 | % | | | 2,331 | | |
| Oil & Gas Extraction | | | 2.3 | % | | | 2,249 | | |
| Industrial Machinery & Equipment | | | 2.2 | % | | | 2,129 | | |
| Instruments & Related Products | | | 2.1 | % | | | 2,083 | | |
| Engineering & Management Services | | | 2.1 | % | | | 2,055 | | |
| Construction | | | 2.1 | % | | | 2,054 | | |
| Beer, Wine & Distilled Beverages | | | 1.8 | % | | | 1,739 | | |
| Medical Instruments & Supplies | | | 1.7 | % | | | 1,706 | | |
| Radio & Television Broadcasting | | | 1.7 | % | | | 1,627 | | |
| Metal Mining | | | 1.6 | % | | | 1,547 | | |
| Communications Equipment | | | 1.5 | % | | | 1,485 | | |
| Radio, Television & Computer Stores | | | 1.5 | % | | | 1,451 | | |
| Railroads | | | 1.5 | % | | | 1,449 | | |
| Rubber & Misc. Plastic Products | | | 1.5 | % | | | 1,436 | | |
| Electric Services | | | 1.4 | % | | | 1,348 | | |
| Wholesale Trade Nondurable Goods | | | 1.3 | % | | | 1,308 | | |
| Department Stores | | | 1.3 | % | | | 1,256 | | |
| Business Credit Institutions | | | 1.2 | % | | | 1,173 | | |
| Tobacco Products | | | 1.1 | % | | | 1,056 | | |
| Automotive | | | 1.1 | % | | | 1,052 | | |
| Food Stores | | | 1.1 | % | | | 1,039 | | |
| AIr Transportation | | | 1.0 | % | | | 992 | | |
| Gas Production & Distribution | | | 1.0 | % | | | 964 | | |
| Hotels & Other Lodging Places | | | 1.0 | % | | | 962 | | |
| Electronic & Other Electric Equipment | | | 0.9 | % | | | 890 | | |
| Personal Credit Institutions | | | 0.9 | % | | | 866 | | |
| Amusement & Recreation Services | | | 0.9 | % | | | 848 | | |
| Holding & Other Investment Offices | | | 0.8 | % | | | 828 | | |
| Shoe Stores | | | 0.8 | % | | | 804 | | |
| Computer & Data Processing Services | | | 0.8 | % | | | 798 | | |
| Retail Trade | | | 0.8 | % | | | 771 | | |
| Printing & Publishing | | | 0.8 | % | | | 766 | | |
| Textile Mill Products | | | 0.8 | % | | | 742 | | |
| Stone, Clay & Glass Products | | | 0.7 | % | | | 728 | | |
| Business Services | | | 0.7 | % | | | 666 | | |
| Security & Commodity Brokers | | | 0.7 | % | | | 635 | | |
| Investment Companies | | | 0.6 | % | | | 563 | | |
| Public Administration | | | 0.6 | % | | | 558 | | |
| Drug Stores & Proprietary Stores | | | 0.3 | % | | | 329 | | |
| Insurance | | | 0.3 | % | | | 292 | | |
| Trucking & Warehousing | | | 0.1 | % | | | 98 | | |
| Investment securities, at value | | | 98.6 | % | | | 96,113 | | |
| Security lending collateral | | | 3.6 | % | | | 3,505 | | |
| Liabilities in excess of other assets | | | (2.2 | )% | | | (2,156 | ) | |
| Net assets | | | 100.0 | % | | $ | 97,462 | | |
The notes to the financial statements are an integral part of this report.
Transamerica IDEX Mutual Funds
Annual Report 2005
7
TA IDEX American Century International
STATEMENT OF ASSETS AND LIABILITIES
At October 31, 2005
(all amounts except per share amounts in thousands)
| Assets: | |
Investment securities, at value (cost: $89,426)
(including securities loaned of $3,349) | | $ | 99,618 | | |
| Cash | | | 1,337 | | |
| Foreign currencies (cost: $104) | | | 102 | | |
| Receivables: | |
| Investment securities sold | | | 929 | | |
| Shares of beneficial interest sold | | | 80 | | |
| Interest | | | 4 | | |
| Dividends | | | 97 | | |
| Dividend reclaims receivable | | | 125 | | |
| Other | | | 6 | | |
| | | | 102,298 | | |
| Liabilities: | |
| Investment securities purchased | | | 1,022 | | |
| Accounts payable and accrued liabilities: | |
| Shares of beneficial interest redeemed | | | 110 | | |
| Management and advisory fees | | | 77 | | |
| Distribution and service fees | | | 46 | | |
| Transfer agent fees | | | 23 | | |
| Administration fees | | | 2 | | |
| Payable for collateral for securities on loan | | | 3,505 | | |
Unrealized depreciation on forward
foreign currency contracts | | | 6 | | |
| Other | | | 45 | | |
| | | | 4,836 | | |
| Net Assets | | $ | 97,462 | | |
| Net Assets Consist of: | |
Shares of beneficial interest, unlimited shares
authorized, no par value | | $ | 68,502 | | |
| Accumulated net investment income (loss) | | | (455 | ) | |
Undistributed net realized gain (loss) from
investment securities and foreign
currency transactions | | | 19,231 | | |
Net unrealized appreciation (depreciation) on:
Investment securities | | | 10,191 | | |
Translation of assets and liabilites denominated
in foreign currencies | | | (7 | ) | |
| Net Assets | | $ | 97,462 | | |
| Net Assets by Class: | |
| Class A | | $ | 67,656 | | |
| Class B | | | 21,069 | | |
| Class C | | | 8,737 | | |
| Shares Outstanding: | |
| Class A | | | 6,716 | | |
| Class B | | | 2,190 | | |
| Class C | | | 915 | | |
| Net Asset Value Per Share: | |
| Class A | | $ | 10.07 | | |
| Class B | | | 9.62 | | |
| Class C | | | 9.55 | | |
| Maximum Offering Price Per Share (a): | |
| Class A | | $ | 10.66 | | |
(a) Includes the maximum selling commission (represented as a percentage of offering price) which is reduced on certain levels of sales as set forth in the Prospectus. Net asset value per share for Classes B and C shares represents offering price. The redemption price for Classes B and C shares equals net asset value less any applicable contingent deferred sales charge.
STATEMENT OF OPERATIONS
For the year ended October 31, 2005
(all amounts in thousands)
| Investment Income: | |
| Interest | | $ | 55 | | |
Dividends (net of withholding taxes on
foreign dividends of $201) | | | 2,893 | | |
| Income from loaned securities–net | | | 11 | | |
| | | | 2,959 | | |
| Expenses: | |
| Management and advisory fees | | | 1,352 | | |
| Distribution and service fees: | |
| Class A | | | 408 | | |
| Class B | | | 215 | | |
| Class C | | | 93 | | |
| Transfer agent fees: | |
| Class A | | | 101 | | |
| Class B | | | 109 | | |
| Class C | | | 36 | | |
| Printing and shareholder reports | | | 40 | | |
| Custody fees | | | 168 | | |
| Administration fees | | | 28 | | |
| Legal fees | | | 12 | | |
| Audit fees | | | 27 | | |
| Trustees fees | | | 9 | | |
| Registration fees: | |
| Class A | | | 20 | | |
| Class B | | | 11 | | |
| Class C | | | 14 | | |
| Other | | | 12 | | |
| Total expenses | | | 2,655 | | |
| Less: | |
| Reimbursement of class expenses: | |
| Class B | | | (83 | ) | |
| Class C | | | (33 | ) | |
| Total reimbursed expenses | | | (116 | ) | |
| Net expenses | | | 2,539 | | |
| Net Investment Income (Loss) | | | 420 | | |
| Net Realized Gain (Loss) from: | |
| Investment securities | | | 40,327 | | |
| Foreign currency transactions | | | (1,217 | ) | |
| | | | 39,110 | | |
Net Increase (Decrease) in Unrealized Appreciation
(Depreciation) on: | |
| Investment securities | | | (11,454 | ) | |
Translation of assets and liabilities denominated in
foreign currencies | | | (20 | ) | |
| | | | (11,474 | ) | |
Net Gain (Loss) on Investment Securities and
Foreign Currency Transactions | | | 27,636 | | |
Net Increase (Decrease) in Net Assets Resulting
from Operations | | $ | 28,056 | | |
The notes to the financial statements are an integral part of this report.
Transamerica IDEX Mutual Funds
Annual Report 2005
8
TA IDEX American Century International
STATEMENTS OF CHANGES IN NET ASSETS
For the years ended
(all amounts in thousands)
| | | October 31,
2005 | | October 31,
2004 | |
| Increase (Decrease) In Net Assets From: | |
| Operations: | |
| Net investment income (loss) | | $ | 420 | | | $ | (76 | ) | |
Net realized gain (loss) from
investment securities
and foreign currency
transactions | | | 39,110 | | | | 16,156 | | |
Net unrealized appreciation
(depreciation) on investment
securities and foreign currency
translation | | | (11,474 | ) | | | 4,506 | | |
| | | | 28,056 | | | | 20,586 | | |
| Distributions to Shareholders: | |
| From net investment income: | |
| Class A | | | (1,352 | ) | | | (410 | ) | |
| Class B | | | (3 | ) | | | (47 | ) | |
| Class C | | | (52 | ) | | | (2 | ) | |
| Class C2 | | | – | | | | (12 | ) | |
| Class M | | | – | | | | (7 | ) | |
| | | | (1,407 | ) | | | (478 | ) | |
| Capital Share Transactions: | |
| Proceeds from shares sold: | |
| Class A | | | 6,712 | | | | 43,204 | | |
| Class B | | | 3,382 | | | | 2,535 | | |
| Class C | | | 1,825 | | | | 920 | | |
| Class C2 | | | – | | | | 476 | | |
| Class M | | | – | | | | 358 | | |
| | | | 11,919 | | | | 47,493 | | |
Dividends and distributions
reinvested: | |
| Class A | | | 1,350 | | | | 409 | | |
| Class B | | | 3 | | | | 44 | | |
| Class C | | | 50 | | | | 2 | | |
| Class C2 | | | – | | | | 11 | | |
| Class M | | | – | | | | 7 | | |
| | | | 1,403 | | | | 473 | | |
| Cost of shares redeemed: | |
| Class A | | | (150,811 | ) | | | (25,540 | ) | |
| Class B | | | (5,137 | ) | | | (5,662 | ) | |
| Class C | | | (3,488 | ) | | | (842 | ) | |
| Class C2 | | | – | | | | (1,501 | ) | |
| Class M | | | – | | | | (879 | ) | |
| | | | (159,436 | ) | | | (34,424 | ) | |
| Class level exchanges: | |
| Class C | | | – | | | | 8,249 | | |
| Class C2 | | | – | | | | (5,368 | ) | |
| Class M | | | – | | | | (2,881 | ) | |
| | | | – | | | | – | | |
| Automatic conversions: | |
| Class A | | | 160 | | | | 9 | | |
| Class B | | | (160 | ) | | | (9 | ) | |
| | | | – | | | | – | | |
| | | | (146,114 | ) | | | 13,542 | | |
| Net increase (decrease) in net assets | | | (119,465 | ) | | | 33,650 | | |
| | | October 31,
2005 | | October 31,
2004 | |
| Net Assets: | |
| Beginning of year | | $ | 216,927 | | | $ | 183,277 | | |
| End of year | | $ | 97,462 | | | $ | 216,927 | | |
Accumulated Net Investment Income
(Loss) | | $ | (455 | ) | | $ | 229 | | |
| Share Activity: | |
| Shares issued: | |
| Class A | | | 692 | | | | 5,293 | | |
| Class B | | | 366 | | | | 308 | | |
| Class C | | | 200 | | | | 112 | | |
| Class C2 | | | – | | | | 58 | | |
| Class M | | | – | | | | 43 | | |
| | | | 1,258 | | | | 5,814 | | |
Shares issued–reinvested from
distributions: | |
| Class A | | | 143 | | | | 47 | | |
| Class B | | | – | | | | 5 | | |
| Class C | | | 6 | | | | – | | |
| Class C2 | | | – | | | | 1 | | |
| Class M | | | – | | | | 1 | | |
| | | | 149 | | | | 54 | | |
| Shares redeemed: | |
| Class A | | | (15,422 | ) | | | (2,998 | ) | |
| Class B | | | (555 | ) | | | (698 | ) | |
| Class C | | | (383 | ) | | | (103 | ) | |
| Class C2 | | | – | | | | (183 | ) | |
| Class M | | | – | | | | (105 | ) | |
| | | | (16,360 | ) | | | (4,087 | ) | |
| Class level exchanges: | |
| Class C | | | – | | | | 1,009 | | |
| Class C2 | | | – | | | | (654 | ) | |
| Class M | | | – | | | | (353 | ) | |
| | | | – | | | | 2 | | |
| Automatic conversions: | |
| Class A | | | 16 | | | | 1 | | |
| Class B | | | (17 | ) | | | (1 | ) | |
| | | | (1 | ) | | | – | | |
Net increase (decrease) in shares
outstanding: | |
| Class A | | | (14,571 | ) | | | 2,343 | | |
| Class B | | | (206 | ) | | | (386 | ) | |
| Class C | | | (177 | ) | | | 1,018 | | |
| Class C2 | | | – | | | | (778 | ) | |
| Class M | | | – | | | | (414 | ) | |
| | | | (14,954 | ) | | | 1,783 | | |
The notes to the financial statements are an integral part of this report.
Transamerica IDEX Mutual Funds
Annual Report 2005
9
TA IDEX American Century International
FINANCIAL HIGHLIGHTS
| | | | | For a share of beneficial interest outstanding throughout each period | |
| | | | | Net Asset | | Investment Operations | | Distributions | | Net Asset | |
| | | For the
Period
Ended (d)(g) | | Value,
Beginning
of Period | | Net
Investment
Income (Loss) | | Net Realized
and Unrealized
Gain (Loss) | | Total
Operations | | From Net
Investment
Income | | From Net
Realized
Gains | | Total
Distributions | | Value,
End
of Period | |
| Class A | | 10/31/2005 | | $ | 8.81 | | | $ | 0.03 | | | $ | 1.30 | | | $ | 1.33 | | | $ | (0.07 | ) | | $ | – | | | $ | (0.07 | ) | | $ | 10.07 | | |
| | | 10/31/2004 | | | 8.03 | | | | – | (h) | | | 0.80 | | | | 0.80 | | | | (0.02 | ) | | | – | | | | (0.02 | ) | | | 8.81 | | |
| | | 10/31/2003 | | | 7.00 | | | | 0.02 | | | | 1.01 | | | | 1.03 | | | | – | | | | – | | | | – | | | | 8.03 | | |
| | | 10/31/2002 | | | 8.38 | | | | 0.01 | | | | (1.39 | ) | | | (1.38 | ) | | | – | | | | – | | | | – | | | | 7.00 | | |
| | | 10/31/2001 | | | 12.76 | | | | 0.05 | | | | (3.05 | ) | | | (3.00 | ) | | | – | | | | (1.38 | ) | | | (1.38 | ) | | | 8.38 | | |
| Class B | | 10/31/2005 | | | 8.41 | | | | – | (h) | | | 1.21 | | | | 1.21 | | | | – | (h) | | | – | | | | – | | | | 9.62 | | |
| | | 10/31/2004 | | | 7.70 | | | | (0.04 | ) | | | 0.77 | | | | 0.73 | | | | (0.02 | ) | | | – | | | | (0.02 | ) | | | 8.41 | | |
| | | 10/31/2003 | | | 6.76 | | | | (0.03 | ) | | | 0.97 | | | | 0.94 | | | | – | | | | – | | | | – | | | | 7.70 | | |
| | | 10/31/2002 | | | 8.15 | | | | (0.04 | ) | | | (1.35 | ) | | | (1.39 | ) | | | – | | | | – | | | | – | | | | 6.76 | | |
| | | 10/31/2001 | | | 12.53 | | | | (0.02 | ) | | | (2.98 | ) | | | (3.00 | ) | | | – | | | | (1.38 | ) | | | (1.38 | ) | | | 8.15 | | |
| Class C | | 10/31/2005 | | | 8.40 | | | | – | (h) | | | 1.20 | | | | 1.20 | | | | (0.05 | ) | | | – | | | | (0.05 | ) | | | 9.55 | | |
| | | 10/31/2004 | | | 7.70 | | | | (0.09 | ) | | | 0.81 | | | | 0.72 | | | | (0.02 | ) | | | – | | | | (0.02 | ) | | | 8.40 | | |
| | | 10/31/2003 | | | 6.73 | | | | (0.03 | ) | | | 1.00 | | | | 0.97 | | | | – | | | | – | | | | – | | | | 7.70 | | |
| | | | | | | Ratios/Supplemental Data | |
| | | For the
Period | | Total | | Net Assets,
End of
Period | | Ratio of Expenses
to Average
Net Assets (a) | | Net Investment
Income (Loss)
to Average | | Portfolio
Turnover | |
| | | Ended (g) | | Return (c) | | (000's) | | Net (e) | | Total (f) | | Net Assets (a) | | Rate (b) | |
| Class A | | 10/31/2005 | | | 15.17 | % | | $ | 67,656 | | | | 1.56 | % | | | 1.56 | % | | | 0.36 | % | | | 82 | % | |
| | | 10/31/2004 | | | 9.95 | | | | 187,608 | | | | 1.59 | | | | 1.59 | | | | (0.05 | ) | | | 159 | | |
| | | 10/31/2003 | | | 14.71 | | | | 152,086 | | | | 1.78 | | | | 2.39 | | | | 0.23 | | | | 220 | | |
| | | 10/31/2002 | | | (16.49 | ) | | | 14,921 | | | | 1.87 | | | | 3.68 | | | | 0.22 | | | | 241 | | |
| | | 10/31/2001 | | | (26.43 | ) | | | 5,209 | | | | 1.55 | | | | 2.77 | | | | 0.47 | | | | 129 | | |
| Class B | | 10/31/2005 | | | 14.41 | | | | 21,069 | | | | 2.34 | | | | 2.72 | | | | (0.01 | ) | | | 82 | | |
| | | 10/31/2004 | | | 9.46 | | | | 20,153 | | | | 2.09 | | | | 2.09 | | | | (0.46 | ) | | | 159 | | |
| | | 10/31/2003 | | | 13.91 | | | | 21,421 | | | | 2.44 | | | | 3.05 | | | | (0.42 | ) | | | 220 | | |
| | | 10/31/2002 | | | (17.09 | ) | | | 5,328 | | | | 2.52 | | | | 4.33 | | | | (0.43 | ) | | | 241 | | |
| | | 10/31/2001 | | | (26.96 | ) | | | 5,003 | | | | 2.20 | | | | 3.42 | | | | (0.18 | ) | | | 129 | | |
| Class C | | 10/31/2005 | | | 14.36 | | | | 8,737 | | | | 2.34 | | | | 2.70 | | | | (0.01 | ) | | | 82 | | |
| | | 10/31/2004 | | | 9.33 | | | | 9,166 | | | | 2.40 | | | | 2.49 | | | | (1.07 | ) | | | 159 | | |
| | | 10/31/2003 | | | 14.41 | | | | 568 | | | | 2.44 | | | | 3.04 | | | | (0.42 | ) | | | 220 | | |
NOTES TO FINANCIAL HIGHLIGHTS
(a) Annualized.
(b) Not annualized.
(c) Total Return has been calculated for the applicable period without deduction of a sales load, if any, on an initial purchase. Periods of less than one year are not annualized.
(d) Per share information is calculated based on average number of shares outstanding.
(e) Ratio of Net Expenses to Average Net Assets is net of fee waivers and reimbursements by the investment adviser, if any (see note 2.)
(f) Ratio of Total Expenses to Average Net Assets includes all expenses before fee waivers and reimbursements by the investment adviser.
(g) The inception date for the Fund's offering of share Class C was November 11, 2002.
(h) Rounds to less than $(0.01) per share.
The notes to the financial statements are an integral part of this report.
Transamerica IDEX Mutual Funds
Annual Report 2005
10
TA IDEX American Century International
NOTES TO FINANCIAL STATEMENTS
At October 31, 2005
(all amounts in thousands)
NOTE 1. ORGANIZATION AND SIGNIFICANT ACCOUNTING POLICIES
Transamerica IDEX Mutual Funds is an open-end management investment company registered under the Investment Company Act of 1940, as amended (the "1940 Act").
In the normal course of business, TA IDEX American Century International (the "Fund") enters into contracts that contain a variety of representations that provide general indemnifications. The Fund's maximum exposure under these arrangements is unknown, as this would involve future claims that may be made against the Fund and/or its affiliates that have not yet occurred. However, based on experience, the Fund expects the risk of loss to be remote.
This report should be read in conjunction with the current Fund prospectus, which contains more complete information about the Fund.
The following is a summary of significant accounting policies followed by the Fund in the preparation of the financial statements. In preparing the Fund's financial statements in accordance with accounting principles generally accepted in the United States of America ("GAAP"), estimates or assumptions (which could differ from actual results) may be used that affect reported amounts and disclosures.
Multiple class operations, income and expenses: The Fund currently offers three classes of shares, each with a public offering price that reflects different sales charges, if any, and expense levels. On June 15, 2004, Class C2 shares merged into Class C. On September 24, 2004, Class M shares merged into Class C. Class B shares will convert to Class A shares eight years after purchase. Income, non-class specific expenses and realized and unrealized gains and losses, are allocated daily to each class, based upon the value of shares outstanding method as permitted under Rule 18f-3 of the 1940 Act. Each class bears its own specific expenses as well as a portion of general, common expenses.
Security valuations: The Fund values its investments at the close of the New York Stock Exchange ("NYSE"), normally 4 p.m. ET, each day the NYSE is open for business. Fund investments are valued at the last sale price or closing price on the day of valuation taken from the primary exchange where the security is principally traded.
Securities traded in the over-the-counter market and listed securities for which no sale was reported on that date are valued at the last quoted bid price.
Debt securities are valued based on a price quotation or other equivalent indication of value supplied by an exchange, a pricing service or a major market maker; however, those that mature in sixty days or less are valued at amortized cost, which approximates market.
Investment company securities are valued at the net asset value of the underlying portfolio.
Foreign securities generally are valued based on quotations from the primary market in which they are traded. Because many foreign securities markets and exchanges close prior to the close of the NYSE, closing prices for foreign securities in those markets or on those exchanges do not reflect the events that occur after that close. If a significant market event impacting the value of a portfolio security (e.g., natural disaster, company announcement, market volatility) occurs subsequent to the close of trading in the security, but prior to the calculation of the Fund's net asset value per share, market quotations for that security may be determined to be unreliable and, accordingly, not "readily available." As a result, foreign equity securities held by the Fund may be valued at fair market value as determined in good faith by the Fund's Administrative Valuation Committee, under the supervision of the Board's Valuation Committee , using guidelines adopted by the Board of Trustees.
Other securities for which quotations are not readily available or whose values have been determined to be unreliable are valued at fair market value as determined in good faith by the Fund's Administrative Valuation Committee, under the supervision of the Board's Valuation Committee, using guidelines adopted by the Board of Trustees.
Cash: The Fund may leave cash overnight in its cash account with the custodian, Investors Bank & Trust Company ("IBT"). IBT has been contracted on behalf of the Fund to invest the excess cash into a savings account, which at October 31, 2005, was paying an interest rate of 2.76%.
Repurchase agreements: The Fund is authorized to enter into repurchase agreements. The Fund, through its custodian, IBT, receives delivery of the underlying securities, the value of which at the time of purchase is required to be an amount equal to at least 100% of the resale price. The Fund will bear the risk of value fluctuations until the security can be sold and may encounter delays and incur costs in liquidating the security. In the event of bankruptcy or insolvency of the seller, delays and costs may be incurred.
Securities lending: The Fund may lend securities to qualified borrowers, with IBT acting as the Fund's lending agent. The Fund earns negotiated lenders' fees. The Fund receives cash and/or securities as collateral against the loaned securities. Cash collateral received is invested in short term, interest bearing securities. The Fund monitors the market value of securities loaned on a daily basis and requires collateral in an amount at least equal to the value of the securities loaned. Income from loaned securities on the Statement of Operations is net of fees, in the amount of $5, earned by IBT for its services.
Security transactions and investment income: Security transactions are recorded on the trade date. Security gains and losses are calculated
Transamerica IDEX Mutual Funds
Annual Report 2005
11
TA IDEX American Century International
NOTES TO FINANCIAL STATEMENTS (continued)
At October 31, 2005
(all amounts in thousands)
NOTE 1.–(continued)
on the specific identification basis. Dividend income, if any, is recorded on the ex-dividend date or, in the case of foreign securities, as soon as the Fund is informed of the ex-dividend date. Interest income, including accretion of discounts and amortization of premiums, is recorded on the accrual basis commencing on the settlement date.
Foreign currency denominated investments: The accounting records of the Fund are maintained in U.S. dollars. Securities and other assets and liabilities denominated in foreign currencies are translated into U.S. dollars at the closing exchange rate each day. The cost of foreign securities is translated at the exchange rate in effect when the investment was acquired. The Fund combines fluctuations from currency exchange rates and fluctuations in value when computing net realized and unrealized gains or losses from investments.
Net foreign currency gains and losses resulting from changes in exchange rates include: 1) foreign currency fluctuations between trade date and settlement date of investment security transactions; 2) gains and losses on forward foreign currency contracts; and 3) the difference between the receivable amounts of interest and dividends recorded in the accounting records in U.S. dollars and the amounts actually received.
Foreign currency denominated assets may involve risks not typically associated with domestic transactions. These risks include revaluation of currencies, adverse fluctuations in foreign currency values and possible adverse political, social and economic developments, including those particular to a specific industry, country or region.
Foreign capital gains taxes: The Fund may be subject to taxes imposed by countries in which it invests, with respect to its investment in issuers existing or operating in such countries. Such taxes are generally based on income earned or repatriated and capital gains realized on the sale of such investments. The Fund accrues such taxes when the related income or capital gains are earned. Some countries require governmental approval for the repatriation of investment income, capital or the proceeds of sales earned by foreign investors. In addition, if there is deterioration in a country's balance of payments or for other reasons, a country may impose temporary restrictions on foreign capital remittances abroad.
Forward foreign currency contracts: The Fund may enter into forward foreign currency contracts to hedge against exchange rate risk arising from investments in securities denominated in foreign currencies. Contracts are valued at the contractual forward rate and are marked to market daily, with the change in value recorded as an unrealized gain or loss. When the contracts are settled a realized gain or loss is incurred. Risks may arise from changes in market value of the underlying currencies and from the possible inability of counterparties to meet the terms of their contracts.
At October 31, 2005, there were no outstanding forward foreign currency contracts.
Redemption fees: A short-term trading redemption fee may be assessed on any Fund shares in a fund account that are sold during the first five (5) NYSE trading days following their purchase date. This redemption fee will equal 2% of the amount redeemed and shares held the longest will be treated as being redeemed first and shares held the shortest as being redeemed last. For the year ended October 31, 2005, the Fund received less than $1 in redemption fees.
Dividend distributions: Distributions to shareholders are recorded on the ex-dividend date and are determined in accordance with Federal income tax regulations which may differ from GAAP.
NOTE 2. RELATED PARTY TRANSACTIONS
Effective January 1, 2005 AEGON/Transamerica Fund Advisors, Inc. was renamed Transamerica Fund Advisors, Inc. ("TFAI"); AEGON/Transamerica Fund Services, Inc. and AEGON/Transamerica Investor Services, Inc. merged into one entity and was renamed Transamerica Fund Services, Inc. ("TFS").
TFAI is the Fund's investment adviser. TFS is the Fund's administrator and transfer agent. AFSG Securities Corp. ("AFSG") is the Fund's distributor/principal underwriter. TFAI, TFS , and AFSG are affiliates of AEGON, NV, a Netherlands corporation.
The following schedule reflects the percentage of fund assets owned by affiliated mutual funds:
| | | Net
Assets | | % of
Net Assets | |
TA IDEX Asset Allocation–
Growth Portfolio | | $ | 27,167 | | | | 27.87 | % | |
TA IDEX Asset Allocation–
Moderate Growth Portfolio | | | 21,288 | | | | 21.84 | % | |
TA IDEX Asset Allocation–
Moderate Portfolio | | | 5,653 | | | | 5.80 | % | |
| Total | | $ | 54,108 | | | | 55.51 | % | |
Investment advisory fees: The Fund pays management fees to TFAI based on average daily net assets ("ANA") at the following breakpoints:
From November 1, 2004 to December 31, 2004:
1.00% of the first $50 million of ANA
0.95% of the next $100 million of ANA
0.90% of the next $350 million of ANA
0.85% of the next $500 million of ANA
0.80% of ANA over $1 billion
Transamerica IDEX Mutual Funds
Annual Report 2005
12
TA IDEX American Century International
NOTES TO FINANCIAL STATEMENTS (continued)
At October 31, 2005
(all amounts in thousands)
NOTE 2.–(continued)
From January 1, 2005 on:
0.925% of the first $250 million of ANA
0.90% of the next $250 million of ANA
0.85% of the next $500 million of ANA
0.80% of ANA over $1 billion
TFAI has contractually agreed to waive its advisory fee and will reimburse the Fund to the extent that operating expenses, excluding 12b-1 fees, exceed the following stated annual limit:
From November 1, 2004 to December 31, 2004:
1.40% Expense Limit
From January 1, 2005 on:
1.325% Expense Limit
If total Fund expenses fall below the annual expense limitation agreement agreed to by the adviser within the succeeding three years, the Fund may be required to pay that adviser a portion or all of the waived advisory fees.
| | | Advisory Fee
Waived | | Available for
Recapture Through | |
| Fiscal Year 2003 | | $ | 473 | | | | 10/31/2006 | | |
If total class expenses fall below the annual expense limitation agreement agreed to by the adviser within the succeeding three years, the Fund may be required to pay that adviser a portion or all of the reimbursed class expenses.
| Fiscal Year 2005: | | Reimbursement
of Class Expenses | | Available for
Recapture Through | |
| Class B | | $ | 83 | | | 10/31/2008 | |
| Class C | | | 33 | | | 10/31/2008 | |
| Fiscal Year 2004: | |
| Class C | | | 3 | | | 10/31/2007 | |
There were no amounts recaptured during the year ended October 31, 2005.
Distribution and service fees: The Fund has a 12b-1 distribution plan under the 1940 Act pursuant to which an annual fee, based on average daily net assets, is paid to the distributor for various disbursements such as broker-dealer account servicing fees and other promotional expenses of the Fund. The Fund is authorized under the 12b-1 plan to pay fees on each class up to the following limits:
| Class A | | | 0.35 | % | |
| Class B | | | 1.00 | % | |
| Class C | | | 1.00 | % | |
In the case the Fund or a class of shares of the Fund is closed to new investors or investments, the Fund is authorized to pay 12b-1 fees for past sales and distribution efforts and present and past investor services.
Underwriter commissions relate to front-end sales charges imposed for Class A shares and contingent deferred sales charges from Classes B, C and certain A share redemptions. For the year ended October 31, 2005, the underwriter commissions were as follows:
| Received by Underwriter | | $ | 203 | | |
| Retained by Underwriter | | | 6 | | |
| Contingent Deferred Sales Charge | | | 45 | | |
Administrative services: The Fund has entered into an agreement with TFS for financial and legal fund administration services. As of January 1, 2005 the Fund pays TFS an annual fee of 0.02% of ANA. Prior to January 1, 2005 the Fund paid TFS an annual fee of 0.015% of ANA. The Legal fees on the Statement of Operations are for fees paid to external legal counsel.
Transfer agent fees: The Fund pays TFS an annual per-account charge for each open and closed account. The Fund paid TFS $222 for the year ended October 31, 2005.
Deferred compensation plan: Each eligible independent Fund Trustee may elect to participate in a non-qualified deferred compensation plan maintained by Transamerica IDEX Mutual Funds (the "Plan"). Under the Plan, such Trustees may defer payment of all or a portion of their total fees earned as a Fund Trustee. Each Trustee who is a participant in the Plan may elect that the earnings, losses or gains credited to his or her deferred fee amounts be determined based on a deemed investment in any series of Transamerica IDEX Mutual Funds, including the Fund. The right of a participant to receive a distribution from the Plan of the deferred fees is an unsecured claim against the general assets of all series of Transamerica IDEX Mutual Funds. The pro rata liability to the Fund of all deferred fees in the Plan amounted, as of October 31, 2005, to $6.
Brokerage commissions: Brokerage commissions incurred on security transactions placed with an affiliate of the advisor for the year ended October 31, 2005, were $15.
Transamerica IDEX Mutual Funds
Annual Report 2005
13
TA IDEX American Century International
NOTES TO FINANCIAL STATEMENTS (continued)
At October 31, 2005
(all amounts in thousands)
NOTE 3. INVESTMENT TRANSACTIONS
The cost of securities purchased and proceeds from securities sold (excluding short-term securities) for the year ended October 31, 2005, were as follows:
| Purchases of securities: | |
| Long-Term | | $ | 119,521 | | |
| U.S. Government | | | – | | |
| Proceeds from maturities and sales of securities | |
| Long-Term | | | 263,599 | | |
| U.S. Government | | | – | | |
NOTE 4. FEDERAL INCOME TAX MATTERS
The Fund has not made any provision for federal income or excise taxes due to its policy to distribute all of its taxable income and capital gains to its shareholders and otherwise qualify as a regulated investment company under Subchapter M of the Internal Revenue Code. Income and capital gain distributions are determined in accordance with income tax regulations, which may differ from GAAP. These differences are primarily due to differing treatment for items including, but not limited to, wash sales, foreign currency transactions, passive foreign investment companies and capital loss carryforwards.
Therefore, distributions determined in accordance with tax regulations may differ significantly in amount or character from net investment income and realized gains for financial reporting purposes. Financial reporting records are adjusted for permanent book/tax differences to reflect tax character. Financial records are not adjusted for temporary differences. These reclassifications are as follows:
Shares of beneficial interest, unlimited
shares authorized | | $ | (9 | ) | |
| Accumulated net investment income (loss) | | | 303 | | |
Undistributed net realized gain (loss) from investment
securities | | | (294 | ) | |
The capital loss carryforwards are available to offset future realized capital gains through the periods listed:
Capital Loss
Carryforward | | Available through | |
| $ | 1,287 | | | October 31, 2009 | |
| | 3,177 | | | October 31, 2010 | |
The capital loss carryforward utilized during the year ended October 31, 2005 was $14,957.
The tax character of distributions paid may differ from the character of distributions shown in the Statement of Changes in Net Assets due to short-term gains being treated as ordinary income for tax purposes. The tax character of distributions paid during 2004 and 2005 was as follows:
| 2004 Distributions paid from: | |
| Ordinary Income | | $ | 478 | | |
| Long-term Capital Gain | | | – | | |
| 2005 Distributions paid from: | |
| Ordinary Income | | | 1,407 | | |
| Long-term Capital Gain | | | – | | |
The tax basis components of distributable earnings as of October 31, 2005, are as follows:
| Undistributed Ordinary Income | | $ | 74 | | |
| Undistributed Long-term Capital Gains | | $ | 23,904 | | |
| Capital Loss Carryforward | | $ | (4,464 | ) | |
| Net Unrealized Appreciation (Depreciation) | | $ | 9,448 | * | |
* Amount includes unrealized appreciation (depreciation) from foreign currency and deferred compensation.
The aggregate cost of investments and composition of unrealized appreciation (depreciation) for federal income tax purposes as of October 31, 2005, are as follows:
| Federal Tax Cost Basis | | $ | 90,161 | | |
| Unrealized Appreciation | | $ | 10,823 | | |
| Unrealized (Depreciation) | | | (1,366 | ) | |
| Net Unrealized Appreciation (Depreciation) | | $ | 9,457 | | |
NOTE 5. REGULATORY PROCEEDINGS
There continues to be significant federal and state regulatory activity relating to financial services companies, particularly mutual fund companies and their investment advisers. As part of an ongoing investigation regarding potential market timing, recordkeeping and trading compliance issues and matters affecting the Fund's investment adviser, TFAI, and certain affiliates and former employees of TFAI, the SEC staff has indicated that it is likely to take some action against TFAI and certain of its affiliates at the conclusion of the investigation. The potential timing and the scope of any such action is difficult to predict. Although the impact of any action brought against TFAI and/or its affiliates is difficult to assess at the present time, the Fund currently believes that the likelihood that any such action will have a material adverse impact on it is remote. It is important to note that the Fund is not aware of any allega tion of wrongdoing against it and its Board at the time this annual report is printed. Although it is not anticipated that these developments will have an adverse impact on the Fund, there can be no assurance at this time. TFAI and its affiliates are actively working with the SEC in regard to this matter; however, the exact resolution cannot be determined at this time. TFAI will take such actions that it deems necessary or appropriate to continue providing management services to the Fund and to bring all matters to an appropriate conclusion.
TFAI and/or its affiliates, and not the Fund, will bear the costs regarding these regulatory matters.
Transamerica IDEX Mutual Funds
Annual Report 2005
14
Report of Independent Registered Certified Public Accounting Firm
To the Board of Trustees and Shareholders of
TA IDEX American Century International
In our opinion, the accompanying statement of assets and liabilities, including the schedule of investments, and the related statements of operations and of changes in net assets and the financial highlights present fairly, in all material respects, the financial position of TA IDEX American Century International (the "Fund") (one of the portfolios constituting the Transamerica IDEX Mutual Funds) at October 31, 2005, the results of its operations for the year then ended, the changes in its net assets for each of the two years in the period then ended and the financial highlights for each of the periods presented, in conformity with accounting principles generally accepted in the United States of America. These financial statements and financial highlights (hereafter referred to as "financial statements") are the responsibility of the Fund's management; our responsibility is to express an opinion on these financial statements bas ed on our audits. We conducted our audits of these financial statements in accordance with the standards of the Public Company Accounting Oversight Board (United States). Those standards require that we plan and perform the audit to obtain reasonable assurance about whether the financial statements are free of material misstatement. An audit includes examining, on a test basis, evidence supporting the amounts and disclosures in the financial statements, assessing the accounting principles used and significant estimates made by management, and evaluating the overall financial statement presentation. We believe that our audits, which included confirmation of securities at October 31, 2005 by correspondence with the custodian, provide a reasonable basis for our opinion.

December 22, 2005
Transamerica IDEX Mutual Funds
Annual Report 2005
15
TA IDEX American Century International
SUPPLEMENTAL INFORMATION (unaudited)
TAX INFORMATION
For dividends paid during the year ended October 31, 2005, the Fund designated $3,826 as qualified dividend income.
The information and distributions reported herein may differ from the information and distributions taxable to the shareholders for the calendar year ending December 31, 2005. Complete information will be computed and reported in conjunction with your 2005 Form 1099-DIV.
Transamerica IDEX Mutual Funds
Annual Report 2005
16
TA IDEX American Century Large Company Value
MARKET ENVIRONMENT
Equity investors faced numerous headwinds during the period covered by this report, a twelve-month stretch that saw a presidential election, eight increases in short-term interest rates, a new record high for oil and three major hurricanes.
Volatility characterized much of the period. Growing speculation about the impact of higher interest rates and energy prices on economic vitality and corporate profits frequently pressured the market. At the same time, numerous strong earnings reports and merger announcements helped stocks gain traction. Ultimately, investors were rewarded for their fortitude, and the equities market demonstrated considerable resilience, rebounding from troughs to secure gains.
In that environment, TA IDEX American Century Large Company Value produced overall gains in all of the sectors in which it was invested.
PERFORMANCE
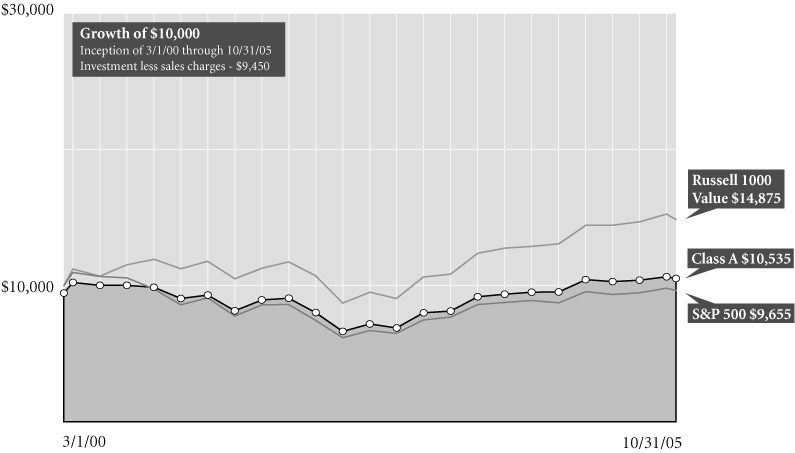
For the year ended October 31, 2005, TA IDEX American Century Large Company Value, Class A returned 9.10%. By comparison its primary and secondary benchmarks, the Standard and Poor's 500 Composite Stock Index and the Russell 1000 Value Index, returned 8.71% and 11.86%, respectively.
STRATEGY REVIEW
The portfolio's interest in the energy sector, a position devoted entirely to the oil and gas industry, contributed significantly to absolute performance during the fiscal year. Soaring oil prices underpinned gains for numerous firms across the industry, and each of our holdings advanced. Major integrated energy companies ConocoPhillips, Exxon Mobil Corporation, Chevron Corporation, and Royal Dutch/Shell Group of Companies all ranked among the top contributors.
Nevertheless, many of the strongest performers in the sector did not meet our value criteria. For example, energy equipment and services companies recorded powerful gains, but were too richly valued by our standards to merit inclusion in the portfolio. Consequently, our relatively smaller exposure to the energy sector as a whole contributed to our overall underperformance versus our benchmark.
We also found success in the financials sector, on average our largest single stake. Insurance companies paced gains in the group, producing two more top contributors in Loews Corporation and The Hartford Financial Services Group, Inc. ("Hartford") In April, Hartford recorded its most profitable quarter ever driven by strength in its property and casualty insurance segment, where innovative technologies helped the firm maintain competitive pricing.
Elsewhere, our position in the information technology sector produced one of the portfolio's top-contributing stocks: Hewlett-Packard Company. News that the company had gained market share and emerged as the global leader in the server business further supported the stock's climb.
Despite those successes, we suffered some setbacks, one of which emerged from the consumer discretionary sector. On March 1, Lear Corporation, a leading automotive interior-systems supplier, lowered its earnings forecast, and then, on April 22, 2005 reported a steep drop in first-quarter profit, citing diminished production for light trucks and SUVs and higher raw-materials costs. The stock decreased sharply following each of these announcements.
Although investments in the materials area contributed overall, our position in the mining and metals industry slowed performance, led by aluminum giant Alcoa Inc., one of only two holdings. The stock came under pressure late in 2004-amid-concerns about high energy costs and sluggish demand in the auto market. And though the company in July 2005 reported its highest-ever quarterly income and revenue, it later reduced its earnings forecast, citing Hurricane Katrina, which temporarily closed two of its plants, weak pricing power and higher raw-materials costs. Nevertheless, we remain confident in this firm's long-term prospects and have maintained a position.
The TA IDEX American Century Large Company Value investment team will continue to follow its strategy of searching for large fundamentally sound businesses that, because of transitory issues, are selling at prices we believe are below fair market value.
Mark Mallon, CFA
Charles A. Ritter, CFA
Brendan Healy, CFA
Co-Fund Managers
American Century Investment Management Inc.
Transamerica IDEX Mutual Funds
Annual Report 2005
1
TA IDEX American Century Large Company Value
Comparison of change in value of $10,000 investment in Class A shares and its comparative indices.
Average Annual Total Return for Periods Ended 10/31/05
| | | 1 year | | 5 years | | From
Inception | | Inception
Date | |
| Class A (NAV) | | | 9.10 | % | | | 0.57 | % | | | 1.93 | % | | 3/1/00 | |
| Class A (POP) | | | 3.10 | % | | | (0.56 | )% | | | 0.92 | % | | 3/1/00 | |
| S&P 5001 | | | 8.71 | % | | | (1.73 | )% | | | (0.62 | )% | | 3/1/00 | |
| Russell 1000 Value1 | | | 11.86 | % | | | 4.71 | % | | | 7.25 | % | | 3/1/00 | |
| Class B (NAV) | | | 8.01 | % | | | (0.19 | )% | | | 1.18 | % | | 3/1/00 | |
| Class B (POP) | | | 3.01 | % | | | (0.39 | )% | | | 1.18 | % | | 3/1/00 | |
| Class C (NAV) | | | 7.93 | % | | | – | | | | 13.49 | % | | 11/11/02 | |
| Class C (POP) | | | 6.93 | % | | | – | | | | 13.49 | % | | 11/11/02 | |
NOTES
1 The Standard and Poor's 500 Composite Stock (S&P 500) Index and the Russell 1000 Value (Russell 1000 Value) Index are unmanaged indices used as a general measure of market performance. Calculations assume dividends and capital gains are reinvested and do not include any managerial expenses. From inception calculation is based on life of Class A shares. Source: Standard & Poor's Micropal®© Micropal, Inc. 2005 – 1-800-596-5323 – http://www.funds-sp.com.
The performance data presented represents past performance, future results may vary. Performance data does not reflect the deduction of taxes that would be paid on fund distributions or the redemption of fund shares. Investment return and principal value will fluctuate so that an investor's shares, when redeemed, may be worth more or less than their original cost. Current performance may be lower or higher than performance quoted. Please see www.transamericaidex.com for performance data current to the most recent month-end.
Public Offering Price (POP) returns include the reinvestment of dividends and capital gains and reflect the maximum sales charge of 5.5% for A shares or the maximum applicable contingent deferred sales charge (5% in the 1st year, decreasing to 0% after 6 years) for Class B shares and 1% (during the first 12 months) for Class C shares. Shares purchased prior to March 1, 2004 are subject to a maximum applicable contingent deferred sales charge (5% in the 1st year, decreasing to 0% after 7 years) for Class B shares and (2% in the 1st year, decreasing to 0% after 2 years) for Class C shares. Net Asset Value (NAV) returns include the reinvestment of dividends and capital gains but do not reflect any sales charges.
This material must be preceded or accompanied by a current prospectus, which includes specific contents regarding the investment objectives and policies of this fund.
Transamerica IDEX Mutual Funds
Annual Report 2005
2
TA IDEX American Century Large Company Value
UNDERSTANDING YOUR FUND'S EXPENSES
(unaudited)
SHAREHOLDER EXPENSES
Fund shareholders may incur two types of costs: (1) transaction costs, including sales charges (loads) on purchases, contingent deferred sales charges on redemptions and redemption fees; and (2) ongoing costs, including management fees, 12b-1 distribution and service fees, and other fund expenses.
The following Example is intended to help you understand your ongoing costs (in dollars and cents) of investing in a Fund and to compare these costs with the ongoing costs of investing in other funds.
The Example is based on an investment of $1,000 invested at May 1, 2005 and held for the entire period until October 31, 2005.
ACTUAL EXPENSES
The first line in the table below provides information about actual account values and actual expenses. You may use the information in this line, together with the amount you invested, to estimate the expenses that you paid over the period. Simply divide your account value by $1,000 (for example, an $8,600 account value divided by $1,000 = 8.6), then multiply the result by the number in the first line of your Fund under the heading entitled "Expenses Paid During Period" to estimate the expenses you paid on your account during this period. If your account is an IRA, your expenses could have included a $15 annual fee. The amount of any fee paid through your account would increase the estimate of expenses you paid during the period and decrease your ending account value.
HYPOTHETICAL EXAMPLE FOR COMPARISON PURPOSES
The second line in the table below provides information about hypothetical account values and hypothetical expenses based on the Fund's actual expense ratio and an assumed rate of return of 5% per year before expenses, which is not the Fund's actual return. The hypothetical account values and expenses may not be used to estimate the actual ending account balance or expenses you paid for the period. You may use this information to compare the ongoing costs of investing in your Fund and other funds. To do so, compare this 5% hypothetical example with the 5% hypothetical examples that appear in the shareholder reports of the other funds. As in the case of the actual expense example, if your account is subject to an IRA fee, the amount of the fee paid through your account would increase the hypothetical expenses you would have paid during the period and decrease the hypothetical ending account value.
Please note that the expenses shown in the table are meant to highlight your ongoing costs only and do not reflect any transactional costs, such as sales charges, redemption fees, brokerage commissions paid on purchases and sales of fund shares. Therefore, the second line under the Fund in the table is useful in comparing ongoing costs only, and will not help you determine the relative total costs of owning different funds. If any of these transaction costs were included, your costs would be higher. The expenses shown in the table do not reflect any fees that may be charged to you by brokers, financial intermediaries or other financial institutions.
| | | Beginning
Account
Value | | Ending
Account
Value | | Annualized
Expense
Ratio | | Expenses Paid
During Period (a) | |
| Class A | | | |
| Actual | | $ | 1,000.00 | | | $ | 1,035.80 | | | | 1.35 | % | | $ | 6.93 | | |
| Hypothetical (b) | | | 1,000.00 | | | | 1,018.40 | | | | 1.35 | | | | 6.87 | | |
| Class B | | | |
| Actual | | | 1,000.00 | | | | 1,029.90 | | | | 2.50 | | | | 12.79 | | |
| Hypothetical (b) | | | 1,000.00 | | | | 1,012.60 | | | | 2.50 | | | | 12.68 | | |
| Class C | | | |
| Actual | | | 1,000.00 | | | | 1,030.50 | | | | 2.37 | | | | 12.13 | | |
| Hypothetical (b) | | | 1,000.00 | | | | 1,013.26 | | | | 2.37 | | | | 12.03 | | |
(a) Expenses are calculated using each Fund's annualized expense ratio (as disclosed in the table), multiplied by the average account value for the period, multiplied by number of days in the period (184 days), and divided by the number of days in the year (365 days).
(b) 5% return per year before expenses.
GRAPHICAL PRESENTATION OF SCHEDULE OF INVESTMENTS
By Sector
At October 31, 2005
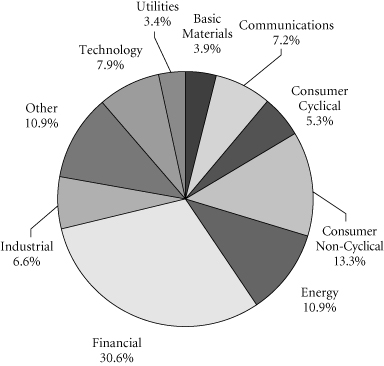
This chart shows the percentage breakdown by sector of the Fund's total investment securities.
Transamerica IDEX Mutual Funds
Annual Report 2005
3
TA IDEX American Century Large Company Value
SCHEDULE OF INVESTMENTS
At October 31, 2005
(all amounts except share amounts in thousands)
| | | Shares | | Value | |
| COMMON STOCKS (97.3%) | |
| Aerospace (0.6%) | |
| Northrop Grumman Corp. | | | 45,700 | | | $ | 2,452 | | |
| Apparel & Accessory Stores (0.6%) | |
| Gap (The), Inc. | | | 140,100 | | | | 2,421 | | |
| Apparel Products (1.2%) | |
| Liz Claiborne, Inc. † | | | 74,500 | | | | 2,622 | | |
| V.F. Corp. | | | 51,400 | | | | 2,686 | | |
| Automotive (0.4%) | |
| Lear Corp. † | | | 59,400 | | | | 1,809 | | |
| Beverages (2.3%) | |
| Coca-Cola Co. (The) | | | 95,100 | | | | 4,068 | | |
| Molson Coors Brewing Co.–Class B | | | 41,500 | | | | 2,561 | | |
| Pepsi Bottling Group, Inc. | | | 112,600 | | | | 3,201 | | |
| Business Credit Institutions (3.4%) | |
| Freddie Mac | | | 240,200 | | | | 14,736 | | |
| Chemicals & Allied Products (2.2%) | |
| Avon Products, Inc. | | | 40,500 | | | | 1,093 | | |
| du Pont (E.I.) de Nemours & Co. | | | 84,400 | | | | 3,519 | | |
| PPG Industries, Inc. | | | 78,900 | | | | 4,732 | | |
| Commercial Banks (18.1%) | |
| Bank of America Corp. † | | | 330,900 | | | | 14,474 | | |
| Bank of New York Co., Inc. (The) | | | 123,400 | | | | 3,861 | | |
| Citigroup, Inc. | | | 452,300 | | | | 20,706 | | |
| JP Morgan Chase & Co. | | | 286,900 | | | | 10,506 | | |
| National City Corp. | | | 65,500 | | | | 2,111 | | |
| PNC Financial Services Group, Inc. | | | 77,600 | | | | 4,711 | | |
| US Bancorp † | | | 199,700 | | | | 5,907 | | |
| Wachovia Corp. | | | 134,300 | | | | 6,785 | | |
| Wells Fargo & Co. | | | 150,900 | | | | 9,084 | | |
| Communication (0.5%) | |
| Viacom, Inc.–Class B | | | 62,900 | | | | 1,948 | | |
| Communications Equipment (0.4%) | |
| Avaya, Inc. ‡ | | | 132,800 | | | | 1,530 | | |
| Computer & Data Processing Services (3.7%) | |
| Computer Sciences Corp. ‡ | | | 59,700 | | | | 3,060 | | |
| Fiserv, Inc. ‡ | | | 71,300 | | | | 3,114 | | |
| Microsoft Corp. | | | 292,600 | | | | 7,520 | | |
| Oracle Corp. ‡ | | | 173,300 | | | | 2,197 | | |
| Computer & Office Equipment (3.4%) | |
| Hewlett-Packard Co. | | | 303,500 | | | | 8,510 | | |
| International Business Machines Corp. | | | 72,400 | | | | 5,928 | | |
| Electric Services (1.3%) | |
| PPL Corp. | | | 182,000 | | | | 5,704 | | |
| | | Shares | | Value | |
| Electric, Gas & Sanitary Services (2.3%) | | | |
| Exelon Corp. † | | | 134,000 | | | $ | 6,972 | | |
| NiSource, Inc. | | | 125,500 | | | | 2,968 | | |
| Electronic & Other Electric Equipment (1.4%) | | | |
| General Electric Co. | | | 150,000 | | | | 5,086 | | |
| Whirlpool Corp. † | | | 11,000 | | | | 863 | | |
| Electronic Components & Accessories (1.8%) | | | |
| Intel Corp. | | | 137,800 | | | | 3,238 | | |
| Tyco International, Ltd. † | | | 174,400 | | | | 4,602 | | |
| Environmental Services (0.7%) | | | |
| Waste Management, Inc. | | | 108,300 | | | | 3,196 | | |
| Fabricated Metal Products (0.7%) | | | |
| Parker Hannifin Corp. | | | 49,800 | | | | 3,121 | | |
| Finance (1.2%) | | | |
| SPDR Trust Series 1 † | | | 42,500 | | | | 5,111 | | |
| Food & Kindred Products (3.9%) | | | |
| Altria Group, Inc. | | | 90,900 | | | | 6,822 | | |
| HJ Heinz Co. | | | 98,200 | | | | 3,486 | | |
| Sara Lee Corp. | | | 128,900 | | | | 2,301 | | |
| Unilever NV-NY Shares | | | 59,900 | | | | 4,212 | | |
| Food Stores (1.0%) | | | |
| Kroger Co. †‡ | | | 215,800 | | | | 4,294 | | |
| Health Services (0.5%) | | | |
| HCA, Inc. | | | 44,400 | | | | 2,140 | | |
| Industrial Machinery & Equipment (2.2%) | | | |
| Deere & Co. † | | | 46,700 | | | | 2,834 | | |
| Dover Corp. | | | 80,500 | | | | 3,138 | | |
| Ingersoll-Rand Co.–Class A | | | 96,200 | | | | 3,635 | | |
| Instruments & Related Products (0.7%) | | | |
| Xerox Corp. ‡ | | | 235,300 | | | | 3,193 | | |
| Insurance (4.3%) | | | |
| Allstate Corp. (The) | | | 107,200 | | | | 5,659 | | |
| American International Group, Inc. | | | 95,700 | | | | 6,201 | | |
| Loews Corp. | | | 47,500 | | | | 4,417 | | |
| MGIC Investment Corp. | | | 39,600 | | | | 2,346 | | |
| Insurance Agents, Brokers & Service (1.8%) | | | |
| Hartford Financial Services Group, Inc. (The) | | | 73,200 | | | | 5,838 | | |
| Marsh & McLennan Cos., Inc. † | | | 71,800 | | | | 2,093 | | |
| Life Insurance (0.7%) | | | |
| Torchmark Corp. | | | 60,700 | | | | 3,207 | | |
| Lumber & Wood Products (1.3%) | | | |
| Weyerhaeuser Co. | | | 89,800 | | | | 5,688 | | |
The notes to the financial statements are an integral part of this report.
Transamerica IDEX Mutual Funds
Annual Report 2005
4
TA IDEX American Century Large Company Value
SCHEDULE OF INVESTMENTS (continued)
At October 31, 2005
(all amounts except share amounts in thousands)
| | | Shares | | Value | |
| Motion Pictures (1.7%) | | | |
| Time Warner, Inc. | | | 410,200 | | | $ | 7,314 | | |
| Oil & Gas Extraction (2.8%) | | | |
| Royal Dutch Shell PLC–Class A, ADR † | | | 194,700 | | | | 12,079 | | |
| Petroleum Refining (8.9%) | | | |
| Chevron Corp. | | | 166,300 | | | | 9,491 | | |
| ConocoPhillips | | | 160,300 | | | | 10,480 | | |
| Exxon Mobil Corp. | | | 328,600 | | | | 18,448 | | |
| Pharmaceuticals (5.7%) | | | |
| Abbott Laboratories | | | 112,400 | | | | 4,839 | | |
| Bristol-Myers Squibb Co. | | | 121,100 | | | | 2,564 | | |
| Johnson & Johnson | | | 83,800 | | | | 5,248 | | |
| Merck & Co., Inc. | | | 61,500 | | | | 1,736 | | |
| Pfizer, Inc. | | | 256,600 | | | | 5,578 | | |
| Wyeth | | | 104,100 | | | | 4,639 | | |
| Primary Metal Industries (1.0%) | | | |
| Alcoa, Inc. | | | 115,000 | | | | 2,793 | | |
| Nucor Corp. | | | 25,500 | | | | 1,526 | | |
| Printing & Publishing (1.8%) | | | |
| Gannett Co., Inc. | | | 72,200 | | | | 4,524 | | |
| RR Donnelley & Sons Co. | | | 87,700 | | | | 3,071 | | |
| Railroads (0.7%) | | | |
| Norfolk Southern Corp. | | | 69,600 | | | | 2,798 | | |
| Restaurants (1.4%) | | | |
| McDonald's Corp. | | | 187,500 | | | | 5,925 | | |
| Rubber & Misc. Plastic Products (0.7%) | | | |
| Newell Rubbermaid, Inc. | | | 133,100 | | | | 3,060 | | |
| Savings Institutions (1.4%) | | | |
| Washington Mutual, Inc. | | | 146,700 | | | | 5,809 | | |
| Security & Commodity Brokers (3.2%) | | | |
| Merrill Lynch & Co., Inc. | | | 107,300 | | | | 6,947 | | |
| Morgan Stanley | | | 122,600 | | | | 6,671 | | |
| Telecommunications (4.2%) | | | |
| AT&T Corp. | | | 55,200 | | | | 1,092 | | |
| BellSouth Corp. † | | | 178,700 | | | | 4,650 | | |
| SBC Communications, Inc. | | | 237,300 | | | | 5,660 | | |
| Sprint Nextel Corp. | | | 150,100 | | | | 3,499 | | |
| Verizon Communications, Inc. | | | 104,300 | | | | 3,286 | | |
| Variety Stores (1.2%) | | | |
| Dollar General Corp. | | | 122,700 | | | | 2,385 | | |
| Wal-Mart Stores, Inc. | | | 58,800 | | | | 2,782 | | |
| Total Common Stocks (cost: $408,407) | | | | | | | 419,111 | | |
| | | Principal | | Value | |
| SECURITY LENDING COLLATERAL (10.6%) | | | |
| Debt (9.8%) | | | |
| Bank Notes (0.7%) | | | |
Bank of America
3.81%, due 06/07/2006 * | | $ | 1,274 | | | $ | 1,274 | | |
| 3.81%, due 08/10/2006 * | | | 1,265 | | | | 1,265 | | |
Credit Suisse First Boston Corp.
4.11%, due 03/10/2006 * | | | 253 | | | | 253 | | |
| Certificates Of Deposit (0.7%) | | | |
Canadian Imperial Bank of Commerce
4.07%, due 11/04/2005 * | | | 1,012 | | | | 1,012 | | |
Harris Trust & Savings Bank
3.80%, due 11/04/2005 * | | | 805 | | | | 805 | | |
Rabobank Nederland
4.03%, due 05/31/2006 * | | | 1,265 | | | | 1,265 | | |
| Commercial Paper (2.1%) | | | |
Ciesco LLC
4.00%, due 11/03/2005 | | | 1,263 | | | | 1,263 | | |
General Electric Capital Corp.
3.96%, due 12/05/2005 | | | 1,012 | | | | 1,012 | | |
Paradigm Funding LLC–144A
4.01%, due 11/07/2005 | | | 1,009 | | | | 1,009 | | |
Park Avenue Receivables Corp.–144A
4.03%, due 12/02/2005 | | | 1,002 | | | | 1,002 | | |
Preferred Receivables Corp.–144A
4.04%, due 12/05/2005 | | | 759 | | | | 759 | | |
Ranger Funding Co. LLC–144A
3.99%, due 11/15/2005 | | | 753 | | | | 753 | | |
Sheffield Receivables Corp.–144A
4.01%, due 11/08/2005 | | | 759 | | | | 759 | | |
Yorktown Capital LLC
3.97%, due 11/09/2005 | | | 1,260 | | | | 1,260 | | |
| 3.93%, due 11/17/2005 | | | 1,256 | | | | 1,256 | | |
| Euro Dollar Overnight (2.3%) | | | |
Bank of Montreal
3.79%, due 11/01/2005 | | | 759 | | | | 759 | | |
Barclays
3.80%, due 11/04/2005 | | | 1,012 | | | | 1,012 | | |
BNP Paribas
3.83%, due 11/02/2005 | | | 1,518 | | | | 1,518 | | |
Deutsche Bank
3.80%, due 11/02/2005 | | | 2,530 | | | | 2,530 | | |
HSBC Banking/Holdings PLC
3.84%, due 11/07/2005 | | | 759 | | | | 759 | | |
Royal Bank of Scotland
3.76%, due 11/01/2005 | | | 1,012 | | | | 1,012 | | |
The notes to the financial statements are an integral part of this report.
Transamerica IDEX Mutual Funds
Annual Report 2005
5
TA IDEX American Century Large Company Value
SCHEDULE OF INVESTMENTS (continued)
At October 31, 2005
(all amounts except share amounts in thousands)
| | | Principal | | Value | |
| Euro Dollar Overnight (continued) | | | |
Svenska Handlesbanken
4.03%, due 11/01/2005 | | $ | 1,303 | | | $ | 1,303 | | |
UBS AG
3.80%, due 11/03/2005 | | | 1,012 | | | | 1,012 | | |
| Euro Dollar Terms (0.8%) | | | |
Royal Bank of Scotland
4.00%, due 12/12/2005 | | | 1,012 | | | | 1,012 | | |
UBS AG
4.02%, due 12/01/2005 | | | 1,012 | | | | 1,012 | | |
Wells Fargo
3.96%, due 11/14/2005 | | | 1,518 | | | | 1,518 | | |
| Promissory Notes (0.2%) | | | |
Goldman Sachs Group, Inc.
4.02%, due 12/28/2005 | | | 1,062 | | | | 1,062 | | |
| Repurchase Agreements (3.0%) †† | | | |
Credit Suisse First Boston Corp.
4.10%, dated 10/31/2005 to be
repurchased at $1,724 on 11/01/2005 | | | 1,724 | | | | 1,724 | | |
Goldman Sachs Group, Inc. (The)
4.10%, dated 10/31/2005 to be
repurchased at $4,301 on 11/01/2005 | | | 4,300 | | | | 4,300 | | |
Lehman Brothers, Inc.
4.10%, dated 10/31/2005 to be
repurchased at $119 on 11/01/2005 | | | 119 | | | | 119 | | |
Merrill Lynch & Co.
4.10%, dated 10/31/2005 to be
repurchased at $5,060 on 11/01/2005 | | | 5,059 | | | | 5,059 | | |
Morgan Stanley Dean Witter & Co.
4.17%, dated 10/31/2005 to be
repurchased at $1,517 on 11/01/2005 | | | 1,517 | | | | 1,517 | | |
| | | Shares | | Value | |
| Investment Companies (0.8%) | | | |
| Money Market Funds (0.8%) | | | |
American Beacon Fund
1-day yield of 3.81% | | | 1,090,709 | | | $ | 1,091 | | |
Barclays Global Investors
Institutional Money Market Fund
1-day yield of 3.92% | | | 1,011,849 | | | | 1,012 | | |
Goldman Sachs Financial Square
Prime Obligations Fund
1-day yield of 3.79% | | | 157,614 | | | | 157 | | |
Merrimac Cash Fund,
Premium Class
1-day yield of 3.70% @ | | | 1,000,666 | | | | 1,000 | | |
| Total Security Lending Collateral (cost: $45,435) | | | | | | | 45,435 | | |
| Total Investment Securities (cost: $453,842) | | | | | | $ | 464,546 | | |
| SUMMARY: | | | |
| Investment securities, at value | | | 107.9 | % | | $ | 464,546 | | |
| Liabilities in excess of other assets | | | (7.9 | )% | | | (33,847 | ) | |
| Net assets | | | 100.0 | % | | $ | 430,699 | | |
NOTES TO SCHEDULE OF INVESTMENTS:
† At October 31, 2005, all or a portion of this security is on loan (see Note 1). The value at October 31, 2005, of all securities on loan is $44,166.
‡ Non-income producing.
* Floating or variable rate note. Rate is listed as of October 31, 2005.
†† Cash collateral for the Repurchase Agreements, valued at $12,974, that serve as collateral for securities lending are invested in corporate bonds with interest rates and maturity dates ranging from 0.00%–9.86% and 12/31/2005–11/15/2096, respectively.
@ Regulated investment company advised by Investors Bank and Trust Co. ("IBT"). IBT is also the accounting, custody and lending agent for the Fund.
DEFINITIONS:
144A 144A Securities are registered pursuant to Rule 144A of the Securities Act of 1933. These securities are deemed to be liquid for purposes of compliance limitations on holdings of illiquid securities and may be resold as transactions exempt from registration, normally to qualified institutional buyers. At October 31, 2005, these securities aggregated $4,282 or 1.0% of the net assets of the Fund.
ADR American Depositary Receipt
The notes to the financial statements are an integral part of this report.
Transamerica IDEX Mutual Funds
Annual Report 2005
6
TA IDEX American Century Large Company Value
STATEMENT OF ASSETS AND LIABILITIES
At October 31, 2005
(all amounts except per share amounts in thousands)
| Assets: | | | |
Investment securities, at value (cost: $453,842)
(including securities loaned of $44,166) | | $ | 464,546 | | |
| Cash | | | 11,970 | | |
| Receivables: | |
| Shares of beneficial interest sold | | | 5 | | |
| Interest | | | 27 | | |
| Dividends | | | 700 | | |
| Other | | | 6 | | |
| | | | 477,254 | | |
| Liabilities: | | | |
| Investment securities purchased | | | 286 | | |
| Accounts payable and accrued liabilities: | |
| Shares of beneficial interest redeemed | | | 111 | | |
| Management and advisory fees | | | 509 | | |
| Distribution and service fees | | | 140 | | |
| Transfer agent fees | | | 14 | | |
| Administration fees | | | 7 | | |
| Payable for collateral for securities on loan | | | 45,435 | | |
| Other | | | 53 | | |
| | | | 46,555 | | |
| Net Assets | | $ | 430,699 | | |
| Net Assets Consist of: | | | |
Shares of beneficial interest, unlimited shares
authorized, no par value | | $ | 409,005 | | |
| Undistributed net investment income (loss) | | | – | | |
Undistributed net realized gain (loss) from investment
securities | | | 10,990 | | |
Net unrealized appreciation (depreciation) on
investment securities | | | 10,704 | | |
| Net Assets | | $ | 430,699 | | |
| Net Assets by Class: | | | |
| Class A | | $ | 406,609 | | |
| Class B | | | 16,927 | | |
| Class C | | | 7,163 | | |
| Shares Outstanding: | | | |
| Class A | | | 37,028 | | |
| Class B | | | 1,586 | | |
| Class C | | | 673 | | |
| Net Asset Value Per Share: | | | |
| Class A | | $ | 10.98 | | |
| Class B | | | 10.67 | | |
| Class C | | | 10.64 | | |
| Maximum Offering Price Per Share (a): | | | |
| Class A | | $ | 11.62 | | |
(a) Includes the maximum selling commission (represented as a percentage of offering price) which is reduced on certain levels of sales as set forth in the Prospectus. Net asset value per share for Classes B and C shares represents offering price. The redemption price for Classes B and C shares equals net asset value less any applicable contingent deferred sales charge.
STATEMENT OF OPERATIONS
For the year ended October 31, 2005
(all amounts in thousands)
| Investment Income: | | | |
| Interest | | $ | 301 | | |
Dividends (net of withholding taxes on
foreign dividends of $89) | | | 9,740 | | |
| Income from loaned securities–net | | | 56 | | |
| | | | 10,097 | | |
| Expenses: | | | |
| Management and advisory fees | | | 3,391 | | |
| Distribution and service fees: | |
| Class A | | | 1,334 | | |
| Class B | | | 186 | | |
| Class C | | | 77 | | |
| Transfer agent fees: | |
| Class A | | | 34 | | |
| Class B | | | 65 | | |
| Class C | | | 22 | | |
| Printing and shareholder reports | | | 19 | | |
| Custody fees | | | 51 | | |
| Administration fees | | | 79 | | |
| Legal fees | | | 26 | | |
| Audit fees | | | 18 | | |
| Trustees fees | | | 17 | | |
| Registration fees: | |
| Class A | | | 41 | | |
| Class B | | | 12 | | |
| Class C | | | 14 | | |
| Other | | | 5 | | |
Total expenses before recapture of waived and
reimbursed expenses | | | 5,391 | | |
| Recaptured expenses | | | 208 | | |
| Net expenses | | | 5,599 | | |
| Net Investment Income (Loss) | | | 4,498 | | |
| Net Realized and Unrealized Gain (Loss): | | | |
| Realized gain (loss) from investment securities | | | 14,033 | | |
Increase (decrease) in unrealized appreciation
(depreciation) on investment securities | | | 5,916 | | |
| Net Gain (Loss) on Investment Securities | | | 19,949 | | |
Net Increase (Decrease) in Net Assets Resulting
from Operations | | $ | 24,447 | | |
The notes to the financial statements are an integral part of this report.
Transamerica IDEX Mutual Funds
Annual Report 2005
7
TA IDEX American Century Large Company Value
STATEMENTS OF CHANGES IN NET ASSETS
For the years ended
(all amounts in thousands)
| | | October 31,
2005 | | October 31,
2004 | |
| Increase (Decrease) In Net Assets From: | |
| Operations: | |
| Net investment income (loss) | | $ | 4,498 | | | $ | 604 | | |
Net realized gain (loss) from
investment securities | | | 14,033 | | | | 4,617 | | |
Net unrealized appreciation
(depreciation) on investment
securities | | | 5,916 | | | | 2,671 | | |
| | | | 24,447 | | | | 7,892 | | |
| Distributions to Shareholders: | |
| From net investment income: | |
| Class A | | | (5,062 | ) | | | (39 | ) | |
| Class B | | | – | | | | (27 | ) | |
| Class C | | | (5 | ) | | | (2 | ) | |
| Class C2 | | | – | | | | (8 | ) | |
| Class M | | | – | | | | (3 | ) | |
| | | | (5,067 | ) | | | (79 | ) | |
| Capital Share Transactions: | |
| Proceeds from shares sold: | |
| Class A | | | 265,545 | | | | 147,090 | | |
| Class B | | | 2,124 | | | | 3,766 | | |
| Class C | | | 1,174 | | | | 1,077 | | |
| Class C2 | | | – | | | | 427 | | |
| Class M | | | – | | | | 269 | | |
| | | | 268,843 | | | | 152,629 | | |
Dividends and distributions
reinvested: | |
| Class A | | | 5,058 | | | | 38 | | |
| Class B | | | – | | | | 25 | | |
| Class C | | | 4 | | | | 1 | | |
| Class C2 | | | – | | | | 7 | | |
| Class M | | | – | | | | 3 | | |
| | | | 5,062 | | | | 74 | | |
| Cost of shares redeemed: | |
| Class A | | | (38,506 | ) | | | (3,949 | ) | |
| Class B | | | (5,187 | ) | | | (4,402 | ) | |
| Class C | | | (2,194 | ) | | | (2,320 | ) | |
| Class C2 | | | – | | | | (1,018 | ) | |
| Class M | | | – | | | | (674 | ) | |
| | | | (45,887 | ) | | | (12,363 | ) | |
| Class level exchanges: | |
| Class A | | | – | | | | 7,377 | | |
| Class B | | | – | | | | (5,388 | ) | |
| Class C | | | – | | | | (1,989 | ) | |
| | | | – | | | | – | | |
| | | October 31,
2005 | | October 31,
2004 | |
| Automatic conversions: | |
| Class A | | $ | 91 | | | $ | 10 | | |
| Class B | | | (91 | ) | | | (10 | ) | |
| | | | – | | | | – | | |
| | | | 228,018 | | | | 140,340 | | |
| Net increase (decrease) in net assets | | | 247,398 | | | | 148,153 | | |
| Net Assets: | |
| Beginning of year | | | 183,301 | | | | 35,148 | | |
| End of year | | $ | 430,699 | | | $ | 183,301 | | |
Accumulated Net Investment Income
(Loss) | | $ | -- | | | $ | 539 | | |
| Share Activity: | |
| Shares issued: | |
| Class A | | | 24,696 | | | | 14,819 | | |
| Class B | | | 201 | | | | 396 | | |
| Class C | | | 112 | | | | 112 | | |
| Class C2 | | | – | | | | 45 | | |
| Class M | | | – | | | | 28 | | |
| | | | 25,009 | | | | 15,400 | | |
Shares issued–reinvested from
distributions: | |
| Class A | | | 467 | | | | 4 | | |
| Class B | | | – | | | | 3 | | |
| Class C2 | | | – | | | | 1 | | |
| | | | 467 | | | | 8 | | |
| Shares redeemed: | |
| Class A | | | (3,553 | ) | | | (403 | ) | |
| Class B | | | (490 | ) | | | (459 | ) | |
| Class C | | | (208 | ) | | | (243 | ) | |
| Class C2 | | | – | | | | (109 | ) | |
| Class M | | | – | | | | (71 | ) | |
| | | | (4,251 | ) | | | (1,285 | ) | |
| Class level exchanges: | |
| Class C | | | – | | | | 761 | | |
| Class C2 | | | – | | | | (557 | ) | |
| Class M | | | – | | | | (203 | ) | |
| | | | – | | | | 1 | | |
| Automatic conversions: | |
| Class A | | | 8 | | | | 1 | | |
| Class B | | | (9 | ) | | | (1 | ) | |
| | | | (1 | ) | | | – | | |
Net increase (decrease) in shares
outstanding: | |
| Class A | | | 21,618 | | | | 14,421 | | |
| Class B | | | (298 | ) | | | (61 | ) | |
| Class C | | | (96 | ) | | | 630 | | |
| Class C2 | | | – | | | | (620 | ) | |
| Class M | | | – | | | | (246 | ) | |
| | | | 21,224 | | | | 14,124 | | |
The notes to the financial statements are an integral part of this report.
Transamerica IDEX Mutual Funds
Annual Report 2005
8
TA IDEX American Century Large Company Value
FINANCIAL HIGHLIGHTS
| | | | | For a share of beneficial interest outstanding throughout each period | |
| | | | | Net Asset | | Investment Operations | | Distributions | | Net Asset | |
| | | For the
Period
Ended (d)(g) | | Value,
Beginning
of Period | | Net
Investment
Income (Loss) | | Net Realized
and Unrealized
Gain (Loss) | | Total
Operations | | From Net
Investment
Income | | From Net
Realized
Gains | | Total
Distributions | | Value,
End
of Period | |
| Class A | | 10/31/2005 | | $ | 10.20 | | | $ | 0.13 | | | $ | 0.80 | | | $ | 0.93 | | | $ | (0.15 | ) | | $ | – | | | $ | (0.15 | ) | | $ | 10.98 | | |
| | | 10/31/2004 | | | 9.09 | | | | 0.11 | | | | 1.01 | | | | 1.12 | | | | (0.01 | ) | | | – | | | | (0.01 | ) | | | 10.20 | | |
| | | 10/31/2003 | | | 7.55 | | | | 0.04 | | | | 1.50 | | | | 1.54 | | | | – | | | | – | | | | – | | | | 9.09 | | |
| | | 10/31/2002 | | | 8.79 | | | | 0.01 | | | | (1.25 | ) | | | (1.24 | ) | | | – | | | | – | | | | – | | | | 7.55 | | |
| | | 10/31/2001 | | | 10.83 | | | | (0.03 | ) | | | (2.01 | ) | | | (2.04 | ) | | | – | | | | – | | | | – | | | | 8.79 | | |
| Class B | | 10/31/2005 | | | 9.88 | | | | 0.02 | | | | 0.77 | | | | 0.79 | | | | – | | | | – | | | | – | | | | 10.67 | | |
| | | 10/31/2004 | | | 8.87 | | | | 0.02 | | | | 1.00 | | | | 1.02 | | | | (0.01 | ) | | | – | | | | (0.01 | ) | | | 9.88 | | |
| | | 10/31/2003 | | | 7.41 | | | | (0.01 | ) | | | 1.47 | | | | 1.46 | | | | – | | | | – | | | | – | | | | 8.87 | | |
| | | 10/31/2002 | | | 8.69 | | | | (0.05 | ) | | | (1.23 | ) | | | (1.28 | ) | | | – | | | | – | | | | – | | | | 7.41 | | |
| | | 10/31/2001 | | | 10.79 | | | | (0.10 | ) | | | (2.00 | ) | | | (2.10 | ) | | | – | | | | – | | | | – | | | | 8.69 | | |
| Class C | | 10/31/2005 | | | 9.86 | | | | 0.02 | | | | 0.77 | | | | 0.79 | | | | (0.01 | ) | | | – | | | | (0.01 | ) | | | 10.64 | | |
| | | 10/31/2004 | | | 8.87 | | | | – | | | | 1.00 | | | | 1.00 | | | | (0.01 | ) | | | – | | | | (0.01 | ) | | | 9.86 | | |
| | | 10/31/2003 | | | 7.32 | | | | (0.01 | ) | | | 1.56 | | | | 1.55 | | | | – | | | | – | | | | – | | | | 8.87 | | |
| | | | | | | Ratios/Supplemental Data | |
| | | For the
Period | | Total | | Net Assets,
End of
Period | | Ratio of Expenses
to Average
Net Assets (a) | | Net Investment
Income (Loss)
to Average | | Portfolio
Turnover | |
| | | Ended (g) | | Return (c) | | (000's) | | Net (e) | | Total (f) | | Net Assets (a) | | Rate (b) | |
| Class A | | 10/31/2005 | | | 9.10 | % | | $ | 406,609 | | | | 1.31 | % (h) | | | 1.31 | % (h) | | | 1.16 | % | | | 28 | % | |
| | | 10/31/2004 | | | 12.38 | | | | 157,103 | | | | 1.54 | | | | 1.54 | | | | 1.11 | | | | 61 | | |
| | | 10/31/2003 | | | 20.40 | | | | 8,988 | | | | 1.85 | | | | 2.56 | | | | 0.53 | | | | 76 | | |
| | | 10/31/2002 | | | (14.15 | ) | | | 7,908 | | | | 1.80 | | | | 2.43 | | | | 0.09 | | | | 161 | | |
| | | 10/31/2001 | | | (18.80 | ) | | | 5,183 | | | | 1.55 | | | | 2.49 | | | | (0.28 | ) | | | 113 | | |
| Class B | | 10/31/2005 | | | 8.01 | | | | 16,927 | | | | 2.36 | (h) | | | 2.36 | (h) | | | 0.23 | | | | 28 | | |
| | | 10/31/2004 | | | 11.54 | | | | 18,612 | | | | 2.32 | | | | 2.32 | | | | 0.20 | | | | 61 | | |
| | | 10/31/2003 | | | 19.70 | | | | 17,245 | | | | 2.50 | | | | 3.21 | | | | (0.12 | ) | | | 76 | | |
| | | 10/31/2002 | | | (14.76 | ) | | | 14,446 | | | | 2.45 | | | | 3.08 | | | | (0.56 | ) | | | 161 | | |
| | | 10/31/2001 | | | (19.41 | ) | | | 11,623 | | | | 2.20 | | | | 3.14 | | | | (0.93 | ) | | | 113 | | |
| Class C | | 10/31/2005 | | | 7.93 | | | | 7,163 | | | | 2.42 | (h) | | | 2.42 | (h) | | | 0.16 | | | | 28 | | |
| | | 10/31/2004 | | | 11.38 | | | | 7,586 | | | | 2.50 | | | | 2.54 | | | | 0.04 | | | | 61 | | |
| | | 10/31/2003 | | | 21.17 | | | | 1,230 | | | | 2.50 | | | | 3.21 | | | | (0.12 | ) | | | 76 | | |
NOTES TO FINANCIAL HIGHLIGHTS
(a) Annualized.
(b) Not annualized.
(c) Total Return has been calculated for the applicable period without deduction of a sales load, if any, on an initial purchase. Periods of less than one year are not annualized.
(d) Per share information is calculated based on average number of shares outstanding.
(e) Ratio of Net Expenses to Average Net Assets is net of fee waivers and reimbursements by the investment adviser, if any (see note 2).
(f) Ratio of Total Expenses to Average Net Assets includes all expenses before fee waivers and reimbursements by the investment adviser.
(g) The inception date for the Fund's offering of share Class C was November 11, 2002.
(h) Ratios of Total Expenses to Average Net Assets and net Expenses to Average Net Assets are inclusive of recaptured expenses by the investment advisor. The impact of recaptured expenses was 0.06%, 0.06% and 0.07% for Class A, Class B and Class C, respectively (see Note 2).
The notes to the financial statements are an integral part of this report.
Transamerica IDEX Mutual Funds
Annual Report 2005
9
TA IDEX American Century Large Company Value
NOTES TO FINANCIAL STATEMENTS
At October 31, 2005
(all amounts in thousands)
NOTE 1. ORGANIZATION AND SIGNIFICANT ACCOUNTING POLICIES
Transamerica IDEX Mutual Funds is an open-end management investment company registered under the Investment Company Act of 1940, as amended (the "1940 Act").
In the normal course of business, TA IDEX American Century Large Company Value (the "Fund") enters into contracts that contain a variety of representations that provide general indemnifications. The Fund's maximum exposure under these arrangements is unknown, as this would involve future claims that may be made against the Fund and/or its affiliates that have not yet occurred. However, based on experience, the Fund expects the risk of loss to be remote.
This report should be read in conjunction with the current Fund prospectus, which contains more complete information about the Fund.
The following is a summary of significant accounting policies followed by the Fund in the preparation of the financial statements. In preparing the Fund's financial statements in accordance with accounting principles generally accepted in the United States of America ("GAAP"), estimates or assumptions (which could differ from actual results) may be used that affect reported amounts and disclosures.
Multiple class operations, income and expenses: The Fund currently offers three classes of shares, each with a public offering price that reflects different sales charges, if any, and expense levels. On June 15, 2004, Class C2 shares merged into Class C. On September 24, 2004, Class M shares merged into Class C. Class B shares will convert to Class A shares eight years after purchase. Income, non-class specific expenses and realized and unrealized gains and losses, are allocated daily to each class, based upon the value of shares outstanding method as permitted under Rule 18f-3 of the 1940 Act. Each class bears its own specific expenses as well as a portion of general, common expenses.
Security valuations: The Fund values its investments at the close of the New York Stock Exchange ("NYSE"), normally 4 p.m. ET, each day the NYSE is open for business. Fund investments are valued at the last sale price or closing price on the day of valuation taken from the primary exchange where the security is principally traded.
Securities traded in the over-the-counter market and listed securities for which no sale was reported on that date are valued at the last quoted bid price.
Debt securities are valued based on a price quotation or other equivalent indication of value supplied by an exchange, a pricing service or a major market maker; however, those that mature in sixty days or less are valued at amortized cost, which approximates market.
Investment company securities are valued at the net asset value of the underlying portfolio.
Other securities for which quotations are not readily available or whose values have been determined to be unreliable are valued at fair market value as determined in good faith by the Fund's Administrative Valuation Committee, under the supervision of the Board's Valuation Committee, using guidelines adopted by the Board of Trustees.
Cash: The Fund may leave cash overnight in its cash account with the custodian, Investors Bank & Trust Company ("IBT"). IBT has been contracted on behalf of the Fund to invest the excess cash into a savings account, which at October 31, 2005, was paying an interest rate of 2.76%.
Repurchase agreements: The Fund is authorized to enter into repurchase agreements. The Fund, through its custodian, IBT, receives delivery of the underlying securities, the value of which at the time of purchase is required to be an amount equal to at least 100% of the resale price. The Fund will bear the risk of value fluctuations until the security can be sold and may encounter delays and incur costs in liquidating the security. In the event of bankruptcy or insolvency of the seller, delays and costs may be incurred.
Securities lending: The Fund may lend securities to qualified borrowers, with IBT acting as the Fund's lending agent. The Fund earns negotiated lenders' fees. The Fund receives cash and/or securities as collateral against the loaned securities. Cash collateral received is invested in short term, interest bearing securities. The Fund monitors the market value of securities loaned on a daily basis and requires collateral in an amount at least equal to the value of the securities loaned. Income from loaned securities on the Statement of Operations is net of fees, in the amount of $24, earned by IBT for its services.
Security transactions and investment income: Security transactions are recorded on the trade date. Security gains and losses are calculated on the specific identification basis. Dividend income, if any, is recorded on the ex-dividend date or, in the case of foreign securities, as soon as the Fund is informed of the ex-dividend date. Interest income, including accretion of discounts and amortization of premiums, is recorded on the accrual basis commencing on the settlement date.
Redemption fees: A short-term trading redemption fee may be assessed on any Fund shares in a fund account that are sold during the first five (5) NYSE trading days following their purchase date. This redemption fee will equal 2% of the amount redeemed and shares held the longest will be treated as being redeemed first and shares held the shortest as being redeemed last. For the year ended October 31, 2005, the Fund received less than $1 in redemption fees.
Dividend distributions: Distributions to shareholders are recorded on the ex-dividend date and are determined in accordance with Federal income tax regulations which may differ from GAAP.
Transamerica IDEX Mutual Funds
Annual Report 2005
10
TA IDEX American Century Large Company Value
NOTES TO FINANCIAL STATEMENTS (continued)
At October 31, 2005
(all amounts in thousands)
NOTE 2. RELATED PARTY TRANSACTIONS
Effective January 1, 2005 AEGON/Transamerica Fund Advisors, Inc. was renamed Transamerica Fund Advisors, Inc. ("TFAI"); AEGON/Transamerica Fund Services, Inc. and AEGON/Transamerica Investor Services, Inc. merged into one entity and was renamed Transamerica Fund Services, Inc. ("TFS").
TFAI is the Fund's investment adviser. TFS is the Fund's administrator and transfer agent. AFSG Securities Corp. ("AFSG") is the Fund's distributor/principal underwriter. TFAI, TFS , and AFSG are affiliates of AEGON, NV, a Netherlands corporation.
The following schedule reflects the percentage of fund assets owned by affiliated mutual funds:
| | | Net
Assets | | % of
Net Assets | |
TA IDEX Asset Allocation–
Conservative Portfolio | | $ | 25,864 | | | | 6.01 | % | |
TA IDEX Asset Allocation–
Growth Portfolio | | | 87,514 | | | | 20.32 | % | |
TA IDEX Asset Allocation–
Moderate Growth Portfolio | | | 196,214 | | | | 45.56 | % | |
TA IDEX Asset Allocation–
Moderate Portfolio | | | 86,414 | | | | 20.06 | % | |
| Total | | $ | 396,006 | | | | 91.95 | % | |
Investment advisory fees: The Fund pays management fees to TFAI based on average daily net assets ("ANA") at the following breakpoints:
From November 1, 2004 to December 31, 2004:
0.90% of the first $100 million of ANA
0.85% of the next $150 million of ANA
0.80% of ANA over $250 million
From January 1, 2005 on:
0.85% of the first $250 million of ANA
0.80% of the next $250 million of ANA
0.775% of the next $250 million of ANA
0.70 of ANA over $750 million
TFAI has contractually agreed to waive its advisory fee and will reimburse the Fund to the extent that operating expenses, excluding 12b-1 fees, exceed the following stated annual limit:
From November 1, 2004 to December 31, 2004:
1.50% Expense Limit
From January 1, 2005 on:
1.45% Expense Limit
If total Fund expenses fall below the annual expense limitation agreement agreed to by the adviser within the succeeding three years, the Fund may be required to pay that adviser a portion or all of the reimbursed class expenses.
For the year ended October 31, 2005, the Fund recaptured the following of previously waived expenses.
| | | Amount
Recaptured | | Year Waived/
Reimbursed | |
| Fund | | $ | 207 | | | Fiscal Year 2003 | |
| Class C | | | 1 | | | Fiscal Year 2004 | |
| | | $ | 208 | | | | |
There are no amounts available for recapture at October 31, 2005.
Distribution and service fees: The Fund has a 12b-1 distribution plan under the 1940 Act pursuant to which an annual fee, based on average daily net assets, is paid to the distributor for various disbursements such as broker-dealer account servicing fees and other promotional expenses of the Fund. The Fund is authorized under the 12b-1 plan to pay fees on each class up to the following limits:
| Class A | | | 0.35 | % | |
| Class B | | | 1.00 | % | |
| Class C | | | 1.00 | % | |
In the case the Fund or a class of shares of the Fund is closed to new investors or investments, the Fund is authorized to pay 12b-1 fees for past sales and distribution efforts and present and past investor services.
Underwriter commissions relate to front-end sales charges imposed for Class A shares and contingent deferred sales charges from Classes B, C, and certain A share redemptions. For the year ended October 31, 2005, the underwriter commissions were as follows:
| Received by Underwriter | | $ | 96 | | |
| Retained by Underwriter | | | 6 | | |
| Contingent Deferred Sales Charge | | | 48 | | |
Administrative services: The Fund has entered into an agreement with TFS for financial and legal fund administration services. As of
Transamerica IDEX Mutual Funds
Annual Report 2005
11
TA IDEX American Century Large Company Value
NOTES TO FINANCIAL STATEMENTS (continued)
At October 31, 2005
(all amounts in thousands)
NOTE 2.–(continued)
January 1, 2005 the Fund pays TFS an annual fee of 0.02% of ANA. Prior to January 1, 2005 the Fund paid TFS an annual fee of 0.015% of ANA. The Legal fees on the Statement of Operations are for fees paid to external legal counsel.
Transfer agent fees: The Fund pays TFS an annual per-account charge for each open and closed account. The Fund paid TFS $105 for the year ended October 31, 2005.
Brokerage commissions: Brokerage commissions incurred on security transactions placed with an affiliate of the adviser for the period from inception through October 31, 2005, were less than $1.
Deferred compensation plan: Each eligible independent Fund Trustee may elect to participate in a non-qualified deferred compensation plan maintained by Transamerica IDEX Mutual Funds (the "Plan"). Under the Plan, such Trustees may defer payment of all or a portion of their total fees earned as a Fund Trustee. Each Trustee who is a participant in the Plan may elect that the earnings, losses or gains credited to his or her deferred fee amounts be determined based on a deemed investment in any series of Transamerica IDEX Mutual Funds, including the Fund. The right of a participant to receive a distribution from the Plan of the deferred fees is an unsecured claim against the general assets of all series of Transamerica IDEX Mutual Funds. The pro rata liability to the Fund of all deferred fees i n the Plan amounted, as of October 31, 2005, to $6.
NOTE 3. INVESTMENT TRANSACTIONS
The cost of securities purchased and proceeds from securities sold (excluding short-term securities) for the year ended October 31, 2005, were as follows:
| Purchases of securities: | | | |
| Long-Term | | $ | 329,594 | | |
| U.S. Government | | | – | | |
| Proceeds from maturities and sales of securities: | | | |
| Long-Term | | | 105,605 | | |
| U.S. Government | | | – | | |
NOTE 4. FEDERAL INCOME TAX MATTERS
The Fund has not made any provision for federal income or excise taxes due to its policy to distribute all of its taxable income and capital gains to its shareholders and otherwise qualify as a regulated investment company under Subchapter M of the Internal Revenue Code. Income and capital gain distributions are determined in accordance with income tax regulations, which may differ from GAAP. These differences are primarily due to differing treatment for items including, but not limited to, wash sales and distribution reclasses.
Therefore, distributions determined in accordance with tax regulations may differ significantly in amount or character from net investment income and realized gains for financial reporting purposes. Financial reporting records are adjusted for permanent book/tax differences to reflect tax character. Financial records are not adjusted for temporary differences. These reclassifications are as follows:
Shares of beneficial interest, unlimited
shares authorized | | $ | (1 | ) | |
| Accumulated net investment income (loss) | | | 30 | | |
Undistributed net realized gain (loss) from investment
securities | | | (29 | ) | |
The tax character of distributions paid may differ from the character of distributions shown in the Statement of Changes in Net Assets due to short-term gains being treated as ordinary income for tax purposes. The tax character of distributions paid during 2004 and 2005 was as follows:
| 2004 Distributions paid from: | |
| Ordinary Income | | $ | 79 | | |
| Long-term Capital Gain | | | – | | |
| 2005 Distributions paid from: | |
| Ordinary Income | | | 5,067 | | |
| Long-term Capital Gain | | | – | | |
The tax basis components of distributable earnings as of October 31, 2005, are as follows:
| Undistributed Ordinary Income | | $ | 7,523 | | |
| Undistributed Long-term Capital Gains | | $ | 4,357 | | |
| Capital Loss Carryforward | | $ | – | | |
| Net Unrealized Appreciation (Depreciation) | | $ | 9,814 | | |
The capital loss carryforward utilized during the year ended October 31, 2005 was $2,425.
The aggregate cost of investments and composition of unrealized appreciation (depreciation) for federal income tax purposes as of October 31, 2005, are as follows:
| Federal Tax Cost Basis | | $ | 454,732 | | |
| Unrealized Appreciation | | $ | 24,700 | | |
| Unrealized (Depreciation) | | | (14,886 | ) | |
| Net Unrealized Appreciation (Depreciation) | | $ | 9,814 | | |
NOTE 5. REGULATORY PROCEEDINGS
There continues to be significant federal and state regulatory activity relating to financial services companies, particularly mutual fund companies and their investment advisers. As part of an ongoing investigation regarding potential market timing, recordkeeping and trading
Transamerica IDEX Mutual Funds
Annual Report 2005
12
TA IDEX American Century Large Company Value
NOTES TO FINANCIAL STATEMENTS (continued)
At October 31, 2005
(all amounts in thousands)
NOTE 5.–(continued)
compliance issues and matters affecting the Fund's investment adviser, TFAI, and certain affiliates and former employees of TFAI, the SEC staff has indicated that it is likely to take some action against TFAI and certain of its affiliates at the conclusion of the investigation. The potential timing and the scope of any such action is difficult to predict. Although the impact of any action brought against TFAI and/or its affiliates is difficult to assess at the present time, the Fund currently believes that the likelihood that any such action will have a material adverse impact on it is remote. It is important to note that the Fund is not aware of any allegation of wrongdoing against it and its Board at the time this annual report is printed. Although it is not anticipated that these developments will have an adverse impact on the Fund, there can be no assurance at this time. TFAI and its affiliates are actively working with the SEC in regard to this matter; however, the exact resolution cannot be determined at this time. TFAI will take such actions that it deems necessary or appropriate to continue providing management services to the Fund and to bring all matters to an appropriate conclusion.
TFAI and/or its affiliates, and not the Fund, will bear the costs regarding these regulatory matters.
Transamerica IDEX Mutual Funds
Annual Report 2005
13
Report of Independent Registered Certified Public Accounting Firm
To the Board of Trustees and Shareholders of
TA IDEX American Century Large Company Value
In our opinion, the accompanying statement of assets and liabilities, including the schedule of investments, and the related statements of operations and of changes in net assets and the financial highlights present fairly, in all material respects, the financial position of TA IDEX American Century Large Company Value (the "Fund") (one of the portfolios constituting the Transamerica IDEX Mutual Funds) at October 31, 2005, the results of its operations for the year then ended, the changes in its net assets for each of the two years in the period then ended and the financial highlights for each of the periods presented, in conformity with accounting principles generally accepted in the United States of America. These financial statements and financial highlights (hereafter referred to as "financial statements") are the responsibility of the Fund's management; our responsibility is to express an opin ion on these financial statements based on our audits. We conducted our audits of these financial statements in accordance with the standards of the Public Company Accounting Oversight Board (United States). Those standards require that we plan and perform the audit to obtain reasonable assurance about whether the financial statements are free of material misstatement. An audit includes examining, on a test basis, evidence supporting the amounts and disclosures in the financial statements, assessing the accounting principles used and significant estimates made by management, and evaluating the overall financial statement presentation. We believe that our audits, which included confirmation of securities at October 31, 2005 by correspondence with the custodian, provide a reasonable basis for our opinion.

December 22, 2005
Transamerica IDEX Mutual Funds
Annual Report 2005
14
TA IDEX American Century Large Company Value
SUPPLEMENTAL INFORMATION (unaudited)
TAX INFORMATION
For dividends paid during the year ended October 31, 2005, the Fund designated $9,386 as qualified dividend income.
For corporate shareholders, 90% of investment income (dividend income plus short-term gains, if any) qualifies for the dividends received deduction.
The information and distributions reported herein may differ from the information and distributions taxable to the shareholders for the calendar year ending December 31, 2005. Complete information will be computed and reported in conjunction with your 2005 Form 1099-DIV.
Transamerica IDEX Mutual Funds
Annual Report 2005
15
TA IDEX Asset Allocation–Conservative Portfolio
MARKET ENVIRONMENT
The past twelve months were a volatile period in the stock market, but it ended with solid overall gains. Stocks surged in post-election euphoria at the end of 2004; but then spent the early part of 2005 giving up most of those gains. After hitting bottom in May 2005, most stock indexes posted good gains through the end of November. Large cap stocks lagged the riskier parts of the market. Over the twelve month period, the Standard and Poor's 500 Composite Stock Index ("S&P 500") returned 8.71%, while the Standard and Poor's 400 MidCap Index doubled that with a 17.64% gain. International stocks rose even more, with the Morgan Stanley Capital International EAFE Index up more than 18% in dollar terms. Value stocks gained slightly more than growth stocks over the period, with value doing well early in the year and growth coming on strong in the past six months.
Driving the market's swing was uncertainty about the economy. Fear that the Federal Reserve Board ("Fed") had clamped down too hard stunted performance early in 2005, compounded by worries about Hurricane Katrina later in the year. After all was said and done, though, the economy continued to chug along nicely, as evidenced by continued consumer strength, solid corporate earnings, and continuing productivity growth. The key question mark remaining for the markets is whether the new Fed Chairman will be able to engineer a soft landing or will he crash the economy into another recession.
Short-term interest rates rose dramatically over the year, as the Fed continued hiking rates in 25 basis point doses to forestall inflation. Nevertheless, longer term rates were little changed, leading to a modest 1.13% gain in the Lehman Brothers Aggregate Bond Index ("LBAB") for the year. Bonds with significant credit risk performed much better overall, with emerging-markets bond funds up more than 12%; convertible bond funds up 7%; and high-yield bond funds up more than 3%.
PERFORMANCE
For the year ended October 31, 2005, TA IDEX Asset Allocation–Conservative Portfolio, Class A returned 6.30%. By comparison its primary and secondary benchmarks, the LBAB and the Dow Jones Wilshire 5000 Total Market Index ("DJ Wilshire 5000"), returned 1.13% and 10.77%, respectively.
STRATEGY REVIEW
How did you manage the portfolio in this market environment?
We maintained our strategy of persistent diversification across global equity markets, including small and mid cap stocks, which were key sources of the portfolio's strong relative performance. The portfolio was up 6.30% over the trailing twelve months, versus 1.13% for the LBAB and 10.77% for the DJ Wilshire 5000. Moreover, it landed in the top quintile of Morningstar's Conservative Allocation category.
Which individual holdings had the greatest positive impact on performance?
The biggest winner at the top of the portfolio was TA IDEX Transamerica Convertible Securities. This fund's equity-sensitive bonds gained more than 9% for the year. This fund started the year at 11% of assets but due to profit taking over the course of the year it was down to 7% by year end.
Stock funds kicked in even bigger gains. TA IDEX Transamerica Equity and TA IDEX Transamerica Small/Mid Cap Value both added more than 20% for the year; while TA IDEX Transamerica Growth Opportunities and TA IDEX Clarion Real Estate Securities came close to the 20% mark. TA IDEX T. Rowe Price Health Sciences added more than 15%. These five big winners counted for more than 15% of the portfolio's assets at the beginning of the year, and nearly 13% by year end.
Which individual holdings had the greatest negative impact on performance?
At the start of the year, two of the portfolio's largest equity holdings were TA IDEX Salomon All Cap and TA IDEX Salomon Investors Value, which accounted for more than 10% of assets. These two holdings underperformed their benchmarks through March 2005, at which point they were cut to a total of 2.1% of assets. Since that time, their performance has improved.
Which sectors/industries had the greatest impact on performance?
The portfolio started the year with 6% of assets in TA IDEX Clarion Real Estate Securities, which primarily owns real estate investment trusts ("REIT"s). The real estate sector was one of the best performing sectors across the U.S. stock market, and as a result this fund was up nearly 20% for the year. Over the course of the year profit taking reduced the stake in the real estate fund to less than 3% of assets.
Which countries had the greatest impact on performance?
Because of the limited international choices over the course of the year, the portfolio's foreign exposure was generally below its target level. The largest international exposure of the portfolio was to the eurozone, at approximately 8% of equity assets.
Todd Porter, CFA
Portfolio Manager
Morningstar Associates, LLC
Transamerica IDEX Mutual Funds
Annual Report 2005
1
TA IDEX Asset Allocation–Conservative Portfolio
Comparison of change in value of $10,000 investment in Class A shares and its comparative indices.

Average Annual Total Return for Periods Ended 10/31/05
| | | 1 year | | From
Inception | | Inception
Date | |
| Class A (NAV) | | | 6.30 | % | | | 6.55 | % | | 3/1/02 | |
| Class A (POP) | | | 0.46 | % | | | 4.92 | % | | 3/1/02 | |
| LBAB1 | | | 1.13 | % | | | 4.82 | % | | 3/1/02 | |
| DJ Wilshire 50001 | | | 10.77 | % | | | 6.00 | % | | 3/1/02 | |
| Class B (NAV) | | | 5.65 | % | | | 5.84 | % | | 3/1/02 | |
| Class B (POP) | | | 0.65 | % | | | 5.37 | % | | 3/1/02 | |
| Class C (NAV) | | | 5.61 | % | | | 10.37 | % | | 11/11/02 | |
| Class C (POP) | | | 4.61 | % | | | 10.37 | % | | 11/11/02 | |
NOTES
1 The Lehman Brothers Aggregate Bond (LBAB) Index and the Dow Jones Wilshire 5000 Total Market (DJ Wilshire 5000) Index are unmanaged indices used as a general measure of market performance. Calculations assume dividends and capital gains are reinvested and do not include any managerial expenses. From inception calculation is based on life of Class A shares. Source: Standard & Poor's Micropal®© Micropal, Inc. 2005 – 1-800-596-5323 – http://www.funds-sp.com.
The performance data presented represents past performance, future results may vary. Performance data does not reflect the deduction of taxes that would be paid on fund distributions or the redemption of fund shares. Investment return and principal value will fluctuate so that an investor's shares, when redeemed, may be worth more or less than their original cost. Current performance may be lower or higher than performance quoted. Please see www.transamericaidex.com for performance data current to the most recent month-end.
Public Offering Price (POP) returns include the reinvestment of dividends and capital gains and reflect the maximum sales charge of 5.5% for A shares or the maximum applicable contingent deferred sales charge (5% in the 1st year, decreasing to 0% after 6 years) for Class B shares and 1% (during the first 12 months) for Class C shares. Shares purchased prior to March 1, 2004 are subject to a maximum applicable contingent deferred sales charge (5% in the 1st year, decreasing to 0% after 7 years) for Class B shares and (2% in the 1st year, decreasing to 0% after 2 years) for Class C shares. Net Asset Value (NAV) returns include the reinvestment of dividends and capital gains but do not reflect any sales charges.
This material must be preceded or accompanied by a current prospectus, which includes specific contents regarding the investment objectives and policies of this fund.
Transamerica IDEX Mutual Funds
Annual Report 2005
2
TA IDEX Asset Allocation–Conservative Portfolio
UNDERSTANDING YOUR FUND'S EXPENSES
(unaudited)
SHAREHOLDER EXPENSES
Fund shareholders may incur two types of costs: (1) transaction costs, including sales charges (loads) on purchases, contingent deferred sales charges on redemptions and redemption fees; and (2) ongoing costs, including management fees, 12b-1 distribution and service fees, and other fund expenses.
The following Example is intended to help you understand your ongoing costs (in dollars and cents) of investing in a Fund and to compare these costs with the ongoing costs of investing in other funds.
The Example is based on an investment of $1,000 invested at May 1, 2005 and held for the entire period until October 31, 2005.
ACTUAL EXPENSES
The first line in the table below provides information about actual account values and actual expenses. You may use the information in this line, together with the amount you invested, to estimate the expenses that you paid over the period. Simply divide your account value by $1,000 (for example, an $8,600 account value divided by $1,000 = 8.6), then multiply the result by the number in the first line of your Fund under the heading entitled "Expenses Paid During Period" to estimate the expenses you paid on your account during this period. If your account is an IRA, your expenses could have included a $15 annual fee. The amount of any fee paid through your account would increase the estimate of expenses you paid during the period and decrease your ending account value.
HYPOTHETICAL EXAMPLE FOR COMPARISON PURPOSES
The second line in the table below provides information about hypothetical account values and hypothetical expenses based on the Fund's actual expense ratio and an assumed rate of return of 5% per year before expenses, which is not the Fund's actual return. The hypothetical account values and expenses may not be used to estimate the actual ending account balance or expenses you paid for the period. You may use this information to compare the ongoing costs of investing in your Fund and other funds. To do so, compare this 5% hypothetical example with the 5% hypothetical examples that appear in the shareholder reports of the other funds. As in the case of the actual expense example, if your account is subject to an IRA fee, the amount of the fee paid through your account would increase the hypothetical expenses you would have paid during the period and decrease the hypothetical ending account value.
Please note that the expenses shown in the table are meant to highlight your ongoing costs only and do not reflect any transactional costs, such as sales charges, redemption fees, brokerage commissions paid on purchases and sales of fund shares. Therefore, the second line under the Fund in the table is useful in comparing ongoing costs only, and will not help you determine the relative total costs of owning different funds. If any of these transaction costs were included, your costs would be higher. The expenses shown in the table do not reflect any fees that may be charged to you by brokers, financial intermediaries or other financial institutions.
| | | Beginning
Account
Value | | Ending
Account
Value | | Annualized
Expense
Ratio | | Expenses Paid
During Period (a) | |
| Class A | |
| Actual | | $ | 1,000.00 | | | $ | 1,048.20 | | | | 0.29 | % | | $ | 1.50 | | |
| Hypothetical (b) | | | 1,000.00 | | | | 1,023.74 | | | | 0.29 | | | | 1.48 | | |
| Class B | |
| Actual | | | 1,000.00 | | | | 1,044.60 | | | | 0.95 | | | | 4.90 | | |
| Hypothetical (b) | | | 1,000.00 | | | | 1,020.42 | | | | 0.95 | | | | 4.84 | | |
| Class C | |
| Actual | | | 1,000.00 | | | | 1,044.80 | | | | 0.91 | | | | 4.69 | | |
| Hypothetical (b) | | | 1,000.00 | | | | 1,020.62 | | | | 0.91 | | | | 4.63 | | |
(a) Expenses are calculated using each Fund's annualized expense ratio (as disclosed in the table), multiplied by the average account value for the period, multiplied by number of days in the period (184 days), and divided by the number of days in the year (365 days).
(b) 5% return per year before expenses.
GRAPHICAL PRESENTATION OF SCHEDULE OF INVESTMENTS
By Investment Type
At October 31, 2005
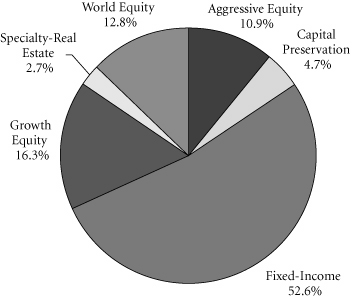
This chart shows the percentage breakdown by investment type of the Fund's total investment securities.
Transamerica IDEX Mutual Funds
Annual Report 2005
3
TA IDEX Asset Allocation–Conservative Portfolio
SCHEDULE OF INVESTMENTS
At October 31, 2005
(all amounts except share amounts in thousands)
| | | Shares | | Value | |
| INVESTMENT COMPANIES (99.9%) ø | | | |
| Aggressive Equity (10.9%) | | | |
| TA IDEX J.P. Morgan Mid Cap Value ‡ | | | 1,207,492 | | | $ | 12,002 | | |
| TA IDEX T. Rowe Price Health Sciences | | | 1,346,777 | | | | 16,754 | | |
| TA IDEX T. Rowe Price Small Cap ‡ | | | 165,997 | | | | 2,093 | | |
TA IDEX Transamerica Growth
Opportunities ‡ | | | 664,621 | | | | 5,217 | | |
| TA IDEX Transamerica Small/Mid Cap Value | | | 740,777 | | | | 12,364 | | |
| Capital Preservation (4.7%) | | | |
| TA IDEX Transamerica Money Market | | | 20,968,407 | | | | 20,968 | | |
| Fixed-Income (52.6%) | | | |
| TA IDEX PIMCO Real Return TIPS | | | 4,103,907 | | | | 41,983 | | |
| TA IDEX PIMCO Total Return | | | 2,822,018 | | | | 28,672 | | |
| TA IDEX Short Term Bond | | | 4,477,852 | | | | 43,838 | | |
| TA IDEX Transamerica Convertible Securities | | | 2,682,193 | | | | 31,006 | | |
| TA IDEX Transamerica Flexible Income | | | 2,651,469 | | | | 24,685 | | |
| TA IDEX Transamerica High-Yield Bond | | | 7,115,124 | | | | 63,823 | | |
| Growth Equity (16.2%) | | | |
TA IDEX American Century Large Company
Value | | | 2,355,515 | | | | 25,864 | | |
| TA IDEX Great Companies-TechnologySM | | | 789,747 | | | | 3,017 | | |
| | | Shares | | Value | |
| Growth Equity (continued) | |
| TA IDEX Janus Growth ‡ | | | 528,712 | | | $ | 13,038 | | |
| TA IDEX Salomon All Cap | | | 751 | | | | 12 | | |
| TA IDEX Salomon Investors Value | | | 319,379 | | | | 4,526 | | |
| TA IDEX T. Rowe Price Tax-Efficient Growth ‡ | | | 396,771 | | | | 4,111 | | |
| TA IDEX Transamerica Equity | | | 1,255,078 | | | | 11,133 | | |
| TA IDEX UBS Large Cap Value ‡ | | | 976,100 | | | | 10,669 | | |
| Specialty–Real Estate (2.6%) | |
| TA IDEX Clarion Real Estate Securities | | | 732,812 | | | | 11,820 | | |
| World Equity (12.9%) | |
| TA IDEX Evergreen International Small Cap ‡ | | | 836,224 | | | | 10,603 | | |
| TA IDEX Marsico International Growth ‡ | | | 351,690 | | | | 3,900 | | |
| TA IDEX Templeton Great Companies Global | | | 1,175,382 | | | | 29,008 | | |
TA IDEX Van Kampen Emerging Markets
Debt | | | 1,319,525 | | | | 13,789 | | |
| Total Investment Companies (cost: $418,034) | | | | | | $ | 444,895 | | |
| SUMMARY: | |
| Investment companies, at value | | | 99.9 | % | | $ | 444,895 | | |
| Other assets in excess of liabilities | | | 0.1 | % | | | 237 | | |
| Net assets | | | 100.0 | % | | $ | 445,132 | | |
NOTES TO SCHEDULE OF INVESTMENTS:
‡ Non-income producing.
Ø The Fund invests its assets in Class A shares of the underlying TA IDEX Mutual Funds, which are affiliates of the Fund.
The notes to the financial statements are an integral part of this report.
Transamerica IDEX Mutual Funds
Annual Report 2005
4
TA IDEX Asset Allocation–Conservative Portfolio
STATEMENT OF ASSETS AND LIABILITIES
At October 31, 2005
(all amounts except per share amounts in thousands)
| Assets: | | | |
Investment in affiliated investment companies at value
(cost: $418,034) | | $ | 444,895 | | |
| Cash | | | 3 | | |
| Receivables: | |
| Shares of beneficial interest sold | | | 1,786 | | |
| Dividends | | | 103 | | |
| Other | | | 11 | | |
| | | | 446,798 | | |
| Liabilities: | | | |
| Investment securities purchased | | | 99 | | |
| Accounts payable and accrued liabilities: | |
| Shares of beneficial interest redeemed | | | 1,260 | | |
| Management and advisory fees | | | 38 | | |
| Distribution and service fees | | | 175 | | |
| Transfer agent fees | | | 37 | | |
| Administration fees | | | 8 | | |
| Other | | | 49 | | |
| | | | 1,666 | | |
| Net Assets | | $ | 445,132 | | |
| Net Assets Consist of: | | | |
Shares of beneficial interest, unlimited shares
authorized, no par value | | $ | 402,124 | | |
| Undistributed net investment income (loss) | | | 3,623 | | |
Undistributed net realized gain (loss) from
investment in affiliated investment companies | | | 12,525 | | |
Net unrealized appreciation (depreciation) on
investment in affiliated investment companies | | | 26,860 | | |
| Net Assets | | $ | 445,132 | | |
| Net Assets by Class: | | | |
| Class A | | $ | 129,724 | | |
| Class B | | | 106,449 | | |
| Class C | | | 208,959 | | |
| Shares Outstanding: | | | |
| Class A | | | 11,430 | | |
| Class B | | | 9,407 | | |
| Class C | | | 18,464 | | |
| Net Asset Value Per Share: | | | |
| Class A | | $ | 11.35 | | |
| Class B | | | 11.32 | | |
| Class C | | | 11.32 | | |
| Maximum Offering Price Per Share (a): | | | |
| Class A | | $ | 12.01 | | |
(a) Includes the maximum selling commission (represented as a percentage of offering price) which is reduced on certain levels of sales as set forth in the Prospectus. Net asset value per share for Classes B and C shares represents offering price. The redemption price for Classes B and C shares equals net
asset value less any applicable contingent deferred sales charge.
STATEMENT OF OPERATIONS
For the year ended October 31, 2005
(all amounts in thousands)
| Investment Income: | | | |
| Dividends from affiliated investment companies | | $ | 13,108 | | |
| Expenses: | | | |
| Management and advisory fees | | | 421 | | |
| Distribution and service fees: | |
| Class B | | | 699 | | |
| Class C | | | 1,284 | | |
| Transfer agent fees: | |
| Class A | | | 128 | | |
| Class B | | | 125 | | |
| Class C | | | 180 | | |
| Printing and shareholder reports | | | 25 | | |
| Custody fees | | | 34 | | |
| Administration fees | | | 81 | | |
| Legal fees | | | 28 | | |
| Audit fees | | | 19 | | |
| Trustees fees | | | 19 | | |
| Registration fees: | |
| Class A | | | 19 | | |
| Class B | | | 18 | | |
| Class C | | | 25 | | |
| Other | | | 5 | | |
| Total expenses | | | 3,110 | | |
| Net Investment Income (Loss) | | | 9,998 | | |
Net Realized and Unrealized Gain (Loss) on Investment
in Affiliated Investment Companies: | | | |
Realized gain (loss) from investment in affiliated
investment companies | | | 11,331 | | |
Realized gain distributions from investment in
affiliated investment companies | | | 1,295 | | |
| | | | 12,626 | | |
Increase (decrease) in unrealized appreciation
(depreciation) on investment in affiliated
investment companies | | | 683 | | |
Net Gain (Loss) on Investment in Affiliated
Investment Companies | | | 13,309 | | |
Net Increase (Decrease) in Net Assets Resulting
from Operations | | $ | 23,307 | | |
The notes to the financial statements are an integral part of this report.
Transamerica IDEX Mutual Funds
Annual Report 2005
5
TA IDEX Asset Allocation–Conservative Portfolio
STATEMENTS OF CHANGES IN NET ASSETS
For the years ended
(all amounts in thousands)
| | | October 31,
2005 | | October 31,
2004 | |
| Increase (Decrease) In Net Assets From: | |
| Operations: | |
| Net investment income (loss) | | $ | 9,998 | | | $ | 3,509 | | |
Net realized gain (loss) from
investment in affiliated
investment companies | | | 12,626 | | | | 16,522 | | |
Net unrealized appreciation
(depreciation) on investment
in affiliated investment companies | | | 683 | | | | 4,037 | | |
| | | | 23,307 | | | | 24,068 | | |
| Distributions to Shareholders: | |
| From net investment income: | |
| Class A | | | (2,144 | ) | | | (3,504 | ) | |
| Class B | | | (1,503 | ) | | | (3,870 | ) | |
| Class C | | | (2,718 | ) | | | (5,152 | ) | |
| Class C2 | | | – | | | | (672 | ) | |
| Class M | | | – | | | | (306 | ) | |
| | | | (6,365 | ) | | | (13,504 | ) | |
| From net realized gains: | |
| Class A | | | (1,842 | ) | | | (137 | ) | |
| Class B | | | (1,833 | ) | | | (216 | ) | |
| Class C | | | (3,177 | ) | | | (232 | ) | |
| Class C2 | | | – | | | | (39 | ) | |
| Class M | | | – | | | | (18 | ) | |
| | | | (6,852 | ) | | | (642 | ) | |
| Capital Share Transactions: | |
| Proceeds from shares sold: | |
| Class A | | | 63,509 | | | | 65,052 | | |
| Class B | | | 20,440 | | | | 35,549 | | |
| Class C | | | 76,238 | | | | 106,542 | | |
| Class C2 | | | – | | | | 5,538 | | |
| Class M | | | – | | | | 1,592 | | |
| | | | 160,187 | | | | 214,273 | | |
Dividends and distributions
reinvested: | |
| Class A | | | 3,385 | | | | 3,046 | | |
| Class B | | | 2,755 | | | | 3,317 | | |
| Class C | | | 4,104 | | | | 3,961 | | |
| Class C2 | | | – | | | | 184 | | |
| Class M | | | – | | | | 288 | | |
| | | | 10,244 | | | | 10,796 | | |
| Cost of shares redeemed: | |
| Class A | | | (40,008 | ) | | | (30,060 | ) | |
| Class B | | | (25,746 | ) | | | (20,630 | ) | |
| Class C | | | (58,161 | ) | | | (40,681 | ) | |
| Class C2 | | | – | | | | (3,918 | ) | |
| Class M | | | – | | | | (2,031 | ) | |
| | | | (123,915 | ) | | | (97,320 | ) | |
| Redemption fees: | |
| Class B | | | 2 | | | | – | | |
| | | | 2 | | | | – | | |
| Class level exchanges: | |
| Class C | | | – | | | | 25,151 | | |
| Class C2 | | | – | | | | (17,719 | ) | |
| Class M | | | – | | | | (7,432 | ) | |
| | | | – | | | | – | | |
| | | October 31,
2005 | | October 31,
2004 | |
| Automatic conversions: | |
| Class A | | $ | 179 | | | $ | 128 | | |
| Class B | | | (179 | ) | | | (128 | ) | |
| | | | – | | | | – | | |
| | | | 46,518 | | | | 127,749 | | |
| Net increase (decrease) in net assets | | | 56,608 | | | | 137,671 | | |
| Net Assets: | |
| Beginning of year | | | 388,524 | | | | 250,853 | | |
| End of year | | $ | 445,132 | | | $ | 388,524 | | |
Undistributed Net Investment Income
(Loss) | | $ | 3,623 | | | $ | – | | |
| Share Activity: | |
| Shares issued: | |
| Class A | | | 5,666 | | | | 5,924 | | |
| Class B | | | 1,832 | | | | 3,244 | | |
| Class C | | | 6,810 | | | | 9,685 | | |
| Class C2 | | | – | | | | 501 | | |
| Class M | | | – | | | | 146 | | |
| | | | 14,308 | | | | 19,500 | | |
Shares issued–reinvested from
distributions: | |
| Class A | | | 301 | | | | 283 | | |
| Class B | | | 246 | | | | 309 | | |
| Class C | | | 366 | | | | 369 | | |
| Class C2 | | | – | | | | 17 | | |
| Class M | | | – | | | | 27 | | |
| | | | 913 | | | | 1,005 | | |
| Shares redeemed: | |
| Class A | | | (3,570 | ) | | | (2,753 | ) | |
| Class B | | | (2,298 | ) | | | (1,882 | ) | |
| Class C | | | (5,186 | ) | | | (3,715 | ) | |
| Class C2 | | | – | | | | (354 | ) | |
| Class M | | | – | | | | (186 | ) | |
| | | | (11,054 | ) | | | (8,890 | ) | |
| Class level exchanges: | |
| Class C | | | – | | | | 2,336 | | |
| Class C2 | | | – | | | | (1,654 | ) | |
| Class M | | | – | | | | (682 | ) | |
| | | | – | | | | – | | |
| Automatic conversions: | |
| Class A | | | 16 | | | | 12 | | |
| Class B | | | (16 | ) | | | (12 | ) | |
| | | | – | | | | – | | |
Net increase (decrease) in shares
outstanding: | |
| Class A | | | 2,413 | | | | 3,466 | | |
| Class B | | | (236 | ) | | | 1,659 | | |
| Class C | | | 1,990 | | | | 8,675 | | |
| Class C2 | | | – | | | | (1,490 | ) | |
| Class M | | | – | | | | (695 | ) | |
| | | | 4,167 | | | | 11,615 | | |
The notes to the financial statements are an integral part of this report.
Transamerica IDEX Mutual Funds
Annual Report 2005
6
TA IDEX Asset Allocation–Conservative Portfolio
FINANCIAL HIGHLIGHTS
| | | | | For a share of beneficial interest outstanding throughout each period | |
| | | | | Net Asset | | Investment Operations | | Distributions | | Net Asset | |
| | | For the
Period
Ended (d)(g) | | Value,
Beginning
of Period | | Net
Investment
Income (Loss) | | Net Realized
and Unrealized
Gain (Loss) | | Total
Operations | | From Net
Investment
Income | | From Net
Realized
Gains | | Total
Distributions | | Value,
End
of Period | |
| Class A | | 10/31/2005 | | $ | 11.07 | | | $ | 0.32 | | | $ | 0.37 | | | $ | 0.69 | | | $ | (0.22 | ) | | $ | (0.19 | ) | | $ | (0.41 | ) | | $ | 11.35 | | |
| | | 10/31/2004 | | | 10.67 | | | | 0.17 | | | | 0.77 | | | | 0.94 | | | | (0.51 | ) | | | (0.03 | ) | | | (0.54 | ) | | | 11.07 | | |
| | | 10/31/2003 | | | 9.22 | | | | 0.18 | | | | 1.47 | | | | 1.65 | | | | (0.20 | ) | | | – | | | | (0.20 | ) | | | 10.67 | | |
| | | 10/31/2002 | | | 10.00 | | | | 0.07 | | | | (0.85 | ) | | | (0.78 | ) | | | – | | | | – | | | | – | | | | 9.22 | | |
| Class B | | 10/31/2005 | | | 11.05 | | | | 0.24 | | | | 0.38 | | | | 0.62 | | | | (0.16 | ) | | | (0.19 | ) | | | (0.35 | ) | | | 11.32 | | |
| | | 10/31/2004 | | | 10.66 | | | | 0.10 | | | | 0.76 | | | | 0.86 | | | | (0.44 | ) | | | (0.03 | ) | | | (0.47 | ) | | | 11.05 | | |
| | | 10/31/2003 | | | 9.18 | | | | 0.11 | | | | 1.47 | | | | 1.58 | | | | (0.10 | ) | | | – | | | | (0.10 | ) | | | 10.66 | | |
| | | 10/31/2002 | | | 10.00 | | | | 0.03 | | | | (0.85 | ) | | | (0.82 | ) | | | – | | | | – | | | | – | | | | 9.18 | | |
| Class C | | 10/31/2005 | | | 11.05 | | | | 0.25 | | | | 0.37 | | | | 0.62 | | | | (0.16 | ) | | | (0.19 | ) | | | (0.35 | ) | | | 11.32 | | |
| | | 10/31/2004 | | | 10.66 | | | | 0.10 | | | | 0.76 | | | | 0.86 | | | | (0.44 | ) | | | (0.03 | ) | | | (0.47 | ) | | | 11.05 | | |
| | | 10/31/2003 | | | 9.19 | | | | 0.11 | | | | 1.46 | | | | 1.57 | | | | (0.10 | ) | | | – | | | | (0.10 | ) | | | 10.66 | | |
| | | | | | | Ratios/Supplemental Data | |
| | | For the
Period | | Total | | Net Assets,
End of
Period | | Ratio of Expenses
to Average
Net Assets (a)(j) | | Net Investment
Income (Loss)
to Average | | Portfolio
Turnover | |
| | | Ended (g) | | Return (c) | | (000's) | | Net (e) | | Total (f) | | Net Assets (a)(i) | | Rate (b) | |
| Class A | | 10/31/2005 | | | 6.30 | % | | $ | 129,724 | | | | 0.28 | % | | | 0.28 | % | | | 2.85 | % | | | 32 | % | |
| | | 10/31/2004 | | | 8.97 | | | | 99,811 | | | | 0.29 | (h) | | | 0.29 | (h) | | | 1.55 | | | | 11 | | |
| | | 10/31/2003 | | | 18.18 | | | | 59,250 | | | | 0.41 | | | | 0.41 | | | | 1.80 | | | | 22 | | |
| | | 10/31/2002 | | | (7.80 | ) | | | 9,482 | | | | 0.45 | | | | 1.21 | | | | 1.27 | | | | 8 | | |
| Class B | | 10/31/2005 | | | 5.65 | | | | 106,449 | | | | 0.93 | | | | 0.93 | | | | 2.15 | | | | 32 | | |
| | | 10/31/2004 | | | 8.21 | | | | 106,601 | | | | 0.92 | (h) | | | 0.92 | (h) | | | 0.93 | | | | 11 | | |
| | | 10/31/2003 | | | 17.38 | | | | 85,134 | | | | 1.06 | | | | 1.06 | | | | 1.15 | | | | 22 | | |
| | | 10/31/2002 | | | (8.20 | ) | | | 23,229 | | | | 1.10 | | | | 1.86 | | | | 0.62 | | | | 8 | | |
| Class C | | 10/31/2005 | | | 5.61 | | | | 208,959 | | | | 0.90 | | | | 0.90 | | | | 2.21 | | | | 32 | | |
| | | 10/31/2004 | | | 8.26 | | | | 182,112 | | | | 0.93 | (h) | | | 0.93 | (h) | | | 0.89 | | | | 11 | | |
| | | 10/31/2003 | | | 17.25 | | | | 83,165 | | | | 1.06 | | | | 1.06 | | | | 1.15 | | | | 22 | | |
NOTES TO FINANCIAL HIGHLIGHTS
(a) Annualized.
(b) Not annualized.
(c) Total Return has been calculated for the applicable period without deduction of a sales load, if any, on an initial purchase. Periods of less than one year are not annualized.
(d) Per share information is calculated based on average number of shares outstanding.
(e) Ratio of Net Expenses to Average Net Assets is net of fee waivers and reimbursements by the investment adviser, if any.
(f) Ratio of Total Expenses to Average Net Assets includes all expenses before fee waivers and reimbursements by the investment adviser.
(g) TA IDEX Asset Allocation–Conservative Portfolio ("the Fund") commenced operations on March 1, 2002. The inception date for the Fund's offering of share Class C is November 11, 2002.
(h) Ratios of Total Expenses to Average Net Assets and Net Expenses to Average Net Assets are inclusive of recaptured expenses by the investment advisor. The impact of recaptured expenses was 0.01%, 0.01% and 0.01% for Class A, Class B and Class C, respectively (see Note 2).
(i) Recognition of net investment income by the Fund is affected by the timing of the declaration of dividends by the underlying companies in which the Fund invests.
(j) Does not include expenses of the investment companies in which the Fund invests.
The notes to the financial statements are an integral part of this report.
Transamerica IDEX Mutual Funds
Annual Report 2005
7
TA IDEX Asset Allocation–Conservative Portfolio
NOTES TO FINANCIAL STATEMENTS
At October 31, 2005
(all amounts in thousands)
NOTE 1. ORGANIZATION AND SIGNIFICANT ACCOUNTING POLICIES
Transamerica IDEX Mutual Funds is an open-end management investment company registered under the Investment Company Act of 1940, as amended (the "1940 Act").
In the normal course of business, TA IDEX Asset Allocation–
Conservative Portfolio (the "Fund") enters into contracts that contain a variety of representations that provide general indemnifications. The Fund's maximum exposure under these arrangements is unknown, as this would involve future claims that may be made against the Fund and/or its affiliates that have not yet occurred. However, based on experience, the Fund expects the risk of loss to be remote.
This report should be read in conjunction with the current Fund prospectus, which contains more complete information about the Fund.
The following is a summary of significant accounting policies followed by the Fund in the preparation of the financial statements. In preparing the Fund's financial statements in accordance with accounting principles generally accepted in the United States of America ("GAAP"), estimates or assumptions (which could differ from actual results) may be used that affect reported amounts and disclosures.
Multiple class operations, income and expenses: The Fund currently offers three classes of shares, each with a public offering price that reflects different sales charges, if any, and expense levels. On June 15, 2004, Class C2 shares merged into Class C. On September 24, 2004, Class M shares merged into Class C. Class B shares will convert to Class A shares eight years after purchase. Income, non-class specific expenses and realized and unrealized gains and losses, are allocated daily to each class, based upon the value of shares outstanding method as permitted under Rule 18f-3 of the 1940 Act. Each class bears its own specific expenses as well as a portion of general, common expenses.
Security valuations: Investment company securities are valued at the net asset value of the underlying portfolio.
Security transactions and investment income: Security transactions are recorded on the trade date. Security gains and losses are calculated on the specific identification basis. Dividend income, if any, is recorded on the ex-dividend date. Dividends and net realized gain (loss) from investment securities for the Fund are from investments in shares of affiliated investment companies.
Redemption fees: A short-term trading redemption fee may be assessed on any fund shares in a fund account that are sold during the first five (5) New York Stock Exchange ("NYSE") trading days following their purchase date. This redemption fee will equal 2% of the amount redeemed and shares held the longest will be treated as being redeemed first and shares held the shortest as being redeemed last. For the year ended October 31, 2005, the Fund received $2 in redemption fees.
Dividend distributions: Distributions to shareholders are recorded on the ex-dividend date and are determined in accordance with Federal income tax regulations which may differ from GAAP.
NOTE 2. RELATED PARTY TRANSACTIONS
Effective January 1, 2005 AEGON/Transamerica Fund Advisors, Inc. was renamed Transamerica Fund Advisors, Inc. ("TFAI"); AEGON/Transamerica Fund Services, Inc. and AEGON/Transamerica Investor Services, Inc. merged into one entity and was renamed Transamerica Fund Services, Inc. ("TFS").
TFAI is the Fund's investment adviser. TFS is the Fund's administrator and transfer agent. AFSG Securities Corp. ("AFSG") is the Fund's distributor/principal underwriter. TFAI, TFS , and AFSG are affiliates of AEGON, NV, a Netherlands corporation.
Transamerica Investment Management, LLC and Great Companies, LLC are affiliates of the Fund and are sub-advisers to other funds within Transamerica IDEX Mutual Funds.
Because the underlying funds have varied expense and fee levels and the Fund may own different proportions of underlying funds at different times, the amount of fees and expenses incurred indirectly by the Fund will vary.
Investment advisory fees: The Fund pays management fees to TFAI based on average daily net assets ("ANA") at the following rate:
0.10% of ANA
TFAI has contractually agreed to waive its advisory fee and will reimburse the Fund to the extent that operating expenses, excluding 12b-1 fees, exceed the following stated annual limit:
0.45% Expense Limit
If total Fund expenses fall below the annual expense limitation agreement agreed to by the adviser within the succeeding three years, the Fund may be required to pay the adviser a portion or all of the waived advisory fees.
There were no amounts recaptured during the year ended October 31, 2005. There were no amounts available for recapture at October 31, 2005.
Distribution and service fees: The Fund has a 12b-1 distribution plan under the 1940 Act pursuant to which an annual fee, based on average daily net assets, is paid to the distributor for various disbursements such as broker-dealer account servicing fees and other promotional expenses of the Fund. The Fund is authorized under the 12b-1 plan to pay fees on each class up to the following limits:
| Class A | | | N/A | | |
| Class B | | | 0.65 | % | |
| Class C | | | 0.65 | % | |
Transamerica IDEX Mutual Funds
Annual Report 2005
8
TA IDEX Asset Allocation–Conservative Portfolio
NOTES TO FINANCIAL STATEMENTS (continued)
At October 31, 2005
(all amounts in thousands)
NOTE 2.–(continued)
In addition, the underlying funds' Class A shares in which the Fund invests impose a 0.35% 12b-1 fee. To avoid duplication of the 12b-1 fees, each class of fund shares of the Fund has reduced the 12b-1 fees by the amount of the underlying funds' Class A 12b-1 fees.
In the case the Fund or a class of shares of the Fund is closed to new investors or investments, the Fund is authorized to pay 12b-1 fees for past sales and distribution efforts and present and past investor services.
Underwriter commission relate to front-end sales charges imposed for Class A shares and contingent deferred sales charges from Classes B, C and certain A share redemptions. For the year ended October 31, 2005, the underwriter commissions were as follows:
| Received by Underwriter | | $ | 6,446 | | |
| Retained by Underwriter | | | 472 | | |
| Contingent Deferred Sales Charge | | | 565 | | |
Administrative services: The Fund has entered into an agreement with TFS for financial and legal fund administration services. As of January 1, 2005 the Fund pays TFS an annual fee of 0.02% of ANA. Prior to January 1, 2005 the Fund paid TFS an annual fee of 0.015% of ANA. The Legal fees on the Statement of Operations are for fees paid to external legal counsel.
Transfer agent fees: The Fund pays TFS an annual per-account charge for each open and closed account. The Fund paid TFS $405 for the year ended October 31, 2005.
Deferred compensation plan: Each eligible independent Fund Trustee may elect to participate in a non-qualified deferred compensation plan maintained by Transamerica IDEX Mutual Funds (the "Plan"). Under the Plan, such Trustees may defer payment of all or a portion of their total fees earned as a Fund Trustee. Each Trustee who is a participant in the Plan may elect that the earnings, losses or gains credited to his or her deferred fee amounts be determined based on a deemed investment in any series of Transamerica IDEX Mutual Funds, including the Fund. The right of a participant to receive a distribution from the Plan of the deferred fees is an unsecured claim against the general assets of all series of Transamerica IDEX Mutual Funds. The pro rata liability to the Fund of all deferred fees i n the Plan amounted, as of October 31, 2005, to $11.
NOTE 3. INVESTMENT TRANSACTIONS
The cost of securities purchased and proceeds from securities sold (excluding short-term securities) for the year ended October 31, 2005, were as follows:
| Purchases of securities: | | | |
| Long-Term | | $ | 177,638 | | |
| U.S. Government | | | – | | |
| Proceeds from maturities and sales of securities: | | | |
| Long-Term | | | 132,914 | | |
| U.S. Government | | | – | | |
NOTE 4. FEDERAL INCOME TAX MATTERS
The Fund has not made any provision for federal income or excise taxes due to its policy to distribute all of its taxable income and capital gains to its shareholders and otherwise qualify as a regulated investment company under Subchapter M of the Internal Revenue Code. Income and capital gain distributions are determined in accordance with income tax regulations, which may differ from GAAP. These differences are primarily due to differing treatment for items including, but not limited to, wash sales and distribution reclasses.
Therefore, distributions determined in accordance with tax regulations may differ significantly in amount or character from net investment income and realized gains for financial reporting purposes. Financial reporting records are adjusted for permanent book/tax differences to reflect tax character. Financial records are not adjusted for temporary differences. These reclassifications are as follows:
Shares of beneficial interest, unlimited
shares authorized | | $ | 1 | | |
| Undistributed net investment income (loss) | | | (10 | ) | |
Undistributed net realized gain (loss) from investment
in affiliated investment companies | | | 9 | | |
The tax character of distributions paid may differ from the character of distributions shown in the Statement of Changes in Net Assets due to short-term gains being treated as ordinary income for tax purposes. The tax character of distributions paid during 2004 and 2005 was as follows:
| 2004 Distributions paid from: | |
| Ordinary Income | | $ | 14,141 | | |
| Long-term Capital Gain | | | 5 | | |
| 2005 Distributions paid from: | |
| Ordinary Income | | | 8,391 | | |
| Long-term Capital Gain | | | 4,826 | | |
Transamerica IDEX Mutual Funds
Annual Report 2005
9
TA IDEX Asset Allocation–Conservative Portfolio
NOTES TO FINANCIAL STATEMENTS (continued)
At October 31, 2005
(all amounts in thousands)
NOTE 4.–(continued)
The tax basis components of distributable earnings as of October 31, 2005, are as follows:
| Undistributed Ordinary Income | | $ | 3,623 | | |
| Undistributed Long-term Capital Gains | | $ | 12,619 | | |
| Capital Loss Carryforward | | $ | – | | |
| Net Unrealized Appreciation (Depreciation) | | $ | 26,766 | * | |
* Amount includes unrealized appreciation (depreciation) of deferred compensation.
The aggregate cost of investments and composition of unrealized appreciation (depreciation) for federal income tax purposes as of October 31, 2005, are as follows:
| Federal Tax Cost Basis | | $ | 418,128 | | |
| Unrealized Appreciation | | $ | 28,819 | | |
| Unrealized (Depreciation) | | | (2,052 | ) | |
| Net Unrealized Appreciation (Depreciation) | | $ | 26,767 | | |
NOTE 5. REGULATORY PROCEEDINGS
There continues to be significant federal and state regulatory activity relating to financial services companies, particularly mutual fund companies and their investment advisers. As part of an ongoing investigation regarding potential market timing, recordkeeping and trading compliance issues and matters affecting the Fund's investment adviser, TFAI, and certain affiliates and former employees of TFAI, the SEC staff has indicated that it is likely to take some action against TFAI and certain of its affiliates at the conclusion of the investigation. The potential timing and the scope of any such action is difficult to predict. Although the impact of any action brought against TFAI and/or its affiliates is difficult to assess at the present time, the Fund currently believes that the likelihood that any such action will have a material adverse impact on it is remote. It is important to note that the Fund is not aware of any allegation of wrongdoing against it and its Board at the time this annual report is printed. Although it is not anticipated that these developments will have an adverse impact on the Fund, there can be no assurance at this time. TFAI and its affiliates are actively working with the SEC in regard to this matter; however, the exact resolution cannot be determined at this time. TFAI will take such actions that it deems necessary or appropriate to continue providing management services to the Fund and to bring all matters to an appropriate conclusion.
TFAI and/or its affiliates, and not the Fund, will bear the costs regarding these regulatory matters.
Transamerica IDEX Mutual Funds
Annual Report 2005
10
Report of Independent Registered Certified Public Accounting Firm
To the Board of Trustees and Shareholders of
TA IDEX Asset Allocation–Conservative Portfolio
In our opinion, the accompanying statement of assets and liabilities, including the schedule of investments, and the related statements of operations and of changes in net assets and the financial highlights present fairly, in all material respects, the financial position of TA IDEX Asset Allocation–Conservative Portfolio (the "Fund") (one of the portfolios constituting the Transamerica IDEX Mutual Funds) at October 31, 2005, the results of its operations for the year then ended, the changes in its net assets for each of the two years in the period then ended and the financial highlights for each of the periods presented, in conformity with accounting principles generally accepted in the United States of America. These financial statements and financial highlights (hereafter referred to as "financial statements") are the responsibility of the Fund's management; our responsibility is to express an opinion on these financial statements based on our audits. We conducted our audits of these financial statements in accordance with the standards of the Public Company Accounting Oversight Board (United States). Those standards require that we plan and perform the audit to obtain reasonable assurance about whether the financial statements are free of material misstatement. An audit includes examining, on a test basis, evidence supporting the amounts and disclosures in the financial statements, assessing the accounting principles used and significant estimates made by management, and evaluating the overall financial statement presentation. We believe that our audits, which included confirmation of securities at October 31, 2005 by correspondence with the custodian, provide a reasonable basis for our opinion.

December 22, 2005
Transamerica IDEX Mutual Funds
Annual Report 2005
11
TA IDEX Asset Allocation–Conservative Portfolio
SUPPLEMENTAL INFORMATION (unaudited)
TAX INFORMATION
For dividends paid during the year ended October 31, 2005, the Fund designated $1,762 as qualified dividend income.
For tax purposes, the Fund has made a Long-Term Capital Gain Designation of $4,826 for the year ended October 31, 2005.
The information and distributions reported herein may differ from the information and distributions taxable to the shareholders for the calendar year ending December 31, 2005. Complete information will be computed and reported in conjunction with your 2005 Form 1099-DIV.
Transamerica IDEX Mutual Funds
Annual Report 2005
12
TA IDEX Asset Allocation–Growth Portfolio
MARKET ENVIRONMENT
The past twelve months were a volatile period in the stock market, but it ended with solid overall gains. Stocks surged in post-election euphoria at the end of 2004; but then spent the early part of 2005 giving up most of those gains. After hitting bottom in May 2005, most stock indexes posted good gains through the end of November. Large cap stocks lagged the riskier parts of the market. Over the twelve month period, the Standard and Poor's 500 Composite Stock Index ("S&P 500") returned 8.71%, while the Standard and Poor's 400 MidCap Index doubled that with a 17.64% gain. International stocks rose even more, with the Morgan Stanley Capital International EAFE Index up more than 18% in dollar terms. Value stocks gained slightly more than growth stocks over the period, with value doing well early in the year and growth coming on strong in the past six months.
Driving the market's swing was uncertainty about the economy. Fear that the Federal Reserve Board ("Fed") had clamped down too hard stunted performance early in 2005, compounded by worries about Hurricane Katrina later in the year. After all was said and done, though, the economy continued to chug along nicely, as evidenced by continued consumer strength, solid corporate earnings, and continuing productivity growth. The key question mark remaining for the markets is whether the new Fed Chairman will be able to engineer a soft landing or will he crash the economy into another recession.
Short-term interest rates rose dramatically over the year, as the Fed continued hiking rates in 25 basis point doses to forestall inflation. Nevertheless, longer term rates were little changed, leading to a modest 1.13% gain in the Lehman Brothers Aggregate Bond Index for the year. Bonds with significant credit risk performed much better overall, with emerging-markets bond funds up more than 12%; convertible bond funds up 7%; and high-yield bond funds up more than 3%.
PERFORMANCE
For the year ended October 31, 2005, TA IDEX Asset Alloca-tion-Growth Portfolio, Class A returned 13.42%. By comparison, its benchmark, the Dow Jones Wilshire 5000 Total Market Index ("DJ Wilshire 5000"), returned 10.77%.
STRATEGY REVIEW
How did you manage the portfolio in this market environment?
We maintained our strategy of persistent diversification across global equity markets, including small and mid cap stocks, which were key sources of the portfolio's strong relative performance. The portfolio was up 13.42% over the trailing twelve months, versus 8.71% for the S&P 500 and 10.77% for the DJ Wilshire 5000. Moreover, it landed in the top quintile of Morningstar's Large Blend category.
Which individual holdings had the greatest positive impact on performance?
TA IDEX Transamerica Equity and TA IDEX Transamerica Small/Mid Cap Value both added more than 20% for the year; while TA IDEX Transamerica Growth Opportunities and TA IDEX Clarion Real Estate Securities came close to the 20% mark. These four big winners counted for nearly 30% of the portfolio's assets at the beginning of the year, and slightly less at the end. Not only did these funds perform well on an absolute basis, they were each standouts on a relative basis as well; all four landed in the top quartile of their respective Morningstar fund categories.
Which individual holdings had the greatest negative impact on performance?
At the start of the year the portfolio's two largest holdings were TA IDEX Salomon All Cap and TA IDEX Salomon Investors Value, which accounted for over 32% of assets. These two holdings underperformed their benchmarks through March 2005, at which point they were cut to a total of less than 9% of assets. Since that time, their performance has improved.
The portfolio's commitment to international equity exposure should have helped more than it did. TA IDEX American Century International, the portfolio's largest international equity holding with 7% of assets at the beginning of the period, lagged its benchmark by more than 225 basis points through March 2005. At that point the fund was removed from the portfolio and replaced by TA IDEX Marsico International Growth and TA IDEX Evergreen International Small Cap, both of which outperformed TA IDEX American Century International over the subsequent period.
Which sectors/industries had the greatest impact on performance?
Both TA IDEX Mercury Large Cap Value and TA IDEX Transamerica Small/Mid Cap Value have significant overweights in the energy sector. This has been one of the best performing sectors in the equity markets in the trailing twelve months, and as a result these are two of the top performing funds in the portfolio. It also helped that they have been the top two holdings in the portfolio since April 2005.
Transamerica IDEX Mutual Funds
Annual Report 2005
1
TA IDEX Asset Allocation–Growth Portfolio (continued)
Which countries had the greatest impact on performance?
Because of the limited international choices over the course of the year, this portfolio's foreign exposure was generally below its target level. The largest international exposure of the portfolio was to the eurozone, at approximately 8% of assets.
Todd Porter, CFA
Portfolio Manager
Morningstar Associates, LLC
Transamerica IDEX Mutual Funds
Annual Report 2005
2
TA IDEX Asset Allocation–Growth Portfolio
Comparison of change in value of $10,000 investment in Class A shares and its comparative index.

Average Annual Total Return for Periods Ended 10/31/05
| | | 1 year | | From
Inception | | Inception
Date | |
| Class A (NAV) | | | 13.42 | % | | | 5.55 | % | | 3/1/02 | |
| Class A (POP) | | | 7.18 | % | | | 3.94 | % | | 3/1/02 | |
| DJ Wilshire 50001 | | | 10.77 | % | | | 6.00 | % | | 3/1/02 | |
| Class B (NAV) | | | 12.55 | % | | | 4.87 | % | | 3/1/02 | |
| Class B (POP) | | | 7.55 | % | | | 4.39 | % | | 3/1/02 | |
| Class C (NAV) | | | 12.82 | % | | | 15.05 | % | | 11/11/02 | |
| Class C (POP) | | | 11.82 | % | | | 15.05 | % | | 11/11/02 | |
NOTES
1 The Dow Jones Wilshire 5000 Total Market (DJ Wilshire 5000) Index is an unmanaged index used as a general measure of market performance. Calculations assume dividends and capital gains are reinvested and do not include any managerial expenses. From inception calculation is based on life of Class A shares. Source: Standard & Poor's Micropal®© Micropal, Inc. 2005 – 1-800-596-5323 – http://www.funds-sp.com.
The performance data presented represents past performance, future results may vary. Performance data does not reflect the deduction of taxes that would be paid on fund distributions or the redemption of fund shares. Investment return and principal value will fluctuate so that an investor's shares, when redeemed, may be worth more or less than their original cost. Current performance may be lower or higher than performance quoted. Please see www.transamericaidex.com for performance data current to the most recent month-end.
Public Offering Price (POP) returns include the reinvestment of dividends and capital gains and reflect the maximum sales charge of 5.5% for A shares or the maximum applicable contingent deferred sales charge (5% in the 1st year, decreasing to 0% after 6 years) for Class B shares and 1% (during the first 12 months) for Class C shares. Shares purchased prior to March 1, 2004 are subject to a maximum applicable contingent deferred sales charge (5% in the 1st year, decreasing to 0% after 7 years) for Class B shares and (2% in the 1st year, decreasing to 0% after 2 years) for Class C shares. Net Asset Value (NAV) returns include the reinvestment of dividends and capital gains but do not reflect any sales charges.
This material must be preceded or accompanied by a current prospectus, which includes specific contents regarding the investment objectives and policies of this fund.
Transamerica IDEX Mutual Funds
Annual Report 2005
3
TA IDEX Asset Allocation–Growth Portfolio
UNDERSTANDING YOUR FUND'S EXPENSES
(unaudited)
SHAREHOLDER EXPENSES
Fund shareholders may incur two types of costs: (1) transaction costs, including sales charges (loads) on purchases, contingent deferred sales charges on redemptions and redemption fees; and (2) ongoing costs, including management fees, 12b-1 distribution and service fees, and other fund expenses.
The following Example is intended to help you understand your ongoing costs (in dollars and cents) of investing in a Fund and to compare these costs with the ongoing costs of investing in other funds.
The Example is based on an investment of $1,000 invested at May 1, 2005 and held for the entire period until October 31, 2005.
ACTUAL EXPENSES
The first line in the table below provides information about actual account values and actual expenses. You may use the information in this line, together with the amount you invested, to estimate the expenses that you paid over the period. Simply divide your account value by $1,000 (for example, an $8,600 account value divided by $1,000 = 8.6), then multiply the result by the number in the first line of your Fund under the heading entitled "Expenses Paid During Period" to estimate the expenses you paid on your account during this period. If your account is an IRA, your expenses could have included a $15 annual fee. The amount of any fee paid through your account would increase the estimate of expenses you paid during the period and decrease your ending account value.
HYPOTHETICAL EXAMPLE FOR COMPARISON PURPOSES
The second line in the table below provides information about hypothetical account values and hypothetical expenses based on the Fund's actual expense ratio and an assumed rate of return of 5% per year before expenses, which is not the Fund's actual return. The hypothetical account values and expenses may not be used to estimate the actual ending account balance or expenses you paid for the period. You may use this information to compare the ongoing costs of investing in your Fund and other funds. To do so, compare this 5% hypothetical example with the 5% hypothetical examples that appear in the shareholder reports of the other funds. As in the case of the actual expense example, if your account is subject to an IRA fee, the amount of the fee paid through your account would increase the hypothetical expenses you would have paid during the period and decrease the hypothetical ending account value.
Please note that the expenses shown in the table are meant to highlight your ongoing costs only and do not reflect any transactional costs, such as sales charges, redemption fees, brokerage commissions paid on purchases and sales of fund shares. Therefore, the second line under the Fund in the table is useful in comparing ongoing costs only, and will not help you determine the relative total costs of owning different funds. If any of these transaction costs were included, your costs would be higher. The expenses shown in the table do not reflect any fees that may be charged to you by brokers, financial intermediaries or other financial institutions.
| | | Beginning
Account
Value | | Ending
Account
Value | | Annualized
Expense
Ratio | | Expenses Paid
During Period (a) | |
| Class A | |
| Actual | | $ | 1,000.00 | | | $ | 1,105.10 | | | | 0.35 | % | | $ | 1.86 | | |
| Hypothetical (b) | | | 1,000.00 | | | | 1,023.44 | | | | 0.35 | | | | 1.79 | | |
| Class B | |
| Actual | | | 1,000.00 | | | | 1,102.10 | | | | 1.00 | | | | 5.30 | | |
| Hypothetical (b) | | | 1,000.00 | | | | 1,020.16 | | | | 1.00 | | | | 5.09 | | |
| Class C | |
| Actual | | | 1,000.00 | | | | 1,102.00 | | | | 0.94 | | | | 4.98 | | |
| Hypothetical (b) | | | 1,000.00 | | | | 1,020.47 | | | | 0.94 | | | | 4.79 | | |
(a) Expenses are calculated using each Fund's annualized expense ratio (as disclosed in the table), multiplied by the average account value for the period, multiplied by number of days in the period (184 days), and divided by the number of days in the year (365 days).
(b) 5% return per year before expenses.
GRAPHICAL PRESENTATION OF SCHEDULE OF INVESTMENTS
By Investment Type
At October 31, 2005

This chart shows the percentage breakdown by investment type of the Fund's total investment securities.
Transamerica IDEX Mutual Funds
Annual Report 2005
4
TA IDEX Asset Allocation–Growth Portfolio
SCHEDULE OF INVESTMENTS
At October 31, 2005
(all amounts except share amounts in thousands)
| | | Shares | | Value | |
| INVESTMENT COMPANIES (99.8%) ø | | | |
| Aggressive Equity (29.4%) | | | |
| TA IDEX J.P. Morgan Mid Cap Value ‡ | | | 5,857,734 | | | $ | 58,226 | | |
| TA IDEX T. Rowe Price Health Sciences | | | 3,828,431 | | | | 47,626 | | |
TA IDEX Transamerica Growth
Opportunities ‡ | | | 7,317,946 | | | | 57,446 | | |
TA IDEX Transamerica
Small/Mid Cap Value | | | 6,678,461 | | | | 111,464 | | |
TA IDEX Van Kampen
Small Company Growth ‡ | | | 2,353,915 | | | | 26,505 | | |
| Growth Equity (49.3%) | | | |
TA IDEX American Century Large
Company Value | | | 7,970,323 | | | | 87,514 | | |
| TA IDEX Great Companies–TechnologySM | | | 3,888,819 | | | | 14,855 | | |
| TA IDEX Janus Growth ‡ | | | 1,695,193 | | | | 41,803 | | |
| TA IDEX Jennison Growth ‡ | | | 4,473,833 | | | | 49,481 | | |
| TA IDEX Mercury Large Cap Value ‡ | | | 15,010,427 | | | | 154,307 | | |
| TA IDEX Salomon All Cap | | | 2,422,503 | | | | 39,002 | | |
| TA IDEX Salomon Investors Value | | | 2,704,042 | | | | 38,316 | | |
| TA IDEX Transamerica Equity | | | 9,134,750 | | | | 81,025 | | |
| Specialty–Real Estate (1.8%) | | | |
| TA IDEX Clarion Real Estate Securities | | | 1,119,686 | | | | 18,061 | | |
| | | Shares | | Value | |
| World Equity (19.3%) | | | |
| TA IDEX American Century International | | | 2,697,792 | | | $ | 27,167 | | |
TA IDEX Evergreen International
Small Cap ‡ | | | 2,893,629 | | | | 36,691 | | |
| TA IDEX Marsico International Growth ‡ | | | 3,209,551 | | | | 35,594 | | |
TA IDEX Templeton Great
Companies Global | | | 3,096,986 | | | | 76,434 | | |
TA IDEX Van Kampen Emerging
Markets Debt | | | 2,165,946 | | | | 22,634 | | |
| Total Investment Companies (cost: $905,721) | | | | | | $ | 1,024,151 | | |
| SUMMARY: | | | |
| Investment Companies, at value | | | 99.8 | % | | $ | 1,024,151 | | |
| Other assets in excess of liabilities | | | 0.2 | % | | | 2,376 | | |
| Net assets | | | 100.0 | % | | $ | 1,026,527 | | |
NOTES TO SCHEDULE OF INVESTMENTS:
‡ Non-income producing.
Ø The Fund invests its assets in Class A shares of the underlying TA IDEX Mutual Funds, which are affiliates of the Fund.
The notes to the financial statements are an integral part of this report.
Transamerica IDEX Mutual Funds
Annual Report 2005
5
TA IDEX Asset Allocation–Growth Portfolio
STATEMENT OF ASSETS AND LIABILITIES
At October 31, 2005
(all amounts except per share amounts in thousands)
| Assets: | | | |
Investment in affiliated investment companies
at value (cost: $905,721) | | $ | 1,024,151 | | |
| Receivables: | |
| Shares of beneficial interest sold | | | 5,363 | | |
| Dividends | | | 41 | | |
| Other | | | 16 | | |
| | | | 1,029,571 | | |
| Liabilities: | | | |
| Investment securities purchased | | | 905 | | |
| Accounts payable and accrued liabilities: | |
| Shares of beneficial interest redeemed | | | 1,423 | | |
| Management and advisory fees | | | 85 | | |
| Distribution and service fees | | | 399 | | |
| Transfer agent fees | | | 116 | | |
| Administration fees | | | 17 | | |
| Due to custodian | | | 4 | | |
| Other | | | 95 | | |
| | | | 3,044 | | |
| Net Assets | | $ | 1,026,527 | | |
| Net Assets Consist of: | | | |
Shares of beneficial interest, unlimited shares
authorized, no par value | | $ | 877,087 | | |
| Undistributed net investment income (loss) | | | 2 | | |
Undistributed net realized gain (loss) from investment
in affiliated investment companies | | | 31,009 | | |
Net unrealized appreciation (depreciation) on
investment in affiliated investment companies | | | 118,429 | | |
| Net Assets | | $ | 1,026,527 | | |
| Net Assets by Class: | | | |
| Class A | | $ | 286,412 | | |
| Class B | | | 211,904 | | |
| Class C | | | 528,211 | | |
| Shares Outstanding: | | | |
| Class A | | | 23,882 | | |
| Class B | | | 18,002 | | |
| Class C | | | 44,855 | | |
| Net Asset Value Per Share: | | | |
| Class A | | $ | 11.99 | | |
| Class B | | | 11.77 | | |
| Class C | | | 11.78 | | |
| Maximum Offering Price Per Share (a): | | | |
| Class A | | $ | 12.69 | | |
(a) Includes the maximum selling commission (represented as a percentage of offering price) which is reduced on certain levels of sales as set forth in the Prospectus. Net asset value per share for Classes B and C shares represents offering price. The redemption price for Classes B and C shares equals net asset value less any applicable contingent deferred sales charge.
STATEMENT OF OPERATIONS
For the year ended October 31, 2005
(all amounts in thousands)
| Investment Income: | | | |
| Dividends from affiliated investment companies | | $ | 6,657 | | |
| Expenses: | | | |
| Management and advisory fees | | | 877 | | |
| Distribution and service fees: | |
| Class B | | | 1,245 | | |
| Class C | | | 2,929 | | |
| Transfer agent fees: | |
| Class A | | | 428 | | |
| Class B | | | 340 | | |
| Class C | | | 557 | | |
| Printing and shareholder reports | | | 71 | | |
| Custody fees | | | 40 | | |
| Administration fees | | | 169 | | |
| Legal fees | | | 57 | | |
| Audit fees | | | 19 | | |
| Trustees fees | | | 38 | | |
| Registration fees: | |
| Class A | | | 32 | | |
| Class B | | | 26 | | |
| Class C | | | 47 | | |
| Other | | | 10 | | |
| Total expenses | | | 6,885 | | |
| Net Investment Income (Loss) | | | (228 | ) | |
Net Realized and Unrealized Gain (Loss) on
Investment in Affiliated Investment Companies: | | | |
Realized gain (loss) from investment in
affiliated investment companies | | | 27,916 | | |
Realized gain distributions from investment in
affiliated investment companies | | | 4,016 | | |
| | | | 31,932 | | |
Increase (decrease) in unrealized appreciation
(depreciation) on investment in affiliated
investment companies | | | 69,271 | | |
Net Gain (Loss) on Investment in Affiliated
Investment Companies | | | 101,203 | | |
Net Increase (Decrease) in Net Assets Resulting
from Operations | | $ | 100,975 | | |
The notes to the financial statements are an integral part of this report.
Transamerica IDEX Mutual Funds
Annual Report 2005
6
TA IDEX Asset Allocation–Growth Portfolio
STATEMENTS OF CHANGES IN NET ASSETS
For the years ended
(all amounts in thousands)
| | | October 31,
2005 | | October 31,
2004 | |
| Increase (Decrease) in Net Assets From: | | | |
| Operations: | | | |
| Net investment income (loss) | | $ | (228 | ) | | $ | (3,397 | ) | |
Net realized gain (loss) from
investment in affiliated
investment companies | | | 31,932 | | | | 11,217 | | |
Net unrealized appreciation
(depreciation) on investment in
affiliated investment companies | | | 69,271 | | | | 23,549 | | |
| | | | 100,975 | | | | 31,369 | | |
| Distributions to Shareholders: | | | |
| From net investment income: | |
| Class A | | | (2,140 | ) | | | – | | |
| Class B | | | (1,002 | ) | | | – | | |
| Class C | | | (2,477 | ) | | | – | | |
| | | | (5,619 | ) | | | – | | |
| From net realized gains: | |
| Class A | | | (1,161 | ) | | | – | | |
| Class B | | | (1,060 | ) | | | – | | |
| Class C | | | (2,385 | ) | | | – | | |
| | | | (4,606 | ) | | | – | | |
| Capital Share Transactions: | | | |
| Proceeds from shares sold: | |
| Class A | | | 131,025 | | | | 132,291 | | |
| Class B | | | 55,124 | | | | 84,889 | | |
| Class C | | | 197,065 | | | | 228,642 | | |
| Class C2 | | | – | | | | 6,081 | | |
| Class M | | | – | | | | 2,709 | | |
| | | | 383,214 | | | | 454,612 | | |
Dividends and distributions
reinvested: | |
| Class A | | | 2,790 | | | | – | | |
| Class B | | | 1,725 | | | | – | | |
| Class C | | | 3,362 | | | | – | | |
| | | | 7,877 | | | | – | | |
| Cost of shares redeemed: | |
| Class A | | | (43,846 | ) | | | (23,172 | ) | |
| Class B | | | (25,580 | ) | | | (14,563 | ) | |
| Class C | | | (75,101 | ) | | | (28,450 | ) | |
| Class C2 | | | – | | | | (3,211 | ) | |
| Class M | | | – | | | | (1,183 | ) | |
| | | | (144,527 | ) | | | (70,579 | ) | |
| Redemption fees: | |
| Class A | | | 2 | | | | – | | |
| Class C | | | 1 | | | | – | | |
| | | | 3 | | | | – | | |
| Class level exchanges: | |
| Class C | | | – | | | | 25,301 | | |
| Class C2 | | | – | | | | (15,616 | ) | |
| Class M | | | – | | | | (9,685 | ) | |
| | | | – | | | | – | | |
| | | October 31,
2005 | | October 31,
2004 | |
| Automatic conversions: | |
| Class A | | $ | 351 | | | $ | 69 | | |
| Class B | | | (351 | ) | | | (69 | ) | |
| | | | – | | | | – | | |
| | | | 246,567 | | | | 384,033 | | |
| Net increase (decrease) in net assets | | | 337,317 | | | | 415,402 | | |
| Net Assets: | | | |
| Beginning of year | | | 689,210 | | | | 273,808 | | |
| End of year | | $ | 1,026,527 | | | $ | 689,210 | | |
Accumulated Net Investment Income
(Loss) | | $ | 2 | | | $ | 3,077 | | |
| Share Activity: | | | |
| Shares issued: | |
| Class A | | | 11,457 | | | | 12,550 | | |
| Class B | | | 4,905 | | | | 8,165 | | |
| Class C | | | 17,476 | | | | 22,002 | | |
| Class C2 | | | – | | | | 585 | | |
| Class M | | | – | | | | 261 | | |
| | | | 33,838 | | | | 43,563 | | |
Shares issued–reinvested from
distributions: | |
| Class A | | | 246 | | | | – | | |
| Class B | | | 154 | | | | – | | |
| Class C | | | 301 | | | | – | | |
| | | | 701 | | | | – | | |
| Shares redeemed: | |
| Class A | | | (3,822 | ) | | | (2,207 | ) | |
| Class B | | | (2,258 | ) | | | (1,402 | ) | |
| Class C | | | (6,645 | ) | | | (2,738 | ) | |
| Class C2 | | | – | | | | (305 | ) | |
| Class M | | | – | | | | (114 | ) | |
| | | | (12,725 | ) | | | (6,766 | ) | |
| Class level exchanges: | |
| Class C | | | – | | | | 2,417 | | |
| Class C2 | | | – | | | | (1,487 | ) | |
| Class M | | | – | | | | (928 | ) | |
| | | | – | | | | 2 | | |
| Automatic conversions: | |
| Class A | | | 30 | | | | 6 | | |
| Class B | | | (31 | ) | | | (6 | ) | |
| | | | (1 | ) | | | – | | |
Net increase (decrease) in shares
outstanding: | |
| Class A | | | 7,911 | | | | 10,349 | | |
| Class B | | | 2,770 | | | | 6,757 | | |
| Class C | | | 11,132 | | | | 21,681 | | |
| Class C2 | | | – | | | | (1,207 | ) | |
| Class M | | | – | | | | (781 | ) | |
| | | | 21,813 | | | | 36,799 | | |
The notes to the financial statements are an integral part of this report.
Transamerica IDEX Mutual Funds
Annual Report 2005
7
TA IDEX Asset Allocation–Growth Portfolio
FINANCIAL HIGHLIGHTS
| | | | | For a share of beneficial interest outstanding throughout each period | |
| | | | | Net Asset | | Investment Operations | | Distributions | | Net Asset | |
| | | For the
Period
Ended (d)(g) | | Value,
Beginning
of Period | | Net
Investment
Income (Loss) | | Net Realized
and Unrealized
Gain (Loss) | | Total
Operations | | From Net
Investment
Income | | From Net
Realized
Gains | | Total
Distributions | | Value,
End
of Period | |
| Class A | | 10/31/2005 | | $ | 10.75 | | | $ | 0.05 | | | $ | 1.38 | | | $ | 1.43 | | | $ | (0.12 | ) | | $ | (0.07 | ) | | $ | (0.19 | ) | | $ | 11.99 | | |
| | | 10/31/2004 | | | 9.82 | | | | (0.02 | ) | | | 0.95 | | | | 0.93 | | | | – | | | | – | | | | – | | | | 10.75 | | |
| | | 10/31/2003 | | | 7.95 | | | | (0.03 | ) | | | 1.90 | | | | 1.87 | | | | – | | | | – | | | | – | | | | 9.82 | | |
| | | 10/31/2002 | | | 10.00 | | | | (0.02 | ) | | | (2.03 | ) | | | (2.05 | ) | | | – | | | | – | | | | – | | | | 7.95 | | |
| Class B | | 10/31/2005 | | | 10.57 | | | | (0.03 | ) | | | 1.36 | | | | 1.33 | | | | (0.06 | ) | | | (0.07 | ) | | | (0.13 | ) | | | 11.77 | | |
| | | 10/31/2004 | | | 9.71 | | | | (0.09 | ) | | | 0.95 | | | | 0.86 | | | | – | | | | – | | | | – | | | | 10.57 | | |
| | | 10/31/2003 | | | 7.91 | | | | (0.08 | ) | | | 1.88 | | | | 1.80 | | | | – | | | | – | | | | – | | | | 9.71 | | |
| | | 10/31/2002 | | | 10.00 | | | | (0.06 | ) | | | (2.03 | ) | | | (2.09 | ) | | | – | | | | – | | | | – | | | | 7.91 | | |
| Class C | | 10/31/2005 | | | 10.57 | | | | (0.02 | ) | | | 1.37 | | | | 1.35 | | | | (0.07 | ) | | | (0.07 | ) | | | (0.14 | ) | | | 11.78 | | |
| | | 10/31/2004 | | | 9.71 | | | | (0.08 | ) | | | 0.94 | | | | 0.86 | | | | – | | | | – | | | | – | | | | 10.57 | | |
| | | 10/31/2003 | | | 7.86 | | | | (0.08 | ) | | | 1.93 | | | | 1.85 | | | | – | | | | – | | | | – | | | | 9.71 | | |
| | | | | | | Ratios/Supplemental Data | |
| | | For the
Period | | Total | | Net Assets,
End of
Period | | Ratio of Expenses
to Average
Net Assets (a)(j) | | Net Investment
Income (Loss)
to Average | | Portfolio
Turnover | |
| | | Ended (g) | | Return (c) | | (000's) | | Net (e) | | Total (f) | | Net Assets (a)(i) | | Rate (b) | |
| Class A | | 10/31/2005 | | | 13.42 | % | | $ | 286,412 | | | | 0.34 | % | | | 0.34 | % | | | 0.42 | % | | | 35 | % | |
| | | 10/31/2004 | | | 9.47 | | | | 171,708 | | | | 0.43 | (h) | | | 0.43 | (h) | | | (0.22 | ) | | | 5 | | |
| | | 10/31/2003 | | | 23.52 | | | | 55,209 | | | | 0.45 | | | | 0.60 | | | | (0.30 | ) | | | 25 | | |
| | | 10/31/2002 | | | (20.50 | ) | | | 8,368 | | | | 0.45 | | | | 1.65 | | | | (0.44 | ) | | | 31 | | |
| Class B | | 10/31/2005 | | | 12.55 | | | | 211,904 | | | | 0.99 | | | | 0.99 | | | | (0.24 | ) | | | 35 | | |
| | | 10/31/2004 | | | 8.96 | | | | 160,959 | | | | 1.05 | (h) | | | 1.05 | (h) | | | (0.82 | ) | | | 5 | | |
| | | 10/31/2003 | | | 22.76 | | | | 82,318 | | | | 1.10 | | | | 1.25 | | | | (0.95 | ) | | | 25 | | |
| | | 10/31/2002 | | | (20.90 | ) | | | 10,452 | | | | 1.10 | | | | 2.30 | | | | (1.09 | ) | | | 31 | | |
| Class C | | 10/31/2005 | | | 12.82 | | | | 528,211 | | | | 0.93 | | | | 0.93 | | | | (0.17 | ) | | | 35 | | |
| | | 10/31/2004 | | | 8.86 | | | | 356,543 | | | | 0.99 | (h) | | | 0.99 | (h) | | | (0.78 | ) | | | 5 | | |
| | | 10/31/2003 | | | 23.54 | | | | 116,956 | | | | 1.10 | | | | 1.25 | | | | (0.95 | ) | | | 25 | | |
NOTES TO FINANCIAL HIGHLIGHTS
(a) Annualized.
(b) Not annualized.
(c) Total Return has been calculated for the applicable period without deduction of a sales load, if any, on an initial purchase. Periods of less than one year are not annualized.
(d) Per share information is calculated based on the average number of shares outstanding.
(e) Ratio of Net Expenses to Average Net Assets is net of fee waivers and reimbursements by the investment adviser, if any.
(f) Ratio of Total Expenses to Average Net Assets includes all expenses before fee waivers and reimbursements by the investment adviser.
(g) TA IDEX Asset Allocation-Growth Portfolio ("the Fund") commenced operations on March 1, 2002. The inception date for the Fund's offering of share Class C was November 11, 2002.
(h) Ratios of Total Expenses to Average Net Assets and Net Expenses to Average Net Assets are inclusive of recaptured expenses by the investment advisor. The impact of recaptured expenses was 0.05%, 0.05% and 0.05% for Class A, Class B and Class C, respectively (see Note 2).
(i) Recognition of net investment income by the Fund is affected by the timing of the declaration of dividends by the underlying companies in which the Fund invests.
(j) Does not include expenses of the investment companies in which the Fund invests.
The notes to the financial statements are an integral part of this report.
Transamerica IDEX Mutual Funds
Annual Report 2005
8
TA IDEX Asset Allocation–Growth Portfolio
NOTES TO FINANCIAL STATEMENTS
At October 31, 2005
(all amounts in thousands)
NOTE 1. ORGANIZATION AND SIGNIFICANT ACCOUNTING POLICIES
Transamerica IDEX Mutual Funds is an open-end management investment company registered under the Investment Company Act of 1940, as amended (the "1940 Act").
In the normal course of business, TA IDEX Asset Allocation–Growth Portfolio (the "Fund") enters into contracts that contain a variety of representations that provide general indemnifications. The Fund's maximum exposure under these arrangements is unknown, as this would involve future claims that may be made against the Fund and/or its affiliates that have not yet occurred. However, based on experience, the Fund expects the risk of loss to be remote.
This report should be read in conjunction with the current Fund prospectus, which contains more complete information about the Fund.
The following is a summary of significant accounting policies followed by the Fund in the preparation of the financial statements. In preparing the Fund's financial statements in accordance with accounting principles generally accepted in the United States of America ("GAAP"), estimates or assumptions (which could differ from actual results) may be used that affect reported amounts and disclosures.
Multiple class operations, income and expenses: The Fund currently offers three classes of shares, each with a public offering price that reflects different sales charges, if any, and expense levels. On June 15, 2004, Class C2 shares merged into Class C. On September 24, 2004, Class M shares merged into Class C. Class B shares will convert to Class A shares eight years after purchase. Income, non-class specific expenses and realized and unrealized gains and losses, are allocated daily to each class, based upon the value of shares outstanding method as permitted under Rule 18f-3 of the 1940 Act. Each class bears its own specific expenses as well as a portion of general, common expenses.
Security valuations: Investment company securities are valued at the net asset value of the underlying portfolio.
Cash: The Fund may leave cash overnight in its cash account with the custodian, Investors Bank & Trust Company ("IBT"). IBT has been contracted on behalf of the Fund to invest the excess cash into a savings account, which at October 31, 2005, was paying an interest rate of 2.76%.
Throughout the year, the Fund may have a cash overdraft balance. A fee is incurred on this overdraft, calculated by multiplying the overdraft by a rate based on the federal funds rate.
Security transactions and investment income: Security transactions are recorded on the trade date. Security gains and losses are calculated on the specific identification basis. Dividend income, if any, is recorded on the ex-dividend date. Dividends and net realized gain (loss) from investment securities for the Fund are from investments in shares of affiliated investment companies.
Redemption fees: A short-term trading redemption fee may be assessed on any fund shares in a fund account that are sold during the first five (5) New York Stock Exchange ("NYSE") trading days following their purchase date. This redemption fee will equal 2% of the amount redeemed and shares held the longest will be treated as being redeemed first and shares held the shortest as being redeemed last. For the year ended October 31, 2005, the Fund received $3 in redemption fees.
Dividend distributions: Distributions to shareholders are recorded on the ex-dividend date and are determined in accordance with Federal income tax regulations which may differ from GAAP.
NOTE 2. RELATED PARTY TRANSACTIONS
Effective January 1, 2005 AEGON/Transamerica Fund Advisors, Inc. was renamed Transamerica Fund Advisors, Inc. ("TFAI"); AEGON/Transamerica Fund Services, Inc. and AEGON/Transamerica Investor Services, Inc. merged into one entity and was renamed Transamerica Fund Services, Inc. ("TFS").
TFAI is the Fund's investment adviser. TFS is the Fund's administrator and transfer agent. AFSG Securities Corp. ("AFSG") is the Fund's distributor/principal underwriter. TFAI, TFS , and AFSG are affiliates of AEGON, NV, a Netherlands corporation.
Transamerica Investment Management, LLC and Great Companies, LLC are affiliates of the Fund and are sub-advisers to other funds within Transamerica IDEX Mutual Funds.
Because the underlying funds have varied expense and fee levels and the Fund may own different proportions of underlying funds at different times, the amount of fees and expenses incurred indirectly by the Fund will vary.
Investment advisory fees: The Fund pays management fees to TFAI based on average daily net assets ("ANA") at the following rate:
0.10% of ANA
TFAI has contractually agreed to waive its advisory fee and will reimburse the Fund to the extent that operating expenses, excluding 12b-1 fees, exceed the following stated annual limit:
0.45% Expense Limit
If total Fund expenses fall below the annual expense limitation agreement agreed to by the adviser within the succeeding three years, the Fund may be required to pay that adviser a portion or all of the waived advisory fees.
Transamerica IDEX Mutual Funds
Annual Report 2005
9
TA IDEX Asset Allocation–Growth Portfolio
NOTES TO FINANCIAL STATEMENTS (continued)
At October 31, 2005
(all amounts in thousands)
NOTE 2.–(continued)
There were no amounts recaptured during the year ended October 31, 2005. There are no amounts available for recapture at October 31, 2005.
Distribution and service fees: The Fund has a 12b-1 distribution plan under the 1940 Act pursuant to which an annual fee, based on average daily net assets, is paid to the distributor for various disbursements such as broker-dealer account servicing fees and other promotional expenses of the Fund. The Fund is authorized under the 12b-1 plan to pay fees on each class up to the following limits:
| Class A | | | N/A | | |
| Class B | | | 0.65 | % | |
| Class C | | | 0.65 | % | |
In addition, the underlying funds' Class A shares in which the Fund invests impose a 0.35% 12b-1 fee. To avoid duplication of the 12b-1 fees, each class of fund shares of the Fund has reduced the 12b-1 fees by the amount of the underlying funds' Class A 12b-1 fees.
In the case the Fund or a class of shares of the Fund is closed to new investors or investments, the Fund is authorized to pay 12b-1 fees for past sales and distribution efforts and present and past investor services.
Underwriter commissions relate to front-end sales charges imposed for Class A shares and contingent deferred sales charges from Classes B, C and certain A share redemptions. For the year ended October 31, 2005, the underwriter commissions were as follows:
| Received by Underwriter | | $ | 17,452 | | |
| Retained by Underwriter | | | 959 | | |
| Contingent Deferred Sales Charge | | | 728 | | |
Administrative services: The Fund has entered into an agreement with TFS for financial and legal fund administration services. As of January 1, 2005 the Fund pays TFS an annual fee of 0.02% of ANA. Prior to January 1, 2005 the Fund paid TFS an annual fee of 0.015% of ANA. The Legal fees on the Statement of Operations are for fees paid to external legal counsel.
Transfer agent fees: The Fund pays TFS an annual per-account charge for each open and closed account. The Fund paid TFS $1,247 for the year ended October 31, 2005.
Deferred compensation plan: Each eligible independent Fund Trustee may elect to participate in a non-qualified deferred compensation plan maintained by Transamerica IDEX Mutual Funds (the "Plan"). Under the Plan, such Trustees may defer payment of all or a portion of their total fees earned as a Fund Trustee. Each Trustee who is a participant in the Plan may elect that the earnings, losses or gains credited to his or her deferred fee amounts be determined based on a deemed investment in any series of Transamerica IDEX Mutual Funds, including the Fund. The right of a participant to receive a distribution from the Plan of the deferred fees is an unsecured claim against the general assets of all s eries of Transamerica IDEX Mutual Funds. The pro rata liability to the Fund of all deferred fees in the Plan amounted, as of October 31, 2005, to $16.
NOTE 3. INVESTMENT TRANSACTIONS
The cost of securities purchased and proceeds from securities sold (excluding short-term securities) for the year ended October 31, 2005, were as follows:
| Purchases of securities: | | | |
| Long-Term | | $ | 549,877 | | |
| U.S. Government | | | – | | |
| Proceeds from maturities and sales of securities: | | | |
| Long-Term | | | 309,807 | | |
| U.S. Government | | | – | | |
NOTE 4. FEDERAL INCOME TAX MATTERS
The Fund has not made any provision for federal income or excise taxes due to its policy to distribute all of its taxable income and capital gains to its shareholders and otherwise qualify as a regulated investment company under Subchapter M of the Internal Revenue Code. Income and capital gain distributions are determined in accordance with income tax regulations, which may differ from GAAP. These differences are primarily due to differing treatment for items including, but not limited to, wash sales and distribution reclasses.
Therefore, distributions determined in accordance with tax regulations may differ significantly in amount or character from net investment income and realized gains for financial reporting purposes. Financial reporting records are adjusted for permanent book/tax differences to reflect tax character. Financial records are not adjusted for temporary differences. These reclassifications are as follows:
Shares of beneficial interest, unlimited
shares authorized | | $ | (2,659 | ) | |
| Undistributed net investment income (loss) | | | 2,772 | | |
Undistributed net realized gain (loss) from investment
in affiliated investment companies | | | (113 | ) | |
The tax character of distributions paid may differ from the character of distributions shown in the Statement of Changes in Net Assets due to short-term gains being treated as ordinary income for tax purposes. The tax character of distributions paid during 2004 and 2005 was as follows:
| 2004 Distributions paid from: | |
| Ordinary Income | | $ | – | | |
| Long-term capital gain | | | – | | |
| 2005 Distributions paid from: | |
| Ordinary Income | | | 5,619 | | |
| Long-term capital gain | | | 4,606 | | |
Transamerica IDEX Mutual Funds
Annual Report 2005
10
TA IDEX Asset Allocation–Growth Portfolio
NOTES TO FINANCIAL STATEMENTS (continued)
At October 31, 2005
(all amounts in thousands)
NOTE 4.–(continued)
The tax basis components of distributable earnings as of October 31, 2005, are as follows:
| Undistributed Ordinary Income | | $ | – | | |
| Undistributed Long-term Capital Gains | | $ | 31,929 | | |
| Capital Loss Carryforward | | $ | – | | |
| Net Unrealized Appreciation (Depreciation) | | $ | 117,510 | * | |
* Amount includes unrealized appreciation (depreciation) of deferred compensation.
The aggregate cost of investments and composition of unrealized appreciation (depreciation) for federal income tax purposes as of October 31, 2005, are as follows:
| Federal Tax Cost Basis | | $ | 906,640 | | |
| Unrealized Appreciation | | $ | 117,511 | | |
| Unrealized (Depreciation) | | | – | | |
| Net Unrealized Appreciation (Depreciation) | | $ | 117,511 | | |
NOTE 5. REGULATORY PROCEEDINGS
There continues to be significant federal and state regulatory activity relating to financial services companies, particularly mutual fund companies and their investment advisers. As part of an ongoing investigation regarding potential market timing, recordkeeping and trading compliance issues and matters affecting the Fund's investment adviser, TFAI, and certain affiliates and former employees of TFAI, the SEC staff has indicated that it is likely to take some action against TFAI and certain of its affiliates at the conclusion of the investigation. The potential timing and the scope of any such action is difficult to predict. Although the impact of any action brought against TFAI and/or its affiliates is difficult to assess at the present time, the Fund currently believes that the likelihood that any such action will have a material adverse impact on it is remote. It is important to note that the Fund is not aware of any allegation of wrongdoing against it and its Board at the time this annual report is printed. Although it is not anticipated that these developments will have an adverse impact on the Fund, there can be no assurance at this time. TFAI and its affiliates are actively working with the SEC in regard to this matter; however, the exact resolution cannot be determined at this time. TFAI will take such actions that it deems necessary or appropriate to continue providing management services to the Fund and to bring all matters to an appropriate conclusion.
TFAI and/or its affiliates, and not the Fund, will bear the costs regarding these regulatory matters.
Transamerica IDEX Mutual Funds
Annual Report 2005
11
Report of Independent Registered Certified Public Accounting Firm
To the Board of Trustees and Shareholders of
TA IDEX Asset Allocation–Growth Portfolio
In our opinion, the accompanying statement of assets and liabilities, including the schedule of investments, and the related statements of operations and of changes in net assets and the financial highlights present fairly, in all material respects, the financial position of TA IDEX Asset Allocation–Growth Portfolio (the "Fund") (one of the portfolios constituting the Transamerica IDEX Mutual Funds) at October 31, 2005, the results of its operations for the year then ended, the changes in its net assets for each of the two years in the period then ended and the financial highlights for each of the periods presented, in conformity with accounting principles generally accepted in the United States of America. These financial statements and financial highlights (hereafter referred to as "financial statements") are the responsibility of the Fund's management; our responsibility is t o express an opinion on these financial statements based on our audits. We conducted our audits of these financial statements in accordance with the standards of the Public Company Accounting Oversight Board (United States). Those standards require that we plan and perform the audit to obtain reasonable assurance about whether the financial statements are free of material misstatement. An audit includes examining, on a test basis, evidence supporting the amounts and disclosures in the financial statements, assessing the accounting principles used and significant estimates made by management, and evaluating the overall financial statement presentation. We believe that our audits, which included confirmation of securities at October 31, 2005 by correspondence with the custodian, provide a reasonable basis for our opinion.

December 22, 2005
Transamerica IDEX Mutual Funds
Annual Report 2005
12
TA IDEX Asset Allocation–Growth Portfolio
SUPPLEMENTAL INFORMATION (unaudited)
TAX INFORMATION
For dividends paid during the year ended October 31, 2005, the Fund designated $2,223 as qualified dividend income.
For tax purposes, the Fund has made a Long-Term Capital Gain Designation of $4,606 for the year ended October 31, 2005.
The information and distributions reported herein may differ from the information and distributions taxable to the shareholders for the calendar year ending December 31, 2005. Complete information will be computed and reported in conjunction with your 2005 Form 1099-DIV.
Transamerica IDEX Mutual Funds
Annual Report 2005
13
TA IDEX Asset Allocation–Moderate Growth Portfolio
MARKET ENVIRONMENT
The past twelve months were a volatile period in the stock market, but it ended with solid overall gains. Stocks surged in post-election euphoria at the end of 2004; but then spent the early part of 2005 giving up most of those gains. After hitting bottom in May 2005, most stock indexes posted good gains through the end of November. Large cap stocks lagged the riskier parts of the market. Over the twelve month period, the Standard and Poor's 500 Composite Stock Index ("S&P 500") returned 8.71%, while the Standard and Poor's 400 MidCap Index doubled that with a 17.64% gain. International stocks rose even more, with the Morgan Stanley Capital International EAFE Index up more than 18% in dollar terms. Value stocks gained slightly more than growth stocks over the period, with value doing well early in the year and growth coming on strong in the past six months.
Driving the market's swing was uncertainty about the economy. Fear that the Federal Reserve Board ("Fed") had clamped down too hard stunted performance early in 2005, compounded by worries about Hurricane Katrina later in the year. After all was said and done, though, the economy continued to chug along nicely, as evidenced by continued consumer strength, solid corporate earnings, and continuing productivity growth. The key question mark remaining for the markets is whether the new Fed Chairman will be able to engineer a soft landing or will he crash the economy into another recession.
Short-term interest rates rose dramatically over the year, as the Fed continued hiking rates in 25 basis point doses to forestall inflation. Nevertheless, longer term rates were little changed, leading to a modest 1.13% gain in the Lehman Brothers Aggregate Bond Index ("LBAB") for the year. Bonds with significant credit risk performed much better overall, with emerging-markets bond funds up more than 12%; convertible bond funds up 7%; and high-yield bond funds up more than 3%.
PERFORMANCE
For the year ended October 31, 2005, TA IDEX Asset Allocation–Moderate Growth Portfolio, Class A returned 10.69%. By comparison its primary and secondary benchmarks, the Dow Jones Wilshire 5000 Total Market Index ("DJ Wilshire 5000") and the LBAB, returned 10.77% and 1.13%, respectively.
STRATEGY REVIEW
How did you manage the portfolio in this market environment?
We maintained our strategy of persistent diversification across global equity markets, including small and mid cap stocks, which were key sources of the portfolio's strong relative performance. The portfolio was up 10.69% over the trailing twelve months, versus 10.77% for the DJ Wilshire 5000, and 1.13% for the LBAB. Moreover, it landed in the top quintile of Morningstar's Moderate Allocation category.
Which individual holdings had the greatest positive impact on performance?
TA IDEX Transamerica Equity and TA IDEX Transamerica Small/Mid Cap Value both added more than 20% for the year; while TA IDEX Transamerica Growth Opportunities and TA IDEX Clarion Real Estate Securities came close to the 20% mark. These four big winners counted for more than 20% of the portfolio's assets at the beginning of the year, and slightly less at the end. Not only did these funds perform well on an absolute basis, they were each standouts on a relative basis as well; all four landed in the top quartile of their respective Morningstar fund categories.
Which individual holdings had the greatest negative impact on performance?
At the start of the year the portfolio's two largest holdings were TA IDEX Salomon All Cap and TA IDEX Salomon Investors Value, which accounted for almost 25% of assets. These two holdings underperformed their benchmarks through March 2005, at which point they were cut to a total of 7% of assets. Since that time, their performance has improved.
The portfolio's commitment to international equity exposure should have helped more than it did. TA IDEX American Century International, the portfolio's largest international equity holding with 7% of assets at the beginning of the period, lagged its benchmark by more than 225 basis points through March 2005. At that point the fund was dramatically reduced and those assets were added to two new international funds, TA IDEX Marsico International Growth and TA IDEX Evergreen International Small Cap, both of which outperformed TA IDEX American Century International over the subsequent period.
Which sectors/industries had the greatest impact on performance?
Both TA IDEX Mercury Large Cap Value and TA IDEX Transamerica Small/Mid Cap Value have significant overweights in the energy sector. This has been one of the best performing sectors in the equity markets in the trailing twelve months, and as a result these are two of the top performing funds in the portfolio. It also helped that they have been two of the top three holdings in the portfolio since April 2005.
Which countries had the greatest impact on performance?
Because of the limited international choices over the course of the year, the portfolio's foreign exposure was generally below its target level. The largest international exposure of the portfolio was to the eurozone, at approximately 7% of equity assets.
Todd Porter, CFA
Portfolio Manager
Morningstar Associates, LLC
Transamerica IDEX Mutual Funds
Annual Report 2005
1
TA IDEX Asset Allocation–Moderate Growth Portfolio
Comparison of change in value of $10,000 investment in Class A shares and its comparative indices.
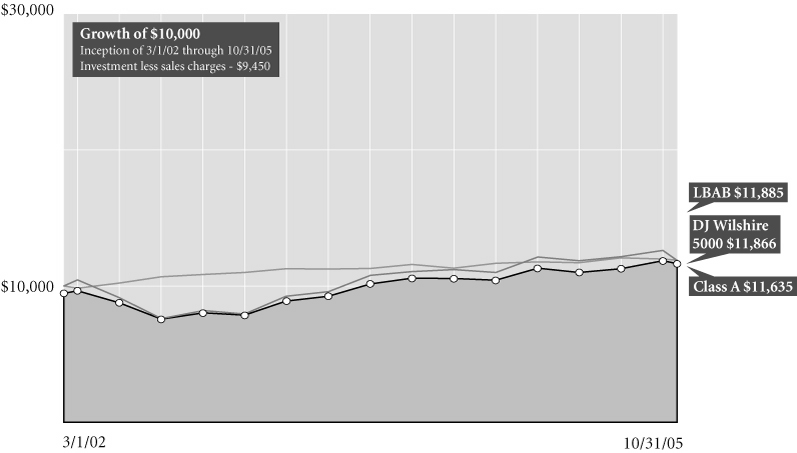
Average Annual Total Return for Periods Ended 10/31/05
| | | 1 year | | From
Inception | | Inception
Date | |
| Class A (NAV) | | | 10.69 | % | | | 5.82 | % | | 3/1/02 | |
| Class A (POP) | | | 4.60 | % | | | 4.20 | % | | 3/1/02 | |
| DJ Wilshire 50001 | | | 10.77 | % | | | 6.00 | % | | 3/1/02 | |
| LBAB1 | | | 1.13 | % | | | 4.82 | % | | 3/1/02 | |
| Class B (NAV) | | | 10.05 | % | | | 5.14 | % | | 3/1/02 | |
| Class B (POP) | | | 5.05 | % | | | 4.66 | % | | 3/1/02 | |
| Class C (NAV) | | | 10.02 | % | | | 13.25 | % | | 11/11/02 | |
| Class C (POP) | | | 9.02 | % | | | 13.25 | % | | 11/11/02 | |
NOTES
1 The Dow Jones Wilshire 5000 Total Market (DJ Wilshire 5000) Index and the Lehman Brothers Aggregate Bond (LBAB) Index are unmanaged indices used as a general measure of market performance. Calculations assume dividends and capital gains are reinvested and do not include any managerial expenses. From inception calculation is based on life of Class A shares. Source: Standard & Poor's Micropal®© Micropal, Inc. 2005 – 1-800-596-5323 – http://www.funds-sp.com.
The performance data presented represents past performance, future results may vary. Performance data does not reflect the deduction of taxes that would be paid on fund distributions or the redemption of fund shares. Investment return and principal value will fluctuate so that an investor's shares, when redeemed, may be worth more or less than their original cost. Current performance may be lower or higher than performance quoted. Please see www.transamericaidex.com for performance data current to the most recent month-end.
Public Offering Price (POP) returns include the reinvestment of dividends and capital gains and reflect the maximum sales charge of 5.5% for A shares or the maximum applicable contingent deferred sales charge (5% in the 1st year, decreasing to 0% after 6 years) for Class B shares and 1% (during the first 12) months for Class C shares. Shares purchased prior to March 1, 2004 are subject to a maximum applicable contingent deferred sales charge (5% in the 1st year, decreasing to 0% after 7 years) for Class B shares and (2% in the 1st year, decreasing to 0% after 2 years) for Class C shares. Net Asset Value (NAV) returns include the reinvestment of dividends and capital gains but do not reflect any sales charges.
This material must be preceded or accompanied by a current prospectus, which includes specific contents regarding the investment objectives and policies of this fund.
Transamerica IDEX Mutual Funds
Annual Report 2005
2
TA IDEX Asset Allocation–Moderate Growth Portfolio
UNDERSTANDING YOUR FUND'S EXPENSES
(unaudited)
SHAREHOLDER EXPENSES
Fund shareholders may incur two types of costs: (1) transaction costs, including sales charges (loads) on purchases, contingent deferred sales charges on redemptions and redemption fees; and (2) ongoing costs, including management fees, 12b-1 distribution and service fees, and other fund expenses.
The following Example is intended to help you understand your ongoing costs (in dollars and cents) of investing in a Fund and to compare these costs with the ongoing costs of investing in other funds.
The Example is based on an investment of $1,000 invested at May 1, 2005 and held for the entire period until October 31, 2005.
ACTUAL EXPENSES
The first line in the table below provides information about actual account values and actual expenses. You may use the information in this line, together with the amount you invested, to estimate the expenses that you paid over the period. Simply divide your account value by $1,000 (for example, an $8,600 account value divided by $1,000 = 8.6), then multiply the result by the number in the first line of your Fund under the heading entitled "Expenses Paid During Period" to estimate the expenses you paid on your account during this period. If your account is an IRA, your expenses could have included a $15 annual fee. The amount of any fee paid through your account would increase the estimate of expenses you paid during the period and decrease your ending account value.
HYPOTHETICAL EXAMPLE FOR COMPARISON PURPOSES
The second line in the table below provides information about hypothetical account values and hypothetical expenses based on the Fund's actual expense ratio and an assumed rate of return of 5% per year before expenses, which is not the Fund's actual return. The hypothetical account values and expenses may not be used to estimate the actual ending account balance or expenses you paid for the period. You may use this information to compare the ongoing costs of investing in your Fund and other funds. To do so, compare this 5% hypothetical example with the 5% hypothetical examples that appear in the shareholder reports of the other funds. As in the case of the actual expense example, if your account is subject to an IRA fee, the amount of the fee paid through your account would increase the hypothetical expenses you would have paid during the period and decrease the hypothetical ending accou nt value.
Please note that the expenses shown in the table are meant to highlight your ongoing costs only and do not reflect any transactional costs, such as sales charges, redemption fees, brokerage commissions paid on purchases and sales of fund shares. Therefore, the second line under the Fund in the table is useful in comparing ongoing costs only, and will not help you determine the relative total costs of owning different funds. If any of these transaction costs were included, your costs would be higher. The expenses shown in the table do not reflect any fees that may be charged to you by brokers, financial intermediaries or other financial institutions.
| | | Beginning
Account
Value | | Ending
Account
Value | | Annualized
Expense
Ratio | | Expenses Paid
During Period (a) | |
| Class A | |
| Actual | | $ | 1,000.00 | | | $ | 1,081.00 | | | | 0.29 | % | | $ | 1.52 | | |
| Hypothetical (b) | | | 1,000.00 | | | | 1,023.74 | | | | 0.29 | | | | 1.48 | | |
| Class B | |
| Actual | | | 1,000.00 | | | | 1,078.60 | | | | 0.96 | | | | 5.03 | | |
| Hypothetical (b) | | | 1,000.00 | | | | 1,020.37 | | | | 0.96 | | | | 4.89 | | |
| Class C | |
| Actual | | | 1,000.00 | | | | 1,077.60 | | | | 0.91 | | | | 4.77 | | |
| Hypothetical (b) | | | 1,000.00 | | | | 1,020.62 | | | | 0.91 | | | | 4.63 | | |
(a) Expenses are calculated using each Fund's annualized expense ratio (as disclosed in the table), multiplied by the average account value for the period, multiplied by number of days in the period (184 days), and divided by the number of days in the year (365 days).
(b) 5% return per year before expenses.
GRAPHICAL PRESENTATION OF SCHEDULE OF INVESTMENTS
By Investment Type
At October 31, 2005

This chart shows the percentage breakdown by investment type of the Fund's total investment securities.
Transamerica IDEX Mutual Funds
Annual Report 2005
3
TA IDEX Asset Allocation–Moderate Growth Portfolio
SCHEDULE OF INVESTMENTS
At October 31, 2005
(all amounts except share amounts in thousands)
| | | Shares | | Value | |
| INVESTMENT COMPANIES (99.9%) ø | |
| Aggressive Equity (23.2%) | |
| TA IDEX J.P. Morgan Mid Cap Value ‡ | | | 9,979,733 | | | $ | 99,199 | | |
| TA IDEX T. Rowe Price Health Sciences | | | 5,879,700 | | | | 73,143 | | |
TA IDEX Transamerica Growth
Opportunities ‡ | | | 11,827,732 | | | | 92,848 | | |
TA IDEX Transamerica
Small/Mid Cap Value | | | 8,561,894 | | | | 142,898 | | |
TA IDEX Van Kampen Small
Company Growth ‡ | | | 4,276,501 | | | | 48,153 | | |
| Capital Preservation (0.8%) | |
| TA IDEX Transamerica Money Market | | | 16,457,063 | | | | 16,457 | | |
| Fixed-Income (18.5%) | |
| TA IDEX PIMCO Real Return TIPS | | | 9,764,759 | | | | 99,893 | | |
| TA IDEX PIMCO Total Return | | | 3,711,792 | | | | 37,712 | | |
TA IDEX Transamerica Convertible
Securities | | | 7,367,028 | | | | 85,163 | | |
| TA IDEX Transamerica Flexible Income | | | 4,780,363 | | | | 44,505 | | |
| TA IDEX Transamerica High-Yield Bond | | | 10,808,910 | | | | 96,956 | | |
| Growth Equity (40.2%) | |
TA IDEX American Century Large
Company Value | | | 17,870,116 | | | | 196,214 | | |
TA IDEX Great
Companies–TechnologySM | | | 7,557,893 | | | | 28,871 | | |
| TA IDEX Janus Growth ‡ | | | 3,827,621 | | | | 94,389 | | |
| TA IDEX Jennison Growth ‡ | | | 22,211 | | | | 246 | | |
| | | Shares | | Value | |
| Growth Equity (continued) | |
| TA IDEX Marsico Growth ‡ | | | 5,337,402 | | | $ | 55,082 | | |
| TA IDEX Mercury Large Cap Value ‡ | | | 18,837,205 | | | | 193,646 | | |
| TA IDEX Salomon All Cap | | | 3,159,874 | | | | 50,874 | | |
| TA IDEX Salomon Investors Value | | | 5,473,087 | | | | 77,554 | | |
| TA IDEX Transamerica Equity | | | 10,757,947 | | | | 95,423 | | |
| Specialty–Real Estate (2.6%) | |
| TA IDEX Clarion Real Estate Securities | | | 3,151,540 | | | | 50,834 | | |
| World Equity (14.6%) | |
TA IDEX American Century
International | | | 2,113,964 | | | | 21,288 | | |
TA IDEX Evergreen International
Small Cap ‡ | | | 4,575,396 | | | | 58,016 | | |
TA IDEX Marsico International
Growth ‡ | | | 4,011,763 | | | | 44,490 | | |
TA IDEX Templeton Great
Companies Global | | | 4,273,340 | | | | 105,466 | | |
TA IDEX Van Kampen Emerging
Markets Debt | | | 5,601,872 | | | | 58,540 | | |
| Total Investment Companies (cost: $1,781,624) | | | | | | $ | 1,967,860 | | |
| SUMMARY: | |
| Investment companies, at value | | | 99.9 | % | | $ | 1,967,860 | | |
| Other assets in excess of liabilities | | | 0.1 | % | | | 2,204 | | |
| Net assets | | | 100.0 | % | | $ | 1,970,064 | | |
NOTES TO SCHEDULE OF INVESTMENTS:
‡ Non-income producing.
Ø The Fund invests its assets in Class A shares of the underlying TA IDEX Mutual Funds, which are affiliates of the Fund.
The notes to the financial statements are an integral part of this report.
Transamerica IDEX Mutual Funds
Annual Report 2005
4
TA IDEX Asset Allocation–Moderate Growth Portfolio
STATEMENT OF ASSETS AND LIABILITIES
At October 31, 2005
(all amounts except share amounts in thousands)
| Assets: | | | |
Investment in affiliated investment companies
at value (cost: $1,781,624) | | $ | 1,967,860 | | |
| Receivables: | |
| Shares of beneficial interest sold | | | 9,024 | | |
| Dividends | | | 129 | | |
| Other | | | 34 | | |
| | | | 1,977,047 | | |
| Liabilities: | | | |
| Investment securities purchased | | | 2,860 | | |
| Accounts payable and accrued liabilities: | |
| Shares of beneficial interest redeemed | | | 2,811 | | |
| Management and advisory fees | | | 164 | | |
| Distribution and service fees | | | 765 | | |
| Transfer agent fees | | | 183 | | |
| Administration fees | | | 33 | | |
| Due to custodian | | | 6 | | |
| Other | | | 161 | | |
| | | | 6,983 | | |
| Net Assets | | $ | 1,970,064 | | |
| Net Assets Consist of: | | | |
Shares of beneficial interest, unlimited shares
authorized, no par value | | $ | 1,722,491 | | |
| Undistributed net investment income (loss) | | | 7,695 | | |
Undistributed net realized gain (loss) from
investment in affiliated investment companies | | | 53,644 | | |
Net unrealized appreciation (depreciation) on
investment in affiliated investment companies | | | 186,234 | | |
| Net Assets | | $ | 1,970,064 | | |
| Net Assets by Class: | | | |
| Class A | | $ | 560,231 | | |
| Class B | | | 428,677 | | |
| Class C | | | 981,156 | | |
| Shares Outstanding: | | | |
| Class A | | | 47,147 | | |
| Class B | | | 36,337 | | |
| Class C | | | 83,138 | | |
| Net Asset Value Per Share: | | | |
| Class A | | $ | 11.88 | | |
| Class B | | | 11.80 | | |
| Class C | | | 11.80 | | |
| Maximum Offering Price Per Share (a): | | | |
| Class A | | $ | 12.57 | | |
(a) Includes the maximum selling commission (represented as a percentage of offering price) which is reduced on certain levels of sales as set forth in the Prospectus. Net asset value per share for Classes B and C shares represents offering price. The redemption price for Classes B and C shares equals net asset value less any applicable contingent deferred sales charge.
STATEMENT OF OPERATIONS
For the year ended October 31, 2005
(all amounts in thousands)
| Investment Income: | | | |
| Dividends from affiliated investment companies | | $ | 28,023 | | |
| Expenses: | | | |
| Management and advisory fees | | | 1,708 | | |
| Distribution and service fees: | |
| Class B | | | 2,534 | | |
| Class C | | | 5,522 | | |
| Transfer agent fees: | |
| Class A | | | 614 | | |
| Class B | | | 575 | | |
| Class C | | | 885 | | |
| Printing and shareholder reports | | | 106 | | |
| Custody fees | | | 58 | | |
| Administration fees | | | 329 | | |
| Legal fees | | | 111 | | |
| Audit fees | | | 20 | | |
| Trustees fees | | | 75 | | |
| Registration fees: | |
| Class A | | | 45 | | |
| Class B | | | 37 | | |
| Class C | | | 62 | | |
| Other | | | 19 | | |
| Total expenses | | | 12,700 | | |
| Net Investment Income (Loss) | | | 15,323 | | |
Net Realized and Unrealized Gain (Loss) on
Investment in Affiliated Investment Companies | | | | | |
Realized gain (loss) from investment in affiliated
investment companies | | | 47,780 | | |
Realized gain distributions from investment in
affiliated investment companies | | | 5,967 | | |
| | | | 53,747 | | |
Increase (decrease) in unrealized appreciation
(depreciation) on investment in affiliated
investment companies | | | 87,330 | | |
Net Gain (Loss) on Investment in Affiliated
Investment Companies | | | 141,077 | | |
Net Increase (Decrease) in Net Assets Resulting
from Operations | | $ | 156,400 | | |
The notes to the financial statements are an integral part of this report.
Transamerica IDEX Mutual Funds
Annual Report 2005
5
TA IDEX Asset Allocation–Moderate Growth Portfolio
STATEMENTS OF CHANGES IN NET ASSETS
For the years ended
(all amounts in thousands)
| | | October 31,
2005 | | October 31,
2004 | |
| Increase (Decrease) In Net Assets From: | |
| Operations: | |
| Net investment income (loss) | | $ | 15,323 | | | $ | (89 | ) | |
Net realized gain (loss) from
investment in affiliated
investment companies | | | 53,747 | | | | 23,388 | | |
Net unrealized appreciation
(depreciation) on investment in
affiliated investment companies | | | 87,330 | | | | 43,855 | | |
| | | | 156,400 | | | | 67,154 | | |
| Distributions to Shareholders: | |
| From net investment income: | |
| Class A | | | (7,069 | ) | | | (1,243 | ) | |
| Class B | | | (4,398 | ) | | | (452 | ) | |
| Class C | | | (9,608 | ) | | | (639 | ) | |
| Class C2 | | | – | | | | (66 | ) | |
| Class M | | | – | | | | (55 | ) | |
| | | | (21,075 | ) | | | (2,455 | ) | |
| From net realized gains: | |
| Class A | | | (1,708 | ) | | | – | | |
| Class B | | | (1,542 | ) | | | – | | |
| Class C | | | (3,196 | ) | | | – | | |
| | | | (6,446 | ) | | | – | | |
| Capital Share Transactions: | |
| Proceeds from shares sold: | |
| Class A | | | 246,518 | | | | 244,152 | | |
| Class B | | | 109,566 | | | | 153,748 | | |
| Class C | | | 356,953 | | | | 410,207 | | |
| Class C2 | | | – | | | | 6,869 | | |
| Class M | | | – | | | | 4,667 | | |
| | | | 713,037 | | | | 819,643 | | |
Dividends and distributions
reinvested: | |
| Class A | | | 7,807 | | | | 1,112 | | |
| Class B | | | 5,035 | | | | 375 | | |
| Class C | | | 8,956 | | | | 455 | | |
| Class C2 | | | – | | | | 49 | | |
| Class M | | | – | | | | 51 | | |
| | | | 21,798 | | | | 2,042 | | |
| Cost of shares redeemed: | |
| Class A | | | (83,068 | ) | | | (44,420 | ) | |
| Class B | | | (48,778 | ) | | | (29,188 | ) | |
| Class C | | | (123,757 | ) | | | (57,323 | ) | |
| Class C2 | | | – | | | | (3,856 | ) | |
| Class M | | | – | | | | (3,241 | ) | |
| | | | (255,603 | ) | | | (138,028 | ) | |
| Redemption fees: | |
| Class A | | | 4 | | | | – | | |
| Class C | | | 2 | | | | – | | |
| | | | 6 | | | | – | | |
| Class level exchanges: | |
| Class C | | | – | | | | 55,381 | | |
| Class C2 | | | – | | | | (34,726 | ) | |
| Class M | | | – | | | | (20,655 | ) | |
| | | | – | | | | – | | |
| | | October 31,
2005 | | October 31,
2004 | |
| Automatic conversions: | |
| Class A | | $ | 422 | | | $ | 128 | | |
| Class B | | | (422 | ) | | | (128 | ) | |
| | | | – | | | | – | | |
| | | | 479,238 | | | | 683,657 | | |
| Net increase (decrease) in net assets | | | 608,117 | | | | 748,356 | | |
| Net Assets: | |
| Beginning of year | | | 1,361,947 | | | | 613,591 | | |
| End of year | | $ | 1,970,064 | | | $ | 1,361,947 | | |
Undistributed Net Investment
Income (Loss) | | $ | 7,695 | | | $ | 13,420 | | |
| Share Activity: | |
| Shares issued: | |
| Class A | | | 21,482 | | | | 22,751 | | |
| Class B | | | 9,598 | | | | 14,399 | | |
| Class C | | | 31,214 | | | | 38,386 | | |
| Class C2 | | | – | | | | 646 | | |
| Class M | | | – | | | | 439 | | |
| | | | 62,294 | | | | 76,621 | | |
Shares issued–reinvested from
distributions: | |
| Class A | | | 686 | | | | 107 | | |
| Class B | | | 443 | | | | 36 | | |
| Class C | | | 788 | | | | 44 | | |
| Class C2 | | | – | | | | 5 | | |
| Class M | | | – | | | | 5 | | |
| | | | 1,917 | | | | 197 | | |
| Shares redeemed: | |
| Class A | | | (7,228 | ) | | | (4,149 | ) | |
| Class B | | | (4,260 | ) | | | (2,732 | ) | |
| Class C | | | (10,790 | ) | | | (5,358 | ) | |
| Class C2 | | | – | | | | (359 | ) | |
| Class M | | | – | | | | (303 | ) | |
| | | | (22,278 | ) | | | (12,901 | ) | |
| Class level exchanges: | |
| Class C | | | – | | | | 5,155 | | |
| Class C2 | | | – | | | | (3,233 | ) | |
| Class M | | | – | | | | (1,920 | ) | |
| | | | – | | | | 2 | | |
| Automatic conversions: | |
| Class A | | | 36 | | | | 12 | | |
| Class B | | | (36 | ) | | | (12 | ) | |
| | | | – | | | | – | | |
Net increase (decrease) in shares
outstanding: | |
| Class A | | | 14,976 | | | | 18,721 | | |
| Class B | | | 5,745 | | | | 11,691 | | |
| Class C | | | 21,212 | | | | 38,227 | | |
| Class C2 | | | – | | | | (2,941 | ) | |
| Class M | | | – | | | | (1,779 | ) | |
| | | | 41,933 | | | | 63,919 | | |
The notes to the financial statements are an integral part of this report.
Transamerica IDEX Mutual Funds
Annual Report 2005
6
TA IDEX Asset Allocation–Moderate Growth Portfolio
FINANCIAL HIGHLIGHTS
| | | | | For a share of beneficial interest outstanding throughout each period | |
| | | | | Net Asset | | Investment Operations | | Distributions | | Net Asset | |
| | | For the
Period
Ended (d)(g) | | Value,
Beginning
of Period | | Net
Investment
Income (Loss) | | Net Realized
and Unrealized
Gain (Loss) | | Total
Operations | | From Net
Investment
Income | | From Net
Realized
Gains | | Total
Distributions | | Value,
End
of Period | |
| Class A | | 10/31/2005 | | $ | 10.97 | | | $ | 0.16 | | | $ | 1.00 | | | $ | 1.16 | | | $ | (0.20 | ) | | $ | (0.05 | ) | | $ | (0.25 | ) | | $ | 11.88 | | |
| | | 10/31/2004 | | | 10.13 | | | | 0.05 | | | | 0.87 | | | | 0.92 | | | | (0.08 | ) | | | – | | | | (0.08 | ) | | | 10.97 | | |
| | | 10/31/2003 | | | 8.37 | | | | 0.04 | | | | 1.77 | | | | 1.81 | | | | (0.05 | ) | | | – | | | | (0.05 | ) | | | 10.13 | | |
| | | 10/31/2002 | | | 10.00 | | | | 0.02 | | | | (1.65 | ) | | | (1.63 | ) | | | – | | | | – | | | | – | | | | 8.37 | | |
| Class B | | 10/31/2005 | | | 10.90 | | | | 0.08 | | | | 1.01 | | | | 1.09 | | | | (0.14 | ) | | | (0.05 | ) | | | (0.19 | ) | | | 11.80 | | |
| | | 10/31/2004 | | | 10.09 | | | | (0.02 | ) | | | 0.85 | | | | 0.83 | | | | (0.02 | ) | | | – | | | | (0.02 | ) | | | 10.90 | | |
| | | 10/31/2003 | | | 8.33 | | | | (0.02 | ) | | | 1.78 | | | | 1.76 | | | | – | | | | – | | | | – | | | | 10.09 | | |
| | | 10/31/2002 | | | 10.00 | | | | (0.01 | ) | | | (1.66 | ) | | | (1.67 | ) | | | – | | | | – | | | | – | | | | 8.33 | | |
| Class C | | 10/31/2005 | | | 10.91 | | | | 0.08 | | | | 1.01 | | | | 1.09 | | | | (0.15 | ) | | | (0.05 | ) | | | (0.20 | ) | | | 11.80 | | |
| | | 10/31/2004 | | | 10.09 | | | | (0.02 | ) | | | 0.86 | | | | 0.84 | | | | (0.02 | ) | | | – | | | | (0.02 | ) | | | 10.91 | | |
| | | 10/31/2003 | | | 8.31 | | | | (0.02 | ) | | | 1.80 | | | | 1.78 | | | | – | | | | – | | | | – | | | | 10.09 | | |
| | | | | | | Ratios/Supplemental Data | |
| | | For the
Period | | Total | | Net Assets,
End of
Period | | Ratio of Expenses
to Average
Net Assets (a)(j) | | Net Investment
Income (Loss)
to Average | | Portfolio
Turnover | |
| | | Ended (g) | | Return (c) | | (000's) | | Net (e) | | Total (f) | | Net Assets (a)(i) | | Rate (b) | |
| Class A | | 10/31/2005 | | | 10.69 | % | | $ | 560,231 | | | | 0.28 | % | | | 0.28 | % | | | 1.37 | % | | | 26 | % | |
| | | 10/31/2004 | | | 9.09 | | | | 352,852 | | | | 0.32 | (h) | | | 0.32 | (h) | | | 0.45 | | | | 3 | | |
| | | 10/31/2003 | | | 21.79 | | | | 136,295 | | | | 0.44 | | | | 0.44 | | | | 0.48 | | | | 15 | | |
| | | 10/31/2002 | | | (16.30 | ) | | | 20,681 | | | | 0.45 | | | | 0.90 | | | | 0.41 | | | | 21 | | |
| Class B | | 10/31/2005 | | | 10.05 | | | | 428,677 | | | | 0.95 | | | | 0.95 | | | | 0.68 | | | | 26 | | |
| | | 10/31/2004 | | | 8.25 | | | | 333,533 | | | | 0.97 | (h) | | | 0.97 | (h) | | | (0.19 | ) | | | 3 | | |
| | | 10/31/2003 | | | 21.15 | | | | 190,621 | | | | 1.09 | | | | 1.09 | | | | (0.17 | ) | | | 15 | | |
| | | 10/31/2002 | | | (16.70 | ) | | | 33,241 | | | | 1.10 | | | | 1.55 | | | | (0.24 | ) | | | 21 | | |
| Class C | | 10/31/2005 | | | 10.02 | | | | 981,156 | | | | 0.90 | | | | 0.90 | | | | 0.74 | | | | 26 | | |
| | | 10/31/2004 | | | 8.35 | | | | 675,562 | | | | 0.92 | (h) | | | 0.92 | (h) | | | (0.15 | ) | | | 3 | | |
| | | 10/31/2003 | | | 21.44 | | | | 239,043 | | | | 1.09 | | | | 1.09 | | | | (0.17 | ) | | | 15 | | |
NOTES TO FINANCIAL HIGHLIGHTS
(a) Annualized.
(b) Not annualized.
(c) Total Return has been calculated for the applicable period without deduction of a sales load, if any, on an initial purchase. Periods of less that one year are not annualized.
(d) Per share information is calculated based on average number of shares outstanding.
(e) Ratio of Net Expenses to Average Net Assets is net of fee waivers and reimbursements by the investment adviser, if any.
(f) Ratio of Total Expenses to Average Net Assets includes all expenses before fee waivers and reimbursements by the investment adviser.
(g) TA IDEX Asset Allocation–Moderate Growth Portfolio ("the Fund") commenced operations on March 1, 2002. The inception date for the Fund's offering of share Class C was November 11, 2002.
(h) Ratios of Total Expenses to Average Net Assets and Net Expenses to Average Net Assets are inclusive of recaptured expenses by the investment advisor. The impact of recaptured expenses was 0.01%, 0.01% and 0.01% for Class A, Class B and Class C, respectively (see Note 2).
(i) Recognition of net investment income by the Fund is affected by the timing of the declaration of dividends by the underlying companies in which the Fund invests.
(j) Does not include expenses of the investment companies in which the Fund invests.
The notes to the financial statements are an integral part of this report.
Transamerica IDEX Mutual Funds
Annual Report 2005
7
TA IDEX Asset Allocation–Moderate Growth Portfolio
NOTES TO FINANCIAL STATEMENTS
At October 31, 2005
(all amounts in thousands)
NOTE 1. ORGANIZATION AND SIGNIFICANT ACCOUNTING POLICIES
Transamerica IDEX Mutual Funds is an open-end management investment company registered under the Investment Company Act of 1940, as amended (the "1940 Act").
In the normal course of business, TA IDEX Asset Allocation–Moderate Growth Portfolio (the "Fund") enters into contracts that contain a variety of representations that provide general indemnifications. The Fund's maximum exposure under these arrangements is unknown, as this would involve future claims that may be made against the Fund and/or its affiliates that have not yet occurred. However, based on experience, the Fund expects the risk of loss to be remote.
This report should be read in conjunction with the current Fund prospectus, which contains more complete information about the Fund.
The following is a summary of significant accounting policies followed by the Fund in the preparation of the financial statements. In preparing the Fund's financial statements in accordance with accounting principles generally accepted in the United States of America ("GAAP"), estimates or assumptions (which could differ from actual results) may be used that affect reported amounts and disclosures.
Multiple class operations, income and expenses: The Fund currently offers three classes of shares, each with a public offering price that reflects different sales charges, if any, and expense levels. On June 15, 2004, Class C2 shares merged into Class C. On September 24, 2004, Class M shares merged into Class C. Class B shares will convert to Class A shares eight years after purchase. Income, non-class specific expenses and realized and unrealized gains and losses, are allocated daily to each class, based upon the value of shares outstanding method as permitted under Rule 18f-3 of the 1940 Act. Each class bears its own specific expenses as well as a portion of general, common expenses.
Security valuations: Investment company securities are valued at the net asset value of the underlying portfolio.
Cash: The Fund may leave cash overnight in its cash account with the custodian, Investors Bank & Trust Company ("IBT"). IBT has been contracted on behalf of the Fund to invest the excess cash into a savings account, which at October 31, 2005, was paying an interest rate of 2.76%.
Throughout the year, the Fund may have a cash overdraft balance. A fee is incurred on this overdraft, calculated by multiplying the overdraft by a rate based on the federal funds rate.
Security transactions and investment income: Security transactions are recorded on the trade date. Security gains and losses are calculated on the specific identification basis. Dividend income, if any, is recorded on the ex-dividend date. Dividends and net realized gain (loss) from investment securities for the Fund are from investments in shares of affiliated investment companies.
Redemption fees: A short-term trading redemption fee may be assessed on any fund shares in a fund account that are sold during the first five (5) New York Stock Exchange ("NYSE") trading days following their purchase date. This redemption fee will equal 2% of the amount redeemed and shares held the longest will be treated as being redeemed first and shares held the shortest as being redeemed last. For the year ended October 31, 2005, the Fund received $6 in redemption fees.
Dividend distributions: Distributions to shareholders are recorded on the ex-dividend date and are determined in accordance with Federal income tax regulations which may differ from GAAP.
NOTE 2. RELATED PARTY TRANSACTIONS
Effective January 1, 2005 AEGON/Transamerica Fund Advisors, Inc. was renamed Transamerica Fund Advisors, Inc. ("TFAI"); AEGON/Transamerica Fund Services, Inc. and AEGON/Transamerica Investor Services, Inc. merged into one entity and was renamed Transamerica Fund Services, Inc. ("TFS").
TFAI is the Fund's investment adviser. TFS is the Fund's administrator and transfer agent. AFSG Securities Corp. ("AFSG") is the Fund's distributor/principal underwriter. TFAI, TFS , and AFSG are affiliates of AEGON, NV, a Netherlands corporation.
Transamerica Investment Management, LLC and Great Companies, LLC are affiliates of the Fund and are sub-advisers to other funds within Transamerica IDEX Mutual Funds.
Because the underlying funds have varied expense and fee levels and the Fund may own different proportions of underlying funds at different times, the amount of fees and expenses incurred indirectly by the Fund will vary.
Investment advisory fees: The Fund pays management fees to TFAI based on average daily net assets ("ANA") at the following rate:
0.10% of ANA
TFAI has contractually agreed to waive its advisory fee and will reimburse the Fund to the extent that operating expenses, excluding 12b-1 fees, exceed the following stated annual limit:
0.45% Expense Limit
If total Fund expenses fall below the annual expense limitation agreement agreed to by the adviser within the succeeding three years, the Fund may be required to pay that adviser a portion or all of the waived advisory fees.
Transamerica IDEX Mutual Funds
Annual Report 2005
8
TA IDEX Asset Allocation–Moderate Growth Portfolio
NOTES TO FINANCIAL STATEMENTS (continued)
At October 31, 2005
(all amounts in thousands)
NOTE 2.–(continued)
There were no amounts recaptured during the year ended October 31, 2005. There are no amounts available for recapture at October 31, 2005.
Distribution and service fees: The Fund has a 12b-1 distribution plan under the 1940 Act pursuant to which an annual fee, based on average daily net assets, is paid to the distributor for various disbursements such as broker-dealer account servicing fees and other promotional expenses of the Fund. The Fund is authorized under the 12b-1 plan to pay fees on each class up to the following limits:
| Class A | | | N/A | | |
| Class B | | | 0.65 | % | |
| Class C | | | 0.65 | % | |
In addition, the underlying funds' Class A shares in which the Fund invests impose a 0.35% 12b-1 fee. To avoid duplication of the 12b-1 fees, each class of fund shares of the Fund has reduced the 12b-1 fees by the amount of the underlying funds' Class A 12b-1 fees.
In the case the Fund or a class of shares of the Fund is closed to new investors or investments, the Fund is authorized to pay 12b-1 fees for past sales and distribution efforts and present and past investor services.
Underwriter commissions relate to front-end sales charges imposed for Class A shares and contingent deferred sales charges from Classes B, C and certain A share redemptions. For the year ended October 31, 2005, the underwriter commissions were as follows:
| Received by Underwriter | | $ | 35,635 | | |
| Retained by Underwriter | | | 2,158 | | |
| Contingent Deferred Sales Charge | | | 1,339 | | |
Administrative services: The Fund has entered into an agreement with TFS for financial and legal fund administration services. As of January 1, 2005 the Fund pays TFS an annual fee of 0.02% of ANA. Prior to January 1, 2005 the Fund paid TFS an annual fee of 0.015% of ANA. The Legal fees on the Statement of Operations are for fees paid to external legal counsel.
Transfer agent fees: The Fund pays TFS an annual per-account charge for each open and closed account. The Fund paid TFS $1,964 for the year ended October 31, 2005.
Deferred compensation plan: Each eligible independent Fund Trustee may elect to participate in a non-qualified deferred compensation plan maintained by Transamerica IDEX Mutual Funds (the "Plan"). Under the Plan, such Trustees may defer payment of all or a portion of their total fees earned as a Fund Trustee. Each Trustee who is a participant in the Plan may elect that the earnings, losses or gains credited to his or her deferred fee amounts be determined based on a deemed investment in any series of Transamerica IDEX Mutual Funds, including the Fund. The right of a participant to receive a distribution from the Plan of the deferred fees is an unsecured claim against the general assets of all s eries of Transamerica IDEX Mutual Funds. The pro rata liability to the Fund of all deferred fees in the Plan amounted, as of October 31, 2005, to $34.
NOTE 3. INVESTMENT TRANSACTIONS
The cost of securities purchased and proceeds from securities sold (excluding short-term securities) for the year ended October 31, 2005, were as follows:
| Purchases of securities: | | | |
| Long-Term | | $ | 915,980 | | |
| U.S. Government | | | – | | |
| Proceeds from maturities and sales of securities: | | | |
| Long-Term | | | 440,851 | | |
| U.S. Government | | | – | | |
NOTE 4. FEDERAL INCOME TAX MATTERS
The Fund has not made any provision for federal income or excise taxes due to its policy to distribute all of its taxable income and capital gains to its shareholders and otherwise qualify as a regulated investment company under Subchapter M of the Internal Revenue Code. Income and capital gain distributions are determined in accordance with income tax regulations, which may differ from GAAP. These differences are primarily due to differing treatment for items including, but not limited to, wash sales and distribution reclasses.
Therefore, distributions determined in accordance with tax regulations may differ significantly in amount or character from net investment income and realized gains for financial reporting purposes. Financial reporting records are adjusted for permanent book/tax differences to reflect tax character. Financial records are not adjusted for temporary differences. These reclassifications are as follows:
| Undistributed net investment income (loss) | | $ | 27 | | |
Undistributed net realized gain (loss) from investment
in affiliated investment companies | | | (27 | ) | |
The tax character of distributions paid may differ from the character of distributions shown in the Statement of Changes in Net Assets due to short-term gains being treated as ordinary income for tax purposes. The tax character of distributions paid during 2004 and 2005 was as follows:
| 2004 Distributions paid from: | |
| Ordinary Income | | $ | 2,455 | | |
| Long-term Capital Gain | | | – | | |
| 2005 Distributions paid from: | |
| Ordinary Income | | | 21,075 | | |
| Long-term Capital Gain | | | 6,446 | | |
Transamerica IDEX Mutual Funds
Annual Report 2005
9
TA IDEX Asset Allocation–Moderate Growth Portfolio
NOTES TO FINANCIAL STATEMENTS (continued)
At October 31, 2005
(all amounts in thousands)
NOTE 4.–(continued)
The tax basis components of distributable earnings as of October 31, 2005, are as follows:
| Undistributed Ordinary Income | | $ | 7,693 | | |
| Undistributed Long-term Capital Gains | | $ | 53,727 | | |
| Capital Loss Carryforward | | $ | - | | |
| Net Unrealized Appreciation (Depreciation) | | $ | 186,150 | * | |
* Amount includes unrealized appreciation (depreciation) from deferred compensation.
The aggregate cost of investments and composition of unrealized appreciation (depreciation) for federal income tax purposes as of October 31, 2005, are as follows:
| Federal Tax Cost Basis | | $ | 1,781,707 | | |
| Unrealized Appreciation | | $ | 189,716 | | |
| Unrealized (Depreciation) | | | (3,563 | ) | |
| Net Unrealized Appreciation (Depreciation) | | $ | 186,153 | | |
NOTE 5. REGULATORY PROCEEDINGS
There continues to be significant federal and state regulatory activity relating to financial services companies, particularly mutual fund companies and their investment advisers. As part of an ongoing investigation regarding potential market timing, recordkeeping and trading compliance issues and matters affecting the Fund's investment adviser, TFAI, and certain affiliates and former employees of TFAI, the SEC staff has indicated that it is likely to take some action against TFAI and certain of its affiliates at the conclusion of the investigation. The potential timing and the scope of any such action is difficult to predict. Although the impact of any action brought against TFAI and/or its affiliates is difficult to assess at the present time, the Fund currently believes that the likelihood that any such action will have a material adverse impact on it is remote. It is important to note that the Fund is not aware of any allegation of wrongdoing against it and its Board at the time this annual report is printed. Although it is not anticipated that these developments will have an adverse impact on the Fund, there can be no assurance at this time. TFAI and its affiliates are actively working with the SEC in regard to this matter; however, the exact resolution cannot be determined at this time. TFAI will take such actions that it deems necessary or appropriate to continue providing management services to the Fund and to bring all matters to an appropriate conclusion.
TFAI and/or its affiliates, and not the Fund, will bear the costs regarding these regulatory matters.
Transamerica IDEX Mutual Funds
Annual Report 2005
10
Report of Independent Registered Certified Public Accounting Firm
To the Board of Trustees and Shareholders of
TA IDEX Asset Allocation–Moderate Growth Portfolio
In our opinion, the accompanying statement of assets and liabilities, including the schedule of investments, and the related statements of operations and of changes in net assets and the financial highlights present fairly, in all material respects, the financial position of TA IDEX Asset Allocation–Moderate Growth Portfolio (the "Fund") (one of the portfolios constituting the Transamerica IDEX Mutual Funds) at October 31, 2005, the results of its operations for the year then ended, the changes in its net assets for each of the two years in the period then ended and the financial highlights for each of the periods presented, in conformity with accounting principles generally accepted in the United States of America. These financial statements and financial highlights (hereafter referred to as "financial statements") are the responsibility of the Fund's management; our responsibility is to expr ess an opinion on these financial statements based on our audits. We conducted our audits of these financial statements in accordance with the standards of the Public Company Accounting Oversight Board (United States). Those standards require that we plan and perform the audit to obtain reasonable assurance about whether the financial statements are free of material misstatement. An audit includes examining, on a test basis, evidence supporting the amounts and disclosures in the financial statements, assessing the accounting principles used and significant estimates made by management, and evaluating the overall financial statement presentation. We believe that our audits, which included confirmation of securities at October 31, 2005 by correspondence with the custodian, provide a reasonable basis for our opinion.

December 22, 2005
Transamerica IDEX Mutual Funds
Annual Report 2005
11
TA IDEX Asset Allocation–Moderate Growth Portfolio
SUPPLEMENTAL INFORMATION (unaudited)
TAX INFORMATION
For dividends paid during the year ended October 31, 2005, the Fund designated $3,160 as qualified dividend income.
For tax purposes, the Fund has made a Long-Term Capital Gain Designation of $6,446 for the year ended October 31, 2005.
The information and distributions reported herein may differ from the information and distributions taxable to the shareholders for the calendar year ending December 31, 2005. Complete information will be computed and reported in conjunction with your 2005 Form 1099-DIV.
Transamerica IDEX Mutual Funds
Annual Report 2005
12
TA IDEX Asset Allocation–Moderate Portfolio
MARKET ENVIRONMENT
The past twelve months were a volatile period in the stock market, but it ended with solid overall gains. Stocks surged in post-election euphoria at the end of 2004; but then spent the early part of 2005 giving up most of those gains. After hitting bottom in May 2005, most stock indexes posted good gains through the end of November. Large cap stocks lagged the riskier parts of the market. Over the twelve month period, the Standard and Poor's 500 Composite Stock Index returned 8.71%, while the Standard and Poor's 400 MidCap Index doubled that with a 17.64% gain. International stocks rose even more, with the Morgan Stanley Capital International EAFE Index up more than 18% in dollar terms. Value stocks gained slightly more than growth stocks over the period, with value doing well early in the year and growth coming on strong in the past six months.
Driving the market's swing was uncertainty about the economy. Fear that the Federal Reserve Board ("Fed") had clamped down too hard stunted performance early in 2005, compounded by worries about Hurricane Katrina later in the year. After all was said and done, though, the economy continued to chug along nicely, as evidenced by continued consumer strength, solid corporate earnings, and continuing productivity growth. The key question mark remaining for the markets is whether the new Fed Chairman will be able to engineer a soft landing or will he crash the economy into another recession.
Short-term interest rates rose dramatically over the year, as the Fed continued hiking rates in 25 basis point doses to forestall inflation. Nevertheless, longer term rates were little changed, leading to a modest 1.13% gain in the Lehman Brothers Aggregate Bond Index ("LBAB") for the year. Bonds with significant credit risk performed much better overall, with emerging-markets bond funds up more than 12%; convertible bond funds up 7%; and high-yield bond funds up more than 3%.
PERFORMANCE
For the year ended October 31, 2005, TA IDEX Asset Allocation–Moderate Portfolio, Class A returned 8.54%. By comparison its primary and secondary benchmarks, the Dow Jones Wilshire 5000 Total Market Index ("DJ Wilshire 5000") and the LBAB, returned 10.77% and 1.13%, respectively.
STRATEGY REVIEW
How did you manage the portfolio in this market environment?
We maintained our strategy of persistent diversification across global equity markets, including small and mid cap stocks, which were key sources of the portfolio's strong relative performance. The portfolio was up 8.54% over the trailing twelve months, versus 10.77% for the DJ Wilshire 5000 and 1.13% for the LBAB. Moreover, it landed in the top third of Morningstar's Moderate Allocation category.
Which individual holdings had the greatest positive impact on performance?
The biggest winner at the top of the portfolio was TA IDEX Transamerica Convertible Securities. This fund's equity-sensitive bonds gained more than 9% for the year, while amounting to a full 7% to 8% of total assets.
Stock funds kicked in even bigger gains. Both TA IDEX Transamerica Equity and TA IDEX Transamerica Small/Mid Cap Value added more than 20% for the year; while TA IDEX Transamerica Growth Opportunities and TA IDEX Clarion Real Estate Securities came close to the 20% mark. TA IDEX T. Rowe Price Health Sciences added more than 15%. These five big winners counted for more than 21% of the portfolio's assets at the beginning of the year, and slightly less at the end.
Which individual holdings had the greatest negative impact on performance?
At the start of the year two of the portfolio's largest equity holdings were TA IDEX Salomon All Cap and TA IDEX Salomon Investors Value, which accounted for more than 15% of assets. These two holdings underperformed their benchmarks through March 2005, at which point they were cut to a total of 6% of assets. Since that time, their performance has improved.
The portfolio's commitment to international equity exposure should have helped more than it did. TA IDEX American Century International, the portfolio's largest international equity holding with 3.5% of assets at the beginning of the period, lagged its benchmark by more than 225 basis points through March 2005. At that point the fund was dramatically reduced and those assets were added to two new international funds, TA IDEX Marsico International Growth and TA IDEX Evergreen International Small Cap, both of which outperformed TA IDEX American Century International over the subsequent period.
Which sectors/industries had the greatest impact on performance?
TA IDEX Transamerica Small/Mid Cap Value, the portfolio's second largest stock fund has a significant overweight in the energy sector. This has been one of the best performing sectors in
Transamerica IDEX Mutual Funds
Annual Report 2005
1
TA IDEX Asset Allocation–Moderate Portfolio (continued)
the equity markets in the trailing twelve months, and as a result this is one of the top performing funds in the portfolio.
The portfolio ended the year with nearly 4% of total assets in TA IDEX Clarion Real Estate Securities ("Clarion"), which primarily owns real estate investment trusts ("REIT"s). The real estate sector was one of the best performing sectors across the U.S. stock market, and as a result Clarion was up nearly 20% for the year.
Which countries had the greatest impact on performance?
Because of the limited international choices over the course of the year, the portfolio's foreign exposure was generally below its target level. The largest international exposure of the portfolio was to the eurozone, at approximately 6% of equity assets.
Todd Porter, CFA
Portfolio Manager
Morningstar Associates, LLC
Transamerica IDEX Mutual Funds
Annual Report 2005
2
TA IDEX Asset Allocation–Moderate Portfolio
Comparison of change in value of $10,000 investment in Class A shares and its comparative indices.
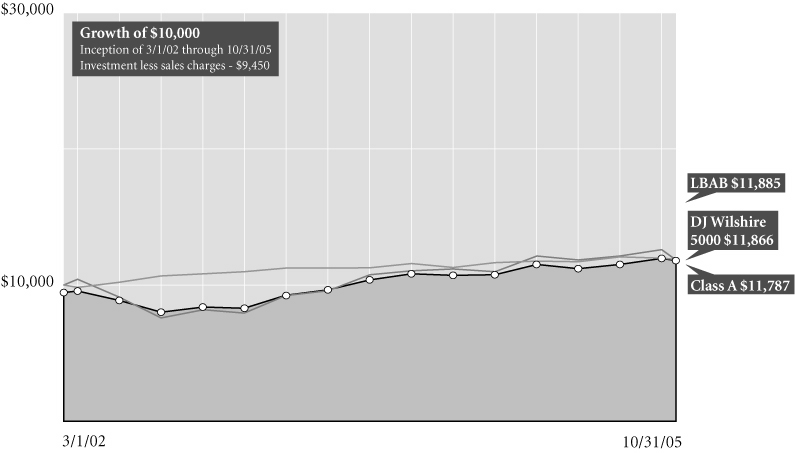
Average Annual Total Return for Periods Ended 10/31/05
| | | 1 year | | From
Inception | | Inception
Date | |
| Class A (NAV) | | | 8.54 | % | | | 6.20 | % | | 3/1/02 | |
| Class A (POP) | | | 2.57 | % | | | 4.57 | % | | 3/1/02 | |
| DJ Wilshire 50001 | | | 10.77 | % | | | 6.00 | % | | 3/1/02 | |
| LBAB1 | | | 1.13 | % | | | 4.82 | % | | 3/1/02 | |
| Class B (NAV) | | | 7.81 | % | | | 5.51 | % | | 3/1/02 | |
| Class B (POP) | | | 2.81 | % | | | 5.04 | % | | 3/1/02 | |
| Class C (NAV) | | | 7.85 | % | | | 11.96 | % | | 11/11/02 | |
| Class C (POP) | | | 6.85 | % | | | 11.96 | % | | 11/11/02 | |
NOTES
1 The Dow Jones Wilshire 5000 Total Market (DJ Wilshire 5000) Index and Lehman Brothers Aggregate Bond (LBAB) Index are unmanaged indices used as a general measure of market performance. Calculations assume dividends and capital gains are reinvested and do not include any managerial expenses. From inception calculation is based on life of Class A shares. Source: Standard & Poor's Micropal®© Micropal, Inc. 2005 – 1-800-596-5323 – http://www.funds-sp.com.
The performance data presented represents past performance, future results may vary. Performance data does not reflect the deduction of taxes that would be paid on fund distributions or the redemption of fund shares. Investment return and principal value will fluctuate so that an investor's shares, when redeemed, may be worth more or less than their original cost. Current performance may be lower or higher than performance quoted. Please see www.transamericaidex.com for performance data current to the most recent month-end.
Public Offering Price (POP) returns include the reinvestment of dividends and capital gains and reflect the maximum sales charge of 5.5% for A shares or the maximum applicable contingent deferred sales charge (5% in the 1st year, decreasing to 0% after 6 years) for Class B shares and 1% (during the first 12 months) for Class C shares. Shares purchased prior to March 1, 2004 are subject to a maximum applicable contingent deferred sales charge (5% in the 1st year, decreasing to 0% after 7 years) for Class B shares and (2% in the 1st year, decreasing to 0% after 2 years) for Class C shares. Net Asset Value (NAV) returns include the reinvestment of dividends and capital gains but do not reflect any sales charges.
This material must be preceded or accompanied by a current prospectus, which includes specific contents regarding the investment objectives and policies of this fund.
Transamerica IDEX Mutual Funds
Annual Report 2005
3
TA IDEX Assest Allocation–Moderate Portfolio
UNDERSTANDING YOUR FUND'S EXPENSES
(unaudited)
SHAREHOLDER EXPENSES
Fund shareholders may incur two types of costs: (1) transaction costs, including sales charges (loads) on purchases, contingent deferred sales charges on redemptions and redemption fees; and (2) ongoing costs, including management fees, 12b-1 distribution and service fees, and other fund expenses.
The following Example is intended to help you understand your ongoing costs (in dollars and cents) of investing in a Fund and to compare these costs with the ongoing costs of investing in other funds.
The Example is based on an investment of $1,000 invested at May 1, 2005 and held for the entire period until October 31, 2005.
ACTUAL EXPENSES
The first line in the table below provides information about actual account values and actual expenses. You may use the information in this line, together with the amount you invested, to estimate the expenses that you paid over the period. Simply divide your account value by $1,000 (for example, an $8,600 account value divided by $1,000 = 8.6), then multiply the result by the number in the first line of your Fund under the heading entitled "Expenses Paid During Period" to estimate the expenses you paid on your account during this period. If your account is an IRA, your expenses could have included a $15 annual fee. The amount of any fee paid through your account would increase the estimate of expenses you paid during the period and decrease your ending account value.
HYPOTHETICAL EXAMPLE FOR COMPARISON PURPOSES
The second line in the table below provides information about hypothetical account values and hypothetical expenses based on the Fund's actual expense ratio and an assumed rate of return of 5% per year before expenses, which is not the Fund's actual return. The hypothetical account values and expenses may not be used to estimate the actual ending account balance or expenses you paid for the period. You may use this information to compare the ongoing costs of investing in your Fund and other funds. To do so, compare this 5% hypothetical example with the 5% hypothetical examples that appear in the shareholder reports of the other funds. As in the case of the actual expense example, if your account is subject to an IRA fee, the amount of the fee paid through your account would increase the hypothetical expenses you would have paid during the period and decrease the hypothetical ending account value.
Please note that the expenses shown in the table are meant to highlight your ongoing costs only and do not reflect any transactional costs, such as sales charges, redemption fees, brokerage commissions paid on purchases and sales of fund shares. Therefore, the second line under the Fund in the table is useful in comparing ongoing costs only, and will not help you determine the relative total costs of owning different funds. If any of these transaction costs were included, your costs would be higher. The expenses shown in the table do not reflect any fees that may be charged to you by brokers, financial intermediaries or other financial institutions.
| | | Beginning
Account
Value | | Ending
Account
Value | | Annualized
Expense
Ratio | | Expenses Paid
During Period (a) | |
| Class A | | | |
| Actual | | $ | 1,000.00 | | | $ | 1,063.20 | | | | 0.26 | % | | $ | 1.35 | | |
| Hypothetical (b) | | | 1,000.00 | | | | 1,023.89 | | | | 0.26 | | | | 1.33 | | |
| Class B | | | |
| Actual | | | 1,000.00 | | | | 1,059.80 | | | | 0.93 | | | | 4.83 | | |
| Hypothetical (b) | | | 1,000.00 | | | | 1,020.52 | | | | 0.93 | | | | 4.74 | | |
| Class C | | | |
| Actual | | | 1,000.00 | | | | 1,059.80 | | | | 0.89 | | | | 4.62 | | |
| Hypothetical (b) | | | 1,000.00 | | | | 1,020.72 | | | | 0.89 | | | | 4.53 | | |
(a) Expenses are calculated using each Fund's annualized expense ratio (as disclosed in the table), multiplied by the average account value for the period, multiplied by number of days in the period (184 days), and divided by the number of days in the year (365 days).
(b) 5% return per year before expenses.
GRAPHICAL PRESENTATION OF SCHEDULE OF INVESTMENTS
By Investment Type
At October 31, 2005
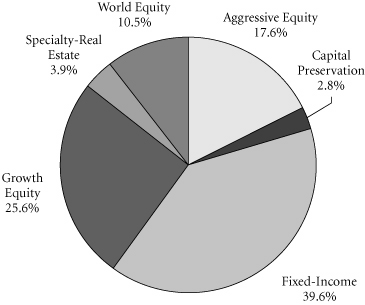
This chart shows the percentage breakdown by investment type of the Fund's total investment securities.
Transamerica IDEX Mutual Funds
Annual Report 2005
4
TA IDEX Asset Allocation–Moderate Portfolio
SCHEDULE OF INVESTMENTS
At October 31, 2005
(all amounts except share amounts in thousands)
| | | Shares | | Value | |
| INVESTMENT COMPANIES (99.9%) ø | | | |
| Aggressive Equity (17.5%) | | | |
| TA IDEX J.P. Morgan Mid Cap Value ‡ | | | 2,844,977 | | | $ | 28,279 | | |
| TA IDEX T. Rowe Price Health Sciences | | | 4,243,678 | | | | 52,791 | | |
| TA IDEX T. Rowe Price Small Cap ‡ | | | 2,022,102 | | | | 25,499 | | |
TA IDEX Transamerica Growth
Opportunities ‡ | | | 5,094,698 | | | | 39,993 | | |
TA IDEX Transamerica Small/Mid Cap
Value | | | 4,932,657 | | | | 82,326 | | |
| Capital Preservation (2.8%) | | | |
| TA IDEX Transamerica Money Market | | | 36,171,786 | | | | 36,172 | | |
| Fixed-Income (39.6%) | | | |
| TA IDEX PIMCO Real Return TIPS | | | 12,403,165 | | | | 126,884 | | |
| TA IDEX PIMCO Total Return | | | 4,903,669 | | | | 49,821 | | |
| TA IDEX Short Term Bond | | | 6,608,672 | | | | 64,699 | | |
TA IDEX Transamerica Convertible
Securities | | | 7,525,642 | | | | 86,997 | | |
| TA IDEX Transamerica Flexible Income | | | 5,214,034 | | | | 48,543 | | |
| TA IDEX Transamerica High-Yield Bond | | | 15,554,517 | | | | 139,524 | | |
| Growth Equity (25.6%) | | | |
TA IDEX American Century Large
Company Value | | | 7,870,146 | | | | 86,414 | | |
| TA IDEX Great Companies–TechnologySM | | | 3,015,207 | | | | 11,518 | | |
| TA IDEX Janus Growth ‡ | | | 985,461 | | | | 24,302 | | |
| | | Shares | | Value | |
| Growth Equity (continued) | |
| TA IDEX Marsico Growth ‡ | | | 3,309,613 | | | $ | 34,155 | | |
| TA IDEX Salomon All Cap | | | 1,509,813 | | | | 24,308 | | |
| TA IDEX Salomon Investors Value | | | 3,423,186 | | | | 48,507 | | |
| TA IDEX Transamerica Equity | | | 4,981,611 | | | | 44,187 | | |
| TA IDEX UBS Large Cap Value ‡ | | | 5,550,341 | | | | 60,665 | | |
| Specialty–Real Estate (3.9%) | |
| TA IDEX Clarion Real Estate Securities | | | 3,167,271 | | | | 51,088 | | |
| World Equity (10.5%) | |
| TA IDEX American Century International | | | 561,355 | | | | 5,653 | | |
TA IDEX Evergreen International
Small Cap ‡ | | | 1,637,801 | | | | 20,767 | | |
| TA IDEX Marsico International Growth ‡ | | | 2,595,945 | | | | 28,789 | | |
TA IDEX Templeton Great Companies
Global | | | 2,047,568 | | | | 50,534 | | |
TA IDEX Van Kampen Emerging
Markets Debt | | | 2,929,845 | | | | 30,617 | | |
| Total Investment Companies (cost: $1,181,978) | | | | | | $ | 1,303,032 | | |
| SUMMARY: | |
| Investment companies, at value | | | 99.9 | % | | $ | 1,303,032 | | |
| Other assets in excess of liabilities | | | 0.1 | % | | | 1,197 | | |
| Net assets | | | 100.0 | % | | $ | 1,304,229 | | |
NOTES TO SCHEDULE OF INVESTMENTS:
‡ Non-income producing.
ø The Fund invests its assets in Class A shares of the underlying TA IDEX Mutual Funds, which are affiliates of the Fund.
The notes to the financial statements are an integral part of this report.
Transamerica IDEX Mutual Funds
Annual Report 2005
5
TA IDEX Asset Allocation–Moderate Portfolio
STATEMENT OF ASSETS AND LIABILITIES
At October 31, 2005
(all amounts except per share amounts in thousands)
| Assets: | | | |
Investment in affiliated investment companies
at value (cost: $1,181,978) | | $ | 1,303,032 | | |
| Receivables: | |
| Shares of beneficial interest sold | | | 5,619 | | |
| Dividends | | | 176 | | |
| Other | | | 17 | | |
| | | | 1,308,844 | | |
| Liabilities: | | | |
| Investment securities purchased | | | 1,531 | | |
| Accounts payable and accrued liabilities: | |
| Shares of beneficial interest redeemed | | | 2,213 | | |
| Management and advisory fees | | | 110 | | |
| Distribution and service fees | | | 532 | | |
| Transfer agent fees | | | 106 | | |
| Administration fees | | | 22 | | |
| Other | | | 101 | | |
| | | | 4,615 | | |
| Net Assets | | $ | 1,304,229 | | |
| Net Assets Consist of: | | | |
Shares of beneficial interest, unlimited shares
authorized, no par value | | $ | 1,141,822 | | |
| Undistributed net investment income (loss) | | | 13,099 | | |
Undistributed net realized gain (loss) from
investment in affiliated investment companies | | | 28,257 | | |
Net unrealized appreciation (depreciation) on
investment in affiliated investment companies | | | 121,051 | | |
| Net Assets | | $ | 1,304,229 | | |
| Net Assets by Class: | | | |
| Class A | | $ | 329,797 | | |
| Class B | | | 295,649 | | |
| Class C | | | 678,783 | | |
| Shares Outstanding: | | | |
| Class A | | | 27,991 | | |
| Class B | | | 25,269 | | |
| Class C | | | 58,017 | | |
| Net Asset Value Per Share: | | | |
| Class A | | $ | 11.78 | | |
| Class B | | | 11.70 | | |
| Class C | | | 11.70 | | |
| Maximum Offering Price Per Share (a): | | | |
| Class A | | $ | 12.47 | | |
(a) Includes the maximum selling commission (represented as a percentage of offering price) which is reduced on certain levels of sales as set forth in the Prospectus. Net asset value per share for Classes B and C shares represents offering price. The redemption price for Classes B and C shares equals net asset value less any applicable contingent deferred sales charge.
STATEMENT OF OPERATIONS
For the year ended October 31, 2005
(all amounts in thousands)
| Investment Income: | | | |
| Dividends from affiliated investment companies | | $ | 30,249 | | |
| Expenses: | | | |
| Management and advisory fees | | | 1,182 | | |
| Distribution and service fees: | |
| Class B | | | 1,849 | | |
| Class C | | | 3,965 | | |
| Transfer agent fees: | |
| Class A | | | 304 | | |
| Class B | | | 345 | | |
| Class C | | | 520 | | |
| Printing and shareholder reports | | | 66 | | |
| Custody fees | | | 48 | | |
| Administration fees | | | 227 | | |
| Legal fees | | | 78 | | |
| Audit fees | | | 19 | | |
| Trustees fees | | | 53 | | |
| Registration fees: | |
| Class A | | | 34 | | |
| Class B | | | 28 | | |
| Class C | | | 52 | | |
| Other | | | 13 | | |
| Total expenses | | | 8,783 | | |
| Net Investment Income (Loss) | | | 21,466 | | |
Net Realized and Unrealized Gain (Loss) on Investment
in Affiliated Investment Companies | | | |
Realized gain (loss) from investment in affiliated
investment companies | | | 24,253 | | |
Realized gain distributions from investment in
affiliated investment companies | | | 4,173 | | |
| | | | 28,426 | | |
Increase (decrease) in unrealized appreciation
(depreciation) on investment in affiliated
investment companies | | | 37,659 | | |
Net Gain (Loss) on Investment in Affiliated
Investment Companies | | | 66,085 | | |
Net Increase (Decrease) in Net Assets Resulting
from Operations | | $ | 87,551 | | |
The notes to the financial statements are an integral part of this report.
Transamerica IDEX Mutual Funds
Annual Report 2005
6
TA IDEX Asset Allocation–Moderate Portfolio
STATEMENTS OF CHANGES IN NET ASSETS
For the years ended
(all amounts in thousands)
| | | October 31,
2005 | | October 31,
2004 | |
| Increase (Decrease) In Net Assets From: | |
| Operations: | |
| Net investment income (loss) | | $ | 21,466 | | | $ | 5,358 | | |
Net realized gain (loss) from
investment in affiliated
investment companies | | | 28,426 | | | | 24,191 | | |
Net unrealized appreciation
(depreciation) on investment in
affiliated investment companies | | | 37,659 | | | | 31,585 | | |
| | | | 87,551 | | | | 61,134 | | |
| Distributions to Shareholders: | |
| From net investment income: | |
| Class A | | | (7,272 | ) | | | (1,929 | ) | |
| Class B | | | (6,249 | ) | | | (1,796 | ) | |
| Class C | | | (13,126 | ) | | | (2,222 | ) | |
| Class C2 | | | – | | | | (412 | ) | |
| Class M | | | – | | | | (167 | ) | |
| | | | (26,647 | ) | | | (6,526 | ) | |
| From net realized gains: | |
| Class A | | | (1,417 | ) | | | – | | |
| Class B | | | (1,533 | ) | | | – | | |
| Class C | | | (3,103 | ) | | | – | | |
| | | | (6,053 | ) | | | – | | |
| Capital Share Transactions: | |
| Proceeds from shares sold: | |
| Class A | | | 143,277 | | | | 136,942 | | |
| Class B | | | 56,165 | | | | 93,601 | | |
| Class C | | | 228,072 | | | | 277,155 | | |
| Class C2 | | | – | | | | 8,303 | | |
| Class M | | | – | | | | 3,239 | | |
| | | | 427,514 | | | | 519,240 | | |
Dividends and distributions
reinvested: | |
| Class A | | | 7,496 | | | | 1,710 | | |
| Class B | | | 6,500 | | | | 1,484 | | |
| Class C | | | 11,211 | | | | 1,515 | | |
| Class C2 | | | – | | | | 324 | | |
| Class M | | | – | | | | 152 | | |
| | | | 25,207 | | | | 5,185 | | |
| Cost of shares redeemed: | |
| Class A | | | (67,750 | ) | | | (34,420 | ) | |
| Class B | | | (41,772 | ) | | | (32,173 | ) | |
| Class C | | | (106,871 | ) | | | (52,508 | ) | |
| Class C2 | | | – | | | | (5,376 | ) | |
| Class M | | | – | | | | (3,146 | ) | |
| | | | (216,393 | ) | | | (127,623 | ) | |
| Redemption fees: | |
| Class A | | | 1 | | | | – | | |
| Class C | | | 2 | | | | – | | |
| | | | 3 | | | | – | | |
| Class level exchanges: | |
| Class C | | | – | | | | 67,248 | | |
| Class C2 | | | – | | | | (49,594 | ) | |
| Class M | | | – | | | | (17,654 | ) | |
| | | | – | | | | – | | |
| | | October 31,
2005 | | October 31,
2004 | |
| Automatic conversions: | |
| Class A | | $ | 281 | | | $ | 95 | | |
| Class B | | | (281 | ) | | | (95 | ) | |
| | | | – | | | | – | | |
| | | | 236,331 | | | | 396,802 | | |
| Net increase (decrease) in net assets | | | 291,182 | | | | 451,410 | | |
| Net Assets: | |
| Beginning of year | | | 1,013,047 | | | | 561,637 | | |
| End of year | | $ | 1,304,229 | | | $ | 1,013,047 | | |
Undistributed Net Investment
Income (Loss) | | $ | 13,099 | | | $ | 18,282 | | |
| Share Activity: | |
| Shares issued: | |
| Class A | | | 12,481 | | | | 12,569 | | |
| Class B | | | 4,921 | | | | 8,625 | | |
| Class C | | | 19,929 | | | | 25,497 | | |
| Class C2 | | | – | | | | 768 | | |
| Class M | | | – | | | | 299 | | |
| | | | 37,331 | | | | 47,758 | | |
Shares issued–reinvested from
distributions: | |
| Class A | | | 658 | | | | 162 | | |
| Class B | | | 571 | | | | 140 | | |
| Class C | | | 986 | | | | 143 | | |
| Class C2 | | | – | | | | 31 | | |
| Class M | | | – | | | | 14 | | |
| | | | 2,215 | | | | 490 | | |
| Shares redeemed: | |
| Class A | | | (5,897 | ) | | | (3,153 | ) | |
| Class B | | | (3,650 | ) | | | (2,959 | ) | |
| Class C | | | (9,329 | ) | | | (4,828 | ) | |
| Class C2 | | | – | | | | (496 | ) | |
| Class M | | | – | | | | (289 | ) | |
| | | | (18,876 | ) | | | (11,725 | ) | |
| Class level exchanges: | |
| Class C | | | – | | | | 6,171 | | |
| Class C2 | | | – | | | | (4,566 | ) | |
| Class M | | | – | | | | (1,603 | ) | |
| | | | – | | | | 2 | | |
| Automatic conversions: | |
| Class A | | | 25 | | | | 9 | | |
| Class B | | | (25 | ) | | | (9 | ) | |
| | | | – | | | | – | | |
Net increase (decrease) in shares
outstanding: | |
| Class A | | | 7,267 | | | | 9,587 | | |
| Class B | | | 1,817 | | | | 5,797 | | |
| Class C | | | 11,586 | | | | 26,983 | | |
| Class C2 | | | – | | | | (4,263 | ) | |
| Class M | | | – | | | | (1,579 | ) | |
| | | | 20,670 | | | | 36,525 | | |
The notes to the financial statements are an integral part of this report.
Transamerica IDEX Mutual Funds
Annual Report 2005
7
TA IDEX Asset Allocation–Moderate Portfolio
FINANCIAL HIGHLIGHTS
| | | | | For a share of beneficial interest outstanding throughout each period | |
| | | | | Net Asset | | Investment Operations | | Distributions | | Net Asset | |
| | | For the
Period
Ended (d)(g) | | Value,
Beginning
of Period | | Net
Investment
Income (Loss) | | Net Realized
and Unrealized
Gain (Loss) | | Total
Operations | | From Net
Investment
Income | | From Net
Realized
Gains | | Total
Distributions | | Value,
End
of Period | |
| Class A | | 10/31/2005 | | $ | 11.23 | | | $ | 0.27 | | | $ | 0.67 | | | $ | 0.94 | | | $ | (0.33 | ) | | $ | (0.06 | ) | | $ | (0.39 | ) | | $ | 11.78 | | |
| | | 10/31/2004 | | | 10.42 | | | | 0.12 | | | | 0.84 | | | | 0.96 | | | | (0.15 | ) | | | – | | | | (0.15 | ) | | | 11.23 | | |
| | | 10/31/2003 | | | 8.76 | | | | 0.12 | | | | 1.62 | | | | 1.74 | | | | (0.08 | ) | | | – | | | | (0.08 | ) | | | 10.42 | | |
| | | 10/31/2002 | | | 10.00 | | | | 0.04 | | | | (1.28 | ) | | | (1.24 | ) | | | – | | | | – | | | | – | | | | 8.76 | | |
| Class B | | 10/31/2005 | | | 11.16 | | | | 0.18 | | | | 0.68 | | | | 0.86 | | | | (0.26 | ) | | | (0.06 | ) | | | (0.32 | ) | | | 11.70 | | |
| | | 10/31/2004 | | | 10.37 | | | | 0.05 | | | | 0.83 | | | | 0.88 | | | | (0.09 | ) | | | – | | | | (0.09 | ) | | | 11.16 | | |
| | | 10/31/2003 | | | 8.71 | | | | 0.05 | | | | 1.63 | | | | 1.68 | | | | (0.02 | ) | | | – | | | | (0.02 | ) | | | 10.37 | | |
| | | 10/31/2002 | | | 10.00 | | | | 0.01 | | | | (1.30 | ) | | | (1.29 | ) | | | – | | | | – | | | | – | | | | 8.71 | | |
| Class C | | 10/31/2005 | | | 11.17 | | | | 0.19 | | | | 0.67 | | | | 0.86 | | | | (0.27 | ) | | | (0.06 | ) | | | (0.33 | ) | | | 11.70 | | |
| | | 10/31/2004 | | | 10.37 | | | | 0.05 | | | | 0.84 | | | | 0.89 | | | | (0.09 | ) | | | – | | | | (0.09 | ) | | | 11.17 | | |
| | | 10/31/2003 | | | 8.71 | | | | 0.05 | | | | 1.63 | | | | 1.68 | | | | (0.02 | ) | | | – | | | | (0.02 | ) | | | 10.37 | | |
| | | | | | | Ratios/Supplemental Data | |
| | | For the
Period | | Total | | Net Assets,
End of
Period | | Ratio of Expenses
to Average
Net Assets (a)(i) | | Net Investment
Income (Loss)
to Average | | Portfolio
Turnover | |
| | | Ended (g) | | Return (c) | | (000's) | | Net (e) | | Total (f) | | Net Assets (a)(h) | | Rate (b) | |
| Class A | | 10/31/2005 | | | 8.54 | % | | $ | 329,797 | | | | 0.26 | % | | | 0.26 | % | | | 2.31 | % | | | 19 | % | |
| | | 10/31/2004 | | | 9.32 | | | | 232,748 | | | | 0.28 | | | | 0.28 | | | | 1.13 | | | | 1 | | |
| | | 10/31/2003 | | | 19.98 | | | | 116,102 | | | | 0.37 | | | | 0.37 | | | | 1.22 | | | | 18 | | |
| | | 10/31/2002 | | | (12.40 | ) | | | 17,517 | | | | 0.45 | | | | 0.78 | | | | 0.83 | | | | 12 | | |
| Class B | | 10/31/2005 | | | 7.81 | | | | 295,649 | | | | 0.92 | | | | 0.92 | | | | 1.61 | | | | 19 | | |
| | | 10/31/2004 | | | 8.62 | | | | 261,772 | | | | 0.93 | | | | 0.93 | | | | 0.48 | | | | 1 | | |
| | | 10/31/2003 | | | 19.39 | | | | 183,148 | | | | 1.02 | | | | 1.02 | | | | 0.57 | | | | 18 | | |
| | | 10/31/2002 | | | (12.90 | ) | | | 38,969 | | | | 1.10 | | | | 1.43 | | | | 0.18 | | | | 12 | | |
| Class C | | 10/31/2005 | | | 7.85 | | | | 678,783 | | | | 0.89 | | | | 0.89 | | | | 1.67 | | | | 19 | | |
| | | 10/31/2004 | | | 8.67 | | | | 518,527 | | | | 0.89 | | | | 0.89 | | | | 0.50 | | | | 1 | | |
| | | 10/31/2003 | | | 19.39 | | | | 201,774 | | | | 1.02 | | | | 1.02 | | | | 0.57 | | | | 18 | | |
NOTES TO FINANCIAL HIGHLIGHTS
(a) Annualized.
(b) Not annualized.
(c) Total Return has been calculated for the applicable period without deduction of a sales load, if any, on an initial purchase. Periods of less than one year are not annualized.
(d) Per share information is calculated based on average number of shares outstanding.
(e) Ratio of Net Expenses to Average Net Assets is net of fee waivers and reimbursements by the investment adviser, if any (see note 2).
(f) Ratio of Total Expenses to Average Net Assets includes all expenses before fee waivers and reimbursements by the investment adviser.
(g) TA IDEX Asset Allocation–Moderate Portfolio ("the Fund") commenced operations on March 1, 2002. The inception date for the Fund's offering of share Class C was November 11, 2002.
(h) Recognition of net investment income by the Fund is affected by the timing of the declaration of dividends by the underlying companies in which the Fund invests.
(i) Does not include expenses of the investment companies in which the Fund invests.
The notes to the financial statements are an integral part of this report.
Transamerica IDEX Mutual Funds
Annual Report 2005
8
TA IDEX Asset Allocation–Moderate Portfolio
NOTES TO FINANCIAL STATEMENTS
At October 31, 2005
(all amounts in thousands)
NOTE 1. ORGANIZATION AND SIGNIFICANT ACCOUNTING POLICIES
Transamerica IDEX Mutual Funds is an open-end management investment company registered under the Investment Company Act of 1940, as amended (the "1940 Act").
In the normal course of business, TA IDEX Asset Allocation - Moderate Portfolio (the "Fund") enters into contracts that contain a variety of representations that provide general indemnifications. The Fund's maximum exposure under these arrangements is unknown, as this would involve future claims that may be made against the Fund and/or its affiliates that have not yet occurred. However, based on experience, the Fund expects the risk of loss to be remote.
This report should be read in conjunction with the current Fund prospectus, which contains more complete information about the Fund.
The following is a summary of significant accounting policies followed by the Fund in the preparation of the financial statements. In preparing the Fund's financial statements in accordance with accounting principles generally accepted in the United States of America ("GAAP"), estimates or assumptions (which could differ from actual results) may be used that affect reported amounts and disclosures.
Multiple class operations, income and expenses: The Fund currently offers three classes of shares, each with a public offering price that reflects different sales charges, if any, and expense levels. On June 15, 2004, Class C2 shares merged into Class C. On September 24, 2004, Class M shares merged into Class C. Class B shares will convert to Class A shares eight years after purchase. Income, non-class specific expenses and realized and unrealized gains and losses, are allocated daily to each class, based upon the value of shares outstanding method as permitted under Rule 18f-3 of the 1940 Act. Each class bears its own specific expenses as well as a portion of general, common expenses.
Security valuations: Investment company securities are valued at the net asset value of the underlying portfolio.
Security transactions and investment income: Security transactions are recorded on the trade date. Security gains and losses are calculated on the specific identification basis. Dividend income, if any, is recorded on the ex-dividend date. Dividends and net realized gain (loss) from investment securities for the Fund are from investments in shares of affiliated investment companies.
Redemption fees: A short-term trading redemption fee may be assessed on any fund shares in a fund account that are sold during the first five (5) New York Stock Exchange ("NYSE") trading days following their purchase date. This redemption fee will equal 2% of the amount redeemed and shares held the longest will be treated as being redeemed first and shares held the shortest as being redeemed last. For the year ended October 31, 2005, the Fund received $3 in redemption fees.
Dividend distributions: Distributions to shareholders are recorded on the ex-dividend date and are determined in accordance with Federal income tax regulations which may differ from GAAP.
NOTE 2. RELATED PARTY TRANSACTIONS
Effective January 1, 2005 AEGON/Transamerica Fund Advisors, Inc. was renamed Transamerica Fund Advisors, Inc. ("TFAI"); AEGON/Transamerica Fund Services, Inc. and AEGON/Transamerica Investor Services, Inc. merged into one entity and was renamed Transamerica Fund Services, Inc. ("TFS").
TFAI is the Fund's investment adviser. TFS is the Fund's administrator and transfer agent. AFSG Securities Corp. ("AFSG") is the Fund's distributor/principal underwriter. TFAI, TFS , and AFSG are affiliates of AEGON, NV, a Netherlands corporation.
TFAI has entered into an agreement with Morningstar Associates, LLC to provide investment services to the Fund. TFAI compensates Morningstar Associates, LLC as described in the Prospectus.
Transamerica Investment Management, LLC and Great Companies, LLC are affiliates of the Fund and are sub-advisers to other funds within Transamerica IDEX Mutual Funds.
Because the underlying funds have varied expense and fee levels and the Fund may own different proportions of underlying funds at different times, the amount of fees and expenses incurred indirectly by the Fund will vary.
Investment advisory fees: The Fund pays management fees to TFAI based on average daily net assets ("ANA") at the following rate:
0.10% of ANA
TFAI has contractually agreed to waive its advisory fee and will reimburse the Fund to the extent that operating expenses, excluding 12b-1 fees, exceed the following stated annual limit:
0.45% Expense Limit
If total Fund expenses fall below the annual expense limitation agreement agreed to by the adviser within the succeeding three years, the Fund may be required to pay that adviser a portion or all of the waived advisory fees.
There were no amounts recaptured during the year ended October 31, 2005. There are no amounts available for recapture at October 31, 2005.
Transamerica IDEX Mutual Funds
Annual Report 2005
9
TA IDEX Asset Allocation–Moderate Portfolio
NOTES TO FINANCIAL STATEMENTS (continued)
At October 31, 2005
(all amounts in thousands)
NOTE 2.–(continued)
Distribution and service fees: The Fund has a 12b-1 distribution plan under the 1940 Act pursuant to which an annual fee, based on average daily net assets, is paid to the distributor for various disbursements such as broker-dealer account servicing fees and other promotional expenses of the Fund. The Fund is authorized under the 12b-1 plan to pay fees on each class up to the following limits:
| Class A | | | N/A | | |
| Class B | | | 0.65 | % | |
| Class C | | | 0.65 | % | |
In addition, the underlying funds' Class A shares in which the Fund invests impose a 0.35% 12b-1 fee. To avoid duplication of the 12b-1 fees, each class of fund shares of the Fund has reduced the 12b-1 fees by the amount of the underlying funds' Class A 12b-1 fees.
In the case the Fund or a class of shares of the Fund is closed to new investors or investments, the Fund is authorized to pay 12b-1 fees for past sales and distribution efforts and present and past investor services.
Underwriter commissions relate to front-end sales charges imposed for Class A shares and contingent deferred sales charges from Classes B, C and certain A share redemptions. For the year ended October 31, 2005, the underwriter commissions were as follows:
| Received by Underwriter | | $ | 19,344 | | |
| Retained by Underwriter | | | 1,206 | | |
| Contingent Deferred Sales Charge | | | 1,010 | | |
Administrative services: The Fund has entered into an agreement with TFS for financial and legal fund administration services. As of January 1, 2005 the Fund pays TFS an annual fee of 0.02% of ANA. Prior to January 1, 2005 the Fund paid TFS an annual fee of 0.015% of ANA. The Legal fees on the Statement of Operations are for fees paid to external legal counsel.
Transfer agent fees: The Fund pays TFS an annual per-account charge for each open and closed account. The Fund paid TFS $1,113 for the year ended October 31, 2005.
Deferred compensation plan: Each eligible independent Fund Trustee may elect to participate in a non-qualified deferred compensation plan maintained by Transamerica IDEX Mutual Funds (the "Plan"). Under the Plan, such Trustees may defer payment of all or a portion of their total fees earned as a Fund Trustee. Each Trustee who is a participant in the Plan may elect that the earnings, losses or gains credited to his or her deferred fee amounts be determined based on a deemed investment in any series of Transamerica IDEX Mutual Funds, including the Fund. The right of a participant to receive a distribution from the Plan of the deferred fees is an unsecured claim against the general assets of all s eries of Transamerica IDEX Mutual Funds. The pro rata liability to the Fund of all deferred fees in the Plan amounted, as of October 31, 2005, to $26.
NOTE 3. INVESTMENT TRANSACTIONS
The cost of securities purchased and proceeds from securities sold (excluding short-term securities) for the year ended October 31, 2005, were as follows:
| Purchases of securities: | | | |
| Long-Term | | $ | 452,502 | | |
| U.S. Government | | | – | | |
| Proceeds from maturities and sales of securities: | | | |
| Long-Term | | | 221,830 | | |
| U.S. Government | | | – | | |
NOTE 4. FEDERAL INCOME TAX MATTERS
The Fund has not made any provision for federal income or excise taxes due to its policy to distribute all of its taxable income and capital gains to its shareholders and otherwise qualify as a regulated investment company under Subchapter M of the Internal Revenue Code. Income and capital gain distributions are determined in accordance with income tax regulations, which may differ from GAAP. These differences are primarily due to differing treatment for items including, but not limited to, wash sales and distribution reclasses.
Therefore, distributions determined in accordance with tax regulations may differ significantly in amount or character from net investment income and realized gains for financial reporting purposes. Financial reporting records are adjusted for permanent book/tax differences to reflect tax character. Financial records are not adjusted for temporary differences. These reclassifications are as follows:
Shares of beneficial interest, unlimited
shares authorized | | $ | 2 | | |
| Undistributed net investment income (loss) | | | (2 | ) | |
The tax character of distributions paid may differ from the character of distributions shown in the Statement of Changes in Net Assets due to short-term gains being treated as ordinary income for tax purposes. The tax character of distributions paid during 2004 and 2005 was as follows:
| 2004 Distributions paid from: | |
| Ordinary Income | | $ | 6,526 | | |
| Long-term Capital Gain | | | – | | |
| 2005 Distributions paid from: | |
| Ordinary Income | | | 26,647 | | |
| Long-term Capital Gain | | | 6,053 | | |
Transamerica IDEX Mutual Funds
Annual Report 2005
10
TA IDEX Asset Allocation–Moderate Portfolio
NOTES TO FINANCIAL STATEMENTS (continued)
At October 31, 2005
(all amounts in thousands)
NOTE 4.–(continued)
The tax basis components of distributable earnings as of October 31, 2005, are as follows:
| Undistributed Ordinary Income | | $ | 13,098 | | |
| Undistributed Long-term Capital Gains | | $ | 28,463 | | |
| Capital Loss Carryforward | | $ | - | | |
| Net Unrealized Appreciation (Depreciation) | | $ | 120,843 | * | |
* Amount includes unrealized appreciation (depreciation) of deferred compensation.
The aggregate cost of investments and composition of unrealized appreciation (depreciation) for federal income tax purposes as of October 31, 2005, are as follows:
| Federal Tax Cost Basis | | $ | 1,182,186 | | |
| Unrealized Appreciation | | $ | 124,520 | | |
| Unrealized (Depreciation) | | | (3,674 | ) | |
| Net Unrealized Appreciation (Depreciation) | | $ | 120,846 | | |
NOTE 5. REGULATORY PROCEEDINGS
There continues to be significant federal and state regulatory activity relating to financial services companies, particularly mutual fund companies and their investment advisers. As part of an ongoing investigation regarding potential market timing, recordkeeping and trading compliance issues and matters affecting the Fund's investment adviser, TFAI, and certain affiliates and former employees of TFAI, the SEC staff has indicated that it is likely to take some action against TFAI and certain of its affiliates at the conclusion of the investigation. The potential timing and the scope of any such action is difficult to predict. Although the impact of any action brought against TFAI and/or its affiliates is difficult to assess at the present time, the Fund currently believes that the likelihood that any such action will have a material adverse impact on it is remote. It is important to note that the Fund is not aware of any allegation of wrongdoing against it and its Board at the time this annual report is printed. Although it is not anticipated that these developments will have an adverse impact on the Fund, there can be no assurance at this time. TFAI and its affiliates are actively working with the SEC in regard to this matter; however, the exact resolution cannot be determined at this time. TFAI will take such actions that it deems necessary or appropriate to continue providing management services to the Fund and to bring all matters to an appropriate conclusion.
TFAI and/or its affiliates, and not the Fund, will bear the costs regarding these regulatory matters.
Transamerica IDEX Mutual Funds
Annual Report 2005
11
Report of Independent Registered Certified Public Accounting Firm
To the Board of Trustees and Shareholders of
TA IDEX Asset Allocation–Moderate Portfolio
In our opinion, the accompanying statement of assets and liabilities, including the schedule of investments, and the related statements of operations and of changes in net assets and the financial highlights present fairly, in all material respects, the financial position of TA IDEX Asset Allocation–Moderate Portfolio (the "Fund") (one of the portfolios constituting the Transamerica IDEX Mutual Funds) at October 31, 2005, the results of its operations for the year then ended, the changes in its net assets for each of the two years in the period then ended and the financial highlights for each of the periods presented, in conformity with accounting principles generally accepted in the United States of America. These financial statements and financial highlights (hereafter referred to as "financial statements") are the responsibility of the Fund's management; our responsibility is to express an opinion on these financial statements based on our audits. We conducted our audits of these financial statements in accordance with the standards of the Public Company Accounting Oversight Board (United States). Those standards require that we plan and perform the audit to obtain reasonable assurance about whether the financial statements are free of material misstatement. An audit includes examining, on a test basis, evidence supporting the amounts and disclosures in the financial statements, assessing the accounting principles used and significant estimates made by management, and evaluating the overall financial statement presentation. We believe that our audits, which included confirmation of securities at October 31, 2005 by correspondence with the custodian, provide a reasonable basis for our opinion.

December 22, 2005
Transamerica IDEX Mutual Funds
Annual Report 2005
12
TA IDEX Asset Allocation–Moderate Portfolio
SUPPLEMENTAL INFORMATION (unaudited)
TAX INFORMATION
For dividends paid during the year ended October 31, 2005, the Fund designated $2,742 as qualified dividend income.
For tax purposes, the Fund has made a Long-Term Capital Gain Designation of $6,054 for the year ended October 31, 2005.
The information and distributions reported herein may differ from the information and distributions taxable to the shareholders for the calendar year ending December 31, 2005. Complete information will be computed and reported in conjunction with your 2005 Form 1099-DIV.
Transamerica IDEX Mutual Funds
Annual Report 2005
13
TA IDEX Clarion Real Estate Securities
MARKET ENVIRONMENT
Real estate stocks have delivered a strong performance over the past twelve months, with the Dow Jones Wilshire Real Estate Securities Index ("DJWRE") up 20.10% since October 31, 2004. For 2005, year-to-date performance for the DJWRE is 8.69%. When compared to stocks and bonds in recent years, stellar performance by real estate in both public and private markets has attracted strong capital flows, resulting in declining cap rates, enhanced returns, and significant capital appreciation. The theme for 2005 has been the press' obsession with the real estate bubble. We believe the articles written often ignore some important fundamentals in the property market and in the Real Estate Investment Trust ("REIT") market. Our portfolio management team, working with the ING Real Estate research team, decided to take a look at the data. We believe that: 1) real estate values today seem rational, given prevail ing bond rates and investors' total return expectations; and 2) since REIT prices are generally in-line with private market real estate values, it stands to reason that REIT prices are reasonable as well. Overall, the public continues to recognize that real estate securities offer a very attractive and liquid alternative for getting exposure to commercial real estate assets.
PERFORMANCE
For the year ended October 31, 2005, TA IDEX Clarion Real Estate Securities, Class A returned 19.87%. By comparison its benchmark, the DJWRE, returned 20.10%.
STRATEGY REVIEW
The inception date of the TA IDEX Clarion Real Estate Securities was March 1, 2003. Since inception, the portfolio is up 27.63%, which is approximately 290 basis points below the DJWRE. For the fiscal year ending October 31, 2005, the Fund is up 19.87%, which is approximately 20 basis points below the benchmark. At the end of 2003, we decided to take a more benchmark-sensitive total return strategy, which has improved relative performance to the benchmark in the past twelve months.
The portfolio's total return investment philosophy is to own a portfolio of approximately 35 to 40 real estate stocks with the goal of outperforming the DJWRE through proprietary real estate market research and knowledge. We seek to own attractively priced stocks that offer favorable underlying real estate fundamentals from both a property type and geographic perspective.
We believe sector performance will continue to be a key source of absolute and relative performance for the portfolio. Evidence continues to mount on the steady improvements in occupancy levels across three major property types. Office and industrial occupancy has been boosted significantly by the strong economy. For this reason, we have increased our exposure to the office sector over the last few months to an overweight position. Retail properties continue to benefit from a seemingly unstoppable consumer, increasingly confident of the labor market and the economy. Only multi-family properties continue to struggle with higher ownership levels and supply. However, we believe that as mortgage rates rise and increasing numbers of younger workers enter the labor force, occupancy levels in the multi-family market will improve further.
Hotels, most linked to a cyclical improvement in the economy, we believe, will do well in 2006 if the economy continues to improve. We have positioned the portfolio to reflect these convictions.
T. Ritson Ferguson, CFA
Joseph P. Smith, CFA
Co-Fund Managers
ING Clarion Real Estate Securities L.P.
Transamerica IDEX Mutual Funds
Annual Report 2005
1
TA IDEX Clarion Real Estate Securities
Comparison of change in value of $10,000 investment in Class A shares and its comparative index.
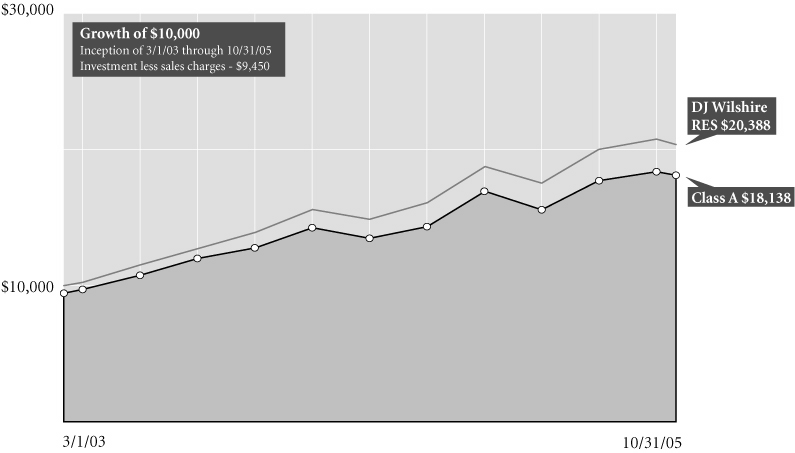
Average Annual Total Return for Periods Ended 10/31/05
| | | 1 year | | From
Inception | | Inception
Date | |
| Class A (NAV) | | | 19.87 | % | | | 27.63 | % | | 3/1/03 | |
| Class A (POP) | | | 13.28 | % | | | 24.96 | % | | 3/1/03 | |
| DJ Wilshire RES1 | | | 20.10 | % | | | 30.55 | % | | 3/1/03 | |
| Class B (NAV) | | | 18.45 | % | | | 26.76 | % | | 3/1/03 | |
| Class B (POP) | | | 13.45 | % | | | 26.00 | % | | 3/1/03 | |
| Class C (NAV) | | | 18.53 | % | | | 26.55 | % | | 3/1/03 | |
| Class C (POP) | | | 17.53 | % | | | 26.55 | % | | 3/1/03 | |
NOTES
1 The Dow Jones Wilshire Real Estate Securities (DJ Wilshire RES) Index is an unmanaged index used as a general measure of market performance. Calculations assume dividends and capital gains are reinvested and do not include any managerial expenses. From inception calculation is based on life of Class A shares.
The performance data presented represents past performance, future results may vary. Performance data does not reflect the deduction of taxes that would be paid on fund distributions or the redemption of fund shares. Investment return and principal value will fluctuate so that an investor's shares, when redeemed, may be worth more or less than their original cost. Current performance may be lower or higher than performance quoted. Please see www.transamericaidex.com for performance data current to the most recent month-end.
Public Offering Price (POP) returns include the reinvestment of dividends and capital gains and reflect the maximum sales charge of 5.5% for A shares or the maximum applicable contingent deferred sales charge (5% in the 1st year, decreasing to 0% after 6 years) for Class B shares and 1% (during the first 12 months) for Class C shares. Shares purchased prior to March 1, 2004 are subject to a maximum applicable contingent deferred sales charge (5% in the 1st year, decreasing to 0% after 7 years) for Class B shares and (2% in the 1st year, decreasing to 0% after 2 years) for Class C shares. Net Asset Value (NAV) returns include the reinvestment of dividends and capital gains but do not reflect any sales charges.
The Fund is non-diversified. Investments in a "non-diversified" fund may be subject to specific risks such as susceptibility to single economic, political or regulatory events and may be subject to greater loss than investments in a diversified fund.
The risks of investing in REITs are similar to investing directly in real estate. Investing in real estate presents its own risks, including declining property values, overbuilding, low occupancy rates from commercial properties, rising operating expenses and interest rates, as well as taxes and other regulatory issues.
This material must be preceded or accompanied by a current prospectus, which includes specific contents regarding the investment objectives and policies of this fund.
Transamerica IDEX Mutual Funds
Annual Report 2005
2
TA IDEX Clarion Real Estate Securities
UNDERSTANDING YOUR FUND'S EXPENSES
(unaudited)
SHAREHOLDER EXPENSES
Fund shareholders may incur two types of costs: (1) transaction costs, including sales charges (loads) on purchases, contingent deferred sales charges on redemptions and redemption fees; and (2) ongoing costs, including management fees, 12b-1 distribution and service fees, and other fund expenses.
The following Example is intended to help you understand your ongoing costs (in dollars and cents) of investing in a Fund and to compare these costs with the ongoing costs of investing in other funds.
The Example is based on an investment of $1,000 invested at May 1, 2005 and held for the entire period until October 31, 2005.
ACTUAL EXPENSES
The first line in the table below provides information about actual account values and actual expenses. You may use the information in this line, together with the amount you invested, to estimate the expenses that you paid over the period. Simply divide your account value by $1,000 (for example, an $8,600 account value divided by $1,000 = 8.6), then multiply the result by the number in the first line of your Fund under the heading entitled "Expenses Paid During Period" to estimate the expenses you paid on your account during this period. If your account is an IRA, your expenses could have included a $15 annual fee. The amount of any fee paid through your account would increase the estimate of expenses you paid during the period and decrease your ending account value.
HYPOTHETICAL EXAMPLE FOR COMPARISON PURPOSES
The second line in the table below provides information about hypothetical account values and hypothetical expenses based on the Fund's actual expense ratio and an assumed rate of return of 5% per year before expenses, which is not the Fund's actual return. The hypothetical account values and expenses may not be used to estimate the actual ending account balance or expenses you paid for the period. You may use this information to compare the ongoing costs of investing in your Fund and other funds. To do so, compare this 5% hypothetical example with the 5% hypothetical examples that appear in the shareholder reports of the other funds. As in the case of the actual expense example, if your account is subject to an IRA fee, the amount of the fee paid through your account would increase the hypothetical expenses you would have paid during the period and decrease the hypothetical ending account value.
Please note that the expenses shown in the table are meant to highlight your ongoing costs only and do not reflect any transactional costs, such as sales charges, redemption fees, brokerage commissions paid on purchases and sales of fund shares. Therefore, the second line under the Fund in the table is useful in comparing ongoing costs only, and will not help you determine the relative total costs of owning different funds. If any of these transaction costs were included, your costs would be higher. The expenses shown in the table do not reflect any fees that may be charged to you by brokers, financial intermediaries or other financial institutions.
| | | Beginning
Account
Value | | Ending
Account
Value | | Annualized
Expense
Ratio | | Expenses Paid
During Period (a) | |
| Class A | |
| Actual | | $ | 1,000.00 | | | $ | 1,106.50 | | | | 1.25 | % | | $ | 6.64 | | |
| Hypothetical (b) | | | 1,000.00 | | | | 1,018.90 | | | | 1.25 | | | | 6.36 | | |
| Class B | |
| Actual | | | 1,000.00 | | | | 1,098.70 | | | | 2.43 | | | | 12.85 | | |
| Hypothetical (b) | | | 1,000.00 | | | | 1,012.96 | | | | 2.43 | | | | 12.33 | | |
| Class C | |
| Actual | | | 1,000.00 | | | | 1,100.60 | | | | 2.15 | | | | 11.38 | | |
| Hypothetical (b) | | | 1,000.00 | | | | 1,014.37 | | | | 2.15 | | | | 10.92 | | |
(a) Expenses are calculated using each Fund's annualized expense ratio (as disclosed in the table), multiplied by the average account value for the period, multiplied by number of days in the period (184 days), and divided by the number of days in the year (365 days).
(b) 5% return per year before expenses.
GRAPHICAL PRESENTATION OF SCHEDULE OF INVESTMENTS
By Real Estate Property Breakdown
At October 31, 2005
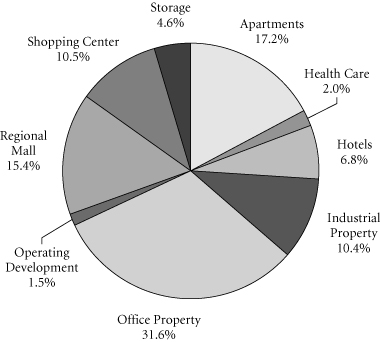
This chart shows the percentage breakdown by real estate property breakdown of the Fund's total investment securities.
Transamerica IDEX Mutual Funds
Annual Report 2005
3
TA IDEX Clarion Real Estate Securities
SCHEDULE OF INVESTMENTS
At October 31, 2005
(all amounts except share amounts in thousands)
| | | Shares | | Value | |
| COMMON STOCKS (98.0%) | |
| Apartments (16.8%) | |
| American Campus Communities, Inc. | | | 34,200 | | | $ | 847 | | |
| Archstone–Smith Trust | | | 73,500 | | | | 2,982 | | |
| AvalonBay Communities, Inc. | | | 71,100 | | | | 6,132 | | |
| BRE Properties–Class A | | | 34,400 | | | | 1,517 | | |
| Camden Property Trust | | | 69,660 | | | | 3,925 | | |
| Equity Residential | | | 135,400 | | | | 5,314 | | |
| GMH Communities Trust | | | 39,400 | | | | 590 | | |
| Post Properties, Inc. | | | 56,200 | | | | 2,293 | | |
| United Dominion Realty Trust, Inc. | | | 85,200 | | | | 1,886 | | |
| Health Care (1.9%) | |
| Ventas, Inc. | | | 96,200 | | | | 2,947 | | |
| Hotels (6.8%) | |
| Host Marriott Corp. | | | 131,700 | | | | 2,211 | | |
| LaSalle Hotel Properties | | | 44,500 | | | | 1,575 | | |
| Starwood Hotels & Resorts Worldwide, Inc. | | | 88,000 | | | | 5,142 | | |
| Strategic Hotel Capital, Inc. | | | 80,300 | | | | 1,364 | | |
| Industrial Property (10.2%) | |
| AMB Property Corp. | | | 102,700 | | | | 4,537 | | |
| Liberty Property Trust | | | 73,349 | | | | 3,058 | | |
| Prologis | | | 182,100 | | | | 7,830 | | |
| Office Property (30.9%) | |
| Arden Realty, Inc. | | | 140,350 | | | | 6,335 | | |
| BioMed Realty Trust, Inc. | | | 59,600 | | | | 1,491 | | |
| Boston Properties, Inc. | | | 87,200 | | | | 6,036 | | |
| CarrAmerica Realty Corp. | | | 55,200 | | | | 1,818 | | |
| Corporate Office Properties Trust | | | 68,900 | | | | 2,395 | | |
| Equity Office Properties Trust | | | 133,000 | | | | 4,096 | | |
| Highwood Properties, Inc. | | | 77,900 | | | | 2,198 | | |
| Maguire Properties, Inc. | | | 101,800 | | | | 3,054 | | |
| Reckson Associates Realty Corp. | | | 111,600 | | | | 3,917 | | |
| SL Green Realty Corp. | | | 66,000 | | | | 4,490 | | |
| Trizec Properties, Inc. | | | 246,800 | | | | 5,491 | | |
| Vornado Realty Trust | | | 68,700 | | | | 5,565 | | |
| Operating/Development (1.5%) | |
| Brookfield Properties Co. | | | 76,600 | | | | 2,244 | | |
| Regional Mall (15.1%) | |
| General Growth Properties, Inc. | | | 141,460 | | | | 6,009 | | |
| Macerich Co. (The) | | | 46,800 | | | | 3,008 | | |
| Mills Corp. (The) | | | 65,800 | | | | 3,520 | | |
| Simon Property Group, Inc. | | | 133,100 | | | | 9,533 | | |
| Taubman Centers, Inc. | | | 22,900 | | | | 755 | | |
| | | Shares | | Value | |
| Shopping Center (10.3%) | | | |
| Acadia Realty Trust | | | 80,200 | | | $ | 1,524 | | |
| Developers Diversified Realty Corp. | | | 86,700 | | | | 3,787 | | |
| Federal Realty Investment Trust | | | 49,400 | | | | 2,996 | | |
| New Plan Excel Realty Trust | | | 47,000 | | | | 1,081 | | |
| Pan Pacific Retail Properties, Inc. | | | 47,600 | | | | 3,023 | | |
| Regency Centers Corp. | | | 56,300 | | | | 3,134 | | |
| Storage (4.5%) | | | |
| Extra Space Storage, Inc. | | | 71,800 | | | | 1,048 | | |
| Public Storage, Inc. | | | 69,600 | | | | 4,608 | | |
| Shurgard Storage Centers, Inc.–Class A | | | 7,800 | | | | 440 | | |
| U-Store-It Trust | | | 36,900 | | | | 770 | | |
| Total Common Stocks (cost: $126,128) | | | | | | $ | 148,516 | | |
| SUMMARY: | | | |
| Investment securities, at value | | | 98.0 | % | | $ | 148,516 | | |
| Other assets in excess of liabilities | | | 2.0 | % | | | 3,050 | | |
| Net assets | | | 100.0 | % | | $ | 151,566 | | |
The notes to the financial statements are an integral part of this report.
Transamerica IDEX Mutual Funds
Annual Report 2005
4
TA IDEX Clarion Real Estate Securities
STATEMENT OF ASSETS AND LIABILITIES
At October 31, 2005
(all amounts except per share amounts in thousands)
| Assets: | | | |
| Investment securities, at value (cost: $126,128) | | $ | 148,516 | | |
| Cash | | | 3,117 | | |
| Receivables: | |
| Investment securities sold | | | 1,884 | | |
| Shares of beneficial interest sold | | | 335 | | |
| Interest | | | 7 | | |
| Dividends | | | 440 | | |
| Other | | | 3 | | |
| | | | 154,302 | | |
| Liabilities: | | | |
| Investment securities purchased | | | 2,504 | | |
| Accounts payable and accrued liabilities: | |
| Shares of beneficial interest redeemed | | | 44 | | |
| Management and advisory fees | | | 99 | | |
| Distribution and service fees | | | 50 | | |
| Transfer agent fees | | | 5 | | |
| Administration fees | | | 2 | | |
| Other | | | 32 | | |
| | | | 2,736 | | |
| Net Assets | | $ | 151,566 | | |
| Net Assets Consist of: | | | |
Shares of beneficial interest, unlimited shares
authorized, no par value | | $ | 113,356 | | |
| Undistributed net investment income (loss) | | | – | | |
Undistributed net realized gain (loss) from investment
securities | | | 15,822 | | |
Net unrealized appreciation (depreciation) on
investment securities | | | 22,388 | | |
| Net Assets | | $ | 151,566 | | |
| Net Assets by Class: | | | |
| Class A | | $ | 139,290 | | |
| Class B | | | 6,644 | | |
| Class C | | | 5,632 | | |
| Shares Outstanding: | | | |
| Class A | | | 8,638 | | |
| Class B | | | 412 | | |
| Class C | | | 351 | | |
| Net Asset Value Per Share: | | | |
| Class A | | $ | 16.13 | | |
| Class B | | | 16.14 | | |
| Class C | | | 16.02 | | |
| Maximum Offering Price Per Share (a): | | | |
| Class A | | $ | 17.07 | | |
(a) Includes the maximum selling commission (represented as a percentage of offering price) which is reduced on certain levels of sales as set forth in the Prospectus. Net asset value per share for Classes B and C shares represents offering price. The redemption price for Classes B and C shares equals net asset value less any applicable contingent deferred sales charge.
STATEMENT OF OPERATIONS
For the year ended October 31, 2005
(all amounts in thousands)
| Investment Income: | | | |
| Interest | | $ | 31 | | |
Dividends (net of withholding taxes on
foreign dividends of $1) | | | 4,011 | | |
| Income from loaned securities–net | | | 21 | | |
| | | | 4,063 | | |
| Expenses: | | | |
| Management and advisory fees | | | 1,080 | | |
| Distribution and service fees: | |
| Class A | | | 432 | | |
| Class B | | | 56 | | |
| Class C | | | 59 | | |
| Transfer agent fees: | |
| Class A | | | 25 | | |
| Class B | | | 18 | | |
| Class C | | | 9 | | |
| Printing and shareholder reports | | | 4 | | |
| Custody fees | | | 21 | | |
| Administration fees | | | 26 | | |
| Legal fees | | | 10 | | |
| Audit fees | | | 18 | | |
| Trustees fees | | | 6 | | |
| Registration fees: | |
| Class A | | | 22 | | |
| Class B | | | 11 | | |
| Class C | | | 15 | | |
| Other | | | 2 | | |
| Total expenses | | | 1,814 | | |
| Net Investment Income (Loss) | | | 2,249 | | |
| Net Realized and Unrealized Gain (Loss): | | | |
| Realized gain (loss) from investment securities | | | 17,287 | | |
Increase (decrease) in unrealized appreciation
(depreciation) on investment securities | | | 3,612 | | |
| Net Gain (Loss) on Investment Securities | | | 20,899 | | |
Net Increase (Decrease) in Net Assets Resulting
from Operations | | $ | 23,148 | | |
The notes to the financial statements are an integral part of this report.
Transamerica IDEX Mutual Funds
Annual Report 2005
5
TA IDEX Clarion Real Estate Securities
STATEMENTS OF CHANGES IN NET ASSETS
For the years ended
(all amounts in thousands)
| | | October 31,
2005 | | October 31,
2004 | |
| Increase (Decrease) In Net Assets From: | | | |
| Operations: | | | |
| Net investment income (loss) | | $ | 2,249 | | | $ | 2,213 | | |
Net realized gain (loss) from
investment securities | | | 17,287 | | | | 7,514 | | |
Net unrealized appreciation
(depreciation) on investment
securities | | | 3,612 | | | | 15,478 | | |
| | | | 23,148 | | | | 25,205 | | |
| Distributions to Shareholders: | | | |
| From net investment income: | |
| Class A | | | (3,317 | ) | | | (3,781 | ) | |
| Class B | | | (82 | ) | | | (88 | ) | |
| Class C | | | (107 | ) | | | (106 | ) | |
| Class C2 | | | – | | | | (7 | ) | |
| Class M | | | – | | | | (13 | ) | |
| | | | (3,506 | ) | | | (3,995 | ) | |
| From net realized gains: | |
| Class A | | | (1,619 | ) | | | (7,237 | ) | |
| Class B | | | (57 | ) | | | (192 | ) | |
| Class C | | | (76 | ) | | | (228 | ) | |
| Class C2 | | | – | | | | (21 | ) | |
| Class M | | | – | | | | (28 | ) | |
| | | | (1,752 | ) | | | (7,706 | ) | |
| Capital Share Transactions: | | | |
| Proceeds from shares sold: | |
| Class A | | | 19,659 | | | | 39,247 | | |
| Class B | | | 3,365 | | | | 2,642 | | |
| Class C | | | 2,151 | | | | 2,662 | | |
| Class C2 | | | – | | | | 101 | | |
| Class M | | | – | | | | 202 | | |
| | | | 25,175 | | | | 44,854 | | |
Dividends and distributions
reinvested: | |
| Class A | | | 4,922 | | | | 11,008 | | |
| Class B | | | 121 | | | | 226 | | |
| Class C | | | 145 | | | | 240 | | |
| Class C2 | | | – | | | | 27 | | |
| Class M | | | – | | | | 29 | | |
| | | | 5,188 | | | | 11,530 | | |
| Cost of shares redeemed: | |
| Class A | | | (27,189 | ) | | | (1,533 | ) | |
| Class B | | | (1,527 | ) | | | (1,021 | ) | |
| Class C | | | (2,761 | ) | | | (714 | ) | |
| Class C2 | | | – | | | | (91 | ) | |
| Class M | | | – | | | | (22 | ) | |
| | | | (31,477 | ) | | | (3,381 | ) | |
| Class level exchanges: | |
| Class C | | | – | | | | 736 | | |
| Class C2 | | | – | | | | (256 | ) | |
| Class M | | | – | | | | (480 | ) | |
| | | | – | | | | – | | |
| | | October 31,
2005 | | October 31,
2004 | |
| Automatic conversions: | |
| Class A | | $ | 90 | | | $ | 4 | | |
| Class B | | | (90 | ) | | | (4 | ) | |
| | | | – | | | | – | | |
| | | | (1,114 | ) | | | 53,003 | | |
| Net increase (decrease) in net assets | | | 16,776 | | | | 66,507 | | |
| Net Assets: | | | |
| Beginning of year | | | 134,790 | | | | 68,283 | | |
| End of year | | $ | 151,566 | | | $ | 134,790 | | |
Undistributed Net Investment Income
(Loss) | | $ | – | | | $ | – | | |
| Share Activity: | | | |
| Shares issued: | |
| Class A | | | 1,233 | | | | 2,967 | | |
| Class B | | | 221 | | | | 204 | | |
| Class C | | | 141 | | | | 205 | | |
| Class C2 | | | – | | | | 8 | | |
| Class M | | | – | | | | 17 | | |
| | | | 1,595 | | | | 3,401 | | |
Shares issued–reinvested from
distributions: | |
| Class A | | | 321 | | | | 887 | | |
| Class B | | | 8 | | | | 18 | | |
| Class C | | | 9 | | | | 19 | | |
| Class C2 | | | – | | | | 2 | | |
| Class M | | | – | | | | 2 | | |
| | | | 338 | | | | 928 | | |
| Shares redeemed: | |
| Class A | | | (1,888 | ) | | | (121 | ) | |
| Class B | | | (100 | ) | | | (81 | ) | |
| Class C | | | (182 | ) | | | (56 | ) | |
| Class C2 | | | – | | | | (7 | ) | |
| Class M | | | – | | | | (2 | ) | |
| | | | (2,170 | ) | | | (267 | ) | |
| Class level exchanges: | |
| Class C | | | – | | | | 58 | | |
| Class C2 | | | – | | | | (21 | ) | |
| Class M | | | – | | | | (37 | ) | |
| | | | – | | | | – | | |
| Automatic conversions: | |
| Class A | | | 6 | | | | – | | |
| Class B | | | (6 | ) | | | – | | |
| | | | – | | | | – | | |
Net increase (decrease) in shares
outstanding: | |
| Class A | | | (328 | ) | | | 3,733 | | |
| Class B | | | 123 | | | | 141 | | |
| Class C | | | (32 | ) | | | 226 | | |
| Class C2 | | | – | | | | (18 | ) | |
| Class M | | | – | | | | (20 | ) | |
| | | | (237 | ) | | | 4,062 | | |
The notes to the financial statements are an integral part of this report.
Transamerica IDEX Mutual Funds
Annual Report 2005
6
TA IDEX Clarion Real Estate Securities
FINANCIAL HIGHLIGHTS
| | | | | For a share of beneficial interest outstanding throughout each period | |
| | | | | Net Asset | | Investment Operations | | Distributions | | Net Asset | |
| | | For the
Period
Ended (d)(g) | | Value,
Beginning
of Period | | Net
Investment
Income (Loss) | | Net Realized
and Unrealized
Gain (Loss) | | Total
Operations | | From Net
Investment
Income | | From Net
Realized
Gains | | Total
Distributions | | Value,
End
of Period | |
| Class A | | 10/31/2005 | | $ | 13.99 | | | $ | 0.27 | | | $ | 2.46 | | | $ | 2.73 | | | $ | (0.41 | ) | | $ | (0.18 | ) | | $ | (0.59 | ) | | $ | 16.13 | | |
| | | 10/31/2004 | | | 12.25 | | | | 0.28 | | | | 3.05 | | | | 3.33 | | | | (0.53 | ) | | | (1.06 | ) | | | (1.59 | ) | | | 13.99 | | |
| | | 10/31/2003 | | | 10.00 | | | | 0.43 | | | | 1.95 | | | | 2.38 | | | | (0.13 | ) | | | – | | | | (0.13 | ) | | | 12.25 | | |
| Class B | | 10/31/2005 | | | 13.99 | | | | 0.06 | | | | 2.49 | | | | 2.55 | | | | (0.22 | ) | | | (0.18 | ) | | | (0.40 | ) | | | 16.14 | | |
| | | 10/31/2004 | | | 12.22 | | | | 0.25 | | | | 3.03 | | | | 3.28 | | | | (0.45 | ) | | | (1.06 | ) | | | (1.51 | ) | | | 13.99 | | |
| | | 10/31/2003 | | | 10.00 | | | | 0.38 | | | | 1.95 | | | | 2.33 | | | | (0.11 | ) | | | – | | | | (0.11 | ) | | | 12.22 | | |
| Class C | | 10/31/2005 | | | 13.92 | | | | 0.11 | | | | 2.44 | | | | 2.55 | | | | (0.27 | ) | | | (0.18 | ) | | | (0.45 | ) | | | 16.02 | | |
| | | 10/31/2004 | | | 12.22 | | | | 0.17 | | | | 3.04 | | | | 3.21 | | | | (0.45 | ) | | | (1.06 | ) | | | (1.51 | ) | | | 13.92 | | |
| | | 10/31/2003 | | | 10.00 | | | | 0.38 | | | | 1.95 | | | | 2.33 | | | | (0.11 | ) | | | – | | | | (0.11 | ) | | | 12.22 | | |
| | | | | | | Ratios/Supplemental Data | |
| | | For the
Period | | Total | | Net Assets,
End of
Period | | Ratio of Expenses
to Average
Net Assets (a) | | Net Investment
Income (Loss)
to Average | | Portfolio
Turnover | |
| | | Ended (g) | | Return (c) | | (000's) | | Net (e) | | Total (f) | | Net Assets (a) | | Rate (b) | |
| Class A | | 10/31/2005 | | | 19.87 | % | | $ | 139,290 | | | | 1.25 | % | | | 1.25 | % | | | 1.77 | % | | | 66 | % | |
| | | 10/31/2004 | | | 29.30 | | | | 125,423 | | | | 1.30 | | | | 1.30 | | | | 2.16 | | | | 73 | | |
| | | 10/31/2003 | | | 23.80 | | | | 64,090 | | | | 1.75 | | | | 1.76 | | | | 5.55 | | | | 95 | | |
| Class B | | 10/31/2005 | | | 18.45 | | | | 6,644 | | | | 2.38 | | | | 2.38 | | | | 0.42 | | | | 66 | | |
| | | 10/31/2004 | | | 28.96 | | | | 4,042 | | | | 1.51 | | | | 1.51 | | | | 1.97 | | | | 73 | | |
| | | 10/31/2003 | | | 23.33 | | | | 1,804 | | | | 2.40 | | | | 2.41 | | | | 4.91 | | | | 95 | | |
| Class C | | 10/31/2005 | | | 18.53 | | | | 5,632 | | | | 2.27 | | | | 2.27 | | | | 0.76 | | | | 66 | | |
| | | 10/31/2004 | | | 28.32 | | | | 5,325 | | | | 2.22 | | | | 2.22 | | | | 1.32 | | | | 73 | | |
| | | 10/31/2003 | | | 23.33 | | | | 1,913 | | | | 2.40 | | | | 2.41 | | | | 4.91 | | | | 95 | | |
NOTES TO FINANCIAL HIGHLIGHTS
(a) Annualized.
(b) Not annualized.
(c) Total Return has been calculated for the applicable period without deduction of a sales load, if any, on an initial purchase. Periods of less than one year are not annualized.
(d) Per share information is calculated based on average number of shares outstanding.
(e) Ratio of Net Expenses to Average Net Assets is net of fee waivers and reimbursements by the investment adviser, if any (see note 2).
(f) Ratio of Total Expenses to Average Net Assets includes all expenses before fee waivers and reimbursements by the investment adviser.
(g) TA IDEX Clarion Real Estate Securities commenced operations on March 1, 2003.
The notes to the financial statements are an integral part of this report.
Transamerica IDEX Mutual Funds
Annual Report 2005
7
TA IDEX Clarion Real Estate Securities
NOTES TO FINANCIAL STATEMENTS
At October 31, 2005
(all amounts in thousands)
NOTE 1. ORGANIZATION AND SIGNIFICANT ACCOUNTING POLICIES
Transamerica IDEX Mutual Funds is an open-end management investment company registered under the Investment Company Act of 1940, as amended (the "1940 Act").
In the normal course of business, TA IDEX Clarion Real Estate Securities (the "Fund") enters into contracts that contain a variety of representations that provide general indemnifications. The Fund's maximum exposure under these arrangements is unknown, as this would involve future claims that may be made against the Fund and/or its affiliates that have not yet occurred. However, based on experience, the Fund expects the risk of loss to be remote.
The Fund is "non-diversified" under the 1940 Act.
This report should be read in conjunction with the current Fund prospectus, which contains more complete information about the Fund.
The following is a summary of significant accounting policies followed by the Fund in the preparation of the financial statements. In preparing the Fund's financial statements in accordance with accounting principles generally accepted in the United States of America ("GAAP"), estimates or assumptions (which could differ from actual results) may be used that affect reported amounts and disclosures.
Multiple class operations, income and expenses: The Fund currently offers three classes of shares, each with a public offering price that reflects different sales charges, if any, and expense levels. On June 15, 2004, Class C2 shares merged into Class C. On September 24, 2004, Class M shares merged into Class C. Class B shares will convert to Class A shares eight years after purchase. Income, non-class specific expenses and realized and unrealized gains and losses, are allocated daily to each class, based upon the value of shares outstanding method as permitted under Rule 18f-3 of the 1940 Act. Each class bears its own specific expenses as well as a portion of general, common expenses.
Security valuations: The Fund values its investments at the close of the New York Stock Exchange ("NYSE"), normally 4 p.m. ET, each day the NYSE is open for business. Fund investments are valued at the last sale price or closing price on the day of valuation taken from the primary exchange where the security is principally traded.
Securities traded in the over-the-counter market and listed securities for which no sale was reported on that date are valued at the last quoted bid price.
Debt securities are valued based on a price quotation or other equivalent indication of value supplied by an exchange, a pricing service or a major market maker; however, those that mature in sixty days or less are valued at amortized cost, which approximates market.
Investment company securities are valued at the net asset value of the underlying portfolio.
Other securities for which quotations are not readily available or whose values have been determined to be unreliable are valued at fair market value as determined in good faith by the Fund's Administrative Valuation Committee, under the supervision of the Board's Valuation Committee, using guidelines adopted by the Board of Trustees.
Cash: The Fund may leave cash overnight in its cash account with the custodian, Investors Bank & Trust Company ("IBT"). IBT has been contracted on behalf of the Fund to invest the excess cash into a savings account, which at October 31, 2005, was paying an interest rate of 2.76%.
Repurchase agreements: The Fund is authorized to enter into repurchase agreements. The Fund, through its custodian, IBT, receives delivery of the underlying securities, the value of which at the time of purchase is required to be an amount equal to at least 100% of the resale price. The Fund will bear the risk of value fluctuations until the security can be sold and may encounter delays and incur costs in liquidating the security. In the event of bankruptcy or insolvency of the seller, delays and costs may be incurred.
Commission recapture: The sub-adviser, to the extent consistent with the best execution and usual commission rate policies and practices, may place security transactions of the Fund with broker/dealers with which Transamerica IDEX Mutual Funds has established a Commission Recapture Program. A Commission Recapture Program is any arrangement under which a broker/dealer applies a portion of the commissions received by such broker/dealer on the security transactions to the Fund. In no event will commissions paid by the Fund be used to pay expenses that would otherwise be borne by any other funds within Transamerica IDEX Mutual Funds, or by any other party.
Recaptured commissions during the year ended October 31, 2005, of $63 are included in net realized gains in the Statement of Operations.
Real Estate Investment Trusts ("REITs"): There are certain additional risks involved in investing in REITs. These include, but are not limited to, economic conditions, changes in zoning laws, real estate values, property taxes and interest rates. Since the Fund invests primarily in real estate securities, the net asset value per share may fluctuate more widely than the net asset value of shares of a fund that invests in a broad range of industries.
Dividend income is recorded at management's estimate of the income included in distributions from the REIT investments. Distributions received in excess of the estimated amount are recorded as a reduction of the cost investments. The actual amounts of income, return of capital and capital gains are only determined by each REIT after the fiscal year end and may differ from the estimated amounts.
Transamerica IDEX Mutual Funds
Annual Report 2005
8
TA IDEX Clarion Real Estate Securities
NOTES TO FINANCIAL STATEMENTS (continued)
At October 31, 2005
(all amounts in thousands)
NOTE 1.–(continued)
Security transactions and investment income: Security transactions are recorded on the trade date. Security gains and losses are calculated on the specific identification basis. Dividend income, if any, is recorded on the ex-dividend date or, in the case of foreign securities, as soon as the Fund is informed of the ex-dividend date. Interest income, including accretion of discounts and amortization of premiums, is recorded on the accrual basis commencing on the settlement date.
Redemption fees: A short-term trading redemption fee may be assessed on any Fund shares in a fund account that are sold during the first five (5) NYSE trading days following their purchase date. This redemption fee will equal 2% of the amount redeemed and shares held the longest will be treated as being redeemed first and shares held the shortest as being redeemed last. For the year ended October 31, 2005, the Fund received less than $1 in redemption fees.
Dividend distributions: Distributions to shareholders are recorded on the ex-dividend date and are determined in accordance with Federal income tax regulations which may differ from GAAP.
NOTE 2. RELATED PARTY TRANSACTIONS
Effective January 1, 2005 AEGON/Transamerica Fund Advisors, Inc. was renamed Transamerica Fund Advisors, Inc. ("TFAI"); AEGON/Transamerica Fund Services, Inc. and AEGON/Transamerica Investor Services, Inc. merged into one entity and was renamed Transamerica Fund Services, Inc. ("TFS").
TFAI is the Fund's investment adviser. TFS is the Fund's administrator and transfer agent. AFSG Securities Corp. ("AFSG") is the Fund's distributor/principal underwriter. TFAI, TFS , and AFSG are affiliates of AEGON, NV, a Netherlands corporation.
The following schedule reflects the percentage of fund assets owned by affiliated mutual funds:
| | | Net
Assets | | % of
Net Assets | |
TA IDEX Asset Allocation–
Conservative Portfolio | | $ | 11,820 | | | | 7.80 | % | |
TA IDEX Asset Allocation–
Growth Portfolio | | | 18,061 | | | | 11.92 | % | |
TA IDEX Asset Allocation–
Moderate Growth Portfolio | | | 50,834 | | | | 33.54 | % | |
TA IDEX Asset Allocation–
Moderate Portfolio | | | 51,088 | | | | 33.71 | % | |
| Total | | $ | 131,803 | | | | 86.97 | % | |
Investment advisory fees: The Fund pays management fees to TFAI based on average daily net assets ("ANA") at the following breakpoints:
0.80% of the first $250 million of ANA
0.775% of the next $250 million of ANA
0.70% of the next $500 million of ANA
0.65% of ANA over $1 billion
TFAI has contractually agreed to waive its advisory fee and will reimburse the Fund to the extent that operating expenses, excluding 12b-1 fees, exceed the following stated annual limit:
1.40% Expense Limit
If total Fund expenses fall below the annual expense limitation agreement agreed to by the adviser within the succeeding three years, the Fund may be required to pay that adviser a portion or all of the waived advisory fees.
There were no amounts recaptured during the year ended October 31, 2005. There are no amounts available for recapture at October 31, 2005.
Distribution and service fees: The Fund has a 12b-1 distribution plan under the 1940 Act pursuant to which an annual fee, based on average daily net assets, is paid to the distributor for various disbursements such as broker-dealer account servicing fees and other promotional expenses of the Fund. The Fund is authorized under the 12b-1 plan to pay fees on each class up to the following limits:
| Class A | | | 0.35 | % | |
| Class B | | | 1.00 | % | |
| Class C | | | 1.00 | % | |
In the case the Fund or a class of shares of the Fund is closed to new investors or investments, the Fund is authorized to pay 12b-1 fees for past sales and distribution efforts and present and past investor services.
Underwriter commissions relate to front-end sales charges imposed for Class A shares and contingent deferred sales charges from Classes B, C and certain A share redemptions. For the year ended October 31, 2005, the underwriter commissions were as follows:
| Received by Underwriter | | $ | 189 | | |
| Retained by Underwriter | | | 18 | | |
| Contingent Deferred Sales Charge | | | 22 | | |
Administrative services: The Fund has entered into an agreement with TFS for financial and legal fund administration services. As of January 1, 2005 the Fund pays TFS an annual fee of 0.02% of ANA. Prior to January 1, 2005 the Fund paid TFS an annual fee of 0.015% of ANA. The Legal fees on the Statement of Operations are for fees paid to external legal counsel.
Transamerica IDEX Mutual Funds
Annual Report 2005
9
TA IDEX Clarion Real Estate Securities
NOTES TO FINANCIAL STATEMENTS (continued)
At October 31, 2005
(all amounts in thousands)
NOTE 2.–(continued)
Transfer agent fees: The Fund pays TFS an annual per-account charge for each open and closed account. The Fund paid TFS $47 for the year ended October 31, 2005
Deferred compensation plan: Each eligible independent Fund Trustee may elect to participate in a non-qualified deferred compensation plan maintained by Transamerica IDEX Mutual Funds (the "Plan"). Under the Plan, such Trustees may defer payment of all or a portion of their total fees earned as a Fund Trustee. Each Trustee who is a participant in the Plan may elect that the earnings, losses or gains credited to his or her deferred fee amounts be determined based on a deemed investment in any series of Transamerica IDEX Mutual Funds, including the Fund. The right of a participant to receive a distribution from the Plan of the deferred fees is an unsecured claim against the general assets of all series of Transamerica IDEX Mutual Funds. The pro rata liability to the Fund of all deferred fees i n the Plan amounted, as of October 31, 2005, to $3.
NOTE 3. INVESTMENT TRANSACTIONS
The cost of securities purchased and proceeds from securities sold (excluding short-term securities) for the year ended October 31, 2005, were as follows:
| Purchases of securities: | | | |
| Long-Term | | $ | 87,952 | | |
| U.S. Government | | | – | | |
| Proceeds from maturities and sales of securities: | | | |
| Long-Term | | | 92,795 | | |
| U.S. Government | | | – | | |
NOTE 4. FEDERAL INCOME TAX MATTERS
The Fund has not made any provision for federal income or excise taxes due to its policy to distribute all of its taxable income and capital gains to its shareholders and otherwise qualify as a regulated investment company under Subchapter M of the Internal Revenue Code. Income and capital gain distributions are determined in accordance with income tax regulations, which may differ from GAAP. These differences are primarily due to differing treatment for items including, but not limited to, wash sales and distribution reclasses.
Therefore, distributions determined in accordance with tax regulations may differ significantly in amount or character from net investment income and realized gains for financial reporting purposes. Financial reporting records are adjusted for permanent book/tax differences to reflect tax character. Financial records are not adjusted for temporary differences. These reclassifications are as follows:
| Undistributed net investment income (loss) | | $ | 1,257 | | |
Undistributed net realized gain (loss) from investment
securities | | | (1,257 | ) | |
The tax character of distributions paid may differ from the character of distributions shown in the Statement of Changes in Net Assets due to short-term gains being treated as ordinary income for tax purposes.
The tax character of distributions paid during 2004 and 2005 was as follows:
| 2004 Distributions paid from: | |
| Ordinary Income | | $ | 10,399 | | |
| Long-term capital gain | | | 1,362 | | |
| 2005 Distributions paid from: | |
| Ordinary Income | | | 3,506 | | |
| Long-term capital gain | | | 1,752 | | |
The tax basis components of distributable earnings as of October 31, 2005, are as follows:
| Undistributed Ordinary Income | | $ | 2,600 | | |
| Undistributed Long-term Capital Gains | | $ | 13,374 | | |
| Capital Loss Carryforward | | $ | – | | |
| Net Unrealized Appreciation (Depreciation) | | $ | 22,236 | | |
The aggregate cost of investments and composition of unrealized appreciation (depreciation) for federal income tax purposes as of October 31, 2005, are as follows:
| Federal Tax Cost Basis | | $ | 126,280 | | |
| Unrealized Appreciation | | $ | 22,236 | | |
| Unrealized (Depreciation) | | | – | | |
| Net Unrealized Appreciation (Depreciation) | | $ | 22,236 | | |
NOTE 5. REGULATORY PROCEEDINGS
There continues to be significant federal and state regulatory activity relating to financial services companies, particularly mutual fund companies and their investment advisers. As part of an ongoing investigation regarding potential market timing, recordkeeping and trading compliance issues and matters affecting the Fund's investment adviser, TFAI, and certain affiliates and former employees of TFAI, the SEC staff has indicated that it is likely to take some action against TFAI and certain of its affiliates at the conclusion of the investigation. The potential timing and the scope of any such action is difficult to predict. Although the impact of any action brought against TFAI and/or its affiliates is difficult to assess at the present time, the Fund currently believes that the likelihood that any such action will have a material adverse impact on it is remote. It is important to note that the Fund is not aware of any allegation of wrongdoing against it and its Board at the time this annual report is printed. Although it is not anticipated that these developments will have an adverse impact on the Fund, there can be no assurance at this time. TFAI and its affiliates are actively working with the SEC in regard to this matter; however, the exact resolution cannot be determined at this time. TFAI will take such actions that it deems necessary or appropriate to continue providing management services to the Fund and to bring all matters to an appropriate conclusion.
TFAI and/or its affiliates, and not the Fund, will bear the costs regarding these regulatory matters.
NOTE 6. SUBSEQUENT EVENT
Effective November 1, 2005, the Fund has changed its name to TA IDEX Clarion Global Real Estate Securities
Transamerica IDEX Mutual Funds
Annual Report 2005
10
Report of Independent Registered Certified Public Accounting Firm
To the Board of Trustees and Shareholders of
TA IDEX Clarion Real Estate Securities
In our opinion, the accompanying statement of assets and liabilities, including the schedule of investments, and the related statements of operations and of changes in net assets and the financial highlights present fairly, in all material respects, the financial position of TA IDEX Clarion Real Estate Securities (the "Fund") (one of the portfolios constituting the Transamerica IDEX Mutual Funds) at October 31, 2005, the results of its operations for the year then ended, the changes in its net assets for each of the two years in the period then ended and the financial highlights for each of the periods presented, in conformity with accounting principles generally accepted in the United States of America. These financial statements and financial highlights (hereafter referred to as "financial statements") are the responsibility of the Fund's management; our responsibility is to express an opinion on these financial statements based on our audits. We conducted our audits of these financial statements in accordance with the standards of the Public Company Accounting Oversight Board (United States). Those standards require that we plan and perform the audit to obtain reasonable assurance about whether the financial statements are free of material misstatement. An audit includes examining, on a test basis, evidence supporting the amounts and disclosures in the financial statements, assessing the accounting principles used and significant estimates made by management, and evaluating the overall financial statement presentation. We believe that our audits, which included confirmation of securities at October 31, 2005 by correspondence with the custodian, provide a reasonable basis for our opinion.

December 22, 2005
Transamerica IDEX Mutual Funds
Annual Report 2005
11
TA IDEX Clarion Real Estate Securities
SUPPLEMENTAL INFORMATION (unaudited)
TAX INFORMATION
For dividends paid during the year ended October 31, 2005, the Fund designated $159 as qualified dividend income.
For tax purposes, the Fund has made a Long-Term Capital Gain Designation of $1,752 for the year ended October 31, 2005.
The information and distributions reported herein may differ from the information and distributions taxable to the shareholders for the calendar year ending December 31, 2005. Complete information will be computed and reported in conjunction with your 2005 Form 1099-DIV.
Transamerica IDEX Mutual Funds
Annual Report 2005
12
TA IDEX Evergreen International Small Cap
MARKET ENVIRONMENT
Our philosophy has continued to emphasize individual stock selection focusing on companies with strong fundamentals such as earnings quality and growth, solid balance sheets and strong management. Some weakness in the international small cap markets in the latter part of 2004 was replaced by robust returns in 2005. The portfolio participated in this strength and outperformed the benchmark index over the period.
PERFORMANCE
For the period from inception November 8, 2004 through October 31, 2005, TA IDEX Evergreen International Small Cap, Class I returned 27.10%. By comparison its benchmark, the Citigroup Global ex-U.S. EMI Index returned 24.79%.
STRATEGY REVIEW
From November 2004 through October 31, 2005 the more significant sector changes in the portfolio were reductions in the weights in consumer discretionary and healthcare and increases in industrials, materials, energy and telecommunications services. These moves largely reflected the changing market and economic backdrop including the rises in U.S. interest rates, increases in energy and commodity prices and the renewed investor sentiment. From a geographic perspective, the most noteworthy changes were a significant increase in the weight in Japan, particularly over the latter months of the period, and increases of lower levels in the Netherlands and the United Kingdom ("U.K.") over a longer part of the year. These increases reflect the impact of both relative performances as well as reallocation of exposure. The funding for reallocations came from reducing the exposure to both France and Germany as well as from cash. Cash flow i n the year was strong and the portfolio was almost fully invested at year-end. Exposure to emerging markets remained largely unchanged at modest levels.
From a sector perspective, industrials, consumer discretionary, information technology ("IT") and materials had the most positive effect on the portfolio over the period. Overweight positions (significant in consumer discretionary) combined with strong stock outperformances to boost the portfolio's return.
The industrials sector had four of the portfolio's top ten contributors. U.K.-based Ashtead Group plc, a construction equipment leasing company, led the way as the portfolio's strongest contributor. Another UK stock, Charter plc, an international engineering company, saw strong returns as did Dutch based Koninklijke BAM, a construction and engineering company. Each of these stocks saw returns of over 80% in the year. Japanese consumer retailers Yamada Denki Co., Ltd. and United Arrows, both of which returned in excess of 100% in the year were the leading contributors. Galeries Lafayette, which was taken private early in 2005, also helped performance. German tire manufacturer and auto component company, Continental AG, had a strong year, in part reaping the rewards from low cost production in Eastern Europe. In IT, the French information systems company, Bull , and Neopost S.A., the office equipment supplier, were also among the stronger performers and the portfolio's heavier weights. Within materials, the largest contribution came from Tokuyama, the Japanese chemical company.
On a regional basis, the U.K., Europe and Japan were the leaders. In addition to individual stocks already mentioned, strong contributions came from a range of companies across different industries. These included Photo-Me International plc, a U.K.-based photographic service company with overseas operations; France's Eurofins Scientific SA, the specialist in scientific analysis of food and raw materials; the U.K.'s energy companies Paladin Resources plc and Tullow Oil plc; Ireland's Anglo Irish Bank Corporation plc; and Japan's financial services company, Nissin Co., Ltd. and retailer, Isetan Company Limited.
From a sector perspective, energy was the only detractor, and marginally so, as the impact of an underweight position offset the benefits of superior stock selection. A number of individual holdings across a range of sectors disappointed and detracted from performance in the period. These included Agfa-Gevaert N.V., the Belgian-based imaging company; Puma AG Rudolf Dassler Sport, the German sports-apparel company; media companies ITV plc in the U.K. and Promotora de Informaciones, S.A. in Spain. Japan's truck and bus manufacturer, Hino Motors, Ltd., was also negative.
Investment Team
Evergreen Investment Management Company, LLC
This Fund is only available for investment by the Asset Allocation Portfolios.
Transamerica IDEX Mutual Funds
Annual Report 2005
1
TA IDEX Evergreen International Small Cap
Comparison of change in value of $10,000 investment in Class I shares and its comparative index.
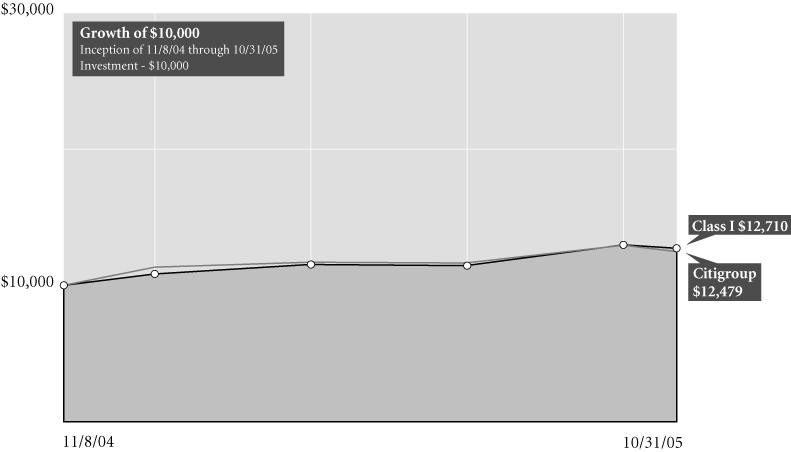
Total Return for Period Ended 10/31/05
| | | From
Inception | | Inception
Date | |
| Class A (NAV) | | | 10.26 | % | | 3/1/05 | |
| Class I (NAV) | | | 27.10 | % | | 11/8/04 | |
| Citigroup1 | | | 24.79 | % | | 11/8/04 | |
NOTES
1 The Citigroup Global ex-U.S. EMI (Citigroup) Index is an unmanaged index used as a general measure of market performance. Calculations assume dividends and capital gains are reinvested and do not include any managerial expenses. From inception calculation is based on life of Class I shares. Source: Standard & Poor's Micropal®© Micropal, Inc. 2005 – 1-800-596-5323 – http://www.funds-sp.com.
The performance data presented represents past performance, future results may vary. Performance data does not reflect the deduction of taxes that would be paid on fund distributions or the redemption of fund shares. Investment return and principal value will fluctuate so that an investor's shares, when redeemed, may be worth more or less than their original cost. Current performance may be lower or higher than performance quoted. Please see www.transamericaidex.com for performance data current to the most recent month-end.
Net Asset Value (NAV) returns include the reinvestment of dividends and capital gains. Class A shares are sold without a sales load.
International investing involves special risks including currency fluctuations, political instability, and different financial accounting standards.
This material must be preceded or accompanied by a current prospectus, which includes specific contents regarding the investment objectives and policies of this fund.
Transamerica IDEX Mutual Funds
Annual Report 2005
2
TA IDEX Evergreen International Small Cap
UNDERSTANDING YOUR FUND'S EXPENSES
(unaudited)
SHAREHOLDER EXPENSES
Fund shareholders may incur ongoing costs, including management fees, 12b-1 distribution and service fees, and other fund expenses. Shares of the fund currently are sold only to certain Transamerica IDEX Mutual Funds and AEGON/Transamerica Series Trust (an affiliate of Transamerica IDEX Mutual Funds) asset allocation funds at net asset value, without any transactional costs.
The following Example is intended to help you understand your ongoing costs (in dollars and cents) of investing in a Fund and to compare these costs with the ongoing costs of investing in other funds.
The Example is based on an investment of $1,000 invested at May 1, 2005 and held for the entire period until October 31, 2005.
ACTUAL EXPENSES
The first line in the table below provides information about actual account values and actual expenses. You may use the information in this line, together with the amount you invested, to estimate the expenses that you paid over the period. Simply divide your account value by $1,000 (for example, an $8,600 account value divided by $1,000 = 8.6), then multiply the result by the number in the first line of your Fund under the heading entitled "Expenses Paid During Period" to estimate the expenses you paid on your account during this period.
HYPOTHETICAL EXAMPLE FOR COMPARISON PURPOSES
The second line in the table below provides information about hypothetical account values and hypothetical expenses based on the Fund's actual expense ratio and an assumed rate of return of 5% per year before expenses, which is not the Fund's actual return. The hypothetical account values and expenses may not be used to estimate the actual ending account balance or expenses you paid for the period. You may use this information to compare the ongoing costs of investing in your Fund and other funds. To do so, compare this 5% hypothetical example with the 5% hypothetical examples that appear in the shareholder reports of the other funds.
Please note that the expenses shown in the table are meant to highlight your ongoing costs only and do not reflect any transactional costs, such as sales charges, redemption fees, brokerage commissions paid on purchases and sales of fund shares. Therefore, the second line under the Fund in the table is useful in comparing ongoing costs only, and will not help you determine the relative total costs of owning different funds.
| | | Beginning
Account
Value | | Ending
Account
Value | | Annualized
Expense
Ratio | | Expenses Paid
During Period (a) | |
| Class A | |
| Actual | | $ | 1,000.00 | | | $ | 1,151.70 | | | | 1.61 | % | | $ | 8.73 | | |
| Hypothetical (b) | | | 1,000.00 | | | | 1,017.09 | | | | 1.61 | | | | 8.19 | | |
| Class I | |
| Actual | | | 1,000.00 | | | | 1,153.40 | | | | 1.22 | | | | 6.62 | | |
| Hypothetical (b) | | | 1,000.00 | | | | 1,019.06 | | | | 1.22 | | | | 6.21 | | |
(a) Expenses are calculated using each Fund's annualized expense ratio (as disclosed in the table), multiplied by the average account value for the period, multiplied by number of days in the period (184 days), and divided by the number of days in the year (365 days).
(b) 5% return per year before expenses.
GRAPHICAL PRESENTATION OF SCHEDULE OF INVESTMENTS
By Region
At October 31, 2005
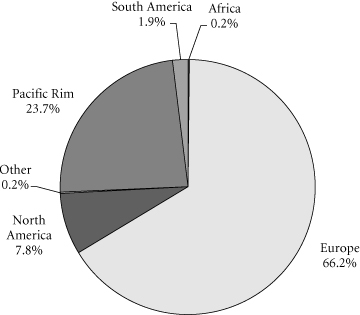
This chart shows the percentage breakdown by region of the Fund's total investment securities.
Transamerica IDEX Mutual Funds
Annual Report 2005
3
TA IDEX Evergreen International Small Cap
SCHEDULE OF INVESTMENTS
At October 31, 2005
(all amounts except share amounts in thousands)
| | | Shares | | Value | |
| COMMON STOCKS ( 97.0%) | |
| Australia (0.3%) | |
| QBE Insurance Group, Ltd. | | | 71,387 | | | $ | 950 | | |
| Belgium (2.6%) | |
| AGFA-Gevaert NV | | | 59,660 | | | | 1,285 | | |
| GIMV Nv | | | 33,627 | | | | 1,731 | | |
| Mobistar SA | | | 8,886 | | | | 719 | | |
| Option NV ‡† | | | 48,939 | | | | 3,097 | | |
| Umicore | | | 17,964 | | | | 1,798 | | |
| Bermuda (0.2%) | |
| China Gas Holdings, Ltd. ‡ | | | 4,380,000 | | | | 695 | | |
| Brazil (2.0%) | |
| Empresa Brasileira de Aeronautica SA, ADR † | | | 87,174 | | | | 3,381 | | |
| Tim Participacoes SA, ADR † | | | 153,997 | | | | 3,121 | | |
| Canada (2.3%) | |
| Brascan Corp.–Class A | | | 14,900 | | | | 680 | | |
| Gabriel Resources, Ltd. ‡ | | | 62,160 | | | | 124 | | |
| Gabriel Resources, Ltd. Warrants ‡ | | | 23,380 | | | | 14 | | |
| RONA, Inc. ‡ | | | 201,800 | | | | 3,752 | | |
| Sierra Wireless ‡ | | | 226,000 | | | | 2,486 | | |
| Transat AT, Inc.–Class A ‡ | | | 26,211 | | | | 361 | | |
| Transat AT, Inc.–Class B ‡ | | | 15,518 | | | | 211 | | |
| Finland (0.2%) | |
| Amer Group | | | 28,100 | | | | 512 | | |
| France (6.9%) | |
| Altran Technologies SA ‡† | | | 385,554 | | | | 4,506 | | |
| Bull SA ठ| | | 6,042,085 | | | | 5,432 | | |
| Eurofins Scientific ‡ | | | 79,256 | | | | 3,372 | | |
| Flo Groupe ‡ | | | 133,212 | | | | 1,221 | | |
| Neopost SA | | | 87,209 | | | | 8,415 | | |
| Germany (8.9%) | |
| Adidas-Salomon AG | | | 49,606 | | | | 8,323 | | |
| Continental AG | | | 93,650 | | | | 7,161 | | |
| Deutz AG ‡† | | | 626,361 | | | | 2,845 | | |
| Leoni AG | | | 60,691 | | | | 1,898 | | |
| Man AG | | | 33,442 | | | | 1,552 | | |
| Puma AG Rudolf Dassler Sport | | | 5,947 | | | | 1,506 | | |
| Q-Cells AG ‡ | | | 31,854 | | | | 1,749 | | |
| SGL Carbon AG ‡ | | | 293,763 | | | | 4,296 | | |
| Ireland (2.4%) | |
| Anglo Irish Bank Corp. PLC | | | 399,649 | | | | 5,451 | | |
| C&C Group PLC | | | 408,107 | | | | 2,529 | | |
| Italy (2.1%) | |
| Davide Campari-Milano SpA | | | 464,107 | | | | 3,146 | | |
| Geox SpA ‡† | | | 381,744 | | | | 3,626 | | |
| Gruppo Coin SpA ‡ | | | 76,420 | | | | 229 | | |
| | | Shares | | Value | |
| Japan (24.5%) | |
| Advan Co., Ltd. | | | 162,400 | | | $ | 2,321 | | |
| Arrk Corp. | | | 67,300 | | | | 3,708 | | |
| Bank of Yokohama, Ltd. (The) | | | 441,000 | | | | 3,578 | | |
| Diamond Lease Co., Ltd. | | | 91,800 | | | | 4,253 | | |
| Hino Motors, Ltd. | | | 762,000 | | | | 4,840 | | |
| Isetan Co., Ltd. | | | 295,300 | | | | 5,279 | | |
| Ito En, Ltd. | | | 41,500 | | | | 1,990 | | |
| Jupiter Telecommunications Co. ‡ | | | 2,374 | | | | 1,904 | | |
| NextCom KK † | | | 1,296 | | | | 1,543 | | |
| NGK Insulators, Ltd. | | | 123,000 | | | | 1,460 | | |
| Nidec Corp. | | | 52,000 | | | | 2,959 | | |
| Nipponkoa Insurance Co., Ltd. | | | 389,000 | | | | 3,260 | | |
| Nissin Co., Ltd. | | | 4,059,040 | | | | 5,826 | | |
| Okumura Corp. | | | 283,000 | | | | 1,763 | | |
| Pigeon Corp. | | | 112,900 | | | | 1,476 | | |
| Ryohin Keikaku Co., Ltd. | | | 80,800 | | | | 5,347 | | |
| Seijo Corp. | | | 45,500 | | | | 1,236 | | |
| Takano Co., Ltd. | | | 74,100 | | | | 1,277 | | |
| Takefuji Corp. | | | 56,060 | | | | 3,908 | | |
| THK Co., Ltd. | | | 112,800 | | | | 2,530 | | |
| Toho Co., Ltd. | | | 102,600 | | | | 1,949 | | |
| Tokuyama Corp. | | | 709,000 | | | | 7,008 | | |
| Tokyo Star Bank, Ltd. (The) ‡ | | | 70 | | | | 244 | | |
| United Arrows, Ltd. † | | | 107,100 | | | | 5,689 | | |
| Yamada Denki Co., Ltd. | | | 63,700 | | | | 5,568 | | |
| Netherlands (13.0%) | |
| Ballast Nedam ‡ | | | 34,560 | | | | 1,412 | | |
| Buhrmann NV † | | | 804,226 | | | | 8,888 | | |
| Fugro NV | | | 53,549 | | | | 1,447 | | |
| Getronics NV | | | 64,625 | | | | 804 | | |
| Grolsch NV | | | 29,903 | | | | 780 | | |
| Hagemeyer NV ‡† | | | 309,026 | | | | 837 | | |
| Heijmans NV | | | 129,959 | | | | 5,871 | | |
| IHC Caland NV | | | 30,346 | | | | 2,346 | | |
| Koninklijke BAM NBM NV | | | 104,751 | | | | 8,500 | | |
| Koninklijke Wessanen NV | | | 237,822 | | | | 3,492 | | |
| USG People NV † | | | 264,169 | | | | 8,521 | | |
| New Zealand (0.3%) | |
| Vector, Ltd. ‡ | | | 527,427 | | | | 1,135 | | |
| South Africa (0.2%) | |
| Harmony Gold Mining Co., Ltd., ADR ‡† | | | 78,808 | | | | 824 | | |
| Spain (5.4%) | |
| Cia de Distribucion Integral Logista SA † | | | 86,376 | | | | 4,577 | | |
Cintra Concesiones de Infraestructuras de
Transporte SA ‡ | | | 222,137 | | | | 2,633 | | |
| Fomento de Construcciones y Contratas SA | | | 8,171 | | | | 448 | | |
| Gestevision Telecinco SA ‡ | | | 102,285 | | | | 2,269 | | |
The notes to the financial statements are an integral part of this report.
Transamerica IDEX Mutual Funds
Annual Report 2005
4
TA IDEX Evergreen International Small Cap
SCHEDULE OF INVESTMENTS (continued)
At October 31, 2005
(all amounts except share amounts in thousands)
| | | Shares | | Value | |
| Spain (continued) | |
| Miquel y Costas | | | 35,885 | | | $ | 1,098 | | |
| NH Hoteles SA | | | 115,949 | | | | 1,737 | | |
| Promotora de Informaciones SA | | | 156,550 | | | | 2,871 | | |
Sociedad General de Aguas de Barcelona
SA–Class B | | | 93,157 | | | | 2,148 | | |
| Switzerland (2.0%) | |
| Lindt & Spruengli AG | | | 2,092 | | | | 3,540 | | |
| Logitech International SA ‡ | | | 81,178 | | | | 3,072 | | |
| United Kingdom (23.7%) | |
| Aberdeen Asset Management PLC | | | 447,171 | | | | 895 | | |
| Ashtead Group PLC ‡ | | | 4,118,023 | | | | 10,281 | | |
| AWG PLC | | | 326,689 | | | | 5,562 | | |
| BAE Systems PLC | | | 932,312 | | | | 5,456 | | |
| Body Shop International PLC | | | 720,141 | | | | 2,678 | | |
| Carphone Warehouse Group PLC | | | 335,706 | | | | 1,165 | | |
| Charter PLC ‡ | | | 846,231 | | | | 5,814 | | |
| Daily Mail and General Trust NV–Class A | | | 41,278 | | | | 458 | | |
| Danka Business Systems PLC ‡ | | | 398,568 | | | | 196 | | |
| Danka Business Systems PLC, ADR ‡ | | | 879,068 | | | | 1,872 | | |
| Electronics Boutique PLC | | | 1,929,639 | | | | 2,930 | | |
| Enterprise Inns PLC | | | 183,837 | | | | 2,537 | | |
| Hilton Group PLC | | | 171,692 | | | | 1,031 | | |
| Homestyle Group PLC ‡ | | | 518,039 | | | | 702 | | |
| ICAP PLC | | | 300,873 | | | | 1,841 | | |
| ITV PLC | | | 1,967,199 | | | | 3,622 | | |
| Kelda Group PLC | | | 89,702 | | | | 1,105 | | |
| Laura Ashley Holdings PLC ‡ | | | 2,093,709 | | | | 491 | | |
| Luminar PLC | | | 273,749 | | | | 2,351 | | |
| Man Group PLC | | | 30,086 | | | | 820 | | |
| Paladin Resources PLC | | | 526,619 | | | | 3,261 | | |
| Photo-Me International PLC | | | 4,595,546 | | | | 10,354 | | |
| Premier Oil PLC ‡ | | | 177,094 | | | | 2,273 | | |
| Regent Inns PLC ‡ | | | 900,025 | | | | 1,386 | | |
| Rentokil Initial PLC | | | 322,406 | | | | 876 | | |
| RHM PLC ‡ | | | 191,514 | | | | 878 | | |
| Schroders PLC | | | 66,087 | | | | 1,005 | | |
| Trafficmaster PLC ‡ | | | 141,549 | | | | 78 | | |
| Tullow Oil PLC | | | 510,402 | | | | 2,191 | | |
| Umbro ‡ | | | 973,978 | | | | 2,138 | | |
| United Utilities PLC | | | 178,826 | | | | 1,974 | | |
| Total Common Stocks (cost: $286,618) | | | | | | | 320,561 | | |
| | | Principal | | Value | |
| SECURITY LENDING COLLATERAL (8.6%) | |
| Debt (8.0%) | |
| Bank Notes (0.5%) | |
Bank of America
3.81%, due 06/07/2006 *
3.81%, due 08/10/2006 * | | | $800
794 | | | | $800
794 | | |
| | | Principal | | Value | |
| Bank Notes (continued) | |
Credit Suisse First Boston Corp.
4.11%, due 03/10/2006 * | | $ | 159 | | | $ | 159 | | |
| Certificates of Deposit (0.6%) | |
Canadian Imperial Bank of Commerce
4.07%, due 11/04/2005 * | | | 635 | | | | 635 | | |
Harris Trust & Savings Bank
3.80%, due 11/04/2005 * | | | 505 | | | | 505 | | |
Rabobank Nederland
4.03%, due 05/31/2006 * | | | 794 | | | | 794 | | |
| Commercial Paper (1.7%) | |
Ciesco LLC
4.00%, due 11/03/2005 | | | 793 | | | | 793 | | |
General Electric Capital Corp.
3.96%, due 12/05/2005 | | | 635 | | | | 635 | | |
Paradigm Funding LLC–144A
4.01%, due 11/07/2005 | | | 633 | | | | 633 | | |
Park Avenue Receivables Corp.–144A
4.03%, due 12/02/2005 | | | 629 | | | | 629 | | |
Preferred Receivables Corp.–144A
4.04%, due 12/05/2005 | | | 476 | | | | 476 | | |
Ranger Funding Co. LLC–144A
3.99%, due 11/15/2005 | | | 472 | | | | 472 | | |
Sheffield Receivables Corp.–144A
4.01%, due 11/08/2005 | | | 476 | | | | 476 | | |
Yorktown Capital LLC
3.97%, due 11/09/2005
3.93%, due 11/17/2005 | | | 791
788 | | | | 791
788 | | |
| Euro Dollar Overnight (1.9%) | |
Bank of Montreal
3.79%, due 11/01/2005 | | | 476 | | | | 476 | | |
Barclays
3.80%, due 11/04/2005 | | | 635 | | | | 635 | | |
BNP Paribas
3.83%, due 11/02/2005 | | | 952 | | | | 952 | | |
Deutsche Bank
3.80%, due 11/02/2005 | | | 1,587 | | | | 1,587 | | |
HSBC Banking/Holdings PLC
3.84%, due 11/07/2005 | | | 476 | | | | 476 | | |
Royal Bank of Scotland
3.76%, due 11/01/2005 | | | 635 | | | | 635 | | |
Svenska Handlesbanken
4.03%, due 11/01/2005 | | | 817 | | | | 817 | | |
UBS AG
3.80%, due 11/03/2005 | | | 635 | | | | 635 | | |
| Euro Dollar Terms (0.7%) | |
Royal Bank of Scotland
4.00%, due 12/12/2005 | | | 635 | | | | 635 | | |
The notes to the financial statements are an integral part of this report.
Transamerica IDEX Mutual Funds
Annual Report 2005
5
TA IDEX Evergreen International Small Cap
SCHEDULE OF INVESTMENTS (continued)
At October 31, 2005
(all amounts except share amounts in thousands)
| | | Principal | | Value | |
| Euro Dollar Terms (continued) | |
UBS AG
4.02%, due 12/01/2005 | | $ | 635 | | | $ | 635 | | |
Wells Fargo
3.96%, due 11/14/2005 | | | 952 | | | | 952 | | |
| Promissory Notes (0.2%) | |
Goldman Sachs Group, Inc.
4.02%, due 12/28/2005 | | | 667 | | | | 667 | | |
| Repurchase Agreements (2.4%) †† | |
Credit Suisse First Boston Corp.
4.10%, dated 10/31/2005 to be repurchased
at $1,082 on 11/01/2005 | | | 1,082 | | | | 1,082 | | |
Goldman Sachs Group, Inc. (The)
4.10%, dated 10/31/2005 to be repurchased
at $2,699 on 11/01/2005 | | | 2,698 | | | | 2,698 | | |
Lehman Brothers, Inc.
4.10%, dated 10/31/2005 to be repurchased
at $75 on 11/01/2005 | | | 75 | | | | 75 | | |
Merrill Lynch & Co.
4.10%, dated 10/31/2005 to be repurchased
at $3,175 on 11/01/2005 | | | 3,174 | | | | 3,174 | | |
Morgan Stanley Dean Witter & Co.
4.17%, dated 10/31/2005 to be repurchased
at $952 on 11/01/2005 | | | 952 | | | | 952 | | |
| | | Shares | | Value | |
| Investment Companies (0.6%) | |
| Money Market Funds (0.6%) | |
American Beacon Fund
1-day yield of 3.81% | | | 684,383 | | | $ | 684 | | |
Barclays Global Investors Institutional
Money Market Fund
1-day yield of 3.92% | | | 634,901 | | | | 635 | | |
Goldman Sachs Financial Square Prime
Obligations Fund
1-day yield of 3.79% | | | 98,897 | | | | 99 | | |
Merrimac Cash Fund, Premium Class
1-day yield of 3.70% @ | | | 627,884 | | | | 628 | | |
| Total Security Lending Collateral (cost: $28,509) | | | | | | | 28,509 | | |
| Total Investment Securities (cost: $315,127) | | | | | | $ | 349,070 | | |
| SUMMARY: | |
| Investment securities, at value | | | 105.6 | % | | $ | 349,070 | | |
| Liabilities in excess of other assets | | | (5.6 | )% | | | (18,515 | ) | |
| Net assets | | | 100.0 | % | | $ | 330,555 | | |
NOTES TO SCHEDULE OF INVESTMENTS:
‡ Non-income producing.
† At October 31, 2005, all or a portion of this security is on loan (see Note 1). The value at October 31, 2005, of all securities on loan is $27,083.
§ Security is deemed to be illiquid.
* Floating or variable rate note. Rate is listed as of October 31, 2005.
†† Cash collateral for the Repurchase Agreements, valued at $8,141, that serve as collateral for securities lending are invested in corporate bonds with interest rates and maturity dates ranging from 0.00%–9.86% and 12/31/2005–11/15/2096, respectively.
@ Regulated investment company advised by Investors Bank and Trust Co. ("IBT"). IBT is also the accounting, custody and lending agent for the Fund.
DEFINITIONS:
144A 144A Securities are registered pursuant to Rule 144A of the Securities Act of 1933. These securities are deemed to be liquid for purposes of compliance limitations on holdings of illiquid securities and may be resold as transactions exempt from registration, normally to qualified institutional buyers. At October 31, 2005, these securities aggregated $2,686 or 0.8% of the net assets of the Fund.
ADR American Depositary Receipt
The notes to the financial statements are an integral part of this report.
Transamerica IDEX Mutual Funds
Annual Report 2005
6
TA IDEX Evergreen International Small Cap
SCHEDULE OF INVESTMENTS (continued)
At October 31, 2005
(all amounts except share amounts in thousands)
| | | Percentage of
Net Assets | | Value | |
| INVESTMENTS BY INDUSTRY: | |
| Business Services | | | 8.8 | % | | $ | 29,200 | | |
| Engineering & Management Services | | | 6.6 | % | | | 22,052 | | |
| Computer & Office Equipment | | | 6.2 | % | | | 20,571 | | |
| Rubber & Misc. Plastic Products | | | 5.1 | % | | | 16,990 | | |
| Chemicals & Allied Products | | | 4.7 | % | | | 15,458 | | |
| Wholesale Trade Durable Goods | | | 3.7 | % | | | 12,093 | | |
| Instruments & Related Products | | | 3.5 | % | | | 11,639 | | |
| Electric, Gas & Sanitary Services | | | 3.3 | % | | | 10,789 | | |
| Commercial Banks | | | 2.8 | % | | | 9,273 | | |
| Oil & Gas Extraction | | | 2.8 | % | | | 9,172 | | |
| Aerospace | | | 2.7 | % | | | 8,837 | | |
| Radio, Television & Computer Stores | | | 2.6 | % | | | 8,498 | | |
| Manufacturing Industries | | | 2.6 | % | | | 8,476 | | |
| Personal Credit Institutions | | | 2.5 | % | | | 8,161 | | |
| Food & Kindred Products | | | 2.4 | % | | | 7,910 | | |
| Restaurants | | | 2.3 | % | | | 7,495 | | |
| Industrial Machinery & Equipment | | | 2.1 | % | | | 6,927 | | |
| Beer, Wine & Distilled Beverages | | | 2.0 | % | | | 6,455 | | |
| Computer & Data Processing Services | | | 1.9 | % | | | 6,236 | | |
| Shoe Stores | | | 1.9 | % | | | 6,180 | | |
| Radio & Television Broadcasting | | | 1.8 | % | | | 5,891 | | |
| Department Stores | | | 1.7 | % | | | 5,508 | | |
| Misc. General Merchandise Stores | | | 1.6 | % | | | 5,347 | | |
| Telecommunications | | | 1.5 | % | | | 5,005 | | |
| Holding & Other Investment Offices | | | 1.5 | % | | | 4,945 | | |
| Automotive | | | 1.5 | % | | | 4,840 | | |
| Communications Equipment | | | 1.4 | % | | | 4,640 | | |
| Insurance | | | 1.2 | % | | | 4,210 | | |
| Lumber & Other Building Materials | | | 1.1 | % | | | 3,752 | | |
| Leather & Leather Products | | | 1.1 | % | | | 3,626 | | |
| Health Services | | | 1.0 | % | | | 3,372 | | |
| Electronic Components & Accessories | | | 1.0 | % | | | 3,358 | | |
| Printing & Publishing | | | 1.0 | % | | | 3,329 | | |
| Electronic & Other Electric Equipment | | | 0.9 | % | | | 2,959 | | |
| Electric Services | | | 0.9 | % | | | 2,884 | | |
| Security & Commodity Brokers | | | 0.8 | % | | | 2,846 | | |
| Public Administration | | | 0.8 | % | | | 2,711 | | |
| Metal Mining | | | 0.8 | % | | | 2,636 | | |
| Water Transportation | | | 0.7 | % | | | 2,346 | | |
| Beverages | | | 0.6 | % | | | 1,990 | | |
| Motion Pictures | | | 0.6 | % | | | 1,949 | | |
| Communication | | | 0.6 | % | | | 1,904 | | |
| Hotels & Other Lodging Places | | | 0.5 | % | | | 1,737 | | |
| Furniture & Fixtures | | | 0.4 | % | | | 1,277 | | |
| Drug Stores & Proprietary Stores | | | 0.4 | % | | | 1,236 | | |
| Paper & Paper Products | | | 0.3 | % | | | 1,098 | | |
| Amusement & Recreation Services | | | 0.3 | % | | | 1,031 | | |
| �� | | Percentage of
Net Assets | | Value | |
| Furniture & Home Furnishings Stores | | | 0.2 | % | | $ | 702 | | |
| Air Transportation | | | 0.2 | % | | | 572 | | |
| Construction | | | 0.1 | % | | | 448 | | |
| Investment securities, at value | | | 97.0 | % | | | 320,561 | | |
| Securities lending collateral | | | 8.6 | % | | | 28,509 | | |
| Liabilities in excess of other assets | | | (5.6 | )% | | | (18,515 | ) | |
| Net assets | | | 100.0 | % | | $ | 330,555 | | |
The notes to the financial statements are an integral part of this report.
Transamerica IDEX Mutual Funds
Annual Report 2005
7
TA IDEX Evergreen International Small Cap
STATEMENT OF ASSETS AND LIABILITIES
At October 31, 2005
(all amounts except per share amounts in thousands)
| Assets: | |
Investment securities, at value (cost: $315,127)
(including securities loaned of $27,083) | | $ | 349,070 | | |
| Cash | | | 8,673 | | |
| Foreign currencies (cost: $1,171) | | | 1,164 | | |
| Receivables: | |
| Interest | | | 21 | | |
| Dividends | | | 513 | | |
| Dividend reclaims receivable | | | 49 | | |
| | | | 359,490 | | |
| Liabilities: | |
| Accounts payable and accrued liabilities: | |
| Management and advisory fees | | | 322 | | |
| Distribution and service fees | | | 37 | | |
| Administration fees | | | 6 | | |
| Payable for collateral for securities on loan | | | 28,509 | | |
| Other | | | 61 | | |
| | | | 28,935 | | |
| Net Assets | | $ | 330,555 | | |
| Net Assets Consist of: | |
Shares of beneficial interest, unlimited shares
authorized, no par value | | $ | 285,307 | | |
| Undistributed net investment income (loss) | | | 823 | | |
Undistributed net realized gain (loss) from investment
securities and foreign currency transactions | | | 10,498 | | |
| Net unrealized appreciation (depreciation) on: | |
| Investment securities | | | 33,943 | | |
Translation of assets and liabilites denominated in
foreign currencies | | | (16 | ) | |
| Net Assets | | $ | 330,555 | | |
| Net Assets by Class: | |
| Class A | | $ | 126,142 | | |
| Class I | | | 204,413 | | |
| Shares Outstanding: | |
| Class A | | | 9,945 | | |
| Class I | | | 16,080 | | |
| Net Asset Value and Offering Price Per Share: | |
| Class A | | $ | 12.69 | | |
| Class I | | | 12.71 | | |
STATEMENT OF OPERATIONS
For the period ended October 31, 2005 (a)
(all amounts in thousands)
| Investment Income: | |
| Interest | | $ | 235 | | |
Dividends (net of withholding taxes on foreign
dividends of $366) | | | 3,824 | | |
| Income from loaned securities–net | | | 57 | | |
| | | | 4,116 | | |
| Expenses: | |
| Management and advisory fees | | | 2,312 | | |
| Distribution and service fees: | |
| Class A | | | 242 | | |
| Transfer agent fees: | |
| Class A | | | 1 | | |
| Class I | | | 1 | | |
| Printing and shareholder reports | | | 1 | | |
| Custody fees | | | 242 | | |
| Administration fees | | | 43 | | |
| Legal fees | | | 11 | | |
| Audit fees | | | 22 | | |
| Trustees fees | | | 7 | | |
| Registration fees: | |
| Class A | | | 9 | | |
| Class I | | | 14 | | |
| Other | | | 2 | | |
| Total expenses | | | 2,907 | | |
| Net Investment Income (Loss) | | | 1,209 | | |
| Net Realized Gain (Loss) from: | |
| Investment securities | | | 10,119 | | |
| Foreign currency transactions | | | (7 | ) | |
| | | | 10,112 | | |
Net Increase (Decrease) in Unrealized Appreciation
(Depreciation) on: | | | | | |
| Investment securities | | | 33,943 | | |
Translation of assets and liabilities denominated in
foreign currencies | | | (16 | ) | |
| | | | 33,927 | | |
Net Gain (Loss) on Investment Securities and Foreign
Currency Transactions | | | 44,039 | | |
Net Increase (Decrease) in Net Assets Resulting
from Operations | | $ | 45,248 | | |
(a) TA IDEX Evergreen International Small Cap ("the Fund") commenced operations on November 8, 2004. The inception date for the Fund's offering of share Class A was March 1, 2005.
The notes to the financial statements are an integral part of this report.
Transamerica IDEX Mutual Funds
Annual Report 2005
8
TA IDEX Evergreen International Small Cap
STATEMENTS OF CHANGES IN NET ASSETS
For the period ended
(all amounts in thousands)
| | | October 31,
2005 (a) | |
| Increase (Decrease) In Net Assets From: | |
| Operations: | |
| Net investment income (loss) | | $ | 1,209 | | |
Net realized gain (loss) from investment securities
and foreign currency transactions | | | 10,112 | | |
Net unrealized appreciation (depreciation)
on investment securities and foreign
currency translation | | | 33,927 | | |
| | | | 45,248 | | |
| Capital Share Transactions: | |
| Proceeds from shares sold: | |
| Class A | | | 114,354 | | |
| Class I | | | 170,953 | | |
| | | | 285,307 | | |
| Net increase (decrease) in net assets | | | 330,555 | | |
| Net Assets: | |
| Beginning of period | | | – | | |
| End of period | | $ | 330,555 | | |
| Undistributed Net Investment Income (Loss) | | $ | 823 | | |
| Share Activity: | |
| Shares issued: | |
| Class A | | | 9,945 | | |
| Class I | | | 16,080 | | |
| | | | 26,025 | | |
| Net increase (decrease) in shares outstanding: | |
| Class A | | | 9,945 | | |
| Class I | | | 16,080 | | |
| | | | 26,025 | | |
(a) TA IDEX Evergreen International Small Cap ("the Fund") commenced operations on November 8, 2004. The inception date for the Fund's offering of share Class A was March 1, 2005.
The notes to the financial statements are an integral part of this report.
Transamerica IDEX Mutual Funds
Annual Report 2005
9
TA IDEX Evergreen International Small Cap
FINANCIAL HIGHLIGHTS
| | | | | For a share of beneficial interest outstanding throughout the period | |
| | | | | Net Asset | | Investment Operations | | Distributions | | Net Asset | |
| | | For the
Period
Ended (d)(g) | | Value,
Beginning
of Period | | Net
Investment
Income (Loss) | | Net Realized
and Unrealized
Gain (Loss) | | Total
Operations | | From Net
Investment
Income | | From Net
Realized
Gains | | Total
Distributions | | Value,
End
of Period | |
| Class A | | 10/31/2005 | | $ | 11.50 | | | $ | 0.05 | | | $ | 1.14 | | | $ | 1.19 | | | $ | – | | | $ | – | | | $ | – | | | $ | 12.69 | | |
| Class I | | 10/31/2005 | | | 10.00 | | | | 0.06 | | | | 2.65 | | | | 2.71 | | | | – | | | | – | | | | – | | | | 12.71 | | |
| | | | | | | Ratios/Supplemental Data | |
| | | For the
Period | | Total | | Net Assets,
End of
Period | | Ratio of Expenses
to Average
Net Assets (a) | | Net Investment
Income (Loss)
to Average | | Portfolio
Turnover | |
| | | Ended (g) | | Return (c) | | (000's) | | Net (e) | | Total (f) | | Net Assets (a) | | Rate (b) | |
| Class A | | 10/31/2005 | | | 10.26 | % | | $ | 126,142 | | | | 1.57 | % | | | 1.57 | % | | | 0.54 | % | | | 65 | % | |
| Class I | | 10/31/2005 | | | 27.10 | | | | 204,413 | | | | 1.22 | | | | 1.22 | | | | 0.56 | | | | 65 | | |
NOTES TO FINANCIAL HIGHLIGHTS
(a) Annualized.
(b) Not annualized.
(c) Total Return has been calculated for the applicable period without deduction of a sales load, if any, on an initial purchase. Periods of less than one year are not annualized.
(d) Per share information is calculated based on average number of shares outstanding.
(e) Ratio of Net Expenses to Average Net Assets is net of fee waivers and reimbursements by the investment adviser, if any (see note 2).
(f) Ratio of Total Expenses to Average Net Assets includes all expenses before fee waivers and reimbursements by the investment adviser.
(g) TA IDEX Evergreen International Small Cap ("the Fund") commenced operations on November 8, 2004. The inception date for the Fund's offering of share Class A was March 1, 2005.
The notes to the financial statements are an integral part of this report.
Transamerica IDEX Mutual Funds
Annual Report 2005
10
TA IDEX Evergreen International Small Cap
NOTES TO FINANCIAL STATEMENTS
At October 31, 2005
(all amounts in thousands)
NOTE 1. ORGANIZATION AND SIGNIFICANT ACCOUNTING POLICIES
Transamerica IDEX Mutual Funds is an open-end management investment company registered under the Investment Company Act of 1940, as amended (the "1940 Act"). TA IDEX Evergreen International Small Cap (the "Fund") began operations on November 8, 2004.
In the normal course of business, the Fund enters into contracts that contain a variety of representations that provide general indemnifications. The Fund's maximum exposure under these arrangements is unknown, as this would involve future claims that may be made against the Fund and/or its affiliates that have not yet occurred. However, based on experience, the Fund expects the risk of loss to be remote.
This report should be read in conjunction with the current Fund prospectus, which contains more complete information about the Fund.
The following is a summary of significant accounting policies followed by the Fund in the preparation of the financial statements. In preparing the Fund's financial statements in accordance with accounting principles generally accepted in the United States of America ("GAAP"), estimates or assumptions (which could differ from actual results) may be used that affect reported amounts and disclosures.
Multiple class operations, income and expenses: The Fund currently offers two classes of shares, Class A and Class I, each with a public offering price that reflects different sales charges, if any, and expense levels. The initial sales charge currently is waived as this Fund is available for investment only by certain strategic asset allocation funds. Income, non-class specific expenses and realized and unrealized gains and losses, are allocated daily to each class, based upon the value of shares outstanding method as permitted under Rule 18f-3 of the 1940 Act. Each class bears its own specific expenses as well as a portion of general, common expenses.
Class I shares are offered for investment to the asset allocation funds of AEGON/Transamerica Series Trust (ATST).
Security valuations: The Fund values its investments at the close of the New York Stock Exchange ("NYSE"), normally 4 p.m. ET, each day the NYSE is open for business. Fund investments are valued at the last sale price or closing price on the day of valuation taken from the primary exchange where the security is principally traded.
Securities traded in the over-the-counter market and listed securities for which no sale was reported on that date are valued at the last quoted bid price.
Debt securities are valued based on a price quotation or other equivalent indication of value supplied by an exchange, a pricing service or a major market maker; however, those that mature in sixty days or less are valued at amortized cost, which approximates market.
Investment company securities are valued at the net asset value of the underlying portfolio.
Foreign securities generally are valued based on quotations from the primary market in which they are traded. Because many foreign securities markets and exchanges close prior to the close of the NYSE, closing prices for foreign securities in those markets or on those exchanges do not reflect the events that occur after that close. If a significant market event impacting the value of a portfolio security (e.g., natural disaster, company announcement, market volatility) occurs subsequent to the close of trading in the security, but prior to the calculation of the Fund's net asset value per share, market quotations for that security may be determined to be unreliable and, accordingly, not "readily available." As a result, foreign equity securities held by the Fund may be valued at fair market value as determined in good faith by the Fund's Administrative Valuation Committee, under the supervision of the Board's Valuation Committee , using guidelines adopted by the Board of Trustees.
Other securities for which quotations are not readily available or whose values have been determined to be unreliable are valued at fair market value as determined in good faith by the Fund's Administrative Valuation Committee, under the supervision of the Board's Valuation Committee, using guidelines adopted by the Board of Trustees.
Cash: The Fund may leave cash overnight in its cash account with the custodian, Investors Bank & Trust Company ("IBT"). IBT has been contracted on behalf of the Fund to invest the excess cash into a savings account, which at October 31, 2005, was paying an interest rate of 2.76%.
Repurchase agreements: The Fund is authorized to enter into repurchase agreements. The Fund, through its custodian, IBT, receives delivery of the underlying securities, the value of which at the time of purchase is required to be an amount equal to at least 100% of the resale price. The Fund will bear the risk of value fluctuations until the security can be sold and may encounter delays and incur costs in liquidating the security. In the event of bankruptcy or insolvency of the seller, delays and costs may be incurred.
Commission recapture: The sub-adviser, to the extent consistent with the best execution and usual commission rate policies and practices, may place security transactions of the Fund with broker/dealers with which Transamerica IDEX Mutual Funds has established a Commission Recapture Program. A Commission Recapture Program is any arrangement under which a broker/dealer applies a portion of the commissions received by such broker/dealer on the security transactions to the Fund. In no event will commissions paid by the Fund be used to pay expenses that would otherwise be borne by any other funds within Transamerica IDEX Mutual Funds, or by any other party.
Recaptured commissions during the year ended October 31, 2005, of $1 are included in net realized gains in the Statement of Operations.
Transamerica IDEX Mutual Funds
Annual Report 2005
11
TA IDEX Evergreen International Small Cap
NOTES TO FINANCIAL STATEMENTS (continued)
At October 31, 2005
(all amounts in thousands)
NOTE 1.–(continued)
Securities lending: The Fund may lend securities to qualified borrowers, with IBT acting as the Fund's lending agent. The Fund earns negotiated lenders' fees. The Fund receives cash and/or securities as collateral against the loaned securities. Cash collateral received is invested in short term, interest bearing securities. The Fund monitors the market value of securities loaned on a daily basis and requires collateral in an amount at least equal to the value of the securities loaned. Income from loaned securities on the Statement of Operations is net of fees, in the amount of $24, earned by IBT for its services.
Security transactions and investment income: Security transactions are recorded on the trade date. Security gains and losses are calculated on the specific identification basis. Dividend income, if any, is recorded on the ex-dividend date or, in the case of foreign securities, as soon as the Fund is informed of the ex-dividend date. Interest income, including accretion of discounts and amortization of premiums, is recorded on the accrual basis commencing on the settlement date.
Foreign currency denominated investments: The accounting records of the Fund are maintained in U.S. dollars. Securities and other assets and liabilities denominated in foreign currencies are translated into U.S. dollars at the closing exchange rate each day. The cost of foreign securities is translated at the exchange rate in effect when the investment was acquired. The Fund combines fluctuations from currency exchange rates and fluctuations in value when computing net realized and unrealized gains or losses from investments.
Net foreign currency gains and losses resulting from changes in exchange rates include: 1) foreign currency fluctuations between trade date and settlement date of investment security transactions; 2) gains and losses on forward foreign currency contracts; and 3) the difference between the receivable amounts of interest and dividends recorded in the accounting records in U.S. dollars and the amounts actually received.
Foreign currency denominated assets may involve risks not typically associated with domestic transactions. These risks include revaluation of currencies, adverse fluctuations in foreign currency values and possible adverse political, social and economic developments, including those particular to a specific industry, country or region.
Foreign capital gains taxes: The Fund may be subject to taxes imposed by countries in which it invests, with respect to its investment in issuers existing or operating in such countries. Such taxes are generally based on income earned or repatriated and capital gains realized on the sale of such investments. The Fund accrues such taxes when the related income or capital gains are earned. Some countries require governmental approval for the repatriation of investment income, capital or the proceeds of sales earned by foreign investors. In addition, if there is deterioration in a country's balance of payments or for other reasons, a country may impose temporary restrictions on foreign capital remittances abroad.
Forward foreign currency contracts: The Fund may enter into forward foreign currency contracts to hedge against exchange rate risk arising from investments in securities denominated in foreign currencies. Contracts are valued at the contractual forward rate and are marked to market daily, with the change in value recorded as an unrealized gain or loss. When the contracts are settled a realized gain or loss is incurred. Risks may arise from changes in market value of the underlying currencies and from the possible inability of counterparties to meet the terms of their contracts.
There were no open forward foreign currency contracts at October 31, 2005.
Redemption fees: A short-term trading redemption fee may be assessed on any Fund shares in a fund account that are sold during the first five (5) NYSE trading days following their purchase date. This redemption fee will equal 2% of the amount redeemed and shares held the longest will be treated as being redeemed first and shares held the shortest as being redeemed last. For the period from inception through October 31, 2005, the Fund received no redemption fees.
Dividend distributions: Distributions to shareholders are recorded on the ex-dividend date and are determined in accordance with Federal income tax regulations which may differ from GAAP.
NOTE 2. RELATED PARTY TRANSACTIONS
Effective January 1, 2005 AEGON/Transamerica Fund Advisors, Inc. was renamed Transamerica Fund Advisors, Inc. ("TFAI"); AEGON/Transamerica Fund Services, Inc. and AEGON/Transamerica Investor Services, Inc. merged into one entity and was renamed Transamerica Fund Services, Inc. ("TFS").
TFAI is the Fund's investment adviser. TFS is the Fund's administrator and transfer agent. AFSG Securities Corp. ("AFSG") is the Fund's distributor/principal underwriter. TFAI, TFS , and AFSG are affiliates of AEGON, NV, a Netherlands corporation.
The following schedule reflects the percentage of Fund assets owned by affiliated mutual funds:
| | | Net
Assets | | % of
Net Assets | |
TA IDEX Asset Allocation–
Conservative Portfolio | | $ | 10,603 | | | | 3.21 | % | |
TA IDEX Asset Allocation–
Growth Portfolio | | | 36,691 | | | | 11.10 | % | |
TA IDEX Asset Allocation–Moderate
Growth Portfolio | | | 58,016 | | | | 17.55 | % | |
TA IDEX Asset Allocation–
Moderate Portfolio | | | 20,767 | | | | 6.28 | % | |
| Asset Allocation–Conservative Portfolio | | | 10,125 | | | | 3.06 | % | |
| Asset Allocation–Growth Portfolio | | | 55,914 | | | | 16.91 | % | |
Asset Allocation–Moderate
Growth Portfolio | | | 92,361 | | | | 27.94 | % | |
| Asset Allocation–Moderate Portfolio | | | 45,975 | | | | 13.91 | % | |
| Total | | $ | 330,452 | | | | 99.96 | % | |
Transamerica IDEX Mutual Funds
Annual Report 2005
12
TA IDEX Evergreen International Small Cap
NOTES TO FINANCIAL STATEMENTS (continued)
At October 31, 2005
(all amounts in thousands)
NOTE 2.–(continued)
Investment advisory fees: The Fund pays management fees to TFAI based on average daily net assets ("ANA") at the following breakpoints:
1.07% of the first $250 million of ANA
1.00% of ANA over $250 million
TFAI has contractually agreed to waive its advisory fee and will reimburse the Fund to the extent that operating expenses exceed the following stated annual limit:
From November 8, 2004 through May 27, 2005:
1.32% Expense Limit (including 12b-1 fees)
From May 28, 2005 on:
1.32% Expense Limit (excluding 12b-1 fees)
If total Fund expenses fall below the annual expense limitation agreement agreed to by the adviser within the succeeding three years, the Fund may be required to pay that adviser a portion or all of the reimbursed class expenses.
There were no amounts recaptured during the period from inception through October 31, 2005. There were no amounts available for recapture at October 31, 2005.
Distribution and service fees: The Fund has a 12b-1 distribution plan under the 1940 Act pursuant to which an annual fee, based on average daily net assets, is paid to the distributor for various disbursements such as broker-dealer account servicing fees and other promotional expenses of the Fund. The Fund is authorized under the 12b-1 plan to pay fees on each class up to the following limits:
| Class A | | | 0.35 | % | |
| Class I | | | N/A | | |
In the case the Fund or a class of shares of the Fund is closed to new investors or investments, the Fund is authorized to pay 12b-1 fees for past sales and distribution efforts and present and past investor services.
Administrative services: The Fund has entered into an agreement with TFS for financial and legal fund administration services. As of January 1, 2005 the Fund pays TFS an annual fee of 0.02% of ANA. Prior to January 1, 2005 the Fund paid TFS an annual fee of 0.015% of ANA. The Legal fees on the Statement of Operations are for fees paid to external legal counsel.
Transfer agent fees: The Fund pays TFS an annual per-account charge for each open and closed account. The Fund paid TFS $2 for the period from inception through October 31, 2005.
NOTE 3. INVESTMENT TRANSACTIONS
The cost of securities purchased and proceeds from securities sold (excluding short-term securities) for the period from inception through October 31, 2005, were as follows:
| Purchases of securities: | |
| Long-Term | | $ | 406,005 | | |
| U.S. Government | | | – | | |
| Proceeds from maturities and sales of securities: | |
| Long-Term | | | 132,243 | | |
| U.S. Government | | | – | | |
NOTE 4. FEDERAL INCOME TAX MATTERS
The Fund has not made any provision for federal income or excise taxes due to its policy to distribute all of its taxable income and capital gains to its shareholders and otherwise qualify as a regulated investment company under Subchapter M of the Internal Revenue Code. Income and capital gain distributions are determined in accordance with income tax regulations, which may differ from GAAP. These differences are primarily due to differing treatment for items including, but not limited to wash sales.
Therefore, distributions determined in accordance with tax regulations may differ significantly in amount or character from net investment income and realized gains for financial reporting purposes. Financial reporting records are adjusted for permanent book/tax differences to reflect tax character. Financial records are not adjusted for temporary differences. These reclassifications are as follows:
| Undistributed net investment income (loss) | | $ | (386 | ) | |
Undistributed net realized gain (loss) from investment
securities | | | 386 | | |
The tax basis components of distributable earnings as of October 31, 2005, are as follows:
| Undistributed Ordinary Income | | $ | 11,435 | | |
| Undistributed Long-term Capital Gains | | $ | 225 | | |
| Capital Loss Carryforward | | $ | – | | |
| Net Unrealized Appreciation (Depreciation) | | $ | 33,582 | * | |
* Amount includes unrealized appreciation (depreciation) from foreign currency.
The aggregate cost of investments and composition of unrealized appreciation (depreciation) for federal income tax purposes as of October 31, 2005, are as follows:
| Federal Tax Cost Basis | | $ | 315,472 | | |
| Unrealized Appreciation | | $ | 39,233 | | |
| Unrealized (Depreciation) | | | (5,635 | ) | |
| Net Unrealized Appreciation (Depreciation) | | $ | 33,598 | | |
Transamerica IDEX Mutual Funds
Annual Report 2005
13
TA IDEX Evergreen International Small Cap
NOTES TO FINANCIAL STATEMENTS (continued)
At October 31, 2005
(all amounts in thousands)
NOTE 5. REGULATORY PROCEEDINGS
There continues to be significant federal and state regulatory activity relating to financial services companies, particularly mutual fund companies and their investment advisers. As part of an ongoing investigation regarding potential market timing, recordkeeping and trading compliance issues and matters affecting the Fund's investment adviser, TFAI, and certain affiliates and former employees of TFAI, the SEC staff has indicated that it is likely to take some action against TFAI and certain of its affiliates at the conclusion of the investigation. The potential timing and the scope of any such action is difficult to predict. Although the impact of any action brought against TFAI and/or its affiliates is difficult to assess at the present time, the Fund currently believes that the likelihood that any such action will have a material adverse impact on it is remote. It is important to note that the Fund is not aware of any allega tion of wrongdoing against it and its Board at the time this annual report is printed. Although it is not anticipated that these developments will have an adverse impact on the Fund, there can be no assurance at this time. TFAI and its affiliates are actively working with the SEC in regard to this matter; however, the exact resolution cannot be determined at this time. TFAI will take such actions that it deems necessary or appropriate to continue providing management services to the Fund and to bring all matters to an appropriate conclusion.
TFAI and/or its affiliates, and not the Fund, will bear the costs regarding these regulatory matters.
Transamerica IDEX Mutual Funds
Annual Report 2005
14
Report of Independent Registered Certified Public Accounting Firm
To the Board of Trustees and Shareholders of
TA IDEX Evergreen International Small Cap
In our opinion, the accompanying statement of assets and liabilities, including the schedule of investments, and the related statements of operations and of changes in net assets and the financial highlights present fairly, in all material respects, the financial position of TA IDEX Evergreen International Small Cap (the "Fund") (one of the portfolios constituting the Transamerica IDEX Mutual Funds) at October 31, 2005, the results of its operations , the changes in its net assets and the financial highlights for the period November 8, 2004 (commencement of operations) through October 31, 2005, in conformity with accounting principles generally accepted in the United States of America. These financial statements and financial highlights (hereafter referred to as "financial statements") are the responsibility of the Fund's management; our responsibility is to express an opinion on these financial statements based on our audit. We conducted our audit of these financial statements in accordance with the standards of the Public Company Accounting Oversight Board (United States). Those standards require that we plan and perform the audit to obtain reasonable assurance about whether the financial statements are free of material misstatement. An audit includes examining, on a test basis, evidence supporting the amounts and disclosures in the financial statements, assessing the accounting principles used and significant estimates made by management, and evaluating the overall financial statement presentation. We believe that our audit, which included confirmation of securities at October 31, 2005 by correspondence with the custodian and brokers, provide a reasonable basis for our opinion.

December 22, 2005
Transamerica IDEX Mutual Funds
Annual Report 2005
15
TA IDEX Evergreen International Small Cap (unaudited)
A discussion regarding the basis of Transamerica IDEX Mutual Funds' Board of Trustees' approval of the fund's advisory arrangements will be available in the fund's semi-annual report for the period ending April 30, 2006.
Transamerica IDEX Mutual Funds
Annual Report 2005
16
TA IDEX Federated Tax Exempt
MARKET ENVIRONMENT
During the period, the AAA-rated general obligation tax exempt yield curve rose while also flattening significantly, with five- and ten-year rates increasing by 81 and 52 basis points, respectively. The 30-year AAA general obligation tax-exempt rate essentially remained the same. It actually decreased by only 1 basis point. As a result, the municipal yield curve flattened by 82 basis points between the five-year and 30-year maturities. Financial markets appeared to continue to focus on the tightening of short-term interest rates by the Federal Reserve Board. The price of oil and the value of the dollar relative to other currencies added to market volatility. Inflation expectations, as always, continued to be the primary predictor of the behavior of long-term interest rates.
PERFORMANCE
For the year ended October 31, 2005, TA IDEX Federated Tax Exempt, Class A returned 1.33%. By comparison its benchmark, the Lehman Brothers Municipal Bond Index returned 2.54%.
STRATEGY REVIEW
During the third quarter, the most opportunistic sectors of the municipal market continued to be the yield sectors, or the sectors of the market that represented the most attractive yields available to investors. This included the revenue bond sectors such as hospitals, resource recovery and higher education. The portfolio benefited from its holdings of hospital and industrial development bonds during the quarter. The portfolio's "BBB"-rated debt also had a positive impact on performance during the quarter. The demand for yield by investors appears to have been the impetus for "BBB"-rated debt to outperform over the other investment grade rating categories.
During the period, the following primary investment strategies were utilized: We continued to believe that income likely would be the primary driver of total return. Strategy focused on making selective purchases of lower investment grade (BBB, A) credits. Credit spreads were wide enough to provide the opportunity for attractive potential returns. Revenue bonds with dedicated revenue streams were emphasized. Revenue bond sectors, such as hospital, higher-education and industrial development bonds also were emphasized. Premium coupons were emphasized because of their lower volatility and sensitivity to changes in interest rates as a result of the income cushion they provide.
J. Scott Albrecht, CFA
Mary Jo Ochson, CFA
Co-Fund Managers
Federated Investment Management Company
Transamerica IDEX Mutual Funds
Annual Report 2005
1
TA IDEX Federated Tax Exempt
Comparison of change in value of $10,000 investment in Class A shares and its comparative index.
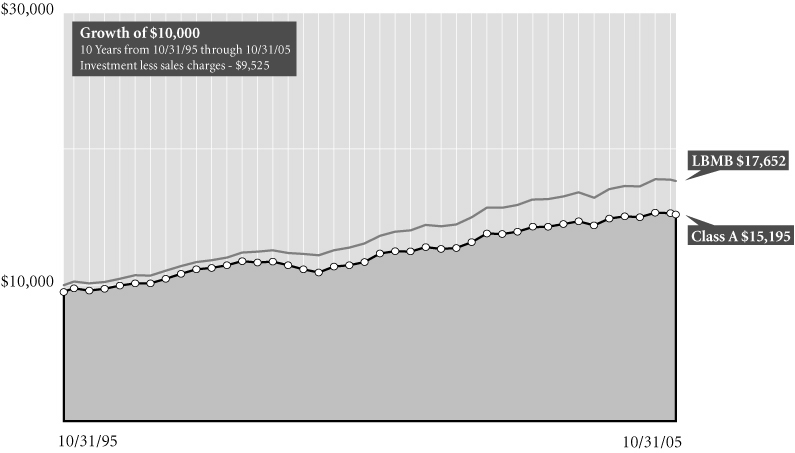
Average Annual Total Return for Periods Ended 10/31/05
| | | 1 year | | 5 years | | 10 years | | From
Inception | | Inception
Date | |
| Class A (NAV) | | | 1.33 | % | | | 5.06 | % | | | 4.78 | % | | | 6.66 | % | | 4/1/85 | |
| Class A (POP) | | | (3.49 | )% | | | 4.04 | % | | | 4.27 | % | | | 6.41 | % | | 4/1/85 | |
| LBMB1 | | | 2.54 | % | | | 5.98 | % | | | 5.85 | % | | | 7.92 | % | | 4/1/85 | |
| Class B (NAV) | | | 0.72 | % | | | 4.39 | % | | | 4.11 | % | | | 4.21 | % | | 10/1/95 | |
| Class B (POP) | | | (4.18 | )% | | | 4.22 | % | | | 4.11 | % | | | 4.21 | % | | 10/1/95 | |
| Class C (NAV) | | | 0.69 | % | | | – | | | | – | | | | 3.15 | % | | 11/11/02 | |
| Class C (POP) | | | (0.28 | )% | | | – | | | | – | | | | 3.15 | % | | 11/11/02 | |
| Class M (NAV) | | | 1.11 | % | | | 4.80 | % | | | 4.51 | % | | | 4.40 | % | | 10/1/93 | |
| Class M (POP) | | | (0.86 | )% | | | 4.59 | % | | | 4.41 | % | | | 4.31 | % | | 10/1/93 | |
NOTES
1 The Lehman Brothers Municipal Bond (LBMB) Index is an unmanaged index used as a general measure of market performance. Calculations assume dividends and capital gains are reinvested and do not include any managerial expenses. From inception calculation is based on life of Class A shares. Source: Standard & Poor's Micropal®© Micropal, Inc. 2005 – 1-800-596-5323 – http://www.funds-sp.com.
The performance data presented represents past performance, future results may vary. Performance data does not reflect the deduction of taxes that would be paid on fund distributions or the redemption of fund shares. Investment return and principal value will fluctuate so that an investor's shares, when redeemed, may be worth more or less than their original cost. Current performance may be lower or higher than performance quoted. Please see www.transamericaidex.com for performance data current to the most recent month-end.
Public Offering Price (POP) returns include the reinvestment of dividends and capital gains and reflect the maximum sales charge of 4.75% for A shares and 1% for M shares or the maximum applicable contingent deferred sales charge (5% in the 1st year, decreasing to 0% after 6 years) for Class B shares and 1% (during the first 12 months) for Class C shares. Shares purchased prior to March 1, 2004 are subject to a maximum applicable contingent deferred sales charge (5% in the 1st year, decreasing to 0% after 7 years) for Class B shares and (2% in the 1st year, decreasing to 0% after 2 years) for Class C shares. Net Asset Value (NAV) returns include the reinvestment of dividends and capital gains but do not reflect any sales charges.
Income derived from this fund may be subject to federal alternative minimum tax, as well as state and/or local taxes.
This material must be preceded or accompanied by a current prospectus, which includes specific contents regarding the investment objectives and policies of this fund.
Transamerica IDEX Mutual Funds
Annual Report 2005
2
TA IDEX Federated Tax Exempt
UNDERSTANDING YOUR FUND'S EXPENSES
(unaudited)
SHAREHOLDER EXPENSES
Fund shareholders may incur two types of costs: (1) transaction costs, including sales charges (loads) on purchases, contingent deferred sales charges on redemptions and redemption fees; and (2) ongoing costs, including management fees, 12b-1 distribution and service fees, and other fund expenses.
The following Example is intended to help you understand your ongoing costs (in dollars and cents) of investing in a Fund and to compare these costs with the ongoing costs of investing in other funds.
The Example is based on an investment of $1,000 invested at May 1, 2005 and held for the entire period until October 31, 2005.
ACTUAL EXPENSES
The first line in the table below provides information about actual account values and actual expenses. You may use the information in this line, together with the amount you invested, to estimate the expenses that you paid over the period. Simply divide your account value by $1,000 (for example, an $8,600 account value divided by $1,000 = 8.6), then multiply the result by the number in the first line of your Fund under the heading entitled "Expenses Paid During Period" to estimate the expenses you paid on your account during this period. If your account is an IRA, your expenses could have included a $15 annual fee. The amount of any fee paid through your account would increase the estimate of expenses you paid during the period and decrease your ending account value.
HYPOTHETICAL EXAMPLE FOR COMPARISON PURPOSES
The second line in the table below provides information about hypothetical account values and hypothetical expenses based on the Fund's actual expense ratio and an assumed rate of return of 5% per year before expenses, which is not the Fund's actual return. The hypothetical account values and expenses may not be used to estimate the actual ending account balance or expenses you paid for the period. You may use this information to compare the ongoing costs of investing in your Fund and other funds. To do so, compare this 5% hypothetical example with the 5% hypothetical examples that appear in the shareholder reports of the other funds. As in the case of the actual expense example, if your account is subject to an IRA fee, the amount of the fee paid through your account would increase the hypothetical expenses you would have paid during the period and decrease the hypothetical ending account value.
Please note that the expenses shown in the table are meant to highlight your ongoing costs only and do not reflect any transactional costs, such as sales charges, redemption fees, brokerage commissions paid on purchases and sales of fund shares. Therefore, the second line under the Fund in the table is useful in comparing ongoing costs only, and will not help you determine the relative total costs of owning different funds. If any of these transaction costs were included, your costs would be higher. The expenses shown in the table do not reflect any fees that may be charged to you by brokers, financial intermediaries or other financial institutions.
| | | Beginning
Account
Value | | Ending
Account
Value | | Annualized
Expense
Ratio | | Expenses Paid
During Period (a) | |
| Class A | |
| Actual | | $ | 1,000.00 | | | $ | 1,002.10 | | | | 1.47 | % | | $ | 7.42 | | |
| Hypothetical (b) | | | 1,000.00 | | | | 1,017.80 | | | | 1.47 | | | | 7.48 | | |
| Class B | |
| Actual | | | 1,000.00 | | | | 999.40 | | | | 2.09 | | | | 10.53 | | |
| Hypothetical (b) | | | 1,000.00 | | | | 1,014.67 | | | | 2.09 | | | | 10.61 | | |
| Class C | |
| Actual | | | 1,000.00 | | | | 999.10 | | | | 2.01 | | | | 10.13 | | |
| Hypothetical (b) | | | 1,000.00 | | | | 1,015.07 | | | | 2.01 | | | | 10.21 | | |
| Class M | |
| Actual | | | 1,000.00 | | | | 1,001.30 | | | | 1.57 | | | | 7.92 | | |
| Hypothetical (b) | | | 1,000.00 | | | | 1,017.29 | | | | 1.57 | | | | 7.98 | | |
(a) Expenses are calculated using each Fund's annualized expense ratio (as disclosed in the table), multiplied by the average account value for the period, multiplied by number of days in the period (184 days), and divided by the number of days in the year (365 days).
(b) 5% return per year before expenses.
GRAPHICAL PRESENTATION OF SCHEDULE OF INVESTMENTS
By Municipal Bond Type
At October 31, 2005
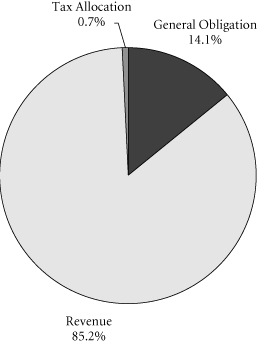
This chart shows the percentage breakdown by municipal bond type of the Fund's total investment securities.
Transamerica IDEX Mutual Funds
Annual Report 2005
3
TA IDEX Federated Tax Exempt
SCHEDULE OF INVESTMENTS
At October 31, 2005
(all amounts except share amounts in thousands)
| | | Principal | | Value | |
| LONG-TERM MUNICIPAL BONDS ( 99.4%) | |
| Alabama (2.6%) | |
Alabama Water Pollution Control Authority,
Revenue Bonds,
5.50%, due 08/15/2023 | | $ | 500 | | | $ | 538 | | |
| California (3.3%) | |
Southern California Logistics
Airport Authority,
5.00%, due 12/01/2035 | | | 150 | | | | 151 | | |
Torrance, CA, (Torrance Memorial
Medical Center), Revenue Bonds, Series A,
6.00%, due 06/01/2022 | | | 500 | | | | 546 | | |
| Colorado (2.4%) | |
Colorado Health Facilities Authority,
(Covenant Retirement Communities, Inc.),
5.25%, due 12/01/2025 | | | 500 | | | | 509 | | |
| District of Columbia (2.7%) | |
District of Columbia Water & Sewer Authority,
Revenue Bonds,
5.50%, due 10/01/2017 | | | 500 | | | | 564 | | |
| Illinois (10.7%) | |
Illinois Educational Facilities Authority,
(Loyola University), Revenue Bonds, Series A,
5.00%, due 07/01/2026 | | | 500 | | | | 506 | | |
Illinois State Partnership, Department of
Central Management, Public Improvements,
General Obligations Bonds,
5.65%, due 07/01/2017 | | | 1,000 | | | | 1,034 | | |
McHenry County, IL, Community Unit School
District No. 200, Unrefunded, Series A,
5.85%, due 01/01/2016 | | | 230 | | | | 241 | | |
Southwestern Illinois Development Authority,
Revenue Bonds, Zero Coupon,
due 11/01/2024 | | | 1,200 | | | | 469 | | |
| Indiana (9.0%) | |
Indiana Health Facility Financing Authority,
(Community Foundation Northwest, IN),
Revenue Bonds,
6.25%, due 03/01/2025 | | | 300 | | | | 320 | | |
Indiana State Development Finance Authority,
(USX Corp./Marathon Oil Co.),
Revenue Bonds,
5.25%, due 12/01/2022 | | | 500 | | | | 537 | | |
Indianapolis, IN, (Distribution System),
Revenue Bonds, Series A,
5.25%, due 08/15/2012 | | | 1,000 | | | | 1,046 | | |
| | | Principal | | Value | |
| Louisiana (2.5%) | |
Sabine River Authority, (International
Paper Co.), Water Facilities, Revenue Bonds,
6.20%, due 02/01/2025 | | $ | 500 | | | $ | 535 | | |
| Massachusetts (4.8%) | |
Massachusetts State Development
Finance Agency, (Massachusetts College of
Pharmacy & Allied Health Services),
Revenue Bonds,
6.38%, due 07/01/2023 | | | 500 | | | | 552 | | |
Massachusetts State Health & Educational
Facilities Authority, (Emerson Hospital),
5.00%, due 08/15/2025 | | | 450 | | | | 459 | | |
| Michigan (5.3%) | |
Cornell Township, MI, Economic
Development Corp.,
(MeadWestvaco/Mead Corp.),
Revenue Bonds,
5.88%, due 05/01/2018 | | | 500 | | | | 560 | | |
Michigan Municipal Bond Authority,
Revenue Bonds,
5.50%, due 10/01/2022 | | | 500 | | | | 547 | | |
| Mississippi (2.9%) | |
Lowndes County, MS, Solid Waste Disposal &
Pollution Control, (Weyerhaeuser Co.),
Revenue Bonds,
6.70%, due 04/01/2022 | | | 500 | | | | 603 | | |
| Nevada (2.0%) | |
Clark County, NV, Industrial Development,
(Southwest Gas Corp.), Revenue Bonds,*
5.45%, due 03/01/2038 | | | 400 | | | | 422 | | |
| New Hampshire (0.4%) | |
New Hampshire State Housing Finance Authority,
Single Family Mortgage,
Revenue Bonds, Series C,
6.13%, due 01/01/2020 | | | 75 | | | | 75 | | |
| New Jersey (1.0%) | |
New Jersey Economic Development Authority,
(Winchester Gardens/Marcus L Ward Home),
Revenue Bonds, Series A,
5.80%, due 11/01/2031 | | | 200 | | | | 206 | | |
| New Mexico (0.7%) | |
New Mexico Mortgage Finance Authority,
Revenue Bonds,
6.05%, due 09/01/2021 | | | 135 | | | | 140 | | |
The notes to the financial statements are an integral part of this report.
Transamerica IDEX Mutual Funds
Annual Report 2005
4
TA IDEX Federated Tax Exempt
SCHEDULE OF INVESTMENTS (continued)
At October 31, 2005
(all amounts except share amounts in thousands)
| | | Principal | | Value | |
| New York (11.8%) | |
New York State Mortgage Agency,
Revenue Bonds, Series 95,
5.50%, due 10/01/2017 | | $ | 500 | | | $ | 520 | | |
New York, NY, City Transitional Finance
Authority, Revenue Bonds,
5.50%, due 02/15/2019 | | | 1,000 | | | | 1,084 | | |
United Nations Development Corp.,
Revenue Bonds, Series A,
5.25%, due 07/01/2024 | | | 250 | | | | 259 | | |
Warwick Valley Central School District, NY,
General Obligations Bonds,
5.50%, due 01/15/2017 | | | 570 | | | | 622 | | |
| North Carolina (3.2%) | |
North Carolina Medical Care Commission,
(Arc of North Carolina),
5.50%, due 10/01/2024 | | | 240 | | | | 246 | | |
North Carolina State Housing Finance
Agency, Revenue Bonds,
5.25%, due 01/01/2022 | | | 415 | | | | 425 | | |
| North Dakota (1.0%) | |
North Dakota State Housing Finance Agency,
Revenue Bonds, Series C,
6.00%, due 07/01/2020 | | | 210 | | | | 211 | | |
| Ohio (6.5%) | |
Cleveland, OH, Municipal School District,
5.25%, due 12/01/2024 | | | 300 | | | | 320 | | |
Ohio State Air Quality Development Authority,
(Cleveland Electric Illumination),
Revenue Bonds,
6.00%, due 12/01/2013 | | | 500 | | | | 518 | | |
Ohio State, General Obligations Bonds, Series A,
5.38%, due 09/15/2017 | | | 500 | | | | 540 | | |
| Pennsylvania (2.6%) | |
Pennsylvania State Higher Educational Facilities
Authority, (UPMC Health System),
Revenue Bonds,
6.00%, due 01/15/2022 | | | 500 | | | | 542 | | |
| Rhode Island (7.6%) | |
Providence, RI, Public Building Authority,
Revenue Bonds, Series A,
5.70%, due 12/15/2015 | | | 500 | | | | 552 | | |
| | | Principal | | Value | |
| Rhode Island (continued) | |
Rhode Island Clean Water Finance Agency,
(Triton Ocean LLC), Revenue Bonds,
5.80%, due 09/01/2022 | | $ | 1,000 | | | $ | 1,053 | | |
| Texas (5.8%) | |
Kingsbridge, TX, Municipal Utility District,
General Obligations Bonds,
5.38%, due 03/01/2015 | | | 500 | | | | 513 | | |
Port Houston Authority, Harris County,
General Obligation Bonds, Series A,
5.50%, due 10/01/2024 | | | 500 | | | | 544 | | |
Sabine River Authority, (TXU Energy Co. LLC),
Revenue Bonds, Series A,*
5.80%, due 07/01/2022 | | | 165 | | | | 176 | | |
| Washington (5.2%) | |
Energy Northwest, WA, Electric,
(Bonneville Power Administration),
Revenue Bonds, Series A,
5.75%, due 07/01/2018 | | | 500 | | | | 552 | | |
University of Washington, Student Facilities
Improvements, Revenue Bonds,
5.88%, due 06/01/2016 | | | 500 | | | | 554 | | |
| Wyoming (5.4%) | |
Wyoming State Farm Loan Board,
Capital Facilities, Revenue Bonds,
5.75%, due 10/01/2020 | | | 1,000 | | | | 1,140 | | |
| Total Long-Term Municipal Bonds (cost: $19,735) | | | | | | | 20,931 | | |
| SHORT-TERM MUNICIPAL BONDS (0.9%) | |
New York, NY,*
2.13%, due 08/01/2020 | | | 200 | | | | 200 | | |
| Total Short-Term Municipal Bonds (cost: $200) | | | | | | | 200 | | |
| Total Investment Securities (cost: $19,935) | | | | | | $ | 21,131 | | |
| SUMMARY: | |
| Investment securities, at value | | | 100.3 | % | | $ | 21,131 | | |
| Liabilities in excess of other assets | | | (0.3 | )% | | | (68 | ) | |
| Net assets | | | 100.0 | % | | $ | 21,063 | | |
NOTES TO SCHEDULE OF INVESTMENTS:
* Floating or variable rate note. Rate is listed as of October 31, 2005.
The notes to the financial statements are an integral part of this report.
Transamerica IDEX Mutual Funds
Annual Report 2005
5
TA IDEX Federated Tax Exempt
STATEMENT OF ASSETS AND LIABILITIES
At October 31, 2005
(all amounts except share amounts in thousands)
| Assets: | |
| Investment securities, at value (cost: $19,935) | | $ | 21,131 | | |
| Cash | | | 98 | | |
| Receivables: | |
| Shares of beneficial interest sold | | | 2 | | |
| Interest | | | 267 | | |
| Other | | | 5 | | |
| | | | 21,503 | | |
| Liabilities: | |
| Accounts payable and accrued liabilities: | |
| Shares of beneficial interest redeemed | | | 391 | | |
| Management and advisory fees | | | 8 | | |
| Distribution and service fees | | | 13 | | |
| Transfer agent fees | | | 4 | | |
| Other | | | 24 | | |
| | | | 440 | | |
| Net Assets | | $ | 21,063 | | |
| Net Assets Consist of: | |
Shares of beneficial interest, unlimited shares
authorized, no par value | | $ | 19,998 | | |
| Undistributed net investment income (loss) | | | 31 | | |
Accumulated net realized gain (loss) from investment
securities and futures contracts | | | (162 | ) | |
Net unrealized appreciation (depreciation) on
investment securities | | | 1,196 | | |
| Net Assets | | $ | 21,063 | | |
| Net Assets by Class: | |
| Class A | | $ | 11,346 | | |
| Class B | | | 5,403 | | |
| Class C | | | 3,157 | | |
| Class M | | | 1,157 | | |
| Shares Outstanding: | |
| Class A | | | 974 | | |
| Class B | | | 464 | | |
| Class C | | | 272 | | |
| Class M | | | 100 | | |
| Net Asset Value Per Share: | |
| Class A | | $ | 11.64 | | |
| Class B | | | 11.65 | | |
| Class C | | | 11.62 | | |
| Class M | | | 11.59 | | |
| Maximum Offering Price Per Share (a): | |
| Class A | | $ | 12.22 | | |
| Class M | | | 11.71 | | |
(a) Includes the maximum selling commission (represented as a percentage of offering price) which is reduced on certain levels of sales as set forth in the Prospectus. Net asset value per share for Classes B and C shares represents offering price. The redemption price for Classes B, C and M shares equals net asset value less any applicable contingent deferred sales charge.
STATEMENT OF OPERATIONS
For the year ended October 31, 2005
(all amounts in thousands)
| Investment Income: | |
| Interest | | $ | 1,413 | | |
| Expenses: | |
| Management and advisory fees | | | 172 | | |
| Distribution and service fees: | |
| Class A | | | 57 | | |
| Class B | | | 68 | | |
| Class C | | | 43 | | |
| Class M | | | 8 | | |
| Transfer agent fees: | |
| Class A | | | 16 | | |
| Class B | | | 8 | | |
| Class C | | | 4 | | |
| Class M | | | 2 | | |
| Printing and shareholder reports | | | 5 | | |
| Custody fees | | | 25 | | |
| Administration fees | | | 5 | | |
| Legal fees | | | 2 | | |
| Audit fees | | | 27 | | |
| Trustees fees | | | 1 | | |
| Registration fees: | |
| Class A | | | 11 | | |
| Class B | | | 8 | | |
| Class C | | | 12 | | |
| Other | | | 1 | | |
| Total expenses | | | 475 | | |
| Less: | |
| Reimbursement of class expenses: | |
| Class B | | | (5 | ) | |
| Class C | | | (8 | ) | |
| Total reimbursed expenses | | | (13 | ) | |
| Net expenses | | | 462 | | |
| Net Investment Income (Loss) | | | 951 | | |
| Net Realized Gain (Loss) from: | |
| Investment securities | | | 468 | | |
| Futures contracts | | | (43 | ) | |
| | | | 425 | | |
Increase (decrease) in unrealized appreciation
(depreciation) on investment securities | | | (1,021 | ) | |
| Net Gain (Loss) on Investment Securities | | | (596 | ) | |
Net Increase (Decrease) in Net Assets Resulting
from Operations | | $ | 355 | | |
The notes to the financial statements are an integral part of this report.
Transamerica IDEX Mutual Funds
Annual Report 2005
6
TA IDEX Federated Tax Exempt
STATEMENTS OF CHANGES IN NET ASSETS
For the years ended
(all amounts in thousands)
| | | October 31,
2005 | | October 31,
2004 | |
| Increase (Decrease) In Net Assets From: | |
| Operations: | |
| Net investment income (loss) | | $ | 951 | | | $ | 1,137 | | |
Net realized gain (loss) from
investment securities and
futures contracts | | | 425 | | | | 327 | | |
Net unrealized appreciation
(depreciation) on investment
securities | | | (1,021 | ) | | | 211 | | |
| | | | 355 | | | | 1,675 | | |
| Distributions to Shareholders: | |
| From net investment income: | |
| Class A | | | (570 | ) | | | (692 | ) | |
| Class B | | | (185 | ) | | | (266 | ) | |
| Class C | | | (128 | ) | | | (95 | ) | |
| Class C2 | | | – | | | | (81 | ) | |
| Class M | | | (48 | ) | | | (56 | ) | |
| | | | (931 | ) | | | (1,190 | ) | |
| Capital Share Transactions: | |
| Proceeds from shares sold: | |
| Class A | | | 497 | | | | 1,066 | | |
| Class B | | | 675 | | | | 825 | | |
| Class C | | | 277 | | | | 1,802 | | |
| Class C2 | | | – | | | | 634 | | |
| Class M | | | 32 | | | | 9 | | |
| | | | 1,481 | | | | 4,336 | | |
Dividends and distributions
reinvested: | |
| Class A | | | 440 | | | | 526 | | |
| Class B | | | 131 | | | | 168 | | |
| Class C | | | 70 | | | | 60 | | |
| Class C2 | | | – | | | | 31 | | |
| Class M | | | 43 | | | | 48 | | |
| | | | 684 | | | | 833 | | |
| Cost of shares redeemed: | |
| Class A | | | (6,509 | ) | | | (3,582 | ) | |
| Class B | | | (2,871 | ) | | | (3,427 | ) | |
| Class C | | | (2,026 | ) | | | (1,927 | ) | |
| Class C2 | | | – | | | | (1,523 | ) | |
| Class M | | | (267 | ) | | | (565 | ) | |
| | | | (11,673 | ) | | | (11,024 | ) | |
| Class level exchanges: | |
| Class C | | | – | | | | 3,266 | | |
| Class C2 | | | – | | | | (3,266 | ) | |
| | | | – | | | | – | | |
| | | | (9,508 | ) | | | (5,855 | ) | |
| Net increase (decrease) in net assets | | | (10,084 | ) | | | (5,370 | ) | |
| | | October 31,
2005 | | October 31,
2004 | |
| Net Assets: | |
| Beginning of year | | $ | 31,147 | | | $ | 36,517 | | |
| End of year | | $ | 21,063 | | | $ | 31,147 | | |
Undistributed Net Investment Income
(Loss) | | $ | 31 | | | $ | 12 | | |
| Share Activity: | |
| Shares issued: | |
| Class A | | | 41 | | | | 90 | | |
| Class B | | | 57 | | | | 70 | | |
| Class C | | | 24 | | | | 151 | | |
| Class C2 | | | – | | | | 53 | | |
| Class M | | | 3 | | | | 1 | | |
| | | | 125 | | | | 365 | | |
Shares issued–reinvested from
distributions: | |
| Class A | | | 37 | | | | 45 | | |
| Class B | | | 11 | | | | 14 | | |
| Class C | | | 6 | | | | 5 | | |
| Class C2 | | | – | | | | 3 | | |
| Class M | | | 4 | | | | 4 | | |
| | | | 58 | | | | 71 | | |
| Shares redeemed: | |
| Class A | | | (554 | ) | | | (304 | ) | |
| Class B | | | (243 | ) | | | (291 | ) | |
| Class C | | | (172 | ) | | | (165 | ) | |
| Class C2 | | | – | | | | (130 | ) | |
| Class M | | | (23 | ) | | | (49 | ) | |
| | | | (992 | ) | | | (939 | ) | |
| Class level exchanges: | |
| Class C | | | – | | | | 284 | | |
| Class C2 | | | – | | | | (284 | ) | |
| | | | – | | | | – | | |
Net increase (decrease) in shares
outstanding: | |
| Class A | | | (476 | ) | | | (169 | ) | |
| Class B | | | (175 | ) | | | (207 | ) | |
| Class C | | | (142 | ) | | | 275 | | |
| Class C2 | | | – | | | | (358 | ) | |
| Class M | | | (16 | ) | | | (44 | ) | |
| | | | (809 | ) | | | (503 | ) | |
The notes to the financial statements are an integral part of this report.
Transamerica IDEX Mutual Funds
Annual Report 2005
7
TA IDEX Federated Tax Exempt
FINANCIAL HIGHLIGHTS
| | | | | For a share of beneficial interest outstanding throughout each period | |
| | | | | Net Asset | | Investment Operations | | Distributions | | Net Asset | |
| | | For the
Period
Ended (d)(g) | | Value,
Beginning
of Period | | Net
Investment
Income (Loss) | | Net Realized
and Unrealized
Gain (Loss) | | Total
Operations | | From Net
Investment
Income | | From Net
Realized
Gains | | Total
Distributions | | Value,
End
of Period | |
| Class A | | 10/31/2005 | | $ | 11.90 | | | $ | 0.42 | | | $ | (0.27 | ) | | $ | 0.15 | | | $ | (0.41 | ) | | $ | – | | | $ | (0.41 | ) | | $ | 11.64 | | |
| | | 10/31/2004 | | | 11.70 | | | | 0.43 | | | | 0.22 | | | | 0.65 | | | | (0.45 | ) | | | – | | | | (0.45 | ) | | | 11.90 | | |
| | | 10/31/2003 | | | 11.51 | | | | 0.41 | | | | 0.19 | | | | 0.60 | | | | (0.41 | ) | | | – | | | | (0.41 | ) | | | 11.70 | | |
| | | 10/31/2002 | | | 11.44 | | | | 0.38 | | | | 0.14 | | | | 0.52 | | | | (0.45 | ) | | | – | | | | (0.45 | ) | | | 11.51 | | |
| | | 10/31/2001 | | | 10.91 | | | | 0.40 | | | | 0.56 | | | | 0.96 | | | | (0.43 | ) | | | – | | | | (0.43 | ) | | | 11.44 | | |
| Class B | | 10/31/2005 | | | 11.89 | | | | 0.35 | | | | (0.27 | ) | | | 0.08 | | | | (0.32 | ) | | | – | | | | (0.32 | ) | | | 11.65 | | |
| | | 10/31/2004 | | | 11.69 | | | | 0.35 | | | | 0.22 | | | | 0.57 | | | | (0.37 | ) | | | – | | | | (0.37 | ) | | | 11.89 | | |
| | | 10/31/2003 | | | 11.51 | | | | 0.34 | | | | 0.17 | | | | 0.51 | | | | (0.33 | ) | | | – | | | | (0.33 | ) | | | 11.69 | | |
| | | 10/31/2002 | | | 11.44 | | | | 0.30 | | | | 0.11 | | | | 0.41 | | | | (0.34 | ) | | | – | | | | (0.34 | ) | | | 11.51 | | |
| | | 10/31/2001 | | | 10.90 | | | | 0.34 | | | | 0.56 | | | | 0.90 | | | | (0.36 | ) | | | – | | | | (0.36 | ) | | | 11.44 | | |
| Class C | | 10/31/2005 | | | 11.89 | | | | 0.35 | | | | (0.27 | ) | | | 0.08 | | | | (0.35 | ) | | | – | | | | (0.35 | ) | | | 11.62 | | |
| | | 10/31/2004 | | | 11.69 | | | | 0.35 | | | | 0.22 | | | | 0.57 | | | | (0.37 | ) | | | – | | | | (0.37 | ) | | | 11.89 | | |
| | | 10/31/2003 | | | 11.59 | | | | 0.33 | | | | 0.10 | | | | 0.43 | | | | (0.33 | ) | | | – | | | | (0.33 | ) | | | 11.69 | | |
| Class M | | 10/31/2005 | | | 11.89 | | | | 0.39 | | | | (0.26 | ) | | | 0.13 | | | | (0.43 | ) | | | – | | | | (0.43 | ) | | | 11.59 | | |
| | | 10/31/2004 | | | 11.70 | | | | 0.40 | | | | 0.21 | | | | 0.61 | | | | (0.42 | ) | | | – | | | | (0.42 | ) | | | 11.89 | | |
| | | 10/31/2003 | | | 11.51 | | | | 0.38 | | | | 0.19 | | | | 0.57 | | | | (0.38 | ) | | | – | | | | (0.38 | ) | | | 11.70 | | |
| | | 10/31/2002 | | | 11.44 | | | | 0.36 | | | | 0.09 | | | | 0.45 | | | | (0.38 | ) | | | – | | | | (0.38 | ) | | | 11.51 | | |
| | | 10/31/2001 | | | 10.91 | | | | 0.40 | | | | 0.53 | | | | 0.93 | | | | (0.40 | ) | | | – | | | | (0.40 | ) | | | 11.44 | | |
| | | | | | | Ratios/Supplemental Data | |
| | | For the
Period | | Total | | Net Assets,
End of
Period | | Ratio of Expenses
to Average
Net Assets (a) | | Net Investment
Income (Loss)
to Average | | Portfolio
Turnover | |
| | | Ended (g) | | Return (c) | | (000's) | | Net (e) | | Total (f) | | Net Assets (a) | | Rate (b) | |
| Class A | | 10/31/2005 | | | 1.33 | % | | $ | 11,346 | | | | 1.35 | % | | | 1.35 | % | | | 3.57 | % | | | 30 | % | |
| | | 10/31/2004 | | | 5.61 | | | | 17,244 | | | | 1.35 | | | | 1.38 | | | | 3.63 | | | | 16 | | |
| | | 10/31/2003 | | | 5.26 | | | | 18,948 | | | | 1.35 | | | | 1.52 | | | | 3.53 | | | | 22 | | |
| | | 10/31/2002 | | | 4.26 | | | | 20,469 | | | | 1.35 | | | | 1.46 | | | | 3.63 | | | | 55 | | |
| | | 10/31/2001 | | | 8.99 | | | | 23,190 | | | | 1.35 | | | | 1.48 | | | | 3.80 | | | | 35 | | |
| Class B | | 10/31/2005 | | | 0.72 | | | | 5,403 | | | | 2.00 | | | | 2.08 | | | | 2.93 | | | | 30 | | |
| | | 10/31/2004 | | | 4.93 | | | | 7,597 | | | | 2.00 | | | | 2.03 | | | | 2.98 | | | | 16 | | |
| | | 10/31/2003 | | | 4.48 | | | | 9,897 | | | | 2.00 | | | | 2.17 | | | | 2.88 | | | | 22 | | |
| | | 10/31/2002 | | | 3.63 | | | | 12,019 | | | | 2.00 | | | | 2.11 | | | | 2.98 | | | | 55 | | |
| | | 10/31/2001 | | | 8.32 | | | | 6,276 | | | | 2.00 | | | | 2.13 | | | | 3.15 | | | | 35 | | |
| Class C | | 10/31/2005 | | | 0.69 | | | | 3,157 | | | | 2.00 | | | | 2.19 | | | | 2.92 | | | | 30 | | |
| | | 10/31/2004 | | | 4.95 | | | | 4,924 | | | | 2.00 | | | | 2.33 | | | | 2.99 | | | | 16 | | |
| | | 10/31/2003 | | | 3.76 | | | | 1,621 | | | | 2.00 | | | | 2.17 | | | | 2.88 | | | | 22 | | |
| Class M | | 10/31/2005 | | | 1.11 | | | | 1,157 | | | | 1.58 | | | | 1.58 | | | | 3.34 | | | | 30 | | |
| | | 10/31/2004 | | | 5.31 | | | | 1,382 | | | | 1.60 | | | | 2.10 | | | | 3.38 | | | | 16 | | |
| | | 10/31/2003 | | | 5.00 | | | | 1,869 | | | | 1.60 | | | | 1.77 | | | | 3.28 | | | | 22 | | |
| | | 10/31/2002 | | | 4.02 | | | | 2,878 | | | | 1.60 | | | | 1.71 | | | | 3.38 | | | | 55 | | |
| | | 10/31/2001 | | | 8.73 | | | | 2,413 | | | | 1.60 | | | | 1.73 | | | | 3.55 | | | | 35 | | |
The notes to the financial statements are an integral part of this report.
Transamerica IDEX Mutual Funds
Annual Report 2005
8
TA IDEX Federated Tax Exempt
FINANCIAL HIGHLIGHTS (continued)
NOTES TO FINANCIAL HIGHLIGHTS
(a) Annualized.
(b) Not annualized.
(c) Total Return has been calculated for the applicable period without deduction of a sales load, if any, on an initial purchase. Periods of less than one year are not annualized.
(d) Per share information is calculated based on average number of shares outstanding.
(e) Ratio of Net Expenses to Average Net Assets is net of fee waivers and reimbursements by the investment adviser, if any (see note 2).
(f) Ratio of Total Expenses to Average Net Assets includes all expenses before fee waivers and reimbursements by the investment adviser.
(g) The inception date for the Fund's offering of share Class C was November 11, 2002.
The notes to the financial statements are an integral part of this report.
Transamerica IDEX Mutual Funds
Annual Report 2005
9
TA IDEX Federated Tax Exempt
NOTES TO FINANCIAL STATEMENTS
At October 31, 2005
(all amounts in thousands)
NOTE 1. ORGANIZATION AND SIGNIFICANT ACCOUNTING POLICIES
Transamerica IDEX Mutual Funds is an open-end management investment company registered under the Investment Company Act of 1940, as amended (the "1940 Act").
In the normal course of business, TA IDEX Federated Tax Exempt (the "Fund") enters into contracts that contain a variety of representations that provide general indemnifications. The Fund's maximum exposure under these arrangements is unknown, as this would involve future claims that may be made against the Fund and/or its affiliates that have not yet occurred. However, based on experience, the Fund expects the risk of loss to be remote.
This report should be read in conjunction with the current Fund prospectus, which contains more complete information about the Fund.
The following is a summary of significant accounting policies followed by the Fund in the preparation of the financial statements. In preparing the Fund's financial statements in accordance with accounting principles generally accepted in the United States of America ("GAAP"), estimates or assumptions (which could differ from actual results) may be used that affect reported amounts and disclosures.
Multiple class operations, income and expenses: The Fund currently offers four classes of shares, each with a public offering price that reflects different sales charges, if any, and expense levels. On June 15, 2004, Class C2 shares merged into Class C. Class B shares will convert to Class A shares eight years after purchase. Income, non-class specific expenses and realized and unrealized gains and losses, are allocated daily to each class, based upon the value of shares outstanding method permitted under Rule 18f-3 of the 1940 Act. Each class bears its own specific expenses as well as a portion of general, common expenses.
Security valuations: The Fund values its investments at the close of the New York Stock Exchange ("NYSE"), normally 4 p.m. ET, each day the NYSE is open for business. Fund investments are valued at the last sale price or closing price on the day of valuation taken from the primary exchange where the security is principally traded.
Securities traded in the over-the-counter market and listed securities for which no sale was reported on that date are valued at the last quoted bid price.
Debt securities are valued based on a price quotation or other equivalent indication of value supplied by an exchange, a pricing service or a major market maker.
Other securities for which quotations are not readily available or whose values have been determined to be unreliable are valued at fair market value as determined in good faith by the Fund's Administrative Valuation Committee, under the supervision of the Board's Valuation Committee, using guidelines adopted by the Board of Trustees.
Cash: The Fund may leave cash overnight in its cash account with the custodian, Investors Bank & Trust Company ("IBT"). IBT has been contracted on behalf of the Fund to invest the excess cash into a savings account, which at October 31, 2005, was paying an interest rate of 2.76%.
Security transactions and investment income: Security transactions are recorded on the trade date. Security gains and losses are calculated on the specific identification basis. Dividend income, if any, is recorded on the ex-dividend date or, in the case of foreign securities, as soon as the Fund is informed of the ex-dividend date. Interest income, including accretion of discounts and amortization of premiums, is recorded on the accrual basis commencing on the settlement date.
Futures contracts: The Fund may enter into futures contracts to manage exposure to market, interest rate or currency fluctuations. Futures contracts are valued at the settlement price established each day by the board of trade or exchange on which they are traded. The primary risks associated with futures contracts are imperfect correlation between the change in market value of the securities held and the prices of futures contracts; the possibility of an illiquid market and inability of the counterparty to meet the contract terms.
At October 31, 2005, there were no outstanding futures contracts.
Redemption fees: A short-term trading redemption fee may be assessed on any Fund shares in a fund account that are sold during the first five (5) NYSE trading days following their purchase date. This redemption fee will equal 2% of the amount redeemed and shares held the longest will be treated as being redeemed first and shares held the shortest as being redeemed last. For the year ended October 31, 2005, the Fund received less than $1 in redemption fees.
Dividend distributions: Distributions to shareholders are recorded on the ex-dividend date and are determined in accordance with Federal income tax regulations which may differ from GAAP.
NOTE 2. RELATED PARTY TRANSACTIONS
Effective January 1, 2005 AEGON/Transamerica Fund Advisors, Inc. was renamed Transamerica Fund Advisors, Inc. ("TFAI"); AEGON/Transamerica Fund Services, Inc. and AEGON/Transamerica Investor Services, Inc. merged into one entity and was renamed Transamerica Fund Services, Inc. ("TFS").
TFAI is the Fund's investment adviser. TFS is the Fund's administrator and transfer agent. AFSG Securities Corp. ("AFSG") is the Fund's distributor/principal underwriter. TFAI, TFS , and AFSG are affiliates of AEGON, NV, a Netherlands corporation.
Transamerica IDEX Mutual Funds
Annual Report 2005
10
TA IDEX Federated Tax Exempt
NOTES TO FINANCIAL STATEMENTS (continued)
At October 31, 2005
(all amounts in thousands)
NOTE 2.–(continued)
Investment advisory fees: The Fund pays management fees to TFAI based on average daily net assets ("ANA") at the following rate:
0.60% of ANA
TFAI has contractually agreed to waive its advisory fee and will reimburse the Fund to the extent that operating expenses, excluding 12b-1 fees, exceed the following stated annual limit:
1.00% Expense Limit
Distribution and service fees: The Fund has a 12b-1 distribution plan under the 1940 Act pursuant to which an annual fee, based on average daily net assets, is paid to the distributor for various disbursements such as broker-dealer account servicing fees and other promotional expenses of the Fund. The Fund is authorized under the 12b-1 plan to pay fees on each class up to the following limits:
| Class A | | | 0.35 | % | |
| Class B | | | 1.00 | % | |
| Class C | | | 1.00 | % | |
| Class M | | | 0.60 | % | |
In the case the Fund or a class of shares of the Fund is closed to new investors or investments, the Fund is authorized to pay 12b-1 fees for past sales and distribution efforts and present and past investor services.
Underwriter commissions relate to front-end sales charges imposed for Class A and M shares and contingent deferred sales charges from Classes B, C, M and certain A share redemptions. For the year ended October 31, 2005, the underwriter commissions were as follows:
| Received by Underwriter | | $ | 42 | | |
| Retained by Underwriter | | | 4 | | |
| Contingent Deferred Sales Charge | | | 32 | | |
Administrative services: The Fund has entered into an agreement with TFS for financial and legal fund administration services. As of January 1, 2005 the Fund pays TFS an annual fee of 0.02% of ANA. Prior to January 1, 2005 the Fund paid TFS an annual fee of 0.015% of ANA. The Legal fees on the Statement of Operations are for fees paid to external legal counsel.
Transfer agent fees: The Fund pays TFS an annual per-account charge for each open and closed account. The Fund paid TFS $26 for the year ended October 31, 2005.
Deferred compensation plan: Each eligible independent Fund Trustee may elect to participate in a non-qualified deferred compensation plan maintained by Transamerica IDEX Mutual Funds (the "Plan"). Under the Plan, such Trustees may defer payment of all or a portion of their total fees earned as a Fund Trustee. Each Trustee who is a participant in the Plan may elect that the earnings, losses or gains credited to his or her deferred fee amounts be determined based on a deemed investment in any series of Transamerica IDEX Mutual Funds, including the Fund. The right of a participant to receive a distribution from the Plan of the deferred fees is an unsecured claim against the general assets of all series of Transamerica IDEX Mutual Funds. The pro rata liability to the Fund of all defer red fees in the Plan amounted, as of October 31, 2005, to $5.
NOTE 3. INVESTMENT TRANSACTIONS
The cost of securities purchased and proceeds from securities sold (excluding short-term securities) for the year ended October 31, 2005, were as follows:
| Purchases of securities: | |
| Long-Term | | $ | 8,400 | | |
| U.S. Government | | | – | | |
| Proceeds from maturities and sales of securities: | |
| Long-Term | | | 17,286 | | |
| U.S. Government | | | – | | |
NOTE 4. FEDERAL INCOME TAX MATTERS
The Fund has not made any provision for federal income or excise taxes due to its policy to distribute all of its taxable income and capital gains to its shareholders and otherwise qualify as a regulated investment company under Subchapter M of the Internal Revenue Code. Income and capital gain distributions are determined in accordance with income tax regulations, which may differ from GAAP. These differences are primarily due to differing treatment for items including, but not limited to, capital loss carryforwards, distribution reclassifications, wash sales, REIT adjustments and net operating losses.
Therefore, distributions determined in accordance with tax regulations may differ significantly in amount or character from net investment income and realized gains for financial reporting purposes. Financial reporting records are adjusted for permanent book/tax differences to reflect tax character. Financial records are not adjusted for temporary differences. These reclassifications are as follows:
Shares of beneficial interest, unlimited
shares authorized | | $ | 1 | | |
| Undistributed net investment income (loss) | | | (1 | ) | |
The tax character of distributions paid may differ from the character of distributions shown in the Statement of Changes in Net Assets due to short-term gains being treated as ordinary income for tax purposes. The tax character of distributions paid during 2004 and 2005 was as follows:
| 2004 Distributions paid from: | |
| Tax Exempt Income | | $ | 1,190 | | |
| Long-term Capital Gain | | | – | | |
| 2005 Distributions paid from: | |
| Tax Exempt Income | | | 931 | | |
| Long-term Capital Gain | | | – | | |
Transamerica IDEX Mutual Funds
Annual Report 2005
11
TA IDEX Federated Tax Exempt
NOTES TO FINANCIAL STATEMENTS (continued)
At October 31, 2005
(all amounts in thousands)
NOTE 4.–(continued)
The capital loss carryforwards are available to offset future realized capital gains through the period listed:
Capital Loss
Carryforward | | Available through | |
| $ | 162 | | | October 31, 2008 | |
The capital loss carryforward utilized during the year ended October 31, 2005 was $425.
The tax basis components of distributable earnings as of October 31, 2005, are as follows:
| Undistributed Tax Exempt Income | | $ | 31 | | |
| Undistributed Long-term Capital Gains | | $ | – | | |
| Capital Loss Carryforward | | $ | (162 | ) | |
| Net Unrealized Appreciation (Depreciation) | | $ | 1,196 | | |
The aggregate cost of investments and composition of unrealized appreciation (depreciation) for federal income tax purposes as of October 31, 2005, are as follows:
| Federal Tax Cost Basis | | $ | 19,935 | | |
| Unrealized Appreciation | | $ | 1,236 | | |
| Unrealized (Depreciation) | | | (40 | ) | |
| Net Unrealized Appreciation (Depreciation) | | $ | 1,196 | | |
NOTE 5. REGULATORY PROCEEDINGS
There continues to be significant federal and state regulatory activity relating to financial services companies, particularly mutual fund companies and their investment advisers. As part of an ongoing investigation regarding potential market timing, recordkeeping and trading compliance issues and matters affecting the Fund's investment adviser, TFAI, and certain affiliates and former employees of TFAI, the SEC staff has indicated that it is likely to take some action against TFAI and certain of its affiliates at the conclusion of the investigation. The potential timing and the scope of any such action is difficult to predict. Although the impact of any action brought against TFAI and/or its affiliates is difficult to assess at the present time, the Fund currently believes that the likelihood that any such action will have a material adverse impact on it is remote. It is important to note that the Fund is not aware of any allega tion of wrongdoing against it and its Board at the time this annual report is printed. Although it is not anticipated that these developments will have an adverse impact on the Fund, there can be no assurance at this time. TFAI and its affiliates are actively working with the SEC in regard to this matter; however, the exact resolution cannot be determined at this time. TFAI will take such actions that it deems necessary or appropriate to continue providing management services to the Fund and to bring all matters to an appropriate conclusion.
TFAI and/or its affiliates, and not the Fund, will bear the costs regarding these regulatory matters.
NOTE 6. SUBSEQUENT EVENT (unaudited)
Effective December 2, 2005, the Fund was dissolved.
Transamerica IDEX Mutual Funds
Annual Report 2005
12
Report of Independent Registered Certified Public Accounting Firm
To the Board of Trustees and Shareholders of
TA IDEX Federated Tax Exempt
In our opinion, the accompanying statement of assets and liabilities, including the schedule of investments, and the related statements of operations and of changes in net assets and the financial highlights present fairly, in all material respects, the financial position of TA IDEX Federated Tax Exempt (the "Fund") (one of the portfolios constituting the Transamerica IDEX Mutual Funds) at October 31, 2005, the results of its operations for the year then ended, the changes in its net assets for each of the two years in the period then ended and the financial highlights for each of the periods presented, in conformity with accounting principles generally accepted in the United States of America. These financial statements and financial highlights (hereafter referred to as "financial statements") are the responsibility of the Fund's management; our responsibility is to express an opinion on these financial statements based on our audits. We conducted our audits of these financial statements in accordance with the standards of the Public Company Accounting Oversight Board (United States). Those standards require that we plan and perform the audit to obtain reasonable assurance about whether the financial statements are free of material misstatement. An audit includes examining, on a test basis, evidence supporting the amounts and disclosures in the financial statements, assessing the accounting principles used and significant estimates made by management, and evaluating the overall financial statement presentation. We believe that our audits, which included confirmation of securities at October 31, 2005 by correspondence with the custodian, provide a reasonable basis for our opinion.

December 22, 2005
Transamerica IDEX Mutual Funds
Annual Report 2005
13
TA IDEX Great Companies–AmericaSM
MARKET ENVIRONMENT
The year 2005 will be remembered for the worst hurricane season since the 1930's; high oil and gas prices; several major air carriers declaring bankruptcy; the Federal Reserve Board routinely raising interest rates; a record federal deficit; CEOs being tried and sent to jail; and the curtailing of a highly speculative real estate mania. All of these factors led to a very uncertain stock market. When combined with the disruptive effect of hedge funds whose high turnover and long/short strategies added volatility to the markets, we faced one of the most challenging investing environments we have seen in years.
It has become increasingly difficult to hold stocks for the long-term in this environment because many stocks are trading within a very tight range. As a result, when a stock goes up, we typically reduce our holdings in the stock and realize a gain for our investors. Failure to do this results in "round-tripping" the stock (going from low price to high price and back to low price) and not realizing gains for our investors.
The amazing thing is the economy has remained strong and unemployment low. Today, we find that stocks are trading at historically low price earning ratios.
PERFORMANCE
For the year ended October 31, 2005, TA IDEX Great Companies-AmericaSM, Class A returned 5.86%. By comparison its benchmark, the Standard and Poor's 500 Composite Stock Index ("S&P 500") returned 8.71%.
STRATEGY REVIEW
During the first six months of 2005, we did not own any energy or utility stocks, which contributed to the Fund's underperformance. During the year we made the following changes to the portfolio:
During the year we removed a number of stocks including Exxon Mobile Corporation, Occidental Petroleum Corporation, Lehman Brothers Holdings Inc., Berkshire Hathaway Inc., Merrill Lynch & Co., Inc., Zimmer Holdings, Inc., Pfizer Inc., Danaher Corporation, Cisco Systems, Inc., and Ecolab Inc. This resulted in higher than normal turnover, but was necessary as we repositioned sectors and stocks within sectors.
The energy sector has outperformed the S&P 500 over an extended period, and as a result we added several energy stocks to the portfolio such as Burlington Resources Inc., ConocoPhillips, and Apache Corporation (sold during the period). We increased our holdings in the technology sector during the year with the addition of Apple Computer, Inc., Motorola, Inc., Microsoft Corporation, Hewlett-Packard Company, QUALCOMM Incorporated, Yahoo! Inc., and Intel Corporation. We also added several financials including JPMorgan Chase & Co., Morgan Stanley and Prudential Financial, Inc.
The best performing stocks for the year 2005 included The Goldman Sachs Group, Inc., Hewlett-Packard Company, Prudential Financial, Inc., PepsiCo, Inc., Colgate-Palmolive Company, Motorola, Inc., and Texas Instruments Incorporated.
The worst performing stocks for the year 2005 included Cisco Systems, Inc., QUALCOMM Incorporated, Intel Corporation, Viacom Inc. Class B, Fortune Brands, Inc., Chesapeake Energy Corporation and American International Group, Inc.
Jim Huguet
Gerry Bollman, CFA
Matt Stephani, CFA, CPA
Derek Hong, CFA
Co-Fund Managers
Great Companies, L.L.C.
Transamerica IDEX Mutual Funds
Annual Report 2005
1
TA IDEX Great Companies–AmericaSM
Comparison of change in value of $10,000 investment in Class A shares and its comparative index.
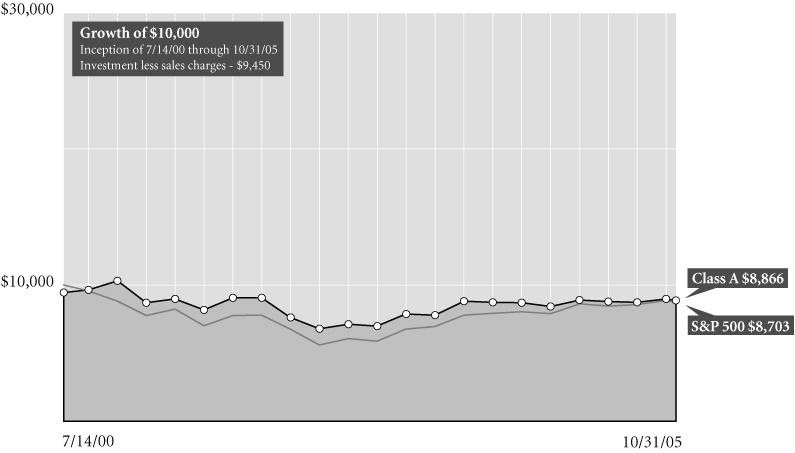
Average Annual Total Return for Periods Ended 10/31/05
| | | 1 year | | 5 years | | From
Inception | | Inception
Date | |
| Class A (NAV) | | | 5.86 | % | | | (2.40 | )% | | | (1.22 | )% | | 7/14/00 | |
| Class A (POP) | | | 0.04 | % | | | (3.50 | )% | | | (2.27 | )% | | 7/14/00 | |
| S&P 5001 | | | 8.71 | % | | | (1.73 | )% | | | (2.59 | )% | | 7/14/00 | |
| Class B (NAV) | | | 5.12 | % | | | (3.06 | )% | | | (1.89 | )% | | 7/14/00 | |
| Class B (POP) | | | 0.12 | % | | | (3.26 | )% | | | (1.89 | )% | | 7/14/00 | |
| Class C (NAV) | | | 5.24 | % | | | – | | | | 6.44 | % | | 11/11/02 | |
| Class C (POP) | | | 4.24 | % | | | – | | | | 6.44 | % | | 11/11/02 | |
NOTES
1 The Standard and Poor's 500 Composite Stock (S&P 500) Index is an unmanaged index used as a general measure of market performance. Calculations assume dividends and capital gains are reinvested and do not include any managerial expenses. From inception calculation is based on life of Class A shares. Source: Standard & Poor's Micropal®© Micropal, Inc. 2005 – 1-800-596-5323 – http://www.funds-sp.com.
The performance data presented represents past performance, future results may vary. Performance data does not reflect the deduction of taxes that would be paid on fund distributions or the redemption of fund shares. Investment return and principal value will fluctuate so that an investor's shares, when redeemed, may be worth more or less than their original cost. Current performance may be lower or higher than performance quoted. Please see www.transamericaidex.com for performance data current to the most recent month-end.
Public Offering Price (POP) returns include the reinvestment of dividends and capital gains and reflect the maximum sales charge of 5.5% for A shares or the maximum applicable contingent deferred sales charge (5% in the 1st year, decreasing to 0% after 6 years) for Class B shares and 1% (during the first 12 months) for Class C shares. Shares purchased prior to March 1, 2004 are subject to a maximum applicable contingent deferred sales charge (5% in the 1st year, decreasing to 0% after 7 years) for Class B shares and (2% in the 1st year, decreasing to 0% after 2 years) for Class C shares. Net Asset Value (NAV) returns include the reinvestment of dividends and capital gains but do not reflect any sales charges.
The Fund is non-diversified. Investments in a "non-diversified" fund may be subject to specific risks such as susceptibility to single economic, political or regulatory events, and may be subject to greater loss than investments in a diversified fund.
The management of this fund is based on a specific philosophy and on proprietary systems and methodology. There is no guarantee the fund will achieve its objectives.
This material must be preceded or accompanied by a current prospectus, which includes specific contents regarding the investment objectives and policies of this fund.
Transamerica IDEX Mutual Funds
Annual Report 2005
2
TA IDEX Great Companies–AmericaSM
UNDERSTANDING YOUR FUND'S EXPENSES
(unaudited)
SHAREHOLDER EXPENSES
Fund shareholders may incur two types of costs: (1) transaction costs, including sales charges (loads) on purchases, contingent deferred sales charges on redemptions and redemption fees; and (2) ongoing costs, including management fees, 12b-1 distribution and service fees, and other fund expenses.
The following Example is intended to help you understand your ongoing costs (in dollars and cents) of investing in a Fund and to compare these costs with the ongoing costs of investing in other funds.
The Example is based on an investment of $1,000 invested at May 1, 2005 and held for the entire period until October 31, 2005.
ACTUAL EXPENSES
The first line in the table below provides information about actual account values and actual expenses. You may use the information in this line, together with the amount you invested, to estimate the expenses that you paid over the period. Simply divide your account value by $1,000 (for example, an $8,600 account value divided by $1,000 = 8.6), then multiply the result by the number in the first line of your Fund under the heading entitled "Expenses Paid During Period" to estimate the expenses you paid on your account during this period. If your account is an IRA, your expenses could have included a $15 annual fee. The amount of any fee paid through your account would increase the estimate of expenses you paid during the period and decrease your ending account value.
HYPOTHETICAL EXAMPLE FOR COMPARISON PURPOSES
The second line in the table below provides information about hypothetical account values and hypothetical expenses based on the Fund's actual expense ratio and an assumed rate of return of 5% per year before expenses, which is not the Fund's actual return. The hypothetical account values and expenses may not be used to estimate the actual ending account balance or expenses you paid for the period. You may use this information to compare the ongoing costs of investing in your Fund and other funds. To do so, compare this 5% hypothetical example with the 5% hypothetical examples that appear in the shareholder reports of the other funds. As in the case of the actual expense example, if your account is subject to an IRA fee, the amount of the fee paid through your account would increase the hypothetical expenses you would have paid during the period and decrease the hypothetical ending account value.
Please note that the expenses shown in the table are meant to highlight your ongoing costs only and do not reflect any transactional costs, such as sales charges, redemption fees, brokerage commissions paid on purchases and sales of fund shares. Therefore, the second line under the Fund in the table is useful in comparing ongoing costs only, and will not help you determine the relative total costs of owning different funds. If any of these transaction costs were included, your costs would be higher. The expenses shown in the table do not reflect any fees that may be charged to you by brokers, financial intermediaries or other financial institutions.
| | | Beginning
Account
Value | | Ending
Account
Value | | Annualized
Expense
Ratio | | Expenses Paid
During Period (a) | |
| Class A | | | |
| Actual | | $ | 1,000.00 | | | $ | 1,020.70 | | | | 1.53 | % | | $ | 7.79 | | |
| Hypothetical (b) | | | 1,000.00 | | | | 1,017.49 | | | | 1.53 | | | | 7.78 | | |
| Class B | | | |
| Actual | | | 1,000.00 | | | | 1,016.90 | | | | 2.22 | | | | 11.29 | | |
| Hypothetical (b) | | | 1,000.00 | | | | 1,014.01 | | | | 2.22 | | | | 11.27 | | |
| Class C | |
| Actual | | | 1,000.00 | | | | 1,016.90 | | | | 2.18 | | | | 11.08 | | |
| Hypothetical (b) | | | 1,000.00 | | | | 1,014.22 | | | | 2.18 | | | | 11.07 | | |
(a) Expenses are calculated using each Fund's annualized expense ratio (as disclosed in the table), multiplied by the average account value for the period, multiplied by number of days in the period (184 days), and divided by the number of days in the year (365 days).
(b) 5% return per year before expenses.
GRAPHICAL PRESENTATION OF SCHEDULE OF INVESTMENTS
By Sector
At October 31, 2005
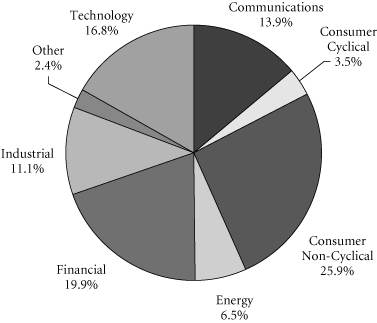
This chart shows the percentage breakdown by sector of the Fund's total investment securities.
Transamerica IDEX Mutual Funds
Annual Report 2005
3
TA IDEX Great Companies–AmericaSM
SCHEDULE OF INVESTMENTS
At October 31, 2005
(all amounts except share amounts in thousands)
| | | Shares | | Value | |
| COMMON STOCKS (96.4%) | |
| Aerospace (4.1%) | |
| United Technologies Corp. | | | 74,000 | | | $ | 3,795 | | |
| Beverages (3.7%) | |
| PepsiCo, Inc. | | | 57,350 | | | | 3,388 | | |
| Business Services (5.2%) | |
| First Data Corp. | | | 46,850 | | | | 1,895 | | |
| Omnicom Group, Inc. | | | 34,900 | | | | 2,895 | | |
| Chemicals & Allied Products (4.1%) | |
| Clorox Co. | | | 34,400 | | | | 1,862 | | |
| Procter & Gamble Co. | | | 33,970 | | | | 1,902 | | |
| Commercial Banks (2.1%) | |
| JP Morgan Chase & Co. | | | 54,000 | | | | 1,978 | | |
| Communication (1.9%) | |
| Viacom, Inc.–Class B | | | 58,000 | | | | 1,796 | | |
| Communications Equipment (6.4%) | |
| Motorola, Inc. | | | 191,600 | | | | 4,246 | | |
| QUALCOMM, Inc. | | | 42,000 | | | | 1,670 | | |
| Computer & Data Processing Services (4.8%) | |
| Microsoft Corp. | | | 90,700 | | | | 2,331 | | |
| Yahoo!, Inc. ‡ | | | 56,000 | | | | 2,070 | | |
| Computer & Office Equipment (7.2%) | |
| Apple Computer, Inc. ‡ | | | 82,700 | | | | 4,763 | | |
| Hewlett-Packard Co. | | | 68,400 | | | | 1,918 | | |
| Electronic & Other Electric Equipment (3.5%) | |
| General Electric Co. | | | 95,600 | | | | 3,242 | | |
| Electronic Components & Accessories (4.7%) | |
| Intel Corp. | | | 111,000 | | | | 2,609 | | |
| Texas Instruments, Inc. | | | 59,000 | | | | 1,685 | | |
| Food & Kindred Products (1.9%) | |
| Kellogg Co. | | | 39,600 | | | | 1,749 | | |
| Insurance (3.3%) | |
| American International Group, Inc. | | | 47,000 | | | | 3,046 | | |
| Leather & Leather Products (3.5%) | |
| Coach, Inc. ‡ | | | 99,000 | | | | 3,186 | | |
| Life Insurance (3.2%) | |
| Prudential Financial, Inc. | | | 40,600 | | | | 2,955 | | |
| Medical Instruments & Supplies (4.3%) | |
| Medtronic, Inc. † | | | 69,400 | | | | 3,932 | | |
| Oil & Gas Extraction (5.4%) | |
| BJ Services Co. † | | | 15,760 | | | | 548 | | |
| Burlington Resources, Inc. | | | 24,000 | | | | 1,733 | | |
| Chesapeake Energy Corp. | | | 28,000 | | | | 899 | | |
| XTO Energy, Inc. | | | 42,000 | | | | 1,825 | | |
| | | Shares | | Value | |
| Paper & Allied Products (3.4%) | | | |
| 3M Co. | | | 41,100 | | | $ | 3,123 | | |
| Petroleum Refining (1.0%) | | | |
| ConocoPhillips | | | 14,680 | | | | 960 | | |
| Pharmaceuticals (11.7%) | | | |
| Abbott Laboratories | | | 42,100 | | | | 1,812 | | |
| Amgen, Inc. ‡ | | | 12,000 | | | | 909 | | |
| Genzyme Corp. ‡ | | | 6,130 | | | | 443 | | |
| Johnson & Johnson | | | 60,800 | | | | 3,807 | | |
| Wyeth | | | 85,620 | | | | 3,815 | | |
| Security & Commodity Brokers (11.0%) | | | |
| American Express Co. | | | 51,000 | | | | 2,538 | | |
| Ameriprise Financial, Inc. ‡ | | | 10,200 | | | | 380 | | |
| Goldman Sachs Group, Inc. (The) | | | 22,500 | | | | 2,843 | | |
| Morgan Stanley | | | 37,000 | | | | 2,013 | | |
| T. Rowe Price Group, Inc. | | | 37,000 | | | | 2,424 | | |
| Total Common Stocks (cost: $84,003) | | | | | | | 88,985 | | |
| | | Principal | | Value | |
| SECURITY LENDING COLLATERAL (2.3%) | | | |
| Debt (2.1%) | | | |
| Bank Notes (0.1%) | | | |
Bank of America
3.81%, due 06/07/2006 * | | $ | 60 | | | $ | 60 | | |
| 3.81%, due 08/10/2006 * | | | 59 | | | | 59 | | |
Credit Suisse First Boston Corp.
4.11%, due 03/10/2006 * | | | 12 | | | | 12 | | |
| Certificates Of Deposit (0.2%) | | | |
Canadian Imperial Bank of Commerce
4.07%, due 11/04/2005 * | | | 47 | | | | 47 | | |
Harris Trust & Savings Bank
3.80%, due 11/04/2005 * | | | 38 | | | | 38 | | |
Rabobank Nederland
4.03%, due 05/31/2006 * | | | 59 | | | | 59 | | |
| Commercial Paper (0.5%) | | | |
Ciesco LLC
4.00%, due 11/03/2005 | | | 59 | | | | 59 | | |
General Electric Capital Corp.
3.96%, due 12/05/2005 | | | 47 | | | | 47 | | |
Paradigm Funding LLC–144A
4.01%, due 11/07/2005 | | | 47 | | | | 47 | | |
Park Avenue Receivables Corp.–144A
4.03%, due 12/02/2005 | | | 47 | | | | 47 | | |
Preferred Receivables Corp.–144A
4.04%, due 12/05/2005 | | | 36 | | | | 36 | | |
Ranger Funding Co. LLC–144A
3.99%, due 11/15/2005 | | | 35 | | | | 35 | | |
The notes to the financial statements are an integral part of this report.
Transamerica IDEX Mutual Funds
Annual Report 2005
4
TA IDEX Great Companies–AmericaSM
SCHEDULE OF INVESTMENTS (continued)
At October 31, 2005
(all amounts except share amounts in thousands)
| | | Principal | | Value | |
| Commercial Paper (continued) | | | |
Sheffield Receivables Corp.–144A
4.01%, due 11/08/2005 | | $ | 36 | | | $ | 36 | | |
Yorktown Capital LLC
3.97%, due 11/09/2005 | | | 59 | | | | 59 | | |
| 3.93%, due 11/17/2005 | | | 59 | | | | 59 | | |
| Euro Dollar Overnight (0.5%) | | | |
Bank of Montreal
3.79%, due 11/01/2005 | | | 36 | | | | 36 | | |
Barclays
3.80%, due 11/04/2005 | | | 48 | | | | 48 | | |
BNP Paribas
3.83%, due 11/02/2005 | | | 71 | | | | 71 | | |
Deutsche Bank
3.80%, due 11/02/2005 | | | 119 | | | | 119 | | |
HSBC Banking/Holdings PLC
3.84%, due 11/07/2005 | | | 36 | | | | 36 | | |
Royal Bank of Scotland
3.76%, due 11/01/2005 | | | 48 | | | | 48 | | |
Svenska Handlesbanken
4.03%, due 11/01/2005 | | | 61 | | | | 61 | | |
UBS AG
3.80%, due 11/03/2005 | | | 48 | | | | 48 | | |
| Euro Dollar Terms (0.2%) | | | |
Royal Bank of Scotland
4.00%, due 12/12/2005 | | | 48 | | | | 48 | | |
UBS AG
4.02%, due 12/01/2005 | | | 48 | | | | 48 | | |
Wells Fargo
3.96%, due 11/14/2005 | | | 71 | | | | 71 | | |
| Promissory Notes (0.0%) | | | |
Goldman Sachs Group, Inc.
4.02%, due 12/28/2005 | | | 50 | | | | 50 | | |
| | | Principal | | Value | |
| Repurchase Agreements (0.6%) †† | | | |
Credit Suisse First Boston Corp. 4.10%,
dated 10/31/2005 to be repurchased
at $81 on 11/01/2005 | | $ | 81 | | | $ | 81 | | |
Goldman Sachs Group, Inc. (The) 4.10%,
dated 10/31/2005 to be repurchased
at $202 on 11/01/2005 | | | 202 | | | | 202 | | |
Lehman Brothers, Inc. 4.10%, dated 10/31/2005
to be repurchased at $6 on 11/01/2005 | | | 6 | | | | 6 | | |
Merrill Lynch & Co. 4.10%, dated 10/31/2005
to be repurchased at $238 on 11/01/2005 | | | 238 | | | | 238 | | |
Morgan Stanley Dean Witter & Co. 4.17%,
dated 10/31/2005 to be repurchased
at $71 on 11/01/2005 | | | 71 | | | | 71 | | |
| | | Shares | | Value | |
| Investment Companies (0.2%) | | | |
| Money Market Funds (0.2%) | | | |
American Beacon Fund
1-day yield of 3.81% | | | 51,253 | | | $ | 51 | | |
Barclays Global Investors Institutional
Money Market Fund
1-day yield of 3.92% | | | 47,547 | | | | 48 | | |
Goldman Sachs Financial Square
Prime Obligations Fund
1-day yield of 3.79% | | | 7,406 | | | | 7 | | |
Merrimac Cash Fund, Premium Class
1-day yield of 3.70% @ | | | 47,022 | | | | 47 | | |
| Total Security Lending Collateral (cost: $2,135) | | | | | | | 2,135 | | |
| Total Investment Securities (cost: $86,138) | | | | | | $ | 91,120 | | |
| SUMMARY: | | | |
| Investment securities, at value | | | 98.7 | % | | $ | 91,120 | | |
| Other assets in excess of liabilities | | | 1.3 | % | | | 1,173 | | |
| Net assets | | | 100.0 | % | | $ | 92,293 | | |
NOTES TO SCHEDULE OF INVESTMENTS:
‡ Non-income producing.
† At October 31, 2005, all or a portion of this security is on loan (see Note 1). The value at October 31, 2005, of all securities on loan is $2,079.
* Floating or variable rate note. Rate is listed as of October 31, 2005.
†† Cash collateral for the Repurchase Agreements, valued at $610, that serve as collateral for securities lending are invested in corporate bonds with interest rates and maturity dates ranging from 0.00%–9.86% and 12/31/2005–11/15/2096, respectively.
@ Regulated investment company advised by Investors Bank and Trust Co. ("IBT"). IBT is also the accounting, custody and lending agent for the Fund.
DEFINITIONS:
144A 144A Securities are registered pursuant to Rule 144A of the Securities Act of 1933. These securities are deemed to be liquid for purposes of compliance limitations on holdings of illiquid securities and may be resold as transactions exempt from registration, normally to qualified institutional buyers. At October 31, 2005, these securities aggregated $201 or 0.2% of the net assets of the Fund.
The notes to the financial statements are an integral part of this report.
Transamerica IDEX Mutual Funds
Annual Report 2005
5
TA IDEX Great Companies–AmericaSM
STATEMENT OF ASSETS AND LIABILITIES
At October 31, 2005
(all amounts except per share amounts in thousands)
| Assets: | | | |
Investment securities, at value (cost: $86,138)
(including securities loaned of $2,079) | | $ | 91,120 | | |
| Cash | | | 1,137 | | |
| Receivables: | |
| Investment securities sold | | | 2,515 | | |
| Shares of beneficial interest sold | | | 11 | | |
| Interest | | | 8 | | |
| Dividends | | | 60 | | |
| Other | | | 8 | | |
| | | | 94,859 | | |
| Liabilities: | | | |
| Accounts payable and accrued liabilities: | |
| Shares of beneficial interest redeemed | | | 233 | | |
| Management and advisory fees | | | 62 | | |
| Distribution and service fees | | | 60 | | |
| Transfer agent fees | | | 35 | | |
| Administration fees | | | 2 | | |
| Payable for collateral for securities on loan | | | 2,135 | | |
| Other | | | 39 | | |
| | | | 2,566 | | |
| Net Assets | | $ | 92,293 | | |
| Net Assets Consist of: | | | |
Shares of beneficial interest, unlimited shares
authorized, no par value | | | 100,170 | | |
| Accumulated net investment income (loss) | | | (3 | ) | |
Accumulated net realized gain (loss) from
investment securities | | | (12,856 | ) | |
Net unrealized appreciation (depreciation) on
investment securities | | | 4,982 | | |
| Net Assets | | $ | 92,293 | | |
| Net Assets by Class: | | | |
| Class A | | $ | 33,170 | | |
| Class B | | | 40,313 | | |
| Class C | | | 18,810 | | |
| Shares Outstanding: | | | |
| Class A | | | 3,541 | | |
| Class B | | | 4,460 | | |
| Class C | | | 2,082 | | |
| Net Asset Value Per Share: | | | |
| Class A | | $ | 9.37 | | |
| Class B | | | 9.04 | | |
| Class C | | | 9.04 | | |
| Maximum Offering Price Per Share (a): | | | |
| Class A | | $ | 9.92 | | |
(a) Includes the maximum selling commission (represented as a percentage of offering price) which is reduced on certain levels of sales as set forth in the Prospectus. Net asset value per share for Classes B and C shares represents offering price. The redemption price for Classes B and C shares equals net asset value less any applicable contingent deferred sales charge.
STATEMENT OF OPERATIONS
For the year ended October 31, 2005
(all amounts in thousands)
| Investment Income: | | | |
| Interest | | $ | 43 | | |
| Dividends | | | 1,487 | | |
| Income from loaned securities–net | | | 5 | | |
| | | | 1,535 | | |
| Expenses: | | | |
| Management and advisory fees | | | 859 | | |
| Distribution and service fees: | |
| Class A | | | 136 | | |
| Class B | | | 481 | | |
| Class C | | | 233 | | |
| Transfer agent fees: | |
| Class A | | | 128 | | |
| Class B | | | 169 | | |
| Class C | | | 71 | | |
| Printing and shareholder reports | | | 48 | | |
| Custody fees | | | 13 | | |
| Administration fees | | | 21 | | |
| Legal fees | | | 8 | | |
| Audit fees | | | 18 | | |
| Trustees fees | | | 5 | | |
| Registration fees: | |
| Class A | | | 11 | | |
| Class B | | | 12 | | |
| Class C | | | 12 | | |
| Other | | | 2 | | |
| Total expenses | | | 2,227 | | |
| Less: | |
| Reimbursement of class expenses: | |
| Class A | | | (25 | ) | |
| Class B | | | (40 | ) | |
| Class C | | | (14 | ) | |
| Total reimbursed expenses | | | (79 | ) | |
| Net expenses | | | 2,148 | | |
| Net Investment Income (Loss) | | | (613 | ) | |
| Net Realized and Unrealized Gain (Loss): | | | |
| Realized gain (loss) from investment securities | | | 9,945 | | |
Increase (decrease) in unrealized appreciation
(depreciation) on investment securities | | | (2,797 | ) | |
| Net Gain (Loss) on Investment Securities | | | 7,148 | | |
Net Increase (Decrease) in Net Assets Resulting
from Operations | | $ | 6,535 | | |
The notes to the financial statements are an integral part of this report.
Transamerica IDEX Mutual Funds
Annual Report 2005
6
TA IDEX Great Companies–AmericaSM
STATEMENTS OF CHANGES IN NET ASSETS
For the years ended
(all amounts in thousands)
| | | October 31,
2005 | | October 31,
2004 | |
| Increase (Decrease) In Net Assets From: | | | |
| Operations: | | | |
| Net investment income (loss) | | $ | (613 | ) | | $ | (564 | ) | |
Net realized gain (loss) from
investment securities | | | 9,945 | | | | 1,147 | | |
Net unrealized appreciation
(depreciation) on investment
securities | | | (2,797 | ) | | | 439 | | |
| | | | 6,535 | | | | 1,022 | | |
| Capital Share Transactions: | | | |
| Proceeds from shares sold: | |
| Class A | | | 3,043 | | | | 10,563 | | |
| Class B | | | 1,547 | | | | 4,872 | | |
| Class C | | | 2,777 | | | | 4,740 | | |
| Class C2 | | | – | | | | 652 | | |
| Class M | | | – | | | | 718 | | |
| | | | 7,367 | | | | 21,545 | | |
| Cost of shares redeemed: | |
| Class A | | | (16,413 | ) | | | (16,054 | ) | |
| Class B | | | (18,429 | ) | | | (12,938 | ) | |
| Class C | | | (11,983 | ) | | | (3,961 | ) | |
| Class C2 | | | – | | | | (3,142 | ) | |
| Class M | | | – | | | | (2,627 | ) | |
| | | | (46,825 | ) | | | (38,722 | ) | |
| Class level exchanges: | |
| Class C | | | – | | | | 22,151 | | |
| Class C2 | | | – | | | | (15,042 | ) | |
| Class M | | | – | | | | (7,109 | ) | |
| | | | – | | | | – | | |
| Automatic conversions: | |
| Class A | | | 15 | | | | 20 | | |
| Class B | | | (15 | ) | | | (20 | ) | |
| | | | – | | | | – | | |
| | | | (39,458 | ) | | | (17,177 | ) | |
| Net increase (decrease) in net assets | | | (32,923 | ) | | | (16,155 | ) | |
| Net Assets: | | | |
| Beginning of year | | | 125,216 | | | | 141,371 | | |
| End of year | | $ | 92,293 | | | $ | 125,216 | | |
Accumulated Net Investment Income
(Loss) | | $ | (3 | ) | | $ | (2 | ) | |
| | | October 31,
2005 | | October 31,
2004 | |
| Share Activity: | |
| Shares issued: | |
| Class A | | | 327 | | | | 1,161 | | |
| Class B | | | 172 | | | | 547 | | |
| Class C | | | 305 | | | | 534 | | |
| Class C2 | | | – | | | | 73 | | |
| Class M | | | – | | | | 81 | | |
| | | | 804 | | | | 2,396 | | |
| Shares redeemed: | |
| Class A | | | (1,765 | ) | | | (1,775 | ) | |
| Class B | | | (2,045 | ) | | | (1,466 | ) | |
| Class C | | | (1,330 | ) | | | (452 | ) | |
| Class C2 | | | – | | | | (349 | ) | |
| Class M | | | – | | | | (294 | ) | |
| | | | (5,140 | ) | | | (4,336 | ) | |
| Class level exchanges: | |
| Class C | | | – | | | | 2,503 | | |
| Class C2 | | | – | | | | (1,676 | ) | |
| Class M | | | – | | | | (823 | ) | |
| | | | – | | | | 4 | | |
| Automatic conversions: | |
| Class A | | | 2 | | | | 2 | | |
| Class B | | | (2 | ) | | | (2 | ) | |
| | | | – | | | | – | | |
Net increase (decrease) in shares
outstanding: | |
| Class A | | | (1,436 | ) | | | (612 | ) | |
| Class B | | | (1,875 | ) | | | (921 | ) | |
| Class C | | | (1,025 | ) | | | 2,585 | | |
| Class C2 | | | – | | | | (1,952 | ) | |
| Class M | | | – | | | | (1,036 | ) | |
| | | | (4,336 | ) | | | (1,936 | ) | |
The notes to the financial statements are an integral part of this report.
Transamerica IDEX Mutual Funds
Annual Report 2005
7
TA IDEX Great Companies–AmericaSM
FINANCIAL HIGHLIGHTS
| | | | | For a share of beneficial interest outstanding throughout each period | |
| | | | | Net Asset | | Investment Operations | | Distributions | | Net Asset | |
| | | For the
Period
Ended (d)(g) | | Value,
Beginning
of Period | | Net
Investment
Income (Loss) | | Net Realized
and Unrealized
Gain (Loss) | | Total
Operations | | From Net
Investment
Income | | From Net
Realized
Gains | | Total
Distributions | | Value,
End
of Period | |
| Class A | | 10/31/2005 | | $ | 8.85 | | | $ | (0.01 | ) | | $ | 0.53 | | | $ | 0.52 | | | $ | – | | | $ | – | | | $ | – | | | $ | 9.37 | | |
| | | 10/31/2004 | | | 8.77 | | | | – | (h) | | | 0.08 | | | | 0.08 | | | | – | | | | – | | | | – | | | | 8.85 | | |
| | | 10/31/2003 | | | 7.65 | | | | – | (h) | | | 1.12 | | | | 1.12 | | | | – | | | | – | | | | – | | | | 8.77 | | |
| | | 10/31/2002 | | | 8.96 | | | | (0.01 | ) | | | (1.30 | ) | | | (1.31 | ) | | | – | | | | – | | | | – | | | | 7.65 | | |
| | | 10/31/2001 | | | 10.58 | | | | (0.02 | ) | | | (1.60 | ) | | | (1.62 | ) | | | – | | | | – | | | | – | | | | 8.96 | | |
| Class B | | 10/31/2005 | | | 8.60 | | | | (0.07 | ) | | | 0.51 | | | | 0.44 | | | | – | | | | – | | | | – | | | | 9.04 | | |
| | | 10/31/2004 | | | 8.57 | | | | (0.06 | ) | | | 0.09 | | | | 0.03 | | | | – | | | | – | | | | – | | | | 8.60 | | |
| | | 10/31/2003 | | | 7.52 | | | | (0.05 | ) | | | 1.10 | | | | 1.05 | | | | – | | | | – | | | | – | | | | 8.57 | | |
| | | 10/31/2002 | | | 8.87 | | | | (0.08 | ) | | | (1.27 | ) | | | (1.35 | ) | | | – | | | | – | | | | – | | | | 7.52 | | |
| | | 10/31/2001 | | | 10.56 | | | | (0.08 | ) | | | (1.61 | ) | | | (1.69 | ) | | | – | | | | – | | | | – | | | | 8.87 | | |
| Class C | | 10/31/2005 | | | 8.59 | | | | (0.07 | ) | | | 0.52 | | | | 0.45 | | | | – | | | | – | | | | – | | | | 9.04 | | |
| | | 10/31/2004 | | | 8.57 | | | | (0.06 | ) | | | 0.08 | | | | 0.02 | | | | – | | | | – | | | | – | | | | 8.59 | | |
| | | 10/31/2003 | | | 7.51 | | | | (0.05 | ) | | | 1.11 | | | | 1.06 | | | | – | | | | – | | | | – | | | | 8.57 | | |
| | | | | | | Ratios/Supplemental Data | |
| | | For the
Period | | Total | | Net Assets,
End of
Period | | Ratio of Expenses
to Average
Net Assets (a) | | Net Investment
Income (Loss)
to Average | | Portfolio
Turnover | |
| | | Ended (g) | | Return (c) | | (000's) | | Net (e) | | Total (f) | | Net Assets (a) | | Rate (b) | |
| Class A | | 10/31/2005 | | | 5.86 | % | | $ | 33,170 | | | | 1.53 | % | | | 1.59 | % | | | (0.13 | )% | | | 100 | % | |
| | | 10/31/2004 | | | 0.93 | | | | 44,056 | | | | 1.55 | | | | 1.55 | | | | – | | | | 23 | | |
| | | 10/31/2003 | | | 14.64 | | | | 49,040 | | | | 1.55 | | | | 1.66 | | | | 0.05 | | | | 54 | | |
| | | 10/31/2002 | | | (14.59 | ) | | | 55,508 | | | | 1.55 | | | | 1.66 | | | | (0.16 | ) | | | 28 | | |
| | | 10/31/2001 | | | (15.35 | ) | | | 38,345 | | | | 1.55 | | | | 1.78 | | | | (0.18 | ) | | | 65 | | |
| Class B | | 10/31/2005 | | | 5.12 | | | | 40,313 | | | | 2.18 | | | | 2.26 | | | | (0.79 | ) | | | 100 | | |
| | | 10/31/2004 | | | 0.35 | | | | 54,460 | | | | 2.17 | | | | 2.17 | | | | (0.62 | ) | | | 23 | | |
| | | 10/31/2003 | | | 13.96 | | | | 62,205 | | | | 2.20 | | | | 2.31 | | | | (0.60 | ) | | | 54 | | |
| | | 10/31/2002 | | | (15.26 | ) | | | 53,256 | | | | 2.20 | | | | 2.31 | | | | (0.81 | ) | | | 28 | | |
| | | 10/31/2001 | | | (15.98 | ) | | | 40,769 | | | | 2.20 | | | | 2.43 | | | | (0.83 | ) | | | 65 | | |
| Class C | | 10/31/2005 | | | 5.24 | | | | 18,810 | | | | 2.18 | | | | 2.24 | | | | (0.79 | ) | | | 100 | | |
| | | 10/31/2004 | | | 0.23 | | | | 26,700 | | | | 2.20 | | | | 2.26 | | | | (0.64 | ) | | | 23 | | |
| | | 10/31/2003 | | | 14.11 | | | | 4,474 | | | | 2.20 | | | | 2.31 | | | | (0.60 | ) | | | 54 | | |
NOTES TO FINANCIAL HIGHLIGHTS
(a) Annualized.
(b) Not annualized.
(c) Total Return has been calculated for the applicable period without deduction of a sales load, if any, on an initial purchase. Periods of less than one year are not annualized.
(d) Per share information is calculated based on average number of shares outstanding.
(e) Ratio of Net Expenses to Average Net Assets is net of fee waivers and reimbursements by the investment adviser, if any (see note 2).
(f) Ratio of Total Expenses to Average Net Assets includes all expenses before fee waivers and reimbursements by the investment adviser.
(g) TA IDEX Great Companies–America ("the Fund") commenced operations on July 14, 2000. The inception date for the Fund's offering of share Class C was November 11, 2002.
(h) Rounds to less than $(0.01).
The notes to the financial statements are an integral part of this report.
Transamerica IDEX Mutual Funds
Annual Report 2005
8
TA IDEX Great Companies–AmericaSM
NOTES TO FINANCIAL STATEMENTS
At October 31, 2005
(all amounts in thousands)
NOTE 1. ORGANIZATION AND SIGNIFICANT ACCOUNTING POLICIES
Transamerica IDEX Mutual Funds is an open-end management investment company registered under the Investment Company Act of 1940, as amended (the "1940 Act").
In the normal course of business, TA IDEX Great Companies–AmericaSM (the "Fund") enters into contracts that contain a variety of representations that provide general indemnifications. The Fund's maximum exposure under these arrangements is unknown, as this would involve future claims that may be made against the Fund and/or its affiliates that have not yet occurred. However, based on experience, the Fund expects the risk of loss to be remote.
The Fund is "non-diversified" under the 1940 Act.
This report should be read in conjunction with the current Fund prospectus, which contains more complete information about the Fund.
The following is a summary of significant accounting policies followed by the Fund in the preparation of the financial statements. In preparing the Fund's financial statements in accordance with accounting principles generally accepted in the United States of America ("GAAP"), estimates or assumptions (which could differ from actual results) may be used that affect reported amounts and disclosures.
Multiple class operations, income and expenses: The Fund currently offers three classes of shares, each with a public offering price that reflects different sales charges, if any, and expense levels. On June 15, 2004, Class C2 shares merged into Class C. On September 24, 2004, Class M shares merged into Class C. Class B shares will convert to Class A shares eight years after purchase. Income, non-class specific expenses and realized and unrealized gains and losses, are allocated daily to each class, based upon the value of shares outstanding method as permitted under Rule 18f-3 of the 1940 Act. Each class bears its own specific expenses as well as a portion of general, common expenses.
Security valuations: The Fund values its investments at the close of the New York Stock Exchange ("NYSE"), normally 4 p.m. ET, each day the NYSE is open for business. Fund investments are valued at the last sale price or closing price on the day of valuation taken from the primary exchange where the security is principally traded.
Securities traded in the over-the-counter market and listed securities for which no sale was reported on that date are valued at the last quoted bid price.
Debt securities are valued based on a price quotation or other equivalent indication of value supplied by an exchange, a pricing service or a major market maker; however, those that mature in sixty days or less are valued at amortized cost, which approximates market.
Investment company securities are valued at the net asset value of the underlying portfolio.
Other securities for which quotations are not readily available or whose values have been determined to be unreliable are valued at fair market value as determined in good faith by the Fund's Administrative Valuation Committee, under the supervision of the Board's Valuation Committee, using guidelines adopted by the Board of Trustees.
Cash: The Fund may leave cash overnight in its cash account with the custodian, Investors Bank & Trust Company ("IBT"). IBT has been contracted on behalf of the Fund to invest the excess cash into a savings account, which at October 31, 2005, was paying an interest rate of 2.76%.
Repurchase agreements: The Fund is authorized to enter into repurchase agreements. The Fund, through its custodian, IBT, receives delivery of the underlying securities, the value of which at the time of purchase is required to be an amount equal to at least 100% of the resale price. The Fund will bear the risk of value fluctuations until the security can be sold and may encounter delays and incur costs in liquidating the security. In the event of bankruptcy or insolvency of the seller, delays and costs may be incurred.
Commission recapture: The sub-adviser, to the extent consistent with the best execution and usual commission rate policies and practices, may place security transactions of the Fund with broker/dealers with which Transamerica IDEX Mutual Funds has established a Commission Recapture Program. A Commission Recapture Program is any arrangement under which a broker/dealer applies a portion of the commissions received by such broker/dealer on the security transactions to the Fund. In no event will commissions paid by the Fund be used to pay expenses that would otherwise be borne by any other funds within Transamerica IDEX Mutual Funds, or by any other party.
Recaptured commissions during the year ended October 31, 2005, of $33 are included in net realized gains in the Statement of Operations
Securities lending: The Fund may lend securities to qualified borrowers, with IBT acting as the Fund's lending agent. The Fund earns negotiated lenders' fees. The Fund receives cash and/or securities as collateral against the loaned securities. Cash collateral received is invested in short term, interest bearing securities. The Fund monitors the market value of securities loaned on a daily basis and requires collateral in an amount at least equal to the value of the securities loaned. Income from loaned securities on the Statement of Operations is net of fees, in the amount of $2, earned by IBT for its services.
Security transactions and investment income: Security transactions are recorded on the trade date. Security gains and losses are calculated
Transamerica IDEX Mutual Funds
Annual Report 2005
9
TA IDEX Great Companies–AmericaSM
NOTES TO FINANCIAL STATEMENTS (continued)
At October 31, 2005
(all amounts in thousands)
NOTE 1.–(continued)
on the specific identification basis. Dividend income, if any, is recorded on the ex-dividend date or, in the case of foreign securities, as soon as the Fund is informed of the ex-dividend date. Interest income, including accretion of discounts and amortization of premiums, is recorded on the accrual basis commencing on the settlement date.
Redemption fees: A short-term trading redemption fee may be assessed on any Fund shares in a fund account that are sold during the first five (5) NYSE trading days following their purchase date. This redemption fee will equal 2% of the amount redeemed and shares held the longest will be treated as being redeemed first and shares held the shortest as being redeemed last. For the year ended October 31, 2005, the Fund received less than $1 in redemption fees.
Dividend distributions: Distributions to shareholders are recorded on the ex-dividend date and are determined in accordance with Federal income tax regulations which may differ from GAAP.
NOTE 2. RELATED PARTY TRANSACTIONS
Effective January 1, 2005 AEGON/Transamerica Fund Advisors, Inc. was renamed Transamerica Fund Advisors, Inc. ("TFAI"); AEGON/Transamerica Fund Services, Inc. and AEGON/Transamerica Investor Services, Inc. merged into one entity and was renamed Transamerica Fund Services, Inc. ("TFS").
TFAI is the Fund's investment adviser. TFS is the Fund's administrator and transfer agent. AFSG Securities Corp. ("AFSG") is the Fund's distributor/principal underwriter. TFAI, TFS , and AFSG are affiliates of AEGON, NV, a Netherlands corporation.
Great Companies, LLC is both an affiliate of the Fund and a sub-adviser to the Fund.
Investment advisory fees: The Fund pays management fees to TFAI based on average daily net assets ("ANA") at the following breakpoints:
From November 1, 2004 to December 31, 2004:
0.80% of the first $500 million of ANA
0.70% of ANA over $500 million
From January 1, 2005 on:
0.775% of the first $250 million of ANA
0.75% of the next $250 million of ANA
0.70% of the next $500 million of ANA
0.65% of ANA over $1 billion
TFAI has contractually agreed to waive its advisory fee and will reimburse the Fund to the extent that operating expenses, excluding 12b-1 fees, exceed the following stated annual limit:
From November 1, 2004 to December 31, 2004:
1.20% Expense Limit
From January 1, 2005 on:
1.175% Expense Limit
If total Fund expenses fall below the annual expense limitation agreement agreed to by the adviser within the succeeding three years, the Fund may be required to pay that adviser a portion or all of the waived advisory fees.
| | | Advisory Fee
Waived | | Available for
Recapture Through | |
| Fiscal Year 2003 | | $ | 148 | | | | 10/31/2006 | | |
If total class expenses fall below the annual expense limitation agreement agreed to by the adviser within the succeeding three years, the Fund may be required to pay that adviser a portion or all of the reimbursed expenses.
| | | Reimbursement of
Class Expenses | | Available for
Recapture Through | |
| Fiscal Year 2005: | |
| Class A | | $ | 25 | | | 10/31/2008 | |
| Class B | | | 40 | | | 10/31/2008 | |
| Class C | | | 14 | | | 10/31/2008 | |
| Fiscal Year 2004: | |
| Class A | | | 2 | | | 10/31/2007 | |
| Class C | | | 7 | | | 10/31/2007 | |
There were no amounts recaptured during the year ended October 31, 2005.
Distribution and service fees: The Fund has a 12b-1 distribution plan under the 1940 Act pursuant to which an annual fee, based on average daily net assets, is paid to the distributor for various disbursements such as broker-dealer account servicing fees and other promotional expenses of the Fund. The Fund is authorized under the 12b-1 plan to pay fees on each class up to the following limits:
| Class A | | | 0.35 | % | |
| Class B | | | 1.00 | % | |
| Class C | | | 1.00 | % | |
Transamerica IDEX Mutual Funds
Annual Report 2005
10
TA IDEX Great Companies–AmericaSM
NOTES TO FINANCIAL STATEMENTS (continued)
At October 31, 2005
(all amounts in thousands)
NOTE 2.–(continued)
In the case the Fund or a class of shares of the Fund is closed to new investors or investments, the Fund is authorized to pay 12b-1 fees for past sales and distribution efforts and present and past investor services.
Underwriter commissions relate to front-end sales charges imposed for Class A shares and contingent deferred sales charges from Classes B, C, and certain A share redemptions. For the year ended October 31, 2005, the underwriter commissions were as follows:
| Received by Underwriter | | $ | 189 | | |
| Retained by Underwriter | | | 8 | | |
| Contingent Deferred Sales Charge | | | 202 | | |
Administrative services: The Fund has entered into an agreement with TFS for financial and legal fund administration services. As of January 1, 2005 the Fund pays TFS an annual fee of 0.02% of ANA. Prior to January 1, 2005 the Fund paid TFS an annual fee of 0.015% of ANA. The Legal fees on the Statement of Operations are for fees paid to external legal counsel.
Transfer agent fees: The Fund pays TFS an annual per-account charge for each open and closed account. The Fund paid TFS $340 for the year ended October 31, 2005.
Deferred compensation plan: Each eligible independent Fund Trustee may elect to participate in a non-qualified deferred compensation plan maintained by Transamerica IDEX Mutual Funds (the "Plan"). Under the Plan, such Trustees may defer payment of all or a portion of their total fees earned as a Fund Trustee. Each Trustee who is a participant in the Plan may elect that the earnings, losses or gains credited to his or her deferred fee amounts be determined based on a deemed investment in any series of Transamerica IDEX Mutual Funds, including the Fund. The right of a participant to receive a distribution from the Plan of the deferred fees is an unsecured claim against the general assets of all series of Transamerica IDEX Mutual Funds. The pro rata liability to the Fund of all deferred fees i n the Plan amounted, as of October 31, 2005, to $8.
NOTE 3. INVESTMENT TRANSACTIONS
The cost of securities purchased and proceeds from securities sold (excluding short-term securities) for the year ended October 31, 2005, were as follows:
| Purchases of securities: | | | |
| Long-Term | | $ | 108,006 | | |
| U.S. Government | | | – | | |
| Proceeds from maturities and sales of securities: | | | |
| Long-Term | | | 149,120 | | |
| U.S. Government | | | – | | |
NOTE 4. FEDERAL INCOME TAX MATTERS
The Fund has not made any provision for federal income or excise taxes due to its policy to distribute all of its taxable income and capital gains to its shareholders and otherwise qualify as a regulated investment company under Subchapter M of the Internal Revenue Code. Income and capital gain distributions are determined in accordance with income tax regulations, which may differ from GAAP. These differences are primarily due to differing treatment for items including, but not limited to, wash sales, net operating losses and capital loss carryforwards.
Therefore, distributions determined in accordance with tax regulations may differ significantly in amount or character from net investment income and realized gains for financial reporting purposes. Financial reporting records are adjusted for permanent book/tax differences to reflect tax character. Financial records are not adjusted for temporary differences. These reclassifications are as follows:
Shares of beneficial interest, unlimited
shares authorized | | $ | (612 | ) | |
| Accumulated net investment income (loss) | | | 612 | | |
The capital loss carryforwards are available to offset future realized capital gains through the periods listed:
Capital Loss
Carryforward | | Available Through | |
| $ | 1,301 | | | October 31, 2010 | |
| | 10,217 | | | October 31, 2011 | |
The capital loss carryforward utilized during the year ended October 31, 2005 was $8,773.
The tax basis components of distributable earnings as of October 31, 2005, are as follows:
| Undistributed Ordinary Income | | $ | – | | |
| Undistributed Long-term Capital Gains | | $ | – | | |
| Capital Loss Carryforward | | $ | (11,518 | ) | |
| Net Unrealized Appreciation (Depreciation) | | $ | 3,644 | * | |
*Amount includes unrealized appreciation (depreciation) from deferred compensation.
The aggregate cost of investments and composition of unrealized appreciation (depreciation) for federal income tax purposes as of October 31, 2005, are as follows:
| Federal Tax Cost Basis | | $ | 87,476 | | |
| Unrealized Appreciation | | $ | 5,299 | | |
| Unrealized (Depreciation) | | | (1,655 | ) | |
| Net Unrealized Appreciation (Depreciation) | | $ | 3,644 | | |
NOTE 5. REGULATORY PROCEEDINGS
There continues to be significant federal and state regulatory activity relating to financial services companies, particularly mutual fund
Transamerica IDEX Mutual Funds
Annual Report 2005
11
TA IDEX Great Companies–AmericaSM
NOTES TO FINANCIAL STATEMENTS (continued)
At October 31, 2005
(all amounts in thousands)
NOTE 5.–(continued)
companies and their investment advisers. As part of an ongoing investigation regarding potential market timing, recordkeeping and trading compliance issues and matters affecting the Fund's investment adviser, TFAI, and certain affiliates and former employees of TFAI, the SEC staff has indicated that it is likely to take some action against TFAI and certain of its affiliates at the conclusion of the investigation. The potential timing and the scope of any such action is difficult to predict. Although the impact of any action brought against TFAI and/or its affiliates is difficult to assess at the present time, the Fund currently believes that the likelihood that any such action will have a material adverse impact on it is remote. It is important to note that the Fund is not aware of any allegation of wrongdoing against it and its Board at the time this annual report is printed. Although it is not anticip ated that these developments will have an adverse impact on the Fund, there can be no assurance at this time. TFAI and its affiliates are actively working with the SEC in regard to this matter; however, the exact resolution cannot be determined at this time. TFAI will take such actions that it deems necessary or appropriate to continue providing management services to the Fund and to bring all matters to an appropriate conclusion.
TFAI and/or its affiliates, and not the Fund, will bear the costs regarding these regulatory matters.
Transamerica IDEX Mutual Funds
Annual Report 2005
12
Report of Independent Registered Certified Public Accounting Firm
To the Board of Trustees and Shareholders of
TA IDEX Great Companies–AmericaSM
In our opinion, the accompanying statement of assets and liabilities, including the schedule of investments, and the related statements of operations and of changes in net assets and the financial highlights present fairly, in all material respects, the financial position of TA IDEX Great Companies–AmericaSM (the "Fund") (one of the portfolios constituting the Transamerica IDEX Mutual Funds) at October 31, 2005, the results of its operations for the year then ended, the changes in its net assets for each of the two years in the period then ended and the financial highlights for each of the periods presented, in conformity with accounting principles generally accepted in the United States of America. These financial statements and financial highlights (hereafter referred to as "financial statements") are the responsibility of the Fund's management; our responsibility is to express an opinion on these financial statements based on our audits. We conducted our audits of these financial statements in accordance with the standards of the Public Company Accounting Oversight Board (United States). Those standards require that we plan and perform the audit to obtain reasonable assurance about whether the financial statements are free of material misstatement. An audit includes examining, on a test basis, evidence supporting the amounts and disclosures in the financial statements, assessing the accounting principles used and significant estimates made by management, and evaluating the overall financial statement presentation. We believe that our audits, which included confirmation of securities at October 31, 2005 by correspondence with the custodian, provide a reasonable basis for our opinion.

December 22, 2005
Transamerica IDEX Mutual Funds
Annual Report 2005
13
TA IDEX Great Companies–TechnologySM
MARKET ENVIRONMENT
High winds and high energy prices have combined to make forecasting an even more difficult task than usual. Investors seem to have taken shelter by fleeing from stocks at the first whiff of trouble and that has increased individual stock volatility sharply. Further, uncertainty about the duration of the rise in interest rates is causing a rising fear of consumer spending weakness. With more and more of technology companies' products aimed at the consumer market (cell phones, music players, and digital televisions), consumer attitudes seem to have a greater influence on technology stock prices. These continuing worries about consumer spending for the holiday season will likely keep technology stock prices dampened until the season's results are known.
PERFORMANCE
For the year ended October 31, 2005, TA IDEX Great Companies–Technologysm, Class A returned 1.23%. By comparison its benchmark, the NASDAQ 100 Index returned 6.22%.
STRATEGY REVIEW
Quality differentials between high quality stocks and low quality stocks contributed to the Fund underperforming during the past year. We continue to emphasize investment in the highest quality producers of technology, including those companies with products aimed at satisfying the rapidly growing appetites of consumers for the newest, best things.
During the year we made the following changes to the portfolio:
Additions:
Adobe Systems Incorporated ("Adobe")-The company is the world leader in graphics and portable document software. Investor concerns about competition from Microsoft Corporation ("Microsoft") allowed the purchase of Adobe shares at a very favorable price.
We added several small biotechnology firms that have products in place to be competitive relative to their peers: Alkermes, Inc, Amylin Pharmaceuticals, Inc. ("Amylin"), Telik, Inc., and Vertex Pharmaceuticals Incorporated ("Vertex").
Apple Computer, Inc.-This niche maker of personal computers has, over the last year, re-invented the music delivery business with its iPod devices. The dominance of the company's market position in high-end personal computing is enhanced by the rapid growth of both iPod and music revenues.
Corning Incorporated ("Corning")-Corning is the world's dominant supplier of glass substrates for Liquid Crystal Display ("LCD") flat panel displays, including High Definition television sets. In addition, the company is a leading supplier of equipment used in fiber optic connections to customers' premises. The implementation of installations of high speed broadband fiber-based services is accelerating here in North America and is expected as well in Europe
FLIR Systems, Inc. ("FLIR")-FLIR is a leading supplier of infrared detection systems and thermal imaging systems. The company has established a strong product profile in super-cooled and "un-cooled" detection technology that will provide a strong competitive base for entry of this technology into automobile, security and law enforcement applications.
Hewlett-Packard Company ("Hewlett-Packard")-A high-profile change in management and a recommitment by the board to repairing the competitive position of this company encouraged us to establish a position in this stock.
Motorola, Inc. ("Motorola")-The revival of the competitive strength of this venerable communications equipment company is resulting in rising revenue growth, a rapid flow of iconic new cellular handsets and the re-establishment of the Motorola brand as one of the most dominant global companies in the wireless communications market.
Nokia Corporation-The current dominant worldwide wireless handset and infrastructure provider had some temporary disappointment with margins that caused a deeper discount of its stock price to its intrinsic value.
Yahoo! Inc.-The increased discount to its intrinsic value with a positive assessment on our part of the company's competitive stance were the reasons for re-establishing this previous holding.
Deletions:
Amylin-A very powerful rise the stock price of more than 50% induced us to take profits in this stock.
Dell Inc. ("Dell")-The deterioration of the outlook for Dell's ability to maintain its revenue growth rate in the face of intensifying competition resulted in our elimination of this stock.
The best performing stocks for the year included Electronic Arts Inc., Vertex, Amgen Inc., Hewlett-Packard, Logitech International S.A., Motorola, and Adobe.
The worst performing stocks for the year included Symantec, FLIR, Xilinx, Inc., Analog Devices, Inc., Alkermes Inc, Telik Inc. and Linear Technology Corporation.
| Jim Huguet | | Matt Stephani, CFA, CPA | |
|
| Gerry Bollman, CFA | | Derek Hong, CFA | |
|
| Co-Fund Managers | | | |
|
| Great Companies, L.L.C. | | | |
|
Transamerica IDEX Mutual Funds
Annual Report 2005
1
TA IDEX Great Companies–TechnologySM
Comparison of change in value of $10,000 investment in Class A shares and its comparative index.
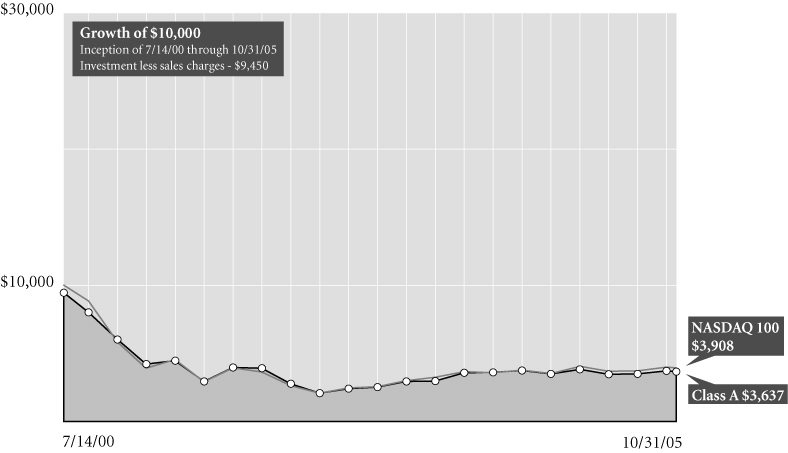
Average Annual Total Return for Periods Ended 10/31/05
| | | 1 year | | 5 years | | From
Inception | | Inception
Date | |
| Class A (NAV) | | | 1.23 | % | | | (13.48 | )% | | | (16.49 | )% | | 7/14/00 | |
| Class A (POP) | | | (4.33 | )% | | | (14.45 | )% | | | (17.38 | )% | | 7/14/00 | |
| NASDAQ 1001 | | | 6.22 | % | | | (13.61 | )% | | | (16.25 | )% | | 7/14/00 | |
| Class B (NAV) | | | 0.00 | % | | | (14.20 | )% | | | (17.19 | )% | | 7/14/00 | |
| Class B (POP) | | | (5.00 | )% | | | (14.37 | )% | | | (17.19 | )% | | 7/14/00 | |
| Class C (NAV) | | | 0.00 | % | | | – | | | | 14.56 | % | | 11/11/02 | |
| Class C (POP) | | | (1.00 | )% | | | – | | | | 14.56 | % | | 11/11/02 | |
NOTES
1 The NASDAQ 100 (NASDAQ 100) Index is an unmanaged index used as a general measure of market performance. Calculations assume dividends and capital gains are reinvested and do not include any managerial expenses. From inception calculation is based on life of Class A shares. Source: Standard & Poor's Micropal®© Micropal, Inc. 2005 – 1-800-596-5323 – http://www.funds-sp.com.
The performance data presented represents past performance, future results may vary. Performance data does not reflect the deduction of taxes that would be paid on fund distributions or the redemption of fund shares. Investment return and principal value will fluctuate so that an investor's shares, when redeemed, may be worth more or less than their original cost. Current performance may be lower or higher than performance quoted. Please see www.transamericaidex.com for performance data current to the most recent month-end.
Public Offering Price (POP) returns include the reinvestment of dividends and capital gains and reflect the maximum sales charge of 5.5% for A shares or the maximum applicable contingent deferred sales charge (5% in the 1st year, decreasing to 0% after 6 years) for Class B shares and 1% (during the first 12 months) for Class C shares. Shares purchased prior to March 1, 2004 are subject to a maximum applicable contingent deferred sales charge (5% in the 1st year, decreasing to 0% after 7 years) for Class B shares and (2% in the 1st year, decreasing to 0% after 2 years) for Class C shares. Net Asset Value (NAV) returns include the reinvestment of dividends and
capital gains but do not reflect any sales charges.
Investing in technology stocks generally involves greater volatility and risks, so an investment in the fund may not be appropriate for everyone.
The Fund is non-diversified. Investments in a "non-diversified" fund may be subject to specific risks such as susceptibility to single economic, political or regulatory events, and may be subject to greater loss than investments in a diversified fund.
The management of this fund is based on a specific philosophy and on proprietary systems and methodology. There is no guarantee the fund will achieve its objectives.
This material must be preceded or accompanied by a current prospectus, which includes specific contents regarding the investment objectives and policies of this fund.
Transamerica IDEX Mutual Funds
Annual Report 2005
2
TA IDEX Great Companies–TechnologySM
UNDERSTANDING YOUR FUND'S EXPENSES
(unaudited)
SHAREHOLDER EXPENSES
Fund shareholders may incur two types of costs: (1) transaction costs, including sales charges (loads) on purchases, contingent deferred sales charges on redemptions and redemption fees; and (2) ongoing costs, including management fees, 12b-1 distribution and service fees, and other fund expenses.
The following Example is intended to help you understand your ongoing costs (in dollars and cents) of investing in a Fund and to compare these costs with the ongoing costs of investing in other funds.
The Example is based on an investment of $1,000 invested at May 1, 2005 and held for the entire period until October 31, 2005.
ACTUAL EXPENSES
The first line in the table below provides information about actual account values and actual expenses. You may use the information in this line, together with the amount you invested, to estimate the expenses that you paid over the period. Simply divide your account value by $1,000 (for example, an $8,600 account value divided by $1,000 = 8.6), then multiply the result by the number in the first line of your Fund under the heading entitled "Expenses Paid During Period" to estimate the expenses you paid on your account during this period. If your account is an IRA, your expenses could have included a $15 annual fee. The amount of any fee paid through your account would increase the estimate of expenses you paid during the period and decrease your ending account value.
HYPOTHETICAL EXAMPLE FOR COMPARISON PURPOSES
The second line in the table below provides information about hypothetical account values and hypothetical expenses based on the Fund's actual expense ratio and an assumed rate of return of 5% per year before expenses, which is not the Fund's actual return. The hypothetical account values and expenses may not be used to estimate the actual ending account balance or expenses you paid for the period. You may use this information to compare the ongoing costs of investing in your Fund and other funds. To do so, compare this 5% hypothetical example with the 5% hypothetical examples that appear in the shareholder reports of the other funds. As in the case of the actual expense example, if your account is subject to an IRA fee, the amount of the fee paid through your account would increase the hypothetical expenses you would have paid during the period and decrease the hypothetical ending account value.
Please note that the expenses shown in the table are meant to highlight your ongoing costs only and do not reflect any transactional costs, such as sales charges, redemption fees, brokerage commissions paid on purchases and sales of fund shares. Therefore, the second line under the Fund in the table is useful in comparing ongoing costs only, and will not help you determine the relative total costs of owning different funds. If any of these transaction costs were included, your costs would be higher. The expenses shown in the table do not reflect any fees that may be charged to you by brokers, financial intermediaries or other financial institutions.
| | | Beginning
Account
Value | | Ending
Account
Value | | Annualized
Expense
Ratio | | Expenses Paid
During Period (a) | |
| Class A | | | |
| Actual | | $ | 1,000.00 | | | $ | 1,092.90 | | | | 1.36 | % | | $ | 7.17 | | |
| Hypothetical (b) | | | 1,000.00 | | | | 1,018.35 | | | | 1.36 | | | | 6.92 | | |
| Class B | | | |
| Actual | | | 1,000.00 | | | | 1,088.80 | | | | 2.20 | | | | 11.58 | | |
| Hypothetical (b) | | | 1,000.00 | | | | 1,014.12 | | | | 2.20 | | | | 11.17 | | |
| Class C | | | |
| Actual | | | 1,000.00 | | | | 1,085.80 | | | | 2.21 | | | | 11.62 | | |
| Hypothetical (b) | | | 1,000.00 | | | | 1,014.06 | | | | 2.21 | | | | 11.22 | | |
(a) Expenses are calculated using each Fund's annualized expense ratio (as disclosed in the table), multiplied by the average account value for the period, multiplied by number of days in the period (184 days), and divided by the number of days in the year (365 days).
(b) 5% return per year before expenses.
GRAPHICAL PRESENTATION OF SCHEDULE OF INVESTMENTS
By Industry
At October 31, 2005
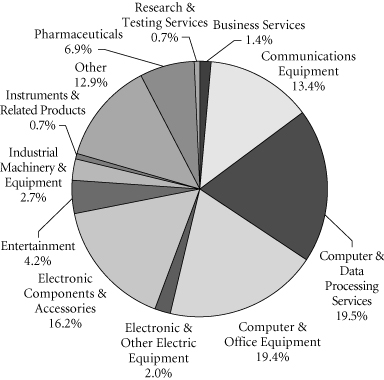
This chart shows the percentage breakdown by industry of the Fund's total investment securities.
Transamerica IDEX Mutual Funds
Annual Report 2005
3
TA IDEX Great Companies–TechnologySM
SCHEDULE OF INVESTMENTS
At October 31, 2005
(all amounts except share amounts in thousands)
| | | Shares | | Value | |
| COMMON STOCKS (94.2%) | | | |
| Business Services (1.5%) | | | |
| First Data Corp. | | | 26,843 | | | $ | 1,086 | | |
| Communications Equipment (14.5%) | | | |
| Corning, Inc. ‡ | | | 157,000 | | | | 3,154 | | |
| Motorola, Inc. | | | 142,700 | | | | 3,162 | | |
| Nokia Corp., ADR | | | 128,000 | | | | 2,153 | | |
| QUALCOMM, Inc. | | | 55,250 | | | | 2,197 | | |
| Computer & Data Processing Services (21.1%) | | | |
| Adobe Systems, Inc. † | | | 80,000 | | | | 2,580 | | |
| Electronic Arts, Inc. ‡ | | | 30,000 | | | | 1,706 | | |
| Microsoft Corp. | | | 218,700 | | | | 5,621 | | |
| Symantec Corp. ‡ | | | 97,050 | | | | 2,315 | | |
| Yahoo!, Inc. ‡ | | | 89,000 | | | | 3,290 | | |
| Computer & Office Equipment (21.0%) | | | |
| Apple Computer, Inc. ‡ | | | 110,070 | | | | 6,339 | | |
| EMC Corp. ‡ | | | 233,600 | | | | 3,261 | | |
| Hewlett-Packard Co. | | | 53,000 | | | | 1,486 | | |
| Logitech International SA, ADR ‡† | | | 112,808 | | | | 4,327 | | |
| Electronic & Other Electric Equipment (2.2%) | | | |
| Samsung Electronics Co., Ltd., GDR–144A | | | 6,000 | | | | 1,602 | | |
| Electronic Components & Accessories (17.6%) | | | |
| Analog Devices, Inc. | | | 68,200 | | | | 2,372 | | |
| Intel Corp. | | | 144,524 | | | | 3,396 | | |
| Linear Technology Corp. | | | 94,400 | | | | 3,135 | | |
| Texas Instruments, Inc. | | | 47,000 | | | | 1,342 | | |
| Xilinx, Inc. | | | 113,400 | | | | 2,716 | | |
| Entertainment (4.6%) | | | |
| International Game Technology † | | | 126,900 | | | | 3,362 | | |
| Industrial Machinery & Equipment (2.9%) | | | |
| Applied Materials, Inc. † | | | 131,300 | | | | 2,151 | | |
| Instruments & Related Products (0.7%) | | | |
| FLIR Systems, Inc. ‡ | | | 25,000 | | | | 524 | | |
| Pharmaceuticals (7.4%) | | | |
| Alkermes, Inc. ‡† | | | 20,700 | | | | 337 | | |
| Amgen, Inc. ‡† | | | 18,850 | | | | 1,428 | | |
| Genzyme Corp. ‡ | | | 32,600 | | | | 2,357 | | |
| Vertex Pharmaceuticals, Inc. ‡ | | | 59,000 | | | | 1,342 | | |
| Research & Testing Services (0.7%) | | | |
| Telik, Inc. ‡† | | | 35,000 | | | | 523 | | |
| Total Common Stocks (cost: $67,908) | | | | | | | 69,264 | | |
| | | Principal | | Value | |
| SECURITY LENDING COLLATERAL (13.9%) | | | |
| Debt (12.9%) | | | |
| Bank Notes (0.9%) | | | |
Bank of America
3.81%, due 06/07/2006 *
3.81%, due 08/10/2006 * | | | $287
284 | | | | $287
284 | | |
Credit Suisse First Boston Corp.
4.11%, due 03/10/2006 * | | | 57 | | | | 57 | | |
| Certificates Of Deposit (0.9%) | | | |
Canadian Imperial Bank of Commerce
4.07%, due 11/04/2005 * | | | 227 | | | | 227 | | |
Harris Trust & Savings Bank
3.80%, due 11/04/2005 * | | | 181 | | | | 181 | | |
Rabobank Nederland
4.03%, due 05/31/2006 * | | | 284 | | | | 284 | | |
| Commercial Paper (2.8%) | | | |
Ciesco LLC
4.00%, due 11/03/2005 | | | 284 | | | | 284 | | |
General Electric Capital Corp.
3.96%, due 12/05/2005 | | | 227 | | | | 227 | | |
Paradigm Funding LLC–144A
4.01%, due 11/07/2005 | | | 227 | | | | 227 | | |
Park Avenue Receivables Corp.–144A
4.03%, due 12/02/2005 | | | 225 | | | | 225 | | |
Preferred Receivables Corp.–144A
4.04%, due 12/05/2005 | | | 171 | | | | 171 | | |
Ranger Funding Co. LLC–144A
3.99%, due 11/15/2005 | | | 169 | | | | 169 | | |
Sheffield Receivables Corp.–144A
4.01%, due 11/08/2005 | | | 171 | | | | 171 | | |
Yorktown Capital LLC
3.97%, due 11/09/2005
3.93%, due 11/17/2005 | | | 283
282 | | | | 283
282 | | |
| Euro Dollar Overnight (3.0%) | | | |
Bank of Montreal
3.79%, due 11/01/2005 | | | 171 | | | | 171 | | |
Barclays
3.80%, due 11/04/2005 | | | 227 | | | | 227 | | |
BNP Paribas
3.83%, due 11/02/2005 | | | 341 | | | | 341 | | |
Deutsche Bank
3.80%, due 11/02/2005 | | | 569 | | | | 569 | | |
HSBC Banking/Holdings PLC
3.84%, due 11/07/2005 | | | 171 | | | | 171 | | |
Royal Bank of Scotland
3.76%, due 11/01/2005 | | | 227 | | | | 227 | | |
The notes to the financial statements are an integral part of this report.
Transamerica IDEX Mutual Funds
Annual Report 2005
4
TA IDEX Great Companies–TechnologySM
SCHEDULE OF INVESTMENTS (continued)
At October 31, 2005
(all amounts except share amounts in thousands)
| | | Principal | | Value | |
| Euro Dollar Overnight (continued) | |
Svenska Handlesbanken
4.03%, due 11/01/2005 | | $ | 293 | | | $ | 293 | | |
UBS AG
3.80%, due 11/03/2005 | | | 228 | | | | 228 | | |
| Euro Dollar Terms (1.1%) | |
Royal Bank of Scotland
4.00%, due 12/12/2005 | | | 228 | | | | 228 | | |
UBS AG
4.02%, due 12/01/2005 | | | 228 | | | | 228 | | |
Wells Fargo
3.96%, due 11/14/2005 | | | 341 | | | | 341 | | |
| Promissory Notes (0.3%) | |
Goldman Sachs Group, Inc.
4.02%, due 12/28/2005 | | | 239 | | | | 239 | | |
| Repurchase Agreements (3.9%) †† | |
Credit Suisse First Boston Corp.
4.10%, dated 10/31/2005 to be repurchased
at $388 on 11/01/2005 | | | 388 | | | | 388 | | |
Goldman Sachs Group, Inc. (The)
4.10%, dated 10/31/2005 to be repurchased
at $967 on 11/01/2005 | | | 967 | | | | 967 | | |
Lehman Brothers, Inc.
4.10%, dated 10/31/2005 to be repurchased
at $27 on 11/01/2005 | | | 27 | | | | 27 | | |
| | | Principal | | Value | |
| Repurchase Agreements (continued) | | | |
Merrill Lynch & Co.
4.10%, dated 10/31/2005 to be repurchased
at $1,138 on 11/01/2005 | | $ | 1,138 | | | $ | 1,138 | | |
Morgan Stanley Dean Witter & Co.
4.17%, dated 10/31/2005 to be repurchased
at $341 on 11/01/2005 | | | 341 | | | | 341 | | |
| | | Shares | | Value | |
| Investment Companies (1.0%) | | | |
| Money Market Funds (1.0%) | | | |
American Beacon Fund
1-day yield of 3.81% | | | 245,249 | | | $ | 245 | | |
Barclays Global Investors
Institutional Money Market Fund
1-day yield of 3.92% | | | 227,517 | | | | 228 | | |
Goldman Sachs Financial
Square Prime Obligations Fund
1-day yield of 3.79% | | | 35,440 | | | | 35 | | |
Merrimac Cash Fund, Premium Class
1-day yield of 3.70% @ | | | 225,003 | | | | 225 | | |
| Total Security Lending Collateral (cost: $10,216) | | | | | | | 10,216 | | |
| Total Investment Securities (cost: $78,124) | | | | | | $ | 79,480 | | |
| SUMMARY: | | | |
| Investment securities, at value | | | 108.1 | % | | $ | 79,480 | | |
| Liabilities in excess of other assets | | | (8.1 | )% | | | (5,962 | ) | |
| Net assets | | | 100.0 | % | | $ | 73,518 | | |
NOTES TO SCHEDULE OF INVESTMENTS:
‡ Non-income producing.
† At October 31, 2005, all or a portion of this security is on loan (see Note 1). The value at October 31, 2005, of all securities on loan is $9,780.
* Floating or variable rate note. Rate is listed as of October 31, 2005.
†† Cash collateral for the Repurchase Agreements, valued at $2,917, that serve as collateral for securities lending are invested in corporate bonds with interest rates and maturity dates ranging from 0.00%–9.86% and 12/31/2005–11/15/2096, respectively.
@ Regulated investment company advised by Investors Bank and Trust Co. ("IBT"). IBT is also the accounting, custody and lending agent for the Fund.
DEFINITIONS:
144A 144A Securities are registered pursuant to Rule 144A of the Securities Act of 1933. These securities are deemed to be liquid for purposes of compliance limitations on holdings of illiquid securities and may be resold as transactions exempt from registration, normally to qualified institutional buyers. At October 31, 2005, these securities aggregated $2,565 or 3.5% of the net assets of the Fund.
ADR American Depositary Receipt
GDR Global Depositary Receipt
The notes to the financial statements are an integral part of this report.
Transamerica IDEX Mutual Funds
Annual Report 2005
5
TA IDEX Great Companies–TechnologySM
STATEMENT OF ASSETS AND LIABILITIES
At October 31, 2005
(all amounts except per share amounts in thousands)
| Assets: | | | |
Investment securities, at value (cost: $78,124)
(including securities loaned of $9,780) | | $ | 79,480 | | |
| Cash | | | 5,102 | | |
| Receivables: | |
| Shares of beneficial interest sold | | | 5 | | |
| Interest | | | 13 | | |
| Dividends | | | 11 | | |
| Other | | | 3 | | |
| | | | 84,614 | | |
| Liabilities: | | | |
| Investment securities purchased | | | 701 | | |
| Accounts payable and accrued liabilities: | |
| Shares of beneficial interest redeemed | | | 71 | | |
| Management and advisory fees | | | 46 | | |
| Distribution and service fees | | | 26 | | |
| Transfer agent fees | | | 10 | | |
| Administration fees | | | 1 | | |
| Payable for collateral for securities on loan | | | 10,216 | | |
| Other | | | 25 | | |
| | | | 11,096 | | |
| Net Assets | | $ | 73,518 | | |
| Net Assets Consist of: | | | |
Shares of beneficial interest, unlimited shares
authorized, no par value | | $ | 71,093 | | |
| Undistributed net investment income (loss) | | | 2 | | |
Undistributed net realized gain (loss) from investment
securities | | | 1,067 | | |
Net unrealized appreciation (depreciation) on
investment securities | | | 1,356 | | |
| Net Assets | | $ | 73,518 | | |
| Net Assets by Class: | | | |
| Class A | | $ | 65,423 | | |
| Class B | | | 5,316 | | |
| Class C | | | 2,779 | | |
| Shares Outstanding: | | | |
| Class A | | | 17,131 | | |
| Class B | | | 1,445 | | |
| Class C | | | 756 | | |
| Net Asset Value Per Share: | | | |
| Class A | | $ | 3.82 | | |
| Class B | | | 3.68 | | |
| Class C | | | 3.67 | | |
| Maximum Offering Price Per Share (a): | | | |
| Class A | | $ | 4.04 | | |
(a) Includes the maximum selling commission (represented as a percentage of offering price) which is reduced on certain levels of sales as set forth in the Prospectus. Net asset value per share for Classes B and C shares represents offering price. The redemption price for Classes B and C shares equals net asset value less any applicable contingent deferred sales charge.
STATEMENT OF OPERATIONS
For the year ended October 31, 2005
(all amounts in thousands)
| Investment Income: | | | |
| Interest | | $ | 96 | | |
| Dividends | | | 1,616 | | |
| Income from loaned securities–net | | | 6 | | |
| | | | 1,718 | | |
| Expenses: | | | |
| Management and advisory fees | | | 716 | | |
| Distribution and service fees: | |
| Class A | | | 280 | | |
| Class B | | | 62 | | |
| Class C | | | 34 | | |
| Transfer agent fees: | |
| Class A | | | 55 | | |
| Class B | | | 41 | | |
| Class C | | | 16 | | |
| Printing and shareholder reports | | | 15 | | |
| Custody fees | | | 10 | | |
| Administration fees | | | 17 | | |
| Legal fees | | | 7 | | |
| Audit fees | | | 18 | | |
| Trustees fees | | | 5 | | |
| Registration fees: | |
| Class A | | | 15 | | |
| Class B | | | 9 | | |
| Class C | | | 10 | | |
| Other | | | 1 | | |
| Total expenses | | | 1,311 | | |
| Less: | |
| Reimbursement of class expenses: | |
| Class B | | | (30 | ) | |
| Class C | | | (15 | ) | |
| Total waived expenses | | | (45 | ) | |
| Net expenses | | | 1,266 | | |
| Net Investment Income (Loss) | | | 452 | | |
| Net Realized and Unrealized Gain (Loss): | | | |
| Realized gain (loss) from investment securities | | | 10,268 | | |
Increase (decrease) in unrealized appreciation
(depreciation) on investment securities | | | (9,975 | ) | |
| Net Gain (Loss) on Investment Securities | | | 293 | | |
Net Increase (Decrease) in Net Assets Resulting
from Operations | | $ | 745 | | |
The notes to the financial statements are an integral part of this report.
Transamerica IDEX Mutual Funds
Annual Report 2005
6
TA IDEX Great Companies–TechnologySM
STATEMENTS OF CHANGES IN NET ASSETS
For the years ended
(all amounts in thousands)
| | | October 31,
2005 | | October 31,
2004 | |
| Increase (Decrease) In Net Assets From: | | | |
| Operations: | | | |
| Net investment income (loss) | | $ | 452 | | | $ | (1,410 | ) | |
Net realized gain (loss) from
investment securities | | | 10,268 | | | | 7,229 | | |
Net unrealized appreciation
(depreciation) on investment
securities | | | (9,975 | ) | | | (596 | ) | |
| | | | 745 | | | | 5,223 | | |
| Distributions to Shareholders: | | | |
| From net investment income: | |
| Class A | | | (455 | ) | | | – | | |
| | | | (455 | ) | | | – | | |
| Capital Share Transactions: | | | |
| Proceeds from shares sold: | |
| Class A | | | 898 | | | | 43,251 | | |
| Class B | | | 371 | | | | 1,211 | | |
| Class C | | | 357 | | | | 1,072 | | |
| Class C2 | | | – | | | | 217 | | |
| Class M | | | – | | | | 169 | | |
| | | | 1,626 | | | | 45,920 | | |
Dividends and distributions
reinvested: | |
| Class A | | | 454 | | | | – | | |
| | | | 454 | | | | – | | |
| Cost of shares redeemed: | |
| Class A | | | (56,227 | ) | | | (6,253 | ) | |
| Class B | | | (1,906 | ) | | | (2,528 | ) | |
| Class C | | | (1,667 | ) | | | (1,125 | ) | |
| Class C2 | | | – | | | | (485 | ) | |
| Class M | | | – | | | | (584 | ) | |
| | | | (59,800 | ) | | | (10,975 | ) | |
| Class level exchanges: | |
| Class C | | | – | | | | 3,369 | | |
| Class C2 | | | – | | | | (2,246 | ) | |
| Class M | | | – | | | | (1,123 | ) | |
| | | | – | | | | – | | |
| Automatic conversions: | |
| Class A | | | 17 | | | | 5 | | |
| Class B | | | (17 | ) | | | (5 | ) | |
| | | | – | | | | – | | |
| | | | (57,720 | ) | | | 34,945 | | |
| Net increase (decrease) in net assets | | | (57,430 | ) | | | 40,168 | | |
| Net Assets: | | | |
| Beginning of year | | | 130,948 | | | | 90,780 | | |
| End of year | | $ | 73,518 | | | $ | 130,948 | | |
Accumulated Net Investment Income
(Loss) | | $ | 2 | | | $ | – | | |
| | | October 31,
2005 | | October 31,
2004 | |
| Share Activity: | | | |
| Shares issued: | |
| Class A | | | 233 | | | | 11,526 | | |
| Class B | | | 101 | | | | 335 | | |
| Class C | | | 97 | | | | 299 | | |
| Class C2 | | | – | | | | 60 | | |
| Class M | | | – | | | | 47 | | |
| | | | 431 | | | | 12,267 | | |
Shares issued–reinvested from
distributions: | |
| Class A | | | 120 | | | | – | | |
| | | | 120 | | | | – | | |
| Shares redeemed: | |
| Class A | | | (14,766 | ) | | | (1,667 | ) | |
| Class B | | | (522 | ) | | | (705 | ) | |
| Class C | | | (456 | ) | | | (316 | ) | |
| Class C2 | | | – | | | | (133 | ) | |
| Class M | | | – | | | | (161 | ) | |
| | | | (15,744 | ) | | | (2,982 | ) | |
| Class level exchanges: | |
| Class C | | | – | | | | 921 | | |
| Class C2 | | | – | | | | (602 | ) | |
| Class M | | | – | | | | (318 | ) | |
| | | | – | | | | 1 | | |
| Automatic conversions: | |
| Class A | | | 5 | | | | 1 | | |
| Class B | | | (5 | ) | | | (1 | ) | |
| | | | – | | | | – | | |
Net increase (decrease) in shares
outstanding: | |
| Class A | | | (14,408 | ) | | | 9,860 | | |
| Class B | | | (426 | ) | | | (371 | ) | |
| Class C | | | (359 | ) | | | 904 | | |
| Class C2 | | | – | | | | (675 | ) | |
| Class M | | | – | | | | (432 | ) | |
| | | | (15,193 | ) | | | 9,286 | | |
The notes to the financial statements are an integral part of this report.
Transamerica IDEX Mutual Funds
Annual Report 2005
7
TA IDEX Great Companies–TechnologySM
FINANCIAL HIGHLIGHTS
| | | | | For a share of beneficial interest outstanding throughout each period | |
| | | | | Net Asset | | Investment Operations | | Distributions | | Net Asset | |
| | | For the
Period
Ended (d)(g) | | Value,
Beginning
of Period | | Net
Investment
Income (Loss) | | Net Realized
and Unrealized
Gain (Loss) | | Total
Operations | | From Net
Investment
Income | | From Net
Realized
Gains | | Total
Distributions | | Value,
End
of Period | |
| Class A | | 10/31/2005 | | $ | 3.80 | | | $ | 0.03 | | | $ | 0.02 | | | $ | 0.05 | | | $ | (0.03 | ) | | $ | – | | | $ | (0.03 | ) | | $ | 3.82 | | |
| | | 10/31/2004 | | | 3.61 | | | | (0.04 | ) | | | 0.23 | | | | 0.19 | | | | – | | | | – | | | | – | | | | 3.80 | | |
| | | 10/31/2003 | | | 2.56 | | | | (0.04 | ) | | | 1.09 | | | | 1.05 | | | | – | | | | – | | | | – | | | | 3.61 | | |
| | | 10/31/2002 | | | 3.63 | | | | (0.05 | ) | | | (1.02 | ) | | | (1.07 | ) | | | – | | | | – | | | | – | | | | 2.56 | | |
| | | 10/31/2001 | | | 7.93 | | | | (0.06 | ) | | | (4.24 | ) | | | (4.30 | ) | | | – | | | | – | | | | – | | | | 3.63 | | |
| Class B | | 10/31/2005 | | | 3.68 | | | | (0.02 | ) | | | 0.02 | | | | – | | | | – | | | | – | | | | – | | | | 3.68 | | |
| | | 10/31/2004 | | | 3.51 | | | | (0.06 | ) | | | 0.23 | | | | 0.17 | | | | – | | | | – | | | | – | | | | 3.68 | | |
| | | 10/31/2003 | | | 2.50 | | | | (0.06 | ) | | | 1.07 | | | | 1.01 | | | | – | | | | – | | | | – | | | | 3.51 | | |
| | | 10/31/2002 | | | 3.58 | | | | (0.08 | ) | | | (1.00 | ) | | | (1.08 | ) | | | – | | | | – | | | | – | | | | 2.50 | | |
| | | 10/31/2001 | | | 7.91 | | | | (0.10 | ) | | | (4.23 | ) | | | (4.33 | ) | | | – | | | | – | | | | – | | | | 3.58 | | |
| Class C | | 10/31/2005 | | | 3.67 | | | | (0.02 | ) | | | 0.02 | | | | – | | | | – | | | | – | | | | – | | | | 3.67 | | |
| | | 10/31/2004 | | | 3.51 | | | | (0.07 | ) | | | 0.23 | | | | 0.16 | | | | – | | | | – | | | | – | | | | 3.67 | | |
| | | 10/31/2003 | | | 2.45 | | | | (0.06 | ) | | | 1.12 | | | | 1.06 | | | | – | | | | – | | | | – | | | | 3.51 | | |
| | | | | | | Ratios/Supplemental Data | |
| | | For the
Period | | Total | | Net Assets,
End of
Period | | Ratio of Expenses
to Average
Net Assets (a) | | Net Investment
Income (Loss)
to Average | | Portfolio
Turnover | |
| | | Ended (g) | | Return (c) | | (000's) | | Net (e) | | Total (f) | | Net Assets (a) | | Rate (b) | |
| Class A | | 10/31/2005 | | | 1.23 | % | | $ | 65,423 | | | | 1.32 | % | | | 1.32 | % | | | 0.63 | % | | | 73 | % | |
| | | 10/31/2004 | | | 5.26 | | | | 119,985 | | | | 1.36 | | | | 1.36 | | | | (1.12 | ) | | | 41 | | |
| | | 10/31/2003 | | | 41.02 | | | | 78,289 | | | | 1.55 | | | | 1.90 | | | | (1.23 | ) | | | 24 | | |
| | | 10/31/2002 | | | (29.45 | ) | | | 6,445 | | | | 1.55 | | | | 2.61 | | | | (1.40 | ) | | | 64 | | |
| | | 10/31/2001 | | | (54.26 | ) | | | 7,106 | | | | 1.55 | | | | 2.68 | | | | (1.04 | ) | | | 58 | | |
| Class B | | 10/31/2005 | | | 0.00 | | | | 5,316 | | | | 2.20 | | | | 2.68 | | | | (0.58 | ) | | | 73 | | |
| | | 10/31/2004 | | | 4.84 | | | | 6,874 | | | | 1.91 | | | | 1.91 | | | | (1.68 | ) | | | 41 | | |
| | | 10/31/2003 | | | 40.40 | | | | 7,864 | | | | 2.20 | | | | 2.55 | | | | (1.88 | ) | | | 24 | | |
| | | 10/31/2002 | | | (30.12 | ) | | | 4,348 | | | | 2.20 | | | | 3.26 | | | | (2.05 | ) | | | 64 | | |
| | | 10/31/2001 | | | (54.80 | ) | | | 5,938 | | | | 2.20 | | | | 3.33 | | | | (1.69 | ) | | | 58 | | |
| Class C | | 10/31/2005 | | | 0.00 | | | | 2,779 | | | | 2.20 | | | | 2.65 | | | | (0.51 | ) | | | 73 | | |
| | | 10/31/2004 | | | 4.56 | | | | 4,089 | | | | 2.20 | | | | 2.60 | | | | (1.94 | ) | | | 41 | | |
| | | 10/31/2003 | | | 43.27 | | | | 739 | | | | 2.20 | | | | 2.55 | | | | (1.88 | ) | | | 24 | | |
NOTES TO FINANCIAL HIGHLIGHTS
(a) Annualized.
(b) Not annualized.
(c) Total Return has been calculated for the applicable periods without deduction of a sales load, if any, on an initial purchase. Periods of less than one year are not annualized.
(d) Per share information is calculated based on average number of shares outstanding.
(e) Ratio of Net Expenses to Average Net Assets is net of fee waivers and reimbursements by the investment adviser, if any (see note 2).
(f) Ratio of Total Expenses to Average Net Assets includes all expenses before fee waivers, reimbursements.
(g) The inception date for the Fund's offering of share Class C was November 11, 2002.
The notes to the financial statements are an integral part of this report.
Transamerica IDEX Mutual Funds
Annual Report 2005
8
TA IDEX Great Companies–TechnologySM
NOTES TO FINANCIAL STATEMENTS
At October 31, 2005
(all amounts in thousands)
NOTE 1. ORGANIZATION AND SIGNIFICANT ACCOUNTING POLICIES
Transamerica IDEX Mutual Funds is an open-end management investment company registered under the Investment Company Act of 1940, as amended (the "1940 Act").
In the normal course of business, TA IDEX Great Companies–
TechnologySM (the "Fund") enters into contracts that contain a variety of representations that provide general indemnifications. The Fund's maximum exposure under these arrangements is unknown, as this would involve future claims that may be made against the Fund and/or its affiliates that have not yet occurred. However, based on experience, the Fund expects the risk of loss to be remote.
The Fund is "non-diversified" under the 1940 Act.
This report should be read in conjunction with the current Fund prospectus, which contains more complete information about the Fund.
The following is a summary of significant accounting policies followed by the Fund in the preparation of the financial statements. In preparing the Fund's financial statements in accordance with accounting principles generally accepted in the United States of America ("GAAP"), estimates or assumptions (which could differ from actual results) may be used that affect reported amounts and disclosures.
Multiple class operations, income and expenses: The Fund currently offers three classes of shares, each with a public offering price that reflects different sales charges, if any, and expense levels. On June 15, 2004, Class C2 shares merged into Class C. On September 24, 2004, Class M shares merged into Class C. Class B shares will convert to Class A shares eight years after purchase. Income, non-class specific expenses and realized and unrealized gains and losses, are allocated daily to each class, based upon the value of shares outstanding method as permitted under Rule 18f-3 of the 1940 Act. Each class bears its own specific expenses as well as a portion of general, common expenses.
Security valuations: The Fund values its investments at the close of the New York Stock Exchange ("NYSE"), normally 4 p.m. ET, each day the NYSE is open for business. Fund investments are valued at the last sale price or closing price on the day of valuation taken from the primary exchange where the security is principally traded.
Securities traded in the over-the-counter market and listed securities for which no sale was reported on that date are valued at the last quoted bid price.
Debt securities are valued based on a price quotation or other equivalent indication of value supplied by an exchange, a pricing service or a major market maker; however, those that mature in sixty days or less are valued at amortized cost, which approximates market.
Investment company securities are valued at the net asset value of the underlying portfolio.
Other securities for which quotations are not readily available or whose values have been determined to be unreliable are valued at fair market value as determined in good faith by the Fund's Administrative Valuation Committee, under the supervision of the Board's Valuation Committee, using guidelines adopted by the Board of Trustees.
Cash: The Fund may leave cash overnight in its cash account with the custodian, Investors Bank & Trust Company ("IBT"). IBT has been contracted on behalf of the Fund to invest the excess cash into a savings account, which at October 31, 2005, was paying an interest rate of 2.76%.
Repurchase agreements: The Fund is authorized to enter into repurchase agreements. The Fund, through its custodian, IBT, receives delivery of the underlying securities, the value of which at the time of purchase is required to be an amount equal to at least 100% of the resale price. The Fund will bear the risk of value fluctuations until the security can be sold and may encounter delays and incur costs in liquidating the security. In the event of bankruptcy or insolvency of the seller, delays and costs may be incurred.
Commission recapture: The sub-adviser, to the extent consistent with the best execution and usual commission rate policies and practices, may place security transactions of the Fund with broker/dealers with which Transamerica IDEX Mutual Funds has established a Commission Recapture Program. A Commission Recapture Program is any arrangement under which a broker/dealer applies a portion of the commissions received by such broker/dealer on the security transactions to the Fund. In no event will commissions paid by the Fund be used to pay expenses that would otherwise be borne by any other funds within Transamerica IDEX Mutual Funds, or by any other party.
Recaptured commissions during the year ended October 31, 2005, of $25 are included in net realized gains in the Statement of Operations.
Securities lending: The Fund may lend securities to qualified borrowers, with IBT acting as the Fund's lending agent. The Fund earns negotiated lenders' fees. The Fund receives cash and/or securities as collateral against the loaned securities. Cash collateral received is invested in short term, interest bearing securities. The Fund monitors the market value of securities loaned on a daily basis and requires collateral in an amount at least equal to the value of the securities loaned. Income from loaned securities on the Statement of Operations is net of fees, in the amount of $2, earned by IBT for its services.
Security transactions and investment income: Security transactions are recorded on the trade date. Security gains and losses are calculated on the specific identification basis. Dividend income, if any, is recorded
Transamerica IDEX Mutual Funds
Annual Report 2005
9
TA IDEX Great Companies–TechnologySM
NOTES TO FINANCIAL STATEMENTS (continued)
At October 31, 2005
(all amounts in thousands)
NOTE 1.–(continued)
on the ex-dividend date or, in the case of foreign securities, as soon as the Fund is informed of the ex-dividend date. Interest income, including accretion of discounts and amortization of premiums, is recorded on the accrual basis commencing on the settlement date.
Redemption fees: A short-term trading redemption fee may be assessed on any Fund shares in a fund account that are sold during the first five (5) NYSE trading days following their purchase date. This redemption fee will equal 2% of the amount redeemed and shares held the longest will be treated as being redeemed first and shares held the shortest as being redeemed last. For the year ended October 31, 2005, the Fund received less than $1 in redemption fees.
Dividend distributions: Distributions to shareholders are recorded on the ex-dividend date and are determined in accordance with Federal income tax regulations which may differ from GAAP.
NOTE 2. RELATED PARTY TRANSACTIONS
Effective January 1, 2005 AEGON/Transamerica Fund Advisors, Inc. was renamed Transamerica Fund Advisors, Inc. ("TFAI"); AEGON/Transamerica Fund Services, Inc. and AEGON/Transamerica Investor Services, Inc. merged into one entity and was renamed Transamerica Fund Services, Inc. ("TFS").
TFAI is the Fund's investment adviser. TFS is the Fund's administrator and transfer agent. AFSG Securities Corp. ("AFSG") is the Fund's distributor/principal underwriter. TFAI, TFS , and AFSG are affiliates of AEGON, NV, a Netherlands corporation.
Great Companies, LLC is both an affiliate of the Fund and a sub-adviser to the Fund.
The following schedule reflects the percentage of fund assets owned by affiliated mutual funds:
| | | Net
Assets | | % of
Net Assets | |
TA IDEX Asset Allocation–
Conservative Portfolio | | $ | 3,017 | | | | 4.10 | % | |
TA IDEX Asset Allocation–
Growth Portfolio | | | 14,855 | | | | 20.21 | % | |
TA IDEX Asset Allocation–
Moderate Growth Portfolio | | | 28,871 | | | | 39.27 | % | |
TA IDEX Asset Allocation–
Moderate Portfolio | | | 11,518 | | | | 15.67 | % | |
| Total | | $ | 58,261 | | | | 79.25 | % | |
Investment advisory fees: The Fund pays management fees to TFAI based on average daily net assets ("ANA") at the following breakpoints:
0.80% of the first $500 million of ANA
0.70% of ANA over $500 million
TFAI has contractually agreed to waive its advisory fee and will reimburse the Fund to the extent that operating expenses, excluding 12b-1 fees, exceed the following stated annual limit:
1.20% Expense Limit
If total Fund expenses fall below the annual expense limitation agreement agreed to by the adviser within the succeeding three years, the Fund may be required to pay that adviser a portion or all of the waived advisory fees.
| | | Advisory Fee
Waived | | Available for
Recapture Through | |
| Fiscal Year 2003 | | $ | 138 | | | | 10/31/2006 | | |
| Fiscal Year 2002 | | | 193 | | | | 10/31/2005 | | |
If total Fund expenses fall below the annual expense limitation agreement agreed to by the adviser within the succeeding three years, the Fund may be required to pay that adviser a portion or all of the reimbursed class expenses.
| | | Reimbursement
of Class Expenses | | Available for
Recapture Through | |
| Fiscal Year 2005 | |
| Class B | | $ | 30 | | | 10/31/2008 | |
| Class C | | | 15 | | | 10/31/2008 | |
| Fiscal Year 2004 | |
| Class C | | | 7 | | | 10/31/2007 | |
There were no amounts recaptured during the year ended October 31, 2005.
Distribution and service fees: The Fund has a 12b-1 distribution plan under the 1940 Act pursuant to which an annual fee, based on average daily net assets, is paid to the distributor for various disbursements such as broker-dealer account servicing fees and other promotional expenses of the Fund. The Fund is authorized under the 12b-1 plan to pay fees on each class up to the following limits:
| Class A | | | 0.35 | % | |
| Class B | | | 1.00 | % | |
| Class C | | | 1.00 | % | |
In the case the Fund or a class of shares of the Fund is closed to new investors or investments, the Fund is authorized to pay 12b-1 fees for past sales and distribution efforts and present and past investor services.
Transamerica IDEX Mutual Funds
Annual Report 2005
10
TA IDEX Great Companies–TechnologySM
NOTES TO FINANCIAL STATEMENTS (continued)
At October 31, 2005
(all amounts in thousands)
NOTE 2.–(continued)
Underwriter commissions relate to front-end sales charges imposed for Class A shares and contingent deferred sales charges from Classes B, C, and certain A share redemptions. For the year ended October 31, 2005, the underwriter commissions were as follows:
| Received by Underwriter | | $ | 47 | | |
| Retained by Underwriter | | | 4 | | |
| Contingent Deferred Sales Charge | | | 17 | | |
Administrative services: The Fund has entered into an agreement with TFS for financial and legal fund administration services. As of January 1, 2005 the Fund pays TFS an annual fee of 0.02% of ANA. Prior to January 1, 2005 the Fund paid TFS an annual fee of 0.015%
of ANA. The Legal fees on the Statement of Operations are for fees paid to external legal counsel.
Transfer agent fees: The Fund pays TFS an annual per-account charge for each open and closed account. The Fund paid TFS $105 for the year ended October 31, 2005.
Deferred compensation plan: Each eligible independent Fund Trustee may elect to participate in a non-qualified deferred compensation plan maintained by Transamerica IDEX Mutual Funds (the "Plan"). Under the Plan, such Trustees may defer payment of all or a portion of their total fees earned as a Fund Trustee. Each Trustee who is a participant in the Plan may elect that the earnings, losses or gains credited to his or her deferred fee amounts be determined based on a deemed investment in any series of Transamerica IDEX Mutual Funds, including the Fund. The right of a participant to receive a distribution from the Plan of the deferred fees is an unsecured claim against the general assets of all series of Transamerica IDEX Mutual Funds. The pro rata liability to the Fund of all deferred fees i n the Plan amounted, as of October 31, 2005, to $3.
NOTE 3. INVESTMENT TRANSACTIONS
The cost of securities purchased and proceeds from securities sold (excluding short-term securities) for the year ended October 31, 2005, were as follows:
| Purchases of securities: | | | |
| Long-Term | | $ | 61,123 | | |
| U.S. Government | | | – | | |
| Proceeds from maturities and sales of securities: | | | |
| Long-Term | | | 112,554 | | |
| U.S. Government | | | – | | |
NOTE 4. FEDERAL INCOME TAX MATTERS
The Fund has not made any provision for federal income or excise taxes due to its policy to distribute all of its taxable income and capital gains to its shareholders and otherwise qualify as a regulated investment company under Subchapter M of the Internal Revenue Code. Income and capital gain distributions are determined in accordance with income tax regulations, which may differ from GAAP. These differences are primarily due to differing treatment for items including, but not limited to, net operating losses, distribution reclasses and return of capital from underlying investments.
Therefore, distributions determined in accordance with tax regulations may differ significantly in amount or character from net investment income and realized gains for financial reporting purposes. Financial reporting records are adjusted for permanent book/tax differences to reflect tax character. Financial records are not adjusted for temporary differences. These reclassifications are as follows:
Shares of beneficial interest, unlimited
shares authorized | | $ | (20 | ) | |
| Undistributed net investment income (loss) | | | 5 | | |
Undistributed net realized gain (loss) from investment
securities | | | 15 | | |
The capital loss carryforward utilized during the year ended
October 31, 2005 was $7,457.
The tax character of distributions paid may differ from the character of distributions shown in the Statement of Changes in Net Assets due to short-term gains being treated as ordinary income for tax purposes. The tax character of distributions paid during 2004 and 2005 was as follows:
| 2004 Distributions paid from: | |
| Ordinary Income | | $ | – | | |
| Long-term Capital Gain | | | – | | |
| 2005 Distributions paid from: | |
| Ordinary Income | | | 452 | | |
| Long-term Capital Gain | | | 3 | | |
The tax basis components of distributable earnings as of October 31, 2005, are as follows:
| Undistributed Ordinary Income | | $ | – | | |
| Undistributed Long-term Capital Gains | | $ | 1,067 | | |
| Capital Loss Carryforward | | $ | – | | |
| Net Unrealized Appreciation (Depreciation) | | $ | 1,358 | | |
The aggregate cost of investments and composition of unrealized appreciation (depreciation) for federal income tax purposes as of October 31, 2005, are as follows:
| Federal Tax Cost Basis | | $ | 78,122 | | |
| Unrealized Appreciation | | $ | 4,974 | | |
| Unrealized (Depreciation) | | | (3,616 | ) | |
| Net Unrealized Appreciation (Depreciation) | | $ | 1,358 | | |
Transamerica IDEX Mutual Funds
Annual Report 2005
11
TA IDEX Great Companies–TechnologySM
NOTES TO FINANCIAL STATEMENTS (continued)
At October 31, 2005
(all amounts in thousands)
NOTE 5. REGULATORY PROCEEDINGS
There continues to be significant federal and state regulatory activity relating to financial services companies, particularly mutual fund companies and their investment advisers. As part of an ongoing investigation regarding potential market timing, recordkeeping and trading compliance issues and matters affecting the Fund's investment adviser, TFAI, and certain affiliates and former employees of TFAI, the SEC staff has indicated that it is likely to take some action against TFAI and certain of its affiliates at the conclusion of the investigation. The potential timing and the scope of any such action is difficult to predict. Although the impact of any action brought against TFAI and/or its affiliates is difficult to assess at the present time, the Fund currently believes that the likelihood that any such action will have a material adverse impact on it is remote. It is important to note that the Fund is not aware of any allegation of wrongdoing against it and its Board at the time this annual report is printed. Although it is not anticipated that these developments will have an adverse impact on the Fund, there can be no assurance at this time. TFAI and its affiliates are actively working with the SEC in regard to this matter; however, the exact resolution cannot be determined at this time. TFAI will take such actions that it deems necessary or appropriate to continue providing management services to the Fund and to bring all matters to an appropriate conclusion.
TFAI and/or its affiliates, and not the Fund, will bear the costs regarding these regulatory matters.
Transamerica IDEX Mutual Funds
Annual Report 2005
12
Report of Independent Registered Certified Public Accounting Firm
To the Board of Trustees and Shareholders of
TA IDEX Great Companies–TechnologySM
In our opinion, the accompanying statement of assets and liabilities, including the schedule of investments, and the related statements of operations and of changes in net assets and the financial highlights present fairly, in all material respects, the financial position of TA IDEX Great Companies–TechnologySM (the "Fund") (one of the portfolios constituting the Transamerica IDEX Mutual Funds) at October 31, 2005, the results of its operations for the year then ended, the changes in its net assets for each of the two years in the period then ended and the financial highlights for each of the periods presented, in conformity with accounting principles generally accepted in the United States of America. These financial statements and financial highlights (hereafter referred to as "financial statements") are the responsibility of the Fund's management; our responsibility is to express an opinion on these financial statements based on our audits. We conducted our audits of these financial statements in accordance with the standards of the Public Company Accounting Oversight Board (United States). Those standards require that we plan and perform the audit to obtain reasonable assurance about whether the financial statements are free of material misstatement. An audit includes examining, on a test basis, evidence supporting the amounts and disclosures in the financial statements, assessing the accounting principles used and significant estimates made by management, and evaluating the overall financial statement presentation. We believe that our audits, which included confirmation of securities at October 31, 2005 by correspondence with the custodian, provide a reasonable basis for our opinion.

December 22, 2005
Transamerica IDEX Mutual Funds
Annual Report 2005
13
TA IDEX Great Companies–TechnologySM
SUPPLEMENTAL INFORMATION (unaudited)
TAX INFORMATION
For dividends paid during the year ended October 31, 2005, the Fund designated $1,615 as qualified dividend income.
For corporate shareholders, 100% of investment income (dividend income plus short-term gains, if any) qualifies for the dividends received deduction.
For tax purposes, the Fund has made a Long-Term Capital Gain Designation of $3 for the year ended October 31, 2005.
The information and distributions reported herein may differ from the information and distributions taxable to the shareholders for the calendar year ending December 31, 2005. Complete information will be computed and reported in conjunction with your 2005 Form 1099-DIV.
Transamerica IDEX Mutual Funds
Annual Report 2005
14
TA IDEX Janus Growth
PERFORMANCE
For the year ended October 31, 2005, TA IDEX Janus Growth, Class A returned 14.38%. By comparison its primary and secondary benchmarks, the Standard and Poor's 500 Composite Stock Index ("S&P 500") and the Russell 1000 Growth Index, returned 8.71% and 8.81%, respectively.
STRATEGY REVIEW
Contributing to the portfolio's outperformance were several well-chosen stocks within the healthcare sector, an area in which the portfolio carried a considerably larger position than the S&P 500 during the period. Offering better visibility and predictability in businesses such as well-established biotechnology companies and managed care operations, healthcare names proved durable as rising oil prices cast doubts on the near-term direction of the economy. Meanwhile, weak performances by select picks from the information technology group worked against the portfolio.
Anticipating that higher energy costs will be the norm, we have trimmed or eliminated names on the margin that are not as likely to fare well when consumer spending is less robust. Many of those names that remain hold solid growth characteristics, frequently tied to specific catalysts that have the potential to facilitate price increases or ease a company's entry into a new, promising market.
Ultimately, we will invest where we think the growth prospects are best, based on a spectrum of factors ranging from company level developments through industry specific issues and the broader economy. This results in a portfolio of 30-50 stocks that are evenly divided among what we think are "high growth companies" – those posting greater than 20% earnings growth – and "stable growth companies" – those growing earnings 10% to 19%. Occasionally, we will also invest in companies we feel have positive business catalysts. In seeking out high-growth companies, we look for expanding earnings projections and strong revenue growth driven by factors such as new products, pricing power and marketplace opportunities. We also value increasing return on invested capital and expanding free cash flow levels.
Record-high crude oil prices helped lift integrated oil company Amerada Hess Corporation, a stable growth position that we sold as it approached our price target. Having hedged all of its 2004 and 2005 production at much lower levels than current oil prices, the company's earnings growth has been constrained. When the financial hedges expire in 2006, we believe Amerada Hess is poised to experience much greater earnings power.
We also pared back on biotechnology blue chip Genentech, Inc. ("Genentech"), which climbed amid positive clinical and regulatory developments for its Avastin and Herceptin cancer treatments. A high-growth company that we have owned for a number of years, Genentech's valuation is finally reaching our target levels. The company may continue to enjoy positive developments, and it looks capable of growing annual earnings up to 50% for the next three or four years, but based on our discounted cash flow analysis, we believe the stock is approaching fair value.
Lexmark International, Inc. detracted from the portfolio's performance. During the period, the manufacturer of printers and related supplies reported single-digit quarterly revenue and earnings growth, as well as growing expenses. We also grew wary of the sustainability of the company's competitive advantage in its cartridge business. Given the computer industry's cutthroat tactics, it is becoming increasingly difficult to defend a proprietary design for something as ubiquitous as a printer ink cartridge. Sensing deterioration in company fundamentals, we decided better opportunities exist elsewhere and exited the position.
A number of the portfolio's laggards during the period came from the consumer discretionary sector, which sagged under the weight of higher energy prices and subdued consumer sentiment following Hurricanes Katrina and Rita. Cruise line operators such as Royal Caribbean Cruises Ltd. and Carnival Corporation, two positions we classified as stable growth holdings, watched increased fuel expenses absorb a substantial portion of revenue increases. Our surveys indicate that the fourth quarter will be equal to consensus, but we are watching for trends in December and January, when the bulk of customer buying occurs.
Edward Keely, CFA
Fund Manager
Janus Capital Management LLC
Transamerica IDEX Mutual Funds
Annual Report 2005
1
TA IDEX Janus Growth
Comparison of change in value of $10,000 investment in Class A shares and its comparative indices.
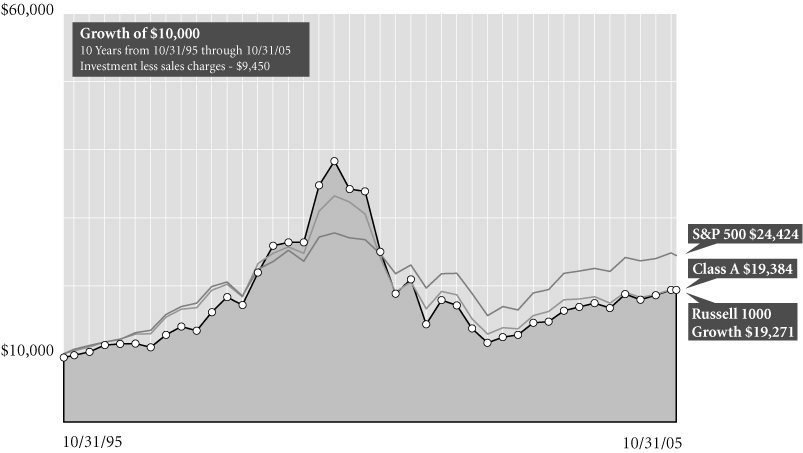
Average Annual Total Return for Periods Ended 10/31/05
| | | 1 year | | 5 years | | 10 years | | From
Inception | | Inception
Date | |
| Class A (NAV) | | | 14.38 | % | | | (9.38 | )% | | | 7.45 | % | | | 11.61 | % | | 5/8/86 | |
| Class A (POP) | | | 8.09 | % | | | (10.39 | )% | | | 6.84 | % | | | 11.29 | % | | 5/8/86 | |
| S&P 5001 | | | 8.71 | % | | | (1.73 | )% | | | 9.34 | % | | | 11.34 | % | | 5/8/86 | |
| Russell 1000 Growth1 | | | 8.81 | % | | | (7.93 | )% | | | 6.78 | % | | | 9.87 | % | | 5/8/86 | |
| Class B (NAV) | | | 13.32 | % | | | (10.07 | )% | | | 6.85 | % | | | 6.90 | % | | 10/1/95 | |
| Class B (POP) | | | 8.32 | % | | | (10.23 | )% | | | 6.85 | % | | | 6.90 | % | | 10/1/95 | |
| Class C (NAV) | | | 13.27 | % | | | – | | | | – | | | | 15.63 | % | | 11/11/02 | |
| Class C (POP) | | | 12.27 | % | | | – | | | | – | | | | 15.63 | % | | 11/11/02 | |
| Class T (NAV) | | | 14.83 | % | | | (9.04 | )% | | | 7.80 | % | | | 12.36 | % | | 6/4/85 | |
| Class T (POP) | | | 5.07 | % | | | (10.64 | )% | | | 6.84 | % | | | 11.88 | % | | 6/4/85 | |
NOTES
1 The Standard and Poor's 500 Composite Stock (S&P 500) Index and the Russell 1000 Growth (Russell 1000 Growth) Index are unmanaged indices used as a general measure of market performance. Calculations assume dividends and capital gains are reinvested and do not include any managerial expenses. From inception calculation is based on life of Class A shares. Source: Standard & Poor's Micropal®© Micropal, Inc. 2005 – 1-800-596-5323 – http://www.funds-sp.com.
The performance data presented represents past performance, future results may vary. Performance data does not reflect the deduction of taxes that would be paid on fund distributions or the redemption of fund shares. Investment return and principal value will fluctuate so that an investor's shares, when redeemed, may be worth more or less than their original cost. Current performance may be lower or higher than performance quoted. Please see www.transamericaidex.com for performance data current to the most recent month-end.
Public Offering Price (POP) returns include the reinvestment of dividends and capital gains and reflect the maximum sales charge of 5.5% for A shares and 8.5% for T Shares or the maximum applicable contingent deferred sales charge (5% in the 1st year, decreasing to 0% after 6 years) for Class B shares and 1% (during the first 12 months) for Class C shares. Shares purchased prior to March 1, 2004 are subject to a maximum applicable contingent deferred sales charge (5% in the 1st year, decreasing to 0% after 7 years) for Class B shares and (2% in the 1st year, decreasing to 0% after 2 years) for Class C shares. Net Asset Value (NAV) returns include the reinvestment of dividends and capital gains but do not reflect any sales charges.
This material must be preceded or accompanied by a current prospectus, which includes specific contents regarding the investment objectives and policies of this fund.
Transamerica IDEX Mutual Funds
Annual Report 2005
2
TA IDEX Janus Growth
UNDERSTANDING YOUR FUND'S EXPENSES
(unaudited)
SHAREHOLDER EXPENSES
Fund shareholders may incur two types of costs: (1) transaction costs, including sales charges (loads) on purchases, contingent deferred sales charges on redemptions and redemption fees; and (2) ongoing costs, including management fees, 12b-1 distribution and service fees, and other fund expenses.
The following Example is intended to help you understand your ongoing costs (in dollars and cents) of investing in a Fund and to compare these costs with the ongoing costs of investing in other funds.
The Example is based on an investment of $1,000 invested at May 1, 2005 and held for the entire period until October 31, 2005.
ACTUAL EXPENSES
The first line in the table below provides information about actual account values and actual expenses. You may use the information in this line, together with the amount you invested, to estimate the expenses that you paid over the period. Simply divide your account value by $1,000 (for example, an $8,600 account value divided by $1,000 = 8.6), then multiply the result by the number in the first line of your Fund under the heading entitled "Expenses Paid During Period" to estimate the expenses you paid on your account during this period. If your account is an IRA, your expenses could have included a $15 annual fee. The amount of any fee paid through your account would increase the estimate of expenses you paid during the period and decrease your ending account value.
HYPOTHETICAL EXAMPLE FOR COMPARISON PURPOSES
The second line in the table below provides information about hypothetical account values and hypothetical expenses based on the Fund's actual expense ratio and an assumed rate of return of 5% per year before expenses, which is not the Fund's actual return. The hypothetical account values and expenses may not be used to estimate the actual ending account balance or expenses you paid for the period. You may use this information to compare the ongoing costs of investing in your Fund and other funds. To do so, compare this 5% hypothetical example with the 5% hypothetical examples that appear in the shareholder reports of the other funds. As in the case of the actual expense example, if your account is subject to an IRA fee, the amount of the fee paid through your account would increase the hypothetical expenses you would have paid during the period and decrease the hypothetical ending account value.
Please note that the expenses shown in the table are meant to highlight your ongoing costs only and do not reflect any transactional costs, such as sales charges, redemption fees, brokerage commissions paid on purchases and sales of fund shares. Therefore, the second line under the Fund in the table is useful in comparing ongoing costs only, and will not help you determine the relative total costs of owning different funds. If any of these transaction costs were included, your costs would be higher. The expenses shown in the table do not reflect any fees that may be charged to you by brokers, financial intermediaries or other financial institutions.
| | | Beginning
Account
Value | | Ending
Account
Value | | Annualized
Expense
Ratio | | Expenses Paid
During Period (a) | |
| Class A | |
| Actual | | $ | 1,000.00 | | | $ | 1,098.40 | | | | 1.49 | % | | $ | 7.88 | | |
| Hypothetical (b) | | | 1,000.00 | | | | 1,017.69 | | | | 1.49 | | | | 7.58 | | |
| Class B | |
| Actual | | | 1,000.00 | | | | 1,092.90 | | | | 2.43 | | | | 12.82 | | |
| Hypothetical (b) | | | 1,000.00 | | | | 1,012.96 | | | | 2.43 | | | | 12.33 | | |
| Class C | |
| Actual | | | 1,000.00 | | | | 1,094.00 | | | | 2.30 | | | | 12.14 | | |
| Hypothetical (b) | | | 1,000.00 | | | | 1,013.61 | | | | 2.30 | | | | 11.67 | | |
| Class T | |
| Actual | | | 1,000.00 | | | | 1,101.10 | | | | 0.98 | | | | 5.19 | | |
| Hypothetical (b) | | | 1,000.00 | | | | 1,020.27 | | | | 0.98 | | | | 4.99 | | |
(a) Expenses are calculated using each Fund's annualized expense ratio (as disclosed in the table), multiplied by the average account value for the period, multiplied by number of days in the period (184 days), and divided by the number of days in the year (365 days).
(b) 5% return per year before expenses.
GRAPHICAL PRESENTATION OF SCHEDULE OF INVESTMENTS
By Sector
At October 31, 2005
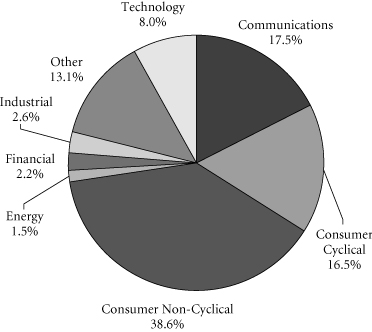
This chart shows the percentage breakdown by sector of the Fund's total investment securities.
Transamerica IDEX Mutual Funds
Annual Report 2005
3
TA IDEX Janus Growth
SCHEDULE OF INVESTMENTS
At October 31, 2005
(all amounts except share amounts in thousands)
| | | Shares | | Value | |
| COMMON STOCKS (93.9%) | |
| Amusement & Recreation Services (1.9%) | |
| Harrah's Entertainment, Inc. | | | 353,055 | | | $ | 21,353 | | |
| Automotive (2.1%) | |
| Harley–Davidson, Inc. † | | | 462,760 | | | | 22,921 | | |
| Business Services (3.6%) | |
| Clear Channel Communications, Inc. | | | 436,075 | | | | 13,265 | | |
| eBay, Inc. ‡ | | | 660,765 | | | | 26,166 | | |
| Chemicals & Allied Products (3.3%) | |
| Procter & Gamble Co. | | | 332,230 | | | | 18,602 | | |
| Reckitt Benckiser PLC | | | 599,447 | | | | 18,118 | | |
| Communication (0.8%) | |
| XM Satellite Radio Holdings, Inc.–Class A †‡ | | | 318,475 | | | | 9,182 | | |
| Communications Equipment (2.7%) | |
| QUALCOMM, Inc. | | | 137,760 | | | | 5,477 | | |
| Research In Motion, Ltd. †‡ | | | 400,805 | | | | 24,646 | | |
| Computer & Data Processing Services (14.7%) | |
| Amdocs, Ltd. ‡ | | | 562,660 | | | | 14,894 | | |
| Ceridian Corp. ‡ | | | 539,940 | | | | 11,830 | | |
| Check Point Software Technologies, Ltd. ‡ | | | 507,615 | | | | 11,350 | | |
| Google, Inc.–Class A ‡ | | | 55,735 | | | | 20,741 | | |
| NAVTEQ Corp. ‡ | | | 602,300 | | | | 23,562 | | |
| Yahoo!, Inc. ‡ | | | 2,149,240 | | | | 79,457 | | |
| Construction (1.4%) | |
| Pulte Homes, Inc. † | | | 395,520 | | | | 14,947 | | |
| Electronic & Other Electric Equipment (3.7%) | |
| General Electric Co. | | | 908,695 | | | | 30,814 | | |
| Harman International Industries, Inc. | | | 99,280 | | | | 9,914 | | |
| Electronic Components & Accessories (3.2%) | |
| Intel Corp. | | | 818,215 | | | | 19,228 | | |
| Maxim Integrated Products, Inc. | | | 455,505 | | | | 15,797 | | |
| Food Stores (1.2%) | |
| Safeway, Inc. † | | | 572,305 | | | | 13,312 | | |
| Hotels & Other Lodging Places (3.7%) | |
| Marriott International, Inc.–Class A | | | 110,505 | | | | 6,588 | | |
| Starwood Hotels & Resorts Worldwide, Inc. | | | 579,250 | | | | 33,846 | | |
| Instruments & Related Products (2.5%) | |
| Alcon, Inc. | | | 210,710 | | | | 28,003 | | |
| Insurance (8.6%) | |
| Aetna, Inc. | | | 322,750 | | | | 28,583 | | |
| UnitedHealth Group, Inc. † | | | 1,144,370 | | | | 66,248 | | |
| Lumber & Other Building Materials (1.6%) | |
| Lowe's Cos., Inc. | | | 284,450 | | | | 17,286 | | |
| | | Shares | | Value | |
| Medical Instruments & Supplies (10.8%) | |
| Medtronic, Inc. | | | 1,214,900 | | | $ | 68,836 | | |
| Synthes, Inc. | | | 250,726 | | | | 26,516 | | |
| Varian Medical Systems, Inc. †‡ | | | 530,560 | | | | 24,172 | | |
| Oil & Gas Extraction (1.7%) | |
| Apache Corp. | | | 83,975 | | | | 5,360 | | |
| Schlumberger, Ltd. † | | | 142,550 | | | | 12,939 | | |
| Personal Credit Institutions (1.3%) | |
| SLM Corp. † | | | 258,935 | | | | 14,379 | | |
| Pharmaceuticals (15.2%) | |
| Celgene Corp. †‡ | | | 959,700 | | | | 53,839 | | |
| Dade Behring Holdings, Inc. | | | 247,025 | | | | 8,895 | | |
| Genentech, Inc. ‡ | | | 198,180 | | | | 17,955 | | |
| Roche Holding AG-Genusschein | | | 377,529 | | | | 56,335 | | |
| Teva Pharmaceutical Industries, Ltd., ADR † | | | 794,500 | | | | 30,286 | | |
| Retail Trade (2.8%) | |
| Staples, Inc. | | | 1,342,627 | | | | 30,518 | | |
| Security & Commodity Brokers (1.1%) | |
| Chicago Mercantile Exchange † | | | 33,490 | | | | 12,229 | | |
| Telecommunications (1.8%) | |
| Nextel Partners, Inc.–Class A ‡ | | | 800,885 | | | | 20,142 | | |
| Transportation & Public Utilities (0.7%) | |
| Expedia, Inc. †‡ | | | 409,182 | | | | 7,689 | | |
| Water Transportation (3.5%) | |
| Carnival Corp. | | | 350,540 | | | | 17,411 | | |
| Royal Caribbean Cruises, Ltd. † | | | 512,150 | | | | 21,224 | | |
| Total Common Stocks (cost: $787,810) | | | | | | | 1,034,855 | | |
| | | Principal | | Value | |
| SECURITY LENDING COLLATERAL (14.2%) | |
| Debt (13.2%) | |
| Bank Notes (0.9%) | |
Bank of America
| |
| 3.81%, due 06/07/2006 * | | $ | 4,390 | | | $ | 4,390 | | |
| 3.81%, due 08/10/2006 * | | | 4,356 | | | | 4,356 | | |
Credit Suisse First Boston Corp.
4.11%, due 03/10/2006 * | | | 871 | | | | 871 | | |
| Certificates Of Deposit (1.0%) | |
Canadian Imperial Bank of Commerce
4.07%, due 11/04/2005 * | | | 3,484 | | | | 3,484 | | |
Harris Trust & Savings Bank
3.80%, due 11/04/2005 * | | | 2,773 | | | | 2,773 | | |
Rabobank Nederland
4.03%, due 05/31/2006 * | | | 4,356 | | | | 4,356 | | |
The notes to the financial statements are an integral part of this report.
Transamerica IDEX Mutual Funds
Annual Report 2005
4
TA IDEX Janus Growth
SCHEDULE OF INVESTMENTS (continued)
At October 31, 2005
(all amounts except share amounts in thousands)
| | | Principal | | Value | |
| Commercial Paper (2.8%) | | | |
Ciesco LLC
| |
| 4.00%, due 11/03/2005 | | $ | 4,350 | | | $ | 4,350 | | |
General Electric Capital Corp.
3.96%, due 12/05/2005 | | | 3,484 | | | | 3,484 | | |
Paradigm Funding LLC–144A
4.01%, due 11/07/2005 | | | 3,474 | | | | 3,474 | | |
Park Avenue Receivables Corp.–144A
4.03%, due 12/02/2005 | | | 3,450 | | | | 3,450 | | |
Preferred Receivables Corp.–144A
4.04%, due 12/05/2005 | | | 2,613 | | | | 2,613 | | |
Ranger Funding Co. LLC–144A
3.99%, due 11/15/2005 | | | 2,593 | | | | 2,593 | | |
Sheffield Receivables Corp.–144A
4.01%, due 11/08/2005 | | | 2,613 | | | | 2,613 | | |
Yorktown Capital LLC
3.97%, due 11/09/2005
3.93%, due 11/17/2005 | | | 4,341
4,326 | | | | 4,341
4,326 | | |
| Euro Dollar Overnight (3.1%) | | | |
Bank of Montreal
3.79%, due 11/01/2005 | | | 2,613 | | | | 2,613 | | |
Barclays
3.80%, due 11/04/2005 | | | 3,484 | | | | 3,484 | | |
BNP Paribas
3.83%, due 11/02/2005 | | | 5,227 | | | | 5,227 | | |
Deutsche Bank
3.80%, due 11/02/2005 | | | 8,711 | | | | 8,711 | | |
HSBC Banking/Holdings PLC
3.84%, due 11/07/2005 | | | 2,613 | | | | 2,613 | | |
Royal Bank of Scotland
3.76%, due 11/01/2005 | | | 3,485 | | | | 3,485 | | |
Svenska Handlesbanken
4.03%, due 11/01/2005 | | | 4,486 | | | | 4,486 | | |
UBS AG
3.80%, due 11/03/2005 | | | 3,485 | | | | 3,485 | | |
| Euro Dollar Terms (1.1%) | | | |
Royal Bank of Scotland
4.00%, due 12/12/2005 | | | 3,485 | | | | 3,485 | | |
UBS AG
4.02%, due 12/01/2005 | | | 3,485 | | | | 3,485 | | |
Wells Fargo
3.96%, due 11/14/2005 | | | 5,227 | | | | 5,227 | | |
| Promissory Notes (0.3%) | | | |
Goldman Sachs Group, Inc.
4.02%, due 12/28/2005 | | | 3,659 | | | | 3,659 | | |
| | | Principal | | Value | |
| Repurchase Agreements (4.0%) †† | | | |
Credit Suisse First Boston Corp.
| |
4.10%, dated 10/31/2005 to be
| |
| repurchased at $5,938 on 11/01/2005 | | $ | 5,937 | | | $ | 5,937 | | |
Goldman Sachs Group, Inc. (The)
4.10%, dated 10/31/2005 to be
repurchased at $14,811 on 11/01/2005 | | | 14,809 | | | | 14,809 | | |
Lehman Brothers, Inc.
4.10%, dated 10/31/2005 to be
repurchased at $410 on 11/01/2005 | | | 410 | | | | 410 | | |
Merrill Lynch & Co.
4.10%, dated 10/31/2005 to be
repurchased at $17,425 on 11/01/2005 | | | 17,423 | | | | 17,423 | | |
Morgan Stanley Dean Witter & Co.
4.17%, dated 10/31/2005 to be
repurchased at $5,223 on 11/01/2005 | | | 5,223 | | | | 5,223 | | |
| | | Shares | | Value | |
| Investment Companies (1.0%) | | | |
| Money Market Funds (1.0%) | | | |
American Beacon Fund
| |
| 1-day yield of 3.81% | | | 3,756,125 | | | $ | 3,756 | | |
Barclays Global Investors Institutional
Money Market Fund
1-day yield of 3.92% | | | 3,484,552 | | | | 3,485 | | |
Goldman Sachs Financial Square
Prime Obligations Fund
1-day yield of 3.79% | | | 542,781 | | | | 543 | | |
Merrimac Cash Fund, Premium Class
1-day yield of 3.70% @ | | | 3,446,040 | | | | 3,446 | | |
| Total Security Lending Collateral (cost: $156,466) | | | | | | | 156,466 | | |
| Total Investment Securities (cost: $944,276) | | | | | | $ | 1,191,321 | | |
| SUMMARY: | | | |
| Investment securities, at value | | | 108.1 | % | | $ | 1,191,321 | | |
| Liabilities in excess of other assets | | | (8.1 | )% | | | (89,480 | ) | |
| Net assets | | | 100.0 | % | | $ | 1,101,841 | | |
| FORWARD FOREIGN CURRENCY CONTRACTS: | | | |
| Currency | | Bought
(Sold) | | Settlement
Date | | Amount in
U.S. Dollars
Bought (Sold) | | Net
Unrealized
Appreciation
(Depreciation) | |
| Swiss Franc | | | (46,300 | ) | | | 01/27/2006 | | | $ | (36,737 | ) | | $ | 576 | | |
| | | $ | (36,737 | ) | | $ | 576 | | |
The notes to the financial statements are an integral part of this report.
Transamerica IDEX Mutual Funds
Annual Report 2005
5
TA IDEX Janus Growth
SCHEDULE OF INVESTMENTS (continued)
At October 31, 2005
(all amounts except share amounts in thousands)
NOTES TO SCHEDULE OF INVESTMENTS:
† At October 31, 2005, all or a portion of this security is on loan (see Note 1). The value at October 31, 2005, of all securities on loan is $151,805.
‡ Non-income producing.
* Floating or variable rate note. Rate is listed as of October 31, 2005.
†† Cash collateral for the Repurchase Agreements, valued at $44,678, that serve as collateral for securities lending are invested in corporate bonds with interest rates and maturity dates ranging from 0.00%–9.86% and 12/31/2005–11/15/2096, respectively.
@ Regulated investment company advised by Investors Bank and Trust Co. ("IBT"). IBT is also the accounting, custody and lending agent for the Fund.
DEFINITIONS:
144A 144A Securities are registered pursuant to Rule 144A of the Securities Act of 1933. These securities are deemed to be liquid for purposes of compliance limitations on holdings of illiquid securities and may be resold as transactions exempt from registration, normally to qualified institutional buyers. At October 31, 2005, these securities aggregated $14,743 or 1.3% of the net assets of the Fund.
ADR American Depositary Receipt
The notes to the financial statements are an integral part of this report.
Transamerica IDEX Mutual Funds
Annual Report 2005
6
TA IDEX Janus Growth
STATEMENT OF ASSETS AND LIABILITIES
At October 31, 2005
(all amounts except per share amounts in thousands)
| Assets: | | | |
Investment securities, at value (cost: $944,276)
(including securities loaned of $151,805) | | $ | 1,191,321 | | |
| Cash | | | 69,273 | | |
| Receivables: | |
| Investment securities sold | | | 1,986 | | |
| Shares of beneficial interest sold | | | 101 | | |
| Interest | | | 156 | | |
| Dividends | | | 93 | | |
| Dividend reclaims receivable | | | 216 | | |
Unrealized appreciation on forward foreign currency
contracts | | | 576 | | |
| Other | | | 332 | | |
| | | | 1,264,054 | | |
| Liabilities: | | | |
| Investment securities purchased | | | 2,515 | | |
| Accounts payable and accrued liabilities: | |
| Shares of beneficial interest redeemed | | | 1,266 | | |
| Management and advisory fees | | | 730 | | |
| Distribution and service fees | | | 390 | | |
| Transfer agent fees | | | 334 | | |
| Administration fees | | | 18 | | |
| Payable for collateral for securities on loan | | | 156,466 | | |
| Other | | | 494 | | |
| | | | 162,213 | | |
| Net Assets | | $ | 1,101,841 | | |
| Net Assets Consist of: | | | |
Shares of beneficial interest, unlimited shares
authorized, no par value | | $ | 1,630,213 | | |
| Accumulated net investment income (loss) | | | (391 | ) | |
Accumulated net realized gain (loss) from investment
securities and foreign currency transactions | | | (775,564 | ) | |
Net unrealized appreciation (depreciation) on:
Investment securities | | | 247,018 | | |
Translation of assets and liabilites denominated
in foreign currencies | | | 565 | | |
| Net Assets | | $ | 1,101,841 | | |
| Net Assets by Class: | | | |
| Class A | | $ | 628,693 | | |
| Class B | | | 179,090 | | |
| Class C | | | 63,366 | | |
| Class T | | | 230,692 | | |
| Shares Outstanding: | | | |
| Class A | | | 25,499 | | |
| Class B | | | 7,885 | | |
| Class C | | | 2,792 | | |
| Class T | | | 8,972 | | |
| Net Asset Value Per Share: | | | |
| Class A | | $ | 24.66 | | |
| Class B | | | 22.71 | | |
| Class C | | | 22.70 | | |
| Class T | | | 25.71 | | |
| Maximum Offering Price Per Share (a): | | | |
| Class A | | $ | 26.10 | | |
| Class T | | | 28.10 | | |
(a) Includes the maximum selling commission (represented as a percentage of offering price) which is reduced on certain levels of sales as set forth in the Prospectus. Net asset value per share for Classes B and C shares represents offering price. The redemption price for Classes B and C shares equals net asset value less any applicable contingent deferred sales charge.
STATEMENT OF OPERATIONS
For the year ended October 31, 2005
(all amounts in thousands)
| Investment Income: | | | |
| Interest | | $ | 1,328 | | |
Dividends (net of withholding taxes on foreign
dividends of $145) | | | 6,933 | | |
| Income from loaned securities–net | | | 130 | | |
| | | | 8,391 | | |
| Expenses: | | | |
| Management and advisory fees | | | 8,837 | | |
| Distribution and service fees: | |
| Class A | | | 2,160 | | |
| Class B | | | 1,946 | | |
| Class C | | | 684 | | |
| Transfer agent fees: | |
| Class A | | | 1,358 | | |
| Class B | | | 1,000 | | |
| Class C | | | 333 | | |
| Class T | | | 288 | | |
| Printing and shareholder reports | | | 526 | | |
| Custody fees | | | 140 | | |
| Administration fees | | | 215 | | |
| Legal fees | | | 79 | | |
| Audit fees | | | 18 | | |
| Trustees fees | | | 54 | | |
| Registration fees: | |
| Class A | | | 28 | | |
| Class B | | | 15 | | |
| Class C | | | 13 | | |
| Class T | | | 14 | | |
| Other | | | 61 | | |
| Total expenses | | | 17,769 | | |
| Less: | |
| Reimbursement of class expenses: | | | | | |
| Class B | | | (141 | ) | |
| Class C | | | (39 | ) | |
| Total reimbursed expenses | | | (180 | ) | |
| Net expenses | | | 17,589 | | |
| Net Investment Income (Loss) | | | (9,198 | ) | |
| Net Realized Gain (Loss) from: | | | |
| Investment securities | | | 99,272 | | |
| Foreign currency transactions | | | 2,132 | | |
| | | | 101,404 | | |
Net Increase (Decrease) in Unrealized Appreciation
(Depreciation) on: | | | |
| Investment securities | | | 55,006 | | |
Translation of assets and liabilities denominated in
foreign currencies | | | 560 | | |
| | | | 55,566 | | |
Net Gain (Loss) on Investment Securities and
Foreign Currency Transactions | | | 156,970 | | |
Net Increase (Decrease) in Net Assets Resulting
from Operations | | $ | 147,772 | | |
The notes to the financial statements are an integral part of this report.
Transamerica IDEX Mutual Funds
Annual Report 2005
7
TA IDEX Janus Growth
STATEMENTS OF CHANGES IN NET ASSETS
For the years ended
(all amounts in thousands)
| | | October 31,
2005 | | October 31,
2004 | |
Increase (Decrease) In Net
Assets From: | |
| Operations: | |
| Net investment income (loss) | | $ | (9,198 | ) | | $ | (13,666 | ) | |
Net realized gain (loss) from
investment securities and foreign
currency transactions | | | 101,404 | | | | 106,544 | | |
Net unrealized appreciation
(depreciation) on investment
securities and foreign currency
translation | | | 55,566 | | | | 16,812 | | |
| | | | 147,772 | | | | 109,690 | | |
| Capital Share Transactions: | |
| Proceeds from shares sold: | |
| Class A | | | 92,689 | | | | 67,910 | | |
| Class B | | | 6,817 | | | | 10,284 | | |
| Class C | | | 5,221 | | | | 1,430 | | |
| Class C2 | | | – | | | | 1,299 | | |
| Class M | | | – | | | | 1,439 | | |
| Class T | | | 2,681 | | | | 16,270 | | |
| | | | 107,408 | | | | 98,632 | | |
| Cost of shares redeemed: | |
| Class A | | | (119,995 | ) | | | (131,454 | ) | |
| Class B | | | (54,012 | ) | | | (57,915 | ) | |
| Class C | | | (21,745 | ) | | | (5,449 | ) | |
| Class C2 | | | – | | | | (7,522 | ) | |
| Class M | | | – | | | | (17,120 | ) | |
| Class T | | | (51,883 | ) | | | (218,736 | ) | |
| | | | (247,635 | ) | | | (438,196 | ) | |
| Class level exchanges: | |
| Class C | | | – | | | | 73,690 | | |
| Class C2 | | | – | | | | (27,543 | ) | |
| Class M | | | – | | | | (46,147 | ) | |
| | | | – | | | | – | | |
| Automatic conversions: | |
| Class A | | | 1,929 | | | | 1,347 | | |
| Class B | | | (1,929 | ) | | | (1,347 | ) | |
| | | | – | | | | – | | |
| | | | (140,227 | ) | | | (339,564 | ) | |
| Net increase (decrease) in net assets | | | 7,545 | | | | (229,874 | ) | |
| Net Assets: | |
| Beginning of year | | | 1,094,296 | | | | 1,324,170 | | |
| End of year | | $ | 1,101,841 | | | $ | 1,094,296 | | |
Accumulated Net Investment
Income (Loss) | | $ | (391 | ) | | $ | (344 | ) | |
| | | October 31,
2005 | | October 31,
2004 | |
| Share Activity: | |
| Shares issued: | |
| Class A | | | 3,958 | | | | 3,230 | | |
| Class B | | | 315 | | | | 524 | | |
| Class C | | | 242 | | | | 73 | | |
| Class C2 | | | – | | | | 66 | | |
| Class M | | | – | | | | 73 | | |
| Class T | | | 111 | | | | 750 | | |
| | | | 4,626 | | | | 4,716 | | |
| Shares redeemed: | |
| Class A | | | (5,148 | ) | | | (6,266 | ) | |
| Class B | | | (2,491 | ) | | | (2,972 | ) | |
| Class C | | | (1,005 | ) | | | (278 | ) | |
| Class C2 | | | – | | | | (385 | ) | |
| Class M | | | – | | | | (867 | ) | |
| Class T | | | (2,130 | ) | | | (10,137 | ) | |
| | | | (10,774 | ) | | | (20,905 | ) | |
| Class level exchanges: | |
| Class C | | | – | | | | 3,720 | | |
| Class C2 | | | – | | | | (1,363 | ) | |
| Class M | | | – | | | | (2,331 | ) | |
| | | | – | | | | 26 | | |
| Automatic conversions: | |
| Class A | | | 83 | | | | 63 | | |
| Class B | | | (89 | ) | | | (68 | ) | |
| | | | (6 | ) | | | (5 | ) | |
Net increase (decrease) in shares
outstanding: | |
| Class A | | | (1,107 | ) | | | (2,973 | ) | |
| Class B | | | (2,265 | ) | | | (2,516 | ) | |
| Class C | | | (763 | ) | | | 3,515 | | |
| Class C2 | | | – | | | | (1,682 | ) | |
| Class M | | | – | | | | (3,125 | ) | |
| Class T | | | (2,019 | ) | | | (9,387 | ) | |
| | | | (6,154 | ) | | | (16,168 | ) | |
The notes to the financial statements are an integral part of this report.
Transamerica IDEX Mutual Funds
Annual Report 2005
8
TA IDEX Janus Growth
FINANCIAL HIGHLIGHTS
| | | | | For a share of beneficial interest outstanding throughout each period | |
| | | | | Net Asset | | Investment Operations | | Distributions | | Net Asset | |
| | | For the
Period
Ended (d)(g) | | Value,
Beginning
of Period | | Net
Investment
Income (Loss) | | Net Realized
and Unrealized
Gain (Loss) | | Total
Operations | | From Net
Investment
Income | | From Net
Realized
Gains | | Total
Distributions | | Value,
End
of Period | |
| Class A | | 10/31/2005 | | $ | 21.56 | | | $ | (0.17 | ) | | $ | 3.27 | | | $ | 3.10 | | | $ | – | | | $ | – | | | $ | – | | | $ | 24.66 | | |
| | | 10/31/2004 | | | 19.73 | | | | (0.21 | ) | | | 2.04 | | | | 1.83 | | | | – | | | | – | | | | – | | | | 21.56 | | |
| | | 10/31/2003 | | | 15.87 | | | | (0.21 | ) | | | 4.07 | | | | 3.86 | | | | – | | | | – | | | | – | | | | 19.73 | | |
| | | 10/31/2002 | | | 19.64 | | | | (0.22 | ) | | | (3.55 | ) | | | (3.77 | ) | | | – | | | | – | | | | – | | | | 15.87 | | |
| | | 10/31/2001 | | | 43.81 | | | | (0.24 | ) | | | (20.80 | ) | | | (21.04 | ) | | | – | | | | (3.13 | ) | | | (3.13 | ) | | | 19.64 | | |
| Class B | | 10/31/2005 | | | 20.04 | | | | (0.34 | ) | | | 3.01 | | | | 2.67 | | | | – | | | | – | | | | – | | | | 22.71 | | |
| | | 10/31/2004 | | | 18.45 | | | | (0.32 | ) | | | 1.91 | | | | 1.59 | | | | – | | | | – | | | | – | | | | 20.04 | | |
| | | 10/31/2003 | | | 14.93 | | | | (0.31 | ) | | | 3.83 | | | | 3.52 | | | | – | | | | – | | | | – | | | | 18.45 | | |
| | | 10/31/2002 | | | 18.63 | | | | (0.34 | ) | | | (3.36 | ) | | | (3.70 | ) | | | – | | | | – | | | | – | | | | 14.93 | | |
| | | 10/31/2001 | | | 42.08 | | | | (0.41 | ) | | | (19.91 | ) | | | (20.32 | ) | | | – | | | | (3.13 | ) | | | (3.13 | ) | | | 18.63 | | |
| Class C | | 10/31/2005 | | | 20.03 | | | | (0.34 | ) | | | 3.01 | | | | 2.67 | | | | – | | | | – | | | | – | | | | 22.70 | | |
| | | 10/31/2004 | | | 18.45 | | | | (0.30 | ) | | | 1.88 | | | | 1.58 | | | | – | | | | – | | | | – | | | | 20.03 | | |
| | | 10/31/2003 | | | 14.74 | | | | (0.32 | ) | | | 4.03 | | | | 3.71 | | | | – | | | | – | | | | – | | | | 18.45 | | |
| Class T | | 10/31/2005 | | | 22.39 | | | | (0.06 | ) | | | 3.38 | | | | 3.32 | | | | – | | | | – | | | | – | | | | 25.71 | | |
| | | 10/31/2004 | | | 20.45 | | | | (0.16 | ) | | | 2.10 | | | | 1.94 | | | | – | | | | – | | | | – | | | | 22.39 | | |
| | | 10/31/2003 | | | 16.40 | | | | (0.16 | ) | | | 4.21 | | | | 4.05 | | | | – | | | | – | | | | – | | | | 20.45 | | |
| | | 10/31/2002 | | | 20.20 | | | | (0.16 | ) | | | (3.64 | ) | | | (3.80 | ) | | | – | | | | – | | | | – | | | | 16.40 | | |
| | | 10/31/2001 | | | 44.76 | | | | (0.14 | ) | | | (21.29 | ) | | | (21.43 | ) | | | – | | | | (3.13 | ) | | | (3.13 | ) | | | 20.20 | | |
| | | | | | | Ratios/Supplemental Data | |
| | | For the
Period | | Total | | Net Assets,
End of
Period | | Ratio of Expenses
to Average
Net Assets (a) | | Net Investment
Income (Loss)
to Average | | Portfolio
Turnover | |
| | | Ended (g) | | Return (c) | | (000's) | | Net (e) | | Total (f) | | Net Assets (a) | | Rate (b) | |
| Class A | | 10/31/2005 | | | 14.38 | % | | $ | 628,693 | | | | 1.45 | % | | | 1.45 | % | | | (0.71 | )% | | | 57 | % | |
| | | 10/31/2004 | | | 9.28 | | | | 573,640 | | | | 1.60 | | | | 1.60 | | | | (1.01 | ) | | | 41 | | |
| | | 10/31/2003 | | | 24.32 | | | | 583,674 | | | | 1.70 | | | | 1.72 | | | | (1.22 | ) | | | 62 | | |
| | | 10/31/2002 | | | (19.21 | ) | | | 505,704 | | | | 1.66 | | | | 1.69 | | | | (1.10 | ) | | | 62 | | |
| | | 10/31/2001 | | | (51.31 | ) | | | 770,590 | | | | 1.49 | | | | 1.49 | | | | (0.83 | ) | | | 64 | | |
| Class B | | 10/31/2005 | | | 13.32 | | | | 179,090 | | | | 2.33 | | | | 2.40 | | | | (1.58 | ) | | | 57 | | |
| | | 10/31/2004 | | | 8.62 | | | | 203,408 | | | | 2.22 | | | | 2.22 | | | | (1.59 | ) | | | 41 | | |
| | | 10/31/2003 | | | 23.58 | | | | 233,731 | | | | 2.35 | | | | 2.37 | | | | (1.87 | ) | | | 62 | | |
| | | 10/31/2002 | | | (19.86 | ) | | | 224,348 | | | | 2.31 | | | | 2.35 | | | | (1.75 | ) | | | 62 | | |
| | | 10/31/2001 | | | (51.74 | ) | | | 354,949 | | | | 2.14 | | | | 2.14 | | | | (1.48 | ) | | | 64 | | |
| Class C | | 10/31/2005 | | | 13.27 | | | | 63,366 | | | | 2.33 | | | | 2.39 | | | | (1.58 | ) | | | 57 | | |
| | | 10/31/2004 | | | 8.62 | | | | 71,196 | | | | 2.08 | | | | 2.08 | | | | (1.44 | ) | | | 41 | | |
| | | 10/31/2003 | | | 25.17 | | | | 735 | | | | 2.35 | | | | 2.37 | | | | (1.88 | ) | | | 62 | | |
| Class T | | 10/31/2005 | | | 14.83 | | | | 230,692 | | | | 1.01 | | | | 1.01 | | | | (0.26 | ) | | | 57 | | |
| | | 10/31/2004 | | | 9.49 | | | | 246,052 | | | | 1.38 | | | | 1.38 | | | | (0.75 | ) | | | 41 | | |
| | | 10/31/2003 | | | 24.70 | | | | 416,719 | | | | 1.35 | | | | 1.37 | | | | (0.87 | ) | | | 62 | | |
| | | 10/31/2002 | | | (18.82 | ) | | | 368,301 | | | | 1.31 | | | | 1.34 | | | | (0.75 | ) | | | 62 | | |
| | | 10/31/2001 | | | (51.07 | ) | | | 546,317 | | | | 1.14 | | | | 1.14 | | | | (0.48 | ) | | | 64 | | |
The notes to the financial statements are an integral part of this report.
Transamerica IDEX Mutual Funds
Annual Report 2005
9
TA IDEX Janus Growth
FINANCIAL HIGHLIGHTS (continued)
NOTES TO FINANCIAL HIGHLIGHTS
(a) Annualized.
(b) Not annualized.
(c) Total Return has been calculated for the applicable period without deduction of a sales load, if any, on an initial purchase. Periods of less than one year are not annualized.
(d) Per share information is calculated based on average number of shares outstanding.
(e) Ratio of Net Expenses to Average Net Assets is net of fee waivers and reimbursements by the investment adviser, if any (see note 2).
(f) Ratio of Total Expenses to Average Net Assets includes all expenses before fee waivers and reimbursements by the investment adviser.
(g) The inception date for the Fund's offering of share Class C was November 11, 2002.
The notes to the financial statements are an integral part of this report.
Transamerica IDEX Mutual Funds
Annual Report 2005
10
TA IDEX Janus Growth
NOTES TO FINANCIAL STATEMENTS
At October 31, 2005
(all amounts in thousands)
NOTE 1. ORGANIZATION AND SIGNIFICANT ACCOUNTING POLICIES
Transamerica IDEX Mutual Funds is an open-end management investment company registered under the Investment Company Act of 1940, as amended (the "1940 Act").
In the normal course of business, TA IDEX Janus Growth (the "Fund") enters into contracts that contain a variety of representations that provide general indemnifications. The Fund's maximum exposure under these arrangements is unknown, as this would involve future claims that may be made against the Fund and/or its affiliates that have not yet occurred. However, based on experience, the Fund expects the risk of loss to be remote.
This report should be read in conjunction with the current Fund prospectus, which contains more complete information about the Fund.
The following is a summary of significant accounting policies followed by the Fund in the preparation of the financial statements. In preparing the Fund's financial statements in accordance with accounting principles generally accepted in the United States of America ("GAAP"), estimates or assumptions (which could differ from actual results) may be used that affect reported amounts and disclosures.
Multiple class operations, income and expenses: The Fund currently offers four classes of shares, each with a public offering price that reflects different sales charges, if any, and expense levels. Class T shares are not available to new investors. On June 15, 2004, Class C2 shares merged into Class C. On September 24, 2004, Class M shares merged into Class C. Class B shares will convert to Class A shares eight years after purchase. Income, non-class specific expenses and realized and unrealized gains and losses, are allocated daily to each class, based upon the value of shares outstanding method as permitted under Rule 18f-3 of the 1940 Act. Each class bears its own specific expenses as well as a portion of general, common expenses.
Security valuations: The Fund values its investments at the close of the New York Stock Exchange ("NYSE"), normally 4 p.m. ET, each day the NYSE is open for business. Fund investments are valued at the last sale price or closing price on the day of valuation taken from the primary exchange where the security is principally traded.
Securities traded in the over-the-counter market and listed securities for which no sale was reported on that date are valued at the last quoted bid price.
Debt securities are valued based on a price quotation or other equivalent indication of value supplied by an exchange, a pricing service or a major market maker; however, those that mature in sixty days or less are valued at amortized cost, which approximates market.
Investment company securities are valued at the net asset value of the underlying portfolio.
Foreign securities generally are valued based on quotations from the primary market in which they are traded. Because many foreign securities markets and exchanges close prior to the close of the NYSE, closing prices for foreign securities in those markets or on those exchanges do not reflect the events that occur after that close. If a significant market event impacting the value of a portfolio security (e.g., natural disaster, company announcement, market volatility) occurs subsequent to the close of trading in the security, but prior to the calculation of the Fund's net asset value per share, market quotations for that security may be determined to be unreliable and, accordingly, not "readily available." As a result, foreign equity securities held by the Fund may be valued at fair market value as determined in good faith by the Fund's Administrative Valuation Committee, under the supervision of the B oard's Valuation Committee, using guidelines adopted by the Board of Trustees.
Other securities for which quotations are not readily available or whose values have been determined to be unreliable are valued at fair market value as determined in good faith by the Fund's Administrative Valuation Committee, under the supervision of the Board's Valuation Committee, using guidelines adopted by the Board of Trustees.
Cash: The Fund may leave cash overnight in its cash account with the custodian, Investors Bank & Trust Company ("IBT"). IBT has been contracted on behalf of the Fund to invest the excess cash into a savings account, which at October 31, 2005, was paying an interest rate of 2.76%.
Repurchase agreements: The Fund is authorized to enter into repurchase agreements. The Fund, through its custodian, IBT, receives delivery of the underlying securities, the value of which at the time of purchase is required to be an amount equal to at least 100% of the resale price. The Fund will bear the risk of value fluctuations until the security can be sold and may encounter delays and incur costs in liquidating the security. In the event of bankruptcy or insolvency of the seller, delays and costs may be incurred.
Commission recapture: The sub-adviser, to the extent consistent with the best execution and usual commission rate policies and practices, may place security transactions of the Fund with broker/dealers with which Transamerica IDEX Mutual Funds has established a Commission Recapture Program. A Commission Recapture Program is any arrangement under which a broker/dealer applies a portion of the commissions received by such broker/dealer on the security transactions to the Fund. In no event will commissions paid by the Fund be used to pay expenses that would otherwise be borne by any other funds within Transamerica IDEX Mutual Funds, or by any other party.
Recaptured commissions during the year ended October 31, 2005, of $206 are included in net realized gains in the Statement of Operations.
Securities lending: The Fund may lend securities to qualified borrowers, with IBT acting as the Fund's lending agent. The Fund earns
Transamerica IDEX Mutual Funds
Annual Report 2005
11
TA IDEX Janus Growth
NOTES TO FINANCIAL STATEMENTS (continued)
At October 31, 2005
(all amounts in thousands)
NOTE 1.–(continued)
negotiated lenders' fees. The Fund receives cash and/or securities as collateral against the loaned securities. Cash collateral received is invested in short term, interest bearing securities. The Fund monitors the market value of securities loaned on a daily basis and requires collateral in an amount at least equal to the value of the securities loaned. Income from loaned securities on the Statement of Operations is net of fees, in the amount of $56, earned by IBT for its services.
Security transactions and investment income: Security transactions are recorded on the trade date. Security gains and losses are calculated on the specific identification basis. Dividend income, if any, is recorded on the ex-dividend date or, in the case of foreign securities, as soon as the Fund is informed of the ex-dividend date. Interest income, including accretion of discounts and amortization of premiums, is recorded on the accrual basis commencing on the settlement date.
Foreign currency denominated investments: The accounting records of the Fund are maintained in U.S. dollars. Securities and other assets and liabilities denominated in foreign currencies are translated into U.S. dollars at the closing exchange rate each day. The cost of foreign securities is translated at the exchange rate in effect when the investment was acquired. The Fund combines fluctuations from currency exchange rates and fluctuations in value when computing net realized and unrealized gains or losses from investments.
Net foreign currency gains and losses resulting from changes in exchange rates include: 1) foreign currency fluctuations between trade date and settlement date of investment security transactions; 2) gains and losses on forward foreign currency contracts; and 3) the difference between the receivable amounts of interest and dividends recorded in the accounting records in U.S. dollars and the amounts actually received.
Foreign currency denominated assets may involve risks not typically associated with domestic transactions. These risks include revaluation of currencies, adverse fluctuations in foreign currency values and possible adverse political, social and economic developments, including those particular to a specific industry, country or region.
Foreign capital gains taxes: The Fund may be subject to taxes imposed by countries in which it invests, with respect to its investment in issuers existing or operating in such countries. Such taxes are generally based on income earned or repatriated and capital gains realized on the sale of such investments. The Fund accrues such taxes when the related income or capital gains are earned. Some countries require governmental approval for the repatriation of investment income, capital or the proceeds of sales earned by foreign investors. In addition, if there is deterioration in a country's balance of payments or for other reasons, a country may impose temporary restrictions on foreign capital remittances abroad.
Forward foreign currency contracts: The Fund may enter into forward foreign currency contracts to hedge against exchange rate risk arising from investments in securities denominated in foreign currencies. Contracts are valued at the contractual forward rate and are marked to market daily, with the change in value recorded as an unrealized gain or loss. When the contracts are settled a realized gain or loss is incurred. Risks may arise from changes in market value of the underlying currencies and from the possible inability of counterparties to meet the terms of their contracts.
Open forward currency contracts at October 31, 2005, are listed in the Schedule of Investments.
Redemption fees: A short-term trading redemption fee may be assessed on any Fund shares in a fund account that are sold during the first five (5) NYSE trading days following their purchase date. This redemption fee will equal 2% of the amount redeemed and shares held the longest will be treated as being redeemed first and shares held the shortest as being redeemed last. For the year ended October 31, 2005, the Fund received less than $1 in redemption fees.
Dividend distributions: Distributions to shareholders are recorded on the ex-dividend date and are determined in accordance with Federal income tax regulations which may differ from GAAP.
NOTE 2. RELATED PARTY TRANSACTIONS
Effective January 1, 2005 AEGON/Transamerica Fund Advisors, Inc. was renamed Transamerica Fund Advisors, Inc. ("TFAI"); AEGON/Transamerica Fund Services, Inc. and AEGON/Transamerica Investor Services, Inc. merged into one entity and was renamed Transamerica Fund Services, Inc. ("TFS").
TFAI is the Fund's investment adviser. TFS is the Fund's administrator and transfer agent. AFSG Securities Corp. ("AFSG") is the Fund's distributor/principal underwriter. TFAI, TFS , and AFSG are affiliates of AEGON, NV, a Netherlands corporation.
The following schedule reflects the percentage of Fund assets owned by affiliated mutual funds:
| | | Net
Assets | | % of
Net Assets | |
TA IDEX Asset Allocation–
Conservative Portfolio | | $ | 13,038 | | | | 1.18 | % | |
TA IDEX Asset Allocation–
Growth Portfolio | | | 41,803 | | | | 3.79 | % | |
TA IDEX Asset Allocation–
Moderate Growth Portfolio | | | 94,389 | | | | 8.57 | % | |
TA IDEX Asset Allocation–
Moderate Portfolio | | | 24,302 | | | | 2.21 | % | |
| Total | | $ | 173,532 | | | | 15.75 | % | |
Transamerica IDEX Mutual Funds
Annual Report 2005
12
TA IDEX Janus Growth
NOTES TO FINANCIAL STATEMENTS (continued)
At October 31, 2005
(all amounts in thousands)
NOTE 2.–(continued)
Investment advisory fees: The Fund pays management fees to TFAI based on average daily net assets ("ANA") at the following breakpoints:
From November 1, 2004 to December 31, 2004:
1.00% of the first $250 million of ANA
0.90% of the next $500 million of ANA
0.80% of the next $750 million of ANA
0.70% of ANA over $1.5 billion
From January 1, 2005 on:
0.80% of the first $250 million of ANA
0.77% of the next $500 million of ANA
0.75% of the next $750 million of ANA
0.70% of the next $1.5 billion of ANA
0.675% of ANA over $3 billion
TFAI has contractually agreed to waive its advisory fee and will reimburse the Fund to the extent that operating expenses, excluding 12b-1 fees, exceed the following stated annual limit:
From November 1, 2004 to December 31, 2004:
1.50% Expense Limit
From January 1, 2005 on:
1.30% Expense Limit
The sub-adviser, Janus Capital Management, LLC, has agreed to a pricing discount based on the aggregate assets that they manage in the AEGON/Transamerica Series Trust and Transamerica IDEX Mutual Funds. There was no discount received by the Fund for the year ended October 31, 2005.
Distribution and service fees: The Fund has a 12b-1 distribution plan under the 1940 Act pursuant to which an annual fee, based on average daily net assets, is paid to the distributor for various disbursements such as broker-dealer account servicing fees and other promotional expenses of the Fund, excluding Class T. The 12b-1 fee for the Fund is comprised of a 0.25% service fee and the remaining amount is an asset-based sales charge/distribution fee. The Fund is authorized under the 12b-1 plan to pay fees on each class up to the following limits:
| Class A | | | 0.35 | % | |
| Class B | | | 1.00 | % | |
| Class C | | | 1.00 | % | |
| Class T | | | N/A | | |
In the case the Fund or a class of shares of the Fund is closed to new investors or investments, the Fund is authorized to pay 12b-1 fees for past sales and distribution efforts and present and past investor services.
Underwriter commissions relate to front-end sales charges imposed for Class A and T shares and contingent deferred sales charges from Classes B, C, and certain A share redemptions. For the year ended October 31, 2005, the underwriter commissions were as follows:
| Received by Underwriter | | $ | 1,147 | | |
| Retained by Underwriter | | | 92 | | |
| Contingent Deferred Sales Charge | | | 371 | | |
Administrative services: The Fund has entered into an agreement with TFS for financial and legal fund administration services. As of January 1, 2005 the Fund pays TFS an annual fee of 0.02% of ANA. Prior to January 1, 2005 the Fund paid TFS an annual fee of 0.015% of ANA. The legal fees on the Statement of Operations are for fees paid to external legal counsel.
Transfer agent fees: The Fund pays TFS an annual per-account charge for each open and closed account. The Fund paid TFS $2,630 for the year ended October 31, 2005.
Deferred compensation plan: Each eligible independent Fund Trustee may elect to participate in a non-qualified deferred compensation plan maintained by Transamerica IDEX Mutual Funds (the "Plan"). Under the Plan, such Trustees may defer payment of all or a portion of their total fees earned as a Fund Trustee. Each Trustee who is a participant in the Plan may elect that the earnings, losses or gains credited to his or her deferred fee amounts be determined based on a deemed investment in any series of Transamerica IDEX Mutual Funds, including the Fund. The right of a participant to receive a distribution from the Plan of the deferred fees is an unsecured claim against the general assets of all series of Transamerica IDEX Mutual Funds. The pro rata liability to the Fund of all deferred fees i n the Plan amounted, as of October 31, 2005, to $332.
NOTE 3. INVESTMENT TRANSACTIONS
The cost of securities purchased and proceeds from securities sold (excluding short-term securities) for the year ended October 31, 2005, were as follows:
| Purchases of securities: | | | |
| Long-Term | | $ | 586,677 | | |
| U.S. Government | | | – | | |
| Proceeds from maturities and sales of securities: | | | |
| Long-Term | | | 677,356 | | |
| U.S. Government | | | – | | |
NOTE 4. FEDERAL INCOME TAX MATTERS
The Fund has not made any provision for federal income or excise taxes due to its policy to distribute all of its taxable income and capital
Transamerica IDEX Mutual Funds
Annual Report 2005
13
TA IDEX Janus Growth
NOTES TO FINANCIAL STATEMENTS (continued)
At October 31, 2005
(all amounts in thousands)
NOTE 4.–(continued)
gains to its shareholders and otherwise qualify as a regulated investment company under Subchapter M of the Internal Revenue Code. Income and capital gain distributions are determined in accordance with income tax regulations, which may differ from GAAP. These differences are primarily due to differing treatment for items including, but not limited to, wash sales, net operating losses, foreign currency transactions, deferred compensation and capital loss carryforwards.
Therefore, distributions determined in accordance with tax regulations may differ significantly in amount or character from net investment income and realized gains for financial reporting purposes. Financial reporting records are adjusted for permanent book/tax differences to reflect tax character. Financial records are not adjusted for temporary differences. These reclassifications are as follows:
Shares of beneficial interest, unlimited
shares authorized | | $ | (9,051 | ) | |
| Accumulated net investment income (loss) | | | 9,151 | | |
Accumulated net realized gain (loss) from investment
securities | | | (100 | ) | |
The capital loss carryforward is available to offset future realized capital gains through the period listed:
Capital Loss
Carryforward | | Available Through | |
| $ | 425,701 | | | October 31, 2009 | |
| | 259,422 | | | October 31, 2010 | |
| | 86,859 | | | October 31, 2011 | |
The capital loss carryforward utilized during the year ended October 31, 2005 was $101,879.
The tax basis components of distributable earnings as of October 31, 2005, are as follows:
| Undistributed Ordinary Income | | $ | – | | |
| Undistributed Long-term Capital Gains | | $ | – | | |
| Capital Loss Carryforward | | $ | (771,982 | ) | |
| Net Unrealized Appreciation (Depreciation) | | $ | 244,577 | * | |
* Amount includes unrealized appreciation (depreciation) from foreign currency and deferred compensation.
The aggregate cost of investments and composition of unrealized appreciation (depreciation) for federal income tax purposes as of October 31, 2005, are as follows:
| Federal Tax Cost Basis | | $ | 947,282 | | |
| Unrealized Appreciation | | $ | 268,217 | | |
| Unrealized (Depreciation) | | | (24,178 | ) | |
| Net Unrealized Appreciation (Depreciation) | | $ | 244,039 | | |
NOTE 5. REGULATORY PROCEEDINGS
There continues to be significant federal and state regulatory activity relating to financial services companies, particularly mutual fund companies and their investment advisers. As part of an ongoing investigation regarding potential market timing, recordkeeping and trading compliance issues and matters affecting the Fund's investment adviser, TFAI, and certain affiliates and former employees of TFAI, the SEC staff has indicated that it is likely to take some action against TFAI and certain of its affiliates at the conclusion of the investigation. The potential timing and the scope of any such action is difficult to predict. Although the impact of any action brought against TFAI and/or its affiliates is difficult to assess at the present time, the Fund currently believes that the likelihood that any such action will have a material adverse impact on it is remote. It is important to note that the Fund is not aware of any allegation of wrongdoing against it and its Board at the time this annual report is printed. Although it is not anticipated that these developments will have an adverse impact on the Fund, there can be no assurance at this time. TFAI and its affiliates are actively working with the SEC in regard to this matter; however, the exact resolution cannot be determined at this time. TFAI will take such actions that it deems necessary or appropriate to continue providing management services to the Fund and to bring all matters to an appropriate conclusion.
TFAI and/or its affiliates, and not the Fund, will bear the costs regarding these regulatory matters.
Transamerica IDEX Mutual Funds
Annual Report 2005
14
Report of Independent Registered Certified Public Accounting Firm
To the Board of Trustees and Shareholders of
TA IDEX Janus Growth
In our opinion, the accompanying statement of assets and liabilities, including the schedule of investments, and the related statements of operations and of changes in net assets and the financial highlights present fairly, in all material respects, the financial position of TA IDEX Janus Growth (the "Fund") (one of the portfolios constituting the Transamerica IDEX Mutual Funds) at October 31, 2005, the results of its operations for the year then ended, the changes in its net assets for each of the two years in the period then ended and the financial highlights for each of the periods presented, in conformity with accounting principles generally accepted in the United States of America. These financial statements and financial highlights (hereafter referred to as "financial statements") are the responsibility of the Fund's management; our responsibility is to express an opinion on these financial s tatements based on our audits. We conducted our audits of these financial statements in accordance with the standards of the Public Company Accounting Oversight Board (United States). Those standards require that we plan and perform the audit to obtain reasonable assurance about whether the financial statements are free of material misstatement. An audit includes examining, on a test basis, evidence supporting the amounts and disclosures in the financial statements, assessing the accounting principles used and significant estimates made by management, and evaluating the overall financial statement presentation. We believe that our audits, which included confirmation of securities at October 31, 2005 by correspondence with the custodian, provide a reasonable basis for our opinion.

December 22, 2005
Transamerica IDEX Mutual Funds
Annual Report 2005
15
TA IDEX Jennison Growth
MARKET ENVIRONMENT
For the twelve months ended October 31, 2005, the portfolio posted a 16.18% return and significantly outperformed its benchmark, the Russell 1000 Growth Index ("Russell 1000 Growth"), which was up 8.81%. The portfolio also outperformed the broader market as measured by the Standard and Poor's 500 Composite Stock Index ("S&P 500"), which returned 8.71%. Within the markets this past fiscal year, energy and utilities have led returns. The portfolio's performance was broad-based as stock selection drove the portfolio's strong relative performance. The positive equity returns during the portfolio's fiscal year occurred despite macro-economic overhangs. High energy prices and concerns over rising inflation and rising interest rates were present; however, corporate profits growth remained healthy reflecting revenue gains and sustained high levels of profitability throughout most of the majo r sectors of the market.
PERFORMANCE
For the year ended October 31, 2005, TA IDEX Jennison Growth, Class A returned 16.18%. By comparison its primary and former benchmarks, the Russell 1000 Growth and the S&P 500, returned 8.81% and 8.71%, respectively.
STRATEGY REVIEW
The portfolio's health care positions had the largest positive impact on outperformance, driven by a variety of holdings. During the fiscal year, companies that brought meaningful scientific advances to the treatment arena or provided services designed to manage the costs of delivering care were rewarded, and the portfolio benefited significantly in both regards. Alcon, Inc., Amgen Inc., Genentech, Inc. ("Genentech") and Roche Holding Ltd. are all benefiting from strong product cycles. Genentech, in particular, has been an exceptional performer in this sector and in the overall portfolio. The serial successes of their oncology portfolio combined with positive data on the company's age-related macular degeneration product Lucentis have helped drive strong returns this past fiscal year. On the services side, Caremark Rx, Inc. and the portfolio's HMO's also posted above market returns.
The performance of the portfolio's information technology holdings has also been very strong on an absolute and relative basis. Google Inc. was the top contributor to returns. The phrase that comes to mind to characterize the situation since the company went public in August 2004 is "explosive growth." Revenues have grown at a triple digit pace driven by sponsored search query, while earnings have developed even more favorably due to the operating leverage that accompanies this level of revenue growth. We have confidence in the company's near term business momentum, and are optimisti c about the intermediate and long term. We believe that continued innovation will drive revenue growth in a business that is still early in its growth cycle. Another stellar performer, Apple Computer, Inc. ("Apple") more than doubled during the portfolio's fiscal year. Apple has been introducing new products at a rapid pace, including the latest iteration of its highly successful iPod family, the Nano. Through the use of flash based memory, Nano combines a sleek form factor with power and capacity heretofore only available on the larger and highly successful Mini. It represents a further step in solidifying the leading position that Apple has secured in the portable/downloadable music market. Further new product introductions, we believe, are likely in the audio and video/photography product categories.
There were notable performers in the consumer sectors. Whole Foods Market, Inc. ("Whole Foods") continues to be a consistent and important contributor to performance. The company is enjoying healthy sales and square footage growth and most importantly, very strong same-store-sales. In addition, the productivity of new stores has been exceptional. We believe the store pipeline is promising and that Whole Foods can continue to grow at rates in excess of 20%. Chico's FAS, Inc. has also been a stellar performer due to growing revenues and earnings and margin improvement. Increased same store sales continue to be the key to success, while their emerging store concept, White House Black Market, is also seeing tremendous growth.
eBay Inc. was the greatest detractor from portfolio returns in the last twelve months, although the majority of weakness came early in 2005. The stock fell on concerns that domestic growth was slowing more than anticipated, coupled with increased investment in emerging markets. We added to our position because we believed that management was very focused on stimulating domestic sales, while its other two units, International and PayPal, Inc. continued to grow at very high rates. Notably, the stock is up significantly from the lows set in the first quarter as business performance has improved. Research in Motion Computing, Inc. was also weak because of issues around intellectual property rights and increased competition, calling into question the sustainability of its growth rate. We eliminated our position during the period.
The only sector in the portfolio to show a negative return for the fiscal year was industrials, while the benchmark's sector was positive. United Parcel Service, Inc. was a weak performer earlier in the period, as a loss in market share weighed on the stock price.
Transamerica IDEX Mutual Funds
Annual Report 2005
1
TA IDEX Jennison Growth
General Electric Company also underperformed as its modest positive return lagged the stronger return of the market this past fiscal year.
The portfolio continues to invest in companies that we believe are high quality with strong balance sheets and proven management teams. We look for superior long-term business fundamentals, which should provide these companies with sustainable, attractive growth opportunities.
Spiros Segalas
Michael A. Del Balso
Kathleen A. McCarragher
Co-Fund Managers
Jennison Associates LLC
Transamerica IDEX Mutual Funds
Annual Report 2005
2
TA IDEX Jennison Growth
Comparison of change in value of $10,000 investment in Class A shares and its comparative indices.
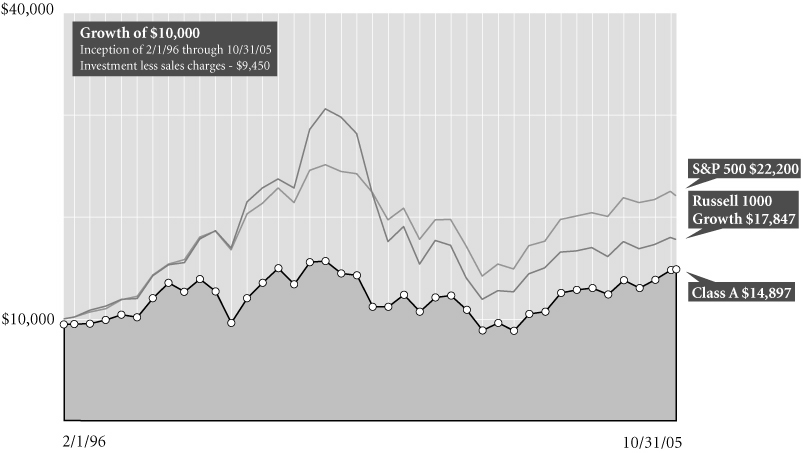
Average Annual Total Return for Periods Ended 10/31/05
| | | 1 year | | 5 years | | From
Inception | | Inception
Date | |
| Class A (NAV) | | | 16.18 | % | | | 4.10 | % | | | 4.77 | % | | 2/1/96 | |
| Class A (POP) | | | 9.79 | % | | | 2.93 | % | | | 4.17 | % | | 2/1/96 | |
| Russell 1000 Growth1 | | | 8.81 | % | | | (7.93 | )% | | | 6.12 | % | | 2/1/96 | |
| S&P 5001 | | | 8.71 | % | | | (1.73 | )% | | | 8.52 | % | | 2/1/96 | |
| Class B (NAV) | | | 15.06 | % | | | 3.41 | % | | | 4.11 | % | | 2/1/96 | |
| Class B (POP) | | | 10.06 | % | | | 3.23 | % | | | 4.11 | % | | 2/1/96 | |
| Class C (NAV) | | | 15.03 | % | | | – | | | | 16.57 | % | | 11/11/02 | |
| Class C (POP) | | | 14.03 | % | | | – | | | | 16.57 | % | | 11/11/02 | |
NOTES
1 The Russell 1000 Growth (Russell 1000 Growth) Index and the Standard and Poor's 500 Composite Stock (S&P 500) Index are unmanaged indices used as a general measure of market performance. Calculations assume dividends and capital gains are reinvested and do not include any managerial expenses. From inception calculation is based on life of Class A shares. For reporting periods through October 31, 2004, the Fund had selected the S&P 500 as its benchmark measure; however, the Russell 1000 is more appropriate for comparison to the Fund. Source: Standard & Poor's Micropal®© Micropal, Inc. 2005 – 1-800-596-5323 – http://www.funds-sp.com.
The performance data presented represents past performance, future results may vary. Performance data does not reflect the deduction of taxes that would be paid on fund distributions or the redemption of fund shares. Investment return and principal value will fluctuate so that an investor's shares, when redeemed, may be worth more or less than their original cost. Current performance may be lower or higher than performance quoted. Please see www.transamericaidex.com for performance data current to the most recent month-end.
Public Offering Price (POP) returns include the reinvestment of dividends and capital gains and reflect the maximum sales charge of 5.5% for A shares or the maximum applicable contingent deferred sales charge (5% in the 1st year, decreasing to 0% after 6 years) for Class B shares and 1% (during the first 12 months) for Class C shares. Shares purchased prior to March 1, 2004 are subject to a maximum applicable contingent deferred salees charge (5% in the 1st year, decreasing to 0% after 7 years) for Class B shares and (2% in the 1st year, decreasing to 0% after 2 years) for Class C shares. Net Asset Value (NAV) returns include the reinvestment of dividends and capital gains but do not reflect any sales charges.
This material must be preceded or accompanied by a current prospectus, which includes specific contents regarding the investment objectives and policies of this fund.
Transamerica IDEX Mutual Funds
Annual Report 2005
3
TA IDEX Jennison Growth
UNDERSTANDING YOUR FUND'S EXPENSES
(unaudited)
SHAREHOLDER EXPENSES
Fund shareholders may incur two types of costs: (1) transaction costs, including sales charges (loads) on purchases, contingent deferred sales charges on redemptions and redemption fees; and (2) ongoing costs, including management fees, 12b-1 distribution and service fees, and other fund expenses.
The following Example is intended to help you understand your ongoing costs (in dollars and cents) of investing in a Fund and to compare these costs with the ongoing costs of investing in other funds.
The Example is based on an investment of $1,000 invested at May 1, 2005 and held for the entire period until October 31, 2005.
ACTUAL EXPENSES
The first line in the table below provides information about actual account values and actual expenses. You may use the information in this line, together with the amount you invested, to estimate the expenses that you paid over the period. Simply divide your account value by $1,000 (for example, an $8,600 account value divided by $1,000 = 8.6), then multiply the result by the number in the first line of your Fund under the heading entitled "Expenses Paid During Period" to estimate the expenses you paid on your account during this period. If your account is an IRA, your expenses could have included a $15 annual fee. The amount of any fee paid through your account would increase the estimate of expenses you paid during the period and decrease your ending account value.
HYPOTHETICAL EXAMPLE FOR COMPARISON PURPOSES
The second line in the table below provides information about hypothetical account values and hypothetical expenses based on the Fund's actual expense ratio and an assumed rate of return of 5% per year before expenses, which is not the Fund's actual return. The hypothetical account values and expenses may not be used to estimate the actual ending account balance or expenses you paid for the period. You may use this information to compare the ongoing costs of investing in your Fund and other funds. To do so, compare this 5% hypothetical example with the 5% hypothetical examples that appear in the shareholder reports of the other funds. As in the case of the actual expense example, if your account is subject to an IRA fee, the amount of the fee paid through your account would increase the hypothetical expenses you would have paid during the period and decrease the hypothetical ending account value.
Please note that the expenses shown in the table are meant to highlight your ongoing costs only and do not reflect any transactional costs, such as sales charges, redemption fees, brokerage commissions paid on purchases and sales of fund shares. Therefore, the second line under the Fund in the table is useful in comparing ongoing costs only, and will not help you determine the relative total costs of owning different funds. If any of these transaction costs were included, your costs would be higher. The expenses shown in the table do not reflect any fees that may be charged to you by brokers, financial intermediaries or other financial institutions.
| | | Beginning
Account
Value | | Ending
Account
Value | | Annualized
Expense
Ratio | | Expenses Paid
During Period (a) | |
| Class A | | | |
| Actual | | $ | 1,000.00 | | | $ | 1,155.70 | | | | 1.06 | % | | $ | 5.76 | | |
| Hypothetical (b) | | | 1,000.00 | | | | 1,019.86 | | | | 1.06 | | | | 5.40 | | |
| Class B | | | |
| Actual | | | 1,000.00 | | | | 1,149.30 | | | | 2.38 | | | | 12.89 | | |
| Hypothetical (b) | | | 1,000.00 | | | | 1,013.21 | | | | 2.38 | | | | 12.08 | | |
| Class C | | | |
| Actual | | | 1,000.00 | | | | 1,150.30 | | | | 2.34 | | | | 12.68 | | |
| Hypothetical (b) | | | 1,000.00 | | | | 1,013.41 | | | | 2.34 | | | | 11.88 | | |
(a) Expenses are calculated using each Fund's annualized expense ratio (as disclosed in the table), multiplied by the average account value for the period, multiplied by number of days in the period (184 days), and divided by the number of days in the year (365 days).
(b) 5% return per year before expenses.
GRAPHICAL PRESENTATION OF SCHEDULE OF INVESTMENTS
By Sector
At October 31, 2005
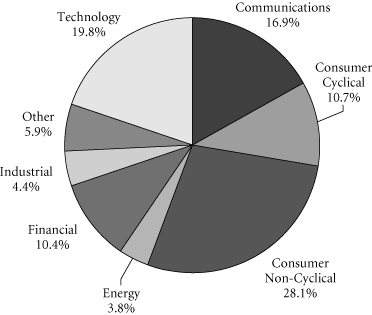
This chart shows the percentage breakdown by sector of the Fund's total investment securities.
Transamerica IDEX Mutual Funds
Annual Report 2005
4
TA IDEX Jennison Growth
SCHEDULE OF INVESTMENTS
At October 31, 2005
(all amounts except share amounts in thousands)
| | | Shares | | Value | |
| COMMON STOCKS (99.1%) | | | |
| Apparel & Accessory Stores (2.4%) | | | |
| Chico's FAS, Inc. ‡ | | | 65,400 | | | $ | 2,586 | | |
| Beverages (1.4%) | | | |
| PepsiCo, Inc. | | | 25,800 | | | | 1,524 | | |
| Business Services (3.2%) | | | |
| eBay, Inc. ‡ | | | 88,500 | | | | 3,505 | | |
| Chemicals & Allied Products (3.1%) | | | |
| Lauder (Estee) Cos., Inc. (The)–Class A † | | | 21,800 | | | | 723 | | |
| Procter & Gamble Co. | | | 46,420 | | | | 2,599 | | |
| Commercial Banks (1.2%) | | | |
| JP Morgan Chase & Co. | | | 35,900 | | | | 1,315 | | |
| Communications Equipment (2.9%) | | | |
| Nokia Corp., ADR | | | 61,300 | | | | 1,031 | | |
| QUALCOMM, Inc. | | | 54,700 | | | | 2,175 | | |
| Computer & Data Processing Services (15.8%) | | | |
| Adobe Systems, Inc. † | | | 66,000 | | | | 2,129 | | |
| Electronic Arts, Inc. ‡ | | | 34,800 | | | | 1,979 | | |
| Google, Inc.–Class A ‡ | | | 16,300 | | | | 6,066 | | |
| Microsoft Corp. | | | 57,900 | | | | 1,488 | | |
| NAVTEQ Corp. ‡ | | | 20,300 | | | | 794 | | |
| SAP AG, ADR † | | | 41,500 | | | | 1,782 | | |
| Yahoo!, Inc. ‡ | | | 80,200 | | | | 2,965 | | |
| Computer & Office Equipment (5.1%) | | | |
| Apple Computer, Inc. ‡ | | | 30,700 | | | | 1,768 | | |
| Cisco Systems, Inc. ‡ | | | 71,300 | | | | 1,244 | | |
| Dell, Inc. ‡ | | | 43,600 | | | | 1,390 | | |
| EMC Corp. ‡ | | | 80,200 | | | | 1,120 | | |
| Department Stores (1.2%) | | | |
| Federated Department Stores, Inc. | | | 21,700 | | | | 1,332 | | |
| Electronic & Other Electric Equipment (3.3%) | | | |
| General Electric Co. | | | 106,900 | | | | 3,625 | | |
| Electronic Components & Accessories (7.9%) | | | |
| Intel Corp. | | | 75,400 | | | | 1,772 | | |
| Marvell Technology Group, Ltd. ‡ | | | 54,200 | | | | 2,515 | | |
| Maxim Integrated Products, Inc. | | | 60,900 | | | | 2,112 | | |
| Texas Instruments, Inc. | | | 78,200 | | | | 2,233 | | |
| Food & Kindred Products (1.2%) | | | |
| Cadbury Schweppes PLC, ADR | | | 34,200 | | | | 1,357 | | |
| Food Stores (2.5%) | | | |
| Whole Foods Market, Inc. | | | 18,600 | | | | 2,681 | | |
| Furniture & Home Furnishings Stores (0.9%) | | | |
| Williams-Sonoma, Inc. ‡ | | | 24,200 | | | | 947 | | |
| Health Services (1.8%) | | | |
| Caremark Rx, Inc. ‡ | | | 36,700 | | | | 1,923 | | |
| | | Shares | | Value | |
| Industrial Machinery & Equipment (1.5%) | | | |
| Applied Materials, Inc. | | | 99,300 | | | $ | 1,627 | | |
| Instruments & Related Products (3.1%) | | | |
| Agilent Technologies, Inc. ‡ | | | 44,900 | | | | 1,437 | | |
| Alcon, Inc. | | | 14,400 | | | | 1,914 | | |
| Insurance (5.3%) | | | |
| American International Group, Inc. | | | 20,700 | | | | 1,341 | | |
| Cigna Corp. | | | 9,400 | | | | 1,089 | | |
| UnitedHealth Group, Inc. | | | 32,500 | | | | 1,881 | | |
| WellPoint, Inc. ‡ | | | 20,200 | | | | 1,509 | | |
| Leather & Leather Products (1.4%) | | | |
| Coach, Inc. ‡ | | | 46,400 | | | | 1,493 | | |
| Lumber & Other Building Materials (1.2%) | | | |
| Lowe's Cos., Inc. | | | 22,300 | | | | 1,355 | | |
| Medical Instruments & Supplies (1.4%) | | | |
| St. Jude Medical, Inc. ‡ | | | 32,000 | | | | 1,538 | | |
| Oil & Gas Extraction (2.8%) | | | |
| Schlumberger, Ltd. † | | | 33,800 | | | | 3,068 | | |
| Petroleum Refining (1.2%) | | | |
| Suncor Energy, Inc. | | | 23,400 | | | | 1,255 | | |
| Pharmaceuticals (13.4%) | | | |
| Abbott Laboratories | | | 22,700 | | | | 977 | | |
| Amgen, Inc. ‡ † | | | 30,800 | | | | 2,333 | | |
| Genentech, Inc. ‡ | | | 30,900 | | | | 2,800 | | |
| Gilead Sciences, Inc. ‡ | | | 37,000 | | | | 1,748 | | |
| Novartis AG, ADR | | | 43,900 | | | | 2,363 | | |
| Roche Holding AG, ADR | | | 39,538 | | | | 2,949 | | |
| Sanofi-Aventis, ADR | | | 36,200 | | | | 1,452 | | |
| Restaurants (0.3%) | | | |
| Starbucks Corp. ‡ | | | 11,000 | | | | 311 | | |
| Retail Trade (0.6%) | | | |
| Amazon.com, Inc. ‡ † | | | 16,600 | | | | 662 | | |
| Rubber & Misc. Plastic Products (1.6%) | | | |
| NIKE, Inc.–Class B | | | 20,500 | | | | 1,723 | | |
| Security & Commodity Brokers (7.5%) | | | |
| American Express Co. | | | 54,800 | | | | 2,727 | | |
| Charles Schwab Corp. (The) | | | 145,400 | | | | 2,210 | | |
| Goldman Sachs Group, Inc. (The) | | | 10,600 | | | | 1,340 | | |
| Merrill Lynch & Co., Inc. | | | 29,700 | | | | 1,923 | | |
| Telecommunications (1.6%) | | | |
| Sprint Nextel Corp. | | | 72,852 | | | | 1,698 | | |
| Variety Stores (2.3%) | | | |
| Target Corp. | | | 45,800 | | | | 2,551 | | |
| Total Common Stocks (cost: $93,037) | | | | | | | 107,954 | | |
The notes to the financial statements are an integral part of this report.
Transamerica IDEX Mutual Funds
Annual Report 2005
5
TA IDEX Jennison Growth
SCHEDULE OF INVESTMENTS (continued)
At October 31, 2005
(all amounts except share amounts in thousands)
| | | Principal | | Value | |
| SECURITY LENDING COLLATERAL (6.2%) | |
| Debt (5.7%) | |
| Bank Notes (0.4%) | |
Bank of America
3.81%, due 06/07/2006 * | | $ | 189 | | | $ | 189 | | |
| 3.81%, due 08/10/2006 * | | | 187 | | | | 187 | | |
Credit Suisse First Boston Corp.
4.11%, due 03/10/2006 * | | | 37 | | | | 37 | | |
| Certificates Of Deposit (0.4%) | |
Canadian Imperial Bank of Commerce
4.07%, due 11/04/2005 * | | | 150 | | | | 150 | | |
Harris Trust & Savings Bank
3.80%, due 11/04/2005 * | | | 119 | | | | 119 | | |
Rabobank Nederland
4.03%, due 05/31/2006 * | | | 187 | | | | 187 | | |
| Commercial Paper (1.2%) | |
Ciesco LLC
4.00%, due 11/03/2005 | | | 187 | | | | 187 | | |
General Electric Capital Corp.
3.96%, due 12/05/2005 | | | 150 | | | | 150 | | |
Paradigm Funding LLC–144A
4.01%, due 11/07/2005 | | | 149 | | | | 149 | | |
Park Avenue Receivables Corp.–144A
4.03%, due 12/02/2005 | | | 148 | | | | 148 | | |
Preferred Receivables Corp.–144A
4.04%, due 12/05/2005 | | | 112 | | | | 112 | | |
Ranger Funding Co. LLC–144A
3.99%, due 11/15/2005 | | | 111 | | | | 111 | | |
Sheffield Receivables Corp.–144A
4.01%, due 11/08/2005 | | | 112 | | | | 112 | | |
Yorktown Capital LLC
3.97%, due 11/09/2005 | | | 186 | | | | 186 | | |
| 3.93%, due 11/17/2005 | | | 186 | | | | 186 | | |
| Euro Dollar Overnight (1.4%) | |
Bank of Montreal
3.79%, due 11/01/2005 | | | 112 | | | | 112 | | |
Barclays
3.80%, due 11/04/2005 | | | 150 | | | | 150 | | |
BNP Paribas
3.83%, due 11/02/2005 | | | 225 | | | | 225 | | |
Deutsche Bank
3.80%, due 11/02/2005 | | | 374 | | | | 374 | | |
HSBC Banking/Holdings PLC
3.84%, due 11/07/2005 | | | 112 | | | | 112 | | |
Royal Bank of Scotland
3.76%, due 11/01/2005 | | | 150 | | | | 150 | | |
Svenska Handlesbanken
4.03%, due 11/01/2005 | | | 193 | | | | 193 | | |
UBS AG
3.80%, due 11/03/2005 | | | 150 | | | | 150 | | |
| | | Principal | | Value | |
| Euro Dollar Terms (0.5%) | |
Royal Bank of Scotland
4.00%, due 12/12/2005 | | $ | 150 | | | $ | 150 | | |
UBS AG
4.02%, due 12/01/2005 | | | 150 | | | | 150 | | |
Wells Fargo
3.96%, due 11/14/2005 | | | 225 | | | | 225 | | |
| Promissory Notes (0.1%) | |
Goldman Sachs Group, Inc.
4.02%, due 12/28/2005 | | | 157 | | | | 157 | | |
| Repurchase Agreements (1.7%) †† | |
Credit Suisse First Boston Corp.
4.10%, dated 10/31/2005 to be
repurchased at $255 on 11/01/2005 | | | 255 | | | | 255 | | |
Goldman Sachs Group, Inc. (The)
4.10%, dated 10/31/2005 to be
repurchased at $636 on 11/01/2005 | | | 636 | | | | 636 | | |
Lehman Brothers, Inc.
4.10%, dated 10/31/2005 to be
repurchased at $18 on 11/01/2005 | | | 18 | | | | 18 | | |
Merrill Lynch & Co.
4.10%, dated 10/31/2005 to be
repurchased at $749 on 11/01/2005 | | | 749 | | | | 749 | | |
Morgan Stanley Dean Witter & Co.
4.18%, dated 10/31/2005 to be
repurchased at $224 on 11/01/2005 | | | 224 | | | | 224 | | |
| | | Shares | | Value | |
| Investment Companies (0.5%) | |
| Money Market Funds (0.5%) | |
American Beacon Fund
1-day yield of 3.81% | | | 161,374 | | | $ | 161 | | |
Barclays Global Investors Institutional
Money Market Fund
1-day yield of 3.92% | | | 149,707 | | | | 150 | | |
Goldman Sachs Financial Square
Prime Obligations Fund
1-day yield of 3.79% | | | 23,319 | | | | 23 | | |
Merrimac Cash Fund, Premium Class
1-day yield of 3.70% @ | | | 148,052 | | | | 148 | | |
| Total Security Lending Collateral (cost: $6,722) | | | | | | | 6,722 | | |
| Total Investment Securities (cost: $99,759) | | | | | | $ | 114,676 | | |
| SUMMARY: | |
| Investment securities, at value | | | 105.3 | % | | $ | 114,676 | | |
| Liabilities in excess of other assets | | | (5.3 | )% | | | (5,815 | ) | |
| Net assets | | | 100.0 | % | | $ | 108,861 | | |
The notes to the financial statements are an integral part of this report.
Transamerica IDEX Mutual Funds
Annual Report 2005
6
TA IDEX Jennison Growth
SCHEDULE OF INVESTMENTS (continued)
At October 31, 2005
(all amounts except share amounts in thousands)
NOTES TO SCHEDULE OF INVESTMENTS:
‡ Non-income producing.
† At October 31, 2005, all or a portion of this security is on loan (see Note 1). The value at October 31, 2005, of all securities on loan is $6,519.
* Floating or variable rate note. Rate is listed as of October 31, 2005.
†† Cash collateral for the Repurchase Agreements, valued at $1,920, that serve as collateral for securities lending are invested in corporate bonds with interest rates and maturity dates ranging from 0.00%–9.86% and 12/31/2005–11/15/2096, respectively.
@ Regulated investment company advised by Investors Bank and Trust Co. ("IBT"). IBT is also the accounting, custody and lending agent for the Fund.
DEFINITIONS:
144A 144A Securities are registered pursuant to Rule 144A of the Securities Act of 1933. These securities are deemed to be liquid for purposes of compliance limitations on holdings of illiquid securities and may be resold as transactions exempt from registration, normally to qualified institutional buyers. At October 31, 2005, these securities aggregated $632 or 0.6% of the net assets of the Fund.
ADR American Depositary Receipt
The notes to the financial statements are an integral part of this report.
Transamerica IDEX Mutual Funds
Annual Report 2005
7
TA IDEX Jennison Growth
STATEMENT OF ASSETS AND LIABILITIES
At October 31, 2005
(all amounts except per share amounts in thousands)
| Assets: | | | |
Investment securities, at value (cost: $99,759)
(including securities loaned of $6,519) | | $ | 114,676 | | |
| Cash | | | 1,257 | | |
| Receivables: | |
| Investment securities sold | | | 140 | | |
| Shares of beneficial interest sold | | | 98 | | |
| Interest | | | 2 | | |
| Dividends | | | 40 | | |
| Dividend reclaims receivable | | | 3 | | |
| Other | | | 6 | | |
| | | | 116,222 | | |
| Liabilities: | | | |
| Investment securities purchased | | | 290 | | |
| Accounts payable and accrued liabilities: | |
| Shares of beneficial interest redeemed | | | 162 | | |
| Management and advisory fees | | | 72 | | |
| Distribution and service fees | | | 55 | | |
| Transfer agent fees | | | 23 | | |
| Administration fees | | | 2 | | |
| Payable for collateral for securities on loan | | | 6,722 | | |
| Other | | | 35 | | |
| | | | 7,361 | | |
| Net Assets | | $ | 108,861 | | |
| Net Assets Consist of: | | | |
Shares of beneficial interest, unlimited shares
authorized, no par value | | $ | 92,111 | | |
| Accumulated net investment income (loss) | | | (3 | ) | |
Undistributed net realized gain (loss) from
investment securities | | | 1,836 | | |
Net unrealized appreciation (depreciation) on
investment securities | | | 14,917 | | |
| Net Assets | | $ | 108,861 | | |
| Net Assets by Class: | | | |
| Class A | | $ | 64,920 | | |
| Class B | | | 32,778 | | |
| Class C | | | 11,163 | | |
| Shares Outstanding: | | | |
| Class A | | | 5,870 | | |
| Class B | | | 3,155 | | |
| Class C | | | 1,072 | | |
| Net Asset Value Per Share: | | | |
| Class A | | $ | 11.06 | | |
| Class B | | | 10.39 | | |
| Class C | | | 10.41 | | |
| Maximum Offering Price Per Share (a): | | | |
| Class A | | $ | 11.70 | | |
(a) Includes the maximum selling commission (represented as a percentage of offering price) which is reduced on certain levels of sales as set forth in the Prospectus. Net asset value per share for Classes B and C shares represents offering price. The redemption price for Classes B and C shares equals net asset value less any applicable contingent deferred sales charge.
STATEMENT OF OPERATIONS
For the year ended October 31, 2005
(all amounts in thousands)
| Investment Income: | | | |
| Interest | | $ | 42 | | |
Dividends (net of withholding taxes on foreign
dividends of $21) | | | 1,123 | | |
| Income from loaned securities–net | | | 17 | | |
| | | | 1,182 | | |
| Expenses: | | | |
| Management and advisory fees | | | 867 | | |
| Distribution and service fees: | |
| Class A | | | 219 | | |
| Class B | | | 336 | | |
| Class C | | | 124 | | |
| Transfer agent fees: | |
| Class A | | | 75 | | |
| Class B | | | 108 | | |
| Class C | | | 46 | | |
| Printing and shareholder reports | | | 32 | | |
| Custody fees | | | 29 | | |
| Administration fees | | | 21 | | |
| Legal fees | | | 8 | | |
| Audit fees | | | 18 | | |
| Trustees fees | | | 5 | | |
| Registration fees: | |
| Class A | | | 18 | | |
| Class B | | | 14 | | |
| Class C | | | 11 | | |
| Other | | | 1 | | |
| Total expenses | | | 1,932 | | |
| Net Investment Income (Loss) | | | (750 | ) | |
| Net Realized and Unrealized Gain (Loss): | | | |
| Realized gain (loss) from investment securities | | | 4,168 | | |
Increase (decrease) in unrealized appreciation
(depreciation) on investment securities | | | 11,261 | | |
| Net Gain (Loss) on Investment Securities | | | 15,429 | | |
Net Increase (Decrease) in Net Assets Resulting
from Operations | | $ | 14,679 | | |
The notes to the financial statements are an integral part of this report.
Transamerica IDEX Mutual Funds
Annual Report 2005
8
TA IDEX Jennison Growth
STATEMENTS OF CHANGES IN NET ASSETS
For the years ended
(all amounts in thousands)
| | | October 31,
2005 | | October 31,
2004 | |
| Increase (Decrease) In Net Assets From: | | | |
| Operations: | | | |
| Net investment income (loss) | | $ | (750 | ) | | $ | (973 | ) | |
Net realized gain (loss) from
investment securities | | | 4,168 | | | | 11,967 | | |
Net unrealized appreciation
(depreciation) on investment
securities | | | 11,261 | | | | (2,428 | ) | |
| | | | 14,679 | | | | 8,566 | | |
| Capital Share Transactions: | | | |
| Proceeds from shares sold: | |
| Class A | | | 31,699 | | | | 43,811 | | |
| Class B | | | 2,484 | | | | 2,025 | | |
| Class C | | | 3,501 | | | | 2,846 | | |
| Class C2 | | | – | | | | 369 | | |
| Class M | | | – | | | | 1,047 | | |
| | | | 37,684 | | | | 50,098 | | |
| Cost of shares redeemed: | |
| Class A | | | (33,134 | ) | | | (8,121 | ) | |
| Class B | | | (8,862 | ) | | | (8,690 | ) | |
| Class C | | | (7,650 | ) | | | (3,250 | ) | |
| Class C2 | | | – | | | | (1,667 | ) | |
| Class M | | | – | | | | (2,836 | ) | |
| | | | (49,646 | ) | | | (24,564 | ) | |
| Class level exchanges: | |
| Class C | | | – | | | | 13,383 | | |
| Class C2 | | | – | | | | (7,197 | ) | |
| Class M | | | – | | | | (6,186 | ) | |
| | | | – | | | | – | | |
| Automatic conversions: | |
| Class A | | | 177 | | | | 31 | | |
| Class B | | | (177 | ) | | | (31 | ) | |
| | | | – | | | | – | | |
| | | | (11,962 | ) | | | 25,534 | | |
| Net increase (decrease) in net assets | | | 2,717 | | | | 34,100 | | |
| Net Assets: | | | |
| Beginning of year | | | 106,144 | | | | 72,044 | | |
| End of year | | $ | 108,861 | | | $ | 106,144 | | |
Accumulated Net Investment Income
(Loss) | | $ | (3 | ) | | $ | 3 | | |
| | | October 31,
2005 | | October 31,
2004 | |
| Share Activity: | |
| Shares issued: | |
| Class A | | | 3,083 | | | | 4,731 | | |
| Class B | | | 251 | | | | 228 | | |
| Class C | | | 364 | | | | 319 | | |
| Class C2 | | | – | | | | 42 | | |
| Class M | | | – | | | | 116 | | |
| | | | 3,698 | | | | 5,436 | | |
| Shares redeemed: | |
| Class A | | | (3,299 | ) | | | (872 | ) | |
| Class B | | | (919 | ) | | | (990 | ) | |
| Class C | | | (807 | ) | | | (373 | ) | |
| Class C2 | | | – | | | | (191 | ) | |
| Class M | | | – | | | | (322 | ) | |
| | | | (5,025 | ) | | | (2,748 | ) | |
| Class level exchanges: | |
| Class C | | | – | | | | 1,494 | | |
| Class C2 | | | – | | | | (791 | ) | |
| Class M | | | – | | | | (703 | ) | |
| | | | – | | | | – | | |
| Automatic conversions: | |
| Class A | | | 17 | | | | 3 | | |
| Class B | | | (18 | ) | | | (4 | ) | |
| | | | (1 | ) | | | (1 | ) | |
Net increase (decrease) in shares
outstanding: | |
| Class A | | | (199 | ) | | | 3,862 | | |
| Class B | | | (686 | ) | | | (766 | ) | |
| Class C | | | (443 | ) | | | 1,440 | | |
| Class C2 | | | – | | | | (940 | ) | |
| Class M | | | – | | | | (909 | ) | |
| | | | (1,328 | ) | | | 2,687 | | |
The notes to the financial statements are an integral part of this report.
Transamerica IDEX Mutual Funds
Annual Report 2005
9
TA IDEX Jennison Growth
FINANCIAL HIGHLIGHTS
| | | | | For a share of beneficial interest outstanding throughout each period | |
| | | | | Net Asset | | Investment Operations | | Distributions | | Net Asset | |
| | | For the
Period
Ended (d)(g) | | Value,
Beginning
of Period | | Net
Investment
Income (Loss) | | Net Realized
and Unrealized
Gain (Loss) | | Total
Operations | | From Net
Investment
Income | | From Net
Realized
Gains | | Total
Distributions | | Value,
End
of Period | |
| Class A | | 10/31/2005 | | $ | 9.52 | | | $ | (0.03 | ) | | $ | 1.57 | | | $ | 1.54 | | | $ | – | | | $ | – | | | $ | – | | | $ | 11.06 | | |
| | | 10/31/2004 | | | 8.54 | | | | (0.07 | ) | | | 1.05 | | | | 0.98 | | | | – | | | | – | | | | – | | | | 9.52 | | |
| | | 10/31/2003 | | | 6.88 | | | | (0.04 | ) | | | 1.70 | | | | 1.66 | | | | – | | | | – | | | | – | | | | 8.54 | | |
| | | 10/31/2002 | | | 8.04 | | | | (0.05 | ) | | | (1.11 | ) | | | (1.16 | ) | | | – | | | | – | | | | – | | | | 6.88 | | |
| | | 10/31/2001 | | | 10.26 | | | | (0.01 | ) | | | (1.17 | ) | | | (1.18 | ) | | | – | | | | (1.04 | ) | | | (1.04 | ) | | | 8.04 | | |
| Class B | | 10/31/2005 | | | 9.03 | | | | (0.11 | ) | | | 1.47 | | | | 1.36 | | | | – | | | | – | | | | – | | | | 10.39 | | |
| | | 10/31/2004 | | | 8.14 | | | | (0.12 | ) | | | 1.01 | | | | 0.89 | | | | – | | | | – | | | | – | | | | 9.03 | | |
| | | 10/31/2003 | | | 6.60 | | | | (0.08 | ) | | | 1.62 | | | | 1.54 | | | | – | | | | – | | | | – | | | | 8.14 | | |
| | | 10/31/2002 | | | 7.77 | | | | (0.10 | ) | | | (1.07 | ) | | | (1.17 | ) | | | – | | | | – | | | | – | | | | 6.60 | | |
| | | 10/31/2001 | | | 10.01 | | | | (0.05 | ) | | | (1.15 | ) | | | (1.20 | ) | | | – | | | | (1.04 | ) | | | (1.04 | ) | | | 7.77 | | |
| Class C | | 10/31/2005 | | | 9.05 | | | | (0.12 | ) | | | 1.48 | | | | 1.36 | | | | – | | | | – | | | | – | | | | 10.41 | | |
| | | 10/31/2004 | | | 8.14 | | | | (0.15 | ) | | | 1.06 | | | | 0.91 | | | | – | | | | – | | | | – | | | | 9.05 | | |
| | | 10/31/2003 | | | 6.60 | | | | (0.09 | ) | | | 1.63 | | | | 1.54 | | | | – | | | | – | | | | – | | | | 8.14 | | |
| | | | | | | Ratios/Supplemental Data | |
| | | For the
Period | | Total | | Net Assets,
End of
Period | | Ratio of Expenses
to Average
Net Assets (a) | | Net Investment
Income (Loss)
to Average | | Portfolio
Turnover | |
| | | Ended (g) | | Return (c) | | (000's) | | Net (e) | | Total (f) | | Net Assets (a) | | Rate (b) | |
| Class A | | 10/31/2005 | | | 16.18 | % | | $ | 64,920 | | | | 1.41 | % | | | 1.41 | % | | | (0.33 | )% | | | 86 | % | |
| | | 10/31/2004 | | | 11.48 | | | | 57,760 | | | | 1.59 | | | | 1.59 | | | | (0.79 | ) | | | 147 | | |
| | | 10/31/2003 | | | 24.13 | | | | 18,833 | | | | 1.75 | | | | 1.90 | | | | (0.54 | ) | | | 100 | | |
| | | 10/31/2002 | | | (14.47 | ) | | | 21,836 | | | | 1.75 | | | | 1.82 | | | | (0.52 | ) | | | 98 | | |
| | | 10/31/2001 | | | (11.08 | ) | | | 17,670 | | | | 1.55 | | | | 2.44 | | | | (0.11 | ) | | | 158 | | |
| Class B | | 10/31/2005 | | | 15.06 | | | | 32,778 | | | | 2.27 | | | | 2.27 | | | | (1.18 | ) | | | 86 | | |
| | | 10/31/2004 | | | 10.93 | | | | 34,667 | | | | 2.24 | | | | 2.24 | | | | (1.37 | ) | | | 147 | | |
| | | 10/31/2003 | | | 23.33 | | | | 37,500 | | | | 2.40 | | | | 2.55 | | | | (1.19 | ) | | | 100 | | |
| | | 10/31/2002 | | | (15.10 | ) | | | 37,363 | | | | 2.40 | | | | 2.47 | | | | (1.17 | ) | | | 98 | | |
| | | 10/31/2001 | | | (11.54 | ) | | | 31,922 | | | | 2.20 | | | | 3.09 | | | | (0.76 | ) | | | 158 | | |
| Class C | | 10/31/2005 | | | 15.03 | | | | 11,163 | | | | 2.37 | | | | 2.37 | | | | (1.20 | ) | | | 86 | | |
| | | 10/31/2004 | | | 11.18 | | | | 13,717 | | | | 2.39 | | | | 2.39 | | | | (1.68 | ) | | | 147 | | |
| | | 10/31/2003 | | | 23.33 | | | | 607 | | | | 2.40 | | | | 2.55 | | | | (1.19 | ) | | | 100 | | |
NOTES TO FINANCIAL HIGHLIGHTS
(a) Annualized.
(b) Not annualized.
(c) Total Return has been calculated for the applicable period without deduction of a sales load, if any, on an initial purchase. Periods of less than one year are not annualized.
(d) Per share information is calculated based on the average number of shares outstanding.
(e) Ratio of Net Expenses to Average Net Assets is net of fee waivers and reimbursements by the investment adviser, if any (see note 2).
(f) Ratio of Total Expenses to Average Net Assets includes all expenses before fee waivers and reimbursements by the investment adviser.
(g) The inception date for the Fund's offering of share Class C was November 11, 2002.
The notes to the financial statements are an integral part of this report.
Transamerica IDEX Mutual Funds
Annual Report 2005
10
TA IDEX Jennison Growth
NOTES TO FINANCIAL STATEMENTS
At October 31, 2005
(all amounts in thousands)
NOTE 1. ORGANIZATION AND SIGNIFICANT ACCOUNTING POLICIES
Transamerica IDEX Mutual Funds is an open-end management investment company registered under the Investment Company Act of 1940, as amended (the "1940 Act").
In the normal course of business, TA IDEX Jennison Growth (the "Fund") enters into contracts that contain a variety of representations that provide general indemnifications. The Fund's maximum exposure under these arrangements is unknown, as this would involve future claims that may be made against the Fund and/or its affiliates that have not yet occurred. However, based on experience, the Fund expects the risk of loss to be remote.
This report should be read in conjunction with the current Fund prospectus, which contains more complete information about the Fund.
The following is a summary of significant accounting policies followed by the Fund in the preparation of the financial statements. In preparing the Fund's financial statements in accordance with accounting principles generally accepted in the United States of America ("GAAP"), estimates or assumptions (which could differ from actual results) may be used that affect reported amounts and disclosures.
Multiple class operations, income and expenses: The Fund currently offers three classes of shares, each with a public offering price that reflects different sales charges, if any, and expense levels. On June 15, 2004, Class C2 shares merged into Class C. On September 24, 2004, Class M shares merged into Class C. Class B shares will convert to Class A shares eight years after purchase. Income, non-class specific expenses and realized and unrealized gains and losses, are allocated daily to each class, based upon the value of shares outstanding method as permitted under Rule 18f-3 of the 1940 Act. Each class bears its own specific expenses as well as a portion of general, common expenses.
Security valuations: The Fund values its investments at the close of the New York Stock Exchange ("NYSE"), normally 4 p.m. ET, each day the NYSE is open for business. Fund investments are valued at the last sale price or closing price on the day of valuation taken from the primary exchange where the security is principally traded.
Securities traded in the over-the-counter market and listed securities for which no sale was reported on that date are valued at the last quoted bid price.
Debt securities are valued based on a price quotation or other equivalent indication of value supplied by an exchange, a pricing service or a major market maker; however, those that mature in sixty days or less are valued at amortized cost, which approximates market.
Investment company securities are valued at the net asset value of the underlying portfolio.
Other securities for which quotations are not readily available or whose values have been determined to be unreliable are valued at fair market value as determined in good faith by the Fund's Administrative Valuation Committee, under the supervision of the Board's Valuation Committee, using guidelines adopted by the Board of Trustees.
Cash: The Fund may leave cash overnight in its cash account with the custodian, Investors Bank & Trust Company ("IBT"). IBT has been contracted on behalf of the Fund to invest the excess cash into a savings account, which at October 31, 2005, was paying an interest rate of 2.76%.
Repurchase agreements: The Fund is authorized to enter into repurchase agreements. The Fund, through its custodian, IBT, receives delivery of the underlying securities, the value of which at the time of purchase is required to be an amount equal to at least 100% of the resale price. The Fund will bear the risk of value fluctuations until the security can be sold and may encounter delays and incur costs in liquidating the security. In the event of bankruptcy or insolvency of the seller, delays and costs may be incurred.
Commission recapture: The sub-adviser, to the extent consistent with the best execution and usual commission rate policies and practices, may place security transactions of the Fund with broker/dealers with which Transamerica IDEX Mutual Funds has established a Commission Recapture Program. A Commission Recapture Program is any arrangement under which a broker/dealer applies a portion of the commissions received by such broker/dealer on the security transactions to the Fund. In no event will commissions paid by the Fund be used to pay expenses that would otherwise be borne by any other funds within Transamerica IDEX Mutual Funds, or by any other party.
Recaptured commissions during the year ended October 31, 2005, of $32 are included in net realized gains in the Statement of Operations.
Securities lending: The Fund may lend securities to qualified borrowers, with IBT acting as the Fund's lending agent. The Fund earns negotiated lenders' fees. The Fund receives cash and/or securities as collateral against the loaned securities. Cash collateral received is invested in short term, interest bearing securities. The Fund monitors the market value of securities loaned on a daily basis and requires collateral in an amount at least equal to the value of the securities loaned. Income from loaned securities on the Statement of Operations is net of fees, in the amount of $7, earned by IBT for its services.
Security transactions and investment income: Security transactions are recorded on the trade date. Security gains and losses are calculated on the specific identification basis. Dividend income, if any, is recorded on the ex-dividend date or, in the case of foreign securities, as soon as the Fund is informed of the ex-dividend date. Interest income, including accretion of discounts and amortization of premiums, is recorded on the accrual basis commencing on the settlement date.
Transamerica IDEX Mutual Funds
Annual Report 2005
11
TA IDEX Jennison Growth
NOTES TO FINANCIAL STATEMENTS (continued)
At October 31, 2005
(all amounts in thousands)
NOTE 1.–(continued)
Redemption fees: A short-term trading redemption fee may be assessed on any Fund shares in a fund account that are sold during the first five (5) NYSE trading days following their purchase date. This redemption fee will equal 2% of the amount redeemed and shares held the longest will be treated as being redeemed first and shares held the shortest as being redeemed last. For the year ended October 31, 2005, the Fund received less than $1 in redemption fees.
Dividend distributions: Distributions to shareholders are recorded on the ex-dividend date and are determined in accordance with Federal income tax regulations which may differ from GAAP.
NOTE 2. RELATED PARTY TRANSACTIONS
Effective January 1, 2005 AEGON/Transamerica Fund Advisors, Inc. was renamed Transamerica Fund Advisors, Inc. ("TFAI"); AEGON/Transamerica Fund Services, Inc. and AEGON/Transamerica Investor Services, Inc. merged into one entity and was renamed Transamerica Fund Services, Inc. ("TFS").
TFAI is the Fund's investment adviser. TFS is the Fund's administrator and transfer agent. AFSG Securities Corp. ("AFSG") is the Fund's distributor/principal underwriter. TFAI, TFS , and AFSG are affiliates of AEGON, NV, a Netherlands corporation.
The following schedule reflects the percentage of Fund assets owned by affiliated mutual funds:
| | | Net
Assets | | % of
Net Assets | |
TA IDEX Asset Allocation–
Growth Portfolio | | $ | 49,481 | | | | 45.45 | % | |
TA IDEX Asset Allocation–
Moderate Growth Portfolio | | | 246 | | | | 0.23 | % | |
| Total | | $ | 49,727 | | | | 45.68 | % | |
Investment advisory fees: The Fund pays management fees to TFAI based on average daily net assets ("ANA") at the following breakpoints:
0.80% of the first $500 million of ANA
0.70% of ANA over $500 million
TFAI has contractually agreed to waive its advisory fee and will reimburse the Fund to the extent that operating expenses, excluding 12b-1 fees, exceed the following stated annual limit:
1.40% Expense Limit
Distribution and service fees: The Fund has a 12b-1 distribution plan under the 1940 Act pursuant to which an annual fee, based on average daily net assets, is paid to the distributor for various disbursements such as broker-dealer account servicing fees and other promotional expenses of the Fund. The Fund is authorized under the 12b-1 plan to pay fees on each class up to the following limits:
| Class A | | | 0.35 | % | |
| Class B | | | 1.00 | % | |
| Class C | | | 1.00 | % | |
In the case the Fund or a class of shares of the Fund is closed to new investors or investments, the Fund is authorized to pay 12b-1 fees for past sales and distribution efforts and present and past investor services.
Underwriter commissions relate to front-end sales charges imposed for Class A shares and contingent deferred sales charges from Classes B, C, and certain A share redemptions. For the year ended October 31, 2005, the underwriter commissions were as follows:
| Received by Underwriter | | $ | 105 | | |
| Retained by Underwriter | | | 5 | | |
| Contingent Deferred Sales Charge | | | 81 | | |
Administrative services: The Fund has entered into an agreement with TFS for financial and legal fund administration services. As of January 1, 2005 the Fund pays TFS an annual fee of 0.02% of ANA. Prior to January 1, 2005 the Fund paid TFS an annual fee of 0.015% of ANA. The Legal fees on the Statement of Operations are for fees paid to external legal counsel.
Transfer agent fees: The Fund pays TFS an annual per-account charge for each open and closed account. The Fund paid TFS $213 for the year ended October 31, 2005.
Brokerage commissions: Brokerage commissions incurred on security transactions placed with an affiliate of the adviser for the year ended October 31, 2005, were $1.
Deferred compensation plan: Each eligible independent Fund Trustee may elect to participate in a non-qualified deferred compensation plan maintained by Transamerica IDEX Mutual Funds (the "Plan"). Under the Plan, such Trustees may defer payment of all or a portion of their total fees earned as a Fund Trustee. Each Trustee who is a participant in the Plan may elect that the earnings, losses or gains credited to his or her deferred fee amounts be determined based on a deemed investment in any series of Transamerica IDEX Mutual Funds, including the Fund. The right of a participant to receive a distribution from the Plan of the deferred fees is an unsecured claim against the general assets of all series of Transamerica IDEX Mutual Funds. The pro rata liability to the Fund of all deferred fees in the Plan amounted, as of October 31, 2005, to $6.
Transamerica IDEX Mutual Funds
Annual Report 2005
12
TA IDEX Jennison Growth
NOTES TO FINANCIAL STATEMENTS (continued)
At October 31, 2005
(all amounts in thousands)
NOTE 4. FEDERAL INCOME TAX MATTERS
NOTE 3. INVESTMENT TRANSACTIONS
The cost of securities purchased and proceeds from securities sold (excluding short-term securities) for the year ended October 31, 2005, were as follows:
| Purchases of securities: | | | |
| Long-Term | | $ | 90,824 | | |
| U.S. Government | | | – | | |
| Proceeds from maturities and sales of securities: | | | |
| Long-Term | | | 102,997 | | |
| U.S. Government | | | – | | |
The Fund has not made any provision for federal income or excise taxes due to its policy to distribute all of its taxable income and capital gains to its shareholders and otherwise qualify as a regulated investment company under Subchapter M of the Internal Revenue Code. Income and capital gain distributions are determined in accordance with income tax regulations, which may differ from GAAP. These differences are primarily due to differing treatment for items including, but not limited to, wash sales.
Therefore, distributions determined in accordance with tax regulations may differ significantly in amount or character from net investment income and realized gains for financial reporting purposes. Financial reporting records are adjusted for permanent book/tax differences to reflect tax character. Financial records are not adjusted for temporary differences. These reclassifications are as follows:
Shares of beneficial interest, unlimited
shares authorized | | $ | (752 | ) | |
| Accumulated net investment income (loss) | | | 744 | | |
Undistributed net realized gain (loss) from investment
securities | | | 8 | | |
The capital loss carryforward utilized during the year ended October 31, 2005 was $1,911.
The tax basis components of distributable earnings as of October 31, 2005, are as follows:
| Undistributed Ordinary Income | | $ | – | | |
| Undistributed Long-term Capital Gains | | $ | 2,384 | | |
| Capital Loss Carryforward | | $ | – | | |
| Net Unrealized Appreciation (Depreciation) | | $ | 14,369 | | |
The aggregate cost of investments and composition of unrealized appreciation (depreciation) for federal income tax purposes as of October 31, 2005, are as follows:
| Federal Tax Cost Basis | | $ | 100,307 | | |
| Unrealized Appreciation | | $ | 16,122 | | |
| Unrealized (Depreciation) | | | (1,753 | ) | |
| Net Unrealized Appreciation (Depreciation) | | $ | 14,369 | | |
NOTE 5. REGULATORY PROCEEDINGS
There continues to be significant federal and state regulatory activity relating to financial services companies, particularly mutual fund companies and their investment advisers. As part of an ongoing investigation regarding potential market timing, recordkeeping and trading compliance issues and matters affecting the Fund's investment adviser, TFAI, and certain affiliates and former employees of TFAI, the SEC staff has indicated that it is likely to take some action against TFAI and certain of its affiliates at the conclusion of the investigation. The potential timing and the scope of any such action is difficult to predict. Although the impact of any action brought against TFAI and/or its affiliates is difficult to assess at the present time, the Fund currently believes that the likelihood that any such action will have a material adverse impact on it is remote. It is important to note that the Fund is not aware of any allegation of wrongdoing against it and its Board at the time this annual report is printed. Although it is not anticipated that these developments will have an adverse impact on the Fund, there can be no assurance at this time. TFAI and its affiliates are actively working with the SEC in regard to this matter; however, the exact resolution cannot be determined at this time. TFAI will take such actions that it deems necessary or appropriate to continue providing management services to the Fund and to bring all matters to an appropriate conclusion.
TFAI and/or its affiliates, and not the Fund, will bear the costs regarding these regulatory matters.
Transamerica IDEX Mutual Funds
Annual Report 2005
13
Report of Independent Registered Certified Public Accounting Firm
To the Board of Trustees and Shareholders of
TA IDEX Jennison Growth
In our opinion, the accompanying statement of assets and liabilities, including the schedule of investments, and the related statements of operations and of changes in net assets and the financial highlights present fairly, in all material respects, the financial position of TA IDEX Jennison Growth (the "Fund") (one of the portfolios constituting the Transamerica IDEX Mutual Funds) at October 31, 2005, the results of its operations for the year then ended, the changes in its net assets for each of the two years in the period then ended and the financial highlights for each of the periods presented, in conformity with accounting principles generally accepted in the United States of America. These financial statements and financial highlights (hereafter referred to as "financial statements") are the responsibility of the Fund's management; our responsibility is to express an opinion on these financia l statements based on our audits. We conducted our audits of these financial statements in accordance with the standards of the Public Company Accounting Oversight Board (United States). Those standards require that we plan and perform the audit to obtain reasonable assurance about whether the financial statements are free of material misstatement. An audit includes examining, on a test basis, evidence supporting the amounts and disclosures in the financial statements, assessing the accounting principles used and significant estimates made by management, and evaluating the overall financial statement presentation. We believe that our audits, which included confirmation of securities at October 31, 2005 by correspondence with the custodian, provide a reasonable basis for our opinion.

December 22, 2005
Transamerica IDEX Mutual Funds
Annual Report 2005
14
TA IDEX J.P. Morgan Mid Cap Value
MARKET ENVIRONMENT
For most of 2005, concerns over inflation, higher interest rates and rising energy prices overwhelmed investors. The market also feared that aggressive Federal Reserve Board ("Fed") tightening and higher long-term bond yields would hamper economic growth. Equities were supported by an extended period of strong corporate profits and signs of continued growth for the U.S. economy.
The uncertainty surrounding the impact of Hurricanes Katrina and Rita along the Gulf Coast made it increasingly difficult to gauge the trajectory of economic growth. The impact of the hurricanes held down equity gains made during the summer months and the resulting upward pressure on energy prices added to existing fears about accelerating inflation.
Actions and statements by the Fed also increased investor anxiety. As energy prices moved higher, it became apparent that the Fed had more, rather than less, tightening to do. The combination of higher energy prices and rising short-term interest rates led to more uncertainty about the true impact a potential reduction in consumer spending could have on the pace of economic growth.
PERFORMANCE
For the period inception March 1, 2005 to October 31, 2005, TA IDEX J.P. Morgan Mid Cap Value, Class A returned (0.60)%. By comparison its benchmark, the Russell Midcap Value returned 6.61%.
STRATEGY REVIEW
The portfolio is managed employing a bottom-up approach to stock selection, constructing portfolios based on company fundamentals, quantitative screening and proprietary analysis. Our aim is to identify undervalued companies that have the potential to increase their intrinsic per-share values, and purchase these companies at a discount.
In the period, the portfolio underperformed the Russell Midcap Value, primarily due to an overweight and stock selections in the consumer discretionary sector, as well as stock selection in the financials sector. Consumer discretionary stocks were hard hit throughout the period as higher energy prices and the prospects of higher interest rates threatened to weaken consumer spending.
Discount retail chain Family Dollar Stores, Inc. ("Family Dollar") was one of the portfolio's larger detractors, following its announcement of a weaker profit outlook attributed to higher freight costs and a shift toward lower-margin items. Family Dollar's most recent earnings report was in line with lowered guidance and included an announcement of intentions to repurchase shares.
IPC Holdings, Ltd. ("IPC"), a provider of property and catastrophe reinsurance products also negatively impacted results. IPC's stock declined, as losses from Hurricane Katrina came in higher than initial company estimates. IPC announced plans to raise additional capital for its reinsurance operations and general corporate purposes through a securities offering.
Despite the portfolio's underperformance, its overweight and stock selection in the energy sector, as well as underweight in consumer staples made positive contributions to performance.
One of the portfolio's top contributors was Burlington Resources Inc. ("Burlington"), an energy exploration and production company. Shares of Burlington advanced throughout the period, due to solid earnings growth from higher energy prices, increased production and accelerated share repurchases.
Health maintenance organization Coventry Health Care, Inc. ("Coventry") also added to the portfolio's performance. Coventry reported strong earnings results on solid performance in its health plans business and with its recent acquisition of First Health Group Corp., a health benefits service provider. In addition, the company announced a three-for-two stock split.
Jonathan K.L. Simon
Fund Manager
J. P. Morgan Investment Management, Inc.
This Fund is only available for investment by the Asset Allocation Portfolios.
Transamerica IDEX Mutual Funds
Annual Report 2005
1
TA IDEX J.P. Morgan Mid Cap Value
Comparison of change in value of $10,000 investment in the TA IDEX J.P. Morgan Mid Cap Value (the "Fund") and its comparative index.
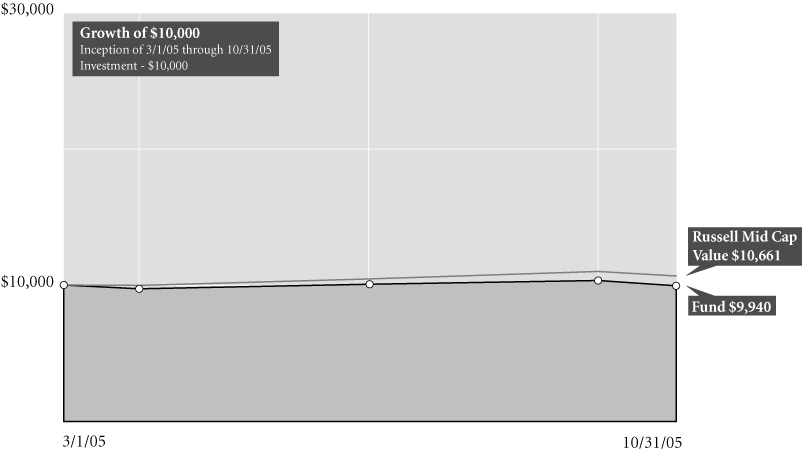
Total Return for Period Ended 10/31/05
| | | From
Inception | | Inception
Date | |
| Fund (NAV) | | | (0.60 | )% | | | 3/1/05 | | |
| Russell Mid Cap Value1 | | | 6.61 | % | | | 3/1/05 | | |
NOTES
1 The Russell Mid Cap Value (Russell Mid Cap Value) Index is an unmanaged index used as a general measure of market performance. Calculations assume dividends and capital gains are reinvested and do not include any managerial expenses. From inception calculation is based on life of the Fund. Source: Standard & Poor's Micropal®© Micropal, Inc. 2005 – 1-800-596-5323 – http://www.funds-sp.com.
The performance data presented represents past performance, future results may vary. Performance data does not reflect the deduction of taxes that would be paid on fund distributions or the redemption of fund shares. Investment return and principal value will fluctuate so that an investor's shares, when redeemed, may be worth more or less than their original cost. Current performance may be lower or higher than performance quoted. Please see www.transamericaidex.com for performance data current to the most recent month-end.
Net Asset Value (NAV) returns include the reinvestment of dividends and capital gains. Fund shares are sold without a sales load.
This material must be preceded or accompanied by a current prospectus, which includes specific contents regarding the investment objectives and policies of this fund.
Transamerica IDEX Mutual Funds
Annual Report 2005
2
TA IDEX J.P. Morgan Mid Cap Value
UNDERSTANDING YOUR FUND'S EXPENSES
(unaudited)
SHAREHOLDER EXPENSES
Fund shareholders may incur ongoing costs, including management fees, 12b-1 distribution and service fees, and other fund expenses. Shares of the fund currently are sold only to certain Transamerica IDEX Mutual Funds and AEGON/Transamerica Series Trust (an affiliate of Transamerica IDEX Mutual Funds) asset allocation funds at net asset value, without any transactional costs.
The following Example is intended to help you understand your ongoing costs (in dollars and cents) of investing in a Fund and to compare these costs with the ongoing costs of investing in other funds.
The Example is based on an investment of $1,000 invested at May 1, 2005 and held for the entire period until October 31, 2005.
ACTUAL EXPENSES
The first line in the table below provides information about actual account values and actual expenses. You may use the information in this line, together with the amount you invested, to estimate the expenses that you paid over the period. Simply divide your account value by $1,000 (for example, an $8,600 account value divided by $1,000 = 8.6), then multiply the result by the number in the first line of your Fund under the heading entitled "Expenses Paid During Period" to estimate the expenses you paid on your account during this period.
HYPOTHETICAL EXAMPLE FOR COMPARISON PURPOSES
The second line in the table below provides information about hypothetical account values and hypothetical expenses based on the Fund's actual expense ratio and an assumed rate of return of 5% per year before expenses, which is not the Fund's actual return. The hypothetical account values and expenses may not be used to estimate the actual ending account balance or expenses you paid for the period. You may use this information to compare the ongoing costs of investing in your Fund and other funds. To do so, compare this 5% hypothetical example with the 5% hypothetical examples that appear in the shareholder reports of the other funds.
Please note that the expenses shown in the table are meant to highlight your ongoing costs only and do not reflect any transactional costs, such as sales charges, redemption fees, brokerage commissions paid on purchases and sales of fund shares. Therefore, the second line under the Fund in the table is useful in comparing ongoing costs only, and will not help you determine the relative total costs of owning different funds.
| | | Beginning
Account
Value | | Ending
Account
Value | | Annualized
Expense
Ratio | | Expenses Paid
During Period (a) | |
| Class A | |
| Actual | | $ | 1,000.00 | | | $ | 1,048.50 | | | | 1.30 | % | | $ | 6.71 | | |
| Hypothetical (b) | | | 1,000.00 | | | | 1,018.65 | | | | 1.30 | | | | 6.61 | | |
(a) Expenses are calculated using each Fund's annualized expense ratio (as disclosed in the table), multiplied by the average account value for the period, multiplied by number of days in the period (184 days), and divided by the number of days in the year (365 days).
(b) 5% return per year before expenses.
GRAPHICAL PRESENTATION OF SCHEDULE OF INVESTMENTS
By Sector
At October 31, 2005

This chart shows the percentage breakdown by sector of the Fund's total investment securities.
Transamerica IDEX Mutual Funds
Annual Report 2005
3
TA IDEX J.P. Morgan Mid Cap Value
SCHEDULE OF INVESTMENTS
At October 31, 2005
(all amounts except share amounts in thousands)
| | | Shares | | Value | |
| COMMON STOCKS (94.5%) | |
| Apparel & Accessory Stores (0.9%) | |
| Ltd. Brands | | | 88,900 | | | $ | 1,779 | | |
| Apparel Products (3.2%) | |
| Columbia Sportswear Co. ‡† | | | 43,600 | | | | 1,850 | | |
| V.F. Corp. | | | 85,400 | | | | 4,462 | | |
| Automotive (1.4%) | |
| Genuine Parts Co. | | | 25,900 | | | | 1,149 | | |
| Harsco Corp. | | | 24,100 | | | | 1,549 | | |
| Automotive Dealers & Service Stations (2.3%) | |
| AutoNation, Inc. ‡ | | | 79,500 | | | | 1,581 | | |
| AutoZone, Inc. ‡ | | | 37,500 | | | | 3,034 | | |
| Beverages (1.0%) | |
| Brown-Forman Corp.–Class B | | | 30,300 | | | | 1,919 | | |
| Business Services (0.5%) | |
| Magellan Health Services, Inc. ‡ | | | 36,900 | | | | 1,097 | | |
| Chemicals & Allied Products (5.1%) | |
| Albemarle Corp. | | | 64,400 | | | | 2,260 | | |
| Clorox Co. | | | 40,400 | | | | 2,187 | | |
| International Flavors & Fragrances, Inc. | | | 22,400 | | | | 739 | | |
| Lauder (Estee) Cos., Inc. (The)–Class A † | | | 51,300 | | | | 1,702 | | |
| PPG Industries, Inc. | | | 24,700 | | | | 1,481 | | |
| Sherwin-Williams Co. (The) | | | 39,000 | | | | 1,660 | | |
| Commercial Banks (7.3%) | |
| Cullen/Frost Bankers, Inc. | | | 33,100 | | | | 1,748 | | |
| M&T Bank Corp. † | | | 34,600 | | | | 3,722 | | |
| North Fork Bancorp, Inc. | | | 148,800 | | | | 3,771 | | |
| Northern Trust Corp. | | | 41,400 | | | | 2,219 | | |
| TCF Financial Corp. | | | 67,500 | | | | 1,829 | | |
| Wilmington Trust Corp. | | | 30,500 | | | | 1,156 | | |
| Computer & Data Processing Services (2.8%) | |
| Affiliated Computer Services, Inc.–Class A ‡ | | | 29,600 | | | | 1,602 | | |
| Computer Associates International, Inc. † | | | 68,000 | | | | 1,902 | | |
| Interactive Data Corp. | | | 52,800 | | | | 1,225 | | |
| NCR Corp. ‡ | | | 29,500 | | | | 892 | | |
| Computer & Office Equipment (0.9%) | |
| Pitney Bowes, Inc. | | | 42,200 | | | | 1,776 | | |
| Department Stores (1.6%) | |
| Federated Department Stores, Inc. | | | 18,471 | | | | 1,134 | | |
| TJX Cos., Inc. | | | 98,100 | | | | 2,112 | | |
| Diversified (0.9%) | |
| Vornado Realty Trust REIT | | | 21,400 | | | | 1,733 | | |
| Electric Services (5.7%) | |
| American Electric Power Co., Inc. | | | 49,800 | | | | 1,891 | | |
| DPL, Inc. † | | | 67,000 | | | | 1,727 | | |
| | | Shares | | Value | |
| Electric Services (continued) | |
| Energy East Corp. | | | 60,300 | | | $ | 1,438 | | |
| PPL Corp. | | | 79,400 | | | | 2,488 | | |
| SCANA Corp. | | | 46,500 | | | | 1,845 | | |
| Westar Energy, Inc. | | | 84,300 | | | | 1,863 | | |
| Electric, Gas & Sanitary Services (0.5%) | |
| PG&E Corp. | | | 29,700 | | | | 1,081 | | |
| Electrical Goods (1.9%) | |
| Carlisle Cos., Inc. | | | 31,600 | | | | 2,107 | | |
| Hughes Supply, Inc. | | | 50,200 | | | | 1,679 | | |
| Electronic & Other Electric Equipment (2.0%) | |
| Ametek, Inc. | | | 44,800 | | | | 1,825 | | |
| Cooper Industries, Ltd.–Class A | | | 29,500 | | | | 2,091 | | |
| Electronic Components & Accessories (0.4%) | |
| Amphenol Corp.–Class A | | | 20,600 | | | | 823 | | |
| Environmental Services (1.0%) | |
| Republic Services, Inc. | | | 58,200 | | | | 2,057 | | |
| Fabricated Metal Products (1.9%) | |
| Crane Co. | | | 54,400 | | | | 1,684 | | |
| Fortune Brands, Inc. | | | 26,700 | | | | 2,028 | | |
| Food & Kindred Products (1.4%) | |
| Del Monte Foods Co. ‡ | | | 130,400 | | | | 1,380 | | |
| Hormel Foods Corp. | | | 41,700 | | | | 1,326 | | |
| Furniture & Home Furnishings Stores (0.4%) | |
| Tuesday Morning Corp. † | | | 36,100 | | | | 866 | | |
| Gas Production & Distribution (4.6%) | |
| AGL Resources, Inc. | | | 55,900 | | | | 1,967 | | |
| Energen Corp. | | | 47,800 | | | | 1,797 | | |
| Kinder Morgan, Inc. † | | | 44,800 | | | | 4,072 | | |
| UGI Corp. | | | 55,600 | | | | 1,312 | | |
| Health Services (4.1%) | |
| Coventry Health Care, Inc. ‡† | | | 67,550 | | | | 3,647 | | |
| Manor Care, Inc. | | | 41,800 | | | | 1,557 | | |
| Omnicare, Inc. | | | 30,800 | | | | 1,666 | | |
| Quest Diagnostics, Inc. | | | 29,000 | | | | 1,355 | | |
| Holding & Other Investment Offices (1.7%) | |
| Istar Financial Inc. REIT | | | 32,800 | | | | 1,209 | | |
| PS Business Parks, Inc. | | | 14,000 | | | | 652 | | |
| Rayonier, Inc. | | | 42,300 | | | | 1,617 | | |
| Hotels & Other Lodging Places (0.9%) | |
| Hilton Hotels Corp. | | | 91,400 | | | | 1,778 | | |
| Industrial Machinery & Equipment (0.8%) | |
| American Standard Cos., Inc. | | | 41,200 | | | | 1,567 | | |
The notes to the financial statements are an integral part of this report.
Transamerica IDEX Mutual Funds
Annual Report 2005
4
TA IDEX J.P. Morgan Mid Cap Value
SCHEDULE OF INVESTMENTS (continued)
At October 31, 2005
(all amounts except share amounts in thousands)
| | | Shares | | Value | |
| Insurance (8.5%) | |
| Assurant, Inc. † | | | 120,400 | | | $ | 4,599 | | |
| Cincinnati Financial Corp. | | | 47,055 | | | | 2,002 | | |
| IPC Holdings, Ltd. | | | 58,500 | | | | 1,540 | | |
| MGIC Investment Corp. † | | | 34,100 | | | | 2,020 | | |
| Old Republic International Corp. | | | 131,200 | | | | 3,399 | | |
| Principal Financial Group | | | 26,100 | | | | 1,295 | | |
| SAFECO Corp. | | | 37,000 | | | | 2,061 | | |
| Life Insurance (1.0%) | |
| Genworth Financial, Inc.–Class A | | | 60,700 | | | | 1,924 | | |
| Metal Cans & Shipping Containers (1.0%) | |
| Ball Corp. † | | | 50,900 | | | | 2,004 | | |
| Mining (1.4%) | |
| Vulcan Materials Co. † | | | 42,900 | | | | 2,789 | | |
| Motor Vehicles, Parts & Supplies (0.5%) | |
| BorgWarner, Inc. | | | 17,100 | | | | 992 | | |
| Oil & Gas Extraction (4.0%) | |
| Burlington Resources, Inc. | | | 47,000 | | | | 3,394 | | |
| Devon Energy Corp. | | | 53,000 | | | | 3,200 | | |
| Pioneer Natural Resources Company | | | 26,800 | | | | 1,341 | | |
| Paper & Allied Products (1.5%) | |
| MeadWestvaco Corp. | | | 61,200 | | | | 1,605 | | |
| Pactiv Corp. ‡† | | | 65,500 | | | | 1,290 | | |
| Petroleum Refining (1.8%) | |
| Ashland, Inc. | | | 36,700 | | | | 1,964 | | |
| Marathon Oil Corp. | | | 26,379 | | | | 1,587 | | |
| Pharmaceuticals (0.9%) | |
| Sigma-Aldrich Corp. | | | 26,800 | | | | 1,707 | | |
| Printing & Publishing (3.5%) | |
| Dex Media, Inc. | | | 64,300 | | | | 1,734 | | |
| Gannett Co., Inc. † | | | 36,500 | | | | 2,287 | | |
| Knight-Ridder, Inc. † | | | 17,100 | | | | 913 | | |
| Scripps (E.W.) Co. (The) | | | 22,900 | | | | 1,049 | | |
| Washington Post–Class B | | | 1,200 | | | | 894 | | |
| Railroads (0.5%) | |
| Norfolk Southern Corp. | | | 23,700 | | | | 953 | | |
| Real Estate (1.7%) | |
| Brookfield Properties Co. † | | | 72,000 | | | | 2,110 | | |
| Forest City Enterprises, Inc.–Class A | | | 32,400 | | | | 1,195 | | |
| Restaurants (1.6%) | |
| Applebees International, Inc. | | | 62,900 | | | | 1,378 | | |
| Outback Steakhouse, Inc. | | | 50,300 | | | | 1,894 | | |
| Retail Trade (0.8%) | |
| Tiffany & Co. † | | | 38,300 | | | | 1,509 | | |
| | | Shares | | Value | |
| Savings Institutions (2.7%) | |
| Golden West Financial Corp. † | | | 58,500 | | | $ | 3,436 | | |
| Webster Financial Corp. | | | 42,200 | | | | 1,948 | | |
| Security & Commodity Brokers (1.4%) | |
| Legg Mason, Inc. | | | 9,340 | | | | 1,002 | | |
| T. Rowe Price Group, Inc. | | | 26,500 | | | | 1,736 | | |
| Telecommunications (4.6%) | |
| ALLTEL Corp. | | | 65,600 | | | | 4,058 | | |
| CenturyTel, Inc. † | | | 108,300 | | | | 3,545 | | |
| Telephone & Data Systems, Inc. | | | 41,900 | | | | 1,515 | | |
| Variety Stores (0.7%) | |
| Family Dollar Stores, Inc. † | | | 63,200 | | | | 1,399 | | |
| Wholesale Trade Nondurable Goods (1.2%) | |
| Dean Foods Co. ‡ | | | 66,000 | | | | 2,386 | | |
| Total Common Stocks (cost: $186,744) | | | | | | | 187,319 | | |
| | | Principal | | Value | |
| SECURITY LENDING COLLATERAL (17.9%) | |
| Debt (16.6%) | |
| Bank Notes (1.1%) | |
Bank of America
| |
| 3.81%, due 06/07/2006 * | | $ | 996 | | | $ | 996 | | |
| 3.81%, due 08/10/2006 * | | | 988 | | | | 988 | | |
Credit Suisse First Boston Corp.
4.11%, due 03/10/2006 * | | | 198 | | | | 198 | | |
| Certificates Of Deposit (1.2%) | |
Canadian Imperial Bank of Commerce
4.07%, due 11/04/2005 * | | | 790 | | | | 790 | | |
Harris Trust & Savings Bank
3.80%, due 11/04/2005 * | | | 629 | | | | 629 | | |
Rabobank Nederland
4.03%, due 05/31/2006 * | | | 988 | | | | 988 | | |
| Commercial Paper (3.6%) | |
Ciesco LLC
4.00%, due 11/03/2005 | | | 987 | | | | 987 | | |
General Electric Capital Corp.
3.96%, due 12/05/2005 | | | 790 | | | | 790 | | |
Paradigm Funding LLC–144A
4.01%, due 11/07/2005 | | | 788 | | | | 788 | | |
Park Avenue Receivables Corp.–144A
4.03%, due 12/02/2005 | | | 783 | | | | 783 | | |
Preferred Receivables Corp.–144A
4.04%, due 12/05/2005 | | | 593 | | | | 593 | | |
Ranger Funding Co. LLC–144A
3.99%, due 11/15/2005 | | | 588 | | | | 588 | | |
Sheffield Receivables Corp.–144A
4.01%, due 11/08/2005 | | | 593 | | | | 593 | | |
The notes to the financial statements are an integral part of this report.
Transamerica IDEX Mutual Funds
Annual Report 2005
5
TA IDEX J.P. Morgan Mid Cap Value
SCHEDULE OF INVESTMENTS (continued)
At October 31, 2005
(all amounts except share amounts in thousands)
| | | Principal | | Value | |
| Commercial Paper (continued) | |
Yorktown Capital LLC
| |
| 3.97%, due 11/09/2005 | | $ | 985 | | | $ | 985 | | |
| 3.93%, due 11/17/2005 | | | 981 | | | | 981 | | |
| Euro Dollar Overnight (3.9%) | |
Bank of Montreal
3.79%, due 11/01/2005 | | | 593 | | | | 593 | | |
Barclays
3.80%, due 11/04/2005 | | | 790 | | | | 790 | | |
BNP Paribas
3.83%, due 11/02/2005 | | | 1,186 | | | | 1,186 | | |
Deutsche Bank
3.80%, due 11/02/2005 | | | 1,976 | | | | 1,976 | | |
HSBC Banking/Holdings PLC
3.84%, due 11/07/2005 | | | 593 | | | | 593 | | |
Royal Bank of Scotland
3.76%, due 11/01/2005 | | | 790 | | | | 790 | | |
Svenska Handlesbanken
4.03%, due 11/01/2005 | | | 1,018 | | | | 1,018 | | |
UBS AG
3.80%, due 11/03/2005 | | | 790 | | | | 790 | | |
| Euro Dollar Terms (1.4%) | |
Royal Bank of Scotland
4.00%, due 12/12/2005 | | | 790 | | | | 790 | | |
UBS AG
4.02%, due 12/01/2005 | | | 791 | | | | 791 | | |
Wells Fargo
3.96%, due 11/14/2005 | | | 1,186 | | | | 1,186 | | |
| Promissory Notes (0.4%) | |
Goldman Sachs Group, Inc.
4.02%, due 12/28/2005 | | | 830 | | | | 830 | | |
| Repurchase Agreements (5.0%) †† | |
Credit Suisse First Boston Corp.
4.10%, dated 10/31/2005 to be
repurchased at $1,347 on 11/01/2005 | | | 1,347 | | | | 1,347 | | |
| | | Principal | | Value | |
| Repurchase Agreements (continued) | |
Goldman Sachs Group, Inc. (The)
4.10%, dated 10/31/2005 to be
repurchased at $3,360 on 11/01/2005 | | $ | 3,360 | | | $ | 3,360 | | |
Lehman Brothers, Inc. 4.10%, dated
10/31/2005 to be repurchased at $93
on 11/01/2005 | | | 93 | | | | 93 | | |
Merrill Lynch & Co. 4.10%, dated
10/31/2005 to be repurchased
at $3,953 on 11/01/2005 | | | 3,953 | | | | 3,953 | | |
Morgan Stanley Dean Witter & Co.
4.17%, dated 10/31/2005 to be
repurchased at $1,185 on 11/01/2005 | | | 1,185 | | | | 1,185 | | |
| | | Shares | | Value | |
| Investment Companies (1.3%) | |
| Money Market Funds (1.3%) | |
American Beacon Fund
| |
| 1-day yield of 3.81% | | | 852,125 | | | $ | 852 | | |
Barclays Global Investors
Institutional Money Market Fund
1-day yield of 3.92% | | | 790,515 | | | | 791 | | |
Goldman Sachs Financial Square
Prime Obligations Fund
1-day yield of 3.79% | | | 123,137 | | | | 123 | | |
Merrimac Cash Fund,
Premium Class
1-day yield of 3.70% @ | | | 781,778 | | | | 782 | | |
| Total Security Lending Collateral (cost: $35,496) | | | | | | | 35,496 | | |
| Total Investment Securities (cost: $222,240) | | | | | | $ | 222,815 | | |
| SUMMARY: | |
| Investment Securities, at value | | | 112.4 | % | | $ | 222,815 | | |
| Liabilities in excess of other assets | | | (12.4 | )% | | | (24,559 | ) | |
| Net assets | | | 100.0 | % | | $ | 198,256 | | |
The notes to the financial statements are an integral part of this report.
NOTES TO SCHEDULE OF INVESTMENTS:
‡ Non-income producing.
† At October 31, 2005, all or a portion of this security is on loan (see Note 1). The value at October 31, 2005, of all securities on loan is $34,478.
* Floating or variable rate note. Rate is listed as of October 31, 2005.
†† Cash collateral for the Repurchase Agreements, valued at $10,136, that serve as collateral for securities lending are invested in corporate bonds with interest rates and maturity dates ranging from 0.00%–9.86% and 12/31/2005–11/15/2096, respectively.
@ Regulated investment company advised by Investors Bank and Trust Co. ("IBT"). IBT is also the accounting, custody and lending agent for the Fund.
DEFINITIONS:
144A 144A Securities are registered pursuant to Rule 144A of the Securities Act of 1933. These securities are deemed to be liquid for purposes of compliance limitations on holdings of illiquid securities and may be resold as transactions exempt from registration, normally to qualified institutional buyers. At October 31, 2005, these securities aggregated $3,345 or 1.7% of the net assets of the Fund.
REIT Real Estate Investment Trust
Transamerica IDEX Mutual Funds
Annual Report 2005
6
TA IDEX J.P. Morgan Mid Cap Value
STATEMENT OF ASSETS AND LIABILITIES
At October 31, 2005
(all amounts except per share amounts in thousands)
| Assets: | |
Investment securities, at value (cost: $222,240)
(including securities loaned of $34,478) | | $ | 222,815 | | |
| Cash | | | 9,166 | | |
| Receivables: | |
| Investment securities sold | | | 1,205 | | |
| Shares of beneficial interest sold | | | 876 | | |
| Interest | | | 21 | | |
| Dividends | | | 178 | | |
| | | | 234,261 | | |
| Liabilities: | |
| Investment securities purchased | | | 279 | | |
| Accounts payable and accrued liabilities: | |
| Shares of beneficial interest redeemed | | | 2 | | |
| Management and advisory fees | | | 134 | | |
| Distribution and service fees | | | 57 | | |
| Administration fees | | | 3 | | |
| Payable for collateral for securities on loan | | | 35,496 | | |
| Other | | | 34 | | |
| | | | 36,005 | | |
| Net Assets | | $ | 198,256 | | |
| Net Assets Consist of: | |
Shares of beneficial interest, unlimited shares
authorized, no par value | | $ | 197,055 | | |
| Undistributed net investment income (loss) | | | 405 | | |
Undistributed net realized gain (loss) from investment
securities | | | 221 | | |
Net unrealized appreciation (depreciation) on
investment securities | | | 575 | | |
| Net Assets | | $ | 198,256 | | |
| Shares Outstanding | | | 19,940 | | |
| Net Asset Value and Offering Price Per Share | | $ | 9.94 | | |
STATEMENT OF OPERATIONS
For the period ended October 31, 2005 (a)
(all amounts in thousands)
| Investment Income: | |
| Interest | | $ | 117 | | |
Dividends (net of withholding taxes on
foreign dividends of $3) | | | 1,505 | | |
| Income from loaned securities–net | | | 11 | | |
| | | | 1,633 | | |
| Expenses: | |
| Management and advisory fees | | | 837 | | |
| Distribution and service fees | | | 353 | | |
| Transfer agent fees | | | 1 | | |
| Printing and shareholder reports | | | 1 | | |
| Custody fees | | | 24 | | |
| Administration fees | | | 20 | | |
| Legal fees | | | 6 | | |
| Audit fees | | | 15 | | |
| Trustees fees | | | 4 | | |
| Registration fees | | | 15 | | |
| Other | | | 1 | | |
| Total expenses | | | 1,277 | | |
| Net Investment Income (Loss) | | | 356 | | |
| Net Realized and Unrealized Gain (Loss): | |
| Realized gain (loss) from investment securities | | | 173 | | |
Increase (decrease) in unrealized appreciation
(depreciation) on investment securities | | | 575 | | |
| Net Gain (Loss) on Investment Securities | | | 748 | | |
Net Increase (Decrease) in Net Assets Resulting
from Operations | | $ | 1,104 | | |
(a) Commenced operations on March 1, 2005.
The notes to the financial statements are an integral part of this report.
Transamerica IDEX Mutual Funds
Annual Report 2005
7
TA IDEX J.P. Morgan Mid Cap Value
STATEMENTS OF CHANGES IN NET ASSETS
For the period ended
(all amounts in thousands)
| | | October 31,
2005 (a) | |
| Increase (Decrease) In Net Assets From: | |
| Operations: | |
| Net investment income (loss) | | $ | 356 | | |
Net realized gain (loss) from
investment securities | | | 173 | | |
Net unrealized appreciation
(depreciation) on investment
securities | | | 575 | | |
| | | | 1,104 | | |
| Capital Share Transactions: | |
| Proceeds from shares sold | | | 197,152 | | |
| Net increase (decrease) in net assets | | | 198,256 | | |
| Net Assets: | |
| Beginning of period | | | – | | |
| End of period | | $ | 198,256 | | |
| Undistributed Net Investment Income (Loss) | | $ | 405 | | |
| Share Activity: | |
| Shares issued | | | 19,940 | | |
| Net increase (decrease) in shares outstanding | | | 19,940 | | |
(a) Commenced operations on March 1, 2005.
The notes to the financial statements are an integral part of this report.
Transamerica IDEX Mutual Funds
Annual Report 2005
8
TA IDEX J.P. Morgan Mid Cap Value
FINANCIAL HIGHLIGHTS
| | | For a share of beneficial interest outstanding throughout the period | |
| | | Net Asset | | Investment Operations | | Distributions | | Net Asset | |
For the
Period
Ended (d)(g) | | Value,
Beginning
of Period | | Net
Investment
Income (Loss) | | Net Realized
and Unrealized
Gain (Loss) | | Total
Operations | | From Net
Investment
Income | | From Net
Realized
Gains | | Total
Distributions | | Value,
End
of Period | |
| 10/31/2005 | | $ | 10.00 | | | $ | 0.02 | | | $(0.08) (h) | | $ | (0.06 | ) | | $ | – | | | $ | – | | | $ | – | | | $ | 9.94 | | |
| | | | | | | Ratios/Supplemental Data | |
| | |
For the
Period | |
Total | | Net Assets,
End of
Period | | Ratio of Expenses
to Average
Net Assets (a) | | Net Investment
Income (Loss)
to Average | |
Portfolio
Turnover | |
| | | Ended (g) | | Return (c) | | (000's) | | Net (e) | | Total (f) | | Net Assets (a) | | Rate (b) | |
| | 10/31/2005 | | | (0.60 | )% | | $ | 198,256 | | | | 1.27 | % | | | 1.27 | % | | | 0.35 | % | | | 30 | % | |
NOTES TO FINANCIAL HIGHLIGHTS
(a) Annualized.
(b) Not annualized.
(c) Total Return has been calculated for the applicable period without deduction of a sales load, if any, on an initial purchase. Periods of less than one year are not annualized.
(d) Per share information is calculated based on average number of shares outstanding.
(e) Ratio of Net Expenses to Average Net Assets is net of fee waivers and reimbursements by the investment adviser, if any (see note 2).
(f) Ratio of Total Expenses to Average Net Assets includes all expenses before fee waivers and reimbursements by the investment adviser.
(g) TA IDEX J.P. Morgan Mid Cap Value ("the Fund") commenced operations on March 1, 2005.
(h) The amount shown for a share outstanding does not correspond with aggregate net realized and unrealized gain (loss) on investments due to the timing of purchases and redemptions of Fund shares in relation to fluctuating market values of the investments of the Fund during the period.
The notes to the financial statements are an integral part of this report.
Transamerica IDEX Mutual Funds
Annual Report 2005
9
TA IDEX J.P. Morgan Mid Cap Value
NOTES TO FINANCIAL STATEMENTS
At October 31, 2005
(all amounts in thousands)
NOTE 1. ORGANIZATION AND SIGNIFICANT ACCOUNTING POLICIES
Transamerica IDEX Mutual Funds is an open-end management investment company registered under the Investment Company Act of 1940, as amended (the "1940 Act"). TA IDEX J.P. Morgan Mid Cap Value (the "Fund") began operations on March 1, 2005.
In the normal course of business, the Fund enters into contracts that contain a variety of representations that provide general indemnifications. The Fund's maximum exposure under these arrangements is unknown, as this would involve future claims that may be made against the Fund and/or its affiliates that have not yet occurred. However, based on experience, the Fund expects the risk of loss to be remote.
This report should be read in conjunction with the current Fund prospectus, which contains more complete information about the Fund.
The following is a summary of significant accounting policies followed by the Fund in the preparation of the financial statements. In preparing the Fund's financial statements in accordance with accounting principles generally accepted in the United States of America ("GAAP"), estimates or assumptions (which could differ from actual results) may be used that affect reported amounts and disclosures.
Security valuations: The Fund values its investments at the close of the New York Stock Exchange ("NYSE"), normally 4 p.m. ET, each day the NYSE is open for business. Fund investments are valued at the last sale price or closing price on the day of valuation taken from the primary exchange where the security is principally traded.
Securities traded in the over-the-counter market and listed securities for which no sale was reported on that date are valued at the last quoted bid price.
Debt securities are valued based on a price quotation or other equivalent indication of value supplied by an exchange, a pricing service or a major market maker; however, those that mature in sixty days or less are valued at amortized cost, which approximates market.
Investment company securities are valued at the net asset value of the underlying portfolio.
Other securities for which quotations are not readily available or whose values have been determined to be unreliable are valued at fair market value as determined in good faith by the Fund's Administrative Valuation Committee, under the supervision of the Board's Valuation Committee, using guidelines adopted by the Board of Trustees.
Cash: The Fund may leave cash overnight in its cash account with the custodian, Investors Bank & Trust Company ("IBT"). IBT has been contracted on behalf of the Fund to invest the excess cash into a savings account, which at October 31, 2005, was paying an interest rate of 2.76%.
Repurchase agreements: The Fund is authorized to enter into repurchase agreements. The Fund, through its custodian, IBT, receives delivery of the underlying securities, the value of which at the time of purchase is required to be an amount equal to at least 100% of the resale price. The Fund will bear the risk of value fluctuations until the security can be sold and may encounter delays and incur costs in liquidating the security. In the event of bankruptcy or insolvency of the seller, delays and costs may be incurred.
Securities lending: The Fund may lend securities to qualified borrowers, with IBT acting as the Fund's lending agent. The Fund earns negotiated lenders' fees. The Fund receives cash and/or securities as collateral against the loaned securities. Cash collateral received is invested in short term, interest bearing securities. The Fund monitors the market value of securities loaned on a daily basis and requires collateral in an amount at least equal to the value of the securities loaned. Income from loaned securities on the Statement of Operations is net of fees, in the amount of $5, earned by IBT for its services.
Security transactions and investment income: Security transactions are recorded on the trade date. Security gains and losses are calculated on the specific identification basis. Dividend income, if any, is recorded on the ex-dividend date or, in the case of foreign securities, as soon as the Fund is informed of the ex-dividend date. Interest income, including accretion of discounts and amortization of premiums, is recorded on the accrual basis commencing on the settlement date.
Redemption fees: A short-term trading redemption fee may be assessed on any Fund shares in a fund account that are sold during the first five (5) NYSE trading days following their purchase date. This redemption fee will equal 2% of the amount redeemed and shares held the longest will be treated as being redeemed first and shares held the shortest as being redeemed last. For the period from inception through October 31, 2005, the Fund received no redemption fees.
Dividend distributions: Distributions to shareholders are recorded on the ex-dividend date and are determined in accordance with Federal income tax regulations which may differ from GAAP.
NOTE 2. RELATED PARTY TRANSACTIONS
Effective January 1, 2005 AEGON/Transamerica Fund Advisors, Inc. was renamed Transamerica Fund Advisors, Inc. ("TFAI"); AEGON/Transamerica Fund Services, Inc. and AEGON/Transamerica Investor Services, Inc. merged into one entity and was renamed Transamerica Fund Services, Inc. ("TFS").
Transamerica IDEX Mutual Funds
Annual Report 2005
10
TA IDEX J.P. Morgan Mid Cap Value
NOTES TO FINANCIAL STATEMENTS (continued)
At October 31, 2005
(all amounts in thousands)
NOTE 2.–(continued)
TFAI is the Fund's investment adviser. TFS is the Fund's administrator and transfer agent. AFSG Securities Corp. ("AFSG") is the Fund's distributor/principal underwriter. TFAI, TFS, and AFSG are affiliates of AEGON, NV, a Netherlands corporation.
The following schedule reflects the percentage of Fund assets owned by affiliated mutual funds:
| | | Net
Assets | | % of
Net Assets | |
TA IDEX Asset Allocation–
Conservative Portfolio | | $ | 12,002 | | | | 6.05 | % | |
TA IDEX Asset Allocation–
Growth Portfolio | | | 58,226 | | | | 29.37 | % | |
TA IDEX Asset Allocation–
Moderate Growth Portfolio | | | 99,199 | | | | 50.04 | % | |
TA IDEX Asset Allocation–
Moderate Portfolio | | | 28,279 | | | | 14.26 | % | |
| Total | | $ | 197,706 | | | | 99.72 | % | |
Investment advisory fees: The Fund pays management fees to TFAI based on average daily net assets ("ANA") at the following breakpoints:
0.85% of the first $100 million of ANA
0.80% of ANA over $100 million
TFAI has contractually agreed to waive its advisory fee and will reimburse the Fund to the extent that operating expenses exceed the following stated annual limit:
From March 1, 2005 through May 27, 2005:
1.05% Expense Limit (including 12b-1 fees)
From May 28, 2005 on:
1.05% Expense Limit (excluding 12b-1 fees)
If total fund expenses fall below the annual expense limitation agreement agreed to by the adviser within the succeeding three years, the Fund may be required to pay that adviser a portion or all of the reimbursed class expenses.
There were no amounts recaptured during the period from inception through October 31, 2005. There are no amounts subject to recapture at October 31, 2005.
Distribution and service fees: The Fund has a 12b-1 distribution plan under the 1940 Act pursuant to which an annual fee, based on average daily net assets, is paid to the distributor for various disbursements such as broker-dealer account servicing fees and other promotional expenses of the Fund. The Fund is authorized under the 12b-1 plan to pay fees on each class up to the following limits:
In the case the Fund or a class of shares of the Fund is closed to new investors or investments, the Fund is authorized to pay 12b-1 fees for past sales and distribution efforts and present and past investor services.
Administrative services: The Fund has entered into an agreement with TFS for financial and legal fund administration services. The Fund pays TFS an annual fee of 0.02% of ANA. The Legal fees on the Statement of Operations are for fees paid to external legal counsel.
Transfer agent fees: The Fund pays TFS an annual per-account charge for each open and closed account. The Fund paid TFS $1 for the period from inception through October 31, 2005.
NOTE 3. INVESTMENT TRANSACTIONS
The cost of securities purchased and proceeds from securities sold (excluding short-term securities) for the period from inception through October 31, 2005, were as follows:
| Purchases of securities: | |
| Long-Term | | $ | 228,856 | | |
| U.S. Government | | | – | | |
| Proceeds from maturities and sales of securities: | |
| Long-Term | | | 42,575 | | |
| U.S. Government | | | – | | |
NOTE 4. FEDERAL INCOME TAX MATTERS
The Fund has not made any provision for federal income or excise taxes due to its policy to distribute all of its taxable income and capital gains to its shareholders and otherwise qualify as a regulated investment company under Subchapter M of the Internal Revenue Code. Income and capital gain distributions are determined in accordance with income tax regulations, which may differ from GAAP. These differences are primarily due to differing treatment for items including, but not limited to, wash sales.
Therefore, distributions determined in accordance with tax regulations may differ significantly in amount or character from net investment income and realized gains for financial reporting purposes. Financial reporting records are adjusted for permanent book/tax differences to reflect tax character. Financial records are not adjusted for temporary differences. These reclassifications are as follows:
Shares of beneficial interest, unlimited
shares authorized | | $ | (97 | ) | |
| Undistributed net investment income (loss) | | | 49 | | |
Undistributed net realized gain (loss) from investment
securities | | | 48 | | |
Transamerica IDEX Mutual Funds
Annual Report 2005
11
TA IDEX J.P. Morgan Mid Cap Value
NOTES TO FINANCIAL STATEMENTS (continued)
At October 31, 2005
(all amounts in thousands)
NOTE 4.–(continued)
The tax basis components of distributable earnings as of October 31, 2005, are as follows:
| Undistributed Ordinary Income | | $ | 1,409 | | |
| Undistributed Long-term Capital Gains | | $ | 25 | | |
| Capital Loss Carryforward | | $ | – | | |
| Net Unrealized Appreciation (Depreciation) | | $ | (233 | ) | |
The aggregate cost of investments and composition of unrealized appreciation (depreciation) for federal income tax purposes as of October 31, 2005, are as follows:
| Federal Tax Cost Basis | | $ | 223,048 | | |
| Unrealized Appreciation | | $ | 8,679 | | |
| Unrealized (Depreciation) | | | (8,912 | ) | |
| Net Unrealized Appreciation (Depreciation) | | $ | (233 | ) | |
NOTE 5. REGULATORY PROCEEDINGS
There continues to be significant federal and state regulatory activity relating to financial services companies, particularly mutual fund companies and their investment advisers. As part of an ongoing investigation regarding potential market timing, recordkeeping and trading compliance issues and matters affecting the Fund's investment adviser, TFAI, and certain affiliates and former employees of TFAI, the SEC staff has indicated that it is likely to take some action against TFAI and certain of its affiliates at the conclusion of the investigation. The potential timing and the scope of any such action is difficult to predict. Although the impact of any action brought against TFAI and/or its affiliates is difficult to assess at the present time, the Fund currently believes that the likelihood that any such action will have a material adverse impact on it is remote. It is important to note that the Fund is not aware of any allega tion of wrongdoing against it and its Board at the time this annual report is printed. Although it is not anticipated that these developments will have an adverse impact on the Fund, there can be no assurance at this time. TFAI and its affiliates are actively working with the SEC in regard to this matter; however, the exact resolution cannot be determined at this time. TFAI will take such actions that it deems necessary or appropriate to continue providing management services to the Fund and to bring all matters to an appropriate conclusion.
TFAI and/or its affiliates, and not the Fund, will bear the costs regarding these regulatory matters.
Transamerica IDEX Mutual Funds
Annual Report 2005
12
Report of Independent Registered Certified Public Accounting Firm
To the Board of Trustees and Shareholders of
TA IDEX J.P. Morgan Mid Cap Value
In our opinion, the accompanying statement of assets and liabilities, including the schedule of investments, and the related statements of operations and of changes in net assets and the financial highlights present fairly, in all material respects, the financial position of TA IDEX J.P. Morgan Mid Cap Value (the "Fund") (one of the portfolios constituting the Transamerica IDEX Mutual Funds) at October 31, 2005, the results of its operations , the changes in its net assets and the financial highlights for the period March 1, 2005 (commencement of operations) through October 31, 2005, in conformity with accounting principles generally accepted in the United States of America. These financial statements and financial highlights (hereafter referred to as "financial statements") are the responsibility of the Fund's management; our responsibility is to express an opinion on these financial statements based on our audit. We conducted our audit of these financial statements in accordance with the standards of the Public Company Accounting Oversight Board (United States). Those standards require that we plan and perform the audit to obtain reasonable assurance about whether the financial statements are free of material misstatement. An audit includes examining, on a test basis, evidence supporting the amounts and disclosures in the financial statements, assessing the accounting principles used and significant estimates made by management, and evaluating the overall financial statement presentation. We believe that our audit, which included confirmation of securities at October 31, 2005 by correspondence with the custodian, provide a reasonable basis for our opinion.

December 22, 2005
Transamerica IDEX Mutual Funds
Annual Report 2005
13
TA IDEX J.P. Morgan Mid Cap Value (unaudited)
A discussion regarding the basis of Transamerica IDEX Mutual Funds' Board of Trustees' approval of the fund's advisory arrangements will be available in the fund's semi-annual report for the period ending April 30, 2006.
Transamerica IDEX Mutual Funds
Annual Report 2005
14
TA IDEX Marsico Growth
MARKET ENVIRONMENT
U.S. large capitalization equities faced a number of challenges over the reporting period, including concerns over higher energy prices, higher interest rates, higher rising inflation expectations, and economic repercussions (particularly the impact on consumer discretionary spending) associated with Hurricanes Katrina and Rita. Despite these factors, however, overall equity returns for the fiscal year were quite solid. Large capitalization equity benchmarks such as the Standard and Poor's 500 Composite Stock Index ("S&P 500") and Russell 1000 Growth Index had total returns of 8.71% and 8.81%, respectively, for the twelve month period ending October 31, 2005.
From the perspective of economic sector performance (using Global Industry Classification Standards Classifications ("GICS") for the S&P 500 as a reference point), gains were relatively widespread although market leadership was quite decisive. Eight of the ten sectors in the S&P 500 had a positive return. Energy (+34%) and utilities (+24%) were the top-performing sectors. Consumer staples (+10%), health care (+10%) and financials (+9%) also had solid absolute returns. No sector experienced a major decline. Consumer discretionary (–1%) and telecommunications services (–0.5%) were the only areas in negative territory, and their losses were quite mild in nature.
At an industry level, similar general strength prevailed, with the vast majority of groups able to post positive returns. In several areas, these gains were quite robust in nature. The top-performing groups included health care equipment and services (+27%), insurance (+20%), real estate (+19%), food beverage and tobacco (+18%), and diversified financials (+12%). Areas of weakness included automobiles and components (–21%), media (–7%), and food and staples retailing (–2%).
In terms of large capitalization investment style results, there was a fair amount of differentiation across various benchmark indexes during the reporting period. Every major index maintained by Frank Russell Company experienced a positive return during the reporting period. However, smaller capitalization companies tended to outperform their larger capitalization counterparts. Within the U.S. large capitalization area, "value" equities outperformed "growth" equities last year, due primarily to strong returns in the energy and utilities sectors (which typically are more heavily weighted in value-oriented equity indexes). Large capitalization "growth" stocks, as measured by the Russell 1000 Growth Index ("Russell 1000 Growth"), underperformed large capitalization "value" stocks, as measured by the Russell 1000 Value Index, by approximately 3% last year.
PERFORMANCE
For the year ended October 31, 2005, TA IDEX Marsico Growth, Class A returned 12.79%. By comparison its primary and secondary benchmarks, the S&P 500 and the Russell 1000 Growth returned, 8.71% and 8.81%, respectively.
STRATEGY REVIEW
During the reporting period, the portfolio's average sector allocations emphasized the health care, consumer discretionary, financials, and industrials sectors. The portfolio invested in every GICS economic sector during the twelve month period, with the energy, utilities, materials, and telecommunications services sectors averaging a significantly underweighted posture relative to the portfolio's primary benchmark, the S&P 500.
The largest individual contributors to the portfolio's annual performance results included pharmaceuticals and biotechnology company Genentech, Inc. (+99% price return), health care service provider UnitedHealth Group Incorporated (+60%), Internet search engine Google Inc. (+73% prior to being sold), and options exchange Chicago Mercantile Exchange Holdings Inc. (+109%). The largest individual detractors from performance included casino and resort operator Wynn Resorts, Limited (–20%), prosthetic joint manufacturer Zimmer Holdings, Inc. (–18%), and Internet retailer eBay Inc. (–18% prior to being sold).
On a sector and industry level, the largest contributors were the health care sector (both pharmaceuticals and biotechnology, and health care equipment and services industry groups contributed significantly), the information technology software and services industry, and the financials sector (particularly diversified financials). The sectors and industries that had the largest negative impact on performance in the period, relative to the S&P 500, included the energy sector (underweighted investment posture in an area with a significantly positive return in the period), and the consumer services and technology hardware and equipment industry groups.
Thomas F. Marsico
Fund Manager
Marsico Capital Management, LLC
Banc of America Capital Management, LLC (BACAP) has the role of sub-adviser with its affiliate Marsico Capital Management, LLC to provide management services to the Fund.
Transamerica IDEX Mutual Funds
Annual Report 2005
1
TA IDEX Marsico Growth
Comparison of change in value of $10,000 investment in Class A shares and its comparative indices.
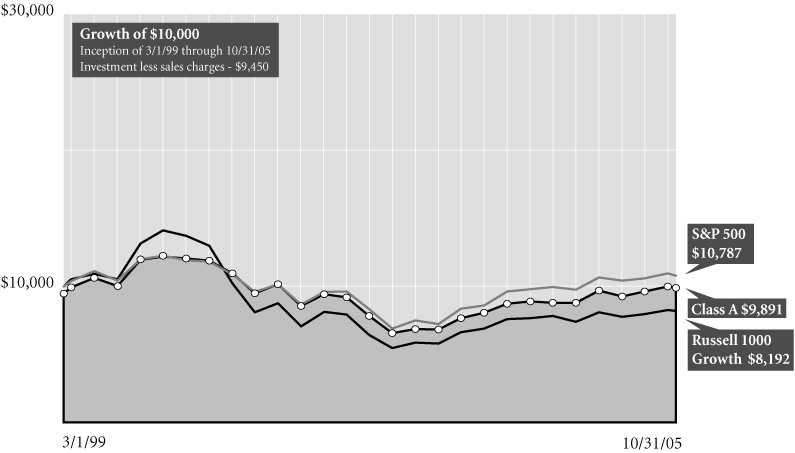
Average Annual Total Return for Periods Ended 10/31/05
| | | 1 year | | 5 years | | From
Inception | | Inception
Date | |
| Class A (NAV) | | | 12.79 | % | | | (3.60 | )% | | | 0.68 | % | | 3/1/99 | |
| Class A (POP) | | | 6.58 | % | | | (4.69 | )% | | | (0.17 | )% | | 3/1/99 | |
| S&P 5001 | | | 8.71 | % | | | (1.73 | )% | | | 1.14 | % | | 3/1/99 | |
| Russell 1000 Growth1 | | | 8.81 | % | | | (7.93 | )% | | | (2.94 | )% | | 3/1/99 | |
| Class B (NAV) | | | 11.70 | % | | | (4.33 | )% | | | (0.05 | )% | | 3/1/99 | |
| Class B (POP) | | | 6.70 | % | | | (4.52 | )% | | | (0.05 | )% | | 3/1/99 | |
| Class C (NAV) | | | 11.69 | % | | | – | | | | 11.07 | % | | 11/11/02 | |
| Class C (POP) | | | 10.69 | % | | | – | | | | 11.07 | % | | 11/11/02 | |
NOTES
1 The Standard and Poor's 500 Composite Stock (S&P 500) Index and the Russell 1000 Growth (Russell 1000 Growth) Index are unmanaged indices used as a general measure of market performance. Calculations assume dividends and capital gains are reinvested and do not include any managerial expenses. From inception calculation is based on life of Class A shares. Source: Standard & Poor's Micropal®© Micropal, Inc. 2005 – 1-800-596-5323 – http://www.funds-sp.com.
The performance data presented represents past performance, future results may vary. Performance data does not reflect the deduction of taxes that would be paid on fund distributions or the redemption of fund shares. Investment return and principal value will fluctuate so that an investor's shares, when redeemed, may be worth more or less than their original cost. Current performance may be lower or higher than performance quoted. Please see www.transamericaidex.com for performance data current to the most recent month-end.
Public Offering Price (POP) returns include the reinvestment of dividends and capital gains and reflect the maximum sales charge of 5.5% for A shares or the maximum applicable contingent deferred sales charge (5% in the 1st year, decreasing to 0% after 6 years) for Class B shares and 1% (during the first 12 months) for Class C shares. Shares purchased prior to March 1, 2004 are subject to a maximum applicable contingent deferred sales charge (5% in the 1st year, decreasing to 0% after 7 years) for Class B shares and (2% in the 1st year, decreasing to 0% after 2 years) for Class C shares. Net Asset Value (NAV) returns include the reinvestment of dividends and capital gains but do not reflect any sales charges.
This material must be preceded or accompanied by a current prospectus, which includes specific contents regarding the investment objectives and policies of this fund.
Transamerica IDEX Mutual Funds
Annual Report 2005
2
TA IDEX Marsico Growth
UNDERSTANDING YOUR FUND'S EXPENSES
(unaudited)
SHAREHOLDER EXPENSES
Fund shareholders may incur two types of costs: (1) transaction costs, including sales charges (loads) on purchases, contingent deferred sales charges on redemptions and redemption fees; and (2) ongoing costs, including management fees, 12b-1 distribution and service fees, and other fund expenses.
The following Example is intended to help you understand your ongoing costs (in dollars and cents) of investing in a Fund and to compare these costs with the ongoing costs of investing in other funds.
The Example is based on an investment of $1,000 invested at May 1, 2005 and held for the entire period until October 31, 2005.
ACTUAL EXPENSES
The first line in the table below provides information about actual account values and actual expenses. You may use the information in this line, together with the amount you invested, to estimate the expenses that you paid over the period. Simply divide your account value by $1,000 (for example, an $8,600 account value divided by $1,000 = 8.6), then multiply the result by the number in the first line of your Fund under the heading entitled "Expenses Paid During Period" to estimate the expenses you paid on your account during this period. If your account is an IRA, your expenses could have included a $15 annual fee. The amount of any fee paid through your account would increase the estimate of expenses you paid during the period and decrease your ending account value.
HYPOTHETICAL EXAMPLE FOR COMPARISON PURPOSES
The second line in the table below provides information about hypothetical account values and hypothetical expenses based on the Fund's actual expense ratio and an assumed rate of return of 5% per year before expenses, which is not the Fund's actual return. The hypothetical account values and expenses may not be used to estimate the actual ending account balance or expenses you paid for the period. You may use this information to compare the ongoing costs of investing in your Fund and other funds. To do so, compare this 5% hypothetical example with the 5% hypothetical examples that appear in the shareholder reports of the other funds. As in the case of the actual expense example, if your account is subject to an IRA fee, the amount of the fee paid through your account would increase the hypothetical expenses you would have paid during the period and decrease the hypothetical ending account value.
Please note that the expenses shown in the table are meant to highlight your ongoing costs only and do not reflect any transactional costs, such as sales charges, redemption fees, brokerage commissions paid on purchases and sales of fund shares. Therefore, the second line under the Fund in the table is useful in comparing ongoing costs only, and will not help you determine the relative total costs of owning different funds. If any of these transaction costs were included, your costs would be higher. The expenses shown in the table do not reflect any fees that may be charged to you by brokers, financial intermediaries or other financial institutions.
| | | Beginning
Account
Value | | Ending
Account
Value | | Annualized
Expense
Ratio | | Expenses Paid
During Period (a) | |
| Class A | |
| Actual | | $ | 1,000.00 | | | $ | 1,078.40 | | | | 1.32 | % | | $ | 6.92 | | |
| Hypothetical (b) | | | 1,000.00 | | | | 1,018.55 | | | | 1.32 | | | | 6.72 | | |
| Class B | |
| Actual | | | 1,000.00 | | | | 1,073.10 | | | | 2.34 | | | | 12.23 | | |
| Hypothetical (b) | | | 1,000.00 | | | | 1,013.41 | | | | 2.34 | | | | 11.88 | | |
| Class C | |
| Actual | | | 1,000.00 | | | | 1,073.30 | | | | 2.15 | | | | 11.24 | | |
| Hypothetical (b) | | | 1,000.00 | | | | 1,014.37 | | | | 2.15 | | | | 10.92 | | |
(a) Expenses are calculated using each Fund's annualized expense ratio (as disclosed in the table), multiplied by the average account value for the period, multiplied by number of days in the period (184 days), and divided by the number of days in the year (365 days).
(b) 5% return per year before expenses.
GRAPHICAL PRESENTATION OF SCHEDULE OF INVESTMENTS
By Sector
At October 31, 2005
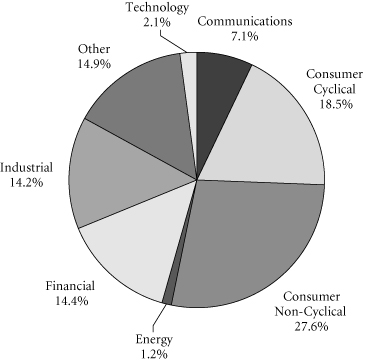
This chart shows the percentage breakdown by sector of the Fund's total investment securities.
Transamerica IDEX Mutual Funds
Annual Report 2005
3
TA IDEX Marsico Growth
SCHEDULE OF INVESTMENTS
At October 31, 2005
(all amounts except share amounts in thousands)
| | | Shares | | Value | |
| COMMON STOCKS (89.3%) | | | |
| Aerospace (3.3%) | | | |
| General Dynamics Corp. | | | 23,254 | | | $ | 2,704 | | |
| Lockheed Martin Corp. | | | 28,339 | | | | 1,716 | | |
| Air Transportation (3.4%) | | | |
| FedEx Corp. | | | 50,414 | | | | 4,635 | | |
| Beverages (0.4%) | | | |
| PepsiCo, Inc. | | | 9,870 | | | | 583 | | |
| Chemicals & Allied Products (3.2%) | | | |
| Procter & Gamble Co. | | | 76,729 | | | | 4,296 | | |
| Commercial Banks (2.7%) | | | |
| UBS AG–Registered | | | 35,791 | | | | 3,066 | | |
| UCBH Holdings, Inc. | | | 37,975 | | | | 661 | | |
| Communications Equipment (4.3%) | | | |
| Motorola, Inc. | | | 108,777 | | | | 2,411 | | |
| QUALCOMM, Inc. | | | 85,949 | | | | 3,417 | | |
| Computer & Data Processing Services (3.2%) | | | |
| Google, Inc.–Class A ‡ | | | 11,513 | | | | 4,284 | | |
| Computer & Office Equipment (2.2%) | | | |
| Apple Computer, Inc. ‡ | | | 51,065 | | | | 2,941 | | |
| Construction (1.6%) | | | |
| KB Home | | | 21,639 | | | | 1,414 | | |
| MDC Holdings, Inc. | | | 11,841 | | | | 812 | | |
| Drug Stores & Proprietary Stores (1.8%) | | | |
| CVS Corp. | | | 52,566 | | | | 1,283 | | |
| Walgreen Co. | | | 26,219 | | | | 1,191 | | |
| Electronic & Other Electric Equipment (3.1%) | | | |
| General Electric Co. | | | 118,098 | | | | 4,005 | | |
| Harman International Industries, Inc. | | | 2,038 | | | | 204 | | |
| Health Services (0.8%) | | | |
| Quest Diagnostics, Inc. | | | 23,320 | | | | 1,089 | | |
| Hotels & Other Lodging Places (3.2%) | | | |
| MGM Mirage, Inc. ‡† | | | 65,484 | | | | 2,447 | | |
| Wynn Resorts, Ltd. ‡† | | | 40,300 | | | | 1,881 | | |
| Industrial Machinery & Equipment (3.0%) | | | |
| Caterpillar, Inc. | | | 78,593 | | | | 4,133 | | |
| Insurance (8.1%) | | | |
| Progressive Corp. (The) | | | 13,233 | | | | 1,533 | | |
| UnitedHealth Group, Inc. † | | | 164,512 | | | | 9,524 | | |
| Lumber & Other Building Materials (5.1%) | | | |
| Home Depot, Inc. (The) | | | 38,706 | | | | 1,588 | | |
| Lowe's Cos., Inc. | | | 87,863 | | | | 5,339 | | |
| | | Shares | | Value | |
| Medical Instruments & Supplies (4.6%) | | | |
| Medtronic, Inc. | | | 58,293 | | | $ | 3,303 | | |
| Zimmer Holdings, Inc. ‡ | | | 46,044 | | | | 2,936 | | |
| Mortgage Bankers & Brokers (2.1%) | | | |
| Countrywide Financial Corp. | | | 87,877 | | | | 2,792 | | |
| Oil & Gas Extraction (1.3%) | | | |
| Halliburton Co. | | | 29,032 | | | | 1,716 | | |
| Personal Credit Institutions (3.2%) | | | |
| SLM Corp. † | | | 78,131 | | | | 4,339 | | |
| Pharmaceuticals (13.0%) | | | |
| Amgen, Inc. ‡ | | | 47,267 | | | | 3,581 | | |
| Amylin Pharmaceuticals, Inc. ‡† | | | 23,489 | | | | 789 | | |
| Genentech, Inc. ‡ | | | 109,435 | | | | 9,915 | | |
| Genzyme Corp. ‡ | | | 17,388 | | | | 1,257 | | |
| Johnson & Johnson | | | 32,862 | | | | 2,058 | | |
| Railroads (2.3%) | | | |
| Burlington Northern Santa Fe Corp. | | | 32,504 | | | | 2,017 | | |
| Union Pacific Corp. | | | 15,165 | | | | 1,049 | | |
| Real Estate (0.8%) | | | |
| St. Joe Co. (The) † | | | 15,962 | | | | 1,053 | | |
| Residential Building Construction (1.6%) | | | |
| Lennar Corp.–Class A | | | 28,361 | | | | 1,576 | | |
| Toll Brothers, Inc. ‡† | | | 17,170 | | | | 634 | | |
| Restaurants (3.8%) | | | |
| Starbucks Corp. ‡ | | | 76,076 | | | | 2,151 | | |
| Yum! Brands, Inc. | | | 59,421 | | | | 3,023 | | |
| Security & Commodity Brokers (5.2%) | | | |
| Chicago Mercantile Exchange † | | | 9,280 | | | | 3,389 | | |
| Goldman Sachs Group, Inc. (The) | | | 4,776 | | | | 604 | | |
| Lehman Brothers Holdings, Inc. † | | | 25,284 | | | | 3,026 | | |
| Variety Stores (2.0%) | | | |
| Target Corp. | | | 49,495 | | | | 2,756 | | |
| Total Common Stocks (cost: $99,678) | | | | | | | 121,121 | | |
| | | Principal | | Value | |
| SECURITY LENDING COLLATERAL (15.6%) | | | |
| Debt (14.5%) | | | |
| Bank Notes (1.0%) | | | |
Bank of America
3.81%, due 06/07/2006 * | | $ | 593 | | | $ | 593 | | |
| 3.81%, due 08/10/2006 * | | | 588 | | | | 588 | | |
Credit Suisse First Boston Corp.
4.11%, due 03/10/2006 * | | | 118 | | | | 118 | | |
The notes to the financial statements are an integral part of this report.
Transamerica IDEX Mutual Funds
Annual Report 2005
4
TA IDEX Marsico Growth
SCHEDULE OF INVESTMENTS (continued)
At October 31, 2005
(all amounts except share amounts in thousands)
| | | Principal | | Value | |
| Certificates Of Deposit (1.0%) | |
Canadian Imperial Bank of Commerce
4.07%, due 11/04/2005 * | | $ | 471 | | | $ | 471 | | |
Harris Trust & Savings Bank
3.80%, due 11/04/2005 * | | | 375 | | | | 375 | | |
Rabobank Nederland
4.03%, due 05/31/2006 * | | | 588 | | | | 588 | | |
| Commercial Paper (3.1%) | |
Ciesco LLC
4.00%, due 11/03/2005 | | | 588 | | | | 588 | | |
General Electric Capital Corp.
3.96%, due 12/05/2005 | | | 471 | | | | 471 | | |
Paradigm Funding LLC–144A
4.01%, due 11/07/2005 | | | 469 | | | | 469 | | |
Park Avenue Receivables Corp.–144A
4.03%, due 12/02/2005 | | | 466 | | | | 466 | | |
Preferred Receivables Corp.–144A
4.04%, due 12/05/2005 | | | 353 | | | | 353 | | |
Ranger Funding Co. LLC–144A
3.99%, due 11/15/2005 | | | 350 | | | | 350 | | |
Sheffield Receivables Corp.–144A
4.01%, due 11/08/2005 | | | 353 | | | | 353 | | |
Yorktown Capital LLC
3.97%, due 11/09/2005
3.93%, due 11/17/2005 | | | 587
584 | | | | 587
584 | | |
| Euro Dollar Overnight (3.4%) | |
Bank of Montreal
3.79%, due 11/01/2005 | | | 353 | | | | 353 | | |
Barclays
3.80%, due 11/04/2005 | | | 471 | | | | 471 | | |
BNP Paribas
3.83%, due 11/02/2005 | | | 706 | | | | 706 | | |
Deutsche Bank
3.80%, due 11/02/2005 | | | 1,177 | | | | 1,177 | | |
HSBC Banking/Holdings PLC
3.84%, due 11/07/2005 | | | 353 | | | | 353 | | |
Royal Bank of Scotland
3.76%, due 11/01/2005 | | | 471 | | | | 471 | | |
Svenska Handlesbanken
4.03%, due 11/01/2005 | | | 606 | | | | 606 | | |
UBS AG
3.80%, due 11/03/2005 | | | 471 | | | | 471 | | |
| Euro Dollar Terms (1.2%) | |
Royal Bank of Scotland
4.00%, due 12/12/2005 | | | 471 | | | | 471 | | |
UBS AG
4.02%, due 12/01/2005 | | | 471 | | | | 471 | | |
| | | Principal | | Value | |
| Euro Dollar Terms (continued) | | | |
Wells Fargo
3.96%, due 11/14/2005 | | $ | 706 | | | $ | 706 | | |
| Promissory Notes (0.4%) | | | |
Goldman Sachs Group, Inc.
4.02%, due 12/28/2005 | | | 494 | | | | 494 | | |
| Repurchase Agreements (4.4%) †† | | | |
Credit Suisse First Boston Corp.
4.10%, dated 10/31/2005
to be repurchased at
$802 on 11/01/2005 | | | 802 | | | | 802 | | |
Goldman Sachs Group, Inc. (The)
4.10%, dated 10/31/2005
to be repurchased at
$2,001 on 11/01/2005 | | | 2,001 | | | | 2,001 | | |
Lehman Brothers, Inc.
4.10%, dated 10/31/2005
to be repurchased at
$55 on 11/01/2005 | | | 55 | | | | 55 | | |
Merrill Lynch & Co.
4.10%, dated 10/31/2005
to be repurchased at
$2,354 on 11/01/2005 | | | 2,354 | | | | 2,354 | | |
Morgan Stanley Dean Witter & Co.
4.17%, dated 10/31/2005
to be repurchased at
$706 on 11/01/2005 | | | 706 | | | | 706 | | |
| | | Shares | | Value | |
| Investment Companies (1.1%) | | | |
| Money Market Funds (1.1%) | | | |
American Beacon Fund
1-day yield of 3.81% | | | 507,453 | | | $ | 507 | | |
Barclays Global Investors
Institutional Money Market Fund
1-day yield of 3.92% | | | 470,764 | | | | 471 | | |
Goldman Sachs Financial
Square Prime Obligations Fund
1-day yield of 3.79% | | | 73,330 | | | | 73 | | |
Merrimac Cash Fund, Premium Class
1-day yield of 3.70% @ | | | 465,561 | | | | 466 | | |
| Total Security Lending Collateral (cost: $21,139) | | | | | | | 21,139 | | |
| Total Investment Securities (cost: $120,817) | | | | | | $ | 142,260 | | |
| SUMMARY: | | | |
| Investment securities, at value | | | 104.9 | % | | $ | 142,260 | | |
| Liabilities in excess of other assets | | | (4.9 | )% | | | (6,695 | ) | |
| Net assets | | | 100.0 | % | | $ | 135,565 | | |
The notes to the financial statements are an integral part of this report.
Transamerica IDEX Mutual Funds
Annual Report 2005
5
TA IDEX Marsico Growth
SCHEDULE OF INVESTMENTS (continued)
At October 31, 2005
(all amounts except share amounts in thousands)
NOTES TO SCHEDULE OF INVESTMENTS:
‡ Non-income producing.
† At October 31, 2005, all or a portion of this security is on loan (see Note 1). The value at October 31, 2005, of all securities on loan is $20,593.
* Floating or variable rate note. Rate is listed as of October 31, 2005.
†† Cash collateral for the Repurchase Agreements, valued at $6,036, that serve as collateral for securities lending are invested in corporate bonds with interest rates and maturity dates ranging from 0.00%–9.86% and 12/31/2005–11/15/2096, respectively.
@ Regulated investment company advised by Investors Bank and Trust Co. ("IBT"). IBT is also the accounting, custody and lending agent for the Fund.
DEFINITIONS:
144A 144A Securities are registered pursuant to Rule 144A of the Securities Act of 1933. These securities are deemed to be liquid for purposes of compliance limitations on holdings of illiquid securities and may be resold as transactions exempt from registration, normally to qualified institutional buyers. At October 31, 2005, these securities aggregated $1,991 or 1.5% of the net assets of the Fund.
The notes to the financial statements are an integral part of this report.
Transamerica IDEX Mutual Funds
Annual Report 2005
6
TA IDEX Marsico Growth
STATEMENT OF ASSETS AND LIABILITIES
At October 31, 2005
(all amounts except per share amounts in thousands)
| Assets: | | | |
Investment securities, at value (cost: $120,817)
(including securities loaned of $20,593) | | $ | 142,260 | | |
| Cash | | | 13,452 | | |
| Receivables: | |
| Investment securities sold | | | 801 | | |
| Shares of beneficial interest sold | | | 375 | | |
| Interest | | | 26 | | |
| Dividends | | | 62 | | |
| Other | | | 3 | | |
| | | | 156,979 | | |
| Liabilities: | | | |
| Accounts payable and accrued liabilities: | |
| Shares of beneficial interest redeemed | | | 56 | | |
| Management and advisory fees | | | 117 | | |
| Distribution and service fees | | | 57 | | |
| Transfer agent fees | | | 11 | | |
| Administration fees | | | 2 | | |
| Payable for collateral for securities on loan | | | 21,139 | | |
| Other | | | 32 | | |
| | | | 21,414 | | |
| Net Assets | | $ | 135,565 | | |
| Net Assets Consist of: | | | |
Shares of beneficial interest, unlimited shares
authorized, no par value | | $ | 126,775 | | |
| Accumulated net investment income (loss) | | | (1 | ) | |
Accumulated net realized gain (loss) from investment
securities and foreign currency transactions | | | (12,652 | ) | |
Net unrealized appreciation (depreciation) on
investment securities | | | 21,443 | | |
| Net Assets | | $ | 135,565 | | |
| Net Assets by Class: | | | |
| Class A | | $ | 102,906 | | |
| Class B | | | 20,650 | | |
| Class C | | | 12,009 | | |
| Shares Outstanding: | | | |
| Class A | | | 9,970 | | |
| Class B | | | 2,101 | | |
| Class C | | | 1,224 | | |
| Net Asset Value Per Share: | | | |
| Class A | | $ | 10.32 | | |
| Class B | | | 9.83 | | |
| Class C | | | 9.81 | | |
| Maximum Offering Price Per Share (a): | | | |
| Class A | | $ | 10.92 | | |
(a) Includes the maximum selling commission (represented as a percentage of offering price) which is reduced on certain levels of sales as set forth in the Prospectus. Net asset value per share for Classes B and C shares represents offering price. The redemption price for Classes B and C shares equals net asset value less any applicable contingent deferred sales charge.
STATEMENT OF OPERATIONS
For the year ended October 31, 2005
(all amounts in thousands)
| Investment Income: | | | |
| Interest | | $ | 152 | | |
Dividends (net of withholding taxes on foreign
dividends of $39) | | | 1,049 | | |
| Income from loaned securities–net | | | 14 | | |
| | | | 1,215 | | |
| Expenses: | | | |
| Management and advisory fees | | | 924 | | |
| Distribution and service fees: | |
| Class A | | | 292 | | |
| Class B | | | 208 | | |
| Class C | | | 112 | | |
| Transfer agent fees: | |
| Class A | | | 58 | | |
| Class B | | | 71 | | |
| Class C | | | 28 | | |
| Printing and shareholder reports | | | 18 | | |
| Custody fees | | | 21 | | |
| Administration fees | | | 22 | | |
| Legal fees | | | 8 | | |
| Audit fees | | | 18 | | |
| Trustees fees | | | 5 | | |
| Registration fees: | |
| Class A | | | 18 | | |
| Class B | | | 12 | | |
| Class C | | | 11 | | |
| Other | | | 4 | | |
| Total expenses before recapture of waived expenses | | | 1,830 | | |
| Recaptured expenses | | | 27 | | |
| Total expenses | | | 1,857 | | |
| Net Investment Income (Loss) | | | (642 | ) | |
| Net Realized and Unrealized Gain (Loss): | | | |
| Realized gain (loss) from investment securities | | | 1,538 | | |
Increase (decrease) in unrealized appreciation
(depreciation) on investment securities | | | 9,880 | | |
| Net Gain (Loss) on Investment Securities | | | 11,418 | | |
Net Increase (Decrease) in Net Assets Resulting
from Operations | | $ | 10,776 | | |
The notes to the financial statements are an integral part of this report.
Transamerica IDEX Mutual Funds
Annual Report 2005
7
TA IDEX Marsico Growth
STATEMENTS OF CHANGES IN NET ASSETS
For the years ended
(all amounts in thousands)
| | | October 31,
2005 | | October 31,
2004 | |
| Increase (Decrease) In Net Assets From: | | | |
| Operations: | | | |
| Net investment income (loss) | | $ | (642 | ) | | $ | (567 | ) | |
Net realized gain (loss) from
investment securities | | | 1,538 | | | | 869 | | |
Net unrealized appreciation
(depreciation) on investment
securities | | | 9,880 | | | | 781 | | |
| | | | 10,776 | | | | 1,083 | | |
| Capital Share Transactions: | | | |
| Proceeds from shares sold: | |
| Class A | | | 62,340 | | | | 5,879 | | |
| Class B | | | 4,047 | | | | 5,383 | | |
| Class C | | | 5,097 | | | | 3,088 | | |
| Class C2 | | | – | | | | 318 | | |
| Class M | | | – | | | | 464 | | |
| | | | 71,484 | | | | 15,132 | | |
| Cost of shares redeemed: | |
| Class A | | | (4,039 | ) | | | (3,608 | ) | |
| Class B | | | (5,390 | ) | | | (5,546 | ) | |
| Class C | | | (3,623 | ) | | | (531 | ) | |
| Class C2 | | | – | | | | (564 | ) | |
| Class M | | | – | | | | (911 | ) | |
| | | | (13,052 | ) | | | (11,160 | ) | |
| Class level exchanges: | |
| Class C | | | – | | | | 5,573 | | |
| Class C2 | | | – | | | | (2,070 | ) | |
| Class M | | | – | | | | (3,503 | ) | |
| | | | – | | | | – | | |
| Automatic conversions: | |
| Class A | | | 56 | | | | 17 | | |
| Class B | | | (56 | ) | | | (17 | ) | |
| | | | – | | | | – | | |
| | | | 58,432 | | | | 3,972 | | |
| Net increase (decrease) in net assets | | | 69,208 | | | | 5,055 | | |
| Net Assets: | | | |
| Beginning of year | | | 66,357 | | | | 61,302 | | |
| End of year | | $ | 135,565 | | | $ | 66,357 | | |
Accumulated Net Investment Income
(Loss) | | $ | (1 | ) | | $ | (1 | ) | |
| | | October 31,
2005 | | October 31,
2004 | |
| Share Activity: | |
| Shares issued: | |
| Class A | | | 6,306 | | | | 649 | | |
| Class B | | | 425 | | | | 615 | | |
| Class C | | | 534 | | | | 352 | | |
| Class C2 | | | – | | | | 36 | | |
| Class M | | | – | | | | 53 | | |
| | | | 7,265 | | | | 1,705 | | |
| Shares redeemed: | |
| Class A | | | (404 | ) | | | (399 | ) | |
| Class B | | | (567 | ) | | | (637 | ) | |
| Class C | | | (378 | ) | | | (61 | ) | |
| Class C2 | | | – | | | | (63 | ) | |
| Class M | | | – | | | | (104 | ) | |
| | | | (1,349 | ) | | | (1,264 | ) | |
| Class level exchanges: | |
| Class C | | | – | | | | 639 | | |
| Class C2 | | | – | | | | (237 | ) | |
| Class M | | | – | | | | (399 | ) | |
| | | | – | | | | 3 | | |
| Automatic conversions: | |
| Class A | | | 6 | | | | 2 | | |
| Class B | | | (6 | ) | | | (2 | ) | |
| | | | – | | | | – | | |
Net increase (decrease) in shares
outstanding: | |
| Class A | | | 5,908 | | | | 252 | | |
| Class B | | | (148 | ) | | | (24 | ) | |
| Class C | | | 156 | | | | 930 | | |
| Class C2 | | | – | | | | (264 | ) | |
| Class M | | | – | | | | (450 | ) | |
| | | | 5,916 | | | | 444 | | |
The notes to the financial statements are an integral part of this report.
Transamerica IDEX Mutual Funds
Annual Report 2005
8
TA IDEX Marsico Growth
FINANCIAL HIGHLIGHTS
| | | | | For a share of beneficial interest outstanding throughout each period | |
| | | | | Net Asset | | Investment Operations | | Distributions | | Net Asset | |
| | | For the
Period
Ended (d)(g) | | Value,
Beginning
of Period | | Net
Investment
Income (Loss) | | Net Realized
and Unrealized
Gain (Loss) | | Total
Operations | | From Net
Investment
Income | | From Net
Realized
Gains | | Total
Distributions | | Value,
End
of Period | |
| Class A | | 10/31/2005 | | $ | 9.15 | | | $ | (0.03 | ) | | $ | 1.20 | | | $ | 1.17 | | | $ | – | | | $ | – | | | $ | – | | | $ | 10.32 | | |
| | | 10/31/2004 | | | 8.97 | | | | (0.05 | ) | | | 0.23 | | | | 0.18 | | | | – | | | | – | | | | – | | | | 9.15 | | |
| | | 10/31/2003 | | | 7.56 | | | | (0.08 | ) | | | 1.49 | | | | 1.41 | | | | – | | | | – | | | | – | | | | 8.97 | | |
| | | 10/31/2002 | | | 9.10 | | | | (0.06 | ) | | | (1.48 | ) | | | (1.54 | ) | | | – | | | | – | | | | – | | | | 7.56 | | |
| | | 10/31/2001 | | | 12.54 | | | | (0.05 | ) | | | (3.25 | ) | | | (3.30 | ) | | | – | | | | (0.14 | ) | | | (0.14 | ) | | | 9.10 | | |
| Class B | | 10/31/2005 | | | 8.80 | | | | (0.12 | ) | | | 1.15 | | | | 1.03 | | | | – | | | | – | | | | – | | | | 9.83 | | |
| | | 10/31/2004 | | | 8.68 | | | | (0.10 | ) | | | 0.22 | | | | 0.12 | | | | – | | | | – | | | | – | | | | 8.80 | | |
| | | 10/31/2003 | | | 7.36 | | | | (0.12 | ) | | | 1.44 | | | | 1.32 | | | | – | | | | – | | | | – | | | | 8.68 | | |
| | | 10/31/2002 | | | 8.92 | | | | (0.11 | ) | | | (1.45 | ) | | | (1.56 | ) | | | – | | | | – | | | | – | | | | 7.36 | | |
| | | 10/31/2001 | | | 12.41 | | | | (0.11 | ) | | | (3.24 | ) | | | (3.35 | ) | | | – | | | | (0.14 | ) | | | (0.14 | ) | | | 8.92 | | |
| Class C | | 10/31/2005 | | | 8.78 | | | | (0.11 | ) | | | 1.14 | | | | 1.03 | | | | – | | | | – | | | | – | | | | 9.81 | | |
| | | 10/31/2004 | | | 8.68 | | | | (0.12 | ) | | | 0.22 | | | | 0.10 | | | | – | | | | – | | | | – | | | | 8.78 | | |
| | | 10/31/2003 | | | 7.18 | | | | (0.12 | ) | | | 1.62 | | | | 1.50 | | | | – | | | | – | | | | – | | | | 8.68 | | |
| | | | | | | Ratios/Supplemental Data | |
| | | For the
Period | | Total | | Net Assets,
End of
Period | | Ratio of Expenses
to Average
Net Assets (a) | | Net Investment
Income (Loss)
to Average | | Portfolio
Turnover | |
| | | Ended (g) | | Return (c) | | (000's) | | Net (e) | | Total (f) | | Net Assets (a) | | Rate (b) | |
| Class A | | 10/31/2005 | | | 12.79 | % | | $ | 102,906 | | | | 1.35 | % (h) | | | 1.35 | % (h) | | | (0.30 | )% | | | 74 | % | |
| | | 10/31/2004 | | | 2.01 | | | | 37,186 | | | | 1.52 | | | | 1.52 | | | | (0.58 | ) | | | 85 | | |
| | | 10/31/2003 | | | 18.65 | | | | 34,167 | | | | 1.75 | | | | 1.80 | | | | (0.97 | ) | | | 129 | | |
| | | 10/31/2002 | | | (16.88 | ) | | | 5,752 | | | | 1.73 | | | | 2.05 | | | | (0.56 | ) | | | 34 | | |
| | | 10/31/2001 | | | (26.63 | ) | | | 7,361 | | | | 1.55 | | | | 2.03 | | | | (0.43 | ) | | | 15 | | |
| Class B | | 10/31/2005 | | | 11.70 | | | | 20,650 | | | | 2.31 | (h) | | | 2.31 | (h) | | | (1.24 | ) | | | 74 | | |
| | | 10/31/2004 | | | 1.38 | | | | 19,792 | | | | 2.13 | | | | 2.13 | | | | (1.19 | ) | | | 85 | | |
| | | 10/31/2003 | | | 17.93 | | | | 19,723 | | | | 2.40 | | | | 2.45 | | | | (1.62 | ) | | | 129 | | |
| | | 10/31/2002 | | | (17.52 | ) | | | 14,130 | | | | 2.38 | | | | 2.70 | | | | (1.21 | ) | | | 34 | | |
| | | 10/31/2001 | | | (27.25 | ) | | | 15,081 | | | | 2.20 | | | | 2.68 | | | | (1.08 | ) | | | 15 | | |
| Class C | | 10/31/2005 | | | 11.69 | | | | 12,009 | | | | 2.26 | (h) | | | 2.26 | (h) | | | (1.20 | ) | | | 74 | | |
| | | 10/31/2004 | | | 1.27 | | | | 9,379 | | | | 2.40 | | | | 2.40 | | | | (1.38 | ) | | | 85 | | |
| | | 10/31/2003 | | | 20.89 | | | | 1,200 | | | | 2.40 | | | | 2.46 | | | | (1.62 | ) | | | 129 | | |
NOTES TO FINANCIAL HIGHLIGHTS
(a) Annualized.
(b) Not annualized.
(c) Total Return has been calculated for the applicable period without deduction of a sales load, if any, on an initial purchase. Periods of less than one year are not annualized.
(d) Per share information is calculated based on average number of shares outstanding.
(e) Ratio of Net Expenses to Average Net Assets is net of fee waivers and reimbursements by the investment adviser, if any (see note 2).
(f) Ratio of Total Expenses to Average Net Assets includes all expenses before fee waivers and reimbursements by the investment adviser.
(g) The inception date for the Fund's offering of share Class C was November 11, 2002.
(h) Ratios of Total Expenses to Average Net Assets and Net Expenses to Average Net Assets are inclusive of recaptured expenses by the investment advisor, if any. The impact of recaptured expenses was 0.03%, 0.03% and 0.03% for Class A, Class B and Class C, respectively (see Note 2).
The notes to the financial statements are an integral part of this report.
Transamerica IDEX Mutual Funds
Annual Report 2005
9
TA IDEX Marsico Growth
NOTES TO FINANCIAL STATEMENTS
At October 31, 2005
(all amounts in thousands)
NOTE 1. ORGANIZATION AND SIGNIFICANT ACCOUNTING POLICIES
Transamerica IDEX Mutual Funds is an open-end management investment company registered under the Investment Company Act of 1940, as amended (the "1940 Act").
In the normal course of business, TA IDEX Marsico Growth (the "Fund") enters into contracts that contain a variety of representations that provide general indemnifications. The Fund's maximum exposure under these arrangements is unknown, as this would involve future claims that may be made against the Fund and/or its affiliates that have not yet occurred. However, based on experience, the Fund expects the risk of loss to be remote.
This report should be read in conjunction with the current Fund prospectus, which contains more complete information about the Fund.
The following is a summary of significant accounting policies followed by the Fund in the preparation of the financial statements. In preparing the Fund's financial statements in accordance with accounting principles generally accepted in the United States of America ("GAAP"), estimates or assumptions (which could differ from actual results) may be used that affect reported amounts and disclosures.
Multiple class operations, income and expenses: The Fund currently offers three classes of shares, each with a public offering price that reflects different sales charges, if any, and expense levels. On June 15, 2004, Class C2 shares merged into Class C. On September 24, 2004, Class M shares merged into Class C. Class B shares will convert to Class A shares eight years after purchase. Income, non-class specific expenses and realized and unrealized gains and losses, are allocated daily to each class, based upon the value of shares outstanding method as permitted under Rule 18f-3 of the 1940 Act. Each class bears its own specific expenses as well as a portion of general, common expenses.
Security valuations: The Fund values its investments at the close of the New York Stock Exchange ("NYSE"), normally 4 p.m. ET, each day the NYSE is open for business. Fund investments are valued at the last sale price or closing price on the day of valuation taken from the primary exchange where the security is principally traded.
Securities traded in the over-the-counter market and listed securities for which no sale was reported on that date are valued at the last quoted bid price.
Debt securities are valued based on a price quotation or other equivalent indication of value supplied by an exchange, a pricing service or a major market maker; however, those that mature in sixty days or less are valued at amortized cost, which approximates market.
Investment company securities are valued at the net asset value of the underlying portfolio.
Other securities for which quotations are not readily available or whose values have been determined to be unreliable are valued at fair market value as determined in good faith by the Fund's Administrative Valuation Committee, under the supervision of the Board's Valuation Committee, using guidelines adopted by the Board of Trustees.
Cash: The Fund may leave cash overnight in its cash account with the custodian, Investors Bank & Trust Company ("IBT"). IBT has been contracted on behalf of the Fund to invest the excess cash into a savings account, which at October 31, 2005, was paying an interest rate of 2.76%.
Repurchase agreements: The Fund is authorized to enter into repurchase agreements. The Fund, through its custodian, IBT, receives delivery of the underlying securities, the value of which at the time of purchase is required to be an amount equal to at least 100% of the resale price. The Fund will bear the risk of value fluctuations until the security can be sold and may encounter delays and incur costs in liquidating the security. In the event of bankruptcy or insolvency of the seller, delays and costs may be incurred.
Commission recapture: The sub-adviser, to the extent consistent with the best execution and usual commission rate policies and practices, may place security transactions of the Fund with broker/dealers with which Transamerica IDEX Mutual Funds has established a Commission Recapture Program. A Commission Recapture Program is any arrangement under which a broker/dealer applies a portion of the commissions received by such broker/dealer on the security transactions to the Fund. In no event will commissions paid by the Fund be used to pay expenses that would otherwise be borne by any other funds within Transamerica IDEX Mutual Funds, or by any other party.
Recaptured commissions during the year ended October 31, 2005, of $37 are included in net realized gains in the Statement of Operations.
Securities lending: The Fund may lend securities to qualified borrowers, with IBT acting as the Fund's lending agent. The Fund earns negotiated lenders' fees. The Fund receives cash and/or securities as collateral against the loaned securities. Cash collateral received is invested in short term, interest bearing securities. The Fund monitors the market value of securities loaned on a daily basis and requires collateral in an amount at least equal to the value of the securities loaned. Income from loaned securities on the Statement of Operations is net of fees, in the amount of $6, earned by IBT for its services.
Security transactions and investment income: Security transactions are recorded on the trade date. Security gains and losses are calculated on the specific identification basis. Dividend income, if any, is recorded on the ex-dividend date or, in the case of foreign securities, as soon as the Fund is informed of the ex-dividend date. Interest
Transamerica IDEX Mutual Funds
Annual Report 2005
10
TA IDEX Marsico Growth
NOTES TO FINANCIAL STATEMENTS (continued)
At October 31, 2005
(all amounts in thousands)
NOTE 1.–(continued)
income, including accretion of discounts and amortization of premiums, is recorded on the accrual basis commencing on the settlement date.
Option contracts: The Fund may enter into options contracts to manage exposure to market fluctuations. Options are valued at the average of the bid and ask ("Mean Quote") established each day at the close of the board of trade or exchange on which they are traded. The primary risks associated with options are imperfect correlation between the change in value of the securities held and the prices of the options contracts; the possibility of an illiquid market and inability of the counterparty to meet the contracts terms. When the Fund writes a covered call or put option, an amount equal to the premium received by the Fund is included in the Fund's Statement of Assets and Liabilities as an asset and as an equivalent liability. Options are marked-to-market daily to reflect the current value of the option written.
There were no open contracts at October 31, 2005.
Transactions in written call and put options were as follows:
| | | Premium | | Contracts* | |
| Beginning Balance October 31, 2004 | | $ | – | | | | – | | |
| Sales | | | 2,845 | | | | 17 | | |
| Closing Buys | | | – | | | | – | | |
| Expirations | | | – | | | | – | | |
| Exercised | | | (2,845 | ) | | | (17 | ) | |
| Balance at October 31, 2005 | | $ | – | | | | – | | |
* Contracts not in thousands
Redemption fees: A short-term trading redemption fee may be assessed on any Fund shares in a fund account that are sold during the first five (5) NYSE trading days following their purchase date. This redemption fee will equal 2% of the amount redeemed and shares held the longest will be treated as being redeemed first and shares held the shortest as being redeemed last. For the year ended October 31, 2005, the Fund received less than $1 in redemption fees.
Dividend distributions: Distributions to shareholders are recorded on the ex-dividend date and are determined in accordance with Federal income tax regulations which may differ from GAAP.
NOTE 2. RELATED PARTY TRANSACTIONS
Effective January 1, 2005 AEGON/Transamerica Fund Advisors, Inc. was renamed Transamerica Fund Advisors, Inc. ("TFAI"); AEGON/Transamerica Fund Services, Inc. and AEGON/Transamerica Investor Services, Inc. merged into one entity and was renamed Transamerica Fund Services, Inc. ("TFS").
TFAI is the Fund's investment adviser. TFS is the Fund's administrator and transfer agent. AFSG Securities Corp. ("AFSG") is the Fund's distributor/principal underwriter. TFAI, TFS , and AFSG are affiliates of AEGON, NV, a Netherlands corporation.
The following schedule reflects the percentage of fund assets owned by affiliated mutual funds:
| | | Net
Assets | | % of
Net Assets | |
TA IDEX Asset Allocation–
Moderate Growth Portfolio | | $ | 55,082 | | | | 40.63 | % | |
TA IDEX Asset Allocation–
Moderate Portfolio | | | 34,155 | | | | 25.19 | % | |
| Total | | $ | 89,237 | | | | 65.82 | % | |
Investment advisory fees: The Fund pays management fees to TFAI based on average daily net assets ("ANA") at the following breakpoints:
0.80% of the first $500 million of ANA
0.70% of ANA over $500 million
TFAI has contractually agreed to waive its advisory fee and will reimburse the Fund to the extent that operating expenses, excluding 12b-1 fees, exceed the following stated annual limit:
1.40% Expense Limit
If total Fund expenses fall below the annual expense limitation agreement agreed to by the adviser within the succeeding three years, the Fund may be required to pay that adviser a portion or all of the waived advisory fees.
For the year ended October 31, 2005, the Fund recaptured the following of previously waived expenses.
Amount
Recaptured | | Year
Waived | |
| $ | 27 | | | Fiscal Year 2003 | |
There are no amounts available for recapture at October 31, 2005.
Distribution and service fees: The Fund has a 12b-1 distribution plan under the 1940 Act pursuant to which an annual fee, based on average daily net assets, is paid to the distributor for various disbursements such as broker-dealer account servicing fees and other promotional expenses of the Fund. The Fund is authorized under the 12b-1 plan to pay fees on each class up to the following limits:
| Class A | | | 0.35 | % | |
| Class B | | | 1.00 | % | |
| Class C | | | 1.00 | % | |
Transamerica IDEX Mutual Funds
Annual Report 2005
11
TA IDEX Marsico Growth
NOTES TO FINANCIAL STATEMENTS (continued)
At October 31, 2005
(all amounts in thousands)
NOTE 2.–(continued)
In the case the Fund or a class of shares of the Fund is closed to new investors or investments, the Fund is authorized to pay 12b-1 fees for past sales and distribution efforts and present and past investor services.
Underwriter commissions relate to front-end sales charges imposed for Class A shares and contingent deferred sales charges from Classes B, C, and certain A share redemptions. For the year ended October 31, 2005, the underwriter commissions were as follows:
| Received by Underwriter | | $ | 279 | | |
| Retained by Underwriter | | | 12 | | |
| Contingent Deferred Sales Charge | | | 55 | | |
Administrative services: The Fund has entered into an agreement with TFS for financial and legal fund administration services. As of January 1, 2005 the Fund pays TFS an annual fee of 0.02% of ANA. Prior to January 1, 2005 the Fund paid TFS an annual fee of 0.015% of ANA. The Legal fees on the Statement of Operations are for fees paid to external legal counsel.
Transfer agent fees: The Fund pays TFS an annual per-account charge for each open and closed account. The Fund paid TFS $148 for the year ended October 31, 2005.
Deferred compensation plan:Each eligible independent Fund Trustee may elect to participate in a non-qualified deferred compensation plan maintained by Transamerica IDEX Mutual Funds (the "Plan"). Under the Plan, such Trustees may defer payment of all or a portion of their total fees earned as a Fund Trustee. Each Trustee who is a participant in the Plan may elect that the earnings, losses or gains credited to his or her deferred fee amounts be determined based on a deemed investment in any series of Transamerica IDEX Mutual Funds, including the Fund. The right of a participant to receive a distribution from the Plan of the deferred fees is an unsecured claim against the general assets of all series of Transamerica IDEX Mutual Funds. The pro rata liability to the Fund of all deferred fees in the Plan amounted, as of October 31, 2005, to $3.
NOTE 3. INVESTMENT TRANSACTIONS
The cost of securities purchased and proceeds from securities sold (excluding short-term securities) for the year ended October 31, 2005, were as follows:
| Purchases of securities: | | | |
| Long-Term | | $ | 124,702 | | |
| U.S. Government | | | – | | |
| Proceeds from maturities and sales of securities: | | | |
| Long-Term | | | 78,317 | | |
| U.S. Government | | | – | | |
NOTE 4. FEDERAL INCOME TAX MATTERS
The Fund has not made any provision for federal income or excise taxes due to its policy to distribute all of its taxable income and capital gains to its shareholders and otherwise qualify as a regulated investment company under Subchapter M of the Internal Revenue Code. Income and capital gain distributions are determined in accordance with income tax regulations, which may differ from GAAP. These differences are primarily due to differing treatment for items including, but not limited to, wash sales, net operating losses, foreign currency transactions and capital loss carryforwards.
Therefore, distributions determined in accordance with tax regulations may differ significantly in amount or character from net investment income and realized gains for financial reporting purposes. Financial reporting records are adjusted for permanent book/tax differences to reflect tax character. Financial records are not adjusted for temporary differences. These reclassifications are as follows:
Shares of beneficial interest, unlimited
shares authorized | | $ | (639 | ) | |
| Undistributed net investment income (loss) | | | 642 | | |
Undistributed net realized gain (loss) from investment
securities | | | (3 | ) | |
The capital loss carryforwards are available to offset future realized capital gains through the periods listed:
Capital Loss
Carryforward | | Available through | |
| $ | 4,018 | | | October 31, 2010 | |
| | 8,550 | | | October 31, 2011 | |
The capital loss carryforward utilized during the year ended October 31, 2005 was $1,537.
The tax basis components of distributable earnings as of October 31, 2005, are as follows:
| Undistributed Ordinary Income | | $ | - | | |
| Undistributed Long-term Capital Gains | | $ | - | | |
| Capital Loss Carryforward | | $ | (12,568 | ) | |
| Net Unrealized Appreciation (Depreciation) | | $ | 21,359 | * | |
* Amount includes unrealized appreciation (depreciation) from deferred compensation.
The aggregate cost of investments and composition of unrealized appreciation (depreciation) for federal income tax purposes as of October 31, 2005, are as follows:
| Federal Tax Cost Basis | | $ | 120,901 | | |
| Unrealized Appreciation | | $ | 22,947 | | |
| Unrealized (Depreciation) | | | (1,588 | ) | |
| Net Unrealized Appreciation (Depreciation) | | $ | 21,359 | | |
Transamerica IDEX Mutual Funds
Annual Report 2005
12
TA IDEX Marsico Growth
NOTES TO FINANCIAL STATEMENTS (continued)
At October 31, 2005
(all amounts in thousands)
NOTE 5. REGULATORY PROCEEDINGS
There continues to be significant federal and state regulatory activity relating to financial services companies, particularly mutual fund companies and their investment advisers. As part of an ongoing investigation regarding potential market timing, recordkeeping and trading compliance issues and matters affecting the Fund's investment adviser, TFAI, and certain affiliates and former employees of TFAI, the SEC staff has indicated that it is likely to take some action against TFAI and certain of its affiliates at the conclusion of the investigation. The potential timing and the scope of any such action is difficult to predict. Although the impact of any action brought against TFAI and/or its affiliates is difficult to assess at the present time, the Fund currently believes that the likelihood that any such action will have a material adverse impact on it is remote. It is important to note that the Fund is not aware of any allegation of wrongdoing against it and its Board at the time this annual report is printed. Although it is not anticipated that these developments will have an adverse impact on the Fund, there can be no assurance at this time. TFAI and its affiliates are actively working with the SEC in regard to this matter; however, the exact resolution cannot be determined at this time. TFAI will take such actions that it deems necessary or appropriate to continue providing management services to the Fund and to bring all matters to an appropriate conclusion.
TFAI and/or its affiliates, and not the Fund, will bear the costs regarding these regulatory matters.
Transamerica IDEX Mutual Funds
Annual Report 2005
13
Report of Independent Registered Certified Public Accounting Firm
To the Board of Trustees and Shareholders of
TA IDEX Marsico Growth
In our opinion, the accompanying statement of assets and liabilities, including the schedule of investments, and the related statements of operations and of changes in net assets and the financial highlights present fairly, in all material respects, the financial position of TA IDEX Marsico Growth (the "Fund") (one of the portfolios constituting the Transamerica IDEX Mutual Funds) at October 31, 2005, the results of its operations for the year then ended, the changes in its net assets for each of the two years in the period then ended and the financial highlights for each of the periods presented, in conformity with accounting principles generally accepted in the United States of America. These financial statements and financial highlights (hereafter referred to as "financial statements") are the responsibility of the Fund's management; our responsibility is to express an opinion on these financial statements based on our audits. We conducted our audits of these financial statements in accordance with the standards of the Public Company Accounting Oversight Board (United States). Those standards require that we plan and perform the audit to obtain reasonable assurance about whether the financial statements are free of material misstatement. An audit includes examining, on a test basis, evidence supporting the amounts and disclosures in the financial statements, assessing the accounting principles used and significant estimates made by management, and evaluating the overall financial statement presentation. We believe that our audits, which included confirmation of securities at October 31, 2005 by correspondence with the custodian, provide a reasonable basis for our opinion.

December 22, 2005
Transamerica IDEX Mutual Funds
Annual Report 2005
14
TA IDEX Marsico International Growth
MARKET ENVIRONMENT
International equities enjoyed robust gains for the period from inception November 8, 2004 through October 31, 2005, helped by strong economic growth in a variety of regions, constrained rates of inflation, and improving corporate profits. During this time, the Morgan Stanley Capital International EAFE Index ("MSCI-EAFE") had a total return of 14.35% – strong performance in its own right and easily surpassing the results in representative U.S. large capitalization equity indexes such as the Standard and Poor's 500 Composite Stock Index, which had a total return of 5.36%. A major underlying factor in the MSCI-EAFE's gain was a resurgent Japanese equity market, which gained nearly 20% during the reporting period.
At an economic sector level, gains were widespread for the period from inception November 8, 2004 through October 31, 2005. All ten sectors in the MSCI-EAFE (Global Industry Classification Standards Classifications ("GICS")) had a positive return during the reporting period. Top-performing areas included materials (+24%), energy (+22%), industrials (+21%), and financials (+17%). Several of the gains in these areas, particularly materials, energy, and industrials, seemed to point towards worldwide economic growth increasing demand for various forms of infrastructure. Other sectors that had notable gains included utilities (+15%), health care (+14%), and consumer staples (+14%). In terms of sector laggards, information technology ("IT") (+1%) struggled to reach positive territory, and telecommunications services (+3%) had a relatively subdued gain.
At an industry level, gains were similarly widespread; only one area had a negative return. Significant gains were common. Top-performing groups included capital goods (+25%), insurance (+20%), diversified financials (+20%), food beverage and tobacco (+19%), and health care equipment and services (+17%). The sole group to be "in the red" was semiconductor and semiconductor equipment, which experienced a decline of –8% during the reporting period.
PERFORMANCE
For the period from inception November 8, 2004 through October 31, 2005, TA IDEX Marsico International Growth, Class I returned 11.49%. By comparison its benchmark, the MSCI-EAFE, returned 14.35%.
STRATEGY REVIEW
During the reporting period, the portfolio's average sector allocations emphasized the consumer discretionary, financials, IT, and health care sectors. The portfolio invested in every GICS economic sector, with the utilities, materials, and telecommunications services sectors averaging a significantly underweighted posture relative to the portfolio's benchmark, the MSCI-EAFE.
The largest individual contributors to the portfolio's performance results included Japanese consumer electronics retailer Yamada Denki Co., Ltd. (US$+130% price return), Mexico's mobile communications provider America Movil, S.A. de C.V. (US$+80%), Swiss pharmaceuticals company Roche Holding Ltd. (US$+21%), and Singapore-based real estate development company CapitaLand Limited (US$+60%). The largest individual detractors from performance included French electronics manufacturer THOMSON (US$–27%) and Japanese software firm Trend Micro Incorporated (US$–37%).
On a sector and industry level, the largest contributors were the telecommunications services, health care (particularly pharmaceuticals and biotechnology), and financials (particularly real estate and banks) sectors. The sectors and industries that had the largest negative impact on performance in the reporting period included the consumer discretionary (particularly consumer services) and IT (particularly software and services) sectors and the insurance industry.
Country allocation that contributed to the portfolio's return included Mexico and Japan, while the stock selection in the United Kingdom and France detracted from performance results.
James G. Gendelman
Fund Manager
Marsico Capital Management, LLC
This Fund is only available for investment by the Asset Allocation Portfolios.
Transamerica IDEX Mutual Funds
Annual Report 2005
1
TA IDEX Marsico International Growth
Comparison of change in value of $10,000 investment in Class I shares and its comparative index.
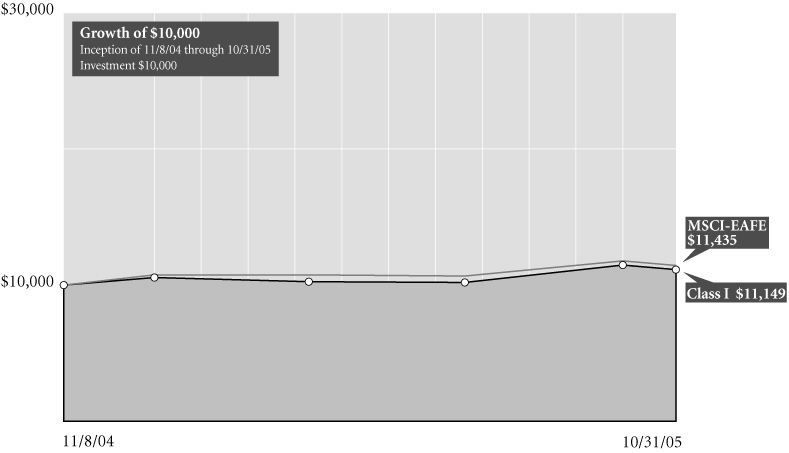
Total Return for Period Ended 10/31/05
| | | From
Inception | | Inception
Date | |
| Class A (NAV) | | | 5.52 | % | | 3/1/05 | |
| Class I (NAV) | | | 11.49 | % | | 11/8/04 | |
| MSCI-EAFE1 | | | 14.35 | % | | 11/8/04 | |
NOTES
1 The Morgan Stanley Capital International – Europe, Australasia and Far East (MSCI-EAFE) Index is a widely recognized unmanaged index used as a general measure of market performance. Calculations assume dividends and capital gains are reinvested and do not include any managerial expenses. From inception calculation is based on life of Class I shares. Source: Standard & Poor's Micropal®© Micropal, Inc. 2005 – 1-800-596-5323 – http://www.funds-sp.com.
The performance data presented represents past performance, future results may vary. Performance data does not reflect the deduction of taxes that would be paid on fund distributions or the redemption of fund shares. Investment return and principal value will fluctuate so that an investor's shares, when redeemed, may be worth more or less than their original cost. Current performance may be lower or higher than performance quoted. Please see www.transamericaidex.com for performance data current to the most recent month-end.
Net Asset Value (NAV) returns include the reinvestment of dividends and capital gains. Class A shares are sold without a sales load.
International investing involves special risks including currency fluctuations, political instability, and different financial accounting standards.
This material must be preceded or accompanied by a current prospectus, which includes specific contents regarding the investment objectives and policies of this fund.
Transamerica IDEX Mutual Funds
Annual Report 2005
2
TA IDEX Marsico International Growth
UNDERSTANDING YOUR FUND'S EXPENSES
(unaudited)
SHAREHOLDER EXPENSES
Fund shareholders may incur ongoing costs, including management fees, 12b-1 distribution and service fees, and other fund expenses. Shares of the fund currently are sold only to certain Transamerica IDEX Mutual Funds and AEGON/Transamerica Series Trust (an affiliate of Transamerica IDEX Mutual Funds) asset allocation funds at net asset value, without any transactional costs.
The following Example is intended to help you understand your ongoing costs (in dollars and cents) of investing in a Fund and to compare these costs with the ongoing costs of investing in other funds.
The Example is based on an investment of $1,000 invested at May 1, 2005 and held for the entire period until October 31, 2005.
ACTUAL EXPENSES
The first line in the table below provides information about actual account values and actual expenses. You may use the information in this line, together with the amount you invested, to estimate the expenses that you paid over the period. Simply divide your account value by $1,000 (for example, an $8,600 account value divided by $1,000 = 8.6), then multiply the result by the number in the first line of your Fund under the heading entitled "Expenses Paid During Period" to estimate the expenses you paid on your account during this period.
HYPOTHETICAL EXAMPLE FOR COMPARISON PURPOSES
The second line in the table below provides information about hypothetical account values and hypothetical expenses based on the Fund's actual expense ratio and an assumed rate of return of 5% per year before expenses, which is not the Fund's actual return. The hypothetical account values and expenses may not be used to estimate the actual ending account balance or expenses you paid for the period. You may use this information to compare the ongoing costs of investing in your Fund and other funds. To do so, compare this 5% hypothetical example with the 5% hypothetical examples that appear in the shareholder reports of the other funds.
Please note that the expenses shown in the table are meant to highlight your ongoing costs only and do not reflect any transactional costs, such as sales charges, redemption fees, brokerage commissions paid on purchases and sales of fund shares. Therefore, the second line under the Fund in the table is useful in comparing ongoing costs only, and will not help you determine the relative total costs of owning different funds.
| | | Beginning
Account
Value | | Ending
Account
Value | | Annualized
Expense
Ratio | | Expenses Paid
During Period (a) | |
| Class A | | | |
| Actual | | $ | 1,000.00 | | | $ | 1,117.90 | | | | 1.58 | % | | $ | 8.43 | | |
| Hypothetical (b) | | | 1,000.00 | | | | 1,017.24 | | | | 1.58 | | | | 8.03 | | |
| Class I | | | |
| Actual | | | 1,000.00 | | | | 1,120.00 | | | | 1.19 | | | | 6.36 | | |
| Hypothetical (b) | | | 1,000.00 | | | | 1,019.21 | | | | 1.19 | | | | 6.06 | | |
(a) Expenses are calculated using each Fund's annualized expense ratio (as disclosed in the table), multiplied by the average account value for the period, multiplied by number of days in the period (184 days), and divided by the number of days in the year (365 days).
(b) 5% return per year before expenses.
GRAPHICAL PRESENTATION OF SCHEDULE OF INVESTMENTS
By Region
At October 31, 2005
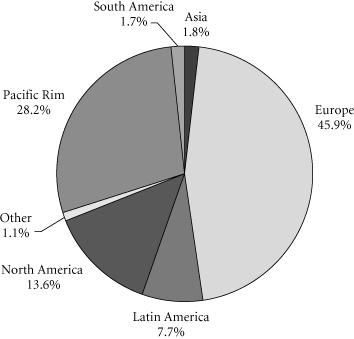
This chart shows the percentage breakdown by region of the Fund's total investment securities.
Transamerica IDEX Mutual Funds
Annual Report 2005
3
TA IDEX Marsico International Growth
SCHEDULE OF INVESTMENTS
At October 31, 2005
(all amounts except share amounts in thousands)
| | | Shares | | Value | |
| PREFERRED STOCKS ( 1.0%) | |
| Germany (1.0%) | |
| Fresenius AG Preferred | | | 28,763 | | | $ | 4,040 | | |
| Total Preferred Stocks (cost: $3,305) | | | | | | | 4,040 | | |
| COMMON STOCKS ( 96.0%) | |
| Australia (1.5%) | |
| CSL, Ltd. | | | 211,504 | | | | 5,931 | | |
| Austria (1.6%) | |
Erste Bank der Oesterreichischen
Sparkassen AG | | | 117,818 | | | | 6,129 | | |
| Bahama Islands (1.2%) | |
| Kerzner International, Ltd. ‡† | | | 83,780 | | | | 4,889 | | |
| Brazil (1.8%) | |
| Natura Cosmeticos SA | | | 28,800 | | | | 1,140 | | |
| Petroleo Brasileiro SA, ADR | | | 96,116 | | | | 6,142 | | |
| Canada (6.5%) | |
| Canadian National Railway Co. † | | | 165,952 | | | | 12,028 | | |
| Shoppers Drug Mart Corp. | | | 265,522 | | | | 8,840 | | |
| Talisman Energy, Inc. | | | 106,886 | | | | 4,738 | | |
| France (8.7%) | |
| JC Decaux SA ‡ | | | 197,936 | | | | 4,047 | | |
| Sanofi-Aventis | | | 73,523 | | | | 5,887 | | |
| Veolia Environnement | | | 254,691 | | | | 10,602 | | |
| Vinci SA | | | 177,473 | | | | 13,869 | | |
| Germany (5.1%) | |
| Continental AG | | | 154,288 | | | | 11,799 | | |
| Hypo Real Estate Holding | | | 169,903 | | | | 8,215 | | |
| Hong Kong (3.1%) | |
| CNOOC, Ltd., ADR | | | 61,169 | | | | 4,019 | | |
| Hang Lung Properties, Ltd. | | | 1,654,825 | | | | 2,370 | | |
| Shangri-La Asia, Ltd. | | | 4,190,000 | | | | 5,864 | | |
| India (1.9%) | |
| ICICI Bank, Ltd., Sponsored ADR | | | 153,374 | | | | 3,627 | | |
| Reliance Industries, Ltd., GDR–144A † | | | 113,809 | | | | 3,848 | | |
| Ireland (1.0%) | |
| Anglo Irish Bank Corp. PLC | | | 284,249 | | | | 3,877 | | |
| Japan (21.0%) | |
| Chugai Pharmaceutical Co., Ltd. | | | 281,000 | | | | 6,134 | | |
| Credit Saison Co., Ltd. | | | 177,000 | | | | 7,987 | | |
| Fanuc, Ltd. | | | 54,826 | | | | 4,288 | | |
| Keyence Corp. | | | 16,200 | | | | 3,709 | | |
| Leopalace21 Corp. | | | 284,788 | | | | 7,343 | | |
| Mitsubishi Tokyo Financial Group, Inc. | | | 636 | | | | 7,926 | | |
| Murata Manufacturing Co., Ltd. | | | 114,300 | | | | 5,668 | | |
| | | Shares | | Value | |
| Japan (continued) | |
| Nippon Electric Glass Co., Ltd. | | | 431,000 | | | $ | 8,205 | | |
| Sumitomo Mitsui Financial Group, Inc. | | | 876 | | | | 8,056 | | |
| Sumitomo Realty & Development Co., Ltd. | | | 505,000 | | | | 8,117 | | |
| Toyota Motor Corp. | | | 176,900 | | | | 8,073 | | |
| Yamada Denki Co., Ltd. | | | 81,700 | | | | 7,141 | | |
| Luxembourg (1.2%) | |
| Stolt Offshore SA ‡ | | | 440,808 | | | | 4,614 | | |
| Mexico (8.3%) | |
| America Movil SA de CV–Class L, ADR | | | 422,351 | | | | 11,087 | | |
| Cemex SA de CV, Sponsored ADR † | | | 253,518 | | | | 13,201 | | |
| Grupo Televisa SA, Sponsored ADR | | | 114,871 | | | | 8,397 | | |
| Singapore (1.4%) | |
| Capitaland, Ltd. | | | 2,945,000 | | | | 5,525 | | |
| South Korea (3.4%) | |
| Hyundai Motor Co., Sponsored GDR–144A † | | | 109,564 | | | | 4,034 | | |
| Samsung Electronics Co., Ltd., GDR–144A | | | 21,358 | | | | 5,703 | | |
| SK Telecom Co., Ltd., ADR † | | | 186,933 | | | | 3,778 | | |
| Sweden (3.3%) | |
| Telefonaktiebolaget LM Ericsson, ADR ‡† | | | 395,327 | | | | 12,971 | | |
| Switzerland (10.3%) | |
| Lonza Group AG † | | | 170,732 | | | | 9,828 | | |
| Roche Holding AG-Genusschein | | | 122,273 | | | | 18,246 | | |
| UBS AG | | | 147,350 | | | | 12,501 | | |
| United Kingdom (13.9%) | |
| ARM Holdings PLC | | | 3,132,618 | | | | 6,032 | | |
| British Energy Group PLC ‡ | | | 515,428 | | | | 4,052 | | |
| Carphone Warehouse Group PLC | | | 1,306,995 | | | | 4,536 | | |
| Diageo PLC | | | 428,259 | | | | 6,332 | | |
| EMI Group PLC | | | 952,705 | | | | 3,610 | | |
| Enterprise Inns PLC | | | 932,485 | | | | 12,870 | | |
| Intercontinental Hotels Group PLC | | | 475,245 | | | | 5,941 | | |
| Reckitt Benckiser PLC | | | 384,538 | | | | 11,622 | | |
| United States (0.8%) | |
| Wynn Resorts, Ltd. ‡† | | | 71,212 | | | | 3,324 | | |
| Total Common Stocks (cost: $352,167) | | | | | | | 378,712 | | |
| | | Principal | | Value | |
| SECURITY LENDING COLLATERAL ( 10.7%) | |
| Debt (9.9%) | |
| Bank Notes (0.7%) | |
Bank of America
3.81%, due 06/07/2006 * | | $ | 1,177 | | | $ | 1,177 | | |
| 3.81%, due 08/10/2006 * | | | 1,168 | | | | 1,168 | | |
Credit Suisse First Boston Corp.
4.11%, due 03/10/2006 * | | | 233 | | | | 233 | | |
The notes to the financial statements are an integral part of this report.
Transamerica IDEX Mutual Funds
Annual Report 2005
4
TA IDEX Marsico International Growth
SCHEDULE OF INVESTMENTS (continued)
At October 31, 2005
(all amounts except share amounts in thousands)
| | | Principal | | Value | |
| Certificates of Deposit (0.7%) | | | |
Canadian Imperial Bank of Commerce
4.07%, due 11/04/2005 * | | $ | 934 | | | $ | 934 | | |
Harris Trust & Savings Bank
3.80%, due 11/04/2005 * | | | 743 | | | | 743 | | |
Rabobank Nederland
4.03%, due 05/31/2006 * | | | 1,168 | | | | 1,168 | | |
| Commercial Paper (2.1%) | | | |
Ciesco LLC
4.00%, due 11/03/2005 | | | 1,166 | | | | 1,166 | | |
General Electric Capital Corp.
3.96%, due 12/05/2005 | | | 934 | | | | 934 | | |
Paradigm Funding LLC–144A
4.01%, due 11/07/2005 | | | 931 | | | | 931 | | |
Park Avenue Receivables Corp.–144A
4.03%, due 12/02/2005 | | | 925 | | | | 925 | | |
Preferred Receivables Corp.–144A
4.04%, due 12/05/2005 | | | 700 | | | | 700 | | |
Ranger Funding Co. LLC–144A
3.99%, due 11/15/2005 | | | 695 | | | | 695 | | |
Sheffield Receivables Corp.–144A
4.01%, due 11/08/2005 | | | 700 | | | | 700 | | |
Yorktown Capital LLC
3.97%, due 11/09/2005 | | | 1,164 | | | | 1,164 | | |
| 3.93%, due 11/17/2005 | | | 1,160 | | | | 1,160 | | |
| Euro Dollar Overnight (2.3%) | | | |
Bank of Montreal
3.79%, due 11/01/2005 | | | 700 | | | | 700 | | |
Barclays
3.80%, due 11/04/2005 | | | 934 | | | | 934 | | |
BNP Paribas
3.83%, due 11/02/2005 | | | 1,401 | | | | 1,401 | | |
Deutsche Bank
3.80%, due 11/02/2005 | | | 2,335 | | | | 2,335 | | |
HSBC Banking/Holdings PLC
3.84%, due 11/07/2005 | | | 700 | | | | 700 | | |
Royal Bank of Scotland
3.76%, due 11/01/2005 | | | 934 | | | | 934 | | |
Svenska Handlesbanken
4.03%, due 11/01/2005 | | | 1,203 | | | | 1,203 | | |
UBS AG
3.80%, due 11/03/2005 | | | 934 | | | | 934 | | |
| Euro Dollar Terms (0.8%) | | | |
Royal Bank of Scotland
4.00%, due 12/12/2005 | | | 934 | | | | 934 | | |
UBS AG
4.02%, due 12/01/2005 | | | 934 | | | | 934 | | |
Wells Fargo
3.96%, due 11/14/2005 | | | 1,401 | | | | 1,401 | | |
| | | Principal | | Value | |
| Promissory Notes (0.3%) | |
Goldman Sachs Group, Inc.
4.02%, due 12/28/2005 | | $ | 981 | | | $ | 981 | | |
| Repurchase Agreements (3.0%) †† | |
Credit Suisse First Boston Corp.
4.10%, dated 10/31/2005 to be
repurchased at $1,592 on 11/01/2005 | | | 1,591 | | | | 1,591 | | |
Goldman Sachs Group, Inc. (The)
4.10%, dated 10/31/2005 to be
repurchased at $3,970 on 11/01/2005 | | | 3,970 | | | | 3,970 | | |
Lehman Brothers, Inc.
4.10%, dated 10/31/2005 to be
repurchased at $110 on 11/01/2005 | | | 110 | | | | 110 | | |
Merrill Lynch & Co.
4.10%, dated 10/31/2005 to be
repurchased at $4,671 on 11/01/2005 | | | 4,670 | | | | 4,670 | | |
Morgan Stanley Dean Witter & Co.
4.17%, dated 10/31/2005 to be
repurchased at $1,400 on 11/01/2005 | | | 1,400 | | | | 1,400 | | |
| | | Shares | | Value | |
| Investment Companies (0.8%) | |
| Money Market Funds (0.8%) | |
American Beacon Fund
1-day yield of 3.81% | | | 1,006,802 | | | $ | 1,007 | | |
Barclays Global Investors
Institutional Money Market Fund
1-day yield of 3.92% | | | 934,009 | | | | 934 | | |
Goldman Sachs Financial Square
Prime Obligations Fund
1-day yield of 3.79% | | | 145,489 | | | | 145 | | |
Merrimac Cash Fund,
Premium Class
1-day yield of 3.70% @ | | | 923,686 | | | | 924 | | |
| Total Security Lending Collateral (cost: $41,940) | | | | | | | 41,940 | | |
| Total Investment Securities (cost: $397,412) | | | | | | $ | 424,692 | | |
| SUMMARY: | |
| Investment securities, at value | | | 107.7 | % | | $ | 424,692 | | |
| Liabilities in excess of other assets | | | (7.7 | )% | | | (30,198 | ) | |
| Net assets | | | 100.0 | % | | $ | 394,494 | | |
The notes to the financial statements are an integral part of this report.
Transamerica IDEX Mutual Funds
Annual Report 2005
5
TA IDEX Marsico International Growth
SCHEDULE OF INVESTMENTS (continued)
At October 31, 2005
(all amounts except share amounts in thousands)
NOTES TO SCHEDULE OF INVESTMENTS:
‡ Non-income producing.
† At October 31, 2005, all or a portion of this security is on loan (see Note 1). The value at October 31, 2005, of all securities on loan is $40,394.
* Floating or variable rate note. Rate is listed as of October 31, 2005.
†† Cash collateral for the Repurchase Agreements, valued at $11,976, that serve as collateral for securities lending are invested in corporate bonds with interest rates and maturity dates ranging from 0.00%–9.86% and 12/31/2005–11/15/2096, respectively.
@ Regulated investment company advised by Investors Bank and Trust Co. ("IBT"). IBT is also the accounting, custody and lending agent for the Fund.
DEFINITIONS:
144A 144A Securities are registered pursuant to Rule 144A of the Securities Act of 1933. These securities are deemed to be liquid for purposes of compliance limitations on holdings of illiquid securities and may be resold as transactions exempt from registration, normally to qualified institutional buyers. At October 31, 2005, these securities aggregated $17,536 or 4.4% of the net assets of the Fund.
ADR American Depositary Receipt
GDR Global Depositary Receipt
| | | Percentage of
Net Assets | | Value | |
| INVESTMENTS BY INDUSTRY: | |
| Commercial Banks | | | 12.8 | % | | $ | 50,331 | | |
| Pharmaceuticals | | | 10.2 | % | | | 40,238 | | |
| Chemicals & Allied Products | | | 6.7 | % | | | 26,439 | | |
| Electronic Components & Accessories | | | 6.1 | % | | | 24,193 | | |
| Real Estate | | | 5.3 | % | | | 20,985 | | |
| Hotels & Other Lodging Places | | | 5.1 | % | | | 20,018 | | |
| Oil & Gas Extraction | | | 5.0 | % | | | 19,512 | | |
| Telecommunications | | | 4.9 | % | | | 19,400 | | |
| Radio & Television Broadcasting | | | 4.8 | % | | | 18,999 | | |
| Construction | | | 3.5 | % | | | 13,869 | | |
| Stone, Clay & Glass Products | | | 3.3 | % | | | 13,201 | | |
| Communications Equipment | | | 3.3 | % | | | 12,971 | | |
| Restaurants | | | 3.3 | % | | | 12,870 | | |
| Automotive | | | 3.1 | % | | | 12,108 | | |
| Railroads | | | 3.0 | % | | | 12,028 | | |
| Rubber & Misc. Plastic Products | | | 3.0 | % | | | 11,799 | | |
| Drug Stores & Proprietary Stores | | | 2.3 | % | | | 8,840 | | |
| Personal Credit Institutions | | | 2.0 | % | | | 7,987 | | |
| Radio, Television & Computer Stores | | | 1.8 | % | | | 7,141 | | |
| Beer, Wine & Distilled Beverages | | | 1.6 | % | | | 6,332 | | |
| Electronic & Other Electric Equipment | | | 1.5 | % | | | 5,703 | | |
| Electric Services | | | 1.0 | % | | | 4,052 | | |
| Business Services | | | 1.0 | % | | | 4,047 | | |
| Instruments & Related Products | | | 0.9 | % | | | 3,709 | | |
| Amusement & Recreation Services | | | 0.9 | % | | | 3,610 | | |
| Residential Building Construction | | | 0.6 | % | | | 2,370 | | |
| Investment securities, at value | | | 97.0 | % | | | 382,752 | | |
| Security lending collateral | | | 10.7 | % | | | 41,940 | | |
| Liabilities in excess of other assets | | | (7.7 | )% | | | (30,198 | ) | |
| Net Assets | | | 100.0 | % | | $ | 394,494 | | |
The notes to the financial statements are an integral part of this report.
Transamerica IDEX Mutual Funds
Annual Report 2005
6
TA IDEX Marsico International Growth
STATEMENT OF ASSETS AND LIABILITIES
At October 31, 2005
(all amounts except per share amounts in thousands)
| Assets: | | | |
Investment securities, at value (cost: $397,412)
(including securities loaned of $40,394) | | $ | 424,692 | | |
| Cash | | | 11,539 | | |
| Foreign currencies (cost: $163) | | | 163 | | |
| Receivables: | |
| Investment securities sold | | | 6,590 | | |
| Interest | | | 24 | | |
| Dividends | | | 240 | | |
| Dividend reclaims receivable | | | 110 | | |
| | | | 443,358 | | |
| Liabilities: | | | |
| Investment securities purchased | | | 6,450 | | |
| Accounts payable and accrued liabilities: | |
| Management and advisory fees | | | 367 | | |
| Distribution and service fees | | | 33 | | |
| Administration fees | | | 7 | | |
| Payable for collateral for securities on loan | | | 41,940 | | |
| Other | | | 67 | | |
| | | | 48,864 | | |
| Net Assets | | $ | 394,494 | | |
| Net Assets Consist of: | | | |
Shares of beneficial interest, unlimited shares
authorized, no par value | | $ | 363,262 | | |
| Undistributed net investment income (loss) | | | 3,283 | | |
Undistributed net realized gain (loss) from investment
securities and foreign currency transactions | | | 676 | | |
| Net unrealized appreciation (depreciation) on: | |
| Investment securities | | | 27,280 | | |
Translation of assets and liabilites denominated in
foreign currencies | | | (7 | ) | |
| Net Assets | | $ | 394,494 | | |
| Net Assets by Class: | | | |
| Class A | | $ | 112,802 | | |
| Class I | | | 281,692 | | |
| Shares Outstanding: | | | |
| Class A | | | 10,171 | | |
| Class I | | | 25,361 | | |
| Net Asset Value and Offering Price Per Share: | | | |
| Class A | | $ | 11.09 | | |
| Class I | | | 11.11 | | |
STATEMENT OF OPERATIONS
For the period ended October 31, 2005 (a)
(all amounts in thousands)
| Investment Income: | | | |
| Interest | | $ | 261 | | |
Dividends (net of withholding taxes on
foreign dividends of $309) | | | 7,644 | | |
| Income from loaned securities–net | | | 34 | | |
| | | | 7,939 | | |
| Expenses: | | | |
| Management and advisory fees | | | 3,003 | | |
| Distribution and service fees: | |
| Class A | | | 222 | | |
| Transfer agent fees: | |
| Class A | | | 1 | | |
| Class I | | | 1 | | |
| Printing and shareholder reports | | | 1 | | |
| Custody fees | | | 245 | | |
| Administration fees | | | 56 | | |
| Legal fees | | | 16 | | |
| Audit fees | | | 22 | | |
| Trustees fees | | | 10 | | |
| Registration fees: | |
| Class A | | | 8 | | |
| Class I | | | 21 | | |
| Other | | | 3 | | |
| Total expenses | | | 3,609 | | |
| Net Investment Income (Loss) | | | 4,330 | | |
| Net Realized Gain (Loss) from: | | | |
| Investment securities | | | 460 | | |
| Foreign currency transactions | | | (260 | ) | |
| | | | 200 | | |
Net Increase (Decrease) in Unrealized
Appreciation (Depreciation) on: | | | |
| Investment securities | | | 27,280 | | |
Translation of assets and liabilities denominated in
foreign currencies | | | (7 | ) | |
| | | | 27,273 | | |
Net Gain (Loss) on Investment Securities and
Foreign Currency Transactions | | | 27,473 | | |
Net Increase (Decrease) in Net Assets Resulting
from Operations | | $ | 31,803 | | |
(a) TA IDEX Marsico International Growth (the "Fund") commenced operations on November 8, 2004. The inception date for the Fund's offering of share Class A was March 1, 2005.
The notes to the financial statements are an integral part of this report.
Transamerica IDEX Mutual Funds
Annual Report 2005
7
TA IDEX Marsico International Growth
STATEMENTS OF CHANGES IN NET ASSETS
For the period ended
(all amounts in thousands)
| | | October 31,
2005 (a) | |
| Increase (Decrease) In Net Assets From: | | | |
| Operations: | | | |
| Net investment income (loss) | | $ | 4,330 | | |
Net realized gain (loss) from
investment securities and
foreign currency transactions | | | 200 | | |
Net unrealized appreciation
(depreciation) on investment
securities and foreign currency
translation | | | 27,273 | | |
| | | | 31,803 | | |
| Distributions to Shareholders: | | | |
| From net investment income: | |
| Class I | | | (573 | ) | |
| | | | (573 | ) | |
| Capital Share Transactions: | | | |
| Proceeds from shares sold: | |
| Class A | | | 105,209 | | |
| Class I | | | 257,482 | | |
| | | | 362,691 | | |
Dividends and distributions
reinvested: | |
| Class I | | | 573 | | |
| | | | 573 | | |
| | | | 363,264 | | |
| Net increase (decrease) in net assets | | | 394,494 | | |
| Net Assets: | | | |
| Beginning of period | | | – | | |
| End of period | | $ | 394,494 | | |
Undistributed Net Investment Income
(Loss) | | $ | 3,283 | | |
| | | October 31,
2005 (a) | |
| Share Activity: | | | |
| Shares issued: | |
| Class A | | | 10,171 | | |
| Class I | | | 25,305 | | |
| | | | 35,476 | | |
Shares issued–reinvested from
distributions: | |
| Class I | | | 56 | | |
| | | | 56 | | |
Net increase (decrease) in shares
outstanding: | |
| Class A | | | 10,171 | | |
| Class I | | | 25,361 | | |
| | | | 35,532 | | |
(a) TA IDEX Marsico International Growth (the "Fund") commenced operations on November 8, 2004. The inception date for the Fund's offering of share Class A was March 1, 2005.
The notes to the financial statements are an integral part of this report.
Transamerica IDEX Mutual Funds
Annual Report 2005
8
TA IDEX Marsico International Growth
FINANCIAL HIGHLIGHTS
| | | | | For a share of beneficial interest outstanding throughout the period | |
| | | | | Net Asset | | Investment Operations | | Distributions | | Net Asset | |
| | | For the
Period
Ended (d)(g) | | Value,
Beginning
of Period | | Net
Investment
Income (Loss) | | Net Realized
and Unrealized
Gain (Loss) | | Total
Operations | | From Net
Investment
Income | | From Net
Realized
Gains | | Total
Distributions | | Value,
End
of Period | |
| Class A | | 10/31/2005 | | $ | 10.51 | | | $ | 0.11 | | | $ | 0.47 | | | $ | 0.58 | | | $ | – | | | $ | – | | | $ | – | | | $ | 11.09 | | |
| Class I | | 10/31/2005 | | | 10.00 | | | | 0.16 | | | | 0.99 | | | | 1.15 | | | | (0.04 | ) | | | – | | | | (0.04 | ) | | | 11.11 | | |
| | | | | | | Ratios/Supplemental Data | |
| | | For the
Period | | Total | | Net Assets,
End of
Period | | Ratio of Expenses
to Average
Net Assets (a) | | Net Investment
Income (Loss)
to Average | | Portfolio
Turnover | |
| | | Ended (g) | | Return (c) | | (000's) | | Net (e) | | Total (f) | | Net Assets (a) | | Rate (b) | |
| Class A | | 10/31/2005 | | | 5.52 | % | | $ | 112,802 | | | | 1.54 | % | | | 1.54 | % | | | 1.50 | % | | | 145 | % | |
| Class I | | 10/31/2005 | | | 11.49 | | | | 281,692 | | | | 1.18 | | | | 1.18 | | | | 1.52 | | | | 145 | | |
NOTES TO FINANCIAL HIGHLIGHTS
(a) Annualized.
(b) Not annualized.
(c) Total Return has been calculated for the applicable period without deduction of a sales load, if any, on an initial purchase. Periods of less than one year are not annualized.
(d) Per share information is calculated based on average number of shares outstanding.
(e) Ratio of Net Expenses to Average Net Assets is net of fee waivers and reimbursements by the investment adviser, if any (see note 2).
(f) Ratio of Total Expenses to Average Net Assets includes all expenses before fee waivers and reimbursements by the investment adviser.
(g) TA IDEX Marsico International Growth ("the Fund") commenced operations on November 8, 2004. The inception date for the Fund's offering of share Class A was March 01, 2005.
The notes to the financial statements are an integral part of this report.
Transamerica IDEX Mutual Funds
Annual Report 2005
9
TA IDEX Marsico International Growth
NOTES TO FINANCIAL STATEMENTS
At October 31, 2005
(all amounts in thousands)
NOTE 1. ORGANIZATION AND SIGNIFICANT ACCOUNTING POLICIES
Transamerica IDEX Mutual Funds is an open-end management investment company registered under the Investment Company Act of 1940, as amended (the "1940 Act"). TA IDEX Marsico International Growth (the "Fund") began operations on November 8, 2004.
In the normal course of business, the Fund enters into contracts that contain a variety of representations that provide general indemnifications. The Fund's maximum exposure under these arrangements is unknown, as this would involve future claims that may be made against the Fund and/or its affiliates that have not yet occurred. However, based on experience, the Fund expects the risk of loss to be remote.
This report should be read in conjunction with the current Fund prospectus, which contains more complete information about the Fund.
The following is a summary of significant accounting policies followed by the Fund in the preparation of the financial statements. In preparing the Fund's financial statements in accordance with accounting principles generally accepted in the United States of America ("GAAP"), estimates or assumptions (which could differ from actual results) may be used that affect reported amounts and disclosures.
Multiple class operations, income and expenses: The Fund currently offers two classes of shares, Class A and Class I, each with a public offering price that reflects different sales charges, if any, and expense levels. The initial sales charge currently is waived as this Fund is available for investment only by certain strategic asset allocation funds. Income, non-class specific expenses and realized and unrealized gains and losses, are allocated daily to each class, based upon the value of shares outstanding method as permitted under Rule 18f-3 of the 1940 Act. Each class bears its own specific expenses as well as a portion of general, common expenses.
Class I shares are offered for investment to the asset allocation funds of AEGON/Transamerica Series Trust (ATST).
Security valuations: The Fund values its investments at the close of the New York Stock Exchange ("NYSE"), normally 4 p.m. ET, each day the NYSE is open for business. Fund investments are valued at the last sale price or closing price on the day of valuation taken from the primary exchange where the security is principally traded.
Securities traded in the over-the-counter market and listed securities for which no sale was reported on that date are valued at the last quoted bid price.
Debt securities are valued based on a price quotation or other equivalent indication of value supplied by an exchange, a pricing service or a major market maker; however, those that mature in sixty days or less are valued at amortized cost, which approximates market.
Investment company securities are valued at the net asset value of the underlying portfolio.
Foreign securities generally are valued based on quotations from the primary market in which they are traded. Because many foreign securities markets and exchanges close prior to the close of the NYSE, closing prices for foreign securities in those markets or on those exchanges do not reflect the events that occur after that close. If a significant market event impacting the value of a portfolio security (e.g., natural disaster, company announcement, market volatility) occurs subsequent to the close of trading in the security, but prior to the calculation of the Fund's net asset value per share, market quotations for that security may be determined to be unreliable and, accordingly, not "readily available." As a result, foreign equity securities held by the Fund may be valued at fair market value as determined in good faith by the Fund's Administrative Valuation Committee, under the supervision of the B oard's Valuation Committee, using guidelines adopted by the Board of Trustees.
Other securities for which quotations are not readily available or whose values have been determined to be unreliable are valued at fair market value as determined in good faith by the Fund's Administrative Valuation Committee, under the supervision of the Board's Valuation Committee, using guidelines adopted by the Board of Trustees.
Cash: The Fund may leave cash overnight in its cash account with the custodian, Investors Bank & Trust Company ("IBT"). IBT has been contracted on behalf of the Fund to invest the excess cash into a savings account, which at October 31, 2005, was paying an interest rate of 2.76%.
Repurchase agreements: The Fund is authorized to enter into repurchase agreements. The Fund, through its custodian, IBT, receives delivery of the underlying securities, the value of which at the time of purchase is required to be an amount equal to at least 100% of the resale price. The Fund will bear the risk of value fluctuations until the security can be sold and may encounter delays and incur costs in liquidating the security. In the event of bankruptcy or insolvency of the seller, delays and costs may be incurred.
Securities lending: The Fund may lend securities to qualified borrowers, with IBT acting as the Fund's lending agent. The Fund earns negotiated lenders' fees. The Fund receives cash and/or securities as collateral against the loaned securities. Cash collateral received is invested in short term, interest bearing securities. The Fund monitors the market value of securities loaned on a daily basis and requires collateral in an amount at least equal to the value of the securities loaned. Income from loaned securities on the Statement of Operations is net of fees, in the amount of $15, earned by IBT for its services.
Security transactions and investment income: Security transactions are recorded on the trade date. Security gains and losses are calculated on the specific identification basis. Dividend income, if any, is recorded
Transamerica IDEX Mutual Funds
Annual Report 2005
10
TA IDEX Marsico International Growth
NOTES TO FINANCIAL STATEMENTS (continued)
At October 31, 2005
(all amounts in thousands)
NOTE 1.–(continued)
on the ex-dividend date or, in the case of foreign securities, as soon as the Fund is informed of the ex-dividend date. Interest income, including accretion of discounts and amortization of premiums, is recorded on the accrual basis commencing on the settlement date.
Foreign currency denominated investments: The accounting records of the Fund are maintained in U.S. dollars. Securities and other assets and liabilities denominated in foreign currencies are translated into U.S. dollars at the closing exchange rate each day. The cost of foreign securities is translated at the exchange rate in effect when the investment was acquired. The Fund combines fluctuations from currency exchange rates and fluctuations in value when computing net realized and unrealized gains or losses from investments.
Net foreign currency gains and losses resulting from changes in exchange rates include: 1) foreign currency fluctuations between trade date and settlement date of investment security transactions; 2) gains and losses on forward foreign currency contracts; and 3) the difference between the receivable amounts of interest and dividends recorded in the accounting records in U.S. dollars and the amounts actually received.
Foreign currency denominated assets may involve risks not typically associated with domestic transactions. These risks include revaluation of currencies, adverse fluctuations in foreign currency values and possible adverse political, social and economic developments, including those particular to a specific industry, country or region.
Foreign capital gains taxes: The Fund may be subject to taxes imposed by countries in which it invests, with respect to its investment in issuers existing or operating in such countries. Such taxes are generally based on income earned or repatriated and capital gains realized on the sale of such investments. The Fund accrues such taxes when the related income or capital gains are earned. Some countries require governmental approval for the repatriation of investment income, capital or the proceeds of sales earned by foreign investors. In addition, if there is deterioration in a country's balance of payments or for other reasons, a country may impose temporary restrictions on foreign capital remittances abroad.
Forward foreign currency contracts: The Fund may enter into forward foreign currency contracts to hedge against exchange rate risk arising from investments in securities denominated in foreign currencies. Contracts are valued at the contractual forward rate and are marked to market daily, with the change in value recorded as an unrealized gain or loss. When the contracts are settled a realized gain or loss is incurred. Risks may arise from changes in market value of the underlying currencies and from the possible inability of counterparties to meet the terms of their contracts.
There were no open forward foreign currency contracts at October 31, 2005.
Redemption fees: A short-term trading redemption fee may be assessed on any Fund shares in a fund account that are sold during the first five (5) NYSE trading days following their purchase date. This redemption fee will equal 2% of the amount redeemed and shares held the longest will be treated as being redeemed first and shares held the shortest as being redeemed last. For the period from inception through October 31, 2005, the Fund received no redemption fees.
Dividend distributions: Distributions to shareholders are recorded on the ex-dividend date and are determined in accordance with Federal income tax regulations which may differ from GAAP.
NOTE 2. RELATED PARTY TRANSACTIONS
Effective January 1, 2005 AEGON/Transamerica Fund Advisors, Inc. was renamed Transamerica Fund Advisors, Inc. ("TFAI"); AEGON/Transamerica Fund Services, Inc. and AEGON/Transamerica Investor Services, Inc. merged into one entity and was renamed Transamerica Fund Services, Inc. ("TFS").
TFAI is the Fund's investment adviser. TFS is the Fund's administrator and transfer agent. AFSG Securities Corp. ("AFSG") is the Fund's distributor/principal underwriter. TFAI, TFS , and AFSG are affiliates of AEGON, NV, a Netherlands corporation.
The following schedule reflects the percentage of fund assets owned by affiliated mutual funds:
| | | Net
Assets | | % of
Net Assets | |
TA IDEX Asset Allocation–
Conservative Portfolio | | $ | 3,900 | | | | 0.99 | % | |
TA IDEX Asset Allocation–
Growth Portfolio | | | 35,594 | | | | 9.02 | % | |
TA IDEX Asset Allocation–
Moderate Growth Portfolio | | | 44,490 | | | | 11.28 | % | |
TA IDEX Asset Allocation–
Moderate Portfolio | | | 28,789 | | | | 7.30 | % | |
| Asset Allocation–Conservative Portfolio | | | 14,274 | | | | 3.62 | % | |
| Asset Allocation–Growth Portfolio | | | 76,832 | | | | 19.48 | % | |
Asset Allocation–Moderate
Growth Portfolio | | | 133,000 | | | | 33.71 | % | |
| Asset Allocation–Moderate Portfolio | | | 57,615 | | | | 14.60 | % | |
| Total | | $ | 394,494 | | | | 100.00 | % | |
Investment advisory fees: The Fund pays management fees to TFAI based on average daily net assets ("ANA") at the following breakpoints:
1.06% of the first $300 million of ANA
1.01% of the next $100 million of ANA
0.96% of the next $600 million of ANA
0.91% of ANA over $1 billion
Transamerica IDEX Mutual Funds
Annual Report 2005
11
TA IDEX Marsico International Growth
NOTES TO FINANCIAL STATEMENTS (continued)
At October 31, 2005
(all amounts in thousands)
NOTE 2.–(continued)
TFAI has contractually agreed to waive its advisory fee and will reimburse the Fund to the extent that operating expenses exceed the following stated annual limit:
From November 8, 2004 through May 27, 2005:
1.31% Expense Limit (including 12b-1 fees)
From May 28, 2005 on:
1.31% Expense Limit (excluding 12b-1 fees)
If total Fund expenses fall below the annual expense limitation agreement agreed to by the adviser within the succeeding three years, the Fund may be required to pay that adviser a portion or all of the reimbursed class expenses.
There were no amounts recaptured during the period from inception through October 31, 2005. There were no amounts available for recapture at October 31, 2005.
Distribution and service fees: The Fund has a 12b-1 distribution plan under the 1940 Act pursuant to which an annual fee, based on average daily net assets, is paid to the distributor for various disbursements such as broker-dealer account servicing fees and other promotional expenses of the Fund. The Fund is authorized under the 12b-1 plan to pay fees on each class up to the following limits:
| Class A | | | 0.35 | % | |
| Class I | | | N/A | | |
In the case the Fund or a class of shares of the Fund is closed to new investors or investments, the Fund is authorized to pay 12b-1 fees for past sales and distribution efforts and present and past investor services.
Administrative services: The Fund has entered into an agreement with TFS for financial and legal fund administration services. As of January 1, 2005 the Fund pays TFS an annual fee of 0.02% of ANA. Prior to January 1, 2005 the Fund paid TFS an annual fee of 0.015% of ANA. The Legal fees on the Statement of Operations are for fees paid to external legal counsel.
Transfer agent fees: The Fund pays TFS an annual per-account charge for each open and closed account. The Fund paid TFS less than $1 for the period from inception through October 31, 2005.
Deferred compensation plan: Each eligible independent Fund Trustee may elect to participate in a non-qualified deferred compensation plan maintained by Transamerica IDEX Mutual Funds (the "Plan"). Under the Plan, such Trustees may defer payment of all or a portion of their total fees earned as a Fund Trustee. Each Trustee who is a participant in the Plan may elect that the earnings, losses or gains credited to his or her deferred fee amounts be determined based on a deemed investment in any series of Transamerica IDEX Mutual Funds, including the Fund. The right of a participant to receive a distribution from the Plan of the deferred fees is an unsecured claim against the general assets of all s eries of Transamerica IDEX Mutual Funds. At October 31, 2005, there were no invested plan amounts.
NOTE 3. INVESTMENT TRANSACTIONS
The cost of securities purchased and proceeds from securities sold (excluding short-term securities) for the period from inception through October 31, 2005, were as follows:
| Purchases of securities: | | | |
| Long-Term | | $ | 743,268 | | |
| U.S. Government | | | – | | |
| Proceeds from maturities and sales of securities: | | | |
| Long-Term | | | 388,256 | | |
| U.S. Government | | | – | | |
NOTE 4. FEDERAL INCOME TAX MATTERS
The Fund has not made any provision for federal income or excise taxes due to its policy to distribute all of its taxable income and capital gains to its shareholders and otherwise qualify as a regulated investment company under Subchapter M of the Internal Revenue Code. Income and capital gain distributions are determined in accordance with income tax regulations, which may differ from GAAP. These differences are primarily due to differing treatment for items including, but not limited to, wash sales and foreign currency transactions.
Therefore, distributions determined in accordance with tax regulations may differ significantly in amount or character from net investment income and realized gains for financial reporting purposes. Financial reporting records are adjusted for permanent book/tax differences to reflect tax character. Financial records are not adjusted for temporary differences. These reclassifications are as follows:
Shares of beneficial interest, unlimited
shares authorized | | $ | (2 | ) | |
| Undistributed net investment income (loss) | | | (474 | ) | |
Undistributed net realized gain (loss) from investment
securities | | | 476 | | |
The tax character of distributions paid may differ from the character of distributions shown in the Statement of Changes in Net Assets due to short-term gains being treated as ordinary income for tax purposes. The tax character of distributions paid during 2005 was as follows:
| 2005 Distributions paid from: | |
| Ordinary Income | | $ | 573 | | |
| Long-term capital gain | | | – | | |
Transamerica IDEX Mutual Funds
Annual Report 2005
12
TA IDEX Marsico International Growth
NOTES TO FINANCIAL STATEMENTS (continued)
At October 31, 2005
(all amounts in thousands)
NOTE 4.–(continued)
The tax basis components of distributable earnings as of October 31, 2005, are as follows:
| Undistributed Ordinary Income | | $ | 5,663 | | |
| Undistributed Long-term Capital Gains | | $ | 120 | | |
| Capital Loss Carryforward | | $ | – | | |
| Net Unrealized Appreciation (Depreciation) | | $ | 25,449 | * | |
* Amount includes unrealized gain/loss from foreign currency.
The aggregate cost of investments and composition of unrealized appreciation (depreciation) for federal income tax purposes as of October 31, 2005, are as follows:
| Federal Tax Cost Basis | | $ | 399,236 | | |
| Unrealized Appreciation | | $ | 35,216 | | |
| Unrealized (Depreciation) | | | (9,760 | ) | |
| Net Unrealized Appreciation (Depreciation) | | $ | 25,456 | | |
NOTE 5. REGULATORY PROCEEDINGS
There continues to be significant federal and state regulatory activity relating to financial services companies, particularly mutual fund companies and their investment advisers. As part of an ongoing investigation regarding potential market timing, recordkeeping and trading compliance issues and matters affecting the Fund's investment adviser, TFAI, and certain affiliates and former employees of TFAI, the SEC staff has indicated that it is likely to take some action against TFAI and certain of its affiliates at the conclusion of the investigation. The potential timing and the scope of any such action is difficult to predict. Although the impact of any action brought against TFAI and/or its affiliates is difficult to assess at the present time, the Fund currently believes that the likelihood that any such action will have a material adverse impact on it is remote. It is important to note that the Fund is not aware of any allegation of wrongdoing against it and its Board at the time this annual report is printed. Although it is not anticipated that these developments will have an adverse impact on the Fund, there can be no assurance at this time. TFAI and its affiliates are actively working with the SEC in regard to this matter; however, the exact resolution cannot be determined at this time. TFAI will take such actions that it deems necessary or appropriate to continue providing management services to the Fund and to bring all matters to an appropriate conclusion.
TFAI and/or its affiliates, and not the Fund, will bear the costs regarding these regulatory matters.
Transamerica IDEX Mutual Funds
Annual Report 2005
13
Report of Independent Registered Certified Public Accounting Firm
To the Board of Trustees and Shareholders of
TA IDEX Marsico International Growth
In our opinion, the accompanying statement of assets and liabilities, including the schedule of investments, and the related statements of operations and of changes in net assets and the financial highlights present fairly, in all material respects, the financial position of TA IDEX Marsico International Growth (the "Fund") (one of the portfolios constituting the Transamerica IDEX Mutual Funds) at October 31, 2005, the results of its operations , the changes in its net assets and the financial highlights for the period November 8, 2004 (commencement of operations) through October 31, 2005, in conformity with accounting principles generally accepted in the United States of America. These financial statements and financial highlights (hereafter referred to as "financial statements") are the responsibility of the Fund's management; our responsibility is to express an opinion on these financial stateme nts based on our audit. We conducted our audit of these financial statements in accordance with the standards of the Public Company Accounting Oversight Board (United States). Those standards require that we plan and perform the audit to obtain reasonable assurance about whether the financial statements are free of material misstatement. An audit includes examining, on a test basis, evidence supporting the amounts and disclosures in the financial statements, assessing the accounting principles used and significant estimates made by management, and evaluating the overall financial statement presentation. We believe that our audit, which included confirmation of securities at October 31, 2005 by correspondence with the custodian, provide a reasonable basis for our opinion.

December 22, 2005
Transamerica IDEX Mutual Funds
Annual Report 2005
14
TA IDEX Marsico International Growth (unaudited)
A discussion regarding the basis of Transamerica IDEX Mutual Funds' Board of Trustees' approval of the fund's advisory arrangements will be available in the fund's semi-annual report for the period ending April 30, 2006.
Transamerica IDEX Mutual Funds
Annual Report 2005
15
TA IDEX Marsico International Growth
SUPPLEMENTAL INFORMATION (unaudited)
TAX INFORMATION
For dividends paid during the year ended October 31, 2005, the Fund designated $6,504 as qualified dividend income.
The information and distributions reported herein may differ from the information and distributions taxable to the shareholders for the calendar year ending December 31, 2005. Complete information will be computed and reported in conjunction with your 2005 Form 1099-DIV.
Transamerica IDEX Mutual Funds
Annual Report 2005
16
TA IDEX Mercury Large Cap Value
MARKET ENVIRONMENT
Most of the major U.S. equity market indexes posted modest gains between March 1, 2005, TA IDEX Mercury Large Cap Value's date of inception, and October 31, 2005. Large-cap growth stocks outperformed their large-cap value counterparts during the same period, with the Russell 1000 Growth Index rising 3.62%, while the Russell 1000 Value Index ("Russell 1000 Value") was up 1.53%.
The recurring themes in the market environment during the period were rising short-term interest rates and higher energy prices. The Federal Reserve Board ("Fed") raised the target federal funds from 2.50% to 3.75% in five increments of 25 basis points (.25%). (The Fed subsequently approved another 25 basis-point increase on November 1.) In addition, oil prices rose to record levels above $70.00 per barrel in September in response to the damage that Hurricane Katrina caused to several key refineries along the U.S. Gulf coast. Even before this catastrophic disaster occurred, an extended period of rising energy prices had been fueled by the limited ability of Organization of the Petroleum Exporting Countries ("OPEC") to increase output; inadequate oil refining and natural gas drilling capacity in the U.S.; and growing demand in Asia, particularly from China and India. Energy prices fell in mid to late October as some of the damage d Gulf coast refineries resumed operations and demand declined somewhat.
We believe that a slowdown in the overall economic growth pattern in the U.S. most likely has begun. The equity market may not have fully discounted that yet and, therefore, remains at some risk within this longer-term trading range. The inflation scare could continue until it is clear that the economy is slowing and the Fed has some visibility to discontinue the short-term interest rate increases once inflationary expectations subside.
Stock prices have moved up somewhat after reaching oversold levels. We will see if there is any sustainability to the advance, but we believe that the higher interest rates on the long end of the yield curve, as well as on the short end, and continued hawkish talk on the part of the Fed will prevent equities from moving significantly higher.
PERFORMANCE
For the period from inception March 1, 2005 to October 31, 2005, TA IDEX Mercury Large Cap Value, Class A returned 2.80%. By comparison its benchmark, the Russell 1000 Value returned 1.53%.
STRATEGY REVIEW
The portfolio outperformed its benchmark, the Russell 1000 Value, for the period. Stock selection in financials (Lehman Brothers Holdings Inc., Prudential Financial, Inc.) enhanced the comparative performance. The relative return also benefited from effective security selection in energy: (Sunoco, Inc., Burlington Resources Inc. and Valero Energy Corporation); healthcare: (AmerisourceBergen Corporation and CIGNA Corporation); consumer discretionary: (Nordstrom, Inc. and MGM Mirage); and materials: (Phelps Dodge Corporation). Overweight positions in information technology ("IT") and energy also had a positive impact on the performance versus the benchmark. Conversely, stock selection in IT (QLogic Corporation, VeriSign, Inc.) slightly detracted from the comparative performance. The relative return also was hindered by an overweight position in healthcare, and underweights in the consumer staples, financial and utility sectors.
For some time now, the portfolio's pro-cyclical bias has benefited performance, so we maintain this strategy. At the end of the fiscal year, the portfolio was overweight versus the benchmark in IT, energy and healthcare, and had underweights in the financial, telecommunication services, utility, consumer staples, and industrial sectors.
Robert C. Doll, Jr., CFA
Fund Manager
Mercury Advisors
This Fund is only available for investment by the Asset Allocation Portfolios.
Transamerica IDEX Mutual Funds
Annual Report 2005
1
TA IDEX Mercury Large Cap Value
Comparison of change in value of $10,000 investment in TA IDEX Mercury Large Cap Value (the "Fund") and its comparative index.
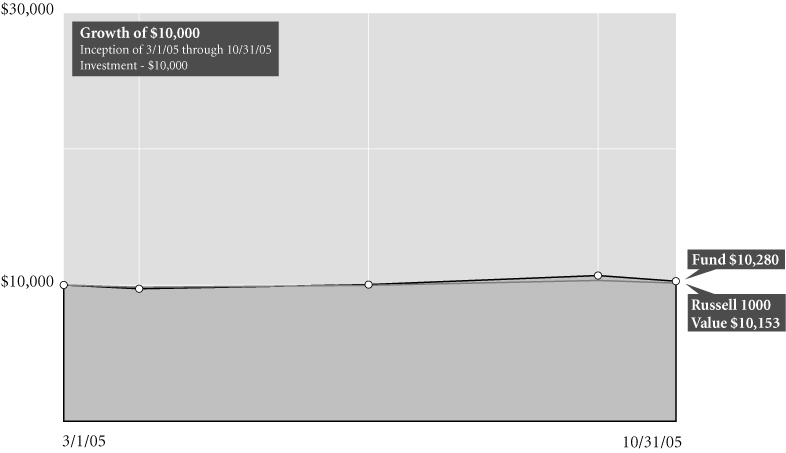
Total Return for Period Ended 10/31/05
| | | From
Inception | | Inception
Date | |
| Fund (NAV) | | | 2.80 | % | | | 3/1/05 | | |
| Russell 1000 Value1 | | | 1.53 | % | | | 3/1/05 | | |
NOTES
1 The Russell 1000 Value (Russell 1000 Value) Index is an unmanaged index used as a general measure of market performance. Calculations assume dividends and capital gains are reinvested and do not include any managerial expenses. From inception calculation is based on life of the Fund. Source: Standard & Poor's Micropal®© Micropal, Inc. 2005 – 1-800-596-5323 – http://www.funds-sp.com.
The performance data presented represents past performance, future results may vary. Performance data does not reflect the deduction of taxes that would be paid on fund distributions or the redemption of fund shares. Investment return and principal value will fluctuate so that an investor's shares, when redeemed, may be worth more or less than their original cost. Current performance may be lower or higher than performance quoted. Please see www.transamericaidex.com for performance data current to the most recent month-end.
Net Asset Value (NAV) returns include the reinvestment of dividends and capital gains. Fund shares are sold without a sales load.
This material must be preceded or accompanied by a current prospectus, which includes specific contents regarding the investment objectives and policies of this fund.
Transamerica IDEX Mutual Funds
Annual Report 2005
2
TA IDEX Mercury Large Cap Value
UNDERSTANDING YOUR FUND'S EXPENSES
(unaudited)
SHAREHOLDER EXPENSES
Fund shareholders may incur ongoing costs, including management fees, 12b-1 distribution and service fees, and other fund expenses. Shares of the fund currently are sold only to certain Transamerica IDEX Mutual Funds and AEGON/Transamerica Series Trust (an affiliate of Transamerica IDEX Mutual Funds) asset allocation funds at net asset value, without any transactional costs.
The following Example is intended to help you understand your ongoing costs (in dollars and cents) of investing in a Fund and to compare these costs with the ongoing costs of investing in other funds.
The Example is based on an investment of $1,000 invested at May 1, 2005 and held for the entire period until October 31, 2005.
ACTUAL EXPENSES
The first line in the table below provides information about actual account values and actual expenses. You may use the information in this line, together with the amount you invested, to estimate the expenses that you paid over the period. Simply divide your account value by $1,000 (for example, an $8,600 account value divided by $1,000 = 8.6), then multiply the result by the number in the first line of your Fund under the heading entitled "Expenses Paid During Period" to estimate the expenses you paid on your account during this period.
HYPOTHETICAL EXAMPLE FOR COMPARISON PURPOSES
The second line in the table below provides information about hypothetical account values and hypothetical expenses based on the Fund's actual expense ratio and an assumed rate of return of 5% per year before expenses, which is not the Fund's actual return. The hypothetical account values and expenses may not be used to estimate the actual ending account balance or expenses you paid for the period. You may use this information to compare the ongoing costs of investing in your Fund and other funds. To do so, compare this 5% hypothetical example with the 5% hypothetical examples that appear in the shareholder reports of the other funds.
Please note that the expenses shown in the table are meant to highlight your ongoing costs only and do not reflect any transactional costs, such as sales charges, redemption fees, brokerage commissions paid on purchases and sales of fund shares. Therefore, the second line under the Fund in the table is useful in comparing ongoing costs only, and will not help you determine the relative total costs of owning different funds.
| | | Beginning
Account
Value | | Ending
Account
Value | | Annualized
Expense
Ratio | | Expenses Paid
During Period (a) | |
| Class A | |
| Actual | | $ | 1,000.00 | | | $ | 1,104.20 | | | | 1.25 | % | | $ | 6.63 | | |
| Hypothetical (b) | | | 1,000.00 | | | | 1,018.90 | | | | 1.25 | | | | 6.36 | | |
(a) Expenses are calculated using each Fund's annualized expense ratio (as disclosed in the table), multiplied by the average account value for the period, multiplied by number of days in the period (184 days), and divided by the number of days in the year (365 days).
(b) 5% return per year before expenses.
GRAPHICAL PRESENTATION OF SCHEDULE OF INVESTMENTS
By Sector
At October 31, 2005
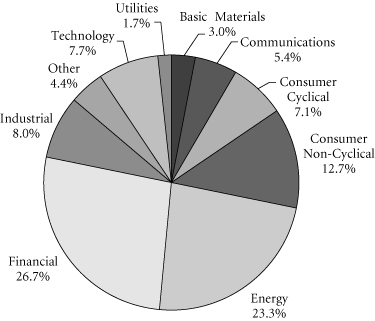
This chart shows the percentage breakdown by sector of the Fund's total investment securities.
Transamerica IDEX Mutual Funds
Annual Report 2005
3
TA IDEX Mercury Large Cap Value
SCHEDULE OF INVESTMENTS
At October 31, 2005
(all amounts except share amounts in thousands)
| | | Shares | | Value | |
| COMMON STOCKS (99.7%) | |
| Aerospace (2.9%) | |
| Goodrich Corp. | | | 75,000 | | | $ | 2,705 | | |
| Lockheed Martin Corp. | | | 50,000 | | | | 3,028 | | |
| Northrop Grumman Corp. | | | 81,000 | | | | 4,346 | | |
| Apparel & Accessory Stores (1.6%) | |
| American Eagle Outfitters | | | 110,000 | | | | 2,590 | | |
| Nordstrom, Inc. | | | 90,000 | | | | 3,118 | | |
| Automotive (0.2%) | |
| Ford Motor Co. | | | 66,000 | | | | 549 | | |
| Automotive Dealers & Service Stations (0.8%) | |
| AutoNation, Inc. ‡ | | | 143,000 | | | | 2,843 | | |
| Business Credit Institutions (0.3%) | |
| CIT Group, Inc. | | | 22,000 | | | | 1,006 | | |
| Chemicals & Allied Products (1.1%) | |
| Eastman Chemical Co. | | | 71,000 | | | | 3,746 | | |
| Commercial Banks (3.0%) | |
| Bank of America Corp. | | | 75,000 | | | | 3,280 | | |
| Citigroup, Inc. | | | 148,000 | | | | 6,775 | | |
| JP Morgan Chase & Co. | | | 13,000 | | | | 476 | | |
| Communication (1.6%) | |
| Viacom, Inc.–Class B | | | 178,000 | | | | 5,513 | | |
| Communications Equipment (2.2%) | |
| Motorola, Inc. | | | 196,000 | | | | 4,343 | | |
| Scientific-Atlanta, Inc. | | | 94,000 | | | | 3,331 | | |
| Computer & Data Processing Services (5.6%) | |
| Checkfree Corp. ‡† | | | 87,000 | | | | 3,697 | | |
| Compuware Corp. ‡ | | | 450,000 | | | | 3,641 | | |
| Fair Isaac Corp. | | | 76,000 | | | | 3,174 | | |
| McAfee, Inc. ‡ | | | 47,000 | | | | 1,411 | | |
| NCR Corp. ‡ | | | 26,000 | | | | 786 | | |
| Oracle Corp. ‡ | | | 236,000 | | | | 2,992 | | |
| Sabre Holdings Corp. | | | 141,000 | | | | 2,754 | | |
| Sybase, Inc. ‡ | | | 53,000 | | | | 1,179 | | |
| Computer & Office Equipment (3.3%) | |
| Apple Computer, Inc. ‡ | | | 60,000 | | | | 3,455 | | |
| Hewlett-Packard Co. | | | 288,000 | | | | 8,076 | | |
| Department Stores (2.4%) | |
| Federated Department Stores, Inc. | | | 68,000 | | | | 4,173 | | |
| JC Penney Co., Inc. | | | 79,000 | | | | 4,045 | | |
| Electric Services (1.7%) | |
| American Electric Power Co., Inc. | | | 106,000 | | | | 4,024 | | |
| CMS Energy Corp. ‡† | | | 5,000 | | | | 75 | | |
| Edison International | | | 19,000 | | | | 831 | | |
| Northeast Utilities | | | 62,000 | | | | 1,128 | | |
| | | Shares | | Value | |
| Electrical Goods (0.9%) | |
| Avnet, Inc. ‡† | | | 139,000 | | | $ | 3,204 | | |
| Electronic & Other Electric Equipment (0.6%) | |
| Energizer Holdings, Inc. ‡† | | | 45,000 | | | | 2,272 | | |
| Electronic Components & Accessories (1.6%) | |
| Intersil Corp.–Class A | | | 90,000 | | | | 2,048 | | |
| QLogic Corp. ‡ | | | 92,000 | | | | 2,775 | | |
| Solectron Corp. ‡ | | | 208,000 | | | | 734 | | |
| Food & Kindred Products (0.2%) | |
| Archer-Daniels-Midland Co. | | | 24,000 | | | | 585 | | |
| Health Services (1.8%) | |
| Caremark Rx, Inc. ‡ | | | 70,000 | | | | 3,668 | | |
| HCA, Inc. | | | 56,000 | | | | 2,699 | | |
| Industrial Machinery & Equipment (0.2%) | |
| Cooper Cameron Corp. ‡ | | | 8,000 | | | | 590 | | |
| Instruments & Related Products (2.2%) | |
| Agilent Technologies, Inc. ‡ | | | 104,000 | | | | 3,329 | | |
| Raytheon Co. | | | 49,000 | | | | 1,811 | | |
| Rockwell Automation, Inc. | | | 48,000 | | | | 2,551 | | |
| Insurance (14.4%) | |
| Aetna, Inc. | | | 42,000 | | | | 3,720 | | |
| Allstate Corp. (The) | | | 103,000 | | | | 5,437 | | |
| American Financial Group, Inc. | | | 53,000 | | | | 1,812 | | |
| Chubb Corp. | | | 48,000 | | | | 4,463 | | |
| Cigna Corp. | | | 39,000 | | | | 4,519 | | |
| Loews Corp. | | | 43,000 | | | | 3,998 | | |
| MGIC Investment Corp. | | | 48,000 | | | | 2,844 | | |
| PMI Group, Inc. (The) | | | 97,000 | | | | 3,868 | | |
| Principal Financial Group | | | 86,000 | | | | 4,268 | | |
| Progressive Corp. (The) | | | 31,000 | | | | 3,590 | | |
| SAFECO Corp. | | | 69,000 | | | | 3,843 | | |
| St. Paul Travelers Cos., Inc. (The) | | | 114,000 | | | | 5,133 | | |
| UnumProvident Corp. | | | 140,000 | | | | 2,841 | | |
| Insurance Agents, Brokers & Service (1.3%) | |
| Hartford Financial Services Group, Inc. (The) | | | 57,000 | | | | 4,546 | | |
| Iron & Steel Foundries (0.8%) | |
| Precision Castparts Corp. | | | 61,000 | | | | 2,889 | | |
| Life Insurance (4.3%) | |
| Lincoln National Corp. | | | 79,000 | | | | 3,998 | | |
| Metlife, Inc. | | | 96,000 | | | | 4,743 | | |
| Nationwide Financial Services–Class A | | | 14,000 | | | | 565 | | |
| Prudential Financial, Inc. | | | 77,000 | | | | 5,605 | | |
| Metal Mining (1.0%) | |
| Phelps Dodge Corp. | | | 29,000 | | | | 3,494 | | |
The notes to the financial statements are an integral part of this report.
Transamerica IDEX Mutual Funds
Annual Report 2005
4
TA IDEX Mercury Large Cap Value
SCHEDULE OF INVESTMENTS (continued)
At October 31, 2005
(all amounts except share amounts in thousands)
| | | Shares | | Value | |
| Mortgage Bankers & Brokers (1.0%) | |
| Countrywide Financial Corp. | | | 110,000 | | | $ | 3,495 | | |
| Oil & Gas Extraction (8.4%) | |
| Anadarko Petroleum Corp. | | | 52,000 | | | | 4,717 | | |
| Apache Corp. | | | 71,000 | | | | 4,532 | | |
| Burlington Resources, Inc. | | | 73,000 | | | | 5,272 | | |
| Devon Energy Corp. | | | 85,000 | | | | 5,132 | | |
| Kerr-McGee Corp. | | | 48,000 | | | | 4,082 | | |
| Occidental Petroleum Corp. | | | 70,000 | | | | 5,522 | | |
| Petroleum Refining (15.7%) | |
| Amerada Hess Corp. | | | 33,000 | | | | 4,128 | | |
| Chevron Corp. | | | 66,000 | | | | 3,767 | | |
| ConocoPhillips | | | 137,000 | | | | 8,957 | | |
| Exxon Mobil Corp. | | | 423,000 | | | | 23,747 | | |
| Marathon Oil Corp. | | | 79,000 | | | | 4,753 | | |
| Sunoco, Inc. | | | 51,000 | | | | 3,800 | | |
| Valero Energy Corp. | | | 52,000 | | | | 5,472 | | |
| Pharmaceuticals (10.2%) | |
| AmerisourceBergen Corp. † | | | 53,000 | | | | 4,042 | | |
| Cardinal Health, Inc. | | | 40,000 | | | | 2,500 | | |
| Invitrogen Corp. ‡†* | | | 41,000 | | | | 2,607 | | |
| McKesson Corp. | | | 55,000 | | | | 2,499 | | |
| Medco Health Solutions, Inc. ‡ | | | 64,000 | | | | 3,616 | | |
| Merck & Co., Inc. | | | 219,000 | | | | 6,180 | | |
| Pfizer, Inc. | | | 559,000 | | | | 12,153 | | |
| Watson Pharmaceuticals, Inc. ‡ | | | 53,000 | | | | 1,832 | | |
| Primary Metal Industries (1.1%) | |
| Nucor Corp. | | | 64,000 | | | | 3,830 | | |
| Railroads (0.7%) | |
| CSX Corp. | | | 50,000 | | | | 2,291 | | |
| Residential Building Construction (1.6%) | |
| Lennar Corp.–Class A | | | 53,000 | | | | 2,946 | | |
| Ryland Group, Inc. | | | 41,000 | | | | 2,759 | | |
| Savings Institutions (1.2%) | |
| Astoria Financial Corp. | | | 16,000 | | | | 447 | | |
| Washington Mutual, Inc. | | | 96,000 | | | | 3,802 | | |
| Security & Commodity Brokers (3.4%) | |
| Goldman Sachs Group, Inc. (The) | | | 50,000 | | | | 6,319 | | |
| Lehman Brothers Holdings, Inc. † | | | 45,000 | | | | 5,385 | | |
| Telecommunications (0.4%) | |
| Qwest Communications International ‡ | | | 328,000 | | | | 1,430 | | |
| Total Common Stocks (cost: $327,734) | | | | | | | 347,546 | | |
| | | Principal | | Value | |
| SECURITY LENDING COLLATERAL (4.5%) | |
| Debt (4.2%) | |
| Bank Notes (0.3%) | |
Bank of America
| |
| 3.81%, due 06/07/2006 * | | $ | 441 | | | $ | 441 | | |
| 3.81%, due 08/10/2006 * | | | 437 | | | | 437 | | |
Credit Suisse First Boston Corp.
4.11%, due 03/10/2006 * | | | 88 | | | | 88 | | |
| Certificates Of Deposit (0.3%) | |
Canadian Imperial Bank of Commerce
4.07%, due 11/04/2005 * | | | 350 | | | | 350 | | |
Harris Trust & Savings Bank
3.80%, due 11/04/2005 * | | | 278 | | | | 278 | | |
Rabobank Nederland
4.03%, due 05/31/2006 * | | | 437 | | | | 437 | | |
| Commercial Paper (0.9%) | |
Ciesco LLC
4.00%, due 11/03/2005 | | | 437 | | | | 437 | | |
General Electric Capital Corp.
3.96%, due 12/05/2005 | | | 350 | | | | 350 | | |
Paradigm Funding LLC–144A
4.01%, due 11/07/2005 | | | 349 | | | | 349 | | |
Park Avenue Receivables Corp.–144A
4.03%, due 12/02/2005 | | | 346 | | | | 346 | | |
Preferred Receivables Corp.–144A
4.04%, due 12/05/2005 | | | 263 | | | | 263 | | |
Ranger Funding Co. LLC–144A
3.99%, due 11/15/2005 | | | 260 | | | | 260 | | |
Sheffield Receivables Corp.–144A
4.01%, due 11/08/2005 | | | 263 | | | | 263 | | |
Yorktown Capital LLC
3.97%, due 11/09/2005
3.93%, due 11/17/2005 | | | 436
435 | | | | 436
435 | | |
| Euro Dollar Overnight (1.0%) | |
Bank of Montreal
3.79%, due 11/01/2005 | | | 262 | | | | 262 | | |
Barclays
3.80%, due 11/04/2005 | | | 350 | | | | 350 | | |
BNP Paribas
3.83%, due 11/02/2005 | | | 525 | | | | 525 | | |
Deutsche Bank
3.80%, due 11/02/2005 | | | 875 | | | | 875 | | |
HSBC Banking/Holdings PLC
3.84%, due 11/07/2005 | | | 262 | | | | 262 | | |
Royal Bank of Scotland
3.76%, due 11/01/2005 | | | 350 | | | | 350 | | |
The notes to the financial statements are an integral part of this report.
Transamerica IDEX Mutual Funds
Annual Report 2005
5
TA IDEX Mercury Large Cap Value
SCHEDULE OF INVESTMENTS (continued)
At October 31, 2005
(all amounts except share amounts in thousands)
| | | Principal | | Value | |
| Euro Dollar Overnight (continued) | |
Svenska Handlesbanken
4.03%, due 11/01/2005 | | $ | 451 | | | $ | 451 | | |
UBS AG
3.80%, due 11/03/2005 | | | 350 | | | | 350 | | |
| Euro Dollar Terms (0.3%) | |
Royal Bank of Scotland
4.00%, due 12/12/2005 | | | 350 | | | | 350 | | |
UBS AG
4.02%, due 12/01/2005 | | | 350 | | | | 350 | | |
Wells Fargo
3.96%, due 11/14/2005 | | | 525 | | | | 525 | | |
| Promissory Notes (0.1%) | |
Goldman Sachs Group, Inc.
4.02%, due 12/28/2005 | | | 367 | | | | 367 | | |
| Repurchase Agreements (1.3%) †† | |
Credit Suisse First Boston Corp.
4.10%, dated 10/31/2005 to be repurchased
at $596 on 11/01/2005 | | | 596 | | | | 596 | | |
Goldman Sachs Group, Inc. (The)
4.10%, dated 10/31/2005 to be repurchased
at $1,487 on 11/01/2005 | | | 1,487 | | | | 1,487 | | |
Lehman Brothers, Inc.
4.10%, dated 10/31/2005 to be repurchased
at $41 on 11/01/2005 | | | 41 | | | | 41 | | |
| | | Principal | | Value | |
| Repurchase Agreements (continued) | |
Merrill Lynch & Co.
4.10%, dated 10/31/2005 to be repurchased
at $1,750 on 11/01/2005 | | $ | 1,750 | | | $ | 1,750 | | |
Morgan Stanley Dean Witter & Co.
4.17%, dated 10/31/2005 to be repurchased
at $525 on 11/01/2005 | | | 525 | | | | 525 | | |
| | | Shares | | Value | |
| Investment Companies (0.3%) | |
| Money Market Funds (0.3%) | |
American Beacon Fund
1-day yield of 3.81% | | | 377,230 | | | $ | 377 | | |
Barclays Global Investors Institutional
Money Market Fund
1-day yield of 3.92% | | | 349,956 | | | | 350 | | |
Goldman Sachs Financial Square
Prime Obligations Fund
1-day yield of 3.79% | | | 54,512 | | | | 55 | | |
Merrimac Cash Fund, Premium Class
1-day yield of 3.70% @ | | | 346,088 | | | | 346 | | |
| Total Security Lending Collateral (cost: $15,714) | | | | | | | 15,714 | | |
| Total Investment Securities (cost: $343,448) | | | | | | $ | 363,260 | | |
| SUMMARY: | |
| Investment securities, at value | | | 104.2 | % | | $ | 363,260 | | |
| Liabilities in excess of other assets | | | (4.2 | )% | | | (14,678 | ) | |
| Net assets | | | 100.0 | % | | $ | 348,582 | | |
NOTES TO SCHEDULE OF INVESTMENTS:
‡ Non-income producing.
† At October 31, 2005, all or a portion of this security is on loan (see Note 1). The value at October 31, 2005, of all securities on loan is $15,207.
* Floating or variable rate note. Rate is listed as of October 31, 2005.
†† Cash collateral for the Repurchase Agreements, valued at $4,487, that serve as collateral for securities lending are invested in corporate bonds with interest rates and maturity dates ranging from 0.00%–9.86% and 12/31/2005–11/15/2096, respectively.
@ Regulated investment company advised by Investors Bank and Trust Co. ("IBT"). IBT is also the accounting, custody and lending agent for the Fund.
DEFINITIONS:
144A 144A Securities are registered pursuant to Rule 144A of the Securities Act of 1933. These securities are deemed to be liquid for purposes of compliance limitations on holdings of illiquid securities and may be resold as transactions exempt from registration, normally to qualified institutional buyers. At October 31, 2005, these securities aggregated $1,481 or 0.4% of the net assets of the Fund.
The notes to the financial statements are an integral part of this report.
Transamerica IDEX Mutual Funds
Annual Report 2005
6
TA IDEX Mercury Large Cap Value
STATEMENT OF ASSETS AND LIABILITIES
At October 31, 2005
(all amounts except per share amounts in thousands)
| Assets: | |
Investment securities, at value (cost: $343,448)
(including securities loaned of $15,207) | | $ | 363,260 | | |
| Cash | | | 1,922 | | |
| Receivables: | |
| Investment securities sold | | | 3,078 | | |
| Shares of beneficial interest sold | | | 429 | | |
| Interest | | | 5 | | |
| Dividends | | | 210 | | |
| | | | 368,904 | | |
| Liabilities: | |
| Investment securities purchased | | | 4,224 | | |
| Accounts payable and accrued liabilities: | |
| Management and advisory fees | | | 231 | | |
| Distribution and service fees | | | 102 | | |
| Administration fees | | | 6 | | |
| Payable for collateral for securities on loan | | | 15,714 | | |
| Other | | | 45 | | |
| | | | 20,322 | | |
| Net Assets | | $ | 348,582 | | |
| Net Assets Consist of: | |
Shares of beneficial interest, unlimited shares
authorized, no par value | | $ | 330,687 | | |
| Undistributed net investment income (loss) | | | 221 | | |
Accumulated net realized gain (loss) from investment
securities | | | (2,138 | ) | |
Net unrealized appreciation (depreciation) on
investment securities | | | 19,812 | | |
| Net Assets | | $ | 348,582 | | |
| Shares Outstanding | | | 33,898 | | |
| Net Asset Value and Offering Price Per Share | | $ | 10.28 | | |
STATEMENT OF OPERATIONS
For the period ended October 31, 2005 (a)
(all amounts in thousands)
| Investment Income: | |
| Interest | | $ | 74 | | |
| Dividends | | | 2,317 | | |
| Income from loaned securities–net | | | 15 | | |
| | | | 2,406 | | |
| Expenses: | |
| Management and advisory fees | | | 1,561 | | |
| Distribution and service fees | | | 687 | | |
| Transfer agent fees | | | 1 | | |
| Printing and shareholder reports | | | 1 | | |
| Custody fees | | | 26 | | |
| Administration fees | | | 39 | | |
| Legal fees | | | 13 | | |
| Audit fees | | | 15 | | |
| Trustees fees | | | 8 | | |
| Registration fees | | | 26 | | |
| Other | | | 3 | | |
| Net expenses | | | 2,380 | | |
| Net Investment Income (Loss) | | | 26 | | |
| Net Realized and Unrealized Gain (Loss): | |
| Realized gain (loss) from investment securities | | | (2,138 | ) | |
Increase (decrease) in unrealized appreciation
(depreciation) on investment securities | | | 19,812 | | |
| Net Gain (Loss) on Investment Securities | | | 17,674 | | |
Net Increase (Decrease) in Net Assets Resulting
from Operations | | $ | 17,700 | | |
(a) Commenced operations on March 1, 2005.
The notes to the financial statements are an integral part of this report.
Transamerica IDEX Mutual Funds
Annual Report 2005
7
TA IDEX Mercury Large Cap Value
STATEMENTS OF CHANGES IN NET ASSETS
For the period ended
(all amounts in thousands)
| | | | | October 31,
2005 (a) | |
| Increase (Decrease) In Net Assets From: | |
| Operations: | |
| Net investment income (loss) | | | | $ | 26 | | |
Net realized gain (loss) from
investment securities | | | | | (2,138 | ) | |
Net unrealized appreciation
(depreciation) on investment
securities | | | | | 19,812 | | |
| | | | | | 17,700 | | |
| Capital Share Transactions: | |
| Proceeds from shares sold | | | | | 330,882 | | |
| | | | | | 330,882 | | |
| Net increase (decrease) in net assets | | | | | 348,582 | | |
| Net Assets: | |
| Beginning of period | | | | | – | | |
| End of period | | | | $ | 348,582 | | |
Undistributed Net Investment Income
(Loss) | | | | $ | 221 | | |
| Share Activity: | |
| Shares issued | | | | | 33,898 | | |
| | | | | | 33,898 | | |
Net increase (decrease) in shares
outstanding | | | | | 33,898 | | |
| | | | | | 33,898 | | |
(a) Commenced operations on March 1, 2005.
The notes to the financial statements are an integral part of this report.
Transamerica IDEX Mutual Funds
Annual Report 2005
8
TA IDEX Mercury Large Cap Value
FINANCIAL HIGHLIGHTS
| | | | | For a share of beneficial interest outstanding throughout the period | |
| | | | | Net Asset | | Investment Operations | | Distributions | | Net Asset | |
| | | For the
Period
Ended (d)(g) | | Value,
Beginning
of Period | | Net
Investment
Income (Loss) | | Net Realized
and Unrealized
Gain (Loss) | | Total
Operations | | From Net
Investment
Income | | From Net
Realized
Gains | | Total
Distributions | | Value,
End
of Period | |
| | 10/31/2005 | | $ | 10.00 | | | $ | – | (h) | | $ | 0.28 | | | $ | 0.28 | | | $ | – | | | $ | – | | | $ | – | | | $ | 10.28 | | |
| | | | | | | Ratios/Supplemental Data | |
| | | For the
Period | | Total | | Net Assets,
End of
Period | | Ratio of Expenses
to Average
Net Assets (a) | | Net Investment
Income (Loss)
to Average | | Portfolio
Turnover | |
| | | Ended (g) | | Return (c) | | (000's) | | Net (e) | | Total (f) | | Net Assets (a) | | Rate (b) | |
| | 10/31/2005 | | | 2.80 | % | | $ | 348,582 | | | | 1.21 | % | | | 1.21 | % | | | 0.01 | % | | | 49 | % | |
NOTES TO FINANCIAL HIGHLIGHTS
(a) Annualized.
(b) Not annualized.
(c) Total Return has been calculated for the applicable period without deduction of a sales load, if any, on an initial purchase. Periods of less than one year are not annualized.
(d) Per share information is based on average number of shares outstanding.
(e) Ratio of Net Expenses to Average Net Assets is net of fee waivers and reimbursements by the investment adviser, if any (see note 2).
(f) Ratio of Total Expenses to Average Net Assets includes all expenses before fee waivers and reimbursements by the investment adviser.
(g) TA IDEX Mercury Large Cap Value ("the Fund") commenced operations on March 1, 2005.
(h) Rounds to less than 0.01% per share.
The notes to the financial statements are an integral part of this report.
Transamerica IDEX Mutual Funds
Annual Report 2005
9
TA IDEX Mercury Large Cap Value
NOTES TO FINANCIAL STATEMENTS
At October 31, 2005
(all amounts in thousands)
NOTE 1. ORGANIZATION AND SIGNIFICANT ACCOUNTING POLICIES
Transamerica IDEX Mutual Funds is an open-end management investment company registered under the Investment Company Act of 1940, as amended (the "1940 Act"). TA IDEX Mercury Large Cap Value (the "Fund") began operations on March 1, 2005.
In the normal course of business, the Fund enters into contracts that contain a variety of representations that provide general indemnifications. The Fund's maximum exposure under these arrangements is unknown, as this would involve future claims that may be made against the Fund and/or its affiliates that have not yet occurred. However, based on experience, the Fund expects the risk of loss to be remote.
This report should be read in conjunction with the current Fund prospectus, which contains more complete information about the Fund.
The following is a summary of significant accounting policies followed by the Fund in the preparation of the financial statements. In preparing the Fund's financial statements in accordance with accounting principles generally accepted in the United States of America ("GAAP"), estimates or assumptions (which could differ from actual results) may be used that affect reported amounts and disclosures.
The initial sales charge currently is waived as this Fund is available for investment only by certain strategic asset allocation funds.
Security valuations: The Fund values its investments at the close of the New York Stock Exchange ("NYSE"), normally 4 p.m. ET, each day the NYSE is open for business. Fund investments are valued at the last sale price or closing price on the day of valuation taken from the primary exchange where the security is principally traded.
Securities traded in the over-the-counter market and listed securities for which no sale was reported on that date are valued at the last quoted bid price.
Debt securities are valued based on a price quotation or other equivalent indication of value supplied by an exchange, a pricing service or a major market maker; however, those that mature in sixty days or less are valued at amortized cost, which approximates market.
Investment company securities are valued at the net asset value of the underlying portfolio.
Other securities for which quotations are not readily available or whose values have been determined to be unreliable are valued at fair market value as determined in good faith by the Fund's Administrative Valuation Committee, under the supervision of the Board's Valuation Committee, using guidelines adopted by the Board of Trustees.
Cash: The Fund may leave cash overnight in its cash account with the custodian, Investors Bank & Trust Company ("IBT"). IBT has been contracted on behalf of the Fund to invest the excess cash into a savings account, which at October 31, 2005, was paying an interest rate of 2.76%.
Repurchase agreements: The Fund is authorized to enter into repurchase agreements. The Fund, through its custodian, IBT, receives delivery of the underlying securities, the value of which at the time of purchase is required to be an amount equal to at least 100% of the resale price. The Fund will bear the risk of value fluctuations until the security can be sold and may encounter delays and incur costs in liquidating the security. In the event of bankruptcy or insolvency of the seller, delays and costs may be incurred.
Securities lending: The Fund may lend securities to qualified borrowers, with IBT acting as the Fund's lending agent. The Fund earns negotiated lenders' fees. The Fund receives cash and/or securities as collateral against the loaned securities. Cash collateral received is invested in short term, interest bearing securities. The Fund monitors the market value of securities loaned on a daily basis and requires collateral in an amount at least equal to the value of the securities loaned. Income from loaned securities on the Statement of Operations is net of fees, in the amount of $6, earned by IBT for its services.
Security transactions and investment income: Security transactions are recorded on the trade date. Security gains and losses are calculated on the specific identification basis. Dividend income, if any, is recorded on the ex-dividend date or, in the case of foreign securities, as soon as the Fund is informed of the ex-dividend date. Interest income, including accretion of discounts and amortization of premiums, is recorded on the accrual basis commencing on the settlement date.
Redemption fees: A short-term trading redemption fee may be assessed on any Fund shares in a fund account that are sold during the first five (5) NYSE trading days following their purchase date. This redemption fee will equal 2% of the amount redeemed and shares held the longest will be treated as being redeemed first and shares held the shortest as being redeemed last. For the period from inception through October 31, 2005, the Fund received no redemption fees.
Dividend distributions: Distributions to shareholders are recorded on the ex-dividend date and are determined in accordance with Federal income tax regulations which may differ from GAAP.
NOTE 2. RELATED PARTY TRANSACTIONS
Effective January 1, 2005 AEGON/Transamerica Fund Advisors, Inc. was renamed Transamerica Fund Advisors, Inc. ("TFAI"); AEGON/Transamerica Fund Services, Inc. and AEGON/Transamerica Investor Services, Inc. merged into one entity and was renamed Transamerica Fund Services, Inc. ("TFS").
Transamerica IDEX Mutual Funds
Annual Report 2005
10
TA IDEX Mercury Large Cap Value
NOTES TO FINANCIAL STATEMENTS (continued)
At October 31, 2005
(all amounts in thousands)
NOTE 2.–(continued)
TFAI is the Fund's investment adviser. TFS is the Fund's administrator and transfer agent. AFSG Securities Corp. ("AFSG") is the Fund's distributor/principal underwriter. TFAI, TFS , and AFSG are affiliates of AEGON, NV, a Netherlands corporation.
The following schedule represents the percentage of Fund assets owned by affiliated mutual funds:
| | | Net
Assets | | % of
Net Assets | |
TA IDEX Asset Allocation–
Growth Portfolio | | $ | 154,307 | | | | 44.27 | % | |
TA IDEX Asset Allocation–
Moderate Growth Portfolio | | | 193,646 | | | | 55.55 | % | |
| Total | | $ | 347,953 | | | | 99.82 | % | |
Investment advisory fees: The Fund pays management fees to TFAI based on average daily net assets ("ANA") at the following breakpoints:
0.80% of the first $250 million of ANA
0.775% of the next $500 million of ANA
0.75% of ANA over $750 million
TFAI has contractually agreed to waive its advisory fee and will reimburse the Fund to the extent that operating expenses exceed the following stated annual limit:
From March 1, 2005 through May 27, 2005:
1.00% Expense Limit (including 12b-1 fees)
From May 28, 2005 on:
1.00% Expense Limit (excluding 12b-1 fees)
If total fund expenses fall below the annual expense limitation agreement agreed to by the adviser within the succeeding three years, the Fund may be required to pay that adviser a portion or all of the reimbursed class expenses.
There were no amounts recaptured during the period from inception through October 31, 2005. There are no amounts subject to recapture at October 31, 2005.
Distribution and service fees: The Fund has a 12b-1 distribution plan under the 1940 Act pursuant to which an annual fee, based on average daily net assets, is paid to the distributor for various disbursements such as broker-dealer account servicing fees and other promotional expenses of the Fund. The Fund is authorized under the 12b-1 plan to pay fees on each class up to the following limits:
In the case the Fund or a class of shares of the Fund is closed to new investors or investments, the Fund is authorized to pay 12b-1 fees for past sales and distribution efforts and present and past investor services.
Administrative services: The Fund has entered into an agreement with TFS for financial and legal fund administration services. The Fund pays TFS an annual fee of 0.02% of ANA. The Legal fees on the Statement of Operations are for fees paid to external legal counsel.
Transfer agent fees: The Fund pays TFS an annual per-account charge for each open and closed account. The Fund paid TFS $1 for the period from inception through October 31, 2005.
Deferred compensation plan: Each eligible independent Fund Trustee may elect to participate in a non-qualified deferred compensation plan maintained by Transamerica IDEX Mutual Funds (the "Plan"). Under the Plan, such Trustees may defer payment of all or a portion of their total fees earned as a Fund Trustee. Each Trustee who is a participant in the Plan may elect that the earnings, losses or gains credited to his or her deferred fee amounts be determined based on a deemed investment in any series of Transamerica IDEX Mutual Funds, including the Fund. The right of a participant to receive a distribution from the Plan of the deferred fees is an unsecured claim against the general assets of all series of Transamerica IDEX Mutual Funds. At October 31, 2005, there were no invested plan amounts.
NOTE 3. INVESTMENT TRANSACTIONS
The cost of securities purchased and proceeds from securities sold (excluding short-term securities) for the period from inception through October 31, 2005, were as follows:
| Purchases of securities: | |
| Long-Term | | $ | 469,334 | | |
| U.S. Government | | | – | | |
| Proceeds from maturities and sales of securities: | |
| Long-Term | | | 139,462 | | |
| U.S. Government | | | – | | |
NOTE 4. FEDERAL INCOME TAX MATTERS
The Fund has not made any provision for federal income or excise taxes due to its policy to distribute all of its taxable income and capital gains to its shareholders and otherwise qualify as a regulated investment company under Subchapter M of the Internal Revenue Code. Income and capital gain distributions are determined in accordance with income tax regulations, which may differ from GAAP. These differences are primarily due to differing treatment for items including, but not limited to, wash sales and net operating losses.
Therefore, distributions determined in accordance with tax regulations may differ significantly in amount or character from net investment income and realized gains for financial reporting purposes. Financial reporting records are adjusted for permanent book/tax differences to reflect tax character. Financial records are not adjusted for temporary differences. These reclassifications are as follows:
Shares of beneficial interest, unlimited
shares authorized | | $ | (195 | ) | |
| Undistributed net investment income (loss) | | | 195 | | |
Transamerica IDEX Mutual Funds
Annual Report 2005
11
TA IDEX Mercury Large Cap Value
NOTES TO FINANCIAL STATEMENTS (continued)
At October 31, 2005
(all amounts in thousands)
NOTE 4.–(continued)
The capital loss carryforwards are available to offset future realized capital gains through the periods listed:
Capital Loss
Carryforward | | Available Through | |
| $ | 2,099 | | | October 31, 2013 | |
The tax basis components of distributable earnings as of October 31, 2005, are as follows:
| Undistributed Ordinary Income | | $ | 221 | | |
| Undistributed Long-term Capital Gains | | $ | – | | |
| Capital Loss Carryforward | | $ | (2,099 | ) | |
| Net Unrealized Appreciation (Depreciation) | | $ | 19,773 | | |
The aggregate cost of investments and composition of unrealized appreciation (depreciation) for federal income tax purposes as of October 31, 2005, are as follows:
| Federal Tax Cost Basis | | $ | 343,487 | | |
| Unrealized Appreciation | | $ | 31,282 | | |
| Unrealized (Depreciation) | | | (11,509 | ) | |
| Net Unrealized Appreciation (Depreciation) | | $ | 19,773 | | |
NOTE 5. REGULATORY PROCEEDINGS
There continues to be significant federal and state regulatory activity relating to financial services companies, particularly mutual fund companies and their investment advisers. As part of an ongoing investigation regarding potential market timing, recordkeeping and trading compliance issues and matters affecting the Fund's investment adviser, TFAI, and certain affiliates and former employees of TFAI, the SEC staff has indicated that it is likely to take some action against TFAI and certain of its affiliates at the conclusion of the investigation. The potential timing and the scope of any such action is difficult to predict. Although the impact of any action brought against TFAI and/or its affiliates is difficult to assess at the present time, the Fund currently believes that the likelihood that any such action will have a material adverse impact on it is remote. It is important to note that the Fund is not aware of any allega tion of wrongdoing against it and its Board at the time this annual report is printed. Although it is not anticipated that these developments will have an adverse impact on the Fund, there can be no assurance at this time. TFAI and its affiliates are actively working with the SEC in regard to this matter; however, the exact resolution cannot be determined at this time. TFAI will take such actions that it deems necessary or appropriate to continue providing management services to the Fund and to bring all matters to an appropriate conclusion.
TFAI and/or its affiliates, and not the Fund, will bear the costs regarding these regulatory matters.
Transamerica IDEX Mutual Funds
Annual Report 2005
12
Report of Independent Registered Certified Public Accounting Firm
To the Board of Trustees and Shareholders of
TA IDEX Mercury Large Cap Value
In our opinion, the accompanying statement of assets and liabilities, including the schedule of investments, and the related statements of operations and of changes in net assets and the financial highlights present fairly, in all material respects, the financial position of TA IDEX Mercury Large Cap Value (the "Fund") (one of the portfolios constituting the Transamerica IDEX Mutual Funds) at October 31, 2005, the results of its operations , the changes in its net assets and the financial highlights for the period March 1, 2005 (commencement of operations) through October 31, 2005, in conformity with accounting principles generally accepted in the United States of America. These financial statements and financial highlights (hereafter referred to as "financial statements") are the responsibility of the Fund's management; our responsibility is to express an opinion on these financial statements based on our audit. We conducted ou r audit of these financial statements in accordance with the standards of the Public Company Accounting Oversight Board (United States). Those standards require that we plan and perform the audit to obtain reasonable assurance about whether the financial statements are free of material misstatement. An audit includes examining, on a test basis, evidence supporting the amounts and disclosures in the financial statements, assessing the accounting principles used and significant estimates made by management, and evaluating the overall financial statement presentation. We believe that our audit, which included confirmation of securities at October 31, 2005 by correspondence with the custodian, provide a reasonable basis for our opinion.

December 22, 2005
Transamerica IDEX Mutual Funds
Annual Report 2005
13
TA IDEX Mercury Large Cap Value (unaudited)
A discussion regarding the basis of Transamerica IDEX Mutual Funds' Board of Trustees' approval of the fund's advisory arrangements will be available in the fund's semi-annual report for the period ending April 30, 2006.
Transamerica IDEX Mutual Funds
Annual Report 2005
14
TA IDEX PIMCO Real Return TIPS
MARKET ENVIRONMENT
At the start of the reporting period all fixed income sectors gained, as mortgages, corporates, and emerging market bonds outperformed. In early 2005 the fixed income market gave up prior gains, as bonds lost ground due to volatile interest rates and weakness in the credit markets related to concerns about the financial outlook for General Motors Corporation.
By the middle of the period, bonds rebounded, as risk appetites for credit-sensitive assets revived. The unusual phenomenon of falling longer-dated yields amid a tightening cycle of increasing federal funds, dubbed a "conundrum" by Federal Reserve Board ("Fed") Chairman Alan Greenspan, was driven by: 1) weakness in manufacturing data signaling a potential slow down in the U.S. economy; 2) Asian central banks buying Treasuries to keep their currencies from appreciating versus the U.S. dollar; and 3) demand from U.S. pension funds looking to reduce the mismatch between their assets and liabilities. Towards the end of the twelve month period much of the rebound was given up as Treasury yields trended higher on signs of stronger economic data and a sustained economic expansion.
During the period the yield curve continued to flatten as the Fed continued with its "measured" tightening process, even after hurricanes in the Gulf Coast. Although measures of inflation excluding energy and food remained relatively tame, the Fed still noted inflation pressure as oil prices surged toward $70 a barrel and other commodity prices climbed sharply as well. In this environment the Fed continued to increase the federal funds rate target to 3.75% by the end of the period.
PERFORMANCE
For the year ended October 31, 2005, the TA IDEX PIMCO Real Return TIPS, Class A returned 2.35%. By comparison its benchmark, the Lehman Brothers Global U.S. TIPS Index returned 2.94%.
STRATEGY REVIEW
PIMCO's investment process is based upon a long-term approach, which utilizes both "top-down" and "bottom-up" strategies. Top-down strategies focus on duration, yield curve positioning, volatility and sector rotation while bottom-up strategies drive our security selection process and facilitate the identification and analysis of undervalued securities. As we believe that no single strategy should dominate returns, our Real Return strategy relies on multiple sources of value added in a highly diversified portfolio.
During the twelve month period the portfolio's performance was relatively stable despite a volatile market, as we employed defensive interest-rate and sector strategies together with broad diversification to help preserve value. The portfolio benefited from our tactical portfolio adjustments and holdings in non-Index securities, such as corporates, emerging markets and non U.S. holdings with an emphasis on European bonds.
An overweight on shorter maturity Treasury Inflation Protected securities ("TIPs") was negative for performance as the real yield curve flattened. Above-benchmark duration from TIPs during the period was positive for returns as U.S. real yields fell. Net short positions in nominal bonds were positive for the period as yields rose toward the end of the twelve month period. An emphasis on non-U.S. inflation linked bonds was an additional positive for performance as real yields fell across the globe. Exposure to Eurozone issues added to performance. Eurozone bonds outperformed Treasuries as growth and inflation were higher in the U.S. A small allocation to corporates helped as their higher yields mitigated the impact of rising interest rates. A focus on mortgages in the latter part of the period was negative as this sector was adversely affected by duration extension arising from higher interest rate s. An allocation to emerging market bonds was positive for performance as these markets benefited from improving economic fundamentals, continued credit quality upgrades, and spreads tightening to historic lows.
John B. Brynjolfsson, CFA
Fund Manager
Pacific Investment Management Co. LLC
Transamerica IDEX Mutual Funds
Annual Report 2005
1
TA IDEX PIMCO Real Return TIPS
Comparison of change in value of $10,000 investment in Class A shares and its comparative index.
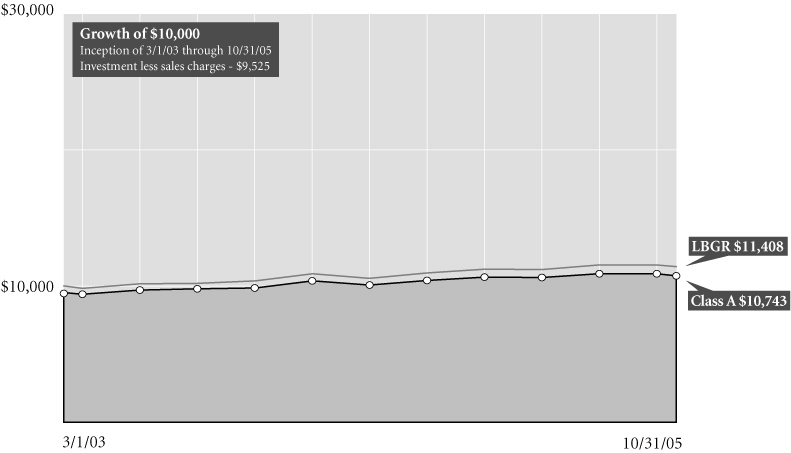
Average Annual Total Return for Periods Ended 10/31/05
| | | 1 year | | From
Inception | | Inception
Date | |
| Class A (NAV) | | | 2.35 | % | | | 4.61 | % | | 3/1/03 | |
| Class A (POP) | | | (2.51 | )% | | | 2.72 | % | | 3/1/03 | |
| LBGR U.S. TIPS1 | | | 2.94 | % | | | 5.05 | % | | 3/1/03 | |
| Class B (NAV) | | | 1.39 | % | | | 3.94 | % | | 3/1/03 | |
| Class B (POP) | | | (3.49 | )% | | | 2.88 | % | | 3/1/03 | |
| Class C (NAV) | | | 1.35 | % | | | 3.81 | % | | 3/1/03 | |
| Class C (POP) | | | 0.37 | % | | | 3.81 | % | | 3/1/03 | |
| Class I (NAV) | | | – | | | | 3.20 | % | | 11/8/04 | |
NOTES
1 The Lehman Brothers Global Real U.S. TIPS (LBGR U.S. TIPS) Index is an unmanaged index used as a general measure of market performance. Calculations assume dividends and capital gains are reinvested and do not include any managerial expenses. From inception calculation is based on life of Class A shares.
The performance data presented represents past performance, future results may vary. Performance data does not reflect the deduction of taxes that would be paid on fund distributions or the redemption of fund shares. Investment return and principal value will fluctuate so that an investor's shares, when redeemed, may be worth more or less than their original cost. Current performance may be lower or higher than performance quoted. Please see www.transamericaidex.com for performance data current to the most recent month-end.
Public Offering Price (POP) returns include the reinvestment of dividends and capital gains and reflect the maximum sales charge of 4.75% for A shares or the maximum applicable contingent deferred sales charge (5% in the 1st year, decreasing to 0% after 6 years) for Class B shares and 1% (during the first 12 months) for Class C shares. Shares purchased prior to March 1, 2004 are subject to a maximum applicable contingent deferred sales charge (5% in the 1st year, decreasing to 0% after 7 years) for Class B shares and (2% in the 1st year, decreasing to 0% after 2 years) for Class C shares. Net Asset Value (NAV) returns include the reinvestment of dividends and capital gains but do not reflect any sales charges.
The Fund is non-diversified. Investments in a "non-diversified" fund may be subject to specific risks such as susceptibility to single economic, political, or regulatory events, and may be subject to greater loss than investments in a diversified fund. In addition, this fund invests in derivatives that are subject to the additional risks of inaccurate market predictions, illiquid markets, adverse tax consequences, and leveraging.
This material must be preceded or accompanied by a current prospectus, which includes specific contents regarding the investment objectives and policies of this fund.
Transamerica IDEX Mutual Funds
Annual Report 2005
2
TA IDEX PIMCO Real Return TIPS
UNDERSTANDING YOUR FUND'S EXPENSES
(unaudited)
SHAREHOLDER EXPENSES
Fund shareholders may incur two types of costs: (1) transaction costs, including sales charges (loads) on purchases, contingent deferred sales charges on redemptions and redemption fees; and (2) ongoing costs, including management fees, 12b-1 distribution and service fees, and other fund expenses.
The following Example is intended to help you understand your ongoing costs (in dollars and cents) of investing in a Fund and to compare these costs with the ongoing costs of investing in other funds.
The Example is based on an investment of $1,000 invested at May 1, 2005 and held for the entire period until October 31, 2005.
ACTUAL EXPENSES
The first line in the table below provides information about actual account values and actual expenses. You may use the information in this line, together with the amount you invested, to estimate the expenses that you paid over the period. Simply divide your account value by $1,000 (for example, an $8,600 account value divided by $1,000 = 8.6), then multiply the result by the number in the first line of your Fund under the heading entitled "Expenses Paid During Period" to estimate the expenses you paid on your account during this period. If your account is an IRA, your expenses could have included a $15 annual fee. The amount of any fee paid through your account would increase the estimate of expenses you paid during the period and decrease your ending account value.
HYPOTHETICAL EXAMPLE FOR COMPARISON PURPOSES
The second line in the table below provides information about hypothetical account values and hypothetical expenses based on the Fund's actual expense ratio and an assumed rate of return of 5% per year before expenses, which is not the Fund's actual return. The hypothetical account values and expenses may not be used to estimate the actual ending account balance or expenses you paid for the period. You may use this information to compare the ongoing costs of investing in your Fund and other funds. To do so, compare this 5% hypothetical example with the 5% hypothetical examples that appear in the shareholder reports of the other funds. As in the case of the actual expense example, if your account is subject to an IRA fee, the amount of the fee paid through your account would increase the hypothetical expenses you would have paid during the period and decrease the hypothetical ending account value.
Please note that the expenses shown in the table are meant to highlight your ongoing costs only and do not reflect any transactional costs, such as sales charges, redemption fees, brokerage commissions paid on purchases and sales of fund shares. Therefore, the second line under the Fund in the table is useful in comparing ongoing costs only, and will not help you determine the relative total costs of owning different funds. If any of these transaction costs were included, your costs would be higher. The expenses shown in the table do not reflect any fees that may be charged to you by brokers, financial intermediaries or other financial institutions.
| | | Beginning
Account
Value | | Ending
Account
Value | | Annualized
Expense
Ratio | | Expenses Paid
During Period (a) | |
| Class A | | | |
| Actual | | $ | 1,000.00 | | | $ | 996.20 | | | | 1.09 | % | | $ | 5.48 | | |
| Hypothetical (b) | | | 1,000.00 | | | | 1,019.71 | | | | 1.09 | | | | 5.55 | | |
| Class B | | | |
| Actual | | | 1,000.00 | | | | 992.20 | | | | 2.02 | | | | 10.14 | | |
| Hypothetical (b) | | | 1,000.00 | | | | 1,015.02 | | | | 2.02 | | | | 10.26 | | |
| Class C | | | |
| Actual | | | 1,000.00 | | | | 992.50 | | | | 1.83 | | | | 9.19 | | |
| Hypothetical (b) | | | 1,000.00 | | | | 1,015.98 | | | | 1.83 | | | | 9.30 | | |
| Class I | | | |
| Actual | | | 1,000.00 | | | | 997.90 | | | | 0.74 | | | | 3.73 | | |
| Hypothetical (b) | | | 1,000.00 | | | | 1,021.48 | | | | 0.74 | | | | 3.77 | | |
(a) Expenses are calculated using each Fund's annualized expense ratio (as disclosed in the table), multiplied by the average account value for the period, multiplied by number of days in the period (184 days), and divided by the number of days in the year (365 days).
(b) 5% return per year before expenses.
GRAPHICAL PRESENTATION OF SCHEDULE OF INVESTMENTS
By Bond Type
At October 31, 2005
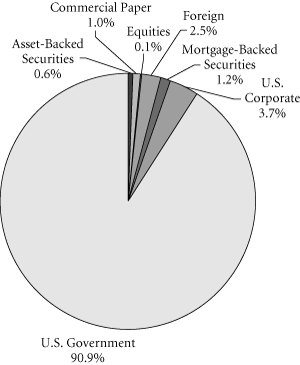
This chart shows the percentage breakdown by bond type of the Fund's total investment securities.
Transamerica IDEX Mutual Funds
Annual Report 2005
3
TA IDEX PIMCO Real Return TIPS
SCHEDULE OF INVESTMENTS
At October 31, 2005
(all amounts except share amounts in thousands)
| | | Principal | | Value | |
| U.S. GOVERNMENT OBLIGATIONS (101%) | |
U.S. Treasury Bond
6.63%, due 02/15/2027 | | $ | 900 | | | $ | 1,114 | | |
U.S. Treasury Inflation Indexed Bond
3.38%, due 01/15/2007 | | | 32,349 | | | | 33,190 | | |
| 3.63%, due 01/15/2008 | | | 19,812 | | | | 20,730 | | |
| 3.88%, due 01/15/2009 | | | 52,444 | | | | 56,128 | | |
| 4.25%, due 01/15/2010 | | | 25,677 | | | | 28,304 | | |
| 0.88%, due 04/15/2010 | | | 15,444 | | | | 14,842 | | |
| 3.50%, due 01/15/2011 | | | 31,817 | | | | 34,464 | | |
| 3.38%, due 01/15/2012 | | | 502 | | | | 547 | | |
| 3.00%, due 07/15/2012 | | | 46,962 | | | | 50,215 | | |
| 1.88%, due 07/15/2013 | | | 66,395 | | | | 66,035 | | |
| 2.00%, due 01/15/2014 | | | 60,151 | | | | 60,318 | | |
| 2.00%, due 07/15/2014 | | | 51,463 | | | | 51,598 | | |
| 1.88%, due 07/15/2015 | | | 16,759 | | | | 16,588 | | |
| 2.38%, due 01/15/2025 | | | 43,858 | | | | 45,638 | | |
| 3.63%, due 04/15/2028 | | | 34,966 | | | | 44,457 | | |
| 3.88%, due 04/15/2029 | | | 54,039 | | | | 71,813 | | |
| 3.38%, due 04/15/2032 | | | 1,106 | | | | 1,414 | | |
| Total U.S. Government Obligations (cost: $603,165) | | | | | | | 597,395 | | |
| U.S. GOVERNMENT AGENCY OBLIGATIONS (10.1%) | |
Fannie Mae
3.24%, due 09/07/2006 * | | | 22,600 | | | | 22,590 | | |
| 3.80%, due 09/21/2006 * | | | 10,500 | | | | 10,492 | | |
Fannie Mae, Series 2003-63, Class FA
4.19%, due 08/25/2034 * | | | 1,132 | | | | 1,130 | | |
Fannie Mae–November TBA
5.00%, due 11/01/2035 | | | 9,000 | | | | 8,660 | | |
| 5.50%, due 11/01/2035 | | | 17,100 | | | | 16,865 | | |
| Total U.S. Government Agency Obligations (cost: $60,034) | | | | | | | 59,737 | | |
| FOREIGN GOVERNMENT OBLIGATIONS (3.1%) | |
Canada Government
3.00%, due 12/01/2036 | | CAD | 418 | | | | 462 | | |
French Republic
5.75%, due 10/25/2032 | | EUR | 500 | | | | 797 | | |
Kingdom of Spain
5.75%, due 07/30/2032 | | EUR | 3,600 | | | | 5,731 | | |
Republic of Brazil
8.00%, due 01/15/2018 | | $ | 527 | | | | 544 | | |
Republic of Germany
6.25%, due 01/04/2030 | | EUR | 3,700 | | | | 6,174 | | |
Russian Federation
5.00%, due 03/31/2030 (a) | | $ | 4,200 | | | | 4,669 | | |
| Total Foreign Government Obligations (cost: $18,617) | | | | | | | 18,377 | | |
| | | Principal | | Value | |
| MORTGAGE-BACKED SECURITIES (1.5%) | |
Ameriquest Mortgage Securities, Inc.,
Series 2003-1, Class AII
4.45%, due 02/25/2033 * | | $ | 8 | | | $ | 8 | | |
Bank of America Mortgage Securities,
Series 2004-1, Class 5A1
6.50%, due 09/25/2033 | | | 160 | | | | 161 | | |
Carrington Mortgage Loan Trust,
Series 2005-NC3, Class A1A
4.12%, due 06/25/2035 * | | | 167 | | | | 167 | | |
Countrywide Home Loan Mortgage Pass
Through Trust, Series 2005-3, Class 1A2
4.33%, due 04/25/2035 * | | | 3,991 | | | | 3,991 | | |
Countrywide Home Loan Mortgage Pass
Through Trust, Series 2005-R2,
Class 1AF1–144A
4.38%, due 06/25/2035 * | | | 648 | | | | 649 | | |
Greenpoint Mortgage Funding Trust,
Series 2005-AR1, Class A2
4.26%, due 06/25/2045 * | | | 2,188 | | | | 2,184 | | |
GSAMP Trust,
Series 2004-SEA2, Class A2A
4.33%, due 03/25/2034 * | | | 366 | | | | 366 | | |
Quest Trust, Series 2005-X1, Class A1–144A
4.22%, due 03/25/2035 * | | | 159 | | | | 159 | | |
Residential Asset Mortgage Product, Inc.,
Series 2004-RS9, Class AII1
4.20%, due 09/25/2013 * | | | 808 | | | | 809 | | |
Structured Adjustable Rate Mortgage Loan
Trust, Series 2005-6XS, Class A1
4.16%, due 03/25/2035 * | | | 311 | | | | 311 | | |
Truman Capital Mortgage Loan Trust,
Series 2004-1, Class A1–144A
4.38%, due 01/25/2034 * | | | 111 | | | | 111 | | |
Wells Fargo Home Equity Trust,
Series 2004-2, Class AIII1
4.20%, due 06/25/2019 * | | | 2 | | | | 2 | | |
| Total Mortgage-Backed Securities (cost: $8,923) | | | | | | | 8,918 | | |
| ASSET-BACKED SECURITIES (0.7%) | |
Equity One ABS, Inc.,
Series 2004-1, Class AV2
4.34%, due 04/25/2034 * | | | 482 | | | | 483 | | |
GSR Mortgage Loan Trust,
Series 2005-AR6, Class 2A1
4.54%, due 09/25/2035 * | | | 1,666 | | | | 1,636 | | |
Redwood Capital, Ltd.,
Series 2003-3–144A
7.90%, due 01/09/2006 *§ | | | 300 | | | | 300 | | |
The notes to the financial statements are an integral part of this report.
Transamerica IDEX Mutual Funds
Annual Report 2005
4
TA IDEX PIMCO Real Return TIPS
SCHEDULE OF INVESTMENTS (continued)
At October 31, 2005
(all amounts except share amounts in thousands)
| | | Principal | | Value | |
Redwood Capital, Ltd.,
Series 2003-4–144A
6.35%, due 01/09/2006 *§ | | $ | 300 | | | $ | 300 | | |
Sequoia Mortgage Trust,
Series 5, Class A
4.35%, due 10/19/2026 * | | | 533 | | | | 533 | | |
Small Business Administration,
Series 2004-P10, Class A
4.50%, due 02/10/2014 | | | 1,104 | | | | 1,078 | | |
| Total Asset-Backed Securities (cost: $4,383) | | | | | | | 4,330 | | |
| CORPORATE DEBT SECURITIES (4.5%) | | | |
| Automotive (0.5%) | | | |
DaimlerChrysler North America Holding Corp.
4.03%, due 03/07/2007 * | | | 2,800 | | | | 2,795 | | |
| Business Credit Institutions (0.4%) | | | |
General Electric Capital Corp.
3.80%, due 03/04/2008 * | | | 2,300 | | | | 2,300 | | |
| Commercial Banks (0.0%) | | | |
Resona Bank, Ltd., Subordinated Note,–144A
5.85%, due 09/15/2049 (b) | | | 200 | | | | 193 | | |
| Insurance (0.0%) | | | |
Residential Reinsurance, Ltd.–144A
7.35%, due 06/08/2006 *§ | | | 300 | | | | 291 | | |
| Personal Credit Institutions (2.5%) | | | |
Ford Motor Credit Co.
6.88%, due 02/01/2006 | | | 1,000 | | | | 999 | | |
| 4.22%, due 11/16/2006 * | | | 1,700 | | | | 1,678 | | |
| 4.87%, due 03/21/2007 * | | | 2,900 | | | | 2,823 | | |
General Motors Acceptance Corp.
4.68%, due 05/18/2006 * | | | 1,500 | | | | 1,491 | | |
| 5.05%, due 01/16/2007 * | | | 4,200 | | | | 4,142 | | |
Toyota Motor Credit Corp.
3.35%, due 09/18/2006 * | | | 3,500 | | | | 3,500 | | |
| Revenue-Miscellaneous (0.1%) | | | |
New Hampshire Municipal Bond Bank, Series B
5.00%, due 08/15/2013 | | | 500 | | | | 540 | | |
| Revenue-Tobacco (0.1%) | | | |
Tobacco Settlement Financing Corp., RI
6.00%, due 06/01/2023 | | | 600 | | | | 630 | | |
| Security & Commodity Brokers (0.9%) | | | |
Goldman Sachs Group, Inc.
4.30%, due 06/28/2010 * | | | 3,000 | | | | 3,006 | | |
Goldman Sachs Group, Inc., Series E
3.90%, due 08/01/2006 * | | | 2,100 | | | | 2,101 | | |
| Total Corporate Debt Securities (cost: $26,481) | | | | | | | 26,489 | | |
| | | Shares | | Value | |
| PREFERRED STOCKS (0.1%) | | | |
| Business Credit Institutions (0.1%) | | | |
| Fannie Mae * | | | 11,600 | | | $ | 635 | | |
| Total Preferred Stocks (cost: $580) | | | | | | | 635 | | |
| | | Principal | | Value | |
| SHORT-TERM U.S. GOVERNMENT OBLIGATIONS (0.1%) | | | |
U.S. Treasury Bill
| |
| 3.33%, due 12/15/2005 #d | | $ | 40 | | | $ | 40 | | |
| 3.38%, due 12/15/2005 #d | | | 140 | | | | 139 | | |
| 3.43%, due 12/15/2005 #d | | | 50 | | | | 50 | | |
| 3.43%, due 12/15/2005 #d | | | 310 | | | | 309 | | |
| 3.58%, due 12/15/2005 #d | | | 50 | | | | 50 | | |
| Total Short-Term U.S. Government Obligations (cost: $587) | | | | | | | 588 | | |
| COMMERCIAL PAPER (1.3%) | | | |
| Commercial Banks (1.1%) | | | |
CBA (Delaware) Finance, Inc.
4.15%, due 01/31/2006 | | | 1,100 | | | | 1,088 | | |
Societe Generale North America, Inc.
4.15%, due 02/01/2006 | | | 500 | | | | 495 | | |
UBS Finance Delaware LLC
4.11%, due 02/22/2006 | | | 3,000 | | | | 2,961 | | |
Westpac Banking Corp.–144A
4.06%, due 01/17/2006 | | | 1,500 | | | | 1,487 | | |
| Communication (0.2%) | | | |
Viacom, Inc.–144A
4.37%, due 12/02/2005 | | | 1,300 | | | | 1,296 | | |
| Total Commercial Paper (cost: $7,327) | | | | | | | 7,327 | | |
| Total Investment Securities (cost: $730,097) | | | | | | $ | 723,796 | | |
| | | Contracts w | | Value | |
| WRITTEN OPTIONS (0.0%) | | | |
| Covered Call Options (0.0%) | | | |
| U.S. 10 Year Treasury Note Futures | | | 66 | | | $ | (1 | ) | |
| Call Strike $114.00 | | | | | | |
| | |
| Expires 11/22/2005 | | | | | | | | | |
U.S. 10 Year Treasury Note Futures
Call Strike $110.00
Expires 11/22/2005 | | | 101 | | | | (9 | ) | |
| Put Options (0.0%) | | | |
U.S. 10 Year Treasury Note Futures
Put Strike $110.00
Expires 11/22/2005 | | | 69 | | | | (113 | ) | |
U.S. 10 Year Treasury Note Futures
Put Strike $109.00
Expires 11/22/2005 | | | 66 | | | | (57 | ) | |
The notes to the financial statements are an integral part of this report.
Transamerica IDEX Mutual Funds
Annual Report 2005
5
TA IDEX PIMCO Real Return TIPS
SCHEDULE OF INVESTMENTS (continued)
At October 31, 2005
(all amounts except share amounts in thousands)
| | | Contracts w | | Value | |
| Put Options (continued) | | | |
| U.S. 10 Year Treasury Note Futures | | | 101 | | | $ | (13 | ) | |
| Put Strike $107.00 | | | | | | |
| | |
| Expires 11/22/2005 | | | | | | | | | |
| Total Written Options (premiums: $91) | | | | | | | (193 | ) | |
| SUMMARY: | | | |
| Investment securities, at value | | | 122.4 | % | | $ | 723,796 | | |
| Written options | | | 0.0 | % | | | (193 | ) | |
| Liabilities in excess of other assets | | | (22.4 | )% | | | (132,285 | ) | |
| Net Assets | | | 100.0 | % | | $ | 591,318 | | |
| SWAP AGREEMENTS: | | | |
| | | Expiration
Date | | Notional
Amount | | Net Unrealized
Appreciation
(Depreciation) | |
Receive a fixed rate equal to 4.00%
and pay a floating rate based on
6-month EURIBOR
(Euro Interbank Offered Rate).
Counterparty: Barclays Bank PLC | | 06/17/10 | | $ | 5,700 | | | $ | 309 | | |
Receive a fixed rate equal to 4.00%
and pay a floating rate based
on 6-month EURIBOR
(Euro Interbank Offered Rate).
Counterparty: Citibank N.A. | | 06/17/10 | | | 8,000 | | | | 403 | | |
Receive a floating rate based
on 3-month United States Dollar–LIBOR
(London Interbank Offered Rate)
and pay a fixed rate equal to 5.00%.
Counterparty: Bank of America, N.A. | | 12/15/15 | | | 16,800 | | | | 941 | | |
Receive a floating rate based
on 3-month United States Dollar–LIBOR
(London Interbank Offered Rate)
and pay a fixed rate equal to 5.00%.
Counterparty: Goldman Sachs
Capital Markets, LP | | 12/15/15 | | | 8,100 | | | | 401 | | |
Receive a floating rate based
on 3-month United States Dollar–LIBOR
(London Interbank Offered Rate)
and pay a fixed rate equal to 5.00%.
Counterparty: JP Morgan & Chase | | 12/15/15 | | | 8,400 | | | | 470 | | |
Receive a fixed rate equal to 4.00%
and pay a floating rate based
on 3-month United States Dollar–LIBOR
(London Interbank Offered Rate).
Counterparty: UBS AG | | 12/15/07 | | | 3,800 | | | | (46 | ) | |
| | | Expiration
Date | | Notional
Amount | | Net Unrealized
Appreciation
(Depreciation) | |
Receive a fixed rate equal to 4.00%
and pay a floating rate based
on 3-month United States Dollar–LIBOR
(London Interbank Offered Rate).
Counterparty: Goldman Sachs
Capital Markets, LP | | 12/15/07 | | $ | 3,100 | | | $ | (38 | ) | |
Receive a floating rate based
on 6-month EURIBOR
(Euro Interbank Offered Rate) and
pay a fixed rate equal to 4.50%.
Counterparty: Goldman Sachs
Capital Markets, LP | | 06/17/15 | | | 8,400 | | | | 113 | | |
Receive a fixed rate equal to 2.1025%
and the Fund will pay a floating rate
based on FRC–Excluding
Tobacco-Non-Revised Consumer
Price Index.
Counterparty: Barclays Bank PLC | | 10/15/10 | | | 5,000 | | | | 2 | | |
Receive a fixed rate equal to 2.45%
and the Fund will pay to the counterparty
at the notional amount in the event of default of
General Motors Acceptance Corp.,
6.875%, due 8/28/2012
Counterparty: Morgan Stanley
Capital, Inc. | | 09/20/07 | | | 600 | | | | 4 | | |
Receive a floating rate based
on 3-month United States Dollar–LIBOR
(London Interbank Offered Rate) and
pay a fixed rate equal to 5.00%.
Counterparty: Goldman Sachs
Capital Markets, LP | | 12/15/05 | | | 4,000 | | | | 151 | | |
Receive a floating rate based
on 3-month United States Dollar–LIBOR
(London Interbank Offered Rate) and
pay a fixed rate equal to 5.00%.
Counterparty: Morgan Stanley
Capital, Inc. | | 12/15/05 | | | 100 | | | | 4 | | |
Total Swap Agreements
(premium $2,792) | | | | $ | 72,000 | | | $ | 2,714 | | |
The notes to the financial statements are an integral part of this report.
Transamerica IDEX Mutual Funds
Annual Report 2005
6
TA IDEX PIMCO Real Return TIPS
SCHEDULE OF INVESTMENTS (continued)
At October 31, 2005
(all amounts except contract amounts in thousands)
| FORWARD FOREIGN CURRENCY CONTRACTS: | |
| Currency | | Bought
(Sold) | | Settlement
Date | | Amount in
U.S. Dollars
Bought (Sold) | | Net
Unrealized
Appreciation
(Depreciation) | |
| Canadian Dollar | | | (487 | ) | | 11/21/2005 | | $ | (414 | ) | | $ | 1 | | |
| Euro Dollar | | | (10,287 | ) | | 11/08/2005 | | | (12,389 | ) | | | 55 | | |
| | | $ | (12,803 | ) | | $ | 56 | | |
| FUTURES CONTRACTS: | |
| | | Contracts | | Settlement
Date | | Amount | | Net Unrealized
Appreciation
(Depreciation) | |
| 10 Year U.S. Treasury Note | | | 125 | | | 12/30/2005 | | $ | (13,557 | ) | | $ | 360 | | |
| 5 Year U.S. Treasury Note | | | 158 | | | 12/30/2005 | | | 16,731 | | | | (358 | ) | |
| Euro-BUND | | | 98 | | | 12/12/2005 | | | (14,145 | ) | | | 240 | | |
| U.S. Treasury Long Bond | | | 13 | | | 12/30/2005 | | | (1,456 | ) | | | 15 | | |
| | | | | | | | | $ | (12,427 | ) | | $ | 257 | | |
NOTES TO SCHEDULE OF INVESTMENTS:
* Floating or variable rate note. Rate is listed as of October 31, 2005.
(a) Russian Federation has a coupon rate of 5.00% until 03/31/2007, thereafter the coupon rate will become 7.50%.
§ Security is deemed to be illiquid.
(b) Resona Bank, Ltd–144A has a coupon rate of 5.85% until 04/15/2016, thereafter the coupon rate will reset quarterly at the 3 Month LIBOR (London Interbank Offer Rate) plus 277 BP.
# At October 31, 2005, all or a portion of this security is segregated with the custodian to cover margin requirements for open option contracts. The value of all securities segregated at October 31, 2005, is $129.
w Contract amounts are not in thousands.
d At October 31, 2005, all or a portion of this security is segregated with the custodian to cover margin requirements for open future contracts. The value of all securities segregated at October 31, 2005, is $319.
DEFINITIONS:
144A 144A Securities are registered pursuant to Rule 144A of the Securities Act of 1933. These securities are deemed to be liquid for purposes of compliance limitations on holdings of illiquid securities and may be resold as transactions exempt from registration, normally to qualified institutional buyers. At October 31, 2005, these securities aggregated $4,786 or 0.8% of the net assets of the Fund.
CAD Canadian dollar
EUR Euro
TBA Mortgage-backed securities traded under delayed delivery commitments. Income on TBA's are not earned until settlement date.
The notes to the financial statements are an integral part of this report.
Transamerica IDEX Mutual Funds
Annual Report 2005
7
TA IDEX PIMCO Real Return TIPS
STATEMENT OF ASSETS AND LIABILITIES
At October 31, 2005
(all amounts except per share amounts in thousands)
| Assets: | | | |
| Investment securities, at value (cost: $730,097) | | $ | 723,796 | | |
| Cash | | | 2,117 | | |
| Foreign currencies (cost: $796) | | | 793 | | |
| Receivables: | |
| Investment securities sold | | | 14,371 | | |
| Shares of beneficial interest sold | | | 109 | | |
| Interest | | | 4,932 | | |
| Unrealized appreciation on forward currency contracts | | | 56 | | |
| Other | | | 8 | | |
| | | | 746,182 | | |
| Liabilities: | | | |
| Investment securities purchased | | | 153,760 | | |
| Accounts payable and accrued liabilities: | |
| Shares of beneficial interest redeemed | | | 4 | | |
| Management and advisory fees | | | 337 | | |
| Income due from swap contracts | | | 302 | | |
| Distribution and service fees | | | 98 | | |
| Transfer agent fees | | | 2 | | |
| Administration fees | | | 10 | | |
| Variation margin | | | 14 | | |
| Written options (premiums $91) | | | 193 | | |
| Swap agreements at value (premiums $2,792) | | | 78 | | |
| Other | | | 66 | | |
| | | | 154,864 | | |
| Net Assets | | $ | 591,318 | | |
| Net Assets Consist of: | | | |
Shares of beneficial interest, unlimited shares
authorized, no par value | | | 597,789 | | |
| Undistributed net investment income (loss) | | | 116 | | |
Accumulated net realized gain (loss) from investment
securities, futures contracts, written options,
swaps and foreign currency transactions | | | (3,184 | ) | |
| Net unrealized appreciation (depreciation) on: | |
| Investment securities | | | (6,301 | ) | |
| Futures contracts | | | 257 | | |
| Written option contracts | | | (102 | ) | |
| Swap agreements | | | 2,714 | | |
Translation of assets and liabilites denominated
in foreign currencies | | | 29 | | |
| Net Assets | | $ | 591,318 | | |
| Net Assets by Class: | | | |
| Class A | | $ | 277,289 | | |
| Class B | | | 9,896 | | |
| Class C | | | 8,167 | | |
| Class I | | | 295,966 | | |
| Shares Outstanding: | | | |
| Class A | | | 27,113 | | |
| Class B | | | 973 | | |
| Class C | | | 807 | | |
| Class I | | | 28,875 | | |
| Net Asset Value Per Share: | | | |
| Class A | | $ | 10.23 | | |
| Class B | | | 10.17 | | |
| Class C | | | 10.13 | | |
| Class I | | | 10.25 | | |
| Maximum Offering Price Per Share (a): | | | |
| Class A | | $ | 10.74 | | |
(a) Includes the maximum selling commission (represented as a percentage of offering price) which is reduced on certain levels of sales as set forth in the Prospectus. Net asset value per share for Classes B, C and I shares represents offering price. The redemption price for Classes B and C shares equals net asset value less any applicable contingent deferred sales charge.
STATEMENT OF OPERATIONS
For the year ended October 31, 2005
(all amounts in thousands)
| Investment Income: | | | |
| Interest | | $ | 23,651 | | |
| Dividends | | | 35 | | |
| | | | 23,686 | | |
| Expenses: | | | |
| Management and advisory fees | | | 3,856 | | |
| Distribution and service fees: | |
| Class A | | | 1,050 | | |
| Class B | | | 90 | | |
| Class C | | | 78 | | |
| Transfer agent fees: | |
| Class A | | | 13 | | |
| Class B | | | 13 | | |
| Class C | | | 9 | | |
| Printing and shareholder reports | | | 2 | | |
| Custody fees | | | 91 | | |
| Administration fees | | | 110 | | |
| Legal fees | | | 38 | | |
| Audit fees | | | 27 | | |
| Trustees fees | | | 26 | | |
| Registration fees: | |
| Class A | | | 33 | | |
| Class B | | | 12 | | |
| Class C | | | 16 | | |
| Class I | | | 10 | | |
| Other | | | 6 | | |
| Total expenses | | | 5,480 | | |
| Net Investment Income (Loss) | | | 18,206 | | |
| Net Realized Gain (Loss) from: | | | |
| Investment securities | | | (735 | ) | |
| Futures contracts | | | 886 | | |
| Written option contracts | | | 366 | | |
| Swap agreements | | | (2,871 | ) | |
| Foreign currency transactions | | | 1,088 | | |
| | | | (1,266 | ) | |
Net Increase (Decrease) in Unrealized Appreciation
(Depreciation) on: | | | |
| Investment securities | | | (8,368 | ) | |
| Futures contracts | | | 52 | | |
| Written option contracts | | | (137 | ) | |
| Swap agreements | | | 4,371 | | |
Translation of assets and liabilities denominated
in foreign currencies | | | 25 | | |
| | | | (4,057 | ) | |
Net Gain (Loss) on Investment Securities,
Futures Contracts, Written Options, Swaps and
Foreign Currency Transactions | | | (5,323 | ) | |
Net Increase (Decrease) in Net Assets Resulting
from Operations | | $ | 12,883 | | |
The notes to the financial statements are an integral part of this report.
Transamerica IDEX Mutual Funds
Annual Report 2005
8
TA IDEX PIMCO Real Return TIPS
STATEMENTS OF CHANGES IN NET ASSETS
For the years ended
(all amounts in thousands)
| | | October 31,
2005 | | October 31,
2004 | |
| Increase (Decrease) In Net Assets From: | |
| Operations: | |
| Net investment income (loss) | | $ | 18,206 | | | $ | 400 | | |
Net realized gain (loss) from
investment securities, futures
contracts, written options, swaps
and foreign currency transactions | | | (1,266 | ) | | | 16,577 | | |
Net unrealized appreciation
(depreciation) on investment
securities, futures contracts, written
options, swaps and foreign currency
translation | | | (4,057 | ) | | | 605 | | |
| | | | 12,883 | | | | 17,582 | | |
| Distributions to Shareholders: | |
| From net investment income: | |
| Class A | | | (8,833 | ) | | | (392 | ) | |
| Class B | | | (210 | ) | | | (6 | ) | |
| Class C | | | (186 | ) | | | (6 | ) | |
| Class I | | | (9,545 | ) | | | – | | |
| | | | (18,774 | ) | | | (404 | ) | |
| From net realized gains: | |
| Class A | | | (5,455 | ) | | | (8,780 | ) | |
| Class B | | | (127 | ) | | | (216 | ) | |
| Class C | | | (109 | ) | | | (183 | ) | |
| Class C2 | | | – | | | | (12 | ) | |
| Class M | | | – | | | | (20 | ) | |
| Class I | | | (3,816 | ) | | | – | | |
| | | | (9,507 | ) | | | (9,211 | ) | |
| Capital Share Transactions: | |
| Proceeds from shares sold: | |
| Class A | | | 18,211 | | | | 281,364 | | |
| Class B | | | 5,708 | | | | 5,292 | | |
| Class C | | | 4,853 | | | | 4,790 | | |
| Class C2 | | | – | | | | 59 | | |
| Class M | | | – | | | | 345 | | |
| Class I | | | 289,761 | | | | – | | |
| | | | 318,533 | | | | 291,850 | | |
Dividends and distributions
reinvested: | |
| Class A | | | 14,233 | | | | 9,143 | | |
| Class B | | | 255 | | | | 169 | | |
| Class C | | | 178 | | | | 123 | | |
| Class C2 | | | – | | | | 11 | | |
| Class M | | | – | | | | 20 | | |
| Class I | | | 13,361 | | | | – | | |
| | | | 28,027 | | | | 9,466 | | |
| Cost of shares redeemed: | |
| Class A | | | (77,637 | ) | | | (4,390 | ) | |
| Class B | | | (3,323 | ) | | | (1,311 | ) | |
| Class C | | | (3,263 | ) | | | (2,691 | ) | |
| Class C2 | | | – | | | | (99 | ) | |
| Class M | | | – | | | | (59 | ) | |
| | | | (84,223 | ) | | | (8,550 | ) | |
| Class level exchanges: | |
| Class C | | | – | | | | 1,062 | | |
| Class C2 | | | – | | | | (302 | ) | |
| Class M | | | – | | | | (760 | ) | |
| | | | – | | | | – | | |
| | | October 31,
2005 | | October 31,
2004 | |
| Automatic conversions: | |
| Class A | | $ | 1 | | | $ | – | | |
| Class B | | | (1 | ) | | | – | | |
| | | | – | | | | – | | |
| | | | 262,337 | | | | 292,766 | | |
| Net increase (decrease) in net assets | | | 246,939 | | | | 300,733 | | |
| Net Assets: | | | |
| Beginning of year | | | 344,379 | | | | 43,646 | | |
| End of year | | $ | 591,318 | | | $ | 344,379 | | |
Undistributed Net Investment Income
(Loss) | | $ | 116 | | | $ | 131 | | |
| Share Activity: | | | |
| Shares issued: | |
| Class A | | | 1,743 | | | | 27,408 | | |
| Class B | | | 550 | | | | 514 | | |
| Class C | | | 471 | | | | 470 | | |
| Class C2 | | | – | | | | 6 | | |
| Class M | | | – | | | | 35 | | |
| Class I | | | 27,591 | | | | – | | |
| | | | 30,355 | | | | 28,433 | | |
Shares issued–reinvested from
distributions: | |
| Class A | | | 1,368 | | | | 908 | | |
| Class B | | | 24 | | | | 17 | | |
| Class C | | | 18 | | | | 12 | | |
| Class C2 | | | – | | | | 1 | | |
| Class M | | | – | | | | 2 | | |
| Class I | | | 1,284 | | | | – | | |
| | | | 2,694 | | | | 940 | | |
| Shares redeemed: | |
| Class A | | | (7,502 | ) | | | (428 | ) | |
| Class B | | | (321 | ) | | | (128 | ) | |
| Class C | | | (317 | ) | | | (263 | ) | |
| Class C2 | | | – | | | | (10 | ) | |
| Class M | | | – | | | | (6 | ) | |
| | | | (8,140 | ) | | | (835 | ) | |
| Class level exchanges: | |
| Class C | | | – | | | | 104 | | |
| Class C2 | | | – | | | | (30 | ) | |
| Class M | | | – | | | | (74 | ) | |
| | | | – | | | | – | | |
Net increase (decrease) in shares
outstanding: | |
| Class A | | | (4,391 | ) | | | 27,888 | | |
| Class B | | | 253 | | | | 403 | | |
| Class C | | | 172 | | | | 323 | | |
| Class C2 | | | – | | | | (33 | ) | |
| Class M | | | – | | | | (43 | ) | |
| Class I | | | 28,875 | | | | – | | |
| | | | 24,909 | | | | 28,538 | | |
The notes to the financial statements are an integral part of this report.
Transamerica IDEX Mutual Funds
Annual Report 2005
9
TA IDEX PIMCO Real Return TIPS
FINANCIAL HIGHLIGHTS
| | | | | For a share of beneficial interest outstanding throughout each period | |
| | | | | Net Asset | | Investment Operations | | Distributions | | Net Asset | |
| | | For the
Period
Ended (d)(g) | | Value,
Beginning
of Period | | Net
Investment
Income (Loss) | | Net Realized
and Unrealized
Gain (Loss) | | Total
Operations | | From Net
Investment
Income | | From Net
Realized
Gains | | Total
Distributions | | Value,
End
of Period | |
| Class A | | 10/31/2005 | | $ | 10.48 | | | $ | 0.30 | | | $ | (0.06 | ) | | $ | 0.24 | | | $ | (0.32 | ) | | $ | (0.17 | ) | | $ | (0.49 | ) | | $ | 10.23 | | |
| | | 10/31/2004 | | | 10.10 | | | | 0.02 | | | | 0.76 | | | | 0.78 | | | | (0.02 | ) | | | (0.38 | ) | | | (0.40 | ) | | | 10.48 | | |
| | | 10/31/2003 | | | 10.00 | | | | 0.14 | | | | 0.07 | | | | 0.21 | | | | (0.11 | ) | | | – | | | | (0.11 | ) | | | 10.10 | | |
| Class B | | 10/31/2005 | | | 10.42 | | | | 0.23 | | | | (0.09 | ) | | | 0.14 | | | | (0.22 | ) | | | (0.17 | ) | | | (0.39 | ) | | | 10.17 | | |
| | | 10/31/2004 | | | 10.08 | | | | (0.02 | ) | | | 0.75 | | | | 0.73 | | | | (0.01 | ) | | | (0.38 | ) | | | (0.39 | ) | | | 10.42 | | |
| | | 10/31/2003 | | | 10.00 | | | | 0.09 | | | | 0.08 | | | | 0.17 | | | | (0.09 | ) | | | – | | | | (0.09 | ) | | | 10.08 | | |
| Class C | | 10/31/2005 | | | 10.39 | | | | 0.23 | | | | (0.09 | ) | | | 0.14 | | | | (0.23 | ) | | | (0.17 | ) | | | (0.40 | ) | | | 10.13 | | |
| | | 10/31/2004 | | | 10.08 | | | | (0.06 | ) | | | 0.76 | | | | 0.70 | | | | (0.01 | ) | | | (0.38 | ) | | | (0.39 | ) | | | 10.39 | | |
| | | 10/31/2003 | | | 10.00 | | | | 0.09 | | | | 0.08 | | | | 0.17 | | | | (0.09 | ) | | | – | | | | (0.09 | ) | | | 10.08 | | |
| Class I | | 10/31/2005 | | | 10.45 | | | | 0.37 | | | | (0.04 | ) | | | 0.33 | | | | (0.36 | ) | | | (0.17 | ) | | | (0.53 | ) | | | 10.25 | | |
| | | | | | | Ratios/Supplemental Data | |
| | | For the
Period | | Total | | Net Assets,
End of
Period | | Ratio of Expenses
to Average
Net Assets (a) | | Net Investment
Income (Loss)
to Average | | Portfolio
Turnover | |
| | | Ended (g) | | Return (c) | | (000's) | | Net (e) | | Total (f) | | Net Assets (a) | | Rate (b) | |
| Class A | | 10/31/2005 | | | 2.35 | % | | $ | 277,289 | | | | 1.10 | % | | | 1.10 | % | | | 2.89 | % | | | 662 | % | |
| | | 10/31/2004 | | | 7.94 | | | | 330,282 | | | | 1.15 | | | | 1.15 | | | | 0.20 | | | | 1,438 | | |
| | | 10/31/2003 | | | 2.09 | | | | 36,531 | | | | 1.65 | | | | 2.03 | | | | 2.07 | | | | 480 | | |
| Class B | | 10/31/2005 | | | 1.39 | | | | 9,896 | | | | 2.00 | | | | 2.00 | | | | 2.26 | | | | 662 | | |
| | | 10/31/2004 | | | 7.51 | | | | 7,496 | | | | 1.51 | | | | 1.51 | | | | (0.20 | ) | | | 1,438 | | |
| | | 10/31/2003 | | | 1.72 | | | | 3,194 | | | | 2.30 | | | | 2.68 | | | | 1.42 | | | | 480 | | |
| Class C | | 10/31/2005 | | | 1.35 | | | | 8,167 | | | | 2.04 | | | | 2.04 | | | | 2.22 | | | | 662 | | |
| | | 10/31/2004 | | | 7.20 | | | | 6,601 | | | | 1.87 | | | | 1.87 | | | | (0.52 | ) | | | 1,438 | | |
| | | 10/31/2003 | | | 1.72 | | | | 3,148 | | | | 2.30 | | | | 2.68 | | | | 1.42 | | | | 480 | | |
| Class I | | 10/31/2005 | | | 3.20 | | | | 295,966 | | | | 0.73 | | | | 0.73 | | | | 3.60 | | | | 662 | | |
NOTES TO FINANCIAL HIGHLIGHTS
(a) Annualized.
(b) Not annualized.
(c) Total Return has been calculated for the applicable period without deduction of a sales load, if any, on an initial purchase. Periods of less than one year are not annualized.
(d) Per share information is calculated based on average number of shares outstanding.
(e) Ratio of Net Expenses to Average Net Assets is net of fee waivers and reimbursements by the investment adviser, if any (see note 2).
(f) Ratio of Total Expenses to Average Net Assets includes all expenses before fee waivers and reimbursements by the investment adviser.
(g) Commenced operations on March 1, 2003. The inception date of the Fund's offering of share Class I was November 8, 2004.
The notes to the financial statements are an integral part of this report.
Transamerica IDEX Mutual Funds
Annual Report 2005
10
TA IDEX PIMCO Real Return TIPS
NOTES TO FINANCIAL STATEMENTS
At October 31, 2005
(all amounts in thousands)
NOTE 1. ORGANIZATION AND SIGNIFICANT ACCOUNTING POLICIES
Transamerica IDEX Mutual Funds is an open-end management investment company registered under the Investment Company Act of 1940, as amended (the "1940 Act").
In the normal course of business, TA IDEX PIMCO Real Return TIPS (the "Fund") enters into contracts that contain a variety of representations that provide general indemnifications. The Fund's maximum exposure under these arrangements is unknown, as this would involve future claims that may be made against the Fund and/or its affiliates that have not yet occurred. However, based on experience, the Fund expects the risk of loss to be remote.
The Fund is "non-diversified" under the 1940 Act.
This report should be read in conjunction with the current Fund prospectus, which contains more complete information about the Fund.
The following is a summary of significant accounting policies followed by the Fund in the preparation of the financial statements. In preparing the Fund's financial statements in accordance with accounting principles generally accepted in the United States of America ("GAAP"), estimates or assumptions (which could differ from actual results) may be used that affect reported amounts and disclosures.
Multiple class operations, income and expenses: The Fund currently offers four classes of shares, each with a public offering price that reflects different sales charges, if any, and expense levels. On June 15, 2004, Class C2 shares merged into Class C. On September 24, 2004, Class M shares merged into Class C. Class B shares will convert to Class A shares eight years after purchase. Income , non-class specific expenses and realized and unrealized gains and losses, are allocated daily to each class, based upon the value of shares outstanding method as permitted under Rule 18f-3 of the 1940 Act. Each class bears its own specific expenses as well as a portion of general common expenses.
Class I shares are offered for investment to the asset allocation funds of AEGON/Transamerica Series Trust (ATST).
Security valuations: The Fund values its investments at the close of the New York Stock Exchange ("NYSE"), normally 4 p.m. ET, each day the NYSE is open for business. Fund investments are valued at the last sale price or closing price on the day of valuation taken from the primary exchange where the security is principally traded.
Securities traded in the over-the-counter market and listed securities for which no sale was reported on that date are valued at the last quoted bid price.
Debt securities are valued based on a price quotation or other equivalent indication of value supplied by an exchange, a pricing service or a major market maker; however, those that mature in sixty days or less are valued at amortized cost, which approximates market.
Foreign securities generally are valued based on quotations from the primary market in which they are traded. Because many foreign securities markets and exchanges close prior to the close of the NYSE, closing prices for foreign securities in those markets or on those exchanges do not reflect the events that occur after that close. If a significant market event impacting the value of a portfolio security (e.g., natural disaster, company announcement, market volatility) occurs subsequent to the close of trading in the security, but prior to the calculation of the Fund's net asset value per share, market quotations for that security may be determined to be unreliable and, accordingly, not "readily available." As a result, foreign equity securities held by the Fund may be valued at fair market value as determined in good faith by the Fund's Administrative Valuation Committee, under the supervision of the B oard's Valuation Committee, using guidelines adopted by the Board of Trustees.
Other securities for which quotations are not readily available or whose values have been determined to be unreliable are valued at fair market value as determined in good faith by the Fund's Administrative Valuation Committee, under the supervision of the Board's Valuation Committee, using guidelines adopted by the Board of Trustees.
Cash: The Fund may leave cash overnight in its cash account with the custodian, Investors Bank & Trust Company ("IBT"). IBT has been contracted on behalf of the Fund to invest the excess cash into a savings account, which at October 31, 2005, was paying an interest rate of 2.76%.
Security transactions and investment income: Security transactions are recorded on the trade date. Security gains and losses are calculated on the specific identification basis. Dividend income, if any, is recorded on the ex-dividend date or, in the case of foreign securities, as soon as the Fund is informed of the ex-dividend date. Interest income, including accretion of discounts and amortization of premiums, is recorded on the accrual basis commencing on the settlement date.
Foreign currency denominated investments: The accounting records of the Fund are maintained in U.S. dollars. Securities and other assets and liabilities denominated in foreign currencies are translated into U.S. dollars at the closing exchange rate each day. The cost of foreign securities is translated at the exchange rate in effect when the investment was acquired. The Fund combines fluctuations from currency exchange rates and fluctuations in value when computing net realized and unrealized gains or losses from investments.
Net foreign currency gains and losses resulting from changes in exchange rates include: 1) foreign currency fluctuations between trade date and settlement date of investment security transactions; 2) gains and losses on forward foreign currency contracts; and 3) the difference between the
Transamerica IDEX Mutual Funds
Annual Report 2005
11
TA IDEX PIMCO Real Return TIPS
NOTES TO FINANCIAL STATEMENTS (continued)
At October 31, 2005
(all amounts in thousands)
NOTE 1.–(continued)
receivable amounts of interest and dividends recorded in the accounting records in U.S. dollars and the amounts actually received.
Foreign currency denominated assets may involve risks not typically associated with domestic transactions. These risks include revaluation of currencies, adverse fluctuations in foreign currency values and possible adverse political, social and economic developments, including those particular to a specific industry, country or region.
Foreign capital gains taxes: The Fund may be subject to taxes imposed by countries in which it invests, with respect to its investment in issuers existing or operating in such countries. Such taxes are generally based on income earned or repatriated and capital gains realized on the sale of such investments. The Fund accrues such taxes when the related income or capital gains are earned. Some countries require governmental approval for the repatriation of investment income, capital or the proceeds of sales earned by foreign investors. In addition, if there is deterioration in a country's balance of payments or for other reasons, a country may impose temporary restrictions on foreign capital remittances abroad.
Forward foreign currency contracts: The Fund may enter into forward foreign currency contracts to hedge against exchange rate risk arising from investments in securities denominated in foreign currencies. Contracts are valued at the contractual forward rate and are marked to market daily, with the change in value recorded as an unrealized gain or loss. When the contracts are settled a realized gain or loss is incurred. Risks may arise from changes in market value of the underlying currencies and from the possible inability of counterparties to meet the terms of their contracts.
Open forward foreign currency contracts at October 31, 2005, are listed in the Schedule of Investments.
Swap agreements: The Fund may enter into swap agreements to manage its exposure to interest rates and credit risk. Interest rate swap agreements involve commitments to pay/receive interest in exchange for a market-linked return, both based on notional amounts. Credit default swaps involve one party making a stream of payments to another party in exchange for the right to receive a specified return in the event of a default by a third party.
Entering into these agreements involves elements of credit, market and documentation risk in excess of the amounts recognized on the Statement of Assets and Liabilities. Such risks involve the possibility that there will be no liquid market for these agreements, that the counterparty to the agreements may default on its obligation to perform or disagree as to the meaning of contractual terms in the agreements, and that there may be unfavorable changes in interest rates.
Swaps are marked to market daily based upon quotations from market makers and vendors and the change in value, if any, is recorded as unrealized gain or loss in the Statement of Operations. Payments received or made at the beginning of the measurement period are reflected as such on the Statement of Assets and Liabilities. A liquidation payment received or made at the termination of the swap is recorded as realized gain or loss in the Statement of Operations. Net periodic payments are included as part of realized gain or loss on the Statement of Operations.
Open swap agreements at October 31, 2005, are listed in the Schedule of Investments.
Futures contracts: The Fund may enter into futures contracts to manage exposure to market, interest rate or currency fluctuations. Futures contracts are valued at the settlement price established each day by the board of trade or exchange on which they are traded. The primary risks associated with futures contracts are imperfect correlation between the change in market value of the securities held and the prices of futures contracts; the possibility of an illiquid market and inability of the counterparty to meet the contract terms.
The underlying face amount of open futures contracts at October 31, 2005, are listed in the Schedule of Investments. The variation margin receivable or payable, as applicable, is included in the accompanying Statement of Assets and Liabilities. Variation margin represents the additional payment due or excess deposits made in order to maintain the equity account at the required margin level.
Option contracts: The Fund may enter into options contracts to manage exposure to market fluctuations. Options are valued at the average of the bid and ask ("Mean Quote") established each day at the close of the board of trade or exchange on which they are traded. The primary risks associated with options are imperfect correlation between the change in value of the securities held and the prices of the options contracts; the possibility of an illiquid market and inability of the counterparty to meet the contracts terms. When the Fund writes a covered call or put option, an amount equal to the premium received by the Fund is included in the Fund's Statement of Assets and Liabilities as an asset and as an equivalent liability. Options are marked-to-market daily to reflect the current value of the option written.
Transactions in written options were as follows:
| | | Premium | | Contracts* | |
| Beginning Balance October 31, 2004 | | $ | 24 | | | | 100 | | |
| Sales | | | 392 | | | | 1,608 | | |
| Closing Buys | | | – | | | | – | | |
| Expirations | | | (325 | ) | | | (1,305 | ) | |
| Exercised | | | – | | | | – | | |
| Balance at October 31, 2005 | | $ | 91 | | | | 403 | | |
* Contracts not in thousands
Transamerica IDEX Mutual Funds
Annual Report 2005
12
TA IDEX PIMCO Real Return TIPS
NOTES TO FINANCIAL STATEMENTS (continued)
At October 31, 2005
(all amounts in thousands)
NOTE 1.–(continued)
Swaptions contracts: The Fund is authorized to write swaption contracts to manage exposure to fluctuations in interest rates and to enhance fund yield. Swaption contracts written by the Fund represent an option that gives the purchaser the right, but not the obligation, to enter into a previously agreed upon swap contract on a future date. If a written call option is exercised, the writer will enter a swap and is obligated to pay the fixed rate and receive a variable rate in exchange. Swaptions are marked-to-market daily based upon quotations from market makers.
When the Fund writes a swaption, the premium received is recorded as a liability and is subsequently adjusted to the current value of the swaption. Changes in the value of the swaption are reported as Unrealized gains or losses in written options in the Statement of Assets and Liabilities. Gain or loss is recognized when the swaption contract expires or is closed. Premiums received from writing swaptions that expire or are exercised are treated by the Fund as realized gains from written options. The difference between the premium and the amount paid on affecting a closing purchase transaction is treated as a realized gain or loss.
Transactions in written swaptions were as follows:
| | | Premium | | Notional
Amount | |
| Beginning Balance October 31, 2004 | | $ | 41 | | | | 4,800 | | |
| Sales | | | – | | | | – | | |
| Closing Buys | | | – | | | | – | | |
| Expirations | | | (41 | ) | | | (4,800 | ) | |
| Exercised | | | – | | | | – | | |
| Balance at October 31, 2005 | | $ | – | | | | – | | |
Redemption fees: A short-term trading redemption fee may be assessed on any Fund shares in a fund account that are sold during the first five (5) NYSE trading days following their purchase date. This redemption fee will equal 2% of the amount redeemed and shares held the longest will be treated as being redeemed first and shares held the shortest as being redeemed last. For the year ended October 31, 2005, the Fund received less than $1 in redemption fees.
Dividend distributions: Distributions to shareholders are recorded on the ex-dividend date and are determined in accordance with Federal income tax regulations which may differ from GAAP.
NOTE 2. RELATED PARTY TRANSACTIONS
Effective January 1, 2005 AEGON/Transamerica Fund Advisors, Inc. was renamed Transamerica Fund Advisors, Inc. ("TFAI"); AEGON/Transamerica Fund Services, Inc. and AEGON/Transamerica Investor Services, Inc. merged into one entity and was renamed Transamerica Fund Services, Inc. ("TFS").
TFAI is the Fund's investment adviser. TFS is the Fund's administrator and transfer agent. AFSG Securities Corp. ("AFSG") is the Fund's distributor/principal underwriter. TFAI, TFS , and AFSG are affiliates of AEGON, NV, a Netherlands corporation.
The following schedule reflects the percentage of Fund assets owned by affiliated mutual funds:
| | | Net
Assets | | % of
Net Assets | |
TA IDEX Asset Allocation–
Conservative Portfolio | | $ | 41,983 | | | | 7.10 | % | |
TA IDEX Asset Allocation–
Moderate Growth Portfolio | | | 99,893 | | | | 16.89 | % | |
TA IDEX Asset Allocation–
Moderate Portfolio | | | 126,884 | | | | 21.46 | % | |
| Asset Allocation–Conservative Portfolio | | | 61,660 | | | | 10.43 | % | |
Asset Allocation–Moderate
Growth Portfolio | | | 102,482 | | | | 17.33 | % | |
| Asset Allocation–Moderate Portfolio | | | 131,827 | | | | 22.29 | % | |
| Total | | $ | 564,729 | | | | 95.50 | % | |
Investment advisory fees: The Fund pays management fees to TFAI based on average daily net assets ("ANA") at the following breakpoints:
From November 1, 2004 to December 31, 2004:
0.70% of ANA
From January 1, 2005 on:
0.70% of the first $250 million of ANA
0.65% of the next $500 million of ANA
0.60% of ANA over $750 million
TFAI has contractually agreed to waive its advisory fee and will reimburse the Fund to the extent that operating expenses, excluding 12b-1 fees, exceed the following stated annual limit:
1.30% Expense Limit–Classes A, B and C
1.00% Expense Limit–Class I
Transamerica IDEX Mutual Funds
Annual Report 2005
13
TA IDEX PIMCO Real Return TIPS
NOTES TO FINANCIAL STATEMENTS (continued)
At October 31, 2005
(all amounts in thousands)
NOTE 2.–(continued)
If total Fund expenses fall below the annual expense limitation agreement agreed to by the adviser within the succeeding three years, the Fund may be required to pay that adviser a portion or all of the reimbursed class expenses.
There were no amounts recaptured during the year ended October 31, 2005. There are no amounts available for recapture at October 31, 2005.
Distribution and service fees: The Fund has a 12b-1 distribution plan under the 1940 Act pursuant to which an annual fee, based on average daily net assets, is paid to the distributor for various disbursements such as broker-dealer account servicing fees and other promotional expenses of the Fund. The Fund is authorized under the 12b-1 plan to pay fees on each class up to the following limits:
| Class A | | | 0.35 | % | |
| Class B | | | 1.00 | % | |
| Class C | | | 1.00 | % | |
| Class I | | | N/A | | |
In the case the Fund or a class of shares of the Fund is closed to new investors or investments, the Fund is authorized to pay 12b-1 fees for past sales and distribution efforts and present and past investor services.
Underwriter commissions relate to front-end sales charges imposed for Class A shares and contingent deferred sales charges from Classes B, C, and certain A share redemptions. For the year ended October 31, 2005, the underwriter commissions were as follows:
| Received by Underwriter | | $ | 287 | | |
| Retained by Underwriter | | | 19 | | |
| Contingent Deferred Sales Charge | | | 35 | | |
Administrative services: The Fund has entered into an agreement with TFS for financial and legal fund administration services. As of January 1, 2005 the Fund pays TFS an annual fee of 0.02% of ANA. Prior to January 1, 2005 the Fund paid TFS an annual fee of 0.015% of ANA. The Legal fees on the Statement of Operations are for fees paid to external legal counsel.
Transfer agent fees: The Fund pays TFS an annual per-account charge for each open and closed account. The Fund paid TFS $34 for the year ended October 31, 2005.
Deferred compensation plan: Each eligible independent Fund Trustee may elect to participate in a non-qualified deferred compensation plan maintained by Transamerica IDEX Mutual Funds (the "Plan"). Under the Plan, such Trustees may defer payment of all or a portion of their total fees earned as a Fund Trustee. Each Trustee who is a participant in the Plan may elect that the earnings, losses or gains credited to his or her deferred fee amounts be determined based on a deemed investment in any series of Transamerica IDEX Mutual Funds, including the Fund. The right of a participant to receive a distribution from the Plan of the deferred fees is an unsecured claim against the general assets of all s eries of Transamerica IDEX Mutual Funds. The pro rata liability to the Fund of all deferred fees in the Plan amounted, as of October 31, 2005, to $8.
NOTE 3. INVESTMENT TRANSACTIONS
The cost of securities purchased and proceeds from securities sold (excluding short-term securities) for the year ended October 31, 2005, were as follows:
Purchases of securities:
| Long-Term | | $ | 74,501 | | |
| U.S. Government | | | 4,524,455 | | |
Proceeds from maturities and sales of securities:
| Long-Term | | | 34,947 | | |
| U.S. Government | | | 4,237,451 | | |
NOTE 4. FEDERAL INCOME TAX MATTERS
The Fund has not made any provision for federal income or excise taxes due to its policy to distribute all of its taxable income and capital gains to its shareholders and otherwise qualify as a regulated investment company under Subchapter M of the Internal Revenue Code. Income and capital gain distributions are determined in accordance with income tax regulations, which may differ from GAAP. These differences are primarily due to differing treatment for items including, but not limited to, wash sales, swap reclass, futures, options and foreign currency transactions.
Therefore, distributions determined in accordance with tax regulations may differ significantly in amount or character from net investment income and realized gains for financial reporting purposes. Financial reporting records are adjusted for permanent book/tax differences to reflect tax character. Financial records are not adjusted for temporary differences. These reclassifications are as follows:
| Undistributed net investment income (loss) | | $ | 553 | | |
Accumulated net realized gain (loss) from investment
securities | | | (553 | ) | |
The tax character of distributions paid may differ from the character of distributions shown in the Statement of Changes in Net Assets due to short-term gains being treated as ordinary income for tax purposes. The tax character of distributions paid during 2004 and 2005 was as follows:
| 2004 Distributions paid from: | |
| Ordinary Income | | $ | 9,606 | | |
| Long-term Capital Gain | | | 9 | | |
| 2005 Distributions paid from: | |
| Ordinary Income | | | 28,048 | | |
| Long-term Capital Gain | | | 233 | | |
Transamerica IDEX Mutual Funds
Annual Report 2005
14
TA IDEX PIMCO Real Return TIPS
NOTES TO FINANCIAL STATEMENTS (continued)
At October 31, 2005
(all amounts in thousands)
NOTE 4.–(continued)
The tax basis components of distributable earnings as of October 31, 2005, are as follows:
| Undistributed Ordinary Income | | $ | 116 | | |
| Undistributed Long-term Capital Gains | | $ | 278 | | |
| Capital Loss Carryforward | | $ | – | | |
| Net Unrealized Appreciation (Depreciation) | | $ | (6,895 | )* | |
* Amount includes unrealized appreciation (depreciation) from derivative instruments, foreign currency translation and deferred compensation.
The aggregate cost of investments and composition of unrealized appreciation (depreciation) for federal income tax purposes as of October 31, 2005, are as follows:
| Federal Tax Cost Basis | | $ | 733,590 | | |
| Unrealized Appreciation | | $ | – | | |
| Unrealized (Depreciation) | | | (9,794 | ) | |
| Net Unrealized Appreciation (Depreciation) | | $ | (9,794 | ) | |
NOTE 5. REGULATORY PROCEEDINGS
There continues to be significant federal and state regulatory activity relating to financial services companies, particularly mutual fund companies and their investment advisers. As part of an ongoing investigation regarding potential market timing, recordkeeping and trading compliance issues and matters affecting the Fund's investment adviser, TFAI, and certain affiliates and former employees of TFAI, the SEC staff has indicated that it is likely to take some action against TFAI and certain of its affiliates at the conclusion of the investigation. The potential timing and the scope of any such action is difficult to predict. Although the impact of any action brought against TFAI and/or its affiliates is difficult to assess at the present time, the Fund currently believes that the likelihood that any such action will have a material adverse impact on it is remote. It is important to note that the Fund is not aware of any allegation of wrongdoing against it and its Board at the time this annual report is printed. Although it is not anticipated that these developments will have an adverse impact on the Fund, there can be no assurance at this time. TFAI and its affiliates are actively working with the SEC in regard to this matter; however, the exact resolution cannot be determined at this time. TFAI will take such actions that it deems necessary or appropriate to continue providing management services to the Fund and to bring all matters to an appropriate conclusion.
TFAI and/or its affiliates, and not the Fund, will bear the costs regarding these regulatory matters.
NOTE 6. SUBSEQUENT EVENT (unaudited)
Effective November 7, 2005, the Expense Limit for the Fund's Class I shares is 1.30%.
Transamerica IDEX Mutual Funds
Annual Report 2005
15
Report of Independent Registered Certified Public Accounting Firm
To the Board of Trustees and Shareholders of
TA IDEX PIMCO Real Return TIPS
In our opinion, the accompanying statement of assets and liabilities, including the schedule of investments, and the related statements of operations and of changes in net assets and the financial highlights present fairly, in all material respects, the financial position of TA IDEX PIMCO Real Return TIPS (the "Fund") (one of the portfolios constituting the Transamerica IDEX Mutual Funds) at October 31, 2005, the results of its operations for the year then ended, the changes in its net assets for each of the two years in the period then ended and the financial highlights for each of the periods presented, in conformity with accounting principles generally accepted in the United States of America. These financial statements and financial highlights (hereafter referred to as "financial statements") are the responsibility of the Fund's management; our responsibility is to express an opinion on these f inancial statements based on our audits. We conducted our audits of these financial statements in accordance with the standards of the Public Company Accounting Oversight Board (United States). Those standards require that we plan and perform the audit to obtain reasonable assurance about whether the financial statements are free of material misstatement. An audit includes examining, on a test basis, evidence supporting the amounts and disclosures in the financial statements, assessing the accounting principles used and significant estimates made by management, and evaluating the overall financial statement presentation. We believe that our audits, which included confirmation of securities at October 31, 2005 by correspondence with the custodian and brokers, provide a reasonable basis for our opinion.

December 22, 2005
Transamerica IDEX Mutual Funds
Annual Report 2005
16
TA IDEX PIMCO Real Return TIPS
SUPPLEMENTAL INFORMATION (unaudited)
TAX INFORMATION
For dividends paid during the year ended October 31, 2005, the Fund designated $35 as qualified dividend income.
For tax purposes, the Fund has made a Long-Term Capital Gain Designation of $233 for the year ended October 31, 2005.
The information and distributions reported herein may differ from the information and distributions taxable to the shareholders for the calendar year ending December 31, 2005. Complete information will be computed and reported in conjunction with your 2005 Form 1099-DIV.
Transamerica IDEX Mutual Funds
Annual Report 2005
17
TA IDEX PIMCO Total Return
MARKET ENVIRONMENT
At the start of the reporting period all fixed income sectors gained, as mortgages, corporates, and emerging market bonds outperformed. In early 2005, the fixed income market gave up prior gains, as bonds lost ground due to volatile interest rates and weakness in the credit markets related to concerns about the financial outlook for General Motors Corporation.
By mid-year of the period, bonds rebounded, as risk appetites for credit-sensitive assets revived. The unusual phenomenon of falling longer-dated yields amid a tightening cycle of increasing federal funds, dubbed a "conundrum" by Federal Reserve Board ("Fed") Chairman Alan Greenspan, was driven by: 1) weakness in manufacturing data signaling a potential slow down in the U.S. economy; 2) Asian central banks buying Treasuries to keep their currencies from appreciating versus the U.S. dollar; and 3) demand from U.S. pension funds looking to reduce the mismatch between their assets and liabilities. Towards the end of the twelve-month period, much of the rebound was given up as Treasury yields trended higher on signs of stronger economic data and a sustained economic expansion.
During the period the yield curve continued to flatten as the Fed continued with its "measured" tightening process, even after hurricanes in the Gulf Coast. Although measures of inflation excluding energy and food remained relatively tame, the Fed still noted inflation pressure as oil prices surged toward $70 a barrel and other commodity prices climbed sharply as well. In this environment the Fed continued to increase the federal funds rate target to 3.75% by the end of the period.
PERFORMANCE
For the year ended October 31, 2005, TA IDEX PIMCO Total Return, Class A returned 0.86%. By comparison its benchmark, the Lehman Brothers Aggregate Bond Index ("LBAB") returned 1.13%.
STRATEGY REVIEW
PIMCO's investment process is based upon a long-term approach, which utilizes both "top-down" and "bottom-up" strategies. Top-down strategies focus on duration, yield curve positioning, volatility and sector rotation while bottom-up strategies drive our security selection process and facilitate the identification and analysis of undervalued securities. As we believe that no single strategy should dominate returns, our Total Return strategy relies on multiple sources of value added in a highly diversified portfolio.
During the twelve month period the portfolio's performance was relatively stable despite a volatile market, as we employed defensive interest-rate and sector strategies together with broad diversification to help preserve value. We maintained a focus on quality, as the average credit rating of securities in the portfolio was held at AA or higher quality during the reporting period.
The portfolio benefited from our tactical adjustments and holdings in non-Index securities, which more than offset the negative impact of an underweight in the strong-performing corporate sector. During the period, we felt that core bond securities (those contained in the LBAB) presented limited buying opportunities due to their rich valuation relative to Treasuries. Therefore, we focused on securities not contained in the LBAB, such as emerging markets and non U.S. holdings with an emphasis on European bonds.
In this environment, tactical moves with the portfolio's duration around the LBAB were neutral given the interest rate volatility during the year. Our exposure to select securities with short-term maturities also added value during the reporting period, as these yields rose less than the markets expected when the Fed raised short-term interest rates. In this environment, underweighting corporates hurt returns as investors anxious to boost yield were drawn to these assets, although security selection added to returns. Within the mortgage sector security selection added to returns. An allocation to European bonds helped returns as yields fell, as prospects for weaker growth than in the U.S. supported these markets. A tactical allocation to Treasury Inflation Protected securities (TIPs) outperformed U.S. Treasury securities over the period. Holdings of municipal bonds helped returns as retail and insuranc e company demand remained strong. Exposure to emerging market issues was a strong positive as these markets benefited from improving economic fundamentals, continued credit quality upgrades and spreads tightening to historic lows.
William H. Gross, CFA
Mohamed El-Erian, PhD
Co- Fund Managers
Pacific Investment Management Co. LLC
Transamerica IDEX Mutual Funds
Annual Report 2005
1
TA IDEX PIMCO Total Return
Comparison of change in value of $10,000 investment in Class A shares and its comparative index.

Average Annual Total Return for Periods Ended 10/31/05
| | | 1 year | | From
Inception | | Inception
Date | |
| Class A (NAV) | | | 0.86 | % | | | 4.25 | % | | 3/1/02 | |
| Class A (POP) | | | (3.93 | )% | | | 2.88 | % | | 3/1/02 | |
| LBAB1 | | | 1.13 | % | | | 4.82 | % | | 3/1/02 | |
| Class B (NAV) | | | 0.07 | % | | | 3.58 | % | | 3/1/02 | |
| Class B (POP) | | | (4.79 | )% | | | 3.08 | % | | 3/1/02 | |
| Class C (NAV) | | | 0.00 | %* | | | 2.86 | % | | 11/11/02 | |
| Class C (POP) | | | (0.97 | )% | | | 2.86 | % | | 11/11/02 | |
NOTES
1 The Lehman Brothers Aggregate Bond (LBAB) Index is an unmanaged index used as a general measure of market performance. Calculations assume dividends and capital gains are reinvested and do not include any managerial expenses. From inception calculation is based on life of Class A shares. Source: Standard & Poor's Micropal®© Micropal, Inc. 2005 – 1-800-596-5323 – http://www.fund-sp.com.
* Rounds to less than 0.01%.
The performance data presented represents past performance, future results may vary. Performance data does not reflect the deduction of taxes that would be paid on fund distributions or the redemption of fund shares. Investment return and principal value will fluctuate so that an investor's shares, when redeemed, may be worth more or less than their original cost. Current performance may be lower or higher than performance quoted. Please see www.transamericaidex.com for performance data current to the most recent month-end.
Public Offering Price (POP) returns include the reinvestment of dividends and capital gains and reflect the maximum sales charge of 4.75% for A shares or the maximum applicable contingent deferred sales charge (5% in the 1st year, decreasing to 0% after 6 years) for Class B shares and 1% (during the first 12 months) for Class C shares. Shares purchased prior to March 1, 2004 are subject to a maximum applicable contingent deferred sales charge (5% in the 1st year, decreasing to 0% after 7 years) for Class B shares and (2% in the 1st year, decreasing to 0% after 2 years) for Class C shares. Net Asset Value (NAV) returns include the reinvestment of dividends and capital gains but do not reflect any sales charges.
This material must be preceded or accompanied by a current prospectus, which includes specific contents regarding the investment objectives and policies of this fund.
Transamerica IDEX Mutual Funds
Annual Report 2005
2
TA IDEX PIMCO Total Return
UNDERSTANDING YOUR FUND'S EXPENSES
(unaudited)
SHAREHOLDER EXPENSES
Fund shareholders may incur two types of costs: (1) transaction costs, including sales charges (loads) on purchases, contingent deferred sales charges on redemptions and redemption fees; and (2) ongoing costs, including management fees, 12b-1 distribution and service fees, and other fund expenses.
The following Example is intended to help you understand your ongoing costs (in dollars and cents) of investing in a Fund and to compare these costs with the ongoing costs of investing in other funds.
The Example is based on an investment of $1,000 invested at May 1, 2005 and held for the entire period until October 31, 2005.
ACTUAL EXPENSES
The first line in the table below provides information about actual account values and actual expenses. You may use the information in this line, together with the amount you invested, to estimate the expenses that you paid over the period. Simply divide your account value by $1,000 (for example, an $8,600 account value divided by $1,000 = 8.6), then multiply the result by the number in the first line of your Fund under the heading entitled "Expenses Paid During Period" to estimate the expenses you paid on your account during this period. If your account is an IRA, your expenses could have included a $15 annual fee. The amount of any fee paid through your account would increase the estimate of expenses you paid during the period and decrease your ending account value.
HYPOTHETICAL EXAMPLE FOR COMPARISON PURPOSES
The second line in the table below provides information about hypothetical account values and hypothetical expenses based on the Fund's actual expense ratio and an assumed rate of return of 5% per year before expenses, which is not the Fund's actual return. The hypothetical account values and expenses may not be used to estimate the actual ending account balance or expenses you paid for the period. You may use this information to compare the ongoing costs of investing in your Fund and other funds. To do so, compare this 5% hypothetical example with the 5% hypothetical examples that appear in the shareholder reports of the other funds. As in the case of the actual expense example, if your account is subject to an IRA fee, the amount of the fee paid through your account would increase the hypothetical expenses you would have paid during the period and decrease the hypothetical ending account value.
Please note that the expenses shown in the table are meant to highlight your ongoing costs only and do not reflect any transactional costs, such as sales charges, redemption fees, brokerage commissions paid on purchases and sales of fund shares. Therefore, the second line under the Fund in the table is useful in comparing ongoing costs only, and will not help you determine the relative total costs of owning different funds. If any of these transaction costs were included, your costs would be higher. The expenses shown in the table do not reflect any fees that may be charged to you by brokers, financial intermediaries or other financial institutions.
| | | Beginning
Account
Value | | Ending
Account
Value | | Annualized
Expense
Ratio | | Expenses Paid
During Period (a) | |
| Class A | | | |
| Actual | | $ | 1,000.00 | | | $ | 998.60 | | | | 1.19 | % | | $ | 5.99 | | |
| Hypothetical (b) | | | 1,000.00 | | | | 1,019.21 | | | | 1.19 | | | | 6.06 | | |
| Class B | | | |
| Actual | | | 1,000.00 | | | | 994.10 | | | | 2.19 | | | | 11.01 | | |
| Hypothetical (b) | | | 1,000.00 | | | | 1,014.17 | | | | 2.19 | | | | 11.12 | | |
| Class C | | | |
| Actual | | | 1,000.00 | | | | 994.70 | | | | 2.07 | | | | 10.41 | | |
| Hypothetical (b) | | | 1,000.00 | | | | 1,014.77 | | | | 2.07 | | | | 10.51 | | |
(a) Expenses are calculated using each Fund's annualized expense ratio (as disclosed in the table), multiplied by the average account value for the period, multiplied by number of days in the period (184 days), and divided by the number of days in the year (365 days).
(b) 5% return per year before expenses.
GRAPHICAL PRESENTATION OF SCHEDULE OF INVESTMENTS
By Bond Type
At October 31, 2005
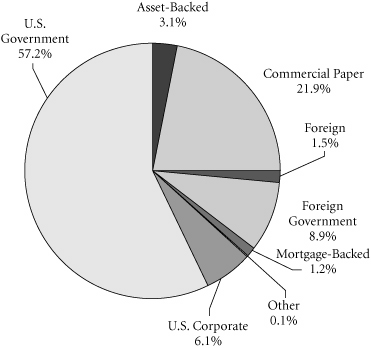
This chart shows the percentage breakdown by bond type of the Fund's total investment securities.
Transamerica IDEX Mutual Funds
Annual Report 2005
3
TA IDEX PIMCO Total Return
SCHEDULE OF INVESTMENTS
At October 31, 2005
(all amounts except share amounts in thousands)
| | | Principal | | Value | |
| U.S. GOVERNMENT OBLIGATIONS (11.8%) | | | |
U.S. Treasury Bond
| |
| 8.75%, due 05/15/2017 | | $ | 1,313 | | | $ | 1,783 | | |
| 7.88%, due 02/15/2021 | | | 200 | | | | 266 | | |
| 8.13%, due 05/15/2021 | | | 600 | | | | 816 | | |
| 8.00%, due 11/15/2021 | | | 2,000 | | | | 2,705 | | |
| 6.00%, due 02/15/2026 | | | 530 | | | | 609 | | |
| 5.25%, due 02/15/2029 | | | 500 | | | | 530 | | |
U.S. Treasury Inflation Indexed Bond
1.88%, due 07/15/2013
2.00%, due 07/15/2014
1.88%, due 07/15/2015
2.38%, due 01/15/2025 | | | 160
521
2,423
375 | | | | 160
522
2,398
390 | | |
U.S. Treasury Note
3.50%, due 02/15/2010
3.88%, due 09/15/2010
4.25%, due 08/15/2013
4.13%, due 05/15/2015 | | | 2,000
160
5,200
1,300 | | | | 1,925
156
5,100
1,255 | | |
| Total U.S. Government Obligations (cost: $18,994) | | | | | | | 18,615 | | |
| U.S. GOVERNMENT AGENCY OBLIGATIONS (44.5%) | | | |
Fannie Mae
5.50%, due 07/01/2016
5.50%, due 12/01/2016
5.50%, due 01/01/2017
5.50%, due 02/01/2017
5.50%, due 05/01/2017
5.00%, due 11/01/2017
5.00%, due 02/01/2018
5.00%, due 03/01/2018
5.00%, due 05/01/2018
5.00%, due 06/01/2018
5.00%, due 08/01/2018
5.00%, due 05/01/2019
5.00%, due 09/01/2019
5.00%, due 10/01/2019
5.00%, due 11/01/2019
5.00%, due 12/01/2019
4.93%, due 01/01/2028 *
5.50%, due 11/01/2032
5.50%, due 01/01/2033
5.16%, due 04/01/2033 *
5.50%, due 04/01/2033
5.50%, due 07/01/2033
5.50%, due 08/01/2033
5.50%, due 11/01/2033
5.50%, due 01/01/2034
5.50%, due 04/01/2034 | | | 292
93
110
121
137
799
247
766
47
1,096
211
336
269
497
951
326
136
2,650
801
44
5,546
228
260
55
578
5,381 | | | | 294
94
111
122
138
789
243
756
47
1,082
208
331
266
491
938
321
139
2,620
791
44
5,480
226
256
55
571
5,317 | | |
| | | Principal | | Value | |
| 5.50%, due 05/01/2034 | | $ | 3,015 | | | $ | 2,980 | | |
| 5.50%, due 06/01/2034 | | | 44 | | | | 43 | | |
| 5.50%, due 09/01/2034 | | | 374 | | | | 369 | | |
| 5.50%, due 11/01/2034 | | | 2,817 | | | | 2,781 | | |
| 5.50%, due 01/01/2035 | | | 4,250 | | | | 4,195 | | |
| 5.50%, due 02/01/2035 | | | 14,412 | | | | 14,231 | | |
| 5.50%, due 03/01/2035 | | | 1,137 | | | | 1,122 | | |
| 5.50%, due 04/01/2035 | | | 1,774 | | | | 1,750 | | |
| 5.50%, due 05/01/2035 | | | 1,835 | | | | 1,811 | | |
| 5.50%, due 06/01/2035 | | | 1,642 | | | | 1,621 | | |
| 5.50%, due 07/01/2035 | | | 743 | | | | 733 | | |
| 5.50%, due 08/01/2035 | | | 658 | | | | 650 | | |
| 5.50%, due 09/01/2035 | | | 649 | | | | 641 | | |
| 5.00%, due 10/01/2035 | | | 7,000 | | | | 6,738 | | |
| 5.50%, due 10/01/2035 | | | 1,859 | | | | 1,835 | | |
| 5.50%, due 11/01/2035 | | | 307 | | | | 303 | | |
Fannie Mae, Series 2003-88 TB
3.00%, due 08/25/2009 | | | 76 | | | | 76 | | |
Freddie Mac
6.50%, due 03/15/2029
6.50%, due 04/15/2029 | | | 10
20 | | | | 10
20 | | |
Freddie Mac, Series 2572, Class HA
5.00%, due 06/15/2013 | | | 85 | | | | 85 | | |
Freddie Mac, Series T-057, Class 1A1
6.50%, due 07/25/2043 | | | 58 | | | | 59 | | |
Freddie Mac, Series T-62, Class 1A1
4.07%, due 10/25/2044 * | | | 2,080 | | | | 2,082 | | |
Ginnie Mae
6.50%, due 07/15/2023
6.50%, due 02/15/2028
6.50%, due 06/15/2029
6.50%, due 01/15/2030
5.50%, due 03/15/2032
5.50%, due 12/15/2032
5.50%, due 12/15/2033
5.50%, due 02/15/2034 | | | 8
237
293
10
79
196
368
1,540 | | | | 8
246
305
11
79
196
368
1,538 | | |
Ginnie Mae, Series 2020-40
6.50%, due 06/20/2032 | | | 50 | | | | 50 | | |
Ginnie Mae-November TBA
5.50%, due 11/01/2035 | | | 1,500 | | | | 1,498 | | |
| Total U.S. Government Agency Obligations (cost: $71,500) | | | | | | | 70,164 | | |
| FOREIGN GOVERNMENT OBLIGATIONS (8.9%) | | | |
Canada Government
0.70%, due 03/20/2006 | | JPY | 48,000 | | | | 414 | | |
Federal Republic of Germany
Zero coupon, due 01/18/2006 | | EUR | 2,200 | | | | 2,624 | | |
The notes to the financial statements are an integral part of this report.
Transamerica IDEX Mutual Funds
Annual Report 2005
4
TA IDEX PIMCO Total Return
SCHEDULE OF INVESTMENTS (continued)
At October 31, 2005
(all amounts except share amounts in thousands)
| | | Principal | | Value | |
French Republic
Zero coupon, due 01/05/2006 | | EUR | 2,300 | | | $ | 2,745 | | |
Hong Kong Government–144A
5.13%, due 08/01/2014 | | $ | 400 | | | | 397 | | |
Italian Republic
0.38%, due 10/10/2006 | | JPY | 80,000 | | | | 689 | | |
Kingdom of Spain
3.10%, due 09/20/2006 | | JPY | 30,000 | | | | 265 | | |
Kingdom of the Netherlands
Zero coupon, due 11/30/2005 | | EUR | 2,200 | | | | 2,633 | | |
Korea Highway Corp.–144A
5.13%, due 05/20/2015 | | $ | 200 | | | | 195 | | |
Malaysia Government
7.50%, due 07/15/2011 | | | 10 | | | | 11 | | |
Republic of Brazil
5.16%, due 04/15/2006 *
11.50%, due 03/12/2008
5.25%, due 04/15/2009 *
9.76%, due 06/29/2009 *
11.00%, due 01/11/2012
5.25%, due 04/15/2012 *
8.00%, due 01/15/2018
11.00%, due 08/17/2040 | | | 72
122
226
350
200
245
263
150 | | | | 72
137
224
408
238
239
271
180 | | |
Republic of Panama
8.25%, due 04/22/2008 | | | 390 | | | | 414 | | |
Republic of Peru
9.13%, due 02/21/2012
5.00%, due 03/07/2017 * | | | 170
147 | | | | 196
138 | | |
Republic of South Africa
5.25%, due 05/16/2013 | | EUR | 90 | | | | 117 | | |
Russian Federation
5.00%, due 03/31/2030 (a) | | $ | 1,109 | | | | 1,233 | | |
United Mexican States
4.83%, due 01/13/2009 *
9.88%, due 02/01/2010
6.38%, due 01/16/2013 | | | 65
75
75 | | | | 66
88
79 | | |
| Total Foreign Government Obligations (cost: $14,034) | | | | | | | 14,073 | | |
| MORTGAGE-BACKED SECURITIES (1.1%) | | | |
Bank of America Mortgage Securities,
Series 2002-K, Class 2A1
5.49%, due 10/20/2032 * | | | 61 | | | | 61 | | |
Bear Stearns Adjustable Rate Mortgage Trust,
Series 2002-5, Class VIA
5.93%, due 06/25/2032 * | | | 12 | | | | 12 | | |
Bear Stearns Adjustable Rate Mortgage
Trust, Series 2003-8, Class 1A1
4.21%, due 01/25/2034 * | | | 253 | | | | 250 | | |
| | | Principal | | Value | |
Bear Stearns Adjustable Rate Mortgage Trust,
Series 2003-8, Class 2A1
4.83%, due 01/25/2034 * | | $ | 78 | | | $ | 77 | | |
Bear Stearns Adjustable Rate Mortgage Trust,
Series 2003-8, Class 4A1
4.70%, due 01/25/2034 * | | | 131 | | | | 128 | | |
Centex Home Equity,
Series 2004-A, Class AV2
4.32%, due 01/25/2034 * | | | 32 | | | | 32 | | |
Countrywide Alternative Loan Trust,
Series 2003-J11, Class 4A1
6.00%, due 10/25/2032 | | | 19 | | | | 19 | | |
Countrywide Home Loan Mortgage Pass
Through Trust, Series 2002-30, Class M
3.87%, due 10/19/2032 * | | | 121 | | | | 119 | | |
Countrywide Home Loan Mortgage Pass
Through Trust, Series 2004-7, Class 1A2
4.31%, due 05/25/2034 * | | | 27 | | | | 27 | | |
Credit Suisse First Boston Mortgage Securities
Corp., Series 2002, Class P-3
1.90%, due 08/25/2033 | | | 162 | | | | 163 | | |
Credit Suisse First Boston Mortgage Securities
Corp., Series 2002-P1, Class A1
1.53%, due 03/28/2032 | | | 7 | | | | 7 | | |
Credit Suisse First Boston Mortgage Securities
Corp., Series 2002-P2A, Class A2
2.14%, due 03/25/2032 | | | 65 | | | | 64 | | |
Home Equity Asset Trust,
Series 2002-1, Class A4
4.34%, due 11/25/2032 * | | | 1 | | | | 1 | | |
KBC Bank Fund Trust III Preferred–144A
9.86%, due 11/29/2049 (b) | | | 15 | | | | 17 | | |
Residential Funding Mortgage Securities I,
Series 2003-S9, Class A1
6.50%, due 03/25/2032 | | | 20 | | | | 20 | | |
Structured Asset Mortgage Investments, Inc.,
Series 2002-AR3, Class A-1
4.33%, due 09/19/2032 * | | | 125 | | | | 125 | | |
Structured Asset Securities Corp.,
Series 2002-HF1, Class A
4.33%, due 01/25/2033 * | | | 4 | | | | 4 | | |
Soundview Home Equity Loan Trust,
Series 2005-B, Class A1
4.15%, due 02/25/2035 * | | | 700 | | | | 701 | | |
| Total Mortgage-Backed Securities (cost: $1,843) | | | | | | | 1,827 | | |
The notes to the financial statements are an integral part of this report.
Transamerica IDEX Mutual Funds
Annual Report 2005
5
TA IDEX PIMCO Total Return
SCHEDULE OF INVESTMENTS (continued)
At October 31, 2005
(all amounts except share amounts in thousands)
| | | Principal | | Value | |
| ASSET-BACKED SECURITIES (3.2%) | | | |
Amortizing Residential Collateral Trust,
Series 2002-BC4, Class A
4.33%, due 07/25/2032 * | | $ | 4 | | | $ | 4 | | |
Bear Stearns Asset Backed Securities, Inc.,
Series 2002-2, Class A1
4.37%, due 10/25/2032 * | | | 33 | | | | 33 | | |
Countrywide Asset-Backed Certificates,
Series 2005-SD1, Class A1A–144A
4.19%, due 05/25/2035 * | | | 88 | | | | 88 | | |
First Horizon Asset Securities, Inc.,
Series 2000-H, Class IA
7.00%, due 09/25/2030 | | | 1 | | | | 1 | | |
GSR Mortgage Loan Trust,
Series 2005-AR6, Class 2A1
4.54%, due 09/25/2035 * | | | 343 | | | | 337 | | |
Morgan Stanley ABS Capital I,
Series 2003-HE2, Class A2
4.38%, due 08/25/2033 * | | | 51 | | | | 51 | | |
Park Place Securities, Inc.,
Series 2005-WHQ4, Class A2A
4.15%, due 08/25/2035 * | | | 375 | | | | 375 | | |
Quest Trust,
Series 2004-X2, Class A–144A
4.60%, due 06/25/2034 * | | | 80 | | | | 81 | | |
Rabobank Capital Funding II–144A
5.26%, due 12/31/2049 (c) | | | 210 | | | | 208 | | |
Rabobank Capital Funding Trust III–144A
5.25%, due 12/31/2049 (d) | | | 280 | | | | 270 | | |
RACERS Series 1997-R-8-3–144A
4.09%, due 08/15/2007 *§ | | | 300 | | | | 287 | | |
Sequoia Mortgage Trust,
Series 10, Class 2A1
4.38%, due 10/20/2027 * | | | 227 | | | | 228 | | |
Small Business Administration
Participation, Series 2003-201
5.13%, due 09/01/2023 | | | 89 | | | | 89 | | |
Small Business Administration,
Series 2004-20C
4.34%, due 03/01/2024 | | | 550 | | | | 527 | | |
Small Business Administration,
Series 2004-P10, Class A
4.50%, due 02/10/2014 | | | 276 | | | | 269 | | |
Washington Mutual,
Series 2000-3, Class A
4.52%, due 12/25/2040 * | | | 124 | | | | 123 | | |
| | | Principal | | Value | |
Washington Mutual,
Series 2002-AR10, Class A6
4.82%, due 10/25/2032 * | | $ | 19 | | | $ | 19 | | |
Washington Mutual,
Series 2002-AR2, Class A
4.12%, due 02/27/2034 * | | | 49 | | | | 48 | | |
Washington Mutual,
Series 2003-R1, Class A1
4.31%, due 12/25/2027 * | | | 1,961 | | | | 1,959 | | |
| Total Asset-Backed Securities (cost: $5,058) | | | | | | | 4,997 | | |
| CORPORATE DEBT SECURITIES (7.4%) | | | |
| Air Transportation (0.4%) | | | |
Continental Airlines, Inc.
7.06%, due 09/15/2009 | | | 200 | | | | 200 | | |
UAL Corp.
6.20%, due 09/01/2008
6.60%, due 09/01/2013 | | | 285
124 | | | | 276
121 | | |
| Commercial Banks (0.4%) | | | |
China Development Bank
5.00%, due 10/15/2015 | | | 100 | | | | 97 | | |
Export-Import Bank of China–144A
5.25%, due 07/29/2014 | | | 250 | | | | 248 | | |
HSBC Capital Funding LP–144A
10.18%, due 12/31/2049 (e) | | | 150 | | | | 225 | | |
Sumitomo Mitsui Banking–144A
5.63%, due 07/15/2049 (f) | | | 150 | | | | 147 | | |
| Communication (0.1%) | | | |
Continental Cablevision, Inc.
8.30%, due 05/15/2006 | | | 100 | | | | 102 | | |
| Electric Services (0.4%) | | | |
Florida Power Corp.
4.80%, due 03/01/2013 | | | 450 | | | | 436 | | |
PSEG Power LLC
6.95%, due 06/01/2012 | | | 210 | | | | 225 | | |
| Electric, Gas & Sanitary Services (0.3%) | | | |
Entergy Gulf States, Inc.
5.70%, due 06/01/2015 | | | 200 | | | | 193 | | |
Niagara Mohawk Power Corp.
7.75%, due 10/01/2008 | | | 250 | | | | 269 | | |
| Environmental Services (0.0%) | | | |
Waste Management, Inc.
6.38%, due 11/15/2012 | | | 75 | | | | 79 | | |
| Food & Kindred Products (0.2%) | | | |
Heinz (H.J.) Co.–144A
6.19%, due 12/01/2020 § | | | 300 | | | | 300 | | |
The notes to the financial statements are an integral part of this report.
Transamerica IDEX Mutual Funds
Annual Report 2005
6
TA IDEX PIMCO Total Return
SCHEDULE OF INVESTMENTS (continued)
At October 31, 2005
(all amounts except share amounts in thousands)
| | | Principal | | Value | |
| Gas Production & Distribution (0.4%) | |
El Paso Energy Corp.
7.75%, due 01/15/2032 † | | $ | 125 | | | $ | 124 | | |
Ras Laffan Liquefied Natural
Gas Co., Ltd.–144A
3.44%, due 09/15/2009 | | | 75 | | | | 72 | | |
Sonat, Inc.
7.63%, due 07/15/2011 | | | 370 | | | | 372 | | |
Southern Natural Gas Co.
8.00%, due 03/01/2032 | | | 100 | | | | 107 | | |
| General Obligation-City (0.2%) | |
Chicago, IL, Board of Education
5.00%, due 12/01/2012 | | | 255 | | | | 273 | | |
| Hotels & Other Lodging Places (0.4%) | |
Harrah's Operating Co., Inc.
7.50%, due 01/15/2009 | | | 10 | | | | 11 | | |
Park Place Entertainment Corp.
7.50%, due 09/01/2009 | | | 350 | | | | 373 | | |
Starwood Hotels & Resorts Worldwide, Inc.
7.88%, due 05/01/2012 | | | 200 | | | | 215 | | |
| Mortgage Bankers & Brokers (0.1%) | |
Petroleum Export/Cayman–144A
5.27%, due 06/15/2011 | | | 175 | | | | 173 | | |
| Motion Pictures (0.1%) | |
Time Warner, Inc.
8.11%, due 08/15/2006
6.88%, due 05/01/2012 | | | 200
20 | | | | 205
21 | | |
| Municipal Obligations (0.3%) | |
Fairfax County, VA
7.54%, due 04/01/2013 | | | 45 | | | | 54 | | |
Tobacco Settlement Financing Corp., VA
5.25%, due 06/01/2019
5.50%, due 06/01/2026 | | | 200
200 | | | | 203
206 | | |
| Oil & Gas Extraction (0.4%) | |
Gaz Capital for Gazprom
8.63%, due 04/28/2034 | | | 500 | | | | 629 | | |
| Paper & Allied Products (0.4%) | |
Bowater Canada Finance Corp.
7.95%, due 11/15/2011 | | | 10 | | | | 10 | | |
Smurfit-Stone Container Corp.
8.38%, due 07/01/2012 | | | 600 | | | | 573 | | |
| Personal Credit Institutions (0.5%) | |
Ford Motor Credit Co.
6.88%, due 02/01/2006 | | | 700 | | | | 700 | | |
| | | Principal | | Value | |
General Motors Acceptance Corp.
| |
| 4.68%, due 05/18/2006 * | | $ | 10 | | | $ | 10 | | |
| 5.05%, due 01/16/2007 * | | | 40 | | | | 39 | | |
| Petroleum Refining (0.1%) | | | |
Enterprise Products Operating, LP
4.95%, due 06/01/2010 | | | 100 | | | | 97 | | |
| Railroads (0.0%) | | | |
Burlington Northern Santa Fe Corp.
6.38%, due 12/15/2005 | | | 40 | | | | 40 | | |
| Revenue-Building Authority (0.3%) | | | |
Liberty, NY, Development Corp.
5.25%, due 10/01/2035 | | | 400 | | | | 438 | | |
| Revenue-Education (0.1%) | | | |
Michigan State Building Authority
5.25%, due 10/15/2013 | | | 180 | | | | 197 | | |
| Revenue-Tobacco (1.0%) | | | |
Golden State Tobacco Securitization Corp.
6.75%, due 06/01/2039
7.90%, due 06/01/2042 | | | 80
35 | | | | 91
43 | | |
Tobacco Settlement Authority, IA
5.60%, due 06/01/2035 | | | 100 | | | | 102 | | |
Tobacco Settlement Financing Corp.
6.00%, due 06/01/2037 | | | 730 | | | | 765 | | |
Tobacco Settlement Financing Corp., LA
5.88%, due 05/15/2039 | | | 40 | | | | 42 | | |
Tobacco Settlement Financing Corp., NJ
6.38%, due 06/01/2032 | | | 420 | | | | 472 | | |
| Revenue-Utilities (0.3%) | | | |
New York, NY, City Municipal Water
Finance Authority
5.00%, due 06/15/2035 | | | 90 | | | | 92 | | |
San Antonio, Texas, Texas Water Utility
Improvements, Revenue Bonds, Series A
5.00%, due 05/15/2032 | | | 450 | | | | 459 | | |
| Telecommunications (1.0%) | | | |
Cingular Wireless LLC
6.50%, due 12/15/2011 | | | 180 | | | | 192 | | |
Deutsche Telekom International Finance BV
8.13%, due 05/29/2012 (g) | | | 124 | | | | 187 | | |
France Telecom SA
7.00%, due 03/14/2008 (h) | | | 307 | | | | 400 | | |
KT Corp.–144A
4.88%, due 07/15/2015 | | | 200 | | | | 190 | | |
SBC Communications, Inc.
4.13%, due 09/15/2009 | | | 575 | | | | 554 | | |
| Total Corporate Debt Securities (cost: $11,037) | | | | | | | 11,649 | | |
The notes to the financial statements are an integral part of this report.
Transamerica IDEX Mutual Funds
Annual Report 2005
7
TA IDEX PIMCO Total Return
SCHEDULE OF INVESTMENTS (continued)
At October 31, 2005
(all amounts except share amounts in thousands)
| | | Principal | | Value | |
| SHORT-TERM U.S. GOVERNMENT OBLIGATIONS (0.4%) | | | |
U.S. Treasury Bill
| |
| 3.50%, due 12/01/2005 d | | $ | 399 | | | $ | 399 | | |
| 3.31%, due 12/15/2005 # | | | 50 | | | | 50 | | |
| 3.33%, due 12/15/2005 # | | | 20 | | | | 20 | | |
| 3.43%, due 12/15/2005 d | | | 95 | | | | 94 | | |
| 3.58%, due 12/15/2005 | | | 20 | | | | 20 | | |
| Total Short-Term U.S. Government Obligations (cost: $583) | | | | | | | 583 | | |
| COMMERCIAL PAPER (21.7%) | | | |
| Commercial Banks (18.7%) | | | |
ANZ National International, Ltd.–144A
3.75%, due 12/12/2005
4.08%, due 01/12/2006 | | | 500
1,100 | | | | 498
1,091 | | |
Barclays U.S. Funding Corp.
4.20%, due 02/27/2006 | | | 1,000 | | | | 986 | | |
BNP Paribas Finance, Inc.
3.75%, due 12/12/2005
4.16%, due 02/27/2006 | | | 3,200
600 | | | | 3,186
592 | | |
CBA (Delaware) Finance, Inc.
3.91%, due 12/28/2005 | | | 1,700 | | | | 1,690 | | |
Danske Corp.
3.74%, due 12/12/2005 | | | 1,100 | | | | 1,095 | | |
DNB NOR Bank ASA
3.59%, due 11/18/2005
3.80%, due 12/23/2005 | | | 300
400 | | | | 300
398 | | |
HBOS Treasury Services
3.69%, due 11/14/2005
3.75%, due 12/01/2005 | | | 100
1,800 | | | | 100
1,794 | | |
Nordea North America, Inc.
4.08%, due 01/20/2006 | | | 800 | | | | 793 | | |
Royal Bank of Scotland
3.74%, due 12/01/2005 | | | 1,700 | | | | 1,695 | | |
Skandinaviska Enskilda Banken AB–144A
3.72%, due 12/08/2005
3.80%, due 12/30/2005 | | | 1,300
2,200 | | | | 1,295
2,186 | | |
Societe Generale North America, Inc.
3.77%, due 12/19/2005
3.78%, due 12/23/2005 | | | 1,500
900 | | | | 1,492
895 | | |
Swedbank
3.73%, due 12/12/2005 | | | 2,300 | | | | 2,290 | | |
UBS Finance Delaware LLC
3.59%, due 11/21/2005
3.76%, due 12/19/2005 | | | 3,000
1,800 | | | | 2,994
1,791 | | |
Westpac Capital Corp.
3.70%, due 11/14/2005 | | | 2,300 | | | | 2,297 | | |
| | | Principal | | Value | |
| Holding & Other Investment Offices (3.0%) | |
| Rabobank USA Finance Corp. | | | | | | |
| | |
| 3.62%, due 11/28/2005 | | $ | 1,500 | | | $ | 1,496 | | |
| 3.86%, due 12/23/2005 | | | 1,800 | | | | 1,790 | | |
San Paolo IMI US Financial Co.
4.14%, due 02/24/2006 | | | 1,500 | | | | 1,480 | | |
| Total Commercial Paper (cost: $34,224) | | | | | | | 34,224 | | |
| | | Contracts w | | Value | |
| PURCHASED OPTIONS (0.1%) | |
| Covered Call Swaptions (0.1%) | |
| LIBOR Rate Swaption § | | | 20,000 | | | $ | 23 | | |
| Call Strike $4.50 | | | | | | |
| | |
| Expires 04/04/2006 | |
LIBOR Rate Swaption §
Call Strike $4.50
Expires 10/04/2006 | | | 24,000
| | | | 71
| | |
| Put Options (0.0%) | |
90-Day Euro Dollar Futures
Put Strike $93.75
Expires 12/19/2005 | | | 94
| | | | 1
| | |
90-Day Euro Dollar Futures
Put Strike $94.25
Expires 12/19/2005 | | | 49
| | | | -o
| | |
| Total Purchased Options (cost: $188) | | | | | | | 95 | | |
| SECURITY LENDING COLLATERAL (0.1%) | |
| Debt (0.1%) | |
| Bank Notes (0.0%) | |
Bank of America
3.81%, due 06/07/2006 *
3.81%, due 08/10/2006 * | | | 4
4 | | | | 4
4 | | |
Credit Suisse First Boston Corp.
4.11%, due 03/10/2006 * | | | 1 | | | | 1 | | |
| Certificates Of Deposit (0.0%) | |
Canadian Imperial Bank of Commerce
4.07%, due 11/04/2005 * | | | 3 | | | | 3 | | |
Harris Trust & Savings Bank
3.80%, due 11/04/2005 * | | | 2 | | | | 2 | | |
Rabobank Nederland
4.03%, due 05/31/2006 * | | | 4 | | | | 4 | | |
| Commercial Paper (0.0%) | |
Ciesco LLC
4.00%, due 11/03/2005 | | | 4 | | | | 4 | | |
General Electric Capital Corp.
3.96%, due 12/05/2005 | | | 3 | | | | 3 | | |
Paradigm Funding LLC–144A
4.01%, due 11/07/2005 | | | 3 | | | | 3 | | |
The notes to the financial statements are an integral part of this report.
Transamerica IDEX Mutual Funds
Annual Report 2005
8
TA IDEX PIMCO Total Return
SCHEDULE OF INVESTMENTS (continued)
At October 31, 2005
(all amounts except share amounts in thousands)
| | | Contracts w | | Value | |
Park Avenue Receivables Corp.–144A
4.03%, due 12/02/2005 | | | 3 | | | $ | 3 | | |
Preferred Receivables Corp.–144A
4.04%, due 12/05/2005 | | 2 | | 2 | |
Ranger Funding Co. LLC–144A
3.99%, due 11/15/2005 | | 2 | | 2 | |
Sheffield Receivables Corp.–144A
4.01%, due 11/08/2005 | | 2 | | 2 | |
Yorktown Capital LLC
3.97%, due 11/09/2005
3.93%, due 11/17/2005 | | 4
4 | | 4
4 | |
| Euro Dollar Overnight (0.0%) | |
Bank of Montreal
3.79%, due 11/01/2005 | | 2 | | 2 | |
Barclays
3.80%, due 11/04/2005 | | 3 | | 3 | |
BNP Paribas
3.83%, due 11/02/2005 | | 4 | | 4 | |
Deutsche Bank
3.80%, due 11/02/2005 | | 7 | | 7 | |
HSBC Banking/Holdings PLC
3.84%, due 11/07/2005 | | 2 | | 2 | |
Royal Bank of Scotland
3.76%, due 11/01/2005 | | 3 | | 3 | |
Svenska Handlesbanken
4.03%, due 11/01/2005 | | 4 | | 4 | |
UBS AG
3.80%, due 11/03/2005 | | 3 | | 3 | |
| Euro Dollar Terms (0.0%) | |
Royal Bank of Scotland
4.00%, due 12/12/2005 | | 3 | | 3 | |
UBS AG
4.02%, due 12/01/2005 | | 3 | | 3 | |
Wells Fargo
3.96%, due 11/14/2005 | | 4 | | 4 | |
| Promissory Notes (0.0%) | |
Goldman Sachs Group, Inc.
4.02%, due 12/28/2005 | | 3 | | 3 | |
| Repurchase Agreements (0.1%) †† | |
Credit Suisse First Boston Corp.
4.10%, dated 10/31/2005 to be repurchased
at $5 on 11/01/2005 | | 5 | | 5 | |
Goldman Sachs Group, Inc. (The)
4.10%, dated 10/31/2005 to be repurchased
at $12 on 11/01/2005 | | 12 | | 12 | |
| | | Contracts w | | Value | |
Lehman Brothers, Inc.
4.10%, dated 10/31/2005 to be repurchased
at $341 (not in thousands) on 11/01/2005 | | | - | o | | $ | - | o | |
Merrill Lynch & Co.
4.10%, dated 10/31/2005 to be repurchased
at $14 on 11/01/2005 | | | 14 | | | | 14 | | |
Morgan Stanley Dean Witter & Co.
4.17%, dated 10/31/2005 to be repurchased
at $4 on 11/01/2005 | | | 4 | | | | 4 | | |
| | | Shares | | Value | |
| Investment Companies (0.0%) | |
| Money Market Funds (0.0%) | |
American Beacon Fund
1-day yield of 3.81% | | | 3,121 | | | $ | 3 | | |
Barclays Global Investors Institutional
Money Market Fund
1-day yield of 3.92% | | | 2,895 | | | | 3 | | |
Goldman Sachs Financial Square Prime
Obligations Fund
1-day yield of 3.79% | | | 451 | | | | - | o | |
Merrimac Cash Fund, Premium Class
1-day yield of 3.70% @ | | | 2,863 | | | | 3 | | |
| Total Security Lending Collateral (cost: $130) | | | | | | | 130 | | |
| Total Investment Securities (cost: $157,591) | | | | | | $ | 156,357 | | |
| | | Contracts w | | Value | |
| WRITTEN OPTIONS (0.0%) | |
| Covered Call Options (0.0%) | |
| U.S. 10 Year Treasury Note Futures | | | 66 | | | $ | (1 | ) | |
| Call Strike $114.00 | | | | | | |
| | |
| Expires 11/22/2005 | | | | | | | | | |
| Put Options (0.0%) | |
U.S. 10 Year Treasury Note Futures
Put Strike $109.00
Expires 11/22/2005 | | | 66 | | | | (56 | ) | |
| Total Written Options (premiums: $37) | | | | | | | (57 | ) | |
| | | Contracts w | | Value | |
| WRITTEN SWAPTIONS (-0.1%) | |
| Covered Call Swaptions (-0.1%) | |
| LIBOR Rate Swaption | | | 9,000 | | | $ | (28 | ) | |
| Call Strike $4.54 | | | | | | |
| | |
| Expires 04/06/2011 | | | | | | | | | |
LIBOR Rate Swaption
Call Strike $4.54
Expires 10/04/2006 | | | 11,000 | | | | (77 | ) | |
| Total Written Swaptions (premiums: $196) | | | | | | | (105 | ) | |
The notes to the financial statements are an integral part of this report.
Transamerica IDEX Mutual Funds
Annual Report 2005
9
TA IDEX PIMCO Total Return
SCHEDULE OF INVESTMENTS (continued)
At October 31, 2005
(all amounts except share amounts in thousands)
| | | | | Value | |
| SUMMARY: | | | |
| Investment securities, at value | | | 99.2 | % | | $ | 156,357 | | |
| Written Swaptions | | | (0.1 | )% | | | (105 | ) | |
| Written Options | | | 0.0 | % | | | (57 | ) | |
| Other assets in excess of liabilities | | | 0.9 | % | | | 1,466 | | |
| Net assets | | | 100.0 | % | | $ | 157,661 | | |
| SWAP AGREEMENTS: | | | |
| | | Expiration
Date | | Notional
Amount | | Net Unrealized
Appreciation
(Depreciation) | |
Receive a fixed rate equal to 0.58%
and the Fund will pay to the
counterparty at the notional amount
in the event of default of Russian
Federation Government Bond,
5.00%, due 03/31/2030.
Counterparty: Morgan Stanley Capital
Services, Inc. | | 6/20/06 | | $ | 500 | | | $ | 1 | | |
Receive a floating rate based on
6-month Japanese Yen–LIBOR (London
Interbank Offered Rate) and pay a fixed
rate equal to 2.00%.
Counterparty: Morgan Stanley Capital
Services, Inc. | | 6/15/12 | | | 130,000 | | | | (35 | ) | |
Receive a fixed rate equal to 3.20%
and the Fund will pay to the
counterparty at the notional amount
in the event of default of General
Motors Acceptance Corp, 6.875%,
due 8/28/2012
Counterparty:Lehman Brothers Special
Financing Inc. | | 6/20/07 | | | 300 | | | | 5 | | |
Receive a fixed rate equal to 2.80% and
the Fund will pay to the counterparty
at the notional amount in the event of
default of General Motors Acceptance
Corp, 6.875%, due 8/28/2012.
Counterparty: JP Morgan Chase Bank | | 6/20/06 | | | 800 | | | | 5 | | |
Receive a fixed rate equal to 0.61% and
the Fund will pay to the counterparty
at the notional amount in the event of
default of Russian Federation
Government Bond, 5.00%,
due 03/312030.
Counterparty: Goldman Sachs
Inter national | | 3/20/07 | | | 425 | | | | 1 | | |
| | | Expiration
Date | | Notional
Amount | | Net Unrealized
Appreciation
(Depreciation) | |
Receive a fixed rate equal to 0.70%
and the Fund will pay to the
counterparty at the notional amount in
the event of default of Russian Federation
Government Bond, 5.00%, due 03/31/2030.
Counterparty: Goldman Sachs
International | | 3/20/07 | | $ | 175 | | | $ | - | o | |
Receive a fixed rate equal to 0.77%
and the Fund will pay to the
counterparty at the notional amount
in the event of default of Russian
Federation Government Bond,
5.00%, due 03/31/2030.
Counterparty: JP Morgan Chase bank | | 5/20/07 | | | 300 | | | | 1 | | |
Receive a floating rate based on 3-month
U.S. Dollar–LIBOR (London Interbank
Offered Rate) and pay a fixed
rate equal to 5.00%.
Counterparty: Goldman Sachs Capital
Markets, LP | | 12/15/15 | | | 2,200 | | | | 110 | | |
Receive a fixed rate equal to 2.09%
and the Fund will pay a floating rate
based on FRC–Excluding
Tobacco-Non-Revised Consumer
Price Index.
Counterparty:BNP Paribas | | 10/15/10 | | | 2,000 | | | | - | o | |
Receive a fixed rate equal to 2.00%
and the Fund will pay to the
counterparty in the event of default
on any securities in the DJ CDX HVOL.
4 Index, the remaining interest payments
on those defaulted securities.
Counterparty :UBS AG | | 12/20/10 | | | 1,500 | | | | (8 | ) | |
Receive a fixed rate equal to 2.1455%
and the Fund will pay a floating rate
based on FRC–Excluding
Tobacco-Non-Revised Consumer
Price Index.
Counterparty: UBS AG | | 10/15/10 | | | 2,100 | | | | 1 | | |
Receive a fixed rate equal to 2.1025%
and the Fund will pay a floating rate
based on FRC–Excluding
Tobacco-Non-Revised Consumer
Price Index.
Counterparty:Barlcays Bank PLC | | 10/15/10 | | | 1,000 | | | | - | o | |
The notes to the financial statements are an integral part of this report.
Transamerica IDEX Mutual Funds
Annual Report 2005
10
TA IDEX PIMCO Total Return
SCHEDULE OF INVESTMENTS (continued)
At October 31, 2005
(all amounts except share amounts in thousands)
| | | Expiration
Date | | Notional
Amount | | Net Unrealized
Appreciation
(Depreciation) | |
Receive a fixed rate equal to 4.00%
and pay a floating rate based on 3-month
United States Dollar–LIBOR
(London Interbank Offered Rate).
Counterparty: Goldman Sachs
Capital Markets, LP | | 12/15/05 | | $ | 800 | | | $ | (8 | ) | |
Total Swap Agreements
(premium $154) | | | | | | $ | 73 | | |
| FORWARD FOREIGN CURRENCY CONTRACTS: | |
| Currency | | Bought
(Sold) | | Settlement
Date | | Amount in
U.S. Dollars
Bought (Sold) | | Net
Unrealized
Appreciation
(Depreciation) | |
| Euro Dollar | | | 2,220 | | | 11/08/2005 | | $ | 2,668 | | | $ | (6 | ) | |
| Euro Dollar | | | (9,434 | ) | | 11/08/2005 | | | (11,352 | ) | | | 40 | | |
| | | $ | (8,684 | ) | | $ | 34 | | |
| FUTURES CONTRACTS: | | | |
| | | Contractsw | | Settlement
Date | | Amount | | Net Unrealized
Appreciation
(Depreciation) | |
| 10 Year Japan Government Bond | | | 1 | | | 12/20/2005 | | $ | 1,178 | | | $ | (10 | ) | |
| 10 Year U.S. Treasury Note | | | 12 | | | 12/30/2005 | | | (1,301 | ) | | | 26 | | |
| 2 Year U.S. Treasury Note | | | 108 | | | 12/30/2005 | | | 22,162 | | | | (137 | ) | |
| 3 Month Euro Euribor | | | 30 | | | 12/19/2005 | | | - | o | | | - | o | |
| 5 Year U.S. Treasury Note | | | 47 | | | 12/30/2005 | | | 4,977 | | | | (81 | ) | |
| 90-Day Euro Dollar | | | 142 | | | 12/19/2005 | | | 33,910 | | | | (220 | ) | |
| 90-Day Euro Dollar | | | 177 | | | 06/19/2006 | | | 42,115 | | | | (196 | ) | |
| U.S. Treasury Long Bond | | | 92 | | | 12/30/2005 | | | 10,301 | | | | (552 | ) | |
| | | | | | | | | $ | 113,342 | | | $ | (1,170 | ) | |
NOTES TO SCHEDULE OF INVESTMENTS:
* Floating or variable rate note. Rate is listed as of October 31, 2005.
(a) Russian Federation has a coupon rate of 5.00% until 03/31/2007, thereafter the coupon rate will become 7.50%.
(b) KBC Bank Fund Trust III–144A has a coupon rate of 9.86% until 11/02/2009, thereafter the coupon rate resets quarterly at the 3-month LIBOR (London Interbank Offer Rate) + 405 BP, if not called.
(c) Rabobank Capital Funding II–144A has a fixed coupon rate 5.26% until 12/31/2013, thereafter the coupon rate will reset quarterly at the 3-month US$ LIBOR + 162.75BP, if not called.
(d) Rabobank Capital Funding Trust III–144A has a fixed coupon rate 5.25% until 10/21/2016, thereafter the coupon rate will reset quarterly at the 3-month US$ LIBOR + 159BP, if not called.
§ Security is deemed to be illiquid.
(e) HSBC Capital Funding LP–144A has a fixed coupon rate 10.18% until 06/30/2030, thereafter the coupon rate will reset quarterly at the 3-month US$ LIBOR + 498BP, if not called.
(f) Sumitomo Matsui Banking–144A has a fixed coupon rate of 5.63% until 10/15/2015, thereafter the coupon rate will reset quarterly at the 3-month US$ LIBOR + 255BP, if not called.
† At October 31, 2005, all or a portion of this security is on loan (see Note 1). The value at October 31, 2005, of all securities on loan is $124.
(g) Deutsche Telekom International Finance BV coupon steps up by 50 BP for each rating downgrade by Standard & Poor's or Moody's for each notch below BBB+/Baa1. Coupon steps down by 50 BP for each rating upgrade above Baa2/BBB.
(h) France Telecom Coupon steps up or down by 25 BP for each rating upgrade or downgrade by Standard and Poor's or Moody's for each notch above or below A-/A3.
# At October 31, 2005, all or a portion of this security is segregated with the custodian to cover margin requirements for open option contracts. The value of all securities segregated at October 31, 2005, is $70.
o Value is less than $1.
†† Cash collateral for the Repurchase Agreements, valued at $37, that serve as collateral for securities lending are invested in corporate bonds with interest rates and maturity dates ranging from 0.00%–9.86% and 12/31/2005–11/15/2096, respectively.
@ Regulated investment company advised by Investors Bank and Trust Co. ("IBT"). IBT is also the accounting, custody and lending agent for the Fund.
w Contract amounts are not in thousands.
d At October 31, 2005, all or a portion of this security is segregated with the custodian to cover margin requirements for open futures contracts. The value of all securities segregated at October 31, 2005 is $453.
The notes to the financial statements are an integral part of this report.
Transamerica IDEX Mutual Funds
Annual Report 2005
11
TA IDEX PIMCO Total Return
SCHEDULE OF INVESTMENTS (continued)
At October 31, 2005
(all amounts except share amounts in thousands)
DEFINITIONS:
144A 144A Securities are registered pursuant to Rule 144A of the Securities Act of 1933. These securities are deemed to be liquid for purposes of compliance limitations on holdings of illiquid securities and may be resold as transactions exempt from registration, normally to qualified institutional buyers. At October 31, 2005, these securities aggregated $7,980 or 5.1% of the net assets of the Fund.
RACERS Restructured Asset Certificates with Enhanced Returns
TBA To Be Announced
The notes to the financial statements are an integral part of this report.
Transamerica IDEX Mutual Funds
Annual Report 2005
12
TA IDEX PIMCO Total Return
STATEMENT OF ASSETS AND LIABILITIES
At October 31, 2005
(all amounts except per share amounts in thousands)
| Assets: | | | |
Investment securities, at value (cost: $157,591)
(including securities loaned of $124) | | $ | 156,357 | | |
| Cash | | | 2,496 | | |
| Foreign currencies (cost: $1,533) | | | 1,429 | | |
| Receivables: | |
| Shares of beneficial interest sold | | | 36 | | |
| Interest | | | 899 | | |
| Variation margin | | | 7 | | |
Unrealized appreciation on forward foreign
currency contracts | | | 40 | | |
| Other | | | 5 | | |
| | | | 161,269 | | |
| Liabilities: | | | |
| Investment securities purchased | | | 2,950 | | |
| Accounts payable and accrued liabilities: | |
| Shares of beneficial interest redeemed | | | 62 | | |
| Management and advisory fees | | | 95 | | |
| Swap contract interest | | | 9 | | |
| Distribution and service fees | | | 65 | | |
| Transfer agent fees | | | 10 | | |
| Administration fees | | | 3 | | |
| Payable for collateral for securities on loan | | | 130 | | |
Unrealized depreciation on forward foreign
currency contracts | | | 6 | | |
| Written options and swaptions (premiums $233) | | | 162 | | |
| Swap agreements at value (premiums $154) | | | 81 | | |
| Other | | | 35 | | |
| | | | 3,608 | | |
| Net Assets | | $ | 157,661 | | |
| Net Assets Consist of: | | | |
Shares of beneficial interest, unlimited shares
authorized, no par value | | $ | 158,918 | | |
| Undistributed net investment income (loss) | | | 63 | | |
Undistributed net realized gain (loss) from investment
securities, futures contracts, written options and
swaptions, swaps and foreign currency transactions | | | 1,011 | | |
| Net unrealized appreciation (depreciation) on: | |
| Investment securities | | | (1,234 | ) | |
| Futures contracts | | | (1,170 | ) | |
| Written option and swaption contracts | | | 71 | | |
| Swap agreements | | | 73 | | |
Translation of assets and liabilites denominated
in foreign currencies | | | (71 | ) | |
| Net Assets | | $ | 157,661 | | |
| Net Assets by Class: | | | |
| Class A | | $ | 125,910 | | |
| Class B | | | 22,116 | | |
| Class C | | | 9,635 | | |
| Shares Outstanding: | | | |
| Class A | | | 12,388 | | |
| Class B | | | 2,173 | | |
| Class C | | | 949 | | |
| Net Asset Value Per Share: | | | |
| Class A | | $ | 10.16 | | |
| Class B | | | 10.18 | | |
| Class C | | | 10.15 | | |
| Maximum Offering Price Per Share (a): | | | |
| Class A | | $ | 10.67 | | |
(a) Includes the maximum selling commission (represented as a percentage of offering price) which is reduced on certain levels of sales as set forth in the Prospectus. Net asset value per share for Classes B and C shares represents offering price. The redemption price for Classes B and C shares equals net asset value less any applicable contingent deferred sales charge.
STATEMENT OF OPERATIONS
For the year ended October 31, 2005
(all amounts in thousands)
| Investment Income: | | | |
| Interest | | $ | 5,859 | | |
| Income from loaned securities–net | | | 7 | | |
| | | | 5,866 | | |
| Expenses: | | | |
| Management and advisory fees | | | 1,098 | | |
| Distribution and service fees: | |
| Class A | | | 423 | | |
| Class B | | | 251 | | |
| Class C | | | 110 | | |
| Transfer agent fees: | |
| Class A | | | 25 | | |
| Class B | | | 50 | | |
| Class C | | | 20 | | |
| Printing and shareholder reports | | | 20 | | |
| Custody fees | | | 76 | | |
| Administration fees | | | 30 | | |
| Legal fees | | | 11 | | |
| Audit fees | | | 27 | | |
| Trustees fees | | | 7 | | |
| Registration fees: | |
| Class A | | | 19 | | |
| Class B | | | 12 | | |
| Class C | | | 14 | | |
| Other | | | 2 | | |
| Total expenses | | | 2,195 | | |
| Net Investment Income (Loss) | | | 3,671 | | |
| Net Realized Gain (Loss) from: | | | |
| Investment securities | | | 348 | | |
| Futures contracts | | | (20 | ) | |
| Written option and swaption contracts | | | 297 | | |
| Swap agreements | | | 294 | | |
| Foreign currency transactions | | | 639 | | |
| | | | 1,558 | | |
Net Increase (Decrease) in Unrealized Appreciation
(Depreciation) on: | | | |
| Investment securities | | | (2,406 | ) | |
| Futures contracts | | | (1,536 | ) | |
| Written option and swaption contracts | | | 23 | | |
| Swap agreements | | | (110 | ) | |
Translation of assets and liabilities denominated
in foreign currencies | | | (70 | ) | |
| | | | (4,099 | ) | |
Net Gain (Loss) on Investment Securities, Futures
Contracts, Written Options and Swaptions,
Swaps and Foreign Currency Transactions | | | (2,541 | ) | |
Net Increase (Decrease) in Net Assets Resulting
from Operations | | $ | 1,130 | | |
The notes to the financial statements are an integral part of this report.
Transamerica IDEX Mutual Funds
Annual Report 2005
13
TA IDEX PIMCO Total Return
STATEMENTS OF CHANGES IN NET ASSETS
For the years ended
(all amounts in thousands)
| | | October 31,
2005 | | October 31,
2004 | |
| Increase (Decrease) In Net Assets From: | |
| Operations: | |
| Net investment income (loss) | | $ | 3,671 | | | $ | 1,081 | | |
Net realized gain (loss) from
investment securities, futures
contracts, written options and
swaptions, swaps and foreign
currency transactions | | | 1,558 | | | | 4,124 | | |
Net unrealized appreciation
(depreciation) on investment
securities, futures contracts, written
options and swaptions, swaps and
foreign currency translation | | | (4,099 | ) | | | 64 | | |
| | | | 1,130 | | | | 5,269 | | |
| Distributions to Shareholders: | |
| From net investment income: | |
| Class A | | | (3,336 | ) | | | (924 | ) | |
| Class B | | | (430 | ) | | | (223 | ) | |
| Class C | | | (197 | ) | | | (49 | ) | |
| Class C2 | | | – | | | | (45 | ) | |
| Class M | | | – | | | | (18 | ) | |
| | | | (3,963 | ) | | | (1,259 | ) | |
| From net realized gains: | |
| Class A | | | (1,399 | ) | | | (2,206 | ) | |
| Class B | | | (337 | ) | | | (1,143 | ) | |
| Class C | | | (149 | ) | | | (180 | ) | |
| Class C2 | | | – | | | | (313 | ) | |
| Class M | | | – | | | | (93 | ) | |
| | | | (1,885 | ) | | | (3,935 | ) | |
| Capital Share Transactions: | |
| Proceeds from shares sold: | |
| Class A | | | 21,913 | | | | 53,387 | | |
| Class B | | | 2,672 | | | | 6,093 | | |
| Class C | | | 1,559 | | | | 1,432 | | |
| Class C2 | | | – | | | | 431 | | |
| Class M | | | – | | | | 57 | | |
| | | | 26,144 | | | | 61,400 | | |
Dividends and distributions
reinvested: | |
| Class A | | | 4,692 | | | | 3,077 | | |
| Class B | | | 567 | | | | 1,079 | | |
| Class C | | | 302 | | | | 181 | | |
| Class C2 | | | – | | | | 313 | | |
| Class M | | | – | | | | 107 | | |
| | | | 5,561 | | | | 4,757 | | |
| Cost of shares redeemed: | |
| Class A | | | (3,417 | ) | | | (6,832 | ) | |
| Class B | | | (8,606 | ) | | | (13,382 | ) | |
| Class C | | | (4,738 | ) | | | (3,016 | ) | |
| Class C2 | | | – | | | | (3,748 | ) | |
| Class M | | | – | | | | (1,377 | ) | |
| | | | (16,761 | ) | | | (28,355 | ) | |
| | | October 31,
2005 | | October 31,
2004 | |
| Class level exchanges: | |
| Class C | | | – | | | | 8,804 | | |
| Class C2 | | | – | | | | (6,831 | ) | |
| Class M | | | – | | | | (1,973 | ) | |
| | | | – | | | | – | | |
| | | | 14,944 | | | | 37,802 | | |
| Net increase (decrease) in net assets | | | 10,226 | | | | 37,877 | | |
| Net Assets: | |
| Beginning of year | | | 147,435 | | | | 109,558 | | |
| End of year | | $ | 157,661 | | | $ | 147,435 | | |
Undistributed Net Investment
Income (Loss) | | $ | 63 | | | $ | – | | |
| Share Activity: | |
| Shares issued: | |
| Class A | | | 2,110 | | | | 5,141 | | |
| Class B | | | 257 | | | | 586 | | |
| Class C | | | 150 | | | | 138 | | |
| Class C2 | | | – | | | | 41 | | |
| Class M | | | – | | | | 5 | | |
| | | | 2,517 | | | | 5,911 | | |
Shares issued–reinvested from
distributions: | |
| Class A | | | 454 | | | | 299 | | |
| Class B | | | 55 | | | | 105 | | |
| Class C | | | 29 | | | | 17 | | |
| Class C2 | | | – | | | | 31 | | |
| Class M | | | – | | | | 11 | | |
| | | | 538 | | | | 463 | | |
| Shares redeemed: | |
| Class A | | | (329 | ) | | | (655 | ) | |
| Class B | | | (829 | ) | | | (1,287 | ) | |
| Class C | | | (458 | ) | | | (291 | ) | |
| Class C2 | | | – | | | | (357 | ) | |
| Class M | | | – | | | | (133 | ) | |
| | | | (1,616 | ) | | | (2,723 | ) | |
| Class level exchanges: | |
| Class C | | | – | | | | 866 | | |
| Class C2 | | | – | | | | (677 | ) | |
| Class M | | | – | | | | (189 | ) | |
| | | | – | | | | – | | |
Net increase (decrease) in shares
outstanding: | |
| Class A | | | 2,235 | | | | 4,785 | | |
| Class B | | | (517 | ) | | | (596 | ) | |
| Class C | | | (279 | ) | | | 730 | | |
| Class C2 | | | – | | | | (962 | ) | |
| Class M | | | – | | | | (306 | ) | |
| | | | 1,439 | | | | 3,651 | | |
The notes to the financial statements are an integral part of this report.
Transamerica IDEX Mutual Funds
Annual Report 2005
14
TA IDEX PIMCO Total Return
FINANCIAL HIGHLIGHTS
| | | | | For a share of beneficial interest outstanding throughout each period | |
| | | | | Net Asset | | Investment Operations | | Distributions | | Net Asset | |
| | | For the
Period
Ended (d)(g) | | Value,
Beginning
of Period | | Net
Investment
Income (Loss) | | Net Realized
and Unrealized
Gain (Loss) | | Total
Operations | | From Net
Investment
Income | | From Net
Realized
Gains | | Total
Distributions | | Value,
End
of Period | |
| Class A | | 10/31/2005 | | $ | 10.48 | | | $ | 0.26 | | | $ | (0.17 | ) | | $ | 0.09 | | | $ | (0.28 | ) | | $ | (0.13 | ) | | $ | (0.41 | ) | | $ | 10.16 | | |
| | | 10/31/2004 | | | 10.52 | | | | 0.12 | | | | 0.36 | | | | 0.48 | | | | (0.14 | ) | | | (0.38 | ) | | | (0.52 | ) | | | 10.48 | | |
| | | 10/31/2003 | | | 10.32 | | | | 0.20 | | | | 0.39 | | | | 0.59 | | | | (0.25 | ) | | | (0.14 | ) | | | (0.39 | ) | | | 10.52 | | |
| | | 10/31/2002 | | | 10.00 | | | | 0.13 | | | | 0.28 | | | | 0.41 | | | | (0.09 | ) | | | – | | | | (0.09 | ) | | | 10.32 | | |
| Class B | | 10/31/2005 | | | 10.48 | | | | 0.17 | | | | (0.16 | ) | | | 0.01 | | | | (0.18 | ) | | | (0.13 | ) | | | (0.31 | ) | | | 10.18 | | |
| | | 10/31/2004 | | | 10.51 | | | | 0.07 | | | | 0.36 | | | | 0.43 | | | | (0.08 | ) | | | (0.38 | ) | | | (0.46 | ) | | | 10.48 | | |
| | | 10/31/2003 | | | 10.32 | | | | 0.13 | | | | 0.38 | | | | 0.51 | | | | (0.18 | ) | | | (0.14 | ) | | | (0.32 | ) | | | 10.51 | | |
| | | 10/31/2002 | | | 10.00 | | | | 0.09 | | | | 0.29 | | | | 0.38 | | | | (0.06 | ) | | | – | | | | (0.06 | ) | | | 10.32 | | |
| Class C | | 10/31/2005 | | | 10.47 | | | | 0.16 | | | | (0.16 | ) | | | – | | | | (0.19 | ) | | | (0.13 | ) | | | (0.32 | ) | | | 10.15 | | |
| | | 10/31/2004 | | | 10.51 | | | | 0.04 | | | | 0.38 | | | | 0.42 | | | | (0.08 | ) | | | (0.38 | ) | | | (0.46 | ) | | | 10.47 | | |
| | | 10/31/2003 | | | 10.38 | | | | 0.13 | | | | 0.32 | | | | 0.45 | | | | (0.18 | ) | | | (0.14 | ) | | | (0.32 | ) | | | 10.51 | | |
| | | | | | | Ratios/Supplemental Data | |
| | | For the
Period | | Total | | Net Assets,
End of
Period | | Ratio of Expenses
to Average
Net Assets (a) | | Net Investment
Income (Loss)
to Average | | Portfolio
Turnover | |
| | | Ended (d) | | Return (c) | | (000's) | | Net (e) | | Total (f) | | Net Assets (a) | | Rate (b) | |
| Class A | | 10/31/2005 | | | 0.86 | % | | $ | 125,910 | | | | 1.20 | % | | | 1.20 | % | | | 2.55 | % | | | 459 | % | |
| | | 10/31/2004 | | | 4.78 | | | | 106,366 | | | | 1.34 | | | | 1.34 | | | | 1.19 | | | | 385 | | |
| | | 10/31/2003 | | | 5.88 | | | | 56,452 | | | | 1.43 | | | | 1.43 | | | | 1.91 | | | | 326 | | |
| | | 10/31/2002 | | | 4.13 | | | | 40,767 | | | | 1.65 | | | | 1.81 | | | | 2.28 | | | | 240 | | |
| Class B | | 10/31/2005 | | | 0.07 | | | | 22,116 | | | | 2.06 | | | | 2.06 | | | | 1.64 | | | | 459 | | |
| | | 10/31/2004 | | | 4.30 | | | | 28,219 | | | | 1.92 | | | | 1.92 | | | | 0.64 | | | | 385 | | |
| | | 10/31/2003 | | | 5.08 | | | | 34,547 | | | | 2.08 | | | | 2.08 | | | | 1.26 | | | | 326 | | |
| | | 10/31/2002 | | | 3.80 | | | | 30,909 | | | | 2.30 | | | | 2.46 | | | | 1.63 | | | | 240 | | |
| Class C | | 10/31/2005 | | | – | (h) | | | 9,635 | | | | 2.11 | | | | 2.11 | | | | 1.58 | | | | 459 | | |
| | | 10/31/2004 | | | 4.10 | | | | 12,850 | | | | 2.09 | | | | 2.09 | | | | 0.41 | | | | 385 | | |
| | | 10/31/2003 | | | 4.47 | | | | 5,231 | | | | 2.08 | | | | 2.08 | | | | 1.25 | | | | 326 | | |
NOTES TO FINANCIAL HIGHLIGHTS
(a) Annualized.
(b) Not annualized.
(c) Total Return has been calculated for the applicable period without deduction of a sales load, if any, on an initial purchase. Periods of less than one year are not annualized.
(d) Per share information is calculated based on average number of shares outstanding.
(e) Ratio of Net Expenses to Average Net Assets is net of fee waivers and reimbursements by the investment adviser, if any (see note 2).
(f) Ratio of Total Expenses to Average Net Assets includes all expenses before fee waivers and reimbursements by the investment adviser.
(g) TA IDEX PIMCO Total Return ("the Fund") commenced operations on March 1, 2002. The inception date for the Fund's offering of share Class C was November 11, 2002.
(h) Amount rounds to less than 0.01%.
The notes to the financial statements are an integral part of this report.
Transamerica IDEX Mutual Funds
Annual Report 2005
15
TA IDEX PIMCO Total Return
NOTES TO FINANCIAL STATEMENTS
At October 31, 2005
(all amounts in thousands)
NOTE 1. ORGANIZATION AND SIGNIFICANT ACCOUNTING POLICIES
Transamerica IDEX Mutual Funds is an open-end management investment company registered under the Investment Company Act of 1940, as amended (the "1940 Act").
In the normal course of business, TA IDEX PIMCO Total Return (the "Fund") enters into contracts that contain a variety of representations that provide general indemnifications. The Fund's maximum exposure under these arrangements is unknown, as this would involve future claims that may be made against the Fund and/or its affiliates that have not yet occurred. However, based on experience, the Fund expects the risk of loss to be remote.
This report should be read in conjunction with the current Fund prospectus, which contains more complete information about the Fund.
The following is a summary of significant accounting policies followed by the Fund in the preparation of the financial statements. In preparing the Fund's financial statements in accordance with accounting principles generally accepted in the United States of America ("GAAP"), estimates or assumptions (which could differ from actual results) may be used that affect reported amounts and disclosures.
Multiple class operations, income and expenses: The Fund currently offers three classes of shares, each with a public offering price that reflects different sales charges, if any, and expense levels. On June 15, 2004, Class C2 shares merged into Class C. On September 24, 2004, Class M shares merged into Class C. Class B shares will convert to Class A shares eight years after purchase. Income, non-class specific expenses and realized and unrealized gains and losses, are allocated daily to each class, based upon the value of shares outstanding method as permitted under Rule 18f-3 of the 1940 Act. Each class bears its own specific expenses as well as a portion of general, common expenses.
Security valuations: The Fund values its investments at the close of the New York Stock Exchange ("NYSE"), normally 4 p.m. ET, each day the NYSE is open for business. Fund investments are valued at the last sale price or closing price on the day of valuation taken from the primary exchange where the security is principally traded.
Securities traded in the over-the-counter market and listed securities for which no sale was reported on that date are valued at the last quoted bid price.
Debt securities are valued based on a price quotation or other equivalent indication of value supplied by an exchange, a pricing service or a major market maker.
Investment company securities are valued at the net asset value of the underlying portfolio.
Foreign securities generally are valued based on quotations from the primary market in which they are traded. Because many foreign securities markets and exchanges close prior to the close of the NYSE, closing prices for foreign securities in those markets or on those exchanges do not reflect the events that occur after that close. If a significant market event impacting the value of a portfolio security (e.g., natural disaster, company announcement, market volatility) occurs subsequent to the close of trading in the security, but prior to the calculation of the Fund's net asset value per share, market quotations for that security may be determined to be unreliable and, accordingly, not "readily available." As a result, foreign equity securities held by the Fund may be valued at fair market value as determined in good faith by the Fund's Administrative Valuation Committee, under the supervision of the B oard's Valuation Committee, using guidelines adopted by the Board of Trustees.
Other securities for which quotations are not readily available or whose values have been determined to be unreliable are valued at fair market value as determined in good faith by the Fund's Administrative Valuation Committee, under the supervision of the Board's Valuation Committee, using guidelines adopted by the Board of Trustees.
Cash: The Fund may leave cash overnight in its cash account with the custodian, Investors Bank & Trust Company ("IBT"). IBT has been contracted on behalf of the Fund to invest the excess cash into a savings account, which at October 31, 2005, was paying an interest rate of 2.76%.
TBA purchase commitments: The Fund may enter into "TBA" (to be announced) purchase commitments to purchase securities for a fixed price at a future date, typically not to exceed 45 days. TBA purchase commitments are considered securities in themselves, and involve a risk of loss if the value of the security to be purchased declines prior to settlement date, in addition to the risk of decline in the value of the Fund's other assets. Unsettled TBA purchase commitments are valued at the current value of the underlying securities, according to the procedures described under Security Valuations.
Repurchase agreements: The Fund is authorized to enter into repurchase agreements. The Fund, through its custodian, Investors Bank & Trust Company ("IBT"), receives delivery of the underlying securities, the value of which at the time of purchase is required to be an amount equal to at least 100% of the resale price. The Fund will bear the risk of value fluctuations until the security can be sold and may encounter delays and incur costs in liquidating the security. In the event of bankruptcy or insolvency of the seller, delays and costs may be incurred.
Reverse repurchase agreements: The Fund may enter into reverse repurchase agreements in which the Fund sells portfolio securities and agrees to repurchase them from the buyer at a specified date and price. Whenever the Fund enters into a reverse repurchase agreement, the Fund's custodian segregates assets in an amount at least equal to the
Transamerica IDEX Mutual Funds
Annual Report 2005
16
TA IDEX PIMCO Total Return
NOTES TO FINANCIAL STATEMENTS (continued)
At October 31, 2005
(all amounts in thousands)
NOTE 1.–(continued)
repurchase price marked-to-market daily (including accrued interest). The Fund pays interest on amounts obtained pursuant to reverse repurchase agreements. Reverse repurchase agreements are considered to be borrowings which may create leverage risk by the Fund.
There were no outstanding reverse repurchase agreements at October 31, 2005.
Securities lending: The Fund may lend securities to qualified borrowers, with IBT acting as the Fund's lending agent. The Fund earns negotiated lenders' fees. The Fund receives cash and/or securities as collateral against the loaned securities. Cash collateral received is invested in short term, interest bearing securities. The Fund monitors the market value of securities loaned on a daily basis and requires collateral in an amount at least equal to the value of the securities loaned. Income from loaned securities on the Statement of Operations is net of fees, in the amount of $3, earned by IBT for its services.
Security transactions and investment income: Security transactions are recorded on the trade date. Security gains and losses are calculated on the specific identification basis. Dividend income, if any, is recorded on the ex-dividend date or, in the case of foreign securities, as soon as the Fund is informed of the ex-dividend date. Interest income, including accretion of discounts and amortization of premiums, is recorded on the accrual basis commencing on the settlement date.
Foreign currency denominated investments: The accounting records of the Fund are maintained in U.S. dollars. Securities and other assets and liabilities denominated in foreign currencies are translated into U.S. dollars at the closing exchange rate each day. The cost of foreign securities is translated at the exchange rate in effect when the investment was acquired. The Fund combines fluctuations from currency exchange rates and fluctuations in value when computing net realized and unrealized gains or losses from investments.
Net foreign currency gains and losses resulting from changes in exchange rates include: 1) foreign currency fluctuations between trade date and settlement date of investment security transactions; 2) gains and losses on forward foreign currency contracts; and 3) the difference between the receivable amounts of interest and dividends recorded in the accounting records in U.S. dollars and the amounts actually received.
Foreign currency denominated assets may involve risks not typically associated with domestic transactions. These risks include revaluation of currencies, adverse fluctuations in foreign currency values and possible adverse political, social and economic developments, including those particular to a specific industry, country or region.
Foreign capital gains taxes: The Fund may be subject to taxes imposed by countries in which it invests, with respect to its investment in issuers existing or operating in such countries. Such taxes are generally based on income earned or repatriated and capital gains realized on the sale of such investments. The Fund accrues such taxes when the related income or capital gains are earned. Some countries require governmental approval for the repatriation of investment income, capital or the proceeds of sales earned by foreign investors. In addition, if there is deterioration in a country's balance of payments or for other reasons, a country may impose temporary restrictions on foreign capital remittances abroad.
Forward foreign currency contracts: The Fund may enter into forward foreign currency contracts to hedge against exchange rate risk arising from investments in securities denominated in foreign currencies. Contracts are valued at the contractual forward rate and are marked to market daily, with the change in value recorded as an unrealized gain or loss. When the contracts are settled a realized gain or loss is incurred. Risks may arise from changes in market value of the underlying currencies and from the possible inability of counterparties to meet the terms of their contracts.
Open forward foreign currency contracts at October 31, 2005, are listed in the Schedule of Investments.
Swap agreements: The Fund may enter into swap agreements to manage its exposure to interest rates and credit risk. Interest rate swap agreements involve commitments to pay/receive interest in exchange for a market-linked return, both based on notional amounts. In a credit default swap, one party makes a stream of payments to another party in exchange for the right to receive a specified return in the event of a default by a third party, typically corporate issues or sovereign issues of an emerging country, on its obligation. A Portfolio may use credit default swaps to provide a measure of protection against defaults of sovereign issuers (i.e., to reduce risk where a Portfolio owns or has exposure to the sovereign issuer) or to take an active long or short position with respect to the likelihood of a particular issuer's default.
Entering into these agreements involves elements of credit, market and documentation risk in excess of the amounts recognized on the Statement of Assets and Liabilities. Such risks involve the possibility that there will be no liquid market for these agreements, that the counterparty to the agreements may default on its obligation to perform or disagree as to the meaning of contractual terms in the agreements, and that there may be unfavorable changes in interest rates.
Swaps are marked to market daily based upon quotations from market makers and vendors and the change in value, if any, is recorded as unrealized gain or loss in the Statement of Operations. Payments received or made at the beginning of the measurement period are reflected as such on the Statement of Assets and Liabilities. A liquidation payment received or made at the termination of the swap is recorded as realized gain or loss in the Statement of Operations. Net periodic payments are included as part of realized gain or loss on the Statement of Operations.
Transamerica IDEX Mutual Funds
Annual Report 2005
17
TA IDEX PIMCO Total Return
NOTES TO FINANCIAL STATEMENTS (continued)
At October 31, 2005
(all amounts in thousands)
NOTE 1.–(continued)
Open swaps agreements at October 31, 2005, are listed in the Schedule of Investments.
Futures contracts: The Fund may enter into futures contracts to manage exposure to market, interest rate or currency fluctuations. Futures contracts are valued at the settlement price established each day by the board of trade or exchange on which they are traded. The primary risks associated with futures contracts are imperfect correlation between the change in market value of the securities held and the prices of futures contracts; the possibility of an illiquid market and inability of the counterparty to meet the contract terms.
The underlying face amounts of open futures contracts at October 31, 2005, are listed in the Schedule of Investments. The variation margin receivable or payable, as applicable, is included in the Statement of Assets and Liabilities. Variation margin represents the additional payment due or excess deposits made in order to maintain the equity account at the required margin level.
Option contracts: The Fund may enter into options contracts to manage exposure to market fluctuations. Options are valued at the average of the bid and ask ("Mean Quote") established each day at the close of the board of trade or exchange on which they are traded. The primary risks associated with options are imperfect correlation between the change in value of the securities held and the prices of the options contracts; the possibility of an illiquid market and inability of the counterparty to meet the contracts terms. When the Fund writes a covered call or put option, an amount equal to the premium received by the Fund is included in the Fund's Statement of Assets and Liabilities as an asset and as an equivalent liability. Options are marked-to-market daily to reflect the current value of the option written.
Transactions in written options were as follows:
| | | Premium | | Contracts* | |
| Beginning Balance October 31, 2004 | | $ | 11 | | | | 23 | | |
| Sales | | | 232 | | | | 793 | | |
| Closing Buys | | | (71 | ) | | | (214 | ) | |
| Expirations | | | (135 | ) | | | (470 | ) | |
| Exercised | | | – | | | | – | | |
| Balance at 10/31/2005 | | $ | 37 | | | | 132 | | |
* Contracts not in thousands
Swaptions contracts: The Fund is authorized to write swaption contracts to manage exposure to fluctuations in interest rates and to enhance fund yield. Swaption contracts written by the Fund represent an option that gives the purchaser the right, but not the obligation, to enter into a previously agreed upon swap contract on a future date. If a written call option is exercised, the writer will enter a swap and is obligated to pay the fixed rate and receive a variable rate in exchange. Swaptions are marked-to-market daily based upon quotations from market makers.
When the Fund writes a swaption, the premium received is recorded as a liability and is subsequently adjusted to the current value of the swaption. Changes in the value of the swaption are reported as Unrealized gains or losses in written options in the Statement of Assets and Liabilities. Gain or loss is recognized when the swaption contract expires or is closed. Premiums received from writing swaptions that expire or are exercised are treated by the Fund as realized gains from written options. The difference between the premium and the amount paid on affecting a closing purchase transaction is treated as a realized gain or loss.
Transactions in written swaptions were as follows:
| | | Premium | | Notional
Amount | |
| Beginning Balance October 31, 2004 | | $ | 55 | | | | 3,700 | | |
| Sales | | | 232 | | | | 27,000 | | |
| Closing Buys | | | – | | | | – | | |
| Expirations | | | (91 | ) | | | (10,700 | ) | |
| Exercised | | | – | | | | – | | |
| Balance at 10/31/2005 | | $ | 196 | | | | 20,000 | | |
Redemption fees: A short-term trading redemption fee may be assessed on any Fund shares in a fund account that are sold during the first five (5) NYSE trading days following their purchase date. This redemption fee will equal 2% of the amount redeemed and shares held the longest will be treated as being redeemed first and shares held the shortest as being redeemed last. For the year ended October 31, 2005, the Fund received less than $1 in redemption fees.
Dividend distributions: Distributions to shareholders are recorded on the ex-dividend date and are determined in accordance with Federal income tax regulations which may differ from GAAP.
NOTE 2. RELATED PARTY TRANSACTIONS
Effective January 1, 2005 AEGON/Transamerica Fund Advisors, Inc. was renamed Transamerica Fund Advisors, Inc. ("TFAI"); AEGON/Transamerica Fund Services, Inc. and AEGON/Transamerica Investor Services, Inc. merged into one entity and was renamed Transamerica Fund Services, Inc. ("TFS").
TFAI is the Fund's investment adviser. TFS is the Fund's administrator and transfer agent. AFSG Securities Corp. ("AFSG") is the Fund's distributor/principal underwriter. TFAI, TFS, and AFSG are affiliates of AEGON, NV, a Netherlands corporation.
Transamerica IDEX Mutual Funds
Annual Report 2005
18
TA IDEX PIMCO Total Return
NOTES TO FINANCIAL STATEMENTS (continued)
At October 31, 2005
(all amounts in thousands)
NOTE 2.–(continued)
The following schedule represents the percentage of Fund assets owned by affiliated mutual funds:
| | | Net
Assets | | % of
Net Assets | |
TA IDEX Asset Allocation –
Conservative Portfolio | | $ | 28,672 | | | | 18.19 | % | |
TA IDEX Asset Allocation –
Moderate Growth Portfolio | | | 37,712 | | | | 23.92 | % | |
TA IDEX Asset Allocation –
Moderate Portfolio | | | 49,821 | | | | 31.60 | % | |
| Total | | $ | 116,205 | | | | 73.71 | % | |
Investment advisory fees: The Fund pays management fees to TFAI based on average daily net assets ("ANA") at the following rate:
From November 1, 2004 through December 31, 2004:
0.70% of ANA
From January 1, 2005 on:
0.70% of the first $250 million of ANA
0.65% of the next $500 million of ANA
0.60% of ANA over $750 million
TFAI has contractually agreed to waive its advisory fee and will reimburse the Fund to the extent that operating expenses, excluding 12b-1 fees, exceed the following stated annual limit:
1.30% Expense Limit
If total Fund expenses fall below the annual expense limitation agreement agreed to by the adviser within the succeeding three years, the Fund may be required to pay that adviser a portion or all of the reimbursed class expenses.
There were no amounts recaptured during the year ended October 31, 2005. There are no amounts available for recapture at October 31, 2005.
Distribution and service fees: The Fund has a 12b-1 distribution plan under the 1940 Act pursuant to which an annual fee, based on average daily net assets, is paid to the distributor for various disbursements such as broker-dealer account servicing fees and other promotional expenses of the Fund. The Fund is authorized under the 12b-1 plan to pay fees on each class up to the following limits:
| Class A | | | 0.35 | % | |
| Class B | | | 1.00 | % | |
| Class C | | | 1.00 | % | |
In the case the Fund or a class of shares of the Fund is closed to new investors or investments, the Fund is authorized to pay 12b-1 fees for past sales and distribution efforts and present and past investor services.
Underwriter commissions relate to front-end sales charges imposed for Class A shares and contingent deferred sales charges from Classes B, C, and certain A share redemptions. For the year ended October 31, 2005, the underwriter commissions were as follows:
| Received by Underwriter | | $ | 92 | | |
| Retained by Underwriter | | | 6 | | |
| Contingent Deferred Sales Charge | | | 81 | | |
Administrative services: The Fund has entered into an agreement with TFS for financial and legal fund administration services. As of January 1, 2005 the Fund pays TFS an annual fee of 0.02% of ANA. Prior to January 1, 2005 the Fund paid TFS an annual fee of 0.015% of ANA. The Legal fees on the Statement of Operations are for fees paid to external legal counsel.
Transfer agent fees: The Fund pays TFS an annual per-account charge for each open and closed account. The Fund paid TFS $89 for the year ended October 31, 2005.
Deferred compensation plan: Each eligible independent Fund Trustee may elect to participate in a non-qualified deferred compensation plan maintained by Transamerica IDEX Mutual Funds (the "Plan"). Under the Plan, such Trustees may defer payment of all or a portion of their total fees earned as a Fund Trustee. Each Trustee who is a participant in the Plan may elect that the earnings, losses or gains credited to his or her deferred fee amounts be determined based on a deemed investment in any series of Transamerica IDEX Mutual Funds, including the Fund. The right of a participant to receive a distribution from the Plan of the deferred fees is an unsecured claim against the general assets of all series of Transamerica IDEX Mutual Funds. The pro rata liability to the Fund of all deferred fees i n the Plan amounted, as of October 31, 2005, to $5.
NOTE 3. INVESTMENT TRANSACTIONS
The cost of securities purchased and proceeds from securities sold (excluding short-term securities) for the year ended October 31, 2005, were as follows:
| Purchases of securities: | | | |
| Long-Term | | $ | 50,942 | | |
| U.S. Government | | | 457,207 | | |
| Proceeds from maturities and sales of securities: | | | |
| Long-Term | | | 51,394 | | |
| U.S. Government | | | 413,983 | | |
Transamerica IDEX Mutual Funds
Annual Report 2005
19
TA IDEX PIMCO Total Return
NOTES TO FINANCIAL STATEMENTS (continued)
At October 31, 2005
(all amounts in thousands)
NOTE 4.–FEDERAL INCOME TAX MATTERS
The Fund has not made any provision for federal income or excise taxes due to its policy to distribute all of its taxable income and capital gains to its shareholders and otherwise qualify as a regulated investment company under Subchapter M of the Internal Revenue Code. Income and capital gain distributions are determined in accordance with income tax regulations, which may differ from GAAP. These differences are primarily due to differing treatment for items including, but not limited to, wash sales, capital loss carryforwards, swap contracts, distribution reclassifications, futures, options and foreign currency transactions.
Therefore, distributions determined in accordance with tax regulations may differ significantly in amount or character from net investment income and realized gains for financial reporting purposes. Financial reporting records are adjusted for permanent book/tax differences to reflect tax character. Financial records are not adjusted for temporary differences. These reclassifications are as follows:
| Undistributed net investment income (loss) | | $ | 355 | | |
Undistributed net realized gain (loss) from investment
securities | | | (355 | ) | |
The capital loss carryforwards are available to offset future realized capital gains through the periods listed:
Capital Loss
Carryforward | | Available through | |
| $ | 203 | | | October 31, 2013 | |
There was no capital loss carryforward utilized during the year ended October 31, 2005.
The tax character of distributions paid may differ from the character of distributions shown in the Statement of Changes in Net Assets due to short-term gains being treated as ordinary income for tax purposes. The tax character of distributions paid during 2004 and 2005 was as follows:
| 2004 Distributions paid from: | |
| Ordinary Income | | $ | 3,914 | | |
| Long-term Capital Gain | | | 1,280 | | |
| 2005 Distributions paid from: | |
| Ordinary Income | | | 5,053 | | |
| Long-term Capital Gain | | | 795 | | |
The tax basis components of distributable earnings as of October 31, 2005, are as follows:
| Undistributed Ordinary Income | | $ | 64 | | |
| Undistributed Long-term Capital Gains | | $ | – | | |
| Capital Loss Carryforward | | $ | (203 | ) | |
| Net Unrealized Appreciation (Depreciation) | | $ | (1,117 | )* | |
* Amount includes unrealized appreciation (depreciation) from derivative instruments and deferred compensation.
The aggregate cost of investments and composition of unrealized appreciation (depreciation) for federal income tax purposes as of October 31, 2005, are as follows:
| Federal Tax Cost Basis | | $ | 157,627 | | |
| Unrealized Appreciation | | $ | 1,118 | | |
| Unrealized (Depreciation) | | | (2,388 | ) | |
| Net Unrealized Appreciation (Depreciation) | | $ | (1,270 | ) | |
NOTE 5. REGULATORY PROCEEDINGS
There continues to be significant federal and state regulatory activity relating to financial services companies, particularly mutual fund companies and their investment advisers. As part of an ongoing investigation regarding potential market timing, recordkeeping and trading compliance issues and matters affecting the Fund's investment adviser, TFAI, and certain affiliates and former employees of TFAI, the SEC staff has indicated that it is likely to take some action against TFAI and certain of its affiliates at the conclusion of the investigation. The potential timing and the scope of any such action is difficult to predict. Although the impact of any action brought against TFAI and/or its affiliates is difficult to assess at the present time, the Fund currently believes that the likelihood that any such action will have a material adverse impact on it is remote. It is important to note that the Fund is not aware of any allegation of wrongdoing against it and its Board at the time this annual report is printed. Although it is not anticipated that these developments will have an adverse impact on the Fund, there can be no assurance at this time. TFAI and its affiliates are actively working with the SEC in regard to this matter; however, the exact resolution cannot be determined at this time. TFAI will take such actions that it deems necessary or appropriate to continue providing management services to the Fund and to bring all matters to an appropriate conclusion.
TFAI and/or its affiliates, and not the Fund, will bear the costs regarding these regulatory matters.
Transamerica IDEX Mutual Funds
Annual Report 2005
20
Report of Independent Registered Certified Public Accounting Firm
To the Board of Trustees and Shareholders of
TA IDEX PIMCO Total Return
In our opinion, the accompanying statement of assets and liabilities, including the schedules of investments, and the related statements of operations and of changes in net assets and the financial highlights present fairly, in all material respects, the financial position of TA IDEX PIMCO Total Return (the "Fund") (one of the portfolios constituting the Transamerica IDEX Mutual Funds) at October 31, 2005, the results of its operations for the year then ended, the changes in its net assets for each of the two years in the period then ended and the financial highlights for each of the periods presented, in conformity with accounting principles generally accepted in the United States of America. These financial statements and financial highlights (hereafter referred to as "financial statements") are the responsibility of the Fund's management; our responsibility is to express an opinion on these fina ncial statements based on our audits. We conducted our audits of these financial statements in accordance with the standards of the Public Company Accounting Oversight Board (United States). Those standards require that we plan and perform the audit to obtain reasonable assurance about whether the financial statements are free of material misstatement. An audit includes examining, on a test basis, evidence supporting the amounts and disclosures in the financial statements, assessing the accounting principles used and significant estimates made by management, and evaluating the overall financial statement presentation. We believe that our audits, which included confirmation of securities at October 31, 2005 by correspondence with the custodian and brokers, provide a reasonable basis for our opinion.

December 22, 2005
Transamerica IDEX Mutual Funds
Annual Report 2005
21
TA IDEX PIMCO Total Return
SUPPLEMENTAL INFORMATION (unaudited)
TAX INFORMATION
For tax purposes, the Fund has made a Long-Term Capital Gain Designation of $795 for the year ended October 31, 2005.
Transamerica IDEX Mutual Funds
Annual Report 2005
22
TA IDEX Protected Principal Stock
MARKET ENVIRONMENT
In the past twelve months, the financial markets have benefited from a broad range of favorable economic indicators. The economy continues to grow in an environment of low inflation, low interest rates and reduced taxes. To counter what could become increasing inflationary pressures, the Federal Reserve Board ("Fed") has continued its policy of increasing the federal funds rate by 0.25% at each of its meetings in 2004 and 2005. To date, the Fed has increased this base lending rate twelve times, from 1.0% on June 25, 2003 to 4.00% on November 1, 2005.
Despite otherwise favorable financial and economic news, steadily rising interest rates and the fear of incipient inflation have dampened investors' enthusiasm. For the twelve months ended October 31, 2005, the Standard and Poor's 500 Composite Stock Index ("S&P 500") and the Dow Jones Industrial Average ("Dow Jones") increased by 8.71% and 6.45%, respectively. Moreover, these gains occurred almost entirely in the last two months of 2004, as investors were motivated by the very favorable earnings prospects being projected into 2005.
As 2005 unfolded, favorable business conditions and correspondingly favorable corporate profits were offset by the inexorable rise in interest rates. As the fiscal year drew to a close, the domestic markets were shaken by the awesome destruction wreaked by Hurricanes Katrina and Rita. Modest gains through the summer months were reversed as investors contemplated the future effects of record-high energy prices, escalating budget deficits and the expectation of still higher interest rates.
For most of the past twelve months, longer-term bonds remained remarkably stable. Buying pressure, primarily from foreign sources, offset domestic investors' fears of higher short-term interest rates. This remarkable stability was finally upset by the devastation of our Gulf Coast and its potential effects on inflation and interest rates. For the twelve months ended October 31, 2005, the Lehman Brothers U. S. Intermediate Government/Credit Index ("LBIGC") and the Lehman Brothers U. S. Aggregate Bond Index ("LBAB") delivered total returns of 0.27% and 1.13%, respectively.
PERFORMANCE
For the year ended October 31, 2005, TA IDEX Protected Principal Stock, Class A returned 5.64%. By comparison its benchmark, the S&P 500 returned 8.71%.
STRATEGY REVIEW
TA IDEX Protected Principal Stock is invested in the stocks comprising the S&P 500. Throughout the year, it has been fully hedged with S&P 500 put options and S&P 500 call options. The index call options are continuously sold in order to generate a regular cash flow which supplements the dividends that are paid on the Fund's stock portfolio. Some of that cash flow is used to purchase index put options to help protect the portfolio's assets should there be a sharp decline in stock prices. Full positions in both put and call options were maintained throughout the year.
For the twelve months ended October 31, 2005, good and bad news in the marketplace were in unusual balance. Consequently, volatility, as measured by the Chicago Board Options Exchange's ("CBOE") Volatility Index (the "VIX") traded near the low end of its historical range throughout the year. Since volatility largely determines option prices, the cash flows available from the hedging strategy employed by TA IDEX Protected Principal Stock were commensurately low.
In the fiscal quarter beginning November 1, 2004, the S&P 500 advanced by a robust 4.96%. Hedging transactions limited TA IDEX Protected Principal Stock returns to 1.98%. As the second fiscal quarter developed, stock prices stabilized and TA IDEX Protected Principal Stock benefited from its hedging strategy and posted a return of –0.37%, limiting the –1.61% return for the S&P 500. The third quarter was characterized by a steady advance of 7.17% in the S&P 500. Hedging techniques, while successful in reducing risk exposure, also served to limit participation in strong short-term market advances, and TA IDEX Protected Principal Stock earned 3.33%. From the end of July to the end of October, investors were transfixed by the devastation in the Gulf Coast states. The markets declined sharply with the S&P 500 down 1.78%, but TA IDEX Protected Principal Stock's hedged strategy, called upon to mitigate losses, increased by 0.63%.
With substantial uncertainties continuing to prevail in the financial markets, TA IDEX Protected Principal Stock managers will continue to focus on the fully hedged equity strategy that has successfully protected principal in the past and has proven that it can deliver competitive returns from the combination of hedging cash flows and stock dividends.
J. Patrick Rogers, CFA
Fund Manager
Gateway Investment Advisers, L.P.
Transamerica IDEX Mutual Funds
Annual Report 2005
1
TA IDEX Protected Principal Stock
Comparison of change in value of $10,000 investment in Class A shares and its comparative index.
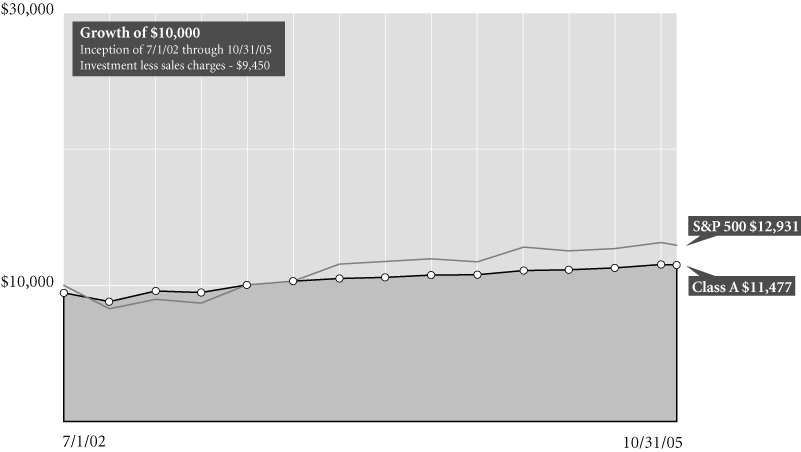
Average Annual Total Return for Periods Ended 10/31/05
| | | 1 year | | From
Inception | | Inception
Date | |
| Class A (NAV) | | | 5.64 | % | | | 5.96 | % | | 7/1/02 | |
| Class A (POP) | | | (0.17 | )% | | | 4.18 | % | | 7/1/02 | |
| S&P 5001 | | | 8.71 | % | | | 7.99 | % | | 7/1/02 | |
| Class B (NAV) | | | 5.00 | % | | | 5.65 | % | | 7/1/02 | |
| Class B (POP) | | | 0.00 | %* | | | 4.58 | % | | 7/1/02 | |
| Class C (NAV) | | | 5.10 | % | | | 5.62 | % | | 7/1/02 | |
| Class C (POP) | | | 5.10 | % | | | 5.62 | % | | 7/1/02 | |
| Class M (NAV) | | | 5.19 | % | | | 5.68 | % | | 7/1/02 | |
| Class M (POP) | | | 3.14 | % | | | 5.36 | % | | 7/1/02 | |
NOTES
1 The Standard and Poor's 500 Composite Stock (S&P 500) Index is an unmanaged index used as a general measure of market performance. Calculations assume dividends and capital gains are reinvested and do not include any managerial expenses. From inception calculation is based on life of Class A shares. Source: Standard & Poor's Micropal®© Micropal, Inc. 2005 – 1-800-596-5323 – http://www.funds-sp.com.
* Rounds to less than 0.01%.
The performance data presented represents past performance, future results may vary. Performance data does not reflect the deduction of taxes that would be paid on fund distributions or the redemption of fund shares. Investment return and principal value will fluctuate so that an investor's shares, when redeemed, may be worth more or less than their original cost. Current performance may be lower or higher than performance quoted. Please see www.transamericaidex.com for performance data current to the most recent month-end.
Public Offering Price (POP) returns include the reinvestment of dividends and capital gains and reflect the maximum sales charge of 5.5% for A shares and 1% for M shares or the maximum applicable contingent deferred sales charge (5% in the 1st year, decreasing to 0% after 6 years) for Class B shares. Class C shares do not impose a sales charge. Shares purchased prior to March 1, 2004 are subject to a maximum applicable contingent deferred sales charge (5% in the 1st year, decreasing to 0% after 7 years) for Class B shares and (2% in the 1st year, decreasing to 0% after 2 years) for Class C shares. Net Asset Value (NAV) returns include the reinvestment of dividends and capital gains but do not reflect any sales charges.
Investments that utilize options strategies may be subject to specific risks, including limited opportunity to participate in rising stock markets or increased risk during market declines. In general,mutual funds that invest in stocks are subject to risks including weaknesses in the market as a whole, in a particular industry, or in a specific holding, and from adverse political or economic developments here or abroad.
Shareholders may lose some or all of the value of their guaranteed amount if they redeem before the end of the 5-year Guarantee Period.
This material must be preceded or accompanied by a current prospectus, which includes specific contents regarding the investment objectives and policies of this fund.
Transamerica IDEX Mutual Funds
Annual Report 2005
2
TA IDEX Protected Principal Stock
UNDERSTANDING YOUR FUND'S EXPENSES
(unaudited)
SHAREHOLDER EXPENSES
Fund shareholders may incur two types of costs: (1) transaction costs, including sales charges (loads) on purchases, contingent deferred sales charges on redemptions and redemption fees; and (2) ongoing costs, including management fees, 12b-1 distribution and service fees, and other fund expenses.
The following Example is intended to help you understand your ongoing costs (in dollars and cents) of investing in a Fund and to compare these costs with the ongoing costs of investing in other funds.
The Example is based on an investment of $1,000 invested at May 1, 2005 and held for the entire period until October 31, 2005.
ACTUAL EXPENSES
The first line in the table below provides information about actual account values and actual expenses. You may use the information in this line, together with the amount you invested, to estimate the expenses that you paid over the period. Simply divide your account value by $1,000 (for example, an $8,600 account value divided by $1,000 = 8.6), then multiply the result by the number in the first line of your Fund under the heading entitled "Expenses Paid During Period" to estimate the expenses you paid on your account during this period. If your account is an IRA, your expenses could have included a $15 annual fee. The amount of any fee paid through your account would increase the estimate of expenses you paid during the period and decrease your ending account value.
HYPOTHETICAL EXAMPLE FOR COMPARISON PURPOSES
The second line in the table below provides information about hypothetical account values and hypothetical expenses based on the Fund's actual expense ratio and an assumed rate of return of 5% per year before expenses, which is not the Fund's actual return. The hypothetical account values and expenses may not be used to estimate the actual ending account balance or expenses you paid for the period. You may use this information to compare the ongoing costs of investing in your Fund and other funds. To do so, compare this 5% hypothetical example with the 5% hypothetical examples that appear in the shareholder reports of the other funds. As in the case of the actual expense example, if your account is subject to an IRA fee, the amount of the fee paid through your account would increase the hypothetical expenses you would have paid during the period and decrease the hypothetical ending account value.
Please note that the expenses shown in the table are meant to highlight your ongoing costs only and do not reflect any transactional costs, such as sales charges, redemption fees, brokerage commissions paid on purchases and sales of fund shares. Therefore, the second line under the Fund in the table is useful in comparing ongoing costs only, and will not help you determine the relative total costs of owning different funds. If any of these transaction costs were included, your costs would be higher. The expenses shown in the table do not reflect any fees that may be charged to you by brokers, financial intermediaries or other financial institutions.
| | | Beginning
Account
Value | | Ending
Account
Value | | Annualized
Expense
Ratio | | Expenses Paid
During Period (a) | |
| Class A | |
| Actual | | $ | 1,000.00 | | | $ | 1,039.80 | | | | 2.12 | % | | $ | 10.90 | | |
| Hypothetical (b) | | | 1,000.00 | | | | 1,014.52 | | | | 2.12 | | | | 10.76 | | |
| Class B | |
| Actual | | | 1,000.00 | | | | 1,035.30 | | | | 2.90 | | | | 14.88 | | |
| Hypothetical (b) | | | 1,000.00 | | | | 1,010.59 | | | | 2.90 | | | | 14.70 | | |
| Class C | |
| Actual | | | 1,000.00 | | | | 1,037.30 | | | | 2.65 | | | | 13.61 | | |
| Hypothetical (b) | | | 1,000.00 | | | | 1,011.85 | | | | 2.65 | | | | 13.44 | | |
| Class M | |
| Actual | | | 1,000.00 | | | | 1,039.20 | | | | 2.36 | | | | 12.13 | | |
| Hypothetical (b) | | | 1,000.00 | | | | 1,013.31 | | | | 2.36 | | | | 11.98 | | |
(a) Expenses are calculated using each Fund's annualized expense ratio (as disclosed in the table), multiplied by the average account value for the period, multiplied by number of days in the period (184 days), and divided by the number of days in the year (365 days).
(b) 5% return per year before expenses.
GRAPHICAL PRESENTATION OF SCHEDULE OF INVESTMENTS
By Sector
At October 31, 2005
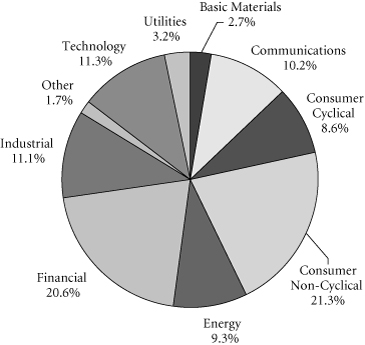
This chart shows the percentage breakdown by sector of the Fund's total investment securities.
Transamerica IDEX Mutual Funds
Annual Report 2005
3
TA IDEX Protected Principal Stock
SCHEDULE OF INVESTMENTS
At October 31, 2005
(all amounts except share amounts in thousands)
| | | Shares | | Value | |
| COMMON STOCKS (98.7%) # | | | |
| Aerospace (1.7%) | | | |
| Boeing Co. (The) | | | 3,600 | | | $ | 233 | | |
| General Dynamics Corp. | | | 900 | | | | 105 | | |
| Goodrich Corp. | | | 500 | | | | 18 | | |
| Lockheed Martin Corp. | | | 1,600 | | | | 97 | | |
| Northrop Grumman Corp. | | | 1,370 | | | | 74 | | |
| Textron, Inc. | | | 600 | | | | 43 | | |
| United Technologies Corp. | | | 4,400 | | | | 226 | | |
| Air Transportation (0.3%) | | | |
| FedEx Corp. | | | 1,100 | | | | 101 | | |
| Southwest Airlines Co. | | | 3,200 | | | | 51 | | |
| Amusement & Recreation Services (0.5%) | | | |
| Disney (Walt) Co. (The) | | | 8,800 | | | | 214 | | |
| Harrah's Entertainment, Inc. | | | 600 | | | | 36 | | |
| Apparel & Accessory Stores (0.4%) | | | |
| Gap (The), Inc. | | | 2,600 | | | | 45 | | |
| Kohl's Corp. ‡ | | | 1,300 | | | | 63 | | |
| Ltd. Brands | | | 1,500 | | | | 30 | | |
| Nordstrom, Inc. | | | 1,000 | | | | 35 | | |
| Apparel Products (0.2%) | | | |
| Cintas Corp. | | | 600 | | | | 24 | | |
| Jones Apparel Group, Inc. | | | 500 | | | | 14 | | |
| Liz Claiborne, Inc. | | | 500 | | | | 18 | | |
| V.F. Corp. | | | 400 | | | | 21 | | |
| Auto Repair, Services & Parking (0.0%) | | | |
| Ryder System, Inc. | | | 300 | | | | 12 | | |
| Automotive (0.7%) | | | |
| Dana Corp. | | | 700 | | | | 5 | | |
| Ford Motor Co. | | | 8,000 | | | | 67 | | |
| General Motors Corp. | | | 2,500 | | | | 69 | | |
| Genuine Parts Co. | | | 800 | | | | 35 | | |
| Harley-Davidson, Inc. | | | 1,100 | | | | 54 | | |
| ITT Industries, Inc. | | | 400 | | | | 41 | | |
| Navistar International Corp. ‡ | | | 300 | | | | 8 | | |
| PACCAR, Inc. | | | 800 | | | | 56 | | |
| Automotive Dealers & Service Stations (0.1%) | | | |
| AutoNation, Inc. ‡ | | | 950 | | | | 19 | | |
| AutoZone, Inc. ‡ | | | 300 | | | | 24 | | |
| Beverages (2.2%) | | | |
| Anheuser-Busch Cos., Inc. | | | 3,400 | | | | 140 | | |
| Brown-Forman Corp.–Class B | | | 400 | | | | 25 | | |
| Coca-Cola Co. (The) | | | 8,900 | | | | 381 | | |
| Coca-Cola Enterprises, Inc. | | | 1,400 | | | | 26 | | |
| Constellation Brands, Inc.–Class A ‡ | | | 600 | | | | 14 | | |
| | | Shares | | Value | |
| Beverages (continued) | |
| Molson Coors Brewing Co.–Class B | | | 400 | | | $ | 25 | | |
| Pepsi Bottling Group, Inc. | | | 900 | | | | 26 | | |
| PepsiCo, Inc. | | | 7,300 | | | | 431 | | |
| Business Credit Institutions (0.9%) | |
| CIT Group, Inc. | | | 900 | | | | 41 | | |
| Fannie Mae | | | 4,200 | | | | 200 | | |
| Freddie Mac | | | 2,900 | | | | 178 | | |
| Business Services (1.4%) | |
| Cendant Corp. | | | 4,400 | | | | 77 | | |
| Clear Channel Communications, Inc. | | | 2,100 | | | | 64 | | |
| Convergys Corp. ‡ | | | 600 | | | | 10 | | |
| eBay, Inc. ‡ | | | 4,700 | | | | 186 | | |
| Equifax, Inc. | | | 600 | | | | 21 | | |
| First Data Corp. | | | 3,395 | | | | 137 | | |
| Interpublic Group of Cos., Inc. ‡ | | | 1,600 | | | | 17 | | |
| Monster Worldwide, Inc. ‡ | | | 500 | | | | 16 | | |
| Moody's Corp. | | | 1,000 | | | | 53 | | |
| Omnicom Group, Inc. | | | 800 | | | | 66 | | |
| Robert Half International, Inc. | | | 700 | | | | 26 | | |
| Chemicals & Allied Products (3.7%) | |
| Air Products & Chemicals, Inc. | | | 1,000 | | | | 57 | | |
| Alberto Culver Co.–Class B | | | 400 | | | | 17 | | |
| Avon Products, Inc. | | | 1,900 | | | | 51 | | |
| Clorox Co. | | | 700 | | | | 38 | | |
| Colgate-Palmolive Co. | | | 2,300 | | | | 122 | | |
| Dow Chemical Co. (The) | | | 4,200 | | | | 193 | | |
| du Pont (E.I.) de Nemours & Co. | | | 4,300 | | | | 179 | | |
| Eastman Chemical Co. | | | 400 | | | | 21 | | |
| Ecolab, Inc. | | | 1,000 | | | | 33 | | |
| International Flavors & Fragrances, Inc. | | | 400 | | | | 13 | | |
| Monsanto Co. | | | 971 | | | | 61 | | |
| PPG Industries, Inc. | | | 800 | | | | 48 | | |
| Praxair, Inc. | | | 1,200 | | | | 59 | | |
| Procter & Gamble Co. | | | 14,502 | | | | 812 | | |
| Rohm & Haas Co. | | | 900 | | | | 39 | | |
| Sherwin-Williams Co. (The) | | | 500 | | | | 21 | | |
| Commercial Banks (9.8%) | |
| AmSouth Bancorp | | | 1,400 | | | | 35 | | |
| Bank of America Corp. | | | 17,418 | | | | 762 | | |
| Bank of New York Co., Inc. (The) | | | 3,400 | | | | 106 | | |
| BB&T Corp. | | | 2,400 | | | | 102 | | |
| Citigroup, Inc. | | | 22,600 | | | | 1,035 | | |
| Comerica, Inc. | | | 800 | | | | 46 | | |
| Compass Bancshares, Inc. | | | 500 | | | | 24 | | |
| Fifth Third Bancorp | | | 2,300 | | | | 92 | | |
| First Horizon National Corp. | | | 500 | | | | 19 | | |
The notes to the financial statements are an integral part of this report.
Transamerica IDEX Mutual Funds
Annual Report 2005
4
TA IDEX Protected Principal Stock
SCHEDULE OF INVESTMENTS (continued)
At October 31, 2005
(all amounts except share amounts in thousands)
| | | Shares | | Value | |
| Commercial Banks (continued) | | | |
| Huntington Bancshares, Inc. | | | 1,000 | | | $ | 23 | | |
| JP Morgan Chase & Co. | | | 15,348 | | | | 562 | | |
| KeyCorp | | | 1,600 | | | | 52 | | |
| M&T Bank Corp. | | | 400 | | | | 43 | | |
| Marshall & IIsley Corp. | | | 900 | | | | 39 | | |
| MBNA Corp. | | | 5,500 | | | | 141 | | |
| Mellon Financial Corp. | | | 1,600 | | | | 51 | | |
| National City Corp. | | | 2,500 | | | | 81 | | |
| North Fork Bancorp, Inc. | | | 1,900 | | | | 48 | | |
| Northern Trust Corp. | | | 900 | | | | 48 | | |
| PNC Financial Services Group, Inc. | | | 1,100 | | | | 67 | | |
| Regions Financial Corp. | | | 2,081 | | | | 68 | | |
| State Street Corp. | | | 1,500 | | | | 83 | | |
| SunTrust Banks, Inc. | | | 1,500 | | | | 109 | | |
| Synovus Financial Corp. | | | 1,200 | | | | 33 | | |
| US Bancorp | | | 8,000 | | | | 237 | | |
| Wachovia Corp. | | | 6,802 | | | | 344 | | |
| Wells Fargo & Co. | | | 7,300 | | | | 439 | | |
| Zions Bancorp | | | 400 | | | | 29 | | |
| Communication (1.0%) | | | |
| Comcast Corp.–Class A ‡ | | | 9,619 | | | | 268 | | |
| Viacom, Inc.–Class B | | | 7,000 | | | | 217 | | |
| Communications Equipment (1.9%) | | | |
| ADC Telecommunications, Inc. ‡ | | | 542 | | | | 9 | | |
| Andrew Corp. ‡ | | | 700 | | | | 7 | | |
| Avaya, Inc. ‡ | | | 1,900 | | | | 22 | | |
| CIENA Corp. ‡ | | | 2,400 | | | | 6 | | |
| Comverse Technology, Inc. ‡ | | | 900 | | | | 23 | | |
| Corning, Inc. ‡ | | | 6,100 | | | | 123 | | |
| L-3 Communications Holdings, Inc. | | | 500 | | | | 39 | | |
| Lucent Technologies, Inc. ‡ | | | 19,300 | | | | 55 | | |
| Motorola, Inc. | | | 10,600 | | | | 235 | | |
| Network Appliance, Inc. ‡ | | | 1,400 | | | | 38 | | |
| QUALCOMM, Inc. | | | 7,100 | | | | 282 | | |
| Rockwell Collins, Inc. | | | 800 | | | | 37 | | |
| Scientific-Atlanta, Inc. | | | 700 | | | | 25 | | |
| Tellabs, Inc. ‡ | | | 2,000 | | | | 19 | | |
| Computer & Data Processing Services (4.9%) | | | |
| Adobe Systems, Inc. | | | 2,000 | | | | 65 | | |
| Affiliated Computer Services, Inc.–Class A ‡ | | | 550 | | | | 30 | | |
| Autodesk, Inc. | | | 1,000 | | | | 45 | | |
| Automatic Data Processing, Inc. | | | 2,600 | | | | 121 | | |
| BMC Software, Inc. ‡ | | | 1,000 | | | | 20 | | |
| Citrix Systems, Inc. ‡ | | | 700 | | | | 19 | | |
| Computer Associates International, Inc. | | | 2,000 | | | | 56 | | |
| Computer Sciences Corp. ‡ | | | 800 | | | | 41 | | |
| | | Shares | | Value | |
| Computer & Data Processing Services (continued) | | | |
| Compuware Corp. ‡ | | | 1,500 | | | $ | 12 | | |
| Electronic Arts, Inc. ‡ | | | 1,200 | | | | 68 | | |
| Electronic Data Systems Corp. | | | 2,300 | | | | 54 | | |
| Fiserv, Inc. ‡ | | | 800 | | | | 35 | | |
| IMS Health, Inc. | | | 1,000 | | | | 23 | | |
| Intuit, Inc. ‡ | | | 800 | | | | 37 | | |
| Mercury Interactive Corp. ‡ | | | 400 | | | | 14 | | |
| Microsoft Corp. | | | 40,100 | | | | 1,031 | | |
| NCR Corp. ‡ | | | 800 | | | | 24 | | |
| Novell, Inc. ‡ | | | 1,500 | | | | 11 | | |
| Oracle Corp. ‡ | | | 16,300 | | | | 207 | | |
| Parametric Technology Corp. ‡ | | | 1,000 | | | | 7 | | |
| Sabre Holdings Corp. | | | 600 | | | | 12 | | |
| Siebel Systems, Inc. | | | 2,300 | | | | 24 | | |
| Sun Microsystems, Inc. ‡ | | | 14,700 | | | | 59 | | |
| Symantec Corp. ‡ | | | 5,023 | | | | 120 | | |
| Unisys Corp. ‡ | | | 1,500 | | | | 8 | | |
| Yahoo!, Inc. ‡ | | | 5,600 | | | | 207 | | |
| Computer & Office Equipment (4.6%) | | | |
| Apple Computer, Inc. ‡ | | | 3,600 | | | | 207 | | |
| Cisco Systems, Inc. ‡ | | | 27,800 | | | | 485 | | |
| Dell, Inc. ‡ | | | 10,500 | | | | 335 | | |
| EMC Corp. ‡ | | | 10,400 | | | | 145 | | |
| Gateway, Inc. ‡ | | | 1,100 | | | | 3 | | |
| Hewlett-Packard Co. | | | 12,600 | | | | 353 | | |
| International Business Machines Corp. | | | 7,000 | | | | 573 | | |
| Jabil Circuit, Inc. ‡ | | | 800 | | | | 24 | | |
| Lexmark International, Inc. ‡ | | | 500 | | | | 21 | | |
| Pitney Bowes, Inc. | | | 1,000 | | | | 42 | | |
| Symbol Technologies, Inc. | | | 905 | | | | 8 | | |
| Construction (0.2%) | | | |
| Centex Corp. | | | 500 | | | | 32 | | |
| Fluor Corp. | | | 400 | | | | 25 | | |
| KB Home | | | 400 | | | | 26 | | |
| Pulte Homes, Inc. | | | 1,000 | | | | 38 | | |
| Department Stores (0.3%) | | | |
| Dillard's, Inc.–Class A | | | 300 | | | | 6 | | |
| Federated Department Stores, Inc. | | | 1,142 | | | | 70 | | |
| JC Penney Co., Inc. | | | 1,000 | | | | 51 | | |
| TJX Cos., Inc. | | | 1,900 | | | | 41 | | |
| Diversified (0.3%) | | | |
| Honeywell International, Inc. | | | 3,700 | | | | 127 | | |
| Vornado Realty Trust REIT | | | 400 | | | | 32 | | |
| Drug Stores & Proprietary Stores (0.6%) | | | |
| CVS Corp. | | | 3,500 | | | | 85 | | |
| Walgreen Co. | | | 4,400 | | | | 200 | | |
The notes to the financial statements are an integral part of this report.
Transamerica IDEX Mutual Funds
Annual Report 2005
5
TA IDEX Protected Principal Stock
SCHEDULE OF INVESTMENTS (continued)
At October 31, 2005
(all amounts except share amounts in thousands)
| | | Shares | | Value | |
| Educational Services (0.1%) | | | |
| Apollo Group, Inc.–Class A ‡ | | | 700 | | | $ | 44 | | |
| Electric Services (2.2%) | | | |
| AES Corp. (The) ‡ | | | 2,900 | | | | 46 | | |
| Allegheny Energy, Inc. ‡ | | | 600 | | | | 17 | | |
| American Electric Power Co., Inc. | | | 1,500 | | | | 57 | | |
| Calpine Corp. ‡ | | | 2,000 | | | | 5 | | |
| CenterPoint Energy, Inc. | | | 1,100 | | | | 15 | | |
| CMS Energy Corp. ‡ | | | 900 | | | | 13 | | |
| Consolidated Edison, Inc. | | | 900 | | | | 41 | | |
| Constellation Energy Group, Inc. | | | 800 | | | | 44 | | |
| Dominion Resources, Inc. | | | 1,300 | | | | 99 | | |
| DTE Energy Co. | | | 800 | | | | 35 | | |
| Duke Energy Corp. | | | 4,000 | | | | 106 | | |
| Edison International | | | 1,300 | | | | 57 | | |
| FirstEnergy Corp. | | | 1,300 | | | | 62 | | |
| FPL Group, Inc. | | | 1,500 | | | | 65 | | |
| Pinnacle West Capital Corp. | | | 400 | | | | 17 | | |
| PPL Corp. | | | 1,600 | | | | 50 | | |
| Progress Energy, Inc. | | | 900 | | | | 39 | | |
| Sempra Energy | | | 1,100 | | | | 49 | | |
| Southern Co. (The) | | | 3,300 | | | | 115 | | |
| TECO Energy, Inc. | | | 900 | | | | 16 | | |
| TXU Corp. | | | 900 | | | | 91 | | |
| Xcel Energy, Inc. | | | 1,800 | | | | 33 | | |
| Electric, Gas & Sanitary Services (0.9%) | | | |
| Ameren Corp. | | | 900 | | | | 47 | | |
| Cinergy Corp. | | | 800 | | | | 32 | | |
| Entergy Corp. | | | 900 | | | | 64 | | |
| Exelon Corp. | | | 2,800 | | | | 146 | | |
| NiSource, Inc. | | | 1,000 | | | | 24 | | |
| PG&E Corp. | | | 1,400 | | | | 51 | | |
| Public Service Enterprise Group, Inc. | | | 900 | | | | 57 | | |
| Electronic & Other Electric Equipment (3.6%) | | | |
| Cooper Industries, Ltd.–Class A | | | 400 | | | | 28 | | |
| Emerson Electric Co. | | | 1,600 | | | | 111 | | |
| General Electric Co. | | | 46,100 | | | | 1,563 | | |
| Maytag Corp. | | | 400 | | | | 7 | | |
| Whirlpool Corp. | | | 300 | | | | 24 | | |
| Electronic Components & Accessories (3.3%) | | | |
| Advanced Micro Devices, Inc. ‡ | | | 1,600 | | | | 37 | | |
| Altera Corp. ‡ | | | 1,500 | | | | 25 | | |
| American Power Conversion Corp. | | | 800 | | | | 17 | | |
| Analog Devices, Inc. | | | 1,500 | | | | 52 | | |
| Applied Micro Circuits Corp. ‡ | | | 1,200 | | | | 3 | | |
| Broadcom Corp.–Class A ‡ | | | 1,100 | | | | 47 | | |
| Freescale Semiconductor, Inc.–Class B ‡ | | | 1,558 | | | | 37 | | |
| | | Shares | | Value | |
| Electronic Components & Accessories (continued) | | | |
| Intel Corp. | | | 26,400 | | | $ | 620 | | |
| JDS Uniphase Corp. ‡ | | | 6,300 | | | | 13 | | |
| Linear Technology Corp. | | | 1,200 | | | | 40 | | |
| LSI Logic Corp. ‡ | | | 1,500 | | | | 12 | | |
| Maxim Integrated Products, Inc. | | | 1,300 | | | | 45 | | |
| Micron Technology, Inc. ‡ | | | 2,600 | | | | 34 | | |
| Molex, Inc. | | | 700 | | | | 18 | | |
| National Semiconductor Corp. | | | 1,400 | | | | 32 | | |
| Novellus Systems, Inc. | | | 600 | | | | 13 | | |
| NVIDIA Corp. ‡ | | | 700 | | | | 23 | | |
| PMC-Sierra, Inc. ‡ | | | 800 | | | | 6 | | |
| QLogic Corp. ‡ | | | 400 | | | | 12 | | |
| Sanmina-SCI Corp. ‡ | | | 2,300 | | | | 8 | | |
| Solectron Corp. ‡ | | | 4,200 | | | | 15 | | |
| Texas Instruments, Inc. | | | 7,200 | | | | 206 | | |
| Tyco International, Ltd. | | | 8,800 | | | | 232 | | |
| Xilinx, Inc. | | | 1,600 | | | | 38 | | |
| Entertainment (0.1%) | | | |
| International Game Technology | | | 1,300 | | | | 34 | | |
| Environmental Services (0.2%) | | | |
| Allied Waste Industries, Inc. ‡ | | | 1,000 | | | | 8 | | |
| Waste Management, Inc. | | | 2,500 | | | | 74 | | |
| Fabricated Metal Products (0.2%) | | | |
| Fortune Brands, Inc. | | | 600 | | | | 46 | | |
| Parker Hannifin Corp. | | | 500 | | | | 31 | | |
| Finance (1.4%) | | | |
| SPDR Trust Series 1 | | | 5,465 | | | | 657 | | |
| Food & Kindred Products (2.5%) | | | |
| Altria Group, Inc. | | | 9,000 | | | | 675 | | |
| Archer-Daniels-Midland Co. | | | 2,600 | | | | 63 | | |
| Campbell Soup Co. | | | 1,200 | | | | 35 | | |
| ConAgra Foods, Inc. | | | 2,300 | | | | 54 | | |
| General Mills, Inc. | | | 1,400 | | | | 68 | | |
| Hercules, Inc. ‡ | | | 500 | | | | 6 | | |
| Hershey Co. (The) | | | 1,000 | | | | 57 | | |
| HJ Heinz Co. | | | 1,400 | | | | 50 | | |
| Kellogg Co. | | | 1,000 | | | | 44 | | |
| McCormick & Co., Inc. | | | 600 | | | | 18 | | |
| Sara Lee Corp. | | | 3,400 | | | | 61 | | |
| Tyson Foods, Inc.–Class A | | | 1,000 | | | | 18 | | |
| WM Wrigley Jr. Co. | | | 900 | | | | 63 | | |
| Food Stores (0.3%) | | | |
| Albertson's, Inc. | | | 1,400 | | | | 35 | | |
| Kroger Co. ‡ | | | 3,100 | | | | 62 | | |
| Safeway, Inc. | | | 2,000 | | | | 47 | | |
The notes to the financial statements are an integral part of this report.
Transamerica IDEX Mutual Funds
Annual Report 2005
6
TA IDEX Protected Principal Stock
SCHEDULE OF INVESTMENTS (continued)
At October 31, 2005
(all amounts except share amounts in thousands)
| | | Shares | | Value | |
| Furniture & Fixtures (0.3%) | |
| Johnson Controls, Inc. | | | 900 | | | $ | 61 | | |
| Leggett & Platt, Inc. | | | 800 | | | | 16 | | |
| Masco Corp. | | | 1,700 | | | | 48 | | |
| Furniture & Home Furnishings Stores (0.1%) | |
| Bed Bath & Beyond, Inc. ‡ | | | 1,100 | | | | 45 | | |
| Gas Production & Distribution (0.4%) | |
| Dynegy, Inc.–Class A ‡ | | | 1,300 | | | | 6 | | |
| El Paso Corp. | | | 2,700 | | | | 32 | | |
| KeySpan Corp. | | | 700 | | | | 24 | | |
| Kinder Morgan, Inc. | | | 500 | | | | 45 | | |
| Nicor, Inc. | | | 200 | | | | 8 | | |
| Peoples Energy Corp. | | | 200 | | | | 7 | | |
| Williams Cos., Inc. (The) | | | 2,500 | | | | 56 | | |
| Health Services (0.8%) | |
| Caremark Rx, Inc. ‡ | | | 1,800 | | | | 94 | | |
| Coventry Health Care, Inc. ‡ | | | 600 | | | | 32 | | |
| Express Scripts, Inc. ‡ | | | 700 | | | | 53 | | |
| HCA, Inc. | | | 1,700 | | | | 82 | | |
| Health Management Associates, Inc.–Class A | | | 900 | | | | 19 | | |
| Laboratory Corp. of America Holdings ‡ | | | 600 | | | | 29 | | |
| Manor Care, Inc. | | | 400 | | | | 15 | | |
| Quest Diagnostics, Inc. | | | 800 | | | | 37 | | |
| Tenet Healthcare Corp. ‡ | | | 2,100 | | | | 18 | | |
| Holding & Other Investment Offices (0.3%) | |
Apartment Investment & Management
Co.–Class A | | | 440 | | | | 17 | | |
| Archstone-Smith Trust REIT | | | 900 | | | | 37 | | |
| Equity Residential | | | 1,100 | | | | 43 | | |
| Plum Creek Timber Co., Inc. | | | 800 | | | | 31 | | |
| Public Storage, Inc. | | | 400 | | | | 26 | | |
| Hotels & Other Lodging Places (0.3%) | |
| Hilton Hotels Corp. | | | 1,500 | | | | 29 | | |
| Marriott International, Inc.–Class A | | | 900 | | | | 54 | | |
| Starwood Hotels & Resorts Worldwide, Inc. | | | 1,000 | | | | 58 | | |
| Industrial Machinery & Equipment (1.6%) | |
| American Standard Cos., Inc. | | | 800 | | | | 30 | | |
| Applied Materials, Inc. | | | 7,100 | | | | 116 | | |
| Baker Hughes, Inc. | | | 1,300 | | | | 71 | | |
| Black & Decker Corp. | | | 400 | | | | 33 | | |
| Caterpillar, Inc. | | | 3,100 | | | | 163 | | |
| Cummins, Inc. | | | 200 | | | | 17 | | |
| Deere & Co. | | | 900 | | | | 55 | | |
| Dover Corp. | | | 900 | | | | 35 | | |
| Eaton Corp. | | | 700 | | | | 41 | | |
| Illinois Tool Works, Inc. | | | 1,000 | | | | 85 | | |
| Ingersoll-Rand Co.–Class A | | | 1,600 | | | | 60 | | |
| | | Shares | | Value | |
| Industrial Machinery & Equipment (continued) | | | |
| National Oilwell Varco, Inc. ‡ | | | 700 | | | $ | 44 | | |
| Pall Corp. | | | 500 | | | | 13 | | |
| Stanley Works (The) | | | 300 | | | | 14 | | |
| Instruments & Related Products (1.1%) | | | |
| Agilent Technologies, Inc. ‡ | | | 2,200 | | | | 70 | | |
| Applera Corp.-Applied Biosystems Group | | | 900 | | | | 22 | | |
| Bausch & Lomb, Inc. | | | 200 | | | | 15 | | |
| Danaher Corp. | | | 1,000 | | | | 52 | | |
| Eastman Kodak Co. | | | 1,100 | | | | 24 | | |
| Fisher Scientific International ‡ | | | 500 | | | | 28 | | |
| KLA-Tencor Corp. | | | 900 | | | | 42 | | |
| Millipore Corp. ‡ | | | 200 | | | | 12 | | |
| PerkinElmer, Inc. | | | 500 | | | | 11 | | |
| Raytheon Co. | | | 2,000 | | | | 74 | | |
| Rockwell Automation, Inc. | | | 800 | | | | 43 | | |
| Snap-On, Inc. | | | 300 | | | | 11 | | |
| Tektronix, Inc. | | | 400 | | | | 9 | | |
| Teradyne, Inc. ‡ | | | 900 | | | | 12 | | |
| Thermo Electron Corp. ‡ | | | 700 | | | | 21 | | |
| Waters Corp. ‡ | | | 500 | | | | 18 | | |
| Xerox Corp. ‡ | | | 4,200 | | | | 57 | | |
| Insurance (4.9%) | | | |
| ACE, Ltd. | | | 1,100 | | | | 57 | | |
| Aetna, Inc. | | | 1,100 | | | | 97 | | |
| AFLAC, Inc. | | | 2,000 | | | | 96 | | |
| Allstate Corp. (The) | | | 2,900 | | | | 153 | | |
| AMBAC Financial Group, Inc. | | | 500 | | | | 35 | | |
| American International Group, Inc. | | | 11,300 | | | | 732 | | |
| Chubb Corp. | | | 900 | | | | 84 | | |
| Cigna Corp. | | | 600 | | | | 70 | | |
| Cincinnati Financial Corp. | | | 682 | | | | 29 | | |
| Loews Corp. | | | 700 | | | | 65 | | |
| MBIA, Inc. | | | 600 | | | | 35 | | |
| MGIC Investment Corp. | | | 400 | | | | 24 | | |
| Principal Financial Group | | | 1,100 | | | | 55 | | |
| Progressive Corp. (The) | | | 900 | | | | 104 | | |
| SAFECO Corp. | | | 500 | | | | 28 | | |
| St. Paul Travelers Cos., Inc. (The) | | | 2,847 | | | | 128 | | |
| UnitedHealth Group, Inc. | | | 5,500 | | | | 318 | | |
| UnumProvident Corp. | | | 1,300 | | | | 26 | | |
| WellPoint, Inc. ‡ | | | 2,600 | | | | 194 | | |
| XL Capital, Ltd.–Class A | | | 600 | | | | 38 | | |
| Insurance Agents, Brokers & Service (0.5%) | | | |
| AON Corp. | | | 1,200 | | | | 41 | | |
| Hartford Financial Services Group, Inc. (The) | | | 1,100 | | | | 88 | | |
| Humana, Inc. ‡ | | | 700 | | | | 31 | | |
| Marsh & McLennan Cos., Inc. | | | 2,300 | | | | 67 | | |
The notes to the financial statements are an integral part of this report.
Transamerica IDEX Mutual Funds
Annual Report 2005
7
TA IDEX Protected Principal Stock
SCHEDULE OF INVESTMENTS (continued)
At October 31, 2005
(all amounts except share amounts in thousands)
| | | Shares | | Value | |
| Leather & Leather Products (0.1%) | | | |
| Coach, Inc. ‡ | | | 1,500 | | | $ | 48 | | |
| Life Insurance (0.9%) | | | |
| Jefferson Pilot Corp. | | | 600 | | | | 33 | | |
| Lincoln National Corp. | | | 800 | | | | 40 | | |
| Metlife, Inc. | | | 3,100 | | | | 153 | | |
| Prudential Financial, Inc. | | | 2,300 | | | | 167 | | |
| Torchmark Corp. | | | 500 | | | | 26 | | |
| Lumber & Other Building Materials (1.2%) | | | |
| Home Depot, Inc. (The) | | | 9,400 | | | | 386 | | |
| Lowe's Cos., Inc. | | | 3,400 | | | | 207 | | |
| Lumber & Wood Products (0.2%) | | | |
| Georgia-Pacific Corp. | | | 1,000 | | | | 33 | | |
| Louisiana-Pacific Corp. | | | 500 | | | | 12 | | |
| Weyerhaeuser Co. | | | 1,100 | | | | 70 | | |
| Management Services (0.1%) | | | |
| Paychex, Inc. | | | 1,400 | | | | 54 | | |
| Medical Instruments & Supplies (1.7%) | | | |
| Bard, (C.R.) Inc. | | | 500 | | | | 31 | | |
| Baxter International, Inc. | | | 2,600 | | | | 99 | | |
| Becton Dickinson & Co. | | | 900 | | | | 46 | | |
| Biomet, Inc. | | | 900 | | | | 31 | | |
| Boston Scientific Corp. ‡ | | | 2,600 | | | | 65 | | |
| Guidant Corp. | | | 1,300 | | | | 82 | | |
| Medtronic, Inc. | | | 5,200 | | | | 295 | | |
| St. Jude Medical, Inc. ‡ | | | 1,400 | | | | 67 | | |
| Stryker Corp. | | | 1,200 | | | | 49 | | |
| Zimmer Holdings, Inc. ‡ | | | 1,100 | | | | 70 | | |
| Metal Cans & Shipping Containers (0.0%) | | | |
| Ball Corp. | | | 500 | | | | 20 | | |
| Metal Mining (0.3%) | | | |
| Freeport-McMoRan Copper & Gold, Inc.–Class B | | | 800 | | | | 40 | | |
| Newmont Mining Corp. | | | 1,800 | | | | 77 | | |
| Phelps Dodge Corp. | | | 400 | | | | 48 | | |
| Mining (0.1%) | | | |
| Vulcan Materials Co. | | | 500 | | | | 33 | | |
| Mortgage Bankers & Brokers (0.2%) | | | |
| Countrywide Financial Corp. | | | 2,400 | | | | 76 | | |
| Motion Pictures (1.1%) | | | |
| News Corp., Inc.–Class A | | | 10,500 | | | | 150 | | |
| Time Warner, Inc. | | | 20,400 | | | | 364 | | |
| Motor Vehicles, Parts & Supplies (0.0%) | | | |
| Visteon Corp. ‡ | | | 600 | | | | 5 | | |
| | | Shares | | Value | |
| Office Property (0.1%) | |
| Equity Office Properties Trust | | | 1,600 | | | $ | 49 | | |
| Oil & Gas Extraction (2.7%) | |
| Anadarko Petroleum Corp. | | | 900 | | | | 82 | | |
| Apache Corp. | | | 1,310 | | | | 84 | | |
| BJ Services Co. | | | 1,400 | | | | 49 | | |
| Burlington Resources, Inc. | | | 1,500 | | | | 108 | | |
| Devon Energy Corp. | | | 1,900 | | | | 115 | | |
| EOG Resources, Inc. | | | 900 | | | | 61 | | |
| Halliburton Co. | | | 2,100 | | | | 124 | | |
| Kerr-McGee Corp. | | | 500 | | | | 43 | | |
| Nabors Industries, Ltd. ‡ | | | 600 | | | | 41 | | |
| Noble Corp. | | | 600 | | | | 39 | | |
| Occidental Petroleum Corp. | | | 1,600 | | | | 126 | | |
| Rowan Cos., Inc. | | | 500 | | | | 16 | | |
| Schlumberger, Ltd. | | | 2,600 | | | | 236 | | |
| Transocean, Inc. ‡ | | | 1,500 | | | | 86 | | |
| Weatherford International, Ltd. ‡ | | | 600 | | | | 38 | | |
| XTO Energy, Inc. | | | 1,533 | | | | 67 | | |
| Paper & Allied Products (1.1%) | |
| 3M Co. | | | 3,400 | | | | 258 | | |
| Avery Dennison Corp. | | | 500 | | | | 28 | | |
| Bemis Co. | | | 500 | | | | 13 | | |
| International Paper Co. | | | 2,000 | | | | 58 | | |
| Kimberly-Clark Corp. | | | 1,900 | | | | 108 | | |
| MeadWestvaco Corp. | | | 800 | | | | 21 | | |
| OfficeMax, Inc. | | | 300 | | | | 8 | | |
| Pactiv Corp. ‡ | | | 600 | | | | 12 | | |
| Temple-Inland, Inc. | | | 600 | | | | 22 | | |
| Personal Credit Institutions (0.4%) | |
| Capital One Financial Corp. | | | 1,000 | | | | 76 | | |
| SLM Corp. | | | 1,700 | | | | 94 | | |
| Personal Services (0.1%) | |
| H&R Block, Inc. | | | 1,400 | | | | 35 | | |
| Petroleum Refining (5.9%) | |
| Amerada Hess Corp. | | | 400 | | | | 50 | | |
| Ashland, Inc. | | | 300 | | | | 16 | | |
| Chevron Corp. | | | 9,941 | | | | 567 | | |
| ConocoPhillips | | | 6,008 | | | | 393 | | |
| Exxon Mobil Corp. | | | 27,700 | | | | 1,555 | | |
| Marathon Oil Corp. | | | 1,470 | | | | 88 | | |
| Murphy Oil Corp. | | | 600 | | | | 28 | | |
| Sunoco, Inc. | | | 600 | | | | 45 | | |
| Valero Energy Corp. | | | 1,100 | | | | 116 | | |
| Pharmaceuticals (8.3%) | |
| Abbott Laboratories | | | 6,700 | | | | 288 | | |
The notes to the financial statements are an integral part of this report.
Transamerica IDEX Mutual Funds
Annual Report 2005
8
TA IDEX Protected Principal Stock
SCHEDULE OF INVESTMENTS (continued)
At October 31, 2005
(all amounts except share amounts in thousands)
| | | Shares | | Value | |
| Pharmaceuticals (continued) | |
| Allergan, Inc. | | | 600 | | | $ | 54 | | |
| AmerisourceBergen Corp. | | | 500 | | | | 38 | | |
| Amgen, Inc. ‡ | | | 5,372 | | | | 407 | | |
| Biogen Idec, Inc. ‡ | | | 1,300 | | | | 53 | | |
| Bristol-Myers Squibb Co. | | | 8,500 | | | | 180 | | |
| Cardinal Health, Inc. | | | 1,700 | | | | 106 | | |
| Chiron Corp. ‡ | | | 600 | | | | 26 | | |
| Forest Laboratories, Inc. ‡ | | | 1,300 | | | | 49 | | |
| Genzyme Corp. ‡ | | | 900 | | | | 65 | | |
| Gilead Sciences, Inc. ‡ | | | 1,800 | | | | 85 | | |
| Hospira, Inc. ‡ | | | 720 | | | | 29 | | |
| Johnson & Johnson | | | 13,000 | | | | 814 | | |
| King Pharmaceuticals, Inc. ‡ | | | 900 | | | | 14 | | |
| Lilly (Eli) & Co. | | | 4,900 | | | | 244 | | |
| McKesson Corp. | | | 1,100 | | | | 50 | | |
| Medco Health Solutions, Inc. ‡ | | | 1,053 | | | | 59 | | |
| MedImmune, Inc. ‡ | | | 900 | | | | 31 | | |
| Merck & Co., Inc. | | | 9,600 | | | | 271 | | |
| Mylan Laboratories | | | 1,000 | | | | 19 | | |
| Pfizer, Inc. | | | 31,640 | | | | 688 | | |
| Schering-Plough Corp. | | | 6,400 | | | | 130 | | |
| Sigma-Aldrich Corp. | | | 300 | | | | 19 | | |
| Watson Pharmaceuticals, Inc. ‡ | | | 500 | | | | 17 | | |
| Wyeth | | | 5,700 | | | | 254 | | |
| Primary Metal Industries (0.4%) | |
| Alcoa, Inc. | | | 3,800 | | | | 92 | | |
| Allegheny Technologies, Inc. | | | 400 | | | | 11 | | |
| Engelhard Corp. | | | 500 | | | | 14 | | |
| Nucor Corp. | | | 700 | | | | 42 | | |
| United States Steel Corp. | | | 500 | | | | 18 | | |
| Printing & Publishing (0.5%) | |
| Dow Jones & Co., Inc. | | | 300 | | | | 10 | | |
| Gannett Co., Inc. | | | 900 | | | | 56 | | |
| Knight-Ridder, Inc. | | | 300 | | | | 16 | | |
| McGraw-Hill Cos., Inc. (The) | | | 1,100 | | | | 54 | | |
| Meredith Corp. | | | 200 | | | | 10 | | |
| New York Times Co.–Class A | | | 600 | | | | 16 | | |
| RR Donnelley & Sons Co. | | | 1,000 | | | | 35 | | |
| Tribune Co. | | | 1,300 | | | | 41 | | |
| Radio & Television Broadcasting (0.1%) | |
| Univision Communications, Inc.–Class A ‡ | | | 1,300 | | | | 34 | | |
| Radio, Television & Computer Stores (0.2%) | |
| Best Buy Co., Inc. | | | 1,750 | | | | 77 | | |
| Circuit City Stores, Inc. | | | 800 | | | | 14 | | |
| RadioShack Corp. | | | 700 | | | | 15 | | |
| | | Shares | | Value | |
| Railroads (0.6%) | |
| Burlington Northern Santa Fe Corp. | | | 1,500 | | | $ | 93 | | |
| CSX Corp. | | | 1,000 | | | | 46 | | |
| Norfolk Southern Corp. | | | 1,600 | | | | 64 | | |
| Union Pacific Corp. | | | 1,200 | | | | 83 | | |
| Regional Mall (0.1%) | |
| Simon Property Group, Inc. | | | 1,000 | | | | 72 | | |
| Residential Building Construction (0.1%) | |
| DR Horton, Inc. | | | 900 | | | | 28 | | |
| Lennar Corp.–Class A | | | 600 | | | | 33 | | |
| Restaurants (0.8%) | |
| Darden Restaurants, Inc. | | | 600 | | | | 19 | | |
| McDonald's Corp. | | | 5,400 | | | | 171 | | |
| Starbucks Corp. ‡ | | | 3,000 | | | | 85 | | |
| Wendy's International, Inc. | | | 500 | | | | 23 | | |
| Yum! Brands, Inc. | | | 1,300 | | | | 66 | | |
| Retail Trade (0.3%) | |
| Office Depot, Inc. ‡ | | | 1,200 | | | | 33 | | |
| Staples, Inc. | | | 3,150 | | | | 72 | | |
| Tiffany & Co. | | | 600 | | | | 24 | | |
| Rubber & Misc. Plastic Products (0.3%) | |
| Cooper Tire & Rubber Co. | | | 300 | | | | 4 | | |
| Goodyear Tire & Rubber Co. (The) ‡ | | | 800 | | | | 13 | | |
| Newell Rubbermaid, Inc. | | | 1,000 | | | | 23 | | |
| NIKE, Inc.–Class B | | | 1,000 | | | | 84 | | |
| Reebok International, Ltd. | | | 300 | | | | 17 | | |
| Sealed Air Corp. ‡ | | | 400 | | | | 20 | | |
| Savings Institutions (0.5%) | |
| Golden West Financial Corp. | | | 1,100 | | | | 65 | | |
| Sovereign Bancorp, Inc. | | | 1,400 | | | | 30 | | |
| Washington Mutual, Inc. | | | 4,240 | | | | 168 | | |
| Security & Commodity Brokers (3.1%) | |
| American Express Co. | | | 5,100 | | | | 254 | | |
| Ameriprise Financial, Inc. ‡ | | | 1,020 | | | | 38 | | |
| Bear Stearns Cos. Inc. (The) | | | 500 | | | | 53 | | |
| Charles Schwab Corp. (The) | | | 4,900 | | | | 74 | | |
| E*TRADE Financial Corp. ‡ | | | 1,450 | | | | 27 | | |
| Federated Investors, Inc.–Class B | | | 450 | | | | 16 | | |
| Franklin Resources, Inc. | | | 900 | | | | 80 | | |
| Goldman Sachs Group, Inc. (The) | | | 1,900 | | | | 240 | | |
| Janus Capital Group, Inc. | | | 1,000 | | | | 18 | | |
| Lehman Brothers Holdings, Inc. | | | 1,000 | | | | 120 | | |
| Merrill Lynch & Co., Inc. | | | 4,100 | | | | 265 | | |
| Morgan Stanley | | | 4,700 | | | | 256 | | |
| T. Rowe Price Group, Inc. | | | 500 | | | | 33 | | |
The notes to the financial statements are an integral part of this report.
Transamerica IDEX Mutual Funds
Annual Report 2005
9
TA IDEX Protected Principal Stock
SCHEDULE OF INVESTMENTS (continued)
At October 31, 2005
(all amounts except share amounts in thousands)
| | | Shares | | Value | |
| Telecommunications (3.0%) | |
| ALLTEL Corp. | | | 1,200 | | | $ | 74 | | |
| AT&T Corp. | | | 3,500 | | | | 69 | | |
| BellSouth Corp. | | | 7,900 | | | | 206 | | |
| CenturyTel, Inc. | | | 600 | | | | 20 | | |
| Citizens Communications Co. | | | 1,300 | | | | 16 | | |
| Qwest Communications International ‡ | | | 7,300 | | | | 32 | | |
| SBC Communications, Inc. | | | 14,300 | | | | 341 | | |
| Sprint Nextel Corp. | | | 12,534 | | | | 292 | | |
| Verizon Communications, Inc. | | | 12,100 | | | | 381 | | |
| Tobacco Products (0.1%) | |
| Reynolds American, Inc. | | | 500 | | | | 43 | | |
| UST, Inc. | | | 700 | | | | 29 | | |
| Toys, Games & Hobbies (0.1%) | |
| Hasbro, Inc. | | | 700 | | | | 13 | | |
| Mattel, Inc. | | | 1,600 | | | | 24 | | |
| Transportation Equipment (0.0%) | |
| Brunswick Corp. | | | 400 | | | | 15 | | |
| Trucking & Warehousing (0.7%) | |
| United Parcel Service, Inc.–Class B | | | 4,800 | | | | 350 | | |
| Variety Stores (1.9%) | |
| Big Lots, Inc. ‡ | | | 500 | | | | 6 | | |
| Costco Wholesale Corp. | | | 1,900 | | | | 92 | | |
| Dollar General Corp. | | | 1,100 | | | | 21 | | |
| Family Dollar Stores, Inc. | | | 700 | | | | 16 | | |
| Sears Holdings Corp. ‡ | | | 383 | | | | 46 | | |
| Target Corp. | | | 3,800 | | | | 212 | | |
| Wal-Mart Stores, Inc. | | | 10,700 | | | | 506 | | |
| Warehouse (0.1%) | |
| Prologis | | | 850 | | | | 37 | | |
| Water Transportation (0.2%) | |
| Carnival Corp. | | | 2,000 | | | | 99 | | |
| Wholesale Trade Durable Goods (0.1%) | |
| Grainger (W.W.), Inc. | | | 400 | | | | 27 | | |
| Patterson Cos., Inc. ‡ | | | 600 | | | | 25 | | |
| Wholesale Trade Nondurable Goods (0.2%) | |
| SUPERVALU, Inc. | | | 600 | | | | 19 | | |
| SYSCO Corp. | | | 2,700 | | | | 86 | | |
| Total Common Stocks (cost: $37,317) | | | | | | | 47,424 | | |
| | | Contracts w | | Value | |
| PURCHASED OPTIONS (0.3%) | | | |
| Put Options (0.3%) | | | |
| S & P 500 Index | | | 165 | | | $ | 25 | | |
| Put Strike $1,125.00 | | | | | | |
| | |
| Expires 11/19/2005 | | | | | | | | | |
S & P 500 Index
Put Strike $1,100.00
Expires 12/17/2005 | | | 61 | | | | 17 | | |
S & P 500 Index
Put Strike $1,125.00
Expires 12/17/2005 | | | 101 | | | | 43 | | |
S & P 500 Index
Put Strike $1,100.00
Expires 01/21/2006 | | | 61 | | | | 34 | | |
| Total Purchased Options (cost: $264) | | | | | | | 119 | | |
| Total Investment Securities (cost: $37,581) | | | | | | | 47,543 | | |
| WRITTEN OPTIONS (-1.5%) | | | |
| Covered Call Options (-1.5%) | | | |
S & P 500 Index
Call Strike $1,200.00
Expires 12/17/2005 | | | 101 | | | | (281 | ) | |
S & P 500 Index
Call Strike $1,225.00
Expires 12/17/2005 | | | 108 | | | | (151 | ) | |
S & P 500 Index
Call Strike $1,200.00
Expires 11/19/2005 | | | 50 | | | | (92 | ) | |
S & P 500 Index
Call Strike $1,225.00
Expires 11/19/2005 | | | 86 | | | | (49 | ) | |
S & P 500 Index
Call Strike $1,180.00
Expires 11/19/2005 | | | 43 | | | | (143 | ) | |
| Total Written Options (premiums: $1,161) | | | | | | | (716 | ) | |
| SUMMARY: | | | |
| Investment securities, at value | | | 99.0 | % | | $ | 47,543 | | |
| Written options | | | (1.5 | )% | | | (716 | ) | |
| Other assets in excess of liabilities | | | 2.5 | % | | | 1,208 | | |
| Net Assets | | | 100.0 | % | | $ | 48,035 | | |
NOTES TO SCHEDULE OF INVESTMENTS:
# Substantially all of the Fund's securities are memo pledged as collateral by the custodian for the listed short index option contracts written by the Fund (see Note 1).
‡ Non-income producing.
w Contract amounts are not in thousands.
DEFINITIONS:
REIT Real Estate Investment Trust
SPDR Standard & Poor's Depositary Receipts
The notes to the financial statements are an integral part of this report.
Transamerica IDEX Mutual Funds
Annual Report 2005
10
TA IDEX Protected Principal Stock
STATEMENT OF ASSETS AND LIABILITIES
At October 31, 2005
(all amounts except per share amounts in thousands)
| Assets: | | | |
| Investment securities, at value (cost: $37,581) | | $ | 47,543 | | |
| Cash | | | 1,317 | | |
| Receivables: | |
| Interest | | | 3 | | |
| Dividends | | | 53 | | |
| Other | | | 3 | | |
| | | | 48,919 | | |
| Liabilities: | | | |
| Accounts payable and accrued liabilities: | |
| Shares of beneficial interest redeemed | | | 26 | | |
| Management and advisory fees | | | 74 | | |
| Distribution and service fees | | | 37 | | |
| Transfer agent fees | | | 4 | | |
| Administration fees | | | 1 | | |
| Written options (premiums $1,161) | | | 716 | | |
| Other | | | 26 | | |
| | | | 884 | | |
| Net Assets | | $ | 48,035 | | |
| Net Assets Consist of: | | | |
Shares of beneficial interest, unlimited shares
authorized, no par value | | $ | 40,062 | | |
| Accumulated net investment income (loss) | | | – | | |
Accumulated net realized gain (loss) from investment
securities and written option contracts | | | (2,434 | ) | |
Net unrealized appreciation (depreciation) on:
Investment securities | | | 9,962 | | |
| Written option contracts | | | 445 | | |
| Net Assets | | $ | 48,035 | | |
| Net Assets by Class: | | | |
| Class A | | $ | 6,906 | | |
| Class B | | | 34,487 | | |
| Class C | | | 4,924 | | |
| Class M | | | 1,718 | | |
| Shares Outstanding: | | | |
| Class A | | | 614 | | |
| Class B | | | 3,098 | | |
| Class C | | | 443 | | |
| Class M | | | 154 | | |
| Net Asset Value Per Share: | | | |
| Class A | | $ | 11.24 | | |
| Class B | | | 11.13 | | |
| Class C | | | 11.12 | | |
| Class M | | | 11.14 | | |
| Maximum Offering Price Per Share (a): | | | |
| Class A | | $ | 11.89 | | |
| Class M | | | 11.25 | | |
(a) Includes the maximum selling commission (represented as a percentage of offering price) which is reduced on certain levels of sales as set forth in the Prospectus. Net asset value per share for Classes B and C shares represents offering price. The redemption price for Classes B and M shares equals net asset value less any applicable contingent deferred sales charge.
STATEMENT OF OPERATIONS
For the year ended October 31, 2005
(all amounts in thousands)
| Investment Income: | | | |
| Interest | | $ | 29 | | |
| Dividends | | | 1,114 | | |
| | | | 1,143 | | |
| Expenses: | | | |
| Management and advisory fees | | | 682 | | |
| Distribution and service fees: | |
| Class A | | | 26 | | |
| Class B | | | 373 | | |
| Class C | | | 57 | | |
| Class M | | | 18 | | |
| Transfer agent fees: | |
| Class A | | | 6 | | |
| Class B | | | 27 | | |
| Class C | | | 4 | | |
| Class M | | | 2 | | |
| Printing and shareholder reports | | | 8 | | |
| Custody fees | | | 33 | | |
| Administration fees | | | 10 | | |
| Legal fees | | | 4 | | |
| Audit fees | | | 27 | | |
| Trustees fees | | | 2 | | |
| Registration fees: | |
| Class A | | | 9 | | |
| Class B | | | 13 | | |
| Class C | | | 2 | | |
| Other | | | 11 | | |
| Total expenses before recapture of waived expenses | | | 1,314 | | |
| Recaptured expenses | | | 52 | | |
| Net expenses | | | 1,366 | | |
| Net Investment Income (Loss) | | | (223 | ) | |
| Net Realized Gain (Loss) from: | | | |
| Investment securities | | | 1,480 | | |
| Written option contracts | | | 35 | | |
| | | | 1,515 | | |
Net Increase (Decrease) in Unrealized
Appreciation (Depreciation) on: | | | |
| Investment securities | | | 916 | | |
| Written option contracts | | | 443 | | |
| | | | 1,359 | | |
Net Gain (Loss) on Investment Securities and
Written Options | | | 2,874 | | |
Net Increase (Decrease) in Net Assets Resulting
from Operations | | $ | 2,651 | | |
The notes to the financial statements are an integral part of this report.
Transamerica IDEX Mutual Funds
Annual Report 2005
11
TA IDEX Protected Principal Stock
STATEMENTS OF CHANGES IN NET ASSETS
For the years ended
(all amounts in thousands)
| | | October 31,
2005 | | October 31,
2004 | |
| Increase (Decrease) In Net Assets From: | |
| Operations: | |
| Net investment income (loss) | | $ | (223 | ) | | $ | (572 | ) | |
Net realized gain (loss) from
investment securities and
written options | | | 1,515 | | | | 477 | | |
Net unrealized appreciation
(depreciation) on investment
securities and written options | | | 1,359 | | | | 2,835 | | |
| | | | 2,651 | | | | 2,740 | | |
| Capital Share Transactions: | |
| Proceeds from shares sold: | |
| Class A | | | – | | | | 5 | | |
| Class B | | | – | | | | 2 | | |
| Class C | | | – | | | | 2 | | |
| | | | – | | | | 9 | | |
| Cost of shares redeemed: | |
| Class A | | | (1,511 | ) | | | (1,733 | ) | |
| Class B | | | (8,122 | ) | | | (7,872 | ) | |
| Class C | | | (1,783 | ) | | | (907 | ) | |
| Class M | | | (701 | ) | | | (1,382 | ) | |
| | | | (12,117 | ) | | | (11,894 | ) | |
| | | | (12,117 | ) | | | (11,885 | ) | |
| Net increase (decrease) in net assets | | | (9,466 | ) | | | (9,145 | ) | |
| Net Assets: | |
| Beginning of year | | | 57,501 | | | | 66,646 | | |
| End of year | | $ | 48,035 | | | $ | 57,501 | | |
Accumulated Net Investment Income
(Loss) | | $ | – | | | $ | – | | |
| Share Activity: | |
| Shares issued: | |
| | | | – | | | | – | | |
| Shares redeemed: | |
| Class A | | | (138 | ) | | | (167 | ) | |
| Class B | | | (746 | ) | | | (760 | ) | |
| Class C | | | (164 | ) | | | (87 | ) | |
| Class M | | | (65 | ) | | | (133 | ) | |
| | | | (1,113 | ) | | | (1,147 | ) | |
Net increase (decrease) in shares
outstanding: | |
| Class A | | | (138 | ) | | | (167 | ) | |
| Class B | | | (746 | ) | | | (760 | ) | |
| Class C | | | (164 | ) | | | (87 | ) | |
| Class M | | | (65 | ) | | | (133 | ) | |
| | | | (1,113 | ) | | | (1,147 | ) | |
The notes to the financial statements are an integral part of this report.
Transamerica IDEX Mutual Funds
Annual Report 2005
12
TA IDEX Protected Principal Stock
FINANCIAL HIGHLIGHTS
| | | | | For a share of beneficial interest outstanding throughout each period | |
| | | | | Net Asset | | Investment Operations | | Distributions | | Net Asset | |
| | | For the
Period
Ended (d)(g) | | Value,
Beginning
of Period | | Net
Investment
Income (Loss) | | Net Realized
and Unrealized
Gain (Loss) | | Total
Operations | | From Net
Investment
Income | | From Net
Realized
Gains | | Total
Distributions | | Value,
End
of Period | |
| Class A | | 10/31/2005 | | $ | 10.64 | | | $ | 0.01 | | | $ | 0.59 | | | $ | 0.60 | | | $ | – | | | $ | – | | | $ | – | | | $ | 11.24 | | |
| | | 10/31/2004 | | | 10.15 | | | | (0.05 | ) | | | 0.54 | | | | 0.49 | | | | – | | | | – | | | | – | | | | 10.64 | | |
| | | 10/31/2003 | | | 10.01 | | | | (0.04 | ) | | | 0.92 | | | | 0.88 | | | | – | | | | (0.74 | ) | | | (0.74 | ) | | | 10.15 | | |
| | | 10/31/2002 | | | 10.00 | | | | (0.02 | ) | | | 0.03 | | | | 0.01 | | | | – | | | | – | | | | – | | | | 10.01 | | |
| Class B | | 10/31/2005 | | | 10.60 | | | | (0.06 | ) | | | 0.59 | | | | 0.53 | | | | – | | | | – | | | | – | | | | 11.13 | | |
| | | 10/31/2004 | | | 10.15 | | | | (0.10 | ) | | | 0.55 | | | | 0.45 | | | | – | | | | – | | | | – | | | | 10.60 | | |
| | | 10/31/2003 | | | 10.01 | | | | (0.11 | ) | | | 0.99 | | | | 0.88 | | | | – | | | | (0.74 | ) | | | (0.74 | ) | | | 10.15 | | |
| | | 10/31/2002 | | | 10.00 | | | | (0.04 | ) | | | 0.05 | | | | 0.01 | | | | – | | | | – | | | | – | | | | 10.01 | | |
| Class C | | 10/31/2005 | | | 10.58 | | | | (0.05 | ) | | | 0.59 | | | | 0.54 | | | | – | | | | – | | | | – | | | | 11.12 | | |
| | | 10/31/2004 | | | 10.15 | | | | (0.12 | ) | | | 0.55 | | | | 0.43 | | | | – | | | | – | | | | – | | | | 10.58 | | |
| | | 10/31/2003 | | | 10.01 | | | | (0.11 | ) | | | 0.99 | | | | 0.88 | | | | – | | | | (0.74 | ) | | | (0.74 | ) | | | 10.15 | | |
| | | 10/31/2002 | | | 10.00 | | | | (0.04 | ) | | | 0.05 | | | | 0.01 | | | | – | | | | – | | | | – | | | | 10.01 | | |
| Class M | | 10/31/2005 | | | 10.59 | | | | (0.04 | ) | | | 0.59 | | | | 0.55 | | | | – | | | | – | | | | – | | | | 11.14 | | |
| | | 10/31/2004 | | | 10.14 | | | | (0.10 | ) | | | 0.55 | | | | 0.45 | | | | – | | | | – | | | | – | | | | 10.59 | | |
| | | 10/31/2003 | | | 10.01 | | | | (0.10 | ) | | | 0.97 | | | | 0.87 | | | | – | | | | (0.74 | ) | | | (0.74 | ) | | | 10.14 | | |
| | | 10/31/2002 | | | 10.00 | | | | (0.04 | ) | | | 0.05 | | | | 0.01 | | | | – | | | | – | | | | – | | | | 10.01 | | |
| | | | | | | Ratios/Supplemental Data | |
| | | For the
Period | | Total | | Net Assets,
End of
Period | | Ratio of Expenses
to Average
Net Assets (a) | | Net Investment
Income (Loss)
to Average | | Portfolio
Turnover | |
| | | Ended (g) | | Return (c) | | (000's) | | Net (e) | | Total (f) | | Net Assets (a) | | Rate (b) | |
| Class A | | 10/31/2005 | | | 5.64 | % | | $ | 6,906 | | | | 2.12 | % (h) | | | 2.12 | % (h) | | | 0.05 | % | | | 3 | % | |
| | | 10/31/2004 | | | 4.82 | | | | 8,006 | | | | 2.22 | (i) | | | 2.22 | (i) | | | (0.53 | ) | | | 1 | | |
| | | 10/31/2003 | | | 9.44 | | | | 9,320 | | | | 2.25 | | | | 2.25 | | | | (0.46 | ) | | | 3 | | |
| | | 10/31/2002 | | | 0.10 | | | | 10,381 | | | | 2.25 | | | | 2.62 | | | | (0.70 | ) | | | 14 | | |
| Class B | | 10/31/2005 | | | 5.00 | | | | 34,487 | | | | 2.69 | (h) | | | 2.69 | (h) | | | (0.51 | ) | | | 3 | | |
| | | 10/31/2004 | | | 4.43 | | | | 40,756 | | | | 2.69 | (i) | | | 2.69 | (i) | | | (0.97 | ) | | | 1 | | |
| | | 10/31/2003 | | | 9.44 | | | | 46,709 | | | | 2.90 | | | | 2.90 | | | | (1.11 | ) | | | 3 | | |
| | | 10/31/2002 | | | 0.10 | | | | 47,170 | | | | 2.90 | | | | 3.28 | | | | (1.35 | ) | | | 14 | | |
| Class C | | 10/31/2005 | | | 5.10 | | | | 4,924 | | | | 2.69 | (h) | | | 2.69 | (h) | | | (0.50 | ) | | | 3 | | |
| | | 10/31/2004 | | | 4.24 | | | | 6,423 | | | | 2.82 | (i) | | | 2.82 | (i) | | | (1.12 | ) | | | 1 | | |
| | | 10/31/2003 | | | 9.44 | | | | 7,041 | | | | 2.90 | | | | 2.90 | | | | (1.11 | ) | | | 3 | | |
| | | 10/31/2002 | | | 0.10 | | | | 6,969 | | | | 2.90 | | | | 3.28 | | | | (1.35 | ) | | | 14 | | |
| Class M | | 10/31/2005 | | | 5.19 | | | | 1,718 | | | | 2.59 | (h) | | | 2.59 | (h) | | | (0.39 | ) | | | 3 | | |
| | | 10/31/2004 | | | 4.44 | | | | 2,316 | | | | 2.80 | (i) | | | 2.80 | (i) | | | (1.01 | ) | | | 1 | | |
| | | 10/31/2003 | | | 9.33 | | | | 3,576 | | | | 2.80 | | | | 2.80 | | | | (1.01 | ) | | | 3 | | |
| | | 10/31/2002 | | | 0.10 | | | | 4,076 | | | | 2.80 | | | | 3.18 | | | | (1.25 | ) | | | 14 | | |
The notes to the financial statements are an integral part of this report.
Transamerica IDEX Mutual Funds
Annual Report 2005
13
TA IDEX Protected Principal Stock
FINANCIAL HIGHLIGHTS (continued)
NOTES TO FINANCIAL HIGHLIGHTS
(a) Annualized.
(b) Not annualized.
(c) Total Return has been calculated for the applicable period without deduction of a sales load, if any, on an initial purchase. Periods of less than one year are not annualized.
(d) Per share information is calculated based on average number of shares outstanding.
(e) Ratio of Net Expenses to Average Net Assets is net of fee waivers and reimbursements by the investment adviser, if any (see note 2).
(f) Ratio of Total Expenses to Average Net Assets includes all expenses before fee waivers and reimbursements.
(g) TA IDEX Protected Principal Stock commenced operations on July 1, 2002.
(h) Ratios of Total Expenses to Average Net Assets and Net Expenses to Average Net Assets are inclusive of recaptured expenses by the investment advisor. The impact of recaptured expenses was 0.10%, 0.10%, 0.10% and 0.10% for Class A, Class B, Class C and Class M, respectively (see Note 2).
(i) Ratios of Total Expenses to Average Net Assets and net Expenses to Average Net Assets are inclusive of recaptured expenses by the investment advisor. The impact of recaptured expenses was 0.06%, 0.06%, 0.06% and 0.07% for Class A, Class B, Class C and Class M, respectively (see Note 2).
The notes to the financial statements are an integral part of this report.
Transamerica IDEX Mutual Funds
Annual Report 2005
14
TA IDEX Protected Principal Stock
NOTES TO FINANCIAL STATEMENTS
At October 31, 2005
(all amounts in thousands)
NOTE 1. ORGANIZATION AND SIGNIFICANT ACCOUNTING POLICIES
Transamerica IDEX Mutual Funds is an open-end management investment company registered under the Investment Company Act of 1940, as amended (the "1940 Act").
In the normal course of business, TA IDEX Protected Principal Stock (the "Fund") enters into contracts that contain a variety of representations that provide general indemnifications. The Fund's maximum exposure under these arrangements is unknown, as this would involve future claims that may be made against the Fund and/or its affiliates that have not yet occurred. However, based on experience, the Fund expects the risk of loss to be remote.
This report should be read in conjunction with the current Fund prospectus, which contains more complete information about the Fund.
The following is a summary of significant accounting policies followed by the Fund in the preparation of the financial statements. In preparing the Fund's financial statements in accordance with accounting principles generally accepted in the United States of America ("GAAP"), estimates or assumptions (which could differ from actual results) may be used that affect reported amounts and disclosures.
Multiple class operations, income and expenses: The Fund currently offers four classes of shares, each with a public offering price that reflects different sales charges, if any, and expense levels. On June 15, 2004, Class C2 shares converted to Class C. Class B shares will convert to Class A shares eight years after purchase. Currently all share classes are closed to new investors. Income, non-class specific expenses and realized and unrealized gains and losses, are allocated daily to each class, based upon the value of shares outstanding method as permitted under Rule 18f-3 of the 1940 Act. Each class bears its own specific expenses as well as a portion of general, common expenses.
Security valuations: The Fund values its investments at the close of the New York Stock Exchange ("NYSE"), normally 4 p.m. ET, each day the NYSE is open for business. Fund investments are valued at the last sale price or closing price on the day of valuation taken from the primary exchange where the security is principally traded.
Securities traded in the over-the-counter market and listed securities for which no sale was reported on that date are valued at the last quoted bid price.
Other securities for which quotations are not readily available or whose values have been determined to be unreliable are valued at fair market value as determined in good faith by the Fund's Administrative Valuation Committee, under the supervision of the Board's Valuation Committee, using guidelines adopted by the Board of Trustees.
Cash: The Fund may leave cash overnight in its cash account with the custodian, Investors Bank & Trust Company ("IBT"). IBT has been contracted on behalf of the Fund to invest the excess cash into a savings account, which at October 31, 2005, was paying an interest rate of 2.76%.
Real Estate Investment Trusts ("REITs"): There are certain additional risks involved in investing in REITs. These include, but are not limited to, economic conditions, changes in zoning laws, real estate values, property taxes and interest rates.
Dividend income is recorded at management's estimate of the income included in distributions from the REIT investments. Distributions received in excess of the estimated amount are recorded as a reduction of the cost of investments. The actual amounts of income, return of capital and capital gains are only determined by each REIT after the fiscal year end and may differ from the estimated amounts.
Security transactions and investment income: Security transactions are recorded on the trade date. Security gains and losses are calculated on the specific identification basis. Dividend income, if any, is recorded on the ex-dividend date or, in the case of foreign securities, as soon as the Fund is informed of the ex-dividend date. Interest income, including accretion of discounts and amortization of premiums, is recorded on the accrual basis commencing on the settlement date.
Option contracts: The Fund may enter into options contracts to manage exposure to market fluctuations. Options are valued at the average of the bid and ask ("Mean Quote") established each day at the close of the board of trade or exchange on which they are traded. The primary risks associated with options are imperfect correlation between the change in value of the securities held and the prices of the options contracts; the possibility of an illiquid market and inability of the counterparty to meet the contracts terms. When the Fund writes a covered call or put option, an amount equal to the premium received by the Fund is included in the Fund's Statement of Assets and Liabilities as an asset and as an equivalent liability. Options are marked-to-market daily to reflect the current value of the option written.
The underlying face amounts of open contracts at October 31, 2005, are listed in the Schedule of Investments.
Transactions in written call and put options were as follows:
| | | Premium | | Contracts* | |
| Beginning Balance 10/31/2004 | | $ | 849 | | | | 501 | | |
| Sales | | | 8,160 | | | | 2,831 | | |
| Closing Buys | | | (7,283 | ) | | | (2,757 | ) | |
| Expirations | | | (565 | ) | | | (187 | ) | |
| Exercised | | | – | | | | – | | |
| Balance at 10/31/2005 | | $ | 1,161 | | | | 388 | | |
* Contracts not in thousands
Transamerica IDEX Mutual Funds
Annual Report 2005
15
TA IDEX Protected Principal Stock
NOTES TO FINANCIAL STATEMENTS (continued)
At October 31, 2005
(all amounts in thousands)
NOTE 1.–(continued)
Redemption fees: A short-term trading redemption fee may be assessed on any Fund shares in a fund account that are sold during the first five (5) NYSE trading days following their purchase date. This redemption fee will equal 2% of the amount redeemed and shares held the longest will be treated as being redeemed first and shares held the shortest as being redeemed last. For the year ended October 31, 2005, the Fund received no redemption fees.
Dividend distributions: Distributions to shareholders are recorded on the ex-dividend date and are determined in accordance with Federal income tax regulations which may differ from GAAP.
NOTE 2. RELATED PARTY TRANSACTIONS
Effective January 1, 2005 AEGON/Transamerica Fund Advisors, Inc. was renamed Transamerica Fund Advisors, Inc. ("TFAI"); AEGON/Transamerica Fund Services, Inc. and AEGON/Transamerica Investor Services, Inc. merged into one entity and was renamed Transamerica Fund Services, Inc. ("TFS").
TFAI is the Fund's investment adviser. TFS is the Fund's administrator and transfer agent. AFSG Securities Corp. ("AFSG") is the Fund's distributor/principal underwriter. TFAI, TFS , and AFSG are affiliates of AEGON, NV, a Netherlands corporation.
TA IDEX Protected Principal Stock Guarantee: The Fund's investment adviser, TFAI, guarantees shareholders a Guaranteed Amount five years after the end of the Offering Period. The Guaranteed Amount will be no less than the value of that shareholder's account on the Investment Date, less extraordinary charges, provided that shareholders have reinvested all dividends and distributions in additional shares and have redeemed no shares ("Guarantee"). Please see the Prospectus and Statement of Additional Information for further information on the Guarantee.
Investment advisory fee: The Fund pays management fees to TFAI based on average daily net assets ("ANA") at the following breakpoints:
1.30% of the first $100 million of ANA
1.25% of ANA over $100 million
TFAI has contractually agreed to waive its advisory fee and will reimburse the Fund to the extent that operating expenses, excluding 12b-1 fees, exceed the following stated annual limit:
1.90% Expense Limit
If total Fund expenses fall below the annual expense limitation agreement agreed to by the adviser within the succeeding three years, the Fund may be required to pay that adviser a portion or all of the waived advisory fees.
For the year ended October 31, 2005, the Fund recaptured the following of previously waived expenses.
Amount
Recaptured | | Year Waived/
Reimbursed | |
| $ | 43 | | | Fiscal Year 2002 | |
| | 9 | | | Fiscal Year 2003 | |
| $ | 52 | | | | |
There are no amounts available for recapture at October 31, 2005.
Distribution and service fees: The Fund has a 12b-1 distribution plan under the 1940 Act pursuant to which an annual fee, based on average daily net assets, is paid to the distributor for various disbursements such as broker-dealer account servicing fees and other promotional expenses of the Fund. The Fund is authorized under the 12b-1 plan to pay fees on each class up to the following limits:
| Class A | | | 0.35 | % | |
| Class B | | | 1.00 | % | |
| Class C | | | 1.00 | % | |
| Class M | | | 0.90 | % | |
In the case the Fund or a class of shares of the Fund is closed to new investors or investments, the Fund is authorized to pay 12b-1 fees for past sales and distribution efforts and present and past investor services.
Underwriter commissions relate to front-end sales charges imposed for Class A and M shares and contingent deferred sales charges from Classes B, M, and certain A share redemptions. For the year ended October 31, 2005, the underwriter commissions were as follows:
| Received by Underwriter | | $ | – | | |
| Retained by Underwriter | | | – | | |
| Contingent Deferred Sales Charge | | | 219 | | |
Administrative services: The Fund has entered into an agreement with TFS for financial and legal fund administration services. As of January 1, 2005 the Fund pays TFS an annual fee of 0.02% of ANA. Prior to January 1, 2005 the Fund paid TFS an annual fee of 0.015% of ANA. The Legal fees on the Statement of Operations are for fees paid to external legal counsel.
Transfer agent fees: The Fund pays TFS an annual per-account charge for each open and closed account. The Fund paid TFS $37 for the year ended October 31, 2005.
Deferred compensation plan: Each eligible independent Fund Trustee may elect to participate in a non-qualified deferred compensation plan maintained by Transamerica IDEX Mutual Funds (the "Plan"). Under the Plan, such Trustees may defer payment of all or a portion of their total fees earned as a Fund Trustee. Each Trustee who is a participant in the Plan may elect that the earnings, losses or gains credited to his or her
Transamerica IDEX Mutual Funds
Annual Report 2005
16
TA IDEX Protected Principal Stock
NOTES TO FINANCIAL STATEMENTS (continued)
At October 31, 2005
(all amounts in thousands)
NOTE 2.–(continued)
deferred fee amounts be determined based on a deemed investment in any series of Transamerica IDEX Mutual Funds, including the Fund. The right of a participant to receive a distribution from the Plan of the deferred fees is an unsecured claim against the general assets of all series of Transamerica IDEX Mutual Funds. The pro rata liability to the Fund of all deferred fees in the Plan amounted, as of October 31, 2005, to $3.
NOTE 3. INVESTMENT TRANSACTIONS
The cost of securities purchased and proceeds from securities sold (excluding short-term securities) for the year ended October 31, 2005, were as follows:
| Purchases of securities: | | | |
| Long-Term | | $ | 1,629 | | |
| U.S. Government | | | – | | |
| Proceeds from maturities and sales of securities: | | | |
| Long-Term | | | 14,561 | | |
| U.S. Government | | | – | | |
NOTE 4. FEDERAL INCOME TAX MATTERS
The Fund has not made any provision for federal income or excise taxes due to its policy to distribute all of its taxable income and capital gains to its shareholders and otherwise qualify as a regulated investment company under Subchapter M of the Internal Revenue Code. Income and capital gain distributions are determined in accordance with income tax regulations, which may differ from GAAP. These differences are primarily due to differing treatment for items including, but not limited to, capital loss carryforwards, net operating losses, options and REITs.
Therefore, distributions determined in accordance with tax regulations may differ significantly in amount or character from net investment income and realized gains for financial reporting purposes. Financial reporting records are adjusted for permanent book/tax differences to reflect tax character. Financial records are not adjusted for temporary differences. These reclassifications are as follows:
Shares of beneficial interest, unlimited
shares authorized | | $ | (231 | ) | |
| Accumulated net investment income (loss) | | | 223 | | |
Accumulated net realized gain (loss) from
investment securities. | | | 8 | | |
The capital loss carryforward is available to offset future realized capital gains through the period listed:
Capital Loss
Carryforward | | Available through | |
| $ | 2,138 | | | October 31, 2011 | |
The capital loss carryforward utilized during the year ended October 31, 2005 was $1,923.
The tax basis components of distributable earnings as of October 31, 2005, are as follows:
| Undistributed Ordinary Income | | $ | – | | |
| Undistributed Long-term Capital Gains | | $ | – | | |
| Capital Loss Carryforward | | $ | (2,138 | ) | |
| Net Unrealized Appreciation (Depreciation) | | $ | 10,111 | * | |
* Amount includes unrealized appreciation (depreciation) from derivative instrument and deferred compensation.
The aggregate cost of investments and composition of unrealized appreciation (depreciation) for federal income tax purposes as of October 31, 2005, are as follows:
| Federal Tax Cost Basis | | $ | 37,877 | | |
| Unrealized Appreciation | | $ | 11,522 | | |
| Unrealized (Depreciation) | | | (1,856 | ) | |
| Net Unrealized Appreciation (Depreciation) | | $ | 9,666 | | |
NOTE 5. REGULATORY PROCEEDINGS
There continues to be significant federal and state regulatory activity relating to financial services companies, particularly mutual fund companies and their investment advisers. As part of an ongoing investigation regarding potential market timing, recordkeeping and trading compliance issues and matters affecting the Fund's investment adviser, TFAI, and certain affiliates and former employees of TFAI, the SEC staff has indicated that it is likely to take some action against TFAI and certain of its affiliates at the conclusion of the investigation. The potential timing and the scope of any such action is difficult to predict. Although the impact of any action brought against TFAI and/or its affiliates is difficult to assess at the present time, the Fund currently believes that the likelihood that any such action will have a material adverse impact on it is remote. It is important to note that the Fund is not aware of any allegation of wrongdoing against it and its Board at the time this annual report is printed. Although it is not anticipated that these developments will have an adverse impact on the Fund, there can be no assurance at this time. TFAI and its affiliates are actively working with the SEC in regard to this matter; however, the exact resolution cannot be determined at this time. TFAI will take such actions that it deems necessary or appropriate to continue providing management services to the Fund and to bring all matters to an appropriate conclusion.
TFAI and/or its affiliates, and not the Fund, will bear the costs regarding these regulatory matters.
Transamerica IDEX Mutual Funds
Annual Report 2005
17
Report of Independent Registered Certified Public Accounting Firm
To the Board of Trustees and Shareholders of
TA IDEX Protected Principal Stock
In our opinion, the accompanying statement of assets and liabilities, including the schedule of investments, and the related statements of operations and of changes in net assets and the financial highlights present fairly, in all material respects, the financial position of TA IDEX Protected Principal Stock (the "Fund") (one of the portfolios constituting the Transamerica IDEX Mutual Funds) at October 31, 2005, the results of its operations for the year then ended, the changes in its net assets for each of the two years in the period then ended and the financial highlights for each of the periods presented, in conformity with accounting principles generally accepted in the United States of America. These financial statements and financial highlights (hereafter referred to as "financial statements") are the responsibility of the Fund's management; our responsibility is to express an opinion on thes e financial statements based on our audits. We conducted our audits of these financial statements in accordance with the standards of the Public Company Accounting Oversight Board (United States). Those standards require that we plan and perform the audit to obtain reasonable assurance about whether the financial statements are free of material misstatement. An audit includes examining, on a test basis, evidence supporting the amounts and disclosures in the financial statements, assessing the accounting principles used and significant estimates made by management, and evaluating the overall financial statement presentation. We believe that our audits, which included confirmation of securities at October 31, 2005 by correspondence with the custodian and brokers, provide a reasonable basis for our opinion.

December 22, 2005
Transamerica IDEX Mutual Funds
Annual Report 2005
18
TA IDEX Salomon All Cap
MARKET ENVIRONMENT
The stock market, over the past year, has been affected by the twin headwinds of rising energy prices and rising interest rates. When interest rates and energy prices rise sharply in combination, the stock market, historically, has had difficulty making significant progress. For example, 1994 was a year in which interest rates and energy prices were rising and the stock market was up approximately 1%. In 2000, both were rising sharply although energy prices were coming from a much lower level than they have recently. Although there were other important things happening in 2000 (Internet/technology bubble), once again the "twin headwinds" were partially responsible for a difficult year where stocks were concerned.
PERFORMANCE
For the year ended October 31, 2005, TA IDEX Salomon All Cap, Class A, returned 8.79%. By comparison its benchmark the Russell 3000 Index ("Russell 3000") returned 10.60%.
STRATEGY REVIEW
Generally speaking, the portfolio's performance was weaker earlier in the fiscal year and stronger as the year progressed.
The energy sector contributed approximately 4.80% during the year versus 2.40% for the benchmark and was the most significant contributor during the year. The largest detractor was the healthcare sector. During the year, this sector contributed approximately 0.30% versus 1.75% for the benchmark.
The five largest contributors to portfolio performance during the latest fiscal year were: The Williams Companies, Inc. (+0.87%); Mitsubishi UFJ Financial Group, Inc. (+0.77%); Canadian Natural Resources Limited (+0.71%); Halliburton Company (+0.70%); and Motorola, Inc. (+0.59%). The five largest detractors to performance included: Solectron Corporation (–0.49%); Alcoa Inc. (–0.35%); Pfizer Inc. (–0.33%); Aphton Corporation (–0.33%); and Lucent Technologies Inc. (–.30%).
Over the past five years, smaller companies have outperformed larger ones, as measured by their respective Russell indices. As of the portfolio's fiscal-year end, our work suggested that many larger companies were attractive. In fact, they may be as attractive, relative to other segments of the market, as at any time in the last 20 years. During 2005, we began to increase our holdings in larger companies consistent with these findings. However, these larger companies still lagged during the year and this fact accounts for at least part of our modest underperformance. For example, if we look at both the Standard and Poor's 500 Composite Stock Index ("S&P 500") and the Russell 3000 performance by deciles over the last year, we find that the largest companies were distinct underachievers. This has been m ost pronounced in the S&P 500 where the largest decile includes 50 companies versus 300 in the largest Russell 3000 decile.
John J. Goode
Peter J. Hable
Co-Fund Managers
Salomon Brothers Asset Management Inc.
Transamerica IDEX Mutual Funds
Annual Report 2005
1
TA IDEX Salomon All Cap
Comparison of change in value of $10,000 investment in Class A shares and its comparative index.
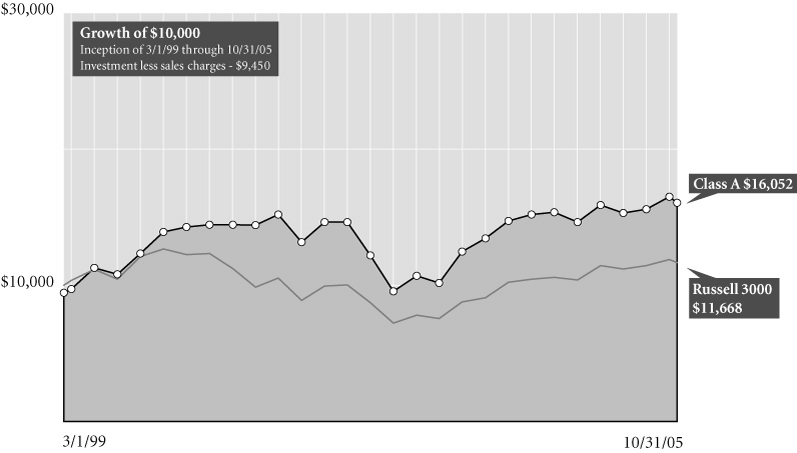
Average Annual Total Return for Periods Ended 10/31/05
| | | 1 year | | 5 years | | From
Inception | | Inception
Date | |
| Class A (NAV) | | | 8.79 | % | | | 1.53 | % | | | 8.26 | % | | 3/1/99 | |
| Class A (POP) | | | 2.80 | % | | | 0.39 | % | | | 7.35 | % | | 3/1/99 | |
| Russell 30001 | | | 10.60 | % | | | (0.81 | )% | | | 2.34 | % | | 3/1/99 | |
| Class B (NAV) | | | 7.84 | % | | | 0.82 | % | | | 7.54 | % | | 3/1/99 | |
| Class B (POP) | | | 2.84 | % | | | 0.63 | % | | | 7.54 | % | | 3/1/99 | |
| Class C (NAV) | | | 7.89 | % | | | – | | | | 14.61 | % | | 11/11/02 | |
| Class C (POP) | | | 6.89 | % | | | – | | | | 14.61 | % | | 11/11/02 | |
NOTES
1 The Russell 3000 (Russell 3000) Index is an unmanaged index used as a general measure of market performance. Calculations assume dividends and capital gains are reinvested and do not include any managerial expenses. From inception calculation is based on life of Class A shares. Source: Standard & Poor's Micropal®© Micropal, Inc. 2005 – 1-800-596-5323 – http://www.funds-sp.com.
The performance data presented represents past performance, future results may vary. Performance data does not reflect the deduction of taxes that would be paid on fund distributions or the redemption of fund shares. Investment return and principal value will fluctuate so that an investor's shares, when redeemed, may be worth more or less than their original cost. Current performance may be lower or higher than performance quoted. Please see www.transamericaidex.com for performance data current to the most recent month-end.
Public Offering Price (POP) returns include the reinvestment of dividends and capital gains and reflect the maximum sales charge of 5.5% for A shares or the maximum applicable contingent deferred sales charge (5% in the 1st year, decreasing to 0% after 6 years) for Class B shares and 1% (during the first 12 months) for Class C shares. Shares purchased prior to March 1, 2004 are subject to a maximum applicable contingent deferred sales charge (5% in the 1st year, decreasing to 0% after 7 years) for Class B shares and (2% in the 1st year, decreasing to 0% after 2 years) for Class C shares. Net Asset Value (NAV) returns include the reinvestment of dividends and capital gains but do not reflect any sales charges.
The Fund is non-diversified. Investments in a "non-diversified" fund may be subject to specific risks such as susceptibility to single economic political, or regulatory events, and may be subject to greater loss than investments in a diversified fund.
This material must be preceded or accompanied by a current prospectus, which includes specific contents regarding the investment objectives and policies of this fund.
Transamerica IDEX Mutual Funds
Annual Report 2005
2
TA IDEX Salomon All Cap
UNDERSTANDING YOUR FUND'S EXPENSES
(unaudited)
SHAREHOLDER EXPENSES
Fund shareholders may incur two types of costs: (1) transaction costs, including sales charges (loads) on purchases, contingent deferred sales charges on redemptions and redemption fees; and (2) ongoing costs, including management fees, 12b-1 distribution and service fees, and other fund expenses.
The following Example is intended to help you understand your ongoing costs (in dollars and cents) of investing in a Fund and to compare these costs with the ongoing costs of investing in other funds.
The Example is based on an investment of $1,000 invested at May 1, 2005 and held for the entire period until October 31, 2005.
ACTUAL EXPENSES
The first line in the table below provides information about actual account values and actual expenses. You may use the information in this line, together with the amount you invested, to estimate the expenses that you paid over the period. Simply divide your account value by $1,000 (for example, an $8,600 account value divided by $1,000 = 8.6), then multiply the result by the number in the first line of your Fund under the heading entitled "Expenses Paid During Period" to estimate the expenses you paid on your account during this period. If your account is an IRA, your expenses could have included a $15 annual fee. The amount of any fee paid through your account would increase the estimate of expenses you paid during the period and decrease your ending account value.
HYPOTHETICAL EXAMPLE FOR COMPARISON PURPOSES
The second line in the table below provides information about hypothetical account values and hypothetical expenses based on the Fund's actual expense ratio and an assumed rate of return of 5% per year before expenses, which is not the Fund's actual return. The hypothetical account values and expenses may not be used to estimate the actual ending account balance or expenses you paid for the period. You may use this information to compare the ongoing costs of investing in your Fund and other funds. To do so, compare this 5% hypothetical example with the 5% hypothetical examples that appear in the shareholder reports of the other funds. As in the case of the actual expense example, if your account is subject to an IRA fee, the amount of the fee paid through your account would increase the hypothetical expenses you would have paid during the period and decrease the hypothetical ending account value.
Please note that the expenses shown in the table are meant to highlight your ongoing costs only and do not reflect any transactional costs, such as sales charges, redemption fees, brokerage commissions paid on purchases and sales of fund shares. Therefore, the second line under the Fund in the table is useful in comparing ongoing costs only, and will not help you determine the relative total costs of owning different funds. If any of these transaction costs were included, your costs would be higher. The expenses shown in the table do not reflect any fees that may be charged to you by brokers, financial intermediaries or other financial institutions.
| | | Beginning
Account
Value | | Ending
Account
Value | | Annualized
Expense
Ratio | | Expenses Paid
During Period (a) | |
| Class A | | | |
| Actual | | $ | 1,000.00 | | | $ | 1,080.50 | | | | 1.41 | % | | $ | 7.39 | | |
| Hypothetical (b) | | | 1,000.00 | | | | 1,018.10 | | | | 1.41 | | | | 7.17 | | |
| Class B | | | |
| Actual | | | 1,000.00 | | | | 1,075.50 | | | | 2.33 | | | | 12.19 | | |
| Hypothetical (b) | | | 1,000.00 | | | | 1,013.46 | | | | 2.33 | | | | 11.82 | | |
| Class C | | | |
| Actual | | | 1,000.00 | | | | 1,076.20 | | | | 2.19 | | | | 11.46 | | |
| Hypothetical (b) | | | 1,000.00 | | | | 1,014.17 | | | | 2.19 | | | | 11.12 | | |
(a) Expenses are calculated using each Fund's annualized expense ratio (as disclosed in the table), multiplied by the average account value for the period, multiplied by number of days in the period (184 days), and divided by the number of days in the year (365 days).
(b) 5% return per year before expenses.
GRAPHICAL PRESENTATION OF SCHEDULE OF INVESTMENTS
By Sector
At October 31, 2005

This chart shows the percentage breakdown by sector of the Fund's total investment securities.
Transamerica IDEX Mutual Funds
Annual Report 2005
3
TA IDEX Salomon All Cap
SCHEDULE OF INVESTMENTS
At October 31, 2005
(all amounts except share amounts in thousands)
| | | Shares | | Value | |
| COMMON STOCKS (90.9%) | |
| Aerospace (1.1%) | |
| Boeing Co. (The) | | | 58,300 | | | $ | 3,769 | | |
| Air Transportation (1.6%) | |
| Southwest Airlines Co. | | | 346,800 | | | | 5,552 | | |
| Amusement & Recreation Services (1.6%) | |
| Disney (Walt) Co. (The) | | | 225,900 | | | | 5,505 | | |
| Automotive (1.0%) | |
| Lear Corp. † | | | 111,300 | | | | 3,390 | | |
| Beverages (0.5%) | |
| Molson Coors Brewing Co.–Class B | | | 30,000 | | | | 1,851 | | |
| Business Services (1.9%) | |
| Clear Channel Communications, Inc. | | | 53,200 | | | | 1,618 | | |
| Interpublic Group of Cos., Inc. †‡ | | | 475,100 | | | | 4,908 | | |
| Chemicals & Allied Products (3.0%) | |
| Dow Chemical Co. (The) | | | 99,000 | | | | 4,540 | | |
| du Pont (E.I.) de Nemours & Co. | | | 137,400 | | | | 5,728 | | |
| Commercial Banks (6.9%) | |
| JP Morgan Chase & Co. | | | 211,700 | | | | 7,753 | | |
| MBNA Corp. | | | 141,600 | | | | 3,621 | | |
| Mitsubishi Tokyo Financial Group, Inc. | | | 690 | | | | 8,599 | | |
| State Street Corp. | | | 75,000 | | | | 4,142 | | |
| Communication (1.3%) | |
| Comcast Corp.–Special Class A ‡ | | | 160,700 | | | | 4,405 | | |
| Communications Equipment (3.6%) | |
| Lucent Technologies, Inc. ‡ | | | 1,291,800 | | | | 3,682 | | |
| Motorola, Inc. | | | 220,800 | | | | 4,893 | | |
| Nokia Corp., ADR | | | 235,800 | | | | 3,966 | | |
| Computer & Data Processing Services (2.9%) | |
| Micromuse, Inc. ‡ | | | 385,600 | | | | 2,765 | | |
| Microsoft Corp. | | | 284,200 | | | | 7,304 | | |
| Computer & Office Equipment (1.6%) | |
| Cisco Systems, Inc. ‡ | | | 253,800 | | | | 4,429 | | |
| LG. Philips LCD Co., Ltd., ADR †‡ | | | 61,500 | | | | 1,169 | | |
| Diversified (0.8%) | |
| Honeywell International, Inc. | | | 85,000 | | | | 2,907 | | |
| Electronic & Other Electric Equipment (1.0%) | |
| Samsung Electronics Co., Ltd., GDR–144A | | | 13,300 | | | | 3,551 | | |
| Electronic Components & Accessories (3.0%) | |
| Novellus Systems, Inc. | | | 101,800 | | | | 2,225 | | |
| Solectron Corp. †‡ | | | 248,020 | | | | 876 | | |
Taiwan Semiconductor
Manufacturing Co., Ltd., ADR | | | 522,155 | | | | 4,219 | | |
| Texas Instruments, Inc. | | | 114,900 | | | | 3,280 | | |
| | | Shares | | Value | |
| Food & Kindred Products (2.1%) | |
| Kraft Foods, Inc.–Class A † | | | 118,700 | | | $ | 3,359 | | |
| Unilever PLC, Sponsored ADR † | | | 97,400 | | | | 3,955 | | |
| Food Stores (1.4%) | |
| Safeway, Inc. † | | | 209,600 | | | | 4,875 | | |
| Gas Production & Distribution (1.3%) | |
| Dynegy, Inc.–Class A †‡ | | | 53,100 | | | | 236 | | |
| Williams Cos., Inc. (The) | | | 185,400 | | | | 4,134 | | |
| Health Services (1.0%) | |
| Enzo Biochemical, Inc. †‡ | | | 243,499 | | | | 3,321 | | |
| Industrial Machinery & Equipment (4.5%) | |
| Applied Materials, Inc. | | | 259,600 | | | | 4,252 | | |
| Baker Hughes, Inc. | | | 50,600 | | | | 2,781 | | |
| Caterpillar, Inc. | | | 101,500 | | | | 5,338 | | |
| Deere & Co. † | | | 53,100 | | | | 3,222 | | |
| Instruments & Related Products (2.8%) | |
| Agilent Technologies, Inc. ‡ | | | 123,300 | | | | 3,947 | | |
| Raytheon Co. | | | 153,900 | | | | 5,687 | | |
| Insurance (7.1%) | |
| AMBAC Financial Group, Inc. | | | 53,100 | | | | 3,764 | | |
| American International Group, Inc. | | | 69,300 | | | | 4,491 | | |
| Chubb Corp. | | | 57,280 | | | | 5,325 | | |
| MGIC Investment Corp. | | | 60,300 | | | | 3,572 | | |
| PMI Group, Inc. (The) | | | 192,000 | | | | 7,657 | | |
| Insurance Agents, Brokers & Service (1.1%) | |
| Hartford Financial Services Group, Inc. (The) | | | 47,300 | | | | 3,772 | | |
| Lumber & Other Building Materials (1.3%) | |
| Home Depot, Inc. (The) | | | 108,700 | | | | 4,461 | | |
| Lumber & Wood Products (1.3%) | |
| Weyerhaeuser Co. | | | 70,200 | | | | 4,447 | | |
| Mining (0.0%) | |
| WGI Heavy Minerals, Inc. ‡ | | | 127,600 | | | | 97 | | |
| Motion Pictures (3.3%) | |
| News Corp., Inc.–Class A | | | 122,100 | | | | 1,740 | | |
| News Corp., Inc.–Class B † | | | 283,800 | | | | 4,274 | | |
| Time Warner, Inc. | | | 296,800 | | | | 5,292 | | |
| Oil & Gas Extraction (3.6%) | |
| Anadarko Petroleum Corp. | | | 39,600 | | | | 3,592 | | |
| GlobalSantaFe Corp. | | | 54,900 | | | | 2,446 | | |
| Halliburton Co. | | | 63,200 | | | | 3,735 | | |
| Schlumberger, Ltd. | | | 32,000 | | | | 2,905 | | |
| Paper & Allied Products (0.3%) | |
| Smurfit-Stone Container Corp. ‡ | | | 102,800 | | | | 1,086 | | |
The notes to the financial statements are an integral part of this report.
Transamerica IDEX Mutual Funds
Annual Report 2005
4
TA IDEX Salomon All Cap
SCHEDULE OF INVESTMENTS (continued)
At October 31, 2005
(all amounts except share amounts in thousands)
| | | Shares | | Value | |
| Petroleum Refining (4.3%) | |
| BP PLC, ADR | | | 17,800 | | | $ | 1,182 | | |
| Chevron Corp. | | | 38,700 | | | | 2,209 | | |
| ConocoPhillips | | | 40,400 | | | | 2,641 | | |
| Exxon Mobil Corp. | | | 58,200 | | | | 3,267 | | |
| Murphy Oil Corp. | | | 124,300 | | | | 5,824 | | |
| Pharmaceuticals (10.9%) | |
| Abbott Laboratories | | | 117,700 | | | | 5,067 | | |
| Amgen, Inc. ‡ | | | 49,700 | | | | 3,765 | | |
| Aphton Corp. †‡ | | | 553,200 | | | | 255 | | |
| GlaxoSmithKline PLC, ADR | | | 97,600 | | | | 5,074 | | |
| Johnson & Johnson | | | 99,500 | | | | 6,231 | | |
| Lilly (Eli) & Co. | | | 47,600 | | | | 2,370 | | |
| Novartis AG, ADR | | | 118,500 | | | | 6,378 | | |
| Pfizer, Inc. | | | 161,600 | | | | 3,513 | | |
| Wyeth | | | 115,200 | | | | 5,133 | | |
| Primary Metal Industries (3.4%) | |
| Alcoa, Inc. | | | 149,600 | | | | 3,634 | | |
| Engelhard Corp. | | | 127,700 | | | | 3,474 | | |
| RTI International Metals, Inc. ‡ | | | 139,600 | | | | 4,679 | | |
| Radio & Television Broadcasting (1.0%) | |
| Pearson PLC | | | 307,600 | | | | 3,420 | | |
| Security & Commodity Brokers (3.3%) | |
| American Express Co. | | | 86,500 | | | | 4,305 | | |
| Ameriprise Financial, Inc. ‡ | | | 17,300 | | | | 644 | | |
| Goldman Sachs Group, Inc. (The) | | | 7,100 | | | | 897 | | |
| Merrill Lynch & Co., Inc. | | | 85,100 | | | | 5,509 | | |
| Telecommunications (1.3%) | |
| Vodafone Group PLC, ADR | | | 174,000 | | | | 4,569 | | |
| Toys, Games & Hobbies (1.8%) | |
| Hasbro, Inc. | | | 190,300 | | | | 3,585 | | |
| Mattel, Inc. | | | 182,800 | | | | 2,696 | | |
| Variety Stores (1.3%) | |
| Wal-Mart Stores, Inc. | | | 96,500 | | | | 4,565 | | |
| Wholesale Trade Durable Goods (0.0%) | |
| IKON Office Solutions, Inc. | | | 6,700 | | | | 67 | | |
| Wholesale Trade Nondurable Goods (0.7%) | |
| Unilever PLC | | | 225,600 | | | | 2,282 | | |
| Total Common Stocks (cost: $287,855) | | | | | | | 315,645 | | |
| | | Principal | | Value | |
| SECURITY LENDING COLLATERAL (7.7%) | |
| Debt (7.1%) | |
| Bank Notes (0.5%) | |
Bank of America
| |
| 3.81%, due 06/07/2006 * | | $ | 749 | | | $ | 749 | | |
| 3.81%, due 08/10/2006 * | | | 743 | | | | 743 | | |
Credit Suisse First Boston Corp.
4.11%, due 03/10/2006 * | | | 149 | | | | 149 | | |
| | | Principal | | Value | |
| Certificates Of Deposit (0.5%) | |
Canadian Imperial Bank of Commerce
4.07%, due 11/04/2005 * | | $ | 594 | | | $ | 594 | | |
Harris Trust & Savings Bank
3.80%, due 11/04/2005 * | | | 473 | | | | 473 | | |
Rabobank Nederland
4.03%, due 05/31/2006 * | | | 743 | | | | 743 | | |
| Commercial Paper (1.5%) | |
Ciesco LLC
4.00%, due 11/03/2005 | | | 742 | | | | 742 | | |
General Electric Capital Corp.
3.96%, due 12/05/2005 | | | 594 | | | | 594 | | |
Paradigm Funding LLC–144A
4.01%, due 11/07/2005 | | | 593 | | | | 593 | | |
Park Avenue Receivables Corp.–144A
4.03%, due 12/02/2005 | | | 588 | | | | 588 | | |
Preferred Receivables Corp.–144A
4.04%, due 12/05/2005 | | | 446 | | | | 446 | | |
Ranger Funding Co. LLC–144A
3.99%, due 11/15/2005 | | | 442 | | | | 442 | | |
Sheffield Receivables Corp.–144A
4.01%, due 11/08/2005 | | | 446 | | | | 446 | | |
Yorktown Capital LLC
3.97%, due 11/09/2005
3.93%, due 11/17/2005 | | | 740
738 | | | | 740
738 | | |
| Euro Dollar Overnight (1.7%) | |
Bank of Montreal
3.79%, due 11/01/2005 | | | 446 | | | | 446 | | |
Barclays
3.80%, due 11/04/2005 | | | 594 | | | | 594 | | |
BNP Paribas
3.83%, due 11/02/2005 | | | 892 | | | | 892 | | |
Deutsche Bank
3.80%, due 11/02/2005 | | | 1,486 | | | | 1,486 | | |
HSBC Banking/Holdings PLC
3.84%, due 11/07/2005 | | | 446 | | | | 446 | | |
Royal Bank of Scotland
3.76%, due 11/01/2005 | | | 594 | | | | 594 | | |
Svenska Handlesbanken
4.03%, due 11/01/2005 | | | 765 | | | | 765 | | |
UBS AG
3.80%, due 11/03/2005 | | | 594 | | | | 594 | | |
| Euro Dollar Terms (0.6%) | |
Royal Bank of Scotland
4.00%, due 12/12/2005 | | | 594 | | | | 594 | | |
UBS AG
4.02%, due 12/01/2005 | | | 594 | | | | 594 | | |
Wells Fargo
3.96%, due 11/14/2005 | | | 892 | | | | 892 | | |
The notes to the financial statements are an integral part of this report.
Transamerica IDEX Mutual Funds
Annual Report 2005
5
TA IDEX Salomon All Cap
SCHEDULE OF INVESTMENTS (continued)
At October 31, 2005
(all amounts except share amounts in thousands)
| | | Principal | | Value | |
| Promissory Notes (0.2%) | | | |
Goldman Sachs Group, Inc.
4.02%, due 12/28/2005 | | $ | 624 | | | $ | 624 | | |
| Repurchase Agreements (2.1%) †† | | | |
Credit Suisse First Boston Corp.
4.10%, dated 10/31/2005 to be
repurchased at $1,013 on 11/01/2005 | | | 1,013 | | | | 1,013 | | |
Goldman Sachs Group, Inc. (The)
4.10%, dated 10/31/2005 to be
repurchased at $2,526 on 11/01/2005 | | | 2,526 | | | | 2,526 | | |
Lehman Brothers, Inc.
4.10%, dated 10/31/2005 to be
repurchased at $70 on 11/01/2005 | | | 70 | | | | 70 | | |
Merrill Lynch & Co.
4.10%, dated 10/31/2005 to be
repurchased at $2,972 on 11/01/2005 | | | 2,972 | | | | 2,972 | | |
Morgan Stanley Dean Witter & Co.
4.17%, dated 10/31/2005 to be
repurchased at $891 on 11/01/2005 | | | 891 | | | | 891 | | |
| | | Shares | | Value | |
| Investment Companies (0.6%) | | | |
| Money Market Funds (0.6%) | | | |
American Beacon Fund
1-day yield of 3.81% | | | 640,707 | | | $ | 641 | | |
Barclays Global Investors Institutional
Money Market Fund
1-day yield of 3.92% | | | 594,383 | | | | 594 | | |
Goldman Sachs Financial Square Prime
Obligations Fund
1-day yield of 3.79% | | | 92,586 | | | | 93 | | |
Merrimac Cash Fund, Premium Class
1-day yield of 3.70% @ | | | 587,814 | | | | 588 | | |
| Total Security Lending Collateral (cost: $26,689) | | | | | | | 26,689 | | |
| Total Investment Securities (cost: $314,544) | | | | | | $ | 342,334 | | |
| SUMMARY: | | | |
| Investment securities , at value | | | 98.6 | % | | $ | 342,334 | | |
| Other assets in excess of liabilities | | | 1.4 | % | | | 4,998 | | |
| Net assets | | | 100.0 | % | | $ | 347,332 | | |
NOTES TO SCHEDULE OF INVESTMENTS:
† At October 31, 2005, all or a portion of this security is on loan (see Note 1). The value at October 31, 2005, of all securities on loan is $24,476.
‡ Non-income producing.
* Floating or variable rate note. Rate is listed as of October 31, 2005.
†† Cash collateral for the Repurchase Agreements, valued at $7,621, that serve as collateral for securities lending are invested in corporate bonds with interest rates and maturity dates ranging from 0.00%–9.86% and 12/31/2005–11/15/2096, respectively.
@ Regulated investment company advised by Investors Bank and Trust Co. ("IBT"). IBT is also the accounting, custody and lending agent for the Fund.
DEFINITIONS:
144A 144A Securities are registered pursuant to Rule 144A of the Securities Act of 1933. These securities are deemed to be liquid for purposes of compliance limitations on holdings of illiquid securities and may be resold as transactions exempt from registration, normally to qualified institutional buyers. At October 31, 2005, these securities aggregated $6,066 or 1.7% of the net assets of the Fund.
ADR American Depositary Receipt
GDR Global Depositary Receipt
The notes to the financial statements are an integral part of this report.
Transamerica IDEX Mutual Funds
Annual Report 2005
6
TA IDEX Salomon All Cap
STATEMENT OF ASSETS AND LIABILITIES
At October 31, 2005
(all amounts except per share amounts in thousands)
| Assets: | | | |
Investment securities, at value (cost: $314,544)
(including securities loaned of $24,476) | | $ | 342,334 | | |
| Cash | | | 30,581 | | |
| Receivables: | |
| Investment securities sold | | | 2,457 | | |
| Shares of beneficial interest sold | | | 108 | | |
| Interest | | | 74 | | |
| Dividends | | | 254 | | |
| Other | | | 24 | | |
| | | | 375,832 | | |
| Liabilities: | | | |
| Investment securities purchased | | | 542 | | |
| Accounts payable and accrued liabilities: | |
| Shares of beneficial interest redeemed | | | 663 | | |
| Management and advisory fees | | | 237 | | |
| Distribution and service fees | | | 200 | | |
| Transfer agent fees | | | 79 | | |
| Administration fees | | | 6 | | |
| Payable for collateral for securities on loan | | | 26,689 | | |
| Other | | | 84 | | |
| | | | 28,500 | | |
| Net Assets | | $ | 347,332 | | |
| Net Assets Consist of: | | | |
Shares of beneficial interest, unlimited shares
authorized, no par value | | | 310,582 | | |
| Accumulated net investment income (loss) | | | (7 | ) | |
Undistributed net realized gain (loss) from
investment securities and foreign currency
transactions | | | 8,969 | | |
| Net unrealized appreciation (depreciation) on: | |
| Investment securities | | | 27,788 | | |
| Net Assets | | $ | 347,332 | | |
| Net Assets by Class: | | | |
| Class A | | $ | 173,929 | | |
| Class B | | | 123,494 | | |
| Class C | | | 49,909 | | |
| Shares Outstanding: | | | |
| Class A | | | 10,802 | | |
| Class B | | | 8,023 | | |
| Class C | | | 3,242 | | |
| Net Asset Value Per Share: | | | |
| Class A | | $ | 16.10 | | |
| Class B | | | 15.39 | | |
| Class C | | | 15.39 | | |
| Maximum Offering Price Per Share (a): | | | |
| Class A | | $ | 17.04 | | |
(a) Includes the maximum selling commission (represented as a percentage of offering price) which is reduced on certain levels of sales as set forth in the Prospectus. Net asset value per share for Classes B and C shares represents offering price. The redemption price for Classes B and C shares equals net asset value less any applicable contingent deferred sales charge.
STATEMENT OF OPERATIONS
For the year ended October 31, 2005
(all amounts in thousands)
| Investment Income: | | | |
| Interest | | $ | 528 | | |
Dividends (net of withholding taxes on foreign
dividends of $74) | | | 7,099 | | |
| Income from loaned securities–net | | | 79 | | |
| | | | 7,706 | | |
| Expenses: | | | |
| Management and advisory fees | | | 3,685 | | |
| Distribution and service fees: | |
| Class A | | | 938 | | |
| Class B | | | 1,406 | | |
| Class C | | | 584 | | |
| Transfer agent fees: | |
| Class A | | | 260 | | |
| Class B | | | 437 | | |
| Class C | | | 150 | | |
| Printing and shareholder reports | | | 122 | | |
| Custody fees | | | 60 | | |
| Administration fees | | | 88 | | |
| Legal fees | | | 38 | | |
| Audit fees | | | 18 | | |
| Trustees fees | | | 26 | | |
| Registration fees: | |
| Class A | | | 24 | | |
| Class B | | | 15 | | |
| Class C | | | 13 | | |
| Other | | | 8 | | |
| Total expenses | | | 7,872 | | |
| Net Investment Income (Loss) | | | (166 | ) | |
| Net Realized Gain (Loss) From: | | | |
| Investment securities | | | 58,910 | | |
| Foreign currency transactions | | | (32 | ) | |
| | | | 58,878 | | |
Increase (decrease) in unrealized appreciation
(depreciation) on investment securities | | | (15,198 | ) | |
Net Gain (Loss) on Investment Securities and
Foreign Currency Transactions | | | 43,680 | | |
Net Increase (Decrease) in Net Assets Resulting
from Operations | | $ | 43,514 | | |
The notes to the financial statements are an integral part of this report.
Transamerica IDEX Mutual Funds
Annual Report 2005
7
TA IDEX Salomon All Cap
STATEMENTS OF CHANGES IN NET ASSETS
For the years ended
(all amounts in thousands)
| | | October 31,
2005 | | October 31,
2004 | |
| Increase (Decrease) In Net Assets From: | | | |
| Operations: | | | |
| Net investment income (loss) | | $ | (166 | ) | | $ | (2,597 | ) | |
Net realized gain (loss) from
investment securities and
foreign currency transactions | | | 58,878 | | | | 25,144 | | |
Net unrealized appreciation
(depreciation) on investment
securities | | | (15,198 | ) | | | 6,182 | | |
| | | | 43,514 | | | | 28,729 | | |
| Distributions to Shareholders: | | | |
| From net investment income: | |
| Class A | | | (19 | ) | | | – | | |
| | | | (19 | ) | | | – | | |
| Capital Share Transactions: | | | |
| Proceeds from shares sold: | |
| Class A | | | 4,851 | | | | 172,341 | | |
| Class B | | | 6,793 | | | | 20,598 | | |
| Class C | | | 2,933 | | | | 8,093 | | |
| Class C2 | | | – | | | | 2,046 | | |
| Class M | | | – | | | | 2,231 | | |
| | | | 14,577 | | | | 205,309 | | |
Dividends and distributions
reinvested: | |
| Class A | | | 19 | | | | – | | |
| | | | 19 | | | | – | | |
| Cost of shares redeemed: | |
| Class A | | | (297,064 | ) | | | (22,683 | ) | |
| Class B | | | (44,894 | ) | | | (36,255 | ) | |
| Class C | | | (23,071 | ) | | | (7,530 | ) | |
| Class C2 | | | – | | | | (7,820 | ) | |
| Class M | | | – | | | | (9,325 | ) | |
| | | | (365,029 | ) | | | (83,613 | ) | |
| Redemption fees: | |
| Class B | | | 3 | | | | – | | |
| | | | 3 | | | | – | | |
| Class level exchanges: | |
| Class C | | | – | | | | 62,362 | | |
| Class C2 | | | – | | | | (30,201 | ) | |
| Class M | | | – | | | | (32,161 | ) | |
| | | | – | | | | – | | |
| Automatic conversions: | |
| Class A | | | 294 | | | | 98 | | |
| Class B | | | (294 | ) | | | (98 | ) | |
| | | | – | | | | – | | |
| | | | (350,430 | ) | | | 121,696 | | |
| Net increase (decrease) in net assets | | | (306,935 | ) | | | 150,425 | | |
| Net Assets: | | | |
| Beginning of year | | | 654,267 | | | | 503,842 | | |
| End of year | | $ | 347,332 | | | $ | 654,267 | | |
Accumulated Net Investment Income
(Loss) | | $ | (7 | ) | | $ | (6 | ) | |
| | | October 31,
2005 | | October 31,
2004 | |
| Share Activity: | | | |
| Shares issued: | |
| Class A | | | 309 | | | | 11,625 | | |
| Class B | | | 452 | | | | 1,436 | | |
| Class C | | | 195 | | | | 567 | | |
| Class C2 | | | – | | | | 143 | | |
| Class M | | | – | | | | 154 | | |
| | | | 956 | | | | 13,925 | | |
Shares issued–reinvested from
distributions: | |
| Class A | | | 1 | | | | – | | |
| | | | 1 | | | | – | | |
| Shares redeemed: | |
| Class A | | | (19,117 | ) | | | (1,535 | ) | |
| Class B | | | (2,978 | ) | | | (2,548 | ) | |
| Class C | | | (1,537 | ) | | | (536 | ) | |
| Class C2 | | | – | | | | (542 | ) | |
| Class M | | | – | | | | (650 | ) | |
| | | | (23,632 | ) | | | (5,811 | ) | |
| Class level exchanges: | |
| Class C | | | – | | | | 4,365 | | |
| Class C2 | | | – | | | | (2,082 | ) | |
| Class M | | | – | | | | (2,271 | ) | |
| | | | – | | | | 12 | | |
| Automatic conversions: | |
| Class A | | | 19 | | | | 6 | | |
| Class B | | | (19 | ) | | | (6 | ) | |
| | | | – | | | | – | | |
Net increase (decrease) in shares
outstanding: | |
| Class A | | | (18,788 | ) | | | 10,096 | | |
| Class B | | | (2,545 | ) | | | (1,118 | ) | |
| Class C | | | (1,342 | ) | | | 4,396 | | |
| Class C2 | | | – | | | | (2,481 | ) | |
| Class M | | | – | | | | (2,767 | ) | |
| | | | (22,675 | ) | | | 8,126 | | |
The notes to the financial statements are an integral part of this report.
Transamerica IDEX Mutual Funds
Annual Report 2005
8
TA IDEX Salomon All Cap
FINANCIAL HIGHLIGHTS
| | | | | For a share of beneficial interest outstanding throughout each period | |
| | | | | Net Asset | | Investment Operations | | Distributions | | Net Asset | |
| | | For the
Period
Ended (d)(g) | | Value,
Beginning
of Period | | Net
Investment
Income (Loss) | | Net Realized
and Unrealized
Gain (Loss) | | Total
Operations | | From Net
Investment
Income | | From Net
Realized
Gains | | Total
Distributions | | Value,
End
of Period | |
| Class A | | 10/31/2005 | | $ | 14.80 | | | $ | 0.06 | | | $ | 1.24 | | | $ | 1.30 | | | $ | – | (h) | | $ | – | | | $ | – | | | $ | 16.10 | | |
| | | 10/31/2004 | | | 13.95 | | | | (0.03 | ) | | | 0.88 | | | | 0.85 | | | | – | | | | – | | | | – | | | | 14.80 | | |
| | | 10/31/2003 | | | 10.34 | | | | (0.04 | ) | | | 3.65 | | | | 3.61 | | | | – | | | | – | | | | – | | | | 13.95 | | |
| | | 10/31/2002 | | | 13.63 | | | | – | | | | (3.15 | ) | | | (3.15 | ) | | | – | | | | (0.14 | ) | | | (0.14 | ) | | | 10.34 | | |
| | | 10/31/2001 | | | 15.51 | | | | 0.12 | | | | (1.58 | ) | | | (1.46 | ) | | | – | | | | (0.42 | ) | | | (0.42 | ) | | | 13.63 | | |
| Class B | | 10/31/2005 | | | 14.27 | | | | (0.09 | ) | | | 1.21 | | | | 1.12 | | | | – | | | | – | | | | – | | | | 15.39 | | |
| | | 10/31/2004 | | | 13.53 | | | | (0.11 | ) | | | 0.85 | | | | 0.74 | | | | – | | | | – | | | | – | | | | 14.27 | | |
| | | 10/31/2003 | | | 10.08 | | | | (0.12 | ) | | | 3.57 | | | | 3.45 | | | | – | | | | – | | | | – | | | | 13.53 | | |
| | | 10/31/2002 | | | 13.41 | | | | (0.10 | ) | | | (3.09 | ) | | | (3.19 | ) | | | – | | | | (0.14 | ) | | | (0.14 | ) | | | 10.08 | | |
| | | 10/31/2001 | | | 15.36 | | | | 0.02 | | | | (1.55 | ) | | | (1.53 | ) | | | – | | | | (0.42 | ) | | | (0.42 | ) | | | 13.41 | | |
| Class C | | 10/31/2005 | | | 14.26 | | | | (0.08 | ) | | | 1.21 | | | | 1.13 | | | | – | | | | – | | | | – | | | | 15.39 | | |
| | | 10/31/2004 | | | 13.53 | | | | (0.12 | ) | | | 0.85 | | | | 0.73 | | | | – | | | | – | | | | – | | | | 14.26 | | |
| | | 10/31/2003 | | | 10.26 | | | | (0.12 | ) | | | 3.39 | | | | 3.27 | | | | – | | | | – | | | | – | | | | 13.53 | | |
| | | | | | | Ratios/Supplemental Data | |
| | | For the
Period | | Total | | Net Assets,
End of
Period | | Ratio of Expenses
to Average
Net Assets (a) | | Net Investment
Income (Loss)
to Average | | Portfolio
Turnover | |
| | | Ended (g) | | Return (c) | | (000's) | | Net (e) | | Total (f) | | Net Assets (a) | | Rate (b) | |
| Class A | | 10/31/2005 | | | 8.79 | % | | $ | 173,929 | | | | 1.32 | % | | | 1.32 | % | | | 0.36 | % | | | 27 | % | |
| | | 10/31/2004 | | | 6.09 | | | | 438,047 | | | | 1.33 | | | | 1.33 | | | | (0.17 | ) | | | 25 | | |
| | | 10/31/2003 | | | 34.91 | | | | 271,958 | | | | 1.55 | | | | 1.64 | | | | (0.36 | ) | | | 30 | | |
| | | 10/31/2002 | | | (23.44 | ) | | | 57,528 | | | | 1.55 | | | | 1.65 | | | | (0.03 | ) | | | 162 | | |
| | | 10/31/2001 | | | (9.49 | ) | | | 77,791 | | | | 1.58 | | | | 1.68 | | | | 0.75 | | | | 82 | | |
| Class B | | 10/31/2005 | | | 7.84 | | | | 123,494 | | | | 2.19 | | | | 2.19 | | | | (0.58 | ) | | | 27 | | |
| | | 10/31/2004 | | | 5.48 | | | | 150,829 | | | | 1.97 | | | | 1.97 | | | | (0.80 | ) | | | 25 | | |
| | | 10/31/2003 | | | 34.23 | | | | 158,147 | | | | 2.20 | | | | 2.29 | | | | (1.01 | ) | | | 30 | | |
| | | 10/31/2002 | | | (24.11 | ) | | | 130,709 | | | | 2.20 | | | | 2.30 | | | | (0.68 | ) | | | 162 | | |
| | | 10/31/2001 | | | (10.09 | ) | | | 167,214 | | | | 2.23 | | | | 2.33 | | | | 0.10 | | | | 82 | | |
| Class C | | 10/31/2005 | | | 7.89 | | | | 49,909 | | | | 2.15 | | | | 2.15 | | | | (0.53 | ) | | | 27 | | |
| | | 10/31/2004 | | | 5.43 | | | | 65,391 | | | | 1.99 | | | | 1.99 | | | | (0.83 | ) | | | 25 | | |
| | | 10/31/2003 | | | 31.87 | | | | 2,547 | | | | 2.20 | | | | 2.29 | | | | (1.01 | ) | | | 30 | | |
NOTES TO FINANCIAL HIGHLIGHTS
(a) Annualized.
(b) Not annualized.
(c) Total Return has been calculated for the applicable period without deduction of a sales load, if any, on an initial purchase. Periods of less than one year are not annualized.
(d) Per share information is calculated based on average number of shares outstanding.
(e) Ratio of Net Expenses to Average Net Assets is net of fee waivers and reimbursements by the investment adviser, if any (see note 2).
(f) Ratio of Total Expenses to Average Net Assets includes all expenses before fee waivers and reimbursements by the investment adviser.
(g) The inception date for the Fund's offering of share Class C was November 11, 2002.
(h) Rounds to less than $(0.01) per share.
The notes to the financial statements are an integral part of this report.
Transamerica IDEX Mutual Funds
Annual Report 2005
9
TA IDEX Salomon All Cap
NOTES TO FINANCIAL STATEMENTS
At October 31, 2005
(all amounts in thousands)
NOTE 1. ORGANIZATION AND SIGNIFICANT ACCOUNTING POLICIES
Transamerica IDEX Mutual Funds is an open-end management investment company registered under the Investment Company Act of 1940, as amended (the "1940 Act").
In the normal course of business, TA IDEX Salomon All Cap (the "Fund") enters into contracts that contain a variety of representations that provide general indemnifications. The Fund's maximum exposure under these arrangements is unknown, as this would involve future claims that may be made against the Fund and/or its affiliates that have not yet occurred. However, based on experience, the Fund expects the risk of loss to be remote.
The Fund is "non-diversified" under the 1940 act.
This report should be read in conjunction with the current Fund prospectus, which contains more complete information about the Fund.
The following is a summary of significant accounting policies followed by the Fund in the preparation of the financial statements. In preparing the Fund's financial statements in accordance with accounting principles generally accepted in the United States of America ("GAAP"), estimates or assumptions (which could differ from actual results) may be used that affect reported amounts and disclosures.
Multiple class operations, income and expenses: The Fund currently offers three classes of shares, each with a public offering price that reflects different sales charges, if any, and expense levels. On June 15, 2004, Class C2 shares merged into Class C. On September 24, 2004, Class M shares merged into Class C. Class B shares will convert to Class A shares eight years after purchase. Income, non-class specific expenses and realized and unrealized gains and losses, are allocated daily to each class, based upon the value of shares outstanding method as permitted under Rule 18f-3 of the 1940 Act. Each class bears its own specific expenses as well as a portion of general, common expenses.
Security valuations: The Fund values its investments at the close of the New York Stock Exchange ("NYSE"), normally 4 p.m. ET, each day the NYSE is open for business. Fund investments are valued at the last sale price or closing price on the day of valuation taken from the primary exchange where the security is principally traded.
Securities traded in the over-the-counter market and listed securities for which no sale was reported on that date are valued at the last quoted bid price.
Debt securities are valued based on a price quotation or other equivalent indication of value supplied by an exchange, a pricing service or a major market maker; however, those that mature in sixty days or less are valued at amortized cost, which approximates market.
Investment company securities are valued at the net asset value of the underlying portfolio.
Foreign securities generally are valued based on quotations from the primary market in which they are traded. Because many foreign securities markets and exchanges close prior to the close of the NYSE, closing prices for foreign securities in those markets or on those exchanges do not reflect the events that occur after that close. If a significant market event impacting the value of a portfolio security (e.g., natural disaster, company announcement, market volatility) occurs subsequent to the close of trading in the security, but prior to the calculation of the Fund's net asset value per share, market quotations for that security may be determined to be unreliable and, accordingly, not "readily available." As a result, foreign equity securities held by the Fund may be valued at fair market value as determined in good faith by the Fund's Administrative Valuation Committee, under the supervision of the B oard's Valuation Committee, using guidelines adopted by the Board of Trustees.
Other securities for which quotations are not readily available or whose values have been determined to be unreliable are valued at fair market value as determined in good faith by the Fund's Administrative Valuation Committee, under the supervision of the Board's Valuation Committee, using guidelines adopted by the Board of Trustees.
Cash: The Fund may leave cash overnight in its cash account with the custodian, Investors Bank & Trust Company ("IBT"). IBT has been contracted on behalf of the Fund to invest the excess cash into a savings account, which at October 31, 2005, was paying an interest rate of 2.76%.
Repurchase agreements: The Fund is authorized to enter into repurchase agreements. The Fund, through its custodian, IBT, receives delivery of the underlying securities, the value of which at the time of purchase is required to be an amount equal to at least 100% of the resale price. The Fund will bear the risk of value fluctuations until the security can be sold and may encounter delays and incur costs in liquidating the security. In the event of bankruptcy or insolvency of the seller, delays and costs may be incurred.
Commission recapture: The sub-adviser, to the extent consistent with the best execution and usual commission rate policies and practices, may place security transactions of the Fund with broker/dealers with which Transamerica IDEX Mutual Funds has established a Commission Recapture Program. A Commission Recapture Program is any arrangement under which a broker/dealer applies a portion of the commissions received by such broker/dealer on the security transactions to the Fund. In no event will commissions paid by the Fund be used to pay expenses that would otherwise be borne by any other funds within Transamerica IDEX Mutual Funds, or by any other party.
Transamerica IDEX Mutual Funds
Annual Report 2005
10
TA IDEX Salomon All Cap
NOTES TO FINANCIAL STATEMENTS (continued)
At October 31, 2005
(all amounts in thousands)
NOTE 1.–(continued)
Recaptured commissions during the year ended October 31, 2005, of $119 are included in net realized gains on the Statement of Operations.
Securities lending: The Fund may lend securities to qualified borrowers, with IBT acting as the Fund's lending agent. The Fund earns negotiated lenders' fees. The Fund receives cash and/or securities as collateral against the loaned securities. Cash collateral received is invested in short term, interest bearing securities. The Fund monitors the market value of securities loaned on a daily basis and requires collateral in an amount at least equal to the value of the securities loaned. Income from loaned securities on the Statement of Operations is net of fees, in the amount of $34, earned by IBT for its services.
Security transactions and investment income: Security transactions are recorded on the trade date. Security gains and losses are calculated on the specific identification basis. Dividend income, if any, is recorded on the ex-dividend date or, in the case of foreign securities, as soon as the Fund is informed of the ex-dividend date. Interest income, including accretion of discounts and amortization of premiums, is recorded on the accrual basis commencing on the settlement date.
Foreign currency denominated investments: The accounting records of the Fund are maintained in U.S. dollars. Securities and other assets and liabilities denominated in foreign currencies are translated into U.S. dollars at the closing exchange rate each day. The cost of foreign securities is translated at the exchange rate in effect when the investment was acquired. The Fund combines fluctuations from currency exchange rates and fluctuations in value when computing net realized and unrealized gains or losses from investments.
Net foreign currency gains and losses resulting from changes in exchange rates include: 1) foreign currency fluctuations between trade date and settlement date of investment security transactions; 2) gains and losses on forward foreign currency contracts; and 3) the difference between the receivable amounts of interest and dividends recorded in the accounting records in U.S. dollars and the amounts actually received.
Foreign currency denominated assets may involve risks not typically associated with domestic transactions. These risks include revaluation of currencies, adverse fluctuations in foreign currency values and possible adverse political, social and economic developments, including those particular to a specific industry, country or region.
Foreign capital gains taxes: The Fund may be subject to taxes imposed by countries in which it invests, with respect to its investment in issuers existing or operating in such countries. Such taxes are generally based on income earned or repatriated and capital gains realized on the sale of such investments. The Fund accrues such taxes when the related income or capital gains are earned. Some countries require governmental approval for the repatriation of investment income, capital or the proceeds of sales earned by foreign investors. In addition, if there is deterioration in a country's balance of payments or for other reasons, a country may impose temporary restrictions on foreign capital remittan ces abroad.
Redemption fees: A short-term trading redemption fee may be assessed on any Fund shares in a fund account that are sold during the first five (5) NYSE trading days following their purchase date. This redemption fee will equal 2% of the amount redeemed and shares held the longest will be treated as being redeemed first and shares held the shortest as being redeemed last. For the year ended October 31, 2005, the Fund received $3 in redemption fees.
Dividend distributions: Distributions to shareholders are recorded on the ex-dividend date and are determined in accordance with Federal income tax regulations which may differ from GAAP.
NOTE 2. RELATED PARTY TRANSACTIONS
Effective January 1, 2005 AEGON/Transamerica Fund Advisors, Inc. was renamed Transamerica Fund Advisors, Inc. ("TFAI"); AEGON/Transamerica Fund Services, Inc. and AEGON/Transamerica Investor Services, Inc. merged into one entity and was renamed Transamerica Fund Services, Inc. ("TFS").
TFAI is the Fund's investment adviser. TFS is the Fund's administrator and transfer agent. AFSG Securities Corp. ("AFSG") is the Fund's distributor/principal underwriter. TFAI, TFS , and AFSG are affiliates of AEGON, NV, a Netherlands corporation.
The following schedule represents the percentage of fund assets owned by affiliated mutual funds:
| | | Net
Assets | | % of
Net Assets | |
TA IDEX Asset Allocation–
Conservative Portfolio | | $ | 12 | | | | – | % | |
TA IDEX Asset Allocation–
Growth Portfolio | | | 39,002 | | | | 11.23 | % | |
TA IDEX Asset Allocation–
Moderate Growth Portfolio | | | 50,874 | | | | 14.65 | % | |
TA IDEX Asset Allocation–
Moderate Portfolio | | | 24,308 | | | | 7.00 | % | |
| Total | | $ | 114,196 | | | | 32.88 | % | |
Investment advisory fees: The Fund pays management fees to TFAI based on average daily net assets ("ANA") at the following breakpoints:
0.80% of the first $500 million of ANA
0.70% of ANA over $500 million
Transamerica IDEX Mutual Funds
Annual Report 2005
11
TA IDEX Salomon All Cap
NOTES TO FINANCIAL STATEMENTS (continued)
At October 31, 2005
(all amounts in thousands)
NOTE 2.–(continued)
TFAI has contractually agreed to waive its advisory fee and will reimburse the Fund to the extent that operating expenses, excluding 12b-1 fees, exceed the following stated annual limit:
1.20% Expense Limit
Distribution and service fees: The Fund has a 12b-1 distribution plan under the 1940 Act pursuant to which an annual fee, based on average daily net assets, is paid to the distributor for various disbursements such as broker-dealer account servicing fees and other promotional expenses of the Fund. The Fund is authorized under the 12b-1 plan to pay fees on each class up to the following limits:
| Class A | | | 0.35 | % | |
| Class B | | | 1.00 | % | |
| Class C | | | 1.00 | % | |
In the case the Fund or a class of shares of the Fund is closed to new investors or investments, the Fund is authorized to pay 12b-1 fees for past sales and distribution efforts and present and past investor services.
Underwriter commissions relate to front-end sales charges imposed for Class A shares and contingent deferred sales charges from Classes B, C, and certain A share redemptions. For the year ended October 31, 2005, the underwriter commissions were as follows:
| Received by Underwriter | | $ | 532 | | |
| Retained by Underwriter | | | 23 | | |
| Contingent Deferred Sales Charge | | | 392 | | |
Administrative services: The Fund has entered into an agreement with TFS for financial and legal fund administration services. As of January 1, 2005 the Fund pays TFS an annual fee of 0.02% of ANA. Prior to January 1, 2005 the Fund paid TFS an annual fee of 0.015% of ANA. The Legal fees on the Statement of Operations are for fees paid to external legal counsel.
Transfer agent fees: The Fund pays TFS an annual per-account charge for each open and closed account. The Fund paid TFS $805 for the year ended October 31, 2005.
Deferred compensation plan: Each eligible independent Fund Trustee may elect to participate in a non-qualified deferred compensation plan maintained by Transamerica IDEX Mutual Funds (the "Plan"). Under the Plan, such Trustees may defer payment of all or a portion of their total fees earned as a Fund Trustee. Each Trustee who is a participant in the Plan may elect that the earnings, losses or gains credited to his or her deferred fee amounts be determined based on a deemed investment in any series of Transamerica IDEX Mutual Funds, including the Fund. The right of a participant to receive a distribution from the Plan of the deferred fees is an unsecured claim against the general assets of all series of Transamerica IDEX Mutual Funds. The pro rata liability to the Fund of all deferred fees i n the Plan amounted, as of October 31, 2005, to $24.
Brokerage commissions: Brokerage commissions incurred on security transactions placed with an affiliate of the adviser for the year ended October 31, 2005, were $19.
NOTE 3. INVESTMENT TRANSACTIONS
The cost of securities purchased and proceeds from securities sold (excluding short-term securities) for the year ended October 31, 2005, were as follows:
| Purchases of securities: | | | |
| Long-Term | | $ | 116,827 | | |
| U.S. Government | | | – | | |
| Proceeds from maturities and sales of securities: | | | |
| Long-Term | | | 468,033 | | |
| U.S. Government | | | – | | |
NOTE 4. FEDERAL INCOME TAX MATTERS
The Fund has not made any provision for federal income or excise taxes due to its policy to distribute all of its taxable income and capital gains to its shareholders and otherwise qualify as a regulated investment company under Subchapter M of the Internal Revenue Code. Income and capital gain distributions are determined in accordance with income tax regulations, which may differ from GAAP. These differences are primarily due to differing treatment for items including, but not limited to, wash sales, net operating losses, excess distributions and foreign currency transactions.
Therefore, distributions determined in accordance with tax regulations may differ significantly in amount or character from net investment income and realized gains for financial reporting purposes. Financial reporting records are adjusted for permanent book/tax differences to reflect tax character. Financial records are not adjusted for temporary differences. These reclassifications are as follows:
Shares of beneficial interest, unlimited
shares authorized | | $ | (199 | ) | |
| Accumulated net investment income (loss) | | | 184 | | |
Undistributed net realized gain (loss) from investment
securities | | | 15 | | |
The capital loss carryforward utilized during the year ended October 31, 2005 was $49,607.
The tax character of distributions paid may differ from the character of distributions shown in the Statement of Changes in Net Assets due to short-term gains being treated as ordinary income for tax purposes. The tax character of distributions paid during 2004 and 2005 was as follows:
| 2004 Distributions paid from: | |
| Ordinary Income | | $ | – | | |
| Long-term Capital Gain | | | – | | |
| 2005 Distributions paid from: | |
| Ordinary Income | | | 19 | | |
| Long-term Capital Gain | | | – | | |
Transamerica IDEX Mutual Funds
Annual Report 2005
12
TA IDEX Salomon All Cap
NOTES TO FINANCIAL STATEMENTS (continued)
At October 31, 2005
(all amounts in thousands)
NOTE 4.–(continued)
The tax basis components of distributable earnings as of October 31, 2005, are as follows:
| Undistributed Ordinary Income | | $ | - | | |
| Undistributed Long-term Capital Gains | | $ | 9,310 | | |
| Capital Loss Carryforward | | $ | - | | |
| Net Unrealized Appreciation (Depreciation) | | $ | 27,447 | * | |
* Amount includes unrealized gain/loss from foreign currency and deferred compensation.
The aggregate cost of investments and composition of unrealized appreciation (depreciation) for federal income tax purposes as of October 31, 2005, are as follows:
| Federal Tax Cost Basis | | $ | 314,885 | | |
| Unrealized Appreciation | | $ | 42,665 | | |
| Unrealized (Depreciation) | | | (15,216 | ) | |
| Net Unrealized Appreciation (Depreciation) | | $ | 27,449 | | |
NOTE 5. REGULATORY PROCEEDINGS
There continues to be significant federal and state regulatory activity relating to financial services companies, particularly mutual fund companies and their investment advisers. As part of an ongoing investigation regarding potential market timing, recordkeeping and trading compliance issues and matters affecting the Fund's investment adviser, TFAI, and certain affiliates and former employees of TFAI, the SEC staff has indicated that it is likely to take some action against TFAI and certain of its affiliates at the conclusion of the investigation. The potential timing and the scope of any such action is difficult to predict. Although the impact of any action brought against TFAI and/or its affiliates is difficult to assess at the present time, the Fund currently believes that the likelihood that any such action will have a material adverse impact on it is remote. It is important to note that the Fund is not aware of any allegation of wrongdoing against it and its Board at the time this annual report is printed. Although it is not anticipated that these developments will have an adverse impact on the Fund, there can be no assurance at this time. TFAI and its affiliates are actively working with the SEC in regard to this matter; however, the exact resolution cannot be determined at this time. TFAI will take such actions that it deems necessary or appropriate to continue providing management services to the Fund and to bring all matters to an appropriate conclusion.
TFAI and/or its affiliates, and not the Fund, will bear the costs regarding these regulatory matters.
Transamerica IDEX Mutual Funds
Annual Report 2005
13
Report of Independent Registered Certified Public Accounting Firm
To the Board of Trustees and Shareholders of
TA IDEX Salomon All Cap
In our opinion, the accompanying statement of assets and liabilities, including the schedule of investments, and the related statements of operations and of changes in net assets and the financial highlights present fairly, in all material respects, the financial position of TA IDEX Salomon All Cap (the "Fund") (one of the portfolios constituting the Transamerica IDEX Mutual Funds) at October 31, 2005, the results of its operations for the year then ended, the changes in its net assets for each of the two years in the period then ended and the financial highlights for each of the periods presented, in conformity with accounting principles generally accepted in the United States of America. These financial statements and financial highlights (hereafter referred to as "financial statements") are the responsibility of the Fund's management; our responsibility is to express an opinion on these financia l statements based on our audits. We conducted our audits of these financial statements in accordance with the standards of the Public Company Accounting Oversight Board (United States). Those standards require that we plan and perform the audit to obtain reasonable assurance about whether the financial statements are free of material misstatement. An audit includes examining, on a test basis, evidence supporting the amounts and disclosures in the financial statements, assessing the accounting principles used and significant estimates made by management, and evaluating the overall financial statement presentation. We believe that our audits, which included confirmation of securities at October 31, 2005 by correspondence with the custodian, provide a reasonable basis for our opinion.

December 22, 2005
Transamerica IDEX Mutual Funds
Annual Report 2005
14
TA IDEX Salomon All Cap
SUPPLEMENTAL INFORMATION (unaudited)
TAX INFORMATION
For dividends paid during the year ended October 31, 2005, the Fund designated $6,971 as qualified dividend income.
The information and distributions reported herein may differ from the information and distributions taxable to the shareholders for the calendar year ending December 31, 2005. Complete information will be computed and reported in conjunction with your 2005 Form 1099-DIV.
Transamerica IDEX Mutual Funds
Annual Report 2005
15
TA IDEX Salomon Investors Value
MARKET ENVIRONMENT
There was no shortage of problems for the U.S. economy to overcome during the reporting period. These included record high oil prices, rising short-term interest rates, the devastation inflicted by Hurricanes Katrina and Rita, geopolitical issues, and falling consumer confidence. However, the economy proved to be surprisingly resilient during the fiscal year.
The Federal Reserve Board ("Fed") continued to raise interest rates over the period in an attempt to ward off inflation. After raising rates in June, August, and September 2004, the Fed increased its target for the federal funds rate in 0.25% increments eight additional times in the fiscal period. All told, the Fed's eleven rate hikes have brought the target for the federal funds rate from 1.00% to 3.75%. This represents the longest sustained Fed tightening cycle since 1977-1979.
The top-performing sector of the Standard and Poor's 500 Composite Stock Index ("S&P 500") was energy, gaining 34%. Other leading sectors included utilities (23%) and consumer staples (10%). All sectors had positive returns during the period with the exception of consumer discretionary (–1%) and telecommunications (–1%), which was marginally negative.
PERFORMANCE
For the year ended October 31, 2005, TA IDEX Salomon Investors Value, Class A returned 9.60%. By comparison its primary and secondary benchmarks, the S&P 500 and the Russell 1000 Value Index ("Russell 1000 Value"), returned 8.71% and 11.86%, respectively.
STRATEGY REVIEW
While the portfolio outperformed its primary benchmark, the S&P 500, during the period, it underperformed its secondary benchmark, the Russell 1000 Value, due to both sector allocation and security selection. An underweight position in materials and an overweight position in consumer staples contributed positively to performance; however, this benefit was more than offset by the underweight position in utilities and the overweight position in consumer discretionary, which held back performance.
Security selection was strongest in the telecommunication and consumer discretionary sectors and weakest in the information technology and healthcare sectors. Top contributors during the period included Altria Group, Inc., Marathon Oil Corporation, ENSCO International Incorporated, Loews Corporation and Total SA. We continue to hold these stocks.
Stocks that detracted from performance came from a number of different sectors and included Lexmark International, Inc. ("Lexmark"), Pfizer Inc., News Corporation, Sprint Nextel Corp. and Comcast Corporation.
In the beginning of October Lexmark shares fell sharply after the company pre-announced it was slashing its profit forecast. The company underestimated the competitive pressures in the printer industry and was forced to cut prices to stem market share losses. We sold our position since we believe the investment thesis is impaired.
During the period, we have reduced our technology and utilities weightings in the portfolio and increased our financials weighting. We are currently overweight in the consumer discretionary, healthcare and consumer staples sectors and underweight in the financials, utilities and energy sectors versus the Russell 1000 Value.
Mark J. McAllister, CFA
Robert Feitler
Co-Fund Managers
Salomon Brothers Asset Management Inc
Transamerica IDEX Mutual Funds
Annual Report 2005
1
TA IDEX Salomon Investors Value
Comparison of change in value of $10,000 investment in Class A shares and its comparative indices.
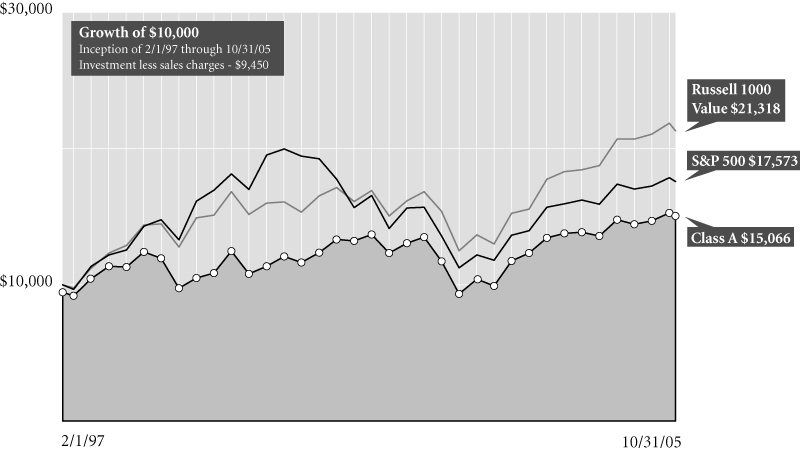
Average Annual Total Return for Periods Ended 10/31/05
| | | 1 year | | 5 years | | From
Inception | | Inception
Date | |
| Class A (NAV) | | | 9.60 | % | | | 3.71 | % | | | 5.47 | % | | 2/1/97 | |
| Class A (POP) | | | 3.57 | % | | | 2.54 | % | | | 4.79 | % | | 2/1/97 | |
| S&P 5001 | | | 8.71 | % | | | (1.73 | )% | | | 6.66 | % | | 2/1/97 | |
| Russell 1000 Value1 | | | 11.86 | % | | | 4.71 | % | | | 9.04 | % | | 2/1/97 | |
| Class B (NAV) | | | 8.53 | % | | | 2.99 | % | | | 4.78 | % | | 2/1/97 | |
| Class B (POP) | | | 3.53 | % | | | 2.81 | % | | | 4.78 | % | | 2/1/97 | |
| Class C (NAV) | | | 8.57 | % | | | – | | | | 13.58 | % | | 11/11/02 | |
| Class C (POP) | | | 7.57 | % | | | – | | | | 13.58 | % | | 11/11/02 | |
NOTES
1 The Standard and Poor's 500 Composite Stock (S&P 500) Index and the Russell 1000 Value (Russell 1000 Value) Index are unmanaged indices used as a general measure of market performance. Calculations assume dividends and capital gains are reinvested and do not include any managerial expenses. From inception calculation is based on life of Class A shares. Source: Standard & Poor's Micropal®© Micropal, Inc. 2005 – 1-800-596-5323 – http://www.funds-sp.com.
The performance data presented represents past performance, future results may vary. Performance data does not reflect the deduction of taxes that would be paid on fund distributions or the redemption of fund shares. Investment return and principal value will fluctuate so that an investor's shares, when redeemed, may be worth more or less than their original cost. Current performance may be lower or higher than performance quoted. Please see www.transamericaidex.com for performance data current to the most recent month-end.
Public Offering Price (POP) returns include the reinvestment of dividends and capital gains and reflect the maximum sales charge of 5.5% for A shares or the maximum applicable contingent deferred sales charge (5% in the 1st year, decreasing to 0% after 6 years) for Class B shares and 1% (during the first 12 months) for Class C shares. Shares purchased prior to March 1, 2004 are subject to a maximum applicable contingent deferred sales charge (5% in the 1st year, decreasing to 0% after 7 years) for Class B shares and (2% in the 1st year, decreasing to 0% after 2 years) for Class C shares. Net Asset Value (NAV) returns include the reinvestment of dividends and capital gains but do not reflect any sales charges.
This material must be preceded or accompanied by a current prospectus, which includes specific contents regarding the investment objectives and policies of this fund.
Transamerica IDEX Mutual Funds
Annual Report 2005
2
TA IDEX Salomon Investors Value
UNDERSTANDING YOUR FUND'S EXPENSES
(unaudited)
SHAREHOLDER EXPENSES
Fund shareholders may incur two types of costs: (1) transaction costs, including sales charges (loads) on purchases, contingent deferred sales charges on redemptions and redemption fees; and (2) ongoing costs, including management fees, 12b-1 distribution and service fees, and other fund expenses.
The following Example is intended to help you understand your ongoing costs (in dollars and cents) of investing in a Fund and to compare these costs with the ongoing costs of investing in other funds.
The Example is based on an investment of $1,000 invested at May 1, 2005 and held for the entire period until October 31, 2005.
ACTUAL EXPENSES
The first line in the table below provides information about actual account values and actual expenses. You may use the information in this line, together with the amount you invested, to estimate the expenses that you paid over the period. Simply divide your account value by $1,000 (for example, an $8,600 account value divided by $1,000 = 8.6), then multiply the result by the number in the first line of your Fund under the heading entitled "Expenses Paid During Period" to estimate the expenses you paid on your account during this period. If your account is an IRA, your expenses could have included a $15 annual fee. The amount of any fee paid through your account would increase the estimate of expenses you paid during the period and decrease your ending account value.
HYPOTHETICAL EXAMPLE FOR COMPARISON PURPOSES
The second line in the table below provides information about hypothetical account values and hypothetical expenses based on the Fund's actual expense ratio and an assumed rate of return of 5% per year before expenses, which is not the Fund's actual return. The hypothetical account values and expenses may not be used to estimate the actual ending account balance or expenses you paid for the period. You may use this information to compare the ongoing costs of investing in your Fund and other funds. To do so, compare this 5% hypothetical example with the 5% hypothetical examples that appear in the shareholder reports of the other funds. As in the case of the actual expense example, if your account is subject to an IRA fee, the amount of the fee paid through your account would increase the hypothetical expenses you would have paid during the period and decrease the hypothetical ending account value.
Please note that the expenses shown in the table are meant to highlight your ongoing costs only and do not reflect any transactional costs, such as sales charges, redemption fees, brokerage commissions paid on purchases and sales of fund shares. Therefore, the second line under the Fund in the table is useful in comparing ongoing costs only, and will not help you determine the relative total costs of owning different funds. If any of these transaction costs were included, your costs would be higher. The expenses shown in the table do not reflect any fees that may be charged to you by brokers, financial intermediaries or other financial institutions.
| | | Beginning
Account
Value | | Ending
Account
Value | | Annualized
Expense
Ratio | | Expenses Paid
During Period (a) | |
| Class A | |
| Actual | | $ | 1,000.00 | | | $ | 1,070.90 | | | | 1.30 | % | | $ | 6.79 | | |
| Hypothetical (b) | | | 1,000.00 | | | | 1,018.65 | | | | 1.30 | | | | 6.61 | | |
| Class B | |
| Actual | | | 1,000.00 | | | | 1,064.80 | | | | 2.29 | | | | 11.92 | | |
| Hypothetical (b) | | | 1,000.00 | | | | 1,013.66 | | | | 2.29 | | | | 11.62 | | |
| Class C | |
| Actual | | | 1,000.00 | | | | 1,066.00 | | | | 2.20 | | | | 11.46 | | |
| Hypothetical (b) | | | 1,000.00 | | | | 1,014.12 | | | | 2.20 | | | | 11.17 | | |
(a) Expenses are calculated using each Fund's annualized expense ratio (as disclosed in the table), multiplied by the average account value for the period, multiplied by number of days in the period (184 days), and divided by the number of days in the year (365 days).
(b) 5% return per year before expenses.
GRAPHICAL PRESENTATION OF SCHEDULE OF INVESTMENTS
By Sector
At October 31, 2005
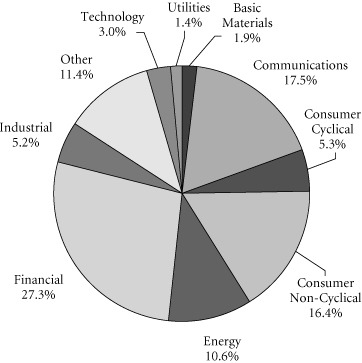
This chart shows the percentage breakdown by sector of the Fund's total investment securities.
Transamerica IDEX Mutual Funds
Annual Report 2005
3
TA IDEX Salomon Investors Value
SCHEDULE OF INVESTMENTS
At October 31, 2005
(all amounts except share amounts in thousands)
| | | Shares | | Value | |
| COMMON STOCKS (96.8%) | |
| Aerospace (4.7%) | |
| Boeing Co. (The) | | | 61,400 | | | $ | 3,969 | | |
| Textron, Inc. | | | 39,400 | | | | 2,838 | | |
| United Technologies Corp. | | | 53,500 | | | | 2,743 | | |
| Business Credit Institutions (1.5%) | |
| Freddie Mac | | | 48,700 | | | | 2,988 | | |
| Chemicals & Allied Products (2.1%) | |
| Air Products & Chemicals, Inc. | | | 39,200 | | | | 2,244 | | |
| du Pont (E.I.) de Nemours & Co. | | | 49,800 | | | | 2,076 | | |
| Commercial Banks (11.2%) | |
| Bank of America Corp. † | | | 156,100 | | | | 6,828 | | |
| Comerica, Inc. | | | 36,600 | | | | 2,115 | | |
| JP Morgan Chase & Co. | | | 91,000 | | | | 3,332 | | |
| MBNA Corp. | | | 46,800 | | | | 1,197 | | |
| US Bancorp | | | 67,300 | | | | 1,991 | | |
| Wachovia Corp. | | | 60,800 | | | | 3,072 | | |
| Wells Fargo & Co. | | | 70,800 | | | | 4,262 | | |
| Communication (3.6%) | |
| Comcast Corp.–Class A ‡ | | | 106,100 | | | | 2,953 | | |
| EchoStar Communications Corp.–Class A | | | 67,600 | | | | 1,816 | | |
| Liberty Global, Inc.–Class A ‡ | | | 13,460 | | | | 333 | | |
| Liberty Media Corp.–Class A ‡ | | | 269,300 | | | | 2,146 | | |
| Communications Equipment (4.4%) | |
| Comverse Technology, Inc. ‡ | | | 74,100 | | | | 1,860 | | |
| Nokia Corp., ADR | | | 236,700 | | | | 3,981 | | |
| Nortel Networks Corp. ‡ | | | 599,500 | | | | 1,948 | | |
| SES GLOBAL | | | 72,400 | | | | 1,145 | | |
| Computer & Data Processing Services (1.9%) | |
| Microsoft Corp. | | | 153,800 | | | | 3,953 | | |
| Computer & Office Equipment (1.0%) | |
| International Business Machines Corp. | | | 25,300 | | | | 2,072 | | |
| Department Stores (1.0%) | |
| JC Penney Co., Inc. | | | 41,400 | | | | 2,120 | | |
| Electric Services (1.5%) | |
| Sempra Energy | | | 69,900 | | | | 3,097 | | |
| Electronic Components & Accessories (0.3%) | |
| Maxim Integrated Products, Inc. | | | 18,600 | | | | 645 | | |
| Food & Kindred Products (4.5%) | |
| Altria Group, Inc. | | | 91,400 | | | | 6,860 | | |
| Sara Lee Corp. | | | 124,500 | | | | 2,222 | | |
| Food Stores (1.7%) | |
| Kroger Co. ‡ | | | 173,400 | | | | 3,451 | | |
| | | Shares | | Value | |
| Holding & Other Investment Offices (1.1%) | |
| Equity Residential † | | | 55,800 | | | $ | 2,190 | | |
| Instruments & Related Products (1.0%) | |
| Raytheon Co. | | | 57,000 | | | | 2,106 | | |
| Insurance (9.7%) | |
| American International Group, Inc. | | | 73,100 | | | | 4,737 | | |
| Chubb Corp. | | | 26,300 | | | | 2,445 | | |
| Loews Corp. | | | 36,600 | | | | 3,403 | | |
| St. Paul Travelers Cos., Inc. (The) | | | 42,300 | | | | 1,905 | | |
| UnitedHealth Group, Inc. | | | 71,400 | | | | 4,133 | | |
| WellPoint, Inc. ‡ | | | 43,000 | | | | 3,211 | | |
| Manufacturing Industries (0.1%) | |
| Liberty Clobal Inc.–Series C ‡ | | | 13,460 | | | | 319 | | |
| Motion Pictures (3.9%) | |
| News Corp., Inc.–Class B † | | | 306,800 | | | | 4,620 | | |
| Time Warner, Inc. | | | 192,300 | | | | 3,429 | | |
| Office Property (1.0%) | |
| Equity Office Properties Trust † | | | 64,200 | | | | 1,977 | | |
| Oil & Gas Extraction (9.0%) | |
| Burlington Resources, Inc. | | | 25,600 | | | | 1,849 | | |
| ENSCO International, Inc. | | | 95,200 | | | | 4,340 | | |
| GlobalSantaFe Corp. | | | 54,800 | | | | 2,441 | | |
| Halliburton Co. | | | 22,500 | | | | 1,330 | | |
| Nexen, Inc. | | | 16,100 | | | | 666 | | |
| Royal Dutch Shell PLC–Class A, ADR † | | | 35,000 | | | | 2,171 | | |
| Total SA, ADR † | | | 43,200 | | | | 5,444 | | |
| Paper & Allied Products (2.2%) | |
| Avery Dennison Corp. † | | | 39,500 | | | | 2,238 | | |
| Kimberly-Clark Corp. | | | 38,000 | | | | 2,160 | | |
| Personal Credit Institutions (2.3%) | |
| Capital One Financial Corp. | | | 60,200 | | | | 4,596 | | |
| Petroleum Refining (2.6%) | |
| Marathon Oil Corp. | | | 60,200 | | | | 3,622 | | |
| Suncor Energy, Inc. | | | 31,500 | | | | 1,689 | | |
| Pharmaceuticals (6.0%) | |
| Abbott Laboratories | | | 47,000 | | | | 2,023 | | |
| Johnson & Johnson | | | 37,300 | | | | 2,336 | | |
| Novartis AG, ADR | | | 57,300 | | | | 3,084 | | |
| Pfizer, Inc. | | | 90,100 | | | | 1,959 | | |
| Sanofi-Aventis, ADR | | | 70,200 | | | | 2,816 | | |
| Restaurants (1.5%) | |
| McDonald's Corp. | | | 97,400 | | | | 3,078 | | |
| Rubber & Misc. Plastic Products (1.0%) | |
| Newell Rubbermaid, Inc. | | | 89,500 | | | | 2,058 | | |
The notes to the financial statements are an integral part of this report.
Transamerica IDEX Mutual Funds
Annual Report 2005
4
TA IDEX Salomon Investors Value
SCHEDULE OF INVESTMENTS (continued)
At October 31, 2005
(all amounts except share amounts in thousands)
| | | Shares | | Value | |
| Savings Institutions (1.5%) | |
| Golden West Financial Corp. † | | | 51,900 | | | $ | 3,048 | | |
| Security & Commodity Brokers (5.3%) | |
| American Express Co. | | | 61,000 | | | | 3,036 | | |
| Goldman Sachs Group, Inc. (The) | | | 24,600 | | | | 3,109 | | |
| Merrill Lynch & Co., Inc. | | | 70,500 | | | | 4,564 | | |
| Telecommunications (6.9%) | |
| ALLTEL Corp. | | | 63,200 | | | | 3,909 | | |
| AT&T Corp. | | | 51,300 | | | | 1,015 | | |
| SBC Communications, Inc. | | | 123,100 | | | | 2,936 | | |
| Sprint Nextel Corp. | | | 267,713 | | | | 6,240 | | |
| Variety Stores (2.3%) | |
| Target Corp. | | | 35,100 | | | | 1,955 | | |
| Wal-Mart Stores, Inc. | | | 55,800 | | | | 2,640 | | |
| Total Common Stocks (cost: $184,594) | | | | | | | 197,084 | | |
| | | Principal | | Value | |
| SECURITY LENDING COLLATERAL (12.4%) | |
| Debt (11.5%) | |
| Bank Notes (0.7%) | |
Bank of America
| |
| 3.81%, due 06/07/2006 * | | $ | 708 | | | | 708 | | |
| 3.81%, due 08/10/2006 * | | | 702 | | | | 702 | | |
Credit Suisse First Boston Corp.
4.11%, due 03/10/2006 * | | | 141 | | | | 141 | | |
| Certificates Of Deposit (0.8%) | |
Canadian Imperial Bank of Commerce
4.07%, due 11/04/2005 * | | | 562 | | | | 562 | | |
Harris Trust & Savings Bank
3.80%, due 11/04/2005 * | | | 447 | | | | 447 | | |
Rabobank Nederland
4.03%, due 05/31/2006 * | | | 702 | | | | 702 | | |
| Commercial Paper (2.5%) | |
Ciesco LLC
4.00%, due 11/03/2005 | | | 702 | | | | 702 | | |
General Electric Capital Corp.
3.96%, due 12/05/2005 | | | 562 | | | | 562 | | |
Paradigm Funding LLC–144A
4.01%, due 11/07/2005 | | | 560 | | | | 560 | | |
Park Avenue Receivables Corp.–144A
4.03%, due 12/02/2005 | | | 556 | | | | 556 | | |
Preferred Receivables Corp.–144A
4.04%, due 12/05/2005 | | | 421 | | | | 421 | | |
Ranger Funding Co. LLC–144A
3.99%, due 11/15/2005 | | | 418 | | | | 418 | | |
Sheffield Receivables Corp.–144A
4.01%, due 11/08/2005 | | | 421 | | | | 421 | | |
| | | Principal | | Value | |
| Commercial Paper (continued) | |
Yorktown Capital LLC
| |
| 3.97%, due 11/09/2005 | | $ | 700 | | | $ | 700 | | |
| 3.93%, due 11/17/2005 | | | 698 | | | | 698 | | |
| Euro Dollar Overnight (2.7%) | |
Bank of Montreal
3.79%, due 11/01/2005 | | | 421 | | | | 421 | | |
Barclays
3.80%, due 11/04/2005 | | | 562 | | | | 562 | | |
BNP Paribas
3.83%, due 11/02/2005 | | | 843 | | | | 843 | | |
Deutsche Bank
3.80%, due 11/02/2005 | | | 1,405 | | | | 1,405 | | |
HSBC Banking/Holdings PLC
3.84%, due 11/07/2005 | | | 421 | | | | 421 | | |
Royal Bank of Scotland
3.76%, due 11/01/2005 | | | 562 | | | | 562 | | |
Svenska Handlesbanken
4.03%, due 11/01/2005 | | | 724 | | | | 724 | | |
UBS AG
3.80%, due 11/03/2005 | | | 562 | | | | 562 | | |
| Euro Dollar Terms (1.0%) | |
Royal Bank of Scotland
4.00%, due 12/12/2005 | | | 562 | | | | 562 | | |
UBS AG
4.02%, due 12/01/2005 | | | 562 | | | | 562 | | |
Wells Fargo
3.96%, due 11/14/2005 | | | 843 | | | | 843 | | |
| Promissory Notes (0.3%) | |
Goldman Sachs Group, Inc.
4.02%, due 12/28/2005 | | | 590 | | | | 590 | | |
| Repurchase Agreements (3.5%) †† | |
Credit Suisse First Boston Corp.
4.10%, dated 10/31/2005 to be repurchased
at $958 on 11/01/2005 | | | 957 | | | | 957 | | |
Goldman Sachs Group, Inc. (The)
4.10%, dated 10/31/2005 to be repurchased
at $2,388 on 11/01/2005 | | | 2,388 | | | | 2,388 | | |
Lehman Brothers, Inc. 4.10%,
dated 10/31/2005 to be repurchased at
$66 on 11/01/2005 | | | 66 | | | | 66 | | |
Merrill Lynch & Co. 4.10, dated 10/31/2005 to
be repurchased at $2,810 on 11/01/2005 | | | 2,810 | | | | 2,810 | | |
Morgan Stanley Dean Witter & Co.
4.17%, dated 10/31/2005 to be repurchased
at $842 on 11/01/2005 | | | 842 | | | | 842 | | |
The notes to the financial statements are an integral part of this report.
Transamerica IDEX Mutual Funds
Annual Report 2005
5
TA IDEX Salomon Investors Value
SCHEDULE OF INVESTMENTS (continued)
At October 31, 2005
(all amounts except share amounts in thousands)
| | | Shares | | Value | |
| Investment Companies (0.9%) | |
| Money Market Funds (0.9%) | |
American Beacon Fund
1-day yield of 3.81% | | | 605,709 | | | $ | 606 | | |
Barclays Global Investors Institutional
Money Market Fund
1-day yield of 3.92% | | | 561,915 | | | | 562 | | |
Goldman Sachs Financial Square
Prime Obligations Fund
1-day yield of 3.79% | | | 87,528 | | | | 88 | | |
Merrimac Cash Fund, Premium Class
1-day yield of 3.70% @ | | | 555,705 | | | | 556 | | |
| Total Security Lending Collateral (cost: $25,232) | | | | | | | 25,232 | | |
| Total Investment Securities (cost: $209,826) | | | | | | $ | 222,316 | | |
| SUMMARY: | |
| Investment securities, at value | | | 109.2 | % | | $ | 222,316 | | |
| Liabilities in excess of other assets | | | (9.2 | )% | | | (18,791 | ) | |
| Net assets | | | 100.0 | % | | $ | 203,525 | | |
NOTES TO SCHEDULE OF INVESTMENTS:
† At October 31, 2005, all or a portion of this security is on loan (see Note 1). The value at October 31, 2005, of all securities on loan is $24,380.
‡ Non-income producing.
* Floating or variable rate note. Rate is listed as of October 31, 2005.
†† Cash collateral for the Repurchase Agreements, valued at $7,205, that serve as collateral for securities lending are invested in corporate bonds with interest rates and maturity dates ranging from 0.00%–9.86% and 12/31/2005–11/15/2096, respectively.
@ Regulated investment company advised by Investors Bank and Trust Co. ("IBT"). IBT is also the accounting, custody and lending agent for the Fund.
DEFINITIONS:
144A 144A Securities are registered pursuant to Rule 144A of the Securities Act of 1933. These securities are deemed to be liquid for purposes of compliance limitations on holdings of illiquid securities and may be resold as transactions exempt from registration, normally to qualified institutional buyers. At October 31, 2005, these securities aggregated $2,376 or 1.2% of the net assets of the Fund.
ADR American Depositary Receipt
The notes to the financial statements are an integral part of this report.
Transamerica IDEX Mutual Funds
Annual Report 2005
6
TA IDEX Salomon Investors Value
STATEMENT OF ASSETS AND LIABILITIES
At October 31, 2005
(all amounts except per share amounts in thousands)
| Assets: | |
Investment securities, at value (cost: $209,826)
(including securities loaned of $24,380) | | $ | 222,316 | | |
| Cash | | | 5,976 | | |
| Receivables: | |
| Investment securities sold | | | 628 | | |
| Shares of beneficial interest sold | | | 23 | | |
| Interest | | | 17 | | |
| Dividends | | | 125 | | |
| Dividend reclaims receivable | | | 1 | | |
| Other | | | 9 | | |
| | | | 229,095 | | |
| Liabilities: | |
| Accounts payable and accrued liabilities: | |
| Shares of beneficial interest redeemed | | | 71 | | |
| Management and advisory fees | | | 135 | | |
| Distribution and service fees | | | 73 | | |
| Transfer agent fees | | | 13 | | |
| Administration fees | | | 3 | | |
| Payable for collateral for securities on loan | | | 25,232 | | |
| Other | | | 43 | | |
| | | | 25,570 | | |
| Net Assets | | $ | 203,525 | | |
| Net Assets Consist of: | |
Shares of beneficial interest, unlimited shares
authorized, no par value | | $ | 147,896 | | |
| Undistributed net investment income (loss) | | | (2 | ) | |
Undistributed net realized gain (loss) from investment
securities and foreign currency transactions | | | 43,144 | | |
| Net unrealized appreciation (depreciation) on: | |
| Investment securities | | | 12,489 | | |
Translation of assets and liabilites denominated
in foreign currencies | | | (2 | ) | |
| Net Assets | | $ | 203,525 | | |
| Net Assets by Class: | |
| Class A | | $ | 180,933 | | |
| Class B | | | 17,684 | | |
| Class C | | | 4,908 | | |
| Shares Outstanding: | |
| Class A | | | 12,772 | | |
| Class B | | | 1,312 | | |
| Class C | | | 366 | | |
| Net Asset Value Per Share: | |
| Class A | | $ | 14.17 | | |
| Class B | | | 13.48 | | |
| Class C | | | 13.43 | | |
| Maximum Offering Price Per Share (a): | |
| Class A | | $ | 14.99 | | |
(a) Includes the maximum selling commission (represented as a percentage of offering price) which is reduced on certain levels of sales as set forth in the Prospectus. Net asset value per share for Classes B and C shares represents offering price. The redemption price for Classes B and C shares equals net asset value less any applicable contingent deferred sales charge.
STATEMENT OF OPERATIONS
For the year ended October 31, 2005
(all amounts in thousands)
| Investment Income: | |
| Interest | | $ | 167 | | |
Dividends (net of withholding taxes on foreign
dividends of $96) | | | 6,903 | | |
| Income from loaned securities-net | | | 25 | | |
| | | | 7,095 | | |
| Expenses: | |
| Management and advisory fees | | | 2,395 | | |
| Distribution and service fees: | |
| Class A | | | 959 | | |
| Class B | | | 196 | | |
| Class C | | | 57 | | |
| Transfer agent fees: | |
| Class A | | | 72 | | |
| Class B | | | 63 | | |
| Class C | | | 20 | | |
| Printing and shareholder reports | | | 20 | | |
| Custody fees | | | 40 | | |
| Administration fees | | | 56 | | |
| Legal fees | | | 25 | | |
| Audit fees | | | 18 | | |
| Trustees fees | | | 18 | | |
| Registration fees: | |
| Class A | | | 30 | | |
| Class B | | | 12 | | |
| Class C | | | 10 | | |
| Other | | | 4 | | |
| Total expenses | | | 3,995 | | |
| Less: | |
| Reimbursement of class expenses: | |
| Class B | | | (8 | ) | |
| Class C | | | (10 | ) | |
| Total reimbursed expenses | | | (18 | ) | |
| Net expenses | | | 3,977 | | |
| Net Investment Income (Loss) | | | 3,118 | | |
| Net Realized Gain (Loss) from: | |
| Investment securities | | | 44,094 | | |
| Foreign currency transactions | | | 2 | | |
| | | | 44,096 | | |
Net Increase (Decrease) in Unrealized
Appreciation (Depreciation) on: | |
| Investment securities | | | (14,131 | ) | |
Translation of assets and liabilities denominated in
foreign currencies | | | (2 | ) | |
| | | | (14,133 | ) | |
Net Gain (Loss) on Investment Securities and
Foreign Currency Transactions | | | 29,963 | | |
Net Increase (Decrease) in Net Assets Resulting
from Operations | | $ | 33,081 | | |
The notes to the financial statements are an integral part of this report.
Transamerica IDEX Mutual Funds
Annual Report 2005
7
TA IDEX Salomon Investors Value
STATEMENTS OF CHANGES IN NET ASSETS
For the years ended
(all amounts in thousands)
| | | October 31,
2005 | | October 31,
2004 | |
| Increase (Decrease) In Net Assets From: | |
| Operations: | |
| Net investment income (loss) | | $ | 3,118 | | | $ | 2,595 | | |
Net realized gain (loss) from
investment securities and
foreign currency transactions | | | 44,096 | | | | 17,527 | | |
Net unrealized appreciation
(depreciation) on investment
securities and foreign currency
translation | | | (14,133 | ) | | | 5,314 | | |
| | | | 33,081 | | | | 25,436 | | |
| Distributions to Shareholders: | |
| From net investment income: | |
| Class A | | | (3,927 | ) | | | (2,368 | ) | |
| Class B | | | (57 | ) | | | (158 | ) | |
| Class C | | | (29 | ) | | | (10 | ) | |
| Class C2 | | | – | | | | (21 | ) | |
| Class M | | | – | | | | (17 | ) | |
| | | | (4,013 | ) | | | (2,574 | ) | |
| From net realized gains: | |
| Class A | | | (6,313 | ) | | | (8,881 | ) | |
| Class B | | | (331 | ) | | | (495 | ) | |
| Class C | | | (97 | ) | | | (37 | ) | |
| Class C2 | | | – | | | | (61 | ) | |
| Class M | | | – | | | | (50 | ) | |
| | | | (6,741 | ) | | | (9,524 | ) | |
| Capital Share Transactions: | |
| Proceeds from shares sold: | |
| Class A | | | 1,445 | | | | 154,680 | | |
| Class B | | | 1,578 | | | | 3,454 | | |
| Class C | | | 559 | | | | 1,228 | | |
| Class C2 | | | – | | | | 287 | | |
| Class M | | | – | | | | 254 | | |
| | | | 3,582 | | | | 159,903 | | |
Dividends and distributions
reinvested: | |
| Class A | | | 10,228 | | | | 11,237 | | |
| Class B | | | 370 | | | | 624 | | |
| Class C | | | 116 | | | | 43 | | |
| Class C2 | | | – | | | | 73 | | |
| Class M | | | – | | | | 65 | | |
| | | | 10,714 | | | | 12,042 | | |
| Cost of shares redeemed: | |
| Class A | | | (257,683 | ) | | | (6,237 | ) | |
| Class B | | | (5,210 | ) | | | (4,752 | ) | |
| Class C | | | (2,104 | ) | | | (814 | ) | |
| Class C2 | | | – | | | | (584 | ) | |
| Class M | | | – | | | | (626 | ) | |
| | | | (264,997 | ) | | | (13,013 | ) | |
| Class level exchanges: | |
| Class C | | | – | | | | 4,670 | | |
| Class C2 | | | – | | | | (2,688 | ) | |
| Class M | | | – | | | | (1,982 | ) | |
| | | | – | | | | – | | |
| | | October 31,
2005 | | October 31,
2004 | |
| Automatic conversions: | |
| Class A | | $ | 790 | | | $ | 48 | | |
| Class B | | | (790 | ) | | | (48 | ) | |
| | | | – | | | | – | | |
| | | | (250,701 | ) | | | 158,932 | | |
| Net increase (decrease) in net assets | | | (228,374 | ) | | | 172,270 | | |
| Net Assets: | |
| Beginning of year | | | 431,899 | | | | 259,629 | | |
| End of year | | $ | 203,525 | | | $ | 431,899 | | |
Undistributed Net Investment Income
(Loss) | | $ | (2 | ) | | $ | 721 | | |
| Share Activity: | |
| Shares issued: | |
| Class A | | | 104 | | | | 11,405 | | |
| Class B | | | 120 | | | | 270 | | |
| Class C | | | 43 | | | | 97 | | |
| Class C2 | | | – | | | | 22 | | |
| Class M | | | – | | | | 19 | | |
| | | | 267 | | | | 11,813 | | |
Shares issued–reinvested from
distributions: | |
| Class A | | | 733 | | | | 858 | | |
| Class B | | | 28 | | | | 50 | | |
| Class C | | | 9 | | | | 3 | | |
| Class C2 | | | – | | | | 6 | | |
| Class M | | | – | | | | 5 | | |
| | | | 770 | | | | 922 | | |
| Shares redeemed: | |
| Class A | | | (18,606 | ) | | | (467 | ) | |
| Class B | | | (394 | ) | | | (375 | ) | |
| Class C | | | (160 | ) | | | (65 | ) | |
| Class C2 | | | – | | | | (45 | ) | |
| Class M | | | – | | | | (48 | ) | |
| | | | (19,160 | ) | | | (1,000 | ) | |
| Class level exchanges: | |
| Class C | | | – | | | | 373 | | |
| Class C2 | | | – | | | | (214 | ) | |
| Class M | | | – | | | | (157 | ) | |
| | | | – | | | | 2 | | |
| Automatic conversions: | |
| Class A | | | 57 | | | | 4 | | |
| Class B | | | (60 | ) | | | (4 | ) | |
| | | | (3 | ) | | | – | | |
Net increase (decrease) in shares
outstanding: | |
| Class A | | | (17,712 | ) | | | 11,800 | | |
| Class B | | | (306 | ) | | | (59 | ) | |
| Class C | | | (108 | ) | | | 408 | | |
| Class C2 | | | – | | | | (231 | ) | |
| Class M | | | – | | | | (181 | ) | |
| | | | (18,126 | ) | | | 11,737 | | |
The notes to the financial statements are an integral part of this report.
Transamerica IDEX Mutual Funds
Annual Report 2005
8
TA IDEX Salomon Investors Value
FINANCIAL HIGHLIGHTS
| | | | | For a share of beneficial interest outstanding throughout each period | |
| | | | | Net Asset | | Investment Operations | | Distributions | | Net Asset | |
| | | For the
Period
Ended (d)(g) | | Value,
Beginning
of Period | | Net
Investment
Income (Loss) | | Net Realized
and Unrealized
Gain (Loss) | | Total
Operations | | From Net
Investment
Income | | From Net
Realized
Gains | | Total
Distributions | | Value,
End
of Period | |
| Class A | | 10/31/2005 | | $ | 13.30 | | | $ | 0.16 | | | $ | 1.11 | | | $ | 1.27 | | | $ | (0.19 | ) | | $ | (0.21 | ) | | $ | (0.40 | ) | | $ | 14.17 | | |
| | | 10/31/2004 | | | 12.51 | | | | 0.10 | | | | 1.09 | | | | 1.19 | | | | (0.10 | ) | | | (0.30 | ) | | | (0.40 | ) | | | 13.30 | | |
| | | 10/31/2003 | | | 10.21 | | | | 0.08 | | | | 2.31 | | | | 2.39 | | | | (0.02 | ) | | | (0.07 | ) | | | (0.09 | ) | | | 12.51 | | |
| | | 10/31/2002 | | | 12.55 | | | | 0.04 | | | | (2.10 | ) | | | (2.06 | ) | | | – | | | | (0.28 | ) | | | (0.28 | ) | | | 10.21 | | |
| | | 10/31/2001 | | | 12.91 | | | | 0.07 | | | | (0.42 | ) | | | (0.35 | ) | | | – | | | | (0.01 | ) | | | (0.01 | ) | | | 12.55 | | |
| Class B | | 10/31/2005 | | | 12.65 | | | | – | (h) | | | 1.08 | | | | 1.08 | | | | (0.04 | ) | | | (0.21 | ) | | | (0.25 | ) | | | 13.48 | | |
| | | 10/31/2004 | | | 11.99 | | | | 0.01 | | | | 1.05 | | | | 1.06 | | | | (0.10 | ) | | | (0.30 | ) | | | (0.40 | ) | | | 12.65 | | |
| | | 10/31/2003 | | | 9.84 | | | | 0.01 | | | | 2.23 | | | | 2.24 | | | | (0.02 | ) | | | (0.07 | ) | | | (0.09 | ) | | | 11.99 | | |
| | | 10/31/2002 | | | 12.19 | | | | (0.01 | ) | | | (2.06 | ) | | | (2.07 | ) | | | – | | | | (0.28 | ) | | | (0.28 | ) | | | 9.84 | | |
| | | 10/31/2001 | | | 12.61 | | | | (0.02 | ) | | | (0.39 | ) | | | (0.41 | ) | | | – | | | | (0.01 | ) | | | (0.01 | ) | | | 12.19 | | |
| Class C | | 10/31/2005 | | | 12.62 | | | | – | (h) | | | 1.08 | | | | 1.08 | | | | (0.06 | ) | | | (0.21 | ) | | | (0.27 | ) | | | 13.43 | | |
| | | 10/31/2004 | | | 11.99 | | | | (0.05 | ) | | | 1.08 | | | | 1.03 | | | | (0.10 | ) | | | (0.30 | ) | | | (0.40 | ) | | | 12.62 | | |
| | | 10/31/2003 | | | 9.77 | | | | 0.01 | | | | 2.30 | | | | 2.31 | | | | (0.02 | ) | | | (0.07 | ) | | | (0.09 | ) | | | 11.99 | | |
| | | | | | | Ratios/Supplemental Data | |
| | | For the
Period | | Total | | Net Assets,
End of
Period | | Ratio of Expenses
to Average
Net Assets (a) | | Net Investment
Income (Loss)
to Average | | Portfolio
Turnover | |
| | | Ended (g) | | Return (c) | | (000's) | | Net (e) | | Total (f) | | Net Assets (a) | | Rate (b) | |
| Class A | | 10/31/2005 | | | 9.60 | % | | $ | 180,933 | | | | 1.25 | % | | | 1.25 | % | | | 1.14 | % | | | 47 | % | |
| | | 10/31/2004 | | | 9.52 | | | | 405,455 | | | | 1.25 | | | | 1.25 | | | | 0.72 | | | | 33 | | |
| | | 10/31/2003 | | | 23.57 | | | | 233,779 | | | | 1.42 | | | | 1.42 | | | | 0.71 | | | | 32 | | |
| | | 10/31/2002 | | | (16.90 | ) | | | 46,960 | | | | 1.55 | | | | 1.91 | | | | 0.56 | | | | 101 | | |
| | | 10/31/2001 | | | (2.68 | ) | | | 12,176 | | | | 1.55 | | | | 1.93 | | | | 0.48 | | | | 29 | | |
| Class B | | 10/31/2005 | | | 8.53 | | | | 17,684 | | | | 2.20 | | | | 2.24 | | | | 0.02 | | | | 47 | | |
| | | 10/31/2004 | | | 8.82 | | | | 20,463 | | | | 1.86 | | | | 1.86 | | | | 0.11 | | | | 33 | | |
| | | 10/31/2003 | | | 22.93 | | | | 20,102 | | | | 2.07 | | | | 2.07 | | | | 0.06 | | | | 32 | | |
| | | 10/31/2002 | | | (17.47 | ) | | | 16,980 | | | | 2.20 | | | | 2.56 | | | | (0.09 | ) | | | 101 | | |
| | | 10/31/2001 | | | (3.31 | ) | | | 20,034 | | | | 2.20 | | | | 2.58 | | | | (0.17 | ) | | | 29 | | |
| Class C | | 10/31/2005 | | | 8.57 | | | | 4,908 | | | | 2.20 | | | | 2.38 | | | | 0.03 | | | | 47 | | |
| | | 10/31/2004 | | | 8.62 | | | | 5,981 | | | | 2.20 | | | | 2.30 | | | | (0.37 | ) | | | 33 | | |
| | | 10/31/2003 | | | 23.81 | | | | 797 | | | | 2.07 | | | | 2.07 | | | | 0.05 | | | | 32 | | |
NOTES TO FINANCIAL HIGHLIGHTS
(a) Annualized.
(b) Not annualized.
(c) Total Return has been calculated for the applicable period without deduction of a sales load, if any, on an initial purchase. Periods of less than one year are not annualized.
(d) Per share information is calculated based on average number of shares outstanding.
(e) Ratio of Net Expenses to Average Net Assets is net of fee waivers and reimbursements by the investment adviser, if any (see note 2).
(f) Ratio of Total Expenses to Average Net Assets includes all expenses before fee waivers and reimbursements by the investment adviser.
(g) The inception date for the Fund's offering of share Class C was November 11, 2002.
(h) Rounds to less than $0.01.
The notes to the financial statements are an integral part of this report.
Transamerica IDEX Mutual Funds
Annual Report 2005
9
TA IDEX Salomon Investors Value
NOTES TO FINANCIAL STATEMENTS
At October 31, 2005
(all amounts in thousands)
NOTE 1. ORGANIZATION AND SIGNIFICANT ACCOUNTING POLICIES
Transamerica IDEX Mutual Funds is an open-end management investment company registered under the Investment Company Act of 1940, as amended (the "1940 Act").
In the normal course of business, TA IDEX Salomon Investors Value (the "Fund") enters into contracts that contain a variety of representations that provide general indemnifications. The Fund's maximum exposure under these arrangements is unknown, as this would involve future claims that may be made against the Fund and/or its affiliates that have not yet occurred. However, based on experience, the Fund expects the risk of loss to be remote.
This report should be read in conjunction with the current Fund prospectus, which contains more complete information about the Fund.
The following is a summary of significant accounting policies followed by the Fund in the preparation of the financial statements. In preparing the Fund's financial statements in accordance with accounting principles generally accepted in the United States of America ("GAAP"), estimates or assumptions (which could differ from actual results) may be used that affect reported amounts and disclosures.
Multiple class operations, income and expenses: The Fund currently offers three classes of shares, each with a public offering price that reflects different sales charges, if any, and expense levels. On June 15, 2004, Class C2 shares merged into Class C. On September 24, 2004, Class M shares merged into Class C. Class B shares will convert to Class A shares eight years after purchase. Income, non-class specific expenses and realized and unrealized gains and losses, are allocated daily to each class, based upon the value of shares outstanding method as permitted under Rule 18f-3 of the 1940 Act. Each class bears its own specific expenses as well as a portion of general, common expenses.
Security valuations: The Fund values its investments at the close of the New York Stock Exchange ("NYSE"), normally 4 p.m. ET, each day the NYSE is open for business. Fund investments are valued at the last sale price or closing price on the day of valuation taken from the primary exchange where the security is principally traded.
Securities traded in the over-the-counter market and listed securities for which no sale was reported on that date are valued at the last quoted bid price.
Debt securities are valued based on a price quotation or other equivalent indication of value supplied by an exchange, a pricing service or a major market maker.
Investment company securities are valued at the net asset value of the underlying portfolio.
Other securities for which quotations are not readily available or whose values have been determined to be unreliable are valued at fair market value as determined in good faith by the Fund's Administrative Valuation Committee, under the supervision of the Board's Valuation Committee, using guidelines adopted by the Board of Trustees.
Cash: The Fund may leave cash overnight in its cash account with the custodian, Investors Bank & Trust Company ("IBT"). IBT has been contracted on behalf of the Fund to invest the excess cash into a savings account, which at October 31, 2005, was paying an interest rate of 2.76%.
Repurchase agreements: The Fund is authorized to enter into repurchase agreements. The Fund, through its custodian, Investors Bank & Trust Company ("IBT"), receives delivery of the underlying securities, the value of which at the time of purchase is required to be an amount equal to at least 100% of the resale price. The Fund will bear the risk of value fluctuations until the security can be sold and may encounter delays and incur costs in liquidating the security. In the event of bankruptcy or insolvency of the seller, delays and costs may be incurred.
Commission recapture: The sub-adviser, to the extent consistent with the best execution and usual commission rate policies and practices, may place security transactions of the Fund with broker/dealers with which Transamerica IDEX Mutual Funds has established a Commission Recapture Program. A Commission Recapture Program is any arrangement under which a broker/dealer applies a portion of the commissions received by such broker/dealer on the security transactions to the Fund. In no event will commissions paid by the Fund be used to pay expenses that would otherwise be borne by any other funds within Transamerica IDEX Mutual Funds, or by any other party.
Recaptured commissions during the year ended October 31, 2005, of less than $114 are included in net realized gains in the Statement of Operations.
Securities lending: The Fund may lend securities to qualified borrowers, with IBT acting as the Fund's lending agent. The Fund earns negotiated lenders' fees. The Fund receives cash and/or securities as collateral against the loaned securities. Cash collateral received is invested in short term, interest bearing securities. The Fund monitors the market value of securities loaned on a daily basis and requires collateral in an amount at least equal to the value of the securities loaned. Income from loaned securities on the Statement of Operations is net of fees, in the amount of $11, earned by IBT for its services.
Real Estate Investment Trusts ("REITs"): There are certain additional risks involved in investing in REITs. These include, but are not limited to, economic conditions, changes in zoning laws, real estate values, property taxes and interest rates.
Dividend income is recorded at management's estimate of the income included in distributions from the REIT investments. Distributions received in excess of the estimated amount are recorded as a reduction of the cost of investments. The actual amounts of income, return of capital and capital gains are only determined by each REIT after the fiscal year end and may differ from the estimated amounts.
Transamerica IDEX Mutual Funds
Annual Report 2005
10
TA IDEX Salomon Investors Value
NOTES TO FINANCIAL STATEMENTS (continued)
At October 31, 2005
(all amounts in thousands)
NOTE 1.–(continued)
Security transactions and investment income: Security transactions are recorded on the trade date. Security gains and losses are calculated on the specific identification basis. Dividend income, if any, is recorded on the ex-dividend date or, in the case of foreign securities, as soon as the Fund is informed of the ex-dividend date. Interest income, including accretion of discounts and amortization of premiums, is recorded on the accrual basis commencing on the settlement date.
Redemption fees: A short-term trading redemption fee may be assessed on any Fund shares in a fund account that are sold during the first five (5) NYSE trading days following their purchase date. This redemption fee will equal 2% of the amount redeemed and shares held the longest will be treated as being redeemed first and shares held the shortest as being redeemed last. For the year ended October 31, 2005, the Fund received less than $1 in redemption fees.
Dividend distributions: Distributions to shareholders are recorded on the ex-dividend date and are determined in accordance with Federal income tax regulations which may differ from GAAP.
NOTE 2. RELATED PARTY TRANSACTIONS
Effective January 1, 2005 AEGON/Transamerica Fund Advisors, Inc. was renamed Transamerica Fund Advisors, Inc. ("TFAI"); AEGON/Transamerica Fund Services, Inc. and AEGON/Transamerica Investor Services, Inc. merged into one entity and was renamed Transamerica Fund Services, Inc. ("TFS").
TFAI is the Fund's investment adviser. TFS is the Fund's administrator and transfer agent. AFSG Securities Corp. ("AFSG") is the Fund's distributor/principal underwriter. TFAI, TFS , and AFSG are affiliates of AEGON, NV, a Netherlands corporation.
The following schedule represents the percentage of Fund assets owned by affiliated mutual funds:
| | | Net
Assets | | % of
Net Assets | |
TA IDEX Asset Allocation–
Conservative Portfolio | | $ | 4,526 | | | | 2.22 | % | |
TA IDEX Asset Allocation–
Growth Portfolio | | | 38,316 | | | | 18.83 | % | |
TA IDEX Asset Allocation–
Moderate Growth Portfolio | | | 77,554 | | | | 38.11 | % | |
TA IDEX Asset Allocation–
Moderate Portfolio | | | 48,507 | | | | 23.83 | % | |
| Total | | $ | 168,903 | | | | 82.99 | % | |
Investment advisory fees: The Fund pays management fees to TFAI based on average daily net assets ("ANA") at the following breakpoints:
0.80% of the first $500 million of ANA
0.70% of ANA over $500 million
TFAI has contractually agreed to waive its advisory fee and will reimburse the Fund to the extent that operating expenses, excluding 12b-1 fees, exceed the following stated annual limit:
1.20% Expense Limit
If total Fund expenses fall below the annual expense limitation agreement agreed to by the adviser within the succeeding three years, the Fund may be required to pay that adviser a portion or all of the reimbursed class expenses.
| | | Reimbursement
of Class
Expenses | | Available for
Recapture Through | |
| Fiscal Year 2005 | |
| Class B | | $ | 8 | | | 10/31/2008 | |
| Class C | | | 10 | | | 10/31/2008 | |
There were no amounts recaptured during the year ended October 31, 2005.
Distribution and service fees: The Fund has a 12b-1 distribution plan under the 1940 Act pursuant to which an annual fee, based on average daily net assets, is paid to the distributor for various disbursements such as broker-dealer account servicing fees and other promotional expenses of the Fund. The Fund is authorized under the 12b-1 plan to pay fees on each class up to the following limits:
| Class A | | | 0.35 | % | |
| Class B | | | 1.00 | % | |
| Class C | | | 1.00 | % | |
In the case the Fund or a class of shares of the Fund is closed to new investors or investments, the Fund is authorized to pay 12b-1 fees for past sales and distribution efforts and present and past investor services.
Underwriter commissions relate to front-end sales charges imposed for Class A shares and contingent deferred sales charges from Classes B, C, and certain A share redemptions. For the year ended October 31, 2005, the underwriter commissions were as follows:
| Received by Underwriter | | $ | 76 | | |
| Retained by Underwriter | | | 4 | | |
| Contingent Deferred Sales Charge | | | 35 | | |
Administrative services: The Fund has entered into an agreement with TFS for financial and legal fund administration services. As of January 1, 2005 the Fund pays TFS an annual fee of 0.02% of ANA. Prior to January 1, 2005 the Fund paid TFS an annual fee of 0.015% of ANA. The Legal fees on the Statement of Operations are for fees paid to external legal counsel.
Transamerica IDEX Mutual Funds
Annual Report 2005
11
TA IDEX Salomon Investors Value
NOTES TO FINANCIAL STATEMENTS (continued)
At October 31, 2005
(all amounts in thousands)
NOTE 2.–(continued)
Transfer agent fees: The Fund pays TFS an annual per-account charge for each open and closed account. The Fund paid TFS $148 for the year ended October 31, 2005.
Deferred compensation plan: Each eligible independent Fund Trustee may elect to participate in a non-qualified deferred compensation plan maintained by Transamerica IDEX Mutual Funds (the "Plan"). Under the Plan, such Trustees may defer payment of all or a portion of their total fees earned as a Fund Trustee. Each Trustee who is a participant in the Plan may elect that the earnings, losses or gains credited to his or her deferred fee amounts be determined based on a deemed investment in any series of Transamerica IDEX Mutual Funds, including the Fund. The right of a participant to receive a distribution from the Plan of the deferred fees is an unsecured claim against the general assets of all series of Transamerica IDEX Mutual Funds. The pro rata liability to the Fund of all deferred fees in the Plan amounted, as of October 31, 2005, to $9.
Brokerage commissions: Brokerage commissions incurred on security transactions placed with an affiliate of the adviser for the year ended October 31, 2005, were $23.
NOTE 3. INVESTMENT TRANSACTIONS
The cost of securities purchased and proceeds from securities sold (excluding short-term securities) for the year ended October 31, 2005, were as follows:
| Purchases of securities: | |
| Long-Term | | $ | 137,437 | | |
| U.S. Government | | | – | | |
| Proceeds from maturities and sales of securities: | |
| Long-Term | | | 398,255 | | |
| U.S. Government | | | – | | |
NOTE 4. FEDERAL INCOME TAX MATTERS
The Fund has not made any provision for federal income or excise taxes due to its policy to distribute all of its taxable income and capital gains to its shareholders and otherwise qualify as a regulated investment company under Subchapter M of the Internal Revenue Code. Income and capital gain distributions are determined in accordance with income tax regulations, which may differ from GAAP. These differences are primarily due to differing treatment for items including, but not limited to, wash sales, distribution reclassifications and foreign currency transactions.
Therefore, distributions determined in accordance with tax regulations may differ significantly in amount or character from net investment income and realized gains for financial reporting purposes. Financial reporting records are adjusted for permanent book/tax differences to reflect tax character. Financial records are not adjusted for temporary differences. These reclassifications are as follows:
Shares of beneficial interest, unlimited
shares authorized | | $ | 5 | | |
| Undistributed net investment income (loss) | | | 172 | | |
Undistributed net realized gain (loss) from investment
securities | | $ | (177 | ) | |
The tax character of distributions paid may differ from the character of distributions shown in the Statement of Changes in Net Assets due to short-term gains being treated as ordinary income for tax purposes. The tax character of distributions paid during 2004 and 2005 was as follows:
| 2004 Distributions paid from: | |
| Ordinary Income | | $ | 6,640 | | |
| Long-term capital gain | | | 5,458 | | |
| 2005 Distributions paid from: | |
| Ordinary Income | | | 4,839 | | |
| Long-term capital gain | | | 5,915 | | |
The tax basis components of distributable earnings as of October 31, 2005, are as follows:
| Undistributed Ordinary Income | | $ | 6,874 | | |
| Undistributed Long-term Capital Gains | | $ | 37,197 | | |
| Capital Loss Carryforward | | $ | – | | |
| Net Unrealized Appreciation (Depreciation) | | $ | 11,558 | * | |
* Amount includes unrealized appreciation (depreciation) from foreign currency and deferred compensation.
The aggregate cost of investments and composition of unrealized appreciation (depreciation) for federal income tax purposes as of October 31, 2005, are as follows:
| Federal Tax Cost Basis | | $ | 210,755 | | |
| Unrealized Appreciation | | $ | 17,174 | | |
| Unrealized (Depreciation) | | | (5,613 | ) | |
| Net Unrealized Appreciation (Depreciation) | | $ | 11,561 | | |
NOTE 5. REGULATORY PROCEEDINGS
There continues to be significant federal and state regulatory activity relating to financial services companies, particularly mutual fund companies and their investment advisers. As part of an ongoing investigation regarding potential market timing, recordkeeping and trading compliance issues and matters affecting the Fund's investment adviser, TFAI, and certain affiliates and former employees of TFAI, the SEC staff has indicated that it is likely to take some action against TFAI and certain of its affiliates at the conclusion of the investigation. The potential timing and the scope of any such action is difficult to predict. Although the impact of any action brought against TFAI and/or its affiliates is difficult to assess at the present time, the Fund currently believes that the likelihood that any such action will have a material adverse impact on it is remote. It is important to note that the Fund is not aware of any allega tion of wrongdoing against it and its Board at the time this annual report is printed. Although it is not anticipated that these developments will have an adverse impact on the Fund, there can be no assurance at this time. TFAI and its affiliates are actively working with the SEC in regard to this matter; however, the exact resolution cannot be determined at this time. TFAI will take such actions that it deems necessary or appropriate to continue providing management services to the Fund and to bring all matters to an appropriate conclusion.
TFAI and/or its affiliates, and not the Fund, will bear the costs regarding these regulatory matters.
Transamerica IDEX Mutual Funds
Annual Report 2005
12
Report of Independent Registered Certified Public Accounting Firm
To the Board of Trustees and Shareholders of
TA IDEX Salomon Investors Value
In our opinion, the accompanying statement of assets and liabilities, including the schedule of investments, and the related statements of operations and of changes in net assets and the financial highlights present fairly, in all material respects, the financial position of TA IDEX Salomon Investors Value (the "Fund") (one of the portfolios constituting the Transamerica IDEX Mutual Funds) at October 31, 2005, the results of its operations for the year then ended, the changes in its net assets for each of the two years in the period then ended and the financial highlights for each of the periods presented, in conformity with accounting principles generally accepted in the United States of America. These financial statements and financial highlights (hereafter referred to as "financial statements") are the responsibility of the Fund's management; our responsibility is to express an opinion on these financial statements based on o ur audits. We conducted our audits of these financial statements in accordance with the standards of the Public Company Accounting Oversight Board (United States). Those standards require that we plan and perform the audit to obtain reasonable assurance about whether the financial statements are free of material misstatement. An audit includes examining, on a test basis, evidence supporting the amounts and disclosures in the financial statements, assessing the accounting principles used and significant estimates made by management, and evaluating the overall financial statement presentation. We believe that our audits, which included confirmation of securities at October 31, 2005 by correspondence with the custodian and brokers, provide a reasonable basis for our opinion.

December 22, 2005
Transamerica IDEX Mutual Funds
Annual Report 2005
13
TA IDEX Salomon Investors Value
SUPPLEMENTAL INFORMATION (unaudited)
TAX INFORMATION
For dividends paid during the year ended October 31, 2005, the Fund designated $6,482 as qualified dividend income.
For corporate shareholders, 56% of investment income (dividend income plus short-term gains, if any) qualifies for the dividends received deduction.
For tax purposes, the Fund has made a Long-Term Capital Gain Designation of $5,914 for the year ended October 31, 2005.
The information and distributions reported herein may differ from the information and distributions taxable to the shareholders for the calendar year ending December 31, 2005. Complete information will be computed and reported in conjunction with your 2005 Form 1099-DIV.
Transamerica IDEX Mutual Funds
Annual Report 2005
14
TA IDEX T. Rowe Price Health Sciences
MARKET ENVIRONMENT
Stocks generally moved higher over the last twelve months. However, concerns about the pace of economic growth amid surging oil prices (which briefly reached $70 per barrel in September) and rising short-term interest rates limited their gains. All healthcare industries delivered strong positive returns other than pharmaceuticals. Healthcare services stocks, which benefited from moderating cost trends and consolidation, gained the most. The pharmaceutical industry was pressured on several fronts, as possible increased regulatory burdens, the imbalance between patent expirations for currently marketed remedies and important new drugs coming onto the market, and the threat of generic competition weighed on the group.
PERFORMANCE
For the year ended October 31, 2005, TA IDEX T. Rowe Price Health Sciences, Class A returned 15.69%. By comparison its benchmark, the Standard and Poor's 500 Composite Stock Index ("S&P 500"), returned 8.71%.
STRATEGY REVIEW
We believe that superior long-term capital appreciation can be achieved by investing in health care companies that have the strongest ability to develop and market new products that will improve the practice of medicine and satisfy unmet medical needs.
Key elements to long-term success in health care investing include maintaining a balanced portfolio of companies in the major health care industries, such as pharmaceuticals, biotechnology, medical products and devices, and health care services; emphasizing therapeutic-based companies; and, all else being equal, holding smaller rather than larger companies. We believe that smaller firms provide investors with the best opportunities to benefit from successful new products.
Although the portfolio outperformed its benchmark, the S&P 500, for the twelve months ended October 31, 2005, it slightly underperformed its Lipper peer group. The benefits from our sector allocation decisions, especially our pharmaceuticals underweight, were more than offset by the negative impact of our weak stock selection.
Our underweight in poorly performing pharmaceutical shares was helpful. The benefits from our Roche Holding AG ("Roche") overweight and our Pfizer Inc. underweight were offset by the negative contribution from our heavier exposure in Elan Corporation, plc (which develops and markets pharmaceuticals and their delivery technology) and our allocation in Johnson & Johnson. Roche reported very strong first-half earnings, driven by solid pharmaceutical business results and Genentech, Inc. ("Genentech")-related income. On February 28, 2005, Elan and Biogen Idec voluntarily suspended marketing of their recently approved multiple sclerosis drug Tysabri, which was thought to have multibillion dollar sales potential. The drug was linked to a very rare and potentially fatal disease that affects the central nervous system.
In life sciences, strong stock selection and our average overweight added value. Dade Behring Holdings, Inc. (manufacture and distribution of diagnostic products and services) and Gen-Probe Incorporated (products for clinical disease diagnosis and for screening donated human blood) aided performance, but our overweight in Affymetrix, Inc. (manufacturing, sale, and servicing of systems for genetic analysis) detracted.
Our group overweight in biotechnology stocks was harmful. The group has performed better recently, benefiting from strong trial results and acquisition announcements. Gilead Sciences, Inc. ("Gilead") (therapeutics for infectious diseases), ViroPharma Incorporated (drugs for viral diseases), Amylin Pharmaceuticals, Inc. (therapeutics for diabetes, obesity, and cardiovascular disease), and Cubist Pharmaceuticals, Inc. (anti-infective products) added value. Gilead benefited from strong sales of its HIV medicines Viread, Emtriva, and Truvada, a fixed-dose combination of Viread and Emtriva that was launched in August 2004.
On the other hand, our heavier exposure in ImClone Systems Inc. (therapeutic products for the treatment of cancer), OSI Pharmaceuticals, Inc. (maker of oncology products), and Eyetech Pharmaceuticals, Inc. ("Eyetech") (medicines for eye diseases) hampered performance. Eyetech's shares fell more than 40% after test results indicated that the company's age-related macular degeneration drug, Macugen, would be less effective than Genentech's competing experimental drug, Lucentis.
The negative contribution from our underweight in the best-performing healthcare services sector more than offset the positive effect of our strong stock selection. Our exposure in WellPoint, Inc. ("Wellpoint") added value, but our avoidance of strong-performing benchmark holding PacifiCare Health Systems, Inc. detracted. In the first full quarter after WellPoint completed its merger with Anthem, Inc., stronger-than-expected enrollment helped the company's earnings exceed expectations.
Finally, our underweight in healthcare products and devices was beneficial, as the sector gained – but lagged others. We were hurt by our allocations in Greatbatch, Inc. and STAAR Surgical Company. Both companies were eliminated from the portfolio. Our underweight in Boston Scientific Corporation and our overweights in Aspect Medical Systems, Inc. and Guidant Corporation aided returns.
Kris H. Jenner
Fund Manager
T. Rowe Price Associates, Inc.
Transamerica IDEX Mutual Funds
Annual Report 2005
1
TA IDEX T. Rowe Price Health Sciences
Comparison of change in value of $10,000 investment in Class A shares and its comparative index.
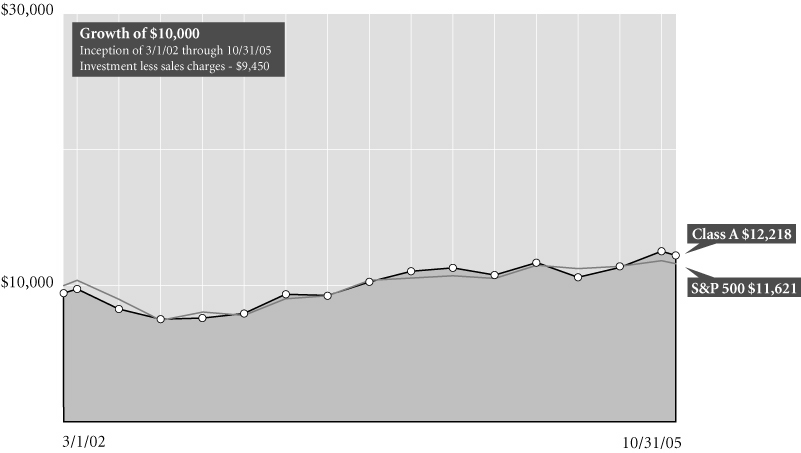
Average Annual Total Return for Periods Ended 10/31/05
| | | 1 year | | From
Inception | | Inception
Date | |
| Class A (NAV) | | | 15.69 | % | | | 7.24 | % | | 3/1/02 | |
| Class A (POP) | | | 9.33 | % | | | 5.60 | % | | 3/1/02 | |
| S&P 5001 | | | 8.71 | % | | | 4.18 | % | | 3/1/02 | |
| Class B (NAV) | | | 14.45 | % | | | 6.45 | % | | 3/1/02 | |
| Class B (POP) | | | 9.45 | % | | | 5.99 | % | | 3/1/02 | |
| Class C (NAV) | | | 14.44 | % | | | 15.87 | % | | 11/11/02 | |
| Class C (POP) | | | 13.44 | % | | | 15.87 | % | | 11/11/02 | |
| Class I (NAV) | | | – | | | | 12.09 | % | | 11/8/04 | |
NOTES
1 The Standard and Poor's 500 Composite Stock (S&P 500) Index is an unmanaged index used as a general measure of market performance. Calculations assume dividends and capital gains are reinvested and do not include any managerial expenses. From inception calculation is based on life of Class A shares. Source: Standard & Poor's Micropal®© Micropal, Inc. 2005 – 1-800-596-5323 – http://www.funds-sp.com.
The performance data presented represents past performance, future results may vary. Performance data does not reflect the deduction of taxes that would be paid on fund distributions or the redemption of fund shares. Investment return and principal value will fluctuate so that an investor's shares, when redeemed, may be worth more or less than their original cost. Current performance may be lower or higher than performance quoted. Please see www.transamericaidex.com for performance data current to the most recent month-end.
Public Offering Price (POP) returns include the reinvestment of dividends and capital gains and reflect the maximum sales charge of 5.5% for A shares or the maximum applicable contingent deferred sales charge (5% in the 1st year, decreasing to 0% after 6 years) for Class B shares and 1% (during the first 12 months) for Class C shares. Shares purchased prior to March 1, 2004 are subject to a maximum applicable contingent deferred sales charge (5% in the 1st year, decreasing to 0% after 7 years) for Class B shares and (2% in the 1st year, decreasing to 0% after 2 years) for Class C shares. Net Asset Value (NAV) returns include the reinvestment of dividends and capital gains but do not reflect any sales charges.
The Fund is non-diversified. Investments in a "non-diversified" fund and sector funds may be subject to specific risks such as susceptibility to single economic, political, or regulatory events, and may be subject to greater loss than investments in a diversified fund.
This material must be preceded or accompanied by a current prospectus, which includes specific contents regarding the investment objectives and policies of this fund.
Transamerica IDEX Mutual Funds
Annual Report 2005
2
TA IDEX T. Rowe Price Health Sciences
UNDERSTANDING YOUR FUND'S EXPENSES
(unaudited)
SHAREHOLDER EXPENSES
Fund shareholders may incur two types of costs: (1) transaction costs, including sales charges (loads) on purchases, contingent deferred sales charges on redemptions and redemption fees; and (2) ongoing costs, including management fees, 12b-1 distribution and service fees, and other fund expenses.
The following Example is intended to help you understand your ongoing costs (in dollars and cents) of investing in a Fund and to compare these costs with the ongoing costs of investing in other funds.
The Example is based on an investment of $1,000 invested at May 1, 2005 and held for the entire period until October 31, 2005.
ACTUAL EXPENSES
The first line in the table below provides information about actual account values and actual expenses. You may use the information in this line, together with the amount you invested, to estimate the expenses that you paid over the period. Simply divide your account value by $1,000 (for example, an $8,600 account value divided by $1,000 = 8.6), then multiply the result by the number in the first line of your Fund under the heading entitled "Expenses Paid During Period" to estimate the expenses you paid on your account during this period. If your account is an IRA, your expenses could have included a $15 annual fee. The amount of any fee paid through your account would increase the estimate of expenses you paid during the period and decrease your ending account value.
HYPOTHETICAL EXAMPLE FOR COMPARISON PURPOSES
The second line in the table below provides information about hypothetical account values and hypothetical expenses based on the Fund's actual expense ratio and an assumed rate of return of 5% per year before expenses, which is not the Fund's actual return. The hypothetical account values and expenses may not be used to estimate the actual ending account balance or expenses you paid for the period. You may use this information to compare the ongoing costs of investing in your Fund and other funds. To do so, compare this 5% hypothetical example with the 5% hypothetical examples that appear in the shareholder reports of the other funds. As in the case of the actual expense example, if your account is subject to an IRA fee, the amount of the fee paid through your account would increase the hypothetical expenses you would have paid during the period and decrease the hypothetical ending account value.
Please note that the expenses shown in the table are meant to highlight your ongoing costs only and do not reflect any transactional costs, such as sales charges, redemption fees, brokerage commissions paid on purchases and sales of fund shares. Therefore, the second line under the Fund in the table is useful in comparing ongoing costs only, and will not help you determine the relative total costs of owning different funds. If any of these transaction costs were included, your costs would be higher. The expenses shown in the table do not reflect any fees that may be charged to you by brokers, financial intermediaries or other financial institutions.
| | | Beginning
Account
Value | | Ending
Account
Value | | Annualized
Expense
Ratio | | Expenses Paid
During Period (a) | |
| Class A | |
| Actual | | $ | 1,000.00 | | | $ | 1,135.00 | | | | 1.45 | % | | $ | 7.80 | | |
| Hypothetical (b) | | | 1,000.00 | | | | 1,017.90 | | | | 1.45 | | | | 7.37 | | |
| Class B | |
| Actual | | | 1,000.00 | | | | 1,128.70 | | | | 2.68 | | | | 14.38 | | |
| Hypothetical (b) | | | 1,000.00 | | | | 1,011.70 | | | | 2.68 | | | | 13.59 | | |
| Class C | |
| Actual | | | 1,000.00 | | | | 1,128.00 | | | | 2.60 | | | | 13.95 | | |
| Hypothetical (b) | | | 1,000.00 | | | | 1,012.10 | | | | 2.60 | | | | 13.19 | | |
| Class I | |
| Actual | | | 1,000.00 | | | | 1,137.10 | | | | 1.07 | | | | 5.76 | | |
| Hypothetical (b) | | | 1,000.00 | | | | 1,019.81 | | | | 1.07 | | | | 5.45 | | |
(a) Expenses are calculated using each Fund's annualized expense ratio (as disclosed in the table), multiplied by the average account value for the period, multiplied by number of days in the period (184 days), and divided by the number of days in the year (365 days).
(b) 5% return per year before expenses.
GRAPHICAL PRESENTATION OF SCHEDULE OF INVESTMENTS
By Industry
At October 31, 2005
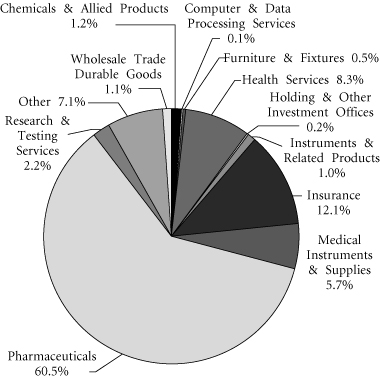
This chart shows the percentage breakdown by industry of the Fund's total investment securities.
Transamerica IDEX Mutual Funds
Annual Report 2005
3
TA IDEX T. Rowe Price Health Sciences
SCHEDULE OF INVESTMENTS
At October 31, 2005
(all amounts except share amounts in thousands)
| | | Shares | | Value | |
| CONVERTIBLE PREFERRED STOCKS (0.0%) | |
| Pharmaceuticals (0.0%) | |
| NeoRx Corp. ‡§m | | | 3 | | | $ | 6 | | |
| Total Convertible Preferred Stocks (cost: $30) | | | | | | | 6 | | |
| COMMON STOCKS (93.1%) | |
| Chemicals & Allied Products (1.2%) | |
| Monsanto Co. | | | 37,600 | | | | 2,369 | | |
| Solvay SA | | | 18,000 | | | | 2,095 | | |
| Computer & Data Processing Services (0.1%) | |
| WebMD Health Corp.–Class A ‡ | | | 15,100 | | | | 394 | | |
| Furniture & Fixtures (0.5%) | |
| Kinetic Concepts, Inc. ‡# | | | 51,100 | | | | 1,834 | | |
| Health Services (8.3%) | |
| Caremark Rx, Inc. ‡ | | | 63,889 | | | | 3,348 | | |
| Community Health Systems, Inc. ‡# | | | 162,000 | | | | 6,012 | | |
| Coventry Health Care, Inc. ‡ | | | 31,850 | | | | 1,720 | | |
| CryoLife, Inc. ‡ | | | 43,200 | | | | 282 | | |
| DaVita, Inc. ‡ | | | 108,800 | | | | 5,351 | | |
| Edwards Lifesciences Corp. ‡ | | | 56,200 | | | | 2,326 | | |
| Gentiva Health Services, Inc. ‡ | | | 10,400 | | | | 153 | | |
| HCA, Inc. | | | 7,200 | | | | 347 | | |
| Healthsouth Corp. ‡ | | | 150,100 | | | | 612 | | |
| Human Genome Sciences, Inc. ‡ | | | 58,400 | | | | 488 | | |
| Manor Care, Inc. | | | 10,900 | | | | 406 | | |
| Nektar Therapeutics ‡ | | | 45,300 | | | | 682 | | |
| Quest Diagnostics, Inc. | | | 64,200 | | | | 2,999 | | |
| Sunrise Senior Living, Inc. ‡ | | | 36,200 | | | | 1,171 | | |
| Symbion, Inc. ‡ | | | 55,331 | | | | 1,252 | | |
| Triad Hospitals, Inc. ‡# | | | 95,400 | | | | 3,924 | | |
| VistaCare, Inc.–Class A ‡ | | | 17,200 | | | | 198 | | |
| Holding & Other Investment Offices (0.2%) | |
| Ventas, Inc. REIT | | | 18,600 | | | | 570 | | |
| Instruments & Related Products (1.0%) | |
| Alcon, Inc. | | | 28,400 | | | | 3,774 | | |
| Insurance (12.1%) | |
| Aetna, Inc. | | | 31,900 | | | | 2,825 | | |
| Assurant, Inc. | | | 25,800 | | | | 986 | | |
| Cigna Corp. | | | 51,200 | | | | 5,933 | | |
| UnitedHealth Group, Inc. | | | 351,300 | | | | 20,337 | | |
| WellPoint, Inc. ‡ | | | 206,100 | | | | 15,392 | | |
| Medical Instruments & Supplies (5.8%) | |
| Aspect Medical Systems, Inc. ‡ | | | 36,400 | | | | 1,187 | | |
| Biomet, Inc. | | | 40,900 | | | | 1,425 | | |
| Boston Scientific Corp. ‡# | | | 83,700 | | | | 2,103 | | |
| Endologix, Inc. ‡ | | | 69,500 | | | | 328 | | |
| | | Shares | | Value | |
| Medical Instruments & Supplies (continued) | |
| Endologix, Inc., Private Placement ‡m | | | 19,700 | | | $ | 93 | | |
| Hologic, Inc. ‡ | | | 19,300 | | | | 1,070 | | |
| Integra LifeSciences Holdings Corp. ‡ | | | 18,800 | | | | 649 | | |
| Medtronic, Inc. | | | 38,870 | | | | 2,202 | | |
| Resmed, Inc. ‡ | | | 89,400 | | | | 3,409 | | |
| Respironics, Inc. ‡ | | | 18,600 | | | | 667 | | |
| St. Jude Medical, Inc. ‡# | | | 84,200 | | | | 4,047 | | |
| Stryker Corp. | | | 51,900 | | | | 2,132 | | |
| Zimmer Holdings, Inc. ‡# | | | 36,000 | | | | 2,296 | | |
| Pharmaceuticals (60.6%) | |
| Abbott Laboratories | | | 30,800 | | | | 1,326 | | |
| Abgenix, Inc. ‡ | | | 202,900 | | | | 2,110 | | |
| Advanced Life Sciences Holdings, Inc. ‡ | | | 60,400 | | | | 238 | | |
| Alexion Pharmaceuticals, Inc. ‡ | | | 48,580 | | | | 1,331 | | |
| Alkermes, Inc. ‡ | | | 317,360 | | | | 5,170 | | |
| Allscripts Healthcare Solutions, Inc. ‡ | | | 30,500 | | | | 488 | | |
| American Pharmaceutical Partners, Inc. ‡ | | | 5,900 | | | | 254 | | |
| Amgen, Inc. ‡# | | | 194,420 | | | | 14,729 | | |
| Amylin Pharmaceuticals, Inc. ‡# | | | 140,180 | | | | 4,710 | | |
| Andrx Corp. ‡ | | | 60,400 | | | | 934 | | |
| Arena Pharmaceuticals, Inc. ‡ | | | 81,800 | | | | 851 | | |
| Array Biopharma, Inc. ‡ | | | 68,200 | | | | 484 | | |
| Astellas Pharma, Inc. | | | 78,000 | | | | 2,782 | | |
| AtheroGenics, Inc. ‡ | | | 67,300 | | | | 1,009 | | |
| Barr Pharmaceuticals, Inc. ‡ | | | 6,200 | | | | 356 | | |
| BioCryst Pharmaceuticals, Inc. ‡ | | | 152,400 | | | | 2,108 | | |
| Biogen Idec, Inc. ‡# | | | 107,000 | | | | 4,347 | | |
| BioSphere Medical, Inc. ‡ | | | 156,400 | | | | 782 | | |
| Cardinal Health, Inc. | | | 62,800 | | | | 3,926 | | |
| Celgene Corp. ‡# | | | 86,900 | | | | 4,875 | | |
| Cell Genesys, Inc. ‡ | | | 49,600 | | | | 267 | | |
| Cephalon, Inc. ‡# | | | 209,740 | | | | 9,562 | | |
| Conor Medsystems, Inc. ‡ | | | 35,500 | | | | 797 | | |
| Cubist Pharmaceuticals, Inc. ‡# | | | 228,500 | | | | 4,618 | | |
| CV Therapeutics, Inc. ‡ | | | 94,000 | | | | 2,356 | | |
| Dade Behring Holdings, Inc. # | | | 89,600 | | | | 3,226 | | |
| Discovery Laboratories, Inc. ‡ | | | 6,900 | | | | 49 | | |
| Dov Pharmaceutical, Inc. ‡ | | | 35,800 | | | | 556 | | |
| Dynavax Technologies Corp. ‡ | | | 11,700 | | | | 69 | | |
| Elan Corp. PLC, ADR ‡ | | | 393,400 | | | | 3,246 | | |
| Encysive Pharmaceuticals, Inc. ‡ | | | 181,900 | | | | 1,910 | | |
| Endo Pharmaceuticals Holdings, Inc. ‡ | | | 12,000 | | | | 323 | | |
| Eyetech Pharmaceuticals, Inc. ‡# | | | 35,500 | | | | 626 | | |
| Favrille, Inc. ‡ | | | 23,600 | | | | 83 | | |
| Genentech, Inc. ‡# | | | 178,840 | | | | 16,203 | | |
| Genmab A/S | | | 54,600 | | | | 1,048 | | |
| Gilead Sciences, Inc. ‡# | | | 388,371 | | | | 18,351 | | |
The notes to the financial statements are an integral part of this report.
Transamerica IDEX Mutual Funds
Annual Report 2005
4
TA IDEX T. Rowe Price Health Sciences
SCHEDULE OF INVESTMENTS (continued)
At October 31, 2005
(all amounts except share amounts in thousands)
| | | Shares | | Value | |
| Pharmaceuticals (continued) | |
| Idenix Pharmaceuticals, Inc. ‡ | | | 13,500 | | | $ | 281 | | |
| ImClone Systems, Inc. ‡# | | | 224,190 | | | | 7,779 | | |
| Immucor, Inc. ‡# | | | 51,300 | | | | 1,330 | | |
| Indevus Pharmaceuticals, Inc. ‡ | | | 77,300 | | | | 338 | | |
| Inhibitex, Inc., Private Placement ‡m | | | 27,700 | | | | 269 | | |
| Inspire Pharmaceuticals, Inc. ‡# | | | 42,600 | | | | 268 | | |
| Invitrogen Corp. ‡ | | | 11,500 | | | | 731 | | |
| IVAX Corp. ‡ | | | 36,225 | | | | 1,034 | | |
| Johnson & Johnson | | | 51,800 | | | | 3,244 | | |
Keryx Biopharmaceuticals, Inc.,
Foreign shares ‡ | | | 54,300 | | | | 785 | | |
Keryx Biopharmaceuticals, Inc.,
Private Placement ‡m | | | 8,000 | | | | 116 | | |
| Lilly (Eli) & Co. # | | | 66,700 | | | | 3,321 | | |
| MannKind Corp. ‡ | | | 24,500 | | | | 277 | | |
| MannKind Corp., Private Placement ‡m | | | 30,624 | | | | 346 | | |
MannKind Corp., Warrants,
Expires 8/5/2010 ‡§m | | | 30,624 | | | | — | o | |
| Martek Biosciences Corp. ‡ | | | 69,800 | | | | 2,155 | | |
| Medarex, Inc. ‡ | | | 7,600 | | | | 66 | | |
| Medco Health Solutions, Inc. ‡ | | | 25,300 | | | | 1,429 | | |
| Medicines Co. ‡# | | | 191,750 | | | | 3,287 | | |
| Medicis Pharmaceutical Corp.–Class A | | | 18,500 | | | | 546 | | |
| MedImmune, Inc. ‡ | | | 72,320 | | | | 2,530 | | |
| MGI PHARMA, Inc. ‡# | | | 153,000 | | | | 2,870 | | |
| Momenta Pharmaceuticals, Inc. ‡ | | | 43,900 | | | | 945 | | |
| Myogen, Inc. ‡# | | | 84,700 | | | | 1,698 | | |
| Myogen, Inc. Warrants ‡§m | | | 2,900 | | | | 36 | | |
| Myogen, Inc., Private Placement ‡m | | | 14,500 | | | | 291 | | |
| NeoRx Corp. ‡ | | | 4,600 | | | | 4 | | |
| NeoRx Corp. Warrants, Expires 12/8/2008 ‡§m | | | 1,200 | | | | — | o | |
| Neurocrine Biosciences, Inc. ‡# | | | 121,360 | | | | 6,410 | | |
| Novartis AG, ADR | | | 46,600 | | | | 2,508 | | |
| Noven Pharmaceuticals, Inc. ‡ | | | 46,000 | | | | 648 | | |
| Novo Nordisk A/S–Class B | | | 15,000 | | | | 769 | | |
| NPS Pharmaceuticals, Inc. ‡ | | | 128,700 | | | | 1,269 | | |
| Onyx Pharmaceuticals, Inc. ‡ | | | 42,500 | | | | 1,092 | | |
| OraSure Technologies, Inc. ‡ | | | 50,800 | | | | 559 | | |
| OSI Pharmaceuticals, Inc. ‡ | | | 142,230 | | | | 3,314 | | |
| Panacos Pharmaceuticals, Inc. ‡ | | | 34,900 | | | | 276 | | |
| Penwest Pharmaceuticals Co. ‡ | | | 25,100 | | | | 398 | | |
| Pfizer, Inc. | | | 134,980 | | | | 2,934 | | |
| Protein Design Labs, Inc. ‡# | | | 178,800 | | | | 5,010 | | |
| Rigel Pharmaceuticals, Inc. ‡ | | | 64,200 | | | | 1,441 | | |
| Roche Holding AG–Genusschein | | | 38,000 | | | | 5,670 | | |
| Sanofi-Aventis | | | 26,400 | | | | 2,114 | | |
| Schering-Plough Corp. | | | 109,980 | | | | 2,237 | | |
| | | Shares | | Value | |
| Pharmaceuticals (continued) | |
| Schwarz Pharma AG | | | 33,100 | | | $ | 1,886 | | |
| Sepracor, Inc. ‡# | | | 231,600 | | | | 13,027 | | |
| Serologicals Corp. ‡ | | | 24,100 | | | | 469 | | |
| Shire Pharmaceuticals PLC, ADR | | | 77,900 | | | | 2,792 | | |
| Tercica, Inc. ‡ | | | 78,300 | | | | 782 | | |
| Teva Pharmaceutical Industries, Ltd., ADR # | | | 18,580 | | | | 708 | | |
| Theravance, Inc. ‡ | | | 106,500 | | | | 2,308 | | |
| Trimeris, Inc. ‡ | | | 186,720 | | | | 2,379 | | |
| United Therapeutics Corp. ‡# | | | 6,400 | | | | 473 | | |
| Valeant Pharmaceuticals International | | | 36,200 | | | | 621 | | |
| Vertex Pharmaceuticals, Inc. ‡ | | | 184,900 | | | | 4,206 | | |
| Vion Pharmaceuticals, Inc. ‡ | | | 222,700 | | | | 490 | | |
| Viropharma, Inc. ‡ | | | 99,633 | | | | 1,909 | | |
| Wyeth # | | | 149,000 | | | | 6,639 | | |
| Research & Testing Services (2.2%) | |
| Affymetrix, Inc. ‡# | | | 21,400 | | | | 972 | | |
| DeCODE Genetics, Inc. ‡ | | | 132,900 | | | | 1,159 | | |
| Exelixis, Inc. ‡ | | | 173,880 | | | | 1,344 | | |
| Gen-Probe, Inc. ‡# | | | 67,600 | | | | 2,761 | | |
| Incyte Corp. ‡ | | | 229,400 | | | | 1,145 | | |
| Kosan Biosciences, Inc. ‡ | | | 87,300 | | | | 619 | | |
| Monogram Biosciences, Inc. ‡ | | | 17,300 | | | | 38 | | |
| Regeneration Technologies, Inc. ‡ | | | 22,700 | | | | 164 | | |
| Wholesale Trade Durable Goods (1.1%) | |
| Patterson Cos., Inc. ‡# | | | 23,300 | | | | 964 | | |
| Symyx Technologies, Inc. ‡ | | | 115,500 | | | | 3,088 | | |
| Total Common Stocks (cost: $324,362) | | | | | | | 349,056 | | |
| | | Principal | | Value | |
| SHORT-TERM U.S. GOVERNMENT OBLIGATIONS (7.2%) | |
U.S. Treasury Bill
| |
| 3.05%, due 11/03/2005 # | | $ | 50 | | | $ | 50 | | |
| 3.08%, due 11/03/2005 # | | | 615 | | | | 615 | | |
| 3.10%, due 11/03/2005 # | | | 700 | | | | 700 | | |
| 3.10%, due 11/03/2005 # | | | 90 | | | | 90 | | |
| 3.17%, due 11/03/2005 # | | | 100 | | | | 100 | | |
| 3.28%, due 11/03/2005 # | | | 25,425 | | | | 25,420 | | |
Total Short-Term U.S. Government Obligations
(cost: $26,975) | | | | | | | 26,975 | | |
| Total Investment Securities (cost: $351,367) | | | | | | $ | 376,037 | | |
| | | Contracts w | | Value | |
| WRITTEN OPTIONS (-0.9%) | |
| Covered Call Options (-0.4%) | |
| Affymetrix, Inc. | | | 111 | | | $ | (22 | ) | |
Call Strike $50.00
| |
| Expires 02/18/2006 | |
The notes to the financial statements are an integral part of this report.
Transamerica IDEX Mutual Funds
Annual Report 2005
5
TA IDEX T. Rowe Price Health Sciences
SCHEDULE OF INVESTMENTS (continued)
At October 31, 2005
(all amounts except share amounts in thousands)
| | | Contracts w | | Value | |
| Covered Call Options (continued) | |
| Amgen, Inc. | | | 48 | | | $ | (56 | ) | |
| Call Strike $65.00 | | | | | | |
| | |
| Expires 01/21/2006 | | | | | | | | | |
Amgen, Inc.
Call Strike $85.00
Expires 01/21/2006 | | | 180 | | | | (13 | ) | |
Amgen, Inc.
Call Strike $90.00
Expires 01/21/2006 | | | 58 | | | | (1 | ) | |
Amylin Pharmaceuticals, Inc.
Call Strike $25.00
Expires 01/21/2006 | | | 364 | | | | (349 | ) | |
Amylin Pharmaceuticals, Inc.
Call Strike $35.00
Expires 01/21/2006 | | | 178 | | | | (55 | ) | |
Biogen Idec, Inc.
Call Strike $40.00
Expires 11/19/2005 | | | 61 | | | | (9 | ) | |
Boston Scientific Corp.
Call Strike $25.00
Expires 01/21/2006 | | | 377 | | | | (57 | ) | |
Boston Scientific Corp.
Call Strike $27.50
Expires 01/21/2006 | | | 36 | | | | (2 | ) | |
Celgene Corp.
Call Strike $55.00
Expires 11/19/2005 | | | 247 | | | | (77 | ) | |
Celgene Corp.
Call Strike $60.00
Expires 01/21/2006 | | | 241 | | | | (83 | ) | |
Cephalon, Inc.
Call Strike $50.00
Expires 12/17/2005 | | | 64 | | | | (4 | ) | |
Community Health Systems, Inc.
Call Strike $40.00
Expires 01/21/2006 | | | 37 | | | | (3 | ) | |
Cubist Pharmaceuticals, Inc.
Call Strike $20.00
Expires 02/18/2006 | | | 250 | | | | (62 | ) | |
Dade Behring Holdings, Inc.
Call Strike $35.00
Expires 11/19/2005 | | | 102 | | | | (19 | ) | |
Eyetech Pharmaceuticals, Inc.
Call Strike $15.00
Expires 12/17/2005 | | | 49 | | | | (14 | ) | |
Genentech, Inc.
Call Strike $90.00
Expires 12/17/2005 | | | 123 | | | | (52 | ) | |
| | | Contracts w | | Value | |
| Covered Call Options (continued) | |
| Genentech, Inc. | | | 180 | | | $ | (36 | ) | |
| Call Strike $95.00 | | | | | | |
| | |
| Expires 12/17/2005 | | | | | | | | | |
Genentech, Inc.
Call Strike $100.00
Expires 12/17/2005 | | | 12 | | | | (1 | ) | |
Genentech, Inc.
Call Strike $100.00
Expires 01/21/2006 | | | 185 | | | | (41 | ) | |
Gen-Probe, Inc.
Call Strike $50.00
Expires 11/19/2005 | | | 184 | | | | (3 | ) | |
Gilead Sciences, Inc.
Call Strike $47.50
Expires 11/19/2005 | | | 189 | | | | (19 | ) | |
Gilead Sciences, Inc.
Call Strike $50.00
Expires 01/21/2006 | | | 126 | | | | (24 | ) | |
ImClone Systems, Inc.
Call Strike $45.00
Expires 11/19/2005 | | | 118 | | | | (1 | ) | |
ImClone Systems, Inc.
Call Strike $45.00
Expires 01/21/2006 | | | 92 | | | | (5 | ) | |
ImClone Systems, Inc.
Call Strike $50.00
Expires 01/21/2006 | | | 121 | | | | (3 | ) | |
Immucor, Inc.
Call Strike $30.00
Expires 12/17/2005 | | | 243 | | | | (15 | ) | |
Immucor, Inc.
Call Strike $30.00
Expires 03/18/2006 | | | 41 | | | | (7 | ) | |
Inspire Pharmaceuticals, Inc.
Call Strike $12.50
Expires 12/17/2005 | | | 37 | | | | (1 | ) | |
Kinetic Concepts, Inc.
Call Strike $45.00
Expires 12/17/2005 | | | 101 | | | | (5 | ) | |
Kinetic Concepts, Inc.
Call Strike $50.00
Expires 12/17/2005 | | | 192 | | | | (4 | ) | |
Lilly (Eli) & Co.
Call Strike $50.00
Expires 01/21/2006 | | | 257 | | | | (48 | ) | |
Medicines Co.
Call Strike $20.00
Expires 01/21/2006 | | | 243 | | | | (15 | ) | |
The notes to the financial statements are an integral part of this report.
Transamerica IDEX Mutual Funds
Annual Report 2005
6
TA IDEX T. Rowe Price Health Sciences
SCHEDULE OF INVESTMENTS (continued)
At October 31, 2005
(all amounts except share amounts in thousands)
| | | Contracts w | | Value | |
| Covered Call Options (continued) | |
| MGI PHARMA, Inc. | | | 240 | | | $ | (26 | ) | |
| Call Strike $22.50 | | | | | | |
| | |
| Expires 04/22/2006 | | | | | | | | | |
Myogen, Inc.
Call Strike $25.00
Expires 12/17/2005 | | | 37 | | | | (3 | ) | |
Neurocrine Biosciences, Inc.
Call Strike $50.00
Expires 11/19/2005 | | | 36 | | | | (12 | ) | |
Patterson Cos., Inc.
Call Strike $45.00
Expires 04/22/2006 | | | 123 | | | | (22 | ) | |
Protein Design Labs, Inc.
Call Strike $30.00
Expires 01/21/2006 | | | 62 | | | | (10 | ) | |
Protein Design Labs, Inc.
Call Strike $30.00
Expires 02/18/2006 | | | 182 | | | | (37 | ) | |
Protein Design Labs, Inc.
Call Strike $35.00
Expires 02/18/2006 | | | 178 | | | | (12 | ) | |
Sepracor, Inc.
Call Strike $60.00
Expires 11/19/2005 | | | 254 | | | | (17 | ) | |
St. Jude Medical, Inc.
Call Strike $50.00
Expires 01/21/2006 | | | 60 | | | | (10 | ) | |
St. Jude Medical, Inc.
Call Strike $55.00
Expires 04/22/2006 | | | 63 | | | | (8 | ) | |
Teva Pharmaceutical Industries, Ltd.
Call Strike $32.50
Expires 01/21/2006 | | | 37 | | | | (23 | ) | |
Triad Hospitals, Inc.
Call Strike $45.00
Expires 11/19/2005 | | | 176 | | | | (2 | ) | |
United Therapeutics Corp.
Call Strike $80.00
Expires 11/19/2005 | | | 59 | | | | (5 | ) | |
Wyeth
Call Strike $45.00
Expires 01/21/2006 | | | 365 | | | | (54 | ) | |
Zimmer Holdings, Inc.
Call Strike $80.00
Expires 01/21/2006 | | | 60 | | | | (1 | ) | |
| | | Contracts w | | Value | |
| Put Options (-0.5%) | |
| Allergan, Inc. | | | 33 | | | $ | (4 | ) | |
| Put Strike $80.00 | | | | | | |
| | |
| Expires 01/21/2006 | | | | | | | | | |
Amgen, Inc.
Put Strike $65.00
Expires 01/21/2006 | | | 72 | | | | (3 | ) | |
Amgen, Inc.
Put Strike $70.00
Expires 01/21/2006 | | | 49 | | | | (6 | ) | |
Amgen, Inc.
Put Strike $80.00
Expires 01/21/2006 | | | 89 | | | | (49 | ) | |
Amylin Pharmaceuticals, Inc.
Put Strike $20.00
Expires 01/21/2006 | | | 17 | | | | (1 | ) | |
Amylin Pharmaceuticals, Inc.
Put Strike $22.50
Expires 01/21/2006 | | | 88 | | | | (5 | ) | |
Amylin Pharmaceuticals, Inc.
Put Strike $25.00
Expires 01/21/2006 | | | 34 | | | | (3 | ) | |
Baxter International, Inc.
Put Strike $35.00
Expires 01/21/2006 | | | 56 | | | | (3 | ) | |
Baxter International, Inc.
Put Strike $40.00
Expires 01/21/2006 | | | 29 | | | | (8 | ) | |
Biomet, Inc.
Put Strike $37.50
Expires 01/21/2006 | | | 28 | | | | (11 | ) | |
Cardinal Health, Inc.
Put Strike $60.00
Expires 01/21/2006 | | | 7 | | | | (1 | ) | |
Cardinal Health, Inc.
Put Strike $65.00
Expires 01/21/2006 | | | 11 | | | | (4 | ) | |
Caremark Rx, Inc.
Put Strike $50.00
Expires 01/21/2006 | | | 33 | | | | (5 | ) | |
Caremark Rx, Inc.
Put Strike $55.00
Expires 01/21/2006 | | | 24 | | | | (9 | ) | |
Caremark Rx, Inc.
Put Strike $55.00
Expires 01/20/2007 | | | 12 | | | | (7 | ) | |
The notes to the financial statements are an integral part of this report.
Transamerica IDEX Mutual Funds
Annual Report 2005
7
TA IDEX T. Rowe Price Health Sciences
SCHEDULE OF INVESTMENTS (continued)
At October 31, 2005
(all amounts except share amounts in thousands)
| | | Contracts w | | Value | |
| Put Options (continued) | |
| Celgene Corp. | | | 63 | | | $ | (1 | ) | |
| Put Strike $35.00 | | | | | | |
| | |
| Expires 01/21/2006 | | | | | | | | | |
Celgene Corp.
Put Strike $40.00
Expires 01/21/2006 | | | 31 | | | | (2 | ) | |
Celgene Corp.
Put Strike $45.00
Expires 01/21/2006 | | | 24 | | | | (3 | ) | |
Celgene Corp.
Put Strike $60.00
Expires 01/21/2006 | | | 25 | | | | (17 | ) | |
Cigna Corp.
Put Strike $120.00
Expires 01/21/2006 | | | 60 | | | | (46 | ) | |
Cigna Corp.
Put Strike $125.00
Expires 01/21/2006 | | | 53 | | | | (58 | ) | |
Community Health Systems, Inc.
Put Strike $40.00
Expires 01/21/2006 | | | 13 | | | | (4 | ) | |
Coventry Health Care, Inc.
Put Strike $56.63
Expires 01/21/2006 | | | 26 | | | | (18 | ) | |
DaVita, Inc.
Put Strike $55.00
Expires 01/21/2006 | | | 24 | | | | (14 | ) | |
Elan Corp.
Put Strike $25.00
Expires 01/21/2006 | | | 45 | | | | (76 | ) | |
Elan Corp.
Put Strike $30.00
Expires 01/21/2006 | | | 13 | | | | (28 | ) | |
Forest Laboratories, Inc.
Put Strike $40.00
Expires 01/21/2006 | | | 56 | | | | (20 | ) | |
Forest Laboratories, Inc.
Put Strike $45.00
Expires 01/21/2006 | | | 20 | | | | (15 | ) | |
Genentech, Inc.
Put Strike $65.00
Expires 01/21/2006 | | | 240 | | | | (8 | ) | |
Genentech, Inc.
Put Strike $80.00
Expires 01/21/2006 | | | 88 | | | | (17 | ) | |
| | | Contracts w | | Value | |
| Put Options (continued) | |
| Genentech, Inc. | | | 44 | | | $ | (7 | ) | |
| Put Strike $85.00 | | | | | | |
| | |
| Expires 12/17/2005 | | | | | | | | | |
Genentech, Inc.
Put Strike $85.00
Expires 01/21/2006 | | | 34 | | | | (11 | ) | |
Genentech, Inc.
Put Strike $90.00
Expires 12/17/2005 | | | 39 | | | | (13 | ) | |
Gen-Probe, Inc.
Put Strike $50.00
Expires 11/19/2005 | | | 15 | | | | (14 | ) | |
Gen-Probe, Inc.
Put Strike $40.00
Expires 02/18/2006 | | | 12 | | | | (4 | ) | |
Genzyme Corp.
Put Strike $75.00
Expires 01/21/2006 | | | 84 | | | | (41 | ) | |
Gilead Sciences, Inc.
Put Strike $42.50
Expires 11/19/2005 | | | 27 | | | | — | o | |
Gilead Sciences, Inc.
Put Strike $45.00
Expires 01/21/2006 | | | 83 | | | | (16 | ) | |
Gilead Sciences, Inc.
Put Strike $47.50
Expires 01/21/2006 | | | 84 | | | | (25 | ) | |
Guidant Corp.
Put Strike $70.00
Expires 01/21/2006 | | | 18 | | | | (13 | ) | |
HCA, Inc.
Put Strike $60.00
Expires 01/21/2006 | | | 65 | | | | (77 | ) | |
HCA, Inc.
Put Strike $55.00
Expires 01/21/2006 | | | 90 | | | | (62 | ) | |
ICOS Corp.
Put Strike $30.00
Expires 01/21/2006 | | | 86 | | | | (36 | ) | |
Immucor, Inc.
Put Strike $30.00
Expires 12/17/2005 | | | 104 | | | | (49 | ) | |
Invitrogen Corp.
Put Strike $65.00
Expires 05/20/2006 | | | 54 | | | | (29 | ) | |
The notes to the financial statements are an integral part of this report.
Transamerica IDEX Mutual Funds
Annual Report 2005
8
TA IDEX T. Rowe Price Health Sciences
SCHEDULE OF INVESTMENTS (continued)
At October 31, 2005
(all amounts except share amounts in thousands)
| | | Contracts w | | Value | |
| Put Options (continued) | |
| Kinetic Concepts, Inc. | | | 75 | | | $ | (180 | ) | |
| Put Strike $60.00 | | | | | | |
| | |
| Expires 12/17/2005 | | | | | | | | | |
Kinetic Concepts, Inc.
Put Strike $40.00
Expires 06/17/2006 | | | 107 | | | | (79 | ) | |
Lilly (Eli) & Co.
Put Strike $55.00
Expires 01/21/2006 | | | 22 | | | | (12 | ) | |
Manor Care, Inc.
Put Strike $40.00
Expires 01/21/2006 | | | 9 | | | | (3 | ) | |
Martek Biosciences Corp.
Put Strike $45.00
Expires 01/21/2006 | | | 17 | | | | (24 | ) | |
Medtronic, Inc.
Put Strike $55.00
Expires 01/21/2006 | | | 37 | | | | (4 | ) | |
Medtronic, Inc.
Put Strike $60.00
Expires 01/21/2006 | | | 61 | | | | (23 | ) | |
Merck & Co., Inc.
Put Strike $30.00
Expires 01/21/2006 | | | 50 | | | | (13 | ) | |
Neurocrine Biosciences, Inc.
Put Strike $55.00
Expires 01/21/2006 | | | 15 | | | | (6 | ) | |
Omnicare, Inc.
Put Strike $45.00
Expires 01/21/2006 | | | 36 | | | | (2 | ) | |
Onyx Pharmaceuticals, Inc.
Put Strike $25.00
Expires 01/21/2006 | | | 24 | | | | (6 | ) | |
Onyx Pharmaceuticals, Inc.
Put Strike $30.00
Expires 01/21/2006 | | | 73 | | | | (42 | ) | |
OSI Pharmaceuticals, Inc.
Put Strike $25.00
Expires 01/21/2006 | | | 12 | | | | (5 | ) | |
OSI Pharmaceuticals, Inc.
Put Strike $40.00
Expires 01/21/2006 | | | 18 | | | | (32 | ) | |
Pfizer, Inc.
Put Strike $22.50
Expires 03/18/2006 | | | 26 | | | | (6 | ) | |
Pharmion Corp.
Put Strike $80.00
Expires 01/21/2006 | | | 31 | | | | (40 | ) | |
| | | Contracts w | | Value | |
| Put Options (continued) | |
| Protein Design Labs, Inc. | | | 18 | | | $ | (2 | ) | |
| Put Strike $25.00 | | | | | | |
| | |
| Expires 01/21/2006 | | | | | | | | | |
Quest Diagnostics, Inc.
Put Strike $55.00
Expires 01/21/2006 | | | 31 | | | | (26 | ) | |
Sepracor, Inc.
Put Strike $55.00
Expires 11/19/2005 | | | 11 | | | | (1 | ) | |
Sepracor, Inc.
Put Strike $55.00
Expires 01/21/2006 | | | 60 | | | | (20 | ) | |
Sepracor, Inc.
Put Strike $65.00
Expires 01/21/2006 | | | 244 | | | | (234 | ) | |
Shire Pharmaceuticals
Put Strike $40.00
Expires 01/21/2006 | | | 123 | | | | (61 | ) | |
St. Jude Medical, Inc.
Put Strike $40.00
Expires 01/21/2006 | | | 44 | | | | (2 | ) | |
St. Jude Medical, Inc.
Put Strike $45.00
Expires 01/21/2006 | | | 65 | | | | (7 | ) | |
St. Jude Medical, Inc.
Put Strike $50.00
Expires 01/21/2006 | | | 128 | | | | (42 | ) | |
Stryker Corp.
Put Strike $50.00
Expires 01/21/2006 | | | 48 | | | | (43 | ) | |
Stryker Corp.
Put Strike $50.00
Expires 03/18/2006 | | | 26 | | | | (24 | ) | |
Triad Hospitals, Inc.
Put Strike $50.00
Expires 01/21/2006 | | | 18 | | | | (16 | ) | |
UnitedHealth Group, Inc.
Put Strike $50.00
Expires 01/21/2006 | | | 24 | | | | (1 | ) | |
UnitedHealth Group, Inc.
Put Strike $60.00
Expires 01/21/2006 | | | 134 | | | | (47 | ) | |
Vertex Pharmaceuticals, Inc.
Put Strike $30.00
Expires 04/22/2006 | | | 12 | | | | (10 | ) | |
Walgreen Co.
Put Strike $50.00
Expires 01/21/2006 | | | 12 | | | | (6 | ) | |
The notes to the financial statements are an integral part of this report.
Transamerica IDEX Mutual Funds
Annual Report 2005
9
TA IDEX T. Rowe Price Health Sciences
SCHEDULE OF INVESTMENTS (continued)
At October 31, 2005
(all amounts except share amounts in thousands)
| | | Contracts w | | Value | |
| Put Options (continued) | |
| WellPoint, Inc. | | | 22 | | | $ | (3 | ) | |
| Put Strike $67.50 | | | | | | |
| | |
| Expires 01/21/2006 | | | | | | | | | |
Zimmer Holdings, Inc.
Put Strike $65.00
Expires 01/21/2006 | | | 15 | | | | (6 | ) | |
Zimmer Holdings, Inc.
Put Strike $80.00
Expires 01/21/2006 | | | 22 | | | | (36 | ) | |
| Total Written Options (premiums: $3,825) | | | | | | | (3,255 | ) | |
| SUMMARY: | |
| Investment securities, at value | | | 100.3 | % | | $ | 376,037 | | |
| Written options | | | (0.9 | )% | | | (3,255 | ) | |
| Other assets in excess of liabilities | | | 0.6 | % | | | 2,399 | | |
| Net assets | | | 100.0 | % | | $ | 375,181 | | |
NOTES TO SCHEDULE OF INVESTMENTS:
‡ Non-income producing.
§ Security is deemed to be illiquid.
# At October 31, 2005, all or a portion of this security is segregated with the custodian to cover margin requirements for open option contracts. The value of all securities segregated at October 31, 2005, is $55,925.
o Value is less than $1.
w Contract amounts are not in thousands.
m Securities valued as determined in good faith in accordance with procedures established by the Fund's Board of Trustees.
DEFINITIONS:
ADR American Depositary Receipt
REIT Real Estate Investment Trust
The notes to the financial statements are an integral part of this report.
Transamerica IDEX Mutual Funds
Annual Report 2005
10
TA IDEX T. Rowe Price Health Sciences
STATEMENT OF ASSETS AND LIABILITIES
At October 31, 2005
(all amounts except per share amounts in thousands)
| Assets: | |
| Investment securities, at value (cost: $351,367) | | $ | 376,037 | | |
| Cash | | | 658 | | |
| Receivables: | |
| Investment securities sold | | | 6,731 | | |
| Shares of beneficial interest sold | | | 1,047 | | |
| Interest | | | 3 | | |
| Dividends | | | 25 | | |
| Dividend reclaims receivable | | | 9 | | |
| Other | | | 5 | | |
| | | | 384,515 | | |
| Liabilities: | |
| Investment securities purchased | | | 5,666 | | |
| Accounts payable and accrued liabilities: | |
| Shares of beneficial interest redeemed | | | 10 | | |
| Management and advisory fees | | | 294 | | |
| Distribution and service fees | | | 63 | | |
| Transfer agent fees | | | 4 | | |
| Administration fees | | | 6 | | |
| Written options (premiums $3,825) | | | 3,255 | | |
| Other | | | 36 | | |
| | | | 9,334 | | |
| Net Assets | | $ | 375,181 | | |
| Net Assets Consist of: | |
Shares of beneficial interest, unlimited shares
authorized, no par value | | $ | 330,777 | | |
| Undistributed net investment income (loss) | | | 1 | | |
Undistributed net realized gain (loss) from investment
securities, foreign currency transactions and
written option contracts | | | 19,161 | | |
| Net unrealized appreciation (depreciation) on: | |
| Investment securities | | | 24,670 | | |
| Written option contracts | | | 570 | | |
Translation of assets and liabilites denominated in
foreign currencies | | | 2 | | |
| Net Assets | | $ | 375,181 | | |
| Net Assets by Class: | |
| Class A | | $ | 194,414 | | |
| Class B | | | 5,274 | | |
| Class C | | | 2,223 | | |
| Class I | | | 173,270 | | |
| Shares Outstanding: | |
| Class A | | | 15,623 | | |
| Class B | | | 436 | | |
| Class C | | | 184 | | |
| Class I | | | 13,836 | | |
| Net Asset Value Per Share: | |
| Class A | | $ | 12.44 | | |
| Class B | | | 12.10 | | |
| Class C | | | 12.07 | | |
| Class I | | | 12.52 | | |
| Maximum Offering Price Per Share (a): | |
| Class A | | $ | 13.16 | | |
(a) Includes the maximum selling commission (represented as a percentage of offering price) which is reduced on certain levels of sales as set forth in the Prospectus. Net asset value per share for Classes B, C and I shares represents offering price. The redemption price for Classes B and C shares equals net asset value less any applicable contingent deferred sales charge.
STATEMENT OF OPERATIONS
For the year ended October 31, 2005
(all amounts in thousands)
| Investment Income: | |
| Interest | | $ | 599 | | |
Dividends (net of withholding taxes on foreign
dividends of $21) | | | 724 | | |
| | | | 1,323 | | |
| Expenses: | |
| Management and advisory fees | | | 3,142 | | |
| Distribution and service fees: | |
| Class A | | | 616 | | |
| Class B | | | 48 | | |
| Class C | | | 23 | | |
| Transfer agent fees: | |
| Class A | | | 26 | | |
| Class B | | | 18 | | |
| Class C | | | 7 | | |
| Class I | | | – | (b) | |
| Printing and shareholder reports | | | 6 | | |
| Custody fees | | | 105 | | |
| Administration fees | | | 61 | | |
| Legal fees | | | 20 | | |
| Audit fees | | | 18 | | |
| Trustees fees | | | 14 | | |
| Registration fees: | |
| Class A | | | 20 | | |
| Class B | | | 10 | | |
| Class C | | | 13 | | |
| Class I | | | 2 | | |
| Other | | | 3 | | |
| Total expenses | | | 4,152 | | |
| Less: | |
| Reimbursement of class expenses: | |
| Class B | | | (3 | ) | |
| Class C | | | (7 | ) | |
| Total reimbursed expenses | | | (10 | ) | |
| Net expenses | | | 4,142 | | |
| Net Investment Income (Loss) | | | (2,819 | ) | |
| Net Realized Gain (Loss) from: | |
| Investment securities | | | 20,109 | | |
| Written option contracts | | | 2,640 | | |
| Foreign currency transactions | | | (71 | ) | |
| | | | 22,678 | | |
Net Increase (Decrease) in Unrealized Appreciation
(Depreciation) on: | |
| Investment securities | | | 22,331 | | |
| Written option contracts | | | 144 | | |
Translation of assets and liabilities denominated in
foreign currencies | | | 2 | | |
| | | | 22,477 | | |
Net Gain (Loss) on Investment Securities,
Written Option Contracts and
Foreign Currencies | | | 45,155 | | |
Net Increase (Decrease) in Net Assets Resulting
from Operations | | $ | 42,336 | | |
(b) Rounds to less than $1.
The notes to the financial statements are an integral part of this report.
Transamerica IDEX Mutual Funds
Annual Report 2005
11
TA IDEX T. Rowe Price Health Sciences
STATEMENTS OF CHANGES IN NET ASSETS
For the years ended
(all amounts in thousands)
| | | October 31,
2005 | | October 31,
2004 | |
| Increase (Decrease) In Net Assets From: | |
| Operations: | |
| Net investment income (loss) | | $ | (2,819 | ) | | $ | (1,415 | ) | |
Net realized gain (loss) from
investment securities, foreign
currency transactions and written
option contracts | | | 22,678 | | | | 6,889 | | |
Net unrealized appreciation
(depreciation) on investment
securities, foreign currency
translation and written option
contracts | | | 22,477 | | | | (746 | ) | |
| | | | 42,336 | | | | 4,728 | | |
| Distributions to Shareholders: | |
| From net realized gains: | |
| Class A | | | (1,404 | ) | | | (3,559 | ) | |
| Class B | | | (39 | ) | | | (143 | ) | |
| Class C | | | (19 | ) | | | (23 | ) | |
| Class C2 | | | – | | | | (30 | ) | |
| Class M | | | – | | | | (15 | ) | |
| Class I | | | (1,010 | ) | | | – | | |
| | | | (2,472 | ) | | | (3,770 | ) | |
| Capital Share Transactions: | |
| Proceeds from shares sold: | |
| Class A | | | 16,484 | | | | 93,348 | | |
| Class B | | | 1,602 | | | | 2,436 | | |
| Class C | | | 812 | | | | 849 | | |
| Class C2 | | | – | | | | 326 | | |
| Class M | | | – | | | | 146 | | |
| Class I | | | 157,147 | | | | – | | |
| | | | 176,045 | | | | 97,105 | | |
Dividends and distributions
reinvested: | |
| Class A | | | 1,404 | | | | 3,555 | | |
| Class B | | | 39 | | | | 140 | | |
| Class C | | | 14 | | | | 14 | | |
| Class C2 | | | – | | | | 23 | | |
| Class M | | | – | | | | 15 | | |
| Class I | | | 1,010 | | | | – | | |
| | | | 2,467 | | | | 3,747 | | |
| Cost of shares redeemed: | |
| Class A | | | (2,348 | ) | | | (1,910 | ) | |
| Class B | | | (1,520 | ) | | | (1,004 | ) | |
| Class C | | | (955 | ) | | | (320 | ) | |
| Class C2 | | | – | | | | (413 | ) | |
| Class M | | | – | | | | (64 | ) | |
| | | | (4,823 | ) | | | (3,711 | ) | |
| Class level exchanges: | |
| Class C | | | – | | | | 1,419 | | |
| Class C2 | | | – | | | | (942 | ) | |
| Class M | | | – | | | | (477 | ) | |
| | | | – | | | | – | | |
| Automatic conversions: | |
| Class A | | | 42 | | | | 6 | | |
| Class B | | | (42 | ) | | | (6 | ) | |
| | | | – | | | | – | | |
| | | | 173,689 | | | | 97,141 | | |
| Net increase (decrease) in net assets | | | 213,553 | | | | 98,099 | | |
| | | October 31,
2005 | | October 31,
2004 | |
| Net Assets: | |
| Beginning of year | | $ | 161,628 | | | $ | 63,529 | | |
| End of year | | $ | 375,181 | | | $ | 161,628 | | |
Undistributed Net Investment Income
(Loss) | | $ | 1 | | | $ | – | | |
| Share Activity: | |
| Shares issued: | |
| Class A | | | 1,405 | | | | 8,337 | | |
| Class B | | | 140 | | | | 218 | | |
| Class C | | | 71 | | | | 77 | | |
| Class C2 | | | – | | | | 30 | | |
| Class M | | | – | | | | 13 | | |
| Class I | | | 13,750 | | | | – | | |
| | | | 15,366 | | | | 8,675 | | |
Shares issued–reinvested from
distributions: | |
| Class A | | | 120 | | | | 308 | | |
| Class B | | | 3 | | | | 13 | | |
| Class C | | | 1 | | | | 1 | | |
| Class C2 | | | – | | | | 2 | | |
| Class M | | | – | | | | 1 | | |
| Class I | | | 86 | | | | – | | |
| | | | 210 | | | | 325 | | |
| Shares redeemed: | |
| Class A | | | (207 | ) | | | (175 | ) | |
| Class B | | | (134 | ) | | | (93 | ) | |
| Class C | | | (84 | ) | | | (30 | ) | |
| Class C2 | | | – | | | | (38 | ) | |
| Class M | | | – | | | | (6 | ) | |
| | | | (425 | ) | | | (342 | ) | |
| Class level exchanges: | |
| Class C | | | – | | | | 128 | | |
| Class C2 | | | – | | | | (84 | ) | |
| Class M | | | – | | | | (44 | ) | |
| | | | – | | | | – | | |
| Automatic conversions: | |
| Class A | | | 4 | | | | 1 | | |
| Class B | | | (4 | ) | | | (1 | ) | |
| | | | – | | | | – | | |
Net increase (decrease) in shares
outstanding: | |
| Class A | | | 1,322 | | | | 8,471 | | |
| Class B | | | 5 | | | | 137 | | |
| Class C | | | (12 | ) | | | 176 | | |
| Class C2 | | | – | | | | (90 | ) | |
| Class M | | | – | | | | (36 | ) | |
| Class I | | | 13,836 | | | | – | | |
| | | | 15,151 | | | | 8,658 | | |
The notes to the financial statements are an integral part of this report.
Transamerica IDEX Mutual Funds
Annual Report 2005
12
TA IDEX T. Rowe Price Health Sciences
FINANCIAL HIGHLIGHTS
| | | | | For a share of beneficial interest outstanding throughout each period | |
| | | | | Net Asset | | Investment Operations | | Distributions | | Net Asset | |
| | | For the
Period
Ended (d)(g) | | Value,
Beginning
of Period | | Net
Investment
Income (Loss) | | Net Realized
and Unrealized
Gain (Loss) | | Total
Operations | | From Net
Investment
Income | | From Net
Realized
Gains | | Total
Distributions | | Value,
End
of Period | |
| Class A | | 10/31/2005 | | $ | 10.84 | | | $ | (0.12 | ) | | $ | 1.82 | | | $ | 1.70 | | | $ | – | | | $ | (0.10 | ) | | $ | (0.10 | ) | | $ | 12.44 | | |
| | | 10/31/2004 | | | 10.14 | | | | (0.13 | ) | | | 1.18 | | | | 1.05 | | | | – | | | | (0.35 | ) | | | (0.35 | ) | | | 10.84 | | |
| | | 10/31/2003 | | | 8.28 | | | | (0.16 | ) | | | 2.02 | | | | 1.86 | | | | – | | | | – | | | | – | | | | 10.14 | | |
| | | 10/31/2002 | | | 10.00 | | | | (0.08 | ) | | | (1.64 | ) | | | (1.72 | ) | | | – | | | | – | | | | – | | | | 8.28 | | |
| Class B | | 10/31/2005 | | | 10.66 | | | | (0.25 | ) | | | 1.79 | | | | 1.54 | | | | – | | | | (0.10 | ) | | | (0.10 | ) | | | 12.10 | | |
| | | 10/31/2004 | | | 10.03 | | | | (0.17 | ) | | | 1.15 | | | | 0.98 | | | | – | | | | (0.35 | ) | | | (0.35 | ) | | | 10.66 | | |
| | | 10/31/2003 | | | 8.24 | | | | (0.21 | ) | | | 2.00 | | | | 1.79 | | | | – | | | | – | | | | – | | | | 10.03 | | |
| | | 10/31/2002 | | | 10.00 | | | | (0.11 | ) | | | (1.65 | ) | | | (1.76 | ) | | | – | | | | – | | | | – | | | | 8.24 | | |
| Class C | | 10/31/2005 | | | 10.63 | | | | (0.25 | ) | | | 1.79 | | | | 1.54 | | | | – | | | | (0.10 | ) | | | (0.10 | ) | | | 12.07 | | |
| | | 10/31/2004 | | | 10.03 | | | | (0.24 | ) | | | 1.19 | | | | 0.95 | | | | – | | | | (0.35 | ) | | | (0.35 | ) | | | 10.63 | | |
| | | 10/31/2003 | | | 8.10 | | | | (0.22 | ) | | | 2.15 | | | | 1.93 | | | | – | | | | – | | | | – | | | | 10.03 | | |
| Class I | | 10/31/2005 | | | 11.26 | | | | (0.07 | ) | | | 1.43 | | | | 1.36 | | | | – | | | | (0.10 | ) | | | (0.10 | ) | | | 12.52 | | |
| | | | | | | Ratios/Supplemental Data | |
| | | For the
Period | | Total | | Net Assets,
End of
Period | | Ratio of Expenses
to Average
Net Assets (a) | | Net Investment
Income (Loss)
to Average | | Portfolio
Turnover | |
| | | Ended (g) | | Return (c) | | (000's) | | Net (e) | | Total (f) | | Net Assets (a) | | Rate (b) | |
| Class A | | 10/31/2005 | | | 15.69 | % | | $ | 194,414 | | | | 1.44 | % | | | 1.44 | % | | | (1.02 | )% | | | 59 | % | |
| | | 10/31/2004 | | | 10.19 | | | | 154,957 | | | | 1.53 | | | | 1.53 | | | | (1.15 | ) | | | 35 | | |
| | | 10/31/2003 | | | 22.46 | | | | 59,115 | | | | 1.95 | | | | 2.19 | | | | (1.61 | ) | | | 30 | | |
| | | 10/31/2002 | | | (17.20 | ) | | | 3,804 | | | | 1.95 | | | | 8.76 | | | | (1.51 | ) | | | 43 | | |
| Class B | | 10/31/2005 | | | 14.45 | | | | 5,274 | | | | 2.60 | | | | 2.66 | | | | (2.18 | ) | | | 59 | | |
| | | 10/31/2004 | | | 9.59 | | | | 4,590 | | | | 2.09 | | | | 2.09 | | | | (1.58 | ) | | | 35 | | |
| | | 10/31/2003 | | | 21.72 | | | | 2,952 | | | | 2.60 | | | | 2.84 | | | | (2.26 | ) | | | 30 | | |
| | | 10/31/2002 | | | (17.60 | ) | | | 758 | | | | 2.60 | | | | 9.41 | | | | (2.16 | ) | | | 43 | | |
| Class C | | 10/31/2005 | | | 14.44 | | | | 2,223 | | | | 2.60 | | | | 2.90 | | | | (2.18 | ) | | | 59 | | |
| | | 10/31/2004 | | | 9.28 | | | | 2,081 | | | | 2.60 | | | | 3.41 | | | | (1.61 | ) | | | 35 | | |
| | | 10/31/2003 | | | 23.83 | | | | 201 | | | | 2.60 | | | | 2.84 | | | | (2.26 | ) | | | 30 | | |
| Class I | | 10/31/2005 | | | 12.09 | | | | 173,270 | | | | 1.06 | | | | 1.06 | | | | (0.65 | ) | | | 59 | | |
NOTES TO FINANCIAL HIGHLIGHTS
(a) Annualized.
(b) Not annualized.
(c) Total Return has been calculated for the applicable period without deduction of a sales load, if any, on an initial purchase. Periods of less than one year are not annualized.
(d) Per share information is calculated based on average shares outstanding.
(e) Ratio of Net Expenses to Average Net Assets is net of fee waivers and reimbursements by the investment adviser, if any (see Note 2).
(f) Ratio of Total Expenses to Average Net Assets includes all expenses before fee waivers, reimbursements.
(g) TA IDEX T. Rowe Price Health Sciences ("the Fund") commenced operations on March 1, 2002.
The inception date for the Fund's offering of share classes are as follows:
Class C – November 11, 2002
Class I – November 8, 2004
The notes to the financial statements are an integral part of this report.
Transamerica IDEX Mutual Funds
Annual Report 2005
13
TA IDEX T. Rowe Price Health Sciences
NOTES TO FINANCIAL STATEMENTS
At October 31, 2005
(all amounts in thousands)
NOTE 1. ORGANIZATION AND SIGNIFICANT ACCOUNTING POLICIES
Transamerica IDEX Mutual Funds is an open-end management investment company registered under the Investment Company Act of 1940, as amended (the "1940 Act").
In the normal course of business, TA IDEX T. Rowe Price Health Sciences (the "Fund") enters into contracts that contain a variety of representations that provide general indemnifications. The Fund's maximum exposure under these arrangements is unknown, as this would involve future claims that may be made against the Fund and/or its affiliates that have not yet occurred. However, based on experience, the Fund expects the risk of loss to be remote.
The Fund is "non-diversified" under the 1940 Act.
This report should be read in conjunction with the current Fund prospectus, which contains more complete information about the Fund.
The following is a summary of significant accounting policies followed by the Fund in the preparation of the financial statements. In preparing the Fund's financial statements in accordance with accounting principles generally accepted in the United States of America ("GAAP"), estimates or assumptions (which could differ from actual results) may be used that affect reported amounts and disclosures.
Multiple class operations, income and expenses: The Fund currently offers four classes of shares, each with a public offering price that reflects different sales charges, if any, and expense levels. On June 15, 2004, Class C2 shares merged into Class C. On September 24, 2004, Class M shares merged into Class C. Class B shares will convert to Class A shares eight years after purchase. Income, non-class specific expenses and realized and unrealized gains and losses, are allocated daily to each class, based upon the value of shares outstanding method as permitted under Rule 18f-3 of the 1940 Act. Each class bears its own specific expenses as well as a portion of general common expenses.
Class I shares are offered for investment to the asset allocation funds of AEGON/Transamerica Series Trust (ATST).
Security valuations: The Fund values its investments at the close of the New York Stock Exchange ("NYSE"), normally 4 p.m. ET, each day the NYSE is open for business. Fund investments are valued at the last sale price or closing price on the day of valuation taken from the primary exchange where the security is principally traded.
Securities traded in the over-the-counter market and listed securities for which no sale was reported on that date are valued at the last quoted bid price.
Foreign securities generally are valued based on quotations from the primary market in which they are traded. Because many foreign securities markets and exchanges close prior to the close of the NYSE, closing prices for foreign securities in those markets or on those exchanges do not reflect the events that occur after that close. If a significant market event impacting the value of a portfolio security (e.g., natural disaster, company announcement, market volatility) occurs subsequent to the close of trading in the security, but prior to the calculation of the Fund's net asset value per share, market quotations for that security may be determined to be unreliable and, accordingly, not "readily available." As a result, foreign equity securities held by the Fund may be valued at fair market value as determined in good faith by the Fund's Administrative Valuation Committee, under the supervision of the Board's Valuation Committee , using guidelines adopted by the Board of Trustees.
Other securities for which quotations are not readily available or whose values have been determined to be unreliable are valued at fair market value as determined in good faith by the Fund's Administrative Valuation Committee, under the supervision of the Board's Valuation Committee, using guidelines adopted by the Board of Trustees.
Cash: The Fund may leave cash overnight in its cash account with the custodian, Investors Bank & Trust Company ("IBT"). IBT has been contracted on behalf of the Fund to invest the excess cash into a savings account, which at October 31, 2005, was paying an interest rate of 2.76%.
Commission recapture: The sub-adviser, to the extent consistent with the best execution and usual commission rate policies and practices, may place security transactions of the Fund with broker/dealers with which Transamerica IDEX Mutual Funds has established a Commission Recapture Program. A Commission Recapture Program is any arrangement under which a broker/dealer applies a portion of the commissions received by such broker/dealer on the security transactions to the Fund. In no event will commissions paid by the Fund be used to pay expenses that would otherwise be borne by any other funds within Transamerica IDEX Mutual Funds, or by any other party.
Recaptured commissions during the year ended October 31, 2005, of $19 are included in net realized gains in the Statement of Operations.
Security transactions and investment income: Security transactions are recorded on the trade date. Security gains and losses are calculated on the specific identification basis. Dividend income, if any, is recorded on the ex-dividend date or, in the case of foreign securities, as soon as the Fund is informed of the ex-dividend date. Interest income, including accretion of discounts and amortization of premiums, is recorded on the accrual basis commencing on the settlement date.
Real Estate Investment Trusts ("REITs"): There are certain additional risks involved in investing in REITs. These include, but are not limited to, economic conditions, changes in zoning laws, real estate values, property taxes and interest rates.
Dividend income is recorded at management's estimate of the income included in distributions from the REIT investments. Distributions
Transamerica IDEX Mutual Funds
Annual Report 2005
14
TA IDEX T. Rowe Price Health Sciences
NOTES TO FINANCIAL STATEMENTS (continued)
At October 31, 2005
(all amounts in thousands)
NOTE 1.–(continued)
received in excess of the estimated amount are recorded as a reduction of the cost of investments. The actual amounts of income, return of capital and capital gains are only determined by each REIT after the fiscal year end and may differ from the estimated amounts.
Foreign currency denominated investments: The accounting records of the Fund are maintained in U.S. dollars. Securities and other assets and liabilities denominated in foreign currencies are translated into U.S. dollars at the closing exchange rate each day. The cost of foreign securities is translated at the exchange rate in effect when the investment was acquired. The Fund combines fluctuations from currency exchange rates and fluctuations in value when computing net realized and unrealized gains or losses from investments.
Net foreign currency gains and losses resulting from changes in exchange rates include: 1) foreign currency fluctuations between trade date and settlement date of investment security transactions; 2) gains and losses on forward foreign currency contracts; and 3) the difference between the receivable amounts of interest and dividends recorded in the accounting records in U.S. dollars and the amounts actually received.
Foreign currency denominated assets may involve risks not typically associated with domestic transactions. These risks include revaluation of currencies, adverse fluctuations in foreign currency values and possible adverse political, social and economic developments, including those particular to a specific industry, country or region.
Foreign capital gains taxes: The Fund may be subject to taxes imposed by countries in which it invests, with respect to its investment in issuers existing or operating in such countries. Such taxes are generally based on income earned or repatriated and capital gains realized on the sale of such investments. The Fund accrues such taxes when the related income or capital gains are earned. Some countries require governmental approval for the repatriation of investment income, capital or the proceeds of sales earned by foreign investors. In addition, if there is deterioration in a country's balance of payments or for other reasons, a country may impose temporary restrictions on foreign capital remittances abroad.
Forward foreign currency contracts: The Fund may enter into forward foreign currency contracts to hedge against exchange rate risk arising from investments in securities denominated in foreign currencies. Contracts are valued at the contractual forward rate and are marked to market daily, with the change in value recorded as an unrealized gain or loss. When the contracts are settled a realized gain or loss is incurred. Risks may arise from changes in market value of the underlying currencies and from the possible inability of counterparties to meet the terms of their contracts.
There were no open forward foreign currency contracts at October 31, 2005
Option contracts: The Fund may enter into options contracts to manage exposure to market fluctuations. Options are valued at the average of the bid and ask ("Mean Quote") established each day at the close of the board of trade or exchange on which they are traded. The primary risks associated with options are imperfect correlation between the change in value of the securities held and the prices of the options contracts; the possibility of an illiquid market and inability of the counterparty to meet the contracts terms. When the Fund writes a covered call or put option, an amount equal to the premium received by the Fund is included in the Fund's Statement of Assets and Liabilities as an asset and as an equivalent liability. Options are marked-to-market daily to reflect the current value of the option written.
The underlying face amounts of open option contracts at October 31, 2005, are listed in the Schedule of Investments.
Transactions in written call and put options were as follows:
| | | Premium | | Contracts* | |
| Beginning Balance October 31, 2004 | | $ | 2,326 | | | | 5,569 | | |
| Sales | | | 13,429 | | | | 39,569 | | |
| Closing Buys | | | (10,433 | ) | | | (32,061 | ) | |
| Expirations | | | (55 | ) | | | (397 | ) | |
| Exercised | | | (1,442 | ) | | | (2,029 | ) | |
| Balance at October 31, 2005 | | $ | 3,825 | | | | 10,651 | | |
* Contracts not in thousands
Redemption fees: A short-term trading redemption fee may be assessed on any Fund shares in a fund account that are sold during the first five (5) NYSE trading days following their purchase date. This redemption fee will equal 2% of the amount redeemed and shares held the longest will be treated as being redeemed first and shares held the shortest as being redeemed last. For the year ended October 31, 2005, the Fund received less than $1 in redemption fees.
Dividend distributions: Distributions to shareholders are recorded on the ex-dividend date and are determined in accordance with Federal income tax regulations which may differ from GAAP.
NOTE 2. RELATED PARTY TRANSACTIONS
Effective January 1, 2005 AEGON/Transamerica Fund Advisors, Inc. was renamed Transamerica Fund Advisors, Inc. ("TFAI"); AEGON/Transamerica Fund Services, Inc. and AEGON/Transamerica Investor Services, Inc. merged into one entity and was renamed Transamerica Fund Services, Inc. ("TFS").
TFAI is the Fund's investment adviser. TFS is the Fund's administrator and transfer agent. AFSG Securities Corp. ("AFSG") is the Fund's distributor/principal underwriter. TFAI, TFS , and AFSG are affiliates of AEGON, NV, a Netherlands corporation.
Transamerica IDEX Mutual Funds
Annual Report 2005
15
TA IDEX T. Rowe Price Health Sciences
NOTES TO FINANCIAL STATEMENTS (continued)
At October 31, 2005
(all amounts in thousands)
NOTE 2.–(continued)
The following schedule reflects the percentage of Fund assets owned by affiliated mutual funds:
| | | Net
Assets | | % of
Net Assets | |
TA IDEX Asset Allocation–
Conservative Portfolio | | $ | 16,754 | | | | 4.47 | % | |
TA IDEX Asset Allocation–
Growth Portfolio | | | 47,626 | | | | 12.69 | % | |
TA IDEX Asset Allocation–
Moderate Growth Portfolio | | | 73,143 | | | | 19.50 | % | |
TA IDEX Asset Allocation–
Moderate Portfolio | | | 52,791 | | | | 14.07 | % | |
| Asset Allocation–Conservative Portfolio | | | 9,545 | | | | 2.54 | % | |
| Asset Allocation–Growth Portfolio | | | 39,875 | | | | 10.63 | % | |
Asset Allocation–Moderate
Growth Portfolio | | | 77,725 | | | | 20.72 | % | |
| Asset Allocation–Moderate Portfolio | | | 45,373 | | | | 12.09 | % | |
| Total | | $ | 362,832 | | | | 96.71 | % | |
Investment advisory fees: The Fund pays management fees to TFAI based on average daily net assets ("ANA") at the following breakpoints:
1.00% of the first $500 million of ANA
0.95% of ANA over $500 million
TFAI has contractually agreed to waive its advisory fee and will reimburse the Fund to the extent that operating expenses, excluding 12b-1 fees, exceed the following stated annual limit:
1.60% Expense Limit–Classes A, B and C
1.30% Expense Limit–Class I
If total Fund expenses fall below the annual expense limitation agreement agreed to by the adviser within the succeeding three years, the Fund may be required to pay that adviser a portion or all of the waived advisory fees.
| | | Advisory Fee
Waived | | Available for
Recapture Through | |
| Fiscal Year 2003 | | $ | 60 | | | | 10/31/2006 | | |
If total Fund expenses fall below the annual expense limitation agreement agreed to by the adviser within the succeeding three years, the Fund may be required to pay that adviser a portion or all of the reimbursed class expenses.
| | | Reimbursement of
Class Expenses | | Available for
Recapture Through | |
| Fiscal Year 2005: | |
| Class B | | $ | 3 | | | 10/31/2008 | |
| Class C | | | 7 | | | 10/31/2008 | |
| Fiscal Year 2004: | |
| Class C | | | 8 | | | 10/31/2007 | |
There were no amounts recaptured during the year ended October 31, 2005.
The sub-adviser, T. Rowe Price, has agreed to a pricing discount based on the aggregate assets that they manage in the Transamerica IDEX Mutual Funds. The amount of the discount received by the Fund at October 31, 2005 was $24.
Distribution and service fees: The Fund has a 12b-1 distribution plan under the 1940 Act pursuant to which an annual fee, based on average daily net assets, is paid to the distributor for various disbursements such as broker-dealer account servicing fees and other promotional expenses of the Fund. The Fund is authorized under the 12b-1 plan to pay fees on each class up to the following limits:
| Class A | | | 0.35 | % | |
| Class B | | | 1.00 | % | |
| Class C | | | 1.00 | % | |
| Class I | | | N/A | | |
In the case the Fund or a class of shares of the Fund is closed to new investors or investments, the Fund is authorized to pay 12b-1 fees for past sales and distribution efforts and present and past investor services.
Underwriter commissions relate to front-end sales charges imposed for Class A shares and contingent deferred sales charges from Classes B, C, and certain A share redemptions. For the year ended October 31, 2005, the underwriter commissions were as follows:
| Received by Underwriter | | $ | 104 | | |
| Retained by Underwriter | | | 5 | | |
| Contingent Deferred Sales Charge | | | 18 | | |
Administrative services: The Fund has entered into an agreement with TFS for financial and legal fund administration services. As of January 1, 2005 the Fund pays TFS an annual fee of 0.02% of ANA. Prior to January 1, 2005 the Fund paid TFS an annual fee of 0.015% of ANA. The Legal fees on the Statement of Operations are for fees paid to external legal counsel.
Transfer agent fees: The Fund pays TFS an annual per-account charge for each open and closed account. The Fund paid TFS $48 for the year ended October 31, 2005.
Deferred compensation plan: Each eligible independent Fund Trustee may elect to participate in a non-qualified deferred compensation plan maintained by Transamerica IDEX Mutual Funds (the "Plan"). Under the Plan, such Trustees may defer payment of all or a portion of their total fees earned as a Fund Trustee. Each Trustee who is a participant in the Plan may elect that the earnings, losses or gains credited to his or her deferred fee amounts be determined based on a deemed investment in any series of Transamerica IDEX Mutual Funds, including the Fund. The right of a participant to receive a distribution from the Plan of the deferred fees is an unsecured claim against the general assets of all series of Transamerica IDEX Mutual Funds. The pro rata liability to the Fund of all deferred fees in the Plan amounted, as of October 31, 2005, to $5.
Transamerica IDEX Mutual Funds
Annual Report 2005
16
TA IDEX T. Rowe Price Health Sciences
NOTES TO FINANCIAL STATEMENTS (continued)
At October 31, 2005
(all amounts in thousands)
NOTE 3. INVESTMENT TRANSACTIONS
The cost of securities purchased and proceeds from securities sold (excluding short-term securities) for the year ended October 31, 2005, were as follows:
| Purchases of securities: | |
| Long-Term | | $ | 332,853 | | |
| U.S. Government | | | – | | |
| Proceeds from maturities and sales of securities: | |
| Long-Term | | | 175,502 | | |
| U.S. Government | | | – | | |
NOTE 4. FEDERAL INCOME TAX MATTERS
The Fund has not made any provision for federal income or excise taxes due to its policy to distribute all of its taxable income and capital gains to its shareholders and otherwise qualify as a regulated investment company under Subchapter M of the Internal Revenue Code. Income and capital gain distributions are determined in accordance with income tax regulations, which may differ from GAAP. These differences are primarily due to differing treatment for items including, but not limited to, wash sales, foreign currency transactions, net operating losses and straddles.
Therefore, distributions determined in accordance with tax regulations may differ significantly in amount or character from net investment income and realized gains for financial reporting purposes. Financial reporting records are adjusted for permanent book/tax differences to reflect tax character. Financial records are not adjusted for temporary differences. These reclassifications are as follows:
| Undistributed net investment income (loss) | | $ | 2,820 | | |
Undistributed net realized gain (loss) from investment
securities | | | (2,820 | ) | |
The tax character of distributions paid may differ from the character of distributions shown in the Statement of Changes in Net Assets due to short-term gains being treated as ordinary income for tax purposes. The tax character of distributions paid during 2004 and 2005 was as follows:
| 2004 Distributions paid from: | |
| Ordinary Income | | $ | 2,666 | | |
| Long-term Capital Gain | | | 1,104 | | |
| 2005 Distributions paid from: | |
| Ordinary Income | | | 950 | | |
| Long-term Capital Gain | | | 1,522 | | |
The tax basis components of distributable earnings as of October 31, 2005, are as follows:
| Undistributed Ordinary Income | | $ | 5,381 | | |
| Undistributed Long-term Capital Gains | | $ | 16,276 | | |
| Capital Loss Carryforward | | $ | – | | |
| Net Unrealized Appreciation (Depreciation) | | $ | 22,745 | * | |
* Amount includes unrealized appreciation (depreciation) from derivative instruments and deferred compensation.
The aggregate cost of investments and composition of unrealized appreciation (depreciation) for federal income tax purposes as of October 31, 2005, are as follows:
| Federal Tax Cost Basis | | $ | 353,864 | | |
| Unrealized Appreciation | | $ | 49,874 | | |
| Unrealized (Depreciation) | | | (27,701 | ) | |
| Net Unrealized Appreciation (Depreciation) | | $ | 22,173 | | |
NOTE 5. REGULATORY PROCEEDINGS
There continues to be significant federal and state regulatory activity relating to financial services companies, particularly mutual fund companies and their investment advisers. As part of an ongoing investigation regarding potential market timing, recordkeeping and trading compliance issues and matters affecting the Fund's investment adviser, TFAI, and certain affiliates and former employees of TFAI, the SEC staff has indicated that it is likely to take some action against TFAI and certain of its affiliates at the conclusion of the investigation. The potential timing and the scope of any such action is difficult to predict. Although the impact of any action brought against TFAI and/or its affiliates is difficult to assess at the present time, the Fund currently believes that the likelihood that any such action will have a material adverse impact on it is remote. It is important to note that the Fund is not aware of any allega tion of wrongdoing against it and its Board at the time this annual report is printed. Although it is not anticipated that these developments will have an adverse impact on the Fund, there can be no assurance at this time. TFAI and its affiliates are actively working with the SEC in regard to this matter; however, the exact resolution cannot be determined at this time. TFAI will take such actions that it deems necessary or appropriate to continue providing management services to the Fund and to bring all matters to an appropriate conclusion.
TFAI and/or its affiliates, and not the Fund, will bear the costs regarding these regulatory matters.
NOTE 6. SUBSEQUENT EVENT (unaudited)
Effective November 7, 2005, the Expense Limit for the Fund's Class I shares is 1.60%.
Transamerica IDEX Mutual Funds
Annual Report 2005
17
Report of Independent Registered Certified Public Accounting Firm
To the Board of Trustees and Shareholders of
TA IDEX T. Rowe Price Health Sciences
In our opinion, the accompanying statement of assets and liabilities, including the schedule of investments, and the related statements of operations and of changes in net assets and the financial highlights present fairly, in all material respects, the financial position of TA IDEX T. Rowe Price Health Sciences (the "Fund") (one of the portfolios constituting the Transamerica IDEX Mutual Funds) at October 31, 2005, the results of its operations for the year then ended, the changes in its net assets for each of the two years in the period then ended and the financial highlights for each of the periods presented, in conformity with accounting principles generally accepted in the United States of America. These financial statements and financial highlights (hereafter referred to as "financial statements") are the responsibility of the Fund's management; our responsibility is to express an opinion on these financial statements base d on our audits. We conducted our audits of these financial statements in accordance with the standards of the Public Company Accounting Oversight Board (United States). Those standards require that we plan and perform the audit to obtain reasonable assurance about whether the financial statements are free of material misstatement. An audit includes examining, on a test basis, evidence supporting the amounts and disclosures in the financial statements, assessing the accounting principles used and significant estimates made by management, and evaluating the overall financial statement presentation. We believe that our audits, which included confirmation of securities at October 31, 2005 by correspondence with the custodian and brokers, provide a reasonable basis for our opinion.

December 22, 2005
Transamerica IDEX Mutual Funds
Annual Report 2005
18
TA IDEX T. Rowe Price Health Sciences
SUPPLEMENTAL INFORMATION (unaudited)
TAX INFORMATION
For tax purposes, the Fund has made a Long-Term Capital Gain Designation of $1,522 for the year ended October 31, 2005.
Transamerica IDEX Mutual Funds
Annual Report 2005
19
TA IDEX T. Rowe Price Small Cap
MARKET ENVIRONMENT
Despite rising short-term interest rates and surging energy costs, U.S. stocks produced respectable gains in the twelve month period ended October 31, 2005. Equities were supported by a moderate economic expansion, generally favorable corporate earnings growth, and low long-term interest rates. The market's gains were capped by fears of higher inflation and slower economic growth toward the end of our reporting period.
Small-cap stocks surpassed their larger peers over the last year: the Russell 2000 Index ("Russell 2000") returned 12.08% versus 8.71% for the Standard and Poor's 500 Composite Stock Index. As measured by various Russell indexes, value stocks had a performance advantage over growth stocks across all market capitalizations over the last year. However, we are encouraged that small-cap growth shares outperformed their value-oriented peers in the last six months.
PERFORMANCE
For the year ended October 31, 2005, TA IDEX T. Rowe Price Small Cap, Class A returned 16.33%. By comparison its primary and former benchmarks, the Russell 2000 Growth Index ("Russell 2000 Growth") and the Russell 2000, returned 10.91% and 12.08%.
STRATEGY REVIEW
The portfolio invests in a broadly diversified portfolio of small-cap company stocks, and our sector allocations are usually not dramatically different from those of broad small-cap growth benchmarks and portfolios. As of October 31, 2005 the portfolio's assets were spread across approximately 300 securities, and very few holdings represented more than 1% of assets. Casting such a wide net is a key tool for risk management, as it can reduce the potentially negative impact of a given stock on the entire portfolio. In addition, such broad diversification provides greater opportunities than more concentrated portfolios to have some exposure to the stocks and sectors that perform best.
The portfolio returned 16.33% in the twelve month period ended October 31, 2005. Its performance surpassed that of its benchmark, the Russell 2000 Growth, as well as the Russell 2000, which advanced 12.08%. The portfolio's performance advantage over its benchmark was driven by favorable stock selection, primarily in the health care and industrials and business services sectors. Underweighting commercial banks, thrifts, and mortgage companies in the financials sector also helped our results, but owning no utilities and weakness among our consumer discretionary holdings limited our gains.
All sectors in the portfolio produced gains in the last twelve months, led by health care, information technology, and industrials and business services. Some of our top-performing underlying industries included health care providers and services, energy equipment and services, health care equipment and supplies, and software. Some of the stocks that had greatest positive impact in absolute terms were health care companies Coventry Health Care, Inc., Omnicare, Inc., Computer Programs and Systems, Inc., regional airline SkyWest, Inc., and energy concern Cal Dive International, Inc.
The consumer staples, materials, and telecommunication services sectors, which have fairly low representation in the portfolio and in the small-cap growth universe, contributed the least to portfolio performance over the last year, though none of these sectors in aggregate detracted from value. The pharmaceuticals industry had the worst performance in absolute terms, though a few other industries with very limited representation in the portfolio – such as textiles, apparel, luxury goods, consumer finance, and food products – lagged due to the poor performance of one or two holdings in that industry. Some of the stocks that detracted from our performance the most were Noven Pharmaceuticals, Inc., Medicis Pharmaceutical Corporation, Martek Biosciences Corporation, fashion accessory maker Fossil, Inc., and communications equipment company Plantronics, Inc.
Paul W. Wojcik, CFA
Fund Manager
T. Rowe Price Associates, Inc.
Transamerica IDEX Mutual Funds
Annual Report 2005
1
TA IDEX T. Rowe Price Small Cap
Comparison of change in value of $10,000 investment in Class A shares and its comparative indices.

Average Annual Total Return for Periods Ended 10/31/05
| | | 1 year | | 5 years | | From
Inception | | Inception
Date | |
| Class A (NAV) | | | 16.33 | % | | | (0.85 | )% | | | 3.90 | % | | 3/1/99 | |
| Class A (POP) | | | 9.93 | % | | | (1.96 | )% | | | 3.02 | % | | 3/1/99 | |
| Russell 2000 Growth1 | | | 10.91 | % | | | (1.62 | )% | | | 3.28 | % | | 3/1/99 | |
| Russell 20001 | | | 12.08 | % | | | 6.75 | % | | | 9.17 | % | | 3/1/99 | |
| Class B (NAV) | | | 15.22 | % | | | (1.59 | )% | | | 3.17 | % | | 3/1/99 | |
| Class B (POP) | | | 10.22 | % | | | (1.78 | )% | | | 3.17 | % | | 3/1/99 | |
| Class C (NAV) | | | 15.21 | % | | | – | | | | 17.02 | % | | 11/11/02 | |
| Class C (POP) | | | 14.21 | % | | | – | | | | 17.02 | % | | 11/11/02 | |
NOTES
1 The Russell 2000 Growth (Russell 2000 Growth) Index and the Russell 2000 (Russell 2000) Index are unmanaged indices used as a general measure of market performance. Calculations assume dividends and capital gains are reinvested and do not include any managerial expenses. From inception calculation is based on life of Class A shares. For reporting periods through October 31, 2004, the Fund had selected the Russell 2000 as its benchmark measure; however, the Russell 2000 Growth is more appropriate for comparison to the Fund. Source: Standard & Poor's Micropal®© Micropal, Inc. 2005 – 1-800-596-5323 – http://www.funds-sp.com.
The performance data presented represents past performance, future results may vary. Performance data does not reflect the deduction of taxes that would be paid on fund distributions or the redemption of fund shares. Investment return and principal value will fluctuate so that an investor's shares, when redeemed, may be worth more or less than their original cost. Current performance may be lower or higher than performance quoted. Please see www.transamericaidex.com for performance data current to the most recent month-end.
Public Offering Price (POP) returns include the reinvestment of dividends and capital gains and reflect the maximum sales charge of 5.5% for A shares or the maximum applicable contingent deferred sales charge (5% in the 1st year, decreasing to 0% after 6 years) for Class B shares and 1% (during the first 12 months) for Class C shares. Net Asset Value (NAV) returns include the reinvestment of dividends and capital gains but do not reflect any sales charges. Shares purchased prior to March 1, 2004 are subject to a maximum applicable contingent deferred sales charge (5% in the 1st year, decreasing to 0% after 7 years) for Class B shares and (2% in the 1st year, decreasing to 0% after 2 years) for Class C shares.
Investing in small cap stocks generally involves greater risks and volatility so an investment in this fund may not be suitable for everyone.
This material must be preceded or accompanied by a current prospectus, which includes specific contents regarding the investment objectives and policies of this fund.
Transamerica IDEX Mutual Funds
Annual Report 2005
2
TA IDEX T. Rowe Price Small Cap
UNDERSTANDING YOUR FUND'S EXPENSES
(unaudited)
SHAREHOLDER EXPENSES
Fund shareholders may incur two types of costs: (1) transaction costs, including sales charges (loads) on purchases, contingent deferred sales charges on redemptions and redemption fees; and (2) ongoing costs, including management fees, 12b-1 distribution and service fees, and other fund expenses.
The following Example is intended to help you understand your ongoing costs (in dollars and cents) of investing in a Fund and to compare these costs with the ongoing costs of investing in other funds.
The Example is based on an investment of $1,000 invested at May 1, 2005 and held for the entire period until October 31, 2005.
ACTUAL EXPENSES
The first line in the table below provides information about actual account values and actual expenses. You may use the information in this line, together with the amount you invested, to estimate the expenses that you paid over the period. Simply divide your account value by $1,000 (for example, an $8,600 account value divided by $1,000 = 8.6), then multiply the result by the number in the first line of your Fund under the heading entitled "Expenses Paid During Period" to estimate the expenses you paid on your account during this period. If your account is an IRA, your expenses could have included a $15 annual fee. The amount of any fee paid through your account would increase the estimate of expenses you paid during the period and decrease your ending account value.
HYPOTHETICAL EXAMPLE FOR COMPARISON PURPOSES
The second line in the table below provides information about hypothetical account values and hypothetical expenses based on the Fund's actual expense ratio and an assumed rate of return of 5% per year before expenses, which is not the Fund's actual return. The hypothetical account values and expenses may not be used to estimate the actual ending account balance or expenses you paid for the period. You may use this information to compare the ongoing costs of investing in your Fund and other funds. To do so, compare this 5% hypothetical example with the 5% hypothetical examples that appear in the shareholder reports of the other funds. As in the case of the actual expense example, if your account is subject to an IRA fee, the amount of the fee paid through your account would increase the hypothetical expenses you would have paid during the period and decrease the hypothetical ending account value.
Please note that the expenses shown in the table are meant to highlight your ongoing costs only and do not reflect any transactional costs, such as sales charges, redemption fees, brokerage commissions paid on purchases and sales of fund shares. Therefore, the second line under the Fund in the table is useful in comparing ongoing costs only, and will not help you determine the relative total costs of owning different funds. If any of these transaction costs were included, your costs would be higher. The expenses shown in the table do not reflect any fees that may be charged to you by brokers, financial intermediaries or other financial institutions.
| | | Beginning
Account
Value | | Ending
Account
Value | | Annualized
Expense
Ratio | | Expenses Paid
During Period (a) | |
| Class A | |
| Actual | | $ | 1,000.00 | | | $ | 1,136.00 | | | | 1.42 | % | | $ | 7.65 | | |
| Hypothetical (b) | | | 1,000.00 | | | | 1,018.05 | | | | 1.42 | | | | 7.22 | | |
| Class B | |
| Actual | | | 1,000.00 | | | | 1,130.60 | | | | 2.36 | | | | 12.67 | | |
| Hypothetical (b) | | | 1,000.00 | | | | 1,013.31 | | | | 2.36 | | | | 11.98 | | |
| Class C | |
| Actual | | | 1,000.00 | | | | 1,129.90 | | | | 2.35 | | | | 12.62 | | |
| Hypothetical (b) | | | 1,000.00 | | | | 1,013.36 | | | | 2.35 | | | | 11.93 | | |
(a) Expenses are calculated using each Fund's annualized expense ratio (as disclosed in the table), multiplied by the average account value for the period, multiplied by number of days in the period (184 days), and divided by the number of days in the year (365 days).
(b) 5% return per year before expenses.
GRAPHICAL PRESENTATION OF SCHEDULE OF INVESTMENTS
By Sector
At October 31, 2005
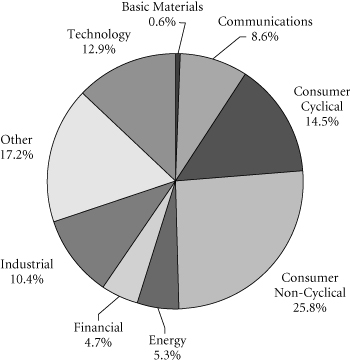
This chart shows the percentage breakdown by sector of the Fund's total investment securities.
Transamerica IDEX Mutual Funds
Annual Report 2005
3
TA IDEX T. Rowe Price Small Cap
SCHEDULE OF INVESTMENTS
At October 31, 2005
(all amounts except share amounts in thousands)
| | | Shares | | Value | |
| COMMON STOCKS (98.4%) | | | |
| Air Transportation (1.5%) | | | |
| Airtran Holdings, Inc. ‡ | | | 5,300 | | | $ | 79 | | |
| Frontier Airlines, Inc. ‡† | | | 6,800 | | | | 64 | | |
| Skywest, Inc. | | | 22,600 | | | | 662 | | |
| Amusement & Recreation Services (1.3%) | | | |
| International Speedway Corp.–Class A | | | 1,000 | | | | 52 | | |
| Station Casinos, Inc. | | | 7,900 | | | | 506 | | |
| WMS Industries, Inc. ‡† | | | 6,300 | | | | 158 | | |
| Apparel & Accessory Stores (2.0%) | | | |
| Christopher & Banks Corp. | | | 6,600 | | | | 88 | | |
| HOT Topic, Inc. ‡† | | | 9,800 | | | | 146 | | |
| Pacific Sunwear of California, Inc. ‡† | | | 12,550 | | | | 314 | | |
| Ross Stores, Inc. | | | 4,500 | | | | 122 | | |
| Talbots, Inc. | | | 2,700 | | | | 70 | | |
| Urban Outfitters, Inc. ‡† | | | 12,000 | | | | 340 | | |
| Apparel Products (0.7%) | | | |
| Gymboree Corp. ‡ | | | 10,200 | | | | 181 | | |
| Quiksilver, Inc. ‡ | | | 18,800 | | | | 217 | | |
| Auto Repair, Services & Parking (0.3%) | | | |
| Dollar Thrifty Automotive Group ‡ | | | 4,700 | | | | 177 | | |
| Automotive (0.9%) | | | |
| Oshkosh Truck Corp. | | | 10,800 | | | | 470 | | |
| Automotive Dealers & Service Stations (1.1%) | | | |
| MarineMax, Inc. ‡ | | | 7,000 | | | | 173 | | |
| O'Reilly Automotive, Inc. ‡ | | | 14,800 | | | | 417 | | |
| Beverages (0.1%) | | | |
| Boston Beer Co., Inc.–Class A ‡ | | | 2,700 | | | | 69 | | |
| Business Services (3.5%) | | | |
| Aptimus, Inc. ‡† | | | 7,900 | | | | 62 | | |
| ChoicePoint, Inc. ‡ | | | 7,600 | | | | 321 | | |
| Computer Programs & Systems, Inc. | | | 16,400 | | | | 605 | | |
| Getty Images, Inc. ‡† | | | 3,500 | | | | 291 | | |
| Heartland Payment Systems, Inc. ‡ | | | 1,000 | | | | 24 | | |
| Iron Mountain, Inc. ‡† | | | 5,825 | | | | 227 | | |
| Jupitermedia Corp. ‡† | | | 11,600 | | | | 197 | | |
| MoneyGram International, Inc. | | | 4,800 | | | | 117 | | |
| SupportSoft, Inc. ‡ | | | 12,800 | | | | 51 | | |
| Commercial Banks (2.0%) | | | |
| Amegy Bancorp, Inc. | | | 2,700 | | | | 62 | | |
| Boston Private Financial Holdings, Inc. | | | 7,300 | | | | 211 | | |
| East-West Bancorp, Inc. | | | 5,500 | | | | 211 | | |
| Investors Financial Services Corp. l | | | 4,600 | | | | 176 | | |
| SVB Financial Group ‡ | | | 3,600 | | | | 179 | | |
| UCBH Holdings, Inc. | | | 14,400 | | | | 251 | | |
| | | Shares | | Value | |
| Communication (0.7%) | |
| Global Payments, Inc. | | | 7,960 | | | $ | 341 | | |
| Insight Communications Co., Inc. ‡ | | | 2,900 | | | | 33 | | |
| Communications Equipment (1.4%) | |
| Inter-Tel, Inc. | | | 13,300 | | | | 246 | | |
| Lifeline Systems, Inc. ‡ | | | 1,300 | | | | 43 | | |
| Plantronics, Inc. | | | 9,400 | | | | 281 | | |
| Polycom, Inc. ‡ | | | 6,506 | | | | 100 | | |
| Powerwave Technologies, Inc. ‡† | | | 9,900 | | | | 111 | | |
| Computer & Data Processing Services (12.4%) | |
| Activision, Inc. ‡ | | | 24,800 | | | | 391 | | |
| Actuate Corp. ‡ | | | 18,000 | | | | 51 | | |
| Agile Software Corp. ‡ | | | 24,400 | | | | 173 | | |
| Avocent Corp. ‡ | | | 1,200 | | | | 37 | | |
| Blue Coat Systems, Inc. ‡ | | | 4,900 | | | | 230 | | |
| Borland Software Corp. ‡ | | | 13,700 | | | | 69 | | |
| CACI International, Inc.–Class A ‡ | | | 4,800 | | | | 262 | | |
| CNET Networks, Inc. ‡ | | | 13,300 | | | | 181 | | |
| Cognex Corp. | | | 6,700 | | | | 191 | | |
| Cognizant Technology Solutions Corp. ‡ | | | 5,000 | | | | 220 | | |
| Cybersource Corp. ‡ | | | 7,700 | | | | 52 | | |
| Digital Insight Corp. ‡ | | | 7,300 | | | | 218 | | |
| Digital River, Inc. ‡ | | | 2,000 | | | | 56 | | |
| Earthlink, Inc. ‡ | | | 3,100 | | | | 34 | | |
| F5 Networks, Inc. ‡ | | | 5,400 | | | | 281 | | |
| Factset Research Systems, Inc. | | | 5,050 | | | | 177 | | |
| Fair Isaac Corp. | | | 9,405 | | | | 393 | | |
| Filenet Corp. ‡ | | | 4,400 | | | | 124 | | |
| Global Cash Access, Inc. ‡ | | | 5,400 | | | | 76 | | |
| Hyperion Solutions Corp. ‡ | | | 8,100 | | | | 392 | | |
| Informatica Corp. ‡ | | | 14,800 | | | | 176 | | |
| Inforte Corp. | | | 38,400 | | | | 152 | | |
| Jack Henry & Associates, Inc. | | | 6,400 | | | | 115 | | |
| Jamdat Mobile, Inc. ‡† | | | 5,700 | | | | 105 | | |
| Kenexa Corp. ‡ | | | 3,200 | | | | 54 | | |
| Macromedia, Inc. ‡ | | | 2,600 | | | | 114 | | |
| MatrixOne, Inc. ‡ | | | 32,700 | | | | 165 | | |
| Mercury Interactive Corp. ‡ | | | 500 | | | | 17 | | |
| Motive, Inc. ‡ | | | 7,100 | | | | 26 | | |
| MTC Technologies, Inc. ‡ | | | 8,900 | | | | 288 | | |
| NAVTEQ Corp. ‡ | | | 1,300 | | | | 51 | | |
| NCI, Inc.–Class A ‡ | | | 2,700 | | | | 33 | | |
| NetIQ Corp. ‡ | | | 2,700 | | | | 32 | | |
| Open Solutions, Inc. ‡† | | | 4,100 | | | | 88 | | |
| Packeteer, Inc. ‡ | | | 13,700 | | | | 108 | | |
| Quest Software, Inc. ‡ | | | 4,300 | | | | 60 | | |
| Radiant Systems, Inc. ‡ | | | 12,550 | | | | 143 | | |
| Red Hat, Inc. ‡† | | | 10,000 | | | | 232 | | |
The notes to the financial statements are an integral part of this report.
Transamerica IDEX Mutual Funds
Annual Report 2005
4
TA IDEX T. Rowe Price Small Cap
SCHEDULE OF INVESTMENTS (continued)
At October 31, 2005
(all amounts except share amounts in thousands)
| | | Shares | | Value | |
| Computer & Data Processing Services (continued) | | | |
| RightNow Technologies, Inc. ‡† | | | 10,000 | | | $ | 152 | | |
| RSA Security, Inc. ‡† | | | 6,100 | | | | 70 | | |
| Serena Software, Inc. ‡ | | | 6,000 | | | | 131 | | |
| SI International, Inc. ‡ | | | 1,800 | | | | 52 | | |
| SkillSoft PLC, ADR ‡ | | | 600 | | | | 2 | | |
| SRA International, Inc.–Class A ‡ | | | 12,200 | | | | 400 | | |
| Taleo Corp.–Class A ‡ | | | 4,500 | | | | 52 | | |
| Websense, Inc. ‡ | | | 4,700 | | | | 278 | | |
| Computer & Office Equipment (1.2%) | | | |
| Maxtor Corp. ‡ | | | 10,700 | | | | 37 | | |
| ScanSource, Inc. ‡† | | | 4,300 | | | | 244 | | |
| Symbol Technologies, Inc. | | | 5 | | | | - | o | |
| Zebra Technologies Corp.–Class A ‡† | | | 8,000 | | | | 345 | | |
| Construction (0.6%) | | | |
| Insituform Technologies, Inc.–Class A ‡ | | | 4,600 | | | | 83 | | |
| MDC Holdings, Inc. | | | 3,664 | | | | 251 | | |
| Drug Stores & Proprietary Stores (0.2%) | | | |
| Drugstore.Com, Inc. ‡ | | | 27,100 | | | | 86 | | |
| Educational Services (1.7%) | | | |
| Apollo Group, Inc.–Class A ‡ | | | 1,873 | | | | 118 | | |
| Corinthian Colleges, Inc. ‡ | | | 8,700 | | | | 108 | | |
| Education Management Corp. ‡ | | | 12,300 | | | | 379 | | |
| ITT Educational Services, Inc. ‡ | | | 5,800 | | | | 321 | | |
| Electrical Goods (0.4%) | | | |
| Hughes Supply, Inc. | | | 6,400 | | | | 214 | | |
| Electronic & Other Electric Equipment (0.9%) | | | |
| Aeroflex, Inc. ‡ | | | 28,700 | | | | 260 | | |
| Harman International Industries, Inc. | | | 1,200 | | | | 120 | | |
| SBS Technologies, Inc. ‡ | | | 9,100 | | | | 89 | | |
| Electronic Components & Accessories (6.0%) | | | |
| Advanced Energy Industries, Inc. ‡ | | | 20,200 | | | | 217 | | |
| AMIS Holdings, Inc. ‡ | | | 6,100 | | | | 68 | | |
| ATMI, Inc. ‡† | | | 4,100 | | | | 112 | | |
| Ceradyne, Inc. ‡† | | | 5,800 | | | | 227 | | |
| Color Kinetics, Inc. ‡† | | | 14,200 | | | | 216 | | |
| Cymer, Inc. ‡† | | | 7,400 | | | | 258 | | |
| Dolby Laboratories, Inc.–Class A ‡ | | | 4,000 | | | | 64 | | |
| Exar Corp. ‡ | | | 7,600 | | | | 96 | | |
| Integrated Device Technology, Inc. ‡ | | | 9,880 | | | | 98 | | |
| Integrated Silicon Solutions, Inc. ‡ | | | 16,100 | | | | 124 | | |
| Intersil Corp.–Class A | | | 11,596 | | | | 264 | | |
| Lattice Semiconductor Corp. ‡ | | | 7,800 | | | | 34 | | |
| Mercury Computer Systems, Inc. ‡ | | | 7,400 | | | | 141 | | |
| Micrel, Inc. ‡ | | | 5,200 | | | | 52 | | |
| | | Shares | | Value | |
| Electronic Components & Accessories (continued) | | | |
| Microchip Technology, Inc. | | | 575 | | | $ | 17 | | |
| Microsemi Corp. ‡ | | | 1,200 | | | | 28 | | |
| Omnivision Technologies, Inc. ‡† | | | 8,600 | | | | 111 | | |
| Pericom Semiconductor Corp. ‡ | | | 5,200 | | | | 41 | | |
| Semtech Corp. ‡ | | | 9,000 | | | | 136 | | |
| Silicon Storage Technology, Inc. ‡ | | | 14,500 | | | | 73 | | |
| Skyworks Solutions, Inc. ‡ | | | 6,900 | | | | 37 | | |
| Tessera Technologies, Inc. ‡† | | | 1,500 | | | | 42 | | |
| Triquint Semiconductor, Inc. ‡ | | | 6,226 | | | | 26 | | |
| TTM Technologies, Inc. ‡ | | | 29,000 | | | | 232 | | |
Varian Semiconductor Equipment
Associates, Inc. ‡† | | | 6,800 | | | | 257 | | |
| Virage Logic Corp. ‡ | | | 10,900 | | | | 85 | | |
| Zoran Corp. ‡ | | | 14,897 | | | | 219 | | |
| Environmental Services (1.0%) | | | |
| Stericycle, Inc. ‡† | | | 5,700 | | | | 328 | | |
| Waste Connections, Inc. ‡ | | | 6,300 | | | | 210 | | |
| Fabricated Metal Products (0.3%) | | | |
| Simpson Manufacturing Co., Inc. | | | 4,000 | | | | 158 | | |
| Food & Kindred Products (0.1%) | | | |
| Peet's Coffee & Tea, Inc. ‡† | | | 2,000 | | | | 67 | | |
| Food Stores (0.1%) | | | |
| Whole Foods Market, Inc. | | | 300 | | | | 43 | | |
| Furniture & Home Furnishings Stores (0.3%) | | | |
| Williams-Sonoma, Inc. ‡ | | | 4,000 | | | | 156 | | |
| Health Services (5.6%) | | | |
| Amedisys, Inc. ‡† | | | 5,600 | | | | 214 | | |
| Amsurg Corp. ‡ | | | 900 | | | | 21 | | |
| Community Health Systems, Inc. ‡ | | | 4,200 | | | | 156 | | |
| Coventry Health Care, Inc. ‡ | | | 8,550 | | | | 462 | | |
| DaVita, Inc. ‡ | | | 9,100 | | | | 448 | | |
| Gentiva Health Services, Inc. ‡ | | | 7,200 | | | | 106 | | |
| LifePoint Hospitals, Inc. ‡ | | | 4,000 | | | | 156 | | |
| Manor Care, Inc. | | | 3,700 | | | | 138 | | |
| Matria Healthcare, Inc. ‡ | | | 5,350 | | | | 179 | | |
| Omnicare, Inc. | | | 6,500 | | | | 352 | | |
| Renal Care Group, Inc. ‡ | | | 4,100 | | | | 192 | | |
| Symbion, Inc. ‡† | | | 9,000 | | | | 204 | | |
| Triad Hospitals, Inc. ‡ | | | 2,800 | | | | 115 | | |
| United Surgical Partners International, Inc. ‡ | | | 7,450 | | | | 267 | | |
| Holding & Other Investment Offices (0.9%) | | | |
| Affiliated Managers Group ‡† | | | 5,400 | | | | 414 | | |
| First Marblehead Corp. (The) † | | | 3,200 | | | | 95 | | |
The notes to the financial statements are an integral part of this report.
Transamerica IDEX Mutual Funds
Annual Report 2005
5
TA IDEX T. Rowe Price Small Cap
SCHEDULE OF INVESTMENTS (continued)
At October 31, 2005
(all amounts except share amounts in thousands)
| | | Shares | | Value | |
| Industrial Machinery & Equipment (2.3%) | | | |
| Actuant Corp.–Class A | | | 7,300 | | | $ | 355 | | |
| Axcelis Technologies, Inc. ‡ | | | 400 | | | | 2 | | |
| Brooks Automation, Inc. ‡ | | | 2,600 | | | | 30 | | |
| Engineered Support Systems, Inc. | | | 9,375 | | | | 379 | | |
| Entegris, Inc. ‡ | | | 12,500 | | | | 122 | | |
| FMC Technologies, Inc. ‡ | | | 3,200 | | | | 117 | | |
| Oil States International, Inc. ‡† | | | 7,000 | | | | 232 | | |
| Instruments & Related Products (3.1%) | | | |
| Anaren, Inc. ‡ | | | 1,300 | | | | 18 | | |
| Cohu, Inc. | | | 5,900 | | | | 137 | | |
| Cyberoptics Corp. ‡ | | | 28,200 | | | | 373 | | |
| Dionex Corp. ‡ | | | 1,650 | | | | 80 | | |
| FLIR Systems, Inc. ‡ | | | 11,700 | | | | 245 | | |
| Fossil, Inc. ‡† | | | 16,630 | | | | 260 | | |
| Herley Industries, Inc. ‡ | | | 3,400 | | | | 57 | | |
| II-VI, Inc. ‡ | | | 5,500 | | | | 98 | | |
| Itron, Inc. ‡ | | | 600 | | | | 26 | | |
| Mine Safety Appliances Co. | | | 3,700 | | | | 155 | | |
| Orbotech, Ltd. ‡ | | | 5,900 | | | | 128 | | |
| Rudolph Technologies, Inc. ‡† | | | 2,300 | | | | 28 | | |
| Varian, Inc. ‡ | | | 2,500 | | | | 92 | | |
| Insurance (1.5%) | | | |
| Max Reinsurance Capital, Ltd. | | | 7,300 | | | | 175 | | |
| RenaissanceRe Holdings, Ltd. | | | 2,600 | | | | 98 | | |
| Stancorp Financial Group, Inc. | | | 2,800 | | | | 258 | | |
| Triad Guaranty, Inc. ‡ | | | 2,400 | | | | 101 | | |
| WellChoice, Inc. ‡ | | | 2,600 | | | | 197 | | |
| Insurance Agents, Brokers & Service (0.3%) | | | |
| Brown & Brown, Inc. | | | 2,700 | | | | 147 | | |
| Leather & Leather Products (0.2%) | | | |
| Timberland Co.–Class A ‡ | | | 3,400 | | | | 96 | | |
| Management Services (2.3%) | | | |
| Corporate Executive Board Co. | | | 8,100 | | | | 669 | | |
| Navigant Consulting, Inc. ‡ | | | 4,600 | | | | 96 | | |
| Resources Connection, Inc. ‡ | | | 17,200 | | | | 491 | | |
| Manufacturing Industries (0.5%) | | | |
| Daktronics, Inc. | | | 4,400 | | | | 95 | | |
| Shuffle Master, Inc. ‡† | | | 6,900 | | | | 175 | | |
| Medical Instruments & Supplies (7.0%) | | | |
| Advanced Neuromodulation Systems, Inc. ‡ | | | 4,300 | | | | 262 | | |
| Armor Holdings, Inc. ‡ | | | 3,400 | | | | 152 | | |
| Arthocare Corp. ‡ | | | 5,000 | | | | 184 | | |
| Aspect Medical Systems, Inc. ‡† | | | 9,100 | | | | 297 | | |
| DENTSPLY International, Inc. | | | 4,050 | | | | 223 | | |
| Hologic, Inc. ‡ | | | 3,800 | | | | 211 | | |
| | | Shares | | Value | |
| Medical Instruments & Supplies (continued) | |
| ICU Medical, Inc. ‡† | | | 8,000 | | | $ | 279 | | |
| Inamed Corp. ‡ | | | 4,950 | | | | 352 | | |
| Integra LifeSciences Holdings Corp. ‡ | | | 3,700 | | | | 128 | | |
| Kyphon, Inc. ‡† | | | 4,200 | | | | 168 | | |
| Mentor Corp. | | | 2,600 | | | | 117 | | |
| Merit Medical Systems, Inc. ‡ | | | 5,700 | | | | 68 | | |
| Respironics, Inc. ‡ | | | 12,800 | | | | 459 | | |
| Steris Corp. | | | 12,100 | | | | 276 | | |
| Techne Corp. ‡ | | | 5,400 | | | | 293 | | |
| Thoratec Corp. ‡ | | | 14,200 | | | | 281 | | |
| Wright Medical Group, Inc. ‡† | | | 3,000 | | | | 56 | | |
| Motion Pictures (1.4%) | |
| Avid Technology, Inc. ‡† | | | 13,177 | | | | 649 | | |
| Macrovision Corp. ‡ | | | 6,200 | | | | 117 | | |
| Oil & Gas Extraction (5.6%) | |
| Atwood Oceanics, Inc. ‡ | | | 1,000 | | | | 70 | | |
| Bill Barrett Corp. ‡ | | | 8,000 | | | | 255 | | |
| Cabot Oil & Gas Corp. | | | 7,200 | | | | 330 | | |
| CAL Dive International, Inc. ‡† | | | 7,200 | | | | 443 | | |
| Comstock Resources, Inc. ‡ | | | 14,900 | | | | 449 | | |
| Forest Oil Corp. ‡ | | | 4,200 | | | | 183 | | |
| Global Industries, Ltd. ‡ | | | 9,400 | | | | 119 | | |
| Grey Wolf, Inc. ‡† | | | 9,000 | | | | 69 | | |
| Helmerich & Payne, Inc. | | | 1,900 | | | | 105 | | |
| Patterson-UTI Energy, Inc. | | | 8,400 | | | | 287 | | |
| Spinnaker Exploration Co. ‡ | | | 3,600 | | | | 222 | | |
| Stone Energy Corp. ‡ | | | 3,800 | | | | 174 | | |
| Unit Corp. ‡ | | | 6,100 | | | | 320 | | |
| Personal Services (0.2%) | |
| Jackson Hewitt Tax Service, Inc. | | | 3,600 | | | | 89 | | |
| Pharmaceuticals (6.7%) | |
| Abgenix, Inc. ‡ | | | 7,500 | | | | 78 | | |
| Alkermes, Inc. ‡† | | | 8,400 | | | | 137 | | |
| Amylin Pharmaceuticals, Inc. ‡† | | | 3,600 | | | | 121 | | |
| Andrx Corp. ‡ | | | 3,000 | | | | 46 | | |
| Arena Pharmaceuticals, Inc. ‡ | | | 3,400 | | | | 35 | | |
| Bradley Pharmaceuticals, Inc. ‡† | | | 3,200 | | | | 39 | | |
| Celgene Corp. ‡† | | | 2,000 | | | | 112 | | |
| Cephalon, Inc. ‡† | | | 1,924 | | | | 88 | | |
| Charles River Laboratories International, Inc. ‡ | | | 3,700 | | | | 162 | | |
| Digene Corp. ‡ | | | 10,600 | | | | 320 | | |
| Henry Schein, Inc. ‡ | | | 2,000 | | | | 79 | | |
| ICOS Corp. ‡ | | | 2,100 | | | | 57 | | |
| Idexx Laboratories, Inc. ‡† | | | 1,500 | | | | 105 | | |
| Invitrogen Corp. ‡ | | | 4,100 | | | | 261 | | |
| Martek Biosciences Corp. ‡† | | | 5,600 | | | | 173 | | |
The notes to the financial statements are an integral part of this report.
Transamerica IDEX Mutual Funds
Annual Report 2005
6
TA IDEX T. Rowe Price Small Cap
SCHEDULE OF INVESTMENTS (continued)
At October 31, 2005
(all amounts except share amounts in thousands)
| | | Shares | | Value | |
| Pharmaceuticals (continued) | |
| Medicines Co. ‡ | | | 11,500 | | | $ | 197 | | |
| Medicis Pharmaceutical Corp.–Class A † | | | 9,600 | | | | 283 | | |
| Myogen, Inc. ‡ | | | 1,700 | | | | 34 | | |
| Neurocrine Biosciences, Inc. ‡ | | | 4,800 | | | | 254 | | |
| Noven Pharmaceuticals, Inc. ‡ | | | 11,900 | | | | 168 | | |
| Par Pharmaceutical Cos., Inc. ‡† | | | 1,700 | | | | 44 | | |
| Protein Design Labs, Inc. ‡† | | | 14,300 | | | | 401 | | |
| Rigel Pharmaceuticals, Inc. ‡ | | | 1,600 | | | | 36 | | |
| Salix Pharmaceuticals, Ltd. ‡ | | | 8,669 | | | | 156 | | |
| Taro Pharmaceuticals Industries ‡† | | | 3,700 | | | | 81 | | |
| Tercica, Inc. ‡† | | | 4,900 | | | | 49 | | |
| Vertex Pharmaceuticals, Inc. ‡ | | | 4,294 | | | | 98 | | |
| Primary Metal Industries (0.2%) | |
| Lone Star Technologies, Inc. ‡ | | | 700 | | | | 32 | | |
| Steel Dynamics, Inc. † | | | 3,000 | | | | 93 | | |
| Printing & Publishing (0.2%) | |
| Scholastic Corp. ‡ | | | 1,500 | | | | 49 | | |
| Valassis Communications, Inc. ‡ | | | 2,000 | | | | 62 | | |
| Radio & Television Broadcasting (1.0%) | |
| COX Radio, Inc.–Class A ‡ | | | 6,100 | | | | 87 | | |
| Entercom Communications Corp. ‡ | | | 3,900 | | | | 113 | | |
| Gray Television, Inc. | | | 3,400 | | | | 31 | | |
| Radio One, Inc.–Class D ‡ | | | 13,200 | | | | 156 | | |
| Regent Communications, Inc. ‡ | | | 13,200 | | | | 67 | | |
| Spanish Broadcasting System, Inc.–Class A ‡ | | | 10,400 | | | | 63 | | |
| Radio, Television & Computer Stores (0.3%) | |
| GameStop Corp.–Class A ‡† | | | 4,400 | | | | 156 | | |
| Research & Testing Services (2.1%) | |
| Advisory Board Co. (The) ‡ | | | 12,800 | | | | 618 | | |
| Exelixis, Inc. ‡ | | | 6,700 | | | | 52 | | |
| Gen-Probe, Inc. ‡ | | | 3,600 | | | | 147 | | |
| Incyte Corp. ‡ | | | 18,500 | | | | 92 | | |
| Pharmaceutical Product Development, Inc. | | | 4,200 | | | | 241 | | |
| Residential Building Construction (0.5%) | |
| Toll Brothers, Inc. ‡† | | | 7,000 | | | | 258 | | |
| Restaurants (2.4%) | |
| BJ's Restaurants, Inc. ‡ | | | 9,400 | | | | 204 | | |
| CEC Entertainment, Inc. ‡† | | | 4,450 | | | | 150 | | |
| Cheesecake Factory (The) ‡† | | | 4,600 | | | | 158 | | |
| PF Chang's China Bistro, Inc. ‡† | | | 6,300 | | | | 288 | | |
| Rare Hospitality International, Inc. ‡ | | | 9,100 | | | | 278 | | |
| Sonic Corp. ‡ | | | 7,475 | | | | 216 | | |
| | | Shares | | Value | |
| Retail Trade (2.3%) | | | |
| AC Moore Arts & Crafts, Inc. ‡† | | | 14,800 | | | $ | 204 | | |
| Coldwater Creek, Inc. ‡ | | | 11,400 | | | | 308 | | |
| Hibbett Sporting Goods, Inc. ‡ | | | 10,050 | | | | 264 | | |
| Marvel Entertainment, Inc. ‡† | | | 5,850 | | | | 103 | | |
| Michaels Stores, Inc. | | | 5,400 | | | | 179 | | |
| Petsmart, Inc. | | | 2,800 | | | | 66 | | |
| Sportsman's Guide (The), Inc. ‡ | | | 1,100 | | | | 29 | | |
| Zumiez, Inc. ‡ | | | 2,300 | | | | 79 | | |
| Rubber & Misc. Plastic Products (0.1%) | | | |
| Trex Co., Inc. ‡† | | | 2,700 | | | | 56 | | |
| Savings Institutions (0.0%) | | | |
| IndyMac Bancorp, Inc. | | | 600 | | | | 22 | | |
| Security & Commodity Brokers (1.2%) | | | |
| Eaton Vance Corp. | | | 7,000 | | | | 174 | | |
| Greenhill & Co., Inc. | | | 1,700 | | | | 81 | | |
| Legg Mason, Inc. | | | 1,500 | | | | 161 | | |
| Raymond James Financial, Inc. | | | 6,900 | | | | 235 | | |
| Social Services (0.7%) | | | |
| Bright Horizons Family Solutions, Inc. ‡ | | | 9,200 | | | | 368 | | |
| Stone, Clay & Glass Products (0.5%) | | | |
| Gentex Corp. | | | 13,500 | | | | 254 | | |
| Telecommunications (2.3%) | | | |
| Adtran, Inc. | | | 9,500 | | | | 287 | | |
| Nextel Partners, Inc.–Class A ‡ | | | 18,900 | | | | 475 | | |
| NII Holdings, Inc.–Class B ‡† | | | 2,700 | | | | 224 | | |
| Novatel Wireless, Inc. ‡† | | | 1,700 | | | | 22 | | |
| Ubiquitel, Inc. ‡ | | | 11,500 | | | | 99 | | |
| Wireless Facilities, Inc. ‡† | | | 25,100 | | | | 168 | | |
| Transportation & Public Utilities (1.1%) | | | |
| UTI Worldwide, Inc. | | | 6,700 | | | | 573 | | |
| Transportation Equipment (0.2%) | | | |
| Thor Industries, Inc. | | | 4,100 | | | | 134 | | |
| Trucking & Warehousing (1.2%) | | | |
| Forward Air Corp. | | | 5,250 | | | | 186 | | |
| Old Dominion Freight Line, Inc. ‡ | | | 8,000 | | | | 283 | | |
| US Xpress Enterprises, Inc.–Class A ‡ | | | 5,600 | | | | 68 | | |
| Werner Enterprises, Inc. | | | 7,300 | | | | 131 | | |
| Variety Stores (0.3%) | | | |
| Fred's, Inc. † | | | 10,050 | | | | 150 | | |
| Wholesale Trade Durable Goods (2.2%) | | | |
| Cytyc Corp. ‡† | | | 8,800 | | | | 223 | | |
| Insight Enterprises, Inc. ‡ | | | 7,800 | | | | 160 | | |
| Interline Brands, Inc. ‡ | | | 1,400 | | | | 27 | | |
The notes to the financial statements are an integral part of this report.
Transamerica IDEX Mutual Funds
Annual Report 2005
7
TA IDEX T. Rowe Price Small Cap
SCHEDULE OF INVESTMENTS (continued)
At October 31, 2005
(all amounts except share amounts in thousands)
| | | Shares | | Value | |
| Wholesale Trade Durable Goods (continued) | |
| Patterson Cos., Inc. ‡ | | | 4,400 | | | $ | 182 | | |
| Reliance Steel & Aluminum Co. | | | 600 | | | | 34 | | |
| SCP Pool Corp. | | | 7,530 | | | | 271 | | |
| Symyx Technologies, Inc. ‡ | | | 9,600 | | | | 257 | | |
| West Marine, Inc. ‡ | | | 2,000 | | | | 27 | | |
| Wholesale Trade Nondurable Goods (1.3%) | |
| SunOpta, Inc. ‡† | | | 48,300 | | | | 239 | | |
| Tractor Supply Co. ‡ | | | 4,200 | | | | 204 | | |
| United Natural Foods, Inc. ‡ | | | 10,000 | | | | 281 | | |
| Total Common Stocks (cost: $45,510) | | | | | | | 53,292 | | |
| | | Principal | | Value | |
| SECURITY LENDING COLLATERAL (20.4%) | |
| Debt (18.9%) | |
| Bank Notes (1.2%) | |
Bank of America
| |
| 3.81%, due 06/07/2006 * | | $ | 310 | | | $ | 310 | | |
| 3.81%, due 08/10/2006 * | | | 307 | | | | 307 | | |
Credit Suisse First Boston Corp.
4.11%, due 03/10/2006 * | | | 62 | | | | 62 | | |
| Certificates Of Deposit (1.4%) | |
Canadian Imperial Bank of Commerce
4.07%, due 11/04/2005 * | | | 246 | | | | 246 | | |
Harris Trust & Savings Bank
3.80%, due 11/04/2005 * | | | 196 | | | | 196 | | |
Rabobank Nederland
4.03%, due 05/31/2006 * | | | 307 | | | | 307 | | |
| Commercial Paper (4.1%) | |
Ciesco LLC
4.00%, due 11/03/2005 | | | 307 | | | | 307 | | |
General Electric Capital Corp.
3.96%, due 12/05/2005 | | | 246 | | | | 246 | | |
Paradigm Funding LLC–144A
4.01%, due 11/07/2005 | | | 245 | | | | 245 | | |
Park Avenue Receivables Corp.–144A
4.03%, due 12/02/2005 | | | 243 | | | | 243 | | |
Preferred Receivables Corp.–144A
4.04%, due 12/05/2005 | | | 184 | | | | 184 | | |
Ranger Funding Co. LLC–144A
3.99%, due 11/15/2005 | | | 183 | | | | 183 | | |
Sheffield Receivables Corp.–144A
4.01%, due 11/08/2005 | | | 184 | | | | 184 | | |
Yorktown Capital LLC
3.97%, due 11/09/2005
3.93%, due 11/17/2005 | | | 306
305 | | | | 306
305 | | |
| | | Principal | | Value | |
| Euro Dollar Overnight (4.4%) | |
Bank of Montreal
3.79%, due 11/01/2005 | | $ | 184 | | | $ | 184 | | |
Barclays
3.80%, due 11/04/2005 | | | 246 | | | | 246 | | |
BNP Paribas
3.83%, due 11/02/2005 | | | 369 | | | | 369 | | |
Deutsche Bank
3.80%, due 11/02/2005 | | | 615 | | | | 615 | | |
HSBC Banking/Holdings PLC
3.84%, due 11/07/2005 | | | 184 | | | | 184 | | |
Royal Bank of Scotland
3.76%, due 11/01/2005 | | | 246 | | | | 246 | | |
Svenska Handlesbanken
4.03%, due 11/01/2005 | | | 317 | | | | 317 | | |
UBS AG
3.80%, due 11/03/2005 | | | 246 | | | | 246 | | |
| Euro Dollar Terms (1.6%) | |
Royal Bank of Scotland
4.00%, due 12/12/2005 | | | 246 | | | | 246 | | |
UBS AG
4.02%, due 12/01/2005 | | | 246 | | | | 246 | | |
Wells Fargo
3.96%, due 11/14/2005 | | | 369 | | | | 369 | | |
| Promissory Notes (0.5%) | |
Goldman Sachs Group, Inc.
4.02%, due 12/28/2005 | | | 258 | | | | 258 | | |
| Repurchase Agreements (5.7%) †† | |
Credit Suisse First Boston Corp.
4.10%, dated 10/31/2005 to be
repurchased at $419 on 11/01/2005 | | | 419 | | | | 419 | | |
Goldman Sachs Group, Inc. (The)
4.10%, dated 10/31/2005 to be
repurchased at $1,045 on 11/01/2005 | | | 1,045 | | | | 1,045 | | |
Lehman Brothers, Inc.
4.10%, dated 10/31/2005 to be
repurchased at $29 on 11/01/2005 | | | 29 | | | | 29 | | |
Merrill Lynch & Co.
4.10%, dated 10/31/2005 to be
repurchased at $1,230 on 11/01/2005 | | | 1,230 | | | | 1,230 | | |
Morgan Stanley Dean Witter & Co.
4.17%, dated 10/31/2005 to be
repurchased at $369 on 11/01/2005 | | | 369 | | | | 369 | | |
The notes to the financial statements are an integral part of this report.
Transamerica IDEX Mutual Funds
Annual Report 2005
8
TA IDEX T. Rowe Price Small Cap
SCHEDULE OF INVESTMENTS (continued)
At October 31, 2005
(all amounts except share amounts in thousands)
| | | Shares | | Value | |
| Investment Companies (1.5%) | | | |
| Money Market Funds (1.5%) | | | |
American Beacon Fund
1-day yield of 3.81% | | | 265,053 | | | $ | 265 | | |
Barclays Global Investors
Institutional Money Market Fund
1-day yield of 3.92% | | | 245,889 | | | | 246 | | |
Goldman Sachs Financial Square
Prime Obligations Fund
1-day yield of 3.79% | | | 38,302 | | | | 38 | | |
Merrimac Cash Fund,
Premium Class
1-day yield of 3.70% @ | | | 243,171 | | | | 243 | | |
| Total Security Lending Collateral (cost: $11,041) | | | | | | | 11,041 | | |
| Total Investment Securities (cost: $56,551) | | | | | | $ | 64,333 | | |
| SUMMARY: | | | |
| Investment securities, at value | | | 118.8 | % | | $ | 64,333 | | |
| Liabilities in excess of other assets | | | (18.8 | )% | | | (10,188 | ) | |
| Net assets | | | 100.0 | % | | $ | 54,145 | | |
NOTES TO SCHEDULE OF INVESTMENTS:
‡ Non-income producing.
† At October 31, 2005, all or a portion of this security is on loan (see Note 1). The value at October 31, 2005, of all securities on loan is $10,605.
o Value is less than $1.
* Floating or variable rate note. Rate is listed as of October 31, 2005.
†† Cash collateral for the Repurchase Agreements, valued at $3,153, that serve as collateral for securities lending are invested in corporate bonds with interest rates and maturity dates ranging from 0.00%–9.86% and 12/31/2005–11/15/2096, respectively.
@ Regulated investment company advised by Investors Bank and Trust Co. ("IBT"). IBT is also the accounting, custody and lending agent for the Fund.
l Investors Bank and Trust Co., a wholly-owned subsidiary of Investors Financial Services Corp., serves as the accounting, custody and lending agent for the Fund.
DEFINITIONS:
144A 144A Securities are registered pursuant to Rule 144A of the Securities Act of 1933. These securities are deemed to be liquid for purposes of compliance limitations on holdings of illiquid securities and may be resold as transactions exempt from registration, normally to qualified institutional buyers. At October 31, 2005, these securities aggregated $1,039 or 1.9% of the net assets of the Fund.
ADR American Depositary Receipt
The notes to the financial statements are an integral part of this report.
Transamerica IDEX Mutual Funds
Annual Report 2005
9
TA IDEX T. Rowe Price Small Cap
STATEMENT OF ASSETS AND LIABILITIES
At October 31, 2005
(all amounts except per share amounts in thousands)
| Assets: | | | |
Investment securities, at value (cost: $56,551)
(including securities loaned of $10,605) | | $ | 64,333 | | |
| Cash | | | 928 | | |
| Receivables: | |
| Investment securities sold | | | 311 | | |
| Shares of beneficial interest sold | | | 5 | | |
| Interest | | | 3 | | |
| Dividends | | | 7 | | |
| Other | | | 3 | | |
| | | | 65,590 | | |
| Liabilities: | | | |
| Investment securities purchased | | | 278 | | |
| Accounts payable and accrued liabilities: | |
| Shares of beneficial interest redeemed | | | 22 | | |
| Management and advisory fees | | | 33 | | |
| Distribution and service fees | | | 25 | | |
| Transfer agent fees | | | 13 | | |
| Administration fees | | | 1 | | |
| Payable for collateral for securities on loan | | | 11,041 | | |
| Other | | | 32 | | |
| | | | 11,445 | | |
| Net Assets | | $ | 54,145 | | |
| Net Assets Consist of: | | | |
Shares of beneficial interest, unlimited shares
authorized, no par value | | $ | 30,630 | | |
| Undistributed net investment income (loss) | | | – | | |
Undistributed net realized gain (loss) from investment
securities and futures contracts | | | 15,733 | | |
Net unrealized appreciation (depreciation) on
investment securities | | | 7,782 | | |
| Net Assets | | $ | 54,145 | | |
| Net Assets by Class: | | | |
| Class A | | $ | 38,007 | | |
| Class B | | | 11,328 | | |
| Class C | | | 4,810 | | |
| Shares Outstanding: | | | |
| Class A | | | 3,014 | | |
| Class B | | | 942 | | |
| Class C | | | 401 | | |
| Net Asset Value Per Share: | | | |
| Class A | | $ | 12.61 | | |
| Class B | | | 12.03 | | |
| Class C | | | 12.00 | | |
| Maximum Offering Price Per Share (a): | | | |
| Class A | | $ | 13.34 | | |
(a) Includes the maximum selling commission (represented as a percentage of offering price) which is reduced on certain levels of sales as set forth in the Prospectus. Net asset value per share for Classes B and C shares represents offering price. The redemption price for Classes B and C shares equals net asset value less any applicable contingent deferred sales charge.
STATEMENT OF OPERATIONS
For the year ended October 31, 2005
(all amounts in thousands)
| Investment Income: | | | |
| Interest | | $ | 12 | | |
| Dividends | | | 247 | | |
| Income from loaned securities–net | | | 24 | | |
| | | | 283 | | |
| Expenses: | | | |
| Management and advisory fees | | | 452 | | |
| Distribution and service fees: | |
| Class A | | | 155 | | |
| Class B | | | 118 | | |
| Class C | | | 51 | | |
| Transfer agent fees: | |
| Class A | | | 62 | | |
| Class B | | | 61 | | |
| Class C | | | 21 | | |
| Printing and shareholder reports | | | 24 | | |
| Custody fees | | | 27 | | |
| Administration fees | | | 11 | | |
| Legal fees | | | 5 | | |
| Audit fees | | | 18 | | |
| Trustees fees | | | 3 | | |
| Registration fees: | |
| Class A | | | 17 | | |
| Class B | | | 11 | | |
| Class C | | | 10 | | |
| Other | | | 1 | | |
| Total expenses | | | 1,047 | | |
| Less: | |
| Reimbursement of class expenses: | |
| Class B | | | (16 | ) | |
| Class C | | | (8 | ) | |
| Total reimbursed expenses | | | (24 | ) | |
| Net expenses | | | 1,023 | | |
| Net Investment Income (Loss) | | | (740 | ) | |
| Net Realized Gain (Loss) from: | | | |
| Investment securities | | | 16,633 | | |
| Futures contracts | | | 453 | | |
| | | | 17,086 | | |
Increase (decrease) in unrealized appreciation
(depreciation) on investment securities | | | (2,325 | ) | |
Net Gain (Loss) on Investment Securities and
Futures Contracts | | | 14,761 | | |
Net Increase (Decrease) in Net Assets Resulting
from Operations | | $ | 14,021 | | |
The notes to the financial statements are an integral part of this report.
Transamerica IDEX Mutual Funds
Annual Report 2005
10
TA IDEX T. Rowe Price Small Cap
STATEMENTS OF CHANGES IN NET ASSETS
For the years ended
(all amounts in thousands)
| | | October 31,
2005 | | October 31,
2004 | |
| Increase (Decrease) In Net Assets From: | |
| Operations: | |
| Net investment income (loss) | | $ | (740 | ) | | $ | (1,650 | ) | |
Net realized gain (loss) from
investment securities and
futures contracts | | | 17,086 | | | | 6,447 | | |
Net unrealized appreciation
(depreciation) on investment
securities | | | (2,325 | ) | | | (3,896 | ) | |
| | | | 14,021 | | | | 901 | | |
| Capital Share Transactions: | |
| Proceeds from shares sold: | |
| Class A | | | 2,848 | | | | 46,740 | | |
| Class B | | | 1,312 | | | | 2,565 | | |
| Class C | | | 977 | | | | 1,843 | | |
| Class C2 | | | – | | | | 432 | | |
| Class M | | | – | | | | 129 | | |
| | | | 5,137 | | | | 51,709 | | |
| Cost of shares redeemed: | |
| Class A | | | (106,299 | ) | | | (12,651 | ) | |
| Class B | | | (3,417 | ) | | | (3,171 | ) | |
| Class C | | | (1,843 | ) | | | (1,440 | ) | |
| Class C2 | | | – | | | | (584 | ) | |
| Class M | | | – | | | | (879 | ) | |
| | | | (111,559 | ) | | | (18,725 | ) | |
| Class level exchanges: | |
| Class C | | | – | | | | 4,045 | | |
| Class C2 | | | – | | | | (2,406 | ) | |
| Class M | | | – | | | | (1,639 | ) | |
| | | | – | | | | – | | |
| Automatic conversions: | |
| Class A | | | 31 | | | | – | | |
| Class B | | | (31 | ) | | | – | | |
| | | | – | | | | – | | |
| | | | (106,422 | ) | | | 32,984 | | |
| Net increase (decrease) in net assets | | | (92,401 | ) | | | 33,885 | | |
| Net Assets: | |
| Beginning of year | | | 146,546 | | | | 112,661 | | |
| End of year | | $ | 54,145 | | | $ | 146,546 | | |
Undistributed Net Investment Income
(Loss) | | $ | – | | | $ | (1 | ) | |
| | | October 31,
2005 | | October 31,
2004 | |
| Share Activity: | | | |
| Shares issued: | |
| Class A | | | 236 | | | | 4,181 | | |
| Class B | | | 115 | | | | 240 | | |
| Class C | | | 86 | | | | 173 | | |
| Class C2 | | | – | | | | 40 | | |
| Class M | | | – | | | | 13 | | |
| | | | 437 | | | | 4,647 | | |
| Shares redeemed: | |
| Class A | | | (9,203 | ) | | | (1,157 | ) | |
| Class B | | | (298 | ) | | | (301 | ) | |
| Class C | | | (161 | ) | | | (139 | ) | |
| Class C2 | | | – | | | | (53 | ) | |
| Class M | | | – | | | | (83 | ) | |
| | | | (9,662 | ) | | | (1,733 | ) | |
| Class level exchanges: | |
| Class C | | | – | | | | 381 | | |
| Class C2 | | | – | | | | (222 | ) | |
| Class M | | | – | | | | (159 | ) | |
| | | | – | | | | – | | |
| Automatic conversions: | |
| Class A | | | 3 | | | | – | | |
| Class B | | | (3 | ) | | | – | | |
| | | | – | | | | – | | |
Net increase (decrease) in shares
outstanding: | |
| Class A | | | (8,964 | ) | | | 3,024 | | |
| Class B | | | (186 | ) | | | (61 | ) | |
| Class C | | | (75 | ) | | | 415 | | |
| Class C2 | | | – | | | | (235 | ) | |
| Class M | | | – | | | | (229 | ) | |
| | | | (9,225 | ) | | | 2,914 | | |
The notes to the financial statements are an integral part of this report.
Transamerica IDEX Mutual Funds
Annual Report 2005
11
TA IDEX T. Rowe Price Small Cap
FINANCIAL HIGHLIGHTS
| | | | | For a share of beneficial interest outstanding throughout each period | |
| | | | | Net Asset | | Investment Operations | | Distributions | | Net Asset | |
| | | For the
Period
Ended (d)(g) | | Value,
Beginning
of Period | | Net
Investment
Income (Loss) | | Net Realized
and Unrealized
Gain (Loss) | | Total
Operations | | From Net
Investment
Income | | From Net
Realized
Gains | | Total
Distributions | | Value,
End
of Period | |
| Class A | | 10/31/2005 | | $ | 10.84 | | | $ | (0.11 | ) | | $ | 1.88 | | | $ | 1.77 | | | $ | – | | | $ | – | | | $ | – | | | $ | 12.61 | | |
| | | 10/31/2004 | | | 10.61 | | | | (0.12 | ) | | | 0.35 | | | | 0.23 | | | | – | | | | – | | | | – | | | | 10.84 | | |
| | | 10/31/2003 | | | 7.83 | | | | (0.15 | ) | | | 2.93 | | | | 2.78 | | | | – | | | | – | | | | – | | | | 10.61 | | |
| | | 10/31/2002 | | | 9.46 | | | | (0.16 | ) | | | (1.47 | ) | | | (1.63 | ) | | | – | | | | – | | | | – | | | | 7.83 | | |
| | | 10/31/2001 | | | 13.17 | | | | (0.14 | ) | | | (3.56 | ) | | | (3.70 | ) | | | – | | | | (0.01 | ) | | | (0.01 | ) | | | 9.46 | | |
| Class B | | 10/31/2005 | | | 10.44 | | | | (0.22 | ) | | | 1.81 | | | | 1.59 | | | | – | | | | – | | | | – | | | | 12.03 | | |
| | | 10/31/2004 | | | 10.28 | | | | (0.18 | ) | | | 0.34 | | | | 0.16 | | | | – | | | | – | | | | – | | | | 10.44 | | |
| | | 10/31/2003 | | | 7.63 | | | | (0.19 | ) | | | 2.84 | | | | 2.65 | | | | – | | | | – | | | | – | | | | 10.28 | | |
| | | 10/31/2002 | | | 9.29 | | | | (0.22 | ) | | | (1.44 | ) | | | (1.66 | ) | | | – | | | | – | | | | – | | | | 7.63 | | |
| | | 10/31/2001 | | | 13.05 | | | | (0.21 | ) | | | (3.54 | ) | | | (3.75 | ) | | | – | | | | (0.01 | ) | | | (0.01 | ) | | | 9.29 | | |
| Class C | | 10/31/2005 | | | 10.42 | | | | (0.22 | ) | | | 1.80 | | | | 1.58 | | | | – | | | | – | | | | – | | | | 12.00 | | |
| | | 10/31/2004 | | | 10.28 | | | | (0.22 | ) | | | 0.36 | | | | 0.14 | | | | – | | | | – | | | | – | | | | 10.42 | | |
| | | 10/31/2003 | | | 7.52 | | | | (0.20 | ) | | | 2.96 | | | | 2.76 | | | | – | | | | – | | | | – | | | | 10.28 | | |
| | | | | | | Ratios/Supplemental Data | |
| | | For the
Period | | Total | | Net Assets,
End of
Period | | Ratio of Expenses
to Average
Net Assets (a) | | Net Investment
Income (Loss)
to Average | | Portfolio
Turnover | |
| | | Ended (g) | | Return (c) | | (000's) | | Net (e) | | Total (f) | | Net Assets (a) | | Rate (b) | |
| Class A | | 10/31/2005 | | | 16.33 | % | | $ | 38,007 | | | | 1.42 | % | | | 1.42 | % | | | (0.95 | )% | | | 22 | % | |
| | | 10/31/2004 | | | 2.17 | | | | 129,809 | | | | 1.36 | | | | 1.36 | | | | (1.08 | ) | | | 29 | | |
| | | 10/31/2003 | | | 35.50 | | | | 95,018 | | | | 1.75 | | | | 1.93 | | | | (1.55 | ) | | | 25 | | |
| | | 10/31/2002 | | | (17.22 | ) | | | 6,487 | | | | 1.74 | | | | 2.67 | | | | (1.52 | ) | | | 55 | | |
| | | 10/31/2001 | | | (28.11 | ) | | | 7,067 | | | | 1.55 | | | | 2.56 | | | | (1.30 | ) | | | 49 | | |
| Class B | | 10/31/2005 | | | 15.22 | | | | 11,328 | | | | 2.36 | | | | 2.50 | | | | (1.92 | ) | | | 22 | | |
| | | 10/31/2004 | | | 1.56 | | | | 11,776 | | | | 1.94 | | | | 1.94 | | | | (1.67 | ) | | | 29 | | |
| | | 10/31/2003 | | | 34.73 | | | | 12,227 | | | | 2.40 | | | | 2.58 | | | | (2.20 | ) | | | 25 | | |
| | | 10/31/2002 | | | (17.85 | ) | | | 8,860 | | | | 2.39 | | | | 3.32 | | | | (2.17 | ) | | | 55 | | |
| | | 10/31/2001 | | | (28.73 | ) | | | 9,496 | | | | 2.20 | | | | 3.21 | | | | (1.95 | ) | | | 49 | | |
| Class C | | 10/31/2005 | | | 15.21 | | | | 4,810 | | | | 2.36 | | | | 2.51 | | | | (1.91 | ) | | | 22 | | |
| | | 10/31/2004 | | | 1.32 | | | | 4,961 | | | | 2.40 | | | | 2.40 | | | | (2.13 | ) | | | 29 | | |
| | | 10/31/2003 | | | 36.70 | | | | 628 | | | | 2.40 | | | | 2.58 | | | | (2.20 | ) | | | 25 | | |
NOTES TO FINANCIAL HIGHLIGHTS
(a) Annualized.
(b) Not annualized.
(c) Total Return has been calculated for the applicable period without deduction of a sales load, if any, on an initial purchase. Periods of less than one year are not annualized.
(d) Per share information is calculated based on average number of shares outstanding.
(e) Ratio of Net Expenses to Average Net Assets is net of fee waivers and reimbursements by the investment adviser, if any (see note 2).
(f) Ratio of Total Expenses to Average Net Assets includes all expenses before fee waivers and reimbursements by the investment adviser.
(g) The inception date for the Fund's offering of share Class C was November 11, 2002.
The notes to the financial statements are an integral part of this report.
Transamerica IDEX Mutual Funds
Annual Report 2005
12
TA IDEX T. Rowe Price Small Cap
NOTES TO FINANCIAL STATEMENTS
At October 31, 2005
(all amounts in thousands)
NOTE 1. ORGANIZATION AND SIGNIFICANT ACCOUNTING POLICIES
Transamerica IDEX Mutual Funds is an open-end management investment company registered under the Investment Company Act of 1940, as amended (the "1940 Act").
In the normal course of business, TA IDEX T. Rowe Price Small Cap (the "Fund") enters into contracts that contain a variety of representations that provide general indemnifications. The Fund's maximum exposure under these arrangements is unknown, as this would involve future claims that may be made against the Fund and/or its affiliates that have not yet occurred. However, based on experience, the Fund expects the risk of loss to be remote.
This report should be read in conjunction with the current Fund prospectus, which contains more complete information about the Fund.
The following is a summary of significant accounting policies followed by the Fund in the preparation of the financial statements. In preparing the Fund's financial statements in accordance with accounting principles generally accepted in the United States of America ("GAAP"), estimates or assumptions (which could differ from actual results) may be used that affect reported amounts and disclosures.
Multiple class operations, income and expenses: The Fund currently offers three classes of shares, each with a public offering price that reflects different sales charges, if any, and expense levels. On June 15, 2004, Class C2 shares merged into Class C. On September 24, 2004, Class M shares merged into Class C. Class B shares will convert to Class A shares eight years after purchase. Income, non-class specific expenses and realized and unrealized gains and losses, are allocated daily to each class, based upon the value of shares outstanding method as permitted under Rule 18f-3 of the 1940 Act. Each class bears its own specific expenses as well as a portion of general, common expenses.
Security valuations: The Fund values its investments at the close of the New York Stock Exchange ("NYSE"), normally 4 p.m. ET, each day the NYSE is open for business. Fund investments are valued at the last sale price or closing price on the day of valuation taken from the primary exchange where the security is principally traded.
Securities traded in the over-the-counter market and listed securities for which no sale was reported on that date are valued at the last quoted bid price.
Debt securities are valued based on a price quotation or other equivalent indication of value supplied by an exchange, a pricing service or a major market maker; however, those that mature in sixty days or less are valued at amortized cost, which approximates market.
Investment company securities are valued at the net asset value of the underlying portfolio.
Other securities for which quotations are not readily available or whose values have been determined to be unreliable are valued at fair market value as determined in good faith by the Fund's Administrative Valuation Committee, under the supervision of the Board's Valuation Committee, using guidelines adopted by the Board of Trustees.
Cash: The Fund may leave cash overnight in its cash account with the custodian, Investors Bank & Trust Company ("IBT"). IBT has been contracted on behalf of the Fund to invest the excess cash into a savings account, which at October 31, 2005, was paying an interest rate of 2.76%.
Repurchase agreements: The Fund is authorized to enter into repurchase agreements. The Fund, through its custodian, IBT, receives delivery of the underlying securities, the value of which at the time of purchase is required to be an amount equal to at least 100% of the resale price. The Fund will bear the risk of value fluctuations until the security can be sold and may encounter delays and incur costs in liquidating the security. In the event of bankruptcy or insolvency of the seller, delays and costs may be incurred.
Commission recapture: The sub-adviser, to the extent consistent with the best execution and usual commission rate policies and practices, may place security transactions of the Fund with broker/dealers with which Transamerica IDEX Mutual Funds has established a Commission Recapture Program. A Commission Recapture Program is any arrangement under which a broker/dealer applies a portion of the commissions received by such broker/dealer on the security transactions to the Fund. In no event will commissions paid by the Fund be used to pay expenses that would otherwise be borne by any other funds within Transamerica IDEX Mutual Funds, or by any other party.
Recaptured commissions during the year ended October 31, 2005, of less than $1 are included in net realized gains in the Statement of Operations.
Securities lending: The Fund may lend securities to qualified borrowers, with IBT acting as the Fund's lending agent. The Fund earns negotiated lenders' fees. The Fund receives cash and/or securities as collateral against the loaned securities. Cash collateral received is invested in short term, interest bearing securities. The Fund monitors the market value of securities loaned on a daily basis and requires collateral in an amount at least equal to the value of the securities loaned. Income from loaned securities on the Statement of Operations is net of fees, in the amount of $10, earned by IBT for its services.
Security transactions and investment income: Security transactions are recorded on the trade date. Security gains and losses are calculated on the specific identification basis. Dividend income, if any, is recorded on the ex-dividend date or, in the case of foreign securities, as soon as the Fund is informed of the ex-dividend date. Interest income, including accretion of discounts and amortization of premiums, is recorded on the accrual basis commencing on the settlement date.
Transamerica IDEX Mutual Funds
Annual Report 2005
13
TA IDEX T. Rowe Price Small Cap
NOTES TO FINANCIAL STATEMENTS (continued)
At October 31, 2005
(all amounts in thousands)
NOTE 1.–(continued)
Futures contracts: The Fund may enter into futures contracts to manage exposure to market, interest rate or currency fluctuations. Futures contracts are valued at the settlement price established each day by the board of trade or exchange on which they are traded. The primary risks associated with futures contracts are imperfect correlation between the change in market value of the securities held and the prices of futures contracts; the possibility of an illiquid market and inability of the counterparty to meet the contract terms.
At October 31, 2005, there were no open futures contracts.
Redemption fees: A short-term trading redemption fee may be assessed on any Fund shares in a fund account that are sold during the first five (5) NYSE trading days following their purchase date. This redemption fee will equal 2% of the amount redeemed and shares held the longest will be treated as being redeemed first and shares held the shortest as being redeemed last. For the year ended October 31, 2005, the Fund received less than $1 in redemption fees.
Dividend distributions: Distributions to shareholders are recorded on the ex-dividend date and are determined in accordance with Federal income tax regulations which may differ from GAAP.
NOTE 2. RELATED PARTY TRANSACTIONS
Effective January 1, 2005 AEGON/Transamerica Fund Advisors, Inc. was renamed Transamerica Fund Advisors, Inc. ("TFAI"); AEGON/Transamerica Fund Services, Inc. and AEGON/Transamerica Investor Services, Inc. merged into one entity and was renamed Transamerica Fund Services, Inc. ("TFS").
TFAI is the Fund's investment adviser. TFS is the Fund's administrator and transfer agent. AFSG Securities Corp. ("AFSG") is the Fund's distributor/principal underwriter. TFAI, TFS, and AFSG are affiliates of AEGON, NV, a Netherlands corporation.
The following schedule reflects the percentage of Fund assets owned by affiliated mutual funds:
| | | Net
Assets | | % of
Net Assets | |
TA IDEX Asset Allocation–
Conservative Portfolio | | $ | 2,093 | | | | 3.87 | % | |
TA IDEX Asset Allocation–
Moderate Portfolio | | | 25,499 | | | | 47.09 | % | |
| Total | | $ | 27,592 | | | | 50.96 | % | |
Investment advisory fees: The Fund pays management fees to TFAI based on average daily net assets ("ANA") at the following breakpoints:
From November 1, 2004 to December 31, 2004
0.80% of the first $500 million of ANA
0.70% of ANA over $500 million
From January 1, 2005 on:
0.75% of the first $500 million of ANA
0.70% of ANA over $500 million
TFAI has contractually agreed to waive its advisory fee and will reimburse the Fund to the extent that operating expenses, excluding 12b-1 fees, exceed the following stated annual limit:
From November 1, 2004 to December 31, 2004
1.40% Expense Limit
From January 1, 2005 on:
1.35% Expense Limit
The sub-adviser, T. Rowe Price, has agreed to a pricing discount based on the aggregate assets that they manage in the Transamerica IDEX Mutual Funds. The amount of the discount received by the Fund at October 31, 2005 was $5.
Distribution and service fees: The Fund has a 12b-1 distribution plan under the 1940 Act pursuant to which an annual fee, based on average daily net assets, is paid to the distributor for various disbursements such as broker-dealer account servicing fees and other promotional expenses of the Fund. The Fund is authorized under the 12b-1 plan to pay fees on each class up to the following limits:
| Class A | | | 0.35 | % | |
| Class B | | | 1.00 | % | |
| Class C | | | 1.00 | % | |
In the case the Fund or a class of shares of the Fund is closed to new investors or investments, the Fund is authorized to pay 12b-1 fees for past sales and distribution efforts and present and past investor services.
Underwriter commissions relate to front-end sales charges imposed for Class A shares and contingent deferred sales charges from Classes B, C, and certain A share redemptions. For the year ended October 31, 2005, the underwriter commissions were as follows:
| Received by Underwriter | | $ | 114 | | |
| Retained by Underwriter | | | 7 | | |
| Contingent Deferred Sales Charge | | | 26 | | |
Administrative services: The Fund has entered into an agreement with TFS for financial and legal fund administration services. As of January 1, 2005 the Fund pays TFS an annual fee of 0.02% of ANA. Prior to January 1, 2005 the Fund paid TFS an annual fee of 0.015% of ANA.
Transamerica IDEX Mutual Funds
Annual Report 2005
14
TA IDEX T. Rowe Price Small Cap
NOTES TO FINANCIAL STATEMENTS (continued)
At October 31, 2005
(all amounts in thousands)
NOTE 2.–(continued)
The Legal fees on the Statement of Operations are for fees paid to external legal counsel.
Transfer agent fees: The Fund pays TFS an annual per-account charge for each open and closed account. The Fund paid TFS $138 for the year ended October 31, 2005.
Deferred compensation plan: Each eligible independent Fund Trustee may elect to participate in a non-qualified deferred compensation plan maintained by Transamerica IDEX Mutual Funds (the "Plan"). Under the Plan, such Trustees may defer payment of all or a portion of their total fees earned as a Fund Trustee. Each Trustee who is a participant in the Plan may elect that the earnings, losses or gains credited to his or her deferred fee amounts be determined based on a deemed investment in any series of Transamerica IDEX Mutual Funds, including the Fund. The right of a participant to receive a distribution from the Plan of the deferred fees is an unsecured claim against the general assets of all series of Transamerica IDEX Mutual Funds. The pro rata liability to the Fund of all deferred fees in the Plan amounted, as of October 31, 2005, to $4.
NOTE 3. INVESTMENT TRANSACTIONS
The cost of securities purchased and proceeds from securities sold (excluding short-term securities) for the year ended October 31, 2005, were as follows:
| Purchases of securities: | | | |
| Long-Term | | $ | 13,726 | | |
| U.S. Government | | | – | | |
| Proceeds from maturities and sales of securities: | | | |
| Long-Term | | | 119,443 | | |
| U.S. Government | | | – | | |
NOTE 4. FEDERAL INCOME TAX MATTERS
The Fund has not made any provision for federal income or excise taxes due to its policy to distribute all of its taxable income and capital gains to its shareholders and otherwise qualify as a regulated investment company under Subchapter M of the Internal Revenue Code. Income and capital gain distributions are determined in accordance with income tax regulations, which may differ from GAAP. These differences are primarily due to differing treatment for items including, but not limited to, wash sales and net operating losses.
Therefore, distributions determined in accordance with tax regulations may differ significantly in amount or character from net investment income and realized gains for financial reporting purposes. Financial reporting records are adjusted for permanent book/tax differences to reflect tax character. Financial records are not adjusted for temporary differences. These reclassifications are as follows:
Shares of beneficial interest, unlimited
shares authorized | | $ | (740 | ) | |
| Undistributed net investment income (loss) | | | 741 | | |
Undistributed net realized gain (loss) from investment
securities | | | (1 | ) | |
The capital loss carryforward utilized during the year ended October 31, 2005 was $818.
The tax basis components of distributable earnings as of October 31, 2005, are as follows:
| Undistributed Ordinary Income | | $ | – | | |
| Undistributed Long-term Capital Gains | | $ | 15,969 | | |
| Capital Loss Carryforward | | $ | – | | |
| Net Unrealized Appreciation (Depreciation) | | $ | 7,546 | | |
The aggregate cost of investments and composition of unrealized appreciation (depreciation) for federal income tax purposes as of October 31, 2005, are as follows:
| Federal Tax Cost Basis | | $ | 56,787 | | |
| Unrealized Appreciation | | $ | 11,089 | | |
| Unrealized (Depreciation) | | | (3,543 | ) | |
| Net Unrealized Appreciation (Depreciation) | | $ | 7,546 | | |
NOTE 5. REGULATORY PROCEEDINGS
There continues to be significant federal and state regulatory activity relating to financial services companies, particularly mutual fund companies and their investment advisers. As part of an ongoing investigation regarding potential market timing, recordkeeping and trading compliance issues and matters affecting the Fund's investment adviser, TFAI, and affiliates and former employees of TFAI, the SEC staff has indicated that it is likely to take some action against TFAI and certain of its affiliates at the conclusion of the investigation. The potential timing and the scope of any such action is difficult to predict. Although the impact of any action brought against TFAI and/or its affiliates is difficult to assess at the present time, the Fund currently believes that the likelihood that any such action will have a material adverse impact on it is remote. It is important to note that the Fund is not aware of any allegation of wrongdoing against it and its Board at the time this annual report is printed. Although it is not anticipated that these developments will have an adverse impact on the Fund, there can be no assurance at this time. TFAI and its affiliates are actively working with the SEC in regard to this matter; however, the exact resolution cannot be determined at this time. TFAI will take such actions that it deems necessary or appropriate to continue providing management services to the Fund and to bring all matters to an appropriate conclusion.
TFAI and/or its affiliates, and not the Fund, will bear the costs regarding these regulatory matters.
Transamerica IDEX Mutual Funds
Annual Report 2005
15
Report of Independent Registered Certified Public Accounting Firm
To the Board of Trustees and Shareholders of
TA IDEX T. Rowe Price Small Cap
In our opinion, the accompanying statement of assets and liabilities, including the schedule of investments, and the related statements of operations and of changes in net assets and the financial highlights present fairly, in all material respects, the financial position of TA IDEX T. Rowe Price Small Cap (the "Fund") (one of the portfolios constituting the Transamerica IDEX Mutual Funds) at October 31, 2005, the results of its operations for the year then ended, the changes in its net assets for each of the two years in the period then ended and the financial highlights for each of the periods presented, in conformity with accounting principles generally accepted in the United States of America. These financial statements and financial highlights (hereafter referred to as "financial statements") are the responsibility of the Fund's management; our responsibility is to express an opinion on these financial statements based on our audits. We conducted our audits of these financial statements in accordance with the standards of the Public Company Accounting Oversight Board (United States). Those standards require that we plan and perform the audit to obtain reasonable assurance about whether the financial statements are free of material misstatement. An audit includes examining, on a test basis, evidence supporting the amounts and disclosures in the financial statements, assessing the accounting principles used and significant estimates made by management, and evaluating the overall financial statement presentation. We believe that our audits, which included confirmation of securities at October 31, 2005 by correspondence with the custodian, provide a reasonable basis for our opinion.

December 22, 2005
Transamerica IDEX Mutual Funds
Annual Report 2005
16
TA IDEX T. Rowe Price Tax-Efficient Growth
MARKET ENVIRONMENT
Despite rising short-term interest rates and surging energy costs, U.S. stocks produced respectable gains in the twelve month period ended October 31, 2005. Equities were supported by a moderate economic expansion, generally favorable corporate earnings growth, and low long-term interest rates. The market's gains were capped by fears of higher inflation and slower economic growth toward the end of our reporting period.
Our large-cap growth style of investing was not in favor over the last year, as value stocks had a performance advantage over growth across all market capitalizations, as measured by various Russell indexes, and mid- and small-cap shares outperformed their larger rivals. However, we are encouraged that large-cap growth stocks outperformed their value-oriented peers in the last six months.
Energy stocks dominated over the last year as oil prices climbed to $70 per barrel by late August, so avoiding the sector, which stems from the lack of companies that can grow their earnings steadily in the absence of rising commodity prices, was disadvantageous. Trends do not last indefinitely, and we believe investors will eventually discover that there are high-quality companies in many sectors capable of producing steady earnings growth that will not taper off as a cyclical trend comes to an end.
PERFORMANCE
For the year ended October 31, 2005, TA IDEX T. Rowe Price Tax-Efficient Growth, Class A returned 4.31%. By comparison its primary and former benchmarks, the Russell 1000 Growth Index and the Standard and Poor's 500 Composite Stock Index ("S&P 500"), returned 8.81% and 8.71%, respectively.
STRATEGY REVIEW
The portfolio invests in stocks of large-cap growth companies that have strong prospects and are market leaders within their niches. We plan to own our companies for a long time, so we focus on those with strong, sustainable market positions and high returns on capital. We do not trade opportunistically or rotate from sector to sector because, we believe, successful market timing is nearly impossible. We try not to realize gains unless a company's long-term outlook has deteriorated materially. In addition, we will sell investments that have declined and accumulate tax losses that can be used to offset future gains.
The portfolio returned 4.31% for the twelve month period ended October 31, 2005, but trailed the S&P 500, a blend of growth and value stocks, which returned 8.71%. The Fund lagged because we avoided the energy sector and because of weakness in our holdings in the information technology sector ("IT"), which detracted the most in absolute terms. The underlying industry that fared the worst over the last year was semiconductors: semiconductor companies Xilinx, Inc., Maxim Integrated Products, and Analog Devices, Inc. had great negative impact in absolute terms. On the plus side, stock selection in the health care and financials sectors, were the best performing sectors in absolute terms. Our overweighting of health care providers and capital markets companies, the two top-performing underlying industries, helped our relative results. Our largest contributor s to absolute performance included managed care companies WellPoint, Inc. and UnitedHealth Group Inc. and asset managers Franklin Resources, Inc. and Northern Trust Corporation. Credit rating agency Moody's Corp. also performed very well.
Although we are disappointed with the short-term relative performance of the Fund, we remain convinced that the solid fundamentals of our holdings, including good growth prospects, high returns on capital, and competitive positions in their fields of business, coupled with low portfolio turnover and high tax efficiency will lead to favorable long-term results. As of October 31st, we emphasized companies in the IT, consumer discretionary, health care, and financials sectors, whereas stocks of consumer staples and industrials and business services companies represented lesser commitments. We held no energy, utility, or telecommunication services companies and had very little exposure to the materials sector. We feel that companies with good growth prospects and high, sustainable returns on equity are seldom found in these areas.
Donald J. Peters
Fund Manager
T. Rowe Price Associates, Inc.
Transamerica IDEX Mutual Funds
Annual Report 2005
1
TA IDEX T. Rowe Price Tax-Efficient Growth
Comparison of change in value of $10,000 investment in Class A shares and its comparative indices.
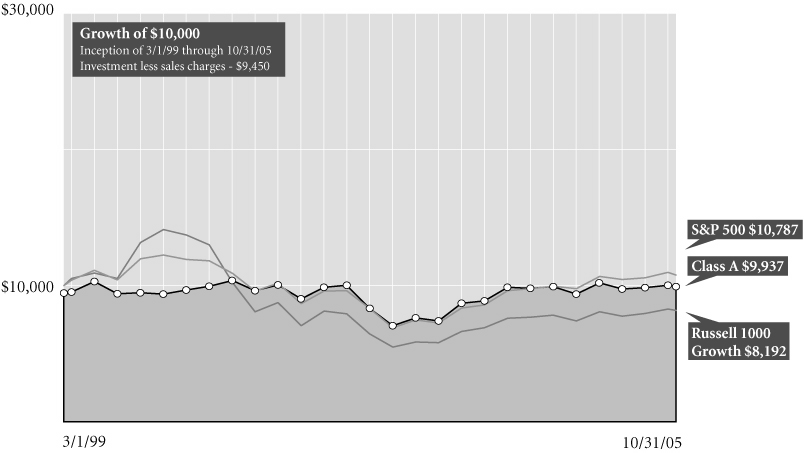
Average Annual Total Return for Periods Ended 10/31/05
| | | 1 year | | 5 years | | From
Inception | | Inception
Date | |
| Class A (NAV) | | | 4.31 | % | | | (0.49 | )% | | | 0.74 | % | | 3/1/99 | |
| Class A (POP) | | | (1.42 | )% | | | (1.61 | )% | | | (0.11 | )% | | 3/1/99 | |
| Return after taxes on distributions2 | | | (1.42 | )% | | | (1.62 | )% | | | (0.19 | )% | | 3/1/99 | |
| Return after taxes on distributions and sale of fund shares2 | | | (0.92 | )% | | | (1.37 | )% | | | (0.14 | )% | | 3/1/99 | |
| Russell 1000 Growth1 | | | 8.81 | % | | | (7.93 | )% | | | (2.94 | )% | | 3/1/99 | |
| S&P 5001 | | | 8.71 | % | | | (1.73 | )% | | | 1.14 | % | | 3/1/99 | |
| Class B (NAV) | | | 3.62 | % | | | (1.14 | )% | | | 0.09 | % | | 3/1/99 | |
| Class B (POP) | | | (1.38 | )% | | | (1.34 | )% | | | 0.09 | % | | 3/1/99 | |
| Class C (NAV) | | | 3.65 | % | | | – | | | | 8.32 | % | | 11/11/02 | |
| Class C (POP) | | | 2.65 | % | | | – | | | | 8.32 | % | | 11/11/02 | |
NOTES
1 The Russell 1000 Growth (Russell 1000 Growth) Index and the Standard and Poor's 500 Composite Stock (S&P 500) Index are unmanaged indices used as a general measure of market performance. Calculations assume dividends and capital gains are reinvested and do not include any managerial expenses. From inception calculation is based on life of Class A shares. For reporting periods through October 31, 2004, the Fund had selected the S&P 500 as its benchmark measure; however, the Russell 1000 is more appropriate for comparison to the Fund. Source: Standard & Poor's Micropal®© Micropal, Inc. 2005 – 1-800-596-5323 – http://www.funds-sp.com.
2 The after-tax returns are calculated using the historic highest individual federal marginal income tax rates and do not reflect the impact of state and local taxes.
The performance data presented represents past performance, future results may vary. Performance data does not reflect the deduction of taxes that would be paid on fund distributions or the redemption of fund shares. Investment return and principal value will fluctuate so that an investor's shares, when redeemed, may be worth more or less than their original cost. Current performance may be lower or higher than performance quoted. Please see www.transamericaidex.com for performance data current to the most recent month-end.
Public Offering Price (POP) returns include the reinvestment of dividends and capital gains and reflect the maximum sales charge of 5.5% for A shares or the maximum applicable contingent deferred sales charge (5% in the 1st year, decreasing to 0% after 6 years) for Class B shares and 1% (during the first 12 months) for Class C shares. Shares purchased prior to March 1, 2004 are subject to a maximum applicable contingent deferred sales charge (5% in the 1st year, decreasing to 0% after 7 years) for Class B shares and (2% in the 1st year, decreasing to 0% after 2 years) for Class C shares. Net Asset Value (NAV) returns include the reinvestment of dividends and capital gains but do not reflect any sales charges.
Funds managed for tax efficiency may not be suitable for IRAs and other nontaxable accounts, as the pre-tax returns may be lower than a similar fund that is not managed with tax considerations. In addition, while tax managed funds have the ability to distribute capital gains, investors may still incur a taxable gain upon liquidating their account.
This material must be preceded or accompanied by a current prospectus, which includes specific contents regarding the investment objectives and policies of this fund.
Transamerica IDEX Mutual Funds
Annual Report 2005
2
TA IDEX T. Rowe Price Tax-Efficient Growth
UNDERSTANDING YOUR FUND'S EXPENSES
(unaudited)
SHAREHOLDER EXPENSES
Fund shareholders may incur two types of costs: (1) transaction costs, including sales charges (loads) on purchases, contingent deferred sales charges on redemptions and redemption fees; and (2) ongoing costs, including management fees, 12b-1 distribution and service fees, and other fund expenses.
The following Example is intended to help you understand your ongoing costs (in dollars and cents) of investing in a Fund and to compare these costs with the ongoing costs of investing in other funds.
The Example is based on an investment of $1,000 invested at May 1, 2005 and held for the entire period until October 31, 2005.
ACTUAL EXPENSES
The first line in the table below provides information about actual account values and actual expenses. You may use the information in this line, together with the amount you invested, to estimate the expenses that you paid over the period. Simply divide your account value by $1,000 (for example, an $8,600 account value divided by $1,000 = 8.6), then multiply the result by the number in the first line of your Fund under the heading entitled "Expenses Paid During Period" to estimate the expenses you paid on your account during this period. If your account is an IRA, your expenses could have included a $15 annual fee. The amount of any fee paid through your account would increase the estimate of expenses you paid during the period and decrease your ending account value.
HYPOTHETICAL EXAMPLE FOR COMPARISON PURPOSES
The second line in the table below provides information about hypothetical account values and hypothetical expenses based on the Fund's actual expense ratio and an assumed rate of return of 5% per year before expenses, which is not the Fund's actual return. The hypothetical account values and expenses may not be used to estimate the actual ending account balance or expenses you paid for the period. You may use this information to compare the ongoing costs of investing in your Fund and other funds. To do so, compare this 5% hypothetical example with the 5% hypothetical examples that appear in the shareholder reports of the other funds. As in the case of the actual expense example, if your account is subject to an IRA fee, the amount of the fee paid through your account would increase the hypothetical expenses you would have paid during the period and decrease the hypothetical ending account value.
Please note that the expenses shown in the table are meant to highlight your ongoing costs only and do not reflect any transactional costs, such as sales charges, redemption fees, brokerage commissions paid on purchases and sales of fund shares. Therefore, the second line under the Fund in the table is useful in comparing ongoing costs only, and will not help you determine the relative total costs of owning different funds. If any of these transaction costs were included, your costs would be higher. The expenses shown in the table do not reflect any fees that may be charged to you by brokers, financial intermediaries or other financial institutions.
| | | Beginning
Account
Value | | Ending
Account
Value | | Annualized
Expense
Ratio | | Expenses Paid
During Period (a) | |
| Class A | |
| Actual | | $ | 1,000.00 | | | $ | 1,038.10 | | | | 1.69 | % | | $ | 8.68 | | |
| Hypothetical (b) | | | 1,000.00 | | | | 1,016.69 | | | | 1.69 | | | | 8.59 | | |
| Class B | |
| Actual | | | 1,000.00 | | | | 1,035.10 | | | | 2.36 | | | | 12.11 | | |
| Hypothetical (b) | | | 1,000.00 | | | | 1,013.31 | | | | 2.36 | | | | 11.98 | | |
| Class C | |
| Actual | | | 1,000.00 | | | | 1,035.10 | | | | 2.35 | | | | 12.05 | | |
| Hypothetical (b) | | | 1,000.00 | | | | 1,013.36 | | | | 2.35 | | | | 11.93 | | |
(a) Expenses are calculated using each Fund's annualized expense ratio (as disclosed in the table), multiplied by the average account value for the period, multiplied by number of days in the period (184 days), and divided by the number of days in the year (365 days).
(b) 5% return per year before expenses.
GRAPHICAL PRESENTATION OF SCHEDULE OF INVESTMENTS
By Sector
At October 31, 2005
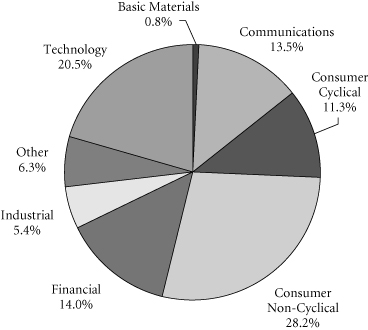
This chart shows the percentage breakdown by sector of the Fund's total investment securities.
Transamerica IDEX Mutual Funds
Annual Report 2005
3
TA IDEX T. Rowe Price Tax-Efficient Growth
SCHEDULE OF INVESTMENTS
At October 31, 2005
(all amounts except share amounts in thousands)
| | | Shares | | Value | |
| COMMON STOCKS (99.7%) | |
| Aerospace (0.7%) | |
| Boeing Co. (The) | | | 2,600 | | | $ | 168 | | |
| Amusement & Recreation Services (1.5%) | |
| Disney (Walt) Co. (The) | | | 6,400 | | | | 156 | | |
| Station Casinos, Inc. | | | 2,900 | | | | 186 | | |
| Apparel Products (0.6%) | |
| Cintas Corp. † | | | 3,300 | | | | 134 | | |
| Automotive (0.5%) | |
| Harley-Davidson, Inc. | | | 2,200 | | | | 109 | | |
| Beverages (2.9%) | |
| Anheuser-Busch Cos., Inc. | | | 1,900 | | | | 78 | | |
| Coca-Cola Co. (The) | | | 6,300 | | | | 269 | | |
| PepsiCo, Inc. | | | 5,070 | | | | 299 | | |
| Business Credit Institutions (0.5%) | |
| Freddie Mac | | | 2,000 | | | | 123 | | |
| Business Services (7.9%) | |
| ChoicePoint, Inc. ‡ | | | 1,900 | | | | 80 | | |
| Clear Channel Communications, Inc. | | | 3,600 | | | | 109 | | |
| eBay, Inc. ‡ | | | 10,800 | | | | 428 | | |
| Equifax, Inc. | | | 700 | | | | 24 | | |
| First Data Corp. | | | 3,700 | | | | 150 | | |
| Getty Images, Inc. ‡ | | | 700 | | | | 58 | | |
| Monster Worldwide, Inc. ‡ | | | 4,300 | | | | 141 | | |
| Moody's Corp. | | | 4,200 | | | | 224 | | |
| Omnicom Group, Inc. | | | 2,800 | | | | 232 | | |
| Robert Half International, Inc. | | | 4,400 | | | | 162 | | |
| WPP Group PLC, Sponsored ADR | | | 3,300 | | | | 163 | | |
| Chemicals & Allied Products (4.0%) | |
| Avon Products, Inc. | | | 4,200 | | | | 113 | | |
| Colgate-Palmolive Co. | | | 2,700 | | | | 143 | | |
| Ecolab, Inc. | | | 3,600 | | | | 119 | | |
| Monsanto Co. | | | 1,000 | | | | 63 | | |
| Procter & Gamble Co. | | | 6,687 | | | | 374 | | |
| Valspar Corp. | | | 3,400 | | | | 75 | | |
| Commercial Banks (8.4%) | |
| Bank of New York Co., Inc. (The) | | | 3,900 | | | | 122 | | |
| Citigroup, Inc. | | | 8,059 | | | | 369 | | |
| Mellon Financial Corp. | | | 4,000 | | | | 127 | | |
| Northern Trust Corp. | | | 9,100 | | | | 488 | | |
| State Street Corp. | | | 8,800 | | | | 486 | | |
| Wells Fargo & Co. | | | 4,800 | | | | 289 | | |
| Communication (0.7%) | |
| Certegy, Inc. | | | 1,200 | | | | 45 | | |
| Viacom, Inc.–Class B | | | 3,800 | | | | 118 | | |
| | | Shares | | Value | |
| Communications Equipment (0.4%) | |
| Nokia Corp., ADR | | | 5,000 | | | $ | 84 | | |
| Computer & Data Processing Services (8.4%) | |
| Adobe Systems, Inc. † | | | 1,600 | | | | 52 | | |
| Automatic Data Processing, Inc. | | | 4,200 | | | | 196 | | |
| Electronic Arts, Inc. ‡ | | | 500 | | | | 28 | | |
| Intuit, Inc. ‡ | | | 2,400 | | | | 110 | | |
| Microsoft Corp. | | | 23,200 | | | | 596 | | |
| NAVTEQ Corp. ‡ | | | 1,400 | | | | 55 | | |
| Oracle Corp. ‡ | | | 21,000 | | | | 266 | | |
| SAP AG, ADR † | | | 4,000 | | | | 172 | | |
| Yahoo!, Inc. ‡ | | | 11,000 | | | | 407 | | |
| Computer & Office Equipment (5.1%) | |
| Cisco Systems, Inc. ‡ | | | 28,000 | | | | 489 | | |
| Dell, Inc. ‡ | | | 16,900 | | | | 539 | | |
| EMC Corp. ‡ | | | 7,700 | | | | 107 | | |
| Symbol Technologies, Inc. | | | 139 | | | | 1 | | |
| Drug Stores & Proprietary Stores (1.0%) | |
| CVS Corp. | | | 4,100 | | | | 100 | | |
| Walgreen Co. | | | 2,900 | | | | 132 | | |
| Educational Services (0.7%) | |
| Apollo Group, Inc.–Class A †‡ | | | 2,350 | | | | 148 | | |
| Electronic & Other Electric Equipment (3.6%) | |
| General Electric Co. | | | 23,750 | | | | 805 | | |
| Electronic Components & Accessories (11.4%) | |
| Altera Corp. †‡ | | | 14,700 | | | | 245 | | |
| Analog Devices, Inc. | | | 7,400 | | | | 257 | | |
| Broadcom Corp.–Class A ‡ | | | 2,000 | | | | 85 | | |
| Intel Corp. | | | 22,000 | | | | 517 | | |
| Linear Technology Corp. | | | 11,600 | | | | 385 | | |
| Maxim Integrated Products, Inc. | | | 10,300 | | | | 357 | | |
| Microchip Technology, Inc. | | | 6,300 | | | | 190 | | |
| Texas Instruments, Inc. | | | 7,000 | | | | 200 | | |
| Xilinx, Inc. | | | 13,400 | | | | 321 | | |
| Entertainment (0.4%) | |
| International Game Technology † | | | 3,100 | | | | 82 | | |
| Food & Kindred Products (1.0%) | |
| General Mills, Inc. † | | | 2,300 | | | | 111 | | |
| WM Wrigley Jr. Co. | | | 1,700 | | | | 118 | | |
| Furniture & Home Furnishings Stores (1.2%) | |
| Bed Bath & Beyond, Inc. ‡ | | | 3,300 | | | | 134 | | |
| Williams-Sonoma, Inc. ‡ | | | 3,600 | | | | 141 | | |
| Hotels & Other Lodging Places (1.0%) | |
| Choice Hotels International, Inc. | | | 2,000 | | | | 66 | | |
| Marriott International, Inc.–Class A | | | 2,500 | | | | 149 | | |
The notes to the financial statements are an integral part of this report.
Transamerica IDEX Mutual Funds
Annual Report 2005
4
TA IDEX T. Rowe Price Tax-Efficient Growth
SCHEDULE OF INVESTMENTS (continued)
At October 31, 2005
(all amounts except share amounts in thousands)
| | | Shares | | Value | |
| Industrial Machinery & Equipment (0.4%) | |
| Illinois Tool Works, Inc. | | | 1,200 | | | $ | 102 | | |
| Insurance (6.6%) | |
| AMBAC Financial Group, Inc. | | | 1,200 | | | | 85 | | |
| American International Group, Inc. | | | 2,663 | | | | 173 | | |
| UnitedHealth Group, Inc. | | | 9,800 | | | | 567 | | |
| WellPoint, Inc. ‡ | | | 8,800 | | | | 657 | | |
| Insurance Agents, Brokers & Service (0.4%) | |
| Marsh & McLennan Cos., Inc. | | | 2,800 | | | | 82 | | |
| Lumber & Other Building Materials (2.0%) | |
| Home Depot, Inc. (The) | | | 10,800 | | | | 443 | | |
| Management Services (0.9%) | |
| Paychex, Inc. | | | 5,200 | | | | 202 | | |
| Medical Instruments & Supplies (4.0%) | |
| Baxter International, Inc. | | | 2,800 | | | | 107 | | |
| Guidant Corp. | | | 300 | | | | 19 | | |
| Medtronic, Inc. | | | 8,700 | | | | 493 | | |
| Stryker Corp. | | | 3,400 | | | | 140 | | |
| Zimmer Holdings, Inc. ‡ | | | 2,200 | | | | 140 | | |
| Motion Pictures (0.7%) | |
| Time Warner, Inc. | | | 8,400 | | | | 150 | | |
| Paper & Allied Products (0.7%) | |
| 3M Co. | | | 600 | | | | 46 | | |
| Kimberly-Clark Corp. | | | 1,900 | | | | 108 | | |
| Personal Credit Institutions (0.6%) | |
| SLM Corp. | | | 2,300 | | | | 128 | | |
| Pharmaceuticals (8.2%) | |
| Abbott Laboratories | | | 4,900 | | | | 211 | | |
| Amgen, Inc. ‡ | | | 3,200 | | | | 242 | | |
| AstraZeneca PLC, ADR | | | 1,900 | | | | 85 | | |
| GlaxoSmithKline PLC, ADR | | | 2,200 | | | | 114 | | |
| Johnson & Johnson | | | 7,500 | | | | 470 | | |
| Lilly (Eli) & Co. † | | | 2,900 | | | | 144 | | |
| Medco Health Solutions, Inc. ‡ | | | 709 | | | | 40 | | |
| Merck & Co., Inc. | | | 2,300 | | | | 65 | | |
| Pfizer, Inc. | | | 12,985 | | | | 282 | | |
| Wyeth | | | 4,100 | | | | 183 | | |
| Printing & Publishing (1.3%) | |
| McGraw-Hill Cos., Inc. (The) | | | 6,000 | | | | 294 | | |
| Radio & Television Broadcasting (0.7%) | |
| IAC/InterActiveCorp. ‡ | | | 1,550 | | | | 40 | | |
| Univision Communications, Inc.–Class A †‡ | | | 4,100 | | | | 107 | | |
| Restaurants (0.5%) | |
| Starbucks Corp. ‡ | | | 4,200 | | | | 119 | | |
| Retail Trade (1.7%) | |
| Amazon.com, Inc. †‡ | | | 5,500 | | | | 219 | | |
| Tiffany & Co. † | | | 4,100 | | | | 162 | | |
| | | Shares | | Value | |
| Rubber & Misc. Plastic Products (0.5%) | |
| NIKE, Inc.–Class B | | | 1,300 | | | $ | 109 | | |
| Security & Commodity Brokers (3.9%) | |
| American Express Co. | | | 3,600 | | | | 179 | | |
| Ameriprise Financial, Inc. ‡ | | | 720 | | | | 27 | | |
| Charles Schwab Corp. (The) | | | 14,600 | | | | 222 | | |
| Eaton Vance Corp. | | | 4,000 | | | | 100 | | |
| Franklin Resources, Inc. | | | 3,900 | | | | 345 | | |
| Transportation & Public Utilities (0.9%) | |
| Expedia, Inc. †‡ | | | 1,550 | | | | 29 | | |
| Expeditors International of Washington, Inc. | | | 2,800 | | | | 170 | | |
| Variety Stores (2.6%) | |
| Dollar General Corp. | | | 8,600 | | | | 167 | | |
| Family Dollar Stores, Inc. † | | | 3,900 | | | | 86 | | |
| Wal-Mart Stores, Inc. | | | 6,800 | | | | 322 | | |
| Water Transportation (0.2%) | |
| Carnival Corp. | | | 900 | | | | 45 | | |
| Wholesale Trade Nondurable Goods (1.0%) | |
| SYSCO Corp. | | | 7,300 | | | | 233 | | |
| Total Common Stocks (cost: $16,099) | | | | | | | 22,322 | | |
| | | Principal | | Value | |
| SECURITY LENDING COLLATERAL (6.7%) | |
| Debt (6.2%) | |
| Bank Notes (0.4%) | |
Bank of America
3.81%, due 06/07/2006 * | | $ | 42 | | | $ | 42 | | |
| 3.81%, due 08/10/2006 * | | | 42 | | | | 42 | | |
Credit Suisse First Boston Corp.
4.11%, due 03/10/2006 * | | | 8 | | | | 8 | | |
| Certificates Of Deposit (0.4%) | |
Canadian Imperial Bank of Commerce
4.07%, due 11/04/2005 * | | | 33 | | | | 33 | | |
Harris Trust & Savings Bank
3.80%, due 11/04/2005 * | | | 27 | | | | 27 | | |
Rabobank Nederland
4.03%, due 05/31/2006 * | | | 42 | | | | 42 | | |
| Commercial Paper (1.3%) | |
Ciesco LLC
4.00%, due 11/03/2005 | | | 42 | | | | 42 | | |
General Electric Capital Corp.
3.96%, due 12/05/2005 | | | 33 | | | | 33 | | |
Paradigm Funding LLC–144A
4.01%, due 11/07/2005 | | | 33 | | | | 33 | | |
Park Avenue Receivables Corp.–144A
4.03%, due 12/02/2005 | | | 33 | | | | 33 | | |
Preferred Receivables Corp.–144A
4.04%, due 12/05/2005 | | | 25 | | | | 25 | | |
The notes to the financial statements are an integral part of this report.
Transamerica IDEX Mutual Funds
Annual Report 2005
5
TA IDEX T. Rowe Price Tax-Efficient Growth
SCHEDULE OF INVESTMENTS (continued)
At October 31, 2005
(all amounts except share amounts in thousands)
| | | Principal | | Value | |
| Commercial Paper (continued) | |
Ranger Funding Co. LLC–144A
3.99%, due 11/15/2005 | | $ | 25 | | | $ | 25 | | |
Sheffield Receivables Corp.–144A
4.01%, due 11/08/2005 | | | 25 | | | | 25 | | |
Yorktown Capital LLC
3.97%, due 11/09/2005
3.93%, due 11/17/2005 | | | 42
42 | | | | 42
42 | | |
| Euro Dollar Overnight (1.5%) | |
Bank of Montreal
3.79%, due 11/01/2005 | | | 25 | | | | 25 | | |
Barclays
3.80%, due 11/04/2005 | | | 33 | | | | 33 | | |
BNP Paribas
3.83%, due 11/02/2005 | | | 50 | | | | 50 | | |
Deutsche Bank
3.80%, due 11/02/2005 | | | 84 | | | | 84 | | |
HSBC Banking/Holdings PLC
3.84%, due 11/07/2005 | | | 25 | | | | 25 | | |
Royal Bank of Scotland
3.76%, due 11/01/2005 | | | 33 | | | | 33 | | |
Svenska Handlesbanken
4.03%, due 11/01/2005 | | | 43 | | | | 43 | | |
UBS AG
3.80%, due 11/03/2005 | | | 33 | | | | 33 | | |
| Euro Dollar Terms (0.5%) | |
Royal Bank of Scotland
4.00%, due 12/12/2005 | | | 33 | | | | 33 | | |
UBS AG
4.02%, due 12/01/2005 | | | 33 | | | | 33 | | |
Wells Fargo
3.96%, due 11/14/2005 | | | 50 | | | | 50 | | |
| Promissory Notes (0.2%) | |
Goldman Sachs Group, Inc.
4.02%, due 12/28/2005 | | | 35 | | | | 35 | | |
| | | Principal | | Value | |
| Repurchase Agreements (1.9%) †† | |
Credit Suisse First Boston Corp.
4.10%, dated 10/31/2005 to be
repurchased at $57 on 11/01/2005 | | $ | 57 | | | $ | 57 | | |
Goldman Sachs Group, Inc. (The)
4.10%, dated 10/31/2005 to be
repurchased at $142 on 11/01/2005 | | | 142 | | | | 142 | | |
Lehman Brothers, Inc.
4.10%, dated 10/31/2005 to be
repurchased at $4 on 11/01/2005 | | | 4 | | | | 4 | | |
Merrill Lynch & Co.
4.10%, dated 10/31/2005 to be
repurchased at $167 on 11/01/2005 | | | 167 | | | | 167 | | |
Morgan Stanley Dean Witter & Co.
4.17%, dated 10/31/2005 to be
repurchased at $50 on 11/01/2005 | | | 50 | | | | 50 | | |
| | | Shares | | Value | |
| Investment Companies (0.5%) | |
| Money Market Funds (0.5%) | |
American Beacon Fund
1-day yield of 3.81% | | | 35,966 | | | $ | 36 | | |
Barclays Global Investors
Institutional Money Market Fund
1-day yield of 3.92% | | | 33,366 | | | | 33 | | |
Goldman Sachs Financial Square
Prime Obligations Fund
1-day yield of 3.79% | | | 5,197 | | | | 5 | | |
Merrimac Cash Fund, Premium Class
1-day yield of 3.70% @ | | | 32,997 | | | | 33 | | |
| Total Security Lending Collateral (cost: $1,498) | | | | | | | 1,498 | | |
| Total Investment Securities (cost: $17,597) | | | | | | $ | 23,820 | | |
| SUMMARY: | |
| Investment securities, at value | | | 106.4 | % | | $ | 23,820 | | |
| Liabilities in excess of other assets | | | (6.4 | )% | | | (1,432 | ) | |
| Net assets | | | 100.0 | % | | $ | 22,388 | | |
NOTES TO SCHEDULE OF INVESTMENTS:
† At October 31, 2005, all or a portion of this security is on loan (see Note 1). The value at October 31, 2005, of all securities on loan is $1,453.
‡ Non-income producing.
* Floating or variable rate note. Rate is listed as of October 31, 2005.
†† Cash collateral for the Repurchase Agreements, valued at $428, that serve as collateral for securities lending are invested in corporate bonds with interest rates and maturity dates ranging from 0.00%–9.86% and 12/31/2005–11/15/2096, respectively.
@ Regulated investment company advised by Investors Bank and Trust Co. ("IBT"). IBT is also the accounting, custody and lending agent for the Fund.
DEFINITIONS:
144A 144A Securities are registered pursuant to Rule 144A of the Securities Act of 1933. These securities are deemed to be liquid for purposes of compliance limitations on holdings of illiquid securities and may be resold as transactions exempt from registration, normally to qualified institutional buyers. At October 31, 2005, these securities aggregated $141 or 0.6% of the net assets of the Fund.
ADR American Depositary Receipt
The notes to the financial statements are an integral part of this report.
Transamerica IDEX Mutual Funds
Annual Report 2005
6
TA IDEX T. Rowe Price Tax-Efficient Growth
STATEMENT OF ASSETS AND LIABILITIES
At October 31, 2005
(all amounts except per share amounts in thousands)
| Assets: | |
Investment securities, at value (cost: $17,597)
(including securities loaned of $1,453) | | $ | 23,820 | | |
| Receivables: | |
| Investment securities sold | | | 121 | | |
| Shares of beneficial interest sold | | | 25 | | |
| Dividends | | | 11 | | |
| Other | | | 2 | | |
| | | | 23,979 | | |
| Liabilities: | |
| Accounts payable and accrued liabilities: | |
| Shares of beneficial interest redeemed | | | 4 | | |
| Management and advisory fees | | | 11 | | |
| Distribution and service fees | | | 14 | | |
| Transfer agent fees | | | 8 | | |
| Due to custodian | | | 31 | | |
| Payable for collateral for securities on loan | | | 1,498 | | |
| Other | | | 25 | | |
| | | | 1,591 | | |
| Net Assets | | $ | 22,388 | | |
| Net Assets Consist of: | |
Shares of beneficial interest, unlimited shares
authorized, no par value | | $ | 19,745 | | |
| Accumulated net investment income (loss) | | | (1 | ) | |
Accumulated net realized gain (loss) from investment
securities | | | (3,579 | ) | |
Net unrealized appreciation (depreciation) on
investment securities | | | 6,223 | | |
| Net Assets | | $ | 22,388 | | |
| Net Assets by Class: | |
| Class A | | $ | 9,740 | | |
| Class B | | | 9,708 | | |
| Class C | | | 2,940 | | |
| Shares Outstanding: | |
| Class A | | | 940 | | |
| Class B | | | 967 | | |
| Class C | | | 293 | | |
| Net Asset Value Per Share: | |
| Class A | | $ | 10.36 | | |
| Class B | | | 10.03 | | |
| Class C | | | 10.03 | | |
| Maximum Offering Price Per Share (a): | |
| Class A | | $ | 10.96 | | |
(a) Includes the maximum selling commission (represented as a percentage of offering price) which is reduced on certain levels of sales as set forth in the Prospectus. Net asset value per share for Classes B and C shares represents offering price. The redemption price for Classes B and C shares equals net asset value less any applicable contingent deferred sales charge.
STATEMENT OF OPERATIONS
For the year ended October 31, 2005
(all amounts in thousands)
| Investment Income: | |
Dividends (net of withholding taxes on foreign
dividends of $1) | | $ | 418 | | |
| Income from loaned securities–net | | | 3 | | |
| | | | 421 | | |
| Expenses: | |
| Management and advisory fees | | | 191 | | |
| Distribution and service fees: | |
| Class A | | | 38 | | |
| Class B | | | 116 | | |
| Class C | | | 36 | | |
| Transfer agent fees: | |
| Class A | | | 30 | | |
| Class B | | | 46 | | |
| Class C | | | 15 | | |
| Printing and shareholder reports | | | 14 | | |
| Custody fees | | | 10 | | |
| Administration fees | | | 5 | | |
| Legal fees | | | 2 | | |
| Audit fees | | | 27 | | |
| Trustees fees | | | 1 | | |
| Registration fees: | |
| Class A | | | 12 | | |
| Class B | | | 12 | | |
| Class C | | | 11 | | |
| Other | | | 1 | | |
| Total expenses | | | 567 | | |
| Less: | |
| Reimbursement of class expenses: | |
| Class A | | | (1 | ) | |
| Class B | | | (13 | ) | |
| Class C | | | (12 | ) | |
| Total reimbursed expenses | | | (26 | ) | |
| Net expenses | | | 541 | | |
| Net Investment Income (Loss) | | | (120 | ) | |
| Net Realized and Unrealized Gain (Loss): | |
| Realized gain (loss) from investment securities | | | 2,259 | | |
Increase (decrease) in unrealized appreciation
(depreciation) on investment securities | | | (980 | ) | |
| Net Gain (Loss) on Investment Securities | | | 1,279 | | |
Net Increase (Decrease) in Net Assets Resulting
from Operations | | $ | 1,159 | | |
The notes to the financial statements are an integral part of this report.
Transamerica IDEX Mutual Funds
Annual Report 2005
7
TA IDEX T. Rowe Price Tax-Efficient Growth
STATEMENTS OF CHANGES IN NET ASSETS
For the years ended
(all amounts in thousands)
| | | October 31,
2005 | | October 31,
2004 | |
| Increase (Decrease) In Net Assets From: | |
| Operations: | |
| Net investment income (loss) | | $ | (120 | ) | | $ | (300 | ) | |
Net realized gain (loss) from
investment securities | | | 2,259 | | | | 211 | | |
Net unrealized appreciation
(depreciation) on investment
securities | | | (980 | ) | | | 303 | | |
| | | | 1,159 | | | | 214 | | |
| Capital Share Transactions: | |
| Proceeds from shares sold: | |
| Class A | | | 618 | | | | 1,616 | | |
| Class B | | | 435 | | | | 2,611 | | |
| Class C | | | 216 | | | | 217 | | |
| Class C2 | | | – | | | | 386 | | |
| Class M | | | – | | | | 146 | | |
| | | | 1,269 | | | | 4,976 | | |
| Cost of shares redeemed: | |
| Class A | | | (2,655 | ) | | | (3,590 | ) | |
| Class B | | | (4,256 | ) | | | (3,729 | ) | |
| Class C | | | (1,718 | ) | | | (691 | ) | |
| Class C2 | | | – | | | | (653 | ) | |
| Class M | | | – | | | | (526 | ) | |
| | | | (8,629 | ) | | | (9,189 | ) | |
| Class level exchanges: | |
| Class C | | | – | | | | 4,376 | | |
| Class C2 | | | – | | | | (3,084 | ) | |
| Class M | | | – | | | | (1,292 | ) | |
| | | | – | | | | – | | |
| Automatic conversions: | |
| Class A | | | 3 | | | | 49 | | |
| Class B | | | (3 | ) | | | (49 | ) | |
| | | | – | | | | – | | |
| | | | (7,360 | ) | | | (4,213 | ) | |
| Net increase (decrease) in net assets | | | (6,201 | ) | | | (3,999 | ) | |
| Net Assets: | |
| Beginning of year | | | 28,589 | | | | 32,588 | | |
| End of year | | $ | 22,388 | | | $ | 28,589 | | |
Accumulated Net Investment Income
(Loss) | | $ | (1 | ) | | $ | (1 | ) | |
| | | October 31,
2005 | | October 31,
2004 | |
| Share Activity: | |
| Shares issued: | |
| Class A | | | 60 | | | | 159 | | |
| Class B | | | 43 | | | | 261 | | |
| Class C | | | 22 | | | | 22 | | |
| Class C2 | | | – | | | | 39 | | |
| Class M | | | – | | | | 14 | | |
| | | | 125 | | | | 495 | | |
| Shares redeemed: | |
| Class A | | | (256 | ) | | | (353 | ) | |
| Class B | | | (423 | ) | | | (377 | ) | |
| Class C | | | (170 | ) | | | (71 | ) | |
| Class C2 | | | – | | | | (66 | ) | |
| Class M | | | – | | | | (52 | ) | |
| | | | (849 | ) | | | (919 | ) | |
| Class level exchanges: | |
| Class C | | | – | | | | 441 | | |
| Class C2 | | | – | | | | (305 | ) | |
| Class M | | | – | | | | (135 | ) | |
| | | | – | | | | 1 | | |
| Automatic conversions: | |
| Class A | | | – | | | | 5 | | |
| Class B | | | – | | | | (5 | ) | |
| | | | – | | | | – | | |
Net increase (decrease) in shares
outstanding: | |
| Class A | | | (196 | ) | | | (189 | ) | |
| Class B | | | (380 | ) | | | (121 | ) | |
| Class C | | | (148 | ) | | | 392 | | |
| Class C2 | | | – | | | | (332 | ) | |
| Class M | | | – | | | | (173 | ) | |
| | | | (724 | ) | | | (423 | ) | |
The notes to the financial statements are an integral part of this report.
Transamerica IDEX Mutual Funds
Annual Report 2005
8
TA IDEX T. Rowe Price Tax-Efficient Growth
FINANCIAL HIGHLIGHTS
| | | | | For a share of beneficial interest outstanding throughout each period | |
| | | | | Net Asset | | Investment Operations | | Distributions | | Net Asset | |
| | | For the
Period
Ended (d)(g) | | Value,
Beginning
of Period | | Net
Investment
Income (Loss) | | Net Realized
and Unrealized
Gain (Loss) | |
Total
Operations | | From Net
Investment
Income | | From Net
Realized
Gains | |
Total
Distributions | | Value,
End
of Period | |
| Class A | | 10/31/2005 | | $ | 9.93 | | | $ | (0.01 | ) | | $ | 0.44 | | | $ | 0.43 | | | $ | – | | | $ | – | | | $ | – | | | $ | 10.36 | | |
| | | 10/31/2004 | | | 9.85 | | | | (0.06 | ) | | | 0.14 | | | | 0.08 | | | | – | | | | – | | | | – | | | | 9.93 | | |
| | | 10/31/2003 | | | 8.09 | | | | (0.05 | ) | | | 1.81 | | | | 1.76 | | | | – | | | | – | | | | – | | | | 9.85 | | |
| | | 10/31/2002 | | | 9.54 | | | | (0.02 | ) | | | (1.43 | ) | | | (1.45 | ) | | | – | | | | – | | | | – | | | | 8.09 | | |
| | | 10/31/2001 | | | 10.64 | | | | 0.05 | | | | (1.13 | ) | | | (1.08 | ) | | | (0.02 | ) | | | – | | | | (0.02 | ) | | | 9.54 | | |
| Class B | | 10/31/2005 | | | 9.68 | | | | (0.07 | ) | | | 0.42 | | | | 0.35 | | | | – | | | | – | | | | – | | | | 10.03 | | |
| | | 10/31/2004 | | | 9.66 | | | | (0.12 | ) | | | 0.14 | | | | 0.02 | | | | – | | | | – | | | | – | | | | 9.68 | | |
| | | 10/31/2003 | | | 7.99 | | | | (0.10 | ) | | | 1.77 | | | | 1.67 | | | | – | | | | – | | | | – | | | | 9.66 | | |
| | | 10/31/2002 | | | 9.49 | | | | (0.09 | ) | | | (1.41 | ) | | | (1.50 | ) | | | – | | | | – | | | | – | | | | 7.99 | | |
| | | 10/31/2001 | | | 10.63 | | | | (0.02 | ) | | | (1.12 | ) | | | (1.14 | ) | | | – | | | | – | | | | – | | | | 9.49 | | |
| Class C | | 10/31/2005 | | | 9.68 | | | | (0.07 | ) | | | 0.42 | | | | 0.35 | | | | – | | | | – | | | | – | | | | 10.03 | | |
| | | 10/31/2004 | | | 9.66 | | | | (0.12 | ) | | | 0.14 | | | | 0.02 | | | | – | | | | – | | | | – | | | | 9.68 | | |
| | | 10/31/2003 | | | 7.91 | | | | (0.11 | ) | | | 1.86 | | | | 1.75 | | | | – | | | | – | | | | – | | | | 9.66 | | |
| | | | | | | Ratios/Supplemental Data | |
| | | For the
Period | | Total | | Net Assets,
End of
Period | | Ratio of Expenses
to Average
Net Assets (a) | | Net Investment
Income (Loss)
to Average | | Portfolio
Turnover | |
| | | Ended (g) | | Return (c) | | (000's) | | Net (e) | | Total (f) | | Net Assets (a) | | Rate (b) | |
| Class A | | 10/31/2005 | | | 4.31 | % | | $ | 9,740 | | | | 1.70 | % | | | 1.70 | % | | | (0.10 | )% | | | 6 | % | |
| | | 10/31/2004 | | | 0.83 | | | | 11,281 | | | | 1.70 | | | | 1.78 | | | | (0.56 | ) | | | 5 | | |
| | | 10/31/2003 | | | 21.76 | | | | 13,057 | | | | 1.70 | | | | 1.85 | | | | (0.56 | ) | | | 50 | | |
| | | 10/31/2002 | | | (15.20 | ) | | | 21,389 | | | | 1.68 | | | | 1.95 | | | | (0.27 | ) | | | 76 | | |
| | | 10/31/2001 | | | (10.14 | ) | | | 8,552 | | | | 1.55 | | | | 2.07 | | | | 0.47 | | | | 30 | | |
| Class B | | 10/31/2005 | | | 3.62 | | | | 9,708 | | | | 2.35 | | | | 2.46 | | | | (0.72 | ) | | | 6 | | |
| | | 10/31/2004 | | | 0.20 | | | | 13,038 | | | | 2.31 | | | | 2.31 | | | | (1.18 | ) | | | 5 | | |
| | | 10/31/2003 | | | 21.05 | | | | 14,181 | | | | 2.35 | | | | 2.50 | | | | (1.21 | ) | | | 50 | | |
| | | 10/31/2002 | | | (15.84 | ) | | | 11,897 | | | | 2.33 | | | | 2.60 | | | | (0.92 | ) | | | 76 | | |
| | | 10/31/2001 | | | (10.75 | ) | | | 15,500 | | | | 2.20 | | | | 2.72 | | | | (0.18 | ) | | | 30 | | |
| Class C | | 10/31/2005 | | | 3.65 | | | | 2,940 | | | | 2.35 | | | | 2.67 | | | | (0.70 | ) | | | 6 | | |
| | | 10/31/2004 | | | 0.17 | | | | 4,270 | | | | 2.35 | | | | 3.00 | | | | (1.21 | ) | | | 5 | | |
| | | 10/31/2003 | | | 22.12 | | | | 473 | | | | 2.35 | | | | 2.50 | | | | (1.21 | ) | | | 50 | | |
NOTES TO FINANCIAL HIGHLIGHTS
(a) Annualized.
(b) Not annualized.
(c) Total Return has been calculated for the applicable period without deduction of a sales load, if any, on an initial purchase. Periods of less that one year are not annualized.
(d) Per share information is calculated based on average number of shares outstanding.
(e) Ratio of Net Expenses to Average Net Assets is net of fee waivers and reimbursements by the investment adviser, if any (see note 2).
(f) Ratio of Total Expenses to Average Net Assets includes all expenses before fee waivers and reimbursements by the investment adviser.
(g) The inception date for the Fund's offering of share Class C was November 11, 2002.
The notes to the financial statements are an integral part of this report.
Transamerica IDEX Mutual Funds
Annual Report 2005
9
TA IDEX T. Rowe Price Tax-Efficient Growth
NOTES TO FINANCIAL STATEMENTS
At October 31, 2005
(all amounts in thousands)
NOTE 1. ORGANIZATION AND SIGNIFICANT ACCOUNTING POLICIES
Transamerica IDEX Mutual Funds is an open-end management investment company registered under the Investment Company Act of 1940, as amended (the "1940 Act").
In the normal course of business, TA IDEX T. Rowe Price Tax-Efficient Growth (the "Fund") enters into contracts that contain a variety of representations that provide general indemnifications. The Fund's maximum exposure under these arrangements is unknown, as this would involve future claims that may be made against the Fund and/or its affiliates that have not yet occurred. However, based on experience, the Fund expects the risk of loss to be remote.
This report should be read in conjunction with the current Fund prospectus, which contains more complete information about the Fund.
The following is a summary of significant accounting policies followed by the Fund in the preparation of the financial statements. In preparing the Fund's financial statements in accordance with accounting principles generally accepted in the United States of America ("GAAP"), estimates or assumptions (which could differ from actual results) may be used that affect reported amounts and disclosures.
Multiple class operations, income and expenses: The Fund currently offers three classes of shares, each with a public offering price that reflects different sales charges, if any, and expense levels. On June 15, 2004, Class C2 shares merged into Class C. On September 24, 2004, Class M shares merged into Class C. Class B shares will convert to Class A shares eight years after purchase. Income, non-class specific expenses and realized and unrealized gains and losses, are allocated daily to each class, based upon the value of shares outstanding method as permitted under Rule 18f-3 of the 1940 Act. Each class bears its own specific expenses as well as a portion of general, common expenses.
Security valuations: The Fund values its investments at the close of the New York Stock Exchange ("NYSE"), normally 4 p.m. ET, each day the NYSE is open for business. Fund investments are valued at the last sale price or closing price on the day of valuation taken from the primary exchange where the security is principally traded.
Securities traded in the over-the-counter market and listed securities for which no sale was reported on that date are valued at the last quoted bid price.
Debt securities are valued based on a price quotation or other equivalent indication of value supplied by an exchange, a pricing service or a major market maker; however, those that mature in sixty days or less are valued at amortized cost, which approximates market.
Investment company securities are valued at the net asset value of the underlying portfolio.
Other securities for which quotations are not readily available or whose values have been determined to be unreliable are valued at fair market value as determined in good faith by the Fund's Administrative Valuation Committee, under the supervision of the Board's Valuation Committee, using guidelines adopted by the Board of Trustees.
Cash: The Fund may leave cash overnight in its cash account with the custodian, Investors Bank & Trust Company ("IBT"). IBT has been contracted on behalf of the Fund to invest the excess cash into a savings account, which at October 31, 2005, was paying an interest rate of 2.76%.
Throughout the year, the Fund may have a cash overdraft balance. A fee is incurred on this overdraft, calculated by multiplying the overdraft by a rate based on the federal funds rate.
Repurchase agreements: The Fund is authorized to enter into repurchase agreements. The Fund, through its custodian, IBT, receives delivery of the underlying securities, the value of which at the time of purchase is required to be an amount equal to at least 100% of the resale price. The Fund will bear the risk of value fluctuations until the security can be sold and may encounter delays and incur costs in liquidating the security. In the event of bankruptcy or insolvency of the seller, delays and costs may be incurred.
Securities lending: The Fund may lend securities to qualified borrowers, with IBT acting as the Fund's lending agent. The Fund earns negotiated lenders' fees. The Fund receives cash and/or securities as collateral against the loaned securities. Cash collateral received is invested in short term, interest bearing securities. The Fund monitors the market value of securities loaned on a daily basis and requires collateral in an amount at least equal to the value of the securities loaned. Income from loaned securities on the Statement of Operations is net of fees, in the amount of $1, earned by IBT for its services.
Security transactions and investment income: Security transactions are recorded on the trade date. Security gains and losses are calculated on the specific identification basis. Dividend income, if any, is recorded on the ex-dividend date or, in the case of foreign securities, as soon as the Fund is informed of the ex-dividend date. Interest income, including accretion of discounts and amortization of premiums, is recorded on the accrual basis commencing on the settlement date.
Redemption fees: A short-term trading redemption fee may be assessed on any Fund shares in a fund account that are sold during the first five (5) NYSE trading days following their purchase date. This redemption fee will equal 2% of the amount redeemed and shares held the longest will be treated as being redeemed first and shares held the shortest as being redeemed last. For the year ended October 31, 2005, the Fund received less than $1 in redemption fees.
Transamerica IDEX Mutual Funds
Annual Report 2005
10
TA IDEX T. Rowe Price Tax-Efficient Growth
NOTES TO FINANCIAL STATEMENTS (continued)
At October 31, 2005
(all amounts in thousands)
NOTE 1.–(continued)
Dividend distributions: Distributions to shareholders are recorded on the ex-dividend date and are determined in accordance with Federal income tax regulations which may differ from GAAP.
NOTE 2. RELATED PARTY TRANSACTIONS
Effective January 1, 2005 AEGON/Transamerica Fund Advisors, Inc. was renamed Transamerica Fund Advisors, Inc. ("TFAI"); AEGON/Transamerica Fund Services, Inc. and AEGON/Transamerica Investor Services, Inc. merged into one entity and was renamed Transamerica Fund Services, Inc. ("TFS").
TFAI is the Fund's investment adviser. TFS is the Fund's administrator and transfer agent. AFSG Securities Corp. ("AFSG") is the Fund's distributor/principal underwriter. TFAI, TFS , and AFSG are affiliates of AEGON, NV, a Netherlands corporation.
The following schedule reflects the percentage of Fund assets owned by affiliated mutual funds:
| | | Net
Assets | | % of
Net Assets | |
TA IDEX Asset Allocation –
Conservative Portfolio | | $ | 4,111 | | | | 18.36 | % | |
| Total | | $ | 4,111 | | | | 18.36 | % | |
Investment advisory fees: The Fund pays management fees to TFAI based on average daily net assets ("ANA") at the following breakpoints:
0.75% of the first $500 million of ANA
0.65% of ANA over $500 million
TFAI has contractually agreed to waive its advisory fee and will reimburse the Fund to the extent that operating expenses, excluding 12b-1 fees, exceed the following stated annual limit:
1.35% Expense Limit
The sub-adviser, T. Rowe Price, has agreed to a pricing discount based on the aggregate assets that they manage in the Transamerica IDEX Mutual Funds. The amount of the discount received by the Fund for the year ended October 31, 2005 was $2.
Distribution and service fees: The Fund has a 12b-1 distribution plan under the 1940 Act pursuant to which an annual fee, based on average daily net assets, is paid to the distributor for various disbursements such as broker-dealer account servicing fees and other promotional expenses of the Fund. The Fund is authorized under the 12b-1 plan to pay fees on each class up to the following limits:
| Class A | | | 0.35 | % | |
| Class B | | | 1.00 | % | |
| Class C | | | 1.00 | % | |
In the case the Fund or a class of shares of the Fund is closed to new investors or investments, the Fund is authorized to pay 12b-1 fees for past sales and distribution efforts and present and past investor services.
Underwriter commissions relate to front-end sales charges imposed for Class A shares and contingent deferred sales charges from Classes B, C, and certain A share redemptions. For the year ended October 31, 2005, the underwriter commissions were as follows:
| Received by Underwriter | | $ | 50 | | |
| Retained by Underwriter | | | 3 | | |
| Contingent Deferred Sales Charge | | | 28 | | |
Administrative services: The Fund has entered into an agreement with TFS for financial and legal fund administration services. As of January 1, 2005 the Fund pays TFS an annual fee of 0.02% of ANA. Prior to January 1, 2005 the Fund paid TFS an annual fee of 0.015% of ANA. The Legal fees on the Statement of Operations are for fees paid to external legal counsel.
Transfer agent fees: The Fund pays TFS an annual per-account charge for each open and closed account. The Fund paid TFS $86 for the year ended October 31, 2005.
Deferred compensation plan: Each eligible independent Fund Trustee may elect to participate in a non-qualified deferred compensation plan maintained by Transamerica IDEX Mutual Funds (the "Plan"). Under the Plan, such Trustees may defer payment of all or a portion of their total fees earned as a Fund Trustee. Each Trustee who is a participant in the Plan may elect that the earnings, losses or gains credited to his or her deferred fee amounts be determined based on a deemed investment in any series of Transamerica IDEX Mutual Funds, including the Fund. The right of a participant to receive a distribution from the Plan of the deferred fees is an unsecured claim against the general assets of all series of Transamerica IDEX Mutual Funds. The pro rata liability to the Fund of all deferred fees in the Plan amounted, as of October 31, 2005, to $2.
NOTE 3. INVESTMENT TRANSACTIONS
The cost of securities purchased and proceeds from securities sold (excluding short-term securities) for the year ended October 31, 2005, were as follows:
| Purchases of securities: | |
| Long-Term | | $ | 1,616 | | |
| U.S. Government | | | – | | |
| Proceeds from maturities and sales of securities: | |
| Long-Term | | | 9,875 | | |
| U.S. Government | | | – | | |
Transamerica IDEX Mutual Funds
Annual Report 2005
11
TA IDEX T. Rowe Price Tax-Efficient Growth
NOTES TO FINANCIAL STATEMENTS (continued)
At October 31, 2005
(all amounts in thousands)
NOTE 4. FEDERAL INCOME TAX MATTERS
The Fund has not made any provision for federal income or excise taxes due to its policy to distribute all of its taxable income and capital gains to its shareholders and otherwise qualify as a regulated investment company under Subchapter M of the Internal Revenue Code. Income and capital gain distributions are determined in accordance with income tax regulations, which may differ from GAAP. These differences are primarily due to differing treatment for items including, but not limited to, wash sales and capital loss carryforwards.
Therefore, distributions determined in accordance with tax regulations may differ significantly in amount or character from net investment income and realized gains for financial reporting purposes. Financial reporting records are adjusted for permanent book/tax differences to reflect tax character. Financial records are not adjusted for temporary differences. These reclassifications are as follows:
Shares of beneficial interest, unlimited
shares authorized | | $ | (120 | ) | |
| Accumulated net investment income (loss) | | | 120 | | |
The capital loss carryforwards are available to offset future realized capital gains through the periods listed:
Capital Loss
Carryforward | | Available Through | |
| $ | 238 | | | October 31, 2010 | |
| | 3,180 | | | October 31, 2011 | |
The capital loss carryforward utilized during the year ended October 31, 2005 was $2,204.
The tax basis components of distributable earnings as of October 31, 2005, are as follows:
| Undistributed Ordinary Income | | $ | – | | |
| Undistributed Long-term Capital Gains | | $ | – | | |
| Capital Loss Carryforward | | $ | (3,418 | ) | |
| Net Unrealized Appreciation (Depreciation) | | $ | 6,062 | | |
The aggregate cost of investments and composition of unrealized appreciation (depreciation) for federal income tax purposes as of October 31, 2005, are as follows:
| Federal Tax Cost Basis | | $ | 17,758 | | |
| Unrealized Appreciation | | $ | 6,349 | | |
| Unrealized (Depreciation) | | | (287 | ) | |
| Net Unrealized Appreciation (Depreciation) | | $ | 6,062 | | |
NOTE 5. REGULATORY PROCEEDINGS
There continues to be significant federal and state regulatory activity relating to financial services companies, particularly mutual fund companies and their investment advisers. As part of an ongoing investigation regarding potential market timing, recordkeeping and trading compliance issues and matters affecting the Fund's investment adviser, TFAI, and certain affiliates and former employees of TFAI, the SEC staff has indicated that it is likely to take some action against TFAI and certain of its affiliates at the conclusion of the investigation. The potential timing and the scope of any such action is difficult to predict. Although the impact of any action brought against TFAI and/or its affiliates is difficult to assess at the present time, the Fund currently believes that the likelihood that any such action will have a material adverse impact on it is remote. It is important to note that the Fund is not aware of any allega tion of wrongdoing against it and its Board at the time this annual report is printed. Although it is not anticipated that these developments will have an adverse impact on the Fund, there can be no assurance at this time. TFAI and its affiliates are actively working with the SEC in regard to this matter; however, the exact resolution cannot be determined at this time. TFAI will take such actions that it deems necessary or appropriate to continue providing management services to the Fund and to bring all matters to an appropriate conclusion.
TFAI and/or its affiliates, and not the Fund, will bear the costs regarding these regulatory matters.
Transamerica IDEX Mutual Funds
Annual Report 2005
12
Report of Independent Registered Certified Public Accounting Firm
To the Board of Trustees and Shareholders of
TA IDEX T. Rowe Price Tax-Efficient Growth
In our opinion, the accompanying statement of assets and liabilities, including the schedule of investments, and the related statements of operations and of changes in net assets and the financial highlights present fairly, in all material respects, the financial position of TA IDEX T. Rowe Price Tax-Efficient Growth (the "Fund") (one of the portfolios constituting the Transamerica IDEX Mutual Funds) at October 31, 2005, the results of its operations for the year then ended, the changes in its net assets for each of the two years in the period then ended and the financial highlights for each of the periods presented, in conformity with accounting principles generally accepted in the United States of America. These financial statements and financial highlights (hereafter referred to as "financial statements") are the responsibility of the Fund's management; our responsibility is to express an opinion on these financial statements based on our audits. We conducted our audits of these financial statements in accordance with the standards of the Public Company Accounting Oversight Board (United States). Those standards require that we plan and perform the audit to obtain reasonable assurance about whether the financial statements are free of material misstatement. An audit includes examining, on a test basis, evidence supporting the amounts and disclosures in the financial statements, assessing the accounting principles used and significant estimates made by management, and evaluating the overall financial statement presentation. We believe that our audits, which included confirmation of securities at October 31, 2005 by correspondence with the custodian, provide a reasonable basis for our opinion.

December 22, 2005
Transamerica IDEX Mutual Funds
Annual Report 2005
13
TA IDEX Templeton Great Companies Global
MARKET ENVIRONMENT
Great Companies, L.L.C:
The twelve months ended October 31, 2005 will be remembered as the worst hurricane season on record for its magnitude and severity both in human and financial toll. The storms exacerbated already high energy prices, while the Federal Reserve Board ("Fed") steadily raised interest rates. Consequently, financial strains were manifested in the form of several major airlines and automobile industry companies declaring bankruptcy. The on-going conflict in Iraq, a record federal deficit, CEO's being tried and sent to jail, concerns that the real estate industry may have peaked, coupled with investigations within the Bush administration, all contributed to a backdrop of investor angst. This led to a very uncertain and choppy stock market. When combined with the disruptive effect of hedge funds and other short-term oriented trading strategies, we observed many stocks trading within a very tight range. Hen ce, in a range bound stock market it is necessary to take profits from time-to-time in order to prevent "round tripping" a stock (going from low price to high price and back to low price).
Templeton Investment Counsel, LLC:
The global economic recovery continued during the period under review. U.S. gross domestic product ("GDP") has grown for fifteen consecutive quarters. Apart from Western Europe, foreign growth appeared to be beating expectations of a slowdown. In Asia, China's industrial production and GDP expanded, and Japan's economic outlook seemed brighter.
Oil prices remained a major concern for the global economy as prices climbed higher and reached record levels in August. Rising energy costs impacted companies and sentiment around the world. European economic growth lagged as consumer and business sentiment were weak for a number of reasons in addition to high energy costs. Also, the region continued to face political and economic integration issues.
Despite the predominantly weak outlook for the European economy, many European equity markets performed well during the portfolio's fiscal year. Asian markets as a whole delivered double digit returns. Although the U.S. dollar depreciated in the foreign exchange market in the first half of the period, it appreciated in the latter half. Overall, for the year under review, foreign currency conversion had little effect on Europe's and the Asia-Pacific region's investment returns.
PERFORMANCE
For the year ended October 31, 2005, TA IDEX Templeton Great Companies Global, Class A returned 10.41%. By comparison its benchmark, the Morgan Stanley Capital International World Index, returned 13.82%.
STRATEGY REVIEW
Great Companies, L.L.C:
We made several changes to the portfolio in the past year. Portfolio turnover was higher than normal; however, it was a by-product of repositioning to take advantage of market volatility. We also removed several stocks that no longer meet our screens as they have failed to adapt to a dynamic market place.
During the year, we removed a number of stocks including Advanced Neuromodulation Systems, Inc. ("Advanced Neuromodulation"), Anheuser-Busch Companies, Inc., Avon Products, Inc., Zimmer Holdings, Inc. ("Zimmer"), Pfizer Inc., Dell Inc., and Genentech, Inc. ("Genentech").
For example, we removed Genentech from the portfolio as the stock appreciated from $56 at the beginning of the year to over $80 when we removed it. Genentech has been an exceptional holding. The company is a great company, however, we determined the valuation to be rich. Similarly, another medical device holding that worked out was Advanced Neuromodulation. This idea was a hit – up substantially from our entry point as investors began to appreciate the growth potential of the neurostimulation market for treating pain. We had closed the gap on the company's intrinsic value and booked the gains.
Zimmer, a stock in a sector that we like, the baby boomer play on implants for knees, hips and other joints was removed because of an investigation's perceived risk on the stock's performance.
The energy sector has outperformed the Standard and Poor's 500 Composite Stock Index ("S&P 500") over an extended period, and as a result, we added several energy stocks to the portfolio. At present, we are underweighted in energy as energy prices have continued to decline. However, we have broadened out our holdings in gas and energy services related companies like Chesapeake Energy Corporation, Burlington Resources Inc., and BJ Services Company, as we ascertain favorable prospects in those segments.
We increased our holdings in the technology sector during the year with the addition of Apple Computer, Inc., Motorola, Inc.,
Transamerica IDEX Mutual Funds
Annual Report 2005
1
TA IDEX Templeton Great Companies Global
and Hewlett-Packard Company ("Hewlett-Packard"). We also added several financials including JP Morgan Chase & Co., Morgan Stanley, and Prudential Financial, Inc.
We had some stellar holdings that outperformed the S&P 500 during the year, including Genzyme Corporation ("Genzyme"), Hewlett-Packard, Vertex Pharmaceuticals Incorporated "(Vertex") and The Goldman Sachs Group, Inc. ("Goldman Sachs").
Genzyme, up more than 36%, as a result of strong results in its several of its core products including Renagel, its remedy used in the treatment of end-stage renal failure. Vertex as well as Amgen Inc. garnered greater than 30% returns as biotechnology was a clear strength for the strategy. Hewlett-Packard was up more than 24% from our entry point on the back of improving company fundamentals, a critical management change and more disclosure on the company's strategy for better profitability and growth. Finally, Goldman Sachs, the venerable investment bank and capital markets powerhouse had a very strong year with healthy growth across almost all parts of its business.
Some of our stocks that underperformed during the year were Symantec Corporation ("Symantec"), International Game Technology ("IGT") and Intel Corporation ("Intel"). Symantec made a less than favorable acquisition while IGT and Intel were the victims of a sequential slowing of their aggregate business sales growth.
Templeton Investment Counsel, LLC:
In absolute and relative terms, the portfolio benefited most from its allocation to industrial stocks, which performed well due to healthy economic growth leading to strong demand for these companies' products, along with improved profitability from successful cost-cutting efforts. Many of the portfolio's industrial stocks experienced significant gains during the period, and we slowly sold some stocks that reached what we considered full valuation.
Our utilities sector allocation, mainly European utilities, also contributed to portfolio performance. Utility stocks performed positively. We selectively trimmed our utility allocation but continued to identify value in the industry.
Although energy stocks were among the greatest absolute contributors to portfolio performance for the reporting period, the portfolio was negatively impacted in relative terms by its underweighted energy sector position. Despite a recent spike in crude oil prices, however, our views on the oil industry remained unchanged, and we believed the energy sector as a whole was near full valuation. Although demand increased over the past few years, exploration efforts were limited partly due to higher exploration and development costs. Geopolitical tensions in oil-producing regions aggravated supply, as did the efforts of several governments to protect and replenish national strategic reserves. Within this context, the supply and demand equilibrium remained fragile, impacting oil prices and energy stocks.
Our financial sector allocation also hurt relative performance, driven by an underweighted position in banks as well as selective stock holdings that underperformed. During the period, we found some value in the sector and recently increased our allocation to several bank and insurance stocks.
From a geographic perspective, European equities benefited the portfolio, but our relatively underweighted position in Japanese equities hindered relative performance. Generally unpopular for more than a decade, Japanese equities rallied as investors seemed to believe that Japan might be entering a period of sustained economic growth. Although we continued to add selectively to our Japanese holdings, our bottom-up research did not support a strong case for investing there. We retained an underweighted position relative to the benchmark based on our valuation analysis for shares of individual companies and our qualitative assessment of their respective management teams.
| Tina Hellmer, CFA | | James Huguet | |
|
| Antonio T. Docal, CFA | | Gerry Bollman, CFA | |
|
| Gary Motyl, CFA | | Matt Stephani, CFA, CPA | |
|
| | | Derek Hong, CFA | |
|
Co-Fund Managers
Templeton Investment Counsel, LLC | | Co-Fund Managers
Great Companies, L.L.C. | |
|
Transamerica IDEX Mutual Funds
Annual Report 2005
2
TA IDEX Templeton Great Companies Global
Comparison of change in value of $10,000 investment in Class A shares and its comparative index.
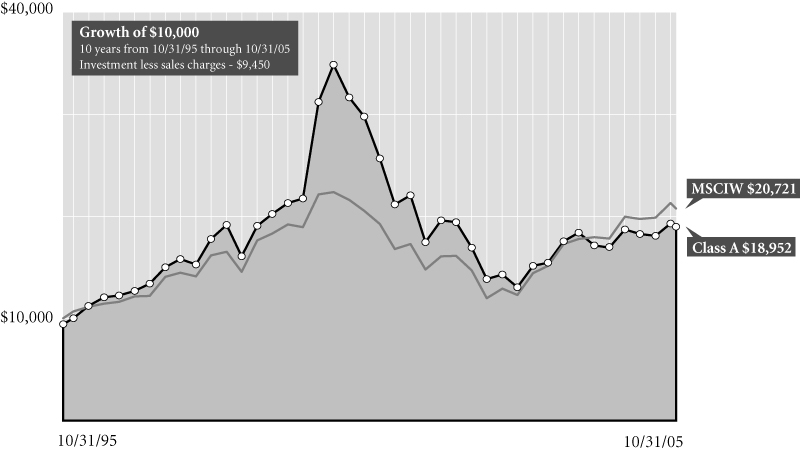
Average Annual Total Return for Periods Ended 10/31/05
| | | 1 year | | 5 years | | 10 years | | From
Inception | | Inception
Date | |
| Class A (NAV) | | | 10.41 | % | | | (7.90 | )% | | | 7.21 | % | | | 10.21 | % | | 10/1/92 | |
| Class A (POP) | | | 4.34 | % | | | (8.94 | )% | | | 6.60 | % | | | 9.74 | % | | 10/1/92 | |
| MSCIW1 | | | 13.82 | % | | | 0.57 | % | | | 7.56 | % | | | 8.93 | % | | 10/1/92 | |
| Class B (NAV) | | | 9.48 | % | | | (8.57 | )% | | | 6.64 | % | | | 6.22 | % | | 10/1/95 | |
| Class B (POP) | | | 4.48 | % | | | (8.75 | )% | | | 6.64 | % | | | 6.22 | % | | 10/1/95 | |
| Class C (NAV) | | | 9.52 | % | | | – | | | | – | | | | 8.95 | % | | 11/11/02 | |
| Class C (POP) | | | 8.52 | % | | | – | | | | – | | | | 8.95 | % | | 11/11/02 | |
NOTES
1 The Morgan Stanley Capital InternationalWorld (MSCIW) Index is an unmanaged index used as a general measure of market performance. Calculations assume dividends and capital gains are reinvested and do not include any managerial expenses. From inception calculation is based on life of Class A shares. Source: Standard & Poor's Micropal®© Micropal, Inc. 2005 – 1-800-596-5323 – http://www.funds-sp.com.
The performance data presented represents past performance, future results may vary. Performance data does not reflect the deduction of taxes that would be paid on fund distributions or the redemption of fund shares. Investment return and principal value will fluctuate so that an investor's shares, when redeemed, may be worth more or less than their original cost. Current performance may be lower or higher than performance quoted. Please see www.transamericaidex.com for performance data current to the most recent month-end.
Public Offering Price (POP) returns include the reinvestment of dividends and capital gains and reflect the maximum sales charge of 5.5% for A shares or the maximum applicable contingent deferred sales charge (5% in the 1st year, decreasing to 0% after 6 years) for Class B shares and 1% (during the first 12 months) for Class C shares. Shares purchased prior to March 1, 2004 are subject to a maximum applicable contingent deferred sales charge (5% in the 1st year, decreasing to 0% after 7 years) for Class B shares and (2% in the 1st year, decreasing to 0% after 2 years) for Class C shares. Net Asset Value (NAV) returns include the reinvestment of dividends and capital gains but do not reflect any sales charges.
Investments in global securities involve risks relating to political, social and economic developments abroad, foreign currency contracts for hedging, as well as risks resulting from the differences between the regulations to which U.S. and foreign issuer markets are subject.
This material must be preceded or accompanied by a current prospectus, which includes specific contents regarding the investment objectives and policies of this fund.
Transamerica IDEX Mutual Funds
Annual Report 2005
3
TA IDEX Templeton Great Companies Global
UNDERSTANDING YOUR FUND'S EXPENSES
(unaudited)
SHAREHOLDER EXPENSES
Fund shareholders may incur two types of costs: (1) transaction costs, including sales charges (loads) on purchases, contingent deferred sales charges on redemptions and redemption fees; and (2) ongoing costs, including management fees, 12b-1 distribution and service fees, and other fund expenses.
The following Example is intended to help you understand your ongoing costs (in dollars and cents) of investing in a Fund and to compare these costs with the ongoing costs of investing in other funds.
The Example is based on an investment of $1,000 invested at May 1, 2005 and held for the entire period until October 31, 2005.
ACTUAL EXPENSES
The first line in the table below provides information about actual account values and actual expenses. You may use the information in this line, together with the amount you invested, to estimate the expenses that you paid over the period. Simply divide your account value by $1,000 (for example, an $8,600 account value divided by $1,000 = 8.6), then multiply the result by the number in the first line of your Fund under the heading entitled "Expenses Paid During Period" to estimate the expenses you paid on your account during this period. If your account is an IRA, your expenses could have included a $15 annual fee. The amount of any fee paid through your account would increase the estimate of expenses you paid during the period and decrease your ending account value.
HYPOTHETICAL EXAMPLE FOR COMPARISON PURPOSES
The second line in the table below provides information about hypothetical account values and hypothetical expenses based on the Fund's actual expense ratio and an assumed rate of return of 5% per year before expenses, which is not the Fund's actual return. The hypothetical account values and expenses may not be used to estimate the actual ending account balance or expenses you paid for the period. You may use this information to compare the ongoing costs of investing in your Fund and other funds. To do so, compare this 5% hypothetical example with the 5% hypothetical examples that appear in the shareholder reports of the other funds. As in the case of the actual expense example, if your account is subject to an IRA fee, the amount of the fee paid through your account would increase the hypothetical expenses you would have paid during the period and decrease the hypothetical ending account value.
Please note that the expenses shown in the table are meant to highlight your ongoing costs only and do not reflect any transactional costs, such as sales charges, redemption fees, brokerage commissions paid on purchases and sales of fund shares. Therefore, the second line under the Fund in the table is useful in comparing ongoing costs only, and will not help you determine the relative total costs of owning different funds. If any of these transaction costs were included, your costs would be higher. The expenses shown in the table do not reflect any fees that may be charged to you by brokers, financial intermediaries or other financial institutions.
| | | Beginning
Account
Value | | Ending
Account
Value | | Annualized
Expense
Ratio | | Expenses Paid
During Period (a) | |
| Class A | |
| Actual | | $ | 1,000.00 | | | $ | 1,059.00 | | | | 1.45 | % | | $ | 7.53 | | |
| Hypothetical (b) | | | 1,000.00 | | | | 1,017.90 | | | | 1.45 | | | | 7.37 | | |
| Class B | |
| Actual | | | 1,000.00 | | | | 1,054.50 | | | | 2.22 | | | | 11.50 | | |
| Hypothetical (b) | | | 1,000.00 | | | | 1,014.01 | | | | 2.22 | | | | 11.27 | | |
| Class C | |
| Actual | | | 1,000.00 | | | | 1,055.20 | | | | 2.21 | | | | 11.45 | | |
| Hypothetical (b) | | | 1,000.00 | | | | 1,014.06 | | | | 2.21 | | | | 11.22 | | |
(a) Expenses are calculated using each Fund's annualized expense ratio (as disclosed in the table), multiplied by the average account value for the period, multiplied by number of days in the period (184 days), and divided by the number of days in the year (365 days).
(b) 5% return per year before expenses.
GRAPHICAL PRESENTATION OF SCHEDULE OF INVESTMENTS
By Region
At October 31, 2005
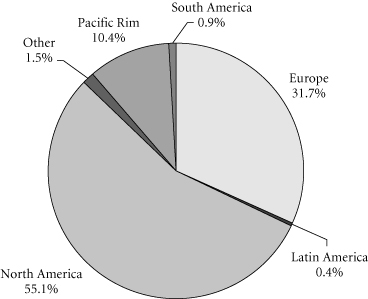
This chart shows the percentage breakdown by region of the Fund's total investment securities.
Transamerica IDEX Mutual Funds
Annual Report 2005
4
TA IDEX Templeton Great Companies Global
SCHEDULE OF INVESTMENTS
At October 31, 2005
(all amounts except share amounts in thousands)
| | | Shares | | Value | |
| COMMON STOCKS (94.7%) | | | |
| Australia (1.1%) | | | |
| Alumina, Ltd. | | | 376,884 | | | $ | 1,632 | | |
| BHP Billiton, Ltd. | | | 72,287 | | | | 1,122 | | |
| National Australia Bank, Ltd. | | | 121,966 | | | | 3,010 | | |
| Brazil (0.9%) | | | |
| Cia Vale do Rio Doce, ADR † | | | 27,030 | | | | 1,117 | | |
| Cia Vale do Rio Doce–Class A, ADR | | | 11,240 | | | | 415 | | |
| Empresa Brasileira de Aeronautica SA, ADR † | | | 36,800 | | | | 1,427 | | |
| Tele Norte Leste Participacoes SA, ADR | | | 86,090 | | | | 1,524 | | |
| Canada (0.9%) | | | |
| Alcan, Inc. | | | 54,070 | | | | 1,705 | | |
| BCE, Inc. † | | | 109,310 | | | | 2,705 | | |
| Cayman Islands (1.0%) | | | |
| ACE, Ltd. | | | 58,730 | | | | 3,060 | | |
| XL Capital, Ltd.–Class A † | | | 34,340 | | | | 2,200 | | |
| Denmark (0.6%) | | | |
| Vestas Wind Systems A/S †‡ | | | 151,830 | | | | 3,286 | | |
| Finland (1.2%) | | | |
| Stora Enso OYJ–Class R † | | | 234,230 | | | | 2,996 | | |
| UPM-Kymmene OYJ | | | 159,480 | | | | 3,083 | | |
| France (3.1%) | | | |
| Accor SA | | | 47,220 | | | | 2,358 | | |
| AXA | | | 104,530 | | | | 3,027 | | |
| Michelin (C.G.D.E.)–Class B | | | 36,747 | | | | 1,984 | | |
| Sanofi-Aventis | | | 37,519 | | | | 3,004 | | |
| Suez SA, ADR † | | | 64,790 | | | | 1,761 | | |
| Total SA | | | 10,093 | | | | 2,533 | | |
| Valeo SA | | | 28,502 | | | | 1,068 | | |
| Germany (2.6%) | | | |
| BASF AG, ADR | | | 27,180 | | | | 1,957 | | |
| Bayerische Motoren Werke AG | | | 53,390 | | | | 2,316 | | |
| Deutsche Post AG | | | 160,340 | | | | 3,575 | | |
| E.ON AG, ADR | | | 95,850 | | | | 2,896 | | |
| Muenchener Rueckversicherungs AG | | | 11,620 | | | | 1,365 | | |
| Siemens AG | | | 16,680 | | | | 1,241 | | |
| Hong Kong (0.9%) | | | |
| Cheung Kong Holdings, Ltd. (a) | | | 252,000 | | | | 2,622 | | |
| Hutchison Whampoa, Ltd. | | | 186,000 | | | | 1,761 | | |
| Israel (0.5%) | | | |
| Check Point Software Technologies, Ltd. ‡ | | | 109,770 | | | | 2,454 | | |
| Italy (1.1%) | | | |
| ENI SpA, ADR † | | | 23,670 | | | | 3,166 | | |
| UniCredito Italiano SpA | | | 460,284 | | | | 2,570 | | |
| | | Shares | | Value | |
| Japan (5.7%) | | | |
| East Japan Railway Co. | | | 388 | | | $ | 2,301 | | |
| Fuji Photo Film Co., Ltd. | | | 51,100 | | | | 1,612 | | |
| Hitachi, Ltd. | | | 453,000 | | | | 2,768 | | |
| KDDI Corp. | | | 356 | | | | 2,032 | | |
| Konica Minolta Holdings, Inc. | | | 198,000 | | | | 1,635 | | |
| Mabuchi Motor Co., Ltd. † | | | 33,000 | | | | 1,605 | | |
| Nintendo Co., Ltd. | | | 28,100 | | | | 3,130 | | |
| Nippon Telegraph & Telephone Corp. | | | 480 | | | | 2,252 | | |
| Nomura Holdings, Inc. | | | 105,100 | | | | 1,595 | | |
| Olympus Corp. | | | 87,800 | | | | 1,943 | | |
| Sompo Japan Insurance, Inc. | | | 233,000 | | | | 3,484 | | |
| Sony Corp., ADR | | | 64,770 | | | | 2,124 | | |
| Takeda Pharmaceutical Co., Ltd. | | | 51,200 | | | | 2,799 | | |
| Mexico (0.4%) | | | |
| Telefonos de Mexico SA de CV–Class L, ADR † | | | 114,300 | | | | 2,307 | | |
| Netherlands (2.3%) | | | |
| Akzo Nobel NV, ADR | | | 43,700 | | | | 1,893 | | |
| ING Groep NV | | | 82,300 | | | | 2,372 | | |
| ING Groep NV, ADR | | | 23,660 | | | | 683 | | |
| Koninklijke Philips Electronics NV | | | 99,700 | | | | 2,605 | | |
| Reed Elsevier NV | | | 232,390 | | | | 3,131 | | |
| VNU NV † | | | 41,900 | | | | 1,332 | | |
| Norway (0.8%) | | | |
| Telenor ASA | | | 397,510 | | | | 3,885 | | |
| Portugal (0.5%) | | | |
| Portugal Telecom SGPS SA | | | 269,150 | | | | 2,432 | | |
| Singapore (0.5%) | | | |
| DBS Group Holdings, Ltd. | | | 265,600 | | | | 2,398 | | |
| DBS Group Holdings, Ltd., ADR | | | 12,210 | | | | 441 | | |
| South Korea (2.1%) | | | |
| Kookmin Bank, ADR †‡ | | | 30,640 | | | | 1,790 | | |
| Korea Electric Power Corp., ADR † | | | 64,200 | | | | 1,048 | | |
| KT Corp., ADR | | | 97,105 | | | | 2,093 | | |
| Samsung Electronics Co., Ltd., GDR–144A | | | 18,230 | | | | 4,867 | | |
| SK Telecom Co., Ltd., ADR † | | | 54,770 | | | | 1,107 | | |
| Spain (2.0%) | | | |
| Banco Santander Central Hispano SA | | | 255,313 | | | | 3,256 | | |
| Iberdrola SA | | | 48,076 | | | | 1,287 | | |
| Repsol YPF SA | | | 107,781 | | | | 3,209 | | |
| Telefonica SA | | | 151,142 | | | | 2,411 | | |
| Sweden (2.9%) | | | |
| Atlas Copco AB–Class A | | | 149,300 | | | | 2,730 | | |
| Electrolux AB–Class B | | | 80,570 | | | | 1,878 | | |
| Nordic Baltic Holding, FDR | | | 300,680 | | | | 2,948 | | |
| Securitas AB–Class B | | | 221,540 | | | | 3,369 | | |
The notes to the financial statements are an integral part of this report.
Transamerica IDEX Mutual Funds
Annual Report 2005
5
TA IDEX Templeton Great Companies Global
SCHEDULE OF INVESTMENTS (continued)
At October 31, 2005
(all amounts except share amounts in thousands)
| | | Shares | | Value | |
| Sweden (continued) | | | |
| Svenska Cellulosa AB–Class B | | | 56,300 | | | $ | 1,900 | | |
| Volvo AB–Class B † | | | 53,800 | | | | 2,214 | | |
| Switzerland (2.8%) | | | |
| Lonza Group AG | | | 46,880 | | | | 2,699 | | |
| Nestle SA, ADR | | | 41,810 | | | | 3,109 | | |
| Novartis AG, ADR | | | 57,780 | | | | 3,110 | | |
| Swiss Reinsurance (a) | | | 46,000 | | | | 3,102 | | |
| UBS AG | | | 23,500 | | | | 1,994 | | |
| UBS AG-Registered | | | 6,800 | | | | 582 | | |
| Taiwan (0.4%) | | | |
| Chunghwa Telecom Co., Ltd., ADR | | | 108,460 | | | | 1,878 | | |
| United Kingdom (10.1%) | | | |
| Alliance Unichem PLC | | | 149,030 | | | | 2,033 | | |
| BAE Systems PLC | | | 607,260 | | | | 3,554 | | |
| Boots Group PLC | | | 207,950 | | | | 2,268 | | |
| BP PLC, ADR | | | 52,570 | | | | 3,491 | | |
| British Airways PLC ‡ | | | 245,660 | | | | 1,314 | | |
| British Sky Broadcasting PLC | | | 282,380 | | | | 2,550 | | |
| Cadbury Schweppes PLC | | | 295,510 | | | | 2,909 | | |
| Compass Group PLC | | | 813,970 | | | | 2,738 | | |
| GlaxoSmithKline PLC | | | 140,659 | | | | 3,659 | | |
| HSBC Holdings PLC | | | 97,779 | | | | 1,538 | | |
| HSBC Holdings PLC, ADR † | | | 9,710 | | | | 765 | | |
| National Grid PLC | | | 212,127 | | | | 1,940 | | |
| National Grid PLC (Deferred Shares) m | | | 268,699 | | | | - | | |
| Pearson PLC | | | 176,790 | | | | 1,966 | | |
| Rentokil Initial PLC | | | 788,460 | | | | 2,143 | | |
| Rolls-Royce Group PLC ‡ | | | 452,880 | | | | 2,927 | | |
| Royal Bank of Scotland Group PLC | | | 107,980 | | | | 2,990 | | |
| Royal Dutch Shell PLC–Class B | | | 102,750 | | | | 3,353 | | |
| Smiths Group PLC | | | 149,790 | | | | 2,420 | | |
| Standard Chartered PLC | | | 100,440 | | | | 2,109 | | |
| Unilever PLC | | | 228,990 | | | | 2,323 | | |
| Vodafone Group PLC | | | 1,111,051 | | | | 2,916 | | |
| United States (50.3%) | | | |
| 3M Co. | | | 75,240 | | | | 5,717 | | |
| Adobe Systems, Inc. † | | | 97,700 | | | | 3,151 | | |
| American International Group, Inc. | | | 131,000 | | | | 8,489 | | |
| Amgen, Inc. ‡ | | | 47,540 | | | | 3,602 | | |
| Apple Computer, Inc. ‡ | | | 208,830 | | | | 12,026 | | |
| BJ Services Co. † | | | 42,750 | | | | 1,486 | | |
| Burlington Resources, Inc. | | | 35,000 | | | | 2,528 | | |
| Capital One Financial Corp. | | | 76,600 | | | | 5,848 | | |
| Chesapeake Energy Corp. | | | 77,000 | | | | 2,472 | | |
| Clorox Co. | | | 101,200 | | | | 5,477 | | |
| Coach, Inc. ‡ | | | 195,000 | | | | 6,275 | | |
| | | Shares | | Value | |
| United States (continued) | |
| ConocoPhillips | | | 40,220 | | | $ | 2,630 | | |
| Corning, Inc. ‡ | | | 296,000 | | | | 5,947 | | |
| Danaher Corp. † | | | 89,810 | | | | 4,679 | | |
| EMC Corp. ‡ | | | 326,000 | | | | 4,551 | | |
| Emerson Electric Co. | | | 63,930 | | | | 4,446 | | |
| First Data Corp. | | | 36,860 | | | | 1,491 | | |
| General Electric Co. | | | 191,810 | | | | 6,504 | | |
| Genzyme Corp. ‡ | | | 77,000 | | | | 5,567 | | |
| Goldman Sachs Group, Inc. (The) | | | 49,250 | | | | 6,224 | | |
| Harman International Industries, Inc. | | | 26,000 | | | | 2,596 | | |
| Hershey Co. (The) | | | 44,000 | | | | 2,500 | | |
| Hewlett-Packard Co. | | | 196,000 | | | | 5,496 | | |
| Intel Corp. | | | 228,520 | | | | 5,370 | | |
| International Game Technology † | | | 284,500 | | | | 7,536 | | |
| Johnson & Johnson | | | 88,000 | | | | 5,511 | | |
| Johnson Controls, Inc. | | | 81,070 | | | | 5,517 | | |
| JP Morgan Chase & Co. | | | 240,000 | | | | 8,789 | | |
| Kellogg Co. | | | 121,160 | | | | 5,352 | | |
| Linear Technology Corp. | | | 175,900 | | | | 5,842 | | |
| Medtronic, Inc. | | | 118,590 | | | | 6,719 | | |
| Microsoft Corp. | | | 227,975 | | | | 5,859 | | |
| Morgan Stanley | | | 77,000 | | | | 4,190 | | |
| Motorola, Inc. | | | 404,720 | | | | 8,969 | | |
| Omnicom Group, Inc. | | | 67,100 | | | | 5,567 | | |
| PepsiCo, Inc. | | | 141,700 | | | | 8,372 | | |
| Procter & Gamble Co. | | | 123,700 | | | | 6,926 | | |
| Prudential Financial, Inc. | | | 68,900 | | | | 5,015 | | |
| Quest Diagnostics, Inc. | | | 50,000 | | | | 2,335 | | |
| St. Jude Medical, Inc. ‡ | | | 115,000 | | | | 5,528 | | |
| Symantec Corp. ‡ | | | 111,920 | | | | 2,669 | | |
| Telik, Inc. †‡ | | | 129,000 | | | | 1,927 | | |
| United Technologies Corp. | | | 147,200 | | | | 7,548 | | |
| Vertex Pharmaceuticals, Inc. ‡ | | | 152,120 | | | | 3,461 | | |
| Viacom, Inc.–Class B | | | 288,580 | | | | 8,937 | | |
| W.R. Berkley Corp. | | | 143,000 | | | | 6,249 | | |
| WM Wrigley Jr. Co. | | | 40,000 | | | | 2,780 | | |
| Wyeth | | | 122,720 | | | | 5,468 | | |
| Yahoo!, Inc. ‡ | | | 166,250 | | | | 6,146 | | |
| Total Common Stocks (cost: $458,292) | | | | | | | 486,470 | | |
| | | Principal | | Value | |
| SECURITY LENDING COLLATERAL (7.8%) | |
| Debt (7.2%) | |
| Bank Notes (0.5%) | |
Bank of America
| |
| 3.81%, due 06/07/2006 * | | $ | 1,119 | | | $ | 1,119 | | |
| 3.81%, due 08/10/2006 * | | | 1,111 | | | | 1,111 | | |
Credit Suisse First Boston Corp.
4.11%, due 03/10/2006 * | | | 222 | | | | 222 | | |
The notes to the financial statements are an integral part of this report.
Transamerica IDEX Mutual Funds
Annual Report 2005
6
TA IDEX Templeton Great Companies Global
SCHEDULE OF INVESTMENTS (continued)
At October 31, 2005
(all amounts except share amounts in thousands)
| | | Principal | | Value | |
| Certificates of Deposit (0.5%) | |
Canadian Imperial Bank of Commerce
4.07%, due 11/04/2005 * | | $ | 889 | | | $ | 889 | | |
Harris Trust & Savings Bank
3.80%, due 11/04/2005 * | | | 707 | | | | 707 | | |
Rabobank Nederland
4.03%, due 05/31/2006 * | | | 1,111 | | | | 1,111 | | |
| Commercial Paper (1.5%) | |
Ciesco LLC
4.00%, due 11/03/2005 | | | 1,109 | | | | 1,109 | | |
General Electric Capital Corp.
3.96%, due 12/05/2005 | | | 889 | | | | 889 | | |
Paradigm Funding LLC–144A
4.01%, due 11/07/2005 | | | 886 | | | | 886 | | |
Park Avenue Receivables Corp.–144A
4.03%, due 12/02/2005 | | | 880 | | | | 880 | | |
Preferred Receivables Corp.–144A
4.04%, due 12/05/2005 | | | 666 | | | | 666 | | |
Ranger Funding Co. LLC–144A
3.99%, due 11/15/2005 | | | 661 | | | | 661 | | |
Sheffield Receivables Corp.–144A
4.01%, due 11/08/2005 | | | 666 | | | | 666 | | |
Yorktown Capital LLC
3.97%, due 11/09/2005
3.93%, due 11/17/2005 | | | 1,107
1,103 | | | | 1,107
1,103 | | |
| Euro Dollar Overnight (1.7%) | |
Bank of Montreal
3.79%, due 11/01/2005 | | | 666 | | | | 666 | | |
Barclays
3.80%, due 11/04/2005 | | | 889 | | | | 889 | | |
BNP Paribas
3.83%, due 11/02/2005 | | | 1,333 | | | | 1,333 | | |
Deutsche Bank
3.80%, due 11/02/2005 | | | 2,222 | | | | 2,222 | | |
HSBC Banking/Holdings PLC
3.84%, due 11/07/2005 | | | 667 | | | | 667 | | |
Royal Bank of Scotland
3.76%, due 11/01/2005 | | | 889 | | | | 889 | | |
Svenska Handlesbanken
4.03%, due 11/01/2005 | | | 1,144 | | | | 1,144 | | |
UBS AG
3.80%, due 11/03/2005 | | | 889 | | | | 889 | | |
| Euro Dollar Terms (0.6%) | |
Royal Bank of Scotland
4.00%, due 12/12/2005 | | | 889 | | | | 889 | | |
UBS AG
4.02%, due 12/01/2005 | | | 889 | | | | 889 | | |
| | | Principal | | Value | |
| Euro Dollar Terms (continued) | | | |
Wells Fargo
3.96%, due 11/14/2005 | | $ | 1,333 | | | $ | 1,333 | | |
| Promissory Notes (0.2%) | | | |
Goldman Sachs Group, Inc.
4.02%, due 12/28/2005 | | | 933 | | | | 933 | | |
| Repurchase Agreements (2.2%) †† | | | |
Credit Suisse First Boston Corp.
4.10%, dated 10/31/2005 to be
repurchased at $1,514 on 11/01/2005 | | | 1,514 | | | | 1,514 | | |
Goldman Sachs Group, Inc. (The)
4.10%, dated 10/31/2005 to be
repurchased at $3,777 on 11/01/2005 | | | 3,777 | | | | 3,777 | | |
Lehman Brothers, Inc.
4.10%, dated 10/31/2005 to be
repurchased at $105 on 11/01/2005 | | | 105 | | | | 105 | | |
Merrill Lynch & Co.
4.10%, dated 10/31/2005 to be
repurchased at $4,444 on 11/01/2005 | | | 4,443 | | | | 4,443 | | |
Morgan Stanley Dean Witter & Co.
4.17%, dated 10/31/2005 to be
repurchased at $1,332 on 11/01/2005 | | | 1,332 | | | | 1,332 | | |
| | | Shares | | Value | |
| Investment Companies (0.6%) | | | |
| Money Market Funds (0.6%) | | | |
American Beacon Fund
1-day yield of 3.81% | | | 957,928 | | | $ | 958 | | |
Barclays Global Investors
Institutional Money Market Fund
1-day yield of 3.92% | | | 888,669 | | | | 889 | | |
Goldman Sachs Financial Square
Prime Obligations Fund
1-day yield of 3.79% | | | 138,426 | | | | 138 | | |
Merrimac Cash Fund, Premium Class
1-day yield of 3.70% @ | | | 878,847 | | | | 879 | | |
| Total Security Lending Collateral (cost: $39,904) | | | | | | | 39,904 | | |
| Total Investment Securities (cost: $498,196) | | | | | | $ | 526,374 | | |
| SUMMARY: | | | |
| Investment securities, at value | | | 102.5 | % | | $ | 526,374 | | |
| Liabilities in excess of other assets | | | (2.5 | )% | | | (13,055 | ) | |
| Net assets | | | 100.0 | % | | $ | 513,319 | | |
The notes to the financial statements are an integral part of this report.
Transamerica IDEX Mutual Funds
Annual Report 2005
7
TA IDEX Templeton Great Companies Global
SCHEDULE OF INVESTMENTS (continued)
At October 31, 2005
(all amounts except share amounts in thousands)
NOTES TO SCHEDULE OF INVESTMENTS:
† At October 31, 2005, all or a portion of this security is on loan (see Note 1). The value at October 31, 2005, of all securities on loan is $38,280.
‡ Non-income producing.
* Floating or variable rate note. Rate is listed as of October 31, 2005.
†† Cash collateral for the Repurchase Agreements, valued at $11,394, that serve as collateral for securities lending are invested in corporate bonds with interest rates and maturity dates ranging from 0.00%–9.86% and 12/31/2005–11/15/2096, respectively.
@ Regulated investment company advised by Investors Bank and Trust Co. ("IBT"). IBT is also the accounting, custody and lending agent for the Fund.
m Securities valued as determined in good faith in accordance with procedure established by the Fund's Board of Trustees.
(a) Passive Foreign Investment Company.
DEFINITIONS:
144A 144A Securities are registered pursuant to Rule 144A of the Securities Act of 1933. These securities are deemed to be liquid for purposes of compliance limitations on holdings of illiquid securities and may be resold as transactions exempt from registration, normally to qualified institutional buyers. At October 31, 2005, these securities aggregated $8,626 or 1.7% of the net assets of the Fund.
ADR American Depositary Receipt
FDR Finnish Depositary Receipt
GDR Global Depositary Receipt
| | | Percentage of
Net Assets | | Value | |
| INVESTMENTS BY INDUSTRY: | | | |
| Pharmaceuticals | | | 7.4 | % | | $ | 38,214 | | |
| Commercial Banks | | | 6.9 | % | | | 35,180 | | |
| Insurance | | | 5.4 | % | | | 27,949 | | |
| Telecommunications | | | 4.9 | % | | | 25,110 | | |
| Computer & Office Equipment | | | 4.8 | % | | | 24,841 | | |
| Electronic & Other Electric Equipment | | | 4.6 | % | | | 23,577 | | |
| Computer & Data Processing Services | | | 4.0 | % | | | 20,279 | | |
| Communications Equipment | | | 3.8 | % | | | 19,472 | | |
| Chemicals & Allied Products | | | 3.7 | % | | | 18,952 | | |
| Food & Kindred Products | | | 3.2 | % | | | 16,650 | | |
| Business Services | | | 3.2 | % | | | 16,231 | | |
| Aerospace | | | 3.0 | % | | | 15,456 | | |
| Electronic Components & Accessories | | | 3.0 | % | | | 15,422 | | |
| Oil & Gas Extraction | | | 2.5 | % | | | 12,861 | | |
| Medical Instruments & Supplies | | | 2.4 | % | | | 12,247 | | |
| Security & Commodity Brokers | | | 2.3 | % | | | 12,009 | | |
| Petroleum Refining | | | 2.3 | % | | | 12,007 | | |
| Communication | | | 2.2 | % | | | 11,487 | | |
| Life Insurance | | | 2.2 | % | | | 11,097 | | |
| Instruments & Related Products | | | 1.9 | % | | | 9,869 | | |
| Paper & Allied Products | | | 1.7 | % | | | 8,800 | | |
| Beverages | | | 1.6 | % | | | 8,372 | | |
| Entertainment | | | 1.5 | % | | | 7,536 | | |
| Electric Services | | | 1.4 | % | | | 7,171 | | |
| Leather & Leather Products | | | 1.2 | % | | | 6,275 | | |
| Personal Credit Institutions | | | 1.1 | % | | | 5,848 | | |
| Furniture & Fixtures | | | 1.1 | % | | | 5,517 | | |
| Paper & Paper Products | | | 1.0 | % | | | 4,896 | | |
| Automotive | | | 0.9 | % | | | 4,530 | | |
| Metal Mining | | | 0.8 | % | | | 4,286 | | |
| Transportation & Public Utilities | | | 0.7 | % | | | 3,575 | | |
| | | Percentage of
Net Assets | | Value | |
| INVESTMENTS BY INDUSTRY: (continued) | | | |
| Radio & Television Broadcasting | | | 0.6 | % | | $ | 3,298 | | |
| Printing & Publishing | | | 0.6 | % | | | 3,131 | | |
| Manufacturing Industries | | | 0.6 | % | | | 3,130 | | |
| Restaurants | | | 0.5 | % | | | 2,738 | | |
| Industrial Machinery & Equipment | | | 0.5 | % | | | 2,730 | | |
| Specialty–Real Estate | | | 0.5 | % | | | 2,622 | | |
| Hotels & Other Lodging Places | | | 0.5 | % | | | 2,358 | | |
| Health Services | | | 0.5 | % | | | 2,335 | | |
| Wholesale Trade Nondurable Goods | | | 0.5 | % | | | 2,323 | | |
| Railroads | | | 0.5 | % | | | 2,301 | | |
| Drug Stores & Proprietary Stores | | | 0.4 | % | | | 2,268 | | |
| Rubber & Misc. Plastic Products | | | 0.4 | % | | | 1,984 | | |
| Research & Testing Services | | | 0.4 | % | | | 1,927 | | |
| Holding & Other Investment Offices | | | 0.4 | % | | | 1,761 | | |
| Electric, Gas & Sanitary Services | | | 0.3 | % | | | 1,761 | | |
| Primary Metal Industries | | | 0.3 | % | | | 1,705 | | |
| Air Transportation | | | 0.3 | % | | | 1,314 | | |
| Motor Vehicles, Parts & Supplies | | | 0.2 | % | | | 1,068 | | |
| Investment securities, at value | | | 94.7 | % | | | 486,470 | | |
| Security lending collateral | | | 7.8 | % | | | 39,904 | | |
| Liabilities in excess of other assets | | | (2.5 | )% | | | (13,055 | ) | |
| Net assets | | | 100.0 | % | | $ | 513,319 | | |
The notes to the financial statements are an integral part of this report.
Transamerica IDEX Mutual Funds
Annual Report 2005
8
TA IDEX Templeton Great Companies Global
STATEMENT OF ASSETS AND LIABILITIES
At October 31, 2005
(all amounts except per share amounts in thousands)
| Assets: | | | |
Investment securities, at value (cost: $498,196)
(including securities loaned of $38,280) | | $ | 526,374 | | |
| Cash | | | 22,431 | | |
| Foreign currencies (cost: $63) | | | 63 | | |
| Receivables: | |
| Investment securities sold | | | 4,477 | | |
| Shares of beneficial interest sold | | | 17 | | |
| Interest | | | 81 | | |
| Dividends | | | 507 | | |
| Dividend reclaims receivable | | | 534 | | |
| Other | | | 221 | | |
| | | | 554,705 | | |
| Liabilities: | | | |
| Accounts payable and accrued liabilities: | |
| Shares of beneficial interest redeemed | | | 612 | | |
| Management and advisory fees | | | 324 | | |
| Distribution and service fees | | | 223 | | |
| Transfer agent fees | | | 125 | | |
| Administration fees | | | 9 | | |
| Payable for collateral for securities on loan | | | 39,904 | | |
| Other | | | 189 | | |
| | | | 41,386 | | |
| Net Assets | | $ | 513,319 | | |
| Net Assets Consist of: | | | |
Shares of beneficial interest, unlimited shares
authorized, no par value | | $ | 859,455 | | |
| Accumulated net investment income (loss) | | | (866 | ) | |
Accumulated net realized gain (loss) from investment
securitiesand foreign currency transactions | | | (373,507 | ) | |
| Net unrealized appreciation (depreciation) on: | |
| Investment securities | | | 28,170 | | |
Translation of assets and liabilites denominated
in foreign currencies | | | 67 | | |
| Net Assets | | $ | 513,319 | | |
| Net Assets by Class: | | | |
| Class A | | $ | 385,504 | | |
| Class B | | | 90,877 | | |
| Class C | | | 36,938 | | |
| Shares Outstanding: | | | |
| Class A | | | 15,622 | | |
| Class B | | | 3,910 | | |
| Class C | | | 1,591 | | |
| Net Asset Value Per Share: | | | |
| Class A | | $ | 24.68 | | |
| Class B | | | 23.24 | | |
| Class C | | | 23.21 | | |
| Maximum Offering Price Per Share (a): | | | |
| Class A | | $ | 26.12 | | |
(a) Includes the maximum selling commission (represented as a percentage of offering price) which is reduced on certain levels of sales as set forth in the Prospectus. Net asset value per share for Classes B and C shares represents offering price. The redemption price for Classes B and C shares equals net asset value less any applicable contingent deferred sales charge.
STATEMENT OF OPERATIONS
For the year ended October 31, 2005
(all amounts in thousands)
| Investment Income: | | | |
| Interest | | $ | 371 | | |
Dividends (net of withholding taxes on foreign
dividends of $679) | | | 10,955 | | |
| Income from loaned securities–net | | | 73 | | |
| | | | 11,399 | | |
| Expenses: | | | |
| Management and advisory fees | | | 3,988 | | |
| Distribution and service fees: | |
| Class A | | | 1,231 | | |
| Class B | | | 1,067 | | |
| Class C | | | 430 | | |
| Transfer agent fees: | |
| Class A | | | 511 | | |
| Class B | | | 525 | | |
| Class C | | | 199 | | |
| Printing and shareholder reports | | | 245 | | |
| Custody fees | | | 163 | | |
| Administration fees | | | 97 | | |
| Legal fees | | | 33 | | |
| Audit fees | | | 33 | | |
| Trustees fees | | | 22 | | |
| Registration fees: | |
| Class A | | | 23 | | |
| Class B | | | 12 | | |
| Class C | | | 4 | | |
| Other | | | 8 | | |
| Total expenses | | | 8,591 | | |
| Less: | |
| Reimbursement of class expenses: | |
| Class B | | | (226 | ) | |
| Class C | | | (77 | ) | |
| Total reimbursed expenses | | | (303 | ) | |
| Net expenses | | | 8,288 | | |
| Net Investment Income (Loss) | | | 3,111 | | |
| Net Realized Gain (Loss) from: | | | |
| Investment securities | | | 20,787 | | |
| Foreign currency transactions | | | (545 | ) | |
| | | | 20,242 | | |
Net Increase (Decrease) in Unrealized Appreciation
(Depreciation) on: | | | |
| Investment securities | | | 19,840 | | |
Translation of assets and liabilities denominated in
foreign currencies | | | (149 | ) | |
| | | | 19,691 | | |
Net Gain (Loss) on Investment Securities and
Foreign Currency Transactions | | | 39,933 | | |
Net Increase (Decrease) in Net Assets Resulting
from Operations | | $ | 43,044 | | |
The notes to the financial statements are an integral part of this report.
Transamerica IDEX Mutual Funds
Annual Report 2005
9
TA IDEX Templeton Great Companies Global
STATEMENTS OF CHANGES IN NET ASSETS
For the years ended
(all amounts in thousands)
| | | October 31,
2005 | | October 31,
2004 | |
| Increase (Decrease) In Net Assets From: | | | |
| Operations: | | | |
| Net investment income (loss) | | $ | 3,111 | | | $ | (2,434 | ) | |
Net realized gain (loss) from
investment securities and foreign
currency transactions | | | 20,242 | | | | 54,690 | | |
Net unrealized appreciation
(depreciation) on investment
securities and foreign currency
translation | | | 19,691 | | | | (30,035 | ) | |
| | | | 43,044 | | | | 22,221 | | |
| Distributions to Shareholders: | | | |
| From net investment income: | |
| Class A | | | (3,664 | ) | | | – | | |
| Class B | | | (5 | ) | | | – | | |
| Class C | | | (8 | ) | | | – | | |
| | | | (3,677 | ) | | | – | | |
| Capital Share Transactions: | | | |
| Proceeds from shares sold: | |
| Class A | | | 174,981 | | | | 9,922 | | |
| Class B | | | 2,689 | | | | 3,635 | | |
| Class C | | | 1,105 | | | | 505 | | |
| Class C2 | | | – | | | | 833 | | |
| Class M | | | – | | | | 771 | | |
| | | | 178,775 | | | | 15,666 | | |
| Proceeds from fund acquisition: | |
| Class A | | | – | | | | 85,329 | | |
| Class B | | | – | | | | 4,841 | | |
| Class C | | | – | | | | 436 | | |
| Class C2 | | | – | | | | 1,244 | | |
| Class M | | | – | | | | 838 | | |
| | | | – | | | | 92,688 | | |
Dividends and distributions
reinvested: | |
| Class A | | | 3,598 | | | | – | | |
| Class B | | | 4 | | | | – | | |
| Class C | | | 8 | | | | – | | |
| | | | 3,610 | | | | – | | |
| Cost of shares redeemed: | |
| Class A | | | (47,814 | ) | | | (70,094 | ) | |
| Class B | | | (36,203 | ) | | | (50,478 | ) | |
| Class C | | | (16,720 | ) | | | (2,995 | ) | |
| Class C2 | | | – | | | | (6,874 | ) | |
| Class M | | | – | | | | (20,371 | ) | |
| | | | (100,737 | ) | | | (150,812 | ) | |
| Class level exchanges: | |
| Class C | | | – | | | | 49,193 | | |
| Class C2 | | | – | | | | (14,403 | ) | |
| Class M | | | – | | | | (34,790 | ) | |
| | | | – | | | | – | | |
| | | October 31,
2005 | | October 31,
2004 | |
| Automatic conversions: | |
| Class A | | $ | 3,265 | | | $ | 1,159 | | |
| Class B | | | (3,265 | ) | | | (1,159 | ) | |
| | | | – | | | | – | | |
| | | | 81,648 | | | | (42,458 | ) | |
| Net increase (decrease) in net assets | | | 121,015 | | | | (20,237 | ) | |
| Net Assets: | | | |
| Beginning of year | | | 392,304 | | | | 412,541 | | |
| End of year | | $ | 513,319 | | | $ | 392,304 | | |
Accumulated Net Investment Income
(Loss) | | $ | (866 | ) | | $ | (254 | ) | |
| Share Activity: | | | |
| Shares issued: | |
| Class A | | | 7,281 | | | | 438 | | |
| Class B | | | 118 | | | | 169 | | |
| Class C | | | 49 | | | | 24 | | |
| Class C2 | | | – | | | | 38 | | |
| Class M | | | – | | | | 36 | | |
| | | | 7,448 | | | | 705 | | |
| Shares issued on fund acquisition: | |
| Class A | | | – | | | | 3,817 | | |
| Class B | | | – | | | | 230 | | |
| Class C | | | – | | | | 21 | | |
| Class C2 | | | – | | | | 59 | | |
| Class M | | | – | | | | 39 | | |
| | | | – | | | | 4,166 | | |
Shares issued–reinvested from
distributions: | |
| Class A | | | 147 | | | | – | | |
| | | | 147 | | | | – | | |
| Shares redeemed: | |
| Class A | | | (1,977 | ) | | | (3,098 | ) | |
| Class B | | | (1,596 | ) | | | (2,370 | ) | |
| Class C | | | (739 | ) | | | (144 | ) | |
| Class C2 | | | – | | | | (321 | ) | |
| Class M | | | – | | | | (950 | ) | |
| | | | (4,312 | ) | | | (6,883 | ) | |
| Class level exchanges: | |
| Class C | | | – | | | | 2,372 | | |
| Class C2 | | | – | | | | (689 | ) | |
| Class M | | | – | | | | (1,675 | ) | |
| | | | – | | | | 8 | | |
| Automatic conversions: | |
| Class A | | | 134 | | | | 51 | | |
| Class B | | | (143 | ) | | | (54 | ) | |
| | | | (9 | ) | | | (3 | ) | |
Net increase (decrease) in shares
outstanding: | |
| Class A | | | 5,585 | | | | 1,208 | | |
| Class B | | | (1,621 | ) | | | (2,025 | ) | |
| Class C | | | (690 | ) | | | 2,273 | | |
| Class C2 | | | – | | | | (913 | ) | |
| Class M | | | – | | | | (2,550 | ) | |
| | | | 3,274 | | | | (2,007 | ) | |
The notes to the financial statements are an integral part of this report.
Transamerica IDEX Mutual Funds
Annual Report 2005
10
TA IDEX Templeton Great Companies Global
FINANCIAL HIGHLIGHTS
| | | | | For a share of beneficial interest outstanding throughout each period | |
| | | | | Net Asset | | Investment Operations | | Distributions | | Net Asset | |
| | | For the
Period
Ended (d)(g) | | Value,
Beginning
of Period | | Net
Investment
Income (Loss) | | Net Realized
and Unrealized
Gain (Loss) | |
Total
Operations | | From Net
Investment
Income | | From Net
Realized
Gains | |
Total
Distributions | | Value,
End
of Period | |
| Class A | | 10/31/2005 | | $ | 22.57 | | | $ | 0.21 | | | $ | 2.14 | | | $ | 2.35 | | | $ | (0.24 | ) | | $ | – | | | $ | (0.24 | ) | | $ | 24.68 | | |
| | | 10/31/2004 | | | 21.41 | | | | (0.07 | ) | | | 1.23 | | | | 1.16 | | | | – | | | | – | | | | – | | | | 22.57 | | |
| | | 10/31/2003 | | | 19.06 | | | | (0.05 | ) | | | 2.40 | | | | 2.35 | | | | – | | | | – | | | | – | | | | 21.41 | | |
| | | 10/31/2002 | | | 23.67 | | | | (0.08 | ) | | | (4.53 | ) | | | (4.61 | ) | | | – | | | | – | | | | – | | | | 19.06 | | |
| | | 10/31/2001 | | | 40.20 | | | | (0.07 | ) | | | (13.99 | ) | | | (14.06 | ) | | | – | | | | (2.47 | ) | | | (2.47 | ) | | | 23.67 | | |
| Class B | | 10/31/2005 | | | 21.23 | | | | 0.02 | | | | 1.99 | | | | 2.01 | | | | – | (h) | | | – | | | | – | | | | 23.24 | | |
| | | 10/31/2004 | | | 20.25 | | | | (0.20 | ) | | | 1.18 | | | | 0.98 | | | | – | | | | – | | | | – | | | | 21.23 | | |
| | | 10/31/2003 | | | 18.14 | | | | (0.17 | ) | | | 2.28 | | | | 2.11 | | | | – | | | | – | | | | – | | | | 20.25 | | |
| | | 10/31/2002 | | | 22.71 | | | | (0.22 | ) | | | (4.35 | ) | | | (4.57 | ) | | | – | | | | – | | | | – | | | | 18.14 | | |
| | | 10/31/2001 | | | 38.97 | | | | (0.27 | ) | | | (13.52 | ) | | | (13.79 | ) | | | – | | | | (2.47 | ) | | | (2.47 | ) | | | 22.71 | | |
| Class C | | 10/31/2005 | | | 21.21 | | | | 0.02 | | | | 1.99 | | | | 2.01 | | | | (0.01 | ) | | | – | | | | (0.01 | ) | | | 23.21 | | |
| | | 10/31/2004 | | | 20.25 | | | | (0.15 | ) | | | 1.11 | | | | 0.96 | | | | – | | | | – | | | | – | | | | 21.21 | | |
| | | 10/31/2003 | | | 18.00 | | | | (0.17 | ) | | | 2.42 | | | | 2.25 | | | | – | | | | – | | | | – | | | | 20.25 | | |
| | | | | | | Ratios/Supplemental Data | |
| | | For the
Period | | Total | | Net Assets,
End of
Period | | Ratio of Expenses
to Average
Net Assets (a) | | Net Investment
Income (Loss)
to Average | | Portfolio
Turnover | |
| | | Ended (g) | | Return (c) | | (000's) | | Net (e) | | Total (f) | | Net Assets (a) | | Rate (b) | |
| Class A | | 10/31/2005 | | | 10.41 | % | | $ | 385,504 | | | | 1.42 | % | | | 1.42 | % | | | 0.85 | % | | | 79 | % | |
| | | 10/31/2004 | | | 5.41 | | | | 226,517 | | | | 1.85 | | | | 1.85 | | | | (0.31 | ) | | | 140 | | |
| | | 10/31/2003 | | | 12.33 | | | | 189,046 | | | | 2.07 | | | | 2.07 | | | | (0.26 | ) | | | 103 | | |
| | | 10/31/2002 | | | (19.46 | ) | | | 225,722 | | | | 1.88 | | | | 1.88 | | | | (0.34 | ) | | | 72 | | |
| | | 10/31/2001 | | | (37.08 | ) | | | 374,626 | | | | 1.63 | | | | 1.63 | | | | (0.24 | ) | | | 79 | | |
| Class B | | 10/31/2005 | | | 9.48 | | | | 90,877 | | | | 2.20 | | | | 2.41 | | | | 0.07 | | | | 79 | | |
| | | 10/31/2004 | | | 4.83 | | | | 117,409 | | | | 2.49 | | | | 2.49 | | | | (0.93 | ) | | | 140 | | |
| | | 10/31/2003 | | | 11.57 | | | | 153,046 | | | | 2.72 | | | | 2.72 | | | | (0.91 | ) | | | 103 | | |
| | | 10/31/2002 | | | (20.09 | ) | | | 193,259 | | | | 2.53 | | | | 2.53 | | | | (0.99 | ) | | | 72 | | |
| | | 10/31/2001 | | | (37.58 | ) | | | 320,693 | | | | 2.28 | | | | 2.28 | | | | (0.89 | ) | | | 79 | | |
| Class C | | 10/31/2005 | | | 9.52 | | | | 36,938 | | | | 2.20 | | | | 2.38 | | | | 0.07 | | | | 79 | | |
| | | 10/31/2004 | | | 4.74 | | | | 48,378 | | | | 2.18 | | | | 2.18 | | | | (0.72 | ) | | | 140 | | |
| | | 10/31/2003 | | | 12.50 | | | | 163 | | | | 2.72 | | | | 2.72 | | | | (0.92 | ) | | | 103 | | |
NOTES TO FINANCIAL HIGHLIGHTS
(a) Annualized.
(b) Not annualized.
(c) Total Return has been calculated for the applicable period without deduction of a sales load, if any, on an initial purchase. Periods of less that one year are not annualized.
(d) Per share information is calculated based on average number of shares outstanding.
(e) Ratio of Net Expenses to Average Net Assets is net of fee waivers and reimbursements by the investment adviser, if any (see note 2).
(f) Ratio of Total Expenses to Average Net Assets includes all expenses before fee waivers and reimbursements by the investment adviser.
(g) The inception date for the Fund's offering of share Class C was November 11, 2002.
(h) Rounds to less than $(0.01) per share.
The notes to the financial statements are an integral part of this report.
Transamerica IDEX Mutual Funds
Annual Report 2005
11
TA IDEX Templeton Great Companies Global
NOTES TO FINANCIAL STATEMENTS
At October 31, 2005
(all amounts in thousands)
NOTE 1. ORGANIZATION AND SIGNIFICANT ACCOUNTING POLICIES
Transamerica IDEX Mutual Funds is an open-end management investment company registered under the Investment Company Act of 1940, as amended (the "1940 Act").
In the normal course of business, TA IDEX Templeton Great Companies Global (the "Fund") enters into contracts that contain a variety of representations that provide general indemnifications. The Fund's maximum exposure under these arrangements is unknown, as this would involve future claims that may be made against the Fund and/or its affiliates that have not yet occurred. However, based on experience, the Fund expects the risk of loss to be remote.
This report should be read in conjunction with the current Fund prospectus, which contains more complete information about the Fund.
The following is a summary of significant accounting policies followed by the Fund in the preparation of the financial statements. In preparing the Fund's financial statements in accordance with accounting principles generally accepted in the United States of America ("GAAP"), estimates or assumptions (which could differ from actual results) may be used that affect reported amounts and disclosures.
On May 28, 2004, the Fund acquired all of the net assets of TA IDEX Templeton Great Companies Global pursuant to a plan of reorganization. TA IDEX Janus Global is the accounting survivor. At the same time, the Fund changed sub-advisers from Janus Capital Management, LLC to Templeton Investment Counsel, LLC and Great Companies, LLC and was renamed from TA IDEX Janus Global to TA IDEX Templeton Great Companies Global.
The acquisition was accomplished by a tax free exchange of 4,196 shares of the Fund for 12,556 shares of TA IDEX Templeton Great Companies Global outstanding on May 27, 2004. TA IDEX Great Companies Global's net assets at that date, $92,688, including $3,609 unrealized appreciation, were combined with those of the Fund. The aggregate net assets of TA IDEX Janus Global immediately before the acquisition was $341,594. The combined net assets of the Fund immediately after the acquisition was $434,282. Proceeds in connection with the acquisition were as follows:
| | | Shares | | Amount | |
| Proceeds in connection with the acquisition | |
| Class A | | | 3,817 | | | $ | 85,329 | | |
| Class B | | | 230 | | | | 4,841 | | |
| Class C | | | 21 | | | | 436 | | |
| Class C2 | | | 59 | | | | 1,244 | | |
| Class M | | | 39 | | | | 838 | | |
| | | | | | | $ | 92,688 | | |
Multiple class operations, income and expenses: The Fund currently offers three classes of shares, each with a public offering price that reflects different sales charges, if any, and expense levels. On June 15, 2004, Class C2 shares merged into Class C. On September 24, 2004, Class M shares merged into Class C. Class B shares will convert to Class A shares eight years after purchase. Income, non-class specific expenses and realized and unrealized gains and losses, are allocated daily to each class, based upon the value of shares outstanding method as permitted under Rule 18f-3 of the 1940 Act. Each class bears its own specific expenses as well as a portion of general, common expenses.
Security valuations: The Fund values its investments at the close of the New York Stock Exchange ("NYSE"), normally 4 p.m. ET, each day the NYSE is open for business. Fund investments are valued at the last sale price or closing price on the day of valuation taken from the primary exchange where the security is principally traded.
Securities traded in the over-the-counter market and listed securities for which no sale was reported on that date are valued at the last quoted bid price.
Debt securities are valued based on a price quotation or other equivalent indication of value supplied by an exchange, a pricing service or a major market maker; however, those that mature in sixty days or less are valued at amortized cost, which approximates market.
Investment company securities are valued at the net asset value of the underlying portfolio.
Foreign securities generally are valued based on quotations from the primary market in which they are traded. Because many foreign securities markets and exchanges close prior to the close of the NYSE, closing prices for foreign securities in those markets or on those exchanges do not reflect the events that occur after that close. If a significant market event impacting the value of a portfolio security (e.g., natural disaster, company announcement, market volatility) occurs subsequent to the close of trading in the security, but prior to the calculation of the Fund's net asset value per share, market quotations for that security may be determined to be unreliable and, accordingly, not "readily available." As a result, foreign equity securities held by the Fund may be valued at fair market value as determined in good faith by the Fund's Administrative Valuation Committee, under the supervision of the B oard's Valuation Committee, using guidelines adopted by the Board of Trustees.
Other securities for which quotations are not readily available or whose values have been determined to be unreliable are valued at fair market value as determined in good faith by the Fund's Administrative Valuation Committee, under the supervision of the Board's Valuation Committee, using guidelines adopted by the Board of Trustees.
Cash: The Fund may leave cash overnight in its cash account with the custodian, Investors Bank & Trust Company ("IBT"). IBT has been contracted on behalf of the Fund to invest the excess cash into a savings account, which at October 31, 2005, was paying an interest rate of 2.76%.
Transamerica IDEX Mutual Funds
Annual Report 2005
12
TA IDEX Templeton Great Companies Global
NOTES TO FINANCIAL STATEMENTS (continued)
At October 31, 2005
(all amounts in thousands)
NOTE 1.–(continued)
Repurchase agreements: The Fund is authorized to enter into repurchase agreements. The Fund, through its custodian, IBT, receives delivery of the underlying securities, the value of which at the time of purchase is required to be an amount equal to at least 100% of the resale price. The Fund will bear the risk of value fluctuations until the security can be sold and may encounter delays and incur costs in liquidating the security. In the event of bankruptcy or insolvency of the seller, delays and costs may be incurred.
Commission recapture: The sub-adviser, to the extent consistent with the best execution and usual commission rate policies and practices, may place security transactions of the Fund with broker/dealers with which Transamerica IDEX Mutual Funds has established a Commission Recapture Program. A Commission Recapture Program is any arrangement under which a broker/dealer applies a portion of the commissions received by such broker/dealer on the security transactions to the Fund. In no event will commissions paid by the Fund be used to pay expenses that would otherwise be borne by any other funds within Transamerica IDEX Mutual Funds, or by any other party.
Recaptured commissions during the year ended October 31, 2005, of $118 are included in net realized gains in the Statement of Operations.
Securities lending: The Fund may lend securities to qualified borrowers, with IBT acting as the Fund's lending agent. The Fund earns negotiated lenders' fees. The Fund receives cash and/or securities as collateral against the loaned securities. Cash collateral received is invested in short term, interest bearing securities. The Fund monitors the market value of securities loaned on a daily basis and requires collateral in an amount at least equal to the value of the securities loaned. Income from loaned securities on the Statement of Operations is net of fees, in the amount of $31, earned by IBT for its services.
Security transactions and investment income: Security transactions are recorded on the trade date. Security gains and losses are calculated on the specific identification basis. Dividend income, if any, is recorded on the ex-dividend date or, in the case of foreign securities, as soon as the Fund is informed of the ex-dividend date. Interest income, including accretion of discounts and amortization of premiums, is recorded on the accrual basis commencing on the settlement date.
Foreign currency denominated investments: The accounting records of the Fund are maintained in U.S. dollars. Securities and other assets and liabilities denominated in foreign currencies are translated into U.S. dollars at the closing exchange rate each day. The cost of foreign securities is translated at the exchange rate in effect when the investment was acquired. The Fund combines fluctuations from currency exchange rates and fluctuations in value when computing net realized and unrealized gains or losses from investments.
Net foreign currency gains and losses resulting from changes in exchange rates include: 1) foreign currency fluctuations between trade date and settlement date of investment security transactions; 2) gains and losses on forward foreign currency contracts; and 3) the difference between the receivable amounts of interest and dividends recorded in the accounting records in U.S. dollars and the amounts actually received.
Foreign currency denominated assets may involve risks not typically associated with domestic transactions. These risks include revaluation of currencies, adverse fluctuations in foreign currency values and possible adverse political, social and economic developments, including those particular to a specific industry, country or region.
Foreign capital gains taxes: The Fund may be subject to taxes imposed by countries in which it invests, with respect to its investment in issuers existing or operating in such countries. Such taxes are generally based on income earned or repatriated and capital gains realized on the sale of such investments. The Fund accrues such taxes when the related income or capital gains are earned. Some countries require governmental approval for the repatriation of investment income, capital or the proceeds of sales earned by foreign investors. In addition, if there is deterioration in a country's balance of payments or for other reasons, a country may impose temporary restrictions on foreign capital remittances abroad.
Forward foreign currency contracts: The Fund may enter into forward foreign currency contracts to hedge against exchange rate risk arising from investments in securities denominated in foreign currencies. Contracts are valued at the contractual forward rate and are marked to market daily, with the change in value recorded as an unrealized gain or loss. When the contracts are settled a realized gain or loss is incurred. Risks may arise from changes in market value of the underlying currencies and from the possible inability of counterparties to meet the terms of their contracts.
At October 31, 2005, there were no outstanding forward foreign currency contracts.
Redemption fees: A short-term trading redemption fee may be assessed on any Fund shares in a fund account that are sold during the first five (5) NYSE trading days following their purchase date. This redemption fee will equal 2% of the amount redeemed and shares held the longest will be treated as being redeemed first and shares held the shortest as being redeemed last. For the year ended October 31, 2005, the Fund received less than $1 in redemption fees.
Dividend distributions: Distributions to shareholders are recorded on the ex-dividend date and are determined in accordance with Federal income tax regulations which may differ from GAAP.
Transamerica IDEX Mutual Funds
Annual Report 2005
13
TA IDEX Templeton Great Companies Global
NOTES TO FINANCIAL STATEMENTS (continued)
At October 31, 2005
(all amounts in thousands)
NOTE 2. RELATED PARTY TRANSACTIONS
Effective January 1, 2005 AEGON/Transamerica Fund Advisors, Inc. was renamed Transamerica Fund Advisors, Inc. ("TFAI"); AEGON/Transamerica Fund Services, Inc. and AEGON/Transamerica Investor Services, Inc. merged into one entity and was renamed Transamerica Fund Services, Inc. ("TFS").
TFAI is the Fund's investment adviser. TFS is the Fund's administrator and transfer agent. AFSG Securities Corp. ("AFSG") is the Fund's distributor/principal underwriter. TFAI, TFS , and AFSG are affiliates of AEGON, NV, a Netherlands corporation.
The following schedule reflects the percentage of fund assets owned by affiliated mutual funds:
| | | Net
Assets | | % of
Net Assets | |
TA IDEX Asset Allocation–
Conservatove Portfolio | | $ | 29,008 | | | | 5.65 | % | |
TA IDEX Asset Allocation–
Growth Portfolio | | | 76,434 | | | | 14.89 | % | |
TA IDEX Asset Allocation–
Moderate Growth Portfolio | | | 105,466 | | | | 20.55 | % | |
TA IDEX Asset Allocation–
Moderate Portfolio | | | 50,534 | | | | 9.84 | % | |
| Total | | $ | 261,442 | | | | 50.93 | % | |
Investment advisory fee: The Fund pays management fees to TFAI based on average daily net assets ("ANA") at the following breakpoints:
0.80% of the first $500 million of ANA
0.70% of ANA over $500 million
TFAI has contractually agreed to waive its advisory fee and will reimburse the Fund to the extent that operating expenses, excluding 12b-1 fees, exceed the following stated annual limit:
1.20% Expense Limit
If total Fund expenses fall below the annual expense limitation agreement agreed to by the adviser within the succeeding three years, the Fund may be required to pay that adviser a portion or all of the reimbursed class expenses.
Reimbursement
Fiscal Year 2005 | | Available for
of Class Expenses | | Recapture Through | |
| Class B | | $ | 226 | | | | 10/31/2008 | | |
| Class C | | | 77 | | | | 10/31/2008 | | |
There were no amounts recaptured during the year ended October 31, 2005.Great Companies, LLC is both an affiliate of the Fund and a sub-adviser to the Fund.
Distribution and service fees: The Fund has a 12b-1 distribution plan under the 1940 Act pursuant to which an annual fee, based on average daily net assets, is paid to the distributor for various disbursements such as broker-dealer account servicing fees and other promotional expenses of the Fund. The Fund is authorized under the 12b-1 plan to pay fees on each class up to the following limits:
| Class A | | | 0.35 | % | |
| Class B | | | 1.00 | % | |
| Class C | | | 1.00 | % | |
In the case the Fund or a class of shares of the Fund is closed to new investors or investments, the Fund is authorized to pay 12b-1 fees for past sales and distribution efforts and present and past investor services.
Underwriter commissions relate to front-end sales charges imposed for Class A shares and contingent deferred sales charges from Classes B, C, and certain A share redemptions. For the year ended October 31, 2005, the underwriter commissions were as follows:
| Received by Underwriter | | $ | 287 | | |
| Retained by Underwriter | | | 17 | | |
| Contingent Deferred Sales Charge | | | 180 | | |
Administrative services: The Fund has entered into an agreement with TFS for financial and legal fund administration services. As of January 1, 2005 the Fund pays TFS an annual fee of 0.02% of ANA. Prior to January 1, 2005 the Fund paid TFS an annual fee of 0.015% of ANA. The Legal fees on the Statement of Operations are for fees paid to external legal counsel.
Transfer agent fees: The Fund pays TFS an annual per-account charge for each open and closed account. The Fund paid TFS $1,171 for the year ended October 31, 2005.
Deferred compensation plan: Each eligible independent Fund Trustee may elect to participate in a non-qualified deferred compensation plan maintained by Transamerica IDEX Mutual Funds (the "Plan"). Under the Plan, such Trustees may defer payment of all or a portion of their total fees earned as a Fund Trustee. Each Trustee who is a participant in the Plan may elect that the earnings, losses or gains credited to his or her deferred fee amounts be determined based on a deemed investment in any series of Transamerica IDEX Mutual Funds, including the Fund. The right of a participant to receive a distribution from the Plan of the deferred fees is an unsecured claim against the general assets of all series of Transamerica IDEX Mutual Funds. The pro rata liability to the Fund of all deferred fees i n the Plan amounted, as of October 31, 2005, to $104.
Transamerica IDEX Mutual Funds
Annual Report 2005
14
TA IDEX Templeton Great Companies Global
NOTES TO FINANCIAL STATEMENTS (continued)
At October 31, 2005
(all amounts in thousands)
NOTE 3. INVESTMENT TRANSACTIONS
The cost of securities purchased and proceeds from securities sold (excluding short-term securities) for the year ended October 31, 2005, were as follows:
| Purchases of securities: | | | |
| Long-Term | | $ | 438,975 | | |
| U.S. Government | | | – | | |
| Proceeds from maturities and sales of securities | | | |
| Long-Term | | | 378,162 | | |
| U.S. Government | | | – | | |
NOTE 4. FEDERAL INCOME TAX MATTERS
The Fund has not made any provision for federal income or excise taxes due to its policy to distribute all of its taxable income and capital gains to its shareholders and otherwise qualify as a regulated investment company under Subchapter M of the Internal Revenue Code. Income and capital gain distributions are determined in accordance with income tax regulations, which may differ from GAAP. These differences are primarily due to differing treatment for items including, but not limited to, wash sales, net operating losses, foreign currency transactions, excess distribution, return of capital from underlying investments, passive foreign investment companies, deferred compensation and capital loss carryforwards.
Therefore, distributions determined in accordance with tax regulations may differ significantly in amount or character from net investment income and realized gains for financial reporting purposes. Financial reporting records are adjusted for permanent book/tax differences to reflect tax character. Financial records are not adjusted for temporary differences. These reclassifications are as follows:
Shares of beneficial interest, unlimited
shares authorized | | $ | (72 | ) | |
| Accumulated net investment income (loss) | | | (46 | ) | |
Accumulated net realized gain (loss) from investment
securities | | | 118 | | |
The capital loss carryforwards are available to offset future realized capital gains through the periods listed:
Capital Loss
Carryforward | | Available Through | |
| $ | 110,307 | | | October 31, 2009 | |
| | 205,203 | | | October 31, 2010 | |
| | 57,944 | | | October 31, 2011 | |
The capital loss carryforward utilized during the year ended October 31, 2005 was $19,784.
The tax character of distributions paid may differ from the character of distributions shown in the Statement of Changes in Net Assets due to short-term gains being treated as ordinary income for tax purposes. The tax character of distributions paid during 2004 and 2005 was as follows:
| 2004 Distributions paid from: | |
| Ordinary Income | | $ | – | | |
| Long-term Capital Gain | | | – | | |
| 2005 Distributions paid from: | |
| Ordinary Income | | | 3,677 | | |
| Long-term Capital Gain | | | – | | |
The tax basis components of distributable earnings as of October 31, 2005, are as follows:
| Undistributed Ordinary Income | | $ | – | | |
| Undistributed Long-term Capital Gains | | $ | – | | |
| Capital Loss Carryforward | | $ | (373,454 | ) | |
| Net Unrealized Appreciation (Depreciation) | | $ | 27,431 | * | |
* Includes unrealized gain/loss from foreign currency and deferred compensation.
The aggregate cost of investments and composition of unrealized appreciation (depreciation) for federal income tax purposes as of October 31, 2005, are as follows:
| Federal Tax Cost Basis | | $ | 499,000 | | |
| Unrealized Appreciation | | $ | 42,164 | | |
| Unrealized (Depreciation) | | | (14,790 | ) | |
| Net Unrealized Appreciation (Depreciation) | | $ | 27,374 | | |
NOTE 5. REGULATORY PROCEEDINGS
There continues to be significant federal and state regulatory activity relating to financial services companies, particularly mutual fund companies and their investment advisers. As part of an ongoing investigation regarding potential market timing, recordkeeping and trading compliance issues and matters affecting the Fund's investment adviser, TFAI, and certain affiliates and former employees of TFAI, the SEC staff has indicated that it is likely to take some action against TFAI and certain of its affiliates at the conclusion of the investigation. The potential timing and the scope of any such action is difficult to predict. Although the impact of any action brought against TFAI and/or its affiliates is difficult to assess at the present time, the Fund currently believes that the likelihood that any such action will have a material adverse impact on it is remote. It is important to note that the Fund is not aware of any allegation of wrongdoing against it and its Board at the time this annual report is printed. Although it is not anticipated that these developments will have an adverse impact on the Fund, there can be no assurance at this time. TFAI and its affiliates are actively working with the SEC in regard to this matter; however, the exact resolution cannot be determined at this time. TFAI will take such actions that it deems necessary or appropriate to continue providing management services to the Fund and to bring all matters to an appropriate conclusion.
TFAI and/or its affiliates, and not the Fund, will bear the costs regarding these regulatory matters.
Transamerica IDEX Mutual Funds
Annual Report 2005
15
Report of Independent Registered Certified Public Accounting Firm
To the Board of Trustees and Shareholders of
TA IDEX Templeton Great Companies Global
In our opinion, the accompanying statement of assets and liabilities, including the schedule of investments, and the related statements of operations and of changes in net assets and the financial highlights present fairly, in all material respects, the financial position of TA IDEX Templeton Great Companies Global (the "Fund") (one of the portfolios constituting the Transamerica IDEX Mutual Funds) at October 31, 2005, the results of its operations for the year then ended, the changes in its net assets for each of the two years in the period then ended and the financial highlights for each of the periods presented, in conformity with accounting principles generally accepted in the United States of America. These financial statements and financial highlights (hereafter referred to as "financial statements") are the responsibility of the Fund's management; our responsibility is to express an opinion on these financial statements based on our audits. We conducted our audits of these financial statements in accordance with the standards of the Public Company Accounting Oversight Board (United States). Those standards require that we plan and perform the audit to obtain reasonable assurance about whether the financial statements are free of material misstatement. An audit includes examining, on a test basis, evidence supporting the amounts and disclosures in the financial statements, assessing the accounting principles used and significant estimates made by management, and evaluating the overall financial statement presentation. We believe that our audits, which included confirmation of securities at October 31, 2005 by correspondence with the custodian, provide a reasonable basis for our opinion.

December 22, 2005
Transamerica IDEX Mutual Funds
Annual Report 2005
16
TA IDEX Templeton Great Companies Global
SUPPLEMENTAL INFORMATION (unaudited)
TAX INFORMATION
For dividends paid during the year ended October 31, 2005, the Fund designated $11,159 as qualified dividend income.
For corporate shareholders, 100% of investment income (dividend income plus short-term gains, if any) qualifies for the dividends received deduction.
The information and distributions reported herein may differ from the information and distributions taxable to the shareholders for the calendar year ending December 31, 2005. Complete information will be computed and reported in conjunction with your 2005 Form 1099-DIV.
Transamerica IDEX Mutual Funds
Annual Report 2005
17
TA IDEX Transamerica Balanced
MARKET ENVIRONMENT
As measured by the Standard and Poor's 500 Composite Stock Index ("S&P 500"), U.S. equities posted a gain of 8.71% in the twelve months ended October 31, 2005, reflecting a broadly based advance in the initial months of the period and year-round gains for energy and utilities.
Throughout the year, investors alternated between fear of recession and expectations of sustainable economic growth, causing stock prices to vacillate widely. Their concerns about the state of the economy were heightened after late-summer hurricanes shuttered many Gulf Coast oil and gas refineries, setting off yet another spike in energy prices while short-term interest rates continued to climb. Increasingly concerned about inflation, investors turned cautious and the market lost ground in the final weeks of the period.
In the bond market, short-term yields rose as the Federal Reserve Board ("Fed") steadily lifted a key overnight lending rate from 1.75% to 3.75%. Long-term yields were largely unchanged until inflation fears escalated, but even then rose less than short-term yields. Corporate bonds underperformed Treasuries. The Lehman Brothers U.S. Government/Credit Index ("LBGC") gained 0.83%.
PERFORMANCE
For the year ended October 31, 2005, TA IDEX Transamerica Balanced, Class A returned 8.41%. By comparison its primary and secondary benchmarks, the S&P 500 and the LBGC, returned 8.71% and 0.83%, respectively.
STRATEGY REVIEW
TA IDEX Transamerica Balanced delivered a one-year total return of 8.41%, considerably better than the 5.56% for a 60% equity/ 40% bonds blend of the abovementioned indexes. The primary drivers of the portfolio's superior results were a mild tilt toward equities (an average of approximately 65% of assets) and individual healthcare and industrial holdings. These more than offset underweighting in energy stocks, the equity market's strongest sector.
Positioned for solid global economic growth, the equity portfolio was overweighted in consumer discretionary stocks and industrial stocks of companies that stand to benefit from infrastructure development. Among the latter were two top contributors to performance: Caterpillar Inc. (heavy equipment) and Jacobs Engineering Group Inc. (construction). The equity portfolio also benefited from our stock selections in the health care sector, including the portfolio's largest contributor to results, pharmaceuticals company Roche Holdings Ltd. AG ("Roche"). The gains for Roche's stock can be attributed to its position as a major shareholder in a successful biotechnology company (Genentech, Inc.), a surge in demand for a patented product (Tamiflu), and the sale of its over-the-counter pharmaceuticals business.
One stock, Diebold, Incorporated, proved fundamentally disappointing. This manufacturer and servicer of ATMs lost market share in 2005 and because it was unclear how management would rectify the loss, we exited the position.
The portfolio's fixed-income portfolio performed in line with the benchmark LBGC, making a small contribution to results. An overweighting in the underperforming corporate bond sector was more than offset by a shorter-than-index duration, which limited principal erosion in a rising-rate environment. The portfolio also benefited from our limited exposure to troubled industries like automobiles; sustained emphasis on secularly growing areas like basic materials; and a small allocation to mortgage-backed securities, a sector that outperformed Treasuries and corporates.
Gary U. Rollé, CFA
Heidi Y. Hu, CFA
Co-Fund Managers
Transamerica Investment Management, LLC
Transamerica IDEX Mutual Funds
Annual Report 2005
1
TA IDEX Transamerica Balanced
Comparison of change in value of $10,000 investment in Class A shares and its comparative indices.
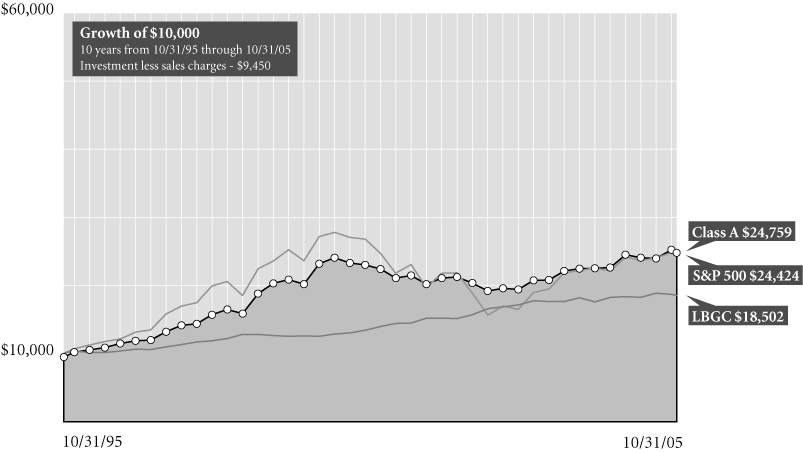
Average Annual Total Return for Periods Ended 10/31/05
| | | 1 year | | 5 years | | 10 years | | From
Inception | | Inception
Date | |
| Class A (NAV) | | | 8.41 | % | | | 1.73 | % | | | 10.11 | % | | | 10.76 | % | | 12/2/94 | |
| Class A (POP) | | | 2.45 | % | | | 0.59 | % | | | 9.49 | % | | | 10.19 | % | | 12/2/94 | |
| S&P 5001 | | | 8.71 | % | | | (1.73 | )% | | | 9.34 | % | | | 11.25 | % | | 12/2/94 | |
| LBGC1 | | | 0.83 | % | | | 6.57 | % | | | 6.35 | % | | | 7.28 | % | | 12/2/94 | |
| Class B (NAV) | | | 7.80 | % | | | 1.08 | % | | | 9.42 | % | | | 9.44 | % | | 10/1/95 | |
| Class B (POP) | | | 2.80 | % | | | 0.89 | % | | | 9.42 | % | | | 9.44 | % | | 10/1/95 | |
| Class C (NAV) | | | 7.85 | % | | | – | | | | – | | | | 7.40 | % | | 11/11/02 | |
| Class C (POP) | | | 6.85 | % | | | – | | | | – | | | | 7.40 | % | | 11/11/02 | |
NOTES
1 The Standard and Poor's 500 Composite Stock (S&P 500) Index and Lehman Brothers U.S. Government/Credit (LBGC) Index are unmanaged indices used as a general measure of market performance. Calculations assume dividends and capital gains are reinvested and do not include any managerial expenses. From inception calculation is based on life of Class A shares. Source: Standard & Poor's Micropal®© Micropal, Inc. 2005 – 1-800-596-5323 – http://www.fund-sp.com.
The performance data presented represents past performance, future results may vary. Performance data does not reflect the deduction of taxes that would be paid on fund distributions or the redemption of fund shares. Investment return and principal value will fluctuate so that an investor's shares, when redeemed, may be worth more or less than their original cost. Current performance may be lower or higher than performance quoted. Please see www.transamericaidex.com for performance data current to the most recent month-end.
Public Offering Price (POP) returns include the reinvestment of dividends and capital gains and reflect the maximum sales charge of 5.5% for A shares or the maximum applicable contingent deferred sales charge (5% in the 1st year, decreasing to 0% after 6 years) for Class B shares and 1% (during the first 12 months) for Class C shares. Shares purchased prior to March 1, 2004 are subject to a maximum applicable contingent deferred sales charge (5% in the 1st year, decreasing to 0% after 7 years) for Class B shares and (2% in the 1st year, decreasing to 0% after 2 years) for Class C shares. Net Asset Value (NAV) returns include the reinvestment of dividends and capital gains but do not reflect any sales charges.
This material must be preceded or accompanied by a current prospectus, which includes specific contents regarding the investment objectives and policies of this fund.
Transamerica IDEX Mutual Funds
Annual Report 2005
2
TA IDEX Transamerica Balanced
UNDERSTANDING YOUR FUND'S EXPENSES
(unaudited)
SHAREHOLDER EXPENSES
Fund shareholders may incur two types of costs: (1) transaction costs, including sales charges (loads) on purchases, contingent deferred sales charges on redemptions and redemption fees; and (2) ongoing costs, including management fees, 12b-1 distribution and service fees, and other fund expenses.
The following Example is intended to help you understand your ongoing costs (in dollars and cents) of investing in a Fund and to compare these costs with the ongoing costs of investing in other funds.
The Example is based on an investment of $1,000 invested at May 1, 2005 and held for the entire period until October 31, 2005.
ACTUAL EXPENSES
The first line in the table below provides information about actual account values and actual expenses. You may use the information in this line, together with the amount you invested, to estimate the expenses that you paid over the period. Simply divide your account value by $1,000 (for example, an $8,600 account value divided by $1,000 = 8.6), then multiply the result by the number in the first line of your Fund under the heading entitled "Expenses Paid During Period" to estimate the expenses you paid on your account during this period. If your account is an IRA, your expenses could have included a $15 annual fee. The amount of any fee paid through your account would increase the estimate of expenses you paid during the period and decrease your ending account value.
HYPOTHETICAL EXAMPLE FOR COMPARISON PURPOSES
The second line in the table below provides information about hypothetical account values and hypothetical expenses based on the Fund's actual expense ratio and an assumed rate of return of 5% per year before expenses, which is not the Fund's actual return. The hypothetical account values and expenses may not be used to estimate the actual ending account balance or expenses you paid for the period. You may use this information to compare the ongoing costs of investing in your Fund and other funds. To do so, compare this 5% hypothetical example with the 5% hypothetical examples that appear in the shareholder reports of the other funds. As in the case of the actual expense example, if your account is subject to an IRA fee, the amount of the fee paid through your account would increase the hypothetical expense s you would have paid during the period and decrease the hypothetical ending account value.
Please note that the expenses shown in the table are meant to highlight your ongoing costs only and do not reflect any transactional costs, such as sales charges, redemption fees, brokerage commissions paid on purchases and sales of fund shares. Therefore, the second line under the Fund in the table is useful in comparing ongoing costs only, and will not help you determine the relative total costs of owning different funds. If any of these transaction costs were included, your costs would be higher. The expenses shown in the table do not reflect any fees that may be charged to you by brokers, financial intermediaries or other financial institutions.
| | | Beginning
Account
Value | | Ending
Account
Value | | Annualized
Expense
Ratio | | Expenses Paid
During Period (a) | |
| Class A | |
| Actual | | $ | 1,000.00 | | | $ | 1,060.50 | | | | 1.82 | % | | $ | 9.45 | | |
| Hypothetical (b) | | | 1,000.00 | | | | 1,016.03 | | | | 1.82 | | | | 9.25 | | |
| Class B | |
| Actual | | | 1,000.00 | | | | 1,058.00 | | | | 2.25 | | | | 11.67 | | |
| Hypothetical (b) | | | 1,000.00 | | | | 1,013.86 | | | | 2.25 | | | | 11.42 | | |
| Class C | |
| Actual | | | 1,000.00 | | | | 1,058.90 | | | | 2.16 | | | | 11.21 | | |
| Hypothetical (b) | | | 1,000.00 | | | | 1,014.32 | | | | 2.16 | | | | 10.97 | | |
(a) Expenses are calculated using each Fund's annualized expense ratio (as disclosed in the table), multiplied by the average account value for the period, multiplied by number of days in the period (184 days), and divided by the number of days in the year (365 days).
(b) 5% return per year before expenses.
GRAPHICAL PRESENTATION OF SCHEDULE OF INVESTMENTS
By Asset Type
At October 31, 2005
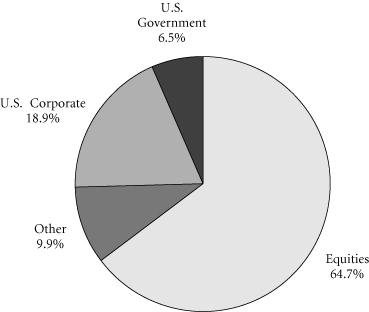
This chart shows the percentage breakdown by asset type of the Fund's total investment securities.
Transamerica IDEX Mutual Funds
Annual Report 2005
3
TA IDEX Transamerica Balanced
SCHEDULE OF INVESTMENTS
At October 31, 2005
(all amounts except share amounts in thousands)
| | | Principal | | Value | |
| U.S. GOVERNMENT OBLIGATIONS (5.1%) | | | |
U.S. Treasury Bond
5.38%, due 02/15/2031 † | | $ | 6,900 | | | $ | 7,525 | | |
U.S. Treasury Note
4.25%, due 08/15/2014
4.00%, due 02/15/2015 †
4.13%, due 05/15/2015 †
4.25%, due 08/15/2015 † | | 1,230
305
1,450
1,996 | | | 1,201
292
1,399
1,948 | | |
U.S. Treasury STRIPS
Zero coupon, due 05/15/2030 † | | 1,280 | | | 397 | | |
| Total U.S. Government Obligations (cost: $13,180) | | | | | 12,762 | | |
| U.S. GOVERNMENT AGENCY OBLIGATIONS (1.5%) | | | |
Fannie Mae
6.00%, due 09/01/2034
5.50%, due 05/01/2035 | | 1,559
2,048 | | | 1,572
2,021 | | |
| Total U.S. Government Agency Obligations (cost: $3,693) | | | | | 3,593 | | |
| CORPORATE DEBT SECURITIES (19.2%) | | | |
| Aerospace (0.6%) | |
Honeywell International, Inc.
5.13%, due 11/01/2006
6.13%, due 11/01/2011 | | 910
660 | | | 912
695 | | |
| Agriculture (0.1%) | | | |
Michael Foods, Inc.
8.00%, due 11/15/2013 | | 320 | | | 325 | | |
| Amusement & Recreation Services (0.9%) | | | |
Harrah's Operating Co., Inc.
5.50%, due 07/01/2010 | | 1,750 | | | 1,738 | | |
Mandalay Resort Group
6.50%, due 07/31/2009 | | 585 | | | 584 | | |
| Beverages (1.1%) | | | |
Coca-Cola Enterprises, Inc.
5.38%, due 08/15/2006 | | 950 | | | 955 | | |
Diageo Capital PLC
3.50%, due 11/19/2007 | | 1,750 | | | 1,707 | | |
| Business Services (0.4%) | | | |
Clear Channel Communications, Inc.
6.00%, due 11/01/2006
4.63%, due 01/15/2008 | | 555
545 | | | 561
536 | | |
| Chemicals & Allied Products (1.5%) | | | |
ICI Wilmington, Inc.
4.38%, due 12/01/2008 | | 791 | | | 773 | | |
Lubrizol Corp.
4.63%, due 10/01/2009 | | 1,350 | | | 1,316 | | |
Monsanto Co.
5.50%, due 07/30/2035 | | 800 | | | 749 | | |
| | | Principal | | Value | |
| Chemicals & Allied Products (continued) | | | |
Potash Corp. of Saskatchewan
| |
| 7.13%, due 06/15/2007 | | $ | 830 | | | $ | 857 | | |
| Commercial Banks (1.3%) | | | |
Barclays Bank PLC
6.28%, due 12/15/2034 (a) | | 660 | | 626 | |
HBOS PLC–144A
5.92%, due 09/01/2049 (b) | | 700 | | 690 | |
Sumitomo Matsui Banking–144A
5.63%, due 07/15/2049 (c) | | 500 | | 489 | |
US Bank NA
3.75%, due 02/06/2009 | | 1,400 | | 1,350 | |
| Communication (0.6%) | | | |
Comcast Corp.
4.95%, due 06/15/2016 | | 675 | | 627 | |
COX Communications, Inc.
6.75%, due 03/15/2011 | | 773 | | 811 | |
| Computer & Office Equipment (0.3%) | | | |
Hewlett-Packard Co.
3.63%, due 03/15/2008 | | 765 | | 745 | |
| Department Stores (0.1%) | | | |
Neiman-Marcus Group, Inc.–144A
9.00%, due 10/15/2015 | | 200 | | 196 | |
| Electric Services (0.5%) | | | |
Duke Capital LLC
5.67%, due 08/15/2014 | | 510 | | 508 | |
PSEG Funding Trust
5.38%, due 11/16/2007 | | 875 | | 878 | |
| Electric, Gas & Sanitary Services (0.3%) | | | |
NiSource Finance Corp.
7.88%, due 11/15/2010 | | 745 | | 828 | |
| Food & Kindred Products (0.4%) | | | |
Tyson Foods, Inc.
8.25%, due 10/01/2011 | | 850 | | 958 | |
| Holding & Other Investment Offices (0.8%) | | | |
Hutchison Whampoa International,
Ltd.–144A
7.45%, due 11/24/2033 | | 560 | | 622 | |
iStar Financial, Inc.
4.88%, due 01/15/2009 | | 875 | | 860 | |
Tanger Factory Outlet Centers REIT
6.15%, due 11/15/2015 | | 620 | | 619 | |
| Hotels & Other Lodging Places (1.0%) | | | |
Starwood Hotels & Resorts Worldwide, Inc.
7.38%, due 05/01/2007 | | 1,900 | | 1,945 | |
The notes to the financial statements are an integral part of this report.
Transamerica IDEX Mutual Funds
Annual Report 2005
4
TA IDEX Transamerica Balanced
SCHEDULE OF INVESTMENTS (continued)
At October 31, 2005
(all amounts except share amounts in thousands)
| | | Principal | | Value | |
| Hotels & Other Lodging Places (continued) | | | |
Wynn Las Vegas LLC/Wynn Las Vegas
| |
Capital Corp.
| |
| 6.63%, due 12/01/2014 | | $ | 500 | | | $ | 476 | | |
| Metal Mining (0.4%) | | | |
Phelps Dodge Corp.
9.50%, due 06/01/2031 | | 688 | | 932 | |
| Mortgage Bankers & Brokers (1.1%) | | | |
Countrywide Home Loans, Inc.
5.50%, due 08/01/2006 | | 1,800 | | 1,811 | |
Countrywide Home Loans, Inc., Series L
2.88%, due 02/15/2007 | | 865 | | 843 | |
| Motion Pictures (0.5%) | | | |
Time Warner, Inc.
9.13%, due 01/15/2013 | | 1,120 | | 1,337 | |
| Oil & Gas Extraction (0.6%) | | | |
Chesapeake Energy Corp.
7.00%, due 08/15/2014 | | 180 | | 187 | |
Husky Oil, Ltd.
8.90%, due 08/15/2028 (d) | | 870 | | 936 | |
Nexen, Inc.
5.88%, due 03/10/2035 | | 340 | | 324 | |
| Personal Credit Institutions (1.2%) | | | |
General Electric Capital Corp.
2.85%, due 01/30/2006
5.35%, due 03/30/2006 | | 940
1,570 | | 937
1,576 | |
General Motors Acceptance Corp.
4.38%, due 12/10/2007 | | 575 | | 543 | |
| Petroleum Refining (0.4%) | | | |
Enterprise Products Operating, LP, Series B
5.60%, due 10/15/2014 | | 500 | | 491 | |
Valero Energy Corp.
7.50%, due 04/15/2032 | | 375 | | 442 | |
| Primary Metal Industries (0.7%) | | | |
Alcoa, Inc.
4.25%, due 08/15/2007 | | 1,825 | | 1,809 | |
| Printing & Publishing (0.5%) | | | |
Media General, Inc.
6.95%, due 09/01/2006 | | 690 | | 697 | |
News America Holdings, Inc.
7.75%, due 12/01/2045 | | 392 | | 442 | |
| Restaurants (0.2%) | | | |
Landry's Restaurants, Inc., Series B
7.50%, due 12/15/2014 | | 500 | | 460 | |
| | | Principal | | Value | |
| Security & Commodity Brokers (1.6%) | | | |
E*Trade Financial Corp.
| |
| 8.00%, due 06/15/2011 | | $ | 500 | | | $ | 507 | | |
Merrill Lynch & Co., Inc.
6.13%, due 05/16/2006 | | | 1,900 | | | | 1,913 | | |
Nuveen Investments, Inc.
5.00%, due 09/15/2010 | | | 875 | | | | 857 | | |
Residential Capital Corp.–144A
6.38%, due 06/30/2010 | | | 630 | | | | 640 | | |
| Telecommunications (1.9%) | | | |
SBC Communications, Inc.
5.75%, due 05/02/2006 | | | 1,900 | | | | 1,910 | | |
Sprint Capital Corp.
4.78%, due 08/17/2006 | | | 1,780 | | | | 1,779 | | |
Verizon Global Funding Corp.
4.00%, due 01/15/2008 | | | 955 | | | | 937 | | |
| Variety Stores (0.2%) | | | |
Target Corp.
5.50%, due 04/01/2007 | | | 435 | | | | 439 | | |
| Total Corporate Debt Securities (cost: $48,637) | | | | | | | 47,685 | | |
| | | Shares | | Value | |
| COMMON STOCKS (65.9%) | | | |
| Automotive (4.4%) | | | |
| Harley-Davidson, Inc. † | | | 100,000 | | | $ | 4,953 | | |
| PACCAR, Inc. | | | 86,000 | | | | 6,022 | | |
| Business Services (1.4%) | | | |
| eBay, Inc. ‡ | | | 90,000 | | | | 3,564 | | |
| Chemicals & Allied Products (2.2%) | | | |
| Procter & Gamble Co. | | | 97,500 | | | | 5,459 | | |
| Communication (1.5%) | | | |
| XM Satellite Radio Holdings, Inc.–Class A †‡ | | | 125,000 | | | | 3,604 | | |
| Communications Equipment (3.2%) | | | |
| QUALCOMM, Inc. | | | 200,000 | | | | 7,952 | | |
| Computer & Data Processing Services (3.8%) | | | |
| Microsoft Corp. | | | 153,465 | | | | 3,944 | | |
| Yahoo!, Inc. ‡ | | | 146,100 | | | | 5,401 | | |
| Computer & Office Equipment (1.4%) | | | |
| Sandisk Corp. ‡ | | | 60,000 | | | | 3,533 | | |
| Electronic & Other Electric Equipment (1.4%) | | | |
| General Electric Co. | | | 100,045 | | | | 3,393 | | |
| Engineering & Management Services (3.3%) | | | |
| Jacobs Engineering Group, Inc. ‡ | | | 130,000 | | | | 8,287 | | |
| Hotels & Other Lodging Places (5.0%) | | | |
| Marriott International, Inc.–Class A | | | 180,060 | | | | 10,735 | | |
| MGM Mirage, Inc. †‡ | | | 43,000 | | | | 1,607 | | |
The notes to the financial statements are an integral part of this report.
Transamerica IDEX Mutual Funds
Annual Report 2005
5
TA IDEX Transamerica Balanced
SCHEDULE OF INVESTMENTS (continued)
At October 31, 2005
(all amounts except share amounts in thousands)
| | | Shares | | Value | |
| Industrial Machinery & Equipment (9.6%) | |
| Caterpillar, Inc. | | | 217,100 | | | $ | 11,417 | | |
| Donaldson Co., Inc. † | | | 120,000 | | | | 3,750 | | |
| Graco, Inc. | | | 100,000 | | | | 3,427 | | |
| Kennametal, Inc. | | | 100,000 | | | | 5,111 | | |
| Insurance (3.0%) | |
| WellPoint, Inc. ‡ | | | 100,000 | | | | 7,468 | | |
| Medical Instruments & Supplies (1.3%) | |
| Zimmer Holdings, Inc. ‡ | | | 50,000 | | | | 3,188 | | |
| Motor Vehicles, Parts & Supplies (0.9%) | |
| BorgWarner, Inc. | | | 40,000 | | | | 2,320 | | |
| Oil & Gas Extraction (5.1%) | |
| Anadarko Petroleum Corp. | | | 70,000 | | | | 6,350 | | |
| Apache Corp. | | | 70,000 | | | | 4,468 | | |
| Schlumberger, Ltd. † | | | 20,000 | | | | 1,815 | | |
| Petroleum Refining (1.3%) | |
| Suncor Energy, Inc. | | | 60,000 | | | | 3,218 | | |
| Pharmaceuticals (6.5%) | |
| Amgen, Inc. †‡ | | | 62,995 | | | | 4,773 | | |
| Roche Holding AG-Genusschein | | | 75,698 | | | | 11,296 | | |
| Primary Metal Industries (1.9%) | |
| Hubbell, Inc.–Class B | | | 100,000 | | | | 4,816 | | |
| Printing & Publishing (4.0%) | |
| McGraw-Hill Cos., Inc. (The) | | | 205,000 | | | | 10,033 | | |
| Security & Commodity Brokers (0.8%) | |
| Ameriprise Financial, Inc. ‡ | | | 50,000 | | | | 1,861 | | |
| Transportation & Public Utilities (1.2%) | |
| Expeditors International of Washington, Inc. | | | 50,000 | | | | 3,033 | | |
| Wholesale Trade Durable Goods (2.7%) | |
| Grainger (W.W.), Inc. | | | 100,000 | | | | 6,698 | | |
| Total Common Stocks (cost: $128,640) | | | | | | | 163,496 | | |
| | | Principal | | Value | |
| SECURITY LENDING COLLATERAL (10.2%) | |
| Debt (9.5%) | |
| Bank Notes (0.6%) | |
Bank of America
| |
| 3.81%, due 06/07/2006 * | | $ | 709 | | | $ | 709 | | |
| 3.81%, due 08/10/2006 * | | | 703 | | | | 703 | | |
Credit Suisse First Boston Corp.
4.11%, due 03/10/2006 * | | | 141 | | | | 141 | | |
| Certificates Of Deposit (0.7%) | |
Canadian Imperial Bank of Commerce
4.07%, due 11/04/2005 * | | | 563 | | | | 563 | | |
| | | Principal | | Value | |
| Certificates Of Deposit (continued) | | | |
Harris Trust & Savings Bank
| |
| 3.80%, due 11/04/2005 * | | $ | 448 | | | $ | 448 | | |
Rabobank Nederland
4.03%, due 05/31/2006 * | | | 703 | | | | 703 | | |
| Commercial Paper (2.0%) | | | |
Ciesco LLC
4.00%, due 11/03/2005 | | | 702 | | | | 702 | | |
General Electric Capital Corp.
3.96%, due 12/05/2005 | | | 562 | | | | 562 | | |
Paradigm Funding LLC–144A
4.01%, due 11/07/2005 | | | 561 | | | | 561 | | |
Park Avenue Receivables Corp.–144A
4.03%, due 12/02/2005 | | | 557 | | | | 557 | | |
Preferred Receivables Corp.–144A
4.04%, due 12/05/2005 | | | 422 | | | | 422 | | |
Ranger Funding Co. LLC–144A
3.99%, due 11/15/2005 | | | 419 | | | | 419 | | |
Sheffield Receivables Corp.–144A
4.01%, due 11/08/2005 | | | 422 | | | | 422 | | |
Yorktown Capital LLC
3.97%, due 11/09/2005 701 701
3.93%, due 11/17/2005 | | | 698 | | | | 698 | | |
| Euro Dollar Overnight (2.2%) | | | |
Bank of Montreal
3.79%, due 11/01/2005 | | | 422 | | | | 422 | | |
Barclays
3.80%, due 11/04/2005 | | | 562 | | | | 562 | | |
BNP Paribas
3.83%, due 11/02/2005 | | | 844 | | | | 844 | | |
Deutsche Bank
3.80%, due 11/02/2005 | | | 1,406 | | | | 1,406 | | |
HSBC Banking/Holdings PLC
3.84%, due 11/07/2005 | | | 422 | | | | 422 | | |
Royal Bank of Scotland
3.76%, due 11/01/2005 | | | 562 | | | | 562 | | |
Svenska Handlesbanken
4.03%, due 11/01/2005 | | | 724 | | | | 724 | | |
UBS AG
3.80%, due 11/03/2005 | | | 562 | | | | 562 | | |
| Euro Dollar Terms (0.8%) | | | |
Royal Bank of Scotland
4.00%, due 12/12/2005 | | | 562 | | | | 562 | | |
UBS AG
4.02%, due 12/01/2005 | | | 562 | | | | 562 | | |
Wells Fargo
3.96%, due 11/14/2005 | | | 844 | | | | 844 | | |
The notes to the financial statements are an integral part of this report.
Transamerica IDEX Mutual Funds
Annual Report 2005
6
TA IDEX Transamerica Balanced
SCHEDULE OF INVESTMENTS (continued)
At October 31, 2005
(all amounts except share amounts in thousands)
| | | Principal | | Value | |
| Promissory Notes (0.3%) | | | |
Goldman Sachs Group, Inc.
| |
| 4.02%, due 12/28/2005 | | $ | 591 | | | $ | 591 | | |
| Repurchase Agreements (2.9%) †† | | | |
Credit Suisse First Boston Corp.
4.10%, dated 10/31/2005 to be repurchased
at $958 on 11/01/2005 | | | 958 | | | | 958 | | |
Goldman Sachs Group, Inc. (The)
4.10%, dated 10/31/2005 to be repurchased
at $2,391 on 11/01/2005 | | | 2,390 | | | | 2,390 | | |
Lehman Brothers, Inc.
4.10%, dated 10/31/2005 to be repurchased
at $66 on 11/01/2005 | | | 66 | | | | 66 | | |
Merrill Lynch & Co.
4.10%, dated 10/31/2005 to be repurchased
at $2,812 on 11/01/2005 | | | 2,812 | | | | 2,812 | | |
Morgan Stanley Dean Witter & Co.
4.17%, dated 10/31/2005 to be repurchased
at $843 on 11/01/2005 | | | 843 | | | | 843 | | |
| | | Shares | | Value | |
| Investment Companies (0.7%) | | | |
| Money Market Funds (0.7%) | | | |
American Beacon Fund
1-day yield of 3.81% | | | 606,271 | | | $ | 606 | | |
Barclays Global Investors
Institutional Money Market Fund
1-day yield of 3.92% | | | 562,437 | | | | 562 | | |
Goldman Sachs Financial
Square Prime Obligations Fund
1-day yield of 3.79% | | | 87,610 | | | | 88 | | |
Merrimac Cash Fund,
Premium Class
1-day yield of 3.70% @ | | | 556,221 | | | | 556 | | |
| Total Security Lending Collateral (cost: $25,255) | | | | | | | 25,255 | | |
| Total Investment Securities (cost: $219,405) | | | | | | $ | 252,791 | | |
| SUMMARY: | | | |
| Investment securities, at value | | | 101.9 | % | | $ | 252,791 | | |
| Liabilities in excess of other assets | | | (1.9 | )% | | | (4,596 | ) | |
| Net assets | | | 100.0 | % | | $ | 248,195 | | |
NOTES TO SCHEDULE OF INVESTMENTS:
† At October 31, 2005, all or a portion of this security is on loan (see Note 1). The value at October 31, 2005, of all securities on loan is $24,655.
(a) Barclays Bank PLC has a fixed coupon rate of 6.28% until 12/15/2034, thereafter the coupon rate will reset quarterly at the 3-month US$ LIBOR + 155BP, if not called.
(b) HBOS PLC–144A has a fixed coupon rate of 5.92% until 10/01/2015, thereafter the coupon rate will reset quarterly at the 3-month US$ LIBOR + 129.5BP, if not called.
(c) Sumitomo Matsui Banking–144A has a fixed coupon rate of 5.63% until 10/15/2015, thereafter the coupon rate will reset quarterly at the 3-month US$ LIBOR + 255BP, if not called.
(d) Husky Oil, Ltd. has a fixed coupon rate of 8.90% until 8/15/2008, thereafter the coupon rate will reset quarterly at the 3-month US$ LIBOR + 550BP, if not called.
‡ Non-income producing.
* Floating or variable rate note. Rate is listed as of October 31, 2005.
†† Cash collateral for the Repurchase Agreements, valued at $7,211, that serve as collateral for securities lending are invested in corporate bonds with interest rates and maturity dates ranging from 0.00%–9.86% and 12/31/2005–11/15/2096, respectively.
@ Regulated investment company advised by Investors Bank and Trust Co. ("IBT"). IBT is also the accounting, custody and lending agent for the Fund.
DEFINITIONS:
144A 144A Securities are registered pursuant to Rule 144A of the Securities Act of 1933. These securities are deemed to be liquid for purposes of compliance limitations on holdings of illiquid securities and may be resold as transactions exempt from registration, normally to qualified institutional buyers. At October 31, 2005, these securities aggregated $5,018 or 2.0% of the net assets of the Fund.
REIT Real Estate Investment Trust
STRIPS Separate Trading of Registered Interest and Principal of Securities
The notes to the financial statements are an integral part of this report.
Transamerica IDEX Mutual Funds
Annual Report 2005
7
TA IDEX Transamerica Balanced
STATEMENT OF ASSETS AND LIABILITIES
At October 31, 2005
(all amounts except per share amounts in thousands)
| Assets: | | | |
Investment securities, at value (cost: $219,405)
(including securities loaned of $24,655) | | $ | 252,791 | | |
| Cash | | | 20,306 | | |
| Receivables: | |
| Investment securities sold | | | 791 | | |
| Shares of beneficial interest sold | | | 21 | | |
| Interest | | | 994 | | |
| Dividends | | | 103 | | |
| Dividend reclaims receivable | | | 45 | | |
| Other | | | 35 | | |
| | | | 275,086 | | |
| Liabilities: | | | |
| Investment securities purchased | | | 618 | | |
| Accounts payable and accrued liabilities: | |
| Shares of beneficial interest redeemed | | | 514 | | |
| Management and advisory fees | | | 170 | | |
| Distribution and service fees | | | 178 | | |
| Transfer agent fees | | | 74 | | |
| Administration fees | | | 4 | | |
| Payable for collateral for securities on loan | | | 25,255 | | |
| Other | | | 78 | | |
| | | | 26,891 | | |
| Net Assets | | $ | 248,195 | | |
| Net Assets Consist of: | | | |
Shares of beneficial interest, unlimited shares
authorized, no par value | | $ | 251,070 | | |
| Accumulated net investment income (loss) | | | (26 | ) | |
Accumulated net realized gain (loss) from investment
securities and foreign currency transactions | | | (36,231 | ) | |
| Net unrealized appreciation (depreciation) on: | |
| Investment securities | | | 33,384 | | |
Translation of assets and liabilites denominated in
foreign currencies | | | (2 | ) | |
| Net Assets | | $ | 248,195 | | |
| Net Assets by Class: | | | |
| Class A | | $ | 62,440 | | |
| Class B | | | 142,479 | | |
| Class C | | | 43,276 | | |
| Shares Outstanding: | | | |
| Class A | | | 3,137 | | |
| Class B | | | 7,166 | | |
| Class C | | | 2,184 | | |
| Net Asset Value Per Share: | | | |
| Class A | | $ | 19.90 | | |
| Class B | | | 19.88 | | |
| Class C | | | 19.82 | | |
| Maximum Offering Price Per Share (a): | | | |
| Class A | | $ | 21.06 | | |
(a) Includes the maximum selling commission (represented as a percentage of offering price) which is reduced on certain levels of sales as set forth in the Prospectus. Net asset value per share for Classes B and C shares represents offering price. The redemption price for Classes B and C shares equals net asset value less any applicable contingent deferred sales charge.
STATEMENT OF OPERATIONS
For the year ended October 31, 2005
(all amounts in thousands)
| Investment Income: | | | |
| Interest | | $ | 3,388 | | |
Dividends (net of withholding taxes on foreign
dividends of $33) | | | 3,038 | | |
| Income from loaned securities-net | | | 60 | | |
| | | | 6,486 | | |
| Expenses: | | | |
| Management and advisory fees | | | 2,232 | | |
Distribution and service fees:
Class A | | | 240 | | |
| Class B | | | 1,596 | | |
| Class C | | | 493 | | |
Transfer agent fees:
Class A | | | 215 | | |
| Class B | | | 351 | | |
| Class C | | | 107 | | |
| Printing and shareholder reports | | | 135 | | |
| Custody fees | | | 39 | | |
| Administration fees | | | 53 | | |
| Legal fees | | | 20 | | |
| Audit fees | | | 29 | | |
| Trustees fees | | | 14 | | |
Registration fees:
Class A | | | 10 | | |
| Class B | | | 13 | | |
| Class C | | | 3 | | |
| Other | | | 8 | | |
| Total expenses | | | 5,558 | | |
| Net Investment Income (Loss) | | | 928 | | |
| Net Realized Gain (Loss) from: | | | |
| Investment securities | | | 8,039 | | |
| Foreign currency transactions | | | 36 | | |
| | | | 8,075 | | |
Net Increase (Decrease) in Unrealized Appreciation
(Depreciation) on: | | | |
| Investment securities | | | 13,282 | | |
Translation of assets and liabilities denominated in
foreign currencies | | | (40 | ) | |
| | | | 13,242 | | |
Net Gain (Loss) on Investment Securities and
Foreign Currency Transactions | | | 21,317 | | |
Net Increase (Decrease) in Net Assets Resulting
from Operations | | $ | 22,245 | | |
The notes to the financial statements are an integral part of this report.
Transamerica IDEX Mutual Funds
Annual Report 2005
8
TA IDEX Transamerica Balanced
STATEMENTS OF CHANGES IN NET ASSETS
For the years ended
(all amounts in thousands)
| | | October 31,
2005 | | October 31,
2004 | |
| Increase (Decrease) In Net Assets From: | | | |
| Operations: | | | |
| Net investment income (loss) | | $ | 928 | | | $ | 1,052 | | |
Net realized gain (loss) from
investment securities and
foreign currency transactions | | | 8,075 | | | | 33,174 | | |
Net unrealized appreciation
(depreciation) on investment
securities and foreign currency
translation | | | 13,242 | | | | (13,114 | ) | |
| | | | 22,245 | | | | 21,112 | | |
| Distributions to Shareholders: | | | |
| From net investment income: | |
| Class A | | | (674 | ) | | | (579 | ) | |
| Class B | | | (257 | ) | | | (399 | ) | |
| Class C | | | (207 | ) | | | (10 | ) | |
| Class C2 | | | – | | | | (53 | ) | |
| Class M | | | – | | | | (98 | ) | |
| | | | (1,138 | ) | | | (1,139 | ) | |
| Capital Share Transactions: | | | |
| Proceeds from shares sold: | |
| Class A | | | 5,253 | | | | 9,645 | | |
| Class B | | | 5,269 | | | | 7,041 | | |
| Class C | | | 2,629 | | | | 1,114 | | |
| Class C2 | | | – | | | | 769 | | |
| Class M | | | – | | | | 480 | | |
| | | | 13,151 | | | | 19,049 | | |
| Proceeds from fund acquisition: | |
| Class A | | | – | | | | 6,534 | | |
| Class B | | | – | | | | 17,187 | | |
| Class C | | | – | | | | 879 | | |
| Class C2 | | | – | | | | 2,271 | | |
| Class M | | | – | | | | 1,338 | | |
| | | | – | | | | 28,209 | | |
Dividends and distributions
reinvested: | |
| Class A | | | 648 | | | | 558 | | |
| Class B | | | 237 | | | | 368 | | |
| Class C | | | 189 | | | | 9 | | |
| Class C2 | | | – | | | | 47 | | |
| Class M | | | – | | | | 90 | | |
| | | | 1,074 | | | | 1,072 | | |
| Cost of shares redeemed: | |
| Class A | | | (22,047 | ) | | | (38,320 | ) | |
| Class B | | | (45,442 | ) | | | (64,412 | ) | |
| Class C | | | (17,265 | ) | | | (6,563 | ) | |
| Class C2 | | | – | | | | (9,893 | ) | |
| Class M | | | – | | | | (13,324 | ) | |
| | | | (84,754 | ) | | | (132,512 | ) | |
| Class level exchanges: | |
| Class C | | | – | | | | 52,877 | | |
| Class C2 | | | – | | | | (23,753 | ) | |
| Class M | | | – | | | | (29,124 | ) | |
| | | | – | | | | – | | |
| Automatic conversions: | |
| Class A | | | 509 | | | | 134 | | |
| Class B | | | (509 | ) | | | (134 | ) | |
| | | | – | | | | – | | |
| | | | (70,529 | ) | | | (84,182 | ) | |
| Net increase (decrease) in net assets | | | (49,422 | ) | | | (64,209 | ) | |
| | | October 31,
2005 | | October 31,
2004 | |
| Net Assets: | |
| Beginning of year | | $ | 297,617 | | | $ | 361,826 | | |
| End of year | | $ | 248,195 | | | $ | 297,617 | | |
Accumulated Net Investment Income
(Loss) | | $ | (26 | ) | | $ | 131 | | |
| Share Activity: | |
| Shares issued: | |
| Class A | | | 270 | | | | 540 | | |
| Class B | | | 270 | | | | 393 | | |
| Class C | | | 135 | | | | 62 | | |
| Class C2 | | | – | | | | 43 | | |
| Class M | | | – | | | | 27 | | |
| | | | 675 | | | | 1,065 | | |
| Shares issued on fund acquisition: | |
| Class A | | | – | | | | 362 | | |
| Class B | | | – | | | | 956 | | |
| Class C | | | – | | | | 49 | | |
| Class C2 | | | – | | | | 126 | | |
| Class M | | | – | | | | 74 | | |
| | | | – | | | | 1,567 | | |
Shares issued–reinvested from
distributions: | |
| Class A | | | 33 | | | | 31 | | |
| Class B | | | 12 | | | | 21 | | |
| Class C | | | 10 | | | | 1 | | |
| Class C2 | | | – | | | | 3 | | |
| Class M | | | – | | | | 5 | | |
| | | | 55 | | | | 61 | | |
| Shares redeemed: | |
| Class A | | | (1,130 | ) | | | (2,128 | ) | |
| Class B | | | (2,329 | ) | | | (3,597 | ) | |
| Class C | | | (887 | ) | | | (365 | ) | |
| Class C2 | | | – | | | | (553 | ) | |
| Class M | | | – | | | | (745 | ) | |
| | | | (4,346 | ) | | | (7,388 | ) | |
| Class level exchanges: | |
| Class C | | | – | | | | 2,929 | | |
| Class C2 | | | – | | | | (1,321 | ) | |
| Class M | | | – | | | | (1,608 | ) | |
| | | | – | | | | – | | |
| Automatic conversions: | |
| Class A | | | 26 | | | | 7 | | |
| Class B | | | (26 | ) | | | (7 | ) | |
| | | | – | | | | – | | |
Net increase (decrease) in shares
outstanding: | |
| Class A | | | (801 | ) | | | (1,188 | ) | |
| Class B | | | (2,073 | ) | | | (2,234 | ) | |
| Class C | | | (742 | ) | | | 2,676 | | |
| Class C2 | | | – | | | | (1,702 | ) | |
| Class M | | | – | | | | (2,247 | ) | |
| | | | (3,616 | ) | | | (4,695 | ) | |
The notes to the financial statements are an integral part of this report.
Transamerica IDEX Mutual Funds
Annual Report 2005
9
TA IDEX Transamerica Balanced
FINANCIAL HIGHLIGHTS
| | | | | For a share of beneficial interest outstanding throughout each period | |
| | | | | Net Asset | | Investment Operations | | Distributions | | Net Asset | |
| | | For the
Period
Ended (d)(g) | | Value,
Beginning
of Period | | Net
Investment
Income (Loss) | | Net Realized
and Unrealized
Gain (Loss) | | Total
Operations | | From Net
Investment
Income | | From Net
Realized
Gains | | Total
Distributions | | Value,
End
of Period | |
| Class A | | 10/31/2005 | | $ | 18.53 | | | $ | 0.15 | | | $ | 1.41 | | | $ | 1.56 | | | $ | (0.19 | ) | | $ | – | | | $ | (0.19 | ) | | $ | 19.90 | | |
| | | 10/31/2004 | | | 17.43 | | | | 0.14 | | | | 1.08 | | | | 1.22 | | | | (0.12 | ) | | | – | | | | (0.12 | ) | | | 18.53 | | |
| | | 10/31/2003 | | | 16.23 | | | | 0.19 | | | | 1.21 | | | | 1.40 | | | | (0.20 | ) | | | – | | | | (0.20 | ) | | | 17.43 | | |
| | | 10/31/2002 | | | 17.31 | | | | 0.29 | | | | (1.09 | ) | | | (0.80 | ) | | | (0.28 | ) | | | – | | | | (0.28 | ) | | | 16.23 | | |
| | | 10/31/2001 | | | 19.75 | | | | 0.37 | | | | (2.18 | ) | | | (1.81 | ) | | | (0.35 | ) | | | (0.28 | ) | | | (0.63 | ) | | | 17.31 | | |
| Class B | | 10/31/2005 | | | 18.47 | | | | 0.04 | | | | 1.40 | | | | 1.44 | | | | (0.03 | ) | | | – | | | | (0.03 | ) | | | 19.88 | | |
| | | 10/31/2004 | | | 17.39 | | | | 0.04 | | | | 1.08 | | | | 1.12 | | | | (0.04 | ) | | | – | | | | (0.04 | ) | | | 18.47 | | |
| | | 10/31/2003 | | | 16.22 | | | | 0.08 | | | | 1.18 | | | | 1.26 | | | | (0.09 | ) | | | – | | | | (0.09 | ) | | | 17.39 | | |
| | | 10/31/2002 | | | 17.30 | | | | 0.18 | | | | (1.09 | ) | | | (0.91 | ) | | | (0.17 | ) | | | – | | | | (0.17 | ) | | | 16.22 | | |
| | | 10/31/2001 | | | 19.73 | | | | 0.25 | | | | (2.17 | ) | | | (1.92 | ) | | | (0.23 | ) | | | (0.28 | ) | | | (0.51 | ) | | | 17.30 | | |
| Class C | | 10/31/2005 | | | 18.45 | | | | 0.04 | | | | 1.41 | | | | 1.45 | | | | (0.08 | ) | | | – | | | | (0.08 | ) | | | 19.82 | | |
| | | 10/31/2004 | | | 17.39 | | | | (0.01 | ) | | | 1.11 | | | | 1.10 | | | | (0.04 | ) | | | – | | | | (0.04 | ) | | | 18.45 | | |
| | | 10/31/2003 | | | 16.22 | | | | 0.08 | | | | 1.18 | | | | 1.26 | | | | (0.09 | ) | | | – | | | | (0.09 | ) | | | 17.39 | | |
| | | | | | | Ratios/Supplemental Data | |
| | | For the
Period | | Total | | Net Assets,
End of
Period | | Ratio of Expenses
to Average
Net Assets (a) | | Net Investment
Income (Loss)
to Average | | Portfolio
Turnover | |
| | | Ended (g) | | Return (c) | | (000's) | | Net (e) | | Total (f) | | Net Assets (a) | | Rate (b) | |
| Class A | | 10/31/2005 | | | 8.41 | % | | $ | 62,440 | | | | 1.59 | % | | | 1.59 | % | | | 0.75 | % | | | 27 | % | |
| | | 10/31/2004 | | | 7.03 | | | | 72,997 | | | | 1.70 | | | | 1.70 | | | | 0.76 | | | | 107 | | |
| | | 10/31/2003 | | | 8.71 | | | | 89,335 | | | | 1.73 | | | | 1.73 | | | | 1.13 | | | | 69 | | |
| | | 10/31/2002 | | | (4.72 | ) | | | 100,923 | | | | 1.68 | | | | 1.70 | | | | 1.70 | | | | 87 | | |
| | | 10/31/2001 | | | (9.35 | ) | | | 126,369 | | | | 1.64 | | | | 1.66 | | | | 1.96 | | | | 114 | | |
| Class B | | 10/31/2005 | | | 7.80 | | | | 142,479 | | | | 2.14 | | | | 2.14 | | | | 0.20 | | | | 27 | | |
| | | 10/31/2004 | | | 6.44 | | | | 170,630 | | | | 2.26 | | | | 2.26 | | | | 0.19 | | | | 107 | | |
| | | 10/31/2003 | | | 7.84 | | | | 199,472 | | | | 2.37 | | | | 2.37 | | | | 0.48 | | | | 69 | | |
| | | 10/31/2002 | | | (5.31 | ) | | | 214,019 | | | | 2.33 | | | | 2.35 | | | | 1.05 | | | | 87 | | |
| | | 10/31/2001 | | | (9.93 | ) | | | 243,387 | | | | 2.29 | | | | 2.31 | | | | 1.31 | | | | 114 | | |
| Class C | | 10/31/2005 | | | 7.85 | | | | 43,276 | | | | 2.13 | | | | 2.13 | | | | 0.21 | | | | 27 | | |
| | | 10/31/2004 | | | 6.33 | | | | 53,990 | | | | 2.28 | | | | 2.28 | | | | (0.08 | ) | | | 107 | | |
| | | 10/31/2003 | | | 7.84 | | | | 4,354 | | | | 2.38 | | | | 2.39 | | | | 0.48 | | | | 69 | | |
NOTES TO FINANCIAL HIGHLIGHTS
(a) Annualized.
(b) Not annualized.
(c) Total Return has been calculated for the applicable period without deduction of a sales load, if any, on an initial purchase. Periods of less that one year are not annualized.
(d) Per share information is calculated based on average number of shares outstanding.
(e) Ratio of Net Expenses to Average Net Assets is net of fee waivers and reimbursements by the investment adviser, if any (see note 2).
(f) Ratio of Total Expenses to Average Net Assets includes all expenses before fee waivers and reimbursements by the investment adviser.
(g) The inception date for the Fund's offering of share Class C was November 11, 2002.
The notes to the financial statements are an integral part of this report.
Transamerica IDEX Mutual Funds
Annual Report 2005
10
TA IDEX Transamerica Balanced
NOTES TO FINANCIAL STATEMENTS
At October 31, 2005
(all amounts in thousands)
NOTE 1. ORGANIZATION AND SIGNIFICANT ACCOUNTING POLICIES
Transamerica IDEX Mutual Funds is an open-end management investment company registered under the Investment Company Act of 1940, as amended (the "1940 Act").
In the normal course of business, TA IDEX Transamerica Balanced (the "Fund") enters into contracts that contain a variety of representations that provide general indemnifications. The Fund's maximum exposure under these arrangements is unknown, as this would involve future claims that may be made against the Fund and/or its affiliates that have not yet occurred. However, based on experience, the Fund expects the risk of loss to be remote.
This report should be read in conjunction with the current Fund prospectus, which contains more complete information about the Fund.
The following is a summary of significant accounting policies followed by the Fund in the preparation of the financial statements. In preparing the Fund's financial statements in accordance with accounting principles generally accepted in the United States of America ("GAAP"), estimates or assumptions (which could differ from actual results) may be used that affect reported amounts and disclosures.
On May 28, 2004, the Fund acquired all of the net assets of TA IDEX Janus Growth & Income pursuant to a plan of reorganization. TA IDEX Transamerica Balanced is the accounting survivor. At the same time, the Fund changed sub-advisers from Janus Capital Management, LLC to Transamerica Investment Management, LLC and was renamed from TA IDEX Janus Balanced to TA IDEX Transamerica Balanced.
The acquisition was accomplished by a tax free exchange of 1,567 shares of the Fund for 3,232 shares of TA IDEX Janus Growth & Income outstanding on May 27, 2004. TA IDEX Janus Growth & Income's net assets at that date, $28,209, including $4,682 unrealized appreciation, were combined with those of the Fund. The aggregate net assets of TA IDEX Transamerica Balanced immediately before the acquisition was $302,562, the combined net assets of the Fund immediately after the acquisition was $330,771. Proceeds in connection with the acquisition were as follows:
| | | Shares | | Amount | |
| Proceeds in connection with the acquisition | |
| Class A | | | 362 | | | $ | 6,534 | | |
| Class B | | | 956 | | | | 17,187 | | |
| Class C | | | 49 | | | | 879 | | |
| Class C2 | | | 126 | | | | 2,271 | | |
| Class M | | | 74 | | | | 1,338 | | |
| | | | | | | $ | 28,209 | | |
Multiple class operations, income and expenses: The Fund currently offers three classes of shares, each with a public offering price that reflects different sales charges, if any, and expense levels. On June 15, 2004, Class C2 shares merged into Class C. On September 24, 2004, Class M shares merged into Class C. Class B shares will convert to Class A shares eight years after purchase. Income, non-class specific expenses and realized and unrealized gains and losses, are allocated daily to each class, based upon the value of shares outstanding method as permitted under Rule 18f-3 of the 1940 Act. Each class bears its own specific expenses as well as a portion of general, common expenses.
Security valuations: The Fund values its investments at the close of the New York Stock Exchange ("NYSE"), normally 4 p.m. ET, each day the NYSE is open for business. Fund investments are valued at the last sale price or closing price on the day of valuation taken from the primary exchange where the security is principally traded.
Securities traded in the over-the-counter market and listed securities for which no sale was reported on that date are valued at the last quoted bid price.
Debt securities are valued based on a price quotation or other equivalent indication of value supplied by an exchange, a pricing service or a major market maker.
Investment company securities are valued at the net asset value of the underlying portfolio.
Foreign securities generally are valued based on quotations from the primary market in which they are traded. Because many foreign securities markets and exchanges close prior to the close of the NYSE, closing prices for foreign securities in those markets or on those exchanges do not reflect the events that occur after that close. If a significant market event impacting the value of a portfolio security (e.g., natural disaster, company announcement, market volatility) occurs subsequent to the close of trading in the security, but prior to the calculation of the Fund's net asset value per share, market quotations for that security may be determined to be unreliable and, accordingly, not "readily available." As a result, foreign equity securities held by the Fund may be valued at fair market value as determined in good faith by the Fund's Administrative Valuation Committee, under the supervision of the B oard's Valuation Committee, using guidelines adopted by the Board of Trustees.
Other securities for which quotations are not readily available or whose values have been determined to be unreliable are valued at fair market value as determined in good faith by the Fund's Administrative Valuation Committee, under the supervision of the Board's Valuation Committee, using guidelines adopted by the Board of Trustees.
Cash: The Fund may leave cash overnight in its cash account with the custodian, Investors Bank & Trust Company ("IBT"). IBT has been contracted on behalf of the Fund to invest the excess cash into a savings account, which at October 31, 2005, was paying an interest rate of 2.76%.
Transamerica IDEX Mutual Funds
Annual Report 2005
11
TA IDEX Transamerica Balanced
NOTES TO FINANCIAL STATEMENTS (continued)
At October 31, 2005
(all amounts in thousands)
NOTE 1.–(continued)
Repurchase agreements: The Fund is authorized to enter into repurchase agreements. The Fund, through its custodian, Investors Bank & Trust Company ("IBT"), receives delivery of the underlying securities, the value of which at the time of purchase is required to be an amount equal to at least 100% of the resale price. The Fund will bear the risk of value fluctuations until the security can be sold and may encounter delays and incur costs in liquidating the security. In the event of bankruptcy or insolvency of the seller, delays and costs may be incurred.
Commission recapture: The sub-adviser, to the extent consistent with the best execution and usual commission rate policies and practices, may place security transactions of the Fund with broker/dealers with which Transamerica IDEX Mutual Funds has established a Commission Recapture Program. A Commission Recapture Program is any arrangement under which a broker/dealer applies a portion of the commissions received by such broker/dealer on the security transactions to the Fund. In no event will commissions paid by the Fund be used to pay expenses that would otherwise be borne by any other funds within Transamerica IDEX Mutual Funds, or by any other party.
Recaptured commissions during the year ended October 31, 2005, of $3 are included in net realized gains in the Statement of Operations.
Securities lending: The Fund may lend securities to qualified borrowers, with IBT acting as the Fund's lending agent. The Fund earns negotiated lenders' fees. The Fund receives cash and/or securities as collateral against the loaned securities. Cash collateral received is invested in short term, interest bearing securities. The Fund monitors the market value of securities loaned on a daily basis and requires collateral in an amount at least equal to the value of the securities loaned. Income from loaned securities on the Statement of Operations is net of fees, in the amount of $26, earned by IBT for its services.
Real Estate Investment Trusts ("REITs"): There are certain additional risks involved in investing in REITs. These include, but are not limited to, economic conditions, changes in zoning laws, real estate values, property taxes and interest rates.
Dividend income is recorded at management's estimate of the income included in distributions from the REIT investments. Distributions received in excess of the estimated amount are recorded as a reduction of the cost of investments. The actual amounts of income, return of capital and capital gains are only determined by each REIT after the fiscal year end and may differ from the estimated amounts.
Security transactions and investment income: Security transactions are recorded on the trade date. Security gains and losses are calculated on the specific identification basis. Dividend income, if any, is recorded on the ex-dividend date or, in the case of foreign securities, as soon as the Fund is informed of the ex-dividend date. Interest income, including accretion of discounts and amortization of premiums, is recorded on the accrual basis commencing on the settlement date.
Foreign currency denominated investments: The accounting records of the Fund are maintained in U.S. dollars. Securities and other assets and liabilities denominated in foreign currencies are translated into U.S. dollars at the closing exchange rate each day. The cost of foreign securities is translated at the exchange rate in effect when the investment was acquired. The Fund combines fluctuations from currency exchange rates and fluctuations in value when computing net realized and unrealized gains or losses from investments.
Net foreign currency gains and losses resulting from changes in exchange rates include: 1) foreign currency fluctuations between trade date and settlement date of investment security transactions; 2) gains and losses on forward foreign currency contracts; and 3) the difference between the receivable amounts of interest and dividends recorded in the accounting records in U.S. dollars and the amounts actually received.
Foreign currency denominated assets may involve risks not typically associated with domestic transactions. These risks include revaluation of currencies, adverse fluctuations in foreign currency values and possible adverse political, social and economic developments, including those particular to a specific industry, country or region.
Foreign capital gains taxes: The Fund may be subject to taxes imposed by countries in which it invests, with respect to its investment in issuers existing or operating in such countries. Such taxes are generally based on income earned or repatriated and capital gains realized on the sale of such investments. The Fund accrues such taxes when the related income or capital gains are earned. Some countries require governmental approval for the repatriation of investment income, capital or the proceeds of sales earned by foreign investors. In addition, if there is deterioration in a country's balance of payments or for other reasons, a country may impose temporary restrictions on foreign capital remittances abroad.
Forward foreign currency contracts: The Fund may enter into forward foreign currency contracts to hedge against exchange rate risk arising from investments in securities denominated in foreign currencies. Contracts are valued at the contractual forward rate and are marked to market daily, with the change in value recorded as an unrealized gain or loss. When the contracts are settled a realized gain or loss is incurred. Risks may arise from changes in market value of the underlying currencies and from the possible inability of counterparties to meet the terms of their contracts.
There were no open forward foreign currency contracts at October 31, 2005.
Redemption fees: A short-term trading redemption fee may be assessed on any Fund shares in a fund account that are sold during the first five (5) NYSE trading days following their purchase date. This redemption fee will equal 2% of the amount redeemed and shares held the longest will be treated as being redeemed first and shares held the shortest as being redeemed last. For the year ended October 31, 2005, the Fund received less than $1 in redemption fees.
Transamerica IDEX Mutual Funds
Annual Report 2005
12
TA IDEX Transamerica Balanced
NOTES TO FINANCIAL STATEMENTS (continued)
At October 31, 2005
(all amounts in thousands)
NOTE 1.–(continued)
Dividend distributions: Distributions to shareholders are recorded on the ex-dividend date and are determined in accordance with Federal income tax regulations which may differ from GAAP.
NOTE 2. RELATED PARTY TRANSACTIONS
Effective January 1, 2005 AEGON/Transamerica Fund Advisors, Inc. was renamed Transamerica Fund Advisors, Inc. ("TFAI"); AEGON/Transamerica Fund Services, Inc. and AEGON/Transamerica Investor Services, Inc. merged into one entity and was renamed Transamerica Fund Services, Inc. ("TFS").
TFAI is the Fund's investment adviser. TFS is the Fund's administrator and transfer agent. AFSG Securities Corp. ("AFSG") is the Fund's distributor/principal underwriter. TFAI, TFS , and AFSG are affiliates of AEGON, NV, a Netherlands corporation.
Transamerica Investment Management, LLC is both an affiliate of the Fund and a sub-adviser to the Fund.
Investment advisory fees: The Fund pays management fees to TFAI based on average daily net assets ("ANA") at the following breakpoints:
From November 1, 2004 to December 31, 2004:
0.85% of the first $250 million of ANA
0.80% of the next $250 million of ANA
0.75% of the next $1 billion of ANA
0.65% of ANA over $1.5 billion
From January 1, 2005 on:
0.80% of the first $250 million of ANA
0.75% of the next $250 million of ANA
0.70% of the next $1 billion of ANA
0.625% of ANA over $1.5 billion
TFAI has contractually agreed to waive its advisory fee and will reimburse the Fund to the extent that operating expenses, excluding 12b-1 fees, exceed the following stated annual limit:
From November 1, 2004 to December 31, 2004:
1.50% Expense Limit
From January 1, 2005 on:
1.45% Expense Limit
If total Fund expenses fall below the annual expense limitation agreement agreed to by the adviser within the succeeding three years, the Fund may be required to pay that adviser a portion or all of the reimbursed class expenses.
There were no amounts recaptured during the year ended October 31, 2005. There are no amounts available for recapture at October 31, 2005.
Distribution and service fees: The Fund has a 12b-1 distribution plan under the 1940 Act pursuant to which an annual fee, based on average daily net assets, is paid to the distributor for various disbursements such as broker-dealer account servicing fees and other promotional expenses of the Fund. The Fund is authorized under the 12b-1 plan to pay fees on each class up to the following limits:
| Class A | | | 0.35 | % | |
| Class B | | | 1.00 | % | |
| Class C | | | 1.00 | % | |
In the case the Fund or a class of shares of the Fund is closed to new investors or investments, the Fund is authorized to pay 12b-1 fees for past sales and distribution efforts and present and past investor services.
Underwriter commissions relate to front-end sales charges imposed for Class A shares and contingent deferred sales charges from Classes B, C, and certain A share redemptions. For the year ended October 31, 2005, the underwriter commissions were as follows:
| Received by Underwriter | | $ | 400 | | |
| Retained by Underwriter | | | 21 | | |
| Contingent Deferred Sales Charge | | | 338 | | |
Administrative services: The Fund has entered into an agreement with TFS for financial and legal fund administration services. As of January 1, 2005 the Fund pays TFS an annual fee of 0.02% of ANA. Prior to January 1, 2005 the Fund paid TFS an annual fee of 0.015% of ANA. The Legal fees on the Statement of Operations are for fees paid to external legal counsel.
Transfer agent fees: The Fund pays TFS an annual per-account charge for each open and closed account. The Fund paid TFS $630 for the year ended October 31, 2005.
Deferred compensation plan: Each eligible independent Fund Trustee may elect to participate in a non-qualified deferred compensation plan maintained by Transamerica IDEX Mutual Funds (the "Plan"). Under the Plan, such Trustees may defer payment of all or a portion of their total fees earned as a Fund Trustee. Each Trustee who is a participant in the Plan may elect that the earnings, losses or gains credited to his or her deferred fee amounts be determined based on a deemed investment in any series of Transamerica IDEX Mutual Funds, including the Fund. The right of a participant to receive a distribution from the Plan of the deferred fees is an unsecured claim against the general assets of all series of Transamerica IDEX Mutual Funds. The pro rata liability to the Fund of all defer red fees in the Plan amounted, as of October 31, 2005, to $35.
Transamerica IDEX Mutual Funds
Annual Report 2005
13
TA IDEX Transamerica Balanced
NOTES TO FINANCIAL STATEMENTS (continued)
At October 31, 2005
(all amounts in thousands)
NOTE 3. INVESTMENT TRANSACTIONS
The cost of securities purchased and proceeds from securities sold (excluding short-term securities) for the year ended October 31, 2005, were as follows:
| Purchases of securities: | | | |
| Long-Term | | $ | 43,061 | | |
| U.S. Government | | | 30,299 | | |
| Proceeds from maturities and sales of securities: | | | |
| Long-Term | | | 125,301 | | |
| U.S. Government | | | 37,277 | | |
NOTE 4. FEDERAL INCOME TAX MATTERS
The Fund has not made any provision for federal income or excise taxes due to its policy to distribute all of its taxable income and capital gains to its shareholders and otherwise qualify as a regulated investment company under Subchapter M of the Internal Revenue Code. Income and capital gain distributions are determined in accordance with income tax regulations, which may differ from GAAP. These differences are primarily due to differing treatment for items including, but not limited to, wash sales and capital loss carryforwards.
Therefore, distributions determined in accordance with tax regulations may differ significantly in amount or character from net investment income and realized gains for financial reporting purposes. Financial reporting records are adjusted for permanent book/tax differences to reflect tax character. Financial records are not adjusted for temporary differences. These reclassifications are as follows:
Shares of beneficial interest, unlimited
shares authorized | | $ | (67 | ) | |
| Accumulated net investment income (loss) | | | 53 | | |
Accumulated net realized gain (loss) from
investment securities. | | | 14 | | |
The capital loss carryforwards are available to offset future realized capital gains through the periods listed:
Capital Loss
Carryforward | | Available through | |
| $ | 520 | | | October 31, 2009 | |
| | 26,030 | | | October 31, 2010 | |
| | 9,071 | | | October 31, 2011 | |
The capital loss carryforward utilized during the year ended October 31, 2005 was $8,016.
The tax character of distributions paid may differ from the character of distributions shown in the Statement of Changes in Net Assets due to short-term gains being treated as ordinary income for tax purposes. The tax character of distributions paid during 2004 and 2005 was as follows:
| 2004 Distributions paid from: | |
| Ordinary Income | | $ | 1,139 | | |
| Long-term Capital Gain | | | – | | |
| 2005 Distributions paid from: | |
| Ordinary Income | | | 1,138 | | |
| Long-term Capital Gain | | | – | | |
The tax basis components of distributable earnings as of October 31, 2005, are as follows:
| Undistributed Ordinary Income | | $ | – | | |
| Undistributed Long-term Capital Gains | | $ | – | | |
| Capital Loss Carryforward | | $ | (35,621 | ) | |
| Net Unrealized Appreciation (Depreciation) | | $ | 32,772 | * | |
* Amount includes unrealized appreciation (depreciation) from foreign currency and deferred compensation.
The aggregate cost of investments and composition of unrealized appreciation (depreciation) for federal income tax purposes as of October 31, 2005, are as follows:
| Federal Tax Cost Basis | | $ | 220,015 | | |
| Unrealized Appreciation | | $ | 36,817 | | |
| Unrealized (Depreciation) | | | (4,041 | ) | |
| Net Unrealized Appreciation (Depreciation) | | $ | 32,776 | | |
NOTE 5. REGULATORY PROCEEDINGS
There continues to be significant federal and state regulatory activity relating to financial services companies, particularly mutual fund companies and their investment advisers. As part of an ongoing investigation regarding potential market timing, recordkeeping and trading compliance issues and matters affecting the Fund's investment adviser, TFAI, and certain affiliates and former employees of TFAI, the SEC staff has indicated that it is likely to take some action against TFAI and certain of its affiliates at the conclusion of the investigation. The potential timing and the scope of any such action is difficult to predict. Although the impact of any action brought against TFAI and/or its affiliates is difficult to assess at the present time, the Fund currently believes that the likelihood that any such action will have a material adverse impact on it is remote. It is important to note that the Fund is not aware of any allegation of wrongdoing against it and its Board at the time this annual report is printed. Although it is not anticipated that these developments will have an adverse impact on the Fund, there can be no assurance at this time. TFAI and its affiliates are actively working with the SEC in regard to this matter; however, the exact resolution cannot be determined at this time. TFAI will take such actions that it deems necessary or appropriate to continue providing management services to the Fund and to bring all matters to an appropriate conclusion.
TFAI and/or its affiliates, and not the Fund, will bear the costs regarding these regulatory matters.
Transamerica IDEX Mutual Funds
Annual Report 2005
14
Report of Independent Registered Certified Public Accounting Firm
To the Board of Trustees and Shareholders of
TA IDEX Transamerica Balanced
In our opinion, the accompanying statement of assets and liabilities, including the schedule of investments, and the related statements of operations and of changes in net assets and the financial highlights present fairly, in all material respects, the financial position of TA IDEX Transamerica Balanced (the "Fund") (one of the portfolios constituting the Transamerica IDEX Mutual Funds) at October 31, 2005, the results of its operations for the year then ended, the changes in its net assets for each of the two years in the period then ended and the financial highlights for each of the periods presented, in conformity with accounting principles generally accepted in the United States of America. These financial statements and financial highlights (hereafter referred to as "financial statements") are the responsibility of the Fund's management; our responsibility is to express an opinion on these fi nancial statements based on our audits. We conducted our audits of these financial statements in accordance with the standards of the Public Company Accounting Oversight Board (United States). Those standards require that we plan and perform the audit to obtain reasonable assurance about whether the financial statements are free of material misstatement. An audit includes examining, on a test basis, evidence supporting the amounts and disclosures in the financial statements, assessing the accounting principles used and significant estimates made by management, and evaluating the overall financial statement presentation. We believe that our audits, which included confirmation of securities at October 31, 2005 by correspondence with the custodian and brokers, provide a reasonable basis for our opinion.

December 22, 2005
Transamerica IDEX Mutual Funds
Annual Report 2005
15
TA IDEX Transamerica Balanced
SUPPLEMENTAL INFORMATION (unaudited)
TAX INFORMATION
For dividends paid during the year ended October 31, 2005, the Fund designated $3,012 as qualified dividend income.
For corporate shareholders, 98% of investment income (dividend income plus short-term gains, if any) qualifies for the dividends received deduction.
The information and distributions reported herein may differ from the information and distributions taxable to the shareholders for the calendar year ending December 31, 2005. Complete information will be computed and reported in conjunction with your 2005 Form 1099-DIV.
Transamerica IDEX Mutual Funds
Annual Report 2005
16
TA IDEX Transamerica High-Yield Bond
MARKET ENVIRONMENT
Strong personal consumption expenditures along with continued employment growth, contributed to a sustained growth trend of the economy over the past fiscal year. While employment growth continues to be below historical recoveries, this was more than offset by the consumers who subsidized their spending by borrowing and extracting equity from their homes. This has led to a consumer negative savings rate.
Although inflation continued to remain benign throughout the fiscal year, it did not deter the Federal Reserve Board ("Fed") from continuing to raise interest rates at every Federal Open Market Committee ("FOMC") meeting during the year. The Fed continues to be concerned that higher energy prices may flow through to final consumer prices and eventually raise investor's inflation expectations. A proxy for whether duration or credit outperformed during the year is witnessed by Lehman Brothers High Yield Index (credit) increasing 4.08% during the fiscal year ended October 31, 2005, while Lehman Brothers Credit Index (duration) increased just 0.65%. The vast majority of the portfolio's underperformance for the year versus high yield fund peers was our limitation to hold no more than 75% of high yield in the portfolio during the first six months of the fiscal year.
PERFORMANCE
For the year ended October 31, 2005, TA IDEX Transamerica High-Yield Bond, Class A returned 2.06%. By comparison its benchmark, the Merrill Lynch High Yield Cash Pay Index ("Merrill Lynch High Yield"), returned 4.01%
STRATEGY REVIEW
For a vast portion of the portfolio's life, duration product (investment grade bonds) has been used to manage risk/reward for the portfolio. As stated in last year's letter; "since 1985 through the end of the third calendar quarter of 2004, investment grade corporate bonds as measured by the Merrill Lynch High Grade Corporate Master Index returned an average monthly return of 0.78% couple with a 1.51 standard deviation, or a Sharpe ratio of 0.23%. This slightly exceeded the Merrill Lynch High Yield Index Sharpe ratio of 0.22%, which experienced an average monthly return of 0.83% and a standard deviation of 1.80."
Essentially this philosophy enabled the portfolio to garner returns from a higher quality sector that experienced about the same average monthly return as its lower rated counterpart, but with less monthly volatility as the high yield sector. This was primarily due to the duration advantage gained by owning investment grade bonds over the past 20 years during an extraordinary period of high interest rates. However, interest rates have reverted to their historical mean suggesting the advantage of using duration to add value to the portfolio is coming to an end. After very thorough and thoughtful analysis the Board accepted our recommendation to change the Fund to an all high yield mandate. The change was made effective August 1, 2005.
The macroeconomic environment provided a very positive backdrop to credit throughout the fiscal year. Default rates remained near historical lows, corporation's balance sheets have improved dramatically since the recession of 2001-2002, and free cash has built to very high levels. Unfortunately this has also made merger and acquisitions ("M&A") more attractive with deals being consummated that generally reward the equity holders versus the bond holders. This risk has grown throughout the fiscal year as the coffers of M&A funds have grown considerably. This risk has been reduced considerably within the portfolio as virtually all of the investment grade holdings were liquidated to transition to an all high yield portfolio. Risk of rising interest rates was also reduced dramatically with the transition out of investment grade securities and into high yield bonds.
Performance for the fiscal year ended October 31, 2005 was marked by increased price volatility as the market started to incorporate slower earnings growth and balance sheet improvement in a variety of sectors. The perceived aggressiveness of the Fed along with a relatively flat yield curve has also become sources of concern, adding to volatility.
Positive contributors were driven primarily by improving credit situations. Some positive return contributors were Qwest Communications International Inc., Dynegy Inc., Rogers Wireless Inc. and Crystal Holdings, LLC. The portfolio also opportunistically took advantage of the volatility to increase or start positions in select names within the cyclical industries' sub-sectors and looked for other, name-specific opportunities in an effort to generate alpha for shareholders. Other examples of positive contributors included DynCorp International Inc., Ameripath, Inc., Texas Genco Inc. and US Onocology, Inc.
Negative contributors to performance were spread across several sub-sectors but remained concentrated in areas of the economy most impacted by rising input costs or heavy competition such as paper, packaging, chemicals, metals and automobiles/automobile parts. Issuers that lagged in performance during the fiscal year ended October 31, 2005 included Anchor Glass Container Corporation, Leiner Health Products Inc., General Motors Corporation, Adelphia Communications Corporation, and a
Transamerica IDEX Mutual Funds
Annual Report 2005
1
TA IDEX Transamerica High-Yield Bond
variety of paper and packaging names. Although we have seen some reprieve in the input costs lately, we continue to believe many high yield companies will experience difficulty as they retain little ability to raise prices to the end customer.
With the portfolio now total high yield, the risks have shifted from a combination of duration (interest rate risk) and credit to primarily credit. No longer does a significant rise in interest rates pose the key risk to the portfolio. Rather, a long sustained underperformance by the economy would be the predominate risk, which is mitigated by our very low weighting in CCC securities and generally a higher proportion of better quality credits within the portfolio.
David R. Halfpap CFA
Bradley J. Beman CFA
Co-Fund Managers
AEGON USA Investment Management, LLC
Transamerica IDEX Mutual Funds
Annual Report 2005
2
TA IDEX Transamerica High-Yield Bond
Comparison of change in value of $10,000 investment in Class A shares and its comparative index.
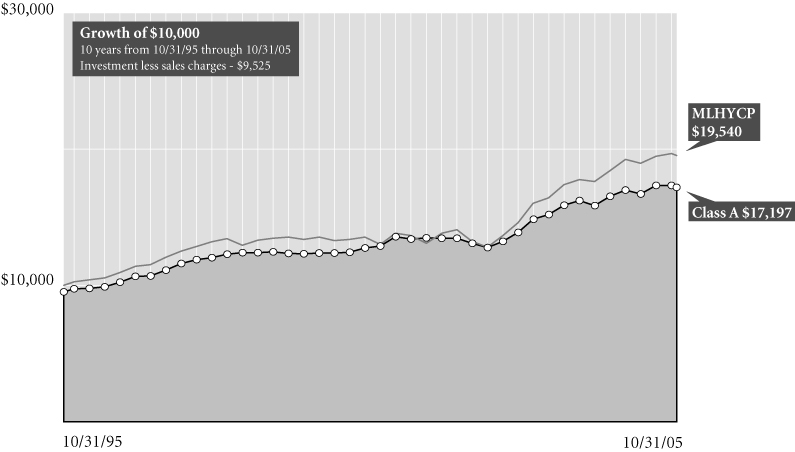
Average Annual Total Return for Periods Ended 10/31/05
| | | 1 year | | 5 years | | 10 years | | From
Inception | | Inception
Date | |
| Class A (NAV) | | | 2.06 | % | | | 6.25 | % | | | 6.09 | % | | | 8.40 | % | | 6/14/85 | |
| Class A (POP) | | | (2.79 | )% | | | 5.22 | % | | | 5.57 | % | | | 8.15 | % | | 6/14/85 | |
| MLHYCP1 | | | 4.01 | % | | | 8.23 | % | | | 6.93 | % | | | 9.58 | % | | 6/14/85 | |
| Class B (NAV) | | | 1.21 | % | | | 5.53 | % | | | 5.39 | % | | | 5.36 | % | | 10/1/95 | |
| Class B (POP) | | | (3.58 | )% | | | 5.38 | % | | | 5.39 | % | | | 5.36 | % | | 10/1/95 | |
| Class C (NAV) | | | 1.21 | % | | | – | | | | – | | | | 9.55 | % | | 11/11/02 | |
| Class C (POP) | | | 0.26 | % | | | – | | | | – | | | | 9.55 | % | | 11/11/02 | |
| Class I (NAV) | | | – | | | | – | | | | – | | | | 2.33 | % | | 11/8/04 | |
NOTES
1 The Merrill Lynch High Yield Cash Pay (MLHYCP) Index is an unmanaged index used as a general measure of market performance. Calculations assume dividends and capital gains are reinvested and do not include any managerial expenses. From inception calculation is based on life of Class A shares. Source: Standard & Poor's Micropal®© Micropal, Inc. 2005 – 1-800-596-5323 – http://www.funds-sp.com.
The performance data presented represents past performance, future results may vary. Performance data does not reflect the deduction of taxes that would be paid on fund distributions or the redemption of fund shares. Investment return and principal value will fluctuate so that an investor's shares, when redeemed, may be worth more or less than their original cost. Current performance may be lower or higher than performance quoted. Please see www.transamericaidex.com for performance data current to the most recent month-end.
Public Offering Price (POP) returns include the reinvestment of dividends and capital gains and reflect the maximum sales charge of 4.75% for A shares or the maximum applicable contingent deferred sales charge (5% in the 1st year, decreasing to 0% after 6 years) for Class B shares and 1% (during the first 12 months) for Class C shares. Shares purchased prior to March 1, 2004 are subject to a maximum applicable contingent deferred sales charge (5% in the 1st year, decreasing to 0% after 7 years) for Class B shares and (2% in the 1st year, decreasing to 0% after 2 years) for Class C shares. Net Asset Value (NAV) returns include the reinvestment of dividends and capital gains but do not reflect any sales charges.
Investments in high-yield bonds ("junk bonds") may be subject to greater volatility and risks as the income derived from these securities is not guaranteed and may be unpredictable.
This material must be preceded or accompanied by a current prospectus, which includes specific contents regarding the investment objectives and policies of this fund.
Transamerica IDEX Mutual Funds
Annual Report 2005
3
TA IDEX Transamerica High-Yield Bond
UNDERSTANDING YOUR FUND'S EXPENSES
(unaudited)
SHAREHOLDER EXPENSES
Fund shareholders may incur two types of costs: (1) transaction costs, including sales charges (loads) on purchases, contingent deferred sales charges on redemptions and redemption fees; and (2) ongoing costs, including management fees, 12b-1 distribution and service fees, and other fund expenses.
The following Example is intended to help you understand your ongoing costs (in dollars and cents) of investing in a Fund and to compare these costs with the ongoing costs of investing in other funds.
The Example is based on an investment of $1,000 invested at May 1, 2005 and held for the entire period until October 31, 2005.
ACTUAL EXPENSES
The first line in the table below provides information about actual account values and actual expenses. You may use the information in this line, together with the amount you invested, to estimate the expenses that you paid over the period. Simply divide your account value by $1,000 (for example, an $8,600 account value divided by $1,000 = 8.6), then multiply the result by the number in the first line of your Fund under the heading entitled "Expenses Paid During Period" to estimate the expenses you paid on your account during this period. If your account is an IRA, your expenses could have included a $15 annual fee. The amount of any fee paid through your account would increase the estimate of expenses you paid during the period and decrease your ending account value.
HYPOTHETICAL EXAMPLE FOR COMPARISON PURPOSES
The second line in the table below provides information about hypothetical account values and hypothetical expenses based on the Fund's actual expense ratio and an assumed rate of return of 5% per year before expenses, which is not the Fund's actual return. The hypothetical account values and expenses may not be used to estimate the actual ending account balance or expenses you paid for the period. You may use this information to compare the ongoing costs of investing in your Fund and other funds. To do so, compare this 5% hypothetical example with the 5% hypothetical examples that appear in the shareholder reports of the other funds. As in the case of the actual expense example, if your account is subject to an IRA fee, the amount of the fee paid through your account would increase the hypothetical expenses you would have paid during the period and decrease the hypothetical ending account value.
Please note that the expenses shown in the table are meant to highlight your ongoing costs only and do not reflect any transactional costs, such as sales charges, redemption fees, brokerage commissions paid on purchases and sales of fund shares. Therefore, the second line under the Fund in the table is useful in comparing ongoing costs only, and will not help you determine the relative total costs of owning different funds. If any of these transaction costs were included, your costs would be higher. The expenses shown in the table do not reflect any fees that may be charged to you by brokers, financial intermediaries or other financial institutions.
| | | Beginning
Account
Value | | Ending
Account
Value | | Annualized
Expense
Ratio | | Expenses Paid
During Period (a) | |
| Class A | |
| Actual | | $ | 1,000.00 | | | $ | 1,029.10 | | | | 1.07 | % | | $ | 5.47 | | |
| Hypothetical (b) | | | 1,000.00 | | | | 1,019.81 | | | | 1.07 | | | | 5.45 | | |
| Class B | |
| Actual | | | 1,000.00 | | | | 1,025.30 | | | | 1.94 | | | | 9.90 | | |
| Hypothetical (b) | | | 1,000.00 | | | | 1,015.43 | | | | 1.94 | | | | 9.86 | | |
| Class C | |
| Actual | | | 1,000.00 | | | | 1,024.30 | | | | 1.90 | | | | 9.69 | | |
| Hypothetical (b) | | | 1,000.00 | | | | 1,015.63 | | | | 1.90 | | | | 9.65 | | |
| Class I | |
| Actual | | | 1,000.00 | | | | 1,031.00 | | | | 0.67 | | | | 3.43 | | |
| Hypothetical (b) | | | 1,000.00 | | | | 1,021.83 | | | | 0.67 | | | | 3.41 | | |
(a) Expenses are calculated using each Fund's annualized expense ratio (as disclosed in the table), multiplied by the average account value for the period, multiplied by number of days in the period (184 days), and divided by the number of days in the year (365 days).
(b) 5% return per year before expenses.
GRAPHICAL PRESENTATION OF SCHEDULE OF INVESTMENTS
By Bond Credit Quality (Moody Ratings)
At October 31, 2005
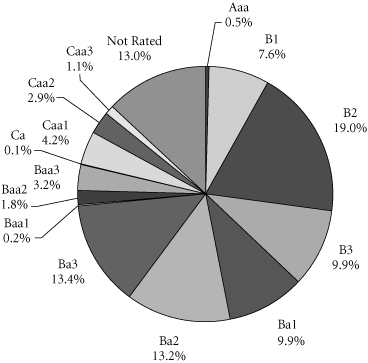
Transamerica IDEX Mutual Funds
Annual Report 2005
4
TA IDEX Transamerica High-Yield Bond
GRAPHICAL PRESENTATION OF SCHEDULE OF INVESTMENTS
(continued)
| Aaa | | Prime grade obligations. Exceptional financial security and ability to meet senior financial obligations. | |
|
| B1 | | Moderate vulnerability to adverse business, financial and economic conditions but currently has the capacity to meet financial commitments. | |
|
| B2 | | More vulnerable to adverse business, financial and economic conditions but currently has the capacity to meet financial commitments. | |
|
| B3 | | Assurance of interest and principal payments or of maintenance of other terms of the contract over any long period of time may be small. | |
|
| Ba1 | | Moderate vulnerability in the near-term but faces major ongoing uncertainties in the event of adverse business, financial and economic conditions. | |
|
| Ba2 | | Vulnerable in the near-term but faces major ongoing uncertainties in the event of adverse business, financial and economic conditions. | |
|
| Ba3 | | More vulnerable in the near-term but faces major ongoing uncertainties in the event of adverse business, financial and economic conditions. | |
|
| Baa1 | | Medium grade obligations. Interest payments and principal security are adequate for the present but certain protective elements may be lacking or may be characteristically unreliable over great length of time. | |
|
| Baa2 | | Medium grade obligations. Interest payments and principal security appear adequate for the present but certain protective elements may be lacking or may be characteristically unreliable over great length of time. | |
|
| Baa3 | | Medium grade obligations. Interest payments and principal security are not as adequate for the present but certain protective elements may be lacking or may be characteristically unreliable over great length of time. | |
|
| Ca | | Speculative in a high degree. Such issues are often in default or have other marked shortcomings. | |
|
| Caa1 | | Highly vulnerable may be in default on their policyholder obligations or there may be present elements of danger with respect to payment of policyholder obligations and claims. | |
|
| Caa2 | | Extremely vulnerable may be in default on their policyholder obligations or there may be present elements of danger with respect to payment of policyholder obligations and claims. | |
|
| Caa3 | | Speculative, may be in default on their policyholder obligations or have other marked shortcomings. | |
|
Transamerica IDEX Mutual Funds
Annual Report 2005
5
TA IDEX Transamerica High-Yield Bond
SCHEDULE OF INVESTMENTS
At October 31, 2005
(all amounts except share amounts in thousands)
| | | Principal | | Value | |
| U.S. GOVERNMENT OBLIGATIONS (0.4%) | |
U.S. Treasury Bond
5.38%, due 02/15/2031 † | | $ | 1,600 | | | $ | 1,745 | | |
| Total U.S. Government Obligations (cost: $1,838) | | | | | | | 1,745 | | |
| FOREIGN GOVERNMENT OBLIGATIONS (0.2%) | |
Republic of Colombia
9.75%, due 04/23/2009 | | | 1,000 | | | | 1,119 | | |
| Total Foreign Government Obligations (cost: $950) | | | | | | | 1,119 | | |
| CORPORATE DEBT SECURITIES (94.3%) | |
| Agriculture (0.7%) | |
Dole Food Co., Inc.
8.63%, due 05/01/2009 | | | 3,055 | | | | 3,158 | | |
| Air Transportation (0.2%) | |
American Airlines, Inc., Series 2003-1, Class G
3.86%, due 07/09/2010 | | | 813 | | | | 779 | | |
| Amusement & Recreation Services (2.4%) | |
Isle of Capri Casinos, Inc.
7.00%, due 03/01/2014 | | | 3,000 | | | | 2,835 | | |
MGM Mirage
6.75%, due 09/01/2012
5.88%, due 02/27/2014 | | | 1,000
2,500 | | | | 995
2,337 | | |
Mohegan Tribal Gaming Authority
6.38%, due 07/15/2009
6.13%, due 02/15/2013 | | | 1,000
2,000 | | | | 1,000
1,935 | | |
Speedway Motorsports, Inc.
6.75%, due 06/01/2013 | | | 1,000 | | | | 1,022 | | |
| Apparel Products (0.8%) | |
Levi Strauss & Co.
9.75%, due 01/15/2015 | | | 3,500 | | | | 3,535 | | |
| Automotive (5.5%) | |
ArvinMeritor, Inc.
8.75%, due 03/01/2012 | | | 452 | | | | 424 | | |
Ford Motor Co.
7.45%, due 07/16/2031 † | | | 2,000 | | | | 1,470 | | |
General Motors Acceptance Corp.
6.75%, due 12/01/2014 † | | | 8,000 | | | | 7,650 | | |
General Motors Corp.
7.13%, due 07/15/2013 † | | | 2,000 | | | | 1,580 | | |
Lear Corp., Series B
5.75%, due 08/01/2014 † | | | 2,000 | | | | 1,610 | | |
Metaldyne Corp.–144A
11.00%, due 11/01/2013 † | | | 2,000 | | | | 1,800 | | |
Navistar International Corp.
7.50%, due 06/15/2011
6.25%, due 03/01/2012 | | | 1,000
6,000 | | | | 950
5,385 | | |
| | | Principal | | Value | |
| Automotive (continued) | |
Tenneco Automotive, Inc.
10.25%, due 07/15/2013 | | $ | 2,500 | | | $ | 2,700 | | |
| Beverages (0.5%) | |
Constellation Brands, Inc.
8.13%, due 01/15/2012 | | | 2,000 | | | | 2,082 | | |
| Business Credit Institutions (0.6%) | |
Ford Motor Credit Co.
6.50%, due 01/25/2007
5.80%, due 01/12/2009 | | | 500
1,000 | | | | 494
916 | | |
HVB Funding Trust III–144A
9.00%, due 10/22/2031 | | | 1,000 | | | | 1,311 | | |
| Business Services (3.8%) | |
Di Finance/Dyncorp International–144A
9.50%, due 02/15/2013 | | | 1,410 | | | | 1,463 | | |
Iron Mountain, Inc.
8.63%, due 04/01/2013 | | | 4,000 | | | | 4,170 | | |
Quintiles Transnational Corp.
10.00%, due 10/01/2013 | | | 1,000 | | | | 1,104 | | |
R.H. Donnelley Corp.
6.88%, due 01/15/2013 | | | 2,500 | | | | 2,287 | | |
R.H. Donnelley Finance Corp I–144A
10.88%, due 12/15/2012 | | | 2,000 | | | | 2,240 | | |
United Rentals North America, Inc.
6.50%, due 02/15/2012 | | | 1,000 | | | | 959 | | |
Universal Compression, Inc.
7.25%, due 05/15/2010 | | | 2,000 | | | | 2,040 | | |
Universal Hospital Services, Inc.
10.13%, due 11/01/2011 | | | 2,000 | | | | 2,005 | | |
| Chemicals & Allied Products (3.7%) | |
Airgas, Inc.
6.25%, due 07/15/2014 | | | 1,500 | | | | 1,492 | | |
Equistar Chemicals, LP/Equistar Funding Corp.
10.13%, due 09/01/2008
10.63%, due 05/01/2011 | | | 1,000
2,000 | | | | 1,077
2,180 | | |
Huntsman International LLC
9.88%, due 03/01/2009
10.13%, due 07/01/2009
11.63%, due 10/15/2010 | | | 1,000
2,000
965 | | | | 1,050
2,057
1,093 | | |
Huntsman International LLC–144A
7.38%, due 01/01/2015 † | | | 2,000 | | | | 1,900 | | |
Lyondell Chemical Co.
10.50%, due 06/01/2013 | | | 1,000 | | | | 1,134 | | |
Nalco Co.
7.75%, due 11/15/2011 | | | 2,000 | | | | 2,042 | | |
NOVA Chemicals Corp.
6.50%, due 01/15/2012 | | | 1,000 | | | | 955 | | |
The notes to the financial statements are an integral part of this report.
Transamerica IDEX Mutual Funds
Annual Report 2005
6
TA IDEX Transamerica High-Yield Bond
SCHEDULE OF INVESTMENTS (continued)
At October 31, 2005
(all amounts except share amounts in thousands)
| | | Principal | | Value | |
| Chemicals & Allied Products (continued) | |
Scotts Co. (The)
6.63%, due 11/15/2013 | | $ | 1,000 | | | $ | 1,020 | | |
| Communication (5.8%) | |
Adelphia Communications Corp.
10.25%, due 11/01/2006 v | | | 1,000 | | | | 635 | | |
Cablevision Systems Corp., Series B
8.00%, due 04/15/2012 | | | 1,000 | | | | 955 | | |
CCH I Holdings LLC–144A
9.92%, due 04/01/2014 | | | 493 | | | | 318 | | |
CCH I LLC–144A
11.00%, due 10/01/2015 | | | 4,274 | | | | 3,868 | | |
Charter Communications Operating LLC/
Charter Communications Operating
Capital Corp.–144A
8.38%, due 04/30/2014 | | | 2,000 | | | | 2,005 | | |
CSC Holdings, Inc.–144A
7.00%, due 04/15/2012 | | | 2,000 | | | | 1,930 | | |
Echostar DBS Corp.
5.75%, due 10/01/2008
6.63%, due 10/01/2014 | | | 3,000
2,000 | | | | 2,932
1,940 | | |
Intelsat Bermuda, Ltd.–144A
8.63%, due 01/15/2015 | | | 8,000 | | | | 8,100 | | |
Liberty Media Corp.
7.88%, due 07/15/2009 | | | 1,000 | | | | 1,046 | | |
PanAmSat Corp.
9.00%, due 08/15/2014 | | | 1,300 | | | | 1,368 | | |
| Communications Equipment (0.9%) | |
L-3 Communications Corp.
7.63%, due 06/15/2012
6.13%, due 07/15/2013
6.13%, due 01/15/2014 | | | 1,000
2,000
1,000 | | | | 1,045
1,960
977 | | |
| Computer & Data Processing Services (0.6%) | |
Unisys Corp.
6.88%, due 03/15/2010 †
8.00%, due 10/15/2012 †
8.50%, due 10/15/2015 | | | 1,000
1,000
1,000 | | | | 895
880
870 | | |
| Computer & Office Equipment (0.2%) | |
Seagate Technology Holdings Corp.
8.00%, due 05/15/2009 | | | 1,000 | | | | 1,046 | | |
| Construction (2.9%) | |
Beazer Homes USA, Inc.
6.50%, due 11/15/2013 | | | 2,000 | | | | 1,840 | | |
Centex Corp.
5.80%, due 09/15/2009 | | | 750 | | | | 759 | | |
| | | Principal | | Value | |
| Construction (continued) | |
DR Horton, Inc.
| |
| 5.88%, due 07/01/2013 | | $ | 3,000 | | | $ | 2,899 | | |
| 6.13%, due 01/15/2014 | | | 1,000 | | | | 980 | | |
| 5.25%, due 02/15/2015 | | | 1,000 | | | | 913 | | |
KB Home
5.75%, due 02/01/2014 | | | 1,000 | | | | 925 | | |
Standard-Pacific Corp.
6.25%, due 04/01/2014 | | | 3,000 | | | | 2,640 | | |
WCI Communities, Inc.
6.63%, due 03/15/2015 | | | 2,000 | | | | 1,715 | | |
| Department Stores (1.1%) | |
Neiman-Marcus Group, Inc.–144A
9.00%, due 10/15/2015 † | | | 5,000 | | | | 4,912 | | |
Saks, Inc.
8.25%, due 11/15/2008 | | | — | o | | | — | o | |
| Drug Stores & Proprietary Stores (1.4%) | |
Jean Coutu Group, Inc.
8.50%, due 08/01/2014 † | | | 2,000 | | | | 1,855 | | |
Medco Health Solutions, Inc.
7.25%, due 08/15/2013 | | | 1,000 | | | | 1,083 | | |
Rite Aid Corp.
12.50%, due 09/15/2006
9.50%, due 02/15/2011 | | | 2,000
1,000 | | | | 2,095
1,050 | | |
| Electric Services (8.6%) | |
AES Corp. (The)–144A
8.75%, due 05/15/2013 | | | 2,000 | | | | 2,160 | | |
Cleveland Electric Illuminating Co., (The)
5.65%, due 12/15/2013 | | | 1,000 | | | | 1,001 | | |
CMS Energy Corp.
7.50%, due 01/15/2009 | | | 2,000 | | | | 2,072 | | |
Dynegy Holdings, Inc.–144A
10.13%, due 07/15/2013 | | | 3,000 | | | | 3,300 | | |
Elwood Energy LLC
8.16%, due 07/05/2026 | | | 1,734 | | | | 1,925 | | |
Nevada Power Co., Series A
8.25%, due 06/01/2011 | | | 4,000 | | | | 4,400 | | |
NRG Energy, Inc.
8.00%, due 12/15/2013 | | | 1,931 | | | | 2,105 | | |
PSEG Energy Holdings LLC
7.75%, due 04/16/2007 | | | 3,000 | | | | 3,045 | | |
Reliant Energy, Inc.
6.75%, due 12/15/2014 | | | 2,000 | | | | 1,860 | | |
Texas Genco LLC/Texas Genco Financing
Corp.–144A
6.88%, due 12/15/2014 | | | 5,000 | | | | 5,350 | | |
The notes to the financial statements are an integral part of this report.
Transamerica IDEX Mutual Funds
Annual Report 2005
7
TA IDEX Transamerica High-Yield Bond
SCHEDULE OF INVESTMENTS (continued)
At October 31, 2005
(all amounts except share amounts in thousands)
| | | Principal | | Value | |
| Electric Services (continued) | |
Texas New Mexico Power Co.
6.13%, due 06/01/2008 | | $ | 3,000 | | | $ | 3,037 | | |
TXU Corp., Series O
4.80%, due 11/15/2009 | | | 3,000 | | | | 2,843 | | |
TXU Corp., Series P
5.55%, due 11/15/2014 | | | 4,000 | | | | 3,677 | | |
| Electronic Components & Accessories (0.6%) | |
Celestica, Inc.
7.88%, due 07/01/2011 | | | 1,450 | | | | 1,435 | | |
Flextronics International, Ltd.
6.50%, due 05/15/2013 | | | 1,000 | | | | 1,002 | | |
| Environmental Services (0.5%) | |
Allied Waste North America, Inc.
6.50%, due 11/15/2010 †
7.88%, due 04/15/2013 † | | | 1,000
1,000 | | | | 970
1,025 | | |
| Food & Kindred Products (0.7%) | |
Del Monte Corp.
8.63%, due 12/15/2012 | | | 3,000 | | | | 3,195 | | |
| Gas Production & Distribution (2.7%) | |
Colorado Interstate Gas Co.
5.95%, due 03/15/2015 | | | 3,500 | | | | 3,324 | | |
Dynegy-Roseton/Danskammer, Series 2001,
Class B
7.67%, due 11/08/2016 | | | 2,000 | | | | 1,970 | | |
Northwest Pipeline Corp.
8.13%, due 03/01/2010 | | | 2,000 | | | | 2,120 | | |
Williams Cos., Inc.
7.13%, due 09/01/2011
7.63%, due 07/15/2019 | | | 2,000
2,000 | | | | 2,062
2,120 | | |
| Health Services (4.9%) | |
Ameripath, Inc.
10.50%, due 04/01/2013 | | | 1,590 | | | | 1,654 | | |
Community Health Systems, Inc.
6.50%, due 12/15/2012 | | | 1,000 | | | | 990 | | |
Coventry Health Care, Inc.
5.88%, due 01/15/2012
6.13%, due 01/15/2015 | | | 1,750
2,250 | | | | 1,741
2,267 | | |
Extendicare Health Services, Inc.
6.88%, due 05/01/2014 | | | 3,000 | | | | 2,925 | | |
HCA, Inc.
6.95%, due 05/01/2012
6.38%, due 01/15/2015 † | | | 3,000
3,000 | | | | 3,056
2,944 | | |
Manor Care, Inc.
6.25%, due 05/01/2013 | | | 2,000 | | | | 2,060 | | |
Tenet Healthcare Corp.–144A
9.25%, due 02/01/2015 | | | 3,500 | | | | 3,316 | | |
| | | Principal | | Value | |
| Holding & Other Investment Offices (3.3%) | |
General Growth Properties, Inc.
5.61%, due 11/01/2007 | | $ | 1,773 | | | $ | 1,780 | | |
iStar Financial, Inc.
4.88%, due 01/15/2009 | | | 1,000 | | | | 983 | | |
Nell AF Sarl–144A
8.38%, due 08/15/2015 † | | | 2,000 | | | | 1,920 | | |
Simon Property Group, LP REIT
3.75%, due 01/30/2009 | | | 1,000 | | | | 960 | | |
Sungard Data Systems Inc.–144A
9.13%, due 08/15/2013
10.25%, due 08/15/2015 | | | 4,000
3,000 | | | | 4,060
2,974 | | |
Ventas Realty, LP/Ventas Capital Corp. REIT
6.63%, due 10/15/2014 | | | 1,500 | | | | 1,507 | | |
| Hotels & Other Lodging Places (4.2%) | |
Hilton Hotels Corp.
7.63%, due 12/01/2012 | | | 2,000 | | | | 2,122 | | |
Kerzner International, Ltd.–144A
6.75%, due 10/01/2015 | | | 3,000 | | | | 2,850 | | |
Las Vegas Sands Corp.
6.38%, due 02/15/2015 | | | 2,000 | | | | 1,895 | | |
Mandalay Resort Group
6.38%, due 12/15/2011 | | | 1,000 | | | | 988 | | |
MGM Mirage
6.00%, due 10/01/2009 | | | 2,500 | | | | 2,456 | | |
Station Casinos, Inc.
6.00%, due 04/01/2012
6.50%, due 02/01/2014
6.88%, due 03/01/2016 | | | 1,000
2,000
2,000 | | | | 983
1,995
2,015 | | |
Wynn Las Vegas LLC/Wynn Las Vegas
Capital Corp.
6.63%, due 12/01/2014 | | | 3,000 | | | | 2,858 | | |
| Industrial Machinery & Equipment (1.4%) | |
Case New Holland, Inc.
9.25%, due 08/01/2011 | | | 2,250 | | | | 2,368 | | |
Dresser-Rand Group–144A
7.38%, due 11/01/2014 | | | 2,643 | | | | 2,709 | | |
Terex Corp.
7.38%, due 01/15/2014 | | | 1,000 | | | | 995 | | |
| Instruments & Related Products (0.5%) | |
DirecTV Holdings LLC/DirecTV Financing Co.
8.38%, due 03/15/2013 | | | 2,000 | | | | 2,165 | | |
| Lumber & Other Building Materials (0.5%) | |
Builders Firstsource, Inc.–144A
8.04%, due 02/15/2012 * | | | 2,000 | | | | 2,010 | | |
The notes to the financial statements are an integral part of this report.
Transamerica IDEX Mutual Funds
Annual Report 2005
8
TA IDEX Transamerica High-Yield Bond
SCHEDULE OF INVESTMENTS (continued)
At October 31, 2005
(all amounts except share amounts in thousands)
| | | Principal | | Value | |
| Management Services (0.8%) | |
Corrections Corp. of America
7.50%, due 05/01/2011 | | $ | 1,000 | | | $ | 1,034 | | |
US Oncology, Inc.
10.75%, due 08/15/2014 | | | 2,000 | | | | 2,205 | | |
| Medical Instruments & Supplies (0.4%) | |
Bard (C.R.), Inc.
6.70%, due 12/01/2026 | | | 1,500 | | | | 1,676 | | |
| Metal Cans & Shipping Containers (1.0%) | |
Ball Corp.
6.88%, due 12/15/2012 | | | 3,000 | | | | 3,045 | | |
Crown European Holdings SA
10.88%, due 03/01/2013 | | | 1,000 | | | | 1,178 | | |
| Mining (0.2%) | |
Peabody Energy Corp.
6.88%, due 03/15/2013 | | | 1,000 | | | | 1,033 | | |
| Mortgage Bankers & Brokers (0.2%) | |
Crystal US Holdings 3 LLC/Crystal US Sub 3
Corp., Series A
0.00%, due 10/01/2014 (a) | | | 1,300 | | | | 913 | | |
| Motion Pictures (1.1%) | |
Liberty Media Corp.
8.25%, due 02/01/2030 † | | | 5,000 | | | | 4,690 | | |
| Motor Vehicles, Parts & Supplies (0.4%) | |
ArvinMeritor, Inc.–144A
8.13%, due 09/15/2015 | | | 452 | | | | 398 | | |
TRW Automotive, Inc.
11.00%, due 02/15/2013 | | | 1,300 | | | | 1,453 | | |
| Oil & Gas Extraction (4.3%) | |
Chesapeake Energy Corp.
7.50%, due 09/15/2013
6.38%, due 06/15/2015 | | | 1,000
3,000 | | | | 1,060
2,948 | | |
Forest Oil Corp.
8.00%, due 12/15/2011
7.75%, due 05/01/2014 | | | 500
1,000 | | | | 546
1,053 | | |
Kerr-McGee Corp.
7.00%, due 11/01/2011 | | | 1,370 | | | | 1,370 | | |
Newfield Exploration Co.
6.63%, due 09/01/2014 | | | 1,500 | | | | 1,526 | | |
Petroleum Geo-Services ASA
10.00%, due 11/05/2010 | | | 2,500 | | | | 2,763 | | |
Pride International, Inc.
7.38%, due 07/15/2014 | | | 2,000 | | | | 2,155 | | |
Whiting Petroleum Corp.–144A
7.00%, due 02/01/2014 | | | 5,000 | | | | 5,013 | | |
| | | Principal | | Value | |
| Paper & Allied Products (3.1%) | |
Cascades, Inc.
7.25%, due 02/15/2013 | | $ | 2,000 | | | $ | 1,780 | | |
Georgia-Pacific Corp.
8.88%, due 02/01/2010
7.70%, due 06/15/2015
7.75%, due 11/15/2029 | | | 1,000
3,000
4,000 | | | | 1,095
3,244
4,100 | | |
Graphic Packaging International Corp.
8.50%, due 08/15/2011 | | | 2,000 | | | | 1,930 | | |
Smurfit-Stone Container Corp.
8.38%, due 07/01/2012 | | | 1,000 | | | | 955 | | |
| Paper & Paper Products (0.9%) | |
Boise Cascade LLC
7.13%, due 10/15/2014 | | | 2,000 | | | | 1,780 | | |
MDP Acquisitions PLC
9.63%, due 10/01/2012 | | | 2,000 | | | | 1,920 | | |
| Paperboard Containers & Boxes (0.6%) | |
Jefferson Smurfit Corp.
7.50%, due 06/01/2013 | | | 2,000 | | | | 1,800 | | |
Jefferson Smurfit-Stone Container Corp.
8.25%, due 10/01/2012 | | | 1,000 | | | | 943 | | |
| Personal Services (0.5%) | |
Service Corp. International
7.70%, due 04/15/2009 | | | 2,000 | | | | 2,085 | | |
| Petroleum Refining (1.1%) | |
Giant Industries, Inc.
8.00%, due 05/15/2014 | | | 1,500 | | | | 1,553 | | |
Premcor Refining Group (The), Inc.
6.75%, due 02/01/2011
6.13%, due 05/01/2011 | | | 2,000
1,000 | | | | 2,115
1,026 | | |
| Pharmaceuticals (1.0%) | |
Elan Finance PLC/Elan Finance Corp.
7.75%, due 11/15/2011 | | | 3,000 | | | | 2,640 | | |
Leiner Health Products, Inc.
11.00%, due 06/01/2012 † | | | 2,000 | | | | 1,660 | | |
| Primary Metal Industries (1.4%) | |
International Steel Group, Inc.
6.50%, due 04/15/2014 | | | 1,000 | | | | 983 | | |
Novelis, Inc.–144A
7.25%, due 02/15/2015 | | | 3,500 | | | | 3,194 | | |
U.S. Steel Corp.
9.75%, due 05/15/2010 | | | 1,682 | | | | 1,833 | | |
| Printing & Publishing (3.6%) | |
American Color Graphics, Inc.
10.00%, due 06/15/2010 | | | 2,000 | | | | 1,325 | | |
The notes to the financial statements are an integral part of this report.
Transamerica IDEX Mutual Funds
Annual Report 2005
9
TA IDEX Transamerica High-Yield Bond
SCHEDULE OF INVESTMENTS (continued)
At October 31, 2005
(all amounts except share amounts in thousands)
| | | Principal | | Value | |
| Printing & Publishing (continued) | |
Dex Media East LLC/Dex Media East Finance Co.
9.88%, due 11/15/2009 | | $ | 1,000 | | | $ | 1,088 | | |
Dex Media West LLC/Dex Media Finance Co.,
Series B
8.50%, due 08/15/2010 | | | 2,000 | | | | 2,095 | | |
Dex Media, Inc.
8.00%, due 11/15/2013 | | | 1,000 | | | | 1,018 | | |
Houghton Mifflin Co.
9.88%, due 02/01/2013 † | | | 2,000 | | | | 2,065 | | |
Jostens IH Corp.
7.63%, due 10/01/2012 | | | 1,000 | | | | 985 | | |
Primedia, Inc.
8.88%, due 05/15/2011
8.00%, due 05/15/2013 | | | 2,000
2,500 | | | | 1,950
2,281 | | |
Quebecor World Capital Corp.
4.88%, due 11/15/2008 | | | 2,000 | | | | 1,872 | | |
Vertis, Inc.
10.88%, due 06/15/2009 † | | | 1,000 | | | | 930 | | |
| Radio & Television Broadcasting (0.9%) | |
Corus Entertainment, Inc.
8.75%, due 03/01/2012 | | | 2,005 | | | | 2,140 | | |
Videotron Ltee
6.88%, due 01/15/2014 | | | 1,500 | | | | 1,515 | | |
| Railroads (1.0%) | |
Progress Rail Services Corp./Progress Metal
Reclamation Co.–144A
7.75%, due 04/01/2012 | | | 4,000 | | | | 4,090 | | |
| Restaurants (1.0%) | |
Restaurant Co. (The)–144A
10.00%, due 10/01/2013 | | | 5,000 | | | | 4,400 | | |
| Rubber & Misc. Plastic Products (0.5%) | |
Jarden Corp.
5.09%, due 01/03/2011 | | | 1,985 | | | | 2,000 | | |
| Stone, Clay & Glass Products (1.5%) | |
Anchor Glass Container Corp., Series B
11.00%, due 02/15/2013 †v | | | 1,000 | | | | 635 | | |
Owens Brockway Glass Container, Inc.
7.75%, due 05/15/2011
8.75%, due 11/15/2012
6.75%, due 12/01/2014 | | | 1,000
1,000
2,000 | | | | 1,025
1,073
1,880 | | |
Owens-Illinois, Inc.
7.35%, due 05/15/2008 | | | 2,000 | | | | 2,000 | | |
| Telecommunications (7.1%) | |
AT&T Corp.
9.05%, due 11/15/2011 | | | 3,000 | | | | 3,315 | | |
| | | Principal | | Value | |
| Telecommunications (continued) | |
Citizens Communications Co.
6.25%, due 01/15/2013 | | $ | 2,000 | | | $ | 1,895 | | |
Hawaiian Telcom Communications, Inc.–144A
9.75%, due 05/01/2013 † | | | 4,500 | | | | 4,478 | | |
MCI, Inc.
5.91%, due 05/01/2007 | | | 4,000 | | | | 4,040 | | |
Nextel Communications, Inc., Series F
5.95%, due 03/15/2014 | | | 4,000 | | | | 4,012 | | |
Qwest Capital Funding, Inc.
7.00%, due 08/03/2009 †
7.90%, due 08/15/2010 † | | | 2,000
5,000 | | | | 1,960
4,975 | | |
Qwest Corp.
7.50%, due 06/15/2023 | | | 2,000 | | | | 1,880 | | |
Rogers Wireless Communications, Inc.
8.00%, due 12/15/2012 †
6.38%, due 03/01/2014 | | | 1,500
2,500 | | | | 1,586
2,494 | | |
| Tobacco Products (0.5%) | |
RJ Reynolds Tobacco Holdings, Inc.–144A
6.50%, due 07/15/2010 | | | 2,000 | | | | 1,965 | | |
| Transportation Equipment (1.0%) | |
Trinity Industries, Inc.
6.50%, due 03/15/2014 | | | 2,500 | | | | 2,438 | | |
Westinghouse Air Brake Co.
6.88%, due 07/31/2013 | | | 2,000 | | | | 2,040 | | |
| Trucking & Warehousing (0.4%) | |
Iron Mountain, Inc.
6.63%, due 01/01/2016 | | | 2,000 | | | | 1,840 | | |
| Water Transportation (0.8%) | |
Royal Caribbean Cruises, Ltd.
7.00%, due 10/15/2007
8.75%, due 02/02/2011 | | | 1,000
2,000 | | | | 1,030
2,230 | | |
| Total Corporate Debt Securities (cost: $408,570) | | | | | | | 405,456 | | |
| | | Shares | | Value | |
| PREFERRED STOCKS (0.5%) | |
| Holding & Other Investment Offices (0.5%) | |
| Duke Realty Corp. REIT (b) | | | 40,000 | | | $ | 2,008 | | |
| Total Preferred Stocks (cost: $2,008) | | | | | | | 2,008 | | |
| COMMON STOCKS (0.0%) | |
| Printing & Publishing (0.0%) | |
| Golden Books Family Entertainment, Inc. ‡ | | | 63,750 | | | | — | o | |
| Total Common Stocks (cost: $168) | | | | | | | — | | |
The notes to the financial statements are an integral part of this report.
Transamerica IDEX Mutual Funds
Annual Report 2005
10
TA IDEX Transamerica High-Yield Bond
SCHEDULE OF INVESTMENTS (continued)
At October 31, 2005
(all amounts except share amounts in thousands)
| | | Principal | | Value | |
| SECURITY LENDING COLLATERAL (12.9%) | |
| Debt (12.0%) | |
| Bank Notes (0.8%) | |
Bank of America
| |
| 3.81%, due 06/07/2006 * | | $ | 1,553 | | | $ | 1,553 | | |
| 3.81%, due 08/10/2006 * | | | 1,541 | | | | 1,541 | | |
Credit Suisse First Boston Corp.
4.11%, due 03/10/2006 * | | | 308 | | | | 308 | | |
| Certificates Of Deposit (0.9%) | |
Canadian Imperial Bank of Commerce
4.07%, due 11/04/2005 * | | | 1,233 | | | | 1,233 | | |
Harris Trust & Savings Bank
3.80%, due 11/04/2005 * | | | 981 | | | | 981 | | |
Rabobank Nederland
4.03%, due 05/31/2006 * | | | 1,541 | | | | 1,541 | | |
| Commercial Paper (2.6%) | |
Ciesco LLC
4.00%, due 11/03/2005 | | | 1,539 | | | | 1,539 | | |
General Electric Capital Corp.
3.96%, due 12/05/2005 | | | 1,233 | | | | 1,233 | | |
Paradigm Funding LLC–144A
4.01%, due 11/07/2005 | | | 1,229 | | | | 1,229 | | |
Park Avenue Receivables Corp.–144A
4.03%, due 12/02/2005 | | | 1,220 | | | | 1,220 | | |
Preferred Receivables Corp.–144A
4.04%, due 12/05/2005 | | | 924 | | | | 924 | | |
Ranger Funding Co. LLC–144A
3.99%, due 11/15/2005 | | | 917 | | | | 917 | | |
Sheffield Receivables Corp.–144A
4.01%, due 11/08/2005 | | | 924 | | | | 924 | | |
Yorktown Capital LLC
3.97%, due 11/09/2005
3.93%, due 11/17/2005 | | | 1,536
1,530 | | | | 1,536
1,530 | | |
| Euro Dollar Overnight (2.8%) | |
Bank of Montreal
3.79%, due 11/01/2005 | | | 925 | | | | 925 | | |
Barclays
3.80%, due 11/04/2005 | | | 1,233 | | | | 1,233 | | |
BNP Paribas
3.83%, due 11/02/2005 | | | 1,849 | | | | 1,849 | | |
Deutsche Bank
3.80%, due 11/02/2005 | | | 3,082 | | | | 3,082 | | |
HSBC Banking/Holdings PLC
3.84%, due 11/07/2005 | | | 925 | | | | 925 | | |
| | | Principal | | Value | |
| Euro Dollar Overnight (continued) | |
Royal Bank of Scotland
3.76%, due 11/01/2005 | | $ | 1,233 | | | $ | 1,233 | | |
Svenska Handlesbanken
4.03%, due 11/01/2005 | | | 1,587 | | | | 1,587 | | |
UBS AG
3.80%, due 11/03/2005 | | | 1,233 | | | | 1,233 | | |
| Euro Dollar Terms (1.0%) | |
Royal Bank of Scotland
4.00%, due 12/12/2005 | | | 1,233 | | | | 1,233 | | |
UBS AG
4.02%, due 12/01/2005 | | | 1,233 | | | | 1,233 | | |
Wells Fargo
3.96%, due 11/14/2005 | | | 1,849 | | | | 1,849 | | |
| Promissory Notes (0.3%) | |
Goldman Sachs Group, Inc.
4.02%, due 12/28/2005 | | | 1,294 | | | | 1,294 | | |
| Repurchase Agreements (3.6%) †† | |
Credit Suisse First Boston Corp.
2.10%, dated 10/31/2005 to be
repurchased at $2101 on 11/01/2005 | | | 2,100 | | | | 2,100 | | |
Goldman Sachs Group, Inc. (The)
4.10%, dated 10/31/2005 to be
repurchased at $5,240 on 11/01/2005 | | | 5,239 | | | | 5,239 | | |
Lehman Brothers, Inc.
4.10%, dated 10/31/2005 to be
repurchased at $145 on 11/01/2005 | | | 145 | | | | 145 | | |
Merrill Lynch & Co.
4.10%, date 10/31/2005 to be
repurchased at $6,164 on 11/01/2005 | | | 6,164 | | | | 6,164 | | |
Morgan Stanley Dean Witter & Co.
4.17%, dated 10/31/2005 to be
repurchased at $1,848 on 11/01/2005 | | | 1,848 | | | | 1,848 | | |
| | | Shares | | Value | |
| Investment Companies (0.9%) | |
| Money Market Funds (0.9%) | |
American Beacon Fund
1-day yield of 3.81% | | | 1,328,822 | | | $ | 1,329 | | |
Barclays Global Investors Institutional
Money Market Fund
1-day yield of 3.92% | | | 1,232,746 | | | | 1,233 | | |
Goldman Sachs Financial Square
Prime Obligations Fund
1-day yield of 3.79% | | | 192,022 | | | | 192 | | |
The notes to the financial statements are an integral part of this report.
Transamerica IDEX Mutual Funds
Annual Report 2005
11
TA IDEX Transamerica High-Yield Bond
SCHEDULE OF INVESTMENTS (continued)
At October 31, 2005
(all amounts except share amounts in thousands)
| | | Shares | | Value | |
| Money Market Funds (continued) | |
Merrimac Cash Fund, Premium Class
1-day yield of 3.70% @ | | | 1,219,122 | | | $ | 1,219 | | |
| Total Security Lending Collateral (cost: $55,354) | | | | | | | 55,354 | | |
| Total Investment Securities (cost: $468,888) | | | | | | $ | 465,682 | | |
| SUMMARY: | |
| Investment securities, at value | | | 108.3 | % | | $ | 465,682 | | |
| Liabilities in excess of other assets | | | (8.3 | )% | | | (35,596 | ) | |
| Net assets | | | 100.0 | % | | $ | 430,086 | | |
NOTES TO SCHEDULE OF INVESTMENTS:
† At October 31, 2005, all or a portion of this security is on loan (see Note 1). The value at October 31, 2005, of all securities on loan is $53,920.
o Value is less than $1.
* Floating or variable rate note. Rate is listed as of October 31, 2005.
‡ Non-income producing.
†† Cash collateral for the Repurchase Agreements, valued at $15,806, that serve as collateral for securities lending are invested in corporate bonds with interest rates and maturity dates ranging from 0.00%–9.86% and 12/31/2005–11/15/2096, respectively.
@ Regulated investment company advised by Investors Bank and Trust Co. ("IBT"). IBT is also the accounting, custody and lending agent for the Fund.
v Securities are currently in default on interest payments.
(a) Crystal US Holdings LLC/Crystal US Sub 3 Corp., Series A has a coupon rate of 0.00% until 10/01/2009, thereafter a coupon rate 10.00%.
(b) Duke Realty Corp. REIT has a coupon rate of 7.99% until 10/01/2012, thereafter the coupon rate will be 9.99%.
DEFINITIONS:
144A 144A Securities are registered pursuant to Rule 144A of the Securities Act of 1933. These securities are deemed to be liquid for purposes of compliance limitations on holdings of illiquid securities and may be resold as transactions exempt from registration, normally to qualified institutional buyers. At October 31, 2005, these securities aggregated $89,248 or 20.8% of the net assets of the Fund.
REIT Real Estate Investment Trust
The notes to the financial statements are an integral part of this report.
Transamerica IDEX Mutual Funds
Annual Report 2005
12
TA IDEX Transamerica High-Yield Bond
STATEMENT OF ASSETS AND LIABILITIES
At October 31, 2005
(all amounts except per share amounts in thousands)
| Assets: | |
Investment securities, at value (cost: $468,888)
(including securities loaned of $53,920) | | $ | 465,682 | | |
| Cash | | | 13,401 | | |
| Receivables: | |
| Investment securities sold | | | 2,134 | | |
| Shares of beneficial interest sold | | | 25 | | |
| Interest | | | 9,008 | | |
| Other | | | 23 | | |
| | | | 490,273 | | |
| Liabilities: | |
| Investment securities purchased | | | 4,304 | | |
| Accounts payable and accrued liabilities: | |
| Shares of beneficial interest redeemed | | | 75 | | |
| Management and advisory fees | | | 220 | | |
| Distribution and service fees | | | 146 | | |
| Transfer agent fees | | | 18 | | |
| Administration fees | | | 7 | | |
| Payable for collateral for securities on loan | | | 55,354 | | |
| Other | | | 63 | | |
| | | | 60,187 | | |
| Net Assets | | $ | 430,086 | | |
| Net Assets Consist of: | |
Shares of beneficial interest, unlimited shares
authorized, no par value | | $ | 441,086 | | |
| Accumulated net investment income (loss) | | | (803 | ) | |
Accumulated net realized gain (loss) from investment
securities | | | (6,989 | ) | |
Net unrealized appreciation (depreciation) on
investment securities | | | (3,208 | ) | |
| Net Assets | | $ | 430,086 | | |
| Net Assets by Class: | |
| Class A | | $ | 336,340 | | |
| Class B | | | 37,006 | | |
| Class C | | | 15,880 | | |
| Class I | | | 40,860 | | |
| Shares Outstanding: | |
| Class A | | | 37,502 | | |
| Class B | | | 4,127 | | |
| Class C | | | 1,773 | | |
| Class I | | | 4,529 | | |
| Net Asset Value Per Share: | |
| Class A | | $ | 8.97 | | |
| Class B | | | 8.97 | | |
| Class C | | | 8.96 | | |
| Class I | | | 9.02 | | |
| Maximum Offering Price Per Share (a): | |
| Class A | | $ | 9.42 | | |
(a) Includes the maximum selling commission (represented as a percentage of offering price) which is reduced on certain levels of sales as set forth in the Prospectus. Net asset value per share for Classes B, C and I shares represents offering price. The redemption price for Classes B and C shares equals net asset value less any applicable contingent deferred sales charge.
STATEMENT OF OPERATIONS
For the year ended October 31, 2005
(all amounts in thousands)
| Investment Income: | |
| Interest | | $ | 30,196 | | |
| Dividends | | | 160 | | |
| Income from loaned securities–net | | | 178 | | |
| | | | 30,534 | | |
| Expenses: | |
| Management and advisory fees | | | 2,574 | | |
| Distribution and service fees: | |
| Class A | | | 1,173 | | |
| Class B | | | 433 | | |
| Class C | | | 204 | | |
| Transfer agent fees: | |
| Class A | | | 95 | | |
| Class B | | | 73 | | |
| Class C | | | 35 | | |
| Class I | | | – | (b) | |
| Printing and shareholder reports | | | 37 | | |
| Custody fees | | | 69 | | |
| Administration fees | | | 83 | | |
| Legal fees | | | 29 | | |
| Audit fees | | | 27 | | |
| Trustees fees | | | 20 | | |
| Registration fees: | |
| Class A | | | 36 | | |
| Class B | | | 12 | | |
| Class C | | | 11 | | |
| Other | | | 7 | | |
| Total expenses | | | 4,918 | | |
| Net Investment Income (Loss) | | | 25,616 | | |
| Net Realized and Unrealized Gain (Loss): | |
| Realized gain (loss) from investment securities | | | 5,533 | | |
Increase (decrease) in unrealized appreciation
(depreciation) on investment securities | | | (23,007 | ) | |
| Net Gain (Loss) on Investment Securities | | | (17,474 | ) | |
Net Increase (Decrease) in Net Assets Resulting
from Operations | | $ | 8,142 | | |
(b) Rounds to less than $1.
The notes to the financial statements are an integral part of this report.
Transamerica IDEX Mutual Funds
Annual Report 2005
13
TA IDEX Transamerica High-Yield Bond
STATEMENTS OF CHANGES IN NET ASSETS
For the years ended
(all amounts in thousands)
| | | October 31,
2005 | | October 31,
2004 | |
| Increase (Decrease) In Net Assets From: | |
| Operations: | |
| Net investment income (loss) | | $ | 25,616 | | | $ | 19,795 | | |
Net realized gain (loss) from
investment securities | | | 5,533 | | | | 1,691 | | |
Net unrealized appreciation
(depreciation) on investment
securities | | | (23,007 | ) | | | 8,022 | | |
| | | | 8,142 | | | | 29,508 | | |
| Distributions to Shareholders: | |
| From net investment income: | |
| Class A | | | (21,465 | ) | | | (15,855 | ) | |
| Class B | | | (2,372 | ) | | | (2,484 | ) | |
| Class C | | | (1,112 | ) | | | (692 | ) | |
| Class C2 | | | – | | | | (457 | ) | |
| Class M | | | – | | | | (230 | ) | |
| Class I | | | (2,175 | ) | | | – | | |
| | | | (27,124 | ) | | | (19,718 | ) | |
| Capital Share Transactions: | |
| Proceeds from shares sold: | |
| Class A | | | 37,109 | | | | 123,099 | | |
| Class B | | | 3,673 | | | | 11,418 | | |
| Class C | | | 3,394 | | | | 6,907 | | |
| Class C2 | | | – | | | | 3,491 | | |
| Class M | | | – | | | | 1,288 | | |
| Class I | | | 40,302 | | | | – | | |
| | | | 84,478 | | | | 146,203 | | |
Dividends and distributions
reinvested: | |
| Class A | | | 20,851 | | | | 15,278 | | |
| Class B | | | 1,477 | | | | 1,364 | | |
| Class C | | | 630 | | | | 328 | | |
| Class C2 | | | – | | | | 139 | | |
| Class M | | | – | | | | 167 | | |
| Class I | | | 2,175 | | | | – | | |
| | | | 25,133 | | | | 17,276 | | |
| Cost of shares redeemed: | |
| Class A | | | (16,220 | ) | | | (30,327 | ) | |
| Class B | | | (15,678 | ) | | | (16,380 | ) | |
| Class C | | | (12,670 | ) | | | (6,611 | ) | |
| Class C2 | | | – | | | | (10,227 | ) | |
| Class M | | | – | | | | (2,569 | ) | |
| | | | (44,568 | ) | | | (66,114 | ) | |
| Redemption fees: | |
| Class B | | | 1 | | | | – | | |
| | | | 1 | | | | – | | |
| Class level exchanges: | |
| Class A | | | – | | | | 15,462 | | |
| Class B | | | – | | | | (10,695 | ) | |
| Class C | | | – | | | | (4,767 | ) | |
| | | | – | | | | – | | |
| | | October 31,
2005 | | October 31,
2004 | |
| Automatic conversions: | |
| Class A | | $ | 74 | | | $ | – | | |
| Class B | | | (74 | ) | | | – | | |
| | | | – | | | | – | | |
| | | | 65,044 | | | | 97,365 | | |
| Net increase (decrease) in net assets | | | 46,062 | | | | 107,155 | | |
| Net Assets: | |
| Beginning of year | | | 384,024 | | | | 276,869 | | |
| End of year | | $ | 430,086 | | | $ | 384,024 | | |
Accumulated Net Investment Income
(Loss) | | $ | (803 | ) | | $ | 844 | | |
| Share Activity: | |
| Shares issued: | |
| Class A | | | 3,986 | | | | 13,311 | | |
| Class B | | | 397 | | | | 1,243 | | |
| Class C | | | 366 | | | | 756 | | |
| Class C2 | | | – | | | | 377 | | |
| Class M | | | – | | | | 141 | | |
| Class I | | | 4,293 | | | | – | | |
| | | | 9,042 | | | | 15,828 | | |
Shares issued–reinvested from
distributions: | |
| Class A | | | 2,266 | | | | 1,673 | | |
| Class B | | | 161 | | | | 149 | | |
| Class C | | | 70 | | | | 36 | | |
| Class C2 | | | – | | | | 15 | | |
| Class M | | | – | | | | 18 | | |
| Class I | | | 236 | | | | – | | |
| | | | 2,733 | | | | 1,891 | | |
| Shares redeemed: | |
| Class A | | | (1,761 | ) | | | (3,306 | ) | |
| Class B | | | (1,700 | ) | | | (1,790 | ) | |
| Class C | | | (1,373 | ) | | | (722 | ) | |
| Class C2 | | | – | | | | (1,118 | ) | |
| Class M | | | – | | | | (280 | ) | |
| | | | (4,834 | ) | | | (7,216 | ) | |
| Class level exchanges: | |
| Class C | | | – | | | | 1,714 | | |
| Class C2 | | | – | | | | (1,199 | ) | |
| Class M | | | – | | | | (515 | ) | |
| | | | – | | | | – | | |
| Automatic conversions: | |
| Class A | | | 8 | | | | – | | |
| Class B | | | (8 | ) | | | – | | |
| | | | – | | | | – | | |
Net increase (decrease) in shares
outstanding: | |
| Class A | | | 4,499 | | | | 11,678 | | |
| Class B | | | (1,150 | ) | | | (398 | ) | |
| Class C | | | (937 | ) | | | 1,784 | | |
| Class C2 | | | – | | | | (1,925 | ) | |
| Class M | | | – | | | | (636 | ) | |
| Class I | | | 4,529 | | | | – | | |
| | | | 6,941 | | | | 10,503 | | |
The notes to the financial statements are an integral part of this report.
Transamerica IDEX Mutual Funds
Annual Report 2005
14
TA IDEX Transamerica High-Yield Bond
FINANCIAL HIGHLIGHTS
| | | | | For a share of beneficial interest outstanding throughout each period | |
| | | | | Net Asset | | Investment Operations | | Distributions | | Net Asset | |
| | | For the
Period
Ended (d)(g) | | Value,
Beginning
of Period | | Net
Investment
Income (Loss) | | Net Realized
and Unrealized
Gain (Loss) | | Total
Operations | | From Net
Investment
Income | | From Net
Realized
Gains | | Total
Distributions | | Value,
End
of Period | |
| Class A | | 10/31/2005 | | $ | 9.37 | | | $ | 0.56 | | | $ | (0.37 | ) | | $ | 0.19 | | | $ | (0.59 | ) | | $ | – | | | $ | (0.59 | ) | | $ | 8.97 | | |
| | | 10/31/2004 | | | 9.08 | | | | 0.52 | | | | 0.29 | | | | 0.81 | | | | (0.52 | ) | | | – | | | | (0.52 | ) | | | 9.37 | | |
| | | 10/31/2003 | | | 7.93 | | | | 0.57 | | | | 1.16 | | | | 1.73 | | | | (0.58 | ) | | | – | | | | (0.58 | ) | | | 9.08 | | |
| | | 10/31/2002 | | | 9.26 | | | | 0.57 | | | | (1.31 | ) | | | (0.74 | ) | | | (0.59 | ) | | | – | | | | (0.59 | ) | | | 7.93 | | |
| | | 10/31/2001 | | | 9.24 | | | | 0.72 | | | | 0.01 | | | | 0.73 | | | | (0.71 | ) | | | – | | | | (0.71 | ) | | | 9.26 | | |
| Class B | | 10/31/2005 | | | 9.37 | | | | 0.48 | | | | (0.37 | ) | | | 0.11 | | | | (0.51 | ) | | | – | | | | (0.51 | ) | | | 8.97 | | |
| | | 10/31/2004 | | | 9.08 | | | | 0.46 | | | | 0.29 | | | | 0.75 | | | | (0.46 | ) | | | – | | | | (0.46 | ) | | | 9.37 | | |
| | | 10/31/2003 | | | 7.93 | | | | 0.51 | | | | 1.17 | | | | 1.68 | | | | (0.53 | ) | | | – | | | | (0.53 | ) | | | 9.08 | | |
| | | 10/31/2002 | | | 9.26 | | | | 0.52 | | | | (1.32 | ) | | | (0.80 | ) | | | (0.53 | ) | | | – | | | | (0.53 | ) | | | 7.93 | | |
| | | 10/31/2001 | | | 9.24 | | | | 0.57 | | | | 0.10 | | | | 0.67 | | | | (0.65 | ) | | | – | | | | (0.65 | ) | | | 9.26 | | |
| Class C | | 10/31/2005 | | | 9.36 | | | | 0.47 | | | | (0.36 | ) | | | 0.11 | | | | (0.51 | ) | | | – | | | | (0.51 | ) | | | 8.96 | | |
| | | 10/31/2004 | | | 9.08 | | | | 0.46 | | | | 0.28 | | | | 0.74 | | | | (0.46 | ) | | | – | | | | (0.46 | ) | | | 9.36 | | |
| | | 10/31/2003 | | | 8.08 | | | | 0.51 | | | | 1.02 | | | | 1.53 | | | | (0.53 | ) | | | – | | | | (0.53 | ) | | | 9.08 | | |
| Class I | | 10/31/2005 | | | 9.39 | | | | 0.59 | | | | (0.37 | ) | | | 0.22 | | | | (0.59 | ) | | | – | | | | (0.59 | ) | | | 9.02 | | |
| | | | | | | Ratios/Supplemental Data | |
| | | For the
Period | | Total | | Net Assets,
End of
Period | | Ratio of Expenses
to Average
Net Assets (a) | | Net Investment
Income (Loss)
to Average | | Portfolio
Turnover | |
| | | Ended (g) | | Return (c) | | (000's) | | Net (e) | | Total (f) | | Net Assets (a) | | Rate (b) | |
| Class A | | 10/31/2005 | | | 2.06 | % | | $ | 336,340 | | | | 1.05 | % | | | 1.05 | % | | | 6.04 | % | | | 71 | % | |
| | | 10/31/2004 | | | 9.23 | | | | 309,223 | | | | 1.08 | | | | 1.08 | | | | 5.67 | | | | 49 | | |
| | | 10/31/2003 | | | 22.74 | | | | 193,708 | | | | 1.22 | | | | 1.22 | | | | 6.57 | | | | 46 | | |
| | | 10/31/2002 | | | (8.48 | ) | | | 60,332 | | | | 1.35 | | | | 1.35 | | | | 6.61 | | | | 64 | | |
| | | 10/31/2001 | | | 8.12 | | | | 50,755 | | | | 1.41 | | | | 1.41 | | | | 7.35 | | | | 16 | | |
| Class B | | 10/31/2005 | | | 1.21 | | | | 37,006 | | | | 1.85 | | | | 1.85 | | | | 5.18 | | | | 71 | | |
| | | 10/31/2004 | | | 8.52 | | | | 49,422 | | | | 1.72 | | | | 1.72 | | | | 5.05 | | | | 49 | | |
| | | 10/31/2003 | | | 21.94 | | | | 51,511 | | | | 1.87 | | | | 1.87 | | | | 5.92 | | | | 46 | | |
| | | 10/31/2002 | | | (9.03 | ) | | | 31,336 | | | | 2.00 | | | | 2.00 | | | | 5.96 | | | | 64 | | |
| | | 10/31/2001 | | | 7.45 | | | | 35,471 | | | | 2.06 | | | | 2.06 | | | | 6.70 | | | | 16 | | |
| Class C | | 10/31/2005 | | | 1.21 | | | | 15,880 | | | | 1.88 | | | | 1.88 | | | | 5.11 | | | | 71 | | |
| | | 10/31/2004 | | | 8.41 | | | | 25,379 | | | | 1.78 | | | | 1.78 | | | | 4.95 | | | | 49 | | |
| | | 10/31/2003 | | | 19.52 | | | | 8,403 | | | | 1.87 | | | | 1.87 | | | | 5.92 | | | | 46 | | |
| Class I | | 10/31/2005 | | | 2.33 | | | | 40,860 | | | | 0.66 | | | | 0.66 | | | | 6.60 | | | | 71 | | |
NOTES TO FINANCIAL HIGHLIGHTS
(a) Annualized.
(b) Not annualized.
(c) Total Return has been calculated for the applicable period without deduction of a sales load, if any, on an initial purchase. Periods of less than one year are not annualized.
(d) Per share information is calculated based on average number of shares outstanding.
(e) Ratio of Net Expenses to Average Net Assets is net of fee waivers and reimbursements by the investment adviser, if any (see note 2).
(f) Ratio of Total Expenses to Average Net Assets includes all expenses before fee waivers and reimbursements by the investment adviser.
(g) The inception date for the Fund's offering of share classes are as follows:
Class C – November 11, 2002
Class I – November 8, 2004
The notes to the financial statements are an integral part of this report.
Transamerica IDEX Mutual Funds
Annual Report 2005
15
TA IDEX Transamerica High-Yield Bond
NOTES TO FINANCIAL STATEMENTS
At October 31, 2005
(all amounts in thousands)
NOTE 1. ORGANIZATION AND SIGNIFICANT ACCOUNTING POLICIES
Transamerica IDEX Mutual Funds is an open-end management investment company registered under the Investment Company Act of 1940, as amended (the "1940 Act").
In the normal course of business, TA IDEX Transamerica High-Yield Bond (the "Fund") enters into contracts that contain a variety of representations that provide general indemnifications. The Fund's maximum exposure under these arrangements is unknown, as this would involve future claims that may be made against the Fund and/or its affiliates that have not yet occurred. However, based on experience, the Fund expects the risk of loss to be remote.
Effective August 1, 2005, TA IDEX Transamerica Conservative High-Yield Bond changed its name to TA IDEX Transamerica High-Yield Bond.
This report should be read in conjunction with the current Fund prospectus, which contains more complete information about the Fund.
The following is a summary of significant accounting policies followed by the Fund in the preparation of the financial statements. In preparing the Fund's financial statements in accordance with accounting principles generally accepted in the United States of America ("GAAP"), estimates or assumptions (which could differ from actual results) may be used that affect reported amounts and disclosures.
Multiple class operations, income and expenses: The Fund currently offers four classes of shares, each with a public offering price that reflects different sales charges, if any, and expense levels. On June 15, 2004, Class C2 shares merged into Class C. On September 24, 2004, Class M shares merged into Class C. Class B shares will convert to Class A shares eight years after purchase. Income, non-class specific expenses and realized and unrealized gains and losses, are allocated daily to each class, based upon the value of shares outstanding method as permitted under Rule 18f-3 of the 1940 Act. Each class bears its own specific expenses as well as a portion of general common expenses.
Class I shares are offered for investment to the asset allocation funds of AEGON/Transamerica Series Trust (ATST).
Security valuations: The Fund values its investments at the close of the New York Stock Exchange ("NYSE"), normally 4 p.m. ET, each day the NYSE is open for business. Fund investments are valued at the last sale price or closing price on the day of valuation taken from the primary exchange where the security is principally traded.
Securities traded in the over-the-counter market and listed securities for which no sale was reported on that date are valued at the last quoted bid price.
Debt securities are valued based on a price quotation or other equivalent indication of value supplied by an exchange, a pricing service or a major market maker; however, those that mature in sixty days or less are valued at amortized cost, which approximates market.
Investment company securities are valued at the net asset value of the underlying portfolio.
Other securities for which quotations are not readily available or whose values have been determined to be unreliable are valued at fair market value as determined in good faith by the Fund's Administrative Valuation Committee, under the supervision of the Board's Valuation Committee, using guidelines adopted by the Board of Trustees.
Cash: The Fund may leave cash overnight in its cash account with the custodian, Investors Bank & Trust Company ("IBT"). IBT has been contracted on behalf of the Fund to invest the excess cash into a savings account, which at October 31, 2005, was paying an interest rate of 2.76%.
Repurchase agreements: The Fund is authorized to enter into repurchase agreements. The Fund, through its custodian, IBT, receives delivery of the underlying securities, the value of which at the time of purchase is required to be an amount equal to at least 100% of the resale price. The Fund will bear the risk of value fluctuations until the security can be sold and may encounter delays and incur costs in liquidating the security. In the event of bankruptcy or insolvency of the seller, delays and costs may be incurred.
Securities lending: The Fund may lend securities to qualified borrowers, with IBT acting as the Fund's lending agent. The Fund earns negotiated lenders' fees. The Fund receives cash and/or securities as collateral against the loaned securities. Cash collateral received is invested in short term, interest bearing securities. The Fund monitors the market value of securities loaned on a daily basis and requires collateral in an amount at least equal to the value of the securities loaned. Income from loaned securities on the Statement of Operations is net of fees, in the amount of $76, earned by IBT for its services.
Real Estate Investment Trusts ("REITs"): There are certain additional risks involved in investing in REITs. These include, but are not limited to, economic conditions, changes in zoning laws, real estate values, property taxes and interest rates.
Dividend income is recorded at management's estimate of the income included in distributions from the REIT investments. Distributions received in excess of the estimated amount are recorded as a reduction of the cost of investments. The actual amounts of income, return of capital and capital gains are only determined by each REIT after the fiscal year end and may differ from the estimated amounts.
Security transactions and investment income: Security transactions are recorded on the trade date. Security gains and losses are calculated on the specific identification basis. Dividend income, if any, is recorded on the ex-dividend date or, in the case of foreign securities, as soon as the Fund is informed of the ex-dividend date. Interest income, including accretion of discounts and amortization of premiums, is recorded on the accrual basis commencing on the settlement date.
Transamerica IDEX Mutual Funds
Annual Report 2005
16
TA IDEX Transamerica High-Yield Bond
NOTES TO FINANCIAL STATEMENTS (continued)
At October 31, 2005
(all amounts in thousands)
NOTE 1.–(continued)
Redemption fees: A short-term trading redemption fee may be assessed on any Fund shares in a fund account that are sold during the first five (5) NYSE trading days following their purchase date. This redemption fee will equal 2% of the amount redeemed and shares held the longest will be treated as being redeemed first and shares held the shortest as being redeemed last. For the year ended October 31, 2005, the Fund received $1 in redemption fees.
Dividend distributions: Distributions to shareholders are recorded on the ex-dividend date and are determined in accordance with Federal income tax regulations which may differ from GAAP.
NOTE 2. RELATED PARTY TRANSACTIONS
Effective January 1, 2005 AEGON/Transamerica Fund Advisors, Inc. was renamed Transamerica Fund Advisors, Inc. ("TFAI"); AEGON/Transamerica Fund Services, Inc. and AEGON/Transamerica Investor Services, Inc. merged into one entity and was renamed Transamerica Fund Services, Inc. ("TFS").
TFAI is the Fund's investment adviser. TFS is the Fund's administrator and transfer agent. AFSG Securities Corp. ("AFSG") is the Fund's distributor/principal underwriter. TFAI, TFS , and AFSG are affiliates of AEGON, NV, a Netherlands corporation.
AEGON USA Investment Management, Inc. is both the sub-adviser to the Fund and an affiliate of the Fund.
The following schedule reflects the percentage of Fund assets owned by affiliated mutual funds:
| | | Net
Assets | | % of
Net Assets | |
TA IDEX Asset Allocation–
Conservative Portfolio | | $ | 63,823 | | | | 14.84 | % | |
TA IDEX Asset Allocation–
Moderate Growth Portfolio | | | 96,956 | | | | 22.54 | % | |
TA IDEX Asset Allocation–
Moderate Portfolio | | | 139,524 | | | | 32.44 | % | |
Asset Allocation–Moderate
Growth Portfolio | | | 26,221 | | | | 6.10 | % | |
| Asset Allocation–Moderate Portfolio | | | 14,628 | | | | 3.40 | % | |
| Total | | $ | 341,152 | | | | 79.32 | % | |
Investment advisory fees: The Fund pays management fees to TFAI based on average daily net assets ("ANA") at the following breakpoints:
From November 1, 2004 to December 31, 2004:
0.60% of ANA
From January 1, 2005 on:
0.60% of the first $400 million of ANA
0.575% of the next $350 million of ANA
0.55% of ANA over $750 million
TFAI has contractually agreed to waive its advisory fee and will reimburse the Fund to the extent that operating expenses, excluding 12b-1 fees, exceed the following stated annual limit:
1.25% Expense Limit–Classes A, B and C
0.80% Expense Limit–Class I
Distribution and service fees: The Fund has a 12b-1 distribution plan under the 1940 Act pursuant to which an annual fee, based on average daily net assets, is paid to the distributor for various disbursements such as broker-dealer account servicing fees and other promotional expenses of the Fund. The Fund is authorized under the 12b-1 plan to pay fees on each class up to the following limits:
| Class A | | | 0.35 | % | |
| Class B | | | 1.00 | % | |
| Class C | | | 1.00 | % | |
| Class I | | | N/A | | |
In the case the Fund or a class of shares of the Fund is closed to new investors or investments, the Fund is authorized to pay 12b-1 fees for past sales and distribution efforts and present and past investor services.
Underwriter commissions relate to front-end sales charges imposed for Class A shares and contingent deferred sales charges from Classes B, C, and certain A share redemptions. For the year ended October 31, 2005, the underwriter commissions were as follows:
| Received by Underwriter | | $ | 221 | | |
| Retained by Underwriter | | | 18 | | |
| Contingent Deferred Sales Charge | | | 205 | | |
Administrative services: The Fund has entered into an agreement with TFS for financial and legal fund administration services. As of January 1, 2005 the Fund pays TFS an annual fee of 0.02% of ANA. Prior to January 1, 2005 the Fund paid TFS an annual fee of 0.015% of ANA. The Legal fees on the Statement of Operations are for fees paid to external legal counsel.
Transfer agent fees: The Fund pays TFS an annual per-account charge for each open and closed account. The Fund paid TFS $191 for the year ended October 31, 2005.
Deferred compensation plan: Each eligible independent Fund Trustee may elect to participate in a non-qualified deferred compensation plan
Transamerica IDEX Mutual Funds
Annual Report 2005
17
TA IDEX Transamerica High-Yield Bond
NOTES TO FINANCIAL STATEMENTS (continued)
At October 31, 2005
(all amounts in thousands)
NOTE 2.–(continued)
maintained by Transamerica IDEX Mutual Funds (the "Plan"). Under the Plan, such Trustees may defer payment of all or a portion of their total fees earned as a Fund Trustee. Each Trustee who is a participant in the Plan may elect that the earnings, losses or gains credited to his or her deferred fee amounts be determined based on a deemed investment in any series of Transamerica IDEX Mutual Funds, including the Fund. The right of a participant to receive a distribution from the Plan of the deferred fees is an unsecured claim against the general assets of all series of Transamerica IDEX Mutual Funds. The pro rata liability to the Fund of all deferred fees in the Plan amounted, as of October 31, 2005, to $23.
NOTE 3. INVESTMENT TRANSACTIONS
The cost of securities purchased and proceeds from securities sold (excluding short-term securities) for the year ended October 31, 2005, were as follows:
| Purchases of securities: | |
| Long-Term | | $ | 335,619 | | |
| U.S. Government | | | 7,309 | | |
| Proceeds from maturities and sales of securities: | |
| Long-Term | | | 279,261 | | |
| U.S. Government | | | 9,351 | | |
NOTE 4. FEDERAL INCOME TAX MATTERS
The Fund has not made any provision for federal income or excise taxes due to its policy to distribute all of its taxable income and capital gains to its shareholders and otherwise qualify as a regulated investment company under Subchapter M of the Internal Revenue Code. Income and capital gain distributions are determined in accordance with income tax regulations, which may differ from GAAP. These differences are primarily due to differing treatment for items including, but not limited to, wash sales and capital loss carryforwards.
Therefore, distributions determined in accordance with tax regulations may differ significantly in amount or character from net investment income and realized gains for financial reporting purposes. Financial reporting records are adjusted for permanent book/tax differences to reflect tax character. Financial records are not adjusted for temporary differences. These reclassifications are as follows:
Shares of beneficial interest, unlimited
shares authorized | | $ | (45 | ) | |
| Accumulated net investment income (loss) | | | (139 | ) | |
Accumulated net realized gain (loss) from investment
securities | | | 184 | | |
The capital loss carryforwards are available to offset future realized capital gains through the periods listed:
Capital Loss
Carryforward | | Available Through | |
| $ | 1,624 | | | October 31, 2010 | |
| | 5,283 | | | October 31, 2011 | |
The capital loss carryforward utilized during the year ended October 31, 2005 was $5,713.
The tax character of distributions paid may differ from the character of distributions shown in the Statement of Changes in Net Assets due to short-term gains being treated as ordinary income for tax purposes. The tax character of distributions paid during 2004 and 2005 was as follows:
| 2004 Distributions paid from: | |
| Ordinary Income | | $ | 19,718 | | |
| Long-term Capital Gain | | | – | | |
| 2005 Distributions paid from: | |
| Ordinary Income | | | 27,124 | | |
| Long-term Capital Gain | | | – | | |
The tax basis components of distributable earnings as of October 31, 2005, are as follows:
| Undistributed Ordinary Income | | $ | — | | |
| Undistributed Long-term Capital Gains | | $ | — | | |
| Capital Loss Carryforward | | $ | (6,907 | ) | |
| Net Unrealized Appreciation (Depreciation) | | $ | (3,290 | )* | |
*Amount includes unrealized appreciation (depreciation) from deferred compensation.
The aggregate cost of investments and composition of unrealized appreciation (depreciation) for federal income tax purposes as of October 31, 2005, are as follows:
| Federal Tax Cost Basis | | $ | 468,970 | | |
| Unrealized Appreciation | | $ | 7,771 | | |
| Unrealized (Depreciation) | | | (11,847 | ) | |
| Net Unrealized Appreciation (Depreciation) | | $ | (3,288 | ) | |
NOTE 5. REGULATORY PROCEEDINGS
There continues to be significant federal and state regulatory activity relating to financial services companies, particularly mutual fund companies and their investment advisers. As part of an ongoing investigation regarding potential market timing, recordkeeping and trading compliance issues and matters affecting the Fund's investment adviser, TFAI, and certain affiliates and former employees of TFAI, the SEC staff has indicated that it is likely to take some action against TFAI and certain of its affiliates at the conclusion of the investigation. The potential
Transamerica IDEX Mutual Funds
Annual Report 2005
18
TA IDEX Transamerica High-Yield Bond
NOTES TO FINANCIAL STATEMENTS (continued)
At October 31, 2005
(all amounts in thousands)
NOTE 5.–(continued)
timing and the scope of any such action is difficult to predict. Although the impact of any action brought against TFAI and/or its affiliates is difficult to assess at the present time, the Fund currently believes that the likelihood that any such action will have a material adverse impact on it is remote. It is important to note that the Fund is not aware of any allegation of wrongdoing against it and its Board at the time this annual report is printed. Although it is not anticipated that these developments will have an adverse impact on the Fund, there can be no assurance at this time. TFAI and its affiliates are actively working with the SEC in regard to this matter; however, the exact resolution cannot be determined at this time. TFAI will take such actions that it deems necessary or appropriate to continue providing management services to the Fund and to bring all matters to an appropriate conclusion.
TFAI and/or its affiliates, and not the Fund, will bear the costs regarding these regulatory matters.
NOTE 6. SUBSEQUENT EVENT (unaudited)
Effective November 7, 2005, the Expense Limit for the Fund's Class I shares is 1.25%.
Transamerica IDEX Mutual Funds
Annual Report 2005
19
Report of Independent Registered Certified Public Accounting Firm
To the Board of Trustees and Shareholders of
TA IDEX Transamerica High-Yield Bond
In our opinion, the accompanying statement of assets and liabilities, including the schedule of investments, and the related statements of operations and of changes in net assets and the financial highlights present fairly, in all material respects, the financial position of TA IDEX Transamerica High-Yield Bond (the "Fund") (one of the portfolios constituting the Transamerica IDEX Mutual Funds) at October 31, 2005, the results of its operations for the year then ended, the changes in its net assets for each of the two years in the period then ended and the financial highlights for each of the periods presented, in conformity with accounting principles generally accepted in the United States of America. These financial statements and financial highlights (hereafter referred to as "financial statements") are the responsibility of the Fund's management; our responsibility is to express an opinion on these financial statements based on our audits. We conducted our audits of these financial statements in accordance with the standards of the Public Company Accounting Oversight Board (United States). Those standards require that we plan and perform the audit to obtain reasonable assurance about whether the financial statements are free of material misstatement. An audit includes examining, on a test basis, evidence supporting the amounts and disclosures in the financial statements, assessing the accounting principles used and significant estimates made by management, and evaluating the overall financial statement presentation. We believe that our audits, which included confirmation of securities at October 31, 2005 by correspondence with the custodian and brokers, provide a reasonable basis for our opinion.

December 22, 2005
Transamerica IDEX Mutual Funds
Annual Report 2005
20
TA IDEX Transamerica High-Yield Bond
SUPPLEMENTAL INFORMATION (unaudited)
TAX INFORMATION
For corporate shareholders, 0.03% of investment income (dividend income plus short-term gains, if any) qualifies for the dividends received deduction.
The information and distributions reported herein may differ from the information and distributions taxable to the shareholders for the calendar year ending December 31, 2005. Complete information will be computed and reported in conjunction with your 2005 Form 1099-DIV.
Transamerica IDEX Mutual Funds
Annual Report 2005
21
TA IDEX Transamerica Convertible Securities
MARKET ENVIRONMENT
For the twelve months ended October 31, 2005, the Merrill Lynch All U.S. Convertibles Index ("MLCI") rose 4.50% but, like U.S. equity markets, followed an uneven path to its gains. In the initial months of the period, convertibles advanced as evidence of economic growth firmed, oil prices that began rising in mid-2004 receded, and corporate earnings remained strong. While gross domestic product continued to grow in early 2005, other factors – higher energy prices, interest rates, inconsistent job growth data and uncertainty about long-term inflation trends – gave investors pause. The MLCI retreated, only to rebound in late spring, in spite of sharply higher energy prices and a mid-cycle slowdown in the U.S. economy. Performance remained generally positive through the summer and early fall as convertibles, which are highly sensitive to the direction of equities, followed stocks to higher levels. Powering the advances in both markets was the energy sector, far and away the markets' leading area.
PERFORMANCE
For the year ended October 31, 2005, TA IDEX Transamerica Convertibles Securities, Class A returned 9.24%. By comparison its benchmark, the MLCI, returned 4.50%.
STRATEGY REVIEW
We seek the convertibles of companies that stand to benefit from positive changes in the company, its industry, or the external forces driving its business; generate free cash flow; and prudently reinvest to enhance shareholder value. For example, recognizing that the sharp rise in oil and natural gas prices were part of a structural change in the energy industry, we increased the portfolio's investments in oil and gas companies. This greater weighting, combined with excellent results for holdings like Halliburton Company ("Halliburton"), Schlumberger Limited ("Schlumberger"), Chesapeake Energy Corporation ("Chesapeake") and Quicksilver Resources Inc. ("Quicksilver"), was a major reason for the portfolio's outperformance versus the MLCI. Halliburton is an energy exploration and servicing company; Schlumberger also provides services for energy exploration; Chesapeake is a natural gas provider; and Quick silver is an energy exploration and production company.
Another area of strength for the portfolio was telecommunications and technology, where holdings in Nextel Partners, Inc. ("Nextel Partners") augmented performance. Nextel Partners, a domestic wireless phone company holds an option to force Sprint to buy the company as part of their Nextel acquisition. This gain compensated for several poorly performing holdings in the portfolio: most notably, Tyco International, Ltd. ("Tyco"), a diversified industrial manufacturer; and Overstock.com ("Overstock"), a discount retail web site. We maintained our investment in Tyco, which has good cash flow characteristics but has languished as momentum investors have sold their holdings. We believe the company still has considerable potential.
Conversely, we are losing our confidence in Overstock, where senior management has, in our view, done a questionable job of managing investment community expectations. In addition, we anticipate a deceleration in consumer spending that may be detrimental to Overstock.
Kirk J.Kim, CFA
Fund Manager
Transamerica Investment Management, LLC
Transamerica IDEX Mutual Funds
Annual Report 2005
1
TA IDEX Transamerica Convertible Securities
Comparison of change in value of $10,000 investment in Class A shares and its comparative index.

Average Annual Total Return for Periods Ended 10/31/05
| | | 1 year | | From
Inception | | Inception
Date | |
| Class A (NAV) | | | 9.24 | % | | | 8.87 | % | | 3/1/02 | |
| Class A (POP) | | | 4.05 | % | | | 7.43 | % | | 3/1/02 | |
| MLCI1 | | | 4.50 | % | | | 7.66 | % | | 3/1/02 | |
| Class B (NAV) | | | 8.09 | % | | | 8.10 | % | | 3/1/02 | |
| Class B (POP) | | | 3.09 | % | | | 7.66 | % | | 3/1/02 | |
| Class C (NAV) | | | 8.17 | % | | | 12.29 | % | | 11/11/02 | |
| Class C (POP) | | | 7.17 | % | | | 12.29 | % | | 11/11/02 | |
NOTES
1 The Merrill Lynch All U.S. Convertibles (MLCI) Index is an unmanaged index used as a general measure of market performance. Calculations assume dividends and capital gains are reinvested and do not include any managerial expenses. From inception calculation is based on life of Class A shares. Source: Standard & Poor's Micropal®© Micropal, Inc. 2005 – 1-800-596-5323 – http://www.funds-sp.com.
The performance data presented represents past performance, future results may vary. Performance data does not reflect the deduction of taxes that would be paid on fund distributions or the redemption of fund shares. Investment return and principal value will fluctuate so that an investor's shares, when redeemed, may be worth more or less than their original cost. Current performance may be lower or higher than performance quoted. Please see www.transamericaidex.com for performance data current to the most recent month-end.
Public Offering Price (POP) returns include the reinvestment of dividends and capital gains and reflect the maximum sales charge of 4.75% for A shares or the maximum applicable contingent deferred sales charge (5% in the 1st year, decreasing to 0% after 6 years) for Class B shares and 1% (during the first 12 months) for Class C shares. Shares purchased prior to March 1, 2004 are subject to a maximum applicable contingent deferred sales charge (5% in the 1st year, decreasing to 0% after 7 years) for Class B shares and (2% in the 1st year, decreasing to 0% after 2 years) for Class C shares. Net Asset Value (NAV) returns include the reinvestment of dividends and capital gains but do not reflect any sales charges.
This material must be preceded or accompanied by a current prospectus, which includes specific contents regarding the investment objectives and policies of this fund.
Transamerica IDEX Mutual Funds
Annual Report 2005
2
TA IDEX Transamerica Convertible Securities
UNDERSTANDING YOUR FUND'S EXPENSES
(unaudited)
SHAREHOLDER EXPENSES
Fund shareholders may incur two types of costs: (1) transaction costs, including sales charges (loads) on purchases, contingent deferred sales charges on redemptions and redemption fees; and (2) ongoing costs, including management fees, 12b-1 distribution and service fees, and other fund expenses.
The following Example is intended to help you understand your ongoing costs (in dollars and cents) of investing in a Fund and to compare these costs with the ongoing costs of investing in other funds.
The Example is based on an investment of $1,000 invested at May 1, 2005 and held for the entire period until October 31, 2005.
ACTUAL EXPENSES
The first line in the table below provides information about actual account values and actual expenses. You may use the information in this line, together with the amount you invested, to estimate the expenses that you paid over the period. Simply divide your account value by $1,000 (for example, an $8,600 account value divided by $1,000 = 8.6), then multiply the result by the number in the first line of your Fund under the heading entitled "Expenses Paid During Period" to estimate the expenses you paid on your account during this period. If your account is an IRA, your expenses could have included a $15 annual fee. The amount of any fee paid through your account would increase the estimate of expenses you paid during the period and decrease your ending account value.
HYPOTHETICAL EXAMPLE FOR COMPARISON PURPOSES
The second line in the table below provides information about hypothetical account values and hypothetical expenses based on the Fund's actual expense ratio and an assumed rate of return of 5% per year before expenses, which is not the Fund's actual return. The hypothetical account values and expenses may not be used to estimate the actual ending account balance or expenses you paid for the period. You may use this information to compare the ongoing costs of investing in your Fund and other funds. To do so, compare this 5% hypothetical example with the 5% hypothetical examples that appear in the shareholder reports of the other funds. As in the case of the actual expense example, if your account is subject to an IRA fee, the amount of the fee paid through your account would increase the hypothetical expenses you would have paid during the period and decrease the hypothetical ending account value.
Please note that the expenses shown in the table are meant to highlight your ongoing costs only and do not reflect any transactional costs, such as sales charges, redemption fees, brokerage commissions paid on purchases and sales of fund shares. Therefore, the second line under the Fund in the table is useful in comparing ongoing costs only, and will not help you determine the relative total costs of owning different funds. If any of these transaction costs were included, your costs would be higher. The expenses shown in the table do not reflect any fees that may be charged to you by brokers, financial intermediaries or other financial institutions.
| | | Beginning
Account
Value | | Ending
Account
Value | | Annualized
Expense
Ratio | | Expenses Paid
During Period (a) | |
| Class A | | | |
| Actual | | $ | 1,000.00 | | | $ | 1,093.30 | | | | 1.18 | % | | $ | 6.23 | | |
| Hypothetical (b) | | | 1,000.00 | | | | 1,019.26 | | | | 1.18 | | | | 6.01 | | |
| Class B | | | |
| Actual | | | 1,000.00 | | | | 1,087.90 | | | | 2.24 | | | | 11.79 | | |
| Hypothetical (b) | | | 1,000.00 | | | | 1,013.91 | | | | 2.24 | | | | 11.37 | | |
| Class C | | | |
| Actual | | | 1,000.00 | | | | 1,089.00 | | | | 2.02 | | | | 10.64 | | |
| Hypothetical (b) | | | 1,000.00 | | | | 1,015.02 | | | | 2.02 | | | | 10.26 | | |
(a) Expenses are calculated using each Fund's annualized expense ratio (as disclosed in the table), multiplied by the average account value for the period, multiplied by number of days in the period (184 days), and divided by the number of days in the year (365 days).
(b) 5% return per year before expenses.
GRAPHIC PRESENTATION OF SCHEDULE OF INVESTMENTS
By Sector
At October 31, 2005

This chart shows the percentage breakdown by sector of the Fund's total investment securities.
Transamerica IDEX Mutual Funds
Annual Report 2005
3
TA IDEX Transamerica Convertible Securities
SCHEDULE OF INVESTMENTS
At October 31, 2005
(all amounts except share amounts in thousands)
| | | Principal | | Value | |
| CORPORATE DEBT SECURITIES (1.3%) | |
| Mortgage Bankers & Brokers (1.3%) | |
Virgin River Casino Corp.–144A
0.25%, due 01/15/2013 (a) | | $ | 4,000 | | | $ | 2,840 | | |
| Total Corporate Debt Securities (cost: $2,694) | | | | | | | 2,840 | | |
| CONVERTIBLE BONDS (86.6%) | |
| Commercial Banks (13.7%) | |
Bank of America Corp.
0.25%, due 04/30/2014 | | | 2,750 | | | | 3,847 | | |
Euronet Worldwide, Inc.–144A
3.50%, due 10/15/2025 | | | 5,000 | | | | 4,881 | | |
Tiers Trust, United States–144A
0.25%, due 10/22/2012 | | | 8,000 | | | | 8,735 | | |
Wachovia Corp.–144A
0.25%, due 03/01/2013 | | | 7,500 | | | | 7,195 | | |
Wells Fargo & Co.
0.25%, due 04/29/2014 | | | 5,000 | | | | 5,662 | | |
| Communication (4.4%) | |
American Tower Corp.
3.00%, due 08/15/2012 † | | | 2,150 | | | | 2,808 | | |
XM Satellite Radio Holdings, Inc., Senior Note
1.75%, due 12/01/2009 | | | 4,000 | | | | 3,455 | | |
XM Satellite Radio, Inc.–144A
1.75%, due 12/01/2009 | | | 4,000 | | | | 3,455 | | |
| Computer & Data Processing Services (4.5%) | |
Openwave Systems, Inc.
2.75%, due 09/09/2008 | | | 4,500 | | | | 5,130 | | |
Overstock.com, Inc.
3.75%, due 12/01/2011 † | | | 4,300 | | | | 3,327 | | |
Terremark Worldwide, Inc.
9.00%, due 06/15/2009 | | | 2,000 | | | | 1,500 | | |
| Computer & Office Equipment (2.1%) | |
Scientific Games Corp.–144A
0.75%, due 12/01/2024 | | | 4,000 | | | | 4,590 | | |
| Electric Services (2.2%) | |
Centerpoint Energy, Inc., Series B
3.75%, due 05/15/2023 | | | 2,000 | | | | 2,433 | | |
CMS Energy Corp.
2.88%, due 12/01/2024 | | | 2,000 | | | | 2,418 | | |
| Electronic Components & Accessories (1.1%) | |
Cypress Semiconductor Corp.
1.25%, due 06/15/2008 | | | 2,150 | | | | 2,378 | | |
| Holding & Other Investment Offices (1.4%) | |
Affordable Residental Communities REIT–144A
7.50%, due 08/15/2025 | | | 3,100 | | | | 3,100 | | |
| | | Principal | | Value | |
| Hotels & Other Lodging Places (3.8%) | | | |
Kerzner International, Ltd.
2.38%, due 04/15/2024 | | $ | 3,100 | | | $ | 3,503 | | |
Starwood Hotels & Resorts Worldwide, Inc.
3.50%, due 05/16/2023 | | | 4,000 | | | | 4,795 | | |
| Industrial Machinery & Equipment (2.6%) | | | |
Cooper Cameron Corp., Senior Note
1.50%, due 05/15/2024 † | | | 4,700 | | | | 5,675 | | |
| Management Services (2.2%) | | | |
Fluor Corp.
1.50%, due 02/15/2024 | | | 4,000 | | | | 4,915 | | |
| Manufacturing Industries (4.1%) | | | |
Shuffle Master, Inc.
1.25%, due 04/15/2024 | | | 4,850 | | | | 5,129 | | |
Tyco International Group SA, Series B
3.13%, due 01/15/2023 | | | 3,000 | | | | 3,836 | | |
| Mortgage Bankers & Brokers (3.8%) | | | |
WMT Debt Exchangeable Trust–144A
0.25%, due 05/02/2013 | | | 800 | | | | 8,408 | | |
| Motion Pictures (3.5%) | | | |
Lions Gate Entertainment Corp.
4.88%, due 12/15/2010
2.94%, due 10/15/2024 | | | 1,000
3,750 | | | | 1,821
3,830 | | |
Walt Disney Co.
2.13%, due 04/15/2023 | | | 2,000 | | | | 2,028 | | |
| Oil & Gas Extraction (6.7%) | | | |
Halliburton Co.
3.13%, due 07/15/2023 | | | 2,750 | | | | 4,544 | | |
Quicksilver Resources, Inc.–144A
1.88%, due 11/01/2024 | | | 3,000 | | | | 4,271 | | |
Schlumberger Ltd.
1.50%, due 06/01/2023 † | | | 4,500 | | | | 5,912 | | |
| Personal Credit Institutions (2.8%) | | | |
American Express Co.
1.85%, due 12/01/2033 (b) | | | 5,800 | | | | 6,112 | | |
| Pharmaceuticals (1.9%) | | | |
Allergan, Inc.
Zero coupon, due 11/06/2022 | | | 4,000 | | | | 4,130 | | |
| Primary Metal Industries (1.7%) | | | |
Inco, Ltd.
Zero coupon, due 03/29/2021 | | | 3,500 | | | | 3,741 | | |
| Printing & Publishing (1.4%) | | | |
Barnes Group, Inc.–144A
3.75%, due 08/01/2025 | | | 3,000 | | | | 3,113 | | |
The notes to the financial statements are an integral part of this report.
Transamerica IDEX Mutual Funds
Annual Report 2005
4
TA IDEX Transamerica Convertible Securities
SCHEDULE OF INVESTMENTS (continued)
At October 31, 2005
(all amounts except share amounts in thousands)
| | | Principal | | Value | |
| Radio, Television & Computer Stores (2.7%) | |
Guitar Center, Inc.
4.00%, due 07/15/2013 | | $ | 3,900 | | | $ | 6,030 | | |
| Security & Commodity Brokers (11.6%) | |
Blackrock, Inc./New York–144A
2.63%, due 02/15/2035 | | | 4,750 | | | | 4,993 | | |
Lehman Brothers Holdings, Inc.
0.25%, due 09/06/2012 | | | 5,500 | | | | 5,394 | | |
Morgan Stanley Group, Inc.–144A
0.25%, due 07/30/2014 § | | | 5,300 | | | | 5,519 | | |
Svensk Exportkredit AB
0.25%, due 01/31/2015 § | | | 7,000 | | | | 9,581 | | |
| Telecommunications (4.6%) | |
Nextel Partners, Inc.
1.50%, due 11/15/2008 | | | 2,250 | | | | 4,433 | | |
NII Holdings, Inc.
2.88%, due 02/01/2034 † | | | 3,500 | | | | 5,771 | | |
| Water Transportation (2.5%) | |
Carnival Corp.
1.13%, due 04/29/2033 (c) | | | 4,000 | | | | 2,975 | | |
Royal Caribbean Cruises, Ltd.
Zero coupon, due 05/18/2021 | | | 4,000 | | | | 2,610 | | |
| Wholesale Trade Durable Goods (1.3%) | |
WESCO International, Inc.–144A
2.63%, due 10/15/2025 | | | 2,500 | | | | 2,863 | | |
| Total Convertible Bonds (cost: $177,126) | | | | | | | 190,846 | | |
| | | Shares | | Value | |
| CONVERTIBLE PREFERRED STOCKS (10.5%) | |
| Chemicals & Allied Products (1.9%) | |
| Celanese Corp. | | | 155,000 | | | $ | 4,088 | | |
| Insurance (1.5%) | |
| Fortis Insurance NV–144A | | | 3,080 | | | | 3,399 | | |
| Life Insurance (2.0%) | |
| Metlife, Inc. | | | 160,000 | | | | 4,380 | | |
| Mining (2.5%) | |
| Arch Coal, Inc. | | | 30,000 | | | | 5,569 | | |
| Oil & Gas Extraction (2.6%) | |
| Chesapeake Energy Corp. † | | | 20,850 | | | | 5,686 | | |
| Total Convertible Preferred Stocks (cost: $19,294) | | | | | | | 23,122 | | |
| | | Principal | | Value | |
| SECURITY LENDING COLLATERAL (9.1%) | |
| Debt (8.5%) | |
| Bank Notes (0.6%) | |
Bank of America
| |
| 3.81%, due 06/07/2006 * | | $ | 565 | | | $ | 565 | | |
| 3.81%, due 08/10/2006 * | | | 560 | | | | 560 | | |
Credit Suisse First Boston Corp.
4.11%, due 03/10/2006 * | | | 112 | | | | 112 | | |
| Certificates Of Deposit (0.6%) | |
Canadian Imperial Bank of Commerce
4.07%, due 11/04/2005 * | | | 448 | | | | 448 | | |
Harris Trust & Savings Bank
3.80%, due 11/04/2005 * | | | 357 | | | | 357 | | |
Rabobank Nederland
4.03%, due 05/31/2006 * | | | 560 | | | | 560 | | |
| Commercial Paper (1.8%) | |
Ciesco LLC
4.00%, due 11/03/2005 | | | 560 | | | | 560 | | |
General Electric Capital Corp.
3.96%, due 12/05/2005 | | | 448 | | | | 448 | | |
Paradigm Funding LLC–144A
4.01%, due 11/07/2005 | | | 447 | | | | 447 | | |
Park Avenue Receivables Corp.–144A
4.03%, due 12/02/2005 | | | 444 | | | | 444 | | |
Preferred Receivables Corp.–144A
4.04%, due 12/05/2005 | | | 336 | | | | 336 | | |
Ranger Funding Co. LLC–144A
3.99%, due 11/15/2005 | | | 334 | | | | 334 | | |
Sheffield Receivables Corp.–144A
4.01%, due 11/08/2005 | | | 336 | | | | 336 | | |
Yorktown Capital LLC
3.97%, due 11/09/2005
3.93%, due 11/17/2005 | | | 559
557 | | | | 559
557 | | |
| Euro Dollar Overnight (2.0%) | |
Bank of Montreal
3.79%, due 11/01/2005 | | | 336 | | | | 336 | | |
Barclays
3.80%, due 11/04/2005 | | | 448 | | | | 448 | | |
BNP Paribas
3.83%, due 11/02/2005 | | | 673 | | | | 673 | | |
Deutsche Bank
3.80%, due 11/02/2005 | | | 1,121 | | | | 1,121 | | |
HSBC Banking/Holdings PLC
3.84%, due 11/07/2005 | | | 336 | | | | 336 | | |
Royal Bank of Scotland
3.76%, due 11/01/2005 | | | 448 | | | | 448 | | |
The notes to the financial statements are an integral part of this report.
Transamerica IDEX Mutual Funds
Annual Report 2005
5
TA IDEX Transamerica Convertible Securities
SCHEDULE OF INVESTMENTS (continued)
At October 31, 2005
(all amounts except share amounts in thousands)
| | | Principal | | Value | |
| Euro Dollar Overnight (continued) | | | |
Svenska Handlesbanken
4.03%, due 11/01/2005 | | $ | 577 | | | $ | 577 | | |
UBS AG
3.80%, due 11/03/2005 | | | 448 | | | | 448 | | |
| Euro Dollar Terms (0.7%) | | | |
Royal Bank of Scotland
4.00%, due 12/12/2005 | | | 448 | | | | 448 | | |
UBS AG
4.02%, due 12/01/2005 | | | 448 | | | | 448 | | |
Wells Fargo
3.96%, due 11/14/2005 | | | 673 | | | | 673 | | |
| Promissory Notes (0.2%) | | | |
Goldman Sachs Group, Inc.
4.02%, due 12/28/2005 | | | 471 | | | | 471 | | |
| Repurchase Agreements (2.6%) †† | | | |
Credit Suisse First Boston Corp.
4.10%, dated 10/31/2005 to be
repurchased at $764 on 11/01/2005 | | | 764 | | | | 764 | | |
Goldman Sachs Group, Inc. (The)
4.10%, dated 10/31/2005 to be
repurchased at $1,905 on 11/01/2005 | | | 1,905 | | | | 1,905 | | |
Lehman Brothers, Inc.
4.10%, dated 10/31/2005 to be
repurchased at $53 on 11/01/2005 | | | 53 | | | | 53 | | |
| | | Principal | | Value | |
| Repurchase Agreements (continued) | | | |
Merrill Lynch & Co.
4.10%, dated 10/31/2005 to be
repurchased at $2,242 on 11/01/2005 | | $ | 2,241 | | | $ | 2,241 | | |
Morgan Stanley Dean Witter & Co.
4.17%, dated 10/31/2005 to be
repurchased at $672 on 11/01/2005 | | | 672 | | | | 672 | | |
| | | Shares | | Value | |
| Investment Companies (0.6%) | | | |
| Money Market Funds (0.6%) | | | |
American Beacon Fund
1-day yield of 3.81% | | | 483,211 | | | $ | 483 | | |
Barclays Global Investors Institutional
Money Market Fund
1-day yield of 3.92% | | | 448,274 | | | | 448 | | |
Goldman Sachs Financial Square
Prime Obligations Fund
1-day yield of 3.79% | | | 69,827 | | | | 70 | | |
Merrimac Cash Fund, Premium Class
1-day yield of 3.70% @ | | | 443,320 | | | | 443 | | |
| Total Security Lending Collateral (cost: $20,129) | | | | | | | 20,129 | | |
| Total Investment Securities (cost: $219,243) | | | | | | $ | 236,937 | | |
| SUMMARY: | | | |
| Investment securities, at value | | | 107.5 | % | | $ | 236,937 | | |
| Liabilities in excess of other assets | | | (7.5 | )% | | | (16,442 | ) | |
| Net assets | | | 100.0 | % | | $ | 220,495 | | |
NOTES TO SCHEDULE OF INVESTMENTS:
(a) Virgin River Casino Corp.–144A has a coupon rate of 0.00% until 01/15/2009, thereafter the coupon rate will be 12.75%.
† At October 31, 2005, all or a portion of this security is on loan (see Note 1). The value at October 31, 2005, of all securities on loan is $19,396.
(b) American Express Co. has a coupon rate of 1.85% until 12/01/2006, thereafter the coupon rate will be 0.00%.
§ Security is deemed to be illiquid.
(c) Carnival Corp. has a coupon rate of 1.13% until 04/29/2008, thereafter the coupon rate will be 0.00%.
* Floating or variable rate note. Rate is listed as of October 31, 2005.
†† Cash collateral for the Repurchase Agreements, valued at $5,748, that serve as collateral for securities lending are invested in corporate bonds with interest rates and maturity dates ranging from 0.00%–9.86% and 12/31/2005–11/15/2096, respectively.
@ Regulated investment company advised by Investors Bank and Trust Co. ("IBT"). IBT is also the accounting, custody and lending agent for the Fund.
DEFINITIONS:
144A 144A Securities are registered pursuant to Rule 144A of the Securities Act of 1933. These securities are deemed to be liquid for purposes of compliance limitations on holdings of illiquid securities and may be resold as transactions exempt from registration, normally to qualified institutional buyers. At October 31, 2005, these securities aggregated $69,259 or 31.4% of the net assets of the Fund.
The notes to the financial statements are an integral part of this report.
Transamerica IDEX Mutual Funds
Annual Report 2005
6
TA IDEX Transamerica Convertible Securities
STATEMENT OF ASSETS AND LIABILITIES
At October 31, 2005
(all amounts except per share amounts in thousands)
| Assets: | | | |
Investment securities, at value (cost: $219,243)
(including securities loaned of $19,396) | | $ | 236,937 | | |
| Cash | | | 6,381 | | |
| Receivables: | |
| Interest | | | 889 | | |
| Dividends | | | 149 | | |
| Other | | | 6 | | |
| | | | 244,362 | | |
| Liabilities: | | | |
| Investment securities purchased | | | 3,490 | | |
| Accounts payable and accrued liabilities: | |
| Shares of beneficial interest redeemed | | | 1 | | |
| Management and advisory fees | | | 140 | | |
| Distribution and service fees | | | 72 | | |
| Transfer agent fees | | | 2 | | |
| Administration fees | | | 4 | | |
| Payable for collateral for securities on loan | | | 20,129 | | |
| Other | | | 29 | | |
| | | | 23,867 | | |
| Net Assets | | $ | 220,495 | | |
| Net Assets Consist of: | | | |
Shares of beneficial interest, unlimited shares
authorized, no par value | | $ | 200,657 | | |
| Undistributed net investment income (loss) | | | – | | |
Undistributed net realized gain (loss) from investment
securities | | | 2,144 | | |
Net unrealized appreciation (depreciation) on
investment securities | | | 17,694 | | |
| Net Assets | | $ | 220,495 | | |
| Net Assets by Class: | | | |
| Class A | | $ | 209,374 | | |
| Class B | | | 6,656 | | |
| Class C | | | 4,465 | | |
| Shares Outstanding: | | | |
| Class A | | | 18,112 | | |
| Class B | | | 577 | | |
| Class C | | | 388 | | |
| Net Asset Value Per Share: | | | |
| Class A | | $ | 11.56 | | |
| Class B | | | 11.54 | | |
| Class C | | | 11.50 | | |
| Maximum Offering Price Per Share (a): | | | |
| Class A | | $ | 12.14 | | |
(a) Includes the maximum selling commission (represented as a percentage of offering price) whuch is reduced on certain levels of sales as set forth in the Prospectus. Net asset value per share for Classes B and C shares represents offering price. The redemption price for Classes B and C shares equals net asset value less any applicable contingent deferred sales charge.
STATEMENT OF OPERATIONS
For the year ended October 31, 2005
(all amounts in thousands)
| Investment Income: | | | |
| Interest | | $ | 4,400 | | |
| Dividends | | | 1,928 | | |
| Income from loaned securities–net | | | 128 | | |
| | | | 6,456 | | |
| Expenses: | | | |
| Management and advisory fees | | | 1,666 | | |
| Distribution and service fees: | |
| Class A | | | 737 | | |
| Class B | | | 67 | | |
| Class C | | | 50 | | |
| Transfer agent fees: | |
| Class A | | | 11 | | |
| Class B | | | 12 | | |
| Class C | | | 5 | | |
| Printing and shareholder reports | | | 2 | | |
| Custody fees | | | 32 | | |
| Administration fees | | | 42 | | |
| Legal fees | | | 15 | | |
| Audit fees | | | 18 | | |
| Trustees fees | | | 10 | | |
| Registration fees: | |
| Class A | | | 21 | | |
| Class B | | | 11 | | |
| Class C | | | 13 | | |
| Other | | | 2 | | |
| Total expenses | | | 2,714 | | |
| Net Investment Income (Loss) | | | 3,742 | | |
| Net Realized and Unrealized Gain (Loss): | | | |
| Realized gain (loss) from investment securities | | | 2,181 | | |
Increase (decrease) in unrealized appreciation
(depreciation) on investment securities | | | 12,365 | | |
| Net Gain (Loss) on Investment Securities | | | 14,546 | | |
Net Increase (Decrease) in Net Assets Resulting
from Operations | | $ | 18,288 | | |
The notes to the financial statements are an integral part of this report.
Transamerica IDEX Mutual Funds
Annual Report 2005
7
TA IDEX Transamerica Convertible Securities
STATEMENTS OF CHANGES IN NET ASSETS
For the years ended
(all amounts in thousands)
| | | October 31,
2005 | | October 31,
2004 | |
| Increase (Decrease) in Net Assets From: | |
| Operations: | |
| Net investment income (loss) | | $ | 3,742 | | | $ | 3,504 | | |
Net realized gain (loss) from
investment securities | | | 2,181 | | | | 16,278 | | |
Net unrealized appreciation
(depreciation) on investment
securities | | | 12,365 | | | | (6,610 | ) | |
| | | | 18,288 | | | | 13,172 | | |
| Distributions to Shareholders: | |
| From net investment income: | |
| Class A | | | (3,735 | ) | | | (3,482 | ) | |
| Class B | | | (60 | ) | | | (85 | ) | |
| Class C | | | (50 | ) | | | (70 | ) | |
| Class C2 | | | – | | | | (11 | ) | |
| Class M | | | – | | | | (6 | ) | |
| | | | (3,845 | ) | | | (3,654 | ) | |
| From net realized gains: | |
| Class A | | | (4,356 | ) | | | (13,842 | ) | |
| Class B | | | (142 | ) | | | (501 | ) | |
| Class C | | | (113 | ) | | | (412 | ) | |
| Class C2 | | | – | | | | (92 | ) | |
| Class M | | | – | | | | (37 | ) | |
| | | | (4,611 | ) | | | (14,884 | ) | |
| Capital Share Transactions: | |
| Proceeds from shares sold: | |
| Class A | | | 28,320 | | | | 1,441 | | |
| Class B | | | 1,221 | | | | 1,806 | | |
| Class C | | | 563 | | | | 915 | | |
| Class C2 | | | – | | | | 572 | | |
| Class M | | | – | | | | 174 | | |
| | | | 30,104 | | | | 4,908 | | |
Dividends and distributions
reinvested: | |
| Class A | | | 8,026 | | | | 17,303 | | |
| Class B | | | 151 | | | | 422 | | |
| Class C | | | 128 | | | | 362 | | |
| Class C2 | | | – | | | | 62 | | |
| Class M | | | – | | | | 43 | | |
| | | | 8,305 | | | | 18,192 | | |
| Cost of shares redeemed: | |
| Class A | | | (24,313 | ) | | | (1,053 | ) | |
| Class B | | | (1,407 | ) | | | (2,085 | ) | |
| Class C | | | (1,658 | ) | | | (2,547 | ) | |
| Class C2 | | | – | | | | (632 | ) | |
| Class M | | | – | | | | (208 | ) | |
| | | | (27,378 | ) | | | (6,525 | ) | |
| Class level exchanges: | |
| Class C | | | – | | | | 1,631 | | |
| Class C2 | | | – | | | | (1,164 | ) | |
| Class M | | | – | | | | (467 | ) | |
| | | | – | | | | – | | |
| | | October 31,
2005 | | October 31,
2004 | |
| Automatic conversions: | |
| Class A | | $ | 1 | | | $ | 61 | | |
| Class B | | | (1 | ) | | | (61 | ) | |
| | | | – | | | | – | | |
| | | | 11,031 | | | | 16,575 | | |
| Net increase (decrease) in net assets | | | 20,863 | | | | 11,209 | | |
| Net Assets: | |
| Beginning of year | | | 199,632 | | | | 188,423 | | |
| End of year | | $ | 220,495 | | | $ | 199,632 | | |
Undistributed Net Investment Income
(Loss) | | $ | – | | | $ | 104 | | |
| Share Activity: | |
| Shares issued: | |
| Class A | | | 2,466 | | | | 125 | | |
| Class B | | | 108 | | | | 158 | | |
| Class C | | | 49 | | | | 82 | | |
| Class C2 | | | – | | | | 49 | | |
| Class M | | | – | | | | 15 | | |
| | | | 2,623 | | | | 429 | | |
Shares issued–reinvested from
distributions: | |
| Class A | | | 697 | | | | 1,576 | | |
| Class B | | | 13 | | | | 38 | | |
| Class C | | | 11 | | | | 33 | | |
| Class C2 | | | – | | | | 6 | | |
| Class M | | | – | | | | 4 | | |
| | | | 721 | | | | 1,657 | | |
| Shares redeemed: | |
| Class A | | | (2,139 | ) | | | (93 | ) | |
| Class B | | | (124 | ) | | | (184 | ) | |
| Class C | | | (147 | ) | | | (236 | ) | |
| Class C2 | | | – | | | | (55 | ) | |
| Class M | | | – | | | | (18 | ) | |
| | | | (2,410 | ) | | | (586 | ) | |
| Class level exchanges: | |
| Class C | | | – | | | | 150 | | |
| Class C2 | | | – | | | | (107 | ) | |
| Class M | | | – | | | | (43 | ) | |
| | | | – | | | | – | | |
| Automatic conversions: | |
| Class A | | | – | | | | 7 | | |
| Class B | | | – | | | | (7 | ) | |
| | | | – | | | | – | | |
Net increase (decrease) in shares
outstanding: | |
| Class A | | | 1,024 | | | | 1,615 | | |
| Class B | | | (3 | ) | | | 5 | | |
| Class C | | | (87 | ) | | | 29 | | |
| Class C2 | | | – | | | | (107 | ) | |
| Class M | | | – | | | | (42 | ) | |
| | | | 934 | | | | 1,500 | | |
The notes to the financial statements are an integral part of this report.
Transamerica IDEX Mutual Funds
Annual Report 2005
8
TA IDEX Transamerica Convertible Securities
FINANCIAL HIGHLIGHTS
| | | | | For a share of beneficial interest outstanding throughout each period | |
| | | | | Net Asset | | Investment Operations | | Distributions | | Net Asset | |
| | | For the
Period
Ended (d)(g) | | Value,
Beginning
of Period | | Net
Investment
Income (Loss) | | Net Realized
and Unrealized
Gain (Loss) | | Total
Operations | | From Net
Investment
Income | | From Net
Realized
Gains | | Total
Distributions | | Value,
End
of Period | |
| Class A | | 10/31/2005 | | $ | 11.00 | | | $ | 0.20 | | | $ | 0.81 | | | $ | 1.01 | | | $ | (0.20 | ) | | $ | (0.25 | ) | | $ | (0.45 | ) | | $ | 11.56 | | |
| | | 10/31/2004 | | | 11.32 | | | | 0.21 | | | | 0.56 | | | | 0.77 | | | | (0.22 | ) | | | (0.87 | ) | | | (1.09 | ) | | | 11.00 | | |
| | | 10/31/2003 | | | 9.39 | | | | 0.24 | | | | 1.92 | | | | 2.16 | | | | (0.23 | ) | | | – | | | | (0.23 | ) | | | 11.32 | | |
| | | 10/31/2002 | | | 10.00 | | | | 0.14 | | | | (0.67 | ) | | | (0.53 | ) | | | (0.08 | ) | | | – | | | | (0.08 | ) | | | 9.39 | | |
| Class B | | 10/31/2005 | | | 11.00 | | | | 0.09 | | | | 0.80 | | | | 0.89 | | | | (0.10 | ) | | | (0.25 | ) | | | (0.35 | ) | | | 11.54 | | |
| | | 10/31/2004 | | | 11.31 | | | | 0.14 | | | | 0.57 | | | | 0.71 | | | | (0.15 | ) | | | (0.87 | ) | | | (1.02 | ) | | | 11.00 | | |
| | | 10/31/2003 | | | 9.38 | | | | 0.17 | | | | 1.93 | | | | 2.10 | | | | (0.17 | ) | | | – | | | | (0.17 | ) | | | 11.31 | | |
| | | 10/31/2002 | | | 10.00 | | | | 0.11 | | | | (0.68 | ) | | | (0.57 | ) | | | (0.05 | ) | | | – | | | | (0.05 | ) | | | 9.38 | | |
| Class C | | 10/31/2005 | | | 10.97 | | | | 0.08 | | | | 0.82 | | | | 0.90 | | | | (0.12 | ) | | | (0.25 | ) | | | (0.37 | ) | | | 11.50 | | |
| | | 10/31/2004 | | | 11.31 | | | | 0.11 | | | | 0.57 | | | | 0.68 | | | | (0.15 | ) | | | (0.87 | ) | | | (1.02 | ) | | | 10.97 | | |
| | | 10/31/2003 | | | 9.36 | | | | 0.17 | | | | 1.95 | | | | 2.12 | | | | (0.17 | ) | | | – | | | | (0.17 | ) | | | 11.31 | | |
| | | | | | | Ratios/Supplemental Data | |
| | | For the
Period | | Total | | Net Assets,
End of
Period | | Ratio of Expenses
to Average
Net Assets (a) | | Net Investment
Income (Loss)
to Average | | Portfolio
Turnover | |
| | | Ended (g) | | Return (c) | | (000's) | | Net (e) | | Total (f) | | Net Assets (a) | | Rate (b) | |
| Class A | | 10/31/2005 | | | 9.24 | % | | $ | 209,374 | | | | 1.17 | % | | | 1.17 | % | | | 1.74 | % | | | 87 | % | |
| | | 10/31/2004 | | | 7.06 | | | | 188,049 | | | | 1.20 | | | | 1.20 | | | | 1.83 | | | | 157 | | |
| | | 10/31/2003 | | | 23.49 | | | | 175,175 | | | | 1.33 | | | | 1.33 | | | | 2.27 | | | | 119 | | |
| | | 10/31/2002 | | | (5.42 | ) | | | 10,205 | | | | 1.73 | | | | 3.85 | | | | 2.59 | | | | 170 | | |
| Class B | | 10/31/2005 | | | 8.09 | | | | 6,656 | | | | 2.15 | | | | 2.15 | | | | 0.76 | | | | 87 | | |
| | | 10/31/2004 | | | 6.52 | | | | 6,379 | | | | 1.79 | | | | 1.79 | | | | 1.24 | | | | 157 | | |
| | | 10/31/2003 | | | 22.58 | | | | 6,508 | | | | 1.98 | | | | 1.98 | | | | 1.62 | | | | 119 | | |
| | | 10/31/2002 | | | (5.68 | ) | | | 1,138 | | | | 2.38 | | | | 4.50 | | | | 1.94 | | | | 170 | | |
| Class C | | 10/31/2005 | | | 8.17 | | | | 4,465 | | | | 2.16 | | | | 2.16 | | | | 0.73 | | | | 87 | | |
| | | 10/31/2004 | | | 6.33 | | | | 5,204 | | | | 2.05 | | | | 2.05 | | | | 0.98 | | | | 157 | | |
| | | 10/31/2003 | | | 22.84 | | | | 5,048 | | | | 1.98 | | | | 1.98 | | | | 1.62 | | | | 119 | | |
NOTES TO FINANCIAL HIGHLIGHTS
(a) Annualized.
(b) Not annualized.
(c) Total Return has been calculated for the applicable period without deduction of a sales load, if any, on an initial purchase. Periods of less than one year are not annualized.
(d) Per share information is calculated based on average number of shares outstanding.
(e) Ratio of Net Expenses to Average Net Assets is net of fee waivers and reimbursements by the investment adviser, if any (see note 2).
(f) Ratio of Total Expenses to Average Net Assets includes all expenses before fee waivers and reimbursements by the investment adviser.
(g) TA IDEX Transamerica Convertible Securities ("the Fund") commenced operations on March 1, 2002. The inception date for the Fund's offering of share Class C was November 11, 2002.
The notes to the financial statements are an integral part of this report.
Transamerica IDEX Mutual Funds
Annual Report 2005
9
TA IDEX Transamerica Convertible Securities
NOTES TO FINANCIAL STATEMENTS
At October 31, 2005
(all amounts in thousands)
NOTE 1. ORGANIZATION AND SIGNIFICANT ACCOUNTING POLICIES
Transamerica IDEX Mutual Funds is an open-end management investment company registered under the Investment Company Act of 1940, as amended (the "1940 Act").
In the normal course of business, TA IDEX Transamerica Convertible Securities (the "Fund") enters into contracts that contain a variety of representations that provide general indemnifications. The Fund's maximum exposure under these arrangements is unknown, as this would involve future claims that may be made against the Fund and/or its affiliates that have not yet occurred. However, based on experience, the Fund expects the risk of loss to be remote.
This report should be read in conjunction with the current Fund prospectus, which contains more complete information about the Fund.
The following is a summary of significant accounting policies followed by the Fund in the preparation of the financial statements. In preparing the Fund's financial statements in accordance with accounting principles generally accepted in the United States of America ("GAAP"), estimates or assumptions (which could differ from actual results) may be used that affect reported amounts and disclosures.
Multiple class operations, income and expenses: The Fund currently offers three classes of shares, each with a public offering price that reflects different sales charges, if any, and expense levels. On June 15, 2004, Class C2 shares merged into Class C. On September 24, 2004, Class M shares merged into Class C. Class B shares will convert to Class A shares eight years after purchase. Income, non-class specific expenses and realized and unrealized gains and losses, are allocated daily to each class, based upon the value of shares outstanding method as permitted under Rule 18f-3 of the 1940 Act. Each class bears its own specific expenses as well as a portion of general, common expenses.
Security valuations: The Fund values its investments at the close of the New York Stock Exchange ("NYSE"), normally 4 p.m. ET, each day the NYSE is open for business. Fund investments are valued at the last sale price or closing price on the day of valuation taken from the primary exchange where the security is principally traded.
Securities traded in the over-the-counter market and listed securities for which no sale was reported on that date are valued at the last quoted bid price.
Debt securities are valued based on a price quotation or other equivalent indication of value supplied by an exchange, a pricing service or a major market maker.
Investment company securities are valued at the net asset value of the underlying portfolio.
Other securities for which quotations are not readily available or whose values have been determined to be unreliable are valued at fair market value as determined in good faith by the Fund's Administrative Valuation Committee, under the supervision of the Board's Valuation Committee, using guidelines adopted by the Board of Trustees.
Cash: The Fund may leave cash overnight in its cash account with the custodian, Investors Bank & Trust Company ("IBT"). IBT has been contracted on behalf of the Fund to invest the excess cash into a savings account, which at October 31, 2005, was paying an interest rate of 2.76%.
Repurchase agreements: The Fund is authorized to enter into repurchase agreements. The Fund, through its custodian, Investors Bank & Trust Company ("IBT"), receives delivery of the underlying securities, the value of which at the time of purchase is required to be an amount equal to at least 100% of the resale price. The Fund will bear the risk of value fluctuations until the security can be sold and may encounter delays and incur costs in liquidating the security. In the event of bankruptcy or insolvency of the seller, delays and costs may be incurred.
Securities lending: The Fund may lend securities to qualified borrowers, with IBT acting as the Fund's lending agent. The Fund earns negotiated lenders' fees. The Fund receives cash and/or securities as collateral against the loaned securities. Cash collateral received is invested in short term, interest bearing securities. The Fund monitors the market value of securities loaned on a daily basis and requires collateral in an amount at least equal to the value of the securities loaned. Income from loaned securities on the Statement of Operations is net of fees, in the amount of $55, earned by IBT for its services.
Real Estate Investment Trusts ("REITs"): There are certain additional risks involved in investing in REITs. These include, but are not limited to, economic conditions, changes in zoning laws, real estate values, property taxes and interest rates.
Dividend income is recorded at management's estimate of the income included in distributions from the REIT investments. Distributions received in excess of the estimated amount are recorded as a reduction of the cost of investments. The actual amounts of income, return of capital and capital gains are only determined by each REIT after the fiscal year end and may differ from the estimated amounts.
Security transactions and investment income: Security transactions are recorded on the trade date. Security gains and losses are calculated on the specific identification basis. Dividend income, if any, is recorded on the ex-dividend date or, in the case of foreign securities, as soon as the Fund is informed of the ex-dividend date. Interest income, including accretion of discounts and amortization of premiums, is recorded on the accrual basis commencing on the settlement date.
Redemption fees: A short-term trading redemption fee may be assessed on any Fund shares in a fund account that are sold during the first five (5) NYSE trading days following their purchase date. This redemption fee will equal 2% of the amount redeemed and shares held the longest will be treated as being redeemed first and shares held the
Transamerica IDEX Mutual Funds
Annual Report 2005
10
TA IDEX Transamerica Convertible Securities
NOTES TO FINANCIAL STATEMENTS (continued)
At October 31, 2005
(all amounts in thousands)
NOTE 1.–(continued)
shortest as being redeemed last. For the year ended October 31, 2005, the Fund received no redemption fees.
Dividend distributions: Distributions to shareholders are recorded on the ex-dividend date and are determined in accordance with Federal income tax regulations which may differ from GAAP.
NOTE 2. RELATED PARTY TRANSACTIONS
Effective January 1, 2005 AEGON/Transamerica Fund Advisors, Inc. was renamed Transamerica Fund Advisors, Inc. ("TFAI"); AEGON/Transamerica Fund Services, Inc. and AEGON/Transamerica Investor Services, Inc. merged into one entity and was renamed Transamerica Fund Services, Inc. ("TFS").
TFAI is the Fund's investment adviser. TFS is the Fund's administrator and transfer agent. AFSG Securities Corp. ("AFSG") is the Fund's distributor/principal underwriter. TFAI, TFS , and AFSG are affiliates of AEGON, NV, a Netherlands corporation.
Transamerica Investment Management, LLC is both an affiliate of the Fund and a sub-adviser to the Fund.
The following schedule represents the percentage of Fund assets owned by affiliated mutual funds:
| | | Net
Assets | | % of
Net Assets | |
TA IDEX Asset Allocation–
Conservative Portfolio | | $ | 31,006 | | | | 14.06 | % | |
TA IDEX Asset Allocation–
Moderate Growth Portfolio | | | 85,163 | | | | 38.62 | % | |
TA IDEX Asset Allocation–
Moderate Portfolio | | | 86,997 | | | | 39.46 | % | |
| Total | | $ | 203,166 | | | | 92.14 | % | |
Investment advisory fees: The Fund pays management fees to TFAI based on average daily net assets ("ANA") at the following rate:
From November 1, 2004 to December 31, 2004:
0.75% of ANA
From January 1, 2005 on:
0.75% of the first $250 million of ANA
0.70% of ANA over $250 million
TFAI has contractually agreed to waive its advisory fee and will reimburse the Fund to the extent that operating expenses, excluding 12b-1 fees, exceed the following stated annual limit:
1.35% Expense Limit
If total Fund expenses fall below the annual expense limitation agreement agreed to by the adviser within the succeeding three years, the Fund may be required to pay that adviser a portion or all of the reimbursed class expenses.
There were no amounts recaptured during the year ended October 31, 2005. There are no amounts available for recapture at October 31, 2005.
Distribution and service fees: The Fund has a 12b-1 distribution plan under the 1940 Act pursuant to which an annual fee, based on average daily net assets, is paid to the distributor for various disbursements such as broker-dealer account servicing fees and other promotional expenses of the Fund. The Fund is authorized under the 12b-1 plan to pay fees on each class up to the following limits:
| Class A | | | 0.35 | % | |
| Class B | | | 1.00 | % | |
| Class C | | | 1.00 | % | |
In the case the Fund or a class of shares of the Fund is closed to new investors or investments, the Fund is authorized to pay 12b-1 fees for past sales and distribution efforts and present and past investor services.
Underwriter commissions relate to front-end sales charges imposed for Class A shares and contingent deferred sales charges from Classes B, C, and certain A share redemptions. For the year ended October 31, 2005, the underwriter commissions were as follows:
| Received by Underwriter | | $ | 76 | | |
| Retained by Underwriter | | | 3 | | |
| Contingent Deferred Sales Charge | | | 24 | | |
Administrative services: The Fund has entered into an agreement with TFS for financial and legal fund administration services. As of January 1, 2005 the Fund pays TFS an annual fee of 0.02% of ANA. Prior to January 1, 2005 the Fund paid TFS an annual fee of 0.015% of ANA. The Legal fees on the Statement of Operations are for fees paid to external legal counsel.
Transfer agent fees: The Fund pays TFS an annual per-account charge for each open and closed account. The Fund paid TFS $27 for the year ended October 31, 2005.
Deferred compensation plan: Each eligible independent Fund Trustee may elect to participate in a non-qualified deferred compensation plan maintained by Transamerica IDEX Mutual Funds (the "Plan"). Under the Plan, such Trustees may defer payment of all or a portion of their total fees earned as a Fund Trustee. Each Trustee who is a participant in the Plan may elect that the earnings, losses or gains credited to his or her deferred fee amounts be determined based on a deemed investment in
Transamerica IDEX Mutual Funds
Annual Report 2005
11
TA IDEX Transamerica Convertible Securities
NOTES TO FINANCIAL STATEMENTS (continued)
At October 31, 2005
(all amounts in thousands)
NOTE 2.–(continued)
any series of Transamerica IDEX Mutual Funds, including the Fund. The right of a participant to receive a distribution from the Plan of the deferred fees is an unsecured claim against the general assets of all series of Transamerica IDEX Mutual Funds. The pro rata liability to the Fund of all deferred fees in the Plan amounted, as of October 31, 2005, to $6.
NOTE 3. INVESTMENT TRANSACTIONS
The cost of securities purchased and proceeds from securities sold (excluding short-term securities) for the year ended October 31, 2005, were as follows:
| Purchases of securities: | | | |
| Long-Term | | $ | 192,372 | | |
| U.S. Government | | | – | | |
| Proceeds from maturities and sales of securities: | | | |
| Long-Term | | | 188,338 | | |
| U.S. Government | | | – | | |
NOTE 4. FEDERAL INCOME TAX MATTERS
The Fund has not made any provision for federal income or excise taxes due to its policy to distribute all of its taxable income and capital gains to its shareholders and otherwise qualify as a regulated investment company under Subchapter M of the Internal Revenue Code. Income and capital gain distributions are determined in accordance with income tax regulations, which may differ from GAAP. These differences are primarily due to differing treatment for items including, but not limited to, wash sales.
Therefore, distributions determined in accordance with tax regulations may differ significantly in amount or character from net investment income and realized gains for financial reporting purposes. Financial reporting records are adjusted for permanent book/tax differences to reflect tax character. Financial records are not adjusted for temporary differences. These reclassifications are as follows:
Shares of beneficial interest, unlimited
shares authorized | | $ | 2 | | |
| Undistributed net investment income (loss) | | | (1 | ) | |
Undistributed net realized gain (loss) from investment
securities | | | (1 | ) | |
The tax character of distributions paid may differ from the character of distributions shown in the Statement of Changes in Net Assets due to short-term gains being treated as ordinary income for tax purposes. The tax character of distributions paid during 2004 and 2005 was as follows:
| 2004 Distributions paid from: | |
| Ordinary Income | | $ | 17,139 | | |
| Long-term Capital Gain | | | 1,399 | | |
| 2005 Distributions paid from: | |
| Ordinary Income | | | 7,596 | | |
| Long-term Capital Gain | | | 860 | | |
The tax basis components of distributable earnings as of October 31, 2005, are as follows:
| Undistributed Ordinary Income | | $ | 918 | | |
| Undistributed Long-term Capital Gains | | $ | 1,262 | | |
| Capital Loss Carryforward | | $ | – | | |
| Net Unrealized Appreciation (Depreciation) | | $ | 17,658 | | |
The aggregate cost of investments and composition of unrealized appreciation (depreciation) for federal income tax purposes as of October 31, 2005, are as follows:
| Federal Tax Cost Basis | | $ | 219,279 | | |
| Unrealized Appreciation | | $ | 22,572 | | |
| Unrealized (Depreciation) | | | (4,914 | ) | |
| Net Unrealized Appreciation (Depreciation) | | $ | 17,658 | | |
NOTE 5. REGULATORY PROCEEDINGS
There continues to be significant federal and state regulatory activity relating to financial services companies, particularly mutual fund companies and their investment advisers. As part of an ongoing investigation regarding potential market timing, recordkeeping and trading compliance issues and matters affecting the Fund's investment adviser, TFAI, and certain affiliates and former employees of TFAI, the SEC staff has indicated that it is likely to take some action against TFAI and certain of its affiliates at the conclusion of the investigation. The potential timing and the scope of any such action is difficult to predict. Although the impact of any action brought against TFAI and/or its affiliates is difficult to assess at the present time, the Fund currently believes that the likelihood that any such action will have a material adverse impact on it is remote. It is important to note that the Fund is not aware of any allegation of wrongdoing against it and its Board at the time this annual report is printed. Although it is not anticipated that these developments will have an adverse impact on the Fund, there can be no assurance at this time. TFAI and its affiliates are actively working with the SEC in regard to this matter; however, the exact resolution cannot be determined at this time. TFAI will take such actions that it deems necessary or appropriate to continue providing management services to the Fund and to bring all matters to an appropriate conclusion.
TFAI and/or its affiliates, and not the Fund, will bear the costs regarding these regulatory matters.
Transamerica IDEX Mutual Funds
Annual Report 2005
12
Report of Independent Registered Certified Public Accounting Firm
To the Board of Trustees and Shareholders of
TA IDEX Transamerica Convertible Securities
In our opinion, the accompanying statement of assets and liabilities, including the schedule of investments, and the related statements of operations and of changes in net assets and the financial highlights present fairly, in all material respects, the financial position of TA IDEX Transamerica Convertible Securities (the "Fund") (one of the portfolios constituting the Transamerica IDEX Mutual Funds) at October 31, 2005, the results of its operations for the year then ended, the changes in its net assets for each of the two years in the period then ended and the financial highlights for each of the periods presented, in conformity with accounting principles generally accepted in the United States of America. These financial statements and financial highlights (hereafter referred to as "financial statements") are the responsibility of the Fund's management; our responsibility is to express an opini on on these financial statements based on our audits. We conducted our audits of these financial statements in accordance with the standards of the Public Company Accounting Oversight Board (United States). Those standards require that we plan and perform the audit to obtain reasonable assurance about whether the financial statements are free of material misstatement. An audit includes examining, on a test basis, evidence supporting the amounts and disclosures in the financial statements, assessing the accounting principles used and significant estimates made by management, and evaluating the overall financial statement presentation. We believe that our audits, which included confirmation of securities at October 31, 2005 by correspondence with the custodian and brokers, provide a reasonable basis for our opinion.

December 22, 2005
Transamerica IDEX Mutual Funds
Annual Report 2005
13
TA IDEX Transamerica Convertible Securities
SUPPLEMENTAL INFORMATION (unaudited)
TAX INFORMATION
For dividends paid during the year ended October 31, 2005, the Fund designated $1,643 as qualified dividend income.
For corporate shareholders, 21% of investment income (dividend income plus short-term gains, if any) qualifies for the dividends received deduction.
For tax purposes, the Fund has made a Long-Term Capital Gain Designation of $860 for the year ended October 31, 2005.
The information and distributions reported herein may differ from the information and distributions taxable to the shareholders for the calendar year ending December 31, 2005. Complete information will be computed and reported in conjunction with your 2005 Form 1099-DIV.
Transamerica IDEX Mutual Funds
Annual Report 2005
14
TA IDEX Transamerica Equity
MARKET ENVIRONMENT
The Standard and Poor's 500 Composite Stock Index ("S&P 500") posted a gain of 8.71% in the twelve months ended October 31, 2005, due largely to a broadly based advance in the initial months of the period, and to gains for energy and utilities stocks throughout the year.
Focusing on sustained growth in the economy and corporate earnings, benign levels of inflation and still-low interest rates, the equity market largely ignored a surge in energy prices that began in 2003 and staged a powerful rally through early 2005. Throughout the year, investors alternated between fear of recession and expectations of sustainable economic growth, causing stock prices to vacillate widely. Their concerns about the state of the economy were heightened after late-summer hurricanes shuttered many Gulf Coast oil and gas refineries, setting off yet another spike in energy prices while interest rates continued to climb.
The economic expansion withstood the hurricanes' impact, but recent government data pointed to growing inflationary pressures as producers increasingly passed along higher energy costs to consumers. Investor sentiment turned cautious as bond yields rose and the equity market lost ground.
PERFORMANCE
For the year ended October 31, 2005, TA IDEX Transamerica Equity, Class A returned 21.16%. By comparison its primary and former benchmarks, the Russell 1000 Growth Index and the S&P 500, returned 8.81% and 8.71%, respectively.
STRATEGY REVIEW
The primary drivers of the portfolio's superior results were individual healthcare, financial and technology holdings which more than offset an underweighting in energy, the market's strongest sector.
The portfolio comprised investments in companies that, in our view, benefited from strongly positive secular trends and have strong management teams, stable balance sheets and highly competitive positions. Because we found more industrial, consumer discretionary, health care and technology stocks that met these parameters, the portfolio was overweighted in those sectors. The portfolio was underweighted in utilities, telecommunications, energy and financial stocks, which were areas where we identified fewer stocks with the right combination of attributes.
The largest contributors to total return were SanDisk Corporation ("SanDisk"), Genentech, Inc. ("Genentech"), and Chicago Mercantile Exchange Holdings Inc. ("CME"). Each is a prime example of a company well positioned to benefit from an enduring, non-cyclical trend.
SanDisk is a leading competitor among portable memory manufacturers, whose shares rose dramatically as it became increasingly clear that applications and demand for ultra-compact memory devices (e.g., picture cell phones) were expanding at a rapid rate. CME's shares rose sharply as investors became increasingly aware that this electronic exchange is at the forefront of a structural shift in how futures, options, foreign exchange and credit derivatives are traded. Genentech, a biopharmaceutical company that develops new therapies for widespread forms of cancer (i.e., breast, lung and colon), saw its stock advance on positive news about the efficacy of Avastin, a ground-breaking cancer treatment.
The gains for these and other stocks were partially diluted by losses for Lexmark International, Inc. ("Lexmark") (computer printers) and Zimmer Holdings, Inc. ("Zimmer") (replacement joint supplier). We exited Lexmark soon after learning that its major customer relationship was in jeopardy but have maintained the portfolio's exposure to Zimmer. Investors exited Zimmer's stock after the company announced that, under pressure from Europe and Japan, it would not raise product prices. In our view, the company's prospects are still encouraging, since sales volumes continue to rise.
Gary U. Rollé, CFA
Fund Manager
Transamerica Investment Management, LLC
Transamerica IDEX Mutual Funds
Annual Report 2005
1
TA IDEX Transamerica Equity
Comparison of change in value of $10,000 investment in Class A shares and its comparative indices.
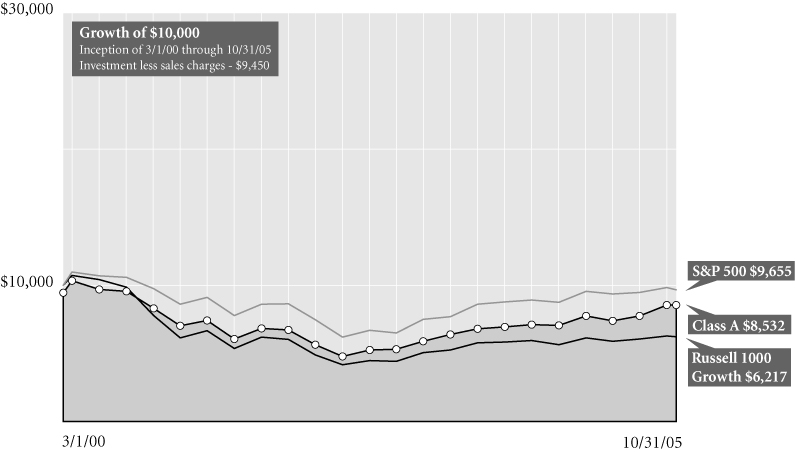
Average Annual Total Return for Periods Ended 10/31/05
| | | 1 year | | 5 years | | From
Inception | | Inception
Date | |
| Class A (NAV) | | | 21.16 | % | | | (2.36 | )% | | | (1.81 | )% | | 3/1/00 | |
| Class A (POP) | | | 14.50 | % | | | (3.46 | )% | | | (2.79 | )% | | 3/1/00 | |
| Russell 1000 Growth1 | | | 8.81 | % | | | (7.93 | )% | | | (8.04 | )% | | 3/1/00 | |
| S&P 5001 | | | 8.71 | % | | | (1.73 | )% | | | (0.62 | )% | | 3/1/00 | |
| Class B (NAV) | | | 20.03 | % | | | (3.12 | )% | | | (2.56 | )% | | 3/1/00 | |
| Class B (POP) | | | 15.03 | % | | | (3.31 | )% | | | (2.56 | )% | | 3/1/00 | |
| Class C (NAV) | | | 20.05 | % | | | – | | | | 17.88 | % | | 11/11/02 | |
| Class C (POP) | | | 19.05 | % | | | – | | | | 17.88 | % | | 11/11/02 | |
NOTES
1 The Russell 1000 Growth (Russell 1000 Growth) Index and the Standard and Poor's 500 Composite Stock (S&P 500) Index are unmanaged indices used as a general measure of market performance. Calculations assume dividends and capital gains are reinvested and do not include any managerial expenses. From inception calculation is based on life of Class A shares. For reporting periods through October 31, 2004, the Fund had selected the S&P 500 as its benchmark measure; however, the Russell 1000 is more appropriate for comparison to the Fund. Source: Standard & Poor's Micropal®© Micropal, Inc. 2005 – 1-800-596-5323 – http://www.funds-sp.com.
The performance data presented represents past performance, future results may vary. Performance data does not reflect the deduction of taxes that would be paid on fund distributions or the redemption of fund shares. Investment return and principal value will fluctuate so that an investor's shares, when redeemed, may be worth more or less than their original cost. Current performance may be lower or higher than performance quoted. Please see www.transamericaidex.com for performance data current to the most recent month-end.
Public Offering Price (POP) returns include the reinvestment of dividends and capital gains and reflect the maximum sales charge of 5.5% for A shares or the maximum applicable contingent deferred sales charge (5% in the 1st year, decreasing to 0% after 6 years) for Class B shares and 1% (during the first 12 months) for Class C shares. Shares purchased prior to March 1, 2004 are subject to a maximum applicable contingent deferred sales charge (5% in the 1st year, decreasing to 0% after 7 years) for Class B shares and (2% in the 1st year, decreasing to 0% after 2 years) for Class C shares. Net Asset Value (NAV) returns include the reinvestment of dividends and capital gains but do not reflect any sales charges.
This material must be preceded or accompanied by a current prospectus, which includes specific contents regarding the investment objectives and policies of this fund.
Transamerica IDEX Mutual Funds
Annual Report 2005
2
TA IDEX Transamerica Equity
UNDERSTANDING YOUR FUND'S EXPENSES
(unaudited)
SHAREHOLDER EXPENSES
Fund shareholders may incur two types of costs: (1) transaction costs, including sales charges (loads) on purchases, contingent deferred sales charges on redemptions and redemption fees; and (2) ongoing costs, including management fees, 12b-1 distribution and service fees, and other fund expenses.
The following Example is intended to help you understand your ongoing costs (in dollars and cents) of investing in a Fund and to compare these costs with the ongoing costs of investing in other funds.
The Example is based on an investment of $1,000 invested at May 1, 2005 and held for the entire period until October 31, 2005.
ACTUAL EXPENSES
The first line in the table below provides information about actual account values and actual expenses. You may use the information in this line, together with the amount you invested, to estimate the expenses that you paid over the period. Simply divide your account value by $1,000 (for example, an $8,600 account value divided by $1,000 = 8.6), then multiply the result by the number in the first line of your Fund under the heading entitled "Expenses Paid During Period" to estimate the expenses you paid on your account during this period. If your account is an IRA, your expenses could have included a $15 annual fee. The amount of any fee paid through your account would increase the estimate of expenses you paid during the period and decrease your ending account value.
HYPOTHETICAL EXAMPLE FOR COMPARISON PURPOSES
The second line in the table below provides information about hypothetical account values and hypothetical expenses based on the Fund's actual expense ratio and an assumed rate of return of 5% per year before expenses, which is not the Fund's actual return. The hypothetical account values and expenses may not be used to estimate the actual ending account balance or expenses you paid for the period. You may use this information to compare the ongoing costs of investing in your Fund and other funds. To do so, compare this 5% hypothetical example with the 5% hypothetical examples that appear in the shareholder reports of the other funds. As in the case of the actual expense example, if your account is subject to an IRA fee, the amount of the fee paid through your account would increase the hypothetical expenses you would have paid during the period and decrease the hypothetical ending account value.
Please note that the expenses shown in the table are meant to highlight your ongoing costs only and do not reflect any transactional costs, such as sales charges, redemption fees, brokerage commissions paid on purchases and sales of fund shares. Therefore, the second line under the Fund in the table is useful in comparing ongoing costs only, and will not help you determine the relative total costs of owning different funds. If any of these transaction costs were included, your costs would be higher. The expenses shown in the table do not reflect any fees that may be charged to you by brokers, financial intermediaries or other financial institutions.
| | | Beginning
Account
Value | | Ending
Account
Value | | Annualized
Expense
Ratio | | Expenses Paid
During Period (a) | |
| Class A | |
| Actual | | $ | 1,000.00 | | | $ | 1,179.50 | | | | 1.34 | % | | $ | 7.36 | | |
| Hypothetical (b) | | | 1,000.00 | | | | 1,018.45 | | | | 1.34 | | | | 6.82 | | |
| Class B | |
| Actual | | | 1,000.00 | | | | 1,174.30 | | | | 2.18 | | | | 11.95 | | |
| Hypothetical (b) | | | 1,000.00 | | | | 1,014.22 | | | | 2.18 | | | | 11.07 | | |
| Class C | |
| Actual | | | 1,000.00 | | | | 1,175.70 | | | | 2.18 | | | | 11.96 | | |
| Hypothetical (b) | | | 1,000.00 | | | | 1,014.22 | | | | 2.18 | | | | 11.07 | | |
(a) Expenses are calculated using each Fund's annualized expense ratio (as disclosed in the table), multiplied by the average account value for the period, multiplied by number of days in the period (184 days), and divided by the number of days in the year (365 days).
(b) 5% return per year before expenses.
GRAPHICAL PRESENTATION OF SCHEDULE OF INVESTMENTS
By Sector
At October 31, 2005
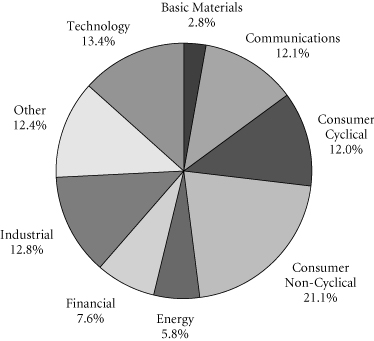
This chart shows the percentage breakdown by sector of the Fund's total investment securities.
Transamerica IDEX Mutual Funds
Annual Report 2005
3
TA IDEX Transamerica Equity
SCHEDULE OF INVESTMENTS
At October 31, 2005
(all amounts except share amounts in thousands)
| | | Shares | | Value | |
| COMMON STOCKS (95.7%) | | | |
| Business Services (4.6%) | | | |
| eBay, Inc. ‡ | | | 250,000 | | | $ | 9,900 | | |
| Moody's Corp. † | | | 139,500 | | | | 7,430 | | |
| Chemicals & Allied Products (6.5%) | | | |
| Praxair, Inc. | | | 235,000 | | | | 11,611 | | |
| Procter & Gamble Co. | | | 230,625 | | | | 12,913 | | |
| Communication (2.7%) | | | |
XM Satellite Radio Holdings,
Inc.–Class A ‡† | | | 350,000 | | | | 10,090 | | |
| Communications Equipment (4.9%) | | | |
| QUALCOMM, Inc. | | | 465,000 | | | | 18,488 | | |
| Computer & Data Processing Services (6.9%) | | | |
| Intuit, Inc. ‡ | | | 225,000 | | | | 10,334 | | |
| Microsoft Corp. | | | 600,000 | | | | 15,420 | | |
| Computer & Office Equipment (7.7%) | | | |
| Apple Computer, Inc. ‡ | | | 160,000 | | | | 9,214 | | |
| SanDisk Corp. ‡ | | | 335,000 | | | | 19,728 | | |
| Drug Stores & Proprietary Stores (3.3%) | | | |
| Walgreen Co. † | | | 270,000 | | | | 12,266 | | |
| Electronic & Other Electric Equipment (2.4%) | | | |
| General Electric Co. | | | 270,000 | | | | 9,156 | | |
| Engineering & Management Services (2.2%) | | | |
| Jacobs Engineering Group, Inc. ‡ | | | 130,000 | | | | 8,287 | | |
| Hotels & Other Lodging Places (5.3%) | | | |
| Marriott International, Inc.–Class A | | | 175,000 | | | | 10,434 | | |
| MGM Mirage, Inc. ‡† | | | 250,000 | | | | 9,343 | | |
| Industrial Machinery & Equipment (2.5%) | | | |
| Caterpillar, Inc. | | | 180,900 | | | | 9,514 | | |
| Insurance (4.0%) | | | |
| WellPoint, Inc. ‡ | | | 200,400 | | | | 14,966 | | |
| Management Services (2.3%) | | | |
| Paychex, Inc. | | | 220,000 | | | | 8,527 | | |
| Medical Instruments & Supplies (3.2%) | | | |
| Zimmer Holdings, Inc. ‡ | | | 185,000 | | | | 11,797 | | |
| Oil & Gas Extraction (4.5%) | | | |
| Anadarko Petroleum Corp. | | | 75,000 | | | | 6,803 | | |
| Schlumberger, Ltd. † | | | 110,000 | | | | 9,985 | | |
| Personal Services (2.0%) | | | |
| Weight Watchers International, Inc. ‡† | | | 145,000 | | | | 7,623 | | |
| Petroleum Refining (1.9%) | | | |
| Suncor Energy, Inc. | | | 130,100 | | | | 6,977 | | |
| | | Shares | | Value | |
| Pharmaceuticals (6.1%) | | | |
| Allergan, Inc. | | | 90,000 | | | $ | 8,037 | | |
| Genentech, Inc. ‡ | | | 165,000 | | | | 14,949 | | |
| Printing & Publishing (3.0%) | | | |
| McGraw-Hill Cos., Inc. (The) | | | 230,300 | | | | 11,271 | | |
| Retail Trade (3.6%) | | | |
| Staples, Inc. | | | 600,000 | | | | 13,638 | | |
| Security & Commodity Brokers (8.4%) | | | |
| American Express Co. | | | 260,420 | | | | 12,961 | | |
| Ameriprise Financial, Inc. ‡ | | | 100,724 | | | | 3,749 | | |
| Chicago Mercantile Exchange Holdings, Inc. † | | | 40,000 | | | | 14,606 | | |
| Transportation & Public Utilities (3.2%) | | | |
Expeditors International of
Washington, Inc. † | | | 200,000 | | | | 12,134 | | |
| Trucking & Warehousing (3.6%) | | | |
| United Parcel Service, Inc.–Class B | | | 185,000 | | | | 13,494 | | |
| Variety Stores (0.9%) | | | |
| Wal-Mart Stores, Inc. | | | 72,300 | | | | 3,421 | | |
| Total Common Stocks (cost: $289,239) | | | | | | | 359,066 | | |
| | | Principal | | Value | |
| SECURITY LENDING COLLATERAL (13.5%) | | | |
| Debt (12.5%) | | | |
| Bank Notes (0.8%) | | | |
Bank of America
| |
| 3.81%, due 06/07/2006 * | | $ | 1,415 | | | $ | 1,415 | | |
| 3.81%, due 08/10/2006 * | | | 1,404 | | | | 1,404 | | |
Credit Suisse First Boston Corp.
4.11%, due 03/10/2006 * | | | 281 | | | | 281 | | |
| Certificates Of Deposit (0.9%) | | | |
Canadian Imperial Bank of Commerce
4.07%, due 11/04/2005 * | | | 1,123 | | | | 1,123 | | |
Harris Trust & Savings Bank
3.80%, due 11/04/2005 * | | | 894 | | | | 894 | | |
Rabobank Nederland
4.03%, due 05/31/2006 * | | | 1,404 | | | | 1,404 | | |
| Commercial Paper (2.7%) | | | |
Ciesco LLC
4.00%, due 11/03/2005 | | | 1,402 | | | | 1,402 | | |
General Electric Capital Corp.
3.96%, due 12/05/2005 | | | 1,123 | | | | 1,123 | | |
Paradigm Funding LLC–144A
4.01%, due 11/07/2005 | | | 1,120 | | | | 1,120 | | |
Park Avenue Receivables Corp.–144A
4.03%, due 12/02/2005 | | | 1,112 | | | | 1,112 | | |
Preferred Receivables Corp.–144A
4.04%, due 12/05/2005 | | | 842 | | | | 842 | | |
The notes to the financial statements are an integral part of this report.
Transamerica IDEX Mutual Funds
Annual Report 2005
4
TA IDEX Transamerica Equity
SCHEDULE OF INVESTMENTS (continued)
At October 31, 2005
(all amounts except share amounts in thousands)
| | | Principal | | Value | |
| Commercial Paper (continued) | |
Ranger Funding Co. LLC–144A
| |
| 3.99%, due 11/15/2005 | | $ | 836 | | | $ | 836 | | |
Sheffield Receivables Corp.–144A
4.01%, due 11/08/2005 | | | 842 | | | | 842 | | |
Yorktown Capital LLC
3.97%, due 11/09/2005
3.93%, due 11/17/2005 | | | 1,399
1,394 | | | | 1,399
1,394 | | |
| Euro Dollar Overnight (2.9%) | |
Bank of Montreal
3.79%, due 11/01/2005 | | | 842 | | | | 842 | | |
Barclays
3.80%, due 11/04/2005 | | | 1,123 | | | | 1,123 | | |
BNP Paribas
3.83%, due 11/02/2005 | | | 1,685 | | | | 1,685 | | |
Deutsche Bank
3.80%, due 11/02/2005 | | | 2,808 | | | | 2,808 | | |
HSBC Banking/Holdings PLC
3.84%, due 11/07/2005 | | | 842 | | | | 842 | | |
Royal Bank of Scotland
3.76%, due 11/01/2005 | | | 1,123 | | | | 1,123 | | |
Svenska Handlesbanken
4.03%, due 11/01/2005 | | | 1,446 | | | | 1,446 | | |
UBS AG
3.80%, due 11/03/2005 | | | 1,123 | | | | 1,123 | | |
| Euro Dollar Terms (1.1%) | |
Royal Bank of Scotland
4.00%, due 12/12/2005 | | | 1,123 | | | | 1,123 | | |
UBS AG
4.02%, due 12/01/2005 | | | 1,123 | | | | 1,123 | | |
Wells Fargo
3.96%, due 11/14/2005 | | | 1,685 | | | | 1,685 | | |
| Promissory Notes (0.3%) | |
Goldman Sachs Group, Inc.
4.02%, due 12/28/2005 | | | 1,179 | | | | 1,179 | | |
| | | Principal | | Value | |
| Repurchase Agreements (3.8%) †† | | | |
Credit Suisse First Boston Corp.
| |
4.10%, dated 10/31/2005 to be
| |
| repurchased at $1,914 on 11/01/2005 | | $ | 1,913 | | | $ | 1,913 | | |
Goldman Sachs Group, Inc. (The)
4.10%, dated 10/31/2005 to be
repurchased at $4,774 on 11/01/2005 | | | 4,773 | | | | 4,773 | | |
Lehman Brothers, Inc. 4.10%,
dated 10/31/2005 to be
repurchased at $132 on 11/01/2005 | | | 132 | | | | 132 | | |
Merrill Lynch & Co. 4.10%,
dated 10/31/2005 to be
repurchased at $5,616 on 11/01/2005 | | | 5,615 | | | | 5,615 | | |
Morgan Stanley Dean Witter & Co.
4.17%, dated 10/31/2005 to be
repurchased at $1,683 on 11/01/2005 | | | 1,683 | | | | 1,683 | | |
| | | Shares | | Value | |
| Investment Companies (1.0%) | | | |
| Money Market Funds (1.0%) | | | |
American Beacon Fund
1-day yield of 3.81% | | | 1,210,586 | | | $ | 1,211 | | |
Barclays Global Investors Institutional
Money Market Fund
1-day yield of 3.92% | | | 1,123,059 | | | | 1,123 | | |
Goldman Sachs Financial Square
Prime Obligations Fund
1-day yield of 3.79% | | | 174,936 | | | | 175 | | |
Merrimac Cash Fund,
Premium Class
1-day yield of 3.70% @ | | | 1,110,647 | | | | 1,111 | | |
| Total Security Lending Collateral (cost: $50,429) | | | | | | | 50,429 | | |
| Total Investment Securities (cost: $339,668) | | | | | | $ | 409,495 | | |
| SUMMARY: | | | |
| Investment securities, at value | | | 109.2 | % | | $ | 409,495 | | |
| Liabilities in excess of other assets | | | (9.2 | )% | | | (34,339 | ) | |
| Net assets | | | 100.0 | % | | $ | 375,156 | | |
NOTES TO SCHEDULE OF INVESTMENTS:
‡ Non-income producing.
† At October 31, 2005, all or a portion of this security is on loan (see Note 1). The value at October 31, 2005, of all securities on loan is $49,147.
* Floating or variable rate note. Rate is listed as of October 31, 2005.
†† Cash collateral for the Repurchase Agreements, valued at $14,400, that serve as collateral for securities lending are invested in corporate bonds with interest rates and maturity dates ranging from 0.00%–9.86% and 12/31/2005–11/15/2096, respectively.
@ Regulated investment company advised by Investors Bank and Trust Co. ("IBT"). IBT is also the accounting, custody and lending agent for the Fund.
DEFINITIONS:
144A 144A Securities are registered pursuant to Rule 144A of the Securities Act of 1933. These securities are deemed to be liquid for purposes of compliance limitations on holdings of illiquid securities and may be resold as transactions exempt from registration, normally to qualified institutional buyers. At October 31, 2005, these securities aggregated $4,752 or 1.3% of the net assets of the Fund.
The notes to the financial statements are an integral part of this report.
Transamerica IDEX Mutual Funds
Annual Report 2005
5
TA IDEX Transamerica Equity
STATEMENT OF ASSETS AND LIABILITIES
At October 31, 2005
(all amounts except per share amounts in thousands)
| Assets: | | | |
Investment securities, at value (cost: $339,668)
(including securities loaned of $49,147) | | $ | 409,495 | | |
| Cash | | | 32,196 | | |
| Receivables: | |
| Shares of beneficial interest sold | | | 1,721 | | |
| Interest | | | 61 | | |
| Dividends | | | 158 | | |
| Other | | | 25 | | |
| | | | 443,656 | | |
| Liabilities: | | | |
| Investment securities purchased | | | 17,294 | | |
| Accounts payable and accrued liabilities: | |
| Shares of beneficial interest redeemed | | | 234 | | |
| Management and advisory fees | | | 230 | | |
| Distribution and service fees | | | 146 | | |
| Transfer agent fees | | | 81 | | |
| Administration fees | | | 6 | | |
| Payable for collateral for securities on loan | | | 50,429 | | |
| Other | | | 80 | | |
| | | | 68,500 | | |
| Net Assets | | $ | 375,156 | | |
| Net Assets Consist of: | | | |
Shares of beneficial interest, unlimited shares
authorized, no par value | | $ | 417,643 | | |
| Undistributed net investment income (loss) | | | 22 | | |
Accumulated net realized gain (loss) from investment
securities | | | (112,334 | ) | |
Net unrealized appreciation (depreciation) on
investment securities | | | 69,825 | | |
| Net Assets | | $ | 375,156 | | |
| Net Assets by Class: | | | |
| Class A | | $ | 301,635 | | |
| Class B | | | 49,865 | | |
| Class C | | | 23,656 | | |
| Shares Outstanding: | | | |
| Class A | | | 34,013 | | |
| Class B | | | 5,873 | | |
| Class C | | | 2,783 | | |
| Net Asset Value Per Share: | | | |
| Class A | | $ | 8.87 | | |
| Class B | | | 8.49 | | |
| Class C | | | 8.50 | | |
| Maximum Offering Price Per Share (a): | | | |
| Class A | | $ | 9.39 | | |
(a) Includes the maximum selling commission (represented as a percentage of offering price) which is reduced on certain levels of sales as set forth in the Prospectus. Net asset value per share for Classes B and C shares represents offering price. The redemption price for Classes B and C shares equals net asset value less any applicable contingent deferred sales charge.
STATEMENT OF OPERATIONS
For the year ended October 31, 2005
(all amounts in thousands)
| Investment Income: | | | |
| Interest | | $ | 135 | | |
Dividends (net of withholding taxes on
foreign dividends of $1) | | | 3,259 | | |
| Income from loaned securities–net | | | 37 | | |
| | | | 3,431 | | |
| Expenses: | | | |
| Management and advisory fees | | | 2,324 | | |
| Distribution and service fees: | |
| Class A | | | 827 | | |
| Class B | | | 488 | | |
| Class C | | | 231 | | |
| Transfer agent fees: | |
| Class A | | | 355 | | |
| Class B | | | 358 | | |
| Class C | | | 101 | | |
| Printing and shareholder reports | | | 156 | | |
| Custody fees | | | 33 | | |
| Administration fees | | | 59 | | |
| Legal fees | | | 20 | | |
| Audit fees | | | 20 | | |
| Trustees fees | | | 14 | | |
| Registration fees: | |
| Class A | | | 20 | | |
| Class B | | | 10 | | |
| Class C | | | 4 | | |
| Other | | | 2 | | |
| Total expenses | | | 5,022 | | |
| Less: | |
| Reimbursement of class expenses: | |
| Class B | | | (211 | ) | |
| Class C | | | (30 | ) | |
| Total reimbursed expenses | | | (241 | ) | |
| Net expenses | | | 4,781 | | |
| Net Investment Income (Loss) | | | (1,350 | ) | |
| Net Realized and Unrealized Gain (Loss): | | | |
| Realized gain (loss) from investment securities | | | 12,626 | | |
Increase (decrease) in unrealized appreciation
(depreciation) on investment securities | | | 45,449 | | |
| Net Gain (Loss) on Investment Securities | | | 58,075 | | |
Net Increase (Decrease) in Net Assets Resulting
from Operations | | $ | 56,725 | | |
The notes to the financial statements are an integral part of this report.
Transamerica IDEX Mutual Funds
Annual Report 2005
6
TA IDEX Transamerica Equity
STATEMENTS OF CHANGES IN NET ASSETS
For the years ended
(all amounts in thousands)
| | | October 31,
2005 | | October 31,
2004 | |
| Increase (Decrease) In Net Assets From: | | | |
| Operations: | | | |
| Net investment income (loss) | | $ | (1,350 | ) | | $ | (1,454 | ) | |
Net realized gain (loss) from
investment securities | | | 12,626 | | | | 13,061 | | |
Net unrealized appreciation
(depreciation) on investment
securities | | | 45,449 | | | | (5,046 | ) | |
| | | | 56,725 | | | | 6,561 | | |
| Distributions to Shareholders: | | | |
| From net realized gains: | |
| Class A | | | (3,512 | ) | | | – | | |
| Class B | | | (861 | ) | | | – | | |
| Class C | | | (391 | ) | | | – | | |
| | | | (4,764 | ) | | | – | | |
| Capital Share Transactions: | | | |
| Proceeds from shares sold: | |
| Class A | | | 100,539 | | | | 60,100 | | |
| Class B | | | 5,207 | | | | 3,345 | | |
| Class C | | | 3,999 | | | | 4,567 | | |
| Class C2 | | | – | | | | 281 | | |
| Class M | | | – | | | | 197 | | |
| | | | 109,745 | | | | 68,490 | | |
| Proceeds from fund acquisition: | |
| Class A | | | – | | | | 62,968 | | |
| Class B | | | – | | | | 45,759 | | |
| Class C | | | – | | | | 899 | | |
| Class C2 | | | – | | | | 6,690 | | |
| Class M | | | – | | | | 8,963 | | |
| | | | – | | | | 125,279 | | |
Dividends and distributions
reinvested: | |
| Class A | | | 3,494 | | | | – | | |
| Class B | | | 840 | | | | – | | |
| Class C | | | 363 | | | | – | | |
| | | | 4,697 | | | | – | | |
| Cost of shares redeemed: | |
| Class A | | | (20,013 | ) | | | (9,235 | ) | |
| Class B | | | (11,503 | ) | | | (5,696 | ) | |
| Class C | | | (6,318 | ) | | | (1,786 | ) | |
| Class C2 | | | – | | | | (302 | ) | |
| Class M | | | – | | | | (741 | ) | |
| | | | (37,834 | ) | | | (17,760 | ) | |
| Class level exchanges: | |
| Class C | | | – | | | | 16,496 | | |
| Class C2 | | | – | | | | (7,469 | ) | |
| Class M | | | – | | | | (9,027 | ) | |
| | | | – | | | | – | | |
| Automatic conversions: | |
| Class A | | | 644 | | | | 327 | | |
| Class B | | | (644 | ) | | | (327 | ) | |
| | | | – | | | | – | | |
| | | | 76,608 | | | | 176,009 | | |
| Net increase (decrease) in net assets | | | 128,569 | | | | 182,570 | | |
| Net Assets: | | | |
| Beginning of year | | | 246,587 | | | | 64,017 | | |
| End of year | | $ | 375,156 | | | $ | 246,587 | | |
Undistributed Net Investment Income
(Loss) | | $ | 22 | | | $ | (19 | ) | |
| | | October 31,
2005 | | October 31,
2004 | |
| Share Activity: | |
| Shares issued: | |
| Class A | | | 12,215 | | | | 8,273 | | |
| Class B | | | 665 | | | | 475 | | |
| Class C | | | 517 | | | | 650 | | |
| Class C2 | | | – | | | | 40 | | |
| Class M | | | – | | | | 28 | | |
| | | | 13,397 | | | | 9,466 | | |
| Shares issued on fund acquisition: | |
| Class A | | | – | | | | 8,474 | | |
| Class B | | | – | | | | 6,356 | | |
| Class C | | | – | | | | 125 | | |
| Class C2 | | | – | | | | 929 | | |
| Class M | | | – | | | | 1,238 | | |
| | | | – | | | | 17,122 | | |
Shares issued–reinvested from
distributions: | |
| Class A | | | 434 | | | | – | | |
| Class B | | | 108 | | | | – | | |
| Class C | | | 46 | | | | – | | |
| | | | 588 | | | | – | | |
| Shares redeemed: | |
| Class A | | | (2,485 | ) | | | (1,268 | ) | |
| Class B | | | (1,484 | ) | | | (809 | ) | |
| Class C | | | (811 | ) | | | (254 | ) | |
| Class C2 | | | – | | | | (43 | ) | |
| Class M | | | – | | | | (105 | ) | |
| | | | (4,780 | ) | | | (2,479 | ) | |
| Class level exchanges: | |
| Class C | | | – | | | | 2,295 | | |
| Class C2 | | | – | | | | (1,035 | ) | |
| Class M | | | – | | | | (1,254 | ) | |
| | | | – | | | | 6 | | |
| Automatic conversions: | |
| Class A | | | 80 | | | | 34 | | |
| Class B | | | (83 | ) | | | (46 | ) | |
| | | | (3 | ) | | | (12 | ) | |
Net increase (decrease) in shares
outstanding: | | | | | | | | | |
| Class A | | | 10,244 | | | | 15,513 | | |
| Class B | | | (794 | ) | | | 5,976 | | |
| Class C | | | (248 | ) | | | 2,816 | | |
| Class C2 | | | – | | | | (109 | ) | |
| Class M | | | – | | | | (93 | ) | |
| | | | 9,202 | | | | 24,103 | | |
The notes to the financial statements are an integral part of this report.
Transamerica IDEX Mutual Funds
Annual Report 2005
7
TA IDEX Transamerica Equity
FINANCIAL HIGHLIGHTS
| | | | | For a share of beneficial interest outstanding throughout each period | |
| | | | | Net Asset | | Investment Operations | | Distributions | | Net Asset | |
| | | For the
Period
Ended (d)(g) | | Value,
Beginning
of Period | | Net
Investment
Income (Loss) | | Net Realized
and Unrealized
Gain (Loss) | | Total
Operations | | From Net
Investment
Income | | From Net
Realized
Gains | | Total
Distributions | | Value,
End
of Period | |
| Class A | | 10/31/2005 | | $ | 7.44 | | | $ | (0.02 | ) | | $ | 1.58 | | | $ | 1.56 | | | $ | – | | | $ | (0.13 | ) | | $ | (0.13 | ) | | $ | 8.87 | | |
| | | 10/31/2004 | | | 6.86 | | | | (0.07 | ) | | | 0.65 | | | | 0.58 | | | | – | | | | – | | | | – | | | | 7.44 | | |
| | | 10/31/2003 | | | 5.52 | | | | (0.05 | ) | | | 1.39 | | | | 1.34 | | | | – | | | | – | | | | – | | | | 6.86 | | |
| | | 10/31/2002 | | | 6.38 | | | | (0.07 | ) | | | (0.79 | ) | | | (0.86 | ) | | | – | | | | – | | | | – | | | | 5.52 | | |
| | | 10/31/2001 | | | 10.16 | | | | (0.10 | ) | | | (3.68 | ) | | | (3.78 | ) | | | – | | | | – | | | | – | | | | 6.38 | | |
| Class B | | 10/31/2005 | | | 7.19 | | | | (0.08 | ) | | | 1.51 | | | | 1.43 | | | | – | | | | (0.13 | ) | | | (0.13 | ) | | | 8.49 | | |
| | | 10/31/2004 | | | 6.68 | | | | (0.11 | ) | | | 0.62 | | | | 0.51 | | | | – | | | | – | | | | – | | | | 7.19 | | |
| | | 10/31/2003 | | | 5.40 | | | | (0.09 | ) | | | 1.37 | | | | 1.28 | | | | – | | | | – | | | | – | | | | 6.68 | | |
| | | 10/31/2002 | | | 6.29 | | | | (0.12 | ) | | | (0.77 | ) | | | (0.89 | ) | | | – | | | | – | | | | – | | | | 5.40 | | |
| | | 10/31/2001 | | | 10.12 | | | | (0.16 | ) | | | (3.67 | ) | | | (3.83 | ) | | | – | | | | – | | | | – | | | | 6.29 | | |
| Class C | | 10/31/2005 | | | 7.20 | | | | (0.08 | ) | | | 1.51 | | | | 1.43 | | | | – | | | | (0.13 | ) | | | (0.13 | ) | | | 8.50 | | |
| | | 10/31/2004 | | | 6.68 | | | | (0.11 | ) | | | 0.63 | | | | 0.52 | | | | – | | | | – | | | | – | | | | 7.20 | | |
| | | 10/31/2003 | | | 5.30 | | | | (0.09 | ) | | | 1.47 | | | | 1.38 | | | | – | | | | – | | | | – | | | | 6.68 | | |
| | | | | | | Ratios/Supplemental Data | |
| | | For the
Period | | Total | | Net Assets,
End of
Period | | Ratio of Expenses
to Average
Net Assets (a) | | Net Investment
Income (Loss)
to Average | | Portfolio
Turnover | |
| | | Ended (g) | | Return (c) | | (000's) | | Net (e) | | Total (f) | | Net Assets (a) | | Rate (b) | |
| Class A | | 10/31/2005 | | | 21.16 | % | | $ | 301,635 | | | | 1.36 | % | | | 1.36 | % | | | (0.27 | )% | | | 39 | % | |
| | | 10/31/2004 | | | 8.45 | | | | 176,851 | | | | 1.50 | | | | 1.50 | | | | (0.90 | ) | | | 97 | | |
| | | 10/31/2003 | | | 24.28 | | | | 56,618 | | | | 1.56 | | | | 1.56 | | | | (0.87 | ) | | | 55 | | |
| | | 10/31/2002 | | | (13.50 | ) | | | 25,127 | | | | 1.74 | | | | 2.32 | | | | (1.19 | ) | | | 19 | | |
| | | 10/31/2001 | | | (37.20 | ) | | | 2,750 | | | | 1.55 | | | | 2.75 | | | | (1.15 | ) | | | 42 | | |
| Class B | | 10/31/2005 | | | 20.03 | | | | 49,865 | | | | 2.18 | | | | 2.61 | | | | (0.99 | ) | | | 39 | | |
| | | 10/31/2004 | | | 7.68 | | | | 47,928 | | | | 2.20 | | | | 2.72 | | | | (1.62 | ) | | | 97 | | |
| | | 10/31/2003 | | | 23.70 | | | | 4,613 | | | | 2.21 | | | | 2.21 | | | | (1.52 | ) | | | 55 | | |
| | | 10/31/2002 | | | (14.22 | ) | | | 2,732 | | | | 2.39 | | | | 2.98 | | | | (1.84 | ) | | | 19 | | |
| | | 10/31/2001 | | | (37.78 | ) | | | 3,070 | | | | 2.20 | | | | 3.40 | | | | (1.80 | ) | | | 42 | | |
| Class C | | 10/31/2005 | | | 20.05 | | | | 23,656 | | | | 2.18 | | | | 2.31 | | | | (1.00 | ) | | | 39 | | |
| | | 10/31/2004 | | | 7.78 | | | | 21,808 | | | | 2.20 | | | | 2.55 | | | | (1.63 | ) | | | 97 | | |
| | | 10/31/2003 | | | 26.04 | | | | 1,435 | | | | 2.21 | | | | 2.21 | | | | (1.52 | ) | | | 55 | | |
NOTES TO FINANCIAL HIGHLIGHTS
(a) Annualized.
(b) Not annualized.
(c) Total Return has been calculated for the applicable period without deduction of a sales load, if any, on an initial purchase. Periods of less than one year are not annualized.
(d) Per share information is calculated based on average number of shares outstanding.
(e) Ratio of Net Expenses to Average Net Assets is net of fee waivers and reimbursements by the investment adviser, if any (see note 2).
(f) Ratio of Total Expenses to Average Net Assets includes all expenses before fee waivers and reimbursements by the investment adviser.
(g) TA IDEX Transamerica Equity commenced operations on March 1, 2000. The inception date for the Fund's offering of share Class C was November 11, 2002.
The notes to the financial statements are an integral part of this report.
Transamerica IDEX Mutual Funds
Annual Report 2005
8
TA IDEX Transamerica Equity
NOTES TO FINANCIAL STATEMENTS
At October 31, 2005
(all amounts in thousands)
NOTE 1. ORGANIZATION AND SIGNIFICANT ACCOUNTING POLICIES
Transamerica IDEX Mutual Funds is an open-end management investment company registered under the Investment Company Act of 1940, as amended (the "1940 Act").
In the normal course of business, TA IDEX Transamerica Equity (the "Fund") enters into contracts that contain a variety of representations that provide general indemnifications. The Fund's maximum exposure under these arrangements is unknown, as this would involve future claims that may be made against the Fund and/or its affiliates that have not yet occurred. However, based on experience, the Fund expects the risk of loss to be remote.
This report should be read in conjunction with the current Fund prospectus, which contains more complete information about the Fund.
The following is a summary of significant accounting policies followed by the Fund in the preparation of the financial statements. In preparing the Fund's financial statements in accordance with accounting principles generally accepted in the United States of America ("GAAP"), estimates or assumptions (which could differ from actual results) may be used that affect reported amounts and disclosures.
On May 28, 2004, the Fund acquired all of the net assets of TA IDEX Alger Aggressive Growth pursuant to a plan of reorganization. TA IDEX Transamerica Equity is the accounting survivor. The acquisition was accomplished by a tax free exchange of 17,122 shares of the Fund for 6,508 shares of TA IDEX Alger Aggressive Growth outstanding on May 27, 2004. TA IDEX Alger Aggressive Growth's net assets at that date, $125,279, including $17,570 unrealized appreciation, were combined with those of the Fund. The aggregate net assets of TA IDEX Transamerica Equity immediately before the acquisition was $86,465, the combined net assets of the Fund immediately after the acquisition was $211,744. Proceeds in connection with the acquisition were as follows:
| | | Shares | | Amount | |
| Proceeds in connection with the acquisition | |
| Class A | | | 8,474 | | | $ | 62,968 | | |
| Class B | | | 6,356 | | | | 45,759 | | |
| Class C | | | 125 | | | | 899 | | |
| Class C2 | | | 929 | | | | 6,690 | | |
| Class M | | | 1,238 | | | | 8,963 | | |
| | | | | | | $ | 125,279 | | |
Multiple class operations, income and expenses: The Fund currently offers three classes of shares, each with a public offering price that reflects different sales charges, if any, and expense levels. On June 15, 2004, Class C2 shares merged into Class C. On September 24, 2004, Class M shares merged into Class C. Class B shares will convert to Class A shares eight years after purchase. Income, non-class specific expenses and realized and unrealized gains and losses, are allocated daily to each class, based upon the value of shares outstanding method as permitted under Rule 18f-3 of the 1940 Act. Each class bears its own specific expenses as well as a porti on of general, common expenses.
Security valuations: The Fund values its investments at the close of the New York Stock Exchange ("NYSE"), normally 4 p.m. ET, each day the NYSE is open for business. Fund investments are valued at the last sale price or closing price on the day of valuation taken from the primary exchange where the security is principally traded.
Securities traded in the over-the-counter market and listed securities for which no sale was reported on that date are valued at the last quoted bid price.
Debt securities are valued based on a price quotation or other equivalent indication of value supplied by an exchange, a pricing service or a major market maker.
Investment company securities are valued at the net asset value of the underlying portfolio.
Other securities for which quotations are not readily available or whose values have been determined to be unreliable are valued at fair market value as determined in good faith by the Fund's Administrative Valuation Committee, under the supervision of the Board's Valuation Committee, using guidelines adopted by the Board of Trustees.
Cash: The Fund may leave cash overnight in its cash account with the custodian, Investors Bank & Trust Company ("IBT"). IBT has been contracted on behalf of the Fund to invest the excess cash into a savings account, which at October 31, 2005, was paying an interest rate of 2.76%.
Repurchase agreements: The Fund is authorized to enter into repurchase agreements. The Fund, through its custodian, Investors Bank & Trust Company ("IBT"), receives delivery of the underlying securities, the value of which at the time of purchase is required to be an amount equal to at least 100% of the resale price. The Fund will bear the risk of value fluctuations until the security can be sold and may encounter delays and incur costs in liquidating the security. In the event of bankruptcy or insolvency of the seller, delays and costs may be incurred.
Commission recapture: The sub-adviser, to the extent consistent with the best execution and usual commission rate policies and practices, may place security transactions of the Fund with broker/dealers with which Transamerica IDEX Mutual Funds has established a Commission Recapture Program. A Commission Recapture Program is any arrangement under which a broker/dealer applies a portion of the commissions received by such broker/dealer on the security transactions to the Fund. In no event will commissions paid by the Fund be used to pay expenses that would otherwise be borne by any other funds within Transamerica IDEX Mutual Funds, or by any other party.
Transamerica IDEX Mutual Funds
Annual Report 2005
9
TA IDEX Transamerica Equity
NOTES TO FINANCIAL STATEMENTS (continued)
At October 31, 2005
(all amounts in thousands)
NOTE 1.–(continued)
Recaptured commissions during the year ended October 31, 2005, of $24 are included in net realized gains in the Statement of Operations.
Securities lending: The Fund may lend securities to qualified borrowers, with IBT acting as the Fund's lending agent. The Fund earns negotiated lenders' fees. The Fund receives cash and/or securities as collateral against the loaned securities. Cash collateral received is invested in short term, interest bearing securities. The Fund monitors the market value of securities loaned on a daily basis and requires collateral in an amount at least equal to the value of the securities loaned. Income from loaned securities on the Statement of Operations is net of fees, in the amount of $16, earned by IBT for its services.
Security transactions and investment income: Security transactions are recorded on the trade date. Security gains and losses are calculated on the specific identification basis. Dividend income, if any, is recorded on the ex-dividend date or, in the case of foreign securities, as soon as the Fund is informed of the ex-dividend date. Interest income, including accretion of discounts and amortization of premiums, is recorded on the accrual basis commencing on the settlement date.
Redemption fees: A short-term trading redemption fee may be assessed on any Fund shares in a fund account that are sold during the first five (5) NYSE trading days following their purchase date. This redemption fee will equal 2% of the amount redeemed and shares held the longest will be treated as being redeemed first and shares held the shortest as being redeemed last. For the year ended October 31, 2005, the Fund received less than $1 in redemption fees.
Dividend distributions: Distributions to shareholders are recorded on the ex-dividend date and are determined in accordance with Federal income tax regulations which may differ from GAAP.
NOTE 2. RELATED PARTY TRANSACTIONS
Effective January 1, 2005 AEGON/Transamerica Fund Advisors, Inc. was renamed Transamerica Fund Advisors, Inc. ("TFAI"); AEGON/Transamerica Fund Services, Inc. and AEGON/Transamerica Investor Services, Inc. merged into one entity and was renamed Transamerica Fund Services, Inc. ("TFS").
TFAI is the Fund's investment adviser. TFS is the Fund's administrator and transfer agent. AFSG Securities Corp. ("AFSG") is the Fund's distributor/principal underwriter. TFAI, TFS , and AFSG are affiliates of AEGON, NV, a Netherlands corporation.
Transamerica Investment Management, LLC is both an affiliate of the Fund and a sub-adviser to the Fund.
The following schedule represents the percentage of Fund assets owned by affiliated mutual funds:
| | | Net
Assets | | % of
Net Assets | |
TA IDEX Asset Allocation–
Conservative Portfolio | | $ | 11,133 | | | | 2.97 | % | |
TA IDEX Asset Allocation–
Growth Portfolio | | | 81,025 | | | | 21.60 | % | |
TA IDEX Asset Allocation–
Moderate Growth Portfolio | | | 95,423 | | | | 25.44 | % | |
TA IDEX Asset Allocation–
Moderate Portfolio | | | 44,187 | | | | 11.78 | % | |
| Total | | $ | 231,768 | | | | 61.79 | % | |
Investment advisory fees: The Fund pays management fees to TFAI based on average daily net assets ("ANA") at the following breakpoints:
From November 1, 2004 to December 31, 2004:
0.775% of the first $500 million of ANA
0.70% of ANA over $500 million
From January 1, 2005 on:
0.75% of the first $500 million of ANA
0.70% of ANA over $500 million
TFAI has contractually agreed to waive its advisory fee and will reimburse the Fund to the extent that operating expenses, excluding 12b-1 fees, exceed the following stated annual limit:
From November 1, 2004 to December 31, 2004:
1.20% Expense Limit
From January 1, 2005 on:
1.175% Expense Limit
Distribution and service fees: The Fund has a 12b-1 distribution plan under the 1940 Act pursuant to which an annual fee, based on average daily net assets, is paid to the distributor for various disbursements such as broker-dealer account servicing fees and other promotional expenses of the Fund. The Fund is authorized under the 12b-1 plan to pay fees on each class up to the following limits:
| Class A | | | 0.35 | % | |
| Class B | | | 1.00 | % | |
| Class C | | | 1.00 | % | |
In the case the Fund or a class of shares of the Fund is closed to new investors or investments, the Fund is authorized to pay 12b-1 fees for past sales and distribution efforts and present and past investor services.
Transamerica IDEX Mutual Funds
Annual Report 2005
10
TA IDEX Transamerica Equity
NOTES TO FINANCIAL STATEMENTS (continued)
At October 31, 2005
(all amounts in thousands)
NOTE 2.–(continued)
Underwriter commissions relate to front-end sales charges imposed for Class A shares and contingent deferred sales charges from Classes B, C, and certain A share redemptions. For the year ended October 31, 2005, the underwriter commissions were as follows:
| Received by Underwriter | | $ | 442 | | |
| Retained by Underwriter | | | 23 | | |
| Contingent Deferred Sales Charge | | | 90 | | |
Administrative services: The Fund has entered into an agreement with TFS for financial and legal fund administration services. As of January 1, 2005 the Fund pays TFS an annual fee of 0.02% of ANA. Prior to January 1, 2005 the Fund paid TFS an annual fee of 0.015% of ANA. The Legal fees on the Statement of Operations are for fees paid to external legal counsel.
Transfer agent fees: The Fund pays TFS an annual per-account charge for each open and closed account. The Fund paid TFS $727 for the year ended October 31, 2005.
Deferred compensation plan: Each eligible independent Fund Trustee may elect to participate in a non-qualified deferred compensation plan maintained by Transamerica IDEX Mutual Funds (the "Plan"). Under the Plan, such Trustees may defer payment of all or a portion of their total fees earned as a Fund Trustee. Each Trustee who is a participant in the Plan may elect that the earnings, losses or gains credited to his or her deferred fee amounts be determined based on a deemed investment in any series of Transamerica IDEX Mutual Funds, including the Fund. The right of a participant to receive a distribution from the Plan of the deferred fees is an unsecured claim against the general assets of all series of Transamerica IDEX Mutual Funds. The pro rata liability to the Fund of all deferred fees i n the Plan amounted, as of October 31, 2005, to $25.
NOTE 3. INVESTMENT TRANSACTIONS
The cost of securities purchased and proceeds from securities sold (excluding short-term securities) for the year ended October 31, 2005, were as follows:
| Purchases of securities: | | | |
| Long-Term | | $ | 167,313 | | |
| U.S. Government | | | – | | |
| Proceeds from maturities and sales of securities: | | | |
| Long-Term | | | 117,035 | | |
| U.S. Government | | | – | | |
NOTE 4. FEDERAL INCOME TAX MATTERS
The Fund has not made any provision for federal income or excise taxes due to its policy to distribute all of its taxable income and capital gains to its shareholders and otherwise qualify as a regulated investment company under Subchapter M of the Internal Revenue Code. Income and capital gain distributions are determined in accordance with income tax regulations, which may differ from GAAP. These differences are primarily due to differing treatment for items including, but not limited to, wash sales, net operating losses and capital loss carryforwards.
Therefore, distributions determined in accordance with tax regulations may differ significantly in amount or character from net investment income and realized gains for financial reporting purposes. Financial reporting records are adjusted for permanent book/tax differences to reflect tax character. Financial records are not adjusted for temporary differences. These reclassifications are as follows:
Shares of beneficial interest, unlimited
shares authorized | | $ | (1,391 | ) | |
| Undistributed net investment income (loss) | | | 1,391 | | |
The capital loss carryforwards are available to offset future realized capital gains through the periods listed:
Capital Loss
Carryforward | | Available through | |
| $ | 67,350 | | | October 31, 2008 | |
| | 48,961 | | | October 31, 2009 | |
The capital loss carryforward utilized during the year ended October 31, 2005 was $7,898.
The tax character of distributions paid may differ from the character of distributions shown in the Statement of Changes in Net Assets due to short-term gains being treated as ordinary income for tax purposes. The tax character of distributions paid during 2004 and 2005 was as follows:
| 2004 Distributions paid from: | |
| Ordinary Income | | $ | – | | |
| Long-term Capital Gain | | | – | | |
| 2005 Distributions paid from: | |
| Ordinary Income | | | – | | |
| Long-term Capital Gain | | | 4,764 | | |
The tax basis components of distributable earnings as of October 31, 2005, are as follows:
| Undistributed Ordinary Income | | $ | – | | |
| Undistributed Long-term Capital Gains | | $ | 4,411 | | |
| Capital Loss Carryforward | | $ | (116,311 | ) | |
| Net Unrealized Appreciation (Depreciation) | | $ | 69,430 | * | |
*Amount includes unrealized appreciation (depreciation) from deferred compensation.
Transamerica IDEX Mutual Funds
Annual Report 2005
11
TA IDEX Transamerica Equity
NOTES TO FINANCIAL STATEMENTS (continued)
At October 31, 2005
(all amounts in thousands)
NOTE 4.–(continued)
The aggregate cost of investments and composition of unrealized appreciation (depreciation) for federal income tax purposes as of October 31, 2005, are as follows:
| Federal Tax Cost Basis | | $ | 340,063 | | |
| Unrealized Appreciation | | $ | 71,633 | | |
| Unrealized (Depreciation) | | | (2,201 | ) | |
| Net Unrealized Appreciation (Depreciation) | | $ | 69,432 | | |
NOTE 5. REGULATORY PROCEEDINGS
There continues to be significant federal and state regulatory activity relating to financial services companies, particularly mutual fund companies and their investment advisers. As part of an ongoing investigation regarding potential market timing, recordkeeping and trading compliance issues and matters affecting the Fund's investment adviser, TFAI, and certain affiliates and former employees of TFAI, the SEC staff has indicated that it is likely to take some action against TFAI and certain of its affiliates at the conclusion of the investigation. The potential timing and the scope of any such action is difficult to predict. Although the impact of any action brought against TFAI and/or its affiliates is difficult to assess at the present time, the Fund currently believes that the likelihood that any such action will have a material adverse impact on it is remote. It is important to note that the Fund is not aware of any allegation of wrongdoing against it and its Board at the time this annual report is printed. Although it is not anticipated that these developments will have an adverse impact on the Fund, there can be no assurance at this time. TFAI and its affiliates are actively working with the SEC in regard to this matter; however, the exact resolution cannot be determined at this time. TFAI will take such actions that it deems necessary or appropriate to continue providing management services to the Fund and to bring all matters to an appropriate conclusion.
TFAI and/or its affiliates, and not the Fund, will bear the costs regarding these regulatory matters.
Transamerica IDEX Mutual Funds
Annual Report 2005
12
Report of Independent Registered Certified Public Accounting Firm
To the Board of Trustees and Shareholders of
TA IDEX Transamerica Equity
In our opinion, the accompanying statement of assets and liabilities, including the schedule of investments, and the related statements of operations and of changes in net assets and the financial highlights present fairly, in all material respects, the financial position of TA IDEX Transamerica Equity (the "Fund") (one of the portfolios constituting the Transamerica IDEX Mutual Funds) at October 31, 2005, the results of its operations for the year then ended, the changes in its net assets for each of the two years in the period then ended and the financial highlights for each of the periods presented, in conformity with accounting principles generally accepted in the United States of America. These financial statements and financial highlights (hereafter referred to as "financial statements") are the responsibility of the Fund's management; our responsibility is to express an opinion on these fina ncial statements based on our audits. We conducted our audits of these financial statements in accordance with the standards of the Public Company Accounting Oversight Board (United States). Those standards require that we plan and perform the audit to obtain reasonable assurance about whether the financial statements are free of material misstatement. An audit includes examining, on a test basis, evidence supporting the amounts and disclosures in the financial statements, assessing the accounting principles used and significant estimates made by management, and evaluating the overall financial statement presentation. We believe that our audits, which included confirmation of securities at October 31, 2005 by correspondence with the custodian and brokers, provide a reasonable basis for our opinion.

December 22, 2005
Transamerica IDEX Mutual Funds
Annual Report 2005
13
TA IDEX Transamerica Equity
SUPPLEMENTAL INFORMATION (unaudited)
TAX INFORMATION
For tax purposes, the Fund has made a Long-Term Capital Gain Designation of $4,764 for the year ended October 31, 2005.
Transamerica IDEX Mutual Funds
Annual Report 2005
14
TA IDEX Transamerica Flexible Income
MARKET ENVIRONMENT
The Lehman Brothers U.S. Government/Credit Index ("LBGC") advanced 0.83% during this twelve month period as yields on short-term securities rose more rapidly than long-term yields.
With the U.S. economic recovery on solid ground, the Federal Reserve Board ("Fed") adhered to a policy of returning rates, which had reached historically low levels in mid-2004, to what is widely considered a "normal" or "neutral" level (i.e., 4% to 4.5% for the federal funds rate). In a series of eight 0.25% rate increases, the Fed lifted the federal funds rate from 1.75% to 3.75% during the period. Yields on shorter-term securities, which are highly sensitive to the Fed's actions, followed suit, with two-year Treasury yields rising by about 1.80%.
For most of the period, longer-term yields, which are more sensitive to inflation levels than to Fed activities, hovered between 4.00% and 4.50% (for 10-year Treasuries) as investors remained confident in the economic expansion and unconcerned about inflation, despite an up tick in energy prices. Investor sentiment turned cautious, however, when late-summer hurricanes shut down most Gulf Coast oil and natural gas refineries and energy prices surged. As government data pointed to more signs of inflationary pressures, including higher energy costs that are being passed along to consumers, long-term yields rose modestly.
In the corporate bond market, investors worried that companies might deploy growing cash balances in ways that favor shareholders but can be detrimental to corporate creditworthiness. As this so-called "event risk" was widely priced into corporate bonds, credit spreads, or the gap between corporate and Treasury yields, widened so that corporate bonds, especially lower-rated bonds, underperformed Treasuries.
PERFORMANCE
For the year ended October 31, 2005, TA IDEX Transamerica Flexible Income, Class A returned 0.47%. By comparison its benchmark, the LBGC, returned 0.83%.
STRATEGY REVIEW
We attribute the portfolio's results to a "barbell" quality strategy adopted during the period. Previously, we had maintained an average credit quality for the portfolio of BBB (the lowest investment-grade category), emphasizing BBB securities augmented by high-yield bonds and a small allocation to convertible securities. In a low-rate environment with corporate credit quality improving, the higher risk associated with this positioning was more than outweighed by the additional yield. However, as the reporting period progressed, we recognized that corporate bonds were coming under increasing pressure and opted to shift a portion of the portfolio's assets to U.S. Treasury securities, raising the overall portfolio quality to A. The Treasury securities helped to protect the portfolio from principal erosion in a volatile, rising-rate environment, while the BBB a nd high-yield corporates and convertible bonds continued to provide a steady and attractive level of current income.
Within the corporate bond sector, we were careful to underweight the automobile sector, which was plagued by sales-, labor- and benefits-related issues, while overweighting the strongly performing energy sector.
Although the portfolio experienced no major losses during the period, the positive impact of our energy focus was partially offset by price declines in high-yield bonds from Landry's Restaurants, Inc. ("Landry's"), an owner/operator of several middle-class restaurant chains. Like many retail companies, Landry's securities suffered as investors questioned how persistently high energy prices will impact consumer spending.
Peter O. Lopez
Heidi Y. Hu, CFA
Brian Westhoff
Co-Fund Managers
Transamerica Investment Management, LLC
Transamerica IDEX Mutual Funds
Annual Report 2005
1
TA IDEX Transamerica Flexible Income
Comparison of change in value of $10,000 investment in Class A shares and its comparative index.
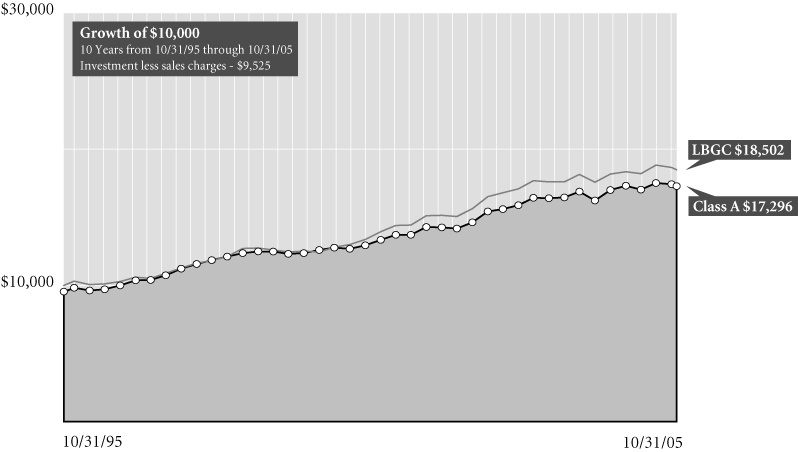
Average Annual Total Return for Periods Ended 10/31/05
| | | 1 year | | 5 years | | 10 years | | From
Inception | | Inception
Date | |
| Class A (NAV) | | | 0.47 | % | | | 5.95 | % | | | 6.15 | % | | | 7.15 | % | | 6/29/87 | |
| Class A (POP) | | | (4.30 | )% | | | 4.93 | % | | | 5.63 | % | | | 6.86 | % | | 6/29/87 | |
| LBGC1 | | | 0.83 | % | | | 6.57 | % | | | 6.35 | % | | | 7.76 | % | | 6/29/87 | |
| Class B (NAV) | | | (0.36 | )% | | | 5.22 | % | | | 5.43 | % | | | 5.55 | % | | 10/1/95 | |
| Class B (POP) | | | (5.17 | )% | | | 5.05 | % | | | 5.43 | % | | | 5.55 | % | | 10/1/95 | |
| Class C (NAV) | | | (0.40 | )% | | | – | | | | – | | | | 3.26 | % | | 11/11/02 | |
| Class C (POP) | | | (1.36 | )% | | | – | | | | – | | | | 3.26 | % | | 11/11/02 | |
| Class I (NAV) | | | – | | | | – | | | | – | | | | 0.85 | % | | 11/8/04 | |
NOTES
1 The Lehman Brothers U.S. Government/Credit (LBGC) Index is an unmanaged index used as a general measure of market performance. Calculations assume dividends and capital gains are reinvested and do not include any managerial expenses. From inception calculation is based on life of Class A shares. Source: Standard & Poor's Micropal®© Micropal, Inc. 2005 – 1-800-596-5323 – http://www.funds-sp.com.
The performance data presented represents past performance, future results may vary. Performance data does not reflect the deduction of taxes that would be paid on fund distributions or the redemption of fund shares. Investment return and principal value will fluctuate so that an investor's shares, when redeemed, may be worth more or less than their original cost. Current performance may be lower or higher than performance quoted. Please see www.transamericaidex.com for performance data current to the most recent month-end.
Public Offering Price (POP) returns include the reinvestment of dividends and capital gains and reflect the maximum sales charge of 4.75% for A shares or the maximum applicable contingent deferred sales charge (5% in the 1st year, decreasing to 0% after 6 years) for Class B shares and 1% (during the first 12 months) for Class C shares. Shares purchased prior to March 1, 2004 are subject to a maximum applicable contingent deferred sales charge (5% in the 1st year, decreasing to 0% after 7 years) for Class B shares and (2% in the 1st year, decreasing to 0% after 2 years) for Class C shares. Net Asset Value (NAV) returns include the reinvestment of dividends and capital gains but do not reflect any sales charges.
This material must be preceded or accompanied by a current prospectus, which includes specific contents regarding the investment objectives and policies of this fund.
Transamerica IDEX Mutual Funds
Annual Report 2005
2
TA IDEX Transamerica Flexible Income
UNDERSTANDING YOUR FUND'S EXPENSES
(unaudited)
SHAREHOLDER EXPENSES
Fund shareholders may incur two types of costs: (1) transaction costs, including sales charges (loads) on purchases, contingent deferred sales charges on redemptions and redemption fees; and (2) ongoing costs, including management fees, 12b-1 distribution and service fees, and other fund expenses.
The following Example is intended to help you understand your ongoing costs (in dollars and cents) of investing in a Fund and to compare these costs with the ongoing costs of investing in other funds.
The Example is based on an investment of $1,000 invested at May 1, 2005 and held for the entire period until October 31, 2005.
ACTUAL EXPENSES
The first line in the table below provides information about actual account values and actual expenses. You may use the information in this line, together with the amount you invested, to estimate the expenses that you paid over the period. Simply divide your account value by $1,000 (for example, an $8,600 account value divided by $1,000 = 8.6), then multiply the result by the number in the first line of your Fund under the heading entitled "Expenses Paid During Period" to estimate the expenses you paid on your account during this period. If your account is an IRA, your expenses could have included a $15 annual fee. The amount of any fee paid through your account would increase the estimate of expenses you paid during the period and decrease your ending account value.
HYPOTHETICAL EXAMPLE FOR COMPARISON PURPOSES
The second line in the table below provides information about hypothetical account values and hypothetical expenses based on the Fund's actual expense ratio and an assumed rate of return of 5% per year before expenses, which is not the Fund's actual return. The hypothetical account values and expenses may not be used to estimate the actual ending account balance or expenses you paid for the period. You may use this information to compare the ongoing costs of investing in your Fund and other funds. To do so, compare this 5% hypothetical example with the 5% hypothetical examples that appear in the shareholder reports of the other funds. As in the case of the actual expense example, if your account is subject to an IRA fee, the amount of the fee paid through your account would increase the hypothetical expenses you would have paid during the period and decrease the hypothetical ending account value.
Please note that the expenses shown in the table are meant to highlight your ongoing costs only and do not reflect any transactional costs, such as sales charges, redemption fees, brokerage commissions paid on purchases and sales of fund shares. Therefore, the second line under the Fund in the table is useful in comparing ongoing costs only, and will not help you determine the relative total costs of owning different funds. If any of these transaction costs were included, your costs would be higher. The expenses shown in the table do not reflect any fees that may be charged to you by brokers, financial intermediaries or other financial institutions.
| | | Beginning
Account
Value | | Ending
Account
Value | | Annualized
Expense
Ratio | | Expenses Paid
During Period (a) | |
| Class A | |
| Actual | | $ | 1,000.00 | | | $ | 1,009.70 | | | | 1.26 | % | | $ | 6.38 | | |
| Hypothetical (b) | | | 1,000.00 | | | | 1,018.85 | | | | 1.26 | | | | 6.41 | | |
| Class B | |
| Actual | | | 1,000.00 | | | | 1,004.30 | | | | 2.22 | | | | 11.22 | | |
| Hypothetical (b) | | | 1,000.00 | | | | 1,014.01 | | | | 2.22 | | | | 11.27 | | |
| Class C | |
| Actual | | | 1,000.00 | | | | 1,004.90 | | | | 2.10 | | | | 10.61 | | |
| Hypothetical (b) | | | 1,000.00 | | | | 1,014.62 | | | | 2.10 | | | | 10.66 | | |
| Class I | |
| Actual | | | 1,000.00 | | | | 1,011.90 | | | | 0.84 | | | | 4.26 | | |
| Hypothetical (b) | | | 1,000.00 | | | | 1,020.97 | | | | 0.84 | | | | 4.28 | | |
(a) Expenses are calculated using each Fund's annualized expense ratio (as disclosed in the table), multiplied by the average account value for the period, multiplied by number of days in the period (184 days), and divided by the number of days in the year (365 days).
(b) 5% return per year before expenses.
GRAPHICAL PRESENTATION OF SCHEDULE OF INVESTMENTS
By Asset Type
At October 31, 2005
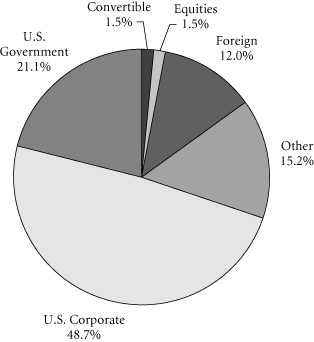
This chart shows the percentage breakdown by asset type of the Fund's total investment securities.
Transamerica IDEX Mutual Funds
Annual Report 2005
3
TA IDEX Transamerica Flexible Income
SCHEDULE OF INVESTMENTS
At October 31, 2005
(all amounts except share amounts in thousands)
| | | Principal | | Value | |
| U.S. GOVERNMENT OBLIGATIONS (24.5%) | |
U.S. Treasury Note
| |
| 2.50%, due 10/31/2006 | | $ | 12,800 | | | $ | 12,569 | | |
3.50%, due 05/31/2007 †
3.75%, due 05/15/2008 †
3.38%, due 10/15/2009 †
3.50%, due 02/15/2010
3.63%, due 06/15/2010 †
4.13%, due 08/15/2010 †
4.00%, due 02/15/2015 †
4.13%, due 05/15/2015 † | | | 13,000
4,000
17,400
5,000
6,500
4,300
3,700
2,875 | | | | 12,826
3,937
16,726
4,812
6,272
4,235
3,538
2,774 | | |
U.S. Treasury STRIPS
Zero coupon, due 05/15/2030 | | | 16,000 | | | | 4,960 | | |
| Total U.S. Government Obligations (cost: $74,195) | | | | | | | 72,649 | | |
| ASSET-BACKED SECURITIES (3.0%) | |
MBNA Credit Card Master Note Trust,
Series 2003-A6 Cl A6
2.75%, due 10/15/2010 | | | 9,360 | | | | 8,909 | | |
| Total Asset-Backed Securities (cost: $8,973) | | | | | | | 8,909 | | |
| CORPORATE DEBT SECURITIES (67.0%) | |
| Aerospace (2.0%) | |
Boeing Co. (The)
8.75%, due 08/15/2021 | | | 2,500 | | | | 3,344 | | |
Bombardier, Inc.–144A
6.75%, due 05/01/2012 † | | | 2,000 | | | | 1,810 | | |
Vought Aircraft Industries, Inc.
8.00%, due 07/15/2011 | | | 1,000 | | | | 945 | | |
| Agriculture (1.3%) | |
Dole Food Co., Inc.
8.63%, due 05/01/2009 | | | 1,200 | | | | 1,240 | | |
Michael Foods, Inc.
8.00%, due 11/15/2013 | | | 2,575 | | | | 2,614 | | |
| Amusement & Recreation Services (1.0%) | |
Boyd Gaming Corp.
6.75%, due 04/15/2014 † | | | 2,500 | | | | 2,466 | | |
Speedway Motorsports, Inc.
6.75%, due 06/01/2013 | | | 500 | | | | 511 | | |
| Automotive (0.8%) | |
DaimlerChrysler NA Holding Corp.
8.50%, due 01/18/2031 | | | 2,000 | | | | 2,347 | | |
| Beer, Wine & Distilled Beverages (0.6%) | |
Foster's Finance Corp.–144A
5.88%, due 06/15/2035 | | | 1,725 | | | | 1,650 | | |
| | | Principal | | Value | |
| Beverages (0.3%) | |
Cia Brasileira de Bebidas
| |
| 8.75%, due 09/15/2013 | | $ | 750 | | | $ | 877 | | |
| Business Credit Institutions (0.7%) | |
ChevronTexaco Capital Co.
3.50%, due 09/17/2007 | | | 1,035 | | | | 1,013 | | |
Pemex Finance, Ltd.
9.03%, due 02/15/2011 | | | 850 | | | | 938 | | |
| Chemicals & Allied Products (2.8%) | |
Cytec Industries, Inc.
6.00%, due 10/01/2015 | | | 3,000 | | | | 2,843 | | |
ICI Wilmington, Inc.
4.38%, due 12/01/2008 | | | 3,000 | | | | 2,932 | | |
Lubrizol Corp.
5.50%, due 10/01/2014 | | | 2,500 | | | | 2,464 | | |
| Commercial Banks (5.0%) | |
Barclays Bank PLC
6.28%, due 12/15/2034 (a) | | | 3,000 | | | | 2,844 | | |
Citizens Banking Corp.
5.75%, due 02/01/2013 | | | 75 | | | | 77 | | |
Compass Bank
5.50%, due 04/01/2020 | | | 3,000 | | | | 2,954 | | |
Royal Bank of Scotland Group PLC
7.65%, due 08/29/2049 (b) | | | 2,000 | | | | 2,349 | | |
Sumitomo Mitsui Banking–144A
5.63%, due 07/15/2049 (c) | | | 3,965 | | | | 3,878 | | |
US Bank NA
3.75%, due 02/06/2009 | | | 3,000 | | | | 2,893 | | |
| Communication (0.6%) | |
Comcast Corp.
4.95%, due 06/15/2016 | | | 1,000 | | | | 929 | | |
COX Communications, Inc.
6.75%, due 03/15/2011 | | | 714 | | | | 749 | | |
| Communications Equipment (0.3%) | |
Inmarsat Finance PLC
0.00%, due 11/15/2012 (d) | | | 1,000 | | | | 817 | | |
| Department Stores (2.8%) | |
JC Penney Co., Inc.
6.88%, due 10/15/2015 | | | 2,000 | | | | 2,084 | | |
May Department Stores Co. (The)
8.50%, due 06/01/2019 | | | 2,500 | | | | 3,017 | | |
Neiman-Marcus Group, Inc.–144A
9.00%, due 10/15/2015 | | | 2,150 | | | | 2,112 | | |
| 10.38%, due 10/15/2015 | | | 1,000 | | | | 965 | | |
The notes to the financial statements are an integral part of this report.
Transamerica IDEX Mutual Funds
Annual Report 2005
4
TA IDEX Transamerica Flexible Income
SCHEDULE OF INVESTMENTS (continued)
At October 31, 2005
(all amounts except share amounts in thousands)
| | | Principal | | Value | |
| Electric Services (2.9%) | |
AES Gener SA
| |
| 7.50%, due 03/25/2014 † | | $ | 2,000 | | | $ | 1,999 | | |
DPL, Inc.
8.25%, due 03/01/2007 | | | 1,059 | | | | 1,101 | | |
FPL Group Capital, Inc.
4.09%, due 02/16/2007 | | | 2,000 | | | | 1,982 | | |
PSEG Funding Trust
5.38%, due 11/16/2007 | | | 1,250 | | | | 1,255 | | |
Southwestern Public Service Co., Series B
5.13%, due 11/01/2006 | | | 500 | | | | 501 | | |
Texas Utilities Corp.
6.38%, due 06/15/2006 | | | 1,625 | | | | 1,637 | | |
| Electric, Gas & Sanitary Services (0.0%) | |
Public Service Co. of Colorado, Series A
6.88%, due 07/15/2009 | | | 100 | | | | 106 | | |
| Finance (0.3%) | |
American Real Estate Partners, LP
8.13%, due 06/01/2012 | | | 1,000 | | | | 1,027 | | |
| Food & Kindred Products (2.0%) | |
ConAgra Foods, Inc.
9.75%, due 03/01/2021 | | | 1,900 | | | | 2,510 | | |
Tyson Foods, Inc.
8.25%, due 10/01/2011 | | | 3,000 | | | | 3,383 | | |
| Food Stores (2.2%) | |
Albertson's, Inc., Note
7.25%, due 05/01/2013 | | | 1,500 | | | | 1,426 | | |
Safeway, Inc.
6.50%, due 03/01/2011 | | | 3,005 | | | | 3,087 | | |
Stater Brothers Holdings, Inc.
8.13%, due 06/15/2012 | | | 2,000 | | | | 1,955 | | |
| Gas Production & Distribution (0.9%) | |
Dynegy Holdings, Inc.–144A
9.88%, due 07/15/2010 | | | 1,000 | | | | 1,075 | | |
Pacific Energy Partners, LP / Pacific
Energy Finance Corp.
7.13%, due 06/15/2014 | | | 1,500 | | | | 1,560 | | |
| Holding & Other Investment Offices (3.4%) | |
EOP Operating, LP
8.38%, due 03/15/2006 | | | 2,150 | | | | 2,179 | | |
Hutchison Whampoa International, Ltd.–144A
5.45%, due 11/24/2010
7.45%, due 11/24/2033 | | | 475
2,500 | | | | 478
2,775 | | |
Noble Group, Ltd.–144A
6.63%, due 03/17/2015 | | | 2,000 | | | | 1,811 | | |
Raytheon Co.
3.50%, due 05/15/2006 | | | 5,500 | | | | 2,779 | | |
| | | Principal | | Value | |
| Hotels & Other Lodging Places (5.4%) | |
Circus Circus Enterprises, Inc.
| |
| 7.63%, due 07/15/2013 † | | $ | 2,000 | | | $ | 2,055 | | |
Host Marriott, LP
7.13%, due 11/01/2013 | | | 2,000 | | | | 2,028 | | |
Intrawest Corp.
7.50%, due 10/15/2013 | | | 3,500 | | | | 3,561 | | |
Starwood Hotels & Resorts, Inc.
6.75%, due 11/15/2005 | | | 4,335 | | | | 4,335 | | |
Station Casinos, Inc.
6.88%, due 03/01/2016 | | | 2,000 | | | | 2,015 | | |
Wynn Las Vegas LLC/Wynn Las Vegas
Capital Corp.
6.63%, due 12/01/2014 | | | 2,000 | | | | 1,905 | | |
| Industrial Machinery & Equipment (3.0%) | |
Case New Holland, Inc.
9.25%, due 08/01/2011 | | | 2,000 | | | | 2,105 | | |
Cummins Engine Co., Inc.
5.65%, due 03/01/2098 | | | 2,000 | | | | 1,440 | | |
Gardner Denver, Inc.–144A
8.00%, due 05/01/2013 | | | 1,000 | | | | 1,040 | | |
Goodman Global Holding Co., Inc.–144A
7.88%, due 12/15/2012 † | | | 1,545 | | | | 1,452 | | |
John Deere Capital Corp.
3.90%, due 01/15/2008 | | | 3,000 | | | | 2,940 | | |
| Insurance (1.4%) | |
Boardwalk Pipelines LLC, Note
5.50%, due 02/01/2017 | | | 2,800 | | | | 2,740 | | |
First American Capital Trust I
8.50%, due 04/15/2012 | | | 125 | | | | 139 | | |
Wellpoint Health Networks, Inc.
6.38%, due 06/15/2006 | | | 1,185 | | | | 1,197 | | |
| Metal Mining (1.1%) | |
Barrick Gold Finance, Inc.
7.50%, due 05/01/2007 | | | 2,000 | | | | 2,074 | | |
Phelps Dodge Corp.
9.50%, due 06/01/2031 | | | 847 | | | | 1,147 | | |
| Mortgage Bankers & Brokers (2.3%) | |
Countrywide Home Loans, Inc.
5.50%, due 08/01/2006 | | | 2,500 | | | | 2,515 | | |
Crystal US Holdings 3 LLC/Crystal US
Sub 3 Corp.
9.63%, due 06/15/2014 | | | 1,300 | | | | 1,430 | | |
Innophos Investments Holdings, Inc.–144A
11.79%, due 02/15/2015 * | | | 2,087 | | | | 1,985 | | |
Virgin River Casino Corp.–144A
9.00%, due 01/15/2012 | | | 1,000 | | | | 1,030 | | |
The notes to the financial statements are an integral part of this report.
Transamerica IDEX Mutual Funds
Annual Report 2005
5
TA IDEX Transamerica Flexible Income
SCHEDULE OF INVESTMENTS (continued)
At October 31, 2005
(all amounts except share amounts in thousands)
| | | Principal | | Value | |
| Motion Pictures (1.1%) | |
Time Warner, Inc.
| |
| 7.63%, due 04/15/2031 | | $ | 3,000 | | | $ | 3,383 | | |
| Oil & Gas Extraction (2.9%) | |
Chesapeake Energy Corp.
6.38%, due 06/15/2015 | | | 1,000 | | | | 983 | | |
El Paso CGP Co.
7.63%, due 09/01/2008 | | | 2,000 | | | | 2,015 | | |
Gazprom International SA–144A
7.20%, due 02/01/2020 | | | 1,000 | | | | 1,064 | | |
Husky Oil, Ltd.
8.90%, due 08/15/2028 (e) | | | 1,420 | | | | 1,527 | | |
Nexen, Inc.
5.88%, due 03/10/2035 | | | 3,310 | | | | 3,150 | | |
| Paper & Allied Products (0.3%) | |
Graphic Packaging International Corp.
9.50%, due 08/15/2013 | | | 1,000 | | | | 898 | | |
| Paperboard Containers & Boxes (0.3%) | |
Graham Packaging Co., Inc.
9.88%, due 10/15/2014 | | | 1,000 | | | | 935 | | |
| Petroleum Refining (2.6%) | |
Enterprise Products Operating, LP, Series B
5.60%, due 10/15/2014 | | | 1,500 | | | | 1,472 | | |
Premcor Refining Group (The), Inc.
9.25%, due 02/01/2010 | | | 2,500 | | | | 2,697 | | |
Valero Energy Corp.
7.50%, due 04/15/2032 | | | 3,000 | | | | 3,539 | | |
| Primary Metal Industries (1.9%) | |
Alcoa, Inc.
4.25%, due 08/15/2007 | | | 2,750 | | | | 2,726 | | |
Noranda, Inc.
6.00%, due 10/15/2015 | | | 2,000 | | | | 1,999 | | |
Novelis, Inc.–144A
7.25%, due 02/15/2015 | | | 1,000 | | | | 913 | | |
| Printing & Publishing (1.0%) | |
News America Holdings, Inc.
7.75%, due 12/01/2045 | | | 2,700 | | | | 3,047 | | |
| Radio & Television Broadcasting (2.5%) | |
Chancellor Media Corp.
8.00%, due 11/01/2008 | | | 3,275 | | | | 3,489 | | |
Grupo Televisa SA, Senior Note
6.63%, due 03/18/2025 | | | 2,000 | | | | 1,952 | | |
Sirius Satellite Radio, Inc.–144A
9.63%, due 08/01/2013 † | | | 2,000 | | | | 1,893 | | |
| | | Principal | | Value | |
| Restaurants (1.7%) | |
Brinker International, Inc.
| |
| 5.75%, due 06/01/2014 | | $ | 3,000 | | | $ | 3,038 | | |
Landry's Restaurants, Inc., Series B
7.50%, due 12/15/2014 | | | 2,000 | | | | 1,840 | | |
Yum! Brands, Inc.
7.70%, due 07/01/2012 | | | 85 | | | | 96 | | |
| Savings Institutions (0.6%) | |
Washington Mutual Bank FA
5.13%, due 01/15/2015 | | | 2,000 | | | | 1,939 | | |
| Security & Commodity Brokers (3.3%) | |
American Real Estate Partners,
LP/American Real Estate
Finance Corp.–144A
7.13%, due 02/15/2013 | | | 1,000 | | | | 973 | | |
E*Trade Financial Corp.
8.00%, due 06/15/2011 | | | 1,500 | | | | 1,523 | | |
Goldman Sachs Group, Inc.
6.35%, due 02/15/2034 | | | 1,975 | | | | 1,980 | | |
Residential Capital Corp.–144A
6.38%, due 06/30/2010 | | | 5,293 | | | | 5,376 | | |
| Stone, Clay & Glass Products (0.3%) | |
Owens Brockway Glass Container, Inc.
6.75%, due 12/01/2014 | | | 1,000 | | | | 940 | | |
| Telecommunications (3.4%) | |
America Movil SA de CV
5.50%, due 03/01/2014 | | | 3,000 | | | | 2,904 | | |
MCI, Inc.
5.91%, due 05/01/2007 | | | 1,500 | | | | 1,515 | | |
Mountain States Telephone & Telegraph
7.38%, due 05/01/2030 | | | 1,000 | | | | 908 | | |
Northwestern Bell Telephone
7.75%, due 05/01/2030 | | | 1,235 | | | | 1,161 | | |
Rogers Wireless Communications, Inc.
7.00%, due 12/15/2010 * | | | 1,000 | | | | 1,035 | | |
Sprint Capital Corp.
7.13%, due 01/30/2006 | | | 2,500 | | | | 2,515 | | |
| Water Transportation (0.7%) | |
Royal Caribbean Cruises, Ltd.
8.75%, due 02/02/2011 | | | 2,000 | | | | 2,230 | | |
| Wholesale Trade Nondurable Goods (1.3%) | |
Domino's, Inc.
8.25%, due 07/01/2011 | | | 1,750 | | | | 1,811 | | |
Unilever Capital Corp.
6.88%, due 11/01/2005 | | | 2,000 | | | | 2,000 | | |
| Total Corporate Debt Securities (cost: $205,111) | | | | | | | 198,887 | | |
The notes to the financial statements are an integral part of this report.
Transamerica IDEX Mutual Funds
Annual Report 2005
6
TA IDEX Transamerica Flexible Income
SCHEDULE OF INVESTMENTS (continued)
At October 31, 2005
(all amounts except share amounts in thousands)
| | | Principal | | Value | |
| CONVERTIBLE BOND (1.8%) | |
| Aerospace (0.3%) | |
Armor Holdings, Inc.
| |
| 2.00%, due 11/01/2024 (f) | | $ | 1,000 | | | $ | 1,026 | | |
| Computer & Data Processing Services (0.3%) | |
Overstock.com, Inc.
3.75%, due 12/01/2011 † | | | 1,000 | | | | 774 | | |
| Computer & Office Equipment (0.4%) | |
Scientific Games Corp.–144A
0.75%, due 12/01/2024 | | | 1,000 | | | | 1,147 | | |
| Oil & Gas Extraction (0.5%) | |
Halliburton Co.
3.13%, due 07/15/2023 | | | 500 | | | | 826 | | |
Schlumberger, Ltd., Series B
2.13%, due 06/01/2023 | | | 500 | | | | 628 | | |
| Radio, Television & Computer Stores (0.3%) | |
Guitar Center, Inc.
4.00%, due 07/15/2013 | | | 600 | | | | 928 | | |
| Total Convertible Bond (cost: $5,387) | | | | | | | 5,329 | | |
| | | Shares | | Value | |
| CONVERTIBLE PREFERRED STOCKS (0.1%) | |
| Business Credit Institutions (0.1%) | |
| Sovereign Capital Trust II | | | 9,500 | | | $ | 424 | | |
| Total Convertible Preferred Stocks (cost: $475) | | | | | | | 424 | | |
| PREFERRED STOCKS (1.8%) | |
| Holding & Other Investment Offices (0.6%) | |
| Saul Centers, Inc. | | | 1,850 | | | | 47 | | |
Tanger Factory Outlet Centers
Preferred, REIT ‡ | | | 66,666 | | | | 1,667 | | |
| Telecommunications (1.2%) | |
| Centaur Funding Corp.–144A | | | 2,750 | | | | 3,534 | | |
| Total Preferred Stocks (cost: $5,277) | | | | | | | 5,248 | | |
| COMMON STOCKS (0.0%) | |
| Telecommunications (0.0%) | |
Versatel Telecom International NV Warrants,
Expires 5/15/2008 ‡m | | | 75 | | | | – | o | |
| Total Common Stocks (cost: $–)o | | | | | | | – | o | |
| | | Principal | | Value | |
| SECURITY LENDING COLLATERAL (17.5%) | |
| Debt (16.3%) | |
| Bank Notes (1.1%) | |
Bank of America
| |
| 3.81%, due 06/07/2006 * | | $ | 1,462 | | | $ | 1,462 | | |
| 3.81%, due 08/10/2006 * | | | 1,450 | | | | 1,450 | | |
Credit Suisse First Boston Corp.
4.11%, due 03/10/2006 * | | | 290 | | | | 290 | | |
| | | Principal | | Value | |
| Certificates Of Deposit (1.2%) | |
Canadian Imperial Bank of Commerce
| |
| 4.07%, due 11/04/2005 * | | $ | 1,160 | | | $ | 1,160 | | |
Harris Trust & Savings Bank
3.80%, due 11/04/2005 * | | | 923 | | | | 923 | | |
Rabobank Nederland
4.03%, due 05/31/2006 * | | | 1,450 | | | | 1,450 | | |
| Commercial Paper (3.5%) | |
Ciesco LLC
4.00%, due 11/03/2005 | | | 1,449 | | | | 1,449 | | |
General Electric Capital Corp.
3.96%, due 12/05/2005 | | | 1,160 | | | | 1,160 | | |
Paradigm Funding LLC–144A
4.01%, due 11/07/2005 | | | 1,157 | | | | 1,157 | | |
Park Avenue Receivables Corp.–144A
4.03%, due 12/02/2005 | | | 1,149 | | | | 1,149 | | |
Preferred Receivables Corp.–144A
4.04%, due 12/05/2005 | | | 870 | | | | 870 | | |
Ranger Funding Co. LLC–144A
3.99%, due 11/15/2005 | | | 864 | | | | 864 | | |
Sheffield Receivables Corp.–144A
4.01%, due 11/08/2005 | | | 870 | | | | 870 | | |
Yorktown Capital LLC
3.97%, due 11/09/2005
3.93%, due 11/17/2005 | | | 1,446
1,441 | | | | 1,446
1,441 | | |
| Euro Dollar Overnight (3.8%) | |
Bank of Montreal
3.79%, due 11/01/2005 | | | 870 | | | | 870 | | |
Barclays
3.80%, due 11/04/2005 | | | 1,160 | | | | 1,160 | | |
BNP Paribas
3.83%, due 11/02/2005 | | | 1,741 | | | | 1,741 | | |
Deutsche Bank
3.80%, due 11/02/2005 | | | 2,901 | | | | 2,901 | | |
HSBC Banking/Holdings PLC
3.84%, due 11/07/2005 | | | 870 | | | | 870 | | |
Royal Bank of Scotland
3.76%, due 11/01/2005 | | | 1,160 | | | | 1,160 | | |
Svenska Handlesbanken
4.03%, due 11/01/2005 | | | 1,494 | | | | 1,494 | | |
UBS AG
3.80%, due 11/03/2005 | | | 1,160 | | | | 1,160 | | |
| Euro Dollar Terms (1.4%) | |
Royal Bank of Scotland
4.00%, due 12/12/2005 | | | 1,160 | | | | 1,160 | | |
UBS AG
4.02%, due 12/01/2005 | | | 1,160 | | | | 1,160 | | |
Wells Fargo
3.96%, due 11/14/2005 | | | 1,741 | | | | 1,741 | | |
The notes to the financial statements are an integral part of this report.
Transamerica IDEX Mutual Funds
Annual Report 2005
7
TA IDEX Transamerica Flexible Income
SCHEDULE OF INVESTMENTS (continued)
At October 31, 2005
(all amounts except share amounts in thousands)
| | | Principal | | Value | |
| Promissory Notes (0.4%) | |
Goldman Sachs Group, Inc.
| |
| 4.02%, due 12/28/2005 | | $ | 1,218 | | | $ | 1,218 | | |
| Repurchase Agreements (4.9%) †† | |
Credit Suisse First Boston Corp.
4.10%, dated 10/31/2005 to be
repurchased at $1,977 on 11/01/2005 | | | 1,977 | | | | 1,977 | | |
Goldman Sachs Group, Inc. (The)
4.10%, dated 10/31/2005 to be
repurchased at $4,932 on 11/01/2005 | | | 4,931 | | | | 4,931 | | |
Lehman Brothers, Inc.
4.10%, dated 10/31/2005 to be
repurchased at $137 on 11/01/2005 | | | 137 | | | | 137 | | |
Merrill Lynch & Co.
4.10%, dated 10/31/2005 to be
repurchased at $5,802 on 11/01/2005 | | | 5,802 | | | | 5,802 | | |
Morgan Stanley Dean Witter & Co.
4.17%, dated 10/31/2005 to be
repurchased at $1,739 on 11/01/2005 | | | 1,739 | | | | 1,739 | | |
| | | Shares | | Value | |
| Investment Companies (1.2%) | |
| Money Market Funds (1.2%) | |
| American Beacon Fund | |
| 1-day yield of 3.81% | | | 1,250,758 | | | $ | 1,251 | | |
Barclays Global Investors Institutional
Money Market Fund
1-day yield of 3.92% | | | 1,160,326 | | | | 1,160 | | |
Goldman Sachs Financial Square Prime
Obligations Fund
1-day yield of 3.79% | | | 180,741 | | | | 181 | | |
Merrimac Cash Fund, Premium Class
1-day yield of 3.70% @ | | | 1,147,502 | | | | 1,148 | | |
| Total Security Lending Collateral (cost: $52,102) | | | | | | | 52,102 | | |
| Total Investment Securities (cost: $351,520) | | | | | | $ | 343,548 | | |
| SUMMARY: | |
| Investment securities, at value | | | 115.7 | % | | $ | 343,548 | | |
| Liabilities in excess of other assets | | | (15.7 | )% | | | (46,637 | ) | |
| Net assets | | | 100.0 | % | | $ | 296,911 | | |
NOTES TO SCHEDULE OF INVESTMENTS:
† At October 31, 2005, all or a portion of this security is on loan (see Note 1). The value at October 31, 2005, of all securities on loan is $50,899.
* Floating or variable rate note. Rate is listed as of October 31, 2005.
(a) Barclays Bank PLC has a fixed coupon rate of 6.28% until 12/15/2034, thereafter the coupon rate will reset quarterly at the 3-month US$ LIBOR + 155BP, if not called.
(b) Royal Bank of Scotland Group PLC has a fixed coupon rate of 7.65% until 09/30/2031, thereafter the coupon rate will reset quarterly at the 3-month US$ LIBOR + 250BP, if not called.
(c) Sumitomo Matsui Banking–144A has a fixed coupon rate of 5.63% until 10/15/2015, thereafter the coupon rate will reset quarterly at the 3-month US$ LIBOR + 255BP, if not called.
(d) Inmarsat Finance PLC has a coupon rate of 0.00% until 11/15/2008, thereafter the coupon rate will be 10.38%.
(e) Husky Oil, Ltd. has a fixed coupon rate of 8.90% until 8/15/2008, thereafter the coupon rate will reset quarterly at the 3-month US$ LIBOR + 550BP, if not called.
(f) Armor Holding, Inc. has a coupon rate of 2.00% until 11/01/2011, thereafter the coupon rate will be 0.00%.
‡ Non-income producing.
o Value is less than $1.
†† Cash collateral for the Repurchase Agreements, valued at $14,877, that serve as collateral for securities lending are invested in corporate bonds with interest rates and maturity dates ranging from 0.00%–9.86% and 12/31/2005–11/15/2096, respectively.
@ Regulated investment company advised by Investors Bank and Trust Co. ("IBT"). IBT is also the accounting, custody and lending agent for the Fund.
m Securities valued as determined in good faith in accordance with procedure established by the Fund's Board of Trustees.
DEFINITIONS:
144A 144A Securities are registered pursuant to Rule 144A of the Securities Act of 1933. These securities are deemed to be liquid for purposes of compliance limitations on holdings of illiquid securities and may be resold as transactions exempt from registration, normally to qualified institutional buyers. At October 31, 2005, these securities aggregated $41,871 or 14.1% of the net assets of the Fund.
REIT Real Estate Investment Trust
STRIPS Separate Trading of Registered Interest and Principal of Securities
The notes to the financial statements are an integral part of this report.
Transamerica IDEX Mutual Funds
Annual Report 2005
8
TA IDEX Transamerica Flexible Income
STATEMENT OF ASSETS AND LIABILITIES
At October 31, 2005
(all amounts except per share amounts in thousands)
| Assets: | |
Investment securities, at value (cost: $351,520)
(including securities loaned of $50,899) | | $ | 343,548 | | |
| Cash | | | 1,551 | | |
| Receivables: | |
| Investment securities sold | | | 2,725 | | |
| Shares of beneficial interest sold | | | 22 | | |
| Interest | | | 4,178 | | |
| Dividend reclaims receivable | | | 3 | | |
| Other | | | 13 | | |
| | | | 352,040 | | |
| Liabilities: | |
| Investment securities purchased | | | 2,560 | | |
| Accounts payable and accrued liabilities: | |
| Shares of beneficial interest redeemed | | | 115 | | |
| Management and advisory fees | | | 195 | | |
| Distribution and service fees | | | 81 | | |
| Transfer agent fees | | | 19 | | |
| Administration fees | | | 5 | | |
| Payable for collateral for securities on loan | | | 52,102 | | |
| Other | | | 52 | | |
| | | | 55,129 | | |
| Net Assets | | $ | 296,911 | | |
| Net Assets Consist of: | |
Shares of beneficial interest, unlimited shares
authorized, no par value | | $ | 305,904 | | |
| Accumulated net investment income (loss) | | | (6 | ) | |
Accumulated net realized gain (loss) from investment
securities | | | (1,014 | ) | |
Net unrealized appreciation (depreciation) on
investment securities | | | (7,973 | ) | |
| Net Assets | | $ | 296,911 | | |
| Net Assets by Class: | |
| Class A | | $ | 140,203 | | |
| Class B | | | 32,560 | | |
| Class C | | | 13,439 | | |
| Class I | | | 110,709 | | |
| Shares Outstanding: | |
| Class A | | | 15,062 | | |
| Class B | | | 3,494 | | |
| Class C | | | 1,446 | | |
| Class I | | | 11,844 | | |
| Net Asset Value Per Share: | |
| Class A | | $ | 9.31 | | |
| Class B | | | 9.32 | | |
| Class C | | | 9.30 | | |
| Class I | | | 9.35 | | |
| Maximum Offering Price Per Share (a): | |
| Class A | | $ | 9.77 | | |
(a) Includes the maximum selling commission (represented as a percentage of offering price) which is reduced on certain levels of sales as set forth in the Prospectus. Net asset value per share for Classes B and C shares represents offering price. The redemption price for Classes B and C shares equals net asset value less any applicable contingent deferred sales charge.
STATEMENT OF OPERATIONS
For the year ended October 31, 2005
(all amounts in thousands)
| Investment Income: | |
| Interest | | $ | 14,315 | | |
Dividends (net of withholding taxes on
foreign dividends of $5) | | | 435 | | |
| Income from loaned securities–net | | | 124 | | |
| | | | 14,874 | | |
| Expenses: | |
| Management and advisory fees | | | 2,060 | | |
| Distribution and service fees: | |
| Class A | | | 439 | | |
| Class B | | | 390 | | |
| Class C | | | 159 | | |
| Transfer agent fees: | |
| Class A | | | 59 | | |
| Class B | | | 83 | | |
| Class C | | | 33 | | |
| Class I | | | – | (b) | |
| Printing and shareholder reports | | | 35 | | |
| Custody fees | | | 34 | | |
| Administration fees | | | 52 | | |
| Legal fees | | | 17 | | |
| Audit fees | | | 18 | | |
| Trustees fees | | | 11 | | |
| Registration fees: | |
| Class A | | | 21 | | |
| Class B | | | 12 | | |
| Class C | | | 11 | | |
| Class I | | | 5 | | |
| Other | | | 3 | | |
| Total expenses | | | 3,442 | | |
| Net Investment Income (Loss) | | | 11,432 | | |
| Net Realized and Unrealized Gain (Loss): | |
| Realized gain (loss) from investment securities | | | (1,014 | ) | |
Increase (decrease) in unrealized appreciation
(depreciation) on investment securities | | | (9,400 | ) | |
| Net Gain (Loss) on Investment Securities | | | (10,414 | ) | |
Net Increase (Decrease) in Net Assets Resulting
from Operations | | $ | 1,018 | | |
(b) Rounds to less than $1.
The notes to the financial statements are an integral part of this report.
Transamerica IDEX Mutual Funds
Annual Report 2005
9
TA IDEX Transamerica Flexible Income
STATEMENTS OF CHANGES IN NET ASSETS
For the years ended
(all amounts in thousands)
| | | October 31,
2005 | | October 31,
2004 | |
| Increase (Decrease) In Net Assets From: | |
| Operations: | |
| Net investment income (loss) | | $ | 11,432 | | | $ | 6,454 | | |
Net realized gain (loss) from
investment securities | | | (1,014 | ) | | | 6,618 | | |
Net unrealized appreciation
(depreciation) on investment
securities | | | (9,400 | ) | | | (4,963 | ) | |
| | | | 1,018 | | | | 8,109 | | |
| Distributions to Shareholders: | |
| From net investment income: | |
| Class A | | | (5,489 | ) | | | (3,599 | ) | |
| Class B | | | (1,327 | ) | | | (1,963 | ) | |
| Class C | | | (552 | ) | | | (364 | ) | |
| Class C2 | | | – | | | | (212 | ) | |
| Class M | | | – | | | | (348 | ) | |
| Class I | | | (4,070 | ) | | | – | | |
| | | | (11,438 | ) | | | (6,486 | ) | |
| From net realized gains: | |
| Class A | | | – | | | | (5,266 | ) | |
| Class B | | | – | | | | (3,484 | ) | |
| Class C | | | – | | | | (374 | ) | |
| Class C2 | | | – | | | | (586 | ) | |
| Class M | | | – | | | | (655 | ) | |
| | | | – | | | | (10,365 | ) | |
| Capital Share Transactions: | |
| Proceeds from shares sold: | |
| Class A | | | 67,541 | | | | 7,550 | | |
| Class B | | | 1,674 | | | | 4,072 | | |
| Class C | | | 1,976 | | | | 1,036 | | |
| Class C2 | | | – | | | | 679 | | |
| Class M | | | – | | | | 218 | | |
| Class I | | | 110,068 | | | | – | | |
| | | | 181,259 | | | | 13,555 | | |
Dividends and distributions
reinvested: | |
| Class A | | | 5,355 | | | | 8,515 | | |
| Class B | | | 1,061 | | | | 4,363 | | |
| Class C | | | 455 | | | | 537 | | |
| Class C2 | | | – | | | | 629 | | |
| Class M | | | – | | | | 931 | | |
| Class I | | | 4,070 | | | | – | | |
| | | | 10,941 | | | | 14,975 | | |
| Cost of shares redeemed: | |
| Class A | | | (7,985 | ) | | | (19,408 | ) | |
| Class B | | | (14,023 | ) | | | (29,607 | ) | |
| Class C | | | (8,075 | ) | | | (6,101 | ) | |
| Class C2 | | | – | | | | (7,240 | ) | |
| Class M | | | – | | | | (4,561 | ) | |
| | | | (30,083 | ) | | | (66,917 | ) | |
| Class level exchanges: | |
| Class C | | | – | | | | 15,979 | | |
| Class C2 | | | – | | | | (7,462 | ) | |
| Class M | | | – | | | | (8,517 | ) | |
| | | | – | | | | – | | |
| | | October 31,
2005 | | October 31,
2004 | |
| Automatic conversions: | |
| Class A | | $ | 82 | | | $ | – | | |
| Class B | | | (82 | ) | | | – | | |
| | | | – | | | | – | | |
| | | | 162,117 | | | | (38,387 | ) | |
| Net increase (decrease) in net assets | | | 151,697 | | | | (47,129 | ) | |
| Net Assets: | |
| Beginning of year | | | 145,214 | | | | 192,343 | | |
| End of year | | $ | 296,911 | | | $ | 145,214 | | |
Accumulated Net Investment Income
(Loss) | | $ | (6 | ) | | $ | (5 | ) | |
| Share Activity: | |
| Shares issued: | |
| Class A | | | 7,039 | | | | 761 | | |
| Class B | | | 175 | | | | 411 | | |
| Class C | | | 207 | | | | 107 | | |
| Class C2 | | | – | | | | 68 | | |
| Class M | | | – | | | | 22 | | |
| Class I | | | 11,417 | | | | – | | |
| | | | 18,838 | | | | 1,369 | | |
Shares issued–reinvested from
distributions: | |
| Class A | | | 563 | | | | 889 | | |
| Class B | | | 111 | | | | 455 | | |
| Class C | | | 48 | | | | 56 | | |
| Class C2 | | | – | | | | 65 | | |
| Class M | | | – | | | | 98 | | |
| Class I | | | 427 | | | | – | | |
| | | | 1,149 | | | | 1,563 | | |
| Shares redeemed: | |
| Class A | | | (835 | ) | | | (1,972 | ) | |
| Class B | | | (1,467 | ) | | | (2,995 | ) | |
| Class C | | | (845 | ) | | | (622 | ) | |
| Class C2 | | | – | | | | (718 | ) | |
| Class M | | | – | | | | (464 | ) | |
| | | | (3,147 | ) | | | (6,771 | ) | |
| Class level exchanges: | |
| Class C | | | – | | | | 1,693 | | |
| Class C2 | | | – | | | | (806 | ) | |
| Class M | | | – | | | | (887 | ) | |
| | | | – | | | | – | | |
| Automatic conversions: | |
| Class A | | | 9 | | | | – | | |
| Class B | | | (9 | ) | | | – | | |
| | | | – | | | | – | | |
Net increase (decrease) in shares
outstanding: | |
| Class A | | | 6,776 | | | | (322 | ) | |
| Class B | | | (1,190 | ) | | | (2,129 | ) | |
| Class C | | | (590 | ) | | | 1,234 | | |
| Class C2 | | | – | | | | (1,391 | ) | |
| Class M | | | – | | | | (1,231 | ) | |
| Class I | | | 11,844 | | | | – | | |
| | | | 16,840 | | | | (3,839 | ) | |
The notes to the financial statements are an integral part of this report.
Transamerica IDEX Mutual Funds
Annual Report 2005
10
TA IDEX Transamerica Flexible Income
FINANCIAL HIGHLIGHTS
| | | | | For a share of beneficial interest outstanding throughout each period | |
| | | | | Net Asset | | Investment Operations | | Distributions | | Net Asset | |
| | | For the
Period
Ended (d)(g) | | Value,
Beginning
of Period | | Net
Investment
Income (Loss) | | Net Realized
and Unrealized
Gain (Loss) | | Total
Operations | | From Net
Investment
Income | | From Net
Realized
Gains | | Total
Distributions | | Value,
End
of Period | |
| Class A | | 10/31/2005 | | $ | 9.68 | | | $ | 0.41 | | | $ | (0.36 | ) | | $ | 0.05 | | | $ | (0.42 | ) | | $ | – | | | $ | (0.42 | ) | | $ | 9.31 | | |
| | | 10/31/2004 | | | 10.21 | | | | 0.41 | | | | 0.11 | | | | 0.52 | | | | (0.42 | ) | | | (0.63 | ) | | | (1.05 | ) | | | 9.68 | | |
| | | 10/31/2003 | | | 9.94 | | | | 0.36 | | | | 0.27 | | | | 0.63 | | | | (0.36 | ) | | | – | | | | (0.36 | ) | | | 10.21 | | |
| | | 10/31/2002 | | | 9.99 | | | | 0.40 | | | | 0.02 | | | | 0.42 | | | | (0.41 | ) | | | (0.06 | ) | | | (0.47 | ) | | | 9.94 | | |
| | | 10/31/2001 | | | 9.26 | | | | 0.47 | | | | 0.71 | | | | 1.18 | | | | (0.45 | ) | | | – | | | | (0.45 | ) | | | 9.99 | | |
| Class B | | 10/31/2005 | | | 9.68 | | | | 0.34 | | | | (0.37 | ) | | | (0.03 | ) | | | (0.33 | ) | | | – | | | | (0.33 | ) | | | 9.32 | | |
| | | 10/31/2004 | | | 10.20 | | | | 0.35 | | | | 0.12 | | | | 0.47 | | | | (0.36 | ) | | | (0.63 | ) | | | (0.99 | ) | | | 9.68 | | |
| | | 10/31/2003 | | | 9.94 | | | | 0.30 | | | | 0.25 | | | | 0.55 | | | | (0.29 | ) | | | – | | | | (0.29 | ) | | | 10.20 | | |
| | | 10/31/2002 | | | 9.99 | | | | 0.34 | | | | 0.02 | | | | 0.36 | | | | (0.35 | ) | | | (0.06 | ) | | | (0.41 | ) | | | 9.94 | | |
| | | 10/31/2001 | | | 9.26 | | | | 0.37 | | | | 0.74 | | | | 1.11 | | | | (0.38 | ) | | | – | | | | (0.38 | ) | | | 9.99 | | |
| Class C | | 10/31/2005 | | | 9.67 | | | | 0.33 | | | | (0.37 | ) | | | (0.04 | ) | | | (0.33 | ) | | | – | | | | (0.33 | ) | | | 9.30 | | |
| | | 10/31/2004 | | | 10.20 | | | | 0.36 | | | | 0.10 | | | | 0.46 | | | | (0.36 | ) | | | (0.63 | ) | | | (0.99 | ) | | | 9.67 | | |
| | | 10/31/2003 | | | 9.98 | | | | 0.29 | | | | 0.22 | | | | 0.51 | | | | (0.29 | ) | | | – | | | | (0.29 | ) | | | 10.20 | | |
| Class I | | 10/31/2005 | | | 9.68 | | | | 0.44 | | | | (0.36 | ) | | | 0.08 | | | | (0.41 | ) | | | – | | | | (0.41 | ) | | | 9.35 | | |
| | | | | | | Ratios/Supplemental Data | |
| | | For the
Period | | Total | | Net Assets,
End of
Period | | Ratio of Expenses
to Average
Net Assets (a) | | Net Investment
Income (Loss)
to Average | | Portfolio
Turnover | |
| | | Ended (g) | | Return (c) | | (000's) | | Net (e) | | Total (f) | | Net Assets (a) | | Rate (b) | |
| Class A | | 10/31/2005 | | | 0.47 | % | | $ | 140,203 | | | | 1.25 | % | | | 1.25 | % | | | 4.33 | % | | | 58 | % | |
| | | 10/31/2004 | | | 5.72 | | | | 80,201 | | | | 1.43 | | | | 1.43 | | | | 4.25 | | | | 169 | | |
| | | 10/31/2003 | | | 6.39 | | | | 87,898 | | | | 1.49 | | | | 1.50 | | | | 3.56 | | | | 164 | | |
| | | 10/31/2002 | | | 4.45 | | | | 61,815 | | | | 1.62 | | | | 1.65 | | | | 4.23 | | | | 245 | | |
| | | 10/31/2001 | | | 13.14 | | | | 29,600 | | | | 1.68 | | | | 1.70 | | | | 4.84 | | | | 315 | | |
| Class B | | 10/31/2005 | | | (0.36 | ) | | | 32,560 | | | | 2.08 | | | | 2.08 | | | | 3.50 | | | | 58 | | |
| | | 10/31/2004 | | | 5.13 | | | | 45,338 | | | | 2.03 | | | | 2.03 | | | | 3.61 | | | | 169 | | |
| | | 10/31/2003 | | | 5.59 | | | | 69,502 | | | | 2.14 | | | | 2.15 | | | | 2.91 | | | | 164 | | |
| | | 10/31/2002 | | | 3.83 | | | | 67,220 | | | | 2.27 | | | | 2.30 | | | | 3.58 | | | | 245 | | |
| | | 10/31/2001 | | | 12.28 | | | | 40,435 | | | | 2.33 | | | | 2.35 | | | | 4.19 | | | | 315 | | |
| Class C | | 10/31/2005 | | | (0.40 | ) | | | 13,439 | | | | 2.11 | | | | 2.11 | | | | 3.47 | | | | 58 | | |
| | | 10/31/2004 | | | 5.02 | | | | 19,675 | | | | 2.10 | | | | 2.10 | | | | 3.74 | | | | 169 | | |
| | | 10/31/2003 | | | 5.16 | | | | 8,178 | | | | 2.14 | | | | 2.15 | | | | 2.91 | | | | 164 | | |
| Class I | | 10/31/2005 | | | 0.85 | | | | 110,709 | | | | 0.85 | | | | 0.85 | | | | 4.73 | | | | 58 | | |
NOTES TO FINANCIAL HIGHLIGHTS
(a) Annualized.
(b) Not annualized.
(c) Total Return has been calculated for the applicable period without deduction of a sales load, if any, on an initial purchase. Periods of less than one year are not annualized.
(d) Per share information is calculated based on average number of shares outstanding.
(e) Ratio of Net Expenses to Average Net Assets is net of fee waivers and reimbursements by the investment adviser, if any (see note 2).
(f) Ratio of Total Expenses to Average Net Assets includes all expenses before waivers and reimbursements by the investment adviser.
(g) The inception date for the Fund's offering of share classes are as follows:
Class C – November 11, 2002
Class I – November 8, 2004
The notes to the financial statements are an integral part of this report.
Transamerica IDEX Mutual Funds
Annual Report 2005
11
TA IDEX Transamerica Flexible Income
NOTES TO FINANCIAL STATEMENTS
At October 31, 2005
(all amounts in thousands)
NOTE 1. ORGANIZATION AND SIGNIFICANT ACCOUNTING POLICIES
Transamerica IDEX Mutual Funds is an open-end management investment company registered under the Investment Company Act of 1940, as amended (the "1940 Act").
In the normal course of business, TA IDEX Transamerica Flexible Income (the "Fund") enters into contracts that contain a variety of representations that provide general indemnifications. The Fund's maximum exposure under these arrangements is unknown, as this would involve future claims that may be made against the Fund and/or its affiliates that have not yet occurred. However, based on experience, the Fund expects the risk of loss to be remote.
This report should be read in conjunction with the current Fund prospectus, which contains more complete information about the Fund.
The following is a summary of significant accounting policies followed by the Fund in the preparation of the financial statements. In preparing the Fund's financial statements in accordance with accounting principles generally accepted in the United States of America ("GAAP"), estimates or assumptions (which could differ from actual results) may be used that affect reported amounts and disclosures.
Multiple class operations, income and expenses: The Fund currently offers four classes of shares, each with a public offering price that reflects different sales charges, if any, and expense levels. On June 15, 2004, Class C2 shares merged into Class C. On September 24, 2004, Class M shares merged into Class C. Class B shares will convert to Class A shares eight years after purchase. Income , non-class specific expenses and realized and unrealized gains and losses, are allocated daily to each class, based upon the value of shares outstanding method as permitted under Rule 18f-3 of the 1940 Act. Each class bears its own specific expenses as well as a portion of general common expenses.
Class I shares are offered for investment to the asset allocation funds of AEGON/Transamerica Series Trust (ATST).
Security valuations: The Fund values its investments at the close of the New York Stock Exchange ("NYSE"), normally 4 p.m. ET, each day the NYSE is open for business. Fund investments are valued at the last sale price or closing price on the day of valuation taken from the primary exchange where the security is principally traded.
Securities traded in the over-the-counter market and listed securities for which no sale was reported on that date are valued at the last quoted bid price.
Debt securities are valued based on a price quotation or other equivalent indication of value supplied by an exchange, a pricing service or a major market maker.
Investment company securities are valued at the net asset value of the underlying portfolio.
Foreign securities generally are valued based on quotations from the primary market in which they are traded. Because many foreign securities markets and exchanges close prior to the close of the NYSE, closing prices for foreign securities in those markets or on those exchanges do not reflect the events that occur after that close. If a significant market event impacting the value of a portfolio security (e.g., natural disaster, company announcement, market volatility) occurs subsequent to the close of trading in the security, but prior to the calculation of the Fund's net asset value per share, market quotations for that security may be determined to be unreliable and, accordingly, not "readily available." As a result, foreign equity securities held by the Fund may be valued at fair market value as determined in good faith by the Fund's Administrative Valuation Committee, under the supervision of the Board's Valuation Committee , using guidelines adopted by the Board of Trustees.
Other securities for which quotations are not readily available or whose values have been determined to be unreliable are valued at fair market value as determined in good faith by the Fund's Administrative Valuation Committee, under the supervision of the Board's Valuation Committee, using guidelines adopted by the Board of Trustees.
Cash: The Fund may leave cash overnight in its cash account with the custodian, Investors Bank & Trust Company ("IBT"). IBT has been contracted on behalf of the Fund to invest the excess cash into a savings account, which at October 31, 2005, was paying an interest rate of 2.76%.
Repurchase agreements: The Fund is authorized to enter into repurchase agreements. The Fund, through its custodian, Investors Bank & Trust Company ("IBT"), receives delivery of the underlying securities, the value of which at the time of purchase is required to be an amount equal to at least 100% of the resale price. The Fund will bear the risk of value fluctuations until the security can be sold and may encounter delays and incur costs in liquidating the security. In the event of bankruptcy or insolvency of the seller, delays and costs may be incurred.
Securities lending: The Fund may lend securities to qualified borrowers, with IBT acting as the Fund's lending agent. The Fund earns negotiated lenders' fees. The Fund receives cash and/or securities as collateral against the loaned securities. Cash collateral received is invested in short term, interest bearing securities. The Fund monitors the market value of securities loaned on a daily basis and requires collateral in an amount at least equal to the value of the securities loaned. Income from loaned securities on the Statement of Operations is net of fees, in the amount of $53, earned by IBT for its services.
Real Estate Investment Trusts ("REITs"): There are certain additional risks involved in investing in REITs. These include, but are not limited to, economic conditions, changes in zoning laws, real estate values, property taxes and interest rates.
Transamerica IDEX Mutual Funds
Annual Report 2005
12
TA IDEX Transamerica Flexible Income
NOTES TO FINANCIAL STATEMENTS (continued)
At October 31, 2005
(all amounts in thousands)
NOTE 1.–(continued)
Dividend income is recorded at management's estimate of the income included in distributions from the REIT investments. Distributions received in excess of the estimated amount are recorded as a reduction of the cost of investments. The actual amounts of income, return of capital and capital gains are only determined by each REIT after the fiscal year end and may differ from the estimated amounts.
Security transactions and investment income: Security transactions are recorded on the trade date. Security gains and losses are calculated on the specific identification basis. Dividend income, if any, is recorded on the ex-dividend date or, in the case of foreign securities, as soon as the Fund is informed of the ex-dividend date. Interest income, including accretion of discounts and amortization of premiums, is recorded on the accrual basis commencing on the settlement date.
Foreign currency denominated investments: The accounting records of the Fund are maintained in U.S. dollars. Securities and other assets and liabilities denominated in foreign currencies are translated into U.S. dollars at the closing exchange rate each day. The cost of foreign securities is translated at the exchange rate in effect when the investment was acquired. The Fund combines fluctuations from currency exchange rates and fluctuations in value when computing net realized and unrealized gains or losses from investments.
Net foreign currency gains and losses resulting from changes in exchange rates include: 1) foreign currency fluctuations between trade date and settlement date of investment security transactions; 2) gains and losses on forward foreign currency contracts; and 3) the difference between the receivable amounts of interest and dividends recorded in the accounting records in U.S. dollars and the amounts actually received.
Foreign currency denominated assets may involve risks not typically associated with domestic transactions. These risks include revaluation of currencies, adverse fluctuations in foreign currency values and possible adverse political, social and economic developments, including those particular to a specific industry, country or region.
Foreign capital gains taxes: The Fund may be subject to taxes imposed by countries in which it invests, with respect to its investment in issuers existing or operating in such countries. Such taxes are generally based on income earned or repatriated and capital gains realized on the sale of such investments. The Fund accrues such taxes when the related income or capital gains are earned. Some countries require governmental approval for the repatriation of investment income, capital or the proceeds of sales earned by foreign investors. In addition, if there is deterioration in a country's balance of payments or for other reasons, a country may impose temporary restrictions on foreign capital remittances abroad.
Forward foreign currency contracts: The Fund may enter into forward foreign currency contracts to hedge against exchange rate risk arising from investments in securities denominated in foreign currencies. Contracts are valued at the contractual forward rate and are marked to market daily, with the change in value recorded as an unrealized gain or loss. When the contracts are settled a realized gain or loss is incurred. Risks may arise from changes in market value of the underlying currencies and from the possible inability of counterparties to meet the terms of their contracts.
There were no open forward foreign currency contracts at October 31, 2005.
Futures contracts: The Fund may enter into futures contracts to manage exposure to market, interest rate or currency fluctuations. Futures contracts are valued at the settlement price established each day by the board of trade or exchange on which they are traded. The primary risks associated with futures contracts are imperfect correlation between the change in market value of the securities held and the prices of futures contracts; the possibility of an illiquid market and inability of the counterparty to meet the contract terms.
There were no open futures contracts at October 31, 2005.
Redemption fees: A short-term trading redemption fee may be assessed on any Fund shares in a fund account that are sold during the first five (5) NYSE trading days following their purchase date. This redemption fee will equal 2% of the amount redeemed and shares held the longest will be treated as being redeemed first and shares held the shortest as being redeemed last. For the year ended October 31, 2005, the Fund received less than $1 in redemption fees.
Dividend distributions: Distributions to shareholders are recorded on the ex-dividend date and are determined in accordance with Federal income tax regulations which may differ from GAAP.
NOTE 2. RELATED PARTY TRANSACTIONS
Effective January 1, 2005 AEGON/Transamerica Fund Advisors, Inc. was renamed Transamerica Fund Advisors, Inc. ("TFAI"); AEGON/Transamerica Fund Services, Inc. and AEGON/Transamerica Investor Services, Inc. merged into one entity and was renamed Transamerica Fund Services, Inc. ("TFS").
TFAI is the Fund's investment adviser. TFS is the Fund's administrator and transfer agent. AFSG Securities Corp. ("AFSG") is the Fund's distributor/principal underwriter. TFAI, TFS , and AFSG are affiliates of AEGON, NV, a Netherlands corporation.
Transamerica Investment Management, LLC is both an affiliate of the Fund and a sub-adviser to the Fund.
Transamerica IDEX Mutual Funds
Annual Report 2005
13
TA IDEX Transamerica Flexible Income
NOTES TO FINANCIAL STATEMENTS (continued)
At October 31, 2005
(all amounts in thousands)
NOTE 2.–(continued)
The following schedule represents the percentage of Fund assets owned by affiliated mutual funds:
| | | Net
Assets | | % of
Net Assets | |
TA IDEX Asset Allocation–
Conservative Portfolio | | $ | 24,685 | | | | 8.31 | % | |
TA IDEX Asset Allocation–
Moderate Growth Portfolio | | | 44,505 | | | | 14.99 | % | |
TA IDEX Asset Allocation–
Moderate Portfolio | | | 48,543 | | | | 16.35 | % | |
Asset Allocation–
Conservative Portfolio | | | 50,295 | | | | 16.94 | % | |
Asset Allocation–
Moderate Growth Portfolio | | | 38,967 | | | | 13.12 | % | |
Asset Allocation–
Moderate Portfolio | | | 21,482 | | | | 7.24 | % | |
| Total | | $ | 228,477 | | | | 76.95 | % | |
Investment advisory fees: The Fund pays management fees to TFAI based on average daily net assets ("ANA") at the following breakpoints:
0.80% of the first $100 million of ANA
0.775% of the next $150 million of ANA
0.675% of ANA over $250 million
TFAI has contractually agreed to waive its advisory fee and will reimburse the Fund to the extent that operating expenses, excluding 12b-1 fees, exceed the following stated annual limit:
1.50% Expense Limit (Class A, B and C)
1.00% Expense Limit (Class I)
If total Fund expenses fall below the annual expense limitation agreement agreed to by the adviser within the succeeding three years, the Fund may be required to pay that adviser a portion or all of the reimbursed class expenses.
There were no amounts recaptured during the year ended October 31, 2005. There are no amounts available for recapture at October 31, 2005.
Distribution and service fees: The Fund has a 12b-1 distribution plan under the 1940 Act pursuant to which an annual fee, based on average daily net assets, is paid to the distributor for various disbursements such as broker-dealer account servicing fees and other promotional expenses of the Fund. The Fund is authorized under the 12b-1 plan to pay fees on each class up to the following limits:
| Class A | | | 0.35 | % | |
| Class B | | | 1.00 | % | |
| Class C | | | 1.00 | % | |
| Class I | | | N/A | | |
In the case the Fund or a class of shares of the Fund is closed to new investors or investments, the Fund is authorized to pay 12b-1 fees for past sales and distribution efforts and present and past investor services.
Underwriter commissions relate to front-end sales charges imposed for Class A shares and contingent deferred sales charges from Classes B, C, and certain A share redemptions. For the year ended October 31, 2005, the underwriter commissions were as follows:
| Received by Underwriter | | $ | 137 | | |
| Retained by Underwriter | | | 8 | | |
| Contingent Deferred Sales Charge | | | 123 | | |
Administrative services: The Fund has entered into an agreement with TFS for financial and legal fund administration services. As of January 1, 2005 the Fund pays TFS an annual fee of 0.02% of ANA. Prior to January 1, 2005 the Fund paid TFS an annual fee of 0.015% of ANA. The Legal fees on the Statement of Operations are for fees paid to external legal counsel.
Transfer agent fees: The Fund pays TFS an annual per-account charge for each open and closed account. The Fund paid TFS $165 for the year ended October 31, 2005.
Deferred compensation plan: Each eligible independent Fund Trustee may elect to participate in a non-qualified deferred compensation plan maintained by Transamerica IDEX Mutual Funds (the "Plan"). Under the Plan, such Trustees may defer payment of all or a portion of their total fees earned as a Fund Trustee. Each Trustee who is a participant in the Plan may elect that the earnings, losses or gains credited to his or her deferred fee amounts be determined based on a deemed investment in any series of Transamerica IDEX Mutual Funds, including the Fund. The right of a participant to receive a distribution from the Plan of the deferred fees is an unsecured claim against the general assets of all series of Transamerica IDEX Mutual Funds. The pro rata liability to the Fund of all deferred fees in the Plan amounted, as of October 31, 2005, to $13.
NOTE 3. INVESTMENT TRANSACTIONS
The cost of securities purchased and proceeds from securities sold (excluding short-term securities) for the year ended October 31, 2005, were as follows:
| Purchases of securities: | |
| Long-Term | | $ | 178,765 | | |
| U.S. Government | | | 125,504 | | |
| Proceeds from maturities and sales of securities: | |
| Long-Term | | | 90,233 | | |
| U.S. Government | | | 52,594 | | |
Transamerica IDEX Mutual Funds
Annual Report 2005
14
TA IDEX Transamerica Flexible Income
NOTES TO FINANCIAL STATEMENTS (continued)
At October 31, 2005
(all amounts in thousands)
NOTE 4. FEDERAL INCOME TAX MATTERS
The Fund has not made any provision for federal income or excise taxes due to its policy to distribute all of its taxable income and capital gains to its shareholders and otherwise qualify as a regulated investment company under Subchapter M of the Internal Revenue Code. Income and capital gain distributions are determined in accordance with income tax regulations, which may differ from GAAP. These differences are primarily due to differing treatment for items including, but not limited to, wash sales and capital loss carryforwards.
Therefore, distributions determined in accordance with tax regulations may differ significantly in amount or character from net investment income and realized gains for financial reporting purposes. Financial reporting records are adjusted for permanent book/tax differences to reflect tax character. Financial records are not adjusted for temporary differences. These reclassifications are as follows:
| Shares of beneficial interest, unlimited shares authorized | | $ | (5 | ) | |
| Accumulated net investment income (loss) | | | 5 | | |
The capital loss carryforward is available to offset future realized capital gains through the period listed:
Capital Loss
Carryforward | | Available through | |
| $ | 890 | | | October 31, 2013 | |
The tax character of distributions paid may differ from the character of distributions shown in the Statement of Changes in Net Assets due to short-term gains being treated as ordinary income for tax purposes. The tax character of distributions paid during 2004 and 2005 was as follows:
| 2004 Distributions paid from: | |
| Ordinary Income | | $ | 9,500 | | |
| Long-term Capital Gain | | | 7,022 | | |
| Return of Capital | | | 329 | | |
| 2005 Distributions paid from: | |
| Ordinary Income | | $ | 11,438 | | |
| Long-term Capital Gain | | | – | | |
The tax basis components of distributable earnings as of October 31, 2005, are as follows:
| Undistributed Ordinary Income | | $ | – | | |
| Undistributed Long-term Capital Gains | | $ | – | | |
| Capital Loss Carryforward | | $ | (890 | ) | |
| Net Unrealized Appreciation (Depreciation) | | $ | (8,097 | )* | |
* Amount includes unrealized appreciation (depreciation) from deferred compensation.
The aggregate cost of investments and composition of unrealized appreciation (depreciation) for federal income tax purposes as of October 31, 2005, are as follows:
| Federal Tax Cost Basis | | $ | 351,644 | | |
| Unrealized Appreciation | | $ | 1,172 | | |
| Unrealized (Depreciation) | | | (9,268 | ) | |
| Net Unrealized Appreciation (Depreciation) | | $ | (8,096 | ) | |
NOTE 5. REGULATORY PROCEEDINGS
There continues to be significant federal and state regulatory activity relating to financial services companies, particularly mutual fund companies and their investment advisers. As part of an ongoing investigation regarding potential market timing, recordkeeping and trading compliance issues and matters affecting the Fund's investment adviser, TFAI, and certain affiliates and former employees of TFAI, the SEC staff has indicated that it is likely to take some action against TFAI and certain of its affiliates at the conclusion of the investigation. The potential timing and the scope of any such action is difficult to predict. Although the impact of any action brought against TFAI and/or its affiliates is difficult to assess at the present time, the Fund currently believes that the likelihood that any such action will have a material adverse impact on it is remote. It is important to note that the Fund is not aware of any allega tion of wrongdoing against it and its Board at the time this annual report is printed. Although it is not anticipated that these developments will have an adverse impact on the Fund, there can be no assurance at this time. TFAI and its affiliates are actively working with the SEC in regard to this matter; however, the exact resolution cannot be determined at this time. TFAI will take such actions that it deems necessary or appropriate to continue providing management services to the Fund and to bring all matters to an appropriate conclusion.
TFAI and/or its affiliates, and not the Fund, will bear the costs regarding these regulatory matters.
NOTE 6. SUBSEQUENT EVENT (unaudited)
Effective November 7, 2005, the Expense Limit for the Fund's Class I shares is 1.50%.
Transamerica IDEX Mutual Funds
Annual Report 2005
15
Report of Independent Registered Certified Public Accounting Firm
To the Board of Trustees and Shareholders of
TA IDEX Transamerica Flexible Income
In our opinion, the accompanying statement of assets and liabilities, including the schedule of investments, and the related statements of operations and of changes in net assets and the financial highlights present fairly, in all material respects, the financial position of TA IDEX Transamerica Flexible Income (the "Fund") (one of the portfolios constituting the Transamerica IDEX Mutual Funds) at October 31, 2005, the results of its operations for the year then ended, the changes in its net assets for each of the two years in the period then ended and the financial highlights for each of the periods presented, in conformity with accounting principles generally accepted in the United States of America. These financial statements and financial highlights (hereafter referred to as "financial statements") are the responsibility of the Fund's management; our responsibility is to express an opinion on these financial statements based on our audits. We conducted our audits of these financial statements in accordance with the standards of the Public Company Accounting Oversight Board (United States). Those standards require that we plan and perform the audit to obtain reasonable assurance about whether the financial statements are free of material misstatement. An audit includes examining, on a test basis, evidence supporting the amounts and disclosures in the financial statements, assessing the accounting principles used and significant estimates made by management, and evaluating the overall financial statement presentation. We believe that our audits, which included confirmation of securities at October 31, 2005 by correspondence with the custodian and brokers, provide a reasonable basis for our opinion.

December 22, 2005
Transamerica IDEX Mutual Funds
Annual Report 2005
16
TA IDEX Transamerica Flexible Income
SUPPLEMENTAL INFORMATION (unaudited)
TAX INFORMATION
For dividends paid during the year ended October 31, 2005, the Fund designated $253 as qualified dividend income.
For corporate shareholders, 2% of investment income (dividend income plus short-term gains, if any) qualifies for the dividends received deduction.
The information and distributions reported herein may differ from the information and distributions taxable to the shareholders for the calendar year ending December 31, 2005. Complete information will be computed and reported in conjunction with your 2005 Form 1099-DIV.
Transamerica IDEX Mutual Funds
Annual Report 2005
17
TA IDEX Transamerica Growth Opportunities
MARKET ENVIRONMENT
The Russell 2500 Growth Index ("Russell 2500 Growth") of small and medium-sized stocks gained 13.83% in this one-year period. The market advanced rapidly in the final weeks of 2004 as investors responded to the clear-cut outcome of the U.S. Presidential election, sustained economic expansion, continued earnings growth and historically low interest rates.
The rally lasted until a sharp up tick in energy prices raised the specter of greater inflationary pressures. That, combined with slower-than-anticipated employment growth, gave investors pause. Although economic fundamentals were quite good, the stock market turned volatile and remained so, fluctuating as investors tried to gauge the import of monthly employment statistics, rising energy prices and the Federal Reserve Board's ("Fed") commitment to raising short-term interest rates. Over the course of the twelve month period, the Fed boosted the federal funds rate from 1.75% to 3.75%. Consumer spending declined somewhat as rates rose and energy prices remained persistently high.
Energy and utilities were the Russell 2500 Growth's best-performing sectors. Sectors that are more sensitive to the economy and/or interest rates, such as financial services, technology and consumer discretionary stocks, were laggards.
PERFORMANCE
For the year ended October 31, 2005, TA IDEX Transamerica Growth Opportunities, Class A returned 18.76%. By comparison its benchmark, the Russell 2500 Growth, returned 13.83%.
STRATEGY REVIEW
We attribute the portfolio's superior results to our consistent focus on companies with savvy management, sustainable competitive advantages, and the ability to benefit from positive secular growth trends. Although the technology, financial services and consumer discretionary were lagging portions of the Russell 2500 Growth, many of the portfolio's strongest stocks were in those sectors. For example, the portfolio's largest contributors to performance during the period included SanDisk Corporation ("SanDisk"), a beneficiary of the trend toward digitization of information and media content; TECHNE Corporation ("TECHNE"), a participant in the broad movement toward bio-engineered medicines; and Weight Watchers International, Inc., a leading diet program that is growing along with Americans' need to maintain healthy body weights.
SanDisk develops, manufactures and distributes flash-memory devices. Its stock price was quite volatile early in the period, as investors questioned whether ultra-compact memory devices represented a growth industry. As it became increasingly clear that the number and variety of applications for such products are expanding rapidly, the stock price soared and, of late, has shown greater stability.
TECHNE, a specialty manufacturer of biological and biotechnology products (e.g., purified proteins for research), is experiencing earnings growth as more pharmaceuticals companies seek to develop genetics-based remedies.
Partially offsetting these gains were the portfolio's energy positioning and several individual holdings. Relatively speaking, energy was the portfolio's weakest sector; the underweighting in this breakaway sector was a factor.
Gemstar-TV Guide International, Inc. and SkillSoft PLC were the portfolio's largest individual detractors from results. Both encountered fundamental problems and we chose to exit our positions. We also saw weak results for Tuesday Morning Corporation, a discount retailer whose earnings declined as consumers, pinched by rising energy costs, curtailed their spending on household items.
Ed Han
John Huber
Co-Fund Managers
Transamerica Investment Management, LLC
Transamerica IDEX Mutual Funds
Annual Report 2005
1
TA IDEX Transamerica Growth Opportunities
Comparison of change in value of $10,000 investment in Class A shares and its comparative index.
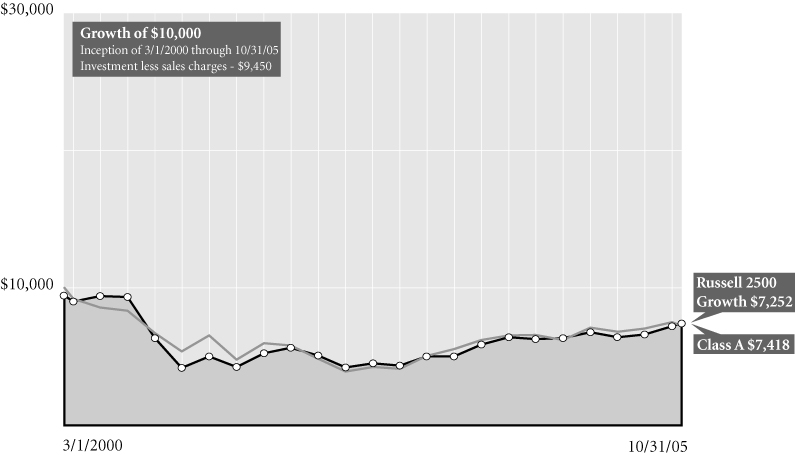
Average Annual Total Return for Periods Ended 10/31/05
| | | 1 year | | 5 years | | From
Inception | | Inception
Date | |
| Class A (NAV) | | | 18.76 | % | | | (2.04 | )% | | | (4.18 | )% | | 3/1/00 | |
| Class A (POP) | | | 12.23 | % | | | (3.15 | )% | | | (5.13 | )% | | 3/1/00 | |
| Russell 2500 Growth1 | | | 13.83 | % | | | (1.48 | )% | | | (5.51 | )% | | 3/1/00 | |
| Class B (NAV) | | | 17.43 | % | | | (2.89 | )% | | | (4.99 | )% | | 3/1/00 | |
| Class B (POP) | | | 12.43 | % | | | (3.08 | )% | | | (4.99 | )% | | 3/1/00 | |
| Class C (NAV) | | | 17.40 | % | | | – | | | | 17.65 | % | | 11/11/02 | |
| Class C (POP) | | | 16.40 | % | | | – | | | | 17.65 | % | | 11/11/02 | |
NOTES
1 The Russell 2500 Growth (Russell 2500 Growth) Index is an unmanaged index used as a general measure of market performance. Calculations assume dividends and capital gains are reinvested and do not include any managerial expenses. From inception calculation is based on life of Class A shares. Source: Standard & Poor's Micropal®© Micropal, Inc. 2005 –1-800-596-5323 – http://www.funds-sp.com.
The performance data presented represents past performance, future results may vary. Performance data does not reflect the deduction of taxes that would be paid on fund distributions or the redemption of fund shares. Investment return and principal value will fluctuate so that an investor's shares, when redeemed, may be worth more or less than their original cost. Current performance may be lower or higher than performance quoted. Please see www.transamericaidex.com for performance data current to the most recent month-end.
Public Offering Price (POP) returns include the reinvestment of dividends and capital gains and reflect the maximum sales charge of 5.5% for A shares or the maximum applicable contingent deferred sales charge (5% in the 1st year, decreasing to 0% after 6 years) for Class B shares and 1% (during the first 12 months) for Class C shares. Shares purchased prior to March 1, 2004 are subject to a maximum applicable contingent deferred sales charge (5% in the 1st year, decreasing to 0% after 7 years) for Class B shares and (2% in the 1st year, decreasing to 0% after 2 years) for Class C shares. Net Asset Value (NAV) returns include the reinvestment of dividends and capital gains but do not reflect any sales charges.
Investing in small cap stocks generally involves greater risk and volatility, therefore an investment in the fund may not be appropriate for everyone.
This material must be preceded or accompanied by a current prospectus, which includes specific contents regarding the investment objectives and policies of this fund.
Transamerica IDEX Mutual Funds
Annual Report 2005
2
TA IDEX Transamerica Growth Opportunities
UNDERSTANDING YOUR FUND'S EXPENSES
(unaudited)
SHAREHOLDER EXPENSES
Fund shareholders may incur two types of costs: (1) transaction costs, including sales charges (loads) on purchases, contingent deferred sales charges on redemptions and redemption fees; and (2) ongoing costs, including management fees, 12b-1 distribution and service fees, and other fund expenses.
The following Example is intended to help you understand your ongoing costs (in dollars and cents) of investing in a Fund and to compare these costs with the ongoing costs of investing in other funds.
The Example is based on an investment of $1,000 invested at May 1, 2005 and held for the entire period until October 31, 2005.
ACTUAL EXPENSES
The first line in the table below provides information about actual account values and actual expenses. You may use the information in this line, together with the amount you invested, to estimate the expenses that you paid over the period. Simply divide your account value by $1,000 (for example, an $8,600 account value divided by $1,000 = 8.6), then multiply the result by the number in the first line of your Fund under the heading entitled "Expenses Paid During Period" to estimate the expenses you paid on your account during this period. If your account is an IRA, your expenses could have included a $15 annual fee. The amount of any fee paid through your account would increase the estimate of expenses you paid during the period and decrease your ending account value.
HYPOTHETICAL EXAMPLE FOR COMPARISON PURPOSES
The second line in the table below provides information about hypothetical account values and hypothetical expenses based on the Fund's actual expense ratio and an assumed rate of return of 5% per year before expenses, which is not the Fund's actual return. The hypothetical account values and expenses may not be used to estimate the actual ending account balance or expenses you paid for the period. You may use this information to compare the ongoing costs of investing in your Fund and other funds. To do so, compare this 5% hypothetical example with the 5% hypothetical examples that appear in the shareholder reports of the other funds. As in the case of the actual expense example, if your account is subject to an IRA fee, the amount of the fee paid through your account would increase the hypothetical expenses you would have paid during the period and decrease the hypothetical ending account value.
Please note that the expenses shown in the table are meant to highlight your ongoing costs only and do not reflect any transactional costs, such as sales charges, redemption fees, brokerage commissions paid on purchases and sales of fund shares. Therefore, the second line under the Fund in the table is useful in comparing ongoing costs only, and will not help you determine the relative total costs of owning different funds. If any of these transaction costs were included, your costs would be higher. The expenses shown in the table do not reflect any fees that may be charged to you by brokers, financial intermediaries or other financial institutions.
| | | Beginning
Account
Value | | Ending
Account
Value | | Annualized
Expense
Ratio | | Expenses Paid
During Period (a) | |
| Class A | |
| Actual | | $ | 1,000.00 | | | $ | 1,205.60 | | | | 1.41 | % | | $ | 7.84 | | |
| Hypothetical (b) | | | 1,000.00 | | | | 1,018.10 | | | | 1.41 | | | | 7.17 | | |
| Class B | |
| Actual | | | 1,000.00 | | | | 1,198.70 | | | | 2.53 | | | | 14.02 | | |
| Hypothetical (b) | | | 1,000.00 | | | | 1,012.45 | | | | 2.53 | | | | 12.83 | | |
| Class C | |
| Actual | | | 1,000.00 | | | | 1,198.40 | | | | 2.44 | | | | 13.52 | | |
| Hypothetical (b) | | | 1,000.00 | | | | 1,012.91 | | | | 2.44 | | | | 12.38 | | |
(a) Expenses are calculated using each Fund's annualized expense ratio (as disclosed in the table), multiplied by the average account value for the period, multiplied by number of days in the period (184 days), and divided by the number of days in the year (365 days).
(b) 5% return per year before expenses.
GRAPHICAL PRESENTATION OF SCHEDULE OF INVESTMENTS
By Sector
At October 31, 2005
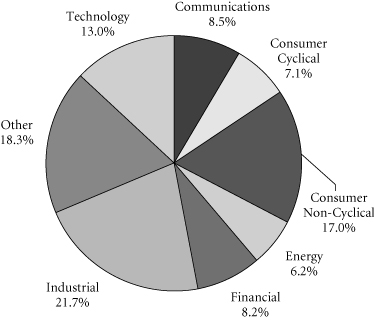
This chart shows the percentage breakdown by sector of the Fund's total investment securities.
Transamerica IDEX Mutual Funds
Annual Report 2005
3
TA IDEX Transamerica Growth Opportunities
SCHEDULE OF INVESTMENTS
At October 31, 2005
(all amounts except share amounts in thousands)
| | | Shares | | Value | |
| COMMON STOCKS (92.8%) | |
| Communication (4.2%) | |
| Global Payments, Inc. | | | 353,284 | | | $ | 15,138 | | |
| Computer & Data Processing Services (6.6%) | |
| Digital Insight Corp. ‡ | | | 159,470 | | | | 4,757 | | |
| McAfee, Inc. ‡ | | | 290,000 | | | | 8,709 | | |
| NAVTEQ Corp. ‡† | | | 206,214 | | | | 8,067 | | |
| THQ, Inc. ‡ | | | 88,180 | | | | 2,044 | | |
| Computer & Office Equipment (7.7%) | |
| Sandisk Corp. ‡† | | | 465,990 | | | | 27,442 | | |
| Engineering & Management Services (3.3%) | |
| Jacobs Engineering Group, Inc. ‡ | | | 185,926 | | | | 11,853 | | |
| Environmental Services (0.3%) | |
| Stericycle, Inc. ‡ | | | 15,300 | | | | 881 | | |
| Furniture & Home Furnishings Stores (1.8%) | |
| Tuesday Morning Corp. † | | | 269,178 | | | | 6,457 | | |
| Hardware Stores (2.5%) | |
| Fastenal Co. † | | | 125,810 | | | | 8,823 | | |
| Industrial Machinery & Equipment (10.2%) | |
| Cooper Cameron Corp. ‡† | | | 171,760 | | | | 12,664 | | |
| Graco, Inc. | | | 323,670 | | | | 11,092 | | |
| Grant Prideco, Inc. ‡ | | | 321,490 | | | | 12,503 | | |
| Management Services (2.4%) | |
| ServiceMaster Co. (The) | | | 681,501 | | | | 8,573 | | |
| Medical Instruments & Supplies (5.5%) | |
| DENTSPLY International, Inc. | | | 82,400 | | | | 4,543 | | |
| Techne Corp. ‡† | | | 257,820 | | | | 13,979 | | |
| Varian Medical Systems, Inc. ‡ | | | 21,000 | | | | 957 | | |
| Motion Pictures (2.8%) | |
| Lions Gate Entertainment Corp. ‡† | | | 600,000 | | | | 5,760 | | |
| Macrovision Corp. ‡ | | | 225,170 | | | | 4,242 | | |
| Paperboard Containers & Boxes (3.1%) | |
| Packaging Corp. of America † | | | 551,780 | | | | 11,196 | | |
| Personal Credit Institutions (3.6%) | |
| Financial Federal Corp. | | | 339,300 | | | | 12,954 | | |
| Personal Services (9.2%) | |
| Jackson Hewitt Tax Service, Inc. | | | 580,000 | | | | 14,338 | | |
| Weight Watchers International, Inc. ‡† | | | 351,600 | | | | 18,484 | | |
| Research & Testing Services (2.2%) | |
| Affymetrix, Inc. ‡† | | | 172,020 | | | | 7,815 | | |
| Restaurants (1.0%) | |
| PF Chang's China Bistro, Inc. ‡† | | | 75,710 | | | | 3,463 | | |
| | | Shares | | Value | |
| Retail Trade (3.5%) | |
| Blue Nile, Inc. ‡† | | | 350,000 | | | $ | 12,554 | | |
| Security & Commodity Brokers (5.7%) | |
| BlackRock, Inc.–Class A | | | 215,000 | | | | 20,382 | | |
| Stone, Clay & Glass Products (2.2%) | |
| Gentex Corp. † | | | 417,924 | | | | 7,865 | | |
| Telecommunications (2.3%) | |
| NeuStar, Inc.–Class A ‡ | | | 271,980 | | | | 8,323 | | |
| Transportation & Public Utilities (12.7%) | |
| CH Robinson Worldwide, Inc. | | | 680,000 | | | | 23,977 | | |
| Expeditors International of Washington, Inc. | | | 348,980 | | | | 21,173 | | |
| Total Common Stocks (cost: $242,484) | | | | | | | 331,008 | | |
| | | Principal | | Value | |
| SECURITY LENDING COLLATERAL (20.7%) | |
| Debt (19.2%) | |
| Bank Notes (1.3%) | |
Bank of America
3.81%, due 06/07/2006 * | | $ | 2,072 | | | $ | 2,072 | | |
| 3.81%, due 08/10/2006 * | | | 2,056 | | | | 2,056 | | |
Credit Suisse First Boston Corp.
4.11%, due 03/10/2006 * | | | 411 | | | | 411 | | |
| Certificates Of Deposit (1.4%) | |
Canadian Imperial Bank of Commerce
4.07%, due 11/04/2005 * | | | 1,645 | | | | 1,644 | | |
Harris Trust & Savings Bank
3.80%, due 11/04/2005 * | | | 1,309 | | | | 1,309 | | |
Rabobank Nederland
4.03%, due 05/31/2006 * | | | 2,056 | | | | 2,056 | | |
| Commercial Paper (4.1%) | |
Ciesco LLC
4.00%, due 11/03/2005 | | | 2,053 | | | | 2,053 | | |
General Electric Capital Corp.
3.96%, due 12/05/2005 | | | 1,645 | | | | 1,645 | | |
Paradigm Funding LLC–144A
4.01%, due 11/07/2005 | | | 1,639 | | | | 1,639 | | |
Park Avenue Receivables Corp.–144A
4.03%, due 12/02/2005 | | | 1,628 | | | | 1,628 | | |
Preferred Receivables Corp.–144A
4.04%, due 12/05/2005 | | | 1,233 | | | | 1,233 | | |
Ranger Funding Co. LLC–144A
3.99%, due 11/15/2005 | | | 1,224 | | | | 1,224 | | |
Sheffield Receivables Corp.–144A
4.01%, due 11/08/2005 | | | 1,233 | | | | 1,233 | | |
Yorktown Capital LLC
3.97%, due 11/09/2005
3.93%, due 11/17/2005 | | | 2,049
2,042 | | | | 2,049
2,042 | | |
The notes to the financial statements are an integral part of this report.
Transamerica IDEX Mutual Funds
Annual Report 2005
4
TA IDEX Transamerica Growth Opportunities
SCHEDULE OF INVESTMENTS (continued)
At October 31, 2005
(all amounts except share amounts in thousands)
| | | Principal | | Value | |
| Euro Dollar Overnight (4.5%) | | | |
Bank of Montreal
3.79%, due 11/01/2005 | | $ | 1,233 | | | $ | 1,233 | | |
Barclays
3.80%, due 11/04/2005 | | | 1,645 | | | | 1,645 | | |
BNP Paribas
3.83%, due 11/02/2005 | | | 2,467 | | | | 2,467 | | |
Deutsche Bank
3.80%, due 11/02/2005 | | | 4,111 | | | | 4,111 | | |
HSBC Banking/Holdings PLC
3.84%, due 11/07/2005 | | | 1,233 | | | | 1,233 | | |
Royal Bank of Scotland
3.76%, due 11/01/2005 | | | 1,645 | | | | 1,645 | | |
Svenska Handlesbanken
4.03%, due 11/01/2005 | | | 2,117 | | | | 2,117 | | |
UBS AG
3.80%, due 11/03/2005 | | | 1,645 | | | | 1,645 | | |
| Euro Dollar Terms (1.6%) | | | |
Royal Bank of Scotland
4.00%, due 12/12/2005 | | | 1,645 | | | | 1,645 | | |
UBS AG
4.02%, due 12/01/2005 | | | 1,645 | | | | 1,645 | | |
Wells Fargo
3.96%, due 11/14/2005 | | | 2,467 | | | | 2,467 | | |
| Promissory Notes (0.5%) | | | |
Goldman Sachs Group, Inc.
4.02%, due 12/28/2005 | | | 1,727 | | | | 1,727 | | |
| Repurchase Agreements (5.8%) †† | | | |
Credit Suisse First Boston Corp.
4.10%, dated 10/31/2005 to be
repurchased at $2,802 on
11/01/2005 | | | 2,802 | | | | 2,802 | | |
| | | Principal | | Value | |
Goldman Sachs Group, Inc. (The)
4.10%, dated 10/31/2005 to be
repurchased at $6,990 on 11/01/2005 | | $ | 6,990 | | | $ | 6,990 | | |
Lehman Brothers, Inc..
4.10%, dated 10/31/2005 to be
repurchased at $194 on 11/01/2005 | | | 194 | | | | 194 | | |
Merrill Lynch & Co.
4.10%, dated 10/31/2005 to be
repurchased at $8,224 on 11/01/2005 | | | 8,223 | | | | 8,223 | | |
Morgan Stanley Dean Witter & Co.
4.17%, dated 10/31/2005 to be
repurchased at $2,465 on 11/01/2005 | | | 2,465 | | | | 2,465 | | |
| | | Shares | | Value | |
| Investment Companies (1.5%) | | | |
| Money Market Funds (1.5%) | | | |
American Beacon Fund
1-day yield of 3.81% | | | 1,772,802 | | | $ | 1,773 | | |
Barclays Global Investors Institutional
Money Market Fund
1-day yield of 3.92% | | | 1,644,626 | | | | 1,645 | | |
Goldman Sachs Financial Square
Prime Obligations Fund
1-day yield of 3.79% | | | 256,180 | | | | 256 | | |
Merrimac Cash Fund, Premium Class
1-day yield of 3.70% @ | | | 1,626,449 | | | | 1,626 | | |
| Total Security Lending Collateral (cost: $73,848) | | | | | | | 73,848 | | |
| Total Investment Securities (cost: $316,332) | | | | | | $ | 404,856 | | |
| SUMMARY: | | | |
| Investment securities, at value | | | 113.5 | % | | $ | 404,856 | | |
| Liabilities in excess of other assets | | | (13.5 | )% | | | (48,276 | ) | |
| Net assets | | | 100.0 | % | | $ | 356,580 | | |
NOTES TO SCHEDULE OF INVESTMENTS:
‡ Non-income producing.
† At October 31, 2005, all or a portion of this security is on loan (see Note 1). The value at October 31, 2005, of all securities on loan is $70,907.
* Floating or variable rate note. Rate is listed as of October 31, 2005.
†† Cash collateral for the Repurchase Agreements, valued at $21,087, that serve as collateral for securities lending are invested in corporate bonds with interest rates and maturity dates ranging from 0.00%–9.86% and 12/31/2005–11/15/2096, respectively.
@ Regulated investment company advised by Investors Bank and Trust Co. ("IBT"). IBT is also the accounting, custody and lending agent for the Fund.
DEFINITIONS:
144A 144A Securities are registered pursuant to Rule 144A of the Securities Act of 1933. These securities are deemed to be liquid for purposes of compliance limitations on holdings of illiquid securities and may be resold as transactions exempt from registration, normally to qualified institutional buyers. At October 31, 2005, these securities aggregated $6,957 or 2.0% of the net assets of the Fund.
The notes to the financial statements are an integral part of this report.
Transamerica IDEX Mutual Funds
Annual Report 2005
5
TA IDEX Transamerica Growth Opportunities
STATEMENT OF ASSETS AND LIABILITIES
At October 31, 2005
(all amounts except per share amounts in thousands)
| Assets: | | | |
Investment securities, at value (cost: $316,332)
(including securities loaned of $70,907) | | $ | 404,856 | | |
| Cash | | | 27,969 | | |
| Receivables: | |
| Investment securities sold | | | 3,000 | | |
| Shares of beneficial interest sold | | | 1,463 | | |
| Interest | | | 87 | | |
| Dividends | | | 70 | | |
| Other | | | 14 | | |
| | | | 437,459 | | |
| Liabilities: | | | |
| Investment securities purchased | | | 6,226 | | |
| Accounts payable and accrued liabilities: | |
| Shares of beneficial interest redeemed | | | 218 | | |
| Management and advisory fees | | | 236 | | |
| Distribution and service fees | | | 156 | | |
| Transfer agent fees | | | 115 | | |
| Administration fees | | | 5 | | |
| Payable for collateral for securities on loan | | | 73,848 | | |
| Other | | | 75 | | |
| | | | 80,879 | | |
| Net Assets | | $ | 356,580 | | |
| Net Assets Consist of: | | | |
Shares of beneficial interest, unlimited shares
authorized, no par value | | $ | 574,153 | | |
| Accumulated net investment income (loss) | | | (17 | ) | |
Accumulated net realized gain (loss) from investment
securities | | | (306,079 | ) | |
Net unrealized appreciation (depreciation) on
investment securities | | | 88,523 | | |
| Net Assets | | $ | 356,580 | | |
| Net Assets by Class: | | | |
| Class A | | $ | 256,559 | | |
| Class B | | | 74,589 | | |
| Class C | | | 25,432 | | |
| Shares Outstanding: | | | |
| Class A | | | 32,691 | | |
| Class B | | | 9,971 | | |
| Class C | | | 3,394 | | |
| Net Asset Value Per Share: | | | |
| Class A | | $ | 7.85 | | |
| Class B | | | 7.48 | | |
| Class C | | | 7.49 | | |
| Maximum Offering Price Per Share (a): | | | |
| Class A | | $ | 8.31 | | |
(a) Includes the maximum selling commission (represented as a percentage of offering price) which is reduced on certain levels of sales as set forth in the Prospectus. Net asset value per share for Classes B and C shares represents offering price. The redemption price for Classes B and C shares equals net asset value less any applicable contingent deferred sales charge.
STATEMENT OF OPERATIONS
For the year ended October 31, 2005
(all amounts in thousands)
| Investment Income: | | | |
| Interest | | $ | 216 | | |
| Dividends | | | 3,333 | | |
| Income from loaned securities–net | | | 212 | | |
| | | | 3,761 | | |
| Expenses: | | | |
| Management and advisory fees | | | 2,672 | | |
| Distribution and service fees: | |
| Class A | | | 832 | | |
| Class B | | | 755 | | |
| Class C | | | 266 | | |
| Transfer agent fees: | |
| Class A | | | 388 | | |
| Class B | | | 535 | | |
| Class C | | | 170 | | |
| Printing and shareholder reports | | | 177 | | |
| Custody fees | | | 35 | | |
| Administration fees | | | 65 | | |
| Legal fees | | | 24 | | |
| Audit fees | | | 20 | | |
| Trustees fees | | | 16 | | |
| Registration fees: | |
| Class A | | | 18 | | |
| Class B | | | 11 | | |
| Class C | | | 4 | | |
| Other | | | 4 | | |
| Total expenses | | | 5,992 | | |
| Less: | |
| Reimbursement of class expenses: | |
| Class B | | | (160 | ) | |
| Class C | | | (38 | ) | |
| Total reimbursed expenses | | | (198 | ) | |
| Net expenses | | | 5,794 | | |
| Net Investment Income (Loss) | | | (2,033 | ) | |
| Net Realized and Unrealized Gain (Loss): | | | |
| Realized gain (loss) from investment securities | | | 19,909 | | |
Increase (decrease) in unrealized appreciation
(depreciation) on investment securities | | | 39,287 | | |
| Net Gain (Loss) on Investment Securities | | | 59,196 | | |
Net Increase (Decrease) in Net Assets Resulting
from Operations | | $ | 57,163 | | |
The notes to the financial statements are an integral part of this report.
Transamerica IDEX Mutual Funds
Annual Report 2005
6
TA IDEX Transamerica Growth Opportunities
STATEMENTS OF CHANGES IN NET ASSETS
For the years ended
(all amounts in thousands)
| | | October 31,
2005 | | October 31,
2004 | |
| Increase (Decrease) In Net Assets From: | | | |
| Operations: | | | |
| Net investment income (loss) | | $ | (2,033 | ) | | $ | (2,185 | ) | |
Net realized gain (loss) from
investment securities | | | 19,909 | | | | 27,965 | | |
Net unrealized appreciation
(depreciation) on investment
securities | | | 39,287 | | | | (220 | ) | |
| | | | 57,163 | | | | 25,560 | | |
| Capital Share Transactions: | | | |
| Proceeds from shares sold: | |
| Class A | | | 7,177 | | | | 70,124 | | |
| Class B | | | 4,534 | | | | 5,768 | | |
| Class C | | | 2,511 | | | | 2,253 | | |
| Class C2 | | | – | | | | 800 | | |
| Class M | | | – | | | | 482 | | |
| | | | 14,222 | | | | 79,427 | | |
| Proceeds from fund acquisition: | |
| Class A | | | – | | | | 18,269 | | |
| Class B | | | – | | | | 28,710 | | |
| Class C | | | – | | | | 783 | | |
| Class C2 | | | – | | | | 5,594 | | |
| Class M | | | – | | | | 3,540 | | |
| | | | – | | | | 56,896 | | |
| Cost of shares redeemed: | |
| Class A | | | (22,648 | ) | | | (23,471 | ) | |
| Class B | | | (19,401 | ) | | | (14,231 | ) | |
| Class C | | | (9,361 | ) | | | (2,369 | ) | |
| Class C2 | | | – | | | | (2,125 | ) | |
| Class M | | | – | | | | (2,585 | ) | |
| | | | (51,410 | ) | | | (44,781 | ) | |
| Class level exchanges: | |
| Class C | | | – | | | | 26,644 | | |
| Class C2 | | | – | | | | (14,565 | ) | |
| Class M | | | – | | | | (12,079 | ) | |
| | | | – | | | | – | | |
| Automatic conversions: | |
| Class A | | | 383 | | | | 268 | | |
| Class B | | | (383 | ) | | | (268 | ) | |
| | | | – | | | | – | | |
| | | | (37,188 | ) | | | 91,542 | | |
| Net increase (decrease) in net assets | | | 19,975 | | | | 117,102 | | |
| Net Assets: | | | |
| Beginning of year | | | 336,605 | | | | 219,503 | | |
| End of year | | $ | 356,580 | | | $ | 336,605 | | |
Accumulated Net Investment Income
(Loss) | | $ | (17 | ) | | $ | (18 | ) | |
| | | October 31,
2005 | | October 31,
2004 | |
| Share Activity: | |
| Shares issued: | |
| Class A | | | 993 | | | | 10,916 | | |
| Class B | | | 676 | | | | 921 | | |
| Class C | | | 372 | | | | 363 | | |
| Class C2 | | | – | | | | 129 | | |
| Class M | | | – | | | | 77 | | |
| | | | 2,041 | | | | 12,406 | | |
| Shares issued on fund acquisition: | |
| Class A | | | – | | | | 2,818 | | |
| Class B | | | – | | | | 4,571 | | |
| Class C | | | – | | | | 125 | | |
| Class C2 | | | – | | | | 891 | | |
| Class M | | | – | | | | 561 | | |
| | | | – | | | | 8,966 | | |
| Shares redeemed: | |
| Class A | | | (3,228 | ) | | | (3,649 | ) | |
| Class B | | | (2,876 | ) | | | (2,289 | ) | |
| Class C | | | (1,384 | ) | | | (377 | ) | |
| Class C2 | | | – | | | | (343 | ) | |
| Class M | | | – | | | | (415 | ) | |
| | | | (7,488 | ) | | | (7,073 | ) | |
| Class level exchanges: | |
| Class C | | | – | | | | 4,213 | | |
| Class C2 | | | – | | | | (2,335 | ) | |
| Class M | | | – | | | | (1,874 | ) | |
| | | | – | | | | 4 | | |
| Automatic conversions: | |
| Class A | | | 55 | | | | 33 | | |
| Class B | | | (57 | ) | | | (43 | ) | |
| | | | (2 | ) | | | (10 | ) | |
Net increase (decrease) in shares
outstanding: | |
| Class A | | | (2,180 | ) | | | 10,118 | | |
| Class B | | | (2,257 | ) | | | 3,160 | | |
| Class C | | | (1,012 | ) | | | 4,324 | | |
| Class C2 | | | – | | | | (1,658 | ) | |
| Class M | | | – | | | | (1,651 | ) | |
| | | | (5,449 | ) | | | 14,293 | | |
The notes to the financial statements are an integral part of this report.
Transamerica IDEX Mutual Funds
Annual Report 2005
7
TA IDEX Transamerica Growth Opportunities
FINANCIAL HIGHLIGHTS
| | | | | For a share of beneficial interest outstanding throughout each period | |
| | | | | Net Asset | | Investment Operations | | Distributions | | Net Asset | |
| | | For the
Period
Ended (d)(g) | | Value,
Beginning
of Period | | Net
Investment
Income (Loss) | | Net Realized
and Unrealized
Gain (Loss) | | Total
Operations | | From Net
Investment
Income | | From Net
Realized
Gains | | Total
Distributions | | Value,
End
of Period | |
| Class A | | 10/31/2005 | | $ | 6.61 | | | $ | (0.02 | ) | | $ | 1.26 | | | $ | 1.24 | | | $ | – | | | $ | – | | | $ | – | | | $ | 7.85 | | |
| | | 10/31/2004 | | | 5.95 | | | | (0.03 | ) | | | 0.69 | | | | 0.66 | | | | – | | | | – | | | | – | | | | 6.61 | | |
| | | 10/31/2003 | | | 4.81 | | | | (0.06 | ) | | | 1.20 | | | | 1.14 | | | | – | | | | – | | | | – | | | | 5.95 | | |
| | | 10/31/2002 | | | 4.81 | | | | (0.06 | ) | | | 0.06 | | | | – | | | | – | | | | – | | | | – | | | | 4.81 | | |
| | | 10/31/2001 | | | 8.70 | | | | (0.07 | ) | | | (3.82 | ) | | | (3.89 | ) | | | – | | | | – | | | | – | | | | 4.81 | | |
| Class B | | 10/31/2005 | | | 6.37 | | | | (0.09 | ) | | | 1.20 | | | | 1.11 | | | | – | | | | – | | | | – | | | | 7.48 | | |
| | | 10/31/2004 | | | 5.79 | | | | (0.09 | ) | | | 0.67 | | | | 0.58 | | | | – | | | | – | | | | – | | | | 6.37 | | |
| | | 10/31/2003 | | | 4.70 | | | | (0.09 | ) | | | 1.18 | | | | 1.09 | | | | – | | | | – | | | | – | | | | 5.79 | | |
| | | 10/31/2002 | | | 4.73 | | | | (0.11 | ) | | | 0.08 | | | | (0.03 | ) | | | – | | | | – | | | | – | | | | 4.70 | | |
| | | 10/31/2001 | | | 8.66 | | | | (0.10 | ) | | | (3.83 | ) | | | (3.93 | ) | | | – | | | | – | | | | – | | | | 4.73 | | |
| Class C | | 10/31/2005 | | | 6.38 | | | | (0.09 | ) | | | 1.20 | | | | 1.11 | | | | – | | | | – | | | | – | | | | 7.49 | | |
| | | 10/31/2004 | | | 5.79 | | | | (0.10 | ) | | | 0.69 | | | | 0.59 | | | | – | | | | – | | | | – | | | | 6.38 | | |
| | | 10/31/2003 | | | 4.62 | | | | (0.09 | ) | | | 1.26 | | | | 1.17 | | | | – | | | | – | | | | – | | | | 5.79 | | |
| | | | | | | Ratios/Supplemental Data | |
| | | For the
Period | | Total | | Net Assets,
End of
Period | | Ratio of Expenses
to Average
Net Assets (a) | | Net Investment
Income (Loss)
to Average | | Portfolio
Turnover | |
| | | Ended (g) | | Return (c) | | (000's) | | Net (e) | | Total (f) | | Net Assets (a) | | Rate (b) | |
| Class A | | 10/31/2005 | | | 18.76 | % | | $ | 256,559 | | | | 1.41 | % | | | 1.41 | % | | | (0.30 | )% | | | 34 | % | |
| | | 10/31/2004 | | | 11.09 | | | | 230,633 | | | | 1.43 | | | | 1.43 | | | | (0.47 | ) | | | 43 | | |
| | | 10/31/2003 | | | 23.70 | | | | 147,340 | | | | 1.75 | | | | 2.21 | | | | (1.11 | ) | | | 97 | | |
| | | 10/31/2002 | | | 0.05 | | | | 12,687 | | | | 1.74 | | | | 2.53 | | | | (1.35 | ) | | | 32 | | |
| | | 10/31/2001 | | | (44.76 | ) | | | 3,807 | | | | 1.55 | | | | 2.83 | | | | (1.11 | ) | | | 59 | | |
| Class B | | 10/31/2005 | | | 17.43 | | | | 74,589 | | | | 2.40 | | | | 2.61 | | | | (1.29 | ) | | | 34 | | |
| | | 10/31/2004 | | | 10.02 | | | | 77,869 | | | | 2.40 | | | | 2.64 | | | | (1.44 | ) | | | 43 | | |
| | | 10/31/2003 | | | 23.19 | | | | 52,492 | | | | 2.41 | | | | 2.87 | | | | (1.76 | ) | | | 97 | | |
| | | 10/31/2002 | | | (0.70 | ) | | | 5,897 | | | | 2.39 | | | | 3.18 | | | | (2.00 | ) | | | 32 | | |
| | | 10/31/2001 | | | (45.35 | ) | | | 4,513 | | | | 2.20 | | | | 3.48 | | | | (1.76 | ) | | | 59 | | |
| Class C | | 10/31/2005 | | | 17.40 | | | | 25,432 | | | | 2.40 | | | | 2.54 | | | | (1.29 | ) | | | 34 | | |
| | | 10/31/2004 | | | 10.19 | | | | 28,103 | | | | 2.40 | | | | 2.65 | | | | (1.58 | ) | | | 43 | | |
| | | 10/31/2003 | | | 25.32 | | | | 483 | | | | 2.42 | | | | 2.89 | | | | (1.78 | ) | | | 97 | | |
NOTES TO FINANCIAL HIGHLIGHTS
(a) Annualized.
(b) Not annualized.
(c) Total Return has been calculated for the applicable period without deduction of a sales load, if any, on an initial purchase. Periods of less than one year are not annualized.
(d) Per share information is calculated based on average number of shares outstanding.
(e) Ratio of Net Expenses to Average Net Assets is net of fee waivers and reimbursements by the investment adviser, if any (see note 2).
(f) Ratio of Total Expenses to Average Net Assets includes all expenses before fee waivers and reimbursements by the investment adviser.
(g) TA IDEX Transamerica Growth Opportunities ("the Fund") commenced operations on March 1, 2000. The inception date for the Fund's offering of share Class C was November 11, 2002.
The notes to the financial statements are an integral part of this report.
Transamerica IDEX Mutual Funds
Annual Report 2005
8
TA IDEX Transamerica Growth Opportunities
NOTES TO FINANCIAL STATEMENTS
At October 31, 2005
(all amounts in thousands)
NOTE 1. ORGANIZATION AND SIGNIFICANT ACCOUNTING POLICIES
Transamerica IDEX Mutual Funds is an open-end management investment company registered under the Investment Company Act of 1940, as amended (the "1940 Act").
In the normal course of business, TA IDEX Transamerica Growth Opportunities (the "Fund") enters into contracts that contain a variety of representations that provide general indemnifications. The Fund's maximum exposure under these arrangements is unknown, as this would involve future claims that may be made against the Fund and/or its affiliates that have not yet occurred. However, based on experience, the Fund expects the risk of loss to be remote.
This report should be read in conjunction with the current Fund prospectus, which contains more complete information about the Fund.
The following is a summary of significant accounting policies followed by the Fund in the preparation of the financial statements. In preparing the Fund's financial statements in accordance with accounting principles generally accepted in the United States of America ("GAAP"), estimates or assumptions (which could differ from actual results) may be used that affect reported amounts and disclosures.
On May 28, 2004, the Fund acquired all of the net assets of TA IDEX PBHG Mid Cap Growth pursuant to a plan of reorganization. TA IDEX Transamerica Growth Opportunities is the accounting survivor. The acquisition was accomplished by a tax free exchange of 8,966 shares of the Fund for 6,421 shares of TA IDEX PBHG Mid Cap Growth outstanding on May 27, 2004. TA IDEX PBHG Mid Cap Growth's net assets at that date, $56,896, including $10,809 unrealized appreciation, were combined with those of the Fund. The aggregate net assets of TA IDEX Transamerica Growth Opportunities immediately before the acquisition was $275,349, the combined net assets of the Fund immediately after the acquisition was $332,245. Proceeds in connection with the acquisition were as follows:
| | | Shares | | Amount | |
| Proceeds in connection with the acquisition | |
| Class A | | | 2,818 | | | $ | 18,269 | | |
| Class B | | | 4,571 | | | | 28,710 | | |
| Class C | | | 125 | | | | 783 | | |
| Class C2 | | | 891 | | | | 5,594 | | |
| Class M | | | 561 | | | | 3,540 | | |
| | | | | | | $ | 56,896 | | |
Multiple class operations, income and expenses: The Fund currently offers three classes of shares, each with a public offering price that reflects different sales charges, if any, and expense levels. On June 15, 2004, Class C2 shares merged into Class C. On September 24, 2004, Class M shares merged into Class C. Class B shares will convert to Class A shares eight years after purchase. Income, non-class specific expenses and realized and unrealized gains and losses, are allocated daily to each class, based upon the value of shares outstanding method as permitted under Rule 18f-3 of the 1940 Act. Each class bears its own specific expenses as well as a porti on of general, common expenses.
Security valuations: The Fund values its investments at the close of the New York Stock Exchange ("NYSE"), normally 4 p.m. ET, each day the NYSE is open for business. Fund investments are valued at the last sale price or closing price on the day of valuation taken from the primary exchange where the security is principally traded.
Securities traded in the over-the-counter market and listed securities for which no sale was reported on that date are valued at the last quoted bid price.
Debt securities are valued based on a price quotation or other equivalent indication of value supplied by an exchange, a pricing service or a major market maker.
Investment company securities are valued at the net asset value of the underlying portfolio.
Other securities for which quotations are not readily available or whose values have been determined to be unreliable are valued at fair market value as determined in good faith by the Fund's Administrative Valuation Committee, under the supervision of the Board's Valuation Committee, using guidelines adopted by the Board of Trustees.
Cash: The Fund may leave cash overnight in its cash account with the custodian, Investors Bank & Trust Company ("IBT"). IBT has been contracted on behalf of the Fund to invest the excess cash into a savings account, which at October 31, 2005, was paying an interest rate of 2.76%.
Repurchase agreements: The Fund is authorized to enter into repurchase agreements. The Fund, through its custodian, Investors Bank & Trust Company ("IBT"), receives delivery of the underlying securities, the value of which at the time of purchase is required to be an amount equal to at least 100% of the resale price. The Fund will bear the risk of value fluctuations until the security can be sold and may encounter delays and incur costs in liquidating the security. In the event of bankruptcy or insolvency of the seller, delays and costs may be incurred.
Commission recapture: The sub-adviser, to the extent consistent with the best execution and usual commission rate policies and practices, may place security transactions of the Fund with broker/dealers with which Transamerica IDEX Mutual Funds has established a Commission Recapture Program. A Commission Recapture Program is any arrangement under which a broker/dealer applies a portion of the commissions received by such broker/dealer on the security transactions to the Fund. In no event will commissions paid by the Fund be
Transamerica IDEX Mutual Funds
Annual Report 2005
9
TA IDEX Transamerica Growth Opportunities
NOTES TO FINANCIAL STATEMENTS (continued)
At October 31, 2005
(all amounts in thousands)
NOTE 1.–(continued)
used to pay expenses that would otherwise be borne by any other funds within Transamerica IDEX Mutual Funds, or by any other party.
Recaptured commissions during the year ended October 31, 2005, of $11 are included in net realized gains in the Statement of Operations.
Securities lending: The Fund may lend securities to qualified borrowers, with IBT acting as the Fund's lending agent. The Fund earns negotiated lenders' fees. The Fund receives cash and/or securities as collateral against the loaned securities. Cash collateral received is invested in short term, interest bearing securities. The Fund monitors the market value of securities loaned on a daily basis and requires collateral in an amount at least equal to the value of the securities loaned. Income from loaned securities on the Statement of Operations is net of fees, in the amount of $91, earned by IBT for its services.
Security transactions and investment income: Security transactions are recorded on the trade date. Security gains and losses are calculated on the specific identification basis. Dividend income, if any, is recorded on the ex-dividend date or, in the case of foreign securities, as soon as the Fund is informed of the ex-dividend date. Interest income, including accretion of discounts and amortization of premiums, is recorded on the accrual basis commencing on the settlement date.
Redemption fees: A short-term trading redemption fee may be assessed on any Fund shares in a fund account that are sold during the first five (5) NYSE trading days following their purchase date. This redemption fee will equal 2% of the amount redeemed and shares held the longest will be treated as being redeemed first and shares held the shortest as being redeemed last. For the year ended October 31, 2005, the Fund received less than $1 in redemption fees.
Dividend distributions: Distributions to shareholders are recorded on the ex-dividend date and are determined in accordance with Federal income tax regulations which may differ from GAAP.
NOTE 2. RELATED PARTY TRANSACTIONS
Effective January 1, 2005 AEGON/Transamerica Fund Advisors, Inc. was renamed Transamerica Fund Advisors, Inc. ("TFAI"); AEGON/Transamerica Fund Services, Inc. and AEGON/Transamerica Investor Services, Inc. merged into one entity and was renamed Transamerica Fund Services, Inc. ("TFS").
TFAI is the Fund's investment adviser. TFS is the Fund's administrator and transfer agent. AFSG Securities Corp. ("AFSG") is the Fund's distributor/principal underwriter. TFAI, TFS , and AFSG are affiliates of AEGON, NV, a Netherlands corporation.
Transamerica Investment Management, LLC is both an affiliate of the Fund and a sub-adviser to the Fund.
The following schedule reflects the percentage of Fund assets owned by affiliated mutual funds;
| | | Net
Assets | | % of
Net Assets | |
TA IDEX Asset Allocation-
Conservative Portfolio | | $ | 5,217 | | | | 1.46 | % | |
TA IDEX Asset Allocation-
Growth Portfolio | | | 57,446 | | | | 16.11 | % | |
TA IDEX Asset Allocation-Moderate
Growth Portfolio | | | 92,848 | | | | 26.04 | % | |
TA IDEX Asset Allocation-
Moderate Portfolio | | | 39,993 | | | | 11.22 | % | |
| Total | | $ | 195,504 | | | | 54.83 | % | |
Investment advisory fees: The Fund pays management fees to TFAI based on average daily net assets ("ANA") at the following breakpoints:
0.80% of the first $250 million of ANA
0.75% of the next $250 million
0.70% over $500 million
TFAI has contractually agreed to waive its advisory fee and will reimburse the Fund to the extent that operating expenses, excluding 12b-1 fees, exceed the following stated annual limit:
1.40% Expense Limit
Distribution and service fees: The Fund has a 12b-1 distribution plan under the 1940 Act pursuant to which an annual fee, based on average daily net assets, is paid to the distributor for various disbursements such as broker-dealer account servicing fees and other promotional expenses of the Fund. The Fund is authorized under the 12b-1 plan to pay fees on each class up to the following limits:
| Class A | | | 0.35 | % | |
| Class B | | | 1.00 | % | |
| Class C | | | 1.00 | % | |
In the case the Fund or a class of shares of the Fund is closed to new investors or investments, the Fund is authorized to pay 12b-1 fees for past sales and distribution efforts and present and past investor services.
Underwriter commissions relate to front-end sales charges imposed for Class A shares and contingent deferred sales charges from Classes B, C, and certain A share redemptions. For the year ended October 31, 2005, the underwriter commissions were as follows:
| Received by Underwriter | | $ | 408 | | |
| Retained by Underwriter | | | 19 | | |
| Contingent Deferred Sales Charge | | | 162 | | |
Transamerica IDEX Mutual Funds
Annual Report 2005
10
TA IDEX Transamerica Growth Opportunities
NOTES TO FINANCIAL STATEMENTS (continued)
At October 31, 2005
(all amounts in thousands)
NOTE 2.–(continued)
Administrative services: The Fund has entered into an agreement with TFS for financial and legal fund administration services. As of January 1, 2005 the Fund pays TFS an annual fee of 0.02% of ANA. Prior to January 1, 2005 the Fund paid TFS an annual fee of 0.015% of ANA. The Legal fees on the Statement of Operations are for fees paid to external legal counsel.
Transfer agent fees: The Fund pays TFS an annual per-account charge for each open and closed account. The Fund paid TFS $1,034 for the year ended October 31, 2005.
Deferred compensation plan: Each eligible independent Fund Trustee may elect to participate in a non-qualified deferred compensation plan maintained by Transamerica IDEX Mutual Funds (the "Plan"). Under the Plan, such Trustees may defer payment of all or a portion of their total fees earned as a Fund Trustee. Each Trustee who is a participant in the Plan may elect that the earnings, losses or gains credited to his or her deferred fee amounts be determined based on a deemed investment in any series of Transamerica IDEX Mutual Funds, including the Fund. The right of a participant to receive a distribution from the Plan of the deferred fees is an unsecured claim against the general assets of all series of Transamerica IDEX Mutual Funds. The pro rata liability to the Fund of all deferred fees i n the Plan amounted, as of October 31, 2005, to $14.
NOTE 3. INVESTMENT TRANSACTIONS
The cost of securities purchased and proceeds from securities sold (excluding short-term securities) for the year ended October 31, 2005, were as follows:
| Purchases of securities: | | | |
| Long-Term | | $ | 110,424 | | |
| U.S. Government | | | – | | |
| Proceeds from maturities and sales of securities | | | |
| Long-Term | | | 174,064 | | |
| U.S. Government | | | – | | |
NOTE 4. FEDERAL INCOME TAX MATTERS
The Fund has not made any provision for federal income or excise taxes due to its policy to distribute all of its taxable income and capital gains to its shareholders and otherwise qualify as a regulated investment company under Subchapter M of the Internal Revenue Code. Income and capital gain distributions are determined in accordance with income tax regulations, which may differ from GAAP. These differences are primarily due to differing treatment for items including, but not limited to, wash sales, net operating losses and capital loss carryforwards.
Therefore, distributions determined in accordance with tax regulations may differ significantly in amount or character from net investment income and realized gains for financial reporting purposes. Financial reporting records are adjusted for permanent book/tax differences to reflect tax character. Financial records are not adjusted for temporary differences. These reclassifications are as follows:
Shares of beneficial interest, unlimited
shares authorized | | $ | (2,033 | ) | |
| Accumulated net investment income (loss) | | | 2,034 | | |
Accumulated net realized gain (loss) from investment
securities | | | (1 | ) | |
The capital loss carryforwards are available to offset future realized capital gains through the periods listed:
Capital Loss
Carryforward | | Available through | |
| $ | 194,799 | | | October 31, 2008 | |
| | 99,199 | | | October 31, 2009 | |
| | 4,618 | | | October 31, 2010 | |
| | 7,437 | | | October 31, 2011 | |
The capital loss carryforward utilized during the year ended October 31, 2005 was $19,842.
The tax basis components of distributable earnings as of October 31, 2005, are as follows:
| Undistributed Ordinary Income | | $ | – | | |
| Undistributed Long-term Capital Gains | | $ | – | | |
| Capital Loss Carryforward | | $ | (306,052 | ) | |
| Net Unrealized Appreciation (Depreciation) | | $ | 88,497 | * | |
* Amount includes unrealized appreciation (depreciation) from deferred compensation.
The aggregate cost of investments and composition of unrealized appreciation (depreciation) for federal income tax purposes as of October 31, 2005, are as follows:
| Federal Tax Cost Basis | | $ | 316,358 | | |
| Unrealized Appreciation | | $ | 91,845 | | |
| Unrealized (Depreciation) | | | (3,347 | ) | |
| Net Unrealized Appreciation (Depreciation) | | $ | 88,498 | | |
NOTE 5. REGULATORY PROCEEDING
There continues to be significant federal and state regulatory activity relating to financial services companies, particularly mutual fund companies and their investment advisers. As part of an ongoing investigation regarding potential market timing, recordkeeping and trading compliance issues and matters affecting the Fund's investment adviser, TFAI, and certain affiliates and former employees of TFAI, the SEC staff has
Transamerica IDEX Mutual Funds
Annual Report 2005
11
TA IDEX Transamerica Growth Opportunities
NOTES TO FINANCIAL STATEMENTS (continued)
At October 31, 2005
(all amounts in thousands)
NOTE 5.–(continued)
indicated that it is likely to take some action against TFAI and certain of its affiliates at the conclusion of the investigation. The potential timing and the scope of any such action is difficult to predict. Although the impact of any action brought against TFAI and/or its affiliates is difficult to assess at the present time, the Fund currently believes that the likelihood that any such action will have a material adverse impact on it is remote. It is important to note that the Fund is not aware of any allegation of wrongdoing against it and its Board at the time this annual report is printed. Although it is not anticipated that these developments will have an adverse impact on the Fund, there can be no assurance at this time. TFAI and its affiliates are actively working with the SEC in regard to this matter; however, the exact resolution cannot be determined at this time. TFAI will take such actions that it deems necessary or appropriate to continue providing management services to the Fund and to bring all matters to an appropriate conclusion.
TFAI and/or its affiliates, and not the Fund, will bear the costs regarding these regulatory matters.
Transamerica IDEX Mutual Funds
Annual Report 2005
12
Report of Independent Registered Certified Public Accounting Firm
To the Board of Trustees and Shareholders of
TA IDEX Transamerica Growth Opportunities
In our opinion, the accompanying statement of assets and liabilities, including the schedule of investments, and the related statements of operations and of changes in net assets and the financial highlights present fairly, in all material respects, the financial position of TA IDEX Transamerica Growth Opportunities (the "Fund") (one of the portfolios constituting the Transamerica IDEX Mutual Funds) at October 31, 2005, the results of its operations for the year then ended, the changes in its net assets for each of the two years in the period then ended and the financial highlights for each of the periods presented, in conformity with accounting principles generally accepted in the United States of America. These financial statements and financial highlights (hereafter referred to as "financial statements") are the responsibility of the Fund's management; our responsibility is to express an opinion on these financial statements based on our audits. We conducted our audits of these financial statements in accordance with the standards of the Public Company Accounting Oversight Board (United States). Those standards require that we plan and perform the audit to obtain reasonable assurance about whether the financial statements are free of material misstatement. An audit includes examining, on a test basis, evidence supporting the amounts and disclosures in the financial statements, assessing the accounting principles used and significant estimates made by management, and evaluating the overall financial statement presentation. We believe that our audits, which included confirmation of securities at October 31, 2005 by correspondence with the custodian and brokers, provide a reasonable basis for our opinion.

December 22, 2005
Transamerica IDEX Mutual Funds
Annual Report 2005
13
TA IDEX Transamerica Money Market
UNDERSTANDING YOUR FUND'S EXPENSES
(unaudited)
SHAREHOLDER EXPENSES
Fund shareholders may incur two types of costs: (1) transaction costs, including sales charges (loads) on purchases, contingent deferred sales charges on redemptions and redemption fees; and (2) ongoing costs, including management fees, 12b-1 distribution and service fees, and other fund expenses.
The following Example is intended to help you understand your ongoing costs (in dollars and cents) of investing in a Fund and to compare these costs with the ongoing costs of investing in other funds.
The Example is based on an investment of $1,000 invested at May 1, 2005 and held for the entire period until October 31, 2005.
ACTUAL EXPENSES
The first line in the table below provides information about actual account values and actual expenses. You may use the information in this line, together with the amount you invested, to estimate the expenses that you paid over the period. Simply divide your account value by $1,000 (for example, an $8,600 account value divided by $1,000 = 8.6), then multiply the result by the number in the first line of your Fund under the heading entitled "Expenses Paid During Period" to estimate the expenses you paid on your account during this period. If your account is an IRA, your expenses could have included a $15 annual fee. The amount of any fee paid through your account would increase the estimate of expenses you paid during the period and decrease your ending account value.
HYPOTHETICAL EXAMPLE FOR COMPARISON PURPOSES
The second line in the table below provides information about hypothetical account values and hypothetical expenses based on the Fund's actual expense ratio and an assumed rate of return of 5% per year before expenses, which is not the Fund's actual return. The hypothetical account values and expenses may not be used to estimate the actual ending account balance or expenses you paid for the period. You may use this information to compare the ongoing costs of investing in your Fund and other funds. To do so, compare this 5% hypothetical example with the 5% hypothetical examples that appear in the shareholder reports of the other funds. As in the case of the actual expense example, if your account is subject to an IRA fee, the amount of the fee paid through your account would increase the hypothetical expenses you would have paid during the period and decrease the hypothetical ending account value.
Please note that the expenses shown in the table are meant to highlight your ongoing costs only and do not reflect any transactional costs, such as sales charges, redemption fees, brokerage commissions paid on purchases and sales of fund shares. Therefore, the second line under the Fund in the table is useful in comparing ongoing costs only, and will not help you determine the relative total costs of owning different funds. If any of these transaction costs were included, your costs would be higher. The expenses shown in the table do not reflect any fees that may be charged to you by brokers, financial intermediaries or other financial institutions.
| | | Beginning
Account
Value | | Ending
Account
Value | | Annualized
Expense
Ratio | | Expenses Paid
During Period (a) | |
| Class A | |
| Actual | | $ | 1,000.00 | | | $ | 1,013.10 | | | | 0.83 | % | | $ | 4.21 | | |
| Hypothetical (b) | | | 1,000.00 | | | | 1,021.02 | | | | 0.83 | | | | 4.23 | | |
| Class B | |
| Actual | | | 1,000.00 | | | | 1,011.50 | | | | 1.48 | | | | 7.50 | | |
| Hypothetical (b) | | | 1,000.00 | | | | 1,017.74 | | | | 1.48 | | | | 7.53 | | |
| Class C | |
| Actual | | | 1,000.00 | | | | 1,012.40 | | | | 1.48 | | | | 7.51 | | |
| Hypothetical (b) | | | 1,000.00 | | | | 1,017.74 | | | | 1.48 | | | | 7.53 | | |
(a) Expenses are calculated using each Fund's annualized expense ratio (as disclosed in the table), multiplied by the average account value for the period, multiplied by number of days in the period (184 days), and divided by the number of days in the year (365 days).
(b) 5% return per year before expenses.
GRAPHICAL PRESENTATION OF SCHEDULE OF INVESTMENTS
By Maturity Distribution
At October 31, 2005

This chart shows the percentage breakdown by maturity date of the Fund's total investment securities.
Transamerica IDEX Mutual Funds
Annual Report 2005
1
TA IDEX Transamerica Money Market
SCHEDULE OF INVESTMENTS
At October 31, 2005
(all amounts except share amounts in thousands)
| | | Principal | | Value | |
| COMMERCIAL PAPER (84.8%) | |
| Asset-Backed (4.6%) | |
CAFCO LLC–144A
| |
| 3.89%, due 12/01/2005 | | $ | 5,900 | | | $ | 5,881 | | |
| 4.15%, due 01/18/2006 | | | 2,350 | | | | 2,329 | | |
Ciesco LLC–144A
3.73%, due 11/15/2005 | | | 900 | | | | 899 | | |
| Automotive (0.5%) | |
Harley-Davidson, Inc.–144A
3.89%, due 11/15/2005 | | | 1,000 | | | | 999 | | |
| Business Credit Institutions (8.6%) | |
Old Line Funding Corp.–144A
3.82%, due 11/15/2005
3.87%, due 11/22/2005
3.93%, due 12/01/2005
3.95%, due 12/05/2005 | | | 2,000
3,200
1,100
3,500 | | | | 1,997
3,193
1,096
3,487 | | |
Paccar Financial Corp.
3.60%, due 11/03/2005
3.65%, due 11/08/2005
3.67%, due 11/10/2005
4.00%, due 01/12/2006 | | | 2,400
1,000
1,100
2,800 | | | | 2,400
999
1,099
2,778 | | |
| Chemicals & Allied Products (2.0%) | |
Dupont EI de Nemours Co.–144A
4.01%, due 12/06/2005
4.02%, due 12/07/2005 | | | 1,250
2,770 | | | | 1,245
2,759 | | |
| Commercial Banks (28.9%) | |
Bank of America Corp.
3.79%, due 11/21/2005 | | | 4,400 | | | | 4,391 | | |
Barclays U.S. Funding Corp.
3.77%, due 11/28/2005
4.00%, due 01/05/2006
4.03%, due 01/11/2006 | | | 4,100
4,500
1,000 | | | | 4,088
4,468
992 | | |
Nestle Capital Corp.–144A
3.75%, due 11/02/2005
3.78%, due 11/03/2005 | | | 6,150
2,500 | | | | 6,149
2,499 | | |
Ranger Funding Co. LLC–144A
3.92%, due 11/22/2005 | | | 5,300 | | | | 5,288 | | |
Royal Bank of Scotland
3.77%, due 11/01/2005
3.77%, due 11/02/2005 | | | 4,300
5,400 | | | | 4,300
5,399 | | |
State Street Corp.
3.84%, due 11/07/2005
3.85%, due 11/14/2005
3.89%, due 11/16/2005
3.90%, due 11/17/2005 | | | 2,800
3,000
2,250
1,800 | | | | 2,798
2,996
2,246
1,797 | | |
| | | Principal | | Value | |
| Commercial Banks (continued) | |
UBS Finance Delaware LLC
| |
| 3.85%, due 11/18/2005 | | $ | 1,700 | | | $ | 1,697 | | |
| 3.70%, due 11/21/2005 | | | 2,200 | | | | 2,195 | | |
| 3.84%, due 11/28/2005 | | | 1,500 | | | | 1,496 | | |
| 3.91%, due 12/13/2005 | | | 3,000 | | | | 2,986 | | |
| 4.08%, due 01/26/2006 | | | 1,500 | | | | 1,485 | | |
| Department Stores (4.9%) | |
Wal-Mart Stores, Inc.–144A
3.92%, due 12/09/2005
3.95%, due 12/12/2005
3.95%, due 12/13/2005 | | | 3,050
3,100
3,650 | | | | 3,037
3,086
3,633 | | |
| Oil & Gas Extraction (6.6%) | |
BP Amoco Capital PLC
4.01%, due 01/17/2006 | | | 3,400 | | | | 3,371 | | |
Total Capital SA��144A
3.91%, due 12/02/2005
3.90%, due 12/09/2005 | | | 7,200
2,500 | | | | 7,176
2,490 | | |
| Personal Credit Institutions (14.4%) | |
American Honda Finance Corp.
4.07%, due 01/18/2006
4.07%, due 01/23/2006 | | | 2,000
7,900 | | | | 1,982
7,826 | | |
General Electric Capital Corp.
3.67%, due 11/07/2005
4.09%, due 01/03/2006
3.99%, due 01/04/2006 | | | 900
3,500
5,500 | | | | 899
3,475
5,461 | | |
Toyota Motor Credit Corp.
3.92%, due 12/12/2005
4.15%, due 01/30/2006 | | | 3,000
6,000 | | | | 2,987
5,938 | | |
| Printing & Publishing (2.5%) | |
Gannett Co., Inc.–144A
3.86%, due 11/08/2005 | | | 5,000 | | | | 4,996 | | |
| Public Administration (4.3%) | |
Quebec Province–144A
3.85%, due 11/23/2005
3.98%, due 12/09/2005 | | | 2,790
5,800 | | | | 2,783
5,776 | | |
| Wholesale Trade Durable Goods (4.9%) | |
Procter & Gamble Co.–144A
4.07%, due 01/25/2006
4.09%, due 01/25/2006 | | | 4,500
5,400 | | | | 4,457
5,348 | | |
| Wholesale Trade Nondurable Goods (2.6%) | |
Unilever Capital Corp.–144A
3.79%, due 11/09/2005 1,200 1,199
3.92%, due 11/22/2005 | | | 3,900 | | | | 3,891 | | |
| Total Commercial Paper (cost: $168,242) | | | | | | | 168,242 | | |
The notes to the financial statements are an integral part of this report.
Transamerica IDEX Mutual Funds
Annual Report 2005
2
TA IDEX Transamerica Money Market
SCHEDULE OF INVESTMENTS (continued)
At October 31, 2005
(all amounts except share amounts in thousands)
| | | Principal | | Value | |
| SHORT-TERM OBLIGATIONS (6.1%) | |
| Electronic & Other Electric Equipment (1.4%) | |
Emerson Electric Co.
6.30%, due 11/01/2005 | | $ | 2,700 | | | $ | 2,700 | | |
| Security & Commodity Brokers (2.4%) | |
Merrill Lynch & Co., Inc.
6.25%, due 01/15/2006
6.15%, due 01/26/2006 | | | 3,000
1,800 | | | | 3,014
1,809 | | |
| Wholesale Trade Nondurable Goods (2.3%) | |
Unilever Capital Corp.
6.88%, due 11/01/2005 | | | 4,575 | | | | 4,575 | | |
| Total Short-Term Obligations (cost: $12,098) | | | | | | | 12,098 | | |
| CERTIFICATES OF DEPOSIT (9.1%) | |
Canadian Imperial Bank of Commerce
3.60%, due 11/01/2005 | | | 800 | | | | 800 | | |
Wells Fargo Bank NA
4.03%, due 12/15/2005
4.07%, due 12/30/2005 | | | 4,800
2,750 | | | | 4,800
2,750 | | |
Toronto-Dominion Bank, Ltd.
3.76%, due 11/04/2005
3.96%, due 12/29/2005
4.11%, due 01/18/2006
4.11%, due 01/19/2006 | | | 2,600
3,100
600
3,500 | | | | 2,600
3,100
600
3,500 | | |
| Total Certificates Of Deposit (cost: $18,150) | | | | | | | 18,150 | | |
| Total Investment Securities (cost: $198,490) | | | | | | $ | 198,490 | | |
| SUMMARY: | |
| Investment securities, at value | | | 100.0 | % | | $ | 198,490 | | |
| Liabilities in excess of other assets | | | (0.0 | )% | | | (42 | ) | |
| Net assets | | | 100.0 | % | | $ | 198,448 | | |
DEFINITIONS:
144A 144A Securities are registered pursuant to Rule 144A of the Securities Act of 1933. These securities are deemed to be liquid for purposes of compliance limitations on holdings of illiquid securities and may be resold as transactions exempt from registration, normally to qualified institutional buyers. At October 31, 2005, these securities aggregated $85,693 or 43.2% of the net assets of the Fund.
The notes to the financial statements are an integral part of this report.
Transamerica IDEX Mutual Funds
Annual Report 2005
3
TA IDEX Transamerica Money Market
STATEMENT OF ASSETS AND LIABILITIES
At October 31, 2005
(all amounts except per share amounts in thousands)
| Assets: | |
| Investment securities, at value (cost: $198,490) | | $ | 198,490 | | |
| Cash | | | 75 | | |
| Receivables: | |
| Shares of beneficial interest sold | | | 275 | | |
| Interest | | | 363 | | |
| Other | | | 11 | | |
| | | | 199,214 | | |
| Liabilities: | |
| Accounts payable and accrued liabilities: | |
| Shares of beneficial interest redeemed | | | 310 | | |
| Management and advisory fees | | | 13 | | |
| Distribution and service fees | | | 85 | | |
| Transfer agent fees | | | 49 | | |
| Administration fees | | | 3 | | |
| Dividends to shareholders | | | 262 | | |
| Other | | | 44 | | |
| | | | 766 | | |
| Net Assets | | $ | 198,448 | | |
| Net Assets Consist of: | |
Shares of beneficial interest, unlimited shares
authorized, no par value | | $ | 198,358 | | |
| Undistributed net investment income (loss) | | | 90 | | |
| Net Assets | | $ | 198,448 | | |
| Net Assets by Class: | |
| Class A | | $ | 150,804 | | |
| Class B | | | 31,647 | | |
| Class C | | | 15,997 | | |
| Shares Outstanding: | |
| Class A | | | 150,804 | | |
| Class B | | | 31,647 | | |
| Class C | | | 15,993 | | |
| Net Asset Value Per Share: | |
| Class A | | $ | 1.00 | | |
| Class B | | | 1.00 | | |
| Class C | | | 1.00 | | |
STATEMENT OF OPERATIONS
For the year ended October 31, 2005
(all amounts in thousands)
| Investment Income: | |
| Interest | | $ | 5,750 | | |
| Expenses: | |
| Management and advisory fees | | | 792 | | |
| Distribution and service fees: | |
| Class A | | | 524 | | |
| Class B | | | 326 | | |
| Class C | | | 158 | | |
| Transfer agent fees: | |
| Class A | | | 307 | | |
| Class B | | | 86 | | |
| Class C | | | 49 | | |
| Printing and shareholder reports | | | 57 | | |
| Custody fees | | | 21 | | |
| Administration fees | | | 38 | | |
| Legal fees | | | 14 | | |
| Audit fees | | | 18 | | |
| Trustees fees | | | 10 | | |
| Registration fees: | |
| Class A | | | 24 | | |
| Class B | | | 14 | | |
| Class C | | | 16 | | |
| Other | | | 5 | | |
| Total expenses | | | 2,459 | | |
| Less: | |
| Reimbursement of class expenses: | |
| Class A | | | (334 | ) | |
| Class B | | | (152 | ) | |
| Class C | | | (101 | ) | |
| Total reimbursed expenses | | | (587 | ) | |
| Net expenses | | | 1,872 | | |
| Net Investment Income (Loss) | | | 3,878 | | |
Net Increase (Decrease) in Net Assets Resulting
from Operations | | $ | 3,878 | | |
The notes to the financial statements are an integral part of this report.
Transamerica IDEX Mutual Funds
Annual Report 2005
4
TA IDEX Transamerica Money Market
STATEMENTS OF CHANGES IN NET ASSETS
For the years ended
(all amounts in thousands)
| | | October 31,
2005 | | October 31,
2004 | |
| Increase (Decrease) In Net Assets From: | |
| Operations: | |
| Net investment income (loss) | | $ | 3,878 | | | $ | 710 | | |
| | | | 3,878 | | | | 710 | | |
| Distributions to Shareholders: | |
| From net investment income: | |
| Class A | | | (3,112 | ) | | | (601 | ) | |
| Class B | | | (511 | ) | | | (56 | ) | |
| Class C | | | (255 | ) | | | (40 | ) | |
| Class C2 | | | – | | | | (9 | ) | |
| Class M | | | – | | | | (4 | ) | |
| | | | (3,878 | ) | | | (710 | ) | |
| Proceeds from shares sold: | |
| Class A | | | 105,852 | | | | 179,283 | | |
| Class B | | | 19,649 | | | | 25,310 | | |
| Class C | | | 18,006 | | | | 23,364 | | |
| Class C2 | | | – | | | | 7,547 | | |
| Class M | | | – | | | | 2,473 | | |
| | | | 143,507 | | | | 237,977 | | |
Dividends and distributions
reinvested: | |
| Class A | | | 2,933 | | | | 545 | | |
| Class B | | | 434 | | | | 54 | | |
| Class C | | | 246 | | | | 11 | | |
| Class C2 | | | – | | | | 8 | | |
| Class M | | | – | | | | 4 | | |
| | | | 3,613 | | | | 622 | | |
| Cost of shares redeemed: | |
| Class A | | | (143,409 | ) | | | (104,345 | ) | |
| Class B | | | (28,522 | ) | | | (39,451 | ) | |
| Class C | | | (24,532 | ) | | | (17,946 | ) | |
| Class C2 | | | – | | | | (10,452 | ) | |
| Class M | | | – | | | | (3,810 | ) | |
| | | | (196,463 | ) | | | (176,004 | ) | |
| Class level exchanges: | |
| Class C | | | – | | | | 13,306 | | |
| Class C2 | | | – | | | | (9,777 | ) | |
| Class M | | | – | | | | (3,529 | ) | |
| | | | – | | | | – | | |
| Automatic conversions: | |
| Class A | | | 117 | | | | 34 | | |
| Class B | | | (117 | ) | | | (34 | ) | |
| | | | – | | | | – | | |
| | | | (49,343 | ) | | | 62,595 | | |
| Net increase (decrease) in net assets | | | (49,343 | ) | | | 62,595 | | |
| Net Assets: | |
| Beginning of year | | | 247,791 | | | | 185,196 | | |
| End of year | | $ | 198,448 | | | $ | 247,791 | | |
Undistributed Net Investment Income
(Loss) | | $ | 90 | | | $ | 91 | | |
| | | October 31,
2005 | | October 31,
2004 | |
| Share Activity: | |
| Shares issued: | |
| Class A | | | 105,853 | | | | 179,282 | | |
| Class B | | | 19,649 | | | | 25,311 | | |
| Class C | | | 18,005 | | | | 23,364 | | |
| Class C2 | | | – | | | | 7,548 | | |
| Class M | | | – | | | | 2,473 | | |
| | | | 143,507 | | | | 237,978 | | |
Shares issued–reinvested from
distributions: | |
| Class A | | | 2,932 | | | | 545 | | |
| Class B | | | 434 | | | | 54 | | |
| Class C | | | 245 | | | | 11 | | |
| Class C2 | | | – | | | | 8 | | |
| Class M | | | – | | | | 4 | | |
| | | | 3,611 | | | | 622 | | |
| Shares redeemed: | |
| Class A | | | (143,409 | ) | | | (104,345 | ) | |
| Class B | | | (28,522 | ) | | | (39,451 | ) | |
| Class C | | | (24,534 | ) | | | (17,946 | ) | |
| Class C2 | | | – | | | | (10,452 | ) | |
| Class M | | | – | | | | (3,810 | ) | |
| | | | (196,465 | ) | | | (176,004 | ) | |
| Class level exchanges: | |
| Class C | | | – | | | | 13,302 | | |
| Class C2 | | | – | | | | (9,777 | ) | |
| Class M | | | – | | | | (3,525 | ) | |
| | | | – | | | | – | | |
| Automatic conversions: | |
| Class A | | | 117 | | | | 34 | | |
| Class B | | | (117 | ) | | | (34 | ) | |
| | | | – | | | | – | | |
Net increase (decrease) in
shares outstanding: | |
| Class A | | | (34,507 | ) | | | 75,516 | | |
| Class B | | | (8,556 | ) | | | (14,120 | ) | |
| Class C | | | (6,284 | ) | | | 18,731 | | |
| Class C2 | | | – | | | | (12,673 | ) | |
| Class M | | | – | | | | (4,858 | ) | |
| | | | (49,347 | ) | | | 62,596 | | |
The notes to the financial statements are an integral part of this report.
Transamerica IDEX Mutual Funds
Annual Report 2005
5
TA IDEX Transamerica Money Market
FINANCIAL HIGHLIGHTS
| | | | | For a share of beneficial interest outstanding throughout each period | |
| | | | | Net Asset | | Investment Operations | | Distributions | | Net Asset | |
| | | For the
Period
Ended (c)(f) | | Value,
Beginning
of Period | | Net
Investment
Income (Loss) | | Net Realized
and Unrealized
Gain (Loss) | | Total
Operations | | From Net
Investment
Income | | From Net
Realized
Gains | | Total
Distributions | | Value,
End
of Period | |
| Class A | | 10/31/2005 | | $ | 1.00 | | | $ | 0.020 | | | $ | – | (g) | | $ | 0.020 | | | $ | (0.020 | ) | | $ | – | | | $ | (0.020 | ) | | $ | 1.00 | | |
| | | 10/31/2004 | | | 1.00 | | | | 0.004 | | | | – | | | | 0.004 | | | | (0.004 | ) | | | – | | | | (0.004 | ) | | | 1.00 | | |
| | | 10/31/2003 | | | 1.00 | | | | 0.004 | | | | – | | | | 0.004 | | | | (0.004 | ) | | | – | | | | (0.004 | ) | | | 1.00 | | |
| | | 10/31/2002 | | | 1.00 | | | | 0.008 | | | | – | | | | 0.008 | | | | (0.008 | ) | | | – | | | | (0.008 | ) | | | 1.00 | | |
| Class B | | 10/31/2005 | | | 1.00 | | | | 0.020 | | | | – | (g) | | | 0.020 | | | | (0.020 | ) | | | – | | | | (0.020 | ) | | | 1.00 | | |
| | | 10/31/2004 | | | 1.00 | | | | 0.001 | | | | – | | | | 0.001 | | | | (0.001 | ) | | | – | | | | (0.001 | ) | | | 1.00 | | |
| | | 10/31/2003 | | | 1.00 | | | | 0.001 | | | | – | | | | 0.001 | | | | (0.001 | ) | | | – | | | | (0.001 | ) | | | 1.00 | | |
| | | 10/31/2002 | | | 1.00 | | | | – | | | | – | | | | – | | | | – | | | | – | | | | – | | | | 1.00 | | |
| Class C | | 10/31/2005 | | | 1.00 | | | | 0.020 | | | | – | (g) | | | 0.020 | | | | (0.020 | ) | | | – | | | | (0.020 | ) | | | 1.00 | | |
| | | 10/31/2004 | | | 1.00 | | | | 0.001 | | | | – | | | | 0.001 | | | | (0.001 | ) | | | – | | | | (0.001 | ) | | | 1.00 | | |
| | | 10/31/2003 | | | 1.00 | | | | 0.002 | | | | – | | | | 0.002 | | | | (0.002 | ) | | | – | | | | (0.002 | ) | | | 1.00 | | |
| | | | | | | Ratios/Supplemental Data | |
| | |
For the
Period | |
Total | | Net Assets,
End of
Period | | Ratio of Expenses
to Average
Net Assets (a) | | Net Investment
Income (Loss)
to Average | |
| | | Ended (f) | | Return (b) | | (000's) | | Net (d) | | Total (e) | | Net Assets (a) | |
| Class A | | 10/31/2005 | | | 2.10 | % | | $ | 150,804 | | | | 0.83 | % | | | 1.05 | % | | | 2.08 | % | |
| | | 10/31/2004 | | | 0.42 | | | | 185,311 | | | | 0.83 | | | | 1.19 | | | | 0.45 | | |
| | | 10/31/2003 | | | 0.39 | | | | 109,794 | | | | 0.83 | | | | 1.22 | | | | 0.42 | | |
| | | 10/31/2002 | | | 0.56 | | | | 131,949 | | | | 0.83 | | | | 1.36 | | | | 0.93 | | |
| Class B | | 10/31/2005 | | | 1.60 | | | | 31,647 | | | | 1.32 | | | | 1.79 | | | | 1.57 | | |
| | | 10/31/2004 | | | 0.14 | | | | 40,203 | | | | 1.10 | | | | 1.81 | | | | 0.13 | | |
| | | 10/31/2003 | | | 0.12 | | | | 54,324 | | | | 1.16 | | | | 1.87 | | | | 0.08 | | |
| | | 10/31/2002 | | | 0.28 | | | | 81,683 | | | | 1.48 | | | | 2.01 | | | | 0.28 | | |
| Class C | | 10/31/2005 | | | 1.87 | | | | 15,997 | | | | 1.26 | | | | 1.89 | | | | 1.61 | | |
| | | 10/31/2004 | | | 0.14 | | | | 22,277 | | | | 0.98 | | | �� | 1.96 | | | | 0.43 | | |
| | | 10/31/2003 | | | 0.12 | | | | 3,542 | | | | 1.04 | | | | 1.87 | | | | 0.21 | | |
NOTES TO FINANCIAL HIGHLIGHTS
(a) Annualized.
(b) Total Return has been calculated for the applicable period without deduction of a sales load, if any, on an initial purchase. Periods of less than one year are not annualized.
(c) Per share information is calculated based on average number of shares outstanding.
(d) Ratio of Net Expenses to Average Net Assets is net of fee waivers and reimbursements by the investment adviser, if any (see note 2).
(e) Ratio of Total Expenses to Average Net Assets includes all expenses before fee waivers and reimbursements by the investment adviser.
(f) TA IDEX Transamerica Money Market ("the Fund") commenced operations on March 1, 2002. The inception date for the Fund's offering of share Class C was November 11, 2002.
(g) Rounds to less than $0.01 per share.
The notes to the financial statements are an integral part of this report.
Transamerica IDEX Mutual Funds
Annual Report 2005
6
TA IDEX Transamerica Money Market
NOTES TO FINANCIAL STATEMENTS
At October 31, 2005
(all amounts in thousands)
NOTE 1. ORGANIZATION AND SIGNIFICANT ACCOUNTING POLICIES
Transamerica IDEX Mutual Funds is an open-end management investment company registered under the Investment Company Act of 1940, as amended (the "1940 Act").
In the normal course of business, TA IDEX Transamerica Money Market (the "Fund") enters into contracts that contain a variety of representations that provide general indemnifications. The Fund's maximum exposure under these arrangements is unknown, as this would involve future claims that may be made against the Fund and/or its affiliates that have not yet occurred. However, based on experience, the Fund expects the risk of loss to be remote.
This report should be read in conjunction with the current Fund prospectus, which contains more complete information about the Fund.
The following is a summary of significant accounting policies followed by the Fund in the preparation of the financial statements. In preparing the Fund's financial statements in accordance with accounting principles generally accepted in the United States of America ("GAAP"), estimates or assumptions (which could differ from actual results) may be used that affect reported amounts and disclosures.
Multiple class operations, income and expenses: The Fund currently offers three classes of shares, each with a public offering price that reflects different sales charges, if any, and expense levels. On June 15, 2004, Class C2 shares merged into Class C. On September 24, 2004, Class M shares merged into Class C. Class B shares will convert to Class A shares eight years after purchase. Income, non-class specific expenses and realized and unrealized gains and losses, are allocated daily to each class, based upon the value of shares outstanding method as permitted under Rule 18f-3 of the 1940 Act. Each class bears its own specific expenses as well as a portion of general, common expenses.
Security valuations: As permitted under Rule 2a-7 of the 1940 Act, the securities held by the Fund are valued on the basis of amortized cost, which approximates market value.
Other securities for which quotations are not readily available or whose values have been determined to be unreliable are valued at fair market value as determined in good faith by the Fund's Administrative Valuation Committee, under the supervision of the Board's Valuation Committee, using guidelines adopted by the Board of Trustees.
Security transactions and investment income: Security transactions are recorded on the trade date. Security gains and losses are calculated on the specific identification basis. Dividend income, if any, is recorded on the ex-dividend date or, in the case of foreign securities, as soon as the Fund is informed of the ex-dividend date. Interest income, including accretion of discounts and amortization of premiums, is recorded on the accrual basis commencing on the settlement date.
Redemption fees: A short-term trading redemption fee may be assessed on any Fund shares in a fund account that are sold during the first five (5) NYSE trading days following their purchase date. This redemption fee will equal 2% of the amount redeemed and shares held the longest will be treated as being redeemed first and shares held the shortest as being redeemed last. For year ended October 31, 2005, the Fund received less than $1 in redemption fees.
Dividend distributions: Distributions to shareholders are recorded on the ex-dividend date and are determined in accordance with Federal income tax regulations which may differ from GAAP.
NOTE 2. RELATED PARTY TRANSACTIONS
Effective January 1, 2005 AEGON/Transamerica Fund Advisors, Inc. was renamed Transamerica Fund Advisors, Inc. ("TFAI"); AEGON/Transamerica Fund Services, Inc. and AEGON/Transamerica Investor Services, Inc. merged into one entity and was renamed Transamerica Fund Services, Inc. ("TFS").
TFAI is the Fund's investment adviser. TFS is the Fund's administrator and transfer agent. AFSG Securities Corp. ("AFSG") is the Fund's distributor/principal underwriter. TFAI, TFS , and AFSG are affiliates of AEGON, NV, a Netherlands corporation.
Transamerica Investment Management, LLC is both an affiliate of the Fund and a sub-adviser to the Fund.
The following schedule reflects the percentage of Fund assets owned by affiliated mutual funds:
| | | Net
Assets | | % of
Net Assets | |
TA IDEX Asset Allocation–
Conservative Portfolio | | $ | 20,968 | | | | 10.57 | % | |
TA IDEX Asset Allocation–
Moderate Growth Portfolio | | | 16,457 | | | | 8.29 | % | |
TA IDEX Asset Allocation–
Moderate Portfolio | | | 36,172 | | | | 18.23 | % | |
| Total | | $ | 73,597 | | | | 37.09 | % | |
Investment advisory fees: The Fund pays management fees to TFAI based on average daily net assets ("ANA") at the following rate:
0.40% of ANA
TFAI has contractually agreed to waive its advisory fee and will reimburse the Fund to the extent that operating expenses, excluding 12b-1 fees, exceed the following stated annual limit:
0.48% Expense Limit
Transamerica IDEX Mutual Funds
Annual Report 2005
7
TA IDEX Transamerica Money Market
NOTES TO FINANCIAL STATEMENTS (continued)
At October 31, 2005
(all amounts in thousands)
NOTE 2.–(continued)
If total Fund expenses fall below the annual expense limitation agreement agreed to by the adviser within the succeeding three years, the Fund may be required to pay that adviser a portion or all of the waived advisory fees.
| | | Advisory Fee
Waived | | Available for
Recapture Through | |
| Fiscal Year 2003 | | $ | 869 | | | | 10/31/2006 | | |
If total Fund expenses fall below the annual expense limitation agreement agreed to by the adviser within the succeeding three years. The Fund may be required to pay that advisor a portion or all of the reimbursed class expenses.
| | | Reimbursement of
Class Expenses | | Available for
Recapture Through | |
| Fiscal Year 2005–Class A | | $ | 334 | | | 10/31/2008 | |
| Fiscal Year 2005–Class B | | | 101 | | | 10/31/2008 | |
| Fiscal Year 2005–Class C | | | 66 | | | 10/31/2008 | |
| Fiscal Year 2004–Class A | | | 477 | | | 10/31/2007 | |
| Fiscal Year 2004–Class B | | | 145 | | | 10/31/2007 | |
| Fiscal Year 2004–Class C | | | 71 | | | 10/31/2007 | |
There were no amounts recaptured during the year ended October 31, 2005.
Distribution and service fees: The Fund has a 12b-1 distribution plan under the 1940 Act pursuant to which an annual fee, based on average daily net assets, is paid to the distributor for various disbursements such as broker-dealer account servicing fees and other promotional expenses of the Fund. The Fund is authorized under the 12b-1 plan to pay fees on each class up to the following limits:
| Class A | | | 0.35 | % | |
| Class B | | | 1.00 | % | |
| Class C | | | 1.00 | % | |
In the case the Fund or a class of shares of the Fund is closed to new investors or investments, the Fund is authorized to pay 12b-1 fees for past sales and distribution efforts and present and past investor services. The Fund has waived a portion of the 12b-1 fees for all classes except Class A. The amount waived for the year ended October 31, 2005 was $86. These waivers are not subject to the expense recapture agreement. The waivers reduced the ratio of net expenses to average net assets by 0.16% for Class B and 0.22% for Class C.
Underwriter commissions relate to front-end sales charges imposed for Class A shares and contingent deferred sales charges from Classes B, C and certain A share redemptions. For the year ended October 31, 2005, the underwriter commissions were as follows:
| Received by Underwriter | | $ | 239 | | |
| Retained by Underwriter | | | – | | |
| Contingent Deferred Sales Charge | | | 148 | | |
Administrative services: The Fund has entered into an agreement with TFS for financial and legal fund administration services. As of January 1, 2005 the Fund pays TFS an annual fee of 0.02% of ANA. Prior to January 1, 2005 the Fund paid TFS an annual fee of 0.015% of ANA. The Legal fees on the Statement of Operations are for fees paid to external legal counsel.
Transfer agent fees: The Fund pays TFS an annual per-account charge for each open and closed account. The Fund paid TFS $375 for the year ended October 31, 2005.
Deferred compensation plan: Each eligible independent Fund Trustee may elect to participate in a non-qualified deferred compensation plan maintained by Transamerica IDEX Mutual Funds (the "Plan"). Under the Plan, such Trustees may defer payment of all or a portion of their total fees earned as a Fund Trustee. Each Trustee who is a participant in the Plan may elect that the earnings, losses or gains credited to his or her deferred fee amounts be determined based on a deemed investment in any series of Transamerica IDEX Mutual Funds, including the Fund. The right of a participant to receive a distribution from the Plan of the deferred fees is an unsecured claim against the general assets of all series of Transamerica IDEX Mutual Funds. The pro rata liability to the Fund of all deferred fees in the Plan amounted, as of October 31, 2005, to $11.
NOTE 3. FEDERAL INCOME TAX MATTERS
The Fund has not made any provision for federal income or excise taxes due to its policy to distribute all of its taxable income and capital gains to its shareholders and otherwise qualify as a regulated investment company under Subchapter M of the Internal Revenue Code. Income and capital gain distributions are determined in accordance with income tax regulations, which may differ from GAAP. These differences are primarily due to differing treatment for items including, but not limited to, capital loss carry forwards and dividends payable.
Therefore, distributions determined in accordance with tax regulations may differ significantly in amount or character from net investment income and realized gains for financial reporting purposes. Financial reporting records are adjusted for permanent book/tax differences to reflect tax character. Financial records are not adjusted for temporary differences. These reclassifications are as follows:
Shares of beneficial interest, unlimited
shares authorized | | $ | 1 | | |
| Undistributed net investment income (loss) | | | (1 | ) | |
The tax character of distributions paid may differ from the character of distributions shown in the Statement of Changes in Net Assets due to
Transamerica IDEX Mutual Funds
Annual Report 2005
8
TA IDEX Transamerica Money Market
NOTES TO FINANCIAL STATEMENTS (continued)
At October 31, 2005
(all amounts in thousands)
NOTE 3.–(continued)
short-term gains being treated as ordinary income for tax purposes. The tax character of distributions paid during 2004 and 2005 was as follows:
| 2004 Distributions paid from: | |
| Ordinary Income | | $ | 710 | | |
| Long-term capital gain | | | – | | |
| 2005 Distributions paid from: | |
| Ordinary Income | | | 3,878 | | |
| Long-term capital gain | | | – | | |
The tax basis components of distributable earnings as of October 31, 2005, are as follows:
| Undistributed Ordinary Income | | $ | 90 | | |
| Undistributed Long-term Capital Gains | | $ | – | | |
| Capital Loss Carryforward | | $ | – | | |
| Net Unrealized Appreciation (Depreciation) | | $ | – | | |
The aggregate cost of investments and composition of unrealized appreciation (depreciation) for federal income tax purposes as of October 31, 2005, are as follows:
| Federal Tax Cost Basis | | $ | 198,490 | | |
| Unrealized Appreciation | | $ | – | | |
| Unrealized (Depreciation) | | | – | | |
| Net Unrealized Appreciation (Depreciation) | | $ | – | | |
NOTE 4. REGULATORY PROCEEDINGS
There continues to be significant federal and state regulatory activity relating to financial services companies, particularly mutual fund companies and their investment advisers. As part of an ongoing investigation regarding potential market timing, recordkeeping and trading compliance issues and matters affecting the Fund's investment adviser, TFAI, and certain affiliates and former employees of TFAI, the SEC staff has indicated that it is likely to take some action against TFAI and certain of its affiliates at the conclusion of the investigation. The potential timing and the scope of any such action is difficult to predict. Although the impact of any action brought against TFAI and/or its affiliates is difficult to assess at the present time, the Fund currently believes that the likelihood that any such action will have a material adverse impact on it is remote. It is important to note that the Fund is not aware of any allega tion of wrongdoing against it and its Board at the time this annual report is printed. Although it is not anticipated that these developments will have an adverse impact on the Fund, there can be no assurance at this time. TFAI and its affiliates are actively working with the SEC in regard to this matter; however, the exact resolution cannot be determined at this time. TFAI will take such actions that it deems necessary or appropriate to continue providing management services to the Fund and to bring all matters to an appropriate conclusion.
TFAI and/or its affiliates, and not the Fund, will bear the costs regarding these regulatory matters.
Transamerica IDEX Mutual Funds
Annual Report 2005
9
Report of Independent Registered Certified Public Accounting Firm
To the Board of Trustees and Shareholders of
TA IDEX Transamerica Money Market
In our opinion, the accompanying statement of assets and liabilities, including the schedule of investments, and the related statements of operations and of changes in net assets and the financial highlights present fairly, in all material respects, the financial position of TA IDEX Transamerica Money Market (the "Fund") (one of the portfolios constituting the Transamerica IDEX Mutual Funds) at October 31, 2005, the results of its operations for the year then ended, the changes in its net assets for each of the two years in the period then ended and the financial highlights for each of the periods presented, in conformity with accounting principles generally accepted in the United States of America. These financial statements and financial highlights (hereafter referred to as "financial statements") are the responsibility of the Fund's management; our responsibility is to express an opinion on these financial statements based on our audits. We conducted our audits of these financial statements in accordance with the standards of the Public Company Accounting Oversight Board (United States). Those standards require that we plan and perform the audit to obtain reasonable assurance about whether the financial statements are free of material misstatement. An audit includes examining, on a test basis, evidence supporting the amounts and disclosures in the financial statements, assessing the accounting principles used and significant estimates made by management, and evaluating the overall financial statement presentation. We believe that our audits, which included confirmation of securities at October 31, 2005 by correspondence with the custodian, provide a reasonable basis for our opinion.

December 22, 2005
Transamerica IDEX Mutual Funds
Annual Report 2005
10
TA IDEX Transamerica Short-Term Bond
MARKET ENVIRONMENT
The U.S. bond market generated mildly positive total returns during this twelve month period as yields on short-term securities rose more rapidly than long-term yields.
With the U.S. economic recovery on solid ground, the Federal Reserve Board ("Fed") deemed in mid-2004 that low interest rates were no longer necessary to stimulate economic growth. Intent on returning rates to what is widely considered a "normal" or "neutral" level (4% to 4.5% for the federal funds rate), the Fed boosted rates in 0.25% increments, lifting the federal funds rate from 1.75% to 3.75% during the period. Yields on shorter-term securities, which are highly sensitive to the Fed's actions, followed suit, with two-year Treasury yields rising by about 1.80%.
For most of the period, longer-term yields, which are more sensitive to inflation levels than to Fed activities, hovered between 4.00% and 4.50% (for 10-year Treasuries) as investors remained confident in the economic expansion and unconcerned about inflation, despite an up tick in energy prices. However, after two late-summer hurricanes shut down most Gulf Coast oil and natural gas refineries, triggering still higher energy prices, investor sentiment shifted. As government data pointed to more signs of inflationary pressures, including higher energy costs that are being passed along to consumers, long-term yields rose modestly.
In the corporate bond market, investors worried that companies might deploy growing cash balances in ways that favor shareholders but can be detrimental to corporate creditworthiness. As this so-called "event risk" was widely priced into corporate bonds, credit spreads, or the gap between corporate and Treasury yields, widened so that corporate bonds underperformed Treasuries.
PERFORMANCE
For the period from inception November 8, 2004 through October 31, 2005, TA IDEX Transamerica Short-Term Bond, Class I returned 0.49%. By comparison, its benchmark, the Merrill Lynch U.S. Corporate & Government 1-3 Year Index ("MLCG 1-3 Year"), returned 1.16%.
STRATEGY REVIEW
Convinced that the U.S. economic expansion was on solid footing and that the Fed would adhere to its credit-tightening policy, we maintained a shorter-than-benchmark duration throughout most of the period. This helped to limit principal erosion in a rising rate environment.
Although corporate bonds lagged Treasuries, our approach to the corporate sector contributed to outperformance. We focused largely on shorter-term corporate securities, which are less sensitive to rising interest rates. At the same time, overweighting the sector added to current yield and, because the corporate coupons (i.e., income payments) were higher than Treasury coupons, this provided more current cash flow to reinvest in additional securities in a rising-rate environment. As the year progressed, we became increasingly defensive regarding the debt of consumer-oriented companies, most notably retailers, while favoring the bonds of corporations positioned to benefit from long-term secular trends (e.g., the basic materials sector, which is positioned to benefit from global infrastructure spending).
Heidi Y. Hu, CFA
Peter O. Lopez
Co-Fund Managers
Transamerica Investment Management, LLC
This Fund is only available for investment by the Asset Allocation Portfolios.
Transamerica IDEX Mutual Funds
Annual Report 2005
1
TA IDEX Transamerica Short-Term Bond
Comparison of change in value of $10,000 investment in Class I shares and its comparative index.
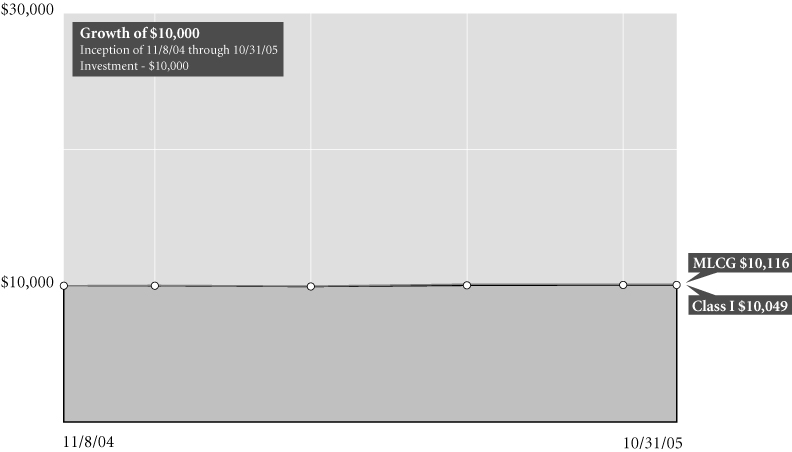
Total Return for Period Ended 10/31/05
| | | From
Inception | | Inception
Date | |
| Class A (NAV) | | | 0.61 | % | | 3/1/05 | |
| Class I (NAV) | | | 0.49 | % | | 11/8/04 | |
| MLCG1 | | | 1.16 | % | | 11/8/04 | |
NOTES
1 The Merrill Lynch U.S. Corporate and Government 1-3 year (MLCG) Index is an unmanaged index used as a general measure of market performance. Calculations assume dividends and capital gains are reinvested and do not include any managerial expenses. From inception calculation is based on life of Class I shares. Source: Standard & Poor's Micropal®© Micropal, Inc. 2005 – 1-800-596-5323 – http://www.funds-sp.com.
The performance data presented represents past performance, future results may vary. Performance data does not reflect the deduction of taxes that would be paid on fund distributions or the redemption of fund shares. Investment return and principal value will fluctuate so that an investor's shares, when redeemed, may be worth more or less than their original cost. Current performance may be lower or higher than performance quoted. Please see www.transamericaidex.com for performance data current to the most recent month-end.
Net Asset Value (NAV) returns include the reinvestment of dividends and capital gains. Class A shares are sold without a sales load.
This material must be preceded or accompanied by a current prospectus, which includes specific contents regarding the investment objectives and policies of this fund.
Transamerica IDEX Mutual Funds
Annual Report 2005
2
TA IDEX Transamerica Short-Term Bond
UNDERSTANDING YOUR FUND'S EXPENSES
(unaudited)
SHAREHOLDER EXPENSES
Fund shareholders may incur ongoing costs, including management fees, 12b-1 distribution and service fees, and other fund expenses. Shares of the fund currently are sold only to certain Transamerica IDEX Mutual Funds and AEGON/Transamerica Series Trust (an affiliate of Transamerica IDEX Mutual Funds) asset allocation funds at net asset value, without any transactional costs.
The following Example is intended to help you understand your ongoing costs (in dollars and cents) of investing in a Fund and to compare these costs with the ongoing costs of investing in other funds.
The Example is based on an investment of $1,000 invested at May 1, 2005 and held for the entire period until October 31, 2005.
ACTUAL EXPENSES
The first line in the table below provides information about actual account values and actual expenses. You may use the information in this line, together with the amount you invested, to estimate the expenses that you paid over the period. Simply divide your account value by $1,000 (for example, an $8,600 account value divided by $1,000 = 8.6), then multiply the result by the number in the first line of your Fund under the heading entitled "Expenses Paid During Period" to estimate the expenses you paid on your account during this period.
HYPOTHETICAL EXAMPLE FOR COMPARISON PURPOSES
The second line in the table below provides information about hypothetical account values and hypothetical expenses based on the Fund's actual expense ratio and an assumed rate of return of 5% per year before expenses, which is not the Fund's actual return. The hypothetical account values and expenses may not be used to estimate the actual ending account balance or expenses you paid for the period. You may use this information to compare the ongoing costs of investing in your Fund and other funds. To do so, compare this 5% hypothetical example with the 5% hypothetical examples that appear in the shareholder reports of the other funds.
Please note that the expenses shown in the table are meant to highlight your ongoing costs only and do not reflect any transactional costs, such as sales charges, redemption fees, brokerage commissions paid on purchases and sales of fund shares. Therefore, the second line under the Fund in the table is useful in comparing ongoing costs only, and will not help you determine the relative total costs of owning different funds.
| | | Beginning
Account
Value | | Ending
Account
Value | | Annualized
Expense
Ratio | | Expenses Paid
During Period (a) | |
| Class A | |
| Actual | | $ | 1,000.00 | | | $ | 1,005.70 | | | | 1.10 | % | | $ | 5.56 | | |
| Hypothetical (b) | | | 1,000.00 | | | | 1,019.66 | | | | 1.10 | | | | 5.60 | | |
| Class I | |
| Actual | | | 1,000.00 | | | | 1,007.40 | | | | 0.71 | | | | 3.59 | | |
| Hypothetical (b) | | | 1,000.00 | | | | 1,021.63 | | | | 0.71 | | | | 3.62 | | |
(a) Expenses are calculated using each Fund's annualized expense ratio (as disclosed in the table), multiplied by the average account value for the period, multiplied by number of days in the period (184 days), and divided by the number of days in the year (365 days).
(b) 5% return per year before expenses.
GRAPHICAL PRESENTATION OF SCHEDULE OF INVESTMENTS
By Bond Credit Quality (Moody Ratings)
At October 31, 2005
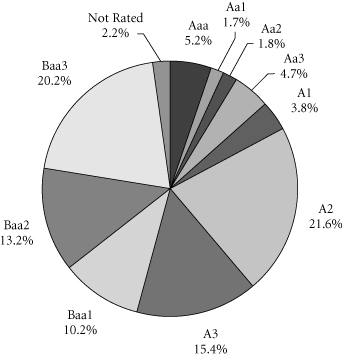
This chart shows the percentage breakdown by Bond Credit Quality of the Fund's total investment securities.
Transamerica IDEX Mutual Funds
Annual Report 2005
3
TA IDEX Transamerica Short-Term Bond
GRAPHICAL PRESENTATION OF SCHEDULE OF INVESTMENTS
(continued)
| Aaa | | Prime grade obligations. Exceptional financial security and ability to meet senior financial obligations. | |
|
| Aa1 | | High grade obligations. Strong capacity to pay interest and repay principal. | |
|
| Aa2 | | High grade obligations. Strong capacity to pay interest and repay principal. | |
|
| Aa3 | | High grade obligations. Strong capacity to pay interest and repay principal. | |
|
| A1 | | Upper medium grade obligations. Interest payments and principal are considered adequate, but elements may be present which suggest a susceptibility to impairment some time in the future. | |
|
| A2 | | Upper medium grade obligations. Interest payments and principal are considered adequate, but elements may be present which suggest a susceptibility to impairment some time in the future. | |
|
| A3 | | Upper medium grade obligations. Interest payments and principal are considered adequate, but elements may be present which suggest a susceptibility to impairment some time in the future. | |
|
| Baa1 | | Medium grade obligations. Interest payments and principal security are adequate for the present but certain protective elements may be lacking or may be characteristically unreliable over great length of time. | |
|
| Baa2 | | Medium grade obligations. Interest payments and principal security appear adequate for the present but certain protective elements may be lacking or may be characteristically unreliable over great length of time. | |
|
| Baa3 | | Medium grade obligations. Interest payments and principal security are not as adequate for the present but certain protective elements may be lacking or may be characteristically unreliable over great length of time. | |
|
Transamerica IDEX Mutual Funds
Annual Report 2005
4
TA IDEX Transamerica Short-Term Bond
SCHEDULE OF INVESTMENTS
At October 31, 2005
(all amounts except share amounts in thousands)
| | | Principal | | Value | |
| CORPORATE DEBT SECURITIES (100.0%) | |
| Aerospace (1.9%) | |
Textron Financial Corp.
5.88%, due 06/01/2007 | | $ | 5,200 | | | $ | 5,271 | | |
| Asset-Backed (1.9%) | |
Honda Auto Receivables Owner Trust,
Series 2005-A Cl A3
4.46%, due 05/21/2009 | | | 3,545 | | | | 3,519 | | |
USAA Auto Owner Trust,
Series 2005-3, Class A2
4.52%, due 06/16/2008 | | | 2,000 | | | | 1,997 | | |
| Automotive (2.1%) | |
DaimlerChrysler North America Holding Corp.
4.75%, due 01/15/2008 | | | 5,950 | | | | 5,888 | | |
| Beverages (5.4%) | |
Bottling Group LLC
2.45%, due 10/16/2006 | | | 3,965 | | | | 3,875 | | |
Coca-Cola Enterprises, Inc.
5.38%, due 08/15/2006 | | | 5,000 | | | | 5,029 | | |
Diageo Capital PLC
3.50%, due 11/19/2007 | | | 6,400 | | | | 6,241 | | |
| Business Credit Institutions (1.9%) | |
CIT Group, Inc.
2.88%, due 09/29/2006 | | | 5,500 | | | | 5,408 | | |
| Chemicals & Allied Products (8.3%) | |
Dow Chemical Co. (The)
5.00%, due 11/15/2007 | | | 4,870 | | | | 4,889 | | |
ICI Wilmington, Inc.
4.38%, due 12/01/2008 | | | 6,202 | | | | 6,062 | | |
Lubrizol Corp.
4.63%, due 10/01/2009 | | | 2,300 | | | | 2,242 | | |
Potash Corp. of Saskatchewan
7.13%, due 06/15/2007 | | | 5,000 | | | | 5,164 | | |
Praxair, Inc.
4.75%, due 07/15/2007 | | | 5,000 | | | | 5,001 | | |
| Commercial Banks (0.9%) | |
Bank One Corp.
6.88%, due 08/01/2006 | | | 2,500 | | | | 2,538 | | |
| Department Stores (1.9%) | |
Meyer (Fred) Stores, Inc.
7.45%, due 03/01/2008 | | | 5,100 | | | | 5,336 | | |
| Electric Services (10.3%) | |
Dominion Resources, Inc.
3.66%, due 11/15/2006 | | | 4,140 | | | | 4,089 | | |
| | | Principal | | Value | |
| Electric Services (continued) | |
Duke Capital LLC
4.33%, due 11/16/2006 | | $ | 6,000 | | | $ | 5,953 | | |
FPL Group Capital, Inc.
4.09%, due 02/16/2007 | | | 7,040 | | | | 6,976 | | |
PSEG Funding Trust
5.38%, due 11/16/2007 | | | 6,240 | | | | 6,263 | | |
TXU Electric Delivery Co.
5.00%, due 09/01/2007 | | | 6,000 | | | | 5,991 | | |
| Electric, Gas & Sanitary Services (1.8%) | |
Nisource Finance Corp.
7.63%, due 11/15/2005 | | | 5,000 | | | | 5,005 | | |
| Gas Production & Distribution (1.8%) | |
Atmos Energy Corp.
4.00%, due 10/15/2009 | | | 5,405 | | | | 5,167 | | |
| Holding & Other Investment Offices (2.9%) | |
Berkshire Hathaway Finance Corp.
3.40%, due 07/02/2007 | | | 4,000 | | | | 3,907 | | |
iStar Financial, Inc.
4.88%, due 01/15/2009 | | | 4,500 | | | | 4,422 | | |
| Industrial Machinery & Equipment (2.7%) | |
Caterpillar Financial Services Corp., Series F
2.65%, due 01/30/2006 | | | 6,000 | | | | 5,975 | | |
John Deere Capital Corp.
3.90%, due 01/15/2008 | | | 1,597 | | | | 1,565 | | |
| Insurance (3.0%) | |
International Lease Finance Corp.
5.63%, due 06/01/2007 † | | | 5,790 | | | | 5,848 | | |
Wellpoint Health Networks, Inc.
6.38%, due 06/15/2006 | | | 2,500 | | | | 2,525 | | |
| Metal Mining (2.2%) | |
Barrick Gold Finance, Inc.
7.50%, due 05/01/2007 | | | 6,000 | | | | 6,221 | | |
| Mortgage Bankers & Brokers (4.1%) | |
Countrywide Home Loans, Inc.
5.50%, due 08/01/2006 | | | 5,500 | | | | 5,532 | | |
Rio Tinto Finance USA, Ltd.
5.75%, due 07/03/2006 | | | 5,961 | | | | 6,007 | | |
| Motion Pictures (2.1%) | |
Time Warner, Inc.
6.13%, due 04/15/2006 | | | 6,000 | | | | 6,036 | | |
| Oil & Gas Extraction (1.7%) | |
Devon Energy Corp.
2.75%, due 08/01/2006 | | | 5,000 | | | | 4,917 | | |
The notes to the financial statements are an integral part of this report.
Transamerica IDEX Mutual Funds
Annual Report 2005
5
TA IDEX Transamerica Short-Term Bond
SCHEDULE OF INVESTMENTS (continued)
At October 31, 2005
(all amounts except share amounts in thousands)
| | | Principal | | Value | |
| Personal Credit Institutions (4.9%) | |
Capital One Bank Corp.
6.88%, due 02/01/2006 | | $ | 6,500 | | | $ | 6,537 | | |
Ford Motor Credit Co.
6.88%, due 02/01/2006 | | | 1,675 | | | | 1,674 | | |
General Electric Capital Corp.
5.00%, due 06/15/2007 | | | 5,500 | | | | 5,522 | | |
| Petroleum Refining (5.2%) | |
BP Capital Markets PLC
2.75%, due 12/29/2006 | | | 5,100 | | | | 4,985 | | |
USX Corp./Consolidated
6.85%, due 03/01/2008 | | | 5,000 | | | | 5,208 | | |
Valero Energy Corp.
7.38%, due 03/15/2006 | | | 4,500 | | | | 4,536 | | |
| Primary Metal Industries (2.2%) | |
Alcoa, Inc.
4.25%, due 08/15/2007 | | | 6,200 | | | | 6,146 | | |
| Printing & Publishing (6.1%) | |
Gannett Co., Inc.
5.50%, due 04/01/2007 | | | 6,000 | | | | 6,058 | | |
Media General, Inc.
6.95%, due 09/01/2006 | | | 6,012 | | | | 6,077 | | |
Viacom, Inc.
5.63%, due 05/01/2007 | | | 5,000 | | | | 5,044 | | |
| Radio & Television Broadcasting (0.7%) | |
Chancellor Media Corp.
8.00%, due 11/01/2008 | | | 2,000 | | | | 2,131 | | |
| Real Estate (1.2%) | |
Tanger Properties L.P.
9.13%, due 02/15/2008 | | | 3,229 | | | | 3,471 | | |
| Restaurants (2.1%) | |
McDonald's Corp.
3.88%, due 08/15/2007 | | | 6,000 | | | | 5,905 | | |
| Security & Commodity Brokers (2.8%) | |
Morgan Stanley
3.63%, due 04/01/2008 | | | 5,000 | | | | 4,858 | | |
Residential Capital Corp.–144A
6.38%, due 06/30/2010 | | | 3,075 | | | | 3,123 | | |
| Telecommunications (9.6%) | |
Alltel Corp.
4.66%, due 05/17/2007 | | | 5,400 | | | | 5,374 | | |
SBC Communications, Inc.
5.75%, due 05/02/2006 | | | 5,400 | | | | 5,428 | | |
Sprint Capital Corp.
4.78%, due 08/17/2006 | | | 6,500 | | | | 6,497 | | |
| | | Principal | | Value | |
| Telecommunications (continued) | |
Telecom Italia Capital SA, Series A
4.00%, due 11/15/2008 | | $ | 6,010 | | | $ | 5,815 | | |
Verizon Global Funding Corp.
6.13%, due 06/15/2007 | | | 4,000 | | | | 4,078 | | |
| Variety Stores (3.7%) | |
Target Corp.
5.50%, due 04/01/2007 | | | 5,160 | | | | 5,213 | | |
Wal-Mart Stores, Inc.
5.45%, due 08/01/2006 | | | 5,100 | | | | 5,131 | | |
| Water Transportation (2.0%) | |
Carnival PLC
7.30%, due 06/01/2007 | | | 5,612 | | | | 5,804 | | |
| Wholesale Trade Nondurable Goods (2.6%) | |
Safeway, Inc.
4.80%, due 07/16/2007 | | | 2,500 | | | | 2,486 | | |
Unilever Capital Corp.
6.88%, due 11/01/2005 | | | 4,900 | | | | 4,900 | | |
| Total Corporate Debt Securities (cost: $285,663) | | | | | | | 282,860 | | |
| SECURITY LENDING COLLATERAL (1.0%) | |
| Debt (0.9%) | |
| Bank Notes (0.0%) | |
Bank of America
3.81%, due 06/07/2006 *
3.81%, due 08/10/2006 * | | | 80
79 | | | | 80
79 | | |
Credit Suisse First Boston Corp.
4.11%, due 03/10/2006 * | | | 16 | | | | 16 | | |
| Certificates Of Deposit (0.1%) | |
Canadian Imperial Bank of Commerce
4.07%, due 11/04/2005 * | | | 63 | | | | 63 | | |
Harris Trust & Savings Bank
3.80%, due 11/04/2005 * | | | 50 | | | | 50 | | |
Rabobank Nederland
4.03%, due 05/31/2006 * | | | 79 | | | | 79 | | |
| Commercial Paper (0.2%) | |
Ciesco LLC
4.00%, due 11/03/2005 | | | 79 | | | | 79 | | |
General Electric Capital Corp.
3.96%, due 12/05/2005 | | | 63 | | | | 63 | | |
Paradigm Funding LLC–144A
4.01%, due 11/07/2005 | | | 63 | | | | 63 | | |
Park Avenue Receivables Corp.–144A
4.03%, due 12/02/2005 | | | 63 | | | | 63 | | |
Preferred Receivables Corp.–144A
4.04%, due 12/05/2005 | | | 48 | | | | 48 | | |
The notes to the financial statements are an integral part of this report.
Transamerica IDEX Mutual Funds
Annual Report 2005
6
TA IDEX Transamerica Short-Term Bond
SCHEDULE OF INVESTMENTS (continued)
At October 31, 2005
(all amounts except share amounts in thousands)
| | | Principal | | Value | |
| Commercial Paper (continued) | |
Ranger Funding Co. LLC–144A
3.99%, due 11/15/2005 | | $ | 47 | | | $ | 47 | | |
Sheffield Receivables Corp.–144A
4.01%, due 11/08/2005 | | | 48 | | | | 48 | | |
Yorktown Capital LLC
3.97%, due 11/09/2005
3.93%, due 11/17/2005 | | | 79
79 | | | | 79
79 | | |
| Euro Dollar Overnight (0.2%) | |
Bank of Montreal
3.79%, due 11/01/2005 | | | 47 | | | | 47 | | |
Barclays
3.80%, due 11/04/2005 | | | 63 | | | | 63 | | |
BNP Paribas
3.83%, due 11/02/2005 | | | 95 | | | | 95 | | |
Deutsche Bank
3.80%, due 11/02/2005 | | | 158 | | | | 158 | | |
HSBC Banking/Holdings PLC
3.84%, due 11/07/2005 | | | 47 | | | | 47 | | |
Royal Bank of Scotland
3.76%, due 11/01/2005 | | | 63 | | | | 63 | | |
Svenska Handlesbanken
4.03%, due 11/01/2005 | | | 81 | | | | 81 | | |
UBS AG
3.80%, due 11/03/2005 | | | 63 | | | | 63 | | |
| Euro Dollar Terms (0.1%) | |
Royal Bank of Scotland
4.00%, due 12/12/2005 | | | 63 | | | | 63 | | |
UBS AG
4.02%, due 12/01/2005 | | | 63 | | | | 63 | | |
Wells Fargo
3.96%, due 11/14/2005 | | | 95 | | | | 95 | | |
| Promissory Notes (0.0%) | |
Goldman Sachs Group, Inc.
4.02%, due 12/28/2005 | | | 66 | | | | 66 | | |
| | | Principal | | Value | |
| Repurchase Agreements (0.3%) †† | |
Credit Suisse First Boston Corp.
4.10%, dated 10/31/2005 to be repurchased
at $108 on 11/01/2005 | | $ | 108 | | | $ | 108 | | |
Goldman Sachs Group, Inc. (The)
4.10%, dated 10/31/2005 to be repurchased
at $269 on 11/01/2005 | | | 269 | | | | 269 | | |
Lehman Brothers, Inc.
4.10%, dated 10/31/2005 to be repurchased
at $7 on 11/01/2005 | | | 8 | | | | 8 | | |
Merrill Lynch & Co.
4.10%, dated 10/31/2005 to be repurchased
at $316 on 11/01/2005 | | | 316 | | | | 316 | | |
Morgan Stanley Dean Witter & Co.
4.17%, dated 10/31/2005 to be repurchased
at $95 on 11/01/2005 | | | 95 | | | | 95 | | |
| | | Shares | | Value | |
| Investment Companies (0.1%) | |
| Money Market Funds (0.1%) | |
American Beacon Fund
1-day yield of 3.81% | | | 68,177 | | | $ | 68 | | |
Barclays Global Investors
Institutional Money Market Fund
1-day yield of 3.92% | | | 63,248 | | | | 63 | | |
Goldman Sachs Financial
Square Prime Obligations Fund
1-day yield of 3.79% | | | 9,852 | | | | 10 | | |
Merrimac Cash Fund, Premium Class
1-day yield of 3.70% @ | | | 62,549 | | | | 63 | | |
| Total Security Lending Collateral (cost: $2,840) | | | | | | | 2,840 | | |
| Total Investment Securities (cost: $288,503) | | | | | | $ | 285,700 | | |
| SUMMARY: | |
| Investment securities, at value | | | 101.0 | % | | $ | 285,700 | | |
| Liabilities in excess of other assets | | | (1.0 | )% | | | (2,797 | ) | |
| Net assets | | | 100.0 | % | | $ | 282,903 | | |
NOTES TO SCHEDULE OF INVESTMENTS:
† At October 31, 2005, all or a portion of this security is on loan (see Note 1). The value at October 31, 2005, of all securities on loan is $2,768.
* Floating or variable rate note. Rate is listed as of October 31, 2005.
†† Cash collateral for the Repurchase Agreements, valued at $811, that serve as collateral for securities lending are invested in corporate bonds with interest rates and maturity dates ranging from 0.00%–9.86% and 12/31/2005–11/15/2096, respectively.
@ Regulated investment company advised by Investors Bank and Trust Co. ("IBT"). IBT is also the accounting, custody and lending agent for the Fund.
DEFINITIONS:
144A 144A Securities are registered pursuant to Rule 144A of the Securities Act of 1933. These securities are deemed to be liquid for purposes of compliance limitations on holdings of illiquid securities and may be resold as transactions exempt from registration, normally to qualified institutional buyers. At October 31, 2005, these securities aggregated $3,392 or 1.2% of the net assets of the Fund.
The notes to the financial statements are an integral part of this report.
Transamerica IDEX Mutual Funds
Annual Report 2005
7
TA IDEX Transamerica Short-Term Bond
STATEMENT OF ASSETS AND LIABILITIES
At October 31, 2005
(all amounts except per share amounts in thousands)
| Assets: | |
Investment securities, at value (cost: $288,503)
(including securities loaned of $2,768) | | $ | 285,700 | | |
| Cash | | | 3,306 | | |
| Receivables: | |
| Investment securities sold | | | 2,511 | | |
| Shares of beneficial interest sold | | | 206 | | |
| Interest | | | 4,124 | | |
| | | | 295,847 | | |
| Liabilities: | |
| Investment securities purchased | | | 9,521 | | |
| Accounts payable and accrued liabilities: | |
| Management and advisory fees | | | 159 | | |
| Distribution and service fees | | | 32 | | |
| Administration fees | | | 5 | | |
| Dividends to shareholders | | | 347 | | |
| Payable for collateral for securities on loan | | | 2,840 | | |
| Other | | | 40 | | |
| | | | 12,944 | | |
| Net Assets | | $ | 282,903 | | |
| Net Assets Consist of: | |
Shares of beneficial interest, unlimited shares
authorized, no par value | | $ | 286,364 | | |
| Undistributed net investment income (loss) | | | – | | |
Accumulated net realized gain (loss) from
investment securities | | | (658 | ) | |
Net unrealized appreciation (depreciation) on
investment securities | | | (2,803 | ) | |
| Net Assets | | $ | 282,903 | | |
| Net Assets by Class: | |
| Class A | | $ | 108,601 | | |
| Class I | | | 174,302 | | |
| Shares Outstanding: | |
| Class A | | | 11,089 | | |
| Class I | | | 17,797 | | |
| Net Asset Value and Offering Price Per Share: | |
| Class A | | $ | 9.79 | | |
| Class I | | | 9.79 | | |
STATEMENT OF OPERATIONS
For the period ended October 31, 2005 (a)
(all amounts in thousands)
| Investment Income: | |
| Interest | | $ | 7,208 | | |
| Income from loaned securities–net | | | 4 | | |
| | | | 7,212 | | |
| Expenses: | |
| Management and advisory fees | | | 1,262 | | |
| Distribution and service fees: | |
| Class A | | | 211 | | |
| Transfer agent fees: | |
| Class A | | | 1 | | |
| Class I | | | 1 | | |
| Printing and shareholder reports | | | 2 | | |
| Custody fees | | | 23 | | |
| Administration fees | | | 38 | | |
| Legal fees | | | 10 | | |
| Audit fees | | | 15 | | |
| Trustees fees | | | 7 | | |
| Registration fees: | |
| Class A | | | 9 | | |
| Class I | | | 14 | | |
| Other | | | 2 | | |
| Total expenses | | | 1,595 | | |
| Net Investment Income (Loss) | | | 5,617 | | |
| Net Realized and Unrealized Gain (Loss): | |
| Realized gain (loss) from investment securities | | | (658 | ) | |
Increase (decrease) in unrealized appreciation
(depreciation) on investment securities | | | (2,803 | ) | |
| Net Gain (Loss) on Investment Securities | | | (3,461 | ) | |
Net Increase (Decrease) in Net Assets Resulting
from Operations | | $ | 2,156 | | |
(a) TA IDEX Transamerica Short-Term Bond ("the Fund") commenced operations on November 8, 2004. The inception date for the Fund's offering of share Class A was March 1, 2005.
The notes to the financial statements are an integral part of this report.
Transamerica IDEX Mutual Funds
Annual Report 2005
8
TA IDEX Transamerica Short-Term Bond
STATEMENTS OF CHANGES IN NET ASSETS
For the period ended
(all amounts in thousands)
| | | October 31,
2005 (a) | |
| Increase (Decrease) In Net Assets From: | |
| Operations: | |
| Net investment income (loss) | | $ | 5,617 | | |
| Net realized gain (loss) from investment securities | | | (658 | ) | |
Net unrealized appreciation (depreciation) on
investment securities | | | (2,803 | ) | |
| | | | 2,156 | | |
| Distributions to Shareholders: | |
| From net investment income: | |
| Class A | | | (1,688 | ) | |
| Class I | | | (3,929 | ) | |
| | | | (5,617 | ) | |
| Capital Share Transactions: | |
| Proceeds from shares sold: | |
| Class A | | | 107,851 | | |
| Class I | | | 173,243 | | |
| | | | 281,094 | | |
| Dividends and distributions reinvested: | |
| Class A | | | 1,564 | | |
| Class I | | | 3,706 | | |
| | | | 5,270 | | |
| | | | 286,364 | | |
| Net increase (decrease) in net assets | | | 282,903 | | |
| Net Assets: | |
| Beginning of period | | | – | | |
| End of period | | $ | 282,903 | | |
| Undistributed Net Investment Income (Loss) | | $ | – | | |
| Share Activity: | |
| Shares issued: | |
| Class A | | | 10,930 | | |
| Class I | | | 17,421 | | |
| | | | 28,351 | | |
| Shares issued–reinvested from distributions: | |
| Class A | | | 159 | | |
| Class I | | | 376 | | |
| | | | 535 | | |
| Net increase (decrease) in shares outstanding: | |
| Class A | | | 11,089 | | |
| Class I | | | 17,797 | | |
| | | | 28,886 | | |
(a) TA IDEX Transamerica Short-Term Bond ("the Fund") commenced operations on November 8, 2004. The inception date for the Fund's offering of share Class A was March 1, 2005.
The notes to the financial statements are an integral part of this report.
Transamerica IDEX Mutual Funds
Annual Report 2005
9
TA IDEX Transamerica Short-Term Bond
FINANCIAL HIGHLIGHTS
| | | | | For a share of beneficial interest outstanding throughout the period | |
| | | | | Net Asset | | Investment Operations | | Distributions | | Net Asset | |
| | | For the
Period
Ended (d)(g) | | Value,
Beginning
of Period | | Net
Investment
Income (Loss) | | Net Realized
and Unrealized
Gain (Loss) | | Total
Operations | | From Net
Investment
Income | | From Net
Realized
Gains | | Total
Distributions | | Value,
End
of Period | |
| Class A | | 10/31/2005 | | $ | 9.90 | | | $ | 0.18 | | | $ | (0.11 | ) | | $ | 0.07 | | | $ | (0.18 | ) | | $ | – | | | $ | (0.18 | ) | | $ | 9.79 | | |
| Class I | | 10/31/2005 | | | 10.00 | | | | 0.28 | | | | (0.22 | ) | | | 0.06 | | | | (0.27 | ) | | | – | | | | (0.27 | ) | | | 9.79 | | |
| | | | | | | Ratios/Supplemental Data | |
| | | For the
Period | | Total | | Net Assets,
End of
Period | | Ratio of Expenses
to Average
Net Assets (a) | | Net Investment
Income (Loss)
to Average | | Portfolio
Turnover | |
| | | Ended (g) | | Return (c) | | (000's) | | Net (e) | | Total (f) | | Net Assets (a) | | Rate (b) | |
| Class A | | 10/31/2005 | | | 0.61 | % | | $ | 108,601 | | | | 1.06 | % | | | 1.06 | % | | | 2.78 | % | | | 153 | % | |
| Class I | | 10/31/2005 | | | 0.49 | | | | 174,302 | | | | 0.71 | | | | 0.71 | | | | 2.92 | | | | 153 | | |
NOTES TO FINANCIAL HIGHLIGHTS
(a) Annualized.
(b) Not annualized.
(c) Total return has been calculated for the applicable period without deduction of a sales load, if any, on an initial purchase. Periods of less than one year are not annualized.
(d) Per share information is calculated based on average number of shares outstanding.
(e) Ratio of Net Expenses to Average Net Assets is net of fee waivers and reimbursements by the investment adviser, if any (see note 2).
(f) Ratio of Total Expenses to Average Net Assets includes all expenses before fee waivers and reimbursements by the investment adviser.
(g) TA IDEX Transamerica Short-Term Bond ("the Fund") commenced operations on November 8, 2004. The inception date for the Fund's offering of share Class A was March 1, 2005.
The notes to the financial statements are an integral part of this report.
Transamerica IDEX Mutual Funds
Annual Report 2005
10
TA IDEX Transamerica Short-Term Bond
NOTES TO FINANCIAL STATEMENTS
At October 31, 2005
(all amounts in thousands)
NOTE 1. ORGANIZATION AND SIGNIFICANT ACCOUNTING POLICIES
Transamerica IDEX Mutual Funds is an open-end management investment company registered under the Investment Company Act of 1940, as amended (the "1940 Act"). TA IDEX Transamerica Short-Term Bond (the "Fund") began operations on November 8, 2004.
In the normal course of business, the Fund enters into contracts that contain a variety of representations that provide general indemnifications. The Fund's maximum exposure under these arrangements is unknown, as this would involve future claims that may be made against the Fund and/or its affiliates that have not yet occurred. However, based on experience, the Fund expects the risk of loss to be remote.
This report should be read in conjunction with the current Fund prospectus, which contains more complete information about the Fund.
The following is a summary of significant accounting policies followed by the Fund in the preparation of the financial statements. In preparing the Fund's financial statements in accordance with accounting principles generally accepted in the United States of America ("GAAP"), estimates or assumptions (which could differ from actual results) may be used that affect reported amounts and disclosures.
Multiple class operations, income and expenses: The Fund currently offers two classes of shares, Class A and Class I, each with a public offering price that reflects different sales charges, if any, and expense levels. The initial sales charge currently is waived as the Fund is available for investment only by certain strategic asset allocation funds. Income, non-class specific expenses and realized and unrealized gains and losses, are allocated daily to each class, based upon the value of shares outstanding method as permitted under Rule 18f-3 of the 1940 Act. Each class bears its own specific expenses as well as a portion of general, common expenses.
Class I shares are offered for investment to the asset allocation funds of AEGON/Transamerica Series Trust (ATST).
Security valuations: The Fund values its investments at the close of the New York Stock Exchange ("NYSE"), normally 4 p.m. ET, each day the NYSE is open for business. Fund investments are valued at the last sale price or closing price on the day of valuation taken from the primary exchange where the security is principally traded.
Securities traded in the over-the-counter market and listed securities for which no sale was reported on that date are valued at the last quoted bid price.
Debt securities are valued based on a price quotation or other equivalent indication of value supplied by an exchange, a pricing service or a major market maker.
Investment company securities are valued at the net asset value of the underlying portfolio.
Other securities for which quotations are not readily available or whose values have been determined to be unreliable are valued at fair market value as determined in good faith by the Fund's Administrative Valuation Committee, under the supervision of the Board's Valuation Committee, using guidelines adopted by the Board of Trustees.
Cash: The Fund may leave cash overnight in its cash account with the custodian, Investors Bank & Trust Company ("IBT"). IBT has been contracted on behalf of the Fund to invest the excess cash into a savings account, which at October 31, 2005, was paying an interest rate of 2.76%.
Repurchase agreements: The Fund is authorized to enter into repurchase agreements. The Fund, through its custodian, IBT, receives delivery of the underlying securities, the value of which at the time of purchase is required to be an amount equal to at least 100% of the resale price. The Fund will bear the risk of value fluctuations until the security can be sold and may encounter delays and incur costs in liquidating the security. In the event of bankruptcy or insolvency of the seller, delays and costs may be incurred.
Securities lending: The Fund may lend securities to qualified borrowers, with IBT acting as the Fund's lending agent. The Fund earns negotiated lenders' fees. The Fund receives cash and/or securities as collateral against the loaned securities. Cash collateral received is invested in short term, interest bearing securities. The Fund monitors the market value of securities loaned on a daily basis and requires collateral in an amount at least equal to the value of the securities loaned. Income from loaned securities on the Statement of Operations is net of fees, in the amount of $2, earned by IBT for its services.
Security transactions and investment income: Security transactions are recorded on the trade date. Security gains and losses are calculated on the specific identification basis. Dividend income, if any, is recorded on the ex-dividend date or, in the case of foreign securities, as soon as the Fund is informed of the ex-dividend date. Interest income, including accretion of discounts and amortization of premiums, is recorded on the accrual basis commencing on the settlement date.
Redemption fees: A short-term trading redemption fee may be assessed on any Fund shares in a fund account that are sold during the first five (5) NYSE trading days following their purchase date. This redemption fee will equal 2% of the amount redeemed and shares held the longest will be treated as being redeemed first and shares held the shortest as being redeemed last. For the period from inception through October 31, 2005, the Fund received no redemption fees.
Dividend distributions: Distributions to shareholders are recorded on the ex-dividend date and are determined in accordance with Federal income tax regulations which may differ from GAAP.
Transamerica IDEX Mutual Funds
Annual Report 2005
11
TA IDEX Transamerica Short-Term Bond
NOTES TO FINANCIAL STATEMENTS (continued)
At October 31, 2005
(all amounts in thousands)
NOTE 2. RELATED PARTY TRANSACTIONS
Effective January 1, 2005 AEGON/Transamerica Fund Advisors, Inc. was renamed Transamerica Fund Advisors, Inc. ("TFAI"); AEGON/Transamerica Fund Services, Inc. and AEGON/Transamerica Investor Services, Inc. merged into one entity and was renamed Transamerica Fund Services, Inc. ("TFS").
TFAI is the Fund's investment adviser. TFS is the Fund's administrator and transfer agent. AFSG Securities Corp. ("AFSG") is the Fund's distributor/principal underwriter. TFAI, TFS , and AFSG are affiliates of AEGON, NV, a Netherlands corporation.
Transamerica Investment Management, LLC is both an affiliate of the Fund and a sub-adviser to the Fund.
The following schedule represents the percentage of Fund assets owned by affiliated mutual funds:
| | | Net
Assets | | % of
Net Assets | |
TA IDEX Asset Allocation–
Conservative Portfolio | | $ | 43,838 | | | | 15.50 | % | |
TA IDEX Asset Allocation–
Moderate Portfolio | | | 64,699 | | | | 22.87 | % | |
Asset Allocation–
Conservative Portfolio | | | 70,764 | | | | 25.01 | % | |
Asset Allocation–
Moderate Portfolio | | | 103,421 | | | | 36.56 | % | |
| Total | | $ | 282,722 | | | | 99.94 | % | |
Investment advisory fees: The Fund pays management fees to TFAI based on average daily net assets ("ANA") at the following break points:
0.65% of the first $250 million of ANA
0.60% of the next $250 million of ANA
0.575% of the next $500 million of ANA
0.55% of ANA over $1 billion
TFAI has contractually agreed to waive its advisory fee and will reimburse the Fund to the extent that operating expenses exceed the following stated annual limit:
From November 8, 2004 through May 27, 2005:
0.85% Expense Limit (including 12b-1 fees)
From May 28, 2005 on:
0.85% Expense Limit (excluding 12b-1 fees)
If total Fund expenses fall below the annual expense limitation agreement agreed to by the adviser within the succeeding three years, the Fund may be required to pay that adviser a portion or all of the reimbursed class expenses.
There were no amounts recaptured during the period from inception through October 31, 2005. There are no amounts available for recapture at October 31, 2005.
Distribution and service fees: The Fund has a 12b-1 distribution plan under the 1940 Act pursuant to which an annual fee, based on average daily net assets, is paid to the distributor for various disbursements such as broker-dealer account servicing fees and other promotional expenses of the Fund. The Fund is authorized under the 12b-1 plan to pay fees on each class up to the following limits:
| Class A | | | 0.35 | % | |
| Class I | | | N/A | | |
In the case the Fund or a class of shares of the Fund is closed to new investors or investments, the Fund is authorized to pay 12b-1 fees for past sales and distribution efforts and present and past investor services.
Administrative services: The Fund has entered into an agreement with TFS for financial and legal fund administration services. As of January 1, 2005 the Fund pays TFS an annual fee of 0.02% of ANA. Prior to January 1, 2005 the Fund paid TFS an annual fee of 0.015% of ANA. The Legal fees on the Statement of Operations are for fees paid to external legal counsel.
Transfer agent fees: The Fund pays TFS an annual per-account charge for each open and closed account. The Fund paid TFS $2 for the period from inception through October 31, 2005.
Deferred compensation plan: Each eligible independent Fund Trustee may elect to participate in a non-qualified deferred compensation plan maintained by Transamerica IDEX Mutual Funds (the "Plan"). Under the Plan, such Trustees may defer payment of all or a portion of their total fees earned as a Fund Trustee. Each Trustee who is a participant in the Plan may elect that the earnings, losses or gains credited to his or her deferred fee amounts be determined based on a deemed investment in any series of Transamerica IDEX Mutual Funds, including the Fund. The right of a participant to receive a distribution from the Plan of the deferred fees is an unsecured claim against the general assets of all series of Transamerica IDEX Mutual Funds. At October 31, 2005, there were no invested plan amounts.
NOTE 3. INVESTMENT TRANSACTIONS
The cost of securities purchased and proceeds from securities sold (excluding short-term securities) for the period from inception through October 31, 2005, were as follows:
| Purchases of securities: | |
| Long-Term | | $ | 305,233 | | |
| U.S. Government | | | 190,368 | | |
| Proceeds from maturities and sales of securities: | |
| Long-Term | | | 50,860 | | |
| U.S. Government | | | 190,209 | | |
Transamerica IDEX Mutual Funds
Annual Report 2005
12
TA IDEX Transamerica Short-Term Bond
NOTES TO FINANCIAL STATEMENTS (continued)
At October 31, 2005
(all amounts in thousands)
NOTE 4. FEDERAL INCOME TAX MATTERS
The Fund has not made any provision for federal income or excise taxes due to its policy to distribute all of its taxable income and capital gains to its shareholders and otherwise qualify as a regulated investment company under Subchapter M of the Internal Revenue Code. Income and capital gain distributions are determined in accordance with income tax regulations, which may differ from GAAP. These differences are primarily due to differing treatment for items including, but not limited to, distributions payable and capital loss carryovers.
The capital loss carryforward is available to offset future realized capital gains through the period listed:
Capital Loss
Carryforward | | Available through | |
| $ | 658 | | | October 31, 2013 | |
The tax character of distributions paid may differ from the character of distributions shown in the Statement of Changes in Net Assets due to short-term gains being treated as ordinary income for tax purposes. The tax character of distributions paid during 2005 was as follows:
| 2005 Distributions paid from: | |
| Ordinary Income | | $ | 5,617 | | |
| Long-term Capital Gain | | | – | | |
The tax basis components of distributable earnings as of October 31, 2005, are as follows:
| Undistributed Ordinary Income | | $ | – | | |
| Undistributed Long-term Capital Gains | | $ | – | | |
| Capital Loss Carryforward | | $ | (658 | ) | |
| Net Unrealized Appreciation (Depreciation) | | $ | (2,803 | ) | |
The aggregate cost of investments and composition of unrealized appreciation (depreciation) for federal income tax purposes as of October 31, 2005, are as follows:
| Federal Tax Cost Basis | | $ | 288,503 | | |
| Unrealized Appreciation | | $ | 25 | | |
| Unrealized (Depreciation) | | | (2,828 | ) | |
| Net Unrealized Appreciation (Depreciation) | | $ | (2,803 | ) | |
NOTE 5. REGULATORY PROCEEDINGS
There continues to be significant federal and state regulatory activity relating to financial services companies, particularly mutual fund companies and their investment advisers. As part of an ongoing investigation regarding potential market timing, recordkeeping and trading compliance issues and matters affecting the Fund's investment adviser, TFAI, and certain affiliates and former employees of TFAI, the SEC staff has indicated that it is likely to take some action against TFAI and certain of its affiliates at the conclusion of the investigation. The potential timing and the scope of any such action is difficult to predict. Although the impact of any action brought against TFAI and/or its affiliates is difficult to assess at the present time, the Fund currently believes that the likelihood that any such action will have a material adverse impact on it is remote. It is important to note that the Fund is not aware of any allega tion of wrongdoing against it and its Board at the time this annual report is printed. Although it is not anticipated that these developments will have an adverse impact on the Fund, there can be no assurance at this time. TFAI and its affiliates are actively working with the SEC in regard to this matter; however, the exact resolution cannot be determined at this time. TFAI will take such actions that it deems necessary or appropriate to continue providing management services to the Fund and to bring all matters to an appropriate conclusion.
TFAI and/or its affiliates, and not the Fund, will bear the costs regarding these regulatory matters.
Transamerica IDEX Mutual Funds
Annual Report 2005
13
Report of Independent Registered Certified Public Accounting Firm
To the Board of Trustees and Shareholders of
TA IDEX Transamerica Short-Term Bond
In our opinion, the accompanying statement of assets and liabilities, including the schedule of investments, and the related statements of operations and of changes in net assets and the financial highlights present fairly, in all material respects, the financial position of TA IDEX Transamerica Short-Term Bond (the "Fund") (one of the portfolios constituting the Transamerica IDEX Mutual Funds) at October 31, 2005, the results of its operations, the changes in its net assets and the financial highlights for the period of November 8, 2004 (commencement of operations) through October 31, 2005, in conformity with accounting principles generally accepted in the United States of America. These financial statements and financial highlights (hereafter referred to as "financial statements") are the responsibility of the Fund's management; our responsibility is to express an opinion on these financial statements based on our audit. We co nducted our audit of these financial statements in accordance with the standards of the Public Company Accounting Oversight Board (United States). Those standards require that we plan and perform the audit to obtain reasonable assurance about whether the financial statements are free of material misstatement. An audit includes examining, on a test basis, evidence supporting the amounts and disclosures in the financial statements, assessing the accounting principles used and significant estimates made by management, and evaluating the overall financial statement presentation. We believe that our audit, which included confirmation of securities at October 31, 2005 by correspondence with the custodian and brokers, provides a reasonable basis for our opinion.

December 22, 2005
Transamerica IDEX Mutual Funds
Annual Report 2005
14
TA IDEX Transamerica Short-Term Bond (unaudited)
A discussion regarding the basis of Transamerica IDEX Mutual Funds' Board of Trustees' approval of the fund's advisory arrangements will be available in the fund's semi-annual report for the period ending April 30, 2006.
Transamerica IDEX Mutual Funds
Annual Report 2005
15
TA IDEX Transamerica Small/Mid Cap Value
MARKET ENVIRONMENT
For the twelve months ended October 31, 2005, results for small and mid-cap stocks were strongly positive but also quite volatile. The market was dominated by escalating energy prices, rising interest rates and intermittent concerns about the state of economic growth and inflationary pressures. Investors vacillated between fear of recession and hope that the aging economic expansion could be sustained. Alternately favoring economically sensitive (i.e., cyclical) and noncyclical stocks, investors caused most market sectors to quickly fall in and out of favor. However, by period end, all but one of the twelve sectors of the Russell 2500 Value Index ("Russell 2500 Value") had risen at least 7%. Leading the broad advance were energy-related stocks, which surged as prices for oil and gas rose and remained persistently higher than in years past. As a result, integrated oils and other energy were by far the strongest contributors to th e Russell 2500 Value, which generated a twelve month total return of 15.64%.
PEFORMANCE
For the year ended October 31, 2005, TA IDEX Transamerica Small/Mid Cap Value, Class A returned 20.41%. By comparison its benchmark, the Russell 2500 Value, returned 15.64%.
STRATEGY REVIEW
We entered the period with only a moderately constructive outlook on the economy and, in keeping with that, chose to emphasize companies that exhibited the ability to control their own destinies regardless of economic trends. For example, we had a sizable exposure to businesses in industries that stood to benefit from worldwide infrastructure development and favorable supply-demand balances, most notably energy businesses and materials and processing companies. Thus, the portfolio was significantly overweighted in energy stocks when oil prices vaulted up and over $60 per barrel in early 2005.
The portfolio's outperformance was due almost entirely to this overweighting in energy, combined with an average return for our individual other-energy holdings that easily outpaced the sector average for the period. As a result, seven of the portfolio's ten largest individual contributors to performance were energy-related firms. These ranged from top contributor Chesapeake Energy Corporation, a natural gas provider, to TODCO, a lessor of jack-up drilling rigs, and GlobalSantaFe Corporation, a drilling services contractor and project manager.
Our overweighting in materials companies was ultimately a detractor from performance, as we focused largely on the chemical industry, which is growing along with the global economy. Although demand remained strong, when oil and gas prices shot up rapidly, chemical and other companies that use these substances as raw materials in their product manufacturing were unable to quickly pass along the higher costs. Profit margins narrowed and stocks of holdings like Georgia Gulf Corporation, Graphic Packaging Corporation and PolyOne Corporation suffered.
Another area of relative weakness was health care, where our holdings failed to keep pace with the sector's strong overall gains.
Michelle E. Stevens, CFA
Fund Manager
Transamerica Investment Management, LLC
Transamerica IDEX Mutual Funds
Annual Report 2005
1
TA IDEX Transamerica Small/Mid Cap Value
Comparison of change in value of $10,000 investment in Class A shares and its comparative index.
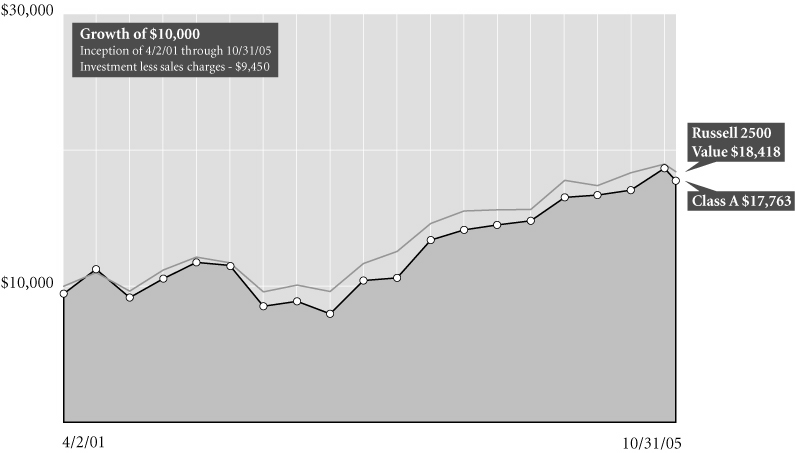
Average Annual Total Return for Periods Ended 10/31/05
| | | 1 year | | From
Inception | | Inception
Date | |
| Class A (NAV) | | | 20.41 | % | | | 14.76 | % | | 4/2/01 | |
| Class A (POP) | | | 13.79 | % | | | 13.35 | % | | 4/2/01 | |
| Russell 2500 Value1 | | | 15.64 | % | | | 14.24 | % | | 4/2/01 | |
| Class B (NAV) | | | 19.30 | % | | | 13.96 | % | | 4/2/01 | |
| Class B (POP) | | | 14.30 | % | | | 13.82 | % | | 4/2/01 | |
| Class C (NAV) | | | 19.22 | % | | | 26.63 | % | | 11/11/02 | |
| Class C (POP) | | | 18.22 | % | | | 26.63 | % | | 11/11/02 | |
NOTES
1 The Russell 2500 Value (Russell 2500 Value) Index is an unmanaged index used as a general measure of market performance. Calculations assume dividends and capital gains are reinvested and do not include any managerial expenses. From inception calculation is based on life of Class A shares. Source: Standard & Poor's Micropal®© Micropal, Inc. 2005 – 1-800-596-5323 – http://www.funds-sp.com.
The performance data presented represents past performance, future results may vary. Performance data does not reflect the deduction of taxes that would be paid on fund distributions or the redemption of fund shares. Investment return and principal value will fluctuate so that an investor's shares, when redeemed, may be worth more or less than their original cost. Current performance may be lower or higher than performance quoted. Please see www.transamericaidex.com for performance data current to the most recent month-end.
Public Offering Price (POP) returns include the reinvestment of dividends and capital gains and reflect the maximum sales charge of 5.5% for A shares or the maximum applicable contingent deferred sales charge (5% in the 1st year, decreasing to 0% after 6 years) for Class B shares and 1% (during the first 12 months) for Class C shares. Shares purchased prior to March 1, 2004 are subject to a maximum applicable contingent deferred sales charge (5% in the 1st year, decreasing to 0% after 7 years) for Class B shares and (2% in the 1st year, decreasing to 0% after 2 years) for Class C shares. Net Asset Value (NAV) returns include the reinvestment of dividends and capital gains but do not reflect any sales charges.
Investing in small cap stocks generally involves greater risk and volatility, therefore an investment in the fund may not be appropriate for everyone.
This material must be preceded or accompanied by a current prospectus, which includes specific contents regarding the investment objectives and policies of this fund.
Transamerica IDEX Mutual Funds
Annual Report 2005
2
TA IDEX Transamerica Small/Mid Cap Value
UNDERSTANDING YOUR FUND'S EXPENSES
(unaudited)
SHAREHOLDER EXPENSES
Fund shareholders may incur two types of costs: (1) transaction costs, including sales charges (loads) on purchases, contingent deferred sales charges on redemptions and redemption fees; and (2) ongoing costs, including management fees, 12b-1 distribution and service fees, and other fund expenses.
The following Example is intended to help you understand your ongoing costs (in dollars and cents) of investing in a Fund and to compare these costs with the ongoing costs of investing in other funds.
The Example is based on an investment of $1,000 invested at May 1, 2005 and held for the entire period until October 31, 2005.
ACTUAL EXPENSES
The first line in the table below provides information about actual account values and actual expenses. You may use the information in this line, together with the amount you invested, to estimate the expenses that you paid over the period. Simply divide your account value by $1,000 (for example, an $8,600 account value divided by $1,000 = 8.6), then multiply the result by the number in the first line of your Fund under the heading entitled "Expenses Paid During Period" to estimate the expenses you paid on your account during this period. If your account is an IRA, your expenses could have included a $15 annual fee. The amount of any fee paid through your account would increase the estimate of expenses you paid during the period and decrease your ending account value.
HYPOTHETICAL EXAMPLE FOR COMPARISON PURPOSES
The second line in the table below provides information about hypothetical account values and hypothetical expenses based on the Fund's actual expense ratio and an assumed rate of return of 5% per year before expenses, which is not the Fund's actual return. The hypothetical account values and expenses may not be used to estimate the actual ending account balance or expenses you paid for the period. You may use this information to compare the ongoing costs of investing in your Fund and other funds. To do so, compare this 5% hypothetical example with the 5% hypothetical examples that appear in the shareholder reports of the other funds. As in the case of the actual expense example, if your account is subject to an IRA fee, the amount of the fee paid through your account would increase the hypothetical expenses you would have paid during the period and decrease the hypothetical ending account value.
Please note that the expenses shown in the table are meant to highlight your ongoing costs only and do not reflect any transactional costs, such as sales charges, redemption fees, brokerage commissions paid on purchases and sales of fund shares. Therefore, the second line under the Fund in the table is useful in comparing ongoing costs only, and will not help you determine the relative total costs of owning different funds. If any of these transaction costs were included, your costs would be higher. The expenses shown in the table do not reflect any fees that may be charged to you by brokers, financial intermediaries or other financial institutions.
| | | Beginning
Account
Value | | Ending
Account
Value | | Annualized
Expense
Ratio | | Expenses Paid
During Period (a) | |
| Class A | |
| Actual | | $ | 1,000.00 | | | $ | 1,139.70 | | | | 1.26 | % | | $ | 6.80 | | |
| Hypothetical (b) | | | 1,000.00 | | | | 1,018.85 | | | | 1.26 | | | | 6.41 | | |
| Class B | |
| Actual | | | 1,000.00 | | | | 1,133.60 | | | | 2.22 | | | | 11.94 | | |
| Hypothetical (b) | | | 1,000.00 | | | | 1,014.01 | | | | 2.22 | | | | 11.27 | | |
| Class C | |
| Actual | | | 1,000.00 | | | | 1,133.80 | | | | 2.18 | | | | 11.72 | | |
| Hypothetical (b) | | | 1,000.00 | | | | 1,014.22 | | | | 2.18 | | | | 11.07 | | |
(a) Expenses are calculated using each Fund's annualized expense ratio (as disclosed in the table), multiplied by the average account value for the period, multiplied by number of days in the period (184 days), and divided by the number of days in the year (365 days).
(b) 5% return per year before expenses.
GRAPHICAL PRESENTATION OF SCHEDULE OF INVESTMENTS
By Sector
At October 31, 2005
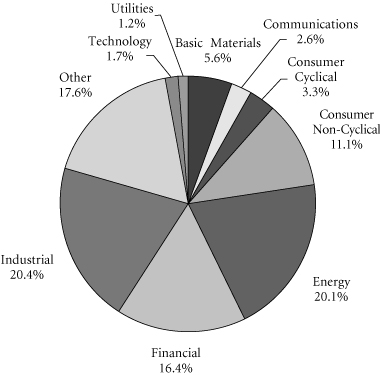
This chart shows the percentage breakdown by sector of the Fund's total investment securities.
Transamerica IDEX Mutual Funds
Annual Report 2005
3
TA IDEX Transamerica Small/Mid Cap Value
SCHEDULE OF INVESTMENTS
At October 31, 2005
(all amounts except share amounts in thousands)
| | | Shares | | Value | |
| COMMON STOCKS (95.3%) | |
| Apparel Products (0.8%) | |
| True Religion Apparel, Inc. ‡† | | | 290,000 | | | $ | 3,628 | | |
| Automotive (1.7%) | |
| Gencorp, Inc. ‡† | | | 355,900 | | | | 6,527 | | |
| National R.V. Holdings, Inc. ‡ | | | 302,500 | | | | 1,410 | | |
| Chemicals & Allied Products (6.0%) | |
| Chemtura Corp. | | | 418,300 | | | | 4,476 | | |
| Olin Corp. † | | | 504,900 | | | | 9,028 | | |
| PolyOne Corp. ‡ | | | 1,265,500 | | | | 7,302 | | |
| Terra Nitrogen Co., L.P. † | | | 280,900 | | | | 6,570 | | |
| Commercial Banks (3.9%) | |
| Corus Bankshares, Inc. † | | | 120,000 | | | | 6,588 | | |
| North Fork Bancorp, Inc. | | | 307,710 | | | | 7,797 | | |
| Provident Bankshares Corp. | | | 95,500 | | | | 3,329 | | |
| Computer & Data Processing Services (2.0%) | |
| Fair Isaac Corp. | | | 215,000 | | | | 8,978 | | |
| SoftBrands, Inc. ‡ | | | 2,576 | | | | 5 | | |
| Computer & Office Equipment (1.1%) | |
| Hypercom Corp. ‡ | | | 829,700 | | | | 4,937 | | |
| Construction (4.9%) | |
| Chemed Corp. | | | 240,000 | | | | 11,539 | | |
| McDermott International, Inc. ‡ | | | 290,000 | | | | 10,536 | | |
| Electric, Gas & Sanitary Services (0.6%) | |
| ALLETE, Inc. | | | 66,666 | | | | 2,934 | | |
| Electronic & Other Electric Equipment (4.9%) | |
| Acuity Brands, Inc. | | | 310,000 | | | | 8,621 | | |
| Genlyte Group, Inc. ‡ | | | 270,000 | | | | 13,762 | | |
| Electronic Components & Accessories (1.6%) | |
| Advanced Energy Industries, Inc. ‡ | | | 300,000 | | | | 3,225 | | |
| OSI Systems, Inc. ‡† | | | 240,000 | | | | 3,984 | | |
| Environmental Services (1.2%) | |
| Republic Services, Inc. | | | 150,000 | | | | 5,302 | | |
| Fabricated Metal Products (1.2%) | |
| Gulf Island Fabrication, Inc. | | | 200,000 | | | | 5,352 | | |
| Food & Kindred Products (0.3%) | |
| TreeHouse Foods, Inc. ‡† | | | 48,000 | | | | 1,240 | | |
| Gas Production & Distribution (0.8%) | |
| KeySpan Corp. | | | 100,000 | | | | 3,457 | | |
| Health Services (1.8%) | |
| LifePoint Hospitals, Inc. ‡† | | | 205,000 | | | | 8,015 | | |
| Holding & Other Investment Offices (4.5%) | |
| Annaly Mortgage Management, Inc. REIT † | | | 350,000 | | | | 4,018 | | |
| | | Shares | | Value | |
| Holding & Other Investment Offices (continued) | |
| Education Realty Trust, Inc. REIT | | | 372,100 | | | $ | 5,768 | | |
| Omega Healthcare Investors, Inc. REIT | | | 875,000 | | | | 10,754 | | |
| Hotels (2.3%) | |
| Host Marriott Corp. † | | | 620,000 | | | | 10,410 | | |
| Industrial Machinery & Equipment (2.6%) | |
| Allis-Chalmers Corp. ‡† | | | 335,000 | | | | 3,099 | | |
| EnPro Industries, Inc. ‡ | | | 75,400 | | | | 2,104 | | |
| Grant Prideco, Inc. ‡ | | | 170,000 | | | | 6,611 | | |
| Instruments & Related Products (0.9%) | |
| Analogic Corp. | | | 83,900 | | | | 3,927 | | |
| Insurance (6.7%) | |
| AMBAC Financial Group, Inc. | | | 120,000 | | | | 8,507 | | |
| HCC Insurance Holdings, Inc. | | | 382,500 | | | | 11,475 | | |
| PartnerRe, Ltd. | | | 140,000 | | | | 8,921 | | |
| Triad Guaranty, Inc. ‡† | | | 40,000 | | | | 1,682 | | |
| Management Services (2.7%) | |
| First Consulting Group, Inc. ‡ | | | 203,600 | | | | 1,181 | | |
| FTI Consulting, Inc. ‡† | | | 400,000 | | | | 10,948 | | |
| Medical Instruments & Supplies (1.9%) | |
| Orthofix International NV ‡ | | | 225,000 | | | | 8,478 | | |
| Metal Mining (0.4%) | |
| Western Silver Corp. ‡† | | | 238,100 | | | | 1,924 | | |
| Oil & Gas Extraction (19.9%) | |
| Bronco Drilling Co., Inc. ‡ | | | 142,225 | | | | 3,448 | | |
| Chesapeake Energy Corp. | | | 442,500 | | | | 14,204 | | |
| Edge Petroleum Corp. ‡ | | | 500,000 | | | | 12,115 | | |
| GlobalSantaFe Corp. | | | 253,000 | | | | 11,271 | | |
| Parker Drilling Co. ‡ | | | 500,000 | | | | 4,420 | | |
| Patterson-UTI Energy, Inc. | | | 265,000 | | | | 9,044 | | |
| Pioneer Drilling Co. ‡ | | | 425,000 | | | | 7,280 | | |
| Superior Energy Services, Inc. ‡ | | | 855,000 | | | | 17,425 | | |
| Todco–Class A | | | 255,150 | | | | 11,418 | | |
| Paper & Allied Products (0.3%) | |
| Graphic Packaging Corp. ‡ | | | 570,100 | | | | 1,511 | | |
| Pharmaceuticals (1.9%) | |
| ARIAD Pharmaceuticals, Inc. ‡† | | | 975,500 | | | | 6,789 | | |
| NeoPharm, Inc. ‡† | | | 99,300 | | | | 954 | | |
| Theragenics Corp. ‡ | | | 244,600 | | | | 736 | | |
| Primary Metal Industries (2.3%) | |
| Aleris International, Inc. ‡ | | | 394,827 | | | | 10,250 | | |
| Retail Trade (1.8%) | |
| Sports Authority, Inc. (The) ‡† | | | 300,000 | | | | 8,352 | | |
The notes to the financial statements are an integral part of this report.
Transamerica IDEX Mutual Funds
Annual Report 2005
4
TA IDEX Transamerica Small/Mid Cap Value
SCHEDULE OF INVESTMENTS (continued)
At October 31, 2005
(all amounts except share amounts in thousands)
| | | Shares | | Value | |
| Savings Institutions (1.5%) | |
| Brookline Bancorp, Inc. | | | 160,000 | | | $ | 2,248 | | |
| Partners Trust Financial Group, Inc. | | | 400,000 | | | | 4,660 | | |
| Telecommunications (1.9%) | |
| Citizens Communications Co. † | | | 700,000 | | | | 8,568 | | |
| Transportation Equipment (0.8%) | |
| Brunswick Corp. | | | 100,000 | | | | 3,813 | | |
| Trucking & Warehousing (1.5%) | |
| Yellow Roadway Corp. ‡† | | | 150,000 | | | | 6,818 | | |
| Water Transportation (6.7%) | |
| Aries Maritime Transport, Ltd. ‡† | | | 1,007,000 | | | | 14,017 | | |
| DryShips, Inc. † | | | 280,000 | | | | 4,214 | | |
| Genco Shipping & Trading, Ltd. ‡† | | | 499,700 | | | | 8,210 | | |
| StealthGas, Inc. ‡ | | | 321,500 | | | | 4,205 | | |
| Wholesale Trade Nondurable Goods (1.9%) | |
| Dean Foods Co. ‡ | | | 240,000 | | | | 8,676 | | |
| Total Common Stocks (cost: $356,153) | | | | | | | 432,995 | | |
| | | Principal | | Value | |
| SECURITY LENDING COLLATERAL (20.6%) | |
| Debt (19.1%) | |
| Bank Notes (1.3%) | |
Bank of America
| |
| 3.81%, due 06/07/2006 * | | $ | 2,620 | | | $ | 2,620 | | |
| 3.81%, due 08/10/2006 * | | | 2,600 | | | | 2,600 | | |
Credit Suisse First Boston Corp.
4.11%, due 03/10/2006 * | | | 520 | | | | 520 | | |
| Certificates Of Deposit (1.4%) | |
Canadian Imperial Bank of Commerce
4.07%, due 11/04/2005 * | | | 2,080 | | | | 2,080 | | |
Harris Trust & Savings Bank
3.80%, due 11/04/2005 * | | | 1,655 | | | | 1,655 | | |
Rabobank Nederland
4.03%, due 05/31/2006 * | | | 2,600 | | | | 2,600 | | |
| Commercial Paper (4.1%) | |
Ciesco LLC
4.00%, due 11/03/2005 | | | 2,596 | | | | 2,596 | | |
General Electric Capital Corp.
3.96%, due 12/05/2005 | | | 2,080 | | | | 2,080 | | |
Paradigm Funding LLC–144A
4.01%, due 11/07/2005 | | | 2,073 | | | | 2,073 | | |
Park Avenue Receivables Corp.–144A
4.03%, due 12/02/2005 | | | 2,059 | | | | 2,059 | | |
Preferred Receivables Corp.–144A
4.04%, due 12/05/2005 | | | 1,560 | | | | 1,560 | | |
Ranger Funding Co. LLC–144A
3.99%, due 11/15/2005 | | | 1,548 | | | | 1,548 | | |
| | | Principal | | Value | |
| Commercial Paper (continued) | |
Sheffield Receivables Corp.–144A
4.01%, due 11/08/2005 | | $ | 1,560 | | | $ | 1,560 | | |
Yorktown Capital LLC
3.97%, due 11/09/2005
3.93%, due 11/17/2005 | | | 2,591
2,582 | | | | 2,591
2,582 | | |
| Euro Dollar Overnight (4.5%) | |
Bank of Montreal
3.79%, due 11/01/2005 | | | 1,560 | | | | 1,560 | | |
Barclays
3.80%, due 11/04/2005 | | | 2,080 | | | | 2,080 | | |
BNP Paribas
3.83%, due 11/02/2005 | | | 3,120 | | | | 3,120 | | |
Deutsche Bank
3.80%, due 11/02/2005 | | | 5,200 | | | | 5,200 | | |
HSBC Banking/Holdings PLC
3.84%, due 11/07/2005 | | | 1,560 | | | | 1,560 | | |
Royal Bank of Scotland
3.76%, due 11/01/2005 | | | 2,080 | | | | 2,080 | | |
Svenska Handlesbanken
4.03%, due 11/01/2005 | | | 2,678 | | | | 2,678 | | |
UBS AG
3.80%, due 11/03/2005 | | | 2,080 | | | | 2,080 | | |
| Euro Dollar Terms (1.6%) | |
Royal Bank of Scotland
4.00%, due 12/12/2005 | | | 2,080 | | | | 2,080 | | |
UBS AG
4.02%, due 12/01/2005 | | | 2,080 | | | | 2,080 | | |
Wells Fargo
3.96%, due 11/14/2005 | | | 3,120 | | | | 3,120 | | |
| Promissory Notes (0.5%) | |
Goldman Sachs Group, Inc.
4.02%, due 12/28/2005 | | | 2,184 | | | | 2,184 | | |
| Repurchase Agreements (5.7%) †† | |
Credit Suisse First Boston Corp.
4.10%, dated 10/31/2005 to be
repurchased at $3,544 on 11/01/2005 | | | 3,544 | | | | 3,544 | | |
Goldman Sachs Group, Inc. (The)
4.10%, dated 10/31/2005 to be
repurchased at $8,841 on 11/01/2005 | | | 8,840 | | | | 8,840 | | |
Lehman Brothers, Inc.
4.10%, dated 10/31/2005 to be
repurchased at $245 on 11/01/2005 | | | 245 | | | | 245 | | |
Merrill Lynch & Co.
4.10%, dated 10/31/2005 to be
repurchased at $10,401 on 11/01/2005 | | | 10,400 | | | | 10,400 | | |
Morgan Stanley Dean Witter & Co.
4.17%, dated 10/31/2005 to be
repurchased at $3,118 on 11/01/2005 | | | 3,117 | | | | 3,117 | | |
The notes to the financial statements are an integral part of this report.
Transamerica IDEX Mutual Funds
Annual Report 2005
5
TA IDEX Transamerica Small/Mid Cap Value
SCHEDULE OF INVESTMENTS (continued)
At October 31, 2005
(all amounts except share amounts in thousands)
| | | Shares | | Value | |
| Investment Companies (1.5%) | |
| Money Market Funds (1.5%) | |
American Beacon Fund
1-day yield of 3.81% | | | 2,242,040 | | | $ | 2,242 | | |
Barclays Global Investors
Institutional Money Market Fund
1-day yield of 3.92% | | | 2,079,938 | | | | 2,080 | | |
Goldman Sachs Financial Square
Prime Obligations Fund
1-day yield of 3.79% | | | 323,987 | | | | 324 | | |
Merrimac Cash Fund,
Premium Class
1-day yield of 3.70% @ | | | 2,056,950 | | | | 2,057 | | |
| Total Security Lending Collateral (cost: $93,395) | | | | | | | 93,395 | | |
| Total Investment Securities (cost: $449,548) | | | | | | $ | 526,390 | | |
| SUMMARY: | |
| Investment securities, at value | | | 115.9 | % | | $ | 526,390 | | |
| Liabilities in excess of other assets | | | (15.9 | )% | | | (72,102 | ) | |
| Net assets | | | 100.0 | % | | $ | 454,288 | | |
NOTES TO SCHEDULE OF INVESTMENTS:
‡ Non-income producing.
† At October 31, 2005, all or a portion of this security is on loan (see Note 1). The value at October 31, 2005, of all securities on loan is $89,058.
* Floating or variable rate note. Rate is listed as of October 31, 2005.
†† Cash collateral for the Repurchase Agreements, valued at $26,668, that serve as collateral for securities lending are invested in corporate bonds with interest rates and maturity dates ranging from 0.00%–9.86% and 12/31/2005–11/15/2096, respectively.
@ Regulated investment company advised by Investors Bank and Trust Co. ("IBT"). IBT is also the accounting, custody and lending agent for the Fund.
DEFINITIONS:
144A 144A Securities are registered pursuant to Rule 144A of the Securities Act of 1933. These securities are deemed to be liquid for purposes of compliance limitations on holdings of illiquid securities and may be resold as transactions exempt from registration, normally to qualified institutional buyers. At October 31, 2005, these securities aggregated $8,800 or 1.9% of the net assets of the Fund.
REIT Real Estate Investment Trust
The notes to the financial statements are an integral part of this report.
Transamerica IDEX Mutual Funds
Annual Report 2005
6
TA IDEX Transamerica Small/Mid Cap Value
STATEMENT OF ASSETS AND LIABILITIES
At October 31, 2005
(all amounts except per share amounts in thousands)
| Assets: | |
Investment securities, at value (cost: $449,548)
(including securities loaned of $89,058) | | $ | 526,390 | | |
| Cash | | | 21,994 | | |
| Receivables: | |
| Investment securities sold | | | 678 | | |
| Shares of beneficial interest sold | | | 549 | | |
| Interest | | | 85 | | |
| Dividends | | | 581 | | |
| Other | | | 11 | | |
| | | | 550,288 | | |
| Liabilities: | |
| Investment securities purchased | | | 1,826 | | |
| Accounts payable and accrued liabilities: | |
| Shares of beneficial interest redeemed | | | 216 | | |
| Management and advisory fees | | | 305 | | |
| Distribution and service fees | | | 171 | | |
| Transfer agent fees | | | 26 | | |
| Administration fees | | | 8 | | |
| Payable for collateral for securities on loan | | | 93,395 | | |
| Other | | | 53 | | |
| | | | 96,000 | | |
| Net Assets | | $ | 454,288 | | |
| Net Assets Consist of: | |
Shares of beneficial interest, unlimited shares
authorized, no par value | | $ | 347,348 | | |
| Undistributed net investment income (loss) | | | (1 | ) | |
Undistributed net realized gain (loss) from
investment securities | | | 30,100 | | |
Net unrealized appreciation (depreciation) on
investment securities | | | 76,841 | | |
| Net Assets | | $ | 454,288 | | |
| Net Assets by Class: | |
| Class A | | $ | 386,346 | | |
| Class B | | | 46,410 | | |
| Class C | | | 21,532 | | |
| Shares Outstanding: | |
| Class A | | | 23,153 | | |
| Class B | | | 2,863 | | |
| Class C | | | 1,331 | | |
| Net Asset Value Per Share: | |
| Class A | | $ | 16.69 | | |
| Class B | | | 16.21 | | |
| Class C | | | 16.18 | | |
| Maximum Offering Price Per Share (a): | |
| Class A | | $ | 17.66 | | |
(a) Includes the maximum selling commission (represented as a percentage of offering price) which is reduced on certain levels of sales as set forth in the Prospectus. Net asset value per share for Classes B and C shares represents offering price. The redemption price for Classes B and C shares equals net asset value less any applicable contingent deferred sales charge.
STATEMENT OF OPERATIONS
For the year ended October 31, 2005
(all amounts in thousands)
| Investment Income: | |
| Interest | | $ | 125 | | |
| Dividends | | | 5,458 | | |
| Income from loaned securities–net | | | 653 | | |
| | | | 6,236 | | |
| Expenses: | |
| Management and advisory fees | | | 3,450 | | |
| Distribution and service fees: | |
| Class A | | | 1,272 | | |
| Class B | | | 466 | | |
| Class C | | | 212 | | |
| Transfer agent fees: | |
| Class A | | | 116 | | |
| Class B | | | 122 | | |
| Class C | | | 60 | | |
| Printing and shareholder reports | | | 35 | | |
| Custody fees | | | 49 | | |
| Administration fees | | | 83 | | |
| Legal fees | | | 30 | | |
| Audit fees | | | 18 | | |
| Trustees fees | | | 20 | | |
| Registration fees: | |
| Class A | | | 26 | | |
| Class B | | | 12 | | |
| Class C | | | 14 | | |
| Other | | | 5 | | |
| Total expenses | | | 5,990 | | |
| Net Investment Income (Loss) | | | 246 | | |
| Net Realized and Unrealized Gain (Loss) | |
| Realized gain (loss) from investment securities | | | 32,191 | | |
Increase (decrease) in unrealized appreciation
(depreciation) on investment securities | | | 45,152 | | |
| Net Gain (Loss) on Investment Securities | | | 77,343 | | |
Net Increase (Decrease) in Net Assets Resulting
from Operations | | $ | 77,589 | | |
The notes to the financial statements are an integral part of this report.
Transamerica IDEX Mutual Funds
Annual Report 2005
7
TA IDEX Transamerica Small/Mid Cap Value
STATEMENTS OF CHANGES IN NET ASSETS
For the years ended
(all amounts in thousands)
| | | October 31,
2005 | | October 31,
2004 | |
| Increase (Decrease) In Net Assets From: | |
| Operations: | |
| Net investment income (loss) | | $ | 246 | | | $ | 521 | | |
Net realized gain (loss) from
investment securities | | | 32,191 | | | | 41,838 | | |
Net unrealized appreciation
(depreciation) on investment
securities | | | 45,152 | | | | 10,477 | | |
| | | | 77,589 | | | | 52,836 | | |
| Distributions to Shareholders: | |
| From net investment income: | |
| Class A | | | (1,974 | ) | | | – | | |
| Class C | | | (12 | ) | | | – | | |
| | | | (1,986 | ) | | | – | | |
| From net realized gains: | |
| Class A | | | (9,811 | ) | | | (24,403 | ) | |
| Class B | | | (1,261 | ) | | | (3,352 | ) | |
| Class C | | | (591 | ) | | | (378 | ) | |
| Class C2 | | | – | | | | (926 | ) | |
| Class M | | | – | | | | (487 | ) | |
| | | | (11,663 | ) | | | (29,546 | ) | |
| Capital Share Transactions: | |
| Proceeds from shares sold: | |
| Class A | | | 23,515 | | | | 159,364 | | |
| Class B | | | 10,917 | | | | 10,062 | | |
| Class C | | | 8,364 | | | | 5,433 | | |
| Class C2 | | | – | | | | 915 | | |
| Class M | | | – | | | | 1,302 | | |
| | | | 42,796 | | | | 177,076 | | |
Dividends and distributions
reinvested: | |
| Class A | | | 11,734 | | | | 24,237 | | |
| Class B | | | 1,149 | | | | 3,058 | | |
| Class C | | | 542 | | | | 343 | | |
| Class C2 | | | – | | | | 809 | | |
| Class M | | | – | | | | 475 | | |
| | | | 13,425 | | | | 28,922 | | |
| Cost of shares redeemed: | |
| Class A | | | (38,305 | ) | | | (16,086 | ) | |
| Class B | | | (12,564 | ) | | | (9,142 | ) | |
| Class C | | | (9,922 | ) | | | (4,965 | ) | |
| Class C2 | | | – | | | | (6,554 | ) | |
| Class M | | | – | | | | (2,191 | ) | |
| | | | (60,791 | ) | | | (38,938 | ) | |
| Class level exchanges: | |
| Class C | | | – | | | | 16,014 | | |
| Class C2 | | | – | | | | (10,526 | ) | |
| Class M | | | – | | | | (5,488 | ) | |
| | | | – | | | | – | | |
| | | October 31,
2005 | | October 31,
2004 | |
| Automatic conversions: | |
| Class A | | $ | 231 | | | $ | 60 | | |
| Class B | | | (231 | ) | | | (60 | ) | |
| | | | – | | | | – | | |
| | | | (4,570 | ) | | | 167,060 | | |
| Net increase (decrease) in net assets | | | 59,370 | | | | 190,350 | | |
| Net Assets: | |
| Beginning of year | | | 394,918 | | | | 204,568 | | |
| End of year | | $ | 454,288 | | | $ | 394,918 | | |
Undistributed Net Investment Income
(Loss) | | $ | (1 | ) | | $ | 520 | | |
| Share Activity: | |
| Shares issued: | |
| Class A | | | 1,437 | | | | 11,172 | | |
| Class B | | | 713 | | | | 729 | | |
| Class C | | | 527 | | | | 396 | | |
| Class C2 | | | – | | | | 66 | | |
| Class M | | | – | | | | 95 | | |
| | | | 2,677 | | | | 12,458 | | |
Shares issued–reinvested from
distributions: | |
| Class A | | | 760 | | | | 1,787 | | |
| Class B | | | 77 | | | | 230 | | |
| Class C | | | 36 | | | | 26 | | |
| Class C2 | | | – | | | | 61 | | |
| Class M | | | – | | | | 36 | | |
| | | | 873 | | | | 2,140 | | |
| Shares redeemed: | |
| Class A | | | (2,433 | ) | | | (1,144 | ) | |
| Class B | | | (809 | ) | | | (666 | ) | |
| Class C | | | (641 | ) | | | (367 | ) | |
| Class C2 | | | – | | | | (459 | ) | |
| Class M | | | – | | | | (160 | ) | |
| | | | (3,883 | ) | | | (2,796 | ) | |
| Class level exchanges: | |
| Class C | | | – | | | | 1,197 | | |
| Class C2 | | | – | | | | (799 | ) | |
| Class M | | | – | | | | (396 | ) | |
| | | | – | | | | 2 | | |
| Automatic conversions: | |
| Class A | | | 15 | | | | 4 | | |
| Class B | | | (15 | ) | | | (4 | ) | |
| | | | – | | | | – | | |
Net increase (decrease) in shares
outstanding: | |
| Class A | | | (221 | ) | | | 11,819 | | |
| Class B | | | (34 | ) | | | 289 | | |
| Class C | | | (78 | ) | | | 1,252 | | |
| Class C2 | | | – | | | | (1,131 | ) | |
| Class M | | | – | | | | (425 | ) | |
| | | | (333 | ) | | | 11,804 | | |
The notes to the financial statements are an integral part of this report.
Transamerica IDEX Mutual Funds
Annual Report 2005
8
TA IDEX Transamerica Small/Mid Cap Value
FINANCIAL HIGHLIGHTS
| | | | | For a share of beneficial interest outstanding throughout each period | |
| | | | | Net Asset | | Investment Operations | | Distributions | | Net Asset | |
| | | For the
Period
Ended (d)(g) | | Value,
Beginning
of Period | | Net
Investment
Income (Loss) | | Net Realized
and Unrealized
Gain (Loss) | | Total
Operations | | From Net
Investment
Income | | From Net
Realized
Gains | | Total
Distributions | | Value,
End
of Period | |
| Class A | | 10/31/2005 | | $ | 14.32 | | | $ | 0.03 | | | $ | 2.85 | | | $ | 2.88 | | | $ | (0.09 | ) | | $ | (0.42 | ) | | $ | (0.51 | ) | | $ | 16.69 | | |
| | | 10/31/2004 | | | 12.94 | | | | 0.04 | | | | 2.56 | | | | 2.60 | | | | – | | | | (1.22 | ) | | | (1.22 | ) | | | 14.32 | | |
| | | 10/31/2003 | | | 9.09 | | | | (0.11 | ) | | | 3.96 | | | | 3.85 | | | | – | | | | – | | | | – | | | | 12.94 | | |
| | | 10/31/2002 | | | 10.12 | | | | (0.07 | ) | | | (0.96 | ) | | | (1.03 | ) | | | – | | | | – | | | | – | | | | 9.09 | | |
| | | 10/31/2001 | | | 10.00 | | | | (0.02 | ) | | | 0.14 | | | | 0.12 | | | | – | | | | – | | | | – | | | | 10.12 | | |
| Class B | | 10/31/2005 | | | 13.97 | | | | (0.11 | ) | | | 2.77 | | | | 2.66 | | | | – | | | | (0.42 | ) | | | (0.42 | ) | | | 16.21 | | |
| | | 10/31/2004 | | | 12.73 | | | | (0.06 | ) | | | 2.52 | | | | 2.46 | | | | – | | | | (1.22 | ) | | | (1.22 | ) | | | 13.97 | | |
| | | 10/31/2003 | | | 8.98 | | | | (0.17 | ) | | | 3.92 | | | | 3.75 | | | | – | | | | – | | | | – | | | | 12.73 | | |
| | | 10/31/2002 | | | 10.08 | | | | (0.19 | ) | | | (0.91 | ) | | | (1.10 | ) | | | – | | | | – | | | | – | | | | 8.98 | | |
| | | 10/31/2001 | | | 10.00 | | | | (0.05 | ) | | | 0.13 | | | | 0.08 | | | | – | | | | – | | | | – | | | | 10.08 | | |
| Class C | | 10/31/2005 | | | 13.96 | | | | (0.12 | ) | | | 2.77 | | | | 2.65 | | | | (0.01 | ) | | | (0.42 | ) | | | (0.43 | ) | | | 16.18 | | |
| | | 10/31/2004 | | | 12.73 | | | | (0.01 | ) | | | 2.46 | | | | 2.45 | | | | – | | | | (1.22 | ) | | | (1.22 | ) | | | 13.96 | | |
| | | 10/31/2003 | | | 9.01 | | | | (0.18 | ) | | | 3.90 | | | | 3.72 | | | | – | | | | – | | | | – | | | | 12.73 | | |
| | | | | | | Ratios/Supplemental Data | |
| | | For the
Period | | Total | | Net Assets,
End of
Period | | Ratio of Expenses
to Average
Net Assets (a) | | Net Investment
Income (Loss)
to Average | | Portfolio
Turnover | |
| | | Ended (g) | | Return (c) | | (000's) | | Net (e) | | Total (f) | | Net Assets (a) | | Rate (b) | |
| Class A | | 10/31/2005 | | | 20.41 | % | | $ | 386,346 | | | | 1.24 | % | | | 1.24 | % | | | 0.20 | % | | | 42 | % | |
| | | 10/31/2004 | | | 20.61 | | | | 334,763 | | | | 1.32 | | | | 1.32 | | | | 0.31 | | | | 81 | | |
| | | 10/31/2003 | | | 42.35 | | | | 149,557 | | | | 1.73 | | | | 1.73 | | | | (1.04 | ) | | | 55 | | |
| | | 10/31/2002 | | | (10.18 | ) | | | 45,500 | | | | 1.85 | | | | 1.98 | | | | (0.88 | ) | | | 22 | | |
| | | 10/31/2001 | | | 1.20 | | | | 6,536 | | | | 1.85 | | | | 3.56 | | | | (0.32 | ) | | | 8 | | |
| Class B | | 10/31/2005 | | | 19.30 | | | | 46,410 | | | | 2.14 | | | | 2.14 | | | | (0.70 | ) | | | 42 | | |
| | | 10/31/2004 | | | 19.85 | | | | 40,477 | | | | 1.97 | | | | 1.97 | | | | (0.43 | ) | | | 81 | | |
| | | 10/31/2003 | | | 41.76 | | | | 33,196 | | | | 2.38 | | | | 2.38 | | | | (1.69 | ) | | | 55 | | |
| | | 10/31/2002 | | | (10.91 | ) | | | 24,391 | | | | 2.50 | | | | 2.63 | | | | (1.53 | ) | | | 22 | | |
| | | 10/31/2001 | | | 0.80 | | | | 7,604 | | | | 2.50 | | | | 4.21 | | | | (0.97 | ) | | | 8 | | |
| Class C | | 10/31/2005 | | | 19.22 | | | | 21,532 | | | | 2.20 | | | | 2.20 | | | | (0.76 | ) | | | 42 | | |
| | | 10/31/2004 | | | 19.78 | | | | 19,678 | | | | 2.07 | | | | 2.07 | | | | (0.02 | ) | | | 81 | | |
| | | 10/31/2003 | | | 41.29 | | | | 1,995 | | | | 2.38 | | | | 2.38 | | | | (1.69 | ) | | | 55 | | |
NOTES TO FINANCIAL HIGHLIGHTS
(a) Annualized.
(b) Not annualized.
(c) Total Return has been calculated for the applicable period without deduction of a sales load, if any, on an initial purchase. Periods of less than one year are not annualized.
(d) Per share information is calculated based on average number of shares outstanding.
(e) Ratio of Net Expenses to Average Net Assets is net of fee waivers and reimbursements by the investment adiviser, if any (see note 2).
(f) Ratio of Total Expenses to Average Net Assets includes all expenses before fee waivers and reimbursements by the investment adviser.
(g) TA IDEX Transamerica Small/Mid Cap Value ("the Fund") commenced operations on April 2, 2001. The inception date for the Fund's offering of share Class C was November 11, 2002.
The notes to the financial statements are an integral part of this report.
Transamerica IDEX Mutual Funds
Annual Report 2005
9
TA IDEX Transamerica Small/Mid Cap Value
NOTES TO FINANCIAL STATEMENTS
At October 31, 2005
(all amounts in thousands)
NOTE 1. ORGANIZATION AND SIGNIFICANT ACCOUNTING POLICIES
Transamerica IDEX Mutual Funds is an open-end management investment company registered under the Investment Company Act of 1940, as amended (the "1940 Act").
In the normal course of business, TA IDEX Transamerica Small/Mid Cap Value (the "Fund") enters into contracts that contain a variety of representations that provide general indemnifications. The Fund's maximum exposure under these arrangements is unknown, as this would involve future claims that may be made against the Fund and/or its affiliates that have not yet occurred. However, based on experience, the Fund expects the risk of loss to be remote.
This report should be read in conjunction with the current Fund prospectus, which contains more complete information about the Fund.
The following is a summary of significant accounting policies followed by the Fund in the preparation of the financial statements. In preparing the Fund's financial statements in accordance with accounting principles generally accepted in the United States of America ("GAAP"), estimates or assumptions (which could differ from actual results) may be used that affect reported amounts and disclosures.
Multiple class operations, income and expenses: The Fund currently offers three classes of shares, each with a public offering price that reflects different sales charges, if any, and expense levels. On June 15, 2004, Class C2 shares merged into Class C. On September 24, 2004, Class M shares merged into Class C. Class B shares will convert to Class A shares eight years after purchase. Income, non-class specific expenses and realized and unrealized gains and losses, are allocated daily to each class, based upon the value of shares outstanding method as permitted under Rule 18f-3 of the 1940 Act. Each class bears its own specific expenses as well as a portion of general, common expenses.
Security valuations: The Fund values its investments at the close of the New York Stock Exchange ("NYSE"), normally 4 p.m. ET, each day the NYSE is open for business. Fund investments are valued at the last sale price or closing price on the day of valuation taken from the primary exchange where the security is principally traded.
Securities traded in the over-the-counter market and listed securities for which no sale was reported on that date are valued at the last quoted bid price.
Debt securities are valued based on a price quotation or other equivalent indication of value supplied by an exchange, a pricing service or a major market maker.
Investment company securities are valued at the net asset value of the underlying portfolio.
Other securities for which quotations are not readily available or whose values have been determined to be unreliable are valued at fair market value as determined in good faith by the Fund's Administrative Valuation Committee, under the supervision of the Board's Valuation Committee, using guidelines adopted by the Board of Trustees.
Cash: The Fund may leave cash overnight in its cash account with the custodian, Investors Bank & Trust Company ("IBT"). IBT has been contracted on behalf of the Fund to invest the excess cash into a savings account, which at October 31, 2005, was paying an interest rate of 2.76%.
Repurchase agreements: The Fund is authorized to enter into repurchase agreements. The Fund, through its custodian, Investors Bank & Trust Company ("IBT"), receives delivery of the underlying securities, the value of which at the time of purchase is required to be an amount equal to at least 100% of the resale price. The Fund will bear the risk of value fluctuations until the security can be sold and may encounter delays and incur costs in liquidating the security. In the event of bankruptcy or insolvency of the seller, delays and costs may be incurred.
Commission recapture: The sub-adviser, to the extent consistent with the best execution and usual commission rate policies and practices, may place security transactions of the Fund with broker/dealers with which Transamerica IDEX Mutual Funds has established a Commission Recapture Program. A Commission Recapture Program is any arrangement under which a broker/dealer applies a portion of the commissions received by such broker/dealer on the security transactions to the Fund. In no event will commissions paid by the Fund be used to pay expenses that would otherwise be borne by any other funds within Transamerica IDEX Mutual Funds, or by any other party.
Recaptured commissions during the year ended October 31, 2005, of $114 are included in net realized gains in the Statement of Operations.
Securities lending: The Fund may lend securities to qualified borrowers, with IBT acting as the Fund's lending agent. The Fund earns negotiated lenders' fees. The Fund receives cash and/or securities as collateral against the loaned securities. Cash collateral received is invested in short term, interest bearing securities. The Fund monitors the market value of securities loaned on a daily basis and requires collateral in an amount at least equal to the value of the securities loaned. Income from loaned securities on the Statement of Operations is net of fees, in the amount of $280, earned by IBT for its services.
Real Estate Investment Trusts ("REITs"): There are certain additional risks involved in investing in REITs. These include, but are not limited to, economic conditions, changes in zoning laws, real estate values, property taxes and interest rates.
Dividend income is recorded at management's estimate of the income included in distributions from the REIT investments. Distributions received in excess of the estimated amount are recorded as a reduction of the cost of investments. The actual amounts of income, return of capital and capital gains are only determined by each REIT after the fiscal year end and may differ from the estimated amounts.
Transamerica IDEX Mutual Funds
Annual Report 2005
10
TA IDEX Transamerica Small/Mid Cap Value
NOTES TO FINANCIAL STATEMENTS (continued)
At October 31, 2005
(all amounts in thousands)
NOTE 1.–(continued)
Security transactions and investment income: Security transactions are recorded on the trade date. Security gains and losses are calculated on the specific identification basis. Dividend income, if any, is recorded on the ex-dividend date or, in the case of foreign securities, as soon as the Fund is informed of the ex-dividend date. Interest income, including accretion of discounts and amortization of premiums, is recorded on the accrual basis commencing on the settlement date.
Redemption fees: A short-term trading redemption fee may be assessed on any Fund shares in a fund account that are sold during the first five (5) NYSE trading days following their purchase date. This redemption fee will equal 2% of the amount redeemed and shares held the longest will be treated as being redeemed first and shares held the shortest as being redeemed last. For year ended October 31, 2005, the Fund received less than $1 in redemption fees.
Dividend distributions: Distributions to shareholders are recorded on the ex-dividend date and are determined in accordance with Federal income tax regulations which may differ from GAAP.
NOTE 2. RELATED PARTY TRANSACTIONS
Effective January 1, 2005 AEGON/Transamerica Fund Advisors, Inc. was renamed Transamerica Fund Advisors, Inc. ("TFAI"); AEGON/Transamerica Fund Services, Inc. and AEGON/Transamerica Investor Services, Inc. merged into one entity and was renamed Transamerica Fund Services, Inc. ("TFS").
TFAI is the Fund's investment adviser. TFS is the Fund's administrator and transfer agent. AFSG Securities Corp. ("AFSG") is the Fund's distributor/principal underwriter. TFAI, TFS , and AFSG are affiliates of AEGON, NV, a Netherlands corporation.
Transamerica Investment Management, LLC is both an affiliate of the Fund and a sub-adviser to the Fund.
The following schedule reflects the percentage of Fund assets owned by affiliated mutual funds:
| | | Net
Assets | | % of
Net Assets | |
TA IDEX Asset Allocation–
Conservative Portfolio | | $ | 12,364 | | | | 2.72 | % | |
TA IDEX Asset Allocation–
Growth Portfolio | | | 111,464 | | | | 24.54 | % | |
TA IDEX Asset Allocation–
Moderate Growth Portfolio | | | 142,898 | | | | 31.46 | % | |
TA IDEX Asset Allocation–
Moderate Portfolio | | | 82,326 | | | | 18.12 | % | |
| Total | | $ | 349,052 | | | | 76.84 | % | |
Investment advisory fees: The Fund pays management fees to TFAI based on average daily net assets ("ANA") at the following breakpoints:
0.80% of the first $500 million of ANA
0.75% of ANA over $500 million
TFAI has contractually agreed to waive its advisory fee and will reimburse the Fund to the extent that operating expenses, excluding 12b-1 fees, exceed the following stated annual limit:
1.40% Expense Limit
If total Fund expenses fall below the annual expense limitation agreement agreed to by the adviser within the succeeding three years, the Fund may be required to pay that adviser a portion or all of the reimbursed class expenses.
There were no amounts recaptured during the year ended October 31, 2005. There are no amounts available for recapture at October 31, 2005.
Distribution and service fees: The Fund has a 12b-1 distribution plan under the 1940 Act pursuant to which an annual fee, based on average daily net assets, is paid to the distributor for various disbursements such as broker-dealer account servicing fees and other promotional expenses of the Fund. The Fund is authorized under the 12b-1 plan to pay fees on each class up to the following limits:
| Class A | | | 0.35 | % | |
| Class B | | | 1.00 | % | |
| Class C | | | 1.00 | % | |
In the case the Fund or a class of shares of the Fund is closed to new investors or investments, the Fund is authorized to pay 12b-1 fees for past sales and distribution efforts and present and past investor services.
Underwriter commissions relate to front-end sales charges imposed for Class A shares and contingent deferred sales charges from Classes B, C, and certain A share redemptions. For the year ended October 31, 2005, the underwriter commissions were as follows:
| Received by Underwriter | | $ | 610 | | |
| Retained by Underwriter | | | 34 | | |
| Contingent Deferred Sales Charge | | | 116 | | |
Administrative services: The Fund has entered into an agreement with TFS for financial and legal fund administration services. As of January 1, 2005 the Fund pays TFS an annual fee of 0.02% of ANA. Prior to January 1, 2005 the Fund paid TFS an annual fee of 0.015% of ANA. The Legal fees on the Statement of Operations are for fees paid to external legal counsel.
Transfer agent fees: The Fund pays TFS an annual per-account charge for each open and closed account. The Fund paid TFS $286 for the year ended October 31, 2005.
Transamerica IDEX Mutual Funds
Annual Report 2005
11
TA IDEX Transamerica Small/Mid Cap Value
NOTES TO FINANCIAL STATEMENTS (continued)
At October 31, 2005
(all amounts in thousands)
NOTE 2.–(continued)
Deferred compensation plan: Each eligible independent Fund Trustee may elect to participate in a non-qualified deferred compensation plan maintained by Transamerica IDEX Mutual Funds (the "Plan"). Under the Plan, such Trustees may defer payment of all or a portion of their total fees earned as a Fund Trustee. Each Trustee who is a participant in the Plan may elect that the earnings, losses or gains credited to his or her deferred fee amounts be determined based on a deemed investment in any series of Transamerica IDEX Mutual Funds, including the Fund. The right of a participant to receive a distribution from the Plan of the deferred fees is an unsecured claim against the general assets of all series of Transamerica IDEX Mutual Funds. The pro rata liability to the Fund of all deferred fees in the Plan amounted, as of October 31, 2005, to $11.
NOTE 3. INVESTMENT TRANSACTIONS
The cost of securities purchased and proceeds from securities sold (excluding short-term securities) for the year ended October 31, 2005, were as follows:
| Purchases of securities: | |
| Long-Term | | $ | 179,618 | | |
| U.S. Government | | | – | | |
| Proceeds from maturities and sales of securities: | |
| Long-Term | | | 205,354 | | |
| U.S. Government | | | – | | |
NOTE 4. FEDERAL INCOME TAX MATTERS
The Fund has not made any provision for federal income or excise taxes due to its policy to distribute all of its taxable income and capital gains to its shareholders and otherwise qualify as a regulated investment company under Subchapter M of the Internal Revenue Code. Income and capital gain distributions are determined in accordance with income tax regulations, which may differ from GAAP. These differences are primarily due to differing treatment for items including, but not limited to, wash sales and distribution reclassifications.
Therefore, distributions determined in accordance with tax regulations may differ significantly in amount or character from net investment income and realized gains for financial reporting purposes. Financial reporting records are adjusted for permanent book/tax differences to reflect tax character. Financial records are not adjusted for temporary differences. These reclassifications are as follows:
| Undistributed net investment income (loss) | | $ | 1,219 | | |
Undistributed net realized gain (loss) from
investment securities | | | (1,219 | ) | |
The tax character of distributions paid may differ from the character of distributions shown in the Statement of Changes in Net Assets due to short-term gains being treated as ordinary income for tax purposes. The tax character of distributions paid during 2004 and 2005 was as follows:
| 2004 Distributions paid from: | |
| Ordinary Income | | $ | 16,974 | | |
| Long-term Capital Gain | | | 12,572 | | |
| 2005 Distributions paid from: | |
| Ordinary Income | | $ | 8,552 | | |
| Long-term Capital Gain | | | 5,097 | | |
The tax basis components of distributable earnings as of October 31, 2005, are as follows:
| Undistributed Ordinary Income | | $ | 10,837 | | |
| Undistributed Long-term Capital Gains | | $ | 19,947 | | |
| Capital Loss Carryforward | | $ | – | | |
| Net Unrealized Appreciation (Depreciation) | | $ | 76,156 | * | |
* Amount includes unrealized appreciation (depreciation) from deferred compensation.
The aggregate cost of investments and composition of unrealized appreciation (depreciation) for federal income tax purposes as of October 31, 2005, are as follows:
| Federal Tax Cost Basis | | $ | 450,233 | | |
| Unrealized Appreciation | | $ | 98,095 | | |
| Unrealized (Depreciation) | | | (21,938 | ) | |
| Net Unrealized Appreciation (Depreciation) | | $ | 76,157 | | |
NOTE 5. REGULATORY PROCEEDINGS
There continues to be significant federal and state regulatory activity relating to financial services companies, particularly mutual fund companies and their investment advisers. As part of an ongoing investigation regarding potential market timing, recordkeeping and trading compliance issues and matters affecting the Fund's investment adviser, TFAI, and certain affiliates and former employees of TFAI, the SEC staff has indicated that it is likely to take some action against TFAI and certain of its affiliates at the conclusion of the investigation. The potential timing and the scope of any such action is difficult to predict. Although the impact of any action brought against TFAI and/or its affiliates is difficult to assess at the present time, the Fund currently believes that the likelihood that any such action will have a material adverse impact on it is remote. It is important to note that the Fund is not aware of any allega tion of wrongdoing against it and its Board at the time this annual report is printed. Although it is not anticipated that these developments will have an adverse impact on the Fund, there can be no assurance at this time. TFAI and its affiliates are actively working with the SEC in regard to this matter; however, the exact resolution cannot be determined at this time. TFAI will take such actions that it deems necessary or appropriate to continue providing management services to the Fund and to bring all matters to an appropriate conclusion.
TFAI and/or its affiliates, and not the Fund, will bear the costs regarding these regulatory matters.
Transamerica IDEX Mutual Funds
Annual Report 2005
12
Report of Independent Registered Certified Public Accounting Firm
To the Board of Trustees and Shareholders of
TA IDEX Transamerica Small/Mid Cap Value
In our opinion, the accompanying statement of assets and liabilities, including the schedule of investments, and the related statements of operations and of changes in net assets and the financial highlights present fairly, in all material respects, the financial position of TA IDEX Transamerica Small/Mid Cap Value (the "Fund") (one of the portfolios constituting the Transamerica IDEX Mutual Funds) at October 31, 2005, the results of its operations for the year then ended, the changes in its net assets for each of the two years in the period then ended and the financial highlights for each of the periods presented, in conformity with accounting principles generally accepted in the United States of America. These financial statements and financial highlights (hereafter referred to as "financial statements") are the responsibility of the Fund's management; our responsibility is to express an opinion on these financial statements b ased on our audits. We conducted our audits of these financial statements in accordance with the standards of the Public Company Accounting Oversight Board (United States). Those standards require that we plan and perform the audit to obtain reasonable assurance about whether the financial statements are free of material misstatement. An audit includes examining, on a test basis, evidence supporting the amounts and disclosures in the financial statements, assessing the accounting principles used and significant estimates made by management, and evaluating the overall financial statement presentation. We believe that our audits, which included confirmation of securities at October 31, 2005 by correspondence with the custodian and brokers, provide a reasonable basis for our opinion.

December 22, 2005
Transamerica IDEX Mutual Funds
Annual Report 2005
13
TA IDEX Transamerica Small/Mid Cap Value
SUPPLEMENTAL INFORMATION (unaudited)
TAX INFORMATION
For dividends paid during the year ended October 31, 2005, the Fund designated $4,359 as qualified dividend income.
For corporate shareholders, 25% of investment income (dividend income plus short-term gains, if any) qualifies for the dividends received deduction.
For tax purposes, the Fund has made a Long-Term Capital Gain Designation of $5,097 for the year ended October 31, 2005.
The information and distributions reported herein may differ from the information and distributions taxable to the shareholders for the calendar year ending December 31, 2005. Complete information will be computed and reported in conjunction with your 2005 Form 1099-DIV.
Transamerica IDEX Mutual Funds
Annual Report 2005
14
TA IDEX Transamerica Value Balanced
MARKET ENVIRONMENT
The twelve months ended October 31, 2005, were strongly positive for value stocks and mildly positive for bonds. The Russell 1000 Value Index ("Russell 1000 Value") gained 11.86%, largely due to unusually powerful gains among energy stocks as oil prices climbed sharply and remained elevated. While all but one other market sector delivered positive returns as well, two points are worth noting. The market's progress was very uneven, and energy was by far the driving force.
In the fixed-income markets, short-term yields rose as the Federal Reserve Board ("Fed") steadily lifted the federal funds rate from 1.75% to 3.75%. Long-term yields, which are more sensitive to economic fundamentals and inflation than to the Fed's actions, rose less or declined slightly. Corporate bonds underperformed Treasuries as investors worried that companies might deploy cash balances in ways that favor shareholders, but are detrimental to corporate creditworthiness. In the end, the Lehman Brothers Aggregate Bond Index ("LBAB") gained 1.13%.
PERFORMANCE
For the year ended October 31, 2005, TA IDEX Transamerica Value Balanced, Class A returned 7.79%. By comparison its primary and secondary benchmarks, the Russell 1000 Value, the LBAB and the Lehman Brothers Intermediate Government/Credit Bond Index, returned 11.86%, 1.13% and 0.27%, respectively.
STRATEGY REVIEW
TA IDEX Transamerica Value Balanced delivered a one-year total return of 7.79%, compared to 7.57% total return for a 60% equities/40% bonds blend of the above mentioned indexes. We attribute the outperformance to the effective use of options in the equity portfolio, which more than offset relative underperformance by the portfolio's health care, financial services and technology holdings.
Throughout the period, we maintained a slightly aggressive asset allocation (i.e., approximately 65% equities and 35% bonds).
In positioning the equity portfolio, we did not fully anticipate the structural change in oil and gas that led to remarkable gains for energy stocks. However, we more than compensated for this through the effective use of put options. Writing puts within the energy sector provided the portfolio with enhanced cash flow without committing capital immediately. In essence, we took advantage of short-term pricing inefficiencies in energy stocks without making a longer-term commitment to the sector after prices had already risen substantially. Likewise, the use of out-of-the-money puts and calls on stocks already in the portfolio (e.g., Altria Group, Inc.("Altria"), Merck & Co., Inc., Sprint FON Group and Microsoft Corporation ("Microsoft")) allowed us to maintain positions in high-quality companies with long-term potential while collecting premiums that boost ed near-term performance.
As for the portfolio's stock holdings, Altria (a multinational food, beverage and tobacco company) and several energy stocks (EOG Resources, Inc., Schlumberger Limited, and Exxon Mobil Corporation) led performance, while mortgage company Fannie Mae and Microsoft hindered results. We divested a large portion of our position in Fannie Mae. Although we remain convinced the company is viable long term, our confidence was shaken by a major earnings restatement and a sudden change in management.
The portfolio's fixed-income portfolio performed in line with the benchmark LBAB, making a small contribution to results. An overweighting in the underperforming corporate bond sector was more than offset by a shorter-than-index duration, which limited principal erosion in a rising-rate environment. The portfolio also benefited from our limited exposure to troubled industries like autos, sustained emphasis on secularly growing areas like basic materials, and an allocation to mortgage-backed securities, a sector that outperformed Treasuries and corporates.
John C. Riazzi, CFA
Heidi Y. Hu, CFA
Co-Fund Managers
Transamerica Investment Management, LLC
Transamerica IDEX Mutual Funds
Annual Report 2005
1
TA IDEX Transamerica Value Balanced
Comparison of change in value of $10,000 investment in Class A shares and its comparative indices.
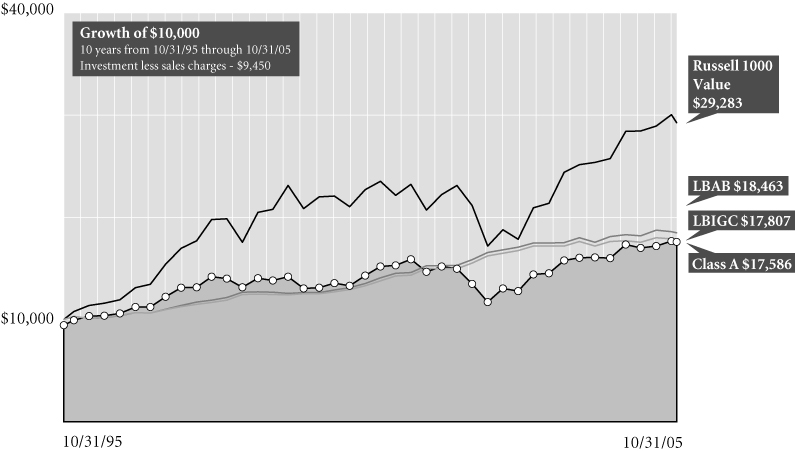
Transamerica IDEX Mutual Funds
Average Annual Total Return for Periods Ended 10/31/05
| | | 1 year | | 5 years | | 10 years | | From
Inception | | Inception
Date | |
| Class A (NAV) | | | 7.79 | % | | | 3.47 | % | | | 6.41 | % | | | 6.25 | % | | 10/1/95 | |
| Class A (POP) | | | 1.86 | % | | | 2.30 | % | | | 5.81 | % | | | 5.65 | % | | 10/1/95 | |
| Russell 1000 Value1 | | | 11.86 | % | | | 4.71 | % | | | 11.34 | % | | | 11.13 | % | | 10/1/95 | |
| LBAB1 | | | 1.13 | % | | | 6.31 | % | | | 6.32 | % | | | 6.40 | % | | 10/1/95 | |
| LBIGC1 | | | 0.27 | % | | | 5.94 | % | | | 5.94 | % | | | 6.00 | % | | 10/1/95 | |
| Class B (NAV) | | | 7.13 | % | | | 2.76 | % | | | 5.71 | % | | | 5.55 | % | | 10/1/95 | |
| Class B (POP) | | | 2.20 | % | | | 2.59 | % | | | 5.71 | % | | | 5.55 | % | | 10/1/95 | |
| Class C (NAV) | | | 7.18 | % | | | – | | | | – | | | | 11.00 | % | | 11/11/02 | |
| Class C (POP) | | | 6.19 | % | | | – | | | | – | | | | 11.00 | % | | 11/11/02 | |
NOTES
1 The Russell 1000 Value (Russell 1000 Value) Index, the Lehman Brothers Aggregate Bond (LBAB) Index and the Lehman Brothers Intermediate U.S. Government/Credit (LBIGC) Index are unmanaged indices used as a general measure of market performance. Calculations assume dividends and capital gains are reinvested and do not include any managerial expenses. From inception calculation is based on life of Class A shares. Source: Standard & Poor's Micropal®© Micropal, Inc. 2005 – 1-800-596-5323 – http://www.funds-sp.com.
The performance data presented represents past performance, future results may vary. Performance data does not reflect the deduction of taxes that would be paid on fund distributions or the redemption of fund shares. Investment return and principal value will fluctuate so that an investor's shares, when redeemed, may be worth more or less than their original cost. Current performance may be lower or higher than performance quoted. Please see www.transamericaidex.com for performance data current to the most recent month-end.
Public Offering Price (POP) returns include the reinvestment of dividends and capital gains and reflect the maximum sales charge of 5.5% for A shares or the maximum applicable contingent deferred sales charge (5% in the 1st year, decreasing to 0% after 6 years) for Class B shares and 1% (during the first 12 months) for Class C shares. Shares purchased prior to March 1, 2004 are subject to a maximum applicable contingent deferred sales charge (5% in the 1st year, decreasing to 0% after 7 years) for Class B shares and (2% in the 1st year, decreasing to 0% after 2 years) for Class C shares. Net Asset Value (NAV) returns include the reinvestment of dividends and capital gains but do not reflect any sales charges.
This material must be preceded or accompanied by a current prospectus, which includes specific contents regarding the investment objectives and policies of this fund.
Annual Report 2005
2
TA IDEX Transamerica Value Balanced
UNDERSTANDING YOUR FUND'S EXPENSES
(unaudited)
SHAREHOLDER EXPENSES
Fund shareholders may incur two types of costs: (1) transaction costs, including sales charges (loads) on purchases, contingent deferred sales charges on redemptions and redemption fees; and (2) ongoing costs, including management fees, 12b-1 distribution and service fees, and other fund expenses.
The following Example is intended to help you understand your ongoing costs (in dollars and cents) of investing in a Fund and to compare these costs with the ongoing costs of investing in other funds.
The Example is based on an investment of $1,000 invested at May 1, 2005 and held for the entire period until October 31, 2005.
ACTUAL EXPENSES
The first line in the table below provides information about actual account values and actual expenses. You may use the information in this line, together with the amount you invested, to estimate the expenses that you paid over the period. Simply divide your account value by $1,000 (for example, an $8,600 account value divided by $1,000 = 8.6), then multiply the result by the number in the first line of your Fund under the heading entitled "Expenses Paid During Period" to estimate the expenses you paid on your account during this period. If your account is an IRA, your expenses could have included a $15 annual fee. The amount of any fee paid through your account would increase the estimate of expenses you paid during the period and decrease your ending account value.
HYPOTHETICAL EXAMPLE FOR COMPARISON PURPOSES
The second line in the table below provides information about hypothetical account values and hypothetical expenses based on the Fund's actual expense ratio and an assumed rate of return of 5% per year before expenses, which is not the Fund's actual return. The hypothetical account values and expenses may not be used to estimate the actual ending account balance or expenses you paid for the period. You may use this information to compare the ongoing costs of investing in your Fund and other funds. To do so, compare this 5% hypothetical example with the 5% hypothetical examples that appear in the shareholder reports of the other funds. As in the case of the actual expense example, if your account is subject to an IRA fee, the amount of the fee paid through your account would increase the hypothetical expenses you would have paid during the period and decrease the hypothetical ending account value.
Please note that the expenses shown in the table are meant to highlight your ongoing costs only and do not reflect any transactional costs, such as sales charges, redemption fees, brokerage commissions paid on purchases and sales of fund shares. Therefore, the second line under the Fund in the table is useful in comparing ongoing costs only, and will not help you determine the relative total costs of owning different funds. If any of these transaction costs were included, your costs would be higher. The expenses shown in the table do not reflect any fees that may be charged to you by brokers, financial intermediaries or other financial institutions.
| | | Beginning
Account
Value | | Ending
Account
Value | | Annualized
Expense
Ratio | | Expenses Paid
During Period (a) | |
| Class A | |
| Actual | | $ | 1,000.00 | | | $ | 1,041.80 | | | | 1.56 | % | | $ | 8.03 | | |
| Hypothetical (b) | | | 1,000.00 | | | | 1,017.34 | | | | 1.56 | | | | 7.93 | | |
| Class B | |
| Actual | | | 1,000.00 | | | | 1,037.50 | | | | 2.27 | | | | 11.66 | | |
| Hypothetical (b) | | | 1,000.00 | | | | 1,013.76 | | | | 2.27 | | | | 11.52 | | |
| Class C | |
| Actual | | | 1,000.00 | | | | 1,038.00 | | | | 2.26 | | | | 11.61 | | |
| Hypothetical (b) | | | 1,000.00 | | | | 1,013.81 | | | | 2.26 | | | | 11.47 | | |
(a) Expenses are calculated using each Fund's annualized expense ratio (as disclosed in the table), multiplied by the average account value for the period, multiplied by number of days in the period (184 days), and divided by the number of days in the year (365 days).
(b) 5% return per year before expenses.
GRAPHICAL PRESENTATION OF SCHEDULE OF INVESTMENTS
By Asset Type
At October 31, 2005
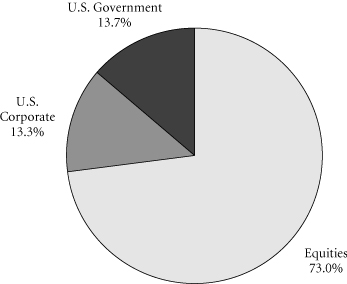
This chart shows the percentage breakdown by asset type of the Fund's total investment securities.
Transamerica IDEX Mutual Funds
Annual Report 2005
3
TA IDEX Transamerica Value Balanced
SCHEDULE OF INVESTMENTS
At October 31, 2005
(all amounts except share amounts in thousands)
| | | Principal | | Value | |
| U.S. GOVERNMENT OBLIGATIONS (3.8%) # | |
U.S. Treasury Bond
5.38%, due 02/15/2031 | | $ | 1,492 | | | $ | 1,627 | | |
U.S. Treasury Note
4.00%, due 09/30/2007
4.25%, due 08/15/2015 | | | 220
665 | | | | 218
649 | | |
U.S. Treasury STRIPS
Zero Coupon, due 05/15/2030 | | | 370 | | | | 115 | | |
| Total U.S. Government Obligations (cost: $2,679) | | | | | | | 2,609 | | |
| U.S. GOVERNMENT AGENCY OBLIGATIONS (9.4%) | |
Fannie Mae
5.50%, due 05/01/2035
5.00%, due 07/01/2035 | | | 1,396
699 | | | | 1,377
673 | | |
Fannie Mae-Conventional Pool
5.00%, due 05/01/2018
5.50%, due 07/01/2019
6.00%, due 04/01/2033
6.00%, due 10/01/2034 | | | 141
903
361
223 | | | | 139
909
365
225 | | |
Freddie Mac-Gold Pool
5.00%, due 04/01/2018
5.50%, due 09/01/2018
5.50%, due 11/01/2018
6.00%, due 12/01/2033
5.50%, due 02/01/2035
5.50%, due 06/01/2035
5.00%, due 07/01/2035 | | | 263
89
168
443
596
606
261 | | | | 260
90
169
448
589
599
251 | | |
Ginnie Mae-FHA/VA Pool
6.50%, due 10/15/2027
6.00%, due 06/15/2034 | | | 102
271 | | | | 106
276 | | |
Total U.S. Government Agency Obligations
(cost: $6,623) | | | | | | | 6,476 | | |
| CORPORATE DEBT SECURITIES (12.8%) | |
| Agriculture (0.3%) | |
Dole Food Co., Inc.
8.63%, due 05/01/2009 | | | 100 | | | | 103 | | |
Michael Foods, Inc.
8.00%, due 11/15/2013 | | | 90 | | | | 91 | | |
| Amusement & Recreation Services (0.2%) | |
Harrah's Operating Co., Inc.
5.50%, due 07/01/2010 | | | 175 | | | | 174 | | |
| Asset-Backed (0.5%) | |
USAA Auto Owner Trust, Series 2005-3, Class A2
4.52%, due 06/16/2008 | | | 373 | | | | 372 | | |
| Beverages (0.3%) | |
Cia Brasileira de Bebidas
8.75%, due 09/15/2013 | | | 150 | | | | 175 | | |
| | | Principal | | Value | |
| Business Credit Institutions (0.4%) | |
Textron Financial Corp.
2.69%, due 10/03/2006 | | $ | 250 | | | $ | 246 | | |
| Chemicals & Allied Products (0.6%) | |
Monsanto Co.
5.50%, due 07/30/2035 | | | 100 | | | | 94 | | |
Nalco Co.
7.75%, due 11/15/2011 | | | 50 | | | | 51 | | |
Potash Corp. of Saskatchewan
7.13%, due 06/15/2007 | | | 235 | | | | 243 | | |
| Commercial Banks (1.1%) | |
China Development Bank
5.00%, due 10/15/2015 | | | 270 | | | | 261 | | |
HBOS PLC–144A
5.92%, due 09/01/2049 (a) | | | 300 | | | | 296 | | |
Sumitomo Mitsui Banking–144A
5.63%, due 07/15/2049 (b) | | | 200 | | | | 196 | | |
| Communication (0.3%) | |
Comcast Corp.
4.95%, due 06/15/2016 | | | 240 | | | | 223 | | |
| Department Stores (0.1%) | |
Neiman-Marcus Group, Inc.–144A
9.00%, due 10/15/2015 | | | 100 | | | | 98 | | |
| Electric Services (0.5%) | |
DPL, Inc.
8.25%, due 03/01/2007 | | | 112 | | | | 116 | | |
PSEG Funding Trust
5.38%, due 11/16/2007 | | | 250 | | | | 251 | | |
| Food & Kindred Products (0.2%) | |
Tyson Foods, Inc.
8.25%, due 10/01/2011 | | | 154 | | | | 174 | | |
| Food Stores (0.1%) | |
Stater Brothers Holdings, Inc.
8.13%, due 06/15/2012 | | | 100 | | | | 98 | | |
| Holding & Other Investment Offices (0.8%) | |
iStar Financial, Inc.
4.88%, due 01/15/2009 | | | 375 | | | | 368 | | |
Tanger Factory Outlet Centers REIT
6.15%, due 11/15/2015 | | | 180 | | | | 180 | | |
| Hotels & Other Lodging Places (1.0%) | |
Starwood Hotels & Resorts Worldwide, Inc.
7.38%, due 05/01/2007 | | | 600 | | | | 614 | | |
Wynn Las Vegas LLC/Wynn Las Vegas Capital Corp.
6.63%, due 12/01/2014 | | | 55 | | | | 52 | | |
The notes to the financial statements are an integral part of this report.
Transamerica IDEX Mutual Funds
Annual Report 2005
4
TA IDEX Transamerica Value Balanced
SCHEDULE OF INVESTMENTS (continued)
At October 31, 2005
(all amounts except share amounts in thousands)
| | | Principal | | Value | |
| Insurance (0.9%) | |
International Lease Finance Corp.
5.63%, due 06/01/2007 | | $ | 600 | | | $ | 606 | | |
| Metal Mining (0.3%) | |
Phelps Dodge Corp.
9.50%, due 06/01/2031 | | | 137 | | | | 186 | | |
| Mortgage Bankers & Brokers (0.9%) | |
Countrywide Home Loans, Inc.
5.50%, due 08/01/2006 | | | 600 | | | | 604 | | |
| Motion Pictures (0.2%) | |
Time Warner, Inc.
9.13%, due 01/15/2013 | | | 125 | | | | 149 | | |
| Oil & Gas Extraction (0.5%) | |
Husky Oil, Ltd.
8.90%, due 08/15/2028 (c) | | | 305 | | | | 328 | | |
| Personal Credit Institutions (0.2%) | |
Ford Motor Credit Co.
6.88%, due 02/01/2006 | | | 125 | | | | 125 | | |
| Primary Metal Industries (0.2%) | |
Noranda, Inc.
6.00%, due 10/15/2015 | | | 125 | | | | 125 | | |
| Printing & Publishing (0.4%) | |
Media General, Inc.
6.95%, due 09/01/2006 | | | 220 | | | | 222 | | |
News America Holdings, Inc.
7.75%, due 12/01/2045 | | | 65 | | | | 73 | | |
| Restaurants (0.1%) | |
Landry's Restaurants, Inc., Series B
7.50%, due 12/15/2014 | | | 50 | | | | 46 | | |
| Security & Commodity Brokers (1.4%) | |
BNP U.S. Funding LLC–144A
7.74%, due 12/29/2049 (d) | | | 250 | | | | 263 | | |
Credit Suisse First Boston (London), Inc.–144A
7.90%, due 05/01/2049 (e) | | | 125 | | | | 130 | | |
E*Trade Financial Corp.
8.00%, due 06/15/2011 | | | 50 | | | | 51 | | |
Nuveen Investments, Inc.
5.00%, due 09/15/2010 | | | 375 | | | | 367 | | |
Residential Capital Corp.–144A
6.38%, due 06/30/2010 | | | 185 | | | | 188 | | |
| Telecommunications (0.4%) | |
Sprint Capital Corp.
4.78%, due 08/17/2006 | | | 250 | | | | 250 | | |
| | | Principal | | Value | |
| Water Transportation (0.9%) | |
Carnival Corp.
3.75%, due 11/15/2007 | | $ | 380 | | | $ | 372 | | |
Royal Caribbean Cruises, Ltd.
8.75%, due 02/02/2011 | | | 235 | | | | 262 | | |
| Total Corporate Debt Securities (cost: $9,017) | | | | | | | 8,823 | | |
| | | Shares | | Value | |
| COMMON STOCKS (70.4%) | |
| Amusement & Recreation Services (1.9%) | |
| Disney (Walt) Co. (The) | | | 52,200 | | | $ | 1,272 | | |
| Business Credit Institutions (0.3%) | |
| Fannie Mae | | | 4,500 | | | | 214 | | |
| Chemicals & Allied Products (1.6%) | |
| Colgate-Palmolive Co. | | | 7,000 | | | | 371 | | |
| Praxair, Inc. | | | 15,000 | | | | 741 | | |
| Commercial Banks (7.5%) | |
| Bank of America Corp. | | | 31,256 | | | | 1,367 | | |
| Citigroup, Inc. | | | 32,540 | | | | 1,490 | | |
| PNC Financial Services Group, Inc. | | | 17,000 | | | | 1,032 | | |
| Wachovia Corp. | | | 20,000 | | | | 1,010 | | |
| Wells Fargo & Co. | | | 5,000 | | | | 301 | | |
| Computer & Data Processing Services (5.6%) | |
| Microsoft Corp. | | | 150,000 | | | | 3,855 | | |
| Electric Services (0.3%) | |
| Dominion Resources, Inc. | | | 3,000 | | | | 228 | | |
| Electronic & Other Electric Equipment (2.3%) | |
| Cooper Industries, Ltd.–Class A | | | 5,500 | | | | 390 | | |
| General Electric Co. | | | 35,500 | | | | 1,204 | | |
| Food & Kindred Products (6.4%) | |
| Altria Group, Inc. | | | 50,000 | | | | 3,753 | | |
| HJ Heinz Co. | | | 11,000 | | | | 391 | | |
| Sara Lee Corp. | | | 15,000 | | | | 268 | | |
| Gas Production & Distribution (2.0%) | |
| KeySpan Corp. | | | 40,000 | | | | 1,383 | | |
| Holding & Other Investment Offices (2.6%) | |
| Plum Creek Timber Co., Inc. | | | 23,000 | | | | 895 | | |
| Rayonier, Inc. | | | 24,000 | | | | 918 | | |
| Insurance (1.2%) | |
| American International Group, Inc. | | | 13,000 | | | | 842 | | |
| Life Insurance (1.1%) | |
| Genworth Financial, Inc.–Class A | | | 23,000 | | | | 729 | | |
| Lumber & Wood Products (0.6%) | |
| Louisiana-Pacific Corp. | | | 17,000 | | | | 424 | | |
The notes to the financial statements are an integral part of this report.
Transamerica IDEX Mutual Funds
Annual Report 2005
5
TA IDEX Transamerica Value Balanced
SCHEDULE OF INVESTMENTS (continued)
At October 31, 2005
(all amounts except share amounts in thousands)
| | | Shares | | Value | |
| Motion Pictures (4.7%) | |
| Time Warner, Inc. | | | 183,000 | | | $ | 3,263 | | |
| Oil & Gas Extraction (3.8%) | |
| Anadarko Petroleum Corp. | | | 7,000 | | | | 635 | | |
| EOG Resources, Inc. | | | 7,000 | | | | 474 | | |
| Schlumberger, Ltd. | | | 16,300 | | | | 1,480 | | |
| Paper & Allied Products (0.4%) | |
| Kimberly-Clark Corp. | | | 5,000 | | | | 284 | | |
| Petroleum Refining (5.7%) | |
| BP PLC, ADR | | | 25,050 | | | | 1,663 | | |
| Exxon Mobil Corp. | | | 14,000 | | | | 786 | | |
| Marathon Oil Corp. | | | 13,750 | | | | 827 | | |
| Murphy Oil Corp. | | | 14,000 | | | | 656 | | |
| Pharmaceuticals (6.6%) | |
| Bristol-Myers Squibb Co. | | | 85,000 | | | | 1,799 | | |
| Merck & Co., Inc. | | | 69,500 | | | | 1,961 | | |
| Schering-Plough Corp. | | | 40,000 | | | | 814 | | |
| Primary Metal Industries (0.6%) | |
| Hubbell, Inc.–Class B | | | 8,000 | | | | 385 | | |
| Railroads (1.1%) | |
| Union Pacific Corp. | | | 11,000 | | | | 761 | | |
| Savings Institutions (2.9%) | |
| Washington Mutual, Inc. | | | 49,890 | | | | 1,976 | | |
| Security & Commodity Brokers (6.5%) | |
| Alliance Capital Management Holding, LP | | | 45,000 | | | | 2,382 | | |
| Jefferies Group, Inc. | | | 14,000 | | | | 594 | | |
| Raymond James Financial, Inc. | | | 28,000 | | | | 953 | | |
| T. Rowe Price Group, Inc. | | | 8,000 | | | | 524 | | |
| Telecommunications (3.3%) | |
| Sprint Nextel Corp. | | | 98,000 | | | | 2,284 | | |
| Tobacco Products (1.4%) | |
| Loews Corp.-Carolina Group | | | 23,000 | | | | 946 | | |
| Total Common Stocks (cost: $41,702) | | | | | | | 48,525 | | |
| Total Investment Securities (cost: $60,021) | | | | | | $ | 66,433 | | |
| | | Contracts w | | Value | |
| WRITTEN OPTIONS (-0.7%) | |
| Covered Call Options (-0.3%) | |
Altria Group, Inc.
Call Strike $75.00
Expires 12/17/2005 | | | 175 | | | | (59 | ) | |
American International Group, Inc.
Call Strike $60.00
Expires 11/19/2005 | | | 130 | | | | (65 | ) | |
| | | Contracts w | | Value | |
| Covered Call Options (continued) | |
| Anadarko Petroleum Corp. | | | 25 | | | $ | (3 | ) | |
| Call Strike $95.00 | | | | | | |
| | |
| Expires 11/19/2005 | | | | | | | | | |
Louisiana-Pacific Corp.
Call Strike $30.00
Expires 01/21/2006 | | | 90 | | | | (2 | ) | |
Raymond James Financial, Inc.
Call Strike $30.00
Expires 11/19/2005 | | | 100 | | | | (42 | ) | |
Schering-Plough Corp.
Call Strike $22.50
Expires 01/21/2006 | | | 175 | | | | (10 | ) | |
Sprint Corp. (FON Group)
Call Strike $27.50
Expires 01/21/2006 | | | 100 | | | | (1 | ) | |
Wells Fargo & Co.
Call Strike $65.00
Expires 01/21/2006 | | | 81 | | | | (2 | ) | |
| Put Options (-0.4%) | |
Alliance Capital Management Holding, LP
Put Strike $45.00
Expires 01/21/2006 | | | 50 | | | | (1 | ) | |
Altria Group, Inc.
Put Strike $40.00
Expires 01/21/2006 | | | 100 | | | | (1 | ) | |
American International Group, Inc.
Put Strike $50.00
Expires 02/18/2006 | | | 130 | | | | (2 | ) | |
Bristol-Myers Squibb Co.
Put Strike $20.00
Expires 01/21/2006 | | | 150 | | | | (8 | ) | |
Colgate-Palmolive Co.
Put Strike $45.00
Expires 01/21/2006 | | | 80 | | | | (1 | ) | |
Duke Energy
Put Strike $15.00
Expires 01/21/2006 | | | 20 | | | | 0 | o | |
Fording Canadian Coal Trust
Put Strike $33.38
Expires 01/21/2006 | | | 294 | | | | (95 | ) | |
Freeport McMoRan Cooper & Gold, Inc.
Put Strike $35.00
Expires 01/21/2006 | | | 166 | | | | (4 | ) | |
General Electric Co.
Put Strike $35.00
Expires 12/17/2005 | | | 80 | | | | (10 | ) | |
The notes to the financial statements are an integral part of this report.
Transamerica IDEX Mutual Funds
Annual Report 2005
6
TA IDEX Transamerica Value Balanced
SCHEDULE OF INVESTMENTS (continued)
At October 31, 2005
(all amounts except share amounts in thousands)
| | | Contracts w | | Value | |
| Put Options (continued) | |
| HJ Heinz Co. | | | 90 | | | $ | (9 | ) | |
| Put Strike $35.00 | | | | | | |
| | |
| Expires 01/21/2006 | | | | | | | | | |
Home Depot
Put Strike $35.00
Expires 01/21/2006 | | | 50 | | | | (1 | ) | |
Merck & Co., Inc.
Put Strike $40.00
Expires 01/21/2006 | | | 100 | | | | (121 | ) | |
PNC Financial Services Group, Inc.
Put Strike $47.50
Expires 11/19/2005 | | | 130 | | | | (1 | ) | |
Sara Lee Corp.
Put Strike $20.00
Expires 01/21/2006 | | | 80 | | | | (19 | ) | |
Schering-Plough Corp.
Put Strike $15.00
Expires 01/21/2006 | | | 100 | | | | (1 | ) | |
Washington Mutual, Inc.
Put Strike $30.00
Expires 01/21/2006 | | | 220 | | | | (2 | ) | |
| Total Written Options (premiums: $442) | | | | | | | (460 | ) | |
| SUMMARY: | |
| Investment securities, at value | | | 96.4 | % | | $ | 66,433 | | |
| Written Options | | | (0.7 | )% | | | (460 | ) | |
| Other assets in excess of liabilities | | | 4.3 | % | | | 2,959 | | |
| Net assets | | | 100.0 | % | | $ | 68,932 | | |
NOTES TO SCHEDULE OF INVESTMENTS:
# Substantially all of the Fund's securities are memo pledged as collateral by the custodian for the listed short index option contracts written by the Fund.
(a) HBOS PLC–144A has a fixed coupon rate of 5.92% until 10/01/2015, thereafter the coupon rate will reset quarterly at the 3-month US$ LIBOR + 129.5BP, if not called.
(b) Sumitomo Matsui Banking–144A has a fixed coupon rate of 5.63% until 10/15/2015, thereafter the coupon rate will reset quarterly at the 3-month US$ LIBOR + 255BP, if not called.
(c) Husky Oil, Ltd. has a fixed coupon rate of 8.90% until 8/15/2008, thereafter the coupon rate will reset quarterly at the 3-month US$ LIBOR + 550BP, if not called.
(d) BNP U.S. Funding LLC–144A has a fixed coupon rate 7.74% until 12/05/2007, thereafter the coupon rate will reset quarterly at the 1-week US$ LIBOR + 280BP, if not called.
(e) Credit Suisse First Boston (London), Inc.–144A has a fixed coupon rate 7.90% until 05/01/2007, thereafter the coupon rate will reset every 5 years at the 5-year current month treasury + 200BP, if not called.
o Value is less than $1.
w Contract amounts are not in thousands.
DEFINITIONS:
144A 144A Securities are registered pursuant to Rule 144A of the Securities Act of 1933. These securities are deemed to be liquid for purposes of compliance limitations on holdings of illiquid securities and may be resold as transactions exempt from registration, normally to qualified institutional buyers. At October 31, 2005, these securities aggregated $1,171 or 1.7% of the net assets of the Fund.
ADR American Depositary Receipt
REIT Real Estate Investment Trust
STRIPS Separate Trading of Registered Interest and Principal of Securities
The notes to the financial statements are an integral part of this report.
Transamerica IDEX Mutual Funds
Annual Report 2005
7
TA IDEX Transamerica Value Balanced
STATEMENT OF ASSETS AND LIABILITIES
At October 31, 2005
(all amounts except per share amounts in thousands)
| Assets: | |
| Investment securities, at value (cost: $60,021) | | $ | 66,433 | | |
| Cash | | | 2,957 | | |
| Receivables: | |
| Investment securities sold | | | 145 | | |
| Shares of beneficial interest sold | | | 6 | | |
| Interest | | | 209 | | |
| Dividends | | | 52 | | |
| Other | | | 14 | | |
| | | | 69,816 | | |
| Liabilities: | |
| Investment securities purchased | | | 179 | | |
| Accounts payable and accrued liabilities: | |
| Shares of beneficial interest redeemed | | | 104 | | |
| Management and advisory fees | | | 46 | | |
| Distribution and service fees | | | 40 | | |
| Transfer agent fees | | | 25 | | |
| Administration fees | | | 1 | | |
| Written options (premiums $442) | | | 460 | | |
| Other | | | 29 | | |
| | | | 884 | | |
| Net Assets | | $ | 68,932 | | |
| Net Assets Consist of: | |
Shares of beneficial interest, unlimited shares
authorized, no par value | | $ | 64,461 | | |
| Accumulated net investment income (loss) | | | (12 | ) | |
Accumulated net realized gain (loss) from investment
securities and written options | | | (1,910 | ) | |
| Net unrealized appreciation (depreciation) on: | |
| Investment securities | | | 6,411 | | |
| Written option contracts | | | (18 | ) | |
| Net Assets | | $ | 68,932 | | |
| Net Assets by Class: | |
| Class A | | $ | 32,934 | | |
| Class B | | | 24,072 | | |
| Class C | | | 11,926 | | |
| Shares Outstanding: | |
| Class A | | | 2,757 | | |
| Class B | | | 2,021 | | |
| Class C | | | 1,001 | | |
| Net Asset Value Per Share: | |
| Class A | | $ | 11.95 | | |
| Class B | | | 11.91 | | |
| Class C | | | 11.91 | | |
| Maximum Offering Price Per Share (a): | |
| Class A | | $ | 12.65 | | |
(a) Includes the maximum selling commission (represented as a percentage of offering price) which is reduced on certain levels of sales as set forth in the Prospectus. Net asset value per share for Classes B and C shares represents offering price. The redemption price for Classes B and C shares equals net asset value less any applicable contingent deferred sales charge.
STATEMENT OF OPERATIONS
For the year ended October 31, 2005
(all amounts in thousands)
| Investment Income: | |
| Interest | | $ | 1,204 | | |
| Dividends | | | 1,512 | | |
| Income from loaned securities–net | | | 4 | | |
| | | | 2,720 | | |
| Expenses: | |
| Management and advisory fees | | | 569 | | |
| Distribution and service fees: | |
| Class A | | | 124 | | |
| Class B | | | 270 | | |
| Class C | | | 133 | | |
| Transfer agent fees: | |
| Class A | | | 105 | | |
| Class B | | | 86 | | |
| Class C | | | 31 | | |
| Printing and shareholder reports | | | 51 | | |
| Custody fees | | | 23 | | |
| Administration fees | | | 15 | | |
| Legal fees | | | 5 | | |
| Audit fees | | | 29 | | |
| Trustees fees | | | 4 | | |
| Registration fees: | |
| Class A | | | 9 | | |
| Class B | | | 9 | | |
| Class C | | | 1 | | |
| Other | | | 2 | | |
| Total expenses | | | 1,466 | | |
| Less: | |
| Reimbursement of class expenses: | |
| Class A | | | (15 | ) | |
| Class B | | | (18 | ) | |
| Total reimbursed expenses | | | (33 | ) | |
| Net expenses | | | 1,433 | | |
| Net Investment Income (Loss) | | | 1,287 | | |
| Net Realized Gain (Loss) from: | |
| Investment securities | | | 1,670 | | |
| Written option contracts | | | 692 | | |
| | | | 2,362 | | |
Net Increase (Decrease) in Unrealized
Appreciation (Depreciation) on: | |
| Investment securities | | | 2,071 | | |
| Written option contracts | | | (80 | ) | |
| | | | 1,991 | | |
Net Gain (Loss) on Investment Securities
and Written Options | | | 4,353 | | |
Net Increase (Decrease) in Net Assets Resulting
from Operations | | $ | 5,640 | | |
The notes to the financial statements are an integral part of this report.
Transamerica IDEX Mutual Funds
Annual Report 2005
8
TA IDEX Transamerica Value Balanced
STATEMENTS OF CHANGES IN NET ASSETS
For the years ended
(all amounts in thousands)
| | | October 31,
2005 | | October 31,
2004 | |
| Increase (Decrease) In Net Assets From: | |
| Operations: | |
| Net investment income (loss) | | $ | 1,287 | | | $ | 626 | | |
Net realized gain (loss) from
investment securities and
written options | | | 2,362 | | | | 6,043 | | |
Net unrealized appreciation
(depreciation) on investment
securities and written options | | | 1,991 | | | | (3,025 | ) | |
| | | | 5,640 | | | | 3,644 | | |
| Distributions to Shareholders: | |
| From net investment income: | |
| Class A | | | (738 | ) | | | (371 | ) | |
| Class B | | | (383 | ) | | | (186 | ) | |
| Class C | | | (199 | ) | | | (38 | ) | |
| Class C2 | | | – | | | | (17 | ) | |
| Class M | | | – | | | | (45 | ) | |
| | | | (1,320 | ) | | | (657 | ) | |
| From net realized gains: | |
| Class A | | | (2,499 | ) | | | – | | |
| Class B | | | (1,957 | ) | | | – | | |
| Class C | | | (975 | ) | | | – | | |
| | | | (5,431 | ) | | | – | | |
| Capital Share Transactions: | |
| Proceeds from shares sold: | |
| Class A | | | 2,804 | | | | 5,521 | | |
| Class B | | | 1,800 | | | | 3,631 | | |
| Class C | | | 820 | | | | 1,973 | | |
| Class C2 | | | – | | | | 471 | | |
| Class M | | | – | | | | 328 | | |
| | | | 5,424 | | | | 11,924 | | |
| Proceeds from fund acquisition: | |
| Class A | | | – | | | | 28,033 | | |
| Class B | | | – | | | | 16,163 | | |
| Class C | | | – | | | | 384 | | |
| Class C2 | | | – | | | | 2,604 | | |
| Class M | | | – | | | | 3,202 | | |
| | | | – | | | | 50,386 | | |
Dividends and distributions
reinvested: | |
| Class A | | | 3,170 | | | | 359 | | |
| Class B | | | 2,252 | | | | 180 | | |
| Class C | | | 1,130 | | | | 36 | | |
| Class C2 | | | – | | | | 16 | | |
| Class M | | | – | | | | 43 | | |
| | | | 6,552 | | | | 634 | | |
| Cost of shares redeemed: | |
| Class A | | $ | (11,118 | ) | | | (10,214 | ) | |
| Class B | | | (7,807 | ) | | | (4,870 | ) | |
| Class C | | | (4,095 | ) | | | (1,054 | ) | |
| Class C2 | | | – | | | | (803 | ) | |
| Class M | | | – | | | | (921 | ) | |
| | | | (23,020 | ) | | | (17,862 | ) | |
| Class level exchanges: | |
| Class C | | | – | | | | 12,159 | | |
| Class C2 | | | – | | | | (6,063 | ) | |
| Class M | | | – | | | | (6,096 | ) | |
| | | | – | | | | – | | |
| | | October 31,
2005 | | October 31,
2004 | |
| Automatic conversions: | |
| Class A | | $ | 1,188 | | | $ | 572 | | |
| Class B | | | (1,188 | ) | | | (572 | ) | |
| | | | – | | | | – | | |
| | | | (11,044 | ) | | | 45,082 | | |
| Net increase (decrease) in net assets | | | (12,155 | ) | | | 48,069 | | |
| Net Assets: | |
| Beginning of year | | | 81,087 | | | | 33,018 | | |
| End of year | | $ | 68,932 | | | $ | 81,087 | | |
Accumulated Net Investment Income
(Loss) | | $ | (12 | ) | | $ | (12 | ) | |
| Share Activity: | |
| Shares issued: | |
| Class A | | | 236 | | | | 467 | | |
| Class B | | | 152 | | | | 309 | | |
| Class C | | | 69 | | | | 166 | | |
| Class C2 | | | – | | | | 40 | | |
| Class M | | | – | | | | 26 | | |
| | | | 457 | | | | 1,008 | | |
| Shares issued on fund acquisition: | |
| Class A | | | – | | | | 2,371 | | |
| Class B | | | – | | | | 1,372 | | |
| Class C | | | – | | | | 33 | | |
| Class C2 | | | – | | | | 221 | | |
| Class M | | | – | | | | 271 | | |
| | | | – | | | | 4,268 | | |
Shares issued–reinvested from
distributions: | |
| Class A | | | 267 | | | | 30 | | |
| Class B | | | 191 | | | | 15 | | |
| Class C | | | 96 | | | | 3 | | |
| Class C2 | | | – | | | | 1 | | |
| Class M | | | – | | | | 4 | | |
| | | | 554 | | | | 53 | | |
| Shares redeemed: | |
| Class A | | | (934 | ) | | | (858 | ) | |
| Class B | | | (658 | ) | | | (411 | ) | |
| Class C | | | (347 | ) | | | (89 | ) | |
| Class C2 | | | – | | | | (67 | ) | |
| Class M | | | – | | | | (77 | ) | |
| | | | (1,939 | ) | | | (1,502 | ) | |
| Class level exchanges: | |
| Class C | | | – | | | | 1,024 | | |
| Class C2 | | | – | | | | (513 | ) | |
| Class M | | | – | | | | (509 | ) | |
| | | | – | | | | 2 | | |
| Automatic conversions: | |
| Class A | | | 100 | | | | 48 | | |
| Class B | | | (100 | ) | | | (48 | ) | |
| | | | – | | | | – | | |
Net increase (decrease) in
shares outstanding: | |
| Class A | | | (331 | ) | | | 2,058 | | |
| Class B | | | (415 | ) | | | 1,237 | | |
| Class C | | | (182 | ) | | | 1,137 | | |
| Class C2 | | | – | | | | (318 | ) | |
| Class M | | | – | | | | (285 | ) | |
| | | | (928 | ) | | | 3,829 | | |
The notes to the financial statements are an integral part of this report.
Transamerica IDEX Mutual Funds
Annual Report 2005
9
TA IDEX Transamerica Value Balanced
FINANCIAL HIGHLIGHTS
| | | | | For a share of beneficial interest outstanding throughout each period | |
| | | | | Net Asset | | Investment Operations | | Distributions | | Net Asset | |
| | | For the
Period
Ended (d)(g) | | Value,
Beginning
of Period | | Net
Investment
Income (Loss) | | Net Realized
and Unrealized
Gain (Loss) | | Total
Operations | | From Net
Investment
Income | | From Net
Realized
Gains | | Total
Distributions | | Value,
End
of Period | |
| Class A | | 10/31/2005 | | $ | 12.11 | | | $ | 0.24 | | | $ | 0.69 | | | $ | 0.93 | | | $ | (0.25 | ) | | $ | (0.84 | ) | | $ | (1.09 | ) | | $ | 11.95 | | |
| | | 10/31/2004 | | | 11.49 | | | | 0.18 | | | | 0.61 | | | | 0.79 | | | | (0.17 | ) | | | – | | | | (0.17 | ) | | | 12.11 | | |
| | | 10/31/2003 | | | 9.69 | | | | 0.18 | | | | 1.83 | | | | 2.01 | | | | (0.21 | ) | | | – | | | | (0.21 | ) | | | 11.49 | | |
| | | 10/31/2002 | | | 11.67 | | | | 0.18 | | | | (1.65 | ) | | | (1.47 | ) | | | (0.16 | ) | | | (0.35 | ) | | | (0.51 | ) | | | 9.69 | | |
| | | 10/31/2001 | | | 12.75 | | | | 0.26 | | | | (0.51 | ) | | | (0.25 | ) | | | (0.26 | ) | | | (0.57 | ) | | | (0.83 | ) | | | 11.67 | | |
| Class B | | 10/31/2005 | | | 12.07 | | | | 0.17 | | | | 0.68 | | | | 0.85 | | | | (0.17 | ) | | | (0.84 | ) | | | (1.01 | ) | | | 11.91 | | |
| | | 10/31/2004 | | | 11.46 | | | | 0.10 | | | | 0.61 | | | | 0.71 | | | | (0.10 | ) | | | – | | | | (0.10 | ) | | | 12.07 | | |
| | | 10/31/2003 | | | 9.69 | | | | 0.11 | | | | 1.80 | | | | 1.91 | | | | (0.14 | ) | | | – | | | | (0.14 | ) | | | 11.46 | | |
| | | 10/31/2002 | | | 11.66 | | | | 0.11 | | | | (1.65 | ) | | | (1.54 | ) | | | (0.08 | ) | | | (0.35 | ) | | | (0.43 | ) | | | 9.69 | | |
| | | 10/31/2001 | | | 12.74 | | | | 0.18 | | | | (0.50 | ) | | | (0.32 | ) | | | (0.19 | ) | | | (0.57 | ) | | | (0.76 | ) | | | 11.66 | | |
| Class C | | 10/31/2005 | | | 12.07 | | | | 0.17 | | | | 0.69 | | | | 0.86 | | | | (0.18 | ) | | | (0.84 | ) | | | (1.02 | ) | | | 11.91 | | |
| | | 10/31/2004 | | | 11.46 | | | | 0.11 | | | | 0.60 | | | | 0.71 | | | | (0.10 | ) | | | – | | | | (0.10 | ) | | | 12.07 | | |
| | | 10/31/2003 | | | 9.71 | | | | 0.12 | | | | 1.77 | | | | 1.89 | | | | (0.14 | ) | | | – | | | | (0.14 | ) | | | 11.46 | | |
| | | | | | | Ratios/Supplemental Data | |
| | | For the
Period | | Total | | Net Assets,
End of
Period | | Ratio of Expenses
to Average
Net Assets (a) | | Net Investment
Income (Loss)
to Average | | Portfolio
Turnover | |
| | | Ended (g) | | Return (c) | | (000's) | | Net (e) | | Total (f) | | Net Assets (a) | | Rate (b) | |
| Class A | | 10/31/2005 | | | 7.79 | % | | $ | 32,934 | | | | 1.55 | % | | | 1.59 | % | | | 2.03 | % | | | 57 | % | |
| | | 10/31/2004 | | | 6.99 | | | | 37,393 | | | | 1.55 | | | | 1.63 | | | | 1.50 | | | | 122 | | |
| | | 10/31/2003 | | | 21.04 | | | | 11,832 | | | | 1.55 | | | | 2.20 | | | | 1.75 | | | | 50 | | |
| | | 10/31/2002 | | | (13.20 | ) | | | 11,020 | | | | 1.55 | | | | 1.89 | | | | 1.56 | | | | 82 | | |
| | | 10/31/2001 | | | (2.13 | ) | | | 13,880 | | | | 1.55 | | | | 1.95 | | | | 2.04 | | | | 50 | | |
| Class B | | 10/31/2005 | | | 7.13 | | | | 24,072 | | | | 2.20 | | | | 2.27 | | | | 1.39 | | | | 57 | | |
| | | 10/31/2004 | | | 6.23 | | | | 29,409 | | | | 2.20 | | | | 2.30 | | | | 0.81 | | | | 122 | | |
| | | 10/31/2003 | | | 19.98 | | | | 13,744 | | | | 2.20 | | | | 2.85 | | | | 1.10 | | | | 50 | | |
| | | 10/31/2002 | | | (13.72 | ) | | | 12,038 | | | | 2.20 | | | | 2.54 | | | | 0.91 | | | | 82 | | |
| | | 10/31/2001 | | | (2.74 | ) | | | 16,180 | | | | 2.20 | | | | 2.60 | | | | 1.39 | | | | 50 | | |
| Class C | | 10/31/2005 | | | 7.18 | | | | 11,926 | | | | 2.16 | | | | 2.16 | | | | 1.43 | | | | 57 | | |
| | | 10/31/2004 | | | 6.31 | | | | 14,285 | | | | 2.20 | | | | 2.39 | | | | 0.78 | | | | 122 | | |
| | | 10/31/2003 | | | 19.73 | | | | 530 | | | | 2.20 | | | | 2.86 | | | | 1.10 | | | | 50 | | |
NOTES TO FINANCIAL HIGHLIGHTS
(a) Annualized.
(b) Not annualized.
(c) Total Return has been calculated for the applicable period without deduction of a sales load, if any, on an initial purchase. Periods of less that one year are not annualized.
(d) Per share information is calculated based on average number of shares outstanding.
(e) Ratio of Net Expenses to Average Net Assets is net of fee waivers and reimbursements by the investment adviser, if any (see note 2).
(f) Ratio of Total Expenses to Average Net Assets includes all expenses before fee waivers and reimbursements by the investment adviser.
(g) The inception date for the Fund's offering of share Class C was November 11, 2002.
The notes to the financial statements are an integral part of this report.
Transamerica IDEX Mutual Funds
Annual Report 2005
10
TA IDEX Transamerica Value Balanced
NOTES TO FINANCIAL STATEMENTS
At October 31, 2005
(all amounts in thousands)
NOTE 1. ORGANIZATION AND SIGNIFICANT ACCOUNTING POLICIES
Transamerica IDEX Mutual Funds is an open-end management investment company registered under the Investment Company Act of 1940, as amended (the "1940 Act").
In the normal course of business, TA IDEX Transamerica Value Balanced (the "Fund") enters into contracts that contain a variety of representations that provide general indemnifications. The Fund's maximum exposure under these arrangements is unknown, as this would involve future claims that may be made against the Fund and/or its affiliates that have not yet occurred. However, based on experience, the Fund expects the risk of loss to be remote.
This report should be read in conjunction with the current Fund prospectus, which contains more complete information about the Fund.
The following is a summary of significant accounting policies followed by the Fund in the preparation of the financial statements. In preparing the Fund's financial statements in accordance with accounting principles generally accepted in the United States of America ("GAAP"), estimates or assumptions (which could differ from actual results) may be used that affect reported amounts and disclosures.
On May 28, 2004, the Fund acquired all of the net assets of TA IDEX LKCM Strategic Total Return pursuant to a plan of reorganization. TA IDEX Transamerica Value Balanced is the accounting survivor. The acquisition was accomplished by a tax free exchange of 4,268 shares of the Fund for 2,942 shares of TA IDEX LKCM Strategic Total Return outstanding on May 27, 2004. TA IDEX LKCM Strategic Total Return's net assets at that date, $50,386, including $6,071 unrealized depreciation, were combined with those of the Fund. The aggregate net assets of TA IDEX Transamerica Value Balanced immediately before the acquisition was $37,187. The combined net assets of the Fund immediately after the acquisition was $87,573. Proceeds in connection with the acquisition were as follows:
| | | Shares | | Amount | |
| Proceeds in connection with the acquisition | |
| Class A | | | 2,371 | | | $ | 28,033 | | |
| Class B | | | 1,372 | | | | 16,163 | | |
| Class C | | | 33 | | | | 384 | | |
| Class C2 | | | 221 | | | | 2,604 | | |
| Class M | | | 271 | | | | 3,202 | | |
| | | | | | | $ | 50,386 | | |
Multiple class operations, income and expenses: The Fund currently offers three classes of shares, each with a public offering price that reflects different sales charges, if any, and expense levels. On June 15, 2004, Class C2 shares merged into Class C. On September 24, 2004, Class M shares merged into Class C. Class B shares will convert to Class A shares eight years after purchase. Income, non-class specific expenses and realized and unrealized gains and losses, are allocated daily to each class, based upon the value of shares outstanding method as permitted under Rule 18f-3 of the 1940 Act. Each class bears its own specific expenses as well as a portion of general, common expenses.
Security valuations: The Fund values its investments at the close of the New York Stock Exchange ("NYSE"), normally 4 p.m. ET, each day the NYSE is open for business. Fund investments are valued at the last sale price or closing price on the day of valuation taken from the primary exchange where the security is principally traded.
Securities traded in the over-the-counter market and listed securities for which no sale was reported on that date are valued at the last quoted bid price.
Debt securities are valued based on a price quotation or other equivalent indication of value supplied by an exchange, a pricing service or a major market maker.
Other securities for which quotations are not readily available or whose values have been determined to be unreliable are valued at fair market value as determined in good faith by the Fund's Administrative Valuation Committee, under the supervision of the Board's Valuation Committee, using guidelines adopted by the Board of Trustees.
Cash: The Fund may leave cash overnight in its cash account with the custodian, Investors Bank & Trust Company ("IBT"). IBT has been contracted on behalf of the Fund to invest the excess cash into a savings account, which at October 31, 2005, was paying an interest rate of 2.76%.
Commission recapture: The sub-adviser, to the extent consistent with the best execution and usual commission rate policies and practices, may place security transactions of the Fund with broker/dealers with which Transamerica IDEX Mutual Funds has established a Commission Recapture Program. A Commission Recapture Program is any arrangement under which a broker/dealer applies a portion of the commissions received by such broker/dealer on the security transactions to the Fund. In no event will commissions paid by the Fund be used to pay expenses that would otherwise be borne by any other funds within Transamerica IDEX Mutual Funds, or by any other party.
Recaptured commissions during the year ended October 31, 2005, of $8 are included in net realized gains in the Statement of Operations.
Real Estate Investment Trusts ("REITs"): There are certain additional risks involved in investing in REITs. These include, but are not limited to, economic conditions, changes in zoning laws, real estate values, property taxes and interest rates.
Transamerica IDEX Mutual Funds
Annual Report 2005
11
TA IDEX Transamerica Value Balanced
NOTES TO FINANCIAL STATEMENTS (continued)
At October 31, 2005
(all amounts in thousands)
NOTE 1.–(continued)
Dividend income is recorded at management's estimate of the income included in distributions from the REIT investments. Distributions received in excess of the estimated amount are recorded as a reduction of the cost of investments. The actual amounts of income, return of capital and capital gains are only determined by each REIT after the fiscal year end and may differ from the estimated amounts.
Security transactions and investment income: Security transactions are recorded on the trade date. Security gains and losses are calculated on the specific identification basis. Dividend income, if any, is recorded on the ex-dividend date or, in the case of foreign securities, as soon as the Fund is informed of the ex-dividend date. Interest income, including accretion of discounts and amortization of premiums, is recorded on the accrual basis commencing on the settlement date.
Option contracts: The Fund may enter into options contracts to manage exposure to market fluctuations. Options are valued at the average of the bid and ask ("Mean Quote") established each day at the close of the board of trade or exchange on which they are traded. The primary risks associated with options are imperfect correlation between the change in value of the securities held and the prices of the options contracts; the possibility of an illiquid market and inability of the counterparty to meet the contracts terms. When the Fund writes a covered call or put option, an amount equal to the premium received by the Fund is included in the Fund's Statement of Assets and Liabilities as an asset and as an equivalent liability. Options are marked-to-market daily to reflect the current value of the option written.
The underlying face amounts of open option contracts at October 31, 2005, are listed in the Schedule of Investments.
Transactions in written call and put options were as follows:
| | | Premium | | Contracts* | |
| Beginning Balance 10/31/2004 | | $ | 837 | | | | 6,025 | | |
| Sales | | | 659 | | | | 4,789 | | |
| Closing Buys | | | (127 | ) | | | (653 | ) | |
| Expirations | | | (692 | ) | | | (5,205 | ) | |
| Exercised | | | (235 | ) | | | (2,240 | ) | |
| Balance at 10/31/2005 | | $ | 442 | | | | 2,716 | | |
* Contracts not in thousands
Redemption fees: A short-term trading redemption fee may be assessed on any Fund shares in a fund account that are sold during the first five (5) NYSE trading days following their purchase date. This redemption fee will equal 2% of the amount redeemed and shares held the longest will be treated as being redeemed first and shares held the shortest as being redeemed last. For the year ended October 31, 2005, the Fund received less than $1 in redemption fees.
Dividend distributions: Distributions to shareholders are recorded on the ex-dividend date and are determined in accordance with Federal income tax regulations which may differ from GAAP.
NOTE 2. RELATED PARTY TRANSACTIONS
Effective January 1, 2005 AEGON/Transamerica Fund Advisors, Inc. was renamed Transamerica Fund Advisors, Inc. ("TFAI"); AEGON/Transamerica Fund Services, Inc. and AEGON/Transamerica Investor Services, Inc. merged into one entity and was renamed Transamerica Fund Services, Inc. ("TFS").
TFAI is the Fund's investment adviser. TFS is the Fund's administrator and transfer agent. AFSG Securities Corp. ("AFSG") is the Fund's distributor/principal underwriter. TFAI, TFS , and AFSG are affiliates of AEGON, NV, a Netherlands corporation.
Transamerica Investment Management, LLC is both an affiliate of the Fund and a sub-adviser to the Fund.
Investment advisory fees: The Fund pays management fees to TFAI based on average daily net assets ("ANA") at the following breakpoints:
0.75% of the first $500 million of ANA
0.65% of the next $500 million of ANA
0.60% of ANA over $1 billion
TFAI has contractually agreed to waive its advisory fee and will reimburse the Fund to the extent that operating expenses, excluding 12b-1 fees, exceed the following stated annual limit:
1.20% Expense Limit
Distribution and service fees: The Fund has a 12b-1 distribution plan under the 1940 Act pursuant to which an annual fee, based on average daily net assets, is paid to the distributor for various disbursements such as broker-dealer account servicing fees and other promotional expenses of the Fund. The Fund is authorized under the 12b-1 plan to pay fees on each class up to the following limits:
| Class A | | | 0.35 | % | |
| Class B | | | 1.00 | % | |
| Class C | | | 1.00 | % | |
In the case the Fund or a class of shares of the Fund is closed to new investors or investments, the Fund is authorized to pay 12b-1 fees for past sales and distribution efforts and present and past investor services.
Underwriter commissions relate to front-end sales charges imposed for Class A shares and contingent deferred sales charges from Classes B, C,
Transamerica IDEX Mutual Funds
Annual Report 2005
12
TA IDEX Transamerica Value Balanced
NOTES TO FINANCIAL STATEMENTS (continued)
At October 31, 2005
(all amounts in thousands)
NOTE 2.–(continued)
and certain A share redemptions. For the year ended October 31, 2005, the underwriter commissions were as follows:
| Received by Underwriter | | $ | 127 | | |
| Retained by Underwriter | | | 10 | | |
| Contingent Deferred Sales Charge | | | 62 | | |
Administrative services: The Fund has entered into an agreement with TFS for financial and legal fund administration services. As of January 1, 2005 the Fund pays TFS an annual fee of 0.02% of ANA. Prior to January 1, 2005 the Fund paid TFS an annual fee of 0.015% of ANA. The Legal fees on the Statement of Operations are for fees paid to external legal counsel.
Transfer agent fees: The Fund pays TFS an annual per-account charge for each open and closed account. The Fund paid TFS $206 for the year ended October 31, 2005.
Deferred compensation plan: Each eligible independent Fund Trustee may elect to participate in a non-qualified deferred compensation plan maintained by Transamerica IDEX Mutual Funds (the "Plan"). Under the Plan, such Trustees may defer payment of all or a portion of their total fees earned as a Fund Trustee. Each Trustee who is a participant in the Plan may elect that the earnings, losses or gains credited to his or her deferred fee amounts be determined based on a deemed investment in any series of Transamerica IDEX Mutual Funds, including the Fund. The right of a participant to receive a distribution from the Plan of the deferred fees is an unsecured claim against the general assets of all series of Transamerica IDEX Mutual Funds. The pro rata liability to the Fund of all deferred fees in the Plan amounted, as of October 31, 2005, to $14.
NOTE 3. INVESTMENT TRANSACTIONS
The cost of securities purchased and proceeds from securities sold (excluding short-term securities) for the year ended October 31, 2005, were as follows:
| Purchases of securities: | |
| Long-Term | | $ | 25,090 | | |
| U.S. Government | | | 17,025 | | |
| Proceeds from maturities and sales of securities: | |
| Long-Term | | | 35,976 | | |
| U.S. Government | | | 21,300 | | |
NOTE 4. FEDERAL INCOME TAX MATTERS
The Fund has not made any provision for federal income or excise taxes due to its policy to distribute all of its taxable income and capital gains to its shareholders and otherwise qualify as a regulated investment company under Subchapter M of the Internal Revenue Code. Income and capital gain distributions are determined in accordance with income tax regulations, which may differ from GAAP. These differences are primarily due to differing treatment for items including, but not limited to, wash sales, excess distributions and capital loss carryforwards.
Therefore, distributions determined in accordance with tax regulations may differ significantly in amount or character from net investment income and realized gains for financial reporting purposes. Financial reporting records are adjusted for permanent book/tax differences to reflect tax character. Financial records are not adjusted for temporary differences. These reclassifications are as follows:
Shares of beneficial interest, unlimited
shares authorized | | $ | (33 | ) | |
| Accumulated net investment income (loss) | | | 33 | | |
The capital loss carryforward is available to offset future realized capital gains through the period listed:
Capital Loss
Carryforward | | Available through | |
| $ | 2,658 | | | October 31, 2010 | |
The capital loss carryforward utilized during the year ended
October 31, 2005 was $1,558.
The tax character of distributions paid may differ from the character of distributions shown in the Statement of Changes in Net Assets due to short-term gains being treated as ordinary income for tax purposes. The tax character of distributions paid during 2004 and 2005 was as follows:
| 2004 Distributions paid from: | |
| Ordinary Income | | $ | 657 | | |
| Long-term Capital Gain | | | – | | |
| 2005 Distributions paid from: | |
| Ordinary Income | | | 1,320 | | |
| Long-term Capital Gain | | | 5,431 | | |
The tax basis components of distributable earnings as of October 31, 2005, are as follows:
| Undistributed Ordinary Income | | $ | – | | |
| Undistributed Long-term Capital Gains | | $ | 982 | | |
| Capital Loss Carryforward | | $ | (2,658 | ) | |
| Net Unrealized Appreciation (Depreciation) | | $ | 6,159 | * | |
* Amount includes unrealized appreciation (depreciation) from derivative instruments and deferred compensation.
The aggregate cost of investments and composition of unrealized appreciation (depreciation) for federal income tax purposes as of October 31, 2005, are as follows:
| Federal Tax Cost Basis | | $ | 60,255 | | |
| Unrealized Appreciation | | $ | 7,627 | | |
| Unrealized (Depreciation) | | | (1,449 | ) | |
| Net Unrealized Appreciation (Depreciation) | | $ | 6,178 | | |
Transamerica IDEX Mutual Funds
Annual Report 2005
13
TA IDEX Transamerica Value Balanced
NOTES TO FINANCIAL STATEMENTS (continued)
At October 31, 2005
(all amounts in thousands)
NOTE 5. REGULATORY PROCEEDINGS
There continues to be significant federal and state regulatory activity relating to financial services companies, particularly mutual fund companies and their investment advisers. As part of an ongoing investigation regarding potential market timing, recordkeeping and trading compliance issues and matters affecting the Fund's investment adviser, TFAI, and certain affiliates and former employees of TFAI, the SEC staff has indicated that it is likely to take some action against TFAI and certain of its affiliates at the conclusion of the investigation. The potential timing and the scope of any such action is difficult to predict. Although the impact of any action brought against TFAI and/or its affiliates is difficult to assess at the present time, the Fund currently believes that the likelihood that any such action will have a material adverse impact on it is remote. It is important to note that the Fund is not aware of any allega tion of wrongdoing against it and its Board at the time this annual report is printed. Although it is not anticipated that these developments will have an adverse impact on the Fund, there can be no assurance at this time. TFAI and its affiliates are actively working with the SEC in regard to this matter; however, the exact resolution cannot be determined at this time. TFAI will take such actions that it deems necessary or appropriate to continue providing management services to the Fund and to bring all matters to an appropriate conclusion.
TFAI and/or its affiliates, and not the Fund, will bear the costs regarding these regulatory matters.
Transamerica IDEX Mutual Funds
Annual Report 2005
14
Report of Independent Registered Certified Public Accounting Firm
To the Board of Trustees and Shareholders of
TA IDEX Transamerica Value Balanced
In our opinion, the accompanying statement of assets and liabilities, including the schedule of investments, and the related statements of operations and of changes in net assets and the financial highlights present fairly, in all material respects, the financial position of TA IDEX Transamerica Value Balanced (the "Fund") (one of the portfolios constituting the Transamerica IDEX Mutual Funds) at October 31, 2005, the results of its operations for the year then ended, the changes in its net assets for each of the two years in the period then ended and the financial highlights for each of the periods presented, in conformity with accounting principles generally accepted in the United States of America. These financial statements and financial highlights (hereafter referred to as "financial statements") are the responsibility of the Fund's management; our responsibility is to express an opinion on these financial statements based on our audits. We conducted our audits of these financial statements in accordance with the standards of the Public Company Accounting Oversight Board (United States). Those standards require that we plan and perform the audit to obtain reasonable assurance about whether the financial statements are free of material misstatement. An audit includes examining, on a test basis, evidence supporting the amounts and disclosures in the financial statements, assessing the accounting principles used and significant estimates made by management, and evaluating the overall financial statement presentation. We believe that our audits, which included confirmation of securities at October 31, 2005 by correspondence with the custodian, provide a reasonable basis for our opinion.

December 22, 2005
Transamerica IDEX Mutual Funds
Annual Report 2005
15
TA IDEX Transamerica Value Balanced
SUPPLEMENTAL INFORMATION (unaudited)
TAX INFORMATION
For dividends paid during the year ended October 31, 2005, the Fund designated $1,556 as qualified dividend income.
For corporate shareholders, 83% of investment income (dividend income plus short-term gains, if any) qualifies for the dividends received deduction.
For tax purposes, the Fund has made a Long-Term Capital Gain Designation of $5,464 for the year ended October 31, 2005.
The information and distributions reported herein may differ from the information and distributions taxable to the shareholders for the calendar year ending December 31, 2005. Complete information will be computed and reported in conjunction with your 2005 Form 1099-DIV.
Transamerica IDEX Mutual Funds
Annual Report 2005
16
TA IDEX UBS Large Cap Value
MARKET ENVIRONMENT
The eleven and a half months since the Fund's inception marked a rather volatile period for equity markets, albeit one of solid absolute and relative performance for the portfolio. The major concern for most investors over the period was the soaring price of oil, which in August, in the wake of Hurricane Katrina, hit an all-time high of more than $70 a barrel. The 2005 hurricane season devastated America's Gulf Coast, causing an estimated $100 billion worth of damage in New Orleans alone. A number of refineries in the region are expected to remain offline until early next year, and the resulting shortage in capacity played a large role in the dramatic spike in gasoline prices.
The Federal Reserve Board ("Fed") continued its tightening policy by raising interest rates 25 basis points in each of eight meetings during the reporting period, bringing the federal funds rate to 3.75%. Despite these less-than-ideal conditions, the underlying economy remained strong, with the Gross Domestic Product ("GDP") estimates showing a healthy growth rate while corporate profitability remained high.
PERFORMANCE
For the period from inception November 8, 2004 through October 31, 2005, TA IDEX UBS Large Cap Value, Class I returned 9.60%. By comparison its benchmark, the Russell 1000 Value Index, returned 8.36%.
STRATEGY REVIEW
Given the economic environment during the period, we positioned the portfolio to take advantage of attractive opportunities primarily on a bottom-up basis, avoiding large sector or industry bets. Stock selection, as a result, was particularly significant and benefited the portfolio's performance. On an industry level, the portfolio's holdings in the construction industry performed particularly well, while the portfolio's underweight exposure to energy detracted from relative returns.
We exited our position in Pfizer Inc. ("Pfizer") earlier in the year due in part to our belief that generic medicines will put downward pressure on future earnings. We also have concerns regarding Pfizer's late stage product pipeline, and the prospects for several of its key remedies. Our limited exposure to the stock, to which the benchmark index had significant exposure, benefited performance.
Despite the crippling effects of the gulf storms and continued volatility in crude oil prices, Marathon Oil Corporation announced recently that it expects the $300 million expansion and clean fuels project at its Detroit refinery to be complete by the middle of November. The project will expand significantly the refinery's production capacity.
UnitedHealth Group Incorporated ("UnitedHealth") was another top contributor to performance. The health care insurer announced it would be acquiring PacifiCare Health Systems ("PacifiCare"), a major Medicare provider. The PacifiCare acquisition gives UnitedHealth, which is predominantly located on the West Coast, a national network and a closer connection to government-related business.
Shares of travel company Expedia, Inc. ("Expedia") traded down after being spun off from IAC/InterActiveCorp. We, however, continue to believe Expedia is undervalued as they continue to develop revenue streams through hotel agreements. The hurricane season is expected to have a limited impact on bookings growth and customer service costs for Expedia.
Mortgage giant Freddie Mac announced recently that earnings for the first half of 2005 declined nearly 60% compared to the same period a year earlier. The earnings drop was due mainly to lower interest income caused by changes in interest rates. It was also reported during the quarter that a bill was being proposed in the U.S. Senate to sharply reduce the company's mortgage portfolio.
Altria Group, Inc.'s ("Altria") stock rose after the Illinois Supreme Court tossed out a billion-dollar verdict, giving a possible preview of its stance in a somewhat similar case involving Altria. Additionally, the acquisition of an Indonesian cigarette company led the US-based food-and-tobacco titan to raise its full-year earnings forecast. Not owning the stock, which was held in the benchmark index, detracted from the portfolio's relative performance.
The damage caused in the southern states by the 2005 hurricane season has added a large degree of uncertainty to near-term economic forecasts, and the recent broad-based increase in energy prices (partially due to the hurricanes) poses a threat to short-term growth in the U.S. and elsewhere. Nonetheless, we continue to underweight the energy sector as we believe the price of crude oil and many other commodities are well in excess of equilibrium.
Investment Team
UBS Global Asset Management (Americas) Inc.
This Fund is only available for investment by the Asset Allocation Portfolios.
Transamerica IDEX Mutual Funds
Annual Report 2005
1
TA IDEX UBS Large Cap Value
Comparison of change in value of $10,000 investment in Class I shares and its comparative index.

Total Return for Period Ended 10/31/05
| | | From
Inception | | Inception
Date | |
| Class A (NAV) | | | 4.79 | % | | 3/1/05 | |
| Class I (NAV) | | | 9.60 | % | | 11/8/04 | |
| Russell 1000 Value1 | | | 8.36 | % | | 11/8/04 | |
NOTES
1 The Russell 1000 Value (Russell 1000 Value) Index is an unmanaged index used as a general measure of market performance. Calculations assume dividends and capital gains are reinvested and do not include any managerial expenses. From inception calculation is based on life of Class I shares. Source: Standard & Poor's Micropal®© Micropal, Inc. 2005 – 1-800-596-5323 – http://www.funds-sp.com.
The performance data presented represents past performance, future results may vary. Performance data does not reflect the deduction of taxes that would be paid on fund distributions or the redemption of fund shares. Investment return and principal value will fluctuate so that an investor's shares, when redeemed, may be worth more or less than their original cost. Current performance may be lower or higher than performance quoted. Please see www.transamericaidex.com for performance data current to the most recent month-end.
Net Asset Value (NAV) returns include the reinvestment of dividends and capital gains. Class A shares are sold without a sales load.
This material must be preceded or accompanied by a current prospectus, which includes specific contents regarding the investment objectives and policies of this fund.
Transamerica IDEX Mutual Funds
Annual Report 2005
2
TA IDEX UBS Large Cap Value
UNDERSTANDING YOUR FUND'S EXPENSES
(unaudited)
SHAREHOLDER EXPENSES
Fund shareholders may incur ongoing costs, including management fees, 12b-1 distribution and service fees, and other fund expenses. Shares of the fund currently are sold only to certain Transamerica IDEX Mutual Funds and AEGON/Transamerica Series Trust (an affiliate of Transamerica IDEX Mutual Funds) asset allocation funds at net asset value, without any transactional costs.
The following Example is intended to help you understand your ongoing costs (in dollars and cents) of investing in a Fund and to compare these costs with the ongoing costs of investing in other funds.
The Example is based on an investment of $1,000 invested at May 1, 2005 and held for the entire period until October 31, 2005.
ACTUAL EXPENSES
The first line in the table below provides information about actual account values and actual expenses. You may use the information in this line, together with the amount you invested, to estimate the expenses that you paid over the period. Simply divide your account value by $1,000 (for example, an $8,600 account value divided by $1,000 = 8.6), then multiply the result by the number in the first line of your Fund under the heading entitled "Expenses Paid During Period" to estimate the expenses you paid on your account during this period.
HYPOTHETICAL EXAMPLE FOR COMPARISON PURPOSES
The second line in the table below provides information about hypothetical account values and hypothetical expenses based on the Fund's actual expense ratio and an assumed rate of return of 5% per year before expenses, which is not the Fund's actual return. The hypothetical account values and expenses may not be used to estimate the actual ending account balance or expenses you paid for the period. You may use this information to compare the ongoing costs of investing in your Fund and other funds. To do so, compare this 5% hypothetical example with the 5% hypothetical examples that appear in the shareholder reports of the other funds.
Please note that the expenses shown in the table are meant to highlight your ongoing costs only and do not reflect any transactional costs, such as sales charges, redemption fees, brokerage commissions paid on purchases and sales of fund shares. Therefore, the second line under the Fund in the table is useful in comparing ongoing costs only, and will not help you determine the relative total costs of owning different funds.
| | | Beginning
Account
Value | | Ending
Account
Value | | Annualized
Expense
Ratio | | Expenses Paid
During Period (a) | |
| Class A | |
| Actual | | $ | 1,000.00 | | | $ | 1,067.40 | | | | 1.32 | % | | $ | 6.88 | | |
| Hypothetical (b) | | | 1,000.00 | | | | 1,018.55 | | | | 1.32 | | | | 6.72 | | |
| Class I | |
| Actual | | | 1,000.00 | | | | 1,069.30 | | | | 0.92 | | | | 4.80 | | |
| Hypothetical (b) | | | 1,000.00 | | | | 1,020.57 | | | | 0.92 | | | | 4.69 | | |
(a) Expenses are calculated using each Fund's annualized expense ratio (as disclosed in the table), multiplied by the average account value for the period, multiplied by number of days in the period (184 days), and divided by the number of days in the year (365 days).
(b) 5% return per year before expenses.
GRAPHICAL PRESENTATION OF SCHEDULE OF INVESTMENTS
By Sector
At October 31, 2005
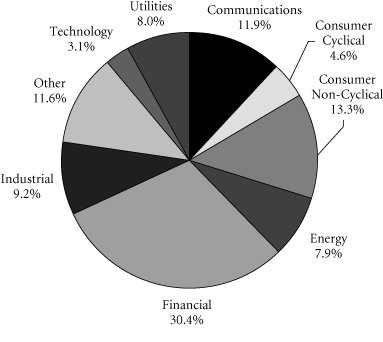
This chart shows the percentage breakdown by sector of the Fund's total investment securities.
Transamerica IDEX Mutual Funds
Annual Report 2005
3
TA IDEX UBS Large Cap Value
SCHEDULE OF INVESTMENTS
At October 31, 2005
(all amounts except share amounts in thousands)
| | | Shares | | Value | |
| COMMON STOCKS (98.9%) | |
| Aerospace (2.9%) | |
| Lockheed Martin Corp. | | | 47,800 | | | $ | 2,895 | | |
| Northrop Grumman Corp. | | | 34,100 | | | | 1,829 | | |
| Air Transportation (1.6%) | |
| FedEx Corp. | | | 29,500 | | | | 2,712 | | |
| Business Credit Institutions (2.5%) | |
| Freddie Mac | | | 67,300 | | | | 4,129 | | |
| Business Services (3.7%) | |
| Cendant Corp. | | | 59,700 | | | | 1,040 | | |
| Clear Channel Communications, Inc. | | | 54,300 | | | | 1,652 | | |
| Omnicom Group, Inc. † | | | 42,200 | | | | 3,501 | | |
| Commercial Banks (22.0%) | |
| Bank of America Corp. | | | 62,000 | | | | 2,712 | | |
| Citigroup, Inc. | | | 151,300 | | | | 6,926 | | |
| Fifth Third Bancorp | | | 98,700 | | | | 3,965 | | |
| JP Morgan Chase & Co. | | | 193,500 | | | | 7,086 | | |
| Mellon Financial Corp. | | | 112,400 | | | | 3,562 | | |
| Northern Trust Corp. | | | 40,300 | | | | 2,160 | | |
| PNC Financial Services Group, Inc. † | | | 50,700 | | | | 3,078 | | |
| Wells Fargo & Co. | | | 115,800 | | | | 6,971 | | |
| Communication (0.5%) | |
| DIRECTV Group (The), Inc. ‡ | | | 63,200 | | | | 899 | | |
| Computer & Data Processing Services (2.2%) | |
| Microsoft Corp. | | | 142,500 | | | | 3,662 | | |
| Computer & Office Equipment (1.2%) | |
| Hewlett-Packard Co. | | | 68,600 | | | | 1,923 | | |
| Electric Services (5.5%) | |
| American Electric Power Co., Inc. | | | 83,900 | | | | 3,185 | | |
| FirstEnergy Corp. | | | 60,900 | | | | 2,893 | | |
| Pepco Holdings, Inc. | | | 66,800 | | | | 1,435 | | |
| Sempra Energy | | | 36,000 | | | | 1,595 | | |
| Electric, Gas & Sanitary Services (3.2%) | |
| Exelon Corp. | | | 81,000 | | | | 4,214 | | |
| NiSource, Inc. | | | 43,700 | | | | 1,033 | | |
| Finance (3.4%) | |
| SPDR Trust Series 1 † | | | 47,500 | | | | 5,712 | | |
| Food Stores (1.4%) | |
| Kroger Co. ‡ | | | 113,100 | | | | 2,251 | | |
| Furniture & Fixtures (3.3%) | |
| Johnson Controls, Inc. | | | 43,700 | | | | 2,974 | | |
| Masco Corp. | | | 87,500 | | | | 2,494 | | |
| Health Services (0.5%) | |
| Caremark Rx, Inc. ‡ | | | 16,500 | | | | 865 | | |
| | | Shares | | Value | |
| Industrial Machinery & Equipment (2.9%) | |
| Baker Hughes, Inc. | | | 25,900 | | | $ | 1,423 | | |
| Illinois Tool Works, Inc. | | | 40,100 | | | | 3,399 | | |
| Insurance (5.5%) | |
| American International Group, Inc. | | | 63,600 | | | | 4,121 | | |
| UnitedHealth Group, Inc. † | | | 84,800 | | | | 4,909 | | |
| Insurance Agents, Brokers & Service (1.7%) | |
| Hartford Financial Services Group, Inc. (The) | | | 34,900 | | | | 2,783 | | |
| Management Services (1.2%) | |
| Accenture, Ltd.–Class A | | | 74,100 | | | | 1,950 | | |
| Motion Pictures (2.1%) | |
| Time Warner, Inc. † | | | 194,600 | | | | 3,470 | | |
| Motor Vehicles, Parts & Supplies (0.9%) | |
| BorgWarner, Inc. | | | 26,500 | | | | 1,537 | | |
| Oil & Gas Extraction (0.7%) | |
| GlobalSantaFe Corp. | | | 26,100 | | | | 1,163 | | |
| Petroleum Refining (7.0%) | |
| Exxon Mobil Corp. | | | 105,700 | | | | 5,934 | | |
| Marathon Oil Corp. | | | 93,200 | | | | 5,607 | | |
| Pharmaceuticals (7.7%) | |
| Bristol-Myers Squibb Co. | | | 63,100 | | | | 1,336 | | |
| Cephalon, Inc. †‡ | | | 34,700 | | | | 1,582 | | |
| Johnson & Johnson | | | 54,400 | | | | 3,406 | | |
| Medco Health Solutions, Inc. ‡ | | | 42,900 | | | | 2,424 | | |
| Wyeth | | | 89,800 | | | | 4,001 | | |
| Radio & Television Broadcasting (1.3%) | |
| IAC/InterActiveCorp. ‡ | | | 13,350 | | | | 342 | | |
| Univision Communications, Inc.–Class A †‡ | | | 67,300 | | | | 1,759 | | |
| Railroads (1.8%) | |
| Burlington Northern Santa Fe Corp. | | | 48,600 | | | | 3,016 | | |
| Security & Commodity Brokers (4.1%) | |
| Morgan Stanley | | | 125,300 | | | | 6,818 | | |
| Telecommunications (4.7%) | |
| SBC Communications, Inc. | | | 122,600 | | | | 2,924 | | |
| Sprint Nextel Corp. | | | 207,363 | | | | 4,834 | | |
| Transportation & Public Utilities (1.1%) | |
| Expedia, Inc. †‡ | | | 99,850 | | | | 1,876 | | |
| Variety Stores (2.3%) | |
| Costco Wholesale Corp. | | | 77,800 | | | | 3,763 | | |
| Total Common Stocks (cost: $156,889) | | | | | | | 163,730 | | |
The notes to the financial statements are an integral part of this report.
Transamerica IDEX Mutual Funds
Annual Report 2005
4
TA IDEX UBS Large Cap Value
SCHEDULE OF INVESTMENTS (continued)
At October 31, 2005
(all amounts except share amounts in thousands)
| | | Principal | | Value | |
| SECURITY LENDING COLLATERAL (9.0%) | | | |
| Debt (8.3%) | | | |
| Bank Notes (0.5%) | | | |
Bank of America
| |
| 3.81%, due 06/07/2006 * | | $ | 416 | | | $ | 416 | | |
| 3.81%, due 08/10/2006 * | | | 412 | | | | 412 | | |
Credit Suisse First Boston Corp.
4.11%, due 03/10/2006 * | | | 82 | | | | 82 | | |
| Certificates Of Deposit (0.6%) | | | |
Canadian Imperial Bank of Commerce
4.07%, due 11/04/2005 * | | | 330 | | | | 330 | | |
Harris Trust & Savings Bank
3.80%, due 11/04/2005 * | | | 263 | | | | 263 | | |
Rabobank Nederland
4.03%, due 05/31/2006 * | | | 412 | | | | 412 | | |
| Commercial Paper (1.8%) | | | |
Ciesco LLC
4.00%, due 11/03/2005 | | | 412 | | | | 412 | | |
General Electric Capital Corp.
3.96%, due 12/05/2005 | | | 330 | | | | 330 | | |
Paradigm Funding LLC–144A
4.01%, due 11/07/2005 | | | 329 | | | | 329 | | |
Park Avenue Receivables Corp.–144A
4.03%, due 12/02/2005 | | | 327 | | | | 327 | | |
Preferred Receivables Corp.–144A
4.04%, due 12/05/2005 | | | 247 | | | | 247 | | |
Ranger Funding Co. LLC–144A
3.99%, due 11/15/2005 | | | 246 | | | | 246 | | |
Sheffield Receivables Corp.–144A
4.01%, due 11/08/2005 | | | 247 | | | | 247 | | |
Yorktown Capital LLC
3.97%, due 11/09/2005
3.93%, due 11/17/2005 | | | 411
410 | | | | 411
410 | | |
| Euro Dollar Overnight (2.0%) | | | |
Bank of Montreal
3.79%, due 11/01/2005 | | | 247 | | | | 247 | | |
Barclays
3.80%, due 11/04/2005 | | | 330 | | | | 330 | | |
BNP Paribas
3.83%, due 11/02/2005 | | | 495 | | | | 495 | | |
Deutsche Bank
3.80%, due 11/02/2005 | | | 825 | | | | 825 | | |
HSBC Banking/Holdings PLC
3.84%, due 11/07/2005 | | | 247 | | | | 247 | | |
Royal Bank of Scotland
3.76%, due 11/01/2005 | | | 330 | | | | 330 | | |
Svenska Handlesbanken
4.03%, due 11/01/2005 | | | 425 | | | | 425 | | |
| | | Principal | | Value | |
| Euro Dollar Overnight (continued) | | | |
UBS AG
| |
| 3.80%, due 11/03/2005 | | $ | 330 | | | $ | 330 | | |
| Euro Dollar Terms (0.7%) | | | |
Royal Bank of Scotland
4.00%, due 12/12/2005 | | | 330 | | | | 330 | | |
UBS AG
4.02%, due 12/01/2005 | | | 330 | | | | 330 | | |
Wells Fargo
3.96%, due 11/14/2005 | | | 495 | | | | 495 | | |
| Promissory Notes (0.2%) | | | |
Goldman Sachs Group, Inc.
4.02%, due 12/28/2005 | | | 346 | | | | 346 | | |
| Repurchase Agreements (2.5%) †† | | | |
Credit Suisse First Boston Corp. 4.10%, dated
10/31/2005 to be repurchased at $562
on 11/01/2005 | | | 562 | | | | 562 | | |
Goldman Sachs Group, Inc. (The) 4.10%, dated
10/31/2005 to be repurchased at $1,402
on 11/01/2005 | | | 1,402 | | | | 1,402 | | |
Lehman Brothers, Inc. 4.10%, dated 10/31/2005
to be repurchased at $39 on 11/01/2005 | | | 39 | | | | 39 | | |
Merrill Lynch & Co. 4.10%, dated 10/31/2005
to be repurchased at $1,650 on 11/01/2005 | | | 1,650 | | | | 1,650 | | |
Morgan Stanley Dean Witter & Co. 4.17%,
dated 10/31/2005 to be repurchased at $495
on 11/01/2005 | | | 494 | | | | 494 | | |
| | | Shares | | Value | |
| Investment Companies (0.7%) | | | |
| Money Market Funds (0.7%) | | | |
American Beacon Fund
1-day yield of 3.81% | | | 355,634 | | | $ | 356 | | |
Barclays Global Investors Institutional
Money Market Fund
1-day yield of 3.92% | | | 329,921 | | | | 330 | | |
Goldman Sachs Financial Square Prime
Obligations Fund
1-day yield of 3.79% | | | 51,391 | | | | 51 | | |
Merrimac Cash Fund, Premium Class
1-day yield of 3.70% @ | | | 326,275 | | | | 326 | | |
| Total Security Lending Collateral (cost: $14,814) | | | | | | | 14,814 | | |
| Total Investment Securities (cost: $171,703) | | | | | | $ | 178,544 | | |
| SUMMARY: | | | |
| Investment securities, at value | | | 107.9 | % | | $ | 178,544 | | |
| Liabilities in excess of other assets | | | (7.9 | )% | | | (13,045 | ) | |
| Net assets | | | 100.0 | % | | $ | 165,499 | | |
The notes to the financial statements are an integral part of this report.
Transamerica IDEX Mutual Funds
Annual Report 2005
5
TA IDEX UBS Large Cap Value
SCHEDULE OF INVESTMENTS (continued)
At October 31, 2003
(all amounts except share amounts in thousands)
NOTES TO SCHEDULE OF INVESTMENTS:
† At October 31, 2005, all or a portion of this security is on loan (see Note 1). The value at October 31, 2005, of all securities on loan is $14,283.
‡ Non-income producing.
* Floating or variable rate note. Rate is listed as of October 31, 2005.
†† Cash collateral for the Repurchase Agreements, valued at $4,230, that serve as collateral for securities lending are invested in corporate bonds with interest rates and maturity dates ranging from 0.00%–9.86% and 12/31/2005–11/15/2096, respectively.
@ Regulated investment company advised by Investors Bank and Trust Co. ("IBT"). IBT is also the accounting, custody and lending agent for the Fund.
DEFINITIONS:
144A 144A Securities are registered pursuant to Rule 144A of the Securities Act of 1933. These securities are deemed to be liquid for purposes of compliance limitations on holdings of illiquid securities and may be resold as transactions exempt from registration, normally to qualified institutional buyers. At October 31, 2005, these securities aggregated $1,396 or 0.8% of the net assets of the Fund.
The notes to the financial statements are an integral part of this report.
Transamerica IDEX Mutual Funds
Annual Report 2005
6
TA IDEX UBS Large Cap Value
STATEMENT OF ASSETS AND LIABILITIES
At October 31, 2005
(all amounts except per share amounts in thousands)
| Assets: | | | |
Investment securities, at value (cost: $171,703)
(including securities loaned of $14,283) | | $ | 178,544 | | |
| Cash | | | 1,676 | | |
| Receivables: | |
| Investment securities sold | | | 601 | | |
| Interest | | | 7 | | |
| Dividends | | | 257 | | |
| | | | 181,085 | | |
| Liabilities: | | | |
| Investment securities purchased | | | 598 | | |
| Accounts payable and accrued liabilities: | |
| Management and advisory fees | | | 121 | | |
| Distribution and service fees | | | 21 | | |
| Administration fees | | | 3 | | |
| Payable for collateral for securities on loan | | | 14,814 | | |
| Other | | | 29 | | |
| | | | 15,586 | | |
| Net Assets | | $ | 165,499 | | |
| Net Assets Consist of: | | | |
Shares of beneficial interest, unlimited shares
authorized, no par value | | $ | 154,542 | | |
| Undistributed net investment income (loss) | | | 1,218 | | |
Undistributed net realized gain (loss) from
investment securities | | | 2,898 | | |
Net unrealized appreciation (depreciation) on
investment securities | | | 6,841 | | |
| Net Assets | | $ | 165,499 | | |
| Net Assets by Class: | | | |
| Class A | | $ | 71,364 | | |
| Class I | | | 94,135 | | |
| Shares Outstanding: | | | |
| Class A | | | 6,529 | | |
| Class I | | | 8,593 | | |
| Net Asset Value and Offering Price Per Share: | | | |
| Class A | | $ | 10.93 | | |
| Class I | | | 10.95 | | |
STATEMENT OF OPERATIONS
For the period ended October 31, 2005 (a)
(all amounts in thousands)
| Investment Income: | | | |
| Interest | | $ | 72 | | |
| Dividends | | | 2,511 | | |
| Income from loaned securities–net | | | 7 | | |
| | | | 2,590 | | |
| Expenses: | | | |
| Management and advisory fees | | | 1,064 | | |
| Distribution and service fees: | |
| Class A | | | 148 | | |
| Transfer agent fees: | |
| Class A | | | 1 | | |
| Class I | | | 1 | | |
| Printing and shareholder reports | | | 1 | | |
| Custody fees | | | 21 | | |
| Administration fees | | | 25 | | |
| Legal fees | | | 7 | | |
| Audit fees | | | 15 | | |
| Trustees fees | | | 4 | | |
| Registration fees: | |
| Class A | | | 5 | | |
| Class I | | | 7 | | |
| Other | | | 1 | | |
| Total expenses | | | 1,300 | | |
| Net Investment Income (Loss) | | | 1,290 | | |
| Net Realized and Unrealized Gain (Loss): | | | |
| Realized gain (loss) from investment securities | | | 2,898 | | |
Increase (decrease) in unrealized appreciation
(depreciation) on investment securities | | | 6,841 | | |
| Net Gain (Loss) on Investment Securities | | | 9,739 | | |
Net Increase (Decrease) in Net Assets Resulting
from Operations | | $ | 11,029 | | |
(a) TA IDEX UBS Large Cap Value ("the Fund") commenced operations on Novermber 8, 2004. The inception date for the Fund's offering of share Class A was March 1, 2005.
The notes to the financial statements are an integral part of this report.
Transamerica IDEX Mutual Funds
Annual Report 2005
7
TA IDEX UBS Large Cap Value
STATEMENTS OF CHANGES IN NET ASSETS
For the period ended
(all amounts in thousands)
| | | October 31,
2005 (a) | |
| Increase (Decrease) In Net Assets From: | | | |
| Operations: | | | |
| Net investment income (loss) | | $ | 1,290 | | |
| Net realized gain (loss) from investment securities | | | 2,898 | | |
Net unrealized appreciation (depreciation) on
investment securities | | | 6,841 | | |
| | | | 11,029 | | |
| Distributions to Shareholders: | | | |
| From net investment income: | |
| Class I | | | (72 | ) | |
| | | | (72 | ) | |
| Capital Share Transactions: | | | |
| Proceeds from shares sold: | |
| Class A | | | 67,684 | | |
| Class I | | | 86,786 | | |
| | | | 154,470 | | |
| Dividends and distributions reinvested: | |
| Class I | | | 72 | | |
| | | | 72 | | |
| | | | 154,542 | | |
| Net increase (decrease) in net assets | | | 165,499 | | |
| Net Assets: | | | |
| Beginning of period | | | – | | |
| End of period | | $ | 165,499 | | |
| Undistributed Net Investment Income (Loss) | | $ | 1,218 | | |
| Share Activity: | | | |
| Shares issued: | |
| Class A | | | 6,529 | | |
| Class I | | | 8,586 | | |
| | | | 15,115 | | |
| Shares issued–reinvested from distributions: | |
| Class I | | | 7 | | |
| | | | 7 | | |
| Net increase (decrease) in shares outstanding: | |
| Class A | | | 6,529 | | |
| Class I | | | 8,593 | | |
| | | | 15,122 | | |
(a) TA IDEX UBS Large Cap Value ("the Fund") commenced operations on November 8, 2004. The inception date for the Fund's offering of share Class A was March 1, 2005.
The notes to the financial statements are an integral part of this report.
Transamerica IDEX Mutual Funds
Annual Report 2005
8
TA IDEX UBS Large Cap Value
FINANCIAL HIGHLIGHTS
| | | | | For a share of beneficial interest outstanding throughout the period | |
| | | | | Net Asset | | Investment Operations | | Distributions | | Net Asset | |
| | | For the
Period
Ended (d)(g) | | Value,
Beginning
of Period | | Net
Investment
Income (Loss) | | Net Realized
and Unrealized
Gain (Loss) | | Total
Operations | | From Net
Investment
Income | | From Net
Realized
Gains | | Total
Distributions | | Value,
End
of Period | |
| Class A | | 10/31/2005 | | $ | 10.43 | | | $ | 0.06 | | | $ | 0.44 | | | $ | 0.50 | | | $ | – | | | $ | – | | | $ | – | | | $ | 10.93 | | |
| Class I | | 10/31/2005 | | | 10.00 | | | | 0.12 | | | | 0.84 | | | | 0.96 | | | | (0.01 | ) | | | – | | | | (0.01 | ) | | | 10.95 | | |
| | | | | | | Ratios/Supplemental Data | |
| | | For the
Period | | Total | | Net Assets,
End of
Period | | Ratio of Expenses
to Average
Net Assets (a) | | Net Investment
Income (Loss)
to Average | | Portfolio
Turnover | |
| | | Ended (g) | | Return (c) | | (000's) | | Net (e) | | Total (f) | | Net Assets (a) | | Rate (b) | |
| Class A | | 10/31/2005 | | | 4.79 | % | | $ | 71,364 | | | | 1.27 | % | | | 1.27 | % | | | 0.80 | % | | | 43 | % | |
| Class I | | 10/31/2005 | | | 9.60 | | | | 94,135 | | | | 0.92 | | | | 0.92 | | | | 1.14 | | | | 43 | | |
NOTES TO FINANCIAL HIGHLIGHTS
(a) Annualized.
(b) Not annualized.
(c) Total Return has been calculated for the applicable period without deduction of a sales load, if any, on a initial purchase. Periods of less than one year are not annualized.
(d) Per share information is caluclated based on average number of shares outstanding.
(e) Ratio of Net Expenses to Average Net Assets is net of fee waivers and reimbursements by the investment adviser, if any (see note 2).
(f) Ratio of Total Expenses to Average Net Assets includes all expenses before fee waivers and reimbursements by the investment adviser.
(g) TA IDEX UBS Large Cap Value ("the Fund") commenced operations on November 8, 2004. The inception dates for the Fund's offering of share Class A was March 1, 2005.
The notes to the financial statements are an integral part of this report.
Transamerica IDEX Mutual Funds
Annual Report 2005
9
TA IDEX UBS Large Cap Value
NOTES TO FINANCIAL STATEMENTS
At October 31, 2005
(all amounts in thousands)
NOTE 1. ORGANIZATION AND SIGNIFICANT ACCOUNTING POLICIES
Transamerica IDEX Mutual Funds is an open-end management investment company registered under the Investment Company Act of 1940, as amended (the "1940 Act"). TA IDEX UBS Large Cap Value (the "Fund") began operations on November 8, 2004.
In the normal course of business, the Fund enters into contracts that contain a variety of representations that provide general indemnifications. The Fund's maximum exposure under these arrangements is unknown, as this would involve future claims that may be made against the Fund and/or its affiliates that have not yet occurred. However, based on experience, the Fund expects the risk of loss to be remote.
This report should be read in conjunction with the current Fund prospectus, which contains more complete information about the Fund.
The following is a summary of significant accounting policies followed by the Fund in the preparation of the financial statements. In preparing the Fund's financial statements in accordance with accounting principles generally accepted in the United States of America ("GAAP"), estimates or assumptions (which could differ from actual results) may be used that affect reported amounts and disclosures.
Multiple class operations, income and expenses: The Fund currently offers two classes of shares, Class A and Class I, each with a public offering price that reflects different sales charges, if any, and expense levels. The initial sales charge currently is waived as this Fund is available for investment only by certain strategic asset allocation funds. Income, non-class specific expenses and realized and unrealized gains and losses, are allocated daily to each class, based upon the value of shares outstanding method as permitted under Rule 18f-3 of the 1940 Act. Each class bears its own specific expenses as well as a portion of general, common expenses.
Class I shares are offered for investment to the asset allocation funds of AEGON/Transamerica Series Trust (ATST).
Security valuations: The Fund values its investments at the close of the New York Stock Exchange ("NYSE"), normally 4 p.m. ET, each day the NYSE is open for business. Fund investments are valued at the last sale price or closing price on the day of valuation taken from the primary exchange where the security is principally traded.
Securities traded in the over-the-counter market and listed securities for which no sale was reported on that date are valued at the last quoted bid price.
Debt securities are valued based on a price quotation or other equivalent indication of value supplied by an exchange, a pricing service or a major market maker; however, those that mature in sixty days or less are valued at amortized cost, which approximates market.
Investment company securities are valued at the net asset value of the underlying portfolio.
Other securities for which quotations are not readily available or whose values have been determined to be unreliable are valued at fair market value as determined in good faith by the Fund's Administrative Valuation Committee, under the supervision of the Board's Valuation Committee, using guidelines adopted by the Board of Trustees.
Cash: The Fund may leave cash overnight in its cash account with the custodian, Investors Bank & Trust Company ("IBT"). IBT has been contracted on behalf of the Fund to invest the excess cash into a savings account, which at October 31, 2005, was paying an interest rate of 2.76%.
Repurchase agreements: The Fund is authorized to enter into repurchase agreements. The Fund, through its custodian, IBT, receives delivery of the underlying securities, the value of which at the time of purchase is required to be an amount equal to at least 100% of the resale price. The Fund will bear the risk of value fluctuations until the security can be sold and may encounter delays and incur costs in liquidating the security. In the event of bankruptcy or insolvency of the seller, delays and costs may be incurred.
Commission recapture: The sub-adviser, to the extent consistent with the best execution and usual commission rate policies and practices, may place security transactions of the Fund with broker/dealers with which Transamerica IDEX Mutual Funds has established a Commission Recapture Program. A Commission Recapture Program is any arrangement under which a broker/dealer applies a portion of the commissions received by such broker/dealer on the security transactions to the Fund. In no event will commissions paid by the Fund be used to pay expenses that would otherwise be borne by any other funds within Transamerica IDEX Mutual Funds, or by any other party.
Recaptured commissions during the period from inception through October 31, 2005, of $49 are included in net realized gains in the Statement of Operations.
Securities lending: The Fund may lend securities to qualified borrowers, with IBT acting as the Fund's lending agent. The Fund earns negotiated lenders' fees. The Fund receives cash and/or securities as collateral against the loaned securities. Cash collateral received is invested in short term, interest bearing securities. The Fund monitors the market value of securities loaned on a daily basis and requires collateral in an amount at least equal to the value of the securities loaned. Income from loaned securities on the Statement of Operations is net of fees, in the amount of $3, earned by IBT for its services.
Transamerica IDEX Mutual Funds
Annual Report 2005
10
TA IDEX UBS Large Cap Value
NOTES TO FINANCIAL STATEMENTS (continued)
At October 31, 2005
(all amounts in thousands)
NOTE 1.–(continued)
Security transactions and investment income: Security transactions are recorded on the trade date. Security gains and losses are calculated on the specific identification basis. Dividend income, if any, is recorded on the ex-dividend date or, in the case of foreign securities, as soon as the Fund is informed of the ex-dividend date. Interest income, including accretion of discounts and amortization of premiums, is recorded on the accrual basis commencing on the settlement date.
Redemption fees: A short-term trading redemption fee may be assessed on any Fund shares in a fund account that are sold during the first five (5) NYSE trading days following their purchase date. This redemption fee will equal 2% of the amount redeemed and shares held the longest will be treated as being redeemed first and shares held the shortest as being redeemed last. For the period from inception through October 31, 2005, the Fund received no redemption fees.
Dividend distributions: Distributions to shareholders are recorded on the ex-dividend date and are determined in accordance with Federal income tax regulations which may differ from GAAP.
NOTE 2. RELATED PARTY TRANSACTIONS
Effective January 1, 2005 AEGON/Transamerica Fund Advisors, Inc. was renamed Transamerica Fund Advisors, Inc. ("TFAI"); AEGON/Transamerica Fund Services, Inc. and AEGON/Transamerica Investor Services, Inc. merged into one entity and was renamed Transamerica Fund Services, Inc. ("TFS").
TFAI is the Fund's investment adviser. TFS is the Fund's administrator and transfer agent. AFSG Securities Corp. ("AFSG") is the Fund's distributor/principal underwriter. TFAI, TFS , and AFSG are affiliates of AEGON, NV, a Netherlands corporation.
The following schedule reflects the percentage of Fund assets owned by affiliated mutual funds:
| | | Net
Assets | | % of
Net Assets | |
TA IDEX Asset Allocation–
Conservative Portfolio | | $ | 10,669 | | | | 6.45 | % | |
TA IDEX Asset Allocation–
Moderate Portfolio | | | 60,665 | | | | 36.66 | % | |
Asset Allocation–
Conservative Portfolio | | | 25,412 | | | | 15.35 | % | |
Asset Allocation–
Growth Portfolio | | | 68,681 | | | | 41.50 | % | |
| Total | | $ | 165,427 | | | | 99.96 | % | |
Investment advisory fees: The Fund pays management fees to TFAI based on average daily net assets ("ANA") at the following breakpoints:
0.85% of the first $200 million of ANA
0.80% of the next $550 million of ANA
0.75% of the next $250 million of ANA
0.70% of ANA over $1 billion
TFAI has contractually agreed to waive its advisory fee and will reimburse the Fund to the extent that operating expenses exceed the following stated annual limit:
From November 8, 2004 through May 27, 2005:
1.05% Expense Limit (including 12b-1 fees)
From May 28, 2005 on:
1.05% Expense Limit (excluding 12b-1 fees)
If total fund expenses fall below the annual expense limitation agreement agreed to by the adviser within the succeeding three years, the Fund may be required to pay that adviser a portion or all of the reimbursed class expenses.
There were no amounts recaptured during the period from inception through October 31, 2005. There are no amounts subject to recapture at October 31, 2005.
Distribution and service fees: The Fund has a 12b-1 distribution plan under the 1940 Act pursuant to which an annual fee, based on average daily net assets, is paid to the distributor for various disbursements such as broker-dealer account servicing fees and other promotional expenses of the Fund. The Fund is authorized under the 12b-1 plan to pay fees on each class up to the following limits:
| Class A | | | 0.35 | % | |
| Class I | | | N/A | | |
In the case the Fund or a class of shares of the Fund is closed to new investors or investments, the Fund is authorized to pay 12b-1 fees for past sales and distribution efforts and present and past investor services.
Administrative services: The Fund has entered into an agreement with TFS for financial and legal fund administration services. As of January 1, 2005 the Fund pays TFS an annual fee of 0.02% of ANA. Prior to January 1, 2005 the Fund paid TFS an annual fee of 0.015% of ANA. The Legal fees on the Statement of Operations are for fees paid to external legal counsel.
Transfer agent fees: The Fund pays TFS an annual per-account charge for each open and closed account. The Fund paid TFS less than $1 for the period from inception through October 31, 2005.
Brokerage commissions: Brokerage commissions incurred on security transactions placed with an affiliate of the adviser for the period from inception through October 31, 2005, were $10.
Transamerica IDEX Mutual Funds
Annual Report 2005
11
TA IDEX UBS Large Cap Value
NOTES TO FINANCIAL STATEMENTS (continued)
At October 31, 2005
(all amounts in thousands)
NOTE 3. INVESTMENT TRANSACTIONS
The cost of securities purchased and proceeds from securities sold (excluding short-term securities) for the period from inception through October 31, 2005, were as follows:
| Purchases of securities: | | | |
| Long-Term | | $ | 201,074 | | |
| U.S. Government | | | – | | |
| Proceeds from maturities and sales of securities: | | | |
| Long-Term | | | 51,705 | | |
| U.S. Government | | | – | | |
NOTE 4. FEDERAL INCOME TAX MATTERS
The Fund has not made any provision for federal income or excise taxes due to its policy to distribute all of its taxable income and capital gains to its shareholders and otherwise qualify as a regulated investment company under Subchapter M of the Internal Revenue Code. Income and capital gain distributions are determined in accordance with income tax regulations, which may differ from GAAP. These differences are primarily due to differing treatment for items including, but not limited to, wash sales.
The tax character of distributions paid may differ from the character of distributions shown in the Statement of Changes in Net Assets due to short-term gains being treated as ordinary income for tax purposes. The tax character of distributions paid during 2005 was as follows:
| 2005 Distributions paid from: | |
| Ordinary Income | | $ | 72 | | |
| Long-term Capital Gain | | | – | | |
The tax basis components of distributable earnings as of October 31, 2005, are as follows:
| Undistributed Ordinary Income | | $ | 4,116 | | |
| Undistributed Long-term Capital Gains | | $ | – | | |
| Capital Loss Carryforward | | $ | – | | |
| Net Unrealized Appreciation (Depreciation) | | $ | 6,841 | | |
The aggregate cost of investments and composition of unrealized appreciation (depreciation) for federal income tax purposes as of October 31, 2005, are as follows:
| Federal Tax Cost Basis | | $ | 171,703 | | |
| Unrealized Appreciation | | $ | 10,234 | | |
| Unrealized (Depreciation) | | | (3,393 | ) | |
| Net Unrealized Appreciation (Depreciation) | | $ | 6,841 | | |
NOTE 5. REGULATORY PROCEEDINGS
There continues to be significant federal and state regulatory activity relating to financial services companies, particularly mutual fund companies and their investment advisers. As part of an ongoing investigation regarding potential market timing, recordkeeping and trading compliance issues and matters affecting the Fund's investment adviser, TFAI, and certain affiliates and former employees of TFAI, the SEC staff has indicated that it is likely to take some action against TFAI and certain of its affiliates at the conclusion of the investigation. The potential timing and the scope of any such action is difficult to predict. Although the impact of any action brought against TFAI and/or its affiliates is difficult to assess at the present time, the Fund currently believes that the likelihood that any such action will have a material adverse impact on it is remote. It is important to note that the Fund is not aware of any allegation of wrongdoing against it and its Board at the time this annual report is printed. Although it is not anticipated that these developments will have an adverse impact on the Fund, there can be no assurance at this time. TFAI and its affiliates are actively working with the SEC in regard to this matter; however, the exact resolution cannot be determined at this time. TFAI will take such actions that it deems necessary or appropriate to continue providing management services to the Fund and to bring all matters to an appropriate conclusion.
TFAI and/or its affiliates, and not the Fund, will bear the costs regarding these regulatory matters.
Transamerica IDEX Mutual Funds
Annual Report 2005
12
Report of Independent Registered Certified Public Accounting Firm
To the Board of Trustees and Shareholders of
TA IDEX UBS Large Cap Value
In our opinion, the accompanying statement of assets and liabilities, including the schedule of investments, and the related statements of operations and of changes in net assets and the financial highlights present fairly, in all material respects, the financial position of TA IDEX UBS Large Cap Value (the "Fund") (one of the portfolios constituting the Transamerica IDEX Mutual Funds) at October 31, 2005, the results of its operations , the changes in its net assets and the financial highlights for the period November 8, 2004 (commencement of operations) through October 31, 2005, in conformity with accounting principles generally accepted in the United States of America. These financial statements and financial highlights (hereafter referred to as "financial statements") are the responsibility of the Fund's management; our responsibility is to express an opinion on these financial statements based on our audit. We conducted our audit of these financial statements in accordance with the standards of the Public Company Accounting Oversight Board (United States). Those standards require that we plan and perform the audit to obtain reasonable assurance about whether the financial statements are free of material misstatement. An audit includes examining, on a test basis, evidence supporting the amounts and disclosures in the financial statements, assessing the accounting principles used and significant estimates made by management, and evaluating the overall financial statement presentation. We believe that our audit, which included confirmation of securities at October 31, 2005 by correspondence with the custodian and brokers, provide a reasonable basis for our opinion.

December 22, 2005
Transamerica IDEX Mutual Funds
Annual Report 2005
13
TA IDEX UBS Large Cap Value (unaudited)
A discussion regarding the basis of Transamerica IDEX Mutual Funds' Board of Trustees' approval of the fund's advisory arrangements will be available in the fund's semi-annual report for the period ending April 30, 2006.
Transamerica IDEX Mutual Funds
Annual Report 2005
14
TA IDEX UBS Large Cap Value
SUPPLEMENTAL INFORMATION (unaudited)
TAX INFORMATION
For dividends paid during the period from inception through October 31, 2005, the Fund designated $2,428 as qualified dividend income.
The information and distributions reported herein may differ from the information and distributions taxable to the shareholders for the calendar year ending December 31, 2005. Complete information will be computed and reported in conjunction with your 2005 Form 1099-DIV.
Transamerica IDEX Mutual Funds
Annual Report 2005
15
TA IDEX Van Kampen Emerging Markets Debt
MARKET ENVIRONMENT
Against the backdrop of growing global growth, emerging markets bonds delivered strong returns for the twelve month period ended October 31, 2005. A flattening yield curve in the U.S. and improving fundamentals in emerging market economies combined to bolster interest in the asset class. As energy prices rose, investors rewarded debt issued by oil-producing countries, while lower-rated credits were boosted by investor's quest for yield. Throughout the period, lower-rated debt outperformed.
After hawkish comments from the Federal Open Market Committee drove global bond markets down in the first quarter of 2005, emerging markets debt rallied briskly during the second quarter of 2005. A rally in the long-term U.S. Treasury was a primary support for this upswing. Emerging market debt also benefited as volatility across financial markets declined and investor risk appetite increased toward the end of the quarter. During the third quarter of 2005, emerging markets bonds continued their advance. Fundamentals for emerging market economies strengthened as most countries experienced improving terms of trade and increasing levels of international reserves. These factors allowed the asset class to shrug off negative external market conditions such as worrisome inflation data and economic uncertainty in the U.S.
Like most asset classes, emerging market bonds retreated in the final weeks of the period. Increased global risk aversion and inflation concerns were the primary driver of volatility across financial markets during October. Apprehension about coordinated rate hikes in the developed world further fueled widening of emerging markets bond spreads.
PERFORMANCE
For the period from inception November 8, 2004 through October 31, 2005, TA IDEX Van Kampen Emerging Markets Debt, Class I returned 9.36%. By comparison its benchmark, the J.P. Morgan Emerging Markets Bond (EMBI Global) Index, returned 10.12%.
STRATEGY REVIEW
We maintained a slightly defensive risk bias for much of the period. The portfolio was overweighted relative to its index in Argentina, Turkish local markets and in Russia, based on the belief that bonds in these countries had yet to reflect fully the ongoing improvement in economic fundamentals. The portfolio included exposure to the local markets of Argentina, Brazil and Turkey. We underweighted the debt of Ecuador based on our concerns about the country's ability to service its debts beyond 2005, despite high oil revenues and manageable financing requirements for 2005. The portfolio was also underweighted relative to its index in Brazil and certain Asian credits due to concerns that valuations have outpaced fundamentals in the final months of the period.
Like most credit markets, the emerging debt markets have benefited in recent years from generous global liquidity conditions and strong global growth. The recent modest decline in emerging market bond prices, however, reflects the growing consensus that higher interest rates in the U.S. and the possibility of higher rates in Europe and Japan will remove some of the abundant financial market liquidity and likely cap the upside of most fixed income asset classes in the months ahead. We also believe that some caution is warranted as many emerging market countries are at the beginning of what is likely to be a noisy political calendar with many important regional and presidential elections slated for 2006.
Although Argentine debt hindered the portfolio's progress at points early in the reporting period, the decision to overweight that country served the portfolio well for the period overall. As that country moved forward with its debt restructuring, the portfolio benefited from both its overall exposure as well as strong security selection. Argentine debt continued to rise in the third quarter, helped by encouraging economic data as well as from increasing investor interest.
The portfolio's overweight in Russia relative to its index also benefited relative returns. Improving fiscal surpluses, a ratings upgrade and that country's repayment of International Monetary Funds ("IMF") debt were among the factors providing support. An overweight in Turkish local-market debt, as well as security selection there, also proved advantageous.
The portfolio's exposure to the Philippines produced more mixed results over the course of the period against a changing political landscape and fluctuating outlook for fiscal reform measures. The portfolio's returns during the third quarter of 2005 were further tempered by its underweighting in Ecuadorian bonds, which rose sharply as oil prices remained high in the aftermath of Hurricanes Katrina and Rita.
Investment Team
Morgan Stanley Investment Management Inc.
This Fund is only available for investment by the Asset Allocation Portfolios.
Transamerica IDEX Mutual Funds
Annual Report 2005
1
TA IDEX Van Kampen Emerging Markets Debt
Comparison of change in value of $10,000 investment in Class I shares and its comparative index.
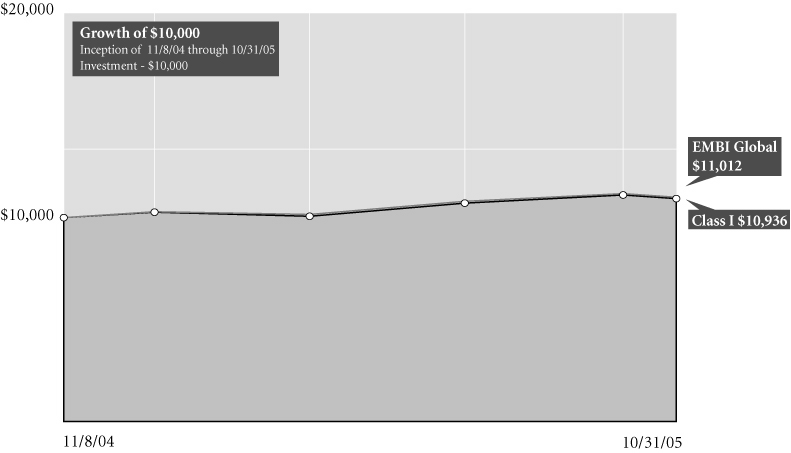
Total Return for Period Ended 10/31/05
| | | From
Inception | | Inception
Date | |
| Class A (NAV) | | | 4.90 | % | | 3/1/05 | |
| Class I (NAV) | | | 9.36 | % | | 11/8/04 | |
| EMBI Global1 | | | 10.12 | % | | 11/8/04 | |
NOTES
1 The J.P. Morgan Emerging Markets Bond (EMBI Global) Index is an unmanaged index used as a general measure of market performance. Calculations assume dividends and capital gains are reinvested and do not include any managerial expenses. From inception calculation is based on life of Class I shares. Source: Standard & Poor's Micropal®© Micropal, Inc. 2005 – 1-800-596-5323 – http://www.funds-sp.com.
The performance data presented represents past performance, future results may vary. Performance data does not reflect the deduction of taxes that would be paid on fund distributions or the redemption of fund shares. Investment return and principal value will fluctuate so that an investor's shares, when redeemed, may be worth more or less than their original cost. Current performance may be lower or higher than performance quoted. Please see www.transamericaidex.com for performance data current to the most recent month-end.
Net Asset Value (NAV) returns include the reinvestment of dividends and capital gains. Class A shares are sold without a sales load.
Investing in emerging markets involves special considerations. These may include risks related to market and currency volatility, adverse social and political developments, and the relatively small size and lesser liquidity of these markets.
This material must be preceded or accompanied by a current prospectus, which includes specific contents regarding the investment objectives and policies of this fund.
Transamerica IDEX Mutual Funds
Annual Report 2005
2
TA IDEX Van Kampen Emerging Markets Debt
UNDERSTANDING YOUR FUND'S EXPENSES
(unaudited)
SHAREHOLDER EXPENSES
Fund shareholders may incur ongoing costs, including management fees, 12b-1 distribution and service fees, and other fund expenses. Shares of the fund currently are sold only to certain Transamerica IDEX Mutual Funds and AEGON/Transamerica Series Trust (an affiliate of Transamerica IDEX Mutual Funds) asset allocation funds at net asset value, without any transactional costs.
The following Example is intended to help you understand your ongoing costs (in dollars and cents) of investing in a Fund and to compare these costs with the ongoing costs of investing in other funds.
The Example is based on an investment of $1,000 invested at May 1, 2005 and held for the entire period until October 31, 2005.
ACTUAL EXPENSES
The first line in the table below provides information about actual account values and actual expenses. You may use the information in this line, together with the amount you invested, to estimate the expenses that you paid over the period. Simply divide your account value by $1,000 (for example, an $8,600 account value divided by $1,000 = 8.6), then multiply the result by the number in the first line of your Fund under the heading entitled "Expenses Paid During Period" to estimate the expenses you paid on your account during this period.
HYPOTHETICAL EXAMPLE FOR COMPARISON PURPOSES
The second line in the table below provides information about hypothetical account values and hypothetical expenses based on the Fund's actual expense ratio and an assumed rate of return of 5% per year before expenses, which is not the Fund's actual return. The hypothetical account values and expenses may not be used to estimate the actual ending account balance or expenses you paid for the period. You may use this information to compare the ongoing costs of investing in your Fund and other funds. To do so, compare this 5% hypothetical example with the 5% hypothetical examples that appear in the shareholder reports of the other funds.
Please note that the expenses shown in the table are meant to highlight your ongoing costs only and do not reflect any transactional costs, such as sales charges, redemption fees, brokerage commissions paid on purchases and sales of fund shares. Therefore, the second line under the Fund in the table is useful in comparing ongoing costs only, and will not help you determine the relative total costs of owning different funds.
| | | Beginning
Account
Value | | Ending
Account
Value | | Annualized
Expense
Ratio | | Expenses Paid
During Period (a) | |
| Class A | |
| Actual | | $ | 1,000.00 | | | $ | 1,068.80 | | | | 1.46 | % | | $ | 7.61 | | |
| Hypothetical (b) | | | 1,000.00 | | | | 1,017.85 | | | | 1.46 | | | | 7.43 | | |
| Class I | |
| Actual | | | 1,000.00 | | | | 1,070.40 | | | | 1.07 | | | | 5.58 | | |
| Hypothetical (b) | | | 1,000.00 | | | | 1,019.81 | | | | 1.07 | | | | 5.45 | | |
(a) Expenses are calculated using each Fund's annualized expense ratio (as disclosed in the table), multiplied by the average account value for the period, multiplied by number of days in the period (184 days), and divided by the number of days in the year (365 days).
(b) 5% return per year before expenses.
GRAPHIC PRESENTATION OF SCHEDULE OF INVESTMENTS
By Region
At October 31, 2005
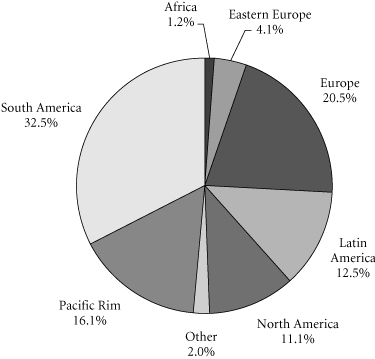
This chart shows the percentage breakdown by region of the Fund's total investment securities.
Transamerica IDEX Mutual Funds
Annual Report 2005
3
TA IDEX Van Kampen Emerging Markets Debt
SCHEDULE OF INVESTMENTS
At October 31, 2005
(all amounts except share amounts in thousands)
| | | Principal | | Value | |
| FOREIGN GOVERNMENT OBLIGATIONS (73.7%) | |
Argentine Republic
| |
| 5.83%, due 12/31/2033 | | $ | 24,930 | | | $ | 10,471 | | |
| 8.28%, due 12/31/2033 | | | 110 | | | | 105 | | |
| 1.33%, due 12/31/2038 (a) | | | 150 | | | | 55 | | |
| 0.00%, due 04/10/2049 *v | | | 2,310 | | | | 970 | | |
Malaysia Government
8.75%, due 06/01/2009
7.50%, due 07/15/2011 | | | 5,570
2,700 | | | | 6,251
3,021 | | |
Republic of Brazil
14.50%, due 10/15/2009
10.50%, due 07/14/2014
8.00%, due 01/15/2018
8.00%, due 01/15/2018
8.88%, due 10/14/2019
5.19%, due 04/15/2024 *
6.00%, due 04/15/2024 *
8.88%, due 04/15/2024 | | | 6,550
2,580
2,350
6,881
9,873
3,900
1,200
1,210 | | | | 8,341
3,024
2,428
7,101
10,416
3,705
1,131
1,252 | | |
Republic of Bulgaria
8.25%, due 01/15/2015 | | | 2,950 | | | | 3,532 | | |
Republic of Colombia
9.75%, due 04/09/2011
9.75%, due 04/09/2011
8.25%, due 12/22/2014
11.75%, due 02/25/2020
8.13%, due 05/21/2024
10.38%, due 01/28/2033 | | | 870
465
700
890
1,500
430 | | | | 991
530
757
1,197
1,554
537 | | |
Republic of Ivory Coast
2.50%, due 03/29/2018 v | | | 495 | | | | 85 | | |
Republic of Nigeria
6.25%, due 11/15/2020 | | | 2,750 | | | | 2,729 | | |
Republic of Panama
9.63%, due 02/08/2011
10.75%, due 05/15/2020
9.38%, due 04/01/2029 | | | 2,460
590
850 | | | | 2,829
801
1,039 | | |
Republic of Peru
9.88%, due 02/06/2015
8.38%, due 05/03/2016
8.75%, due 11/21/2033 | | | 1,180
1,700
1,710 | | | | 1,454
1,917
1,967 | | |
Republic of the Philippines
8.88%, due 03/17/2015
10.63%, due 03/16/2025
9.50%, due 02/02/2030 | | | 9,230
2,450
10,550 | | | | 9,749
2,827
11,130 | | |
Republic of Turkey
11.00%, due 01/14/2013
7.38%, due 02/05/2025 | | | 3,130
2,650 | | | | 3,940
2,624 | | |
| | | Principal | | Value | |
Republic of Venezuela
| |
| 10.75%, due 09/19/2013 | | $ | 4,100 | | | $ | 5,002 | | |
| 8.50%, due 10/08/2014 | | | 1,600 | | | | 1,744 | | |
| 9.38%, due 01/13/2034 | | | 7,912 | | | | 9,202 | | |
Russian Federation
8.25%, due 03/31/2010
11.00%, due 07/24/2018
12.75%, due 06/24/2028
5.00%, due 03/31/2030 (b) | | | 4,820
7,400
6,720
10,140 | | | | 5,144
10,796
12,151
11,272 | | |
State of Qatar
9.75%, due 06/15/2030 | | | 1,220 | | | | 1,809 | | |
United Mexican States
10.38%, due 02/17/2009
8.38%, due 01/14/2011
8.13%, due 12/30/2019
11.50%, due 05/15/2026
8.30%, due 08/15/2031 | | | 3,550
11,250
3,020
940
2,560 | | | | 4,104
12,797
3,612
1,490
3,136 | | |
| Total Foreign Government Obligations (cost: $189,458) | | | | | | | 192,719 | | |
| CORPORATE DEBT SECURITIES (19.4%) | |
| Commercial Banks (1.1%) | |
Banco Abn Amro Real S.A.–144A
Zero Coupon, due 07/21/2006 | | | 1,860 | | | | 2,017 | | |
Banque Centrale de Tunisie
7.38%, due 04/25/2012 | | | 850 | | | | 940 | | |
| Holding & Other Investment Offices (0.2%) | |
Satelites Mexicanos
0.00%, due 11/01/2034 v | | | 1,013 | | | | 527 | | |
| Mortgage Bankers & Brokers (2.4%) | |
Aries Vermoegensverwaltungs
9.60%, due 10/25/2014 | | | 5,000 | | | | 6,406 | | |
| Oil & Gas Extraction (8.9%) | |
Gaz Capital for Gazprom
8.63%, due 04/28/2034 | | | 3,230 | | | | 4,067 | | |
Pemex Project Funding Master Trust
5.17%, due 06/15/2010 *
9.13%, due 10/13/2010
9.75%, due 09/15/2027
9.75%, due 09/15/2027 | | | 2,700
3,500
660
990 | | | | 2,798
4,020
849
1,274 | | |
Pemex Project Funding Master Trust–144A
5.17%, due 06/15/2010 *
8.88%, due 12/01/2023
9.75%, due 09/15/2027
9.75%, due 09/15/2027 | | | 1,500
1,750
2,000
3,070 | | | | 1,554
2,083
2,584
3,966 | | |
| Paper & Paper Products (3.7%) | |
Empresa Nacional de Petroleo
6.75%, due 11/15/2012 | | | 3,150 | | | | 3,355 | | |
The notes to the financial statements are an integral part of this report.
Transamerica IDEX Mutual Funds
Annual Report 2005
4
TA IDEX Van Kampen Emerging Markets Debt
SCHEDULE OF INVESTMENTS (continued)
At October 31, 2005
(all amounts except share amounts in thousands)
| | | Principal | | Value | |
| Paper & Paper Products (continued) | |
Pindo Deli Finance Mauritius
| |
| 0.00%, due 04/29/2018 * | | $ | 1,500 | | | $ | 330 | | |
| 5.25%, due 04/29/2018 * | | | 1,500 | | | | 788 | | |
Pindo Deli Finance Mauritius–144A
4.68%, due 04/29/2015 *
4.68%, due 04/29/2018 *
4.68%, due 04/29/2018 *
0.00%, due 04/29/2027 * | | | 365
950
984
1,915 | | | | 305
499
821
421 | | |
Tjiwi Kimia Finance Mauritius, Ltd.
5.25%, due 04/28/2018 *
5.25%, due 04/28/2018 *
0.00%, due 04/28/2027 * | | | 1,054
1,000
1,500 | | | | 907
660
413 | | |
Tjiwi Kimia Finance Mauritius, Ltd.–144A
5.25%, due 04/29/2015 *
5.25%, due 04/28/2018 *
0.00%, due 04/29/2027 * | | | 329
846
1,045 | | | | 283
558
287 | | |
| Security & Commodity Brokers (3.1%) | |
Citigroup Global Markets Holdings, Inc.–144A
Zero Coupon, due 04/13/2006
Zero Coupon, due 05/25/2006 | | | 1,600
2,500 | | | | 2,092
2,773 | | |
Credit Suisse First Boston, Note
7.20%, due 08/20/2011 | | | 3,100 | | | | 3,134 | | |
| Total Corporate Debt Securities (cost: $49,163) | | | | | | | 50,711 | | |
| Total Investment Securities (cost: $238,621) | | | | | | $ | 243,430 | | |
| SUMMARY: | |
| Investment securities, at value | | | 93.1 | % | | $ | 243,430 | | |
| Other assets in excess of liabilities | | | 6.9 | % | | | 18,174 | | |
| Net assets | | | 100.0 | % | | $ | 261,604 | | |
FUTURES CONTRACTS:
| | | Contracts | | Settlement
Date | | Amount | | Net Unrealized
Appreciation
(Depreciation) | |
| U.S. 2 Year Note (CBT) d | | | 314 | | | | 12/30/2005 | | | $ | (64,434 | ) | | $ | 467 | | |
| | | | | | | | | | | $ | (64,434 | ) | | $ | 467 | | |
NOTES TO SCHEDULE OF INVESTMENTS:
* Floating or variable rate note. Rate is listed as of October 31, 2005.
v Securities are currently in default on interest payments.
(a) Argentine Republic has a coupon rate of 1.33% until 03/31/2009, a coupon rate of 2.50% until 03/31/2019, a coupon rate of 3.75% until 03/31/2029, and thereafter the coupon rate will be 5.25%.
(b) Russian Federation has a coupon rate of 5.00% until 03/31/2007, thereafter the coupon rate will become 7.50%.
d At October 31, 2005, the Fund has cash in the amount of $134, segregated with the custodian to cover margin requirements for open future contracts.
DEFINITIONS:
144A 144A Securities are registered pursuant to Rule 144A of the Securities Act of 1933. These securities are deemed to be liquid for purposes of compliance limitations on holdings of illiquid securities and may be resold as transactions exempt from registration, normally to qualified institutional buyers. At October 31, 2005, these securities aggregated $20,243 or 7.7% of the net assets of the Fund.
CBT Chicago Board of Trade
The notes to the financial statements are an integral part of this report.
Transamerica IDEX Mutual Funds
Annual Report 2005
5
TA IDEX Van Kampen Emerging Markets Debt
STATEMENT OF ASSETS AND LIABILITIES
At October 31, 2005
(all amounts except share amounts in thousands)
| Assets: | |
| Investment securities, at value (cost: $238,621) | | $ | 243,430 | | |
| Cash | | | 14,815 | | |
| Receivables: | |
| Shares of beneficial interest sold | | | 2,073 | | |
| Interest | | | 3,599 | | |
| Variation margin | | | 5 | | |
| Other | | | 46 | | |
| | | | 263,968 | | |
| Liabilities: | |
| Investment securities purchased | | | 1,533 | | |
| Accounts payable and accrued liabilities: | |
| Management and advisory fees | | | 224 | | |
| Distribution and service fees | | | 36 | | |
| Administration fees | | | 4 | | |
| Dividends to shareholders | | | 525 | | |
| Other | | | 42 | | |
| | | | 2,364 | | |
| Net Assets | | $ | 261,604 | | |
| Net Assets Consist of: | |
Shares of beneficial interest, unlimited shares
authorized, no par value | | $ | 255,257 | | |
| Undistributed net investment income (loss) | | | (25 | ) | |
Undistributed net realized gain (loss) from
investment securities and futures contracts | | | 1,096 | | |
| Net unrealized appreciation (depreciation) on: | |
| Investment securities | | | 4,809 | | |
| Futures contracts | | | 467 | | |
| Net Assets | | $ | 261,604 | | |
| Net Assets by Class: | |
| Class A | | $ | 125,582 | | |
| Class I | | | 136,022 | | |
| Shares Outstanding: | |
| Class A | | | 12,020 | | |
| Class I | | | 13,010 | | |
| Net Asset Value and Offering Price Per Share: | |
| Class A | | $ | 10.45 | | |
| Class I | | | 10.45 | | |
STATEMENT OF OPERATIONS
For the period ended October 31, 2005 (a)
(all amounts in thousands)
| Investment Income: | |
| Interest | | $ | 7,805 | | |
| Expenses: | |
| Management and advisory fees | | | 1,237 | | |
| Distribution and service fees: | |
| Class A | | | 200 | | |
| Printing and shareholder reports | | | 2 | | |
| Custody fees | | | 77 | | |
| Administration fees | | | 26 | | |
| Legal fees | | | 6 | | |
| Audit fees | | | 22 | | |
| Trustees fees | | | 4 | | |
| Registration fees: | |
| Class A | | | 10 | | |
| Class I | | | 9 | | |
| Other | | | 1 | | |
| Total expenses | | | 1,594 | | |
| Net Investment Income (Loss) | | | 6,211 | | |
| Net Realized Gain (Loss) from: | |
| Investment securities | | | 1,204 | | |
| Futures contracts | | | (108 | ) | |
| | | | 1,096 | | |
Net Increase (Decrease) in Unrealized
Appreciation (Depreciation) on: | |
| Investment securities | | | 4,809 | | |
| Futures contracts | | | 467 | | |
| | | | 5,276 | | |
Net Gain (Loss) on Investment Securities and
Futures Contracts | | | 6,372 | | |
Net Increase (Decrease) in Net Assets Resulting
from Operations | | $ | 12,583 | | |
(a) TA IDEX Van Kampen Emerging Markets Debt ("the Fund") commenced operations on November 8, 2004. The inception date for the Fund's offering of share Class A was March 1, 2005.
The notes to the financial statements are an integral part of this report.
Transamerica IDEX Mutual Funds
Annual Report 2005
6
TA IDEX Van Kampen Emerging Markets Debt
STATEMENTS OF CHANGES IN NET ASSETS
For the period ended
(all amounts in thousands)
| | | October 31,
2005 (a) | |
| Increase (Decrease) In Net Assets From: | |
| Operations: | |
| Net investment income (loss) | | $ | 6,211 | | |
Net realized gain (loss) from
investment securities and
futures contracts | | | 1,096 | | |
Net unrealized appreciation
(depreciation) on investment
securities and futures contracts | | | 5,276 | | |
| | | | 12,583 | | |
| Distributions to Shareholders: | |
| From net investment income: | |
| Class A | | | (2,621 | ) | |
| Class I | | | (3,615 | ) | |
| | | | (6,236 | ) | |
| Capital Share Transactions: | |
| Proceeds from shares sold: | |
| Class A | | | 119,971 | | |
| Class I | | | 129,575 | | |
| | | | 249,546 | | |
Dividends and distributions
reinvested: | |
| Class A | | | 2,378 | | |
| Class I | | | 3,333 | | |
| | | | 5,711 | | |
| | | | 255,257 | | |
| Net increase (decrease) in net assets | | | 261,604 | | |
| Net Assets: | |
| Beginning of period | | | – | | |
| End of period | | $ | 261,604 | | |
Undistributed Net Investment Income
(Loss) | | $ | (25 | ) | |
| Share Activity: | |
| Shares issued: | |
| Class A | | | 11,788 | | |
| Class I | | | 12,685 | | |
| | | | 24,473 | | |
Shares issued–reinvested from
distributions: | |
| Class A | | | 232 | | |
| Class I | | | 325 | | |
| | | | 557 | | |
Net increase (decrease) in shares
outstanding: | |
| Class A | | | 12,020 | | |
| Class I | | | 13,010 | | |
| | | | 25,030 | | |
(a) TA IDEX Van Kampen Emerging Markets Debt ("the Fund") commenced operations on November 8, 2004. The inception date for the Fund's offering of share Class A was March 1, 2005.
The notes to the financial statements are an integral part of this report.
Transamerica IDEX Mutual Funds
Annual Report 2005
7
TA IDEX Van Kampen Emerging Markets Debt
FINANCIAL HIGHLIGHTS
| | | | | For a share of beneficial interest outstanding throughout the period | |
| | | | | Net Asset | | Investment Operations | | Distributions | | Net Asset | |
| | | For the
Period
Ended (d)(g) | | Value,
Beginning
of Period | | Net
Investment
Income (Loss) | | Net Realized
and Unrealized
Gain (Loss) | | Total
Operations | | From Net
Investment
Income | | From Net
Realized
Gains | | Total
Distributions | | Value,
End
of Period | |
| Class A | | 10/31/2005 | | $ | 10.00 | | | $ | 0.31 | | | $ | 0.46 | | | $ | 0.77 | | | $ | (0.32 | ) | | $ | – | | | $ | (0.32 | ) | | $ | 10.45 | | |
| Class I | | 10/31/2005 | | | 10.00 | | | | 0.49 | | | | 0.45 | | | | 0.94 | | | | (0.49 | ) | | | – | | | | (0.49 | ) | | | 10.45 | | |
| | | | | | | Ratios/Supplemental Data | |
| | | For the
Period | | Total | | Net Assets,
End of
Period | | Ratio of Expenses
to Average
Net Assets (a) | | Net Investment
Income (Loss)
to Average | | Portfolio
Turnover | |
| | | Ended (g) | | Return (c) | | (000's) | | Net (e) | | Total (f) | | Net Assets (a) | | Rate (b) | |
| Class A | | 10/31/2005 | | | 4.90 | % | | $ | 125,582 | | | | 1.42 | % | | | 1.42 | % | | | 4.53 | % | | | 67 | % | |
| Class I | | 10/31/2005 | | | 9.36 | | | | 136,022 | | | | 1.07 | | | | 1.07 | | | | 4.91 | | | | 67 | | |
NOTES TO FINANCIAL HIGHLIGHTS
(a) Annualized.
(b) Not annualized.
(c) Total Return has been calculated for the applicable period without deduction of a sales load, if any, on an initial purchase. Periods of less than one year are not annualized.
(d) Per share information is calculated based on average number of shares outstanding.
(e) Ratio of Net Expenses to Average Net Assets is net of fee waivers and reimbursements by the investment adviser, if any (see note 2).
(f) Ratio of Total Expenses to Average Net Assets includes all expenses before fee waivers and reimbursments by the investment adviser.
(g) TA IDEX Van Kampen Emerging Markets Debt ("the Fund") commenced operations on November 8, 2004. The inception date for the Fund's offering of share Class A was March 1, 2005.
The notes to the financial statements are an integral part of this report.
Transamerica IDEX Mutual Funds
Annual Report 2005
8
TA IDEX Van Kampen Emerging Markets Debt
NOTES TO FINANCIAL STATEMENTS
At October 31, 2005
(all amounts in thousands)
NOTE 1. ORGANIZATION AND SIGNIFICANT ACCOUNTING POLICIES
Transamerica IDEX Mutual Funds is an open-end management investment company registered under the Investment Company Act of 1940, as amended (the "1940 Act"). TA IDEX Van Kampen Emerging Markets Debt (the "Fund") began operations on November 8, 2004.
In the normal course of business, the Fund enters into contracts that contain a variety of representations that provide general indemnifications. The Fund's maximum exposure under these arrangements is unknown, as this would involve future claims that may be made against the Fund and/or its affiliates that have not yet occurred. However, based on experience, the Fund expects the risk of loss to be remote.
This report should be read in conjunction with the current Fund prospectus, which contains more complete information about the Fund.
The following is a summary of significant accounting policies followed by the Fund in the preparation of the financial statements. In preparing the Fund's financial statements in accordance with accounting principles generally accepted in the United States of America ("GAAP"), estimates or assumptions (which could differ from actual results) may be used that affect reported amounts and disclosures.
Multiple class operations, income and expenses: The Fund currently offers two classes of shares, Class A and Class I, each with a public offering price that reflects different sales charges, if any, and expense levels. The initial sales charge currently is waived as this Fund is available for investment only by certain strategic asset allocation funds. Income, non-class specific expenses and realized and unrealized gains and losses, are allocated daily to each class, based upon the value of shares outstanding method as permitted under Rule 18f-3 of the 1940 Act. Each class bears its own specific expenses as well as a portion of general, common expenses.
Class I shares are offered for investment to the asset allocation funds of AEGON/Transamerica Series Trust (ATST).
Security valuations: The Fund values its investments at the close of the New York Stock Exchange ("NYSE"), normally 4 p.m. ET, each day the NYSE is open for business. Fund investments are valued at the last sale price or closing price on the day of valuation taken from the primary exchange where the security is principally traded.
Securities traded in the over-the-counter market and listed securities for which no sale was reported on that date are valued at the last quoted bid price.
Debt securities are valued based on a price quotation or other equivalent indication of value supplied by an exchange, a pricing service or a major market maker; however, those that mature in sixty days or less are valued at amortized cost, which approximates market.
Foreign securities generally are valued based on quotations from the primary market in which they are traded. Because many foreign securities markets and exchanges close prior to the close of the NYSE, closing prices for foreign securities in those markets or on those exchanges do not reflect the events that occur after that close. If a significant market event impacting the value of a portfolio security (e.g., natural disaster, company announcement, market volatility) occurs subsequent to the close of trading in the security, but prior to the calculation of the Fund's net asset value per share, market quotations for that security may be determined to be unreliable and, accordingly, not "readily available." As a result, foreign equity securities held by the Fund may be valued at fair market value as determined in good faith by the Fund's Administrative Valuation Committee, under the supervision of the Board's Valuation Committee , using guidelines adopted by the Board of Trustees.
Other securities for which quotations are not readily available or whose values have been determined to be unreliable are valued at fair market value as determined in good faith by the Fund's Administrative Valuation Committee, under the supervision of the Board's Valuation Committee, using guidelines adopted by the Board of Trustees.
Cash: The Fund may leave cash overnight in its cash account with the custodian, Investors Bank & Trust Company ("IBT"). IBT has been contracted on behalf of the Fund to invest the excess cash into a savings account, which at October 31, 2005, was paying an interest rate of 2.76%.
Security transactions and investment income: Security transactions are recorded on the trade date. Security gains and losses are calculated on the specific identification basis. Dividend income, if any, is recorded on the ex-dividend date or, in the case of foreign securities, as soon as the Fund is informed of the ex-dividend date. Interest income, including accretion of discounts and amortization of premiums, is recorded on the accrual basis commencing on the settlement date.
Foreign currency denominated investments: The accounting records of the Fund are maintained in U.S. dollars. Securities and other assets and liabilities denominated in foreign currencies are translated into U.S. dollars at the closing exchange rate each day. The cost of foreign securities is translated at the exchange rate in effect when the investment was acquired. The Fund combines fluctuations from currency exchange rates and fluctuations in value when computing net realized and unrealized gains or losses from investments.
Net foreign currency gains and losses resulting from changes in exchange rates include: 1) foreign currency fluctuations between trade date and settlement date of investment security transactions; 2) gains and losses on forward foreign currency contracts; and 3) the difference between the
Transamerica IDEX Mutual Funds
Annual Report 2005
9
TA IDEX Van Kampen Emerging Markets Debt
NOTES TO FINANCIAL STATEMENTS (continued)
At October 31, 2005
(all amounts in thousands)
NOTE 1.–(continued)
receivable amounts of interest and dividends recorded in the accounting records in U.S. dollars and the amounts actually received.
Foreign currency denominated assets may involve risks not typically associated with domestic transactions. These risks include revaluation of currencies, adverse fluctuations in foreign currency values and possible adverse political, social and economic developments, including those particular to a specific industry, country or region.
Foreign capital gains taxes: The Fund may be subject to taxes imposed by countries in which it invests, with respect to its investment in issuers existing or operating in such countries. Such taxes are generally based on income earned or repatriated and capital gains realized on the sale of such investments. The Fund accrues such taxes when the related income or capital gains are earned. Some countries require governmental approval for the repatriation of investment income, capital or the proceeds of sales earned by foreign investors. In addition, if there is deterioration in a country's balance of payments or for other reasons, a country may impose temporary restrictions on foreign capital remittances abroad.
Forward foreign currency contracts: The Fund may enter into forward foreign currency contracts to hedge against exchange rate risk arising from investments in securities denominated in foreign currencies. Contracts are valued at the contractual forward rate and are marked to market daily, with the change in value recorded as an unrealized gain or loss. When the contracts are settled a realized gain or loss is incurred. Risks may arise from changes in market value of the underlying currencies and from the possible inability of counterparties to meet the terms of their contracts.
Futures contracts: The Fund may enter into futures contracts to manage exposure to market, interest rate or currency fluctuations. Futures contracts are valued at the settlement price established each day by the board of trade or exchange on which they are traded. The primary risks associated with futures contracts are imperfect correlation between the change in market value of the securities held and the prices of futures contracts; the possibility of an illiquid market and inability of the counterparty to meet the contract terms.
Open futures contracts at October 31, 2005, are listed in the Schedule of Investments.
Redemption fees: A short-term trading redemption fee may be assessed on any Fund shares in a fund account that are sold during the first five (5) NYSE trading days following their purchase date. This redemption fee will equal 2% of the amount redeemed and shares held the longest will be treated as being redeemed first and shares held the shortest as being redeemed last. For the period from inception through October 31, 2005, the Fund received no redemption fees.
Dividend distributions: Distributions to shareholders are recorded on the ex-dividend date and are determined in accordance with Federal income tax regulations which may differ from GAAP.
NOTE 2. RELATED PARTY TRANSACTIONS
Effective January 1, 2005 AEGON/Transamerica Fund Advisors, Inc. was renamed Transamerica Fund Advisors, Inc. ("TFAI"); AEGON/Transamerica Fund Services, Inc. and AEGON/Transamerica Investor Services, Inc. merged into one entity and was renamed Transamerica Fund Services, Inc. ("TFS").
TFAI is the Fund's investment adviser. TFS is the Fund's administrator and transfer agent. AFSG Securities Corp. ("AFSG") is the Fund's distributor/principal underwriter. TFAI, TFS , and AFSG are affiliates of AEGON, NV, a Netherlands corporation.
The following schedule reflects the percentage of Fund assets owned by affiliated mutual funds:
| | | Net
Assets | | % of
Net Assets | |
TA IDEX Asset Allocation–
Conservative Portfolio | | $ | 13,789 | | | | 5.27 | % | |
TA IDEX Asset Allocation–
Growth Portfolio | | | 22,634 | | | | 8.65 | % | |
TA IDEX Asset Allocation–
Moderate Growth Portfolio | | | 58,540 | | | | 22.38 | % | |
TA IDEX Asset Allocation–
Moderate Portfolio | | | 30,617 | | | | 11.70 | % | |
| Asset Allocation–Conservative Portfolio | | | 7,950 | | | | 3.04 | % | |
| Asset Allocation–Growth Portfolio | | | 25,074 | | | | 9.58 | % | |
Asset Allocation–Moderate
Growth Portfolio | | | 76,953 | | | | 29.41 | % | |
| Asset Allocation–Moderate Portfolio | | | 24,666 | | | | 9.43 | % | |
| Total | | $ | 260,223 | | | | 99.46 | % | |
Investment advisory fees: The Fund pays management fees to TFAI based on average daily net assets ("ANA") at the following breakpoints:
0.95% of the first $250 million of ANA
0.90% of the next $250 million of ANA
0.80% of ANA over $500 million
Transamerica IDEX Mutual Funds
Annual Report 2005
10
TA IDEX Van Kampen Emerging Markets Debt
NOTES TO FINANCIAL STATEMENTS (continued)
At October 31, 2005
(all amounts in thousands)
NOTE 2.–(continued)
TFAI has contractually agreed to waive its advisory fee and will reimburse the Fund to the extent that operating expenses exceed the following stated annual limit:
From November 8, 2004 through May 27, 2005:
1.15% Expense Limit (including 12b-1 fees)
From May 28, 2005 on:
1.15% Expense Limit (excluding 12b-1 fees)
If total Fund expenses fall below the annual expense limitation agreement agreed to by the adviser within the succeeding three years, the Fund may be required to pay that adviser a portion or all of the reimbursed class expenses.
There were no amounts recaptured during the period from inception through October 31, 2005. There were no amounts available for recapture at October 31, 2005.
Distribution and service fees: The Fund has a 12b-1 distribution plan under the 1940 Act pursuant to which an annual fee, based on average daily net assets, is paid to the distributor for various disbursements such as broker-dealer account servicing fees and other promotional expenses of the Fund. The Fund is authorized under the 12b-1 plan to pay fees on each class up to the following limits:
| Class A | | | 0.35 | % | |
| Class I | | | N/A | | |
In the case the Fund or a class of shares of the Fund is closed to new investors or investments, the Fund is authorized to pay 12b-1 fees for past sales and distribution efforts and present and past investor services.
Administrative services: The Fund has entered into an agreement with TFS for financial and legal fund administration services. As of January 1, 2005 the Fund pays TFS an annual fee of 0.02% of ANA. Prior to January 1, 2005 the Fund paid TFS an annual fee of 0.015% of ANA. The Legal fees on the Statement of Operations are for fees paid to external legal counsel.
Transfer agent fees: The Fund pays TFS an annual per-account charge for each open and closed account. The Fund paid TFS less than $1 for the period from inception through October 31, 2005.
NOTE 3. INVESTMENT TRANSACTIONS
The cost of securities purchased and proceeds from securities sold (excluding short-term securities) for the period from inception through October 31, 2005, were as follows:
Purchases of securities:
| Long-Term | | $ | 319,418 | | |
| U.S. Government | | | – | | |
Proceeds from maturities and sales of securities:
| Long-Term | | | – | | |
| U.S. Government | | | 82,052 | | |
NOTE 4. FEDERAL INCOME TAX MATTERS
The Fund has not made any provision for federal income or excise taxes due to its policy to distribute all of its taxable income and capital gains to its shareholders and otherwise qualify as a regulated investment company under Subchapter M of the Internal Revenue Code. Income and capital gain distributions are determined in accordance with income tax regulations, which may differ from GAAP. These differences are primarily due to differing treatment for items including, but not limited to, wash sales, dividends payable, defaulted bonds and foreign currency transactions.
The tax character of distributions paid may differ from the character of distributions shown in the Statement of Changes in Net Assets due to short-term gains being treated as ordinary income for tax purposes. The tax character of distributions paid during 2005 was as follows:
2005 Distributions paid from:
| Ordinary Income | | $ | 6,236 | | |
| Long-term capital gain | | | – | | |
The tax basis components of distributable earnings as of October 31, 2005, are as follows:
| Undistributed Ordinary Income | | $ | 1,428 | | |
| Undistributed Long-term Capital Gains | | $ | 215 | | |
| Capital Loss Carryforward | | $ | – | | |
| Net Unrealized Appreciation (Depreciation) | | $ | 4,704 | * | |
* Amount includes unrealized appreciation (depreciation) from futures.
The aggregate cost of investments and composition of unrealized appreciation (depreciation) for federal income tax purposes as of October 31, 2005, are as follows:
| Federal Tax Cost Basis | | $ | 238,726 | | |
| Unrealized Appreciation | | $ | 5,583 | | |
| Unrealized (Depreciation) | | | (879 | ) | |
| Net Unrealized Appreciation (Depreciation) | | $ | 4,704 | | |
Transamerica IDEX Mutual Funds
Annual Report 2005
11
TA IDEX Van Kampen Emerging Markets Debt
NOTES TO FINANCIAL STATEMENTS (continued)
At October 31, 2005
(all amounts in thousands)
NOTE 5. REGULATORY PROCEEDINGS
There continues to be significant federal and state regulatory activity relating to financial services companies, particularly mutual fund companies and their investment advisers. As part of an ongoing investigation regarding potential market timing, recordkeeping and trading compliance issues and matters affecting the Fund's investment adviser, TFAI, and certain affiliates and former employees of TFAI, the SEC staff has indicated that it is likely to take some action against TFAI and certain of its affiliates at the conclusion of the investigation. The potential timing and the scope of any such action is difficult to predict. Although the impact of any action brought against TFAI and/or its affiliates is difficult to assess at the present time, the Fund currently believes that the likelihood that any such action will have a material adverse impact on it is remote. It is important to note that the Fund is not aware of any allega tion of wrongdoing against it and its Board at the time this annual report is printed. Although it is not anticipated that these developments will have an adverse impact on the Fund, there can be no assurance at this time. TFAI and its affiliates are actively working with the SEC in regard to this matter; however, the exact resolution cannot be determined at this time. TFAI will take such actions that it deems necessary or appropriate to continue providing management services to the Fund and to bring all matters to an appropriate conclusion.
TFAI and/or its affiliates, and not the Fund, will bear the costs regarding these regulatory matters.
Transamerica IDEX Mutual Funds
Annual Report 2005
12
Report of Independent Registered Certified Public Accounting Firm
To the Board of Trustees and Shareholders of
TA IDEX Van Kampen Emerging Markets Debt
In our opinion, the accompanying statement of assets and liabilities, including the schedule of investments, and the related statements of operations and of changes in net assets and the financial highlights present fairly, in all material respects, the financial position of TA IDEX Van Kampen Emerging Markets Debt (the "Fund") (one of the portfolios constituting the Transamerica IDEX Mutual Funds) at October 31, 2005, the results of its operations , the changes in its net assets and the financial highlights for the period November 8, 2004 (commencement of operations) through October 31, 2005, in conformity with accounting principles generally accepted in the United States of America. These financial statements and financial highlights (hereafter referred to as "financial statements") are the responsibility of the Fund's management; our responsibility is to express an opinion on these financial statements based on our audit. We conducted our audit of these financial statements in accordance with the standards of the Public Company Accounting Oversight Board (United States). Those standards require that we plan and perform the audit to obtain reasonable assurance about whether the financial statements are free of material misstatement. An audit includes examining, on a test basis, evidence supporting the amounts and disclosures in the financial statements, assessing the accounting principles used and significant estimates made by management, and evaluating the overall financial statement presentation. We believe that our audit, which included confirmation of securities at October 31, 2005 by correspondence with the custodian, provide a reasonable basis for our opinion.

December 22, 2005
Transamerica IDEX Mutual Funds
Annual Report 2005
13
TA IDEX Van Kampen Emerging Markets Debt (unaudited)
A discussion regarding the basis of Transamerica IDEX Mutual Funds' Board of Trustees' approval of the fund's advisory arrangements will be available in the fund's semi-annual report for the period ending April 30, 2006.
Transamerica IDEX Mutual Funds
Annual Report 2005
14
TA IDEX Van Kampen Small Company Growth
MARKET ENVIRONMENT
During the reporting period ending October 31, 2005 the stock market advanced at a respectable, although uneven, clip. The economy continued to grow, companies generally met or exceeded their earnings targets, and core inflation, which excludes food and energy, remained tame. Increased merger-and-acquisition activity and several high-profile initial public offerings boosted interest in stocks, particularly during the final months of 2004. Despite little relief from high prices at the gas pump, consumers, for the most part, continued to spend.
However, volatility and pockets of poorer sentiment were not uncommon. The market's most significant uncertainties included the high price of crude oil and the rising interest rate environment. Energy prices skyrocketed, driven by tight supply, rising demand, and geopolitical instability. The Gulf Coast hurricanes intensified concerns about oil and natural gas production and the impact that rising prices would have on consumer spending. The Federal Reserve Board continued its series of interest rate increases, disappointing some investors who believed a prolonged monetary tightening policy could potentially stifle economic growth. Against this backdrop, the period ended on a more downbeat note.
For the period overall, value stocks outperformed growth stocks, and mid- and small-capitalization stocks outperformed their large-cap counterparts. On a sector basis, energy stocks led the market, supported by a supply-demand imbalance.
PERFORMANCE
For the period from inception November 8, 2004 through October 31, 2005, TA IDEX Van Kampen Small Company Growth, Class I returned 12.80%. By comparison its benchmark, the Russell 2000 Growth Index ("Russell 2000 Growth"), returned 6.84%.
STRATEGY REVIEW
Throughout the period, we used our intensive fundamental research process to seek high-quality growth companies. Our investment discipline favors companies that have high barriers to entry, business visibility, rising return on invested capital, free cash flow and a favorable risk/ reward profile. Our emphasis is on secular growth, and as a result, short-term market events are not as meaningful in the stock selection process.
As of the end of the reporting period, consumer discretionary was the portfolio's largest sector weight and largest overweight versus the Russell 2000 Growth. Meanwhile, the portfolio's largest underweight was in the technology sector.
The portfolio outperformed the Russell 2000 Growth due to stock selection, while sector allocation also added positively to relative performance. In particular, the portfolio benefited from stock selection in the technology, utilities and financial services sectors. Within technology, holdings in the communications technology industry and computer services and software industry were notable contributors. Among the portfolio's utilities stake, exposure to gas distributors proved particularly beneficial. Diversified financials were a notable boon within the portfolio's financial stake. Also on the upside, energy stocks buoyed performance, due primarily to crude oil producer holdings. In terms of broader sector weightings, the portfolio's performance relative to the index benefited from underweightings in technology and financial services, as well as from a modest overweighting in utilities stocks.
In contrast, stock selection in the integrated oils industry detracted from performance. A sector overweight in the consumer staples sector also slowed the portfolio's pace. Despite advantageous stock selection within the consumer discretionary sector, the portfolio's relative performance was hindered by its large overweight to the sector.
Investment Team
Morgan Stanley Investment Management Inc.
This Fund is only available for investment by the Asset Allocation Portfolios.
Transamerica IDEX Mutual Funds
Annual Report 2005
1
TA IDEX Van Kampen Small Company Growth
Comparison of change in value of $10,000 investment in Class I shares and its comparative index.
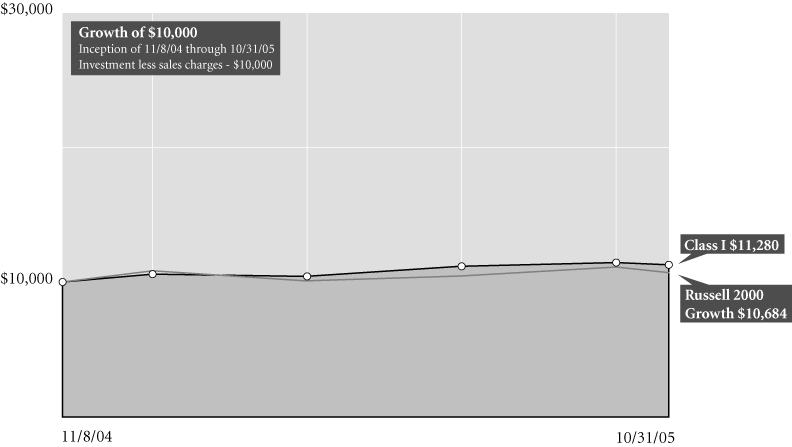
Total Return for Period Ended 10/31/05
| | | From
Inception | | Inception
Date | |
| Class A (NAV) | | | 4.94 | % | | 3/1/05 | |
| Class I (NAV) | | | 12.80 | % | | 11/8/04 | |
| Russell 2000 Growth1 | | | 6.84 | % | | 11/8/04 | |
NOTES
1 The Russell 2000 Growth (Russell 2000 Growth) Index is an unmanaged index used as a general measure of market performance. Calculations assume dividends and capital gains are reinvested and do not include any managerial expenses. From inception calculation is based on life of Class I shares. Source: Standard & Poor's Micropal®© Micropal, Inc. 2005 – 1-800-596-5323 – http://www.funds-sp.com.
The performance data presented represents past performance, future results may vary. Performance data does not reflect the deduction of taxes that would be paid on fund distributions or the redemption of fund shares. Investment return and principal value will fluctuate so that an investor's shares, when redeemed, may be worth more or less than their original cost. Current performance may be lower or higher than performance quoted. Please see www.transamericaidex.com for performance data current to the most recent month-end.
Net Asset Value (NAV) returns include the reinvestment of dividends and capital gains. Class A shares are sold without a sales load.
Investing in small cap stocks generally involves greater risks so an investment in the Fund may not be appropriate for everyone.
This material must be preceded or accompanied by a current prospectus, which includes specific contents regarding the investment objectives and policies of this fund.
Transamerica IDEX Mutual Funds
Annual Report 2005
2
TA IDEX Van Kampen Small Company Growth
UNDERSTANDING YOUR FUND'S EXPENSES
(unaudited)
SHAREHOLDER EXPENSES
Fund shareholders may incur ongoing costs, including management fees, 12b-1 distribution and service fees, and other fund expenses. Shares of the fund currently are sold only to certain Transamerica IDEX Mutual Funds and AEGON/Transamerica Series Trust (an affiliate of Transamerica IDEX Mutual Funds) asset allocation funds at net asset value, without any transactional costs.
The following Example is intended to help you understand your ongoing costs (in dollars and cents) of investing in a Fund and to compare these costs with the ongoing costs of investing in other funds.
The Example is based on an investment of $1,000 invested at May 1, 2005 and held for the entire period until October 31, 2005.
ACTUAL EXPENSES
The first line in the table below provides information about actual account values and actual expenses. You may use the information in this line, together with the amount you invested, to estimate the expenses that you paid over the period. Simply divide your account value by $1,000 (for example, an $8,600 account value divided by $1,000 = 8.6), then multiply the result by the number in the first line of your Fund under the heading entitled "Expenses Paid During Period" to estimate the expenses you paid on your account during this period.
HYPOTHETICAL EXAMPLE FOR COMPARISON PURPOSES
The second line in the table below provides information about hypothetical account values and hypothetical expenses based on the Fund's actual expense ratio and an assumed rate of return of 5% per year before expenses, which is not the Fund's actual return. The hypothetical account values and expenses may not be used to estimate the actual ending account balance or expenses you paid for the period. You may use this information to compare the ongoing costs of investing in your Fund and other funds. To do so, compare this 5% hypothetical example with the 5% hypothetical examples that appear in the shareholder reports of the other funds.
Please note that the expenses shown in the table are meant to highlight your ongoing costs only and do not reflect any transactional costs, such as sales charges, redemption fees, brokerage commissions paid on purchases and sales of fund shares. Therefore, the second line under the Fund in the table is useful in comparing ongoing costs only, and will not help you determine the relative total costs of owning different funds.
| | | Beginning
Account
Value | | Ending
Account
Value | | Annualized
Expense
Ratio | | Expenses Paid
During Period (a) | |
| Class A | |
| Actual | | $ | 1,000.00 | | | $ | 1,131.70 | | | | 1.44 | % | | $ | 7.74 | | |
| Hypothetical (b) | | | 1,000.00 | | | | 1,017.95 | | | | 1.44 | | | | 7.32 | | |
| Class I | |
| Actual | | | 1,000.00 | | | | 1,132.50 | | | | 1.05 | | | | 5.64 | | |
| Hypothetical (b) | | | 1,000.00 | | | | 1,019.91 | | | | 1.05 | | | | 5.35 | | |
(a) Expenses are calculated using each Fund's annualized expense ratio (as disclosed in the table), multiplied by the average account value for the period, multiplied by number of days in the period (184 days), and divided by the number of days in the year (365 days).
(b) 5% return per year before expenses.
GRAPHICAL PRESENTATION OF SCHEDULE OF INVESTMENTS
By Sector
At October 31, 2005

This chart shows the percentage breakdown by sector of the Fund's total investment securities.
Transamerica IDEX Mutual Funds
Annual Report 2005
3
TA IDEX Van Kampen Small Company Growth
SCHEDULE OF INVESTMENTS
At October 31, 2005
(all amounts except share amounts in thousands)
| | | Shares | | Value | |
| COMMON STOCKS (94.3%) | |
| Agriculture (1.1%) | |
| VCA Antech, Inc. ‡† | | | 66,220 | | | $ | 1,708 | | |
| Amusement & Recreation Services (4.1%) | |
| Gaylord Entertainment Co. ‡ | | | 85,240 | | | | 3,365 | | |
| Lakes Entertainment, Inc. ‡† | | | 57,015 | | | | 533 | | |
| WMS Industries, Inc. ‡† | | | 106,235 | | | | 2,670 | | |
| Apparel & Accessory Stores (2.7%) | |
| Carter's, Inc. ‡ | | | 40,795 | | | | 2,576 | | |
| Citi Trends, Inc. ‡† | | | 59,510 | | | | 1,704 | | |
| Apparel Products (0.8%) | |
| Maidenform Brands, Inc. ‡ | | | 108,150 | | | | 1,362 | | |
| Business Services (4.5%) | |
| Akamai Technologies, Inc. ‡ | | | 124,910 | | | | 2,166 | | |
| Focus Media Holding Ltd., ADR ‡ | | | 59,400 | | | | 1,560 | | |
| Macquarie Infrastructure Co. Trust | | | 76,630 | | | | 2,299 | | |
| Netease.com, ADR ‡† | | | 16,900 | | | | 1,289 | | |
| Chemicals & Allied Products (0.9%) | |
| Nuco2, Inc. ‡ | | | 63,935 | | | | 1,464 | | |
| Communication (1.0%) | |
| SBA Communications Corp. ‡ | | | 114,375 | | | | 1,689 | | |
| Computer & Data Processing Services (9.2%) | |
| Bankrate, Inc. ‡† | | | 35,800 | | | | 957 | | |
| Blackboard, Inc. ‡† | | | 66,225 | | | | 1,861 | | |
| CNET Networks, Inc. ‡ | | | 150,413 | | | | 2,044 | | |
| Convera Corp. ‡† | | | 77,500 | | | | 849 | | |
| NetFlix, Inc. ‡† | | | 70,190 | | | | 1,854 | | |
| Salesforce.com, Inc. ‡† | | | 123,940 | | | | 3,097 | | |
Shanda Interactive
Entertainment, Ltd., ADR ‡† | | | 31,455 | | | | 779 | | |
| Sina Corp. ‡† | | | 24,945 | | | | 632 | | |
| Take-Two Interactive Software, Inc. ‡† | | | 43,225 | | | | 893 | | |
| THQ, Inc. ‡ | | | 80,197 | | | | 1,859 | | |
| Educational Services (4.3%) | |
| Ambassadors Group, Inc. | | | 101,630 | | | | 2,640 | | |
| Strayer Education, Inc. † | | | 47,310 | | | | 4,235 | | |
| Electronic Components & Accessories (1.6%) | |
| Tessera Technologies, Inc. ‡ | | | 95,005 | | | | 2,651 | | |
| Engineering & Management Services (0.7%) | |
| Washington Group International, Inc. ‡† | | | 22,040 | | | | 1,095 | | |
| Environmental Services (2.6%) | |
| Stericycle, Inc. ‡ | | | 72,929 | | | | 4,198 | | |
| Food & Kindred Products (2.1%) | |
| Peet's Coffee & Tea, Inc. ‡† | | | 58,925 | | | | 1,960 | | |
| TreeHouse Foods, Inc. ‡ | | | 56,640 | | | | 1,464 | | |
| | | Shares | | Value | |
| Food Stores (1.1%) | | | |
| Pantry, Inc. (The) ‡ | | | 43,725 | | | $ | 1,692 | | |
| Furniture & Home Furnishings Stores (1.1%) | | | |
| Tuesday Morning Corp. | | | 71,195 | | | | 1,708 | | |
| Hotels & Other Lodging Places (2.4%) | | | |
| Great Wolf Resorts, Inc. ‡ | | | 99,536 | | | | 876 | | |
| Kerzner International, Ltd. ‡ | | | 50,630 | | | | 2,954 | | |
| Industrial Machinery & Equipment (1.3%) | | | |
| Middleby Corp. ‡ | | | 28,325 | | | | 2,054 | | |
| Instruments & Related Products (0.5%) | | | |
| Cyberonics, Inc. ‡† | | | 25,900 | | | | 778 | | |
| Lumber & Construction Materials (1.0%) | | | |
| Beacon Roofing Supply, Inc. ‡ | | | 61,060 | | | | 1,664 | | |
| Management Services (1.7%) | | | |
| Corporate Executive Board Co. | | | 33,250 | | | | 2,748 | | |
| Manufacturing Industries (1.8%) | | | |
| Shuffle Master, Inc. ‡† | | | 56,895 | | | | 1,443 | | |
| Yankee Candle Co., Inc. | | | 63,210 | | | | 1,429 | | |
| Medical Instruments & Supplies (3.7%) | | | |
| American Medical Systems Holdings, Inc. ‡ | | | 55,710 | | | | 911 | | |
| Animas Corp. ‡† | | | 60,580 | | | | 997 | | |
| Techne Corp. ‡ | | | 75,058 | | | | 4,070 | | |
| Oil & Gas Extraction (5.2%) | | | |
| Gasco Energy, Inc. ‡† | | | 310,495 | | | | 1,888 | | |
| Petrohawk Energy Corp. ‡ | | | 72,925 | | | | 901 | | |
| Quicksilver Resources, Inc. ‡† | | | 39,115 | | | | 1,515 | | |
| Range Resources Corp. | | | 114,945 | | | | 4,102 | | |
| Paper & Paper Products (0.9%) | | | |
| Neenah Paper, Inc. | | | 49,340 | | | | 1,433 | | |
| Personal Services (1.0%) | | | |
| Coinstar, Inc. ‡† | | | 63,685 | | | | 1,616 | | |
| Pharmaceuticals (4.6%) | | | |
| Adams Respiratory Therapeutics, Inc. ‡ | | | 32,437 | | | | 1,213 | | |
| Dade Behring Holdings, Inc. | | | 85,680 | | | | 3,085 | | |
| Flamel Technologies, ADR ‡† | | | 39,330 | | | | 701 | | |
| Idexx Laboratories, Inc. ‡ | | | 25,215 | | | | 1,768 | | |
| Noven Pharmaceuticals, Inc. ‡ | | | 45,945 | | | | 647 | | |
| Primary Metal Industries (0.7%) | | | |
| Texas Industries, Inc. | | | 22,700 | | | | 1,126 | | |
| Real Estate (3.4%) | | | |
| Desarrolladora Homex SA de CV, ADR ‡† | | | 105,620 | | | | 3,157 | | |
| Housevalues, Inc. ‡† | | | 50,160 | | | | 738 | | |
| Jones Lang Lasalle, Inc. | | | 32,970 | | | | 1,658 | | |
The notes to the financial statements are an integral part of this report.
Transamerica IDEX Mutual Funds
Annual Report 2005
4
TA IDEX Van Kampen Small Company Growth
SCHEDULE OF INVESTMENTS (continued)
At October 31, 2005
(all amounts except share amounts in thousands)
| | | Shares | | Value | |
| Research & Testing Services (3.2%) | |
| Advisory Board Co. (The) ‡ | | | 78,680 | | | $ | 3,796 | | |
| Gen-Probe, Inc. ‡ | | | 31,265 | | | | 1,277 | | |
| Restaurants (3.7%) | |
| AFC Enterprises | | | 114,770 | | | | 1,331 | | |
| BJ's Restaurants, Inc. ‡ | | | 103,270 | | | | 2,241 | | |
| PF Chang's China Bistro, Inc. ‡† | | | 52,855 | | | | 2,418 | | |
| Retail Trade (4.6%) | |
| Blue Nile, Inc. ‡† | | | 83,100 | | | | 2,981 | | |
| Build-A-Bear Workshop, Inc. ‡† | | | 70,685 | | | | 1,694 | | |
| CKX, Inc. ‡ | | | 113,585 | | | | 1,424 | | |
| Overstock.com, Inc. ‡† | | | 38,585 | | | | 1,286 | | |
| Security & Commodity Brokers (3.5%) | |
| Calamos Asset Management, Inc.–Class A | | | 65,375 | | | | 1,588 | | |
| Greenhill & Co., Inc. † | | | 84,153 | | | | 4,035 | | |
| Shoe Stores (0.6%) | |
| Eddie Bauer Holdings, Inc. ‡ | | | 41,355 | | | | 951 | | |
| Social Services (1.8%) | |
| Bright Horizons Family Solutions, Inc. ‡ | | | 73,215 | | | | 2,926 | | |
| Stone, Clay & Glass Products (1.0%) | |
| Eagle Materials, Inc. | | | 16,468 | | | | 1,638 | | |
| Tobacco Products (1.2%) | |
| Loews Corp.–Carolina Group | | | 45,925 | | | | 1,890 | | |
| Transportation Equipment (0.9%) | |
| Polaris Industries, Inc. | | | 33,600 | | | | 1,515 | | |
| Trucking & Warehousing (3.1%) | |
| Landstar System, Inc. | | | 129,125 | | | | 4,974 | | |
| Wholesale Trade Durable Goods (1.9%) | |
| SCP Pool Corp. | | | 85,710 | | | | 3,083 | | |
| Wholesale Trade Nondurable Goods (2.8%) | |
| Provide Commerce, Inc. ‡† | | | 43,275 | | | | 1,053 | | |
| Rocky Mountain Chocolate Factory, Inc. | | | 28,090 | | | | 446 | | |
| Tractor Supply Co. ‡ | | | 61,851 | | | | 3,000 | | |
| Total Common Stocks (cost: $148,262) | | | | | | | 151,872 | | |
| | | Principal | | Value | |
| SECURITY LENDING COLLATERAL (23.6%) | |
| Debt (21.9%) | |
| Bank Notes (1.5%) | |
Bank of America
| |
| 3.81%, due 06/07/2006 * | | $ | 1,070 | | | $ | 1,070 | | |
| 3.81%, due 08/10/2006 * | | | 1,061 | | | | 1,061 | | |
Credit Suisse First Boston Corp.
4.11%, due 03/10/2006 * | | | 212 | | | | 212 | | |
| | | Principal | | Value | |
| Certificates Of Deposit (1.6%) | |
Canadian Imperial Bank of Commerce
4.07%, due 11/04/2005 * | | $ | 849 | | | $ | 849 | | |
Harris Trust & Savings Bank
3.80%, due 11/04/2005 * | | | 676 | | | | 676 | | |
Rabobank Nederland
4.03%, due 05/31/2006 * | | | 1,061 | | | | 1,061 | | |
| Commercial Paper (4.7%) | |
Ciesco LLC
4.00%, due 11/03/2005 | | | 1,060 | | | | 1,060 | | |
General Electric Capital Corp.
3.96%, due 12/05/2005 | | | 849 | | | | 849 | | |
Paradigm Funding LLC–144A
4.01%, due 11/07/2005 | | | 846 | | | | 846 | | |
Park Avenue Receivables Corp.–144A
4.03%, due 12/02/2005 | | | 840 | | | | 840 | | |
Preferred Receivables Corp.–144A
4.04%, due 12/05/2005 | | | 637 | | | | 637 | | |
Ranger Funding Co. LLC–144A
3.99%, due 11/15/2005 | | | 632 | | | | 632 | | |
Sheffield Receivables Corp.–144A
4.01%, due 11/08/2005 | | | 637 | | | | 637 | | |
Yorktown Capital LLC
3.97%, due 11/09/2005
3.93%, due 11/17/2005 | | | 1,058
1,054 | | | | 1,058
1,054 | | |
| Euro Dollar Overnight (5.2%) | |
Bank of Montreal
3.79%, due 11/01/2005 | | | 637 | | | | 637 | | |
Barclays
3.80%, due 11/04/2005 | | | 849 | | | | 849 | | |
BNP Paribas
3.83%, due 11/02/2005 | | | 1,273 | | | | 1,273 | | |
Deutsche Bank
3.80%, due 11/02/2005 | | | 2,122 | | | | 2,122 | | |
HSBC Banking/Holdings PLC
3.84%, due 11/07/2005 | | | 637 | | | | 637 | | |
Royal Bank of Scotland
3.76%, due 11/01/2005 | | | 849 | | | | 849 | | |
Svenska Handlesbanken
4.03%, due 11/01/2005 | | | 1,093 | | | | 1,093 | | |
UBS AG
3.80%, due 11/03/2005 | | | 849 | | | | 849 | | |
| Euro Dollar Terms (1.8%) | |
Royal Bank of Scotland
4.00%, due 12/12/2005 | | | 849 | | | | 849 | | |
UBS AG
4.02%, due 12/01/2005 | | | 849 | | | | 849 | | |
Wells Fargo
3.96%, due 11/14/2005 | | | 1,273 | | | | 1,273 | | |
The notes to the financial statements are an integral part of this report.
Transamerica IDEX Mutual Funds
Annual Report 2005
5
TA IDEX Van Kampen Small Company Growth
SCHEDULE OF INVESTMENTS (continued)
At October 31, 2005
(all amounts except share amounts in thousands)
| | | Principal | | Value | |
| Promissory Notes (0.5%) | | | |
Goldman Sachs Group, Inc.
4.02%, due 12/28/2005 | | $ | 891 | | | $ | 891 | | |
| Repurchase Agreements (6.6%) †† | | | |
Credit Suisse First Boston Corp.
4.10%, dated 10/31/2005 to be
repurchased at $1,447 on 11/01/2005 | | | 1,446 | | | | 1,446 | | |
Goldman Sachs Group, Inc. (The)
4.10%, dated 10/31/2005 to be
repurchased at $3,608 on 11/01/2005 | | | 3,608 | | | | 3,608 | | |
Lehman Brothers, Inc.
4.10%, dated 10/31/2005 to be
repurchased at $100 on 11/01/2005 | | | 100 | | | | 100 | | |
Merrill Lynch & Co.
4.10%, dated 10/31/2005 to be
repurchased at $4,245 on 11/01/2005 | | | 4,245 | | | | 4,245 | | |
Morgan Stanley Dean Witter & Co.
4.17%, dated 10/31/2005 to be
repurchased at $1,273 on 11/01/2005 | | | 1,272 | | | | 1,272 | | |
| | | Shares | | Value | |
| Investment Companies (1.7%) | | | |
| Money Market Funds (1.7%) | | | |
American Beacon Fund
1-day yield of 3.81% | | | 915,098 | | | $ | 915 | | |
Barclays Global Investors
Institutional Money Market Fund
1-day yield of 3.92% | | | 848,935 | | | | 849 | | |
Goldman Sachs Financial Square
Prime Obligations Fund
1-day yield of 3.79% | | | 132,237 | | | | 132 | | |
Merrimac Cash Fund, Premium Class
1-day yield of 3.70% @ | | | 839,553 | | | | 840 | | |
| Total Security Lending Collateral (cost: $38,120) | | | | | | | 38,120 | | |
| Total Investment Securities (cost: $186,382) | | | | | | $ | 189,992 | | |
| SUMMARY: | | | |
| Investment securities, at value | | | 117.9 | % | | $ | 189,992 | | |
| Liabilities in excess of other assets | | | (17.9 | )% | | | (28,885 | ) | |
| Net assets | | | 100.0 | % | | $ | 161,107 | | |
NOTES TO SCHEDULE OF INVESTMENTS:
‡ Non-income producing.
† At October 31, 2005, all or a portion of this security is on loan (see Note 1). The value at October 31, 2005, of all securities on loan is $36,483.
* Floating or variable rate note. Rate is listed as of October 31, 2005.
†† Cash collateral for the Repurchase Agreements, valued at $10,885, that serve as collateral for securities lending are invested in corporate bonds with interest rates and maturity dates ranging from 0.00%–9.86% and 12/31/2005–11/15/2096, respectively.
@ Regulated investment company advised by Investors Bank and Trust Co. ("IBT"). IBT is also the accounting, custody and lending agent for the Fund.
DEFINITIONS:
144A 144A Securities are registered pursuant to Rule 144A of the Securities Act of 1933. These securities are deemed to be liquid for purposes of compliance limitations on holdings of illiquid securities and may be resold as transactions exempt from registration, normally to qualified institutional buyers. At October 31, 2005, these securities aggregated $3,592 or 2.2% of the net assets of the Fund.
ADR American Depositary Receipt
The notes to the financial statements are an integral part of this report.
Transamerica IDEX Mutual Funds
Annual Report 2005
6
TA IDEX Van Kampen Small Company Growth
STATEMENT OF ASSETS AND LIABILITIES
At October 31, 2005
(all amounts except per share amounts in thousands)
| Assets: | | | |
Investment securities, at value (cost: $186,382)
(including securities loaned of $36,483) | | $ | 189,992 | | |
| Cash | | | 7,580 | | |
| Receivables: | |
| Investment securities sold | | | 336 | | |
| Shares of beneficial interest sold | | | 2,362 | | |
| Interest | | | 62 | | |
| Dividends | | | 14 | | |
| | | | 200,346 | | |
| Liabilities: | | | |
| Investment securities purchased | | | 936 | | |
| Accounts payable and accrued liabilities: | |
| Management and advisory fees | | | 131 | | |
| Distribution and service fees | | | 21 | | |
| Administration fees | | | 3 | | |
| Payable for collateral for securities on loan | | | 38,120 | | |
| Other | | | 28 | | |
| | | | 39,239 | | |
| Net Assets | | $ | 161,107 | | |
| Net Assets Consist of: | | | |
Shares of beneficial interest, unlimited shares
authorized, no par value | | $ | 154,279 | | |
| Undistributed net investment income (loss) | | | 99 | | |
Undistributed net realized gain (loss) from investment
securities | | | 3,119 | | |
Net unrealized appreciation (depreciation) on
investment securities | | | 3,610 | | |
| Net Assets | | $ | 161,107 | | |
| Net Assets by Class: | | | |
| Class A | | $ | 74,675 | | |
| Class I | | | 86,432 | | |
| Shares Outstanding: | | | |
| Class A | | | 6,633 | | |
| Class I | | | 7,658 | | |
| Net Asset Value and Offering Price Per Share: | | | |
| Class A | | $ | 11.26 | | |
| Class I | | | 11.29 | | |
STATEMENT OF OPERATIONS
For the period ended October 31, 2005 (a)
(all amounts in thousands)
| Investment Income: | | | |
| Interest | | $ | 92 | | |
| Dividends | | | 738 | | |
| Income from loaned securities–net | | | 172 | | |
| | | | 1,002 | | |
| Expenses: | | | |
| Management and advisory fees | | | 707 | | |
| Distribution and service fees: | |
| Class A | | | 112 | | |
| Transfer agent fees: | |
| Class A | | | 1 | | |
| Class I | | | 1 | | |
| Printing and shareholder reports | | | 1 | | |
| Custody fees | | | 34 | | |
| Administration fees | | | 15 | | |
| Legal fees | | | 3 | | |
| Audit fees | | | 15 | | |
| Trustees fees | | | 2 | | |
| Registration fees: | |
| Class A | | | 6 | | |
| Class I | | | 5 | | |
| Other | | | 1 | | |
| Total expenses | | | 903 | | |
| Net Investment Income (Loss) | | | 99 | | |
| Net Realized and Unrealized Gain (Loss) | | | |
| Realized gain (loss) from investment securities | | | 3,119 | | |
Increase (decrease) in unrealized appreciation
(depreciation) on investment securities | | | 3,610 | | |
| Net Gain (Loss) on Investment Securities | | | 6,729 | | |
Net Increase (Decrease) in Net Assets Resulting
from Operations | | $ | 6,828 | | |
(a) TA IDEX Van Kampen Small Company Growth ("the Fund") commenced operations on November 8, 2004. The inception date for the Fund's offering of Share Class A was March 1, 2005.
The notes to the financial statements are an integral part of this report.
Transamerica IDEX Mutual Funds
Annual Report 2005
7
TA IDEX Van Kampen Small Company Growth
STATEMENTS OF CHANGES IN NET ASSETS
For the period ended
(all amounts in thousands)
| | | October 31,
2005 (a) | |
| Increase (Decrease) In Net Assets From: | | | |
| Operations: | | | |
| Net investment income (loss) | | $ | 99 | | |
| Net realized gain (loss) from investment securities | | | 3,119 | | |
Net unrealized appreciation (depreciation) on
investment securities | | | 3,610 | | |
| | | | 6,828 | | |
| Capital Share Transactions: | | | |
| Proceeds from shares sold: | |
| Class A | | | 71,534 | | |
| Class I | | | 82,745 | | |
| | | | 154,279 | | |
| Net increase (decrease) in net assets | | | 161,107 | | |
| Net Assets: | | | |
| Beginning of period | | | – | | |
| End of period | | $ | 161,107 | | |
Undistributed Net Investment Income
(Loss) | | $ | 99 | | |
| | | October 31,
2005 (a) | |
| Share Activity: | | | |
| Shares issued: | |
| Class A | | | 6,633 | | |
| Class I | | | 7,658 | | |
| | | | 14,291 | | |
Net increase (decrease) in shares
outstanding: | | | |
| Class A | | | 6,633 | | |
| Class I | | | 7,658 | | |
| | | | 14,291 | | |
(a) TA IDEX Van Kampen Small Company Growth ("the Fund") commenced operations on November 8, 2004. The inception date for the Fund's offering of Share Class A was March 1, 2005.
The notes to the financial statements are an integral part of this report.
Transamerica IDEX Mutual Funds
Annual Report 2005
8
TA IDEX Van Kampen Small Company Growth
FINANCIAL HIGHLIGHTS
| | | | | For a share of beneficial interest outstanding throughout the period | |
| | | | | Net Asset | | Investment Operations | | Distributions | | Net Asset | |
| | | For the
Period
Ended (d)(g) | | Value,
Beginning
of Period | | Net
Investment
Income (Loss) | | Net Realized
and Unrealized
Gain (Loss) | | Total
Operations | | From Net
Investment
Income | | From Net
Realized
Gains | | Total
Distributions | | Value,
End
of Period | |
| Class A | | 10/31/2005 | | $ | 10.73 | | | $ | 0.02 | | | $ | 0.51 | | | $ | 0.53 | | | $ | – | | | $ | – | | | $ | – | | | $ | 11.26 | | |
| Class I | | 10/31/2005 | | | 10.00 | | | | 0.01 | | | | 1.28 | | | | 1.29 | | | | – | | | | – | | | | – | | | | 11.29 | | |
| | | | | | | Ratios/Supplemental Data | |
| | | For the
Period | | Total | | Net Assets,
End of
Period | | Ratio of Expenses
to Average
Net Assets (a) | | Net Investment
Income (Loss)
to Average | | Portfolio
Turnover | |
| | | Ended (g) | | Return (c) | | (000's) | | Net (e) | | Total (f) | | Net Assets (a) | | Rate (b) | |
| Class A | | 10/31/2005 | | | 4.94 | % | | $ | 74,675 | | | | 1.41 | % | | | 1.41 | % | | | 0.22 | % | | | 75 | % | |
| Class I | | 10/31/2005 | | | 12.80 | | | | 86,432 | | | | 1.07 | | | | 1.07 | | | | 0.06 | | | | 75 | | |
NOTES TO FINANCIAL HIGHLIGHTS
(a) Annualized.
(b) Not annualized.
(c) Total Return has been calculated for the applicable period without deduction of a sales load, if any, on an initial purchase. Periods of less than one year are not annualized.
(d) Per share information is calculated based on average number of shares outstanding.
(e) Ratio of Net Expenses to Average Net Assets is net of fee waivers and reimbursements by the investment adviser, if any (see note 2).
(f) Ratio of Total Expenses to Average Net Assets includes all expenses before fee waivers and reimbursements by the investment adviser.
(g) TA IDEX Van Kampen Small Company Growth ("the Fund") commenced operations on November 8, 2004. The inception date for the Fund's offering of share Class A was March 1, 2005.
The notes to the financial statements are an integral part of this report.
Transamerica IDEX Mutual Funds
Annual Report 2005
9
TA IDEX Van Kampen Small Company Growth
NOTES TO FINANCIAL STATEMENTS
At October 31, 2005
(all amounts in thousands)
NOTE 1. ORGANIZATION AND SIGNIFICANT ACCOUNTING POLICIES
Transamerica IDEX Mutual Funds is an open-end management investment company registered under the Investment Company Act of 1940, as amended (the "1940 Act"). TA IDEX Van Kampen Small Company Growth (the "Fund") began operations on November 8, 2004.
In the normal course of business, the Fund enters into contracts that contain a variety of representations that provide general indemnifications. The Fund's maximum exposure under these arrangements is unknown, as this would involve future claims that may be made against the Fund and/or its affiliates that have not yet occurred. However, based on experience, the Fund expects the risk of loss to be remote.
This report should be read in conjunction with the current Fund prospectus, which contains more complete information about the Fund.
The following is a summary of significant accounting policies followed by the Fund in the preparation of the financial statements. In preparing the Fund's financial statements in accordance with accounting principles generally accepted in the United States of America ("GAAP"), estimates or assumptions (which could differ from actual results) may be used that affect reported amounts and disclosures.
Multiple class operations, income and expenses: The Fund currently offers two classes of shares, Class A and Class I, each with a public offering price that reflects different sales charges, if any, and expense levels. The initial sales charge currently is waived as this Fund is available for investment only by certain strategic asset allocation funds. Income, non-class specific expenses and realized and unrealized gains and losses, are allocated daily to each class, based upon the value of shares outstanding method as permitted under Rule 18f-3 of the 1940 Act. Each class bears its own specific expenses as well as a portion of general, common expenses.
Class I shares are offered for investment to the asset allocation funds of AEGON/Transamerica Series Trust (ATST).
Security valuations: The Fund values its investments at the close of the New York Stock Exchange ("NYSE"), normally 4 p.m. ET, each day the NYSE is open for business. Fund investments are valued at the last sale price or closing price on the day of valuation taken from the primary exchange where the security is principally traded.
Securities traded in the over-the-counter market and listed securities for which no sale was reported on that date are valued at the last quoted bid price.
Debt securities are valued based on a price quotation or other equivalent indication of value supplied by an exchange, a pricing service or a major market maker; however, those that mature in sixty days or less are valued at amortized cost, which approximates market.
Investment company securities are valued at the net asset value of the underlying portfolio.
Other securities for which quotations are not readily available or whose values have been determined to be unreliable are valued at fair market value as determined in good faith by the Fund's Administrative Valuation Committee, under the supervision of the Board's Valuation Committee, using guidelines adopted by the Board of Trustees.
Cash: The Fund may leave cash overnight in its cash account with the custodian, Investors Bank & Trust Company ("IBT"). IBT has been contracted on behalf of the Fund to invest the excess cash into a savings account, which at October 31, 2005, was paying an interest rate of 2.76%.
Repurchase agreements: The Fund is authorized to enter into repurchase agreements. The Fund, through its custodian, IBT, receives delivery of the underlying securities, the value of which at the time of purchase is required to be an amount equal to at least 100% of the resale price. The Fund will bear the risk of value fluctuations until the security can be sold and may encounter delays and incur costs in liquidating the security. In the event of bankruptcy or insolvency of the seller, delays and costs may be incurred.
Commission recapture: The sub-adviser, to the extent consistent with the best execution and usual commission rate policies and practices, may place security transactions of the Fund with broker/dealers with which Transamerica IDEX Mutual Funds has established a Commission Recapture Program. A Commission Recapture Program is any arrangement under which a broker/dealer applies a portion of the commissions received by such broker/dealer on the security transactions to the Fund. In no event will commissions paid by the Fund be used to pay expenses that would otherwise be borne by any other funds within Transamerica IDEX Mutual Funds, or by any other party.
Recaptured commissions during the period from inception through October 31, 2005, of $38 are included in net realized gains in the Statement of Operations.
Securities lending: The Fund may lend securities to qualified borrowers, with IBT acting as the Fund's lending agent. The Fund earns negotiated lenders' fees. The Fund receives cash and/or securities as collateral against the loaned securities. Cash collateral received is invested in short term, interest bearing securities. The Fund monitors the market value of securities loaned on a daily basis and requires collateral in an amount at least equal to the value of the securities loaned. Income from loaned securities on the Statement of Operations is net of fees, in the amount of $74, earned by IBT for its services.
Security transactions and investment income: Security transactions are recorded on the trade date. Security gains and losses are calculated on the specific identification basis. Dividend income, if any, is recorded on the ex-dividend date or, in the case of foreign securities, as soon as the Fund is informed of the ex-dividend date. Interest income, including accretion of discounts and amortization of premiums, is recorded on the accrual basis commencing on the settlement date.
Transamerica IDEX Mutual Funds
Annual Report 2005
10
TA IDEX Van Kampen Small Company Growth
NOTES TO FINANCIAL STATEMENTS (continued)
At October 31, 2005
(all amounts in thousands)
NOTE 1.–(continued)
Redemption fees: A short-term trading redemption fee may be assessed on any Fund shares in a fund account that are sold during the first five (5) NYSE trading days following their purchase date. This redemption fee will equal 2% of the amount redeemed and shares held the longest will be treated as being redeemed first and shares held the shortest as being redeemed last. For the period from inception through October 31, 2005, the Fund received no redemption fees.
Dividend distributions: Distributions to shareholders are recorded on the ex-dividend date and are determined in accordance with Federal income tax regulations which may differ from GAAP.
NOTE 2. RELATED PARTY TRANSACTIONS
Effective January 1, 2005 AEGON/Transamerica Fund Advisors, Inc. was renamed Transamerica Fund Advisors, Inc. ("TFAI"); AEGON/Transamerica Fund Services, Inc. and AEGON/Transamerica Investor Services, Inc. merged into one entity and was renamed Transamerica Fund Services, Inc. ("TFS").
TFAI is the Fund's investment adviser. TFS is the Fund's administrator and transfer agent. AFSG Securities Corp. ("AFSG") is the Fund's distributor/principal underwriter. TFAI, TFS , and AFSG are affiliates of AEGON, NV, a Netherlands corporation.
The following schedule reflects the percentage of Fund assets owned by affiliated mutual funds:
| | | Net
Assets | | % of
Net Assets | |
TA IDEX Asset Allocation–Growth
Portfolio | | $ | 26,505 | | | | 16.45 | % | |
TA IDEX Asset Allocation–Moderate
Growth Portfolio | | | 48,153 | | | | 29.89 | % | |
| Asset Allocation–Growth Portfolio | | | 30,356 | | | | 18.84 | % | |
Asset Allocation–Moderate Growth
Portfolio | | | 54,184 | | | | 33.63 | % | |
| Total | | $ | 159,198 | | | | 98.81 | % | |
Investment advisory fees: The Fund pays management fees to TFAI based on average daily net assets ("ANA") at the following breakpoints:
0.95% of the first $500 million of ANA
0.85% of ANA over $500 million
TFAI has contractually agreed to waive its advisory fee and will reimburse the Fund to the extent that operating expenses exceed the following stated annual limit:
From November 8, 2004 through May 27, 2005:
1.15% Expense Limit (including 12b-1 fees)
From May 28, 2005 on:
1.15% Expense Limit (excluding 12b-1 fees)
If total fund expenses fall below the annual expense limitation agreement agreed to by the adviser within the succeeding three years, the Fund may be required to pay that adviser a portion or all of the reimbursed class expenses.
There were no amounts recaptured during the period from inception through October 31, 2005. There are no amounts subject to recapture at October 31, 2005.
Distribution and service fees: The Fund has a 12b-1 distribution plan under the 1940 Act pursuant to which an annual fee, based on average daily net assets, is paid to the distributor for various disbursements such as broker-dealer account servicing fees and other promotional expenses of the Fund. The Fund is authorized under the 12b-1 plan to pay fees on each class up to the following limits:
| Class A | | | 0.35 | % | |
| Class I | | | N/A | | |
In the case the Fund or a class of shares of the Fund is closed to new investors or investments, the Fund is authorized to pay 12b-1 fees for past sales and distribution efforts and present and past investor services.
Administrative services: The Fund has entered into an agreement with TFS for financial and legal fund administration services. As of January 1, 2005 the Fund pays TFS an annual fee of 0.02% of ANA. Prior to January 1, 2005 the Fund paid TFS an annual fee of 0.015% of ANA. The Legal fees on the Statement of Operations are for fees paid to external legal counsel.
Transfer agent fees: The Fund pays TFS an annual per-account charge for each open and closed account. The Fund paid TFS less than $1 for the period from inception through October 31, 2005.
Brokerage commissions: Brokerage commissions incurred on security transactions placed with an affiliate of the adviser for the period from inception through October 31, 2005, were $10.
NOTE 3. INVESTMENT TRANSACTIONS
The cost of securities purchased and proceeds from securities sold (excluding short-term securities) for the period from inception through October 31, 2005, were as follows:
| Purchases of securities: | | | |
| Long-Term | | $ | 199,932 | | |
| U.S. Government | | | – | | |
| Proceeds from maturities and sales of securities: | | | |
| Long-Term | | | 54,752 | | |
| U.S. Government | | | – | | |
Transamerica IDEX Mutual Funds
Annual Report 2005
11
TA IDEX Van Kampen Small Company Growth
NOTES TO FINANCIAL STATEMENTS (continued)
At October 31, 2005
(all amounts in thousands)
NOTE 4. FEDERAL INCOME TAX MATTERS
The Fund has not made any provision for federal income or excise taxes due to its policy to distribute all of its taxable income and capital gains to its shareholders and otherwise qualify as a regulated investment company under Subchapter M of the Internal Revenue Code. Income and capital gain distributions are determined in accordance with income tax regulations, which may differ from GAAP. These differences are primarily due to differing treatment for items including, but not limited to, wash sales.
The tax basis components of distributable earnings as of October 31, 2005, are as follows:
| Undistributed Ordinary Income | | $ | – | | |
| Undistributed Long-term Capital Gains | | $ | 3,264 | | |
| Capital Loss Carryforward | | $ | – | | |
| Net Unrealized Appreciation (Depreciation) | | $ | 3,564 | | |
The aggregate cost of investments and composition of unrealized appreciation (depreciation) for federal income tax purposes as of October 31, 2005, are as follows:
| Federal Tax Cost Basis | | $ | 186,428 | | |
| Unrealized Appreciation | | $ | 12,181 | | |
| Unrealized (Depreciation) | | | (8,617 | ) | |
| Net Unrealized Appreciation (Depreciation) | | $ | 3,564 | | |
NOTE 5. REGULATORY PROCEEDINGS
There continues to be significant federal and state regulatory activity relating to financial services companies, particularly mutual fund companies and their investment advisers. As part of an ongoing investigation regarding potential market timing, recordkeeping and trading compliance issues and matters affecting the Fund's investment adviser, TFAI, and certain affiliates and former employees of TFAI, the SEC staff has indicated that it is likely to take some action against TFAI and certain of its affiliates at the conclusion of the investigation. The potential timing and the scope of any such action is difficult to predict. Although the impact of any action brought against TFAI and/or its affiliates is difficult to assess at the present time, the Fund currently believes that the likelihood that any such action will have a material adverse impact on it is remote. It is important to note that the Fund is not aware of any allegation of wrongdoing against it and its Board at the time this annual report is printed. Although it is not anticipated that these developments will have an adverse impact on the Fund, there can be no assurance at this time. TFAI and its affiliates are actively working with the SEC in regard to this matter; however, the exact resolution cannot be determined at this time. TFAI will take such actions that it deems necessary or appropriate to continue providing management services to the Fund and to bring all matters to an appropriate conclusion.
TFAI and/or its affiliates, and not the Fund, will bear the costs regarding these regulatory matters.
Transamerica IDEX Mutual Funds
Annual Report 2005
12
Report of Independent Registered Certified Public Accounting Firm
To the Board of Trustees and Shareholders of
TA IDEX Van Kampen Small Company Growth
In our opinion, the accompanying statement of assets and liabilities, including the schedule of investments, and the related statements of operations and of changes in net assets and the financial highlights present fairly, in all material respects, the financial position of TA IDEX Van Kampen Small Company Growth (the "Fund") (one of the portfolios constituting the Transamerica IDEX Mutual Funds) at October 31, 2005, the results of its operations , the changes in its net assets and the financial highlights for the period November 8, 2004 (commencement of operations) through October 31, 2005, in conformity with accounting principles generally accepted in the United States of America. These financial statements and financial highlights (hereafter referred to as "financial statements") are the responsibility of the Fund's management; our responsibility is to express an opinion on these fina ncial statements based on our audit. We conducted our audit of these financial statements in accordance with the standards of the Public Company Accounting Oversight Board (United States). Those standards require that we plan and perform the audit to obtain reasonable assurance about whether the financial statements are free of material misstatement. An audit includes examining, on a test basis, evidence supporting the amounts and disclosures in the financial statements, assessing the accounting principles used and significant estimates made by management, and evaluating the overall financial statement presentation. We believe that our audit, which included confirmation of securities at October 31, 2005 by correspondence with the custodian, provide a reasonable basis for our opinion.

December 22, 2005
Transamerica IDEX Mutual Funds
Annual Report 2005
13
TA IDEX Van Kampen Small Company Growth (unaudited)
A discussion regarding the basis of Transamerica IDEX Mutual Funds' Board of Trustees' approval of the fund's advisory arrangements will be available in the fund's semi-annual report for the period ending April 30, 2006.
Transamerica IDEX Mutual Funds
Annual Report 2005
14
TRANSAMERICA IDEX MUTUAL FUNDS
Management of the Fund
| Name, Address and Age | | Position(s)
Held with
Fund | | Term of
Office and
Length of
Time Served | | Principal Occupation(s)
During Past 5 Years | | Number
of Funds
in Complex
Overseen
by Trustee | | Other
Directorships
Held By
Trustee | |
| INTERESTED TRUSTEES | | | |
|
Thomas P. O'Neill***
AEGON USA, Inc.
1111 North Charles Street
Baltimore, MD 21201-5574
(DOB: 3/11/58) | | Trustee | | Indefinite** 2003–present | | President, AEGON Financial Services Group, Inc., Financial Institution Division (2001–present); Trustee, AEGON/ Transamerica Series Trust (ATST) (2003–present); Director, Transamerica Income Shares, Inc. (TIS) (2003–present) & Transamerica Index Funds, Inc. (TIF) (2004–2004); Director, National Aquarium of Baltimore | | | 84 | | | N/A | |
|
Brian C. Scott***
Transamerica Fund Advisors, Inc.
570 Carillon Parkway
St. Petersburg, FL 33716
(DOB: 9/29/43) | | Trustee, President & Chief Executive Officer (CEO) | | Indefinite** Trustee 2003–present; President, CEO 2002–present | | Trustee (2003–present), President & CEO (2002–present), ATST; Director, TIS (2002–2005); President & Director, TIF (2002–2004); Manager, Transamerica Investment Management (2002-2005); Director (2002–present), CEO & President (2001–present), Transamerica Fund Advisors, Inc. (TFAI) & Transamerica Fund Services, Inc. (TFS); CEO, Transamerica Investors, Inc. (TII) (2003–present); Director, President & CEO, Endeavor Management Co. (2001–2002) | | | 83 | | | N/A | |
|
| INDEPENDENT TRUSTEES | | | |
|
Peter R. Brown
8323 40th Place North
St. Petersburg, FL 33709
(DOB: 5/10/28) | | Chairman, Trustee | | Indefinite** 1986–present | | Chairman & Trustee, ATST (1986–present); Chairman (2003–present) & Director (2002–present), TIS; Chairman & Director, TIF (2002–2004); Chairman of the Board, Peter Brown Construction Company (1963–2000); Rear Admiral (Ret.) U.S. Navy Reserve, Civil Engineer Corps. | | | 84 | | | N/A | |
|
Charles C. Harris
2840 West Bay Drive, #215
Belleair Bluffs, FL 33770
(DOB: 7/15/30) | | Trustee | | Indefinite** 1994–present | | Trustee, ATST (1986–present); Director, TIS (2002–present) | | | 84 | | | N/A | |
|
Russell A. Kimball, Jr.
1160 Gulf Boulevard
Clearwater Beach, FL 34630
(DOB: 8/17/44) | | Trustee | | Indefinite** 2002–present | | Trustee, ATST (1986–present); Director, TIS (2002–present); General Manager, Sheraton Sand Key Resort (1975–present) | | | 84 | | | N/A | |
|
William W. Short, Jr.
7882 Lantana Creek Road
Largo, FL 33777
(DOB: 2/25/36) | | Trustee | | Indefinite** 1986–present | | Trustee, ATST (2000–present); Director, TIS (2002–present); Retired CEO and Chairman of the Board, Shorts, Inc. | | | 84 | | | N/A | |
|
Daniel Calabria
7068 S. Shore Drive S.
South Pasadena, FL 33707
(DOB: 3/5/36) | | Trustee | | Indefinite** 1996–present | | Trustee, ATST (2001–present); Director, TIS (2002–present); Trustee (1993–2004) & President (1993–1995), Florida Tax Free Funds | | | 84 | | | N/A | |
|
Janice B. Case
205 Palm Island NW
Clearwater, FL 33767
(DOB: 9/27/52) | | Trustee | | Indefinite** 2002–present | | Trustee, ATST (2001–present); Director, TIS (2002–present); Director, Central Vermont Public Service Co. (Audit Committee); Director, Western Electricity Coordinating Council (Chairman, Human Resources and Compensation Committee); Senior Vice President (1996–2000), Vice President (1990–1996), Director of Customer Service & Marketing (1987–1990), Florida Power Corporation | | | 84 | | | Central Vermont Public Service Co. | |
|
Jack E. Zimmerman
6778 Rosezita Lane
Dayton, OH 45459
(DOB: 2/3/28) | | Trustee | | Indefinite** 1985–present | | Retired Director, Regional Marketing of Marietta Corporation & Director of Strategic Planning, Martin Marietta Baltimore Aerospace | | | 39 | | | N/A | |
|
Leo J. Hill
7586 Aralia Way
Largo, FL 33777
(DOB: 3/27/56) | | Trustee | | Indefinite** 2002–present | | Trustee, ATST (2001–present); Director, TIS (2002–present); Owner & President, Prestige Automotive Group (2001–2005) | | | 84 | | | N/A | |
|
| Name, Address and Age | | Position(s)
Held with
Fund | | Term of
Office and
Length of
Time Served | | Principal Occupation(s)
During Past 5 Years | | Number
of Funds
in Complex
Overseen
by Trustee | | Other
Directorships
Held By
Trustee | |
John W. Waechter
3913 Bayview Circle
Gulfport, FL 33707
(DOB: 2/25/52) | | Trustee | | Indefinite** 2005–present | | Trustee, ATST (2004–present); Director, TIS (2004–present); Executive Vice President, Chief Financial Officer, Chief Compliance Officer, William R. Hough & Co. (1979–2004); Treasurer, The Hough Group of Funds (1993–2004) | | | 84 | | | N/A | |
|
Robert L. Anderson, Ph.D.
3301 Bayshore Blvd., #1408
Tampa, FL 33629
(DOB: 10/30/40) | | Trustee | | Indefinite** 2005–present | | Dean, Professor, College of Business, University of South Florida (1995–present) | | | 39 | | | N/A | |
|
| OFFICERS | | | |
|
| Name, Address* and Age | | Position
Held with
Fund* | | Term of
Office and
Length of
Time Served† | | Principal Occupation(s) or Employment
During Past 5 Years | |
John K. Carter
(DOB: 4/24/61) | | Senior Vice President, General Counsel, Secretary & Chief Compliance Officer | | | 1999– | present | | Sr. Vice President (2003–present), General Counsel (2002–present), Secretary (1999–present) & Chief Compliance Officer (2004–present), ATST & TIS; Director, Sr. Vice President (2002–present), General Counsel & Secretary (2001–present), TFAI & TFS; Chief Compliance Officer, TFAI (2004–present); Vice President, AFSG Securities Corporation (AFSG) (2001–present); Vice President, Secretary (2003–present) & Chief Compliance Officer (2004–present), TII; Vice President, Transamerica Investment Services, Inc. (TISI) (2003–2005) & TIM (2001–2005) | |
|
Glenn E. Brightman
(DOB: 12/1/72) | | Vice President & Principal Financial Officer | | | 2005– | present | | Vice President & Principal Financial Officer, ATST & TIS (2005–present); Vice President & Interim Principal Financial Officer, TII (2005–present) | |
|
* The business address of each officer is 570 Carillon Parkway, St. Petersburg, Florida 33716. No officer of the Fund except for the Chief Compliance Officer receives any compensation from the Fund.
** Each trustee serves an indefinite term until he or she is removed, reaches mandatory retirement age, resigns or becomes incapacitated.
*** May be deemed as "interested person" of the Fund as defined in the 1940 Act due to employment with TFAI or an affiliate of TFAI.
† Elected and serves at the pleasure of the Board of Trustees of Transamerica IDEX.
Additional information about the Fund trustees can be found in the Statement of Additional Information, available without charge upon request by calling 1-888-233-4339.
PROXY VOTING POLICIES AND PROCEDURES AND QUARTERLY PORTFOLIO HOLDINGS
A description of the Transamerica IDEX Mutual Funds' proxy voting policies and procedures is available in the Statement of Additional Information of the Funds, available without charge upon request by calling 1-888-233-4339 (toll free) or on the Securities and Exchange Commission website (http://www.sec.gov).
In addition, the Funds are required to file Form N-PX, with their complete proxy voting records for the 12 months ended June 30th, no later than August 31st of each year. The filing of Form N-PX was made on or before August 31, 2005, for the 12 month-period ending June 30, 2005. Once filed, the Form will be available without charge: (1) from the Funds, upon request by calling 1-888-233-4339; and (2) on the SEC's website at www.sec.gov.
The Funds file their complete schedule of portfolio holdings with the Securities and Exchange Commission for the first and third quarter of each fiscal year on Form N-Q which is available on the Commission's website at www.sec.gov. The Funds' Form N-Q may be reviewed and copied at the Commission's Public Reference Room in Washington, D.C. Information on the operation of the Public Reference Room may be obtained by calling 1-800-SEC-0330.
P.O. Box 9012
Clearwater, FL 33758-9012

www.transamericaidex.com
Investor Services 1-888-233-IDEX (4339)
P.O. Box 9012 • Clearwater, FL 33758-9012
Distributor: AFSG Securities Corporation, Member NASD
Item 2: Code of Ethics.
(a) Registrant has adopted a code of ethics that applies to its principal executive officer, principal financial officer, and any other officers who serve a similar function.
(b) Registrant’s code of ethics is reasonably designed as described in this Form N-CSR.
(c) During the period covered by the report, no amendments were made to the provisions of this code of ethics.
(d) During the period covered by the report, Registrant did not grant any waivers, including implicit waivers, from the provisions of this code of ethics.
(e) Not Applicable
(f) Registrant has filed this code of ethics as an exhibit pursuant to Item 12(a)(1) of Form N-CSR.
Item 3: Audit Committee Financial Expert.
Registrant’s Board of Trustees has determined that John W. Waechter is an “audit committee financial expert,” as such term is defined in Item 3 of Form N-CSR. Mr. Waechter is “independent” under the standards set forth in Item 3 of Form N-CSR. The designation of Mr. Waechter as “audit committee financial expert” pursuant to Item 3 of Form N-CSR does not (i) impose upon him any duties, obligations, or liabilities that are greater than the duties, obligations and liabilities imposed upon him as a member of the Registrant’s audit committee or Board of Trustees in the absence of such designation; or (ii) affect the duties, obligations or liabilities of any other member of the Registrant’s audit committee or Board of Trustees.
Item 4: Principal Accountant Fees and Services.
| | | | Fiscal Year Ended 10/31 | |
| | (in thousands) | | 2004 | | 2005 | |
| | | | | | | |
(a) | | Audit Fees | | 486 | | 519 | |
(b) | | Audit-related Fees | | 59 | | 85 | |
(c) | | Tax Fees | | 104 | | 69 | |
(d) | | All Other Fees | | N/A | | N/A | |
(e) (1) | | Pre-approval policy * (see below) | | | | | |
(e) (2) | | % of above that were pre-approved | | 0 | % | 0 | % |
(f) | | If greater than 50%, disclose hours | | N/A | | N/A | |
(g) | | Non-audit fees rendered to Adviser (or affiliate that provided services to Registrant) | | N/A | | N/A | |
(h) | | Disclose whether the Audit Committee has considered whether the provisions of non-audit services rendered to the Adviser that were NOT pre-approved is compatible with maintaining the auditor’s independence. | | Yes | | Yes | |
2
* (e) (1) The Audit Committee may delegate any portion of its authority, including the authority to grant pre-approvals of audit and permitted non-audit services, to one or more members or a subcommittee. Any decision of the subcommittee to grant pre-approvals shall be presented to the full Audit Committee at its next regularly scheduled meeting.
Item 5: Audit Committee of Listed Registrants.
The following individuals comprise the standing Audit Committee: Peter R. Brown, Daniel Calabria, Janice B. Case, Charles C. Harris, Leo J. Hill, Russell A. Kimball, William W. Short and John W. Waechter.
Item 6: Schedule of Investments.
The schedules of investments are included in the annual report to shareholders filed under Item 1 of this Form N-CSR.
Item 7: Disclosure of Proxy Voting Policies and Procedures for Closed-End Management Investment Companies. Not applicable.
Item 8: Portfolio Managers of Closed-End Management Investment Companies. Not applicable.
Item 9. Purchases of Equity Securities by Closed-End Management Investment Company and Affiliated Purchasers. Not applicable.
Item 10: Submission of Matters to a Vote of Security Holders
The Registrant’s Nominating Committee’s provisions with respect to nominations of Trustees to its Board are as follows:
A candidate for nomination as Trustee submitted by a shareholder will not be deemed to be properly submitted to the Committee for the Committee’s consideration unless the following requirements have been met and procedures followed:
1. Each eligible shareholder or shareholder group may submit no more than one nominee each calendar year.
2. The nominee must satisfy all qualifications provided herein and in the Funds’ organizational documents, including qualification as a possible Independent Trustee if the nominee is to serve in that capacity.
• The nominee may not be the nominating shareholder, a member of the nominating shareholder group or a member of the immediate family of the nominating shareholder or any member of the nominating shareholder group.(1)
• Neither the nominee nor any member of the nominee’s immediate family may be currently employed or employed within the year prior to the nomination by any nominating shareholder entity or entity in a nominating shareholder group.
• Neither the nominee nor any immediate family member of the nominee is permitted to have accepted directly or indirectly, during the year of the election for which the nominee’s name was submitted, during the immediately preceding calendar year, or during the year when the nominee’s name was submitted, any consulting, advisory, or other compensatory fee from the nominating shareholder or any member of a nominating shareholder group.
• The nominee may not be an executive officer, director or person fulfilling similar functions of the nominating shareholder or any member of the nominating shareholder group, or of an affiliate of the nominating shareholder or any such member of the nominating shareholder group.
• The nominee may not control the nominating shareholder or any member of the nominating shareholder group (or, in the case of a holder or member that is a fund, an interested person of such holder or member as defined by Section 2(a)(19) of the 1940 Act).
• A shareholder or shareholder group may not submit for consideration a nominee which has previously been considered by the Committee.
3. In order for the Committee to consider shareholder submissions, the following requirements must be satisfied regarding the shareholder or shareholder group submitting the proposed nominee:
Any shareholder or shareholder group submitting a proposed nominee must beneficially own,
(1) Terms such as “immediate family member” and “control” shall be interpreted in accordance with the federal securities laws.
3
• Any shareholder or shareholder group submitting a proposed nominee must beneficially own, either individually or in the aggregate, more than 5% of a Fund’s (or a series thereof) securities that are eligible to vote both at the time of submission of the nominee and at the time of the Board member election. Each of the securities used for purposes of calculating this ownership must have been held continuously for at least two years as of the date of the nomination. In addition, such securities must continue to be held through the date of the meeting. The nominating shareholder or shareholder group must also bear the economic risk of the investment.
• The nominating shareholder or shareholder group must also submit a certification which provides the number of shares which the person or group has (a) sole power to vote or direct the vote; (b) shared power to vote or direct the vote; (c) sole power to dispose or direct the disposition of such shares; and (d) shared power to dispose or direct the disposition of such shares. In addition the certification shall provide that the shares have been held continuously for at least two years.
4. Shareholders or shareholder groups submitting proposed nominees must substantiate compliance with the above requirements at the time of submitting their proposed nominee as part of their written submission to the attention of the Funds’ Secretary, who will provide all submissions to the Committee. This submission to the Funds must include:
• the shareholder’s contact information;
• the nominee’s contact information and the number of applicable Fund shares owned by the proposed nominee;
• all information regarding the nominee that would be required to be disclosed in solicitations of proxies for elections of directors required by Regulation 14A under the Securities Exchange Act of 1934; and
• a notarized letter executed by the nominee, stating his or her intention to serve as a nominee and be named in a Fund’s proxy statement, if so designated by the Committee and the Funds’ Board.
5. The Committee will consider all submissions meeting the applicable requirements stated herein that are received by December 31 of the most recently completed calendar year.
Item 11: Controls and Procedures.
(a) Based on their evaluation of Registrant’s disclosure controls and procedures (as defined in rule 30a-2(c) under the Investment Company Act of 1940 (17 CFR 270.30a-2(c)) as of October 31, 2005, Registrant’s principal executive officer and principal financial officer found Registrant’s disclosure controls and procedures to be appropriately designed to ensure that information required to be disclosed by Registrant in the reports that it files under the Securities Exchange Act of 1934 (a) is accumulated and communicated to Registrant’s management, including its principal executive officer and principal financial officer, to allow timely decisions regarding required disclosure, and (b) is recorded, processed, summarized and reported, within the time periods specified in the rules and forms adopted by the U.S. Securities and Exchange Commission.
(b) There have been no significant changes in Registrant’s internal controls over financial reporting that occurred during the Registrant’s last fiscal half year that has materially affected, or is reasonable likely to materially affect, the Registrant’s internal control over financial reporting.
4
Item 12: Exhibits.
(a) (1) Registrant’s code of ethics (that is the subject of the disclosure required by Item 2(a)) is attached.
(2) Separate certifications for Registrant’s principal executive officer and principal financial officer, as required by Rule 30a-2(a) under the 1940 Act, are attached.
(3) N/A
(b) A certification for Registrant’s principal executive officer and principal financial officer, as required by Rule 30a-2(b) under the 1940 Act, is attached. The certification furnished pursuant to this paragraph is not deemed to be “filed” for purposes of Section 18 of the Securities Act of 1934, or otherwise subject to liability of that section. Such certification is not deemed to be incorporated by reference into any filing under the Securities Act of 1933 or the Securities Exchange Act of 1934, except to the extent that the Registrant specifically incorporates it by reference
5
SIGNATURES
Pursuant to the requirements of the Securities Exchange Act of 1934 and the Investment Company Act of 1940, the Registrant has duly caused this report to be signed on its behalf by the undersigned, thereunto duly authorized.
| Transamerica IDEX Mutual Funds |
| (Registrant) |
| | |
| By: | /s/ Brian C. Scott | |
| | Brian C. Scott |
| | Chief Executive Officer |
| | Date: January 9, 2006 |
Pursuant to the requirements of the Securities Exchange Act of 1934 and the Investment Company Act of 1940, this report has been signed below by the following persons on behalf of the Registrant and in the capacities and on the dates indicated.
By: | /s/ Brian C. Scott | |
| Brian C. Scott |
| Chief Executive Officer |
| Date: January 9, 2006 |
| |
By: | /s/ Glenn E. Brightman | |
| Glenn E. Brightman |
| Principal Financial Officer |
| Date: January 9, 2006 |
| | | |
5
EXHIBIT INDEX
Exhibit No. | | Description of Exhibit |
| | |
12(a)(1) | | Code of Ethics for Principal Executive and Senior Financial Officers |
12(a)(2)(i) | | Section 302 N-CSR Certification of Principal Executive Officer |
12(a)(2)(ii) | | Section 302 N-CSR Certification of Principal Financial Officer |
12(b) | | Section 906 N-CSR Certification of Principal Executive Officer and Principal Financial Officer |
6