As filed with the SEC on January 9, 2008.
UNITED STATES
SECURITIES AND EXCHANGE COMMISSION
Washington, D.C. 20549
FORM N-CSR
CERTIFIED SHAREHOLDER REPORT OF REGISTERED
MANAGEMENT INVESTMENT COMPANIES
Investment Company Act file number: | 811-04556 |
|
TRANSAMERICA IDEX MUTUAL FUNDS |
(Exact name of registrant as specified in charter) |
|
570 Carillon Parkway, St. Petersburg, Florida | | 33716 |
(Address of principal executive offices) | | (Zip code) |
|
Dennis P. Gallagher, Esq. P.O. Box 9012, Clearwater, Florida 33758-9771 |
(Name and address of agent for service) |
|
Registrant’s telephone number, including area code: | (727) 299-1800 | |
|
Date of fiscal year end: | October 31 | |
|
Date of reporting period: | November 1, 2006 - October 31, 2007 | |
| | | | | | | | |
Item 1: Report(s) to Shareholders. The Annual Report is attached.
2

Closed Funds
Annual Report
October 31, 2007
www.transamericaidex.com
Customer Service 1-888-233-IDEX (4339)
P.O. Box 9012 · Clearwater, FL 33758-9012
Distributor: Transamerica Capital, Inc.
Dear Fellow Shareholder,
On behalf of Transamerica IDEX Mutual Funds, I would like to thank you for your continued support and confidence in our products as we look forward to continuing to serve you and your financial adviser in the future. We value the trust you have placed in us.
This annual report is provided to you with the intent of presenting a comprehensive review of the investments of each of your funds. The Securities and Exchange Commission requires that annual and semi-annual reports be sent to all shareholders, and we believe this report to be an important part of the investment process. In addition to providing a comprehensive review, this report also provides a discussion of accounting policies as well as matters presented to shareholders that may have required their vote.
We believe it is important to recognize and understand current market conditions in order to provide a context for reading this report. The positive returns experienced in the equity markets for the trailing 12 months ending October 31, 2007, mask the volatility experienced along the way, with significant pullbacks occurring in February-March and July-August. The Federal Reserve was on hold for most of the past twelve months but more recently in September and October lowered its target for the federal funds rate by 0.50% and 0.25% respectively. The rate reductions by the Federal Reserve signaled an effort to inject liquidity and stability to the markets which have been adversely affected by concerns over subprime debt. While Gross Domestic Product growth remains positive, investor concerns over the extent to which subprime debt may affect consumer spending and persistently high oil prices have been a check on market returns. For the 12 months ending October 31, 2007, the Dow Jones Industrial Average returned 17.94%, the Standard & Poor’s 500 Index returned 14.56%, and the Lehman Aggregate Bond Index returned 5.38%. Please keep in mind it is important to maintain a diversified portfolio as investment returns have historically been difficult to predict.
In addition to your active involvement in the investment process, we firmly believe that a financial adviser is a key resource to help you build a complete picture of your current and future financial needs. Financial advisers are familiar with the market’s history, including long-term returns and volatility of various asset classes. With your financial advisor, you can develop an investment program that incorporates factors such as your goals, your investment timeline, and your risk tolerance.
Please contact your financial adviser if you have any questions about the contents of this report, and thanks again for the confidence you have placed in us.
Sincerely,
John K. Carter | Christopher A. Staples |
President & Chief Executive Officer | Vice President & Chief Investment Officer |
Transamerica IDEX Mutual Funds | Transamerica IDEX Mutual Funds |
The views expressed in this report reflect those of the portfolio managers only and may not necessarily represent the views of Transamerica IDEX Mutual Funds. These views are subject to change based upon market conditions. These views should not be relied upon as investment advice and are not indicative of trading intent on behalf of the Transamerica IDEX Mutual Funds.
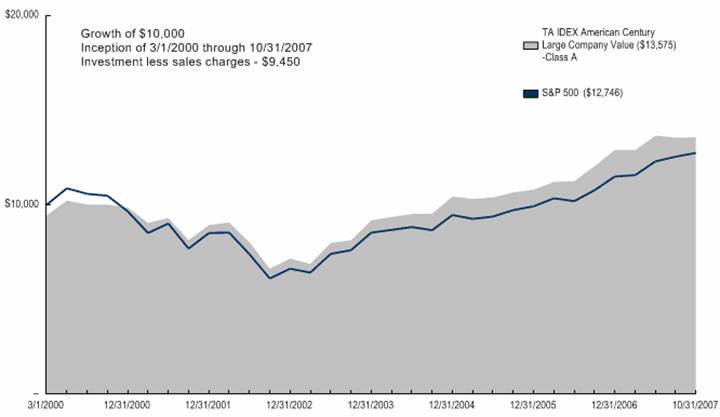
TA IDEX American Century Large Company Value
MARKET ENVIRONMENT
The portfolio provided solid returns despite a challenging market environment. Over the period, growth stocks significantly outperformed value across the capitalization spectrum. Investors generally favored companies that were already strong performers; this momentum bias did not fit well with the portfolio’s investment approach, which seeks stocks that are undervalued by the market.
PERFORMANCE
For the year ended October 31, 2007, TA IDEX American Century Large Company Value Class A returned 9.54%. By comparison its primary and secondary benchmarks, the Standard and Poor’s 500 Composite Stock Index (“S&P 500”) and the Russell 1000 Value Index (“Russell 1000 Value”), returned 14.56% and 10.83%, respectively. As of October 31, 2007, the Fund’s net expense ratios for Class A, Class B, Class C, and Class I were 1.17%, 1.19%, 1.07%, and 0.85%, respectively.
STRATEGY REVIEW
The portfolio’s stake in the information technology (“IT”) sector was a top contributor to performance versus the benchmark. A significant holding was software giant Microsoft Corporation (“Microsoft”), which benefited from strong sales of its new Vista operating system and Office 2007. Microsoft’s announcement last summer of a $20-billion stock buyback also boosted its shares.
Hewlett-Packard Company was another strong IT contributor. The company raised its financial forecast as it continued to gain ground in the personal computer (“PC”) market and moved into high-end enterprise printing equipment.
In consumer staples, a preference for large industry leaders proved to be advantageous as many of these names outperformed the benchmark. One top performer was Unilever plc, a foreign-based, global supplier of foods, home goods, and personal products with a strong presence in the U.S. market. Its stock benefited from the company’s stronger-than-expected revenue growth and its progress in cost-cutting efforts.
The portfolio also held a large position in The Kroger Co. (“Kroger”), the second-largest food retailer in the U.S. Kroger’s stock rose 35% as the company regained market share by tailoring its products and service offerings to its customers’ buying behaviors.
The utilities sector provided PPL Corporation (“PPL”) and Exelon Corporation (“Exelon”), two of the portfolio’s strongest performers relative to the benchmark. Headquartered in Pennsylvania, and a low-cost producer of nuclear- and coal-generated energy, PPL produces and delivers electricity to customers in the U.S., the UK and Latin America. The company reported solid 2006 earnings and reaffirmed its positive outlook for 2007.
Exelon, which distributes electricity to customers in Illinois and Pennsylvania and gas to customers in the Philadelphia area, is the nation’s largest nuclear generator. The company’s nuclear plants benefited as the cost of power from competitors’ gas-fired plants increased.
An underweight in materials hampered results as the sector generated strong returns for the Russell 1000 Value. While a position in steel producer, Nucor Corporation was a bright spot (as the company reported growing sales and pricing power), the portfolio generally held smaller-than-the-benchmark positions in metals, mining, and chemical stocks. Many of these companies have reported exceptionally strong earnings, which has in turn attracted a large number of investors. (The metals and mining segment was up nearly 50% over the period; chemicals rose 25%.) Because the management team believes these current earnings are unsustainable, it has limited the portfolio’s exposure to these industries.
The financials sector was the portfolio’s weakest performer. Many financial firms came under pressure amid the fallout in the sub-prime lending category. Although the management team’s valuation work led the portfolio away from real estate investment trusts, its holdings among thrifts and mortgage finance companies were a drag on relative results. Federal Home Loan Mortgage Corporation (“Freddie Mac”), a top-detracting stock, made slow progress in implementing new accounting systems, which dampened its near-term prospects for reduced regulatory oversight.
A modest position in MGIC Investment Corporation, the nation’s largest private mortgage insurer, hurt performance as the company was hampered by the housing slowdown and significant financial losses from a joint venture involved in restructuring sub-prime mortgages.
Charles A. Ritter, CFA
Brendan Healy, CFA
Co-Fund Managers
American Century Investment Management Inc.
Transamerica IDEX Mutual Funds | Annual Report 2007 |
1
(unaudited)
Average Annual Total Return for Periods Ended 10/31/2007
| | | | | | From | | Inception | |
| | 1 Year | | 5 Years | | Inception | | Date | |
Class A (NAV) | | 9.54 | % | 13.73 | % | 4.83 | % | 3/1/00 | |
Class A (POP) | | 3.54 | % | 12.44 | % | 4.06 | % | 3/1/00 | |
S&P 500 (1) | | 14.56 | % | 13.88 | % | 3.34 | % | 3/1/00 | |
Russell 1000 Value (1) | | 10.83 | % | 16.39 | % | 9.47 | % | 3/1/00 | |
| | | | | | | | | |
Class B (NAV) | | 9.55 | % | 13.13 | % | 4.22 | % | 3/1/00 | |
Class B (POP) | | 4.55 | % | 13.01 | % | 4.22 | % | 3/1/00 | |
| | | | | | | | | |
Class C (NAV) | | 9.66 | % | — | % | 13.49 | % | 11/11/02 | |
Class C (POP) | | 8.66 | % | — | % | 13.49 | % | 11/11/02 | |
| | | | | | | | | |
Class I (NAV) | | 9.95 | % | — | % | 13.26 | % | 11/15/05 | |
NOTES
(1) The Standard and Poor’s 500 Composite Stock (S&P 500) Index and the Russell 1000 Value (Russell 1000 Value) Index are unmanaged indices used as a general measure of market performance. Calculations assume dividends and capital gains are reinvested and do not include any managerial expenses. From inception calculation is based on life of Class A shares. You cannot invest directly in an Index.
The performance data presented represents past performance; future results may vary. Performance data does not reflect the deduction of taxes that would be paid on fund distributions or the redemption of fund shares. Investment return; and principal value will fluctuate so that an investor’s shares, when redeemed, may be worth more or less than their original cost.
Current performance may be lower or higher than performance quoted. Please see www.transamericaidex.com for performance data current to the most recent month-end.
Public Offering Price (POP) returns include the reinvestment of dividends and capital gains and reflect the maximum sales charge of 5.5% for A shares or the maximum applicable contingent deferred sales charge (5% in the 1st year, decreasing to 0% after 6 years) for Class B shares and 1% (during the first 12 months) for Class C shares. Shares purchased prior to March 1, 2004 are subject to a maximum applicable contingent deferred sales charge (5% in the 1st year, decreasing to 0% after 7 years) for Class B shares and (2% in the 1st year, decreasing to 0% after 2 years) for Class C shares. Net Asset Value (NAV) returns include the reinvestment of dividends and capital gains but do not reflect any sales charges.
This material must be preceded or accompanied by a current prospectus, which includes specific contents regarding the investment objectives and policies of this Fund. This Fund is closed to new investments.
2
UNDERSTANDING YOUR FUNDS EXPENSES
(unaudited)
SHAREHOLDER EXPENSES
Fund shareholders may incur two types of costs: (1) transaction costs, including sales charges (loads) on purchases, contingent deferred sales charges on redemptions and redemption fees; and (2) ongoing costs, including management fees, 12b-1 distribution and service fees, and other fund expenses.
The following Example is intended to help you understand your ongoing costs (in dollars and cents) of investing in the Fund and to compare these costs with the ongoing costs of investing in other funds.
The Example is based on an investment of $1,000 invested at May 1, 2007 and held for the entire period until October 31, 2007
ACTUAL EXPENSES
The first line in the table below provides information about actual account values and actual expenses. You may use the information in this line, together with the amount you invested, to estimate the expenses that you paid over the period. Simply divide your account value by $1,000 (for example, an $8,600 account value divided by $1,000 = 8.6), then multiply the result by the number in the first line of your Fund under the heading entitled “Expenses Paid During Period” to estimate the expenses you paid on your account during this period. If your account is an IRA, your expenses could have included a $15 annual fee. The amount of any fee paid through your account would increase the estimate of expenses you paid during the period and decrease your ending account value.
HYPOTHETICAL EXAMPLE FOR COMPARISON PURPOSES
The second line in the table below provides information about hypothetical account values and hypothetical expenses based on the Fund’s actual expense ratio and an assumed rate of return of 5% per year before expenses, which is not the Fund’s actual return. The hypothetical account values and expenses may not be used to estimate the actual ending account balance or expenses you paid for the period. You may use this information to compare the ongoing costs of investing in your Fund and other funds. To do so, compare this 5% hypothetical example with the 5% hypothetical examples that appear in the shareholder reports of the other funds. As in the case of the actual expense example, if your account is subject to an IRA fee, the amount of the fee paid through your account would increase the hypothetical expenses you would have paid during the period and decrease the hypothetical ending account value.
Please note that the expenses shown in the table are meant to highlight your ongoing costs only and do not reflect any transactional costs, such as sales charges, redemption fees, brokerage commissions paid on purchases and sales of fund shares. Therefore, the second line under the Fund in the table is useful in comparing ongoing costs only, and will not help you determine the relative total costs of owning different funds. If any of these transaction costs were included, your costs would be higher. The expenses shown in the table do not reflect any fees that may be charged to you by brokers, financial intermediaries or other financial institutions.
| | Beginning | | Ending | | Annualized | | Expenses | |
| | Account | | Account | | Expense | | Paid During | |
| | Value | | Value | | Ratio | | Period (a) | |
Class A | | | | | | | | | |
Actual | | $ | 1,000.00 | | $ | 1,008.65 | | 1.14 | % | $ | 5.76 | |
Hypothetical (b) | | 1,000.00 | | 1,019.41 | | 1.14 | | 5.79 | |
| | | | | | | | | |
Class B | | | | | | | | | |
Actual | | 1,000.00 | | 1,008.14 | | 1.13 | | 5.70 | |
Hypothetical (b) | | 1,000.00 | | 1,019.46 | | 1.13 | | 5.74 | |
| | | | | | | | | |
Class C | | | | | | | | | |
Actual | | 1,000.00 | | 1,009.80 | | 1.04 | | 5.25 | |
Hypothetical (b) | | 1,000.00 | | 1,019.91 | | 1.04 | | 5.28 | |
| | | | | | | | | |
Class I | | | | | | | | | |
Actual | | 1,000.00 | | 1,010.24 | | 0.85 | | 4.30 | |
Hypothetical (b) | | 1,000.00 | | 1,020.86 | | 0.85 | | 4.32 | |
| | | | | | | | | | | | |
(a) Expenses are calculated using the Fund’s annualized expense ratio (as disclosed in the table), multiplied by the average account value for the period, multiplied by the number of days in the period (184 days), and divided by the number of days in the year (365 days).
(b) 5% return per year before expenses.
GRAPHICAL PRESENTATION OF SCHEDULE OF INVESTMENTS
By Sector
At October 31, 2007
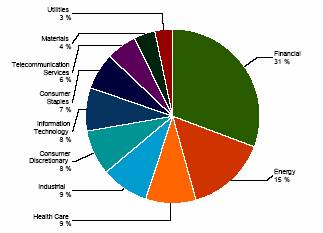
This chart shows the percentage breakdown by sector of the Fund’s total investment securities.
3
SCHEDULE OF INVESTMENTS
At October 31, 2007
(all amounts except share amounts in thousands)
| | Shares | | Value | |
COMMON STOCKS (94.7%) | | | | | |
Aerospace & Defense (1.0%) | | | | | |
Northrop Grumman Corp. | | 85,200 | | $ | 7,124 | |
Beverages (2.3%) | | | | | |
Coca-Cola Co. (The) | | 151,000 | | 9,326 | |
Pepsi Bottling Group, Inc. | | 166,700 | | 7,181 | |
Biotechnology (0.6%) | | | | | |
Amgen, Inc. ‡ | | 70,800 | | 4,114 | |
Capital Markets (2.9%) | | | | | |
Bear Stearns Cos., Inc. (The) | | 14,800 | | 1,681 | |
Merrill Lynch & Co., Inc. | | 142,400 | | 9,401 | |
Morgan Stanley | | 147,200 | | 9,901 | |
Chemicals (2.1%) | | | | | |
Ei DU Pont de Nemours & Co. | | 134,300 | | 6,649 | |
PPG Industries, Inc. | | 114,500 | | 8,558 | |
Commercial Banks (6.5%) | | | | | |
Bank of New York Mellon Corp. | | 110,500 | | 5,398 | |
National City Corp. | | 112,800 | | 2,735 | |
PNC Financial Services Group, Inc. | | 61,900 | | 4,467 | |
US Bancorp | | 277,400 | | 9,199 | |
Wachovia Corp. | | 217,800 | | 9,960 | |
Wells Fargo & Co. | | 432,500 | | 14,709 | |
Commercial Services & Supplies (1.4%) | | | | | |
Avery Dennison Corp. | | 28,200 | | 1,633 | |
RR Donnelley & Sons Co. | | 112,500 | | 4,532 | |
Waste Management, Inc. | | 112,800 | | 4,105 | |
Communications Equipment (0.2%) | | | | | |
Motorola, Inc. | | 95,100 | | 1,787 | |
Computers & Peripherals (2.7%) | | | | | |
Hewlett-Packard Co. | | 202,800 | | 10,481 | |
International Business Machines Corp. | | 73,900 | | 8,581 | |
Consumer Finance (0.2%) | | | | | |
Discover Financial Services | | 82,100 | | 1,585 | |
Diversified Consumer Services (0.6%) | | | | | |
H&R Block, Inc. | | 183,000 | | 3,989 | |
Diversified Financial Services (9.6%) | | | | | |
Bank of America Corp. (1) | | 478,300 | | 23,092 | |
Citigroup, Inc. | | 686,400 | | 28,760 | |
JPMorgan Chase & Co. | | 365,500 | | 17,179 | |
Diversified Telecommunication Services (4.6%) | | | | | |
AT&T, Inc. (1) | | 523,600 | | 21,881 | |
Verizon Communications, Inc. | | 242,100 | | 11,154 | |
Electric Utilities (2.9%) | | | | | |
Exelon Corp. | | 135,600 | | 11,225 | |
PPL Corp. | | 185,300 | | 9,580 | |
Electronic Equipment & Instruments (0.8%) | | | | | |
Tyco Electronics, Ltd. | | 71,700 | | 2,558 | |
Tyco International, Ltd. | | 75,500 | | 3,108 | |
Energy Equipment & Services (0.5%) | | | | | |
National Oilwell Varco, Inc. ‡ | | 49,000 | | 3,589 | |
Food & Staples Retailing (1.9%) | | | | | |
Kroger Co. (The) | | 158,900 | | 4,670 | |
Walgreen Co. | | 35,800 | | 1,419 | |
Wal-Mart Stores, Inc. | | 162,100 | | 7,329 | |
Food Products (1.1%) | | | | | |
Unilever NV | | 251,600 | | $ | 8,167 | |
Health Care Equipment & Supplies (0.4%) | | | | | |
Medtronic, Inc. | | 65,500 | | 3,107 | |
Health Care Providers & Services (0.3%) | | | | | |
Quest Diagnostics, Inc. | | 38,700 | | 2,058 | |
Hotels, Restaurants & Leisure (0.6%) | | | | | |
McDonald’s Corp. | | 77,000 | | 4,597 | |
Household Durables (0.7%) | | | | | |
Newell Rubbermaid, Inc. | | 165,800 | | 4,835 | |
Independent Power Producers & Energy Traders (0.3%) | | | | | |
NRG Energy, Inc. ‡ | | 41,700 | | 1,904 | |
Industrial Conglomerates (2.4%) | | | | | |
General Electric Co. | | 411,400 | | 16,933 | |
Insurance (6.0%) | | | | | |
Allstate Corp. (The) | | 140,800 | | 7,378 | |
American International Group, Inc. | | 224,000 | | 14,139 | |
Hartford Financial Services Group, Inc. | | 86,800 | | 8,422 | |
Loews Corp. | | 102,700 | | 5,041 | |
Marsh & McLennan Cos., Inc. | | 137,200 | | 3,552 | |
Torchmark Corp. | | 63,900 | | 4,164 | |
IT Services (0.4%) | | | | | |
Fiserv, Inc. ‡ | | 53,300 | | 2,953 | |
Machinery (3.2%) | | | | | |
Caterpillar, Inc. | | 59,300 | | 4,424 | |
Deere & Co. | | 19,400 | | 3,005 | |
Dover Corp. | | 98,500 | | 4,531 | |
Ingersoll-Rand Co., Ltd. Class A | | 113,500 | | 5,715 | |
Parker Hannifin Corp. | | 69,300 | | 5,570 | |
Media (3.2%) | | | | | |
Gannett Co., Inc. | | 163,100 | | 6,917 | |
Time Warner, Inc. | | 544,700 | | 9,946 | |
Viacom, Inc. Class B ‡ | | 145,500 | | 6,008 | |
Metals & Mining (0.6%) | | | | | |
Nucor Corp. | | 65,400 | | 4,056 | |
Multiline Retail (0.2%) | | | | | |
Kohl’s Corp. ‡ | | 31,500 | | 1,732 | |
Office Electronics (0.6%) | | | | | |
Xerox Corp. ‡ | | 228,900 | | 3,992 | |
Oil, Gas & Consumable Fuels (13.8%) | | | | | |
Chevron Corp. | | 249,000 | | 22,786 | |
ConocoPhillips | | 180,300 | | 15,318 | |
Devon Energy Corp. | | 27,000 | | 2,522 | |
Exxon Mobil Corp. | | 396,500 | | 36,474 | |
Royal Dutch Shell PLC Class A | | 249,600 | | 21,843 | |
Paper & Forest Products (1.1%) | | | | | |
Weyerhaeuser Co. | | 101,500 | | 7,705 | |
Pharmaceuticals (7.7%) | | | | | |
Abbott Laboratories | | 182,700 | | 9,979 | |
Eli Lilly & Co. | | 84,700 | | 4,586 | |
Johnson & Johnson | | 204,800 | | 13,347 | |
Merck & Co., Inc. | | 95,400 | | 5,558 | |
Pfizer, Inc. | | 520,500 | | 12,810 | |
Wyeth | | 175,500 | | 8,535 | |
The notes to the financial statements are an integral part of this report.
4
| | Shares | | Value | |
Semiconductors & Semiconductor Equipment (0.8%) | | | | | |
Applied Materials, Inc. | | 122,000 | | $ | 2,369 | |
Intel Corp. | | 130,000 | | 3,497 | |
Software (2.6%) | | | | | |
Microsoft Corp. | | 373,100 | | 13,734 | |
Oracle Corp. ‡ | | 235,600 | | 5,223 | |
Specialty Retail (2.1%) | | | | | |
Best Buy Co., Inc. ^ | | 93,200 | | 4,522 | |
Gap, Inc. (The) | | 213,700 | | 4,039 | |
Home Depot, Inc. ^ | | 77,600 | | 2,445 | |
Staples, Inc. | | 174,800 | | 4,080 | |
Textiles, Apparel & Luxury Goods (0.6%) | | | | | |
V.F. Corp. | | 48,800 | | 4,252 | |
Thrifts & Mortgage Finance (3.2%) | | | | | |
Countrywide Financial Corp. ^ | | 64,100 | | 995 | |
Freddie Mac | | 272,400 | | 14,228 | |
MGIC Investment Corp. ^ | | 105,600 | | 2,044 | |
Washington Mutual, Inc. | | 200,400 | | 5,587 | |
Tobacco (1.2%) | | | | | |
Altria Group, Inc. | | 118,000 | | 8,606 | |
Wireless Telecommunication Services (0.8%) | | | | | |
Sprint Nextel Corp. | | 322,300 | | 5,511 | |
Total Common Stocks (cost $612,176) | | | | 678,381 | |
| | | | | |
INVESTMENT COMPANIES (0.9%) | | | | | |
Capital Markets (0.9%) | | | | | |
SPDR Trust Series 1 Series T, Class T ^ | | 43,500 | | $ | 6,727 | |
Total Investment Companies (cost $5,579) | | | | 6,727 | |
Total Security Lending Collateral (cost $17,187) ± | | | | 17,187 | |
Total Investment Securities (cost $634,942) # | | | | $ | 702,295 | |
| | | | | | | |
FUTURES CONTRACTS:
| | | | | | | | Net Unrealized | |
| | | | Settlement | | | | Appreciation | |
| | Contracts (·) | | Date | | Amount | | (Depreciation) | |
S&P500 E-mini Index | | 151 | | 12/21/2007 | | $ | 1,742 | | 521 | |
| | | | | | $ | 1,742 | | $ | 521 | |
| | | | | | | | | | | |
NOTES TO SCHEDULE OF INVESTMENTS
^ At October 31, 2007, all or a portion of this security is on loan (see Note 1). The value at October 31, 2007, of all securities on loan is $16,592.
± Cash collateral for the Repurchase Agreements, valued at $3,137, that serves as collateral for securities lending, is invested in corporate and government bonds with interest rates and maturity dates ranging from 0.00% - 8.125% and 11/14/2007 - 9/15/2037.
‡ Non Income Producing
· Contract Amounts are not in thousands
1 At October 31, 2007, all or a portion of this security is segregated with the custodian to cover margin requirements for open futures contracts. The value of all securities segregated at October 31, 2007 is $2,071.
# Aggregate cost for federal income tax purposes is $635,939. Aggregate gross unrealized appreciation for all securities in which there is an excess of value over tax cost and aggregate gross unrealized depreciation for all securities in which there is an excess of tax cost over value were $97,361 and $31,005, respectively. Net unrealized appreciation for tax purposes is $66,356.
The notes to the financial statements are an integral part of this report.
5
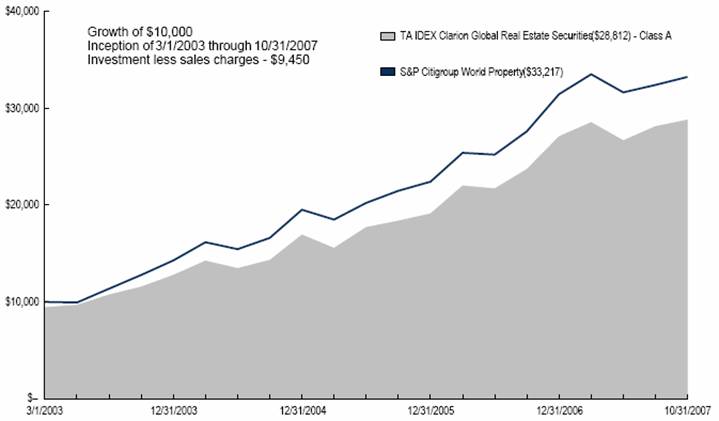
TA IDEX Clarion Global Real Estate Securities
MARKET ENVIRONMENT
By region, Asia-Pacific was the strongest performing region for the period followed by North America and Europe. Performance in the Asia-Pacific region was broad-based with total returns achieved in each of the major countries within this region: Hong Kong 73.78%, Singapore 56.62%, Australia 42.97% and Japan 12.21%. These strong returns were fueled by robust economic growth being generated by emerging economies within the region and those countries which benefit from this growth. The rapid urbanization of China in particular benefited property companies that were able to take advantage of this growth, including Hong Kong-based property developers of residential and commercial space which have expanded into mainland China.
Within Europe, the United Kingdom (“UK”) property stocks were particular laggards returning (13.05)% during the period. The UK has been beset by concerns of decelerating job growth, particularly in the financial district of London. Sentiment has turned for the worse as the expectation increases that property yields will increase in the coming year. As valuations become increasingly attractive, portfolio strategy of being underweight the UK property stocks may be reconsidered during the coming year.
Relative outperformance versus the benchmark was generated primarily by stock picking in Hong Kong, Japan, the United States and Canada. In Hong Kong, overweight positions in mainland residential developers Agile Property Holdings Limited and Guangzhou R&F Properties Co., Ltd. contributed to relative returns as each of these positions returned over 100% during the year. In Japan, an overweight position in Tokyo-based office companies also contributed to relative performance, including Mitsui Fudosan Co., Ltd. which is primarily a developer and landlord of office and condominium properties in the five central wards of Tokyo. Office fundamentals in Tokyo continue to improve, with increasing rent increases and low vacancy levels. Top performers in the U.S. included Hilton Hotels Corporation which appreciated sharply as a result of the announcement during the summer that it would be taken private by the The Blackstone Group, Inc. Archstone Communities Inc., a national apartment Real Estate Investment Trust (“REIT”), appreciated as the result of being taken private at a sharp premium. Federal Realty Investment Trust and Ventas, Inc., U.S. shopping center and healthcare REITs, respectively, also contributed to relative performance. Canadian holding Sunrise Senior Living, Inc. significantly contributed to relative performance as the result of being acquired at a sharp premium by a U.S. healthcare REIT during the year.
PERFORMANCE
For the year ended October 31, 2007, TA IDEX Clarion Global Real Estate Securities Class A returned 14.79%. By comparison its benchmark, the S&P/Citigroup World Property Index (“WPI”), returned 13.91%. As of October 31, 2007, the Fund’s net expense ratios for Class A, Class B, Class C, and Class I were 1.13%, 1.14%, 1.06%, and 0.88%, respectively.
STRATEGY REVIEW
TA IDEX Clarion Global Real Estate Securities offers a global strategy for real estate securities investors in the U.S. The portfolio generally owns between 80-110 real estate stocks with the goal of outperforming the WPI. The portfolio seeks to own attractively priced stocks that own property in markets with favorable underlying real estate fundamentals. The global universe of public real estate companies is approximately three times the size of the U.S. public company universe, which offers additional choices and diversification opportunities to the manager.
The rationale for a global listed property strategy remains very much intact including diversification via low correlation to broad equities and bonds, attractive current yield, attractive valuations and the spread of the REIT structure globally. This remains true even under the possible scenario of slowing global economic growth over the coming year. Investment themes looking out to 2008 include a continuing emphasis on investing in higher growth regions of the world, including the Asia-Pacific region, and looking for opportunities in select markets which are currently under-represented in the listed markets but which show stable to improving property fundamentals. Given the increased volatility in global equity markets, portfolio strategy will be to position itself with an orientation to top quality both by management team, strategy and physical properties.
T. Ritson Ferguson, CFA
Joseph P. Smith, CFA
Steven D. Burton, CFA
Co-Fund Managers
ING Clarion Real Estate Securities LP
6
(unaudited)
Average Annual Total Return for Periods Ended 10/31/2007
| | | | From | | Inception | |
| | 1 Year | | Inception | | Date | |
Class A (NAV) | | 14.79 | % | 26.95 | % | 3/1/03 | |
Class A (POP) | | 8.49 | % | 25.42 | % | 3/1/03 | |
S&P Citigroup World Property(1) | | 13.91 | % | 29.31 | % | 3/1/03 | |
| | | | | | | |
Class B (NAV) | | 14.77 | % | 26.41 | % | 3/1/03 | |
Class B (POP) | | 9.77 | % | 26.32 | % | 3/1/03 | |
| | | | | | | |
Class C (NAV) | | 14.95 | % | 26.35 | % | 3/1/03 | |
Class C (POP) | | 13.95 | % | 26.35 | % | 3/1/03 | |
| | | | | | | |
Class I (NAV) | | 15.11 | % | 28.20 | % | 11/15/05 | |
NOTES
(1) The S&P/Citigroup World Property (Citigroup World Property) Index is an unmanaged index used as a general measure of market performance. Calculations assume dividends and capital gains are reinvested and do not include any managerial expenses. From inception calculation is based on life of Class A shares. You cannot invest directly in an index.
The performance data presented represents past performance; future results may vary. Performance data does not reflect the deduction of taxes that would be paid on fund distributions or the redemption of fund shares. Investment return and principal value will fluctuate so that an investor’s shares, when redeemed, may be worth more or less than their original cost.
Current performance may be lower or higher than performance quoted. Please see www.transamericaidex.com for performance data current to the most recent month-end.
Public Offering Price (POP) returns include the reinvestment of dividends and capital gains and reflect the maximum sales charge of 5.5% for A shares or the maximum applicable contingent deferred sales charge (5% in the 1st year, decreasing to 0% after 6 years) for Class B shares and 1% (during the first 12 months) for Class C shares. Shares purchased prior to March 1, 2004 are subject to a maximum applicable contingent deferred sales charge (5% in the 1st year, decreasing to 0% after 7 years) for Class B shares and (2% in the 1st year, decreasing to 0% after 2 years) for Class C shares. Net Asset Value (NAV) returns include the reinvestment of dividends and capital gains but do not reflect any sales charges.
The Fund is non-diversified. Investments in a “non-diversified” fund may be subject to specific risks such as susceptibility to single economic, political or regulatory events and may be subject to greater loss than investments in a diversified fund. The risks of investing in REITs are similar to investing directly in real estate. Investing in real estate presents its own risks, including declining property values, overbuilding, low occupancy rates from commercial properties, rising operating expenses and interest rates, as well as taxes and other regulatory issues. This material must be preceded or accompanied by a current prospectus, which includes specific contents regarding the investment objectives and policies of this Fund. Investments in global securities involve risks relating to political, social and economic developments abroad, foreign currency contracts for hedging, as well as risks resulting from the differences between the regulations to which U.S. and foreign issuer markets are subject. This Fund is closed to new investments.
7
UNDERSTANDING YOUR FUNDS EXPENSES
(unaudited)
SHAREHOLDER EXPENSES
Fund shareholders may incur two types of costs: (1) transaction costs, including sales charges (loads) on purchases, contingent deferred sales charges on redemptions and redemption fees; and (2) ongoing costs, including management fees, 12b-1 distribution and service fees, and other fund expenses.
The following Example is intended to help you understand your ongoing costs (in dollars and cents) of investing in the Fund and to compare these costs with the ongoing costs of investing in other funds.
The Example is based on an investment of $1,000 invested at May 1, 2007 and held for the entire period until October 31, 2007.
ACTUAL EXPENSES
The first line in the table below provides information about actual account values and actual expenses. You may use the information in this line, together with the amount you invested, to estimate the expenses that you paid over the period. Simply divide your account value by $1,000 (for example, an $8,600 account value divided by $1,000 = 8.6), then multiply the result by the number in the first line of your Fund under the heading entitled “Expenses Paid During Period” to estimate the expenses you paid on your account during this period. If your account is an IRA, your expenses could have included a $15 annual fee. The amount of any fee paid through your account would increase the estimate of expenses you paid during the period and decrease your ending account value.
HYPOTHETICAL EXAMPLE FOR COMPARISON PURPOSES
The second line in the table below provides information about hypothetical account values and hypothetical expenses based on the Fund’s actual expense ratio and an assumed rate of return of 5% per year before expenses, which is not the Fund’s actual return. The hypothetical account values and expenses may not be used to estimate the actual ending account balance or expenses you paid for the period. You may use this information to compare the ongoing costs of investing in your Fund and other funds. To do so, compare this 5% hypothetical example with the 5% hypothetical examples that appear in the shareholder reports of the other funds. As in the case of the actual expense example, if your account is subject to an IRA fee, the amount of the fee paid through your account would increase the hypothetical expenses you would have paid during the period and decrease the hypothetical ending account value.
Please note that the expenses shown in the table are meant to highlight your ongoing costs only and do not reflect any transactional costs, such as sales charges, redemption fees, brokerage commissions paid on purchases and sales of fund shares. Therefore, the second line under the Fund in the table is useful in comparing ongoing costs only, and will not help you determine the relative total costs of owning different funds. If any of these transaction costs were included, your costs would be higher. The expenses shown in the table do not reflect any fees that may be charged to you by brokers, financial intermediaries or other financial institutions.
| | Beginning | | Ending | | Annualized | | Expenses | |
| | Account | | Account | | Expense | | Paid During | |
| | Value | | Value | | Ratio | | Period (a) | |
Class A | | | | | | | | | |
Actual | | $ | 1,000.00 | | $ | 1,004.82 | | 1.12 | % | $ | 5.64 | |
Hypothetical (b) | | 1,000.00 | | 1,019.51 | | 1.12 | | 5.69 | |
| | | | | | | | | |
Class B | | | | | | | | | |
Actual | | 1,000.00 | | 1,004.71 | | 1.13 | | 5.69 | |
Hypothetical (b) | | 1,000.00 | | 1,019.46 | | 1.13 | | 5.74 | |
| | | | | | | | | |
Class C | | | | | | | | | |
Actual | | 1,000.00 | | 1,005.80 | | 1.04 | | 5.24 | |
Hypothetical (b) | | 1,000.00 | | 1,019.91 | | 1.04 | | 5.28 | |
| | | | | | | | | |
Class I | | | | | | | | | |
Actual | | 1,000.00 | | 1,006.24 | | 0.88 | | 4.44 | |
Hypothetical (b) | | 1,000.00 | | 1,020.71 | | 0.88 | | 4.47 | |
| | | | | | | | | | | | |
(a) Expenses are calculated using the Fund’s annualized expense ratio (as disclosed in the table), multiplied by the average account value for the period, multiplied by the number of days in the period (184 days), and divided by the number of days in the year (365 days).
(b) 5% return per year before expenses.
GRAPHICAL PRESENTATION OF SCHEDULE OF INVESTMENTS
By Real Estate Property Breakdown
At October 31, 2007
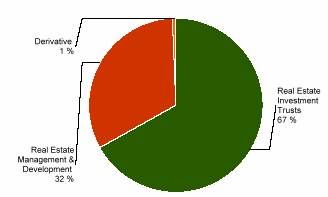
This chart shows the percentage breakdown by real estate property breakdown of the Fund’s total investment securities.
8
SCHEDULE OF INVESTMENTS
At October 31, 2007
(all amounts except share amounts in thousands)
| | Shares | | Value | |
CONVERTIBLE PREFERRED STOCKS (1.3%) | | | | | |
Real Estate Investment Trusts (1.3%) | | | | | |
CFS Retail Property Trust | | 896,400 | | $ | 2,027 | |
Macquarie Countrywide Trust | | 1,192,170 | | 2,221 | |
Macquarie Ddr Trust | | 681,700 | | 742 | |
Total Convertible Preferred Stocks (cost $4,266) | | | | 4,990 | |
| | | | | |
COMMON STOCKS (95.7%) | | | | | |
Hotels, Restaurants & Leisure (0.5%) | | | | | |
Mandarin Oriental International, Ltd. | | 318,900 | | 794 | |
Shangri-La Asia, Ltd. | | 266,900 | | 847 | |
Real Estate Investment Trusts (63.7%) | | | | | |
AMB Property Corp. (1) | | 45,600 | | 2,980 | |
Ascendas ‡, (1) | | 440,000 | | 787 | |
AvalonBay Communities, Inc. (1) | | 48,890 | | 5,996 | |
BioMed Realty Trust, Inc. (1) | | 48,200 | | 1,151 | |
Boston Properties, Inc. (1) | | 83,000 | | 8,992 | |
BRE Properties, Inc. Class A ^ (1) | | 46,000 | | 2,521 | |
British Land Co. PLC (1) | | 188,100 | | 4,236 | |
Brixton PLC (1) | | 86,500 | | 666 | |
Calloway Trust ‡ | | 40,600 | | 1,073 | |
Camden Property Trust (1) | | 30,660 | | 1,912 | |
CapitaMall Trust ‡, (1) | | 1,170,500 | | 2,957 | |
Centro Properties Group | | 155,778 | | 1,010 | |
Corio NV | | 51,670 | | 4,523 | |
Corporate Office Properties Trust SBI MD ^ (1) | | 32,800 | | 1,356 | |
DB Rreef Trust | | 1,007,154 | | 1,951 | |
Derwent London PLC | | 147,929 | | 5,107 | |
Douglas Emmett, Inc. ^ (1) | | 67,300 | | 1,771 | |
Equity One, Inc. ^ (1) | | 39,300 | | 1,029 | |
Equity Residential ^ (1) | | 18,600 | | 777 | |
Essex Property Trust, Inc. (1) | | 12,300 | | 1,518 | |
Eurocommercial Properties NV | | 25,180 | | 1,482 | |
Extra Space Storage, Inc. (1) | | 70,500 | | 1,108 | |
Federal Realty Investment Trust (1) | | 63,300 | | 5,584 | |
Felcor Lodging Trust, Inc. (1) | | 54,100 | | 1,133 | |
General Growth Properties, Inc. (1) | | 121,160 | | 6,586 | |
Goodman Group | | 1,117,184 | | 7,144 | |
GPT Group | | 797,684 | | 3,415 | |
Great Portland Estates PLC (1) | | 118,900 | | 1,412 | |
Hammerson PLC (1) | | 206,600 | | 4,772 | |
Health Care Property Investors, Inc. (1) | | 40,500 | | 1,379 | |
Highwoods Properties, Inc. (1) | | 51,800 | | 1,863 | |
Home Properties, Inc. ^ (1) | | 50,500 | | 2,597 | |
Host Hotels & Resorts, Inc. ^ (1) | | 274,543 | | 6,084 | |
Japan Logistics Fund, Inc. Class A (1) | | 269 | | 1,918 | |
Japan Real Estate Investment Corp. Class A (1) | | 159 | | 1,958 | |
Japan Retail Fund Investment Corp. Class A (1) | | 236 | | 1,736 | |
Kenedix Realty Investment Corp. Class A (1) | | 138 | | $ | 952 | |
Kilroy Realty Corp. (1) | | 27,700 | | 1,802 | |
Kimco Realty Corp. ^ (1) | | 56,700 | | 2,354 | |
Klepierre | | 28,440 | | 1,540 | |
Land Securities Group PLC (1) | | 193,980 | | 6,625 | |
LaSalle Hotel Properties (1) | | 21,700 | | 897 | |
Link (The) (1) | | 1,024,800 | | 2,311 | |
Macerich Co. (The) (1) | | 52,600 | | $ | 4,508 | |
Mercialys SA | | 55,320 | | 2,160 | |
Mirvac Group | | 649,364 | | 3,478 | |
Nationwide Health Properties, Inc. ^ (1) | | 106,700 | | 3,331 | |
New City Residence Investment Corp. Class A (1) | | 249 | | 1,153 | |
Nippon Accommodations Fund, Inc. Class A (1) | | 149 | | 887 | |
Nippon Building Fund, Inc. Class A (1) | | 247 | | 3,556 | |
Nomura Real Estate Residential Fund, Inc. Class A (1) | | 137 | | 844 | |
Omega Healthcare Investors, Inc. (1) | | 107,100 | | 1,792 | |
Post Properties, Inc. ^ (1) | | 29,600 | | 1,214 | |
ProLogis (1) | | 116,600 | | 8,365 | |
Public Storage, Inc. (1) | | 17,100 | | 1,384 | |
Regency Centers Corp. ^ (1) | | 71,700 | | 5,125 | |
RioCan Trust (1) | | 126,900 | | 3,105 | |
Segro PLC | | 151,500 | | 1,470 | |
SILIC | | 9,797 | | 1,511 | |
Simon Property Group, Inc. (1) | | 122,300 | | 12,733 | |
SL Green Realty Corp. ^ (1) | | 53,800 | | 6,491 | |
Societe de La Tour Eiffel | | 8,120 | | 1,359 | |
Stockland | | 658,700 | | 5,463 | |
Strategic Hotels & Resorts, Inc. (1) | | 42,200 | | 922 | |
Tanger Factory Outlet Centers (1) | | 46,300 | | 1,950 | |
Taubman Centers, Inc. (1) | | 44,600 | | 2,626 | |
Unibail-Rodamco | | 47,740 | | 11,853 | |
Valad Property Group | | 1,475,925 | | 2,585 | |
Ventas, Inc. (1) | | 131,100 | | 5,623 | |
Vornado Realty Trust ^ (1) | | 72,000 | | 8,044 | |
Westfield Group | | 979,943 | | 19,798 | |
Real Estate Management & Development (31.5%) | | | | | |
Agile Property Holdings, Ltd. | | 1,232,900 | | 2,952 | |
Allgreen Properties, Ltd. | | 143,500 | | 156 | |
Ascott Group, Ltd. (The) | | 589,800 | | 668 | |
Br Malls Participacoes SA ‡ | | 130,700 | | 1,908 | |
Brookfield Properties Corp. ^ | | 114,050 | | 2,848 | |
Capitaland, Ltd. | | 1,349,000 | | 7,496 | |
Cheung Kong Holdings, Ltd. ‡ | | 477,300 | | 9,280 | |
Citycon OYJ ^ @ | | 543,885 | | 3,541 | |
Conwert Immobilien Invest AG ‡ | | 154,700 | | 2,923 | |
DIC Asset AG | | 20,830 | | $ | 707 | |
Greentown China Holdings, Ltd. | | 311,700 | | 662 | |
Guangzhou R&F Properties Co., Ltd. Class H | | 476,000 | | 2,472 | |
Hang Lung Group, Ltd. | | 642,848 | | 3,765 | |
Hang Lung Properties, Ltd. | | 805,100 | | 3,828 | |
Hongkong Land Holdings, Ltd. | | 339,100 | | 1,689 | |
Hufvudstaden Class A ‡ | | 118,900 | | 1,304 | |
Keppel Land, Ltd. | | 120,100 | | 688 | |
Kerry Properties, Ltd. | | 466,200 | | 4,003 | |
Mitsubishi Estate Co., Ltd. | | 523,800 | | 15,539 | |
Mitsui Fudosan Co., Ltd. | | 592,600 | | 16,243 | |
Norwegian Property ASA | | 108,500 | | 1,348 | |
NTT Urban Development Corp. | | 551 | | 1,228 | |
Safestore Holdings, Ltd. | | 851,000 | | 3,116 | |
Shiamo Property Holdings, Ltd. | | 936,800 | | 3,306 | |
Shui On Land, Ltd. | | 2,033,900 | | 2,808 | |
The notes to the financial statements are an integral part of this report.
9
| | Shares | | Value | |
Real Estate Management & Development (continued) | | | | | | |
Sponda OYJ | | 168,680 | | $ | 2,309 | |
Sumitomo Realty & Development Co., | | 208,200 | | 7,278 | |
Sun Hung KAI Properties, Ltd. | | 655,545 | | 12,416 | |
Wharf Holdings, Ltd. ‡ | | 371,600 | | 2,220 | |
Wing Tai Holdings, Ltd. @ | | 460,300 | | 1,099 | |
Total Common Stocks (cost $293,382) | | | | 363,736 | |
| | Contracts (•) | | Value | |
PURCHASED OPTIONS (0.6%) | | | | | |
Covered Call Options (0.6%) | | | | | |
Brascan Residential Properties | | 306,100 | | 2,428 | |
Call Strike $(0.00) | | | | | |
Expires 10/22/2008 | | | | | |
Total Purchased Options (cost $2,155) | | | | 2,428 | |
| | Shares | | Value | |
WARRANTS (0.0%) | | | | | |
Real Estate Management & Development (0.0%) | | | | | |
China Overseas Land & Investment, Ltd. | | | | | |
Expiration: 08/27/2008, Exercise | | 39,050 | | $ | 33 | |
Price: $(12.50 HKD) | | | | | |
Total Warrants (cost $0) | | | | 33 | |
Total Security Lending Collateral (cost $43,412) ± | | | | 43,412 | |
Total Investment Securities (cost $343,215) # | | | | $ | 414,599 | |
| | Percentage of | | | |
(unaudited) | | Total Investments | | Value | |
INVESTMENTS BY INDUSTRY: | | | | | |
Real Estate Investment Trusts | | 59.6 | % | $ | 247,285 | |
Real Estate Management & Development | | 28.9 | % | 119,832 | |
Derivative | | 0.6 | % | 2,428 | |
Hotels, Restaurants & Leisure | | 0.4 | % | 1,642 | |
Investment Securities, at value | | 89.5 | % | 371,187 | |
Short-Term Investments | | 10.5 | % | 43,412 | |
Total Investments | | 100.0 | % | $ | 414,599 | |
NOTES TO SCHEDULE OF INVESTMENTS
^ | | At October 31, 2007, all or a portion of this security is on loan (see Note 1). The value at October 31, 2007, of all securities on loan is $41,935. |
± | | Cash collateral for the Repurchase Agreements, valued at $7,922, that serves as collateral for securities lending, is invested in corporate and government bonds with interest rates and maturity dates ranging from 0.00% - 8.125% and 11/14/2007 - 9/15/2037. |
‡ | | Non Income Producing |
· | | Contract Amounts are not in thousands |
@ | | Securities valued as determined in good faith in accordance with procedures established by the Fund’s Board of Trustees. |
# | | Aggregate cost for federal income tax purposes is $360,763. Aggregate gross unrealized appreciation for all securities in which there is an excess of value over tax cost and aggregate gross unrealized depreciation for all securities in which there is an excess of tax cost over value were $57,746 and $3,910, respectively. Net unrealized appreciation for tax purposes is $53,836. |
(1) | | Real Estate Investment Trust |
| | |
DEFINITIONS: |
SBI | | Shares Beneficial Interest |
BRL | | Brazil Real |
HKD | | Hong Kong dollar |
The notes to the financial statements are an integral part of this report.
10
TA IDEX Evergreen Health Care
MARKET ENVIRONMENT
During the 2007 fiscal year ending October 31, 2007 the overall market posted solid returns but with higher levels of volatility than seen in several years due to numerous global and domestic factors. Despite the short term sell-off in the Chinese market in early 2007 and a building evidence of a slowing U.S. economy, the first half of the period saw positive performance across sectors. During the second half of the year, investors generally began to favor larger cap more liquid investments as the dual U.S. housing market downturn and sub-prime credit driven liquidity crisis delivered capital market consequences felt on a global basis. U.S. financial and consumer stocks generally posted negative returns while returns in health care were mixed.
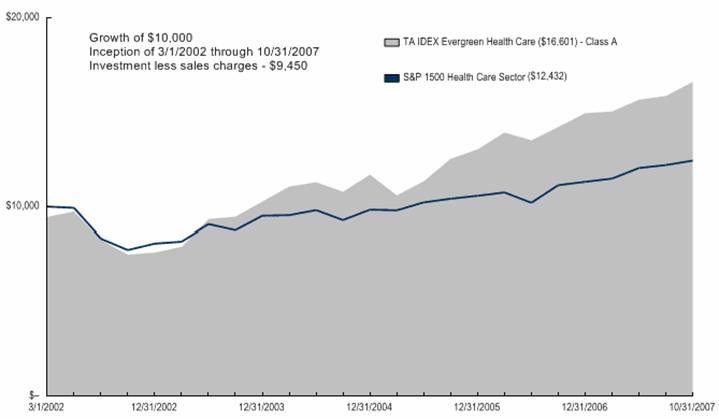
PERFORMANCE
For the year ended October 31, 2007, TA IDEX Evergreen Health Care, Class A returned 13.71%. By comparison its benchmark, Standard and Poor’s 1500 Super Composite Health Care Index (“S&P 1500 Health Care”), returned 11.12%. As of October 31, 2007, the Fund’s net expense ratios for Class A, Class B, Class C, and Class I were 1.24%, 1.24%, 1.24%, and 0.90%, respectively.
STRATEGY REVIEW
The portfolio outperformed the S&P 1500 Health Care over the fiscal year due to diversification across market caps, geographies and industry groups as well as our continued focus on intensive bottom-up research. Our investment process is disciplined in our focus on growth opportunities trading at significant discounts to intrinsic worth. We emphasize positive business momentum in the medium and long terms as well as the overall financial strength of the company. We made significant industry reallocations as we lowered exposure to biotechnology and pharmaceutical companies by consolidating into high conviction stocks such as BioMarin Pharmaceutical Inc. (“BioMarin”), Isis Pharmaceuticals, Inc. and Merck & Co., Inc., while selling companies such as Wyeth, Genzyme Corporation and Johnson & Johnson where growth prospects were lackluster. We increased weights in equipment and supplies companies such as Hologic, Inc. and Inverness Medical Innovations, Inc. as well as life sciences tools and services entity Thermo Fisher Scientific Inc., all of which exhibited attractive growth and valuation characteristics.
Our largest contributor to performance during the course of the year was superior stock selection in a number of areas including chemicals, biotechnology, pharmaceuticals and equipment and supplies. The top performer was Bayer AG, the German chemical concern engaged in successful transformation to a health care company, which benefited from synergies gained through 2006’s acquisition of Schering AG. Several biotechnology companies including BioMarin and Alexion Pharmaceuticals, Inc. provided strong upside based on good product momentum. Within major pharmaceuticals, our underweight allocations to Pfizer Inc., Johnson & Johnson and Eli Lilly and Company aided relative performance. In the equipment industry, strong product momentum from defibrillator manufacturer ZOLL Medical Corporation and from genetic diagnostic test manufacturer Gen-Probe Incorporated led those companies to post revenue and earnings growth above market expectations leading to price increases.
The largest individual stock detractor was Inyx, Inc., an emerging pharmaceutical company engaged in developing proprietary medication delivery technologies and products for the respiratory and dermatological markets. The company filed for Chapter 11 bankruptcy protection after a buyout offer fell through sending shares tumbling. Our lack of exposure to specific niches in the providers and services area also proved detrimental to performance as several of the pharmaceutical benefit managers, including Express Scripts, Inc. and Medco Health Solutions, Inc., sustained strong gains during the year. Finally, several of our foreign holdings underperformed during the period after several years of strong performance. These included Novartis AG (ADS), Chugai Pharmaceutical Co., Ltd. and AstraZeneca PLC.
Our investment approach continues to be diversified with respect to countries and market capitalizations. Our process is research driven focusing on a bottom-up look at each company to determine its growth potential underscored by valuation support prior to its inclusion in the portfolio. We will also be seeking opportunities across the health care sector to take advantage of non-mainstream investments including restructurings, asset stories, spin-offs and other special situations. As always, we pay close attention to risk analysis and management.
Our current exposure is in line with previous time periods in that we have diversification across several health care industries with high absolute weights in biotechnology and pharmaceuticals.
Robert Junkin
Fund Manager
Evergreen Investment Management Company, LLC
11
(unaudited)
Average Annual Total Return for Periods Ended 10/31/2007
| | | | | | From | | Inception | |
| | 1 Year | | 5 Years | | Inception | | Date | |
Class A (NAV) | | 13.71 | % | 16.23 | % | 10.44 | % | 3/1/02 | |
Class A (POP) | | 7.45 | % | 14.93 | % | 9.35 | % | 3/1/02 | |
S&P 1500 Super Health Care Sector (1) | | 11.12 | % | 8.73 | % | 4.17 | % | 3/1/02 | |
| | | | | | | | | |
Class B (NAV) | | 13.73 | % | 15.64 | % | 9.86 | % | 3/1/02 | |
Class B (POP) | | 8.80 | % | 15.53 | % | 9.86 | % | 3/1/02 | |
| | | | | | | | | |
Class C (NAV) | | 13.71 | % | — | % | 16.03 | % | 11/11/02 | |
Class C (POP) | | 12.72 | % | — | % | 16.03 | % | 11/11/02 | |
| | | | | | | | | |
Class I (NAV) | | 14.04 | % | — | % | 15.44 | % | 11/8/04 | |
NOTES
(1) The S&P 1500 Super Composite Health Care (S&P Super Composite Health Care) Index is an unmanaged index used as a general measure of market performance. Calculations assume dividends and capital gains are reinvested and do not include any managerial expenses. From inception calculation is based on life of Class A shares. You cannot invest directly in an index.
The performance data presented represents past performance; future results may vary. Performance data does not reflect the deduction of taxes that would be paid on fund distributions or the redemption of fund shares. Investment return and principal value will fluctuate so that an investor’s shares, when redeemed, may be worth more or less than their original cost.
Current performance may be lower or higher than performance quoted. Please see www.transamericaidex.com for performance data current to the most recent month-end.
Public Offering Price (POP) returns include the reinvestment of dividends and capital gains and reflect the maximum sales charge of 5.5% for A shares or the maximum applicable contingent deferred sales charge (5% in the 1st year, decreasing to 0% after 6 years) for Class B shares and 1% (during the first 12 months) for Class C shares. Shares purchased prior to March 1, 2004 are subject to a maximum applicable contingent deferred sales charge (5% in the 1st year, decreasing to 0% after 7 years) for Class B shares and (2% in the 1st year, decreasing to 0% after 2 years) for Class C shares. Net Asset Value (NAV) returns include the reinvestment of dividends and capital gains but do not reflect any sales charges.
The Fund is non-diversified. Investments in a “non-diversified” fund and sector funds may be subject to specific risks such as susceptibility to single economic, political, or regulatory events, and may be subject to greater loss than investments in a diversified fund. This material must be preceded or accompanied by a current prospectus, which includes specific contents regarding the investment objectives and policies of this Fund. This Fund is closed to new investments.
12
UNDERSTANDING YOUR FUNDS EXPENSES
(unaudited)
SHAREHOLDER EXPENSES
Fund shareholders may incur two types of costs: (1) transaction costs, including sales charges (loads) on purchases, contingent deferred sales charges on redemptions and redemption fees; and (2) ongoing costs, including management fees, 12b-1 distribution and service fees, and other fund expenses.
The following Example is intended to help you understand your ongoing costs (in dollars and cents) of investing in the Fund and to compare these costs with the ongoing costs of investing in other funds.
The Example is based on an investment of $1,000 invested at May 1, 2007 and held for the entire period until October 31, 2007.
ACTUAL EXPENSES
The first line in the table below provides information about actual account values and actual expenses. You may use the information in this line, together with the amount you invested, to estimate the expenses that you paid over the period. Simply divide your account value by $1,000 (for example, an $8,600 account value divided by $1,000 = 8.6), then multiply the result by the number in the first line of your Fund under the heading entitled “Expenses Paid During Period” to estimate the expenses you paid on your account during this period. If your account is an IRA, your expenses could have included a $15 annual fee. The amount of any fee paid through your account would increase the estimate of expenses you paid during the period and decrease your ending account value.
HYPOTHETICAL EXAMPLE FOR COMPARISON PURPOSES
The second line in the table below provides information about hypothetical account values and hypothetical expenses based on the Fund’s actual expense ratio and an assumed rate of return of 5% per year before expenses, which is not the Fund’s actual return. The hypothetical account values and expenses may not be used to estimate the actual ending account balance or expenses you paid for the period. You may use this information to compare the ongoing costs of investing in your Fund and other funds. To do so, compare this 5% hypothetical example with the 5% hypothetical examples that appear in the shareholder reports of the other funds. As in the case of the actual expense example, if your account is subject to an IRA fee, the amount of the fee paid through your account would increase the hypothetical expenses you would have paid during the period and decrease the hypothetical ending account value.
Please note that the expenses shown in the table are meant to highlight your ongoing costs only and do not reflect any transactional costs, such as sales charges, redemption fees, brokerage commissions paid on purchases and sales of fund shares. Therefore, the second line under the Fund in the table is useful in comparing ongoing costs only, and will not help you determine the relative total costs of owning different funds. If any of these transaction costs were included, your costs would be higher. The expenses shown in the table do not reflect any fees that may be charged to you by brokers, financial intermediaries or other financial institutions.
| | Beginning | | Ending | | Annualized | | Expenses | |
| | Account | | Account | | Expense | | Paid During | |
| | Value | | Value | | Ratio | | Period (a) | |
Class A | | | | | | | | | |
Actual | | $ | 1,000.00 | | $ | 1,032.62 | | 1.20 | % | $ | 6.13 | |
Hypothetical (b) | | 1,000.00 | | 1,019.10 | | 1.20 | | 6.09 | |
| | | | | | | | | |
Class B | | | | | | | | | |
Actual | | 1,000.00 | | 1,033.10 | | 1.20 | | 6.13 | |
Hypothetical (b) | | 1,000.00 | | 1,019.10 | | 1.20 | | 6.09 | |
| | | | | | | | | |
Class C | | | | | | | | | |
Actual | | 1,000.00 | | 1,033.28 | | 1.09 | | 5.57 | |
Hypothetical (b) | | 1,000.00 | | 1,019.66 | | 1.09 | | 5.53 | |
| | | | | | | | | |
Class I | | | | | | | | | |
Actual | | 1,000.00 | | 1,033.60 | | 0.90 | | 4.60 | |
Hypothetical (b) | | 1,000.00 | | 1,020.61 | | 0.90 | | 4.57 | |
| | | | | | | | | | | | |
(a) Expenses are calculated using the Fund’s annualized expense ratio (as disclosed in the table), multiplied by the average account value for the period, multiplied by the number of days in the period (184 days), and divided by the number of days in the year (365 days).
(b) 5% return per year before expenses.
GRAPHICAL PRESENTATION OF SCHEDULE OF INVESTMENTS
By Industry
At October 31, 2007
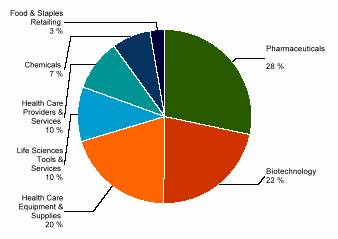
This chart shows the percentage breakdown by industry of the Fund’s total investment securities.
13
SCHEDULE OF INVESTMENTS
At October 31, 2007
(all amounts except share amounts in thousands)
| | Shares | | Value | |
PREFERRED STOCKS (0.9%) | | | | | |
Health Care Equipment & Supplies (0.9%) | | | | | |
Fresenius AG | | 42,630 | | $ | 3,375 | |
Total Preferred Stocks (cost $2,298) | | | | 3,375 | |
| | | | | |
COMMON STOCKS (90.8%) | | | | | |
Biotechnology (20.0%) | | | | | |
Alexion Pharmaceuticals, Inc. ‡^ | | 82,428 | | 6,306 | |
Altus Pharmaceuticals, Inc. ‡^ | | 25,000 | | 346 | |
Amgen, Inc. ‡ | | 130,114 | | 7,561 | |
Antisoma PLC ‡ | | 1,805,000 | | 1,125 | |
Applera Corp. - Celera Group ‡ | | 144,985 | | 2,365 | |
Arqule, Inc. ‡ | | 172,015 | | 1,350 | |
Array Biopharma, Inc. ‡ | | 59,000 | | 661 | |
Biogen IDEC, Inc. ‡ | | 40,147 | | 2,989 | |
BioMarin Pharmaceuticals, Inc. ‡^ | | 167,156 | | 4,635 | |
Celgene Corp. ‡ | | 57,067 | | 3,766 | |
Cephalon, Inc. ‡^ | | 63,500 | | 4,682 | |
Cepheid, Inc. ‡ | | 143,960 | | 3,726 | |
Cubist Pharmaceuticals, Inc. ‡ | | 22,097 | | 517 | |
Genentech, Inc. ‡ | | 46,523 | | 3,449 | |
Human Genome Sciences, Inc. ‡^ | | 192,653 | | 1,822 | |
Incyte Corp. ‡^ | | 310,510 | | 2,689 | |
Indevus Pharmaceuticals, Inc. ‡^ 1@ | | 282,704 | | 2,177 | |
Indevus Pharmaceuticals, Inc. ‡, §,1 | | 188,440 | | q | |
Isis Pharmaceuticals, Inc. ‡^ | | 268,477 | | 4,731 | |
Medarex, Inc. ‡^ | | 4,614 | | 55 | |
Orchid Cellmark, Inc. ‡ | | 323,251 | | 1,797 | |
OSI Pharmaceuticals, Inc. ‡^ | | 103,164 | | 4,289 | |
Panacos Pharmaceuticals, Inc. ‡^ | | 407,783 | | 1,019 | |
Regeneron Pharmaceuticals, Inc. ‡ | | 97,595 | | 2,147 | |
Theratechnologies, Inc. ‡ | | 550,000 | | 6,636 | |
Vertex Pharmaceuticals, Inc. ‡ | | 109,500 | | 3,541 | |
Chemicals (6.6%) | | | | | |
Bayer AG | | 242,277 | | 20,169 | |
Monsanto Co. | | 14,000 | | 1,367 | |
Syngenta AG | | 12,748 | | 3,060 | |
Computers & Peripherals (0.1%) | | | | | |
Medipattern Corp. (The) ‡ | | 159,723 | | 200 | |
Food & Staples Retailing (2.5%) | | | | | |
CVS Caremark Corp. | | 222,487 | | 9,293 | |
Health Care Equipment & Supplies (17.6%) | | | | | |
Abiomed, Inc. ‡^ | | 125,712 | | 1,718 | |
Beckman Coulter, Inc. | | 52,000 | | 3,683 | |
Boston Scientific Corp. ‡ | | 256,000 | | 3,551 | |
Covidien, Ltd. | | 56,000 | | 2,330 | |
CR Bard, Inc. | | 11,000 | | 920 | |
Ev3, Inc. ‡^ | | 223,500 | | 3,281 | |
GEN-Probe, Inc. ‡ | | 100,607 | | 7,045 | |
Hologic, Inc. ‡^ | | 49,000 | | 3,329 | |
Hospira, Inc. ‡ | | 75,136 | | 3,105 | |
Invacare Corp. | | 98,500 | | 2,665 | |
Inverness Medical Innovations, Inc. ‡ | | 98,000 | | 5,889 | |
Medtronic, Inc. | | 65,000 | | 3,084 | |
Nmt Medical, Inc. ‡^ | | 232,041 | | 1,731 | |
Smith & Nephew PLC | | 229,122 | | 3,091 | |
St Jude Medical, Inc. ‡ | | 82,709 | | $ | 3,369 | |
Synthes, Inc. | | 24,000 | | 2,994 | |
Thoratec Corp. ‡^ | | 189,000 | | 3,774 | |
Trans1, Inc. ‡^ | | 20,000 | | 500 | |
Varian Medical Systems, Inc. ‡ | | 65,000 | | 3,170 | |
Vital Signs, Inc. | | 39,515 | | 2,090 | |
Zoll Medical Corp. ‡ | | 166,000 | | 4,060 | |
Health Care Providers & Services (8.7%) | | | | | |
Brookdale Senior Living, Inc. ^ | | 45,042 | | 1,662 | |
Cardinal Health, Inc. | | 112,000 | | 7,619 | |
Emeritus Corp. ‡ | | 187,000 | | 6,171 | |
Fresenius Medical Care AG | | 63,348 | | 3,341 | |
McKesson Corp. | | 59,000 | | 3,900 | |
Medco Health Solutions, Inc. ‡ | | 25,500 | | 2,407 | |
WellPoint, Inc. ‡ | | 92,208 | | 7,306 | |
Life Sciences Tools & Services (9.3%) | | | | | |
Amag Pharmaceuticals, Inc. ‡^ | | 99,859 | | 6,526 | |
Applera Corp. - Applied Biosystems | | 97,924 | | 3,637 | |
Bio-Rad Laboratories, Inc. Class A ‡ | | 33,391 | | 3,225 | |
ENZO Biochem, Inc. ‡^ | | 350,000 | | 4,239 | |
Helicos Biosciences Corp. ‡ | | 100,500 | | 1,421 | |
Pharmaceutical Product Development | | 90,500 | | 3,823 | |
Qiagen NV ‡^ | | 89,000 | | 2,095 | |
Sequenom, Inc. ‡, §, ^ | | 102,108 | | 991 | |
Sequenom, Inc. ‡ | | 100,200 | | 973 | |
Thermo Fisher Scientific, Inc. ‡ | | 129,542 | | 7,618 | |
Pharmaceuticals (26.0%) | | | | | |
Abbott Laboratories | | 118,251 | | 6,459 | |
Adams Respiratory Therapeutics, Inc. ‡ ^ | | 121,000 | | 5,317 | |
Auxilium Pharmaceuticals, Inc. ‡ | | 169,000 | | 4,463 | |
Bristol-Myers Squibb Co. | | 148,398 | | 4,450 | |
Chugai Pharmaceutical Co., Ltd. | | 151,500 | | 2,615 | |
Eurand NV ‡^ | | 185,164 | | 2,546 | |
Forest Laboratories, Inc. ‡ | | 140,000 | | 5,470 | |
Inspire Pharmaceuticals, Inc. ‡ | | 130,000 | | 811 | |
Ipsen | | 124,505 | | 7,084 | |
Merck & Co., Inc. | | 270,395 | | 15,753 | |
Merck KGAA | | 41,986 | | 5,245 | |
Novartis AG | | 65,377 | | 3,476 | |
NOVO Nordisk A/S Class B | | 29,600 | | 3,666 | |
Pfizer, Inc. | | 151,000 | | 3,716 | |
Roche Holding AG | | 19,235 | | 3,279 | |
Schering-Plough Corp. | | 303,205 | | 9,254 | |
Sepracor, Inc. ‡ | | 102,000 | | 2,809 | |
Shire PLC | | 260,000 | | 6,487 | |
Sirtris Pharmaceuticals, Inc. ‡^ | | 49,400 | | 838 | |
Spectrum Pharmaceuticals, Inc. ‡^ | | 287,034 | | 1,088 | |
Xenoport, Inc. ‡ | | 32,000 | | 1,571 | |
Total Common Stocks (cost $276,144) | | | | 337,200 | |
The notes to the financial statements are an integral part of this report.
14
| | Shares | | Value | |
WARRANTS (0.0%) | | | | | |
Pharmaceuticals (0.0%) | | | | | |
MannKind Corp., | | | | | |
Expiration: (8/5/2020) § | | 30,624 | | $ | q | |
Poniard Pharmaceuticals, Inc. | | | | | |
Expiration: (12/08/2008) § | | 1,200 | | q | |
Total Warrants (cost $1) | | | | — | |
| | | | | |
Total Security Lending Collateral (cost $58,335) ± | | | | 58,335 | |
Total Investment Securities (cost $336,778) # | | | | $ | 398,910 | |
| | | | | | | |
NOTES TO SCHEDULE OF INVESTMENTS
q | | Value is less than $1 |
^ | | At October 31, 2007, all or a portion of this security is on loan (see Note 1). The value at October 31, 2007, of all securities on loan is $56,194. |
± | | Cash collateral for the Repurchase Agreements, valued at $10,646, that serves as collateral for securities lending, is invested in corporate and government bonds with interest rates and maturity dates ranging from 0.00% - 8.125% and 11/14/2007 - 9/15/2037. |
‡ | | Non Income Producing |
@ | | Securities valued as determined in good faith in accordance with procedures established by the Fund’s Board of Trustees. |
§ | | Illiquid |
(1) | | Right |
# | | Aggregate cost for federal income tax purposes is $336,949. Aggregate gross unrealized appreciation for all securities in which there is an excess ofvalue over tax cost and aggregate gross unrealized depreciation for all securities in which there is an excess of tax cost over value were $70,519 and$8,896, respectively. Net unrealized appreciation for tax purposes is $61,961. |
The notes to the financial statements are an integral part of this report.
15
TA IDEX Jennison Growth
MARKET ENVIRONMENT
Equity markets posted strong returns in the fiscal year ended October 31, 2007. The Russell 1000® Growth Index (“Russell 1000 Growth”) advanced 19.23% while the Standard and Poor’s 500 Composite Stock Index (“S&P 500”) rose 14.56%, marking the first time in several years that growth stocks outperformed the broader market. Strong US economic growth began to slow, but continued strength overseas, especially in emerging markets, helped drive US expansion. Reflecting in part the rapid development of emerging economies, the prices of commodities, such as metals and agricultural products, maintained elevated levels. Oil prices continued to rise – to record highs – and have shown no signs of abating. At the same time, the US dollar weakened against most major currencies. Inflation, while still largely contained, remains a risk. Corporate earnings growth began to slow, with S&P 500 earnings growth failing to break into the double digits for the first time in several years in 2007’s third quarter. Negative earnings revisions became less uncommon, with financial, retail, and homebuilding companies, along with some energy names, bearing the brunt. Rising energy prices, higher mortgage payments, and reduced home equity, combined to help bring on a much heralded slowdown in consumer spending. Employment, however, remained healthy. Problems in the sub-prime mortgage market, evident early in the year, spread as 2007 progressed. The ensuing credit crunch led to heightened market volatility, especially in July and August. Major financial institutions with balance sheets exposed to structured investment vehicles were hit, some hard. With fears of a serious slowdown in economic growth, the Federal Reserve Board lowered the federal funds rate in September for the first time since June 2003. The 50-basis-point cut spurred a stock market rally at the end of the portfolio’s fiscal year.
PERFORMANCE
For the year ended October 31, 2007, TA IDEX Jennison Growth Class A returned 18.59%. By comparison its benchmark, the Russell 1000 Growth, returned 19.23%. As of October 31, 2007, the Fund’s net expense ratios for Class A, Class B, Class C, and Class I were 1.30%, 1.23%, 1.20%, and 0.87%, respectively.
STRATEGY REVIEW
The portfolio is built from the bottom up, with stocks selected one at a time, based on the fundamentals of individual companies rather than on overarching themes. Stock selection in the information technology sector was the greatest contributor to positive relative performance, as Research in Motion Limited (“RIMM”), Apple Inc. (“Apple”), and Juniper Networks, Inc. (“Juniper”) posted impressive gains. RIMM advanced on the strength of the BlackBerry brand, as new subscribers grew at a solid pace and existing users embraced new product designs. Apple’s growth has been driven by the strength of iPod sales and a resurgence in Macintosh computer sales. The company should continue to benefit from its creativity and innovation in product design and marketing, most recently exhibited in the iPhone. Juniper’s investments in products, and sales force and channel strategy are yielding operating leverage, spurring acceleration in revenue and earnings per share (“EPS”) growth at the telecommunications equipment provider.
Stock selection was also strong in materials, where Monsanto Company (“Monsanto”) posted a triple-digit advance. The agricultural-seed and biotechnology company’s leading market share position, brand strength, first-mover advantage, operational performance, and technological innovation are helping Monsanto benefit from a bullish agriculture cycle.
Schlumberger Limited was a chief contributor in energy. The company has benefited from a resurgence in capital spending on energy-producing activity and from its business and geographic mix. Suncor Energy Inc. and Occidental Petroleum Corporation also performed well.
The consumer sectors were the greatest detractors from performance, as retailers, including Macy’s, Inc. (“Macy’s”) and Kohl’s Corporation, were weak. Declines in other consumer names, such as Whole Foods Market, Inc. (“Whole Foods”) and Starbucks Corporation (“Starbucks”), reflected company transitioning from stages of rapid expansion and high growth to more modest growth. We still like Whole Foods’ numerous competitive advantages within the rapidly growing natural products industry – size and scale of operations, strong brand image, and marketing and merchandising expertise. We eliminated our positions in Starbucks and Macy’s.
Spiros Segalas
Michael A. Del Balso
Blair A. Boyer
Co-Fund Managers
Jennison Associates LLC
16
(unaudited)

Average Annual Total Return for Periods Ended 10/31/2007
| | | | | | | | From | | Inception | |
| | 1 Year | | 5 Years | | 10 Years | | Inception | | Date | |
Class A (NAV) | | 18.59 | % | 14.77 | % | 3.73 | % | 5.85 | % | 2/1/96 | |
Class A (POP) | | 12.07 | % | 13.48 | % | 3.14 | % | 5.35 | % | 2/1/96 | |
Russell 1000 Growth (1) | | 19.23 | % | 12.61 | % | 4.81 | % | 7.58 | % | 2/1/96 | |
| | | | | | | | | | | |
Class B (NAV) | | 18.72 | % | 14.27 | % | 3.18 | % | 5.42 | % | 2/1/96 | |
Class B (POP) | | 13.72 | % | 14.15 | % | 3.18 | % | 5.42 | % | 2/1/96 | |
| | | | | | | | | | | |
Class C (NAV) | | 18.67 | % | — | % | — | % | 14.41 | % | 11/11/02 | |
Class C (POP) | | 17.67 | % | — | % | — | % | 14.41 | % | 11/11/02 | |
| | | | | | | | | | | |
Class I (NAV) | | 19.14 | % | — | % | — | % | 10.17 | % | 11/15/05 | |
NOTES
(1) The Russell 1000 Growth (Russell 1000 Growth) Index is an unmanaged index used as a general measure of market performance. Calculations assume dividends and capital gains are reinvested and do not include any managerial expenses. From inception calculation is based on life of Class A shares. You cannot invest directly in an index.
The performance data presented represents past performance, future results may vary. Performance data does not reflect the deduction of taxes that would be paid on fund distributions nor the redemption of fund shares. Investment return and principal value will fluctuate so that an investor’s shares, when redeemed, may be worth more or less than their original cost.
Current performance may be lower or higher than performance quoted. Please see www.transamericaidex.com for performance data current to the most recent month-end.
Public Offering Price (POP) returns include the reinvestment of dividends and capital gains and reflect the maximum sales charge of 5.5% for A shares or the maximum applicable contingent deferred sales charge (5% in the 1st year, decreasing to 0% after 6 years) for Class B shares and 1% (during the first 12 months) for Class C shares. Shares purchased prior to March 1, 2004 are subject to a maximum applicable contingent deferred sales charge (5% in the 1st year, decreasing to 0% after 7 years) for Class B shares and (2% in the 1st year, decreasing to 0% after 2 years) for Class C shares. Net Asset Value (NAV) returns include the reinvestment of dividends and capital gains but do not reflect any sales charges.
This material must be preceded or accompanied by a current prospectus, which includes specific contents regarding the investment objectives and policies of this Fund. This Fund is closed to new investments.
17
UNDERSTANDING YOUR FUNDS EXPENSES
(unaudited)
SHAREHOLDER EXPENSES
Fund shareholders may incur two types of costs: (1) transaction costs, including sales charges (loads) on purchases, contingent deferred sales charges on redemptions and redemption fees; and (2) ongoing costs, including management fees, 12b-1 distribution and service fees, and other fund expenses.
The following Example is intended to help you understand your ongoing costs (in dollars and cents) of investing in the Fund and to compare these costs with the ongoing costs of investing in other funds.
The Example is based on an investment of $1,000 invested at May 1, 2007 and held for the entire period until October 31, 2007.
ACTUAL EXPENSES
The first line in the table below provides information about actual account values and actual expenses. You may use the information in this line, together with the amount you invested, to estimate the expenses that you paid over the period. Simply divide your account value by $1,000 (for example, an $8,600 account value divided by $1,000 = 8.6), then multiply the result by the number in the first line of your Fund under the heading entitled “Expenses Paid During Period” to estimate the expenses you paid on your account during this period. If your account is an IRA, your expenses could have included a $15 annual fee. The amount of any fee paid through your account would increase the estimate of expenses you paid during the period and decrease your ending account value.
HYPOTHETICAL EXAMPLE FOR COMPARISON PURPOSES
The second line in the table below provides information about hypothetical account values and hypothetical expenses based on the Fund’s actual expense ratio and an assumed rate of return of 5% per year before expenses, which is not the Fund’s actual return. The hypothetical account values and expenses may not be used to estimate the actual ending account balance or expenses you paid for the period. You may use this information to compare the ongoing costs of investing in your Fund and other funds. To do so, compare this 5% hypothetical example with the 5% hypothetical examples that appear in the shareholder reports of the other funds. As in the case of the actual expense example, if your account is subject to an IRA fee, the amount of the fee paid through your account would increase the hypothetical expenses you would have paid during the period and decrease the hypothetical ending account value.
Please note that the expenses shown in the table are meant to highlight your ongoing costs only and do not reflect any transactional costs, such as sales charges, redemption fees, brokerage commissions paid on purchases and sales of fund shares. Therefore, the second line under the Fund in the table is useful in comparing ongoing costs only, and will not help you determine the relative total costs of owning different funds. If any of these transaction costs were included, your costs would be higher. The expenses shown in the table do not reflect any fees that may be charged to you by brokers, financial intermediaries or other financial institutions.
| | Beginning | | Ending | | Annualized | | Expenses | |
| | Account | | Account | | Expense | | Paid During | |
| | Value | | Value | | Ratio | | Period (a) | |
Class A | | | | | | | | | |
Actual | | $ | 1,000.00 | | $ | 1,121.42 | | 1.27 | % | $ | 6.79 | |
Hypothetical (b) | | 1,000.00 | | 1,018.74 | | 1.27 | | 6.46 | |
| | | | | | | | | |
Class B | | | | | | | | | |
Actual | | 1,000.00 | | 1,121.52 | | 1.18 | | 6.30 | |
Hypothetical (b) | | 1,000.00 | | 1,019.20 | | 1.18 | | 6.00 | |
| | | | | | | | | |
Class C | | | | | | | | | |
Actual | | 1,000.00 | | 1,122.23 | | 1.14 | | 6.09 | |
Hypothetical (b) | | 1,000.00 | | 1,019.40 | | 1.14 | | 5.79 | |
| | | | | | | | | |
Class I | | | | | | | | | |
Actual | | 1,000.00 | | 1,124.04 | | 0.87 | | 4.66 | |
Hypothetical (b) | | 1,000.00 | | 1,020.75 | | 0.87 | | 4.44 | |
| | | | | | | | | | | | |
(a) Expenses are calculated using the Fund’s annualized expense ratio (as disclosed in the table), multiplied by the average account value for the period, multiplied by the number of days in the period (184 days), and divided by the number of days in the year (365 days).
(b) 5% return per year before expenses.
GRAPHICAL PRESENTATION OF SCHEDULE OF INVESTMENTS
By Sector
At October 31, 2007
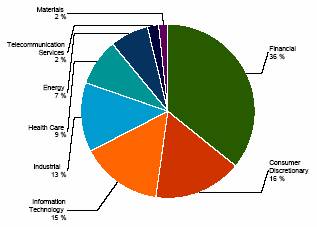
This chart shows the percentage breakdown by sector of the Fund’s total investment securities.
18
SCHEDULE OF INVESTMENTS
At October 31, 2007
(all amounts except share amounts in thousands)
| | Shares | | Value | |
COMMON STOCKS (95.5%) | | | | | |
Aerospace & Defense (3.9%) | | | | | |
Boeing Co. | | 38,200 | | $ | 3,766 | |
United Technologies Corp. | | 45,800 | | 3,508 | |
Beverages (2.0%) | | | | | |
PepsiCo, Inc. | | 51,600 | | 3,804 | |
Biotechnology (5.4%) | | | | | |
Amgen, Inc. ‡ | | 9,500 | | 552 | |
Genentech, Inc. ‡ | | 37,800 | | 2,802 | |
Gilead Sciences, Inc. ‡ | | 149,300 | | 6,896 | |
Capital Markets (5.6%) | | | | | |
Charles Schwab Corp. (The) | | 149,100 | | 3,465 | |
Goldman Sachs Group, Inc. (The) | | 13,200 | | 3,273 | |
Lazard, Ltd. Class A | | 39,500 | | 1,983 | |
UBS AG | | 33,100 | | 1,777 | |
Chemicals (2.2%) | | | | | |
Monsanto Co. | | 42,800 | | 4,179 | |
Communications Equipment (10.5%) | | | | | |
Ciena Corp. ‡^ | | 33,300 | | 1,594 | |
Cisco Systems, Inc. ‡ | | 155,100 | | 5,128 | |
Juniper Networks, Inc. ‡ | | 63,100 | | 2,271 | |
Qualcomm, Inc. | | 83,300 | | 3,559 | |
Research In Motion, Ltd. ‡ | | 58,500 | | 7,284 | |
Computers & Peripherals (5.8%) | | | | | |
Apple, Inc. ‡ | | 29,600 | | 5,622 | |
EMC Corp. ‡ | | 73,300 | | 1,861 | |
Hewlett-Packard Co. | | 67,800 | | 3,504 | |
Consumer Finance (1.3%) | | | | | |
American Express Co. | | 41,500 | | 2,529 | |
Diversified Financial Services (1.7%) | | | | | |
CME Group, Inc. Class A | | 1,300 | | 866 | |
NYSE Euronext ^ | | 24,800 | | 2,328 | |
Electrical Equipment (0.2%) | | | | | |
First Solar, Inc. ‡ | | 2,300 | | 365 | |
Energy Equipment & Services (1.4%) | | | | | |
Schlumberger, Ltd. | | 27,100 | | 2,617 | |
Food & Staples Retailing (1.1%) | | | | | |
Costco Wholesale Corp. | | 25,600 | | 1,722 | |
Whole Foods Market, Inc. ^ | | 7,900 | | 391 | |
Health Care Equipment & Supplies (5.1%) | | | | | |
Alcon, Inc. | | 22,200 | | 3,379 | |
Baxter International, Inc. | | 45,200 | | 2,712 | |
Hologic, Inc. ‡^ | | 21,900 | | 1,488 | |
St Jude Medical, Inc. ‡ | | 48,800 | | 1,988 | |
Hotels, Restaurants & Leisure (1.5%) | | | | | |
Marriott International, Inc. Class A | | 69,900 | | 2,874 | |
Household Products (3.7%) | | | | | |
Colgate-Palmolive Co. | | 57,600 | | 4,393 | |
Procter & Gamble Co. | | 36,100 | | 2,510 | |
Industrial Conglomerates (2.5%) | | | | | |
General Electric Co. | | 114,900 | | 4,729 | |
Internet & Catalog Retail (0.3%) | | | | | |
Alibaba.Com, Ltd. ‡ @ | | 13,200 | | 23 | |
Amazon.Com, Inc. ‡ | | 6,200 | | 553 | |
Internet Software & Services (7.7%) | | | | | |
Akamai Technologies, Inc. ‡^ | | 42,500 | | $ | 1,666 | |
eBay, Inc. ‡ | | 72,200 | | 2,606 | |
Google, Inc. Class A ‡^ | | 12,300 | | 8,696 | |
Yahoo!, Inc. ‡^ | | 49,500 | | 1,539 | |
IT Services (0.7%) | | | | | |
Infosys Technologies, Ltd. | | 27,200 | | 1,386 | |
Life Sciences Tools & Services (1.5%) | | | | | |
Thermo Fisher Scientific, Inc. ‡ | | 46,700 | | 2,746 | |
Media (3.8%) | | | | | |
News Corp. Class A | | 114,000 | | 2,471 | |
Walt Disney Co. (The) | | 134,600 | | 4,661 | |
Multiline Retail (2.2%) | | | | | |
Kohl’s Corp. ‡ | | 13,300 | | 731 | |
Saks, Inc. | | 69,700 | | 1,475 | |
Target Corp. | | 31,500 | | 1,933 | |
Oil, Gas & Consumable Fuels (2.6%) | | | | | |
Marathon Oil Corp. | | 34,900 | | 2,064 | |
Occidental Petroleum Corp. | | 26,600 | | 1,837 | |
Southwestern Energy Co. ‡ | | 5,400 | | 279 | |
Suncor Energy, Inc. | | 7,400 | | 808 | |
Pharmaceuticals (10.0%) | | | | | |
Abbott Laboratories | | 75,900 | | 4,146 | |
Elan Corp. PLC ‡ | | 37,500 | | 892 | |
Merck & Co., Inc. | | 48,300 | | 2,814 | |
Roche Holding AG | | 41,438 | | 3,508 | |
Schering-Plough Corp. | | 78,200 | | 2,387 | |
Teva Pharmaceutical Industries, Ltd. | | 67,200 | | 2,957 | |
Wyeth | | 43,400 | | 2,110 | |
Semiconductors & Semiconductor Equipment (2.4%) | | | | | |
Applied Materials, Inc. | | 42,700 | | 829 | |
Intel Corp. | | 75,900 | | 2,042 | |
NVIDIA Corp. ‡ | | 47,550 | | 1,682 | |
Software (6.1%) | | | | | |
Adobe Systems, Inc. ‡ | | 109,100 | | 5,226 | |
Microsoft Corp. | | 151,200 | | 5,566 | |
Vmware, Inc. Class A ‡^ | | 5,600 | | 699 | |
Specialty Retail (0.8%) | | | | | |
Lowe’s Cos, Inc. | | 50,900 | | 1,369 | |
Urban Outfitters, Inc. ‡ | | 8,000 | | 202 | |
Textiles, Apparel & Luxury Goods (2.9%) | | | | | |
Coach, Inc. ‡ | | 71,700 | | 2,622 | |
Nike, Inc. Class B | | 42,700 | | 2,829 | |
Wireless Telecommunication Services (0.6%) | | | | | |
NII Holdings, Inc. ‡ | | 18,700 | | 1,085 | |
Total Common Stocks (cost $138,934) | | | | 180,157 | |
| | | | | |
Total Security Lending Collateral (cost $10,319) ± | | | | 10,319 | |
Total Investment Securities (cost $149,252) # | | | | $ | 190,476 | |
| | | | | | | |
The notes to the financial statements are an integral part of this report.
19
NOTES TO SCHEDULE OF INVESTMENTS
^ | | At October 31, 2007, all or a portion of this security is on loan (see Note 1). The value at October 31, 2007, of all securities on loan is $10,055. |
± | | Cash collateral for the Repurchase Agreements, valued at $1,883, that serves as collateral for securities lending, is invested in corporate and government bonds with interest rates and maturity dates ranging from 0.00% - 8.125% and 11/14/2007 - 9/15/2037. |
‡ | | Non Income Producing |
@ | | Securities valued as determined in good faith in accordance with procedures established by the Fund’s Board of Trustees. |
# | | Aggregate cost for federal income tax purposes is $149,515. Aggregate gross unrealized appreciation for all securities in which there is an excess of value over tax cost and aggregate gross unrealized depreciation for all securities in which there is an excess of tax cost over value were $41,449 and $488, respectively. Net unrealized appreciation for tax purposes is $40,961. |
The notes to the financial statements are an integral part of this report.
20
TA IDEX Legg Mason Partners Investors Value
MARKET ENVIRONMENT
Weaker housing prices and growing inflation concerns are on the minds of both Wall Street and Main Street, a stark contrast to the experience of recent years.
Fiscal 2007 started with strong corporate earnings and robust private equity activity. Several years of low credit losses and the ample liquidity provided support to consumers and investors. Private equity offered an alternative bid for stocks and generated high fees for financial institutions. Emerging economies remained robust, with growing demand for oil and other commodities pushing prices higher, while the dollar continued to slide. As the year progressed, gross domestic product (“GDP”) slowed and the Federal Reserve Board (“Fed”) became increasingly concerned about inflation.
During the summer months, investors became increasingly worried that a weaker housing market and broader sub-prime lending exposure could spill over into the rest of the economy. Growing concerns that hundreds of billions of dollars of leveraged loan commitments would end up on banks’ balance sheets and force them to take major mark-to-market charges contributed to already deteriorating credit markets. After reaching a high of 1553 on July 19th, the Standard and Poor’s 500 Composite Stock Index (“S&P 500”) fell more than 9% to 1406 on August 15th. Central banks responded by injecting massive amounts of liquidity, and the Fed reduced the federal funds rate (“fed funds rate”) by an aggressive 50 basis points to 4.75% on September 18th.
Structured investment products, such as collateralized debt obligations, that were intended to redistribute risk may have exacerbated the problem. High credit ratings gave investors false comfort and masked the impact of weak underwriting standards and declining home prices. As a result of uncertainty, liquidity in these instruments has declined dramatically forcing financial institutions to recognize large mark-to-market losses. Balancing concerns about further economic deterioration with fears of inflation, the Fed cut the fed funds rate by a more measured 25 basis points on October 31st. Benchmark crude oil finished fiscal 2007 at $94.53, up 61% over the preceding 12 months, while the dollar weakened about 13.5% against the Euro.
Leading sectors of the S&P 500 during the period included energy (38.36%), materials (34.11%) and information technology (26.90%). The remaining sectors, with the exception of financials (-2.53%) and consumer discretionary (-0.07%), also posted positive returns.
PERFORMANCE
For the year ending October 31, 2007, TA IDEX Legg Mason Partners Investors Value Class A returned 11.90%. By comparison, its primary and secondary benchmarks, the S&P 500 and the Russell 1000 Value Index (“Russell 1000 Value”), returned 14.56% and 10.83%, respectively. As of October 31, 2007, the Fund’s net expense ratios for Class A, Class B, Class C, and Class I were 1.21%, 1.20%, 1.19% and 0.89%, respectively.
STRATEGY REVIEW
The portfolio’s outperformance relative to the Russell 1000 Value during the period was mainly attributable to security selection, which was strongest in consumer discretionary and financials and weakest in telecommunication services and health care. Sector allocation had a negative affect to the overall performance. An underweight position in energy and an overweight in consumer discretionary detracted from performance. However, an underweight in financials and an overweight in industrials were overall contributors to the portfolio’s performance.
Top contributors to performance during the period included Nokia Corporation, McDonald’s Corporation, Textron Inc., Altria Group, Inc., and GlobalSantaFe Corporation. We continue to hold these stocks. Stocks that detracted from performance came from the financial sector and included Merrill Lynch & Co., Inc., Capital One Financial Corporation, Federal Home Loan Mortgage Corporation (“Freddie Mac”), Marsh & McLennan Companies, Inc. and Wachovia Corporation. Financial stocks remain under pressure due to sub-prime mortgage exposure and the concerns that this weakness will spill over into the broader economy.
We have reduced our financial and health-care sector exposure in the portfolio and increased our information technology (“IT”) and industrials weightings. We are currently overweight in the consumer discretionary, IT and industrials sectors and underweight in the energy, financials and utilities sectors compared with the Russell 1000 Value.
In this environment, we continue to favor large cap companies with self sufficient balance sheets, strong business franchises and sustainable cash flow. We manage the portfolio with a focus on high quality companies and look for opportunities created by the increased market volatility.
Dmitry Khaykin
Robert Feitler
Co-Fund Managers
ClearBridge Advisors, LLC
21
(unaudited)
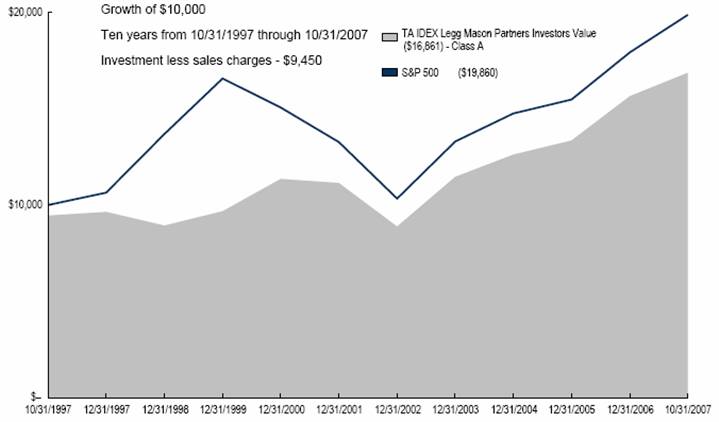
Average Annual Total Return for Periods Ended 10/31/2007
| | | | | | | | From | | Inception | |
| | 1 Year | | 5 Years | | 10 Years | | Inception | | Date | |
| | | | | | | | | | | |
Class A (NAV) | | 11.90 | % | 14.22 | % | 5.96 | % | 7.09 | % | 2/1/97 | |
Class A (POP) | | 5.72 | % | 12.94 | % | 5.36 | % | 6.53 | % | 2/1/97 | |
S&P 500(1) | | 14.56 | % | 13.88 | % | 7.10 | % | 8.24 | % | 2/1/97 | |
Russell 1000 Value(1) | | 10.83 | % | 16.39 | % | 9.11 | % | 10.31 | % | 2/1/97 | |
| | | | | | | | | | | |
Class B (NAV) | | 11.80 | % | 13.69 | % | 5.39 | % | 6.61 | % | 2/1/97 | |
Class B (POP) | | 7.34 | % | 13.58 | % | 5.39 | % | 6.61 | % | 2/1/97 | |
| | | | | | | | | | | |
Class C (NAV) | | 11.83 | % | — | % | — | % | 13.90 | % | 11/11/02 | |
Class C (POP) | | 10.94 | % | — | % | — | % | 13.90 | % | 11/11/02 | |
| | | | | | | | | | | |
Class I (NAV) | | 12.10 | % | — | % | — | % | 14.44 | % | 11/15/05 | |
NOTES
(1) The Standard and Poor’s 500 Composite Stock (S&P 500) Index and the Russell 1000 Value (Russell 1000 Value) Index are unmanaged indices used as a general measure of market performance. Calculations assume dividends and capital gains are reinvested and do not include any managerial expenses. From inception calculation is based on life of Class A shares. You cannot invest directly in an index.
The performance data presented represents past performance; future results may vary. Performance data does not reflect the deduction of taxes that would be paid on fund distributions or the redemption of fund shares. Investment return and principal value will fluctuate so that an investor’s shares, when redeemed, may be worth more or less than their original cost.
Current performance may be lower or higher than performance quoted. Please see www.transamericaidex.com for performance data current to the most recent month-end.
Public Offering Price (POP) returns include the reinvestment of dividends and capital gains and reflect the maximum sales charge of 5.5% for A shares or the maximum applicable contingent deferred sales charge (5% in the 1st year, decreasing to 0% after 6 years) for Class B shares and 1% (during the first 12 months) for Class C shares. Shares purchased prior to March 1, 2004 are subject to a maximum applicable contingent deferred sales charge (5% in the 1st year, decreasing to 0% after 7 years) for Class B shares and (2% in the 1st year, decreasing to 0% after 2 years) for Class C shares.Net Asset Value (NAV) returns include the reinvestment of dividends and capital gains but do not reflect any sales charges.
This material must be preceded or accompanied by a current prospectus, which includes specific contents regarding the investment objectives and policies of this Fund. This Fund is closed to new investments.
22
UNDERSTANDING YOUR FUNDS EXPENSES \
(unaudited)
SHAREHOLDER EXPENSES
Fund shareholders may incur two types of costs: (1) transaction costs, including sales charges (loads) on purchases, contingent deferred sales charges on redemptions and redemption fees; and (2) ongoing costs, including management fees, 12b-1 distribution and service fees, and other fund expenses.
The following Example is intended to help you understand your ongoing costs (in dollars and cents) of investing in the Fund and to compare these costs with the ongoing costs of investing in other funds.
The Example is based on an investment of $1,000 invested at May 1, 2007 and held for the entire period until October 31, 2007.
ACTUAL EXPENSES
The first line in the table below provides information about actual account values and actual expenses. You may use the information in this line, together with the amount you invested, to estimate the expenses that you paid over the period. Simply divide your account value by $1,000 (for example, an $8,600 account value divided by $1,000 = 8.6), then multiply the result by the number in the first line of your Fund under the heading entitled “Expenses Paid During Period” to estimate the expenses you paid on your account during this period. If your account is an IRA, your expenses could have included a $15 annual fee. The amount of any fee paid through your account would increase the estimate of expenses you paid during the period and decrease your ending account value.
HYPOTHETICAL EXAMPLE FOR COMPARISON PURPOSES
The second line in the table below provides information about hypothetical account values and hypothetical expenses based on the Fund’s actual expense ratio and an assumed rate of return of 5% per year before expenses, which is not the Fund’s actual return. The hypothetical account values and expenses may not be used to estimate the actual ending account balance or expenses you paid for the period. You may use this information to compare the ongoing costs of investing in your Fund and other funds. To do so, compare this 5% hypothetical example with the 5% hypothetical examples that appear in the shareholder reports of the other funds. As in the case of the actual expense example, if your account is subject to an IRA fee, the amount of the fee paid through your account would increase the hypothetical expenses you would have paid during the period and decrease the hypothetical ending account value.
Please note that the expenses shown in the table are meant to highlight your ongoing costs only and do not reflect any transactional costs, such as sales charges, redemption fees, brokerage commissions paid on purchases and sales of fund shares. Therefore, the second line under the Fund in the table is useful in comparing ongoing costs only, and will not help you determine the relative total costs of owning different funds. If any of these transaction costs were included, your costs would be higher. The expenses shown in the table do not reflect any fees that may be charged to you by brokers, financial intermediaries or other financial institutions.
| | Beginning | | Ending | | Annualized | | Expenses | |
| | Account | | Account | | Expense | | Paid During | |
| | Value | | Value | | Ratio | | Period (a) | |
| | | | | | | | | |
Class A | | | | | | | | | |
Actual | | $ | 1,000.00 | | $ | 1,030.58 | | 1.21 | % | $ | 6.18 | |
Hypothetical (b) | | 1,000.00 | | 1,019.05 | | 1.21 | | 6.14 | |
| | | | | | | | | |
Class B | | | | | | | | | |
Actual | | 1,000.00 | | 1,030.23 | | 1.18 | | 6.02 | |
Hypothetical (b) | | 1,000.00 | | 1,019.20 | | 1.18 | | 5.99 | |
| | | | | | | | | |
Class C | | | | | | | | | |
Actual | | 1,000.00 | | 1,030.48 | | 1.20 | | 6.12 | |
Hypothetical (b) | | 1,000.00 | | 1,019.10 | | 1.20 | | 6.09 | |
| | | | | | | | | |
Class I | | | | | | | | | |
Actual | | 1,000.00 | | 1,031.63 | | 0.89 | | 4.55 | |
Hypothetical (b) | | 1,000.00 | | 1,020.66 | | 0.89 | | 4.52 | |
| | | | | | | | | | | | |
(a) Expenses are calculated using the Fund’s annualized expense ratio (as disclosed in the table), multiplied by the average account value for the period, multiplied by the number of days in the period (184 days), and divided by the number of days in the year (365 days).
(b) 5% return per year before expenses.
GRAPHICAL PRESENTATION OF SCHEDULE OF INVESTMENTS
By Sector
At October 31, 2007
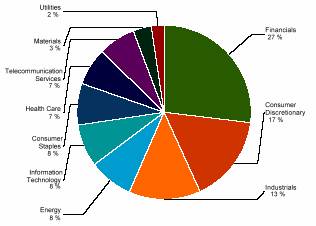
This chart shows the percentage breakdown by sector of the Fund’s total investment securities
23
SCHEDULE OF INVESTMENTS
At October 31, 2007
(all amounts except share amounts in thousands)
| | Shares | | Value | |
COMMON STOCKS (95.5%) | | | | | |
Aerospace & Defense (5.6%) | | | | | |
Boeing Co. | | 10,100 | | $ | 996 | |
L-3 Communications Holdings, Inc. ^ | | 8,700 | | 954 | |
Raytheon Co. ^ | | 19,200 | | 1,221 | |
United Technologies Corp. | | 21,100 | | 1,616 | |
Capital Markets (1.4%) | | | | | |
Merrill Lynch & Co., Inc. | | 18,290 | | 1,208 | |
Chemicals (3.2%) | | | | | |
Air Products & Chemicals, Inc. | | 15,400 | | 1,507 | |
Ei DU Pont de Nemours & Co. | | 25,600 | | 1,267 | |
Commercial Banks (4.3%) | | | | | |
Bank of New York Mellon Corp. | | 22,547 | | 1,101 | |
Wachovia Corp. ^ | | 23,953 | | 1,095 | |
Wells Fargo & Co. ^ | | 44,500 | | 1,514 | |
Commercial Services & Supplies (1.1%) | | | | | |
Avery Dennison Corp. | | 15,500 | | 898 | |
Communications Equipment (3.5%) | | | | | |
Comverse Technology, Inc. ‡ | | 42,700 | | 821 | |
Nokia OYJ | | 55,500 | | 2,204 | |
Computers & Peripherals (1.3%) | | | | | |
International Business Machines Corp. | | 9,900 | | 1,150 | |
Consumer Finance (4.4%) | | | | | |
American Express Co. | | 37,500 | | 2,286 | |
Capital One Financial Corp. | | 23,000 | | 1,508 | |
Diversified Financial Services (4.3%) | | | | | |
Bank of America Corp. | | 33,900 | | 1,636 | |
JPMorgan Chase & Co. | | 43,100 | | 2,026 | |
Diversified Telecommunication Services (4.9%) | | | | | |
AT&T, Inc. | | 64,284 | | 2,686 | |
Embarq Corp. | | 28,504 | | 1,509 | |
Electric Utilities (2.3%) | | | | | |
Sempra Energy | | 31,300 | | 1,925 | |
Energy Equipment & Services (2.0%) | | | | | |
GlobalSantaFe Corp. | | 21,500 | | 1,742 | |
Food & Staples Retailing (1.4%) | | | | | |
Wal-Mart Stores, Inc. | | 27,200 | | 1,230 | |
Food Products (1.1%) | | | | | |
Kraft Foods, Inc. Class A | | 27,466 | | 918 | |
Health Care Providers & Services (3.7%) | | | | | |
UnitedHealth Group, Inc. | | 28,700 | | 1,411 | |
WellPoint, Inc. ‡ | | 22,000 | | 1,743 | |
Hotels, Restaurants & Leisure (2.7%) | | | | | |
McDonald’s Corp. | | 38,900 | | 2,322 | |
Household Products (1.9%) | | | | | |
Kimberly-Clark Corp. | | 22,500 | | 1,595 | |
Industrial Conglomerates (6.1%) | | | | | |
General Electric Co. | | 74,500 | | 3,066 | |
Textron, Inc. | | 31,000 | | 2,146 | |
Insurance (9.5%) | | | | | |
Aflac, Inc. | | 33,400 | | 2,097 | |
Chubb Corp. | | 26,400 | | 1,408 | |
Loews Corp. | | 43,200 | | 2,121 | |
Marsh & McLennan Cos., Inc. ^ | | 42,760 | | 1,107 | |
St. Paul Travelers Cos., Inc. (The) ‡ | | 27,300 | | 1,425 | |
Internet & Catalog Retail (1.4%) | | | | | |
Liberty Media Corp. - Interactive | | 54,153 | | $ | 1,150 | |
Class A ‡ | | | | | |
Media (9.1%) | | | | | |
EchoStar Communications Corp. Class A ‡ | | 27,500 | | 1,346 | |
Liberty Media Corp. - Capital Series A, Class A ‡ | | 11,380 | | 1,422 | |
News Corp. Class B ^ | | 106,100 | | 2,433 | |
SES | | 31,800 | | 784 | |
Time Warner, Inc. | | 100,200 | | 1,830 | |
Multiline Retail (1.2%) | | | | | |
Target Corp. ^ | | 16,600 | | 1,019 | |
Oil, Gas & Consumable Fuels (5.8%) | | | | | |
Royal Dutch Shell PLC Class A | | 13,800 | | 1,208 | |
Suncor Energy, Inc. ^ | | 9,204 | | 1,005 | |
Total SA | | 34,200 | | 2,757 | |
Pharmaceuticals (3.0%) | | | | | |
Abbott Laboratories | | 24,400 | | 1,333 | |
Novartis AG | | 22,600 | | 1,201 | |
Semiconductors & Semiconductor Equipment (1.3%) | | | | | |
Texas Instruments, Inc. | | 33,500 | | 1,092 | |
Software (1.4%) | | | | | |
Microsoft Corp. | | 32,200 | | 1,185 | |
Specialty Retail (1.2%) | | | | | |
Home Depot, Inc. ^ | | 32,000 | | 1,008 | |
Thrifts & Mortgage Finance (1.7%) | | | | | |
Freddie Mac | | 27,989 | | 1,462 | |
Tobacco (3.0%) | | | | | |
Altria Group, Inc. | | 35,200 | | 2,567 | |
Wireless Telecommunication Services (1.7%) | | | | | |
Sprint Nextel Corp. ^ | | 85,713 | | 1,466 | |
Total Common Stocks (cost $63,539) | | | | 81,727 | |
| | | | | |
Total Security Lending Collateral (cost $9,828) ± | | | | 9,828 | |
Total Investment Securities (cost $73,367) # | | | | $ | 91,555 | |
24
NOTES TO SCHEDULE OF INVESTMENTS
^ | | At October 31, 2007, all or a portion of this security is on loan (see Note 1). The value at October 31, 2007, of all securities on loan is $9,472. |
± | | Cash collateral for the Repurchase Agreements, valued at $1,794, that serves as collateral for securities lending, is invested in corporate and government bonds with interest rates and maturity dates ranging from 0.00% - 8.125% and 11/14/2007 - 9/15/2037. |
‡ | | Non Income Producing. |
# | | Aggregate cost for federal income tax purposes is $73,840. Aggregate gross unrealized appreciation for all securities in which there is an excess of value over tax cost and aggregate gross unrealized depreciation for all securities in which there is an excess of tax cost over value were $19,319 and $1,604, respectively. Net unrealized appreciation for tax purposes is $17,715. |
The notes to the financial statements are an integral part of this report.
25
TA IDEX Marsico Growth
MARKET ENVIRONMENT
US large capitalization equities, as measured by the Standard and Poor’s 500 Composite Stock Index (“S&P 500”), posted overall strong gains for the one-year period ended October 31, 2007 despite considerable intra-period volatility and periodic “headwinds.” Equities were faced with a number of seemingly contradictory data points about the strength and trajectory of the US economy, with concerns regarding inflationary pressures on the one hand and fears of a significant economic slowdown on the other. Large capitalization equity benchmarks such as the S&P 500 and Russell 1000 Growth Index (“Russell 1000 Growth”) had total returns of 14.56% and 19.23%, respectively, for the twelve-month period ending October 31, 2007.
From the perspective of economic sector performance (using Global Industry Classification Standards Classifications (“GICS”) for the S&P 500 as a reference point), gains were relatively widespread although market leadership was quite decisive. Eight of ten sectors in the S&P 500 had a positive return. Energy, materials, and information technology (“IT”) were the top-performing sectors. Utilities, telecommunication services, industrials, and consumer staples also had solid absolute returns.
At an industry level, similar general strength prevailed, with the majority of groups able to post positive returns. In several areas, these gains were quite robust in nature. The top-performing groups included technology hardware and equipment, capital goods, software and services, consumer services, and food beverage and tobacco. Areas of weakness during the reporting period included banks and retailing.
Large capitalization equities benefited as the market, particularly in the latter stages of the twelve-month period, seemed to experience a shift in leadership that increasingly favored larger-sized, higher-quality, “franchise growth” companies. Within the US large capitalization area, “growth” equities outperformed “value” equities for the period. Large capitalization “growth” stocks, as measured by the Russell 1000 Growth, outperformed large capitalization “value” stocks, as measured by the Russell 1000 Value Index, by approximately 9% last year.
PERFORMANCE
For the year ended October 31, 2007, TA IDEX Marsico Growth Class A returned 29.85%. By comparison, its benchmarks, the S&P 500 and the Russell 1000 Growth returned, 14.56% and 19.23%, respectively. As of October 31, 2007, the Fund’s net expense ratios for Class A, Class B, Class C, and Class I were 1.20%, 1.17%, 1.02%, and 0.86%, respectively.
STRATEGY REVIEW
During the reporting period, the portfolio’s average sector allocations emphasized the consumer discretionary, financials, industrials, and health care sectors. The portfolio invested in all ten GICS economic sector during the twelve-month period, with the financials, energy, utilities, and consumer staples sectors averaging a significantly underweighted posture relative to the portfolio’s primary benchmark, the S&P 500.
The portfolio outperformed the S&P 500 for the annual period. Consumer discretionary positions were an area of emphasis for the portfolio over the one-year period. The portfolio’s investments in the sector posted a collective gain of more than 27%, led by hotel/casino operators MGM MIRAGE (+113%), Wynn Resorts, Limited (+135%), and Las Vegas Sands Corp. (+76%). These positions were among the portfolio’s top-performing individual positions.
Stock selection within the financials sector also contributed materially to the portfolio’s performance. Specific individual holdings that impacted performance included Chinese banks, Industrial and Commercial Bank of China (+112%) and China Merchants Bank Co., Ltd. (+169%), and diversified financials company The Goldman Sachs Group, Inc. (+32%). The portfolio’s underweighted posture in this sector also aided performance, as it was among the weaker-performing sectors in the benchmark index.
In addition, stock selection in the IT sector was an additional area of strength for the portfolio, led by software and services holdings. Apple Inc. (+74%), Cisco Systems, Inc. (+37%), MasterCard Incorporated (+87%), and Google Inc. (+52%) were among the largest contributors to the portfolio’s performance in this sector.
There were a few areas of weakness for the portfolio during the period. Stock selection in the health care and industrials sectors detracted from performance, as did an underweighted posture in the energy sector, which was the equity markets’ strongest performing sector. In health care, our position in Genentech, Inc., a biotechnology company (-11%), negatively impacted performance. With regard to industrials, the portfolio’s positions posted a collective gain of 19%. While this performance was strong in an absolute basis, it trailed the S&P 500’s industrials sector return of 21%.
Thomas F. Marsico
Fund Manager
Marsico Capital Management, LLC
Columbia Management Advisors, LLC has the role of sub-adviser with its affiliate Marsico Capital Management, LLC to provide management services to the Fund.
26
(unaudited)

Average Annual Total Return for Periods Ended 10/31/2007
| | | | | | From | | Inception | |
| | 1 Year | | 5 Years | | Inception | | Date | |
| | | | | | | | | |
Class A (NAV) | | 29.85 | % | 13.61 | % | 4.39 | % | 3/1/99 | |
Class A (POP) | | 22.73 | % | 12.33 | % | 3.71 | % | 3/1/99 | |
S&P 500(1) | | 14.56 | % | 13.88 | % | 4.28 | % | 3/1/99 | |
Russell 1000 Growth (1) | | 19.23 | % | 12.61 | % | 0.92 | % | 3/1/99 | |
| | | | | | | | | |
Class B (NAV) | | 29.99 | % | 13.08 | % | 3.78 | % | 3/1/99 | |
Class B (POP) | | 24.99 | % | 12.96 | % | 3.78 | % | 3/1/99 | |
| | | | | | | | | |
Class C (NAV) | | 30.09 | % | — | % | 13.74 | % | 11/11/02 | |
Class C (POP) | | 29.09 | % | — | % | 13.74 | % | 11/11/02 | |
| | | | | | | | | |
Class I (NAV) | | 30.25 | % | — | % | 16.81 | % | 11/15/05 | |
NOTES
(1) The Standard and Poor’s 500 Composite Stock (S&P 500) Index and the Russell 1000 Growth (Russell 1000 Growth) Index are unmanaged indices used as a general measure of market performance. Calculations assume dividends and capital gains are reinvested and do not include any managerial expenses. From inception calculation is based on life of Class A shares. You cannot invest directly in an index.
The performance data presented represents past performance; future results may vary. Performance data does not reflect the deduction of taxes that would be paid on fund distributions or the redemption of fund shares. Investment return and principal value will fluctuate so that an investor’s shares, when redeemed, may be worth more or less than their original cost.
Current performance may be lower or higher than performance quoted. Please see www.transamericaidex.com for performance data current to the most recent month-end.
Public Offering Price (POP) returns include the reinvestment of dividends and capital gains and reflect the maximum sales charge of 5.5% for A shares or the maximum applicable contingent deferred sales charge (5% in the 1st year, decreasing to 0% after 6 years) for Class B shares and 1% (during the first 12 months) for Class C shares. Shares purchased prior to March 1, 2004 are subject to a maximum applicable contingent deferred sales charge (5% in the 1st year, decreasing to 0% after 7 years) for Class B shares and (2% in the 1st year, decreasing to 0% after 2 years) for Class C shares. Net Asset Value (NAV) returns include the reinvestment of dividends and capital gains but do not reflect any sales charges.
This material must be preceded or accompanied by a current prospectus, which includes specific contents regarding the investment objectives and policies of this Fund. This Fund is closed to new investments.
27
UNDERSTANDING YOUR FUNDS EXPENSES
(unaudited)
SHAREHOLDER EXPENSES
Fund shareholders may incur two types of costs: (1) transaction costs, including sales charges (loads) on purchases, contingent deferred sales charges on redemptions and redemption fees; and (2) ongoing costs, including management fees, 12b-1 distribution and service fees, and other fund expenses.
The following Example is intended to help you understand your ongoing costs (in dollars and cents) of investing in the Fund and to compare these costs with the ongoing costs of investing in other funds.
The Example is based on an investment of $1,000 invested at May 1, 2007 and held for the entire period until October 31, 2007.
ACTUAL EXPENSES
The first line in the table below provides information about actual account values and actual expenses. You may use the information in this line, together with the amount you invested, to estimate the expenses that you paid over the period. Simply divide your account value by $1,000 (for example, an $8,600 account value divided by $1,000 = 8.6), then multiply the result by the number in the first line of your Fund under the heading entitled “Expenses Paid During Period” to estimate the expenses you paid on your account during this period. If your account is an IRA, your expenses could have included a $15 annual fee. The amount of any fee paid through your account would increase the estimate of expenses you paid during the period and decrease your ending account value.
HYPOTHETICAL EXAMPLE FOR COMPARISON PURPOSES
The second line in the table below provides information about hypothetical account values and hypothetical expenses based on the Fund’s actual expense ratio and an assumed rate of return of 5% per year before expenses, which is not the Fund’s actual return. The hypothetical account values and expenses may not be used to estimate the actual ending account balance or expenses you paid for the period. You may use this information to compare the ongoing costs of investing in your Fund and other funds. To do so, compare this 5% hypothetical example with the 5% hypothetical examples that appear in the shareholder reports of the other funds. As in the case of the actual expense example, if your account is subject to an IRA fee, the amount of the fee paid through your account would increase the hypothetical expenses you would have paid during the period and decrease the hypothetical ending account value.
Please note that the expenses shown in the table are meant to highlight your ongoing costs only and do not reflect any transactional costs, such as sales charges, redemption fees, brokerage commissions paid on purchases and sales of fund shares. Therefore, the second line under the Fund in the table is useful in comparing ongoing costs only, and will not help you determine the relative total costs of owning different funds. If any of these transaction costs were included, your costs would be higher. The expenses shown in the table do not reflect any fees that may be charged to you by brokers, financial intermediaries or other financial institutions.
| | Beginning | | Ending | | Annualized | | Expenses | |
| | Account | | Account | | Expense | | Paid During | |
| | Value | | Value | | Ratio | | Period (a) | |
Class A | | | | | | | | | |
Actual | | $ | 1,000.00 | | $ | 1,198.49 | | 1.15 | % | $ | 6.40 | |
Hypothetical (b) | | 1,000.00 | | 1,019.31 | | 1.15 | | 5.88 | |
| | | | | | | | | |
Class B | | | | | | | | | |
Actual | | 1,000.00 | | 1,199.12 | | 1.12 | | 6.20 | |
Hypothetical (b) | | 1,000.00 | | 1,019.50 | | 1.12 | | 5.69 | |
| | | | | | | | | |
Class C | | | | | | | | | |
Actual | | 1,000.00 | | 1,198.94 | | 1.03 | | 5.68 | |
Hypothetical (b) | | 1,000.00 | | 1,019.97 | | 1.03 | | 5.22 | |
| | | | | | | | | |
Class I | | | | | | | | | |
Actual | | 1,000.00 | | 1,201.00 | | 0.86 | | 4.79 | |
Hypothetical (b) | | 1,000.00 | | 1,020.78 | | 0.86 | | 4.40 | |
| | | | | | | | | | | | |
(a) Expenses are calculated using the Fund’s annualized expense ratio (as disclosed in the table), multiplied by the average account value for the period, multiplied by the number of days in the period (184 days), and divided by the number of days in the year (365 days).
(b) 5% return per year before expenses.
GRAPHICAL PRESENTATION OF SCHEDULE OF INVESTMENTS
By Sector
At October 31, 2007
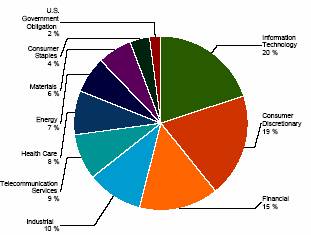
This chart shows the percentage breakdown by sector of the Fund’s total investment securities.
28
SCHEDULE OF INVESTMENTS
At October 31, 2007
(all amounts except share amounts in thousands)
| | Shares | | Value | |
COMMON STOCKS (94.9%) | | | | | |
Aerospace & Defense (6.9%) | | | | | |
Boeing Co. | | 47,348 | | $ | 4,668 | |
General Dynamics Corp. | | 122,377 | | 11,132 | |
Lockheed Martin Corp. | | 126,575 | | 13,928 | |
Air Freight & Logistics (1.1%) | | | | | |
FedEx Corp. | | 44,430 | | 4,591 | |
Automobiles (1.9%) | | | | | |
Toyota Motor Corp. | | 72,134 | | 8,255 | |
Beverages (1.9%) | | | | | |
Coca-Cola Co. (The) | | 38,356 | | 2,369 | |
Heineken NV | | 171,359 | | 5,912 | |
Biotechnology (2.8%) | | | | | |
Amylin Pharmaceuticals, Inc. ‡^ | | 62,246 | | 2,802 | |
Genentech, Inc. ‡ | | 126,828 | | 9,402 | |
Capital Markets (7.9%) | | | | | |
Goldman Sachs Group, Inc. (The) | | 85,875 | | 21,290 | |
Lehman Brothers Holdings, Inc. | | 132,266 | | 8,378 | |
Morgan Stanley | | 62,366 | | 4,195 | |
Chemicals (5.1%) | | | | | |
Air Products & Chemicals, Inc. | | 20,497 | | 2,006 | |
Monsanto Co. | | 131,368 | | 12,825 | |
Praxair, Inc. | | 80,665 | | 6,895 | |
Commercial Banks (5.1%) | | | | | |
China Merchants Bank Co., Ltd. Class H | | 720,500 | | 3,667 | |
Industrial & Commercial Bank of China Class H | | 15,631,000 | | 14,762 | |
Wells Fargo & Co. | | 103,145 | | 3,508 | |
Communications Equipment (3.5%) | | | | | |
Cisco Systems, Inc. ‡ | | 339,984 | | 11,240 | |
Juniper Networks, Inc. ‡ | | 98,738 | | 3,554 | |
Computers & Peripherals (4.7%) | | | | | |
Apple, Inc. ‡ | | 78,364 | | 14,885 | |
Hewlett-Packard Co. | | 103,163 | | 5,332 | |
Diversified Telecommunication Services (2.5%) | | | | | |
AT&T, Inc. | | 256,329 | | 10,712 | |
Energy Equipment & Services (5.4%) | | | | | |
Cameron International Corp. ‡ | | 23,524 | | 2,290 | |
Schlumberger, Ltd. | | 154,164 | | 14,888 | |
Transocean, Inc. ‡ | | 49,749 | | 5,938 | |
Food & Staples Retailing (1.7%) | | | | | |
CVS Caremark Corp. | | 128,273 | | 5,358 | |
Tesco PLC | | 176,439 | | 1,789 | |
Health Care Providers & Services (3.8%) | | | | | |
UnitedHealth Group, Inc. | | 333,863 | | 16,409 | |
Hotels, Restaurants & Leisure (13.5%) | | | | | |
Las Vegas Sands Corp. ‡ | | 98,333 | | 13,050 | |
McDonald’s Corp. | | 303,094 | | 18,095 | |
MGM Mirage, Inc. ‡ | | 97,670 | | 8,947 | |
Station Casinos, Inc. | | 12,789 | | 1,148 | |
Wynn Resorts, Ltd. ^ | | 57,237 | | 9,240 | |
Yum! Brands, Inc. | | 182,068 | | 7,332 | |
Internet Software & Services (3.8%) | | | | | |
Google, Inc. Class A ‡ | | 22,783 | | 16,108 | |
IT Services (3.6%) | | | | | |
Mastercard, Inc. Class A ^ | | 81,388 | | $ | 15,427 | |
Media (1.9%) | | | | | |
Comcast Corp. Class A ‡ | | 381,678 | | 8,034 | |
Metals & Mining (1.2%) | | | | | |
Freeport-McMoRan Copper & Gold, Inc. | | 42,485 | | 5,000 | |
Oil, Gas & Consumable Fuels (1.2%) | | | | | |
Devon Energy Corp. | | 20,533 | | 1,918 | |
Petroleo Brasileiro SA ^ | | 35,293 | | 3,375 | |
Pharmaceuticals (1.3%) | | | | | |
Merck & Co., Inc. | | 39,899 | | 2,325 | |
Schering-Plough Corp. | | 109,473 | | 3,341 | |
Road & Rail (2.2%) | | | | | |
Union Pacific Corp. | | 72,034 | | 9,223 | |
Semiconductors & Semiconductor Equipment (1.8%) | | | | | |
Intel Corp. | | 291,760 | | 7,848 | |
Software (1.3%) | | | | | |
Microsoft Corp. | | 154,915 | | 5,702 | |
Specialty Retail (1.6%) | | | | | |
Lowe’s Cos., Inc. | | 252,942 | | 6,802 | |
Thrifts & Mortgage Finance (1.4%) | | | | | |
Fannie Mae | | 105,150 | | 5,998 | |
Wireless Telecommunication Services (5.8%) | | | | | |
America Movil SAB de CV Series R, Class R | | 154,506 | | 10,103 | |
China Mobile, Ltd. | | 732,600 | | 14,840 | |
Total Common Stocks (cost $308,520) | | | | 406,836 | |
| | | | | |
U.S. GOVERNMENT OBLIGATIONS (2.1%) | | | | | |
U.S. Treasury Bill | | | | | |
3.65%, due 01/10/2008 | | 3,718 | | 3,692 | |
3.80%, due 02/07/2008 | | 1,451 | | 1,436 | |
3.55%, due 01/03/2008 | | 2,183 | | 2,169 | |
4.75%, due 01/31/2008 | | 1,527 | | 1,513 | |
Total U.S. Government Obligations (cost $8,810) | | | | 8,810 | |
| | | | | |
Total Security Lending Collateral (cost $25,584) ± | | | | 25,583 | |
Total Investment Securities (cost $342,913) # | | | | $ | 441,229 | |
The notes to the financial statements are an integral part of this report.
29
NOTES TO SCHEDULE OF INVESTMENTS
^ | | At October 31, 2007, all or a portion of this security is on loan (see Note 1). The value at October 31, 2007 of all securities on loan is $24,958. |
± | | Cash collateral for the Repurchase Agreements, valued at $4,669, that serves as collateral for securities lending, is invested incorporate and government bonds with interest rates and maturity dates ranging from 0.00% - 8.125% and 11/14/2007 - 9/15/2037. |
‡ | | Non Income Producing |
# | | Aggregate cost for federal income tax purposes is $342,802. Aggregate gross unrealized appreciation for all securities in which there is an excess of value over tax cost and aggregate gross unrealized depreciation for all securities in which there is an excess of tax cost over value were $102,017 and $3,590, respectively. Net unrealized appreciation for tax purposes is $98,427. |
The notes to the financial statements are an integral part of this report.
30
TA IDEX MFS International Equity
MARKET ENVIRONMENT
Equity market valuation levels appear reasonable, although investors’ concerns over slowing growth in the U.S. and sub-prime lending in particular have increased volatility in equity markets globally. After strong relative performance, many small-cap and emerging markets stocks, as well as those in cyclical sectors, are trading at high valuations relative to where they have traded historically. With corporate profits higher than they have been in many years, we believe the risk to slowing profit growth has increased. Despite more volatility recently, we continue to pursue our disciplined process: identifying stocks that we believe will be able to generate above-average earnings growth with little volatility; and are trading at attractive valuations relative to our proprietary growth forecasts.
PERFORMANCE
For the year ended October 31, 2007, TA IDEX MFS International Equity Class A returned 20.00%. By comparison, its benchmark, the Morgan Stanley Capital International (EAFE) Index (“MSCI-EAFE”), returned 25.43%. As of October 31, 2007, the Fund’s net expense ratios for Class A, Class B, and Class C were 1.61%, 1.59%, and 1.51%, respectively.
STRATEGY REVIEW
Security selection and, to a lesser extent, our underweighted position in the basic materials sector detracted from performance relative to the portfolio’s benchmark, the MSCI-EAFE, over the reporting period. No individual securities were among the portfolio’s top relative detractors.
Our overweighted position in the technology sector held back relative results. Electronics manufacturer Samsung Electronics Co., Ltd. (South Korea) and printers and computer peripherals maker Canon Inc. (Japan) were principal detractors within this sector. Not owning strong-performing mobile phones maker Nokia Corporation (Finland) also hindered relative returns.
Auto and housing was among the portfolio’s top detracting sectors due to our underweighted position relative to the benchmark. No individual stocks within this sector were among the portfolio’s top detractors.
A combination of stock selection and an overweighted position in the leisure sector also detracted from relative performance. Within this sector, gaming operator William Hill PLC (United Kingdom) dampened relative results.
Several individual holdings within the otherwise strong financial services sector were among the portfolio’s most significant detractors. These included investment management company UBS AG (Switzerland), banking firm Credit Agricole S.A. (France), consumer finance firm Aeon Credit Service (Asia) Company Limited (Japan), and financial services firm Shinsei Bank, Limited (Japan).
Elsewhere, pharmaceutical and diagnostic company Roche Holding Ltd. and consumer products company Kao Corporation (Japan) held back relative returns.
During the reporting period, currency exposure was a detractor from relative performance. All of our investment decisions are driven by the fundamentals of each individual opportunity and, as such, it is common for the portfolio to have different currency exposure than the benchmark.
Our underweighted position in the financial services sector contributed to performance relative to the MSCI-EAFE. Private banking company Julius Baer Holding Ltd. (Switzerland) was a top relative contributor. Not owning poor-performing diversified financial services firm Mitsubishi UFJ Financial Group, Inc. (Japan) was also beneficial.
Security selection in the retailing sector was the primary contributor to relative results. A key driver within this sector was consumer products exporter Li & Fung Limited (Hong Kong).
Stocks in other sectors that aided relative returns included healthcare products maker Bayer AG (Germany), video game console maker Nintendo Co., Ltd. (Japan), power and gas company E.ON AG (Germany), communications provider Singapore Telecommunications Limited (Singapore), food company Nestle S.A. (Switzerland), and electrical distribution equipment manufacturer Schneider Electric SA (France). Avoiding pharmaceutical company Novartis AG (Switzerland) also benefited the portfolio.
David R. Mannheim
Marcus L. Smith
Co-Fund Managers
MFS Investment Management
31
(unaudited)

Average Annual Total Return for Periods Ended 10/31/2007
| | | | | | | | From | | Inception | |
| | 1 Year | | 5 Years | | 10 Years | | Inception | | Date | |
Class A (NAV) | | 20.00 | % | 16.68 | % | 5.24 | % | 5.43 | % | 2/1/97 | |
Class A (POP) | | 13.40 | % | 15.36 | % | 4.65 | % | 4.88 | % | 2/1/97 | |
MSCI EAFE (USD) (1) | | 25.43 | % | 23.71 | % | 9.64 | % | 9.51 | % | 2/1/97 | |
| | | | | | | | | | | |
Class B (NAV) | | 20.12 | % | 16.23 | % | 4.71 | % | 4.94 | % | 2/1/97 | |
Class B (POP) | | 17.26 | % | 16.16 | % | 4.71 | % | 4.94 | % | 2/1/97 | |
| | | | | | | | | | | |
Class C (NAV) | | 20.26 | % | — | % | — | % | 16.40 | % | 11/11/02 | |
Class C (POP) | | 19.70 | % | — | % | — | % | 16.40 | % | 11/11/02 | |
NOTES
(1) The Morgan Stanley Capital International-Europe, Australasia, and Far East (MSCI-EAFE) Index is a widely recognized unmanaged index used as a general measure of market performance. Calculations assume dividends and capital gains are reinvested and do not include any managerial expenses. From inception calculation is based on life of Class A shares. You cannot invest directly in an index.
The performance data presented represents past performance; future results may vary. Performance data does not reflect the deduction of taxes that would be paid on fund distributions or the redemption of fund shares. Investment return and principal value will fluctuate so that an investor’s shares, when redeemed, may be worth more or less than their original cost.
Current performance may be lower or higher than performance quoted. Please see www.transamericaidex.com for performance data current to the most recent month-end.
Public Offering Price (POP) returns include the reinvestment of dividends and capital gains and reflect the maximum sales charge of 5.5% for A shares or the maximum applicable contingent deferred sales charge (5% in the 1st year, decreasing to 0% after 6 years) for Class B shares and 1% (during the first 12 months) for Class C shares. Shares purchased prior to March 1, 2004 are subject to a maximum applicable contingent deferred sales charge (5% in the 1st year, decreasing to 0% after 7 years) for Class B shares and (2% in the 1st year, decreasing to 0% after 2 years) for Class C shares. Net Asset Value (NAV) returns include the reinvestment of dividends and capital gains but do not reflect any sales charges.
International investing involves special risks including currency fluctuations, political instability, and different financial accounting standards. This material must be preceded or accompanied by a current prospectus, which includes specific contents regarding the investment objectives and policies of this Fund. This Fund is closed to new investments.
32
UNDERSTANDING YOUR FUNDS EXPENSES
(unaudited)
SHAREHOLDER EXPENSES
Fund shareholders may incur two types of costs: (1) transaction costs, including sales charges (loads) on purchases, contingent deferred sales charges on redemptions and redemption fees; and (2) ongoing costs, including management fees, 12b-1 distribution and service fees, and other fund expenses.
The following Example is intended to help you understand your ongoing costs (in dollars and cents) of investing in the Fund and to compare these costs with the ongoing costs of investing in other funds.
The Example is based on an investment of $1,000 invested at May 1, 2007 and held for the entire period until October 31, 2007.
ACTUAL EXPENSES
The first line in the table below provides information about actual account values and actual expenses. You may use the information in this line, together with the amount you invested, to estimate the expenses that you paid over the period. Simply divide your account value by $1,000 (for example, an $8,600 account value divided by $1,000 = 8.6), then multiply the result by the number in the first line of your Fund under the heading entitled “Expenses Paid During Period” to estimate the expenses you paid on your account during this period. If your account is an IRA, your expenses could have included a $15 annual fee. The amount of any fee paid through your account would increase the estimate of expenses you paid during the period and decrease your ending account value.
HYPOTHETICAL EXAMPLE FOR COMPARISON PURPOSES
The second line in the table below provides information about hypothetical account values and hypothetical expenses based on the Fund’s actual expense ratio and an assumed rate of return of 5% per year before expenses, which is not the Fund’s actual return. The hypothetical account values and expenses may not be used to estimate the actual ending account balance or expenses you paid for the period. You may use this information to compare the ongoing costs of investing in your Fund and other funds. To do so, compare this 5% hypothetical example with the 5% hypothetical examples that appear in the shareholder reports of the other funds. As in the case of the actual expense example, if your account is subject to an IRA fee, the amount of the fee paid through your account would increase the hypothetical expenses you would have paid during the period and decrease the hypothetical ending account value.
Please note that the expenses shown in the table are meant to highlight your ongoing costs only and do not reflect any transactional costs, such as sales charges, redemption fees, brokerage commissions paid on purchases and sales of fund shares. Therefore, the second line under the Fund in the table is useful in comparing ongoing costs only, and will not help you determine the relative total costs of owning different funds. If any of these transaction costs were included, your costs would be higher. The expenses shown in the table do not reflect any fees that may be charged to you by brokers, financial intermediaries or other financial institutions.
| | Beginning | | Ending | | Annualized | | Expenses | |
| | Account | | Account | | Expense | | Paid During | |
| | Value | | Value | | Ratio | | Period (a) | |
Class A | | | | | | | | | |
Actual | | $ | 1,000.00 | | $ | 1,050.95 | | 1.77 | % | $ | 9.14 | |
Hypothetical (b) | | 1,000.00 | | 1,016.22 | | 1.77 | | 8.99 | |
| | | | | | | | | |
Class B | | | | | | | | | |
Actual | | 1,000.00 | | 1,051.60 | | 1.74 | | 8.98 | |
Hypothetical (b) | | 1,000.00 | | 1,016.39 | | 1.74 | | 8.82 | |
| | | | | | | | | |
Class C | | | | | | | | | |
Actual | | 1,000.00 | | 1,052.90 | | 1.61 | | 8.33 | |
Hypothetical (b) | | 1,000.00 | | 1,017.02 | | 1.61 | | 8.19 | |
| | | | | | | | | | | | |
(a) Expenses are calculated using the Fund’s annualized expense ratio (as disclosed in the table), multiplied by the average account value for the period, multiplied by the number of days in the period (184 days), and divided by the number of days in the year (365 days).
(b) 5% return per year before expenses.
GRAPHICAL PRESENTATION OF SCHEDULE OF INVESTMENTS
By Region
At October 31, 2007
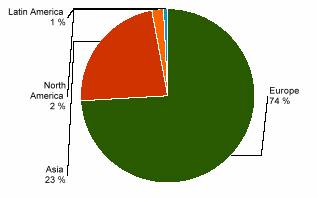
This chart shows the percentage breakdown by region of the Fund’s total investment securities.
33
SCHEDULE OF INVESTMENTS
At October 31, 2007
(all amounts except share amounts in thousands)
| | Shares | | Value | |
COMMON STOCKS (99.0%) | | | | | |
Australia (0.4%) | | | | | |
QBE Insurance Group, Ltd. | | 4,041 | | $ | 122 | |
Austria (1.4%) | | | | | |
Erste Bank DER Oesterreichischen | | 5,202 | | 421 | |
Bermuda (0.8%) | | | | | |
LI & Fung, Ltd. | | 48,000 | | 225 | |
Canada (1.0%) | | | | | |
Canadian National Railway Co. | | 5,233 | | 293 | |
Czech Republic (0.7%) | | | | | |
Komercni Banka As | | 880 | | 202 | |
France (20.8%) | | | | | |
Air Liquide | | 3,563 | | 490 | |
AXA SA | | 13,999 | | 625 | |
Credit Agricole SA | | 13,994 | | 553 | |
Gaz De France ^ | | 5,474 | | 311 | |
Legrand SA | | 9,892 | | 365 | |
LVMH Moet Hennessy Louis Vuitton SA | | 7,583 | | 975 | |
Pernod-Ricard SA | | 2,674 | | 617 | |
Schneider Electric SA | | 5,828 | | 801 | |
Societe Television Francaise | | 5,221 | | 144 | |
Suez SA ‡ | | 4,920 | | 320 | |
Total SA | | 8,588 | | 691 | |
Vivendi | | 4,721 | | 212 | |
Germany (8.9%) | | | | | |
Bayer AG | | 9,317 | | 776 | |
Bayerische Motoren Werke AG | | 4,693 | | 314 | |
E.ON AG | | 3,148 | | 614 | |
Linde AG | | 4,698 | | 594 | |
Merck KGAA | | 2,500 | | 312 | |
India (0.6%) | | | | | |
Satyam Computer Services, Ltd. | | 5,350 | | 162 | |
Indonesia (0.3%) | | | | | |
Bank Central Asia TBK PT | | 127,500 | | 102 | |
Italy (1.5%) | | | | | |
Assicurazioni Generali SpA | | 3,384 | | 160 | |
Intesa Sanpaolo SpA | | 33,660 | | 266 | |
Japan (17.8%) | | | | | |
AEON Credit Service Co., Ltd. | | 10,700 | | 164 | |
Asahi Glass Co., Ltd. | | 23,000 | | 314 | |
Bridgestone Corp. | | 11,000 | | 242 | |
Canon, Inc. | | 14,900 | | 743 | |
Fanuc, Ltd. | | 2,700 | | 294 | |
Hirose Electric Co., Ltd. | | 1,300 | | 155 | |
INPEX Holdings, Inc. | | 32 | | 344 | |
KAO Corp. | | 31,000 | | 887 | |
Nintendo Co., Ltd. | | 300 | | 187 | |
Nomura Holdings, Inc. | | 22,800 | | 405 | |
Omron Corp. | | 8,800 | | 214 | |
Ricoh Co., Ltd. | | 18,000 | | 352 | |
Shizuoka Bank, Ltd. (The) | | 17,000 | | 177 | |
Tokyo Gas Co., Ltd. | | 36,000 | | 160 | |
Toyota Motor Corp. | | 10,100 | | 576 | |
Korea, Republic of (1.5%) | | | | | |
Samsung Electronics Co., Ltd. | | 705 | | $ | 431 | |
Netherlands (5.2%) | | | | | |
Heineken NV | | 6,410 | | 448 | |
Royal Dutch Shell PLC Class A ‡ | | 12,766 | | 558 | |
TNT NV | | 12,780 | | 522 | |
Singapore (1.4%) | | | | | |
Singapore Telecommunications, Ltd. | | 149,150 | | 420 | |
South Africa (0.2%) | | | | �� | |
MTN Group, Ltd. | | 3,600 | | 70 | |
Spain (0.9%) | | | | | |
Banco Bilbao Vizcaya Argentaria SA | | 11,007 | | 277 | |
Switzerland (16.4%) | | | | | |
Actelion, Ltd. ‡ | | 3,353 | | 166 | |
Givaudan SA | | 480 | | 471 | |
Julius Baer Holding AG | | 5,559 | | 481 | |
Nestle SA | | 3,020 | | 1,393 | |
Roche Holding AG | | 5,651 | | 963 | |
Swiss Reinsurance | | 6,115 | | 573 | |
UBS AG | | 14,397 | | 770 | |
Taiwan (0.7%) | | | | | |
Taiwan Semiconductor Manufacturing | | 20,002 | | 213 | |
United Kingdom (17.4%) | | | | | |
BG Group PLC | | 6,389 | | 118 | |
BHP Billiton PLC | | 6,498 | | 247 | |
Diageo PLC | | 28,006 | | 640 | |
GlaxoSmithKline PLC | | 28,775 | | 740 | |
HSBC Holdings PLC ‡ | | 16,340 | | 323 | |
Ladbrokes PLC | | 34,418 | | 294 | |
Reckitt Benckiser Group PLC ‡ | | 14,361 | | 832 | |
Smiths Group PLC | | 20,124 | | 472 | |
Tesco PLC | | 30,169 | | 306 | |
William Hill PLC | | 46,037 | | 592 | |
WPP Group PLC | | 40,177 | | 548 | |
United States (1.1%) | | | | | |
Synthes, Inc. | | 2,684 | | 335 | |
Total Common Stocks (cost $24,116) | | | | 29,084 | |
| | | | | |
Total Security Lending Collateral (cost $118) ± | | | | 118 | |
Total Investment Securities (cost $24,234) # | | | | $ | 29,202 | |
The notes to the financial statements are an integral part of this report.
34
NOTES TO SCHEDULE OF INVESTMENTS
q | | Value is less than $1 |
^ | | At October 31, 2007, all or a portion of this security is on loan (see Note 1). The value at October 31, 2007 of all securities on loan is $112. |
± | | Cash collateral for the Repurchase Agreements, valued at $22, that serves as collateral for securities lending, is invested in corporate and government bonds with interest rates and maturity dates ranging from 0.00% - 8.125% and 11/14/2007 - 9/15/2037. |
‡ | | Non Income Producing |
# | | Aggregate cost for federal income tax purposes is $24,431. Aggregate gross unrealized appreciation for all securities in which there is an excess of value over tax cost and aggregate gross unrealized depreciation for all securities in which there is an excess of tax cost over value were $5,068 and $297, respectively. Net unrealized appreciation for tax purposes is $4,771. |
The notes to the financial statements are an integral part of this report
35
| | Percentage of | | | |
(unaudited) | | Total Investments | | Value | |
INVESTMENTS BY INDUSTRY: | | | | | |
Chemicals | | 8.0 | % | $ | 2,330 | |
Commercial Banks | | 8.0 | % | 2,321 | |
Pharmaceuticals | | 6.9 | % | 2,016 | |
Household Products | | 5.9 | % | 1,719 | |
Oil, Gas & Consumable Fuels | | 5.9 | % | 1,712 | |
Beverages | | 5.8 | % | 1,705 | |
Capital Markets | | 5.7 | % | 1,656 | |
Insurance | | 5.1 | % | 1,480 | |
Food Products | | 4.8 | % | 1,393 | |
Electrical Equipment | | 4.0 | % | 1,166 | |
Office Electronics | | 3.8 | % | 1,095 | |
Textiles, Apparel & Luxury Goods | | 3.3 | % | 975 | |
Media | | 3.1 | % | 904 | |
Automobiles | | 3.0 | % | 889 | |
Hotels, Restaurants & Leisure | | 3.0 | % | 886 | |
Semiconductors & Semiconductor Equipment | | 2.2 | % | 644 | |
Electric Utilities | | 2.1 | % | 614 | |
Air Freight & Logistics | | 1.8 | % | 522 | |
Industrial Conglomerates | | 1.6 | % | 472 | |
Gas Utilities | | 1.6 | % | 470 | |
Diversified Telecommunication Services | | 1.4 | % | 420 | |
Electronic Equipment & Instruments | | 1.3 | % | 369 | |
Health Care Equipment & Supplies | | 1.1 | % | 335 | |
Energy Equipment & Services | | 1.1 | % | 320 | |
Building Products | | 1.1 | % | 314 | |
Food & Staples Retailing | | 1.0 | % | 306 | |
Machinery | | 1.0 | % | 294 | |
Road & Rail | | 1.0 | % | 293 | |
Metals & Mining | | 0.8 | % | 247 | |
Auto Components | | 0.8 | % | 242 | |
Trading Companies & Distributors | | 0.8 | % | 225 | |
Software | | 0.6 | % | 187 | |
Biotechnology | | 0.6 | % | 166 | |
Consumer Finance | | 0.6 | % | 164 | |
IT Services | | 0.6 | % | 162 | |
Wireless Telecommunication Services | | 0.2 | % | 70 | |
Investment Securities, at value | | 99.6 | % | 29,083 | |
Short-Term Investments | | 0.4 | % | 119 | |
Total Investments | | 100.0 | % | $ | 29,202 | |
The notes to the financial statements are an integral part of this report.
36
TA IDEX PIMCO Real Return TIPS
MARKET ENVIRONMENT
The primary focus during the year centered on concerns about the sub-prime mortgage sector that developed in 2007. During most of the year the Federal Reserve Board (“Fed”) focused on stronger economic data making it difficult for them to ease rates, as they focused on inflation concerns. Tight labor markets kept the unemployment rate relatively low and produced real wage gains for consumers that helped offset headwinds from the residential property market. In addition, measures of core inflation (consumer price inflation with the volatile food and energy prices stripped out) remained above the Fed’s targeted range. Weakness in the sub-prime mortgage sector produced a significant tightening of credit conditions for lower quality and first-time borrowers, yet another blow to an already soft housing market.
The Fed remained on hold throughout most of the year, after pausing in August 2006 with the federal funds rate (“fed funds rate”) at 5.25%. However, turmoil in the sub-prime market and the liquidity crunch in the asset-backed commercial paper market drove the Fed to take action in 2007. Initially, in August 2007, the Fed cut the discount rate, by 50 basis points (“bps”) to 5.75% to help alleviate liquidity concerns in the financial markets. Subsequently, the Fed met in September, and citing developments in the financial markets that have increased the uncertainty surrounding the economic outlook, cut both the fed funds and discount rates by 50 bps, to 4.75% and 5.25%, respectively. At the Fed’s October 31, 2007 meeting, they again cut the fed funds and the discount rates by another 25 bps, to 4.50% and 5.00%, respectively; but cited that the upside risks to inflation and the downside risks to economic growth are roughly equal indicating that more rate cuts may not be needed. At the end of October 2007 the benchmark ten-year Treasury yielded 4.47%, 13 basis points lower than at the start of the period.
PERFORMANCE
For the year ended October 31, 2007, TA IDEX PIMCO Real Return TIPS Class A returned 5.27%. By comparison its benchmark, the Lehman Brothers Global Real U.S. TIPS Index, returned 6.33%. As of October 31, 2007, the Fund’s net expense ratios for Class A, Class B, Class C, and Class I were 0.87%, 0.91%, 0.86%, and 0.73%, respectively.
STRATEGY REVIEW
The portfolio’s investment process is based upon a long-term approach, which utilizes both top-down and bottom-up strategies. Top-down strategies focus on duration, yield curve positioning, volatility, and sector rotation, while bottom-up strategies drive the security selection process, facilitating the identification and analysis of undervalued securities. No single strategy dominates returns; the total return strategy relies on multiple sources of value added in a highly diversified portfolio.
During the twelve-month reporting period the portfolio’s performance was relatively stable despite a volatile market (most noticeable in the past three months) as we employed an overweight to Treasury Inflation Protected Securities (“TIPS”) in the portfolio in addition to an emphasis to emerging market currencies. We maintained a focus on quality, as the average credit rating of securities in the portfolio was held at the AA+ level during the reporting period.
The portfolio’s below benchmark duration, on average, detracted from performance over the period. The portfolio benefited from tactical adjustments and holdings in non-index securities. In particular, while holdings of mortgage-backed securities detracted from performance, holdings in emerging market currencies, a curve steepening bias in the United States and in the United Kingdom all proved sources of added value. Also, an overweight to short-maturity TIPS in the U.S. added to performance as the price of oil reached new records.
John B. Brynjolfsson
Fund Manager
Pacific Investment Management Co., LLC
37
(unaudited)
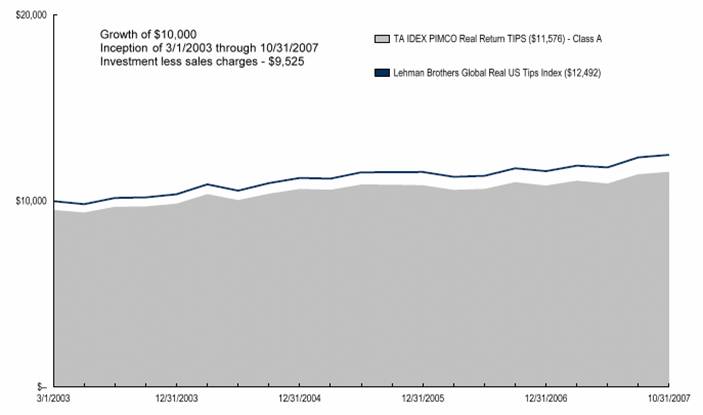
Average Annual Total Return for Periods Ended 10/31/2007
| | | | From | | Inception | |
| | 1 Year | | Inception | | Date | |
Class A (NAV) | | 5.24 | % | 4.27 | % | 3/1/03 | |
Class A (POP) | | 0.29 | % | 3.18 | % | 3/1/03 | |
Lehman Brothers Global Real US Tips Index (1) | | 6.33 | % | 4.88 | % | 3/1/03 | |
| | | | | | | |
Class B (NAV) | | 5.31 | % | 3.83 | % | 3/1/03 | |
Class B (POP) | | 0.31 | % | 3.64 | % | 3/1/03 | |
| | | | | | | |
Class C (NAV) | | 5.38 | % | 3.77 | % | 3/1/03 | |
Class C (POP) | | 4.38 | % | 3.77 | % | 3/1/03 | |
| | | | | | | |
Class I (NAV) | | 5.54 | % | 3.78 | % | 11/8/04 | |
NOTES
(1) The Lehman Brothers Global Real U.S. TIPS (LBGR U.S. TIPS) Index is an unmanaged index used as a general measure of market performance. Calculations assume dividends and capital gains are reinvested and do not include any managerial expenses. From inception, calculation is based on life of Class A shares. You cannot invest directly in an index.
The performance data presented represents past performance; future results may vary. Performance data does not reflect the deduction of taxes that would be paid on fund distributions or the redemption of fund shares. Investment return and principal value will fluctuate so that an investor’s shares, when redeemed, may be worth more or less than their original cost.
Current performance may be lower or higher than performance quoted. Please see www.transamericaidex.com for performance data current to the most recent month-end.
Public Offering Price (POP) returns include the reinvestment of dividends and capital gains and reflect the maximum sales charge of 4.75% for A shares or the maximum applicable contingent deferred sales charge (5% in the 1st year, decreasing to 0% after 6 years) for Class B shares and 1% (during the first 12 months) for Class C shares. Shares purchased prior to March 1, 2004 are subject to a maximum applicable contingent deferred sales charge (5% in the 1st year, decreasing to 0% after 7 years) for Class B shares and (2% in the 1st year, decreasing to 0% after 2 years) for Class C shares. Net Asset Value (NAV) returns include the reinvestment of dividends and capital gains but do not reflect any sales charges.
The Fund is non-diversified. Investments in a “non-diversified” fund may be subject to specific risks such as susceptibility to single economic, political, or regulatory events, and may be subject to greater loss than investments in a diversified fund. In addition, this fund invests in derivatives that are subject to the additional risks of inaccurate market predictions, illiquid markets, adverse tax consequences, and leveraging. This material must be preceded or accompanied by a current prospectus, which includes specific contents regarding the investment objectives and policies of this Fund. This Fund is closed to new investments.
38
UNDERSTANDING YOUR FUNDS EXPENSES
(unaudited)
SHAREHOLDER EXPENSES
Fund shareholders may incur two types of costs: (1) transaction costs, including sales charges (loads) on purchases, contingent deferred sales charges on redemptions and redemption fees; and (2) ongoing costs, including management fees, 12b-1 distribution and service fees, and other fund expenses.
The following Example is intended to help you understand your ongoing costs (in dollars and cents) of investing in the Fund and to compare these costs with the ongoing costs of investing in other funds.
The Example is based on an investment of $1,000 invested at May 1, 2007 and held for the entire period until October 31, 2007.
ACTUAL EXPENSES
The first line in the table below provides information about actual account values and actual expenses. You may use the information in this line, together with the amount you invested, to estimate the expenses that you paid over the period. Simply divide your account value by $1,000 (for example, an $8,600 account value divided by $1,000 = 8.6), then multiply the result by the number in the first line of your Fund under the heading entitled “Expenses Paid During Period” to estimate the expenses you paid on your account during this period. If your account is an IRA, your expenses could have included a $15 annual fee. The amount of any fee paid through your account would increase the estimate of expenses you paid during the period and decrease your ending account value.
HYPOTHETICAL EXAMPLE FOR COMPARISON PURPOSES
The second line in the table below provides information about hypothetical account values and hypothetical expenses based on the Fund’s actual expense ratio and an assumed rate of return of 5% per year before expenses, which is not the Fund’s actual return. The hypothetical account values and expenses may not be used to estimate the actual ending account balance or expenses you paid for the period. You may use this information to compare the ongoing costs of investing in your Fund and other funds. To do so, compare this 5% hypothetical example with the 5% hypothetical examples that appear in the shareholder reports of the other funds. As in the case of the actual expense example, if your account is subject to an IRA fee, the amount of the fee paid through your account would increase the hypothetical expenses you would have paid during the period and decrease the hypothetical ending account value.
Please note that the expenses shown in the table are meant to highlight your ongoing costs only and do not reflect any transactional costs, such as sales charges, redemption fees, brokerage commissions paid on purchases and sales of fund shares. Therefore, the second line under the Fund in the table is useful in comparing ongoing costs only, and will not help you determine the relative total costs of owning different funds. If any of these transaction costs were included, your costs would be higher. The expenses shown in the table do not reflect any fees that may be charged to you by brokers, financial intermediaries or other financial institutions.
| | Beginning | | Ending | | Annualized | | Expenses | |
| | Account | | Account | | Expense | | Paid During | |
| | Value | | Value | | Ratio | | Period (a) | |
Class A | | | | | | | | | |
Actual | | $ | 1,000.00 | | $ | 1,036.64 | | 0.87 | % | $ | 4.49 | |
Hypothetical (b) | | 1,000.00 | | 1,020.73 | | 0.87 | | 4.46 | |
| | | | | | | | | |
Class B | | | | | | | | | |
Actual | | 1,000.00 | | 1,036.97 | | 0.89 | | 4.55 | |
Hypothetical (b) | | 1,000.00 | | 1,020.67 | | 0.89 | | 4.52 | |
| | | | | | | | | |
Class C | | | | | | | | | |
Actual | | 1,000.00 | | 1,037.38 | | 0.84 | | 4.31 | |
Hypothetical (b) | | 1,000.00 | | 1,020.91 | | 0.84 | | 4.27 | |
| | | | | | | | | |
Class I | | | | | | | | | |
Actual | | 1,000.00 | | 1,037.46 | | 0.73 | | 3.76 | |
Hypothetical (b) | | 1,000.00 | | 1,021.45 | | 0.73 | | 3.73 | |
| | | | | | | | | | | | |
(a) Expenses are calculated using the Fund’s annualized expense ratio (as disclosed in the table), multiplied by the average account value for the period, multiplied by the number of days in the period (184 days), and divided by the number of days in the year (365 days).
(b) 5% return per year before expenses.
GRAPHICAL PRESENTATION OF SCHEDULE OF INVESTMENTS
By Asset Type
At October 31, 2007
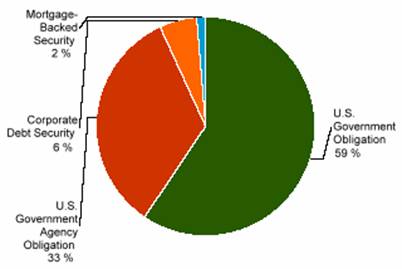
This chart shows the percentage breakdown by asset type of the Fund’s total investment securities.
39
SCHEDULE OF INVESTMENTS
At October 31, 2007
(all amounts except share amounts in thousands)
| | Principal | | Value | |
U.S. GOVERNMENT OBLIGATIONS (103.1%) | | | | | |
U.S. Treasury Inflation Indexed Bond, TIPS | | | | | |
2.00%, due 01/15/2026 | | $ | 40,543 | | $ | 39,159 | |
2.38%, due 01/15/2025 – 01/15/2027 | | 98,022 | | 100,233 | |
3.38%, due 04/15/2032 | | 937 | | 1,161 | |
3.63%, due 04/15/2028 | | 38,310 | | 47,178 | |
3.88%, due 04/15/2029 | | 42,169 | | 54,151 | |
U.S. Treasury Inflation Indexed Note, TIPS | | | | | |
0.88%, due 04/15/2010 | | 33,256 | | 32,492 | |
1.88%, due 07/15/2013 – 07/15/2015 (1) | | 110,413 | | 109,837 | |
2.00%, due 04/15/2012 – 01/15/2016 | | 100,728 | | 100,621 | |
2.38%, due 04/15/2011 – 01/15/2017 | | 58,445 | | 59,622 | |
2.50%, due 07/15/2016 | | 14,311 | | 14,781 | |
2.63%, due 07/15/2017 | | 5,117 | | 5,346 | |
3.00%, due 07/15/2012 | | 21,510 | | 22,606 | |
3.38%, due 01/15/2012 | | 532 | | 564 | |
3.50%, due 01/15/2011 | | 39,903 | | 41,997 | |
3.88%, due 01/15/2009 | | 31,316 | | 32,148 | |
4.25%, due 01/15/2010 | | 44,368 | | 46,791 | |
U.S. Treasury Note | | | | | |
4.63%, due 02/29/2012 | | 10,500 | | 10,713 | |
Total U.S. Government Obligations (cost $710,949) | | | | 719,400 | |
| | | | | |
U.S. GOVERNMENT AGENCY OBLIGATIONS (58.5%) | | | | | |
Fannie Mae | | | | | |
5.28%, due 08/25/2034 | | 240 | | 236 | |
5.50%, due 11/01/2036 – 10/01/2037 | | 311,208 | | 306,679 | |
6.00%, due 08/01/2036 – 10/01/2037 | | 12,370 | | 12,463 | |
6.13%, due 10/01/2044 * | | 94 | | 95 | |
Fannie Mae, TBA | | | | | |
5.50%, due 11/01/2037 | | 2,400 | | 2,365 | |
6.00%, due 11/01/2037 | | 19,900 | | 20,043 | |
Freddie Mac | | | | | |
4.50%, due 05/15/2017 | | 190 | | 188 | |
5.00%, due 02/15/2020 | | 2,569 | | 2,561 | |
5.50%, due 07/01/2037 | | 58,500 | | 57,593 | |
5.98%, due 02/15/2019 * | | 6,126 | | 6,103 | |
Total U.S. Government Agency Obligations (cost $404,779) | | | | 408,326 | |
| | | | | |
FOREIGN GOVERNMENT OBLIGATIONS (3.4%) | | | | | |
Japanese Government CPI Linked Bond, TIPS | | | | | |
0.80%, due 12/10/2015 | | JPY | 390,780 | | 3,323 | |
1.10%, due 12/10/2016 | | 608,170 | | 5,262 | |
1.20%, due 06/10/2017 | | 1,638,150 | | 14,209 | |
Russian Federation, Reg S | | | | | |
7.50%, due 03/31/2030 | | $ | 495 | | 558 | |
Total Foreign Government Obligations (cost $22,931) | | | | 23,352 | |
| | | | | |
MORTGAGE-BACKED SECURITIES (2.3%) | | | | | |
Banc of America Mortgage Securities, Inc. | | 95 | | 96 | |
Series 2004-1, Class 5A1 | | | | | |
6.50%, due 09/25/2033 | | | | | |
Bear Stearns Adjustable Rate Mortgage Trust | | 1,621 | | 1,605 | |
Series 2005-2, Class A1 | | | | | |
4.13%, due 03/25/2035 | | | | | |
Bear Stearns Adjustable Rate Mortgage Trust | | | | | |
Series 2005-2, Class A2 | | | | | |
4.13%, due 03/25/2035 * | | $ | 825 | | $ | 810 | |
Bear Stearns Adjustable Rate Mortgage Trust | | | | | |
Series 2005-5, Class A1 | | | | | |
4.55%, due 08/25/2035 * | | 570 | | 577 | |
Bear Stearns Adjustable Rate Mortgage Trust | | | | | |
Series 2005-5, Class A2 | | | | | |
4.55%, due 08/25/2035 * | | 783 | | 772 | |
Citigroup Mortgage Loan Trust, Inc. | | | | | |
Series 2005-11, Class A1A | | | | | |
4.90%, due 12/25/2035 | | 69 | | 69 | |
Citigroup Mortgage Loan Trust, Inc. | | | | | |
Series 2005-6, Class A1 | | | | | |
4.75%, due 08/25/2035 * | | 651 | | 646 | |
Citigroup Mortgage Loan Trust, Inc. | | | | | |
Series 2005-6, Class A2 | | | | | |
4.25%, due 08/25/2035 * | | 636 | | 622 | |
Citigroup Mortgage Loan Trust, Inc. | | | | | |
Series 2005-6, Class A3 | | | | | |
4.10%, due 08/25/2035 | | 84 | | 83 | |
Countrywide Home Loan Mortgage
Pass-Through Trust | | | | | |
Series 2005-3, Class 1A2 | | | | | |
5.42%, due 04/25/2035 | | 1,610 | | 1,583 | |
Countrywide Home Loan Mortgage
Pass-Through Trust | | | | | |
Series 2005-R2, Class 1AF1 | | | | | |
5.47%, due 06/25/2035 -144A | | 411 | | 402 | |
DaimlerChrysler Finco Term | | | | | |
5.00%, due 08/03/2014 (2) | | 3,300 | | 3,300 | |
Greenpoint Mortgage Funding Trust | | | | | |
Series 2005-AR1, Class A2 | | | | | |
5.35%, due 06/25/2045 | | 774 | | 757 | |
GSR Mortgage Loan Trust | | | | | |
Series 2005-AR6, Class 2A1 | | | | | |
4.54%, due 09/25/2035 * | | 1,245 | | 1,235 | |
HCA, Inc. | | | | | |
7.45%, due 11/18/2013 (2) | | 3,077 | | 3,003 | |
Sequoia Mortgage Trust | | | | | |
Series 5, Class A | | | | | |
5.85%, due 10/19/2026 | | 207 | | 206 | |
Total Mortgage-Backed Securities (cost $15,674) | | | | 15,766 | |
| | | | | | | | |
The notes to the financial statements are an integral part of this report.
40
| | Principal | | Value | |
ASSET-BACKED SECURITIES (0.2%) | | | | | |
Equity One ABS, Inc. | | | | | |
Series 2004-1, Class AV2 | | | | | |
5.43%, due 04/25/2034 | | $ | 48 | | $ | 47 | |
GSAMP Trust | | | | | |
Series 2004-SEA2, Class A2A | | | | | |
5.42%, due 03/25/2034 | | 117 | | 117 | |
Lehman XS Trust | | | | | |
Series 2006-10N, Class 1A1A | | | | | |
4.87%, due 07/25/2046 * | | 270 | | 269 | |
Merrill Lynch Mortgage Investors, Inc. | | | | | |
Series 2006-WMC1, Class A2A | | | | | |
5.21%, due 01/25/2037 | | 10 | | 10 | |
Residential Asset Securities Corp. | | | | | |
Series 2006-KS3, Class AI1 | | | | | |
5.20%, due 04/25/2036 | | 14 | | 14 | |
Small Business Administration | | | | | |
Series 2004-P10A, Class (1) | | | | | |
4.50%, due 02/01/2014 | | 805 | | 770 | |
Truman Capital Mortgage Loan Trust | | | | | |
Series 2004-1, Class A1 | | | | | |
5.47%, due 01/25/2034 -144A | | 17 | | 17 | |
Total Asset-Backed Securities (cost $1,282) | | | | 1,244 | |
| | | | | |
LONG-TERM MUNICIPAL BONDS (0.2%) | | | | | |
Buckeye Tobacco Settlement Financing | | | | | |
5.88%, due 06/01/2047 | | 500 | | 485 | |
New York City Municipal Water Finance Authority Class D | | | | | |
4.75%, due 06/15/2038 | | 200 | | 199 | |
Tobacco Settlement Finance Authority | | | | | |
7.47%, due 06/01/2047 | | 400 | | 395 | |
Tobacco Settlement Financing Corp. | | | | | |
6.00%, due 06/01/2023 | | 600 | | 610 | |
Total Long-Term Municipal Bonds (cost $1,601) | | | | 1,689 | |
| | | | | |
CORPORATE DEBT SECURITIES (6.3%) | | | | | |
Abbey National Treasury Services PLC | | | | | |
5.07%, due 07/02/2008 * | | 4,700 | | 4,701 | |
Atlantic & Western RE, Ltd. | | | | | |
11.48%, due 01/09/2009 * § -144A | | 700 | | 708 | |
Bear Stearns Co., Inc. | | | | | |
6.95%, due 08/10/2012 | | 1,700 | | 1,769 | |
BellSouth Corp. -144A | | | | | |
4.24%, due 04/26/2008 | | 3,300 | | 3,285 | |
C10 Capital SPV, Ltd. -144A | | | | | |
6.72%, due 12/31/2016 Ž | | 300 | | 289 | |
Canada Government, TIPS | | | | | |
3.00%, due 12/01/2036 | | 434 | | 548 | |
Citigroup Funding, Inc. | | | | | |
5.14%, due 04/23/2009 * | | 3,200 | | 3,196 | |
Citigroup, Inc. | | | | | |
5.40%, due 01/30/2009 * | | 500 | | 500 | |
CSC Holdings, Inc. | | | | | |
7.88%, due 12/15/2007 | | $ | 1,100 | | $ | 1,101 | |
Ford Motor Credit Co. LLC | | | | | |
7.25%, due 10/25/2011 | | 1,950 | | 1,814 | |
7.80%, due 06/01/2012 | | 150 | | 141 | |
Fortis Bank | | | | | |
4.77%, due 06/30/2008 * | | 3,000 | | 2,995 | |
Foundation RE II, Ltd. -144A | | | | | |
12.27%, due 11/26/2010 * § | | 500 | | 517 | |
General Electric Capital Corp. -144A | | | | | |
5.66%, due 03/04/2008 * | | 2,300 | | 2,300 | |
5.74%, due 12/12/2008 * | | 500 | | 500 | |
6.50%, due 09/15/2067 * | | 1,900 | | 3,971 | |
Goldman Sachs Group, Inc. | | | | | |
6.75%, due 10/01/2037 | | 400 | | 402 | |
Goldman Sachs Group, Inc. (The) | | | | | |
5.50%, due 06/28/2010 * | | 3,000 | | 2,991 | |
Harrah’s Operating Co., Inc. | | | | | |
7.50%, due 01/15/2009 | | 200 | | 203 | |
Koch Forest Products, Inc. (2) | | | | | |
6.83% - 7.47%, due 12/20/2012 * | | 983 | | 959 | |
Kraft Foods, Inc. | | | | | |
6.00%, due 02/11/2013 | | 700 | | 721 | |
Longpoint RE, Ltd. -144A | | | | | |
10.94%, due 05/08/2010 * § | | 600 | | 618 | |
Mystic RE, Ltd. -144A | | | | | |
14.54%, due 12/05/2008 * § | | 400 | | 409 | |
15.54%, due 06/07/2011 * § | | 1,000 | | 1,052 | |
Rabobank Nederland -144A | | | | | |
5.38%, due 01/15/2009 * | | 400 | | 400 | |
Redwood Capital IX, Ltd. -144A | | | | | |
12.99%, due 01/09/2008 * § | | 300 | | 301 | |
Residential Reinsurance 2007, Ltd. -144A | | | | | |
12.87%, due 06/07/2010 * § | | 1,600 | | 1,651 | |
Royal Bank of Scotland Group PLC | | | | | |
7.09%, due+ * Ž | | 300 | | 449 | |
Unicredit Luxembourg Finance SA -144A | | | | | |
5.41%, due 10/24/2008 * | | 900 | | 898 | |
United Kingdom, TIPS | | | | | |
2.50%, due 05/20/2009 | | 600 | | 3,263 | |
Vita Capital III, Ltd. -144A | | | | | |
6.35%, due 01/01/2012 * § | | 400 | | 397 | |
Wachovia Bank NA | | | | | |
5.69%, due 12/02/2010 * | | 1,200 | | 1,189 | |
Total Corporate Debt Securities (cost $43,656) | | | | 44,238 | |
The notes to the financial statements are an integral part of this report.
41
| | Principal | | Value | |
SHORT-TERM U.S. GOVERNMENT OBLIGATIONS (0.4%) | | | | | |
U.S. Treasury Bill | | | | | |
Zero Coupon, due 12/13/2007 (1) | | $ | 2,150 | | $ | 2,141 | |
4.62%, due 11/29/2007 (1) | | 635 | | 633 | |
Total Short-Term U.S. Government Obligations (cost $2,773) | | | | 2,773 | |
| | | | | | | |
| | Contracts (·) | | Value | |
PURCHASED OPTIONS (0.0%) | | | | | |
10-Year U.S. Treasury Note Future | | | | | |
Expires 11/20/2007 | | 615 | | $ | 9 | |
5-Year U.S. Treasury Note Future | | | | | |
Expires 11/20/2007 | | 261 | | 4 | |
U.S. Treasury Bond Future | | | | | |
Expires 11/20/2007 | | 682 | | 11 | |
Total Purchased Options (cost $29) | | | | 24 | |
| | | | | | |
| | Notional Amount | | Value | |
PURCHASED SWAPTIONS (0.1%) | | | | | |
Covered Call Options (0.1%) | | | | | |
LIBOR Rate Swaption | | | | | |
Call Strike $4.75 | | | | | |
Expires 03/31/2008 § | | 21,000 | | 147 | |
LIBOR Rate Swaption | | | | | |
Call Strike $1.35 | | | | | |
Expires 06/26/2008 § | | 3,000 | | 303 | |
LIBOR Rate Swaption | | | | | |
Call Strike $4.75 | | | | | |
Expires 09/26/2008 § | | 5,000 | | 41 | |
LIBOR Rate Swaption | | | | | |
Put Strike $1.39 | | | | | |
Expires 07/08/2010 § | | 3,400 | | 114 | |
LIBOR Rate Swaption | | | | | |
Call Strike $1.39 | | | | | |
Expires 07/08/2010 § | | 3,400 | | 302 | |
TSY Inflation Swaption | | | | | |
Put Strike $71.00 | | | | | |
Expires 11/13/2007 § | | 50,000 | | q | |
Put Options (0.0%) | | | | | |
LIBOR Rate Swaption | | | | | |
Put Strike $1.35 | | | | | |
Expires 06/26/2008 § | | 3,000 | | 21 | |
Total Purchased Swaptions (cost $693) | | | | 928 | |
| | Principal | | Value | |
CONVERTIBLE BONDS (0.4%) | | | | | |
Chesapeake Energy Corp., Convertible | | | | | |
2.50%, due 05/15/2037 | | $ | 2,500 | | $ | 2,781 | |
Total Convertible Bonds (cost $2,536) | | | | 2,781 | |
Total Investment Securities (cost $1,206,903) # | | | | $ | 1,220,522 | |
| | | | | | | |
| | Contracts (·) | | Value | |
WRITTEN OPTIONS - 0.0% | | | | | |
10-Year U.S. Treasury Note Future | | 98 | | $ | 72 | |
Expires 2/22/2008 | | | | | |
Put Options - 0.0% | | | | | |
10-Year U.S. Treasury Note Future | | 22 | | 5 | |
Put Strike $106.00 | | | | | |
Expires 2/22/2008 | | | | | |
Total Written Options (premiums: $47) | | | | 77 | |
| | | | | | |
| | Notional Amount | | Value | |
WRITTEN SWAPTIONS - 0.2% | | | | | |
Put Swaptions - 0.1% | | | | | |
Dow Jones CDX.IG.9 Index | | $ | 1,000 | | $ | 1 | |
Put Strike $1.00 | | | | | |
Expires 12/20/2007 | | | | | |
LIBOR Rate Swaption | | 1,600 | | 34 | |
Put Strike $5.67 | | | | | |
Expires 8/7/2008 | | | | | |
LIBOR Rate Swaption | | 2,000 | | 43 | |
Put Strike $5.67 | | | | | |
Expires 8/7/2008 | | | | | |
LIBOR Rate Swaption | | 8,000 | | 171 | |
Put Strike $5.25 | | | | | |
Expires 9/15/2008 | | | | | |
LIBOR Rate Swaption | | 7,000 | | 213 | |
Put Strike $5.37 | | | | | |
Expires 9/20/2010 | | | | | |
LIBOR Rate Swaption | | 4,000 | | 121 | |
Put Strike $5.37 | | | | | |
Expires 9/20/2010 | | | | | |
Covered Call Swaptions - 0.1% | | | | | |
Dow Jones CDX.IG.9 Index | | 1,000 | | 3 | |
Call Strike $0.70 | | | | | |
Expires 12/20/2007 | | | | | |
LIBOR Rate Swaption | | 9,000 | | 113 | |
Call Strike $4.95 | | | | | |
Expires 3/31/2008 | | | | | |
LIBOR Rate Swaption | | 1,600 | | 98 | |
Call Strike $5.67 | | | | | |
Expires 8/7/2008 | | | | | |
LIBOR Rate Swaption | | 2,000 | | 123 | |
Call Strike $5.67 | | | | | |
Expires 8/7/2008 | | | | | |
LIBOR Rate Swaption | | 8,000 | | 206 | |
Call Strike $5.25 | | | | | |
Expires 9/15/2008 | | | | | |
LIBOR Rate Swaption | | 2,000 | | 30 | |
Call Strike $4.95 | | | | | |
Expires 9/26/2008 | | | | | |
LIBOR Rate Swaption | | 7,000 | | 214 | |
Call Strike $5.37 | | | | | |
Expires 9/20/2010 | | | | | |
| | | | | | | |
The notes to the financial statements are an integral part of this report.
42
| | Notional Amount | | Value | |
WRITTEN SWAPTIONS (continued) | | | | | |
LIBOR Rate Swaption | | $ | 4,000 | | $ | 122 | |
Call Strike: $5.37 | | | | | |
Expires 9/20/2010 | | | | | |
Total Swaptions Written (premiums: $1,578) | | | | $ | 1,492 | |
| | | | | | | |
SWAP AGREEMENTS
| | | | | | Net Unrealized | |
| | Expiration | | Notional | | Appreciation | |
| | Date | | Amount | | (Depreciation) | |
Receive a fixed rate equal to 0.24% and the Fund will pay to the counterparty at the notional amount in the event of default of Russian Federation Government Bond, 7.50%, due 03/31/2030.
Counterparty: HSBC Bank USA | | 02/20/08 | | $ | 1,000 | | $ | (1 | ) |
| | | | | | | |
Receive a fixed rate equal to 0.28% and the Fund will pay to the counterparty at the notional amount in the event of default of Russian Federation Government Bond, 5.00%, due 03/31/2030.
Counterparty: HSBC Bank USA | | 11/20/07 | | 1,000 | | q | |
| | | | | | | |
Receive a fixed rate equal to 0.30% and the Fund will pay to the counterparty at the notional amount in the event of default of Republic of Panama Government Bond, 8.875%, due 09/30/2027.
Counterparty: Barclays Bank PLC | | 12/22/08 | | 1,700 | | (2 | ) |
| | | | | | | |
Receive a fixed rate equal to 0.33% and the Fund will pay to the counterparty at the notional amount in the event of default of Russian Federation Government Bond, 5.00%, due 03/31/2030.
Counterparty: Barclays Bank PLC | | 12/22/08 | | 1,700 | | (3 | ) |
| | | | | | | |
Receive a fixed rate equal to 0.35% and The Fund will pay to the counterparty at the notional amount in the event of default of Republic of PERU Government Bond, 8.75%, due 11/21/2033.
Counterparty: Barclays Bank PLC | | 12/22/08 | | 1,700 | | (1 | ) |
| | | | | | | |
Receive a fixed rate equal to 0.51% and The Fund will pay to the counterparty at the notional amount in the event of default of Republic of Indonesia Government Bond, 6.75%, due 03/10/2014. §
Counterparty: Deutsche Bank AG | | 12/22/08 | | 1,700 | | q | |
| | | | | | | |
Receive a fixed rate equal to 0.60% and the Fund will pay to the Counterparty, in the event of default on any of the securities in the Dow Jones CDX.IG.5 10 Year Index, the remaining interest payments on those defaulted securities.
Counterparty: Merrill Lynch Intl | | 12/20/12 | | $ | 8,400 | | $ | (3 | ) |
| | | | | | | |
Receive a fixed rate equal to 0.60% and the Fund will pay to the Counterparty, in the event of default on any of the securities in the Dow Jones CDX.IG.5 10 Year Index, the remaining interest payments on those defaulted securities.
Counterparty: Morgan Stanley Capital Services, Inc. | | 12/20/12 | | 8,400 | | (3 | ) |
| | | | | | | |
Receive a fixed rate equal to 0.66% and the Fund will pay to the counterparty at the notional amount in the event of default of Lehman Brothers Holdings, 6.63% due 1/08/2012.
Counterparty: Royal Bank of Scotland PLC | | 09/20/12 | | 400 | | (6 | ) |
| | | | | | | |
Receive a fixed rate equal to 0.72% and the Fund will pay to the counterparty at the notional amount in the event of default of Bear Stearns Co Inc, 6.63% due 1/08/2012.
Counterparty: Citibank NA | | 09/20/12 | | 800 | | (11 | ) |
| | | | | | | |
Receive a fixed rate equal to 0.78% and The Fund will pay to the counterparty at the notional amount in the event of default of Ukraine Government Bond, 7.65%, due 06/11/2013.
Counterparty: Barclays Bank PLC | | 12/22/08 | | 1,700 | | (1 | ) |
| | | | | | | |
Receive a fixed rate equal to 0.97% and the Fund will pay to the counterparty at the notional amount in the event of default of Chesapeake Energy Corp, 6.88%, due 01/15/2016.
Counterparty: Credit Suisse International | | 06/20/12 | | 200 | | (2 | ) |
The notes to the financial statements are an integral part of this report.
43
| | | | | | Net Unrealized | |
| | Expiration | | Notional | | Appreciation | |
| | Date | | Amount | | (Depreciation) | |
Receive a fixed rate equal to 1.01% and the Fund will pay to the counterparty at the notional amount in the event of default of Chesapeake Energy Corp, 6.88%, due 01/15/2016.
Counterparty: Credit Suisse Intl | | 06/20/12 | | $ | 200 | | $ | (2 | ) |
| | | | | | | |
Receive a fixed rate equal to 1.01% and the Fund will pay to the counterparty at the notional amount in the event of default of Chesapeake Energy Corp, 6.88%, due 01/15/2016.
Counterparty: Credit Suisse Intl | | 06/20/12 | | 700 | | (6 | ) |
| | | | | | | |
Receive a fixed rate equal to 1.04% and the Fund will pay to the counterparty at the notional amount in the event of default of Chesapeake Energy Corp, 6.88%, due 01/15/2016.
Counterparty: Credit Suisse Intl | | 06/20/12 | | 100 | | (1 | ) |
| | | | | | | |
Receive a fixed rate equal to 1.12% and the Fund will pay to the counterparty at the notional amount in the event of default of Lehman Brothers Holdings, 6.625%, due 1/18/2012.
Counterparty: BNP Parabas § | | 09/20/12 | | 200 | | 1 | |
| | | | | | | |
Receive a fixed rate equal to 1.20% and the Fund will pay to the counterparty at the notional amount in the event of default of Lehman Brothers Holdings, 6.625%, due 1/18/2012.
Counterparty: BNP Parabas § | | 09/20/12 | | 200 | | 2 | |
| | | | | | | |
Receive a fixed rate equal to 1.37% and the Fund will pay to the counterparty at the notional amount in the event of default of Chesapeake Energy Corp, 6.88%, due 01/15/2016.
Counterparty: Morgan Stanley Capital Services, Inc. § | | 09/20/12 | | 500 | | 4 | |
| | | | | | | |
Receive a fixed rate equal to 1.40% and the Fund will pay to the counterparty at the notional amount in the event of default of Ford Motor Credit, 7.00%, due 10/01/2013. §
Counterparty: Goldman Sachs Intl | | 09/20/08 | | $ | 1,600 | | $ | (36 | ) |
| | | | | | | |
Receive a fixed rate equal to 1.40% and the Fund will pay to the counterparty at the notional amount in the event of default of GMAC LLC, 6.88%, due 08/28/2012.
Counterparty: Barclays Bank PLC | | 09/20/08 | | 600 | | (15 | ) |
| | | | | | | |
Receive a fixed rate equal to 1.43% and the Fund will pay to the counterparty at the notional amount in the event of default of GMAC LLC, 6.88%, due 08/28/2012.
Counterparty: Barclays Bank PLC | | 09/20/08 | | 1,000 | | $ | (26 | ) |
| | | | | | | |
Receive a fixed rate equal to 1.55% and the Fund will pay to the counterparty at the notional amount in the event of default of Chesapeake Energy Corp., 6.88%, due 1/15/2016.
Counterparty: Credit Suisse Intl § | | 09/20/12 | | 100 | | 2 | |
| | | | | | | |
Receive a fixed rate equal to 1.95% and the Fund will pay a floating rate based on FRC-Excluding Tobacco-Non-Revised Consumer Price Index.
Counterparty: Barclays Bank PLC | | 03/15/12 | | EUR | 700 | | (11 | ) |
| | | | | | | | |
Receive a fixed rate equal to 1.98% and the Fund will pay a floating rate based on FRC-Excluding Tobacco-Non-Revised Consumer Price Index.
Counterparty: Barclays Bank PLC | | 04/30/12 | | EUR | 500 | | (4 | ) |
| | | | | | | | | | |
The notes to the financial statements are an integral part of this report.
44
| | | | | | Net Unrealized | |
| | Expiration | | Notional | | Appreciation | |
| | Date | | Amount | | (Depreciation) | |
Receive a fixed rate equal to 1.95% and the Fund will pay a floating rate based on FRC-Excluding Tobacco-Non-Revised Consumer Price Index.
Counterparty: Royal Bank of Scotland PLC | | 03/30/12 | | EUR | $ | 700 | | $ | (5 | ) |
| | | | | | | | |
Receive a fixed rate equal to 1.96% and the Fund will pay a floating rate based on FRC-Excluding Tobacco-Non-Revised Consumer Price Index.
Counterparty: Royal Bank of Scotland PLC | | 03/28/12 | | EUR | 200 | | (1 | ) |
| | | | | | | | |
Receive a fixed rate equal to 1.96% and the Fund will pay a floating rate based on FRC-Excluding Tobacco-Non-Revised Consumer Price Index.
Counterparty: Barclays Bank PLC | | 04/05/12 | | EUR | 200 | | (1 | ) |
| | | | | | | | |
Receive a fixed rate equal to 1.97% and the Fund will pay a floating rate based on FRC–Excluding Tobacco-Non-Revised Consumer Price Index.
Counterparty: JPMorgan Chase Bank | | 12/15/11 | | EUR | 2,200 | | (5 | ) |
| | | | | | | | |
Receive a fixed rate equal to 1.98% and the Fund will pay a floating rate based on FRC–Excluding Tobacco-Non-Revised Consumer Price Index.
Counterparty: Goldman Sachs Capital Markets, LP | | 12/15/11 | | EUR | 7,400 | | (14 | ) |
| | | | | | | | |
Receive a fixed rate equal to 1.98% and the Fund will pay a floating rate based on FRC–Excluding Tobacco-Non-Revised Consumer Price Index.
Counterparty: BNP Paribas | | 03/15/12 | | EUR | 1,100 | | (3 | ) |
| | | | | | | | |
Receive a fixed rate equal to 1.99% and the Fund will pay a floating rate based on FRC–Excluding Tobacco-Non-Revised Consumer Price Index.
Counterparty: BNP Paribas | | 12/15/11 | | EUR | $ | 2,900 | | $ | (1 | ) |
| | | | | | | | |
Receive a fixed rate equal to 10.12% and the Fund will pay a floating rate based on the Brazilian Real-CDI.
Counterparty: Morgan Stanley Capital Services Inc. | | 01/02/12 | | BRL | 3,000 | | (72 | ) |
| | | | | | | | |
Receive a fixed rate equal to 10.58% and the Fund will pay a floating rate based on the Brazilian Real-CDI.
Counterparty: UBS AG | | 01/02/12 | | BRL | 15,700 | | (246 | ) |
| | | | | | | | |
Receive a fixed rate equal to 10.68% and the Fund will pay a floating rate based on the Brazilian Real-CDI.
Counterparty: Barclays Bank PLC | | 01/02/12 | | BRL | 14,800 | | (211 | ) |
| | | | | | | | |
Receive a fixed rate equal to 2.00% and the Fund will pay a floating rate based on FRC–Excluding Tobacco-Non-Revised Consumer Price Index.
Counterparty: Goldman Sachs Capital Markets, LP | | 03/15/12 | | EUR | 1,300 | | (3 | ) |
| | | | | | | | |
Pay a fixed rate equal to 2.0275% and the Fund will receive a floating rate based on FRC- Excluding Tobacco-Non-Revised Consumer Price Index.
Counterparty: JPMorgan Chase Bank § | | 10/17/11 | | EUR | 1,400 | | 13 | |
| | | | | | | | |
Receive a fixed rate equal to 2.04% and the Fund will pay a floating rate based on FRC- Excluding Tobacco-Non-Revised Consumer Price Index.
Counterparty: Goldman Sachs Capital Markets, LP § | | 02/21/11 | | EUR | 5,500 | | 70 | |
| | | | | | | | | | | |
The notes to the financial statements are an integral part of this report.
45
| | | | | | Net Unrealized | |
| | Expiration | | Notional | | Appreciation | |
| | Date | | Amount | | (Depreciation) | |
Receive a fixed rate equal to 2.095% and the Fund will pay a floating rate based on FRC- Excluding Tobacco-Non-Revised Consumer Price Index.
Counterparty: UBS AG § | | 10/15/11 | | EUR | $3,600 | | $ | 50 | |
| | | | | | | |
Receive a fixed rate equal to 2.1025% and the Fund will pay a floating rate based on FRC Excluding Tobacco-Non-Revised Consumer Price Index.
Counterparty: Barclays Bank PLC § | | 10/15/10 | | EUR | 5,000 | | 99 | |
| | | | | | | |
Receive a fixed rate equal to 2.35% and the Fund will pay a floating rate based on FRC- Excluding Tobacco-Non-Revised Consumer Price Index.
Counterparty: UBS AG § | | 10/17/16 | | EUR | 1,400 | | 2 | |
| | | | | | | |
Receive a fixed rate equal to 2.35% and the Fund will pay a floating rate based on FRC- Excluding Tobacco-Non-Revised Consumer Price Index.
Counterparty: JPMorgan Chase Bank § | | 10/17/16 | | EUR | 1,300 | | 2 | |
| | | | | | | |
Receive a fixed rate equal to 2.44% and the Fund will pay in the event of default on any of the securities in the Dow Jones CDX.HY-8 Index, the remaining interest payments on those defaulted securities.
Counterparty: Lehman Securities, Inc. § | | 06/20/12 | | 860 | | 13 | |
| | | | | | | |
Receive a fixed rate equal to 3.05% and the Fund will pay to the counterparty at the notional amount in the event of default of GMAC LLC, 6.88%, due 08/28/2012.
Counterparty: Goldman Sachs International | | 09/20/12 | | 700 | | (41 | ) |
| | | | | | | |
Receive a fixed rate equal to 3.05% and the Fund will pay to the counterparty at the notional amount in the event of default of GMAC LLC, 6.88%, due 08/28/2012.
Counterparty: Barclays Bank PLC | | 09/20/12 | | $ | 100 | | $ | (6 | ) |
| | | | | | | |
Receive a fixed rate equal to 3.40% and the Fund will pay to the counterparty at the notional amount in the event of default of R.H. Donnelley Corp., 8.875%, due 1/15/2016.
Counterparty: Citibank NA § | | 09/20/12 | | 600 | | 6 | |
| | | | | | | |
Pay a fixed rate equal to 3.44% and the Fund will receive a floating rate based on UK - Retail Price Index. Counterparty: Royal Bank of Scotland PLC § | | 09/10/27 | | GBP | 700 | | 8 | |
| | | | | | | |
Receive a fixed rate equal to 3.80% and the Fund will pay to the counterparty at the notional amount in the event of default of Ford Motor Credit, 7.00%, due 10/01/2013.
Counterparty: Morgan Stanley Capital Services, Inc. | | 09/20/12 | | 500 | | (18 | ) |
| | | | | | | |
Receive a fixed rate equal to 3.80% and the Fund will pay to the counterparty at the notional amount in the event of default of Ford Motor Credit, 7.00%, due 10/01/2013. Counterparty: Barclays Bank PLC | | 09/20/12 | | 300 | | (11 | ) |
| | | | | | | |
Receive a fixed rate equal to 4.25% and the Fund will pay to the counterparty at the notional amount in the event of default of GMAC LLC, 6.88%, due 08/28/2012. § Counterparty: Deutsche Bank AG | | 09/20/08 | | 200 | | q | |
| | | | | | | |
Receive a fixed rate equal to 5.0% and pay a floating rate based on 6-month British Pound-LIBOR §
Counterparty: Barclays Bank PLC | | 06/15/09 | | GBP | 10,200 | | (261 | ) |
| | | | | | | | | | |
The notes to the financial statements are an integral part of this report.
46
| | | | | | Net Unrealized | |
| | Expiration | | Notional | | Appreciation | |
| | Date | | Amount | | (Depreciation) | |
Receive a fixed rate equal to 5.00% and pay a floating rate based on
3-month United States Dollar-LIBOR.
Counterparty: Barclays Bank PLC § | | 12/21/09 | | $ | 16,900 | | $ | 148 | |
| | | | | | | |
Receive a fixed rate equal to 5.00% and pay a floating rate based on
3-month United States Dollar-LIBOR.
Counterparty: Lehman Securities, Inc. § | | 12/19/12 | | 1,300 | | 10 | |
| | | | | | | |
Receive a fixed rate equal to 5.00% and pay a floating rate based on
3-month United States Dollar-LIBOR. §
Counterparty: Deutsche Bank AG § | | 12/19/12 | | 3,800 | | 28 | |
| | | | | | | |
Receive a fixed rate equal to 5.00% and pay a floating rate based on
3-month United States Dollar-LIBOR.
Counterparty: Deutsche Bank AG § | | 12/21/09 | | 3,800 | | 33 | |
| | | | | | | |
Receive a fixed rate equal to 5.00% and the Fund will pay a floating rate based on 3-month United States Dollar - LIBOR.
Counterparty: Morgan Stanley Capital Services, Inc. | | 12/19/37 | | 7,500 | | (402 | ) |
| | | | | | | |
Receive a fixed rate equal to 5.00% and the Fund will pay a floating rate based on 3-month United States Dollar - LIBOR.
Counterparty: Royal Bank of Scotland PLC | | 12/19/37 | | 4,600 | | (246 | ) |
| | | | | | | |
Receive a fixed rate equal to 5.00% and the Fund will pay a floating rate based on 3-month United States Dollar - LIBOR.
Counterparty: Deutsche Bank AG | | 12/21/37 | | 900 | | (48 | ) |
| | | | | | | |
Receive a fixed rate equal to 5.00% and the Fund will pay a floating rate based on 3-month United States Dollar - LIBOR.
Counterparty: Credit Suisse International § | | 12/21/09 | | 17,500 | | 153 | |
| | | | | | | |
Receive a fixed rate equal to 5.00% and the Fund will pay a floating rate based on 6-month British Pound–LIBOR
Counterparty: Royal Bank of Scotland PLC | | 09/15/10 | | GBP | $5,100 | | $ | (210 | ) |
| | | | | | | |
Receive a fixed rate equal to 1.00% and the Fund will pay a floating rate based on 6-month Japanese Yen - LIBOR.
Counterparty: Morgan Stanley Capital Services, Inc. § | | 03/18/09 | | JPY | 1,900,000 | | (13 | ) |
| | | | | | | |
Receive a fixed rate equal to 5.00% and the Fund will pay a floating rate based on the 3-month United States Dollar- LIBOR.
Counterparty: Barclays Bank PLC § | | 12/19/12 | | 10,300 | | 77 | |
| | | | | | | |
Receive a fixed rate equal to 5.00% and the Fund will pay a floating rate based on the 3-month United States Dollar- LIBOR. §
Counterparty: Royal Bank of Scotland PLC § | | 12/19/12 | | 16,300 | | 122 | |
| | | | | | | |
Receive a fixed rate equal to 5.00% and the Fund will pay a floating rate based on the 3-month United States Dollar-LIBOR.
Counterparty: UBS AG § | | 06/18/09 | | 105,000 | | 565 | |
| | | | | | | |
Receive a fixed rate equal to 5.00% and the Fund will pay a floating rate based on the 3-month United States Dollar-LIBOR.
Counterparty: Goldman Sachs Capital Markets, LP § | | 12/21/09 | | 7,900 | | 69 | |
| | | | | | | |
Receive a fixed rate equal to 5.00% and the Fund will pay to the counterparty at the notional amount in the event of default of GMAC LLC, 6.88%, due 08/28/2012.
Counterparty: Citibank NA | | 09/20/12 | | 600 | | (1 | ) |
| | | | | | | |
Receive a fixed rate equal to 5.05% and the Fund will pay to the counterparty at the notional amount in the event of default of GMAC LLC, 6.88%, due 08/28/2012.
Counterparty: Goldman Sachs Capital Markets, LP | | 09/22/08 | | 3,400 | | (16 | ) |
| | | | | | | | | | | |
The notes to the financial statements are an integral part of this report.
47
| | | | | | Net Unrealized | |
| | Expiration | | Notional | | Appreciation | |
| | Date | | Amount | | (Depreciation) | |
Receive a fixed rate equal to 5.35% and the Fund will pay to the counterparty at the notional amount in the event of default of GMAC LLC, 6.88%, due 08/28/2012.
Counterparty: Goldman Sachs Capital Markets, LP § | | 09/20/12 | | $ | 3,400 | | $ | 44 | |
| | | | | | | | |
Receive a fixed rate equal to 6.00% and the Fund will pay a floating rate based on 6-month British Pound–LIBOR
Counterparty: Deutsche Bank AG § | | 03/20/10 | | GBP | 5,100 | | (69 | ) |
| | | | | | | | |
Receive a fixed rate equal to 7.00% and the Fund will pay a floating rate based on the 6-month AUD- BBR-BBSW.
Counterparty: Barclays Bank PLC | | 12/15/09 | | AUD | 8,900 | | (42 | ) |
| | | | | | | | |
Receive a fixed rate equal to 6.50% and the Fund will pay a floating rate based on the 6-month AUD–BBR-BBSW.
Counterparty: Deutsche Bank AG | | 01/15/10 | | AUD | 10,400 | | (169 | ) |
| | | | | | | | |
Receive a fixed rate equal to 6.50% and the Fund will pay a floating rate based on the 6-month AUD–BBR-BBSW.
Counterparty: Royal Bank of Scotland PLC | | 01/15/10 | | AUD | 1,100 | | (18 | ) |
| | | | | | | | |
Receive a fixed rate equal to 6.50% and the Fund will pay a floating rate based on the 6-month Australian Dollar- Bank Bill Rate–BBSW (AUD–BBR-BBSW).
Counterparty: JPMorgan Chase Bank | | 01/15/10 | | AUD | 1,700 | | (28 | ) |
| | | | | | | | |
Receive a fixed rate equal to 6.50% and the Fund will pay a floating rate based on the 6-month Australian Dollar– Bank Bill Rate–BBSW (AUD–BBR-BBSW).
Counterparty: Citibank NA | | 01/15/10 | | AUD | 2,700 | | (44 | ) |
| | | | | | | | |
Pay a fixed rate equal to 6.75% and the Fund will receive a floating rate based on the 6-month AUD- BBR-BBSW.
Counterparty: Morgan Stanley Capital Services, Inc. § | | 12/15/17 | | AUD | $1,200 | | $ | 18 | |
| | | | | | | |
Pay a fixed rate equal to 6.75% and the Fund will receive a floating rate based on the 6-month AUD- BBR-BBSW.
Counterparty: Barclays Bank PLC § | | 12/15/17 | | AUD | 1,100 | | 16 | |
| | | | | | | |
Receive a fixed rate equal to 6.85% and the Fund will pay to the counterparty at the notional amount in the event of default of GMAC LLC, 6.875%, due 08/28/2012.
Counterparty: Morgan Stanley Capital Services, Inc. § | | 06/20/12 | | 300 | | 18 | |
| | | | | | | |
Receive a fixed rate equal to 7.00% and the Fund will pay a floating rate based on the 6-month AUD- BBR-BBSW.
Counterparty: Morgan Stanley Capital Services, Inc. | | 12/15/09 | | AUD | 9,600 | | (45 | ) |
| | | | | | | |
Receive a fixed rate equal to 7.00% and the Fund will pay a floating rate based on the 6-month Australian Dollar- Bank Bill Rate- BBSW (AUD- BBR-BBSW.)
Counterparty: Deutsche Bank AG | | 06/15/10 | | AUD | 30,700 | | (261 | ) |
| | | | | | | |
Receive a fixed rate equal to 7.00% and the Fund will pay to the counterparty at the notional amount in the event of default of GMAC LLC, 6.875%, due 08/28/2012.
Counterparty: Bank of America § | | 09/20/12 | | $ | 400 | | 26 | |
| | | | | | | |
Receive a fixed rate equal to 8.17% and the Fund will pay a floating rate based on Mexican Peso Interbank Equilibrium Interest Rate (TIIE)-Banxico.
Counterparty: Morgan Stanley Capital Services, Inc. | | 11/04/16 | | MXN | 13,900 | | (6 | ) |
| | | | | | | | | | |
The notes to the financial statements are an integral part of this report.
48
| | | | | | Net Unrealized | |
| | Expiration | | Notional | | Appreciation | |
| | Date | | Amount | | (Depreciation) | |
Receive a fixed rate equal to 8.17% and the Fund will pay a floating rate based on Mexican Peso Interbank Equilibrium Interest Rate (TIIE)-Banxico.
Counterparty: Merrill Lynch Capital Services | | 11/04/16 | | MXN | $35,400 | | $ | (15 | ) |
| | | | | | | |
Receive a fixed rate equal to 8.17% and the Fund will pay a floating rate based on the Mexican Peso TIIE-Banxico.
Counterparty: Citibank NA | | 11/04/16 | | MXN | 69,400 | | (30 | ) |
| | | | | | | | |
Receive a fixed rate equal to 8.17% and the Fund will pay a floating rate based on the Mexican Peso TIIE-Banxico.
Counterparty: Goldman Sachs Capital Markets LP | | 11/04/16 | | MXN | 33,500 | | (15 | ) |
| | | | | | | | |
Receive a fixed rate equal to 8.33% and the Fund will pay a floating rate based on Mexican Peso TIIE-Banxico.
Counterparty: Barclays Bank PLC § | | 02/14/17 | | MXN | 6,400 | | 3 | |
| | | | | | | |
Receive a floating rate based on 3-month United States Dollar - LIBOR and pay a fixed rate equal to 5.00%.
Counterparty: Deutsche Bank AG § | | 12/20/26 | | 1,300 | | 51 | |
| | | | | | | |
Receive a floating rate based on 3-month United States Dollar - LIBOR and pay a fixed rate equal to 5.00%.
Counterparty: Deutsche Bank AG § | | 12/20/21 | | 1,200 | | 30 | |
| | | | | | | |
Receive a floating rate based on 6-month British Pound-LIBOR and pay a fixed rate equal to 4.00%.
Counterparty: Barclays Bank PLC § | | 12/17/35 | | GBP | 3,300 | | 256 | |
| | | | | | | | |
Receive a floating rate based on 6-month Great British Pound-LIBOR and pay a fixed rate equal to 4.25%.
Counterparty: HSBC Bank USA § | | 06/12/36 | | GBP | 1,300 | | 256 | |
| | | | | | | | |
Receive a floating rate based on 6-month Great British Pound–LIBOR and the Fund will pay a fixed rate equal to 4.00%.
Counterparty: Royal Bank of Scotland PLC § | | 12/17/35 | | GBP | $1,400 | | $ | 133 | |
| | | | | | | | |
Receive a floating rate based on 6-month Great British Pound–LIBOR and the Fund will pay a fixed rate equal to 5.0%.
Counterparty: Goldman Sachs Capital Markets, LP § | | 09/15/15 | | GBP | 2,400 | | 158 | |
| | | | | | | | |
Pay a floating rate based on 6-month Great British Pound–LIBOR and the Fund will receive a fixed rate equal to 5.0%.
Counterparty: Royal Bank of Scotland PLC | | 09/15/10 | | GBP | 3,400 | | (140 | ) |
| | | | | | | | |
Receive a floating rate based on 6-month Great British Pound–LIBOR and the Fund will pay a fixed rate equal to 5.00%. §
Counterparty: Barclays Bank PLC | | 03/20/18 | | GBP | 1,900 | | 101 | |
| | | | | | | | |
Receive a floating rate based on 6-month-EURIBOR and the Fund will pay a fixed rate equal to 4.00%.
Counterparty: Credit Suisse International § | | 06/15/17 | | EUR | 7,600 | | 550 | |
| | | | | | | | |
Receive a floating rate based on CPTFEMU Index and the Fund will pay a fixed rate equal to 2.275%.
Counterparty: UBS AG § | | 10/17/16 | | EUR | 1,400 | | 9 | |
| | | | | | | | |
Receive a floating rate based on the 3-month Canadian Bank rate and pay a fixed rate equal to 5.50%.
Counterparty: Royal Bank of Scotland PLC | | 06/20/17 | | CAD | 100 | | (2 | ) |
| | | | | | | | |
Receive a floating rate based on the 3-month Canadian Bank rate and pay a fixed rate equal to 5.50%.
Counterparty: Bank of America | | 06/20/17 | | CAD | 11,100 | | (196 | ) |
| | | | | | | | |
Receive a floating rate based on the 3-month Canadian Bank rate and the Fund will pay a fixed rate equal to 5.00%.
Counterparty: Bank of America § | | 06/20/12 | | CAD | 15,700 | | 83 | |
The notes to the financial statements are an integral part of this report.
49
| | | | | | Net Unrealized | |
| | Expiration | | Notional | | Appreciation | |
| | Date | | Amount | | (Depreciation) | |
Receive a floating rate based on the 3-month United States Dollar - LIBOR and pay a fixed rate equal to 5.00%.
Counterparty: Royal Bank of Scotland PLC § | | 12/19/17 | | $ | 37,200 | | $ | 341 | |
| | | | | | | |
Receive a floating rate based on the 3-month United States Dollar LIBOR and pay a fixed rate equal to 5.00%.
Counterparty: UBS AG § | | 12/19/17 | | 1,800 | | 16 | |
| | | | | | | |
Receive a floating rate based on the 3-month United States Dollar LIBOR and pay a fixed rate equal to 5.00%.
Counterparty: Morgan Stanley Capital Services, Inc. § | | 12/19/17 | | 100 | | 1 | |
| | | | | | | |
Receive a floating rate based on the 3-month United States Dollar - LIBOR and pay a fixed rate equal to 5.00%.
Counterparty: Deutsche Bank AG § | | 12/19/17 | | 8,400 | | 77 | |
| | | | | | | |
Receive a floating rate based on the 3-month United States Dollar - LIBOR and pay a fixed rate equal to 5.00%. §
Counterparty: Barclays Bank PLC | | 12/19/17 | | 5,700 | | 52 | |
| | | | | | | |
Receive a floating rate based on the 3-month United States Dollar - LIBOR and pay a fixed rate equal to 5.00%. §
Counterparty: Deutsche Bank AG | | 12/19/14 | | 4,000 | | (7 | ) |
| | | | | | | |
Receive a floating rate based on the 3-month United States Dollar - LIBOR and pay a fixed rate equal to 5.00%.
Counterparty: Credit Suisse International § | | 12/19/17 | | 2,800 | | 26 | |
| | | | | | | |
Receive a floating rate based on the 3-month United States Dollar - LIBOR and pay a fixed rate equal to 5.00%.
Counterparty: Bank of America § | | 12/19/17 | | 7,800 | | 71 | |
| | | | | | | |
Receive a floating rate based on the 3-month United States Dollar - LIBOR and pay a fixed rate equal to 5.00%.
Counterparty: Barclays Bank PLC | | 12/19/14 | | $ | 5,400 | | $ | (9 | ) |
| | | | | | | |
Receive a floating rate based on the 6-month Japanese Yen- LIBOR and pay a fixed rate equal to 2.00%.
Counterparty: Barclays Bank PLC | | 12/20/16 | | JPY | 980,000 | | (203 | ) |
| | | | | | | | |
Receive a floating rate based on the 6-month Japanese Yen- LIBOR and pay a fixed rate equal to 2.00%.
Counterparty: Deutsche Bank AG | | 12/20/16 | | JPY | 160,000 | | (33 | ) |
| | | | | | | | |
Receive a floating rate based on the 6-month Japanese Yen- LIBOR and pay a fixed rate equal to 2.00%.
Counterparty: Goldman Sachs International | | 12/20/16 | | JPY | 150,000 | | (31 | ) |
| | | | | | | |
Receive from the counterparty a fixed rate equal to 0.39% and the Fund will pay at the notional amount in the event of default of Goldman Sachs Group, Inc., 6.60%, due 1/15/2012.
Counterparty: BNP Parabas § | | 12/20/12 | | 200 | | 2 | |
| | | | | | | |
Receive from the counterparty a fixed rate equal to 0.40% and the Fund will pay at the notional amount in the event of default of Goldman Sachs Group, Inc., 6.60%, due 1/15/2012.
Counterparty: Citibank NA § | | 12/20/12 | | 200 | | 2 | |
| | | | | | | |
Receive from the counterparty a fixed rate equal to 0.75% and the Fund will pay at the notional amount in the event of default of Goldman Sachs Group, Inc., 6.60%, due 1/15/2012.
Counterparty: Morgan Stanley Capital Services, Inc. § | | 09/20/12 | | 500 | | 3 | |
| | | | | | | | | | |
The notes to the financial statements are an integral part of this report.
50
| | | | | | Net Unrealized | |
| | Expiration | | Notional | | Appreciation | |
| | Date | | Amount | | (Depreciation) | |
Receive from the counterparty a fixed rate equal to 0.80% and the Fund will pay at the notional amount in the event of default of Goldman Sachs Group, Inc., 6.60%, due 1/15/2012.
Counterparty: Morgan Stanley Capital Services, Inc. § | | 09/20/12 | | $ | 400 | | $ | 3 | |
| | | | | | | |
Receive from the Counterparty, in the event of default on any of the securities in the Dow Jones CDX.HY-8 Index, the remaining interest payments on those defaulted securities and the Fund will pay a fixed rate equal to 2.30%.
Counterparty: Lehman Securities, Inc. § | | 06/20/12 | | 1,200 | | 12 | |
| | | | | | | |
Receive from the Counterparty, in the event of default on any of the securities in the Dow Jones CDX.HY-8 Index, the remaining interest payments on those defaulted securities and the Fund will pay a fixed rate equal to 2.46%.
Counterparty: Merrill Lynch International § | | 06/20/12 | | 1,290 | | 21 | |
| | | | | | | |
Receive from the Counterparty, in the event of default on any of the securities in the Dow Jones CDX.HY-8 Index, the remaining interest payments on those defaulted securities and the Fund will pay a fixed rate equal to 2.75%.
Counterparty: Barclays Bank PLC § | | 06/20/12 | | 2,200 | | 75 | |
| | | | | | | |
Receive from the Counterparty, in the event of default on any of the securities in the Dow Jones CDX.HY-8 Index, the remaining interest payments on those defaulted securities and the Fund will pay a fixed rate equal to 2.75%.
Counterparty: Morgan Stanley Capital Services, Inc. § | | 06/20/12 | | 2,700 | | 92 | |
| | | | | | | |
Receive from the Counterparty, in the event of default on any of the securities in the Dow Jones CDX.HY-8 Index, the remaining interest payments on those defaulted securities and the Fund will pay a fixed rate equal to 2.75%.
Counterparty: UBS AG § | | 06/20/12 | | $ | 2,400 | | $ | 81 | |
| | | | | | | |
Receive from the Counterparty, in the event of default on any of the securities in the Dow Jones CDX.HY-8 Index, the remaining interest payments on those defaulted securities and the Fund will pay a fixed rate equal to 2.75%.
Counterparty: Bear Stearns § | | 06/20/12 | | 100 | | 3 | |
| | | | | | | |
Receive from the Counterparty, in the event of default on any of the securities in the Dow Jones CDX.HY-8 Index, the remaining interest payments on those defaulted securities and the Fund will pay a fixed rate equal to 2.75%.
Counterparty: Merrill Lynch Intl § | | 06/20/12 | | 2,600 | | 80 | |
| | | | | | | |
Total Swap Agreements
(Premium $-728) | | | | $ | 3,886,150 | | $ | 990 | |
The notes to the financial statements are an integral part of this report.
51
FUTURES CONTRACTS:
| | | | | | | | Net Unrealized | |
| | | | Settlement | | | | Appreciation | |
| | Contracts (·) | | Date | | Amount | | (Depreciation) | |
3-Month Euro EURIBOR | | 207 | | 12/15/2008 | | 71,634 | | $ | 113 | |
3-Month Euro EURIBOR | | 13 | | 06/15/2009 | | 4,508 | | 14 | |
3-Month Euro EURIBOR | | 20 | | 03/16/2009 | | 6,923 | | 21 | |
3-Month Euro EURIBOR | | (35 | ) | 09/15/2008 | | 12,109 | | 23 | |
90-Day Euro Dollar | | 124 | | 12/15/2008 | | 29,667 | | 32 | |
90-Day Euro Dollar | | 66 | | 03/17/2008 | | 15,758 | | 95 | |
90-Day Euro Dollar | | (17 | ) | 09/15/2008 | | 4,067 | | (21 | ) |
90-Day GBP LIBOR | | 12 | | 03/19/2009 | | 2,946 | | (1 | ) |
90-Day Euro Dollar | | 126 | | 12/17/2007 | | 30,004 | | 40 | |
90-Day Euro Dollar | | 137 | | 06/15/2009 | | 32,729 | | 57 | |
90-Day Euro Dollar | | 109 | | 06/16/2008 | | 26,056 | | 90 | |
90-Day Euro Dollar | | 277 | | 03/16/2009 | | 66,241 | | 111 | |
90-Day Euro Dollar | | 137 | | 09/14/2009 | | 32,695 | | 58 | |
90-Day GBP LIBOR | | 365 | | 06/18/2008 | | 89,405 | | (19 | ) |
90-Day GBP LIBOR | | 22 | | 06/17/2009 | | 5,399 | | (3 | ) |
90-Day GBP LIBOR | | 261 | | 03/19/2008 | | 63,188 | | (228 | ) |
Euro-BUND | | (20 | ) | 12/10/2007 | | (3,279 | ) | (31 | ) |
90-Day GBP LIBOR | | 143 | | 09/18/2008 | | 35,075 | | (28 | ) |
10-Year U.S. Treasury Note | | (517 | ) | 12/31/2007 | | (56,878 | ) | (578 | ) |
5-Year U.S. Treasury Note | | (261 | ) | 12/30/2007 | | (28,017 | ) | (123 | ) |
U.S. Treasury Long Bond | | (682 | ) | 12/30/2007 | | (76,789 | ) | (757 | ) |
| | | | | | | | | | | |
| | | | | | $ | 363,445 | | $ | (1,135 | ) |
The notes to the financial statements are an integral part of this report.
52
FORWARD FOREIGN CURRENCY CONTRACTS:
| | | | | | Amount in | | Net Unrealized | |
| | Bought | | Settlement | | U.S. Dollars | | Appreciation | |
Currency | | (Sold) | | Date | | Bought(Sold) | | (Depreciation) | |
Brazil Real | | 3,817 | | 03/04/2008 | | $ | 1,993 | | $ | 167 | |
Brazil Real | | 16,798 | | 07/02/2008 | | 8,380 | | 969 | |
Brazil Real | | 352 | | 11/05/2007 | | 185 | | 18 | |
Brazil Real | | (352 | ) | 11/05/2007 | | (195 | ) | (8 | ) |
Canadian Dollar | | 140 | | 11/01/2007 | | 144 | | 4 | |
Canadian Dollar | | (508 | ) | 11/01/2007 | | (501 | ) | (34 | ) |
Canadian Dollar | | (368 | ) | 12/20/2007 | | (387 | ) | q | |
Chinese Yuan Renminbi | | 51,704 | | 01/10/2008 | | 6,928 | | 102 | |
Chinese Yuan Renminbi | | (51,704 | ) | 01/10/2008 | | (7,011 | ) | (18 | ) |
Chinese Yuan Renminbi | | 43,219 | | 03/02/2009 | | 6,107 | | 231 | |
Chinese Yuan Renminbi | | (43,219 | ) | 03/02/2009 | | (6,182 | ) | (156 | ) |
Chinese Yuan Renminbi | | 26,240 | | 03/07/2008 | | 3,578 | | 31 | |
Chinese Yuan Renminbi | | (26,240 | ) | 03/07/2008 | | (3,586 | ) | (22 | ) |
Euro Dollar | | (4,269 | ) | 11/05/2007 | | (6,046 | ) | (131 | ) |
Japanese Yen | | (3,094,277 | ) | 12/13/2007 | | (27,114 | ) | 148 | |
Malaysian Ringgit | | 2,844 | | 05/21/2008 | | 843 | | 15 | |
Mexican Peso | | 75,322 | | 03/13/2008 | | 6,890 | | 75 | |
Mexican Peso | | 111,891 | | 07/10/2008 | | 9,978 | | 263 | |
Poland Zloty | | 7,517 | | 07/10/2008 | | 2,736 | | 250 | |
Republic of Korea Won | | 122,721 | | 01/30/2008 | | 135 | | 2 | |
Republic of Korea Won | | 2,356,431 | | 05/30/2008 | | 2,526 | | 101 | |
Russian Ruble | | 101,274 | | 01/11/2008 | | 3,967 | | 125 | |
Russian Ruble | | (51,738 | ) | 01/11/2008 | | (2,072 | ) | (18 | ) |
Russian Ruble | | 1,112 | | 07/10/2008 | | 44 | | 1 | |
Singapore Dollar | | 161 | | 02/20/2008 | | 108 | | 4 | |
Singapore Dollar | | 3,886 | | 05/22/2008 | | 2,602 | | 111 | |
Swiss Franc | | (640 | ) | 12/06/2007 | | (533 | ) | (20 | ) |
United Kingdom Pound | | (5,081 | ) | 11/01/2007 | | (10,215 | ) | (340 | ) |
United Kingdom Pound | | (5,081 | ) | 12/20/2007 | | (10,486 | ) | (53 | ) |
| | | | | | $ | (17,184 | ) | $ | 1,817 | |
The notes to the financial statements are an integral part of this report.
53
NOTES TO SCHEDULE OF INVESTMENTS
q | Value is less than $1 |
* | Floating or variable rate note. Rate is listed as of October 31, 2007. |
§ | Illiquid |
| Contract Amounts are not in thousands |
(1) | At October 31, 2007, all or a portion of this security is segregated with the custodian to cover margin requirements for open options and futures contracts. The value of all securities segregated at October 31, 2007 is $169. |
(2) | Loan Participation |
· | The security has a perpetual maturity. The date shown is the next call date. |
# | Aggregate cost for federal income tax purposes is $1,209,719. Aggregate gross unrealized appreciation for all securities in which there is an excess of value over tax cost and aggregate gross unrealized depreciation for all securities in which there is an excess of tax cost over value were $11,737 and $934, respectively. Net unrealized appreciation for tax purposes is $10,803. |
| |
DEFINITIONS: |
144A | 144A Securities are registered pursuant to Rule 144A of the Securities Act of 1933. These securities are deemed to be liquid for purposes of compliance limitations on holdings of illiquid securities and may be resold as transactions exempt from registration, normally to qualified institutional buyers. At October 31, 2007, these securities aggregated $11,836, or 1.70%, of net assets of the Fund. |
CPI | Consumer Price Index |
TBA | To Be Announced |
TIPS | Treasury Inflation Protected Security |
CAD | Canada dollar |
EUR | Euro Dollar |
GBP | United Kingdom pound |
JPY | Japan yen |
BRL | Brazil Real |
MXN | Mexican Peso |
AUD | Australian Dollar |
The notes to the financial statements are an integral part of this report.
54
TA IDEX PIMCO Total Return
MARKET ENVIRONMENT
The primary focus during the year centered on concerns about the sub-prime mortgage sector that developed in 2007. During most of the year the Federal Reserve Board (“Fed”) focused on stronger economic data making it difficult for them to ease rates, as they focused on inflation concerns. Tight labor markets kept the unemployment rate relatively low and produced real wage gains for consumers that helped offset headwinds from the residential property market. In addition, measures of core inflation (consumer price inflation with the volatile food and energy prices stripped out) remained above the Fed’s targeted range. Weakness in the sub-prime mortgage sector produced a significant tightening of credit conditions for lower quality and first-time borrowers, yet another blow to an already soft housing market.
The Fed remained on hold throughout most of the year, after pausing in August 2006 with the federal funds rate (“fed funds rate”) at 5.25%. However, turmoil in the sub-prime market and the liquidity crunch in the asset-backed commercial paper market drove the Fed to take action in 2007. Initially, in August 2007, the Fed cut the discount rate, by 50 basis points (bps) to 5.75% to help alleviate liquidity concerns in the financial markets. Subsequently, the Fed met in September, and citing developments in the financial markets that have increased the uncertainty surrounding the economic outlook, cut both the fed funds and discount rates by 50 bps, to 4.75% and 5.25%, respectively. At the Fed’s October 31, 2007 meeting, they again cut the fed funds and discount rates by another 25 bps, to 4.50% and 5.00%, respectively; but cited that the upside risks to inflation and the downside risks to economic growth are roughly equal indicating that more rate cuts may not be needed. At the end of October 2007 the benchmark ten-year Treasury yielded 4.47%, 13 basis points lower than at the start of the period.
PERFORMANCE
For the year ended October 31st, 2007, TA IDEX PIMCO Total Return Class A returned 6.01%. By comparison, its benchmark, the Lehman Brothers Aggregate Bond Index, returned 5.38%. As of October 31, 2007, the Fund’s net expense ratios for Class A, Class B, Class C, and Class I were 1.06%, 0.99%, 0.97%, and 0.75%, respectively.
STRATEGY REVIEW
The portfolio’s investment process is based upon a long-term approach, which utilizes both top-down and bottom-up strategies. Top-down strategies focus on duration, yield curve positioning, volatility, and sector rotation, while bottom-up strategies drive the security selection process, facilitating the identification and analysis of undervalued securities. No single strategy dominates returns; the total return strategy relies on multiple sources of value added in a highly diversified portfolio.
During the twelve-month reporting period the portfolio’s performance was relatively stable despite a volatile market (most noticeable in the past three months) as we employed curve steepening strategies; an underweight to investment-grade corporate bonds; and an emphasis to emerging market currencies. We maintained a focus on quality, as the average credit rating of securities in the portfolio was held at the AA+ level during the reporting period.
The portfolio benefited from tactical adjustments and holdings in non-index securities and direct holding of currency. In particular, holdings of emerging market currencies such as the
Brazilian real, the Russian ruble, and the Mexican peso more than offset the negative impact of an overweight in prime, AAA-rated, agency-guaranteed mortgage-backed securities, which lost ground as volatility soared this summer.
For the first part of the year, the portfolio’s main detractors were an above-benchmark duration, curve steepening strategies outside the United States (specifically in the United Kingdom (“UK”)), and an underweight to investment-grade corporate bonds. Strong monthly payroll and gross domestic readings in the U.S., a booming British economy, and strong earnings results meant higher yields in the U.S., expectations for rate increases in the UK, and further tightening of investment-grade spreads. In the second part of this year, however, sub-prime mortgage headlines increased, the credit crunch took hold, and volatility soared. Investors sought the quality of U.S. Treasury bonds and bid up expectations of interest rate cuts by the Fed. In the UK, investors cut back on expectations of rate hikes by the Bank of England. And, in July and August, corporate bonds sold off, driving spreads significantly higher. As a result, curve-steepening strategies in the U.S. and UK and an underweight to corporate bonds proved valuable.
As investors priced in greater expectations of cuts by the Fed, our underweight to the U.S. dollar began to pay significant dividends, most noticeably in September and October as all major developed and developing countries saw their currencies appreciate. Holdings of the Brazilian real, Mexican peso, Russian ruble, and Asian currencies like the Singaporean dollar and South Korean won all proved significantly valuable in the wake of a major sell-off of the U.S. dollar.
Out-of-index allocations proved valuable diversifiers over the past twelve months. Earlier this year, while an allocation to short-maturity Treasury Inflation Protected Securities (“TIPS”) detracted from performance, more recently this strategy has added value as the price of oil reached new records. While high yield bonds added to performance earlier this year on strong earnings results and low default levels, spreads widened significantly in the summer, thus detracting from overall performance.
Pasi Hamalainen
Fund Manager
Pacific Investment Management Co., LLC
55
TA IDEX PIMCO Total Return
(unaudited)
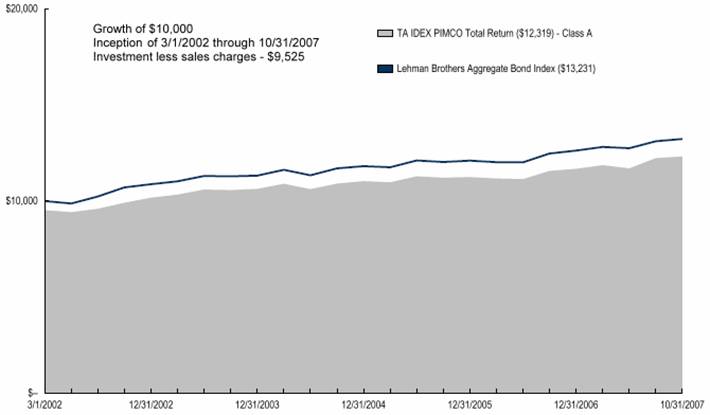
Average Annual Total Return for Periods Ended 10/31/2007
| | From | | Inception | | | | | |
| | 1 Year | | 5 Years | | Inception | | Date | |
Class A (NAV) | | 6.01 | % | 4.43 | % | 4.64 | % | 3/1/02 | |
Class A (POP) | | 1.01 | % | 3.43 | % | 3.75 | % | 3/1/02 | |
Lehman Brothers Aggregate Bond Index (1) | | 5.38 | % | 4.41 | % | 4.98 | % | 3/1/02 | |
| | | | | | | | | |
Class B (NAV) | | 6.17 | % | 3.98 | % | 4.18 | % | 3/1/02 | |
Class B (POP) | | 1.17 | % | 3.81 | % | 4.18 | % | 3/1/02 | |
| | | | | | | | | |
Class C (NAV) | | 6.21 | % | — | % | 3.85 | % | 11/11/02 | |
Class C (POP) | | 5.21 | % | — | % | 3.85 | % | 11/11/02 | |
| | | | | | | | | |
Class I (NAV) | | 6.33 | % | — | % | 5.95 | % | 11/15/05 | |
NOTES
(1) The Lehman Brothers Aggregate Bond (LBAB) Index is an unmanaged index used as a general measure of market performance. Calculations assume dividends and capital gains are reinvested and do not include any managerial expenses. From inception, calculation is based on life of Class A shares. You cannot invest directly in an index.
The performance data presented represents past performance; future results may vary. Performance data does not reflect the deduction of taxes that would be paid on fund distributions or the redemption of fund shares. Investment return and principal value will fluctuate so that an investor’s shares, when redeemed, may be worth more or less than their original cost.
Current performance may be lower or higher than performance quoted. Please see www.transamericaidex.com for performance data current to the most recent month-end.
Public Offering Price (POP) returns include the reinvestment of dividends and capital gains and reflect the maximum sales charge of 4.75% for A shares or the maximum applicable contingent deferred sales charge (5% in the 1st year, decreasing to 0% after 6 years) for Class B shares and 1% (during the first 12 months) for Class C shares. Shares purchased prior to March 1, 2004 are subject to a maximum applicable contingent deferred sales charge (5% in the 1st year, decreasing to 0% after 7 years) for Class B shares and (2% in the 1st year, decreasing to 0% after 2 years) for Class C shares.
Net Asset Value (NAV) returns include the reinvestment of dividends and capital gains but do not reflect any sales charges.
This material must be preceded or accompanied by a current prospectus, which includes specific contents regarding the investment objectives and policies of this Fund. This Fund is closed to new investments.
56
UNDERSTANDING YOUR FUNDS EXPENSES
(unaudited)
SHAREHOLDER EXPENSES
Fund shareholders may incur two types of costs: (1) transaction costs, including sales charges (loads) on purchases, contingent deferred sales charges on redemptions and redemption fees; and (2) ongoing costs, including management fees, 12b-1 distribution and service fees, and other fund expenses.
The following Example is intended to help you understand your ongoing costs (in dollars and cents) of investing in the Fund and to compare these costs with the ongoing costs of investing in other funds.
The Example is based on an investment of $1,000 invested at May 1, 2007 and held for the entire period until October 31, 2007.
ACTUAL EXPENSES
The first line in the table below provides information about actual account values and actual expenses. You may use the information in this line, together with the amount you invested, to estimate the expenses that you paid over the period. Simply divide your account value by $1,000 (for example, an $8,600 account value divided by $1,000 = 8.6), then multiply the result by the number in the first line of your Fund under the heading entitled “Expenses Paid During Period” to estimate the expenses you paid on your account during this period. If your account is an IRA, your expenses could have included a $15 annual fee. The amount of any fee paid through your account would increase the estimate of expenses you paid during the period and decrease your ending account value.
HYPOTHETICAL EXAMPLE FOR COMPARISON PURPOSES
The second line in the table below provides information about hypothetical account values and hypothetical expenses based on the Fund’s actual expense ratio and an assumed rate of return of 5% per year before expenses, which is not the Fund’s actual return. The hypothetical account values and expenses may not be used to estimate the actual ending account balance or expenses you paid for the period. You may use this information to compare the ongoing costs of investing in your Fund and other funds. To do so, compare this 5% hypothetical example with the 5% hypothetical examples that appear in the shareholder reports of the other funds. As in the case of the actual expense example, if your account is subject to an IRA fee, the amount of the fee paid through your account would increase the hypothetical expenses you would have paid during the period and decrease the hypothetical ending account value.
Please note that the expenses shown in the table are meant to highlight your ongoing costs only and do not reflect any transactional costs, such as sales charges, redemption fees, brokerage commissions paid on purchases and sales of fund shares. Therefore, the second line under the Fund in the table is useful in comparing ongoing costs only, and will not help you determine the relative total costs of owning different funds. If any of these transaction costs were included, your costs would be higher. The expenses shown in the table do not reflect any fees that may be charged to you by brokers, financial intermediaries or other financial institutions.
| | Beginning | | Ending | | Annualized | | Expenses | |
| | Account | | Account | | Expense | | Paid During | |
| | Value | | Value | | Ratio | | Period (a) | |
Class A | | | | | | | | | |
Actual | | $ | 1,000.00 | | $ | 1,035.03 | | 1.05 | % | $ | 5.41 | |
Hypothetical (b) | | 1,000.00 | | 1,019.82 | | 1.05 | | 5.36 | |
| | | | | | | | | |
Class B | | | | | | | | | |
Actual | | 1,000.00 | | 1,035.38 | | 0.98 | | 5.01 | |
Hypothetical (b) | | 1,000.00 | | 1,020.21 | | 0.98 | | 4.97 | |
| | | | | | | | | |
Class C | | | | | | | | | |
Actual | | 1,000.00 | | 1,035.67 | | 0.95 | | 4.87 | |
Hypothetical (b) | | 1,000.00 | | 1,020.35 | | 0.95 | | 4.84 | |
| | | | | | | | | |
Class I | | | | | | | | | |
Actual | | 1,000.00 | | 1,036.76 | | 0.75 | | 3.87 | |
Hypothetical (b) | | 1,000.00 | | 1,021.34 | | 0.75 | | 3.84 | |
| | | | | | | | | | | | |
(a) Expenses are calculated using the Fund’s annualized expense ratio (as disclosed in the table), multiplied by the average account value for the period, multiplied by the number of days in the period (184 days), and divided by the number of days in the year (365 days).
(b) 5% return per year before expenses.
GRAPHICAL PRESENTATION OF SCHEDULE OF INVESTMENTS
By Asset Type
At October 31, 2007
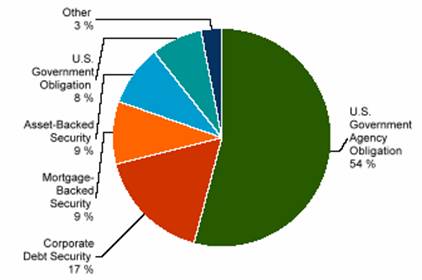
This chart shows the percentage breakdown by Asset Type of the Fund’s total investment securities.
57
SCHEDULE OF INVESTMENTS
At October 31, 2007
(all amounts in thousands)
| | Principal | | Value | |
U.S. GOVERNMENT OBLIGATIONS (10.1%) | | | | | |
U.S. Treasury Bond | | | | | |
4.75%, due 02/15/2037 | | $ | 6,700 | | $ | 6,696 | |
5.00%, due 05/15/2037 | | 2,500 | | 2,600 | |
8.88%, due 08/15/2017 | | 11,300 | | 15,147 | |
U.S. Treasury Inflation Indexed Bond, TIPS | | | | | |
2.38%, due 01/15/2025 – 01/15/2027 ^ | | 4,212 | | 4,319 | |
U.S. Treasury Inflation Indexed Note, TIPS | | | | | |
0.88%, due 04/15/2010 ^ | | 5,268 | | 5,147 | |
2.00%, due 07/15/2014 ^ | | 1,765 | | 1,764 | |
2.38%, due 04/15/2011 ^ (1) | | 3,666 | | 3,724 | |
2.63%, due 07/15/2017 ^ | | 5,016 | | 5,241 | |
U.S. Treasury Note | | | | | |
4.63%, due 02/15/2017 | | 11,400 | | 11,548 | |
Total U.S. Government Obligations (cost $55,634) | | | | 56,186 | |
| | | | | |
U.S. GOVERNMENT AGENCY OBLIGATIONS (72.3%) | | | | | |
Fannie Mae | | | | | |
1.97%, due 07/25/2034 §, (2) | | 3,863 | | 240 | |
3.98%, due 11/01/2033 * | | 478 | | 480 | |
4.00%, due 07/01/2015 | | 2,922 | | 2,856 | |
4.16%, due 03/01/2034 * | | 810 | | 802 | |
4.71%, due 09/01/2035 * | | 1,668 | | 1,662 | |
4.74%, due 07/01/2035 * | | 1,293 | | 1,288 | |
5.00%, due 06/01/2013 – 10/01/2037 | | 36,234 | | 35,070 | |
5.47%, due 06/01/2037 | | 10,461 | | 10,528 | |
5.48%, due 09/25/2042 * | | 722 | | 694 | |
5.50%, due 07/01/2016 – 09/01/2037 | | 88,717 | | 87,594 | |
6.13%, due 03/01/2044 – 10/01/2044 * | | 3,816 | | 3,863 | |
6.30%, due 10/17/2038 | | 2,584 | | 2,594 | |
Fannie Mae , Convertible | | | | | |
7.07%, due 01/01/2026 * | | 8 | | 8 | |
7.16%, due 01/01/2028 * | | 80 | | 80 | |
Fannie Mae , TBA | | | | | |
5.00%, due 11/01/2035 | | 11,000 | | 10,556 | |
5.50%, due 11/01/2022 – 11/01/2037 | | 108,710 | | 107,271 | |
6.00%, due 11/01/2037 | | 22,000 | | 22,158 | |
Freddie Mac | | | | | |
4.00%, due 05/01/2014 | | 931 | | 909 | |
4.11%, due 11/01/2033 * | | 445 | | 449 | |
4.18%, due 03/01/2034 * | | 538 | | 541 | |
4.24%, due 03/01/2034 * | | 431 | | 433 | |
4.50%, due 06/15/2017 – 09/15/2018 | | 4,558 | | 4,491 | |
4.75%, due 09/01/2035 * | | 1,399 | | 1,394 | |
5.00%, due 02/15/2020 – 04/15/2030 | | 29,777 | | 29,709 | |
5.09%, due 01/01/2036 * | | 6,643 | | 6,697 | |
5.32%, due 09/01/2035 * | | 1,187 | | 1,194 | |
5.50%, due 03/15/2017 – 09/01/2037 | | 33,178 | | 32,672 | |
6.21%, due 10/25/2044 * | | 801 | | 807 | |
6.50%, due 04/15/2029 – 07/25/2043 | | 47 | | 48 | |
Freddie Mac, TBA | | | | | |
5.50%, due 11/01/2037 | | 32,000 | | 31,500 | |
Ginnie Mae | | | | | |
0.81%, due 04/16/2033 – 10/16/2033 §, (2) | | 3,602 | | 194 | |
0.85%, due 08/16/2033 §, (2) | | 4,619 | | 242 | |
1.10%, due 09/20/2034 §, (2) | | $ | 3,354 | | $ | 194 | |
5.50%, due 03/15/2032 – 05/15/2036 | | 2,823 | | 2,807 | |
6.38%, due 05/20/2024 * | | 79 | | 79 | |
6.50%, due 07/15/2023 – 06/20/2032 | | 375 | | 387 | |
Total U.S. Government Agency Obligations (cost $401,558) | | | | 402,491 | |
| | | | | |
FOREIGN GOVERNMENT OBLIGATIONS (0.2%) | | | | | |
Hong Kong Government -144A | | | | | |
5.13%, due 08/01/2014 | | 400 | | 399 | |
Korea Expressway Corp. -144A | | | | | |
5.13%, due 05/20/2015 | | 200 | | 195 | |
Malaysia Government | | | | | |
7.50%, due 07/15/2011 | | 10 | | 11 | |
Republic of Brazil | | | | | |
10.25%, due 01/10/2028 | | 1,000 | | 578 | |
Republic of South Africa | | | | | |
5.25%, due 05/16/2013 | | 90 | | 131 | |
Total Foreign Government Obligations (cost $1,169) | | | | 1,314 | |
| | | | | |
MORTGAGE-BACKED SECURITIES (12.4%) | | | | | |
Banc of America Funding Corp. | | | | | |
Series 2005-D, Class A1 | | | | | |
4.11%, due 05/25/2035 * | | 1,722 | | 1,694 | |
Banc of America Funding Corp. | | | | | |
Series 2006-J, Class 4A1 | | | | | |
6.14%, due 01/20/2047 | | 180 | | 180 | |
Bear Stearns Adjustable Rate Mortgage Trust | | | | | |
Series 2003-5, Class 2A1 | | | | | |
4.54%, due 08/25/2033 | | 2,233 | | 2,176 | |
Bear Stearns Adjustable Rate Mortgage Trust | | | | | |
Series 2003-8, Class 2A1 | | | | | |
4.78%, due 01/25/2034 * | | 47 | | 48 | |
Bear Stearns Adjustable Rate Mortgage Trust | | | | | |
Series 2003-8, Class 4A1 | | | | | |
4.61%, due 01/25/2034 | | 83 | | 83 | |
Bear Stearns Adjustable Rate Mortgage Trust | | | | | |
Series 2005-2, Class A2 | | | | | |
4.13%, due 03/25/2035 * | | 2,426 | | 2,382 | |
Bear Stearns Adjustable Rate Mortgage Trust | | | | | |
Series 2005-5, Class A2 | | | | | |
4.55%, due 08/25/2035 * | | 573 | | 566 | |
Bear Stearns Adjustable Rate Mortgage Trust | | | | | |
Series 2005-9, Class A1 | | | | | |
4.63%, due 10/25/2035 * | | 876 | | 862 | |
Bear Stearns Alt-A Trust | | | | | |
Series 2005-7, Class 22A1 | | | | | |
5.51%, due 09/25/2035 | | 465 | | 465 | |
Bear Stearns Alt-A Trust | | | | | |
Series 2006-6, Class 32A1 | | | | | |
5.82%, due 11/25/2036 | | 545 | | 547 | |
Bear Stearns Structured Products, Inc. | | | | | |
5.68%, due 01/26/2036 | | 488 | | 487 | |
CC Mortgage Funding Corp. -144A | | | | | |
Series 2004-3A, Class A1 | | | | | |
5.38%, due 08/25/2035 | | 476 | | 471 | |
58
| | Principal | | Value | |
Citigroup Commercial Mortgage Trust | | | | | |
Series 2006-FL2, Class A1-144A | | | | | |
5.82%, due 08/15/2021 | | $ | 249 | | $ | 248 | |
Citigroup Mortgage Loan Trust, Inc. | | | | | |
Series 2005-6, Class A2 | | | | | |
4.25%, due 08/25/2035 * | | 636 | | 622 | |
Citigroup Mortgage Loan Trust, Inc. | | | | | |
Series 2006-AR1, Class 1A1 | | | | | |
4.90%, due 10/25/2035 * | | 1,743 | | 1,735 | |
Countrywide Alternative Loan Trust | | | | | |
Series 2003-J1, Class 4A1 | | | | | |
6.00%, due 10/25/2032 | | 12 | | 12 | |
Countrywide Alternative Loan Trust | | | | | |
Series 2005-11CB, Class 2A8 | | | | | |
4.50%, due 06/25/2035 | | 473 | | 469 | |
Countrywide Alternative Loan Trust | | | | | |
Series 2005-81, Class A1 | | | | | |
5.41%, due 02/25/2037 * | | 814 | | 790 | |
Countrywide Alternative Loan Trust | | | | | |
Series 2007-HY4, Class 1A1 | | | | | |
5.51%, due 06/25/2037 | | 1,588 | | 1,587 | |
Countrywide Alternative Loan Trust | | | | | |
Series 2007-OA6, Class A1B | | | | | |
5.33%, due 06/25/2037 | | 1,599 | | 1,558 | |
Countrywide Home Loan Mortgage | | | | | |
Pass-Through Trust | | | | | |
Series 2002-30, Class M | | | | | |
3.85%, due 10/19/2032 * | | 40 | | 40 | |
Countrywide Home Loan Mortgage | | | | | |
Pass-Through Trust | | | | | |
Series 2004-12, Class 12A1 | | | | | |
4.71%, due 08/25/2034 | | 804 | | 804 | |
Countrywide Home Loan Mortgage | | | | | |
Pass-Through Trust | | | | | |
Series 2004-7, Class 5A2 | | | | | |
5.40%, due 05/25/2034 * | | 2 | | 2 | |
Countrywide Home Loan Mortgage Pass-Through Trust | | | | | |
Series 2004-R1, Class 2A-144A | | | | | |
6.50%, due 11/25/2034 | | 987 | | 1,019 | |
Countrywide Home Loan Mortgage Pass-Through Trust | | | | | |
Series 2005-R2, Class 1AF1 | | | | | |
5.47%, due 06/25/2035 | | 2,820 | | 2,758 | |
Credit Suisse First Boston Mortgage Securities Corp. | | | | | |
Series 2002-P1A, Class A | | | | | |
5.95%, due 03/25/2032 | | 2 | | 2 | |
CS First Boston Mortgage Securities Corp. | | | | | |
Series 2003-AR15, Class 2A1 | | | | | |
4.22%, due 06/25/2033 | | 2,660 | | 2,643 | |
DaimlerChrysler Finco Term | | | | | |
5.00%, due 08/03/2014 4 | | 2,000 | | 2,000 | |
Deutsche Alt-A Securities, Inc. Alternate Loan Trust | | | | | |
Series 2006-AR6, Class A1 | | | | | |
5.21%, due 02/25/2037 | | 974 | | 970 | |
Deutsche Alt-A Securities, Inc. Alternate Loan Trust | | | | | |
Series 2007-AR1, Class A3B | | | | | |
5.20%, due 01/25/2047 | | 1,269 | | 1,264 | |
First Horizon Asset Securities, Inc. | | | | | |
Series 2005-AR3, Class 2A1 | | | | | |
5.37%, due 08/25/2035 * | | $ | 132 | | $ | 131 | |
GS Mortgage Securities Corp. II | | | | | |
Series 1998-C1, Class A2 | | | | | |
6.62%, due 10/18/2030 | | 950 | | 953 | |
GS Mortgage Securities Corp. II | | | | | |
Series 2007-EOP, Class A1-144A | | | | | |
4.77%, due 03/06/2020 * | | 928 | | 920 | |
GSR Mortgage Loan Trust | | | | | |
Series 2005-AR6, Class 2A1 | | | | | |
4.54%, due 09/25/2035 * | | 256 | | 254 | |
Harborview Mortgage Loan Trust | | | | | |
Series 2006-1, Class 2A1A | | | | | |
5.74%, due 03/19/2037 * | | 2,186 | | 2,148 | |
Harborview Mortgage Loan Trust | | | | | |
Series 2006-12, Class 2A11 | | | | | |
5.59%, due 01/19/2038 | | 748 | | 745 | |
Harborview Mortgage Loan Trust | | | | | |
Series 2006-12, Class 2A2A | | | | | |
5.69%, due 01/19/2038 | | 1,096 | | 1,075 | |
Harborview Mortgage Loan Trust | | | | | |
Series 2007-1, Class 2A1A | | | | | |
5.15%, due 04/19/2038 * | | 1,668 | | 1,637 | |
HCA, Inc. | | | | | |
7.45%, due 11/18/2013 (4) | | 1,489 | | 1,453 | |
Health Management Associates Inc. | | | | | |
7.10%, due 01/16/2014 * § 4 | | 1,095 | | 1,050 | |
IndyMac Index Mortgage Loan Trust | | | | | |
Series 2004-AR11, Class 2A | | | | | |
5.05%, due 12/25/2034 | | 77 | | 77 | |
IndyMac Index Mortgage Loan Trust | | | | | |
Series 2006-AR14, Class 1A1A | | | | | |
5.22%, due 11/25/2046 | | 837 | | 833 | |
JPMorgan Mortgage Trust | | | | | |
Series 2005-A1, Class 6T1 | | | | | |
5.02%, due 02/25/2035 * | | 485 | | 471 | |
JPMorgan Mortgage Trust | | | | | |
Series 2007-A1, Class 5A5 | | | | | |
4.77%, due 07/25/2035 * | | 1,777 | | 1,761 | |
Mellon Residential Funding Corp. | | | | | |
Series 2000-TBC3, Class A1 | | | | | |
5.79%, due 12/15/2030 | | 686 | | 673 | |
Merrill Lynch Mortgage Investors, Inc. | | | | | |
Series 2005-A10, Class A | | | | | |
5.34%, due 02/25/2036 * | | 256 | | 253 | |
MID-State Trust | | | | | |
Series 4, Class A | | | | | |
8.33%, due 04/01/2030 | | 358 | | 360 | |
Mlcc Mortgage Investors, Inc. | | | | | |
Series 2005-2, Class 3A | | | | | |
6.13%, due 10/25/2035 * | | 68 | | 67 | |
Mlcc Mortgage Investors, Inc. | | | | | |
Series 2005-3, Class 4A | | | | | |
5.38%, due 11/25/2035 * | | 88 | | 87 | |
59
| | Principal | | Value | |
Morgan Stanley Capital I | | | | | |
Series 2007-XLFA, Class A1-144A | | | | | |
5.81%, due 10/15/2020 * | | $ | 1,317 | | $ | 1,312 | |
Residential Accredit Loans, Inc. | | | | | |
Series 2006-QO3, Class A1 | | | | | |
5.34%, due 04/25/2046 | | 793 | | 773 | |
Residential Accredit Loans, Inc. | | | | | |
Series 2006-QO7, Class 3A1 | | | | | |
5.23%, due 09/25/2046 * | | 806 | | 791 | |
Residential Funding Mortgage Securities I | | | | | |
Series 2003-S9, Class A1 | | | | | |
6.50%, due 03/25/2032 | | 11 | | 11 | |
Sequoia Mortgage Trust | | | | | |
Series 10, Class 2A1 | | | | | |
5.88%, due 10/20/2027 * | | 60 | | 60 | |
SLM Corp. Bridge Loan | | | | | |
6.00%, due 06/30/2008 § (4) | | 1,900 | | 1,893 | |
Structured Adjustable Rate Mortgage Loan Trust | | | | | |
Series 2004-19, Class 2A1 | | | | | |
6.38%, due 01/25/2035 | | 299 | | 300 | |
Structured Asset Mortgage Investments, Inc. | | | | | |
Series 2002-AR3, Class A1 | | | | | |
5.83%, due 09/19/2032 * | | 36 | | 36 | |
Structured Asset Mortgage Investments, Inc. | | | | | |
Series 2005-AR5, Class A1 | | | | | |
5.75%, due 07/19/2035 * | | 54 | | 54 | |
Structured Asset Mortgage Investments, Inc. | | | | | |
Series 2005-AR5, Class A2 | | | | | |
5.75%, due 07/19/2035 * | | 109 | | 108 | |
Structured Asset Mortgage Investments, Inc. | | | | | |
Series 2005-AR5, Class A3 | | | | | |
5.75%, due 07/19/2035 * | | 186 | | 183 | |
Structured Asset Mortgage Investments, Inc. | | | | | |
Series 2005-AR8, Class A1A | | | | | |
5.41%, due 02/25/2036 * | | 782 | | 754 | |
Structured Asset Mortgage Investments, Inc. | | | | | |
Series 2006-AR3, Class 12A1 | | | | | |
5.35%, due 05/25/2036 * | | 890 | | 874 | |
Structured Asset Securities Corp. | | | | | |
Series 2003-22A, Class 2A1 | | | | | |
4.08%, due 06/25/2033 | | 2,390 | | 2,365 | |
TBW Mortgage Backed Pass-Through Certificates | | | | | |
Series 2006-6, Class A1 | | | | | |
4.98%, due 01/25/2037 * | | 973 | | 970 | |
Thornburg Mortgage Securities Trust | | | | | |
Series 2006-6, Class A1 | | | | | |
5.24%, due 11/25/2046 | | 1,198 | | 1,183 | |
Wachovia Bank Commercial Mortgage Trust | | | | | |
Series 2002-C1, Class A2 | | | | | |
5.68%, due 04/15/2034 | | 281 | | 281 | |
Wachovia Bank Commercial Mortgage Trust | | | | | |
Series 2006-WL7A, Class A1-144A | | | | | |
5.84%, due 09/15/2021 * | | 1,456 | | 1,451 | |
WAMU Mortgage Pass Through Certificates | | | | | |
Series 2006-AR9, Class 2A | | | | | |
5.86%, due 08/25/2046 * | | 839 | | 838 | |
WAMU Mortgage Pass-Through Certificates | | | | | |
Series 2002-AR2, Class A | | | | | |
5.53%, due 02/27/2034 * | | $ | 34 | | $ | 34 | |
WAMU Mortgage Pass-Through Certificates | | | | | |
Series 2002-AR9, Class 1A | | | | | |
6.38%, due 08/25/2042 | | 22 | | 22 | |
WAMU Mortgage Pass-Through Certificates | | | | | |
Series 2003-AR5, Class A7 | | | | | |
4.21%, due 06/25/2033 | | 1,909 | | 1,895 | |
WAMU Mortgage Pass-Through Certificates | | | | | |
Series 2003-AR9, Class 2A | | | | | |
4.05%, due 09/25/2033 * | | 3,014 | | 2,991 | |
WAMU Mortgage Pass-Through Certificates | | | | | |
Series 2003-R1, Class A1 | | | | | |
5.67%, due 12/25/2027 * | | 1,265 | | 1,265 | |
WAMU Mortgage Pass-Through Certificates | | | | | |
Series 2006-AR19, Class 1A1A | | | | | |
5.71%, due 01/25/2047 * | | 1,351 | | 1,337 | |
Wells Fargo Mortgage Backed Securities Trust | | | | | |
Series 2003-13, Class A5 | | | | | |
4.50%, due 11/25/2018 | | 761 | | 743 | |
Wells Fargo Mortgage Backed Securities Trust | | | | | |
Series 2004-CC, Class A1 | | | | | |
4.95%, due 01/25/2035 * | | 602 | | 590 | |
Wells Fargo Mortgage Backed Securities Trust | | | | | |
Series 2006-AR11, Class A2 | | | | | |
5.52%, due 08/25/2036 | | 450 | | 447 | |
Wells Fargo Mortgage Backed Securities Trust | | | | | |
Series 2006-AR8, Class 2A4 | | | | | |
5.24%, due 04/25/2036 | | 2,190 | | 2,186 | |
Total Mortgage-Backed Securities (cost $69,291) | | | | 69,179 | |
60
| | Principal | | Value | |
ASSET-BACKED SECURITIES (12.0%) | | | | | |
Accredited Mortgage Loan Trust | | | | | |
Series 2007-1, Class A1 | | | | | |
5.18%, due 02/25/2037 | | $ | 1,507 | | $ | 1,487 | |
ACE Securities Corp. | | | | | |
Series 2006-NC1, Class A2A | | | | | |
5.20%, due 12/25/2035 | | 178 | | 178 | |
ACE Securities Corp. | | | | | |
Series 2006-NC1, Class A2B | | | | | |
5.28%, due 12/25/2035 | | 1,100 | | 1,085 | |
ACE Securities Corp. | | | | | |
Series 2006-NC3, Class A2A | | | | | |
5.18%, due 12/25/2036 | | 537 | | 530 | |
American Express Credit Account Master Trust | | | | | |
Series 2005-3, Class A | | | | | |
5.75%, due 01/18/2011 * | | 2,400 | | 2,399 | |
Amortizing Residential Collateral Trust | | | | | |
Series 2002-BC4, Class A | | | | | |
5.42%, due 07/25/2032 * | | 4 | | 4 | |
Argent Securities, Inc. | | | | | |
Series 2006-M3, Class A2A | | | | | |
5.18%, due 10/25/2036 | | 687 | | 680 | |
Argent Securities, Inc. | | | | | |
Series 2006-W1, Class A2A | | | | | |
5.21%, due 03/25/2036 | | 125 | | 124 | |
Asset Backed Funding Certificates | | | | | |
Series 2004-OPT5, Class A1 | | | | | |
5.48%, due 06/25/2034 | | 406 | | 396 | |
Asset Backed Funding Certificates | | | | | |
Series 2006-HE1, Class A2A | | | | | |
5.19%, due 01/25/2037 * | | 1,012 | | 1,000 | |
Asset Backed Funding Certificates | | | | | |
Series 2006-OPT2, Class A3A | | | | | |
5.19%, due 10/25/2036 | | 600 | | 595 | |
Aurum CLO | | | | | |
Series 2002-1A, Class A1-144A | | | | | |
5.79%, due 04/15/2014 * | | 1,771 | | 1,762 | |
Bear Stearns Asset Backed Securities Trust | | | | | |
Series 2002-2, Class A1 | | | | | |
5.46%, due 10/25/2032 * | | 32 | | 32 | |
Bear Stearns Asset Backed Securities Trust | | | | | |
Series 2006-SD4, Class 1A1 | | | | | |
5.49%, due 10/25/2036 | | 1,384 | | 1,377 | |
Bear Stearns Asset Backed Securities Trust | | | | | |
Series 2007-AQ1, Class A1 | | | | | |
5.24%, due 11/25/2036 | | 1,675 | | 1,657 | |
Carrington Mortgage Loan Trust | | | | | |
Series 2006-NC4, Class A1 | | | | | |
5.18%, due 10/25/2036 | | 985 | | 977 | |
Citigroup Mortgage Loan Trust, Inc. | | | | | |
Series 2006-WFH3, Class A1 | | | | | |
5.18%, due 10/25/2036 * | | 606 | | 601 | |
Citigroup Mortgage Loan Trust, Inc. | | | | | |
Series 2006-WFH3, Class A2 | | | | | |
5.23%, due 10/25/2036 * | | 1,300 | | 1,267 | |
Citigroup Mortgage Loan Trust, Inc. | | | | | |
Series 2006-WMC1, Class A2A | | | | | |
5.21%, due 12/25/2035 | | 102 | | 101 | |
Citigroup Mortgage Loan Trust, Inc. | | | | | |
Series 2007-AHL1, Class A2A | | | | | |
5.17%, due 12/25/2036 * | | $ | 1,785 | | $ | 1,754 | |
Countrywide Asset-Backed Certificates | | | | | |
Series 2006-1, Class AF1 | | | | | |
5.26%, due 07/25/2036 | | 50 | | 50 | |
Countrywide Asset-Backed Certificates | | | | | |
Series 2006-23, Class 2A1 | | | | | |
5.18%, due 05/25/2037 | | 2,193 | | 2,167 | |
Countrywide Asset-Backed Certificates | | | | | |
Series 2006-26, Class 2A1 | | | | | |
5.21%, due 06/25/2037 | | 1,595 | | 1,576 | |
Countrywide Asset-Backed Certificates | | | | | |
Series 2006-SD1, Class A1-144A | | | | | |
5.29%, due 02/25/2036 * | | 239 | | 237 | |
Countrywide Asset-Backed Certificates | | | | | |
Series 2007-1, Class 2A1 | | | | | |
5.18%, due 07/25/2037 | | 1,768 | | 1,746 | |
Countrywide Asset-Backed Certificates | | | | | |
Series 2007-7, Class 2A1 | | | | | |
5.21%, due 10/25/2037 | | 348 | | 344 | |
Credit-Based Asset Servicing And Securitization LLC | | | | | |
Series 2007-CB1, Class AF1A | | | | | |
5.01%, due 01/25/2037 | | 1,706 | | 1,682 | |
Credit-Based Asset Servicing And Securitization LLC | | | | | |
Series 2007-SP1, Class A1 | | | | | |
5.22%, due 12/25/2037 | | 1,324 | | 1,312 | |
First Franklin Mortgage Loan Asset Backed Certificates | | | | | |
Series 2005-FF1, Class A2C | | | | | |
5.50%, due 12/25/2034 | | 581 | | 576 | |
First Franklin Mortgage Loan Asset Backed Certificates | | | | | |
Series 2007-FF1, Class A2A | | | | | |
5.17%, due 01/25/2038 | | 1,540 | | 1,522 | |
Fremont Home Loan Trust | | | | | |
Series 2006-E, Class 2A1 | | | | | |
5.19%, due 01/25/2037 | | 1,176 | | 1,158 | |
GSAMP Trust | | | | | |
Series 2006-S2, Class A1A | | | | | |
5.20%, due 01/25/2036 | | 175 | | 172 | |
HFC Home Equity Loan Asset Backed Certificates | | | | | |
Series 2006-4, Class A1V | | | | | |
5.57%, due 03/20/2036 | | 334 | | 331 | |
Home Equity Asset Trust | | | | | |
Series 2002-1, Class A4 | | | | | |
5.73%, due 11/25/2032 * | | 1 | | 1 | |
Honda Auto Receivables Owner Trust | | | | | |
Series 2007-1, Class A1 | | | | | |
5.32%, due 03/18/2008 | | 308 | | 308 | |
HSI Asset Securitization Corp. Trust | | | | | |
Series 2006-OPT1, Class 2A1 | | | | | |
5.21%, due 12/25/2035 | | 193 | | 192 | |
HSI Asset Securitization Corp. Trust | | | | | |
Series 2007-OPT1, Class 2A1 | | | | | |
5.18%, due 12/25/2036 | | 1,559 | | 1,545 | |
IndyMac Residential Asset Backed Trust | | | | | |
Series 2006-A, Class A1 | | | | | |
5.22%, due 03/25/2036 | | 168 | | 168 | |
61
| | Principal | | Value | |
JPMorgan Mortgage Acquisition Corp. | | | | | |
Series 2006-CH1, Class A2 | | | | | |
5.18%, due 07/25/2036 | | $ | 560 | | $ | 556 | |
JPMorgan Mortgage Acquisition Corp. | | | | | |
Series 2006-CH2, Class AV2 | | | | | |
5.18%, due 10/25/2036 | | 2,515 | | 2,472 | |
Lehman XS Trust | | | | | |
Series 2006-10N, Class 1A1A | | | | | |
5.21%, due 07/25/2046 * | | 371 | | 370 | |
Lehman XS Trust | | | | | |
Series 2006-16N, Class A1A | | | | | |
5.21%, due 11/25/2046 * | | 803 | | 789 | |
Lehman XS Trust | | | | | |
Series 2006-17, Class WF11 | | | | | |
5.25%, due 11/25/2036 * | | 675 | | 675 | |
Long Beach Mortgage Loan Trust | | | | | |
Series 2006-9, Class 2A1 | | | | | |
5.19%, due 10/25/2036 * | | 837 | | 829 | |
Long Beach Mortgage Loan Trust | | | | | |
Series 2006-WL1, Class 2A1 | | | | | |
5.22%, due 01/25/2046 | | 337 | | 335 | |
Master Asset Backed Securities Trust | | | | | |
Series 2005-NC2, Class A1 | | | | | |
5.24%, due 11/25/2035 | | 57 | | 57 | |
MBNA Credit Card Master Note Trust | | | | | |
Series 2003-A3, Class A3 | | | | | |
5.87%, due 08/16/2010 * | | 2,100 | | 2,101 | |
Merrill Lynch Mortgage Investors, Inc. | | | | | |
Series 2006-FF1, Class A2A | | | | | |
5.20%, due 08/25/2036 * | | 616 | | 611 | |
Morgan Stanley ABS Capital I | | | | | |
Series 2006-HE7, Class A2A | | | | | |
5.18%, due 09/25/2036 * | | 770 | | 762 | |
Morgan Stanley ABS Capital I | | | | | |
Series 2006-HE8, Class A2A | | | | | |
5.18%, due 10/25/2036 | | 940 | | 930 | |
Morgan Stanley ABS Capital I | | | | | |
Series 2007-HE2, Class A2A | | | | | |
5.17%, due 01/25/2037 * | | 1,685 | | 1,660 | |
Morgan Stanley ABS Capital I | | | | | |
Series 2007-NC1, Class A2A | | | | | |
5.18%, due 11/25/2036 | | 1,381 | | 1,364 | |
Morgan Stanley Home Equity Loans | | | | | |
Series 2007-1, Class A1 | | | | | |
5.18%, due 12/25/2036 | | 2,533 | | 2,499 | |
Morgan Stanley Mortgage Loan Trust | | | | | |
Series 2007-3XS, Class 2A1A | | | | | |
5.20%, due 01/25/2047 * | | 1,868 | | 1,828 | |
Nationstar Home Equity Loan Trust | | | | | |
Series 2007-A, Class AV1 | | | | | |
5.19%, due 03/25/2037 | | 1,275 | | 1,263 | |
Nelnet Student Loan Trust | | | | | |
Series 2005-2, Class A2 | | | | | |
5.22%, due 12/22/2014 | | 309 | | 309 | |
Newcastle Mortgage Securities Trust | | | | | |
Series 2006-1, Class A1 | | | | | |
5.20%, due 03/25/2036 | | 258 | | 256 | |
Option One Mortgage Loan Trust | | | | | |
Series 2007-1, Class 2A1 | | | | | |
5.18%, due 01/25/2037 | | $ | 1,248 | | $ | 1,234 | |
Park Place Securities, Inc. | | | | | |
Series 2005-WCW1, Class A1B | | | | | |
5.39%, due 09/25/2035 | | 94 | | 94 | |
Quest Trust | | | | | |
Series 2004-X2, Class A1-144A | | | | | |
5.69%, due 06/25/2034 * | | 2 | | 2 | |
Residential Asset Mortgage Products, Inc. | | | | | |
Series 2006-RS1, Class AI1 | | | | | |
5.21%, due 01/25/2036 * | | 47 | | 47 | |
Residential Asset Securities Corp. | | | | | |
Series 2006-EMX1, Class A1 | | | | | |
5.21%, due 01/25/2036 | | 73 | | 73 | |
Residential Asset Securities Corp. | | | | | |
Series 2006-EMX9, Class 1A1 | | | | | |
5.20%, due 11/25/2036 | | 889 | | 879 | |
Residential Asset Securities Corp. | | | | | |
Series 2006-KS5, Class A1 | | | | | |
5.20%, due 07/25/2036 | | 314 | | 313 | |
Residential Asset Securities Corp. | | | | | |
Series 2006-KS9, Class AI1 | | | | | |
5.20%, due 11/25/2036 | | 889 | | 879 | |
Residential Asset Securities Corp. | | | | | |
Series 2007-KS2, Class AI1 | | | | | |
5.20%, due 02/25/2037 | | 2,384 | | 2,349 | |
Saxon Asset Securities Trust | | | | | |
Series 2006-3, Class A1 | | | | | |
5.19%, due 10/25/2046 | | 608 | | 601 | |
SBI Heloc Trust -144A | | | | | |
Series 2006-1A, Class 1A2A | | | | | |
5.30%, due 08/25/2036 | | 122 | | 116 | |
Securitized Asset Backed Receivables LLC Trust | | | | | |
Series 2007-HE1, Class A2A | | | | | |
5.19%, due 12/25/2036 | | 1,490 | | 1,434 | |
SLM Student Loan Trust | | | | | |
Series 2007-1, Class A1 | | | | | |
5.05%, due 04/25/2012 | | 239 | | 239 | |
SLM Student Loan Trust | | | | | |
Series 2007-3, Class A1 | | | | | |
5.35%, due 10/27/2014 | | 1,491 | | 1,491 | |
Small Business Administration | | | | | |
Participation Certificates | | | | | |
Series 2003-20I, Class 1 | | | | | |
5.13%, due 09/01/2023 | | 71 | | 71 | |
Small Business Administration | | | | | |
Participation Certificates | | | | | |
Series 2004-20C, Class 1 | | | | | |
4.34%, due 03/01/2024 | | 457 | | 437 | |
Small Business Administration | | | | | |
Series 2004-P10A, Class 1 | | | | | |
4.50%, due 02/01/2014 | | 201 | | 192 | |
Soundview Home Equity Loan Trust | | | | | |
Series 2006-3, Class A1 | | | | | |
5.17%, due 11/25/2036 * | | 588 | | 586 | |
62
| | Principal | | Value | |
Structured Asset Securities Corp. | | | | | |
Series 2002-HF1, Class A | | | | | |
5.42%, due 01/25/2033 * | | $ | 4 | | $ | 4 | |
Structured Asset Securities Corp. | | | | | |
Series 2006-BC3, Class A2 | | | | | |
5.18%, due 10/25/2036 * | | 838 | | 826 | |
Structured Asset Securities Corp. | | | | | |
Series 2006-BC6, Class A2 | | | | | |
5.21%, due 01/25/2037 | | 1,225 | | 1,204 | |
Wells Fargo Home Equity Trust | | | | | |
Series 2006-3, Class A1 | | | | | |
5.18%, due 01/25/2037 | | 1,144 | | 1,129 | |
Total Asset-Backed Securities (cost $67,747) | | | | 66,959 | |
| | | | | |
LONG-TERM MUNICIPAL BONDS (1.2%) | | | | | |
Municipal Government Obligation (1.2%) | | | | | |
Buckeye Tobacco Settlement Financing | | | | | |
5.88%, due 06/01/2047 | | 600 | | 582 | |
Chicago Board of Education, IL Class A | | | | | |
5.00%, due 12/01/2012 | | 255 | | 271 | |
City of Chicago, IL Series 1287, Class 1287 | | | | | |
7.17%, due 01/01/2014 * -144A | | 2,430 | | 2,464 | |
City of Houston Tx | | | | | |
5.00%, due 11/15/2036 | | 400 | | 414 | |
Tobacco Settlement Finance Authority | | | | | |
7.47%, due 06/01/2047 | | 1,200 | | 1,186 | |
Tobacco Settlement Financing Corp., LA | | | | | |
5.88%, due 05/15/2039 | | 40 | | 40 | |
Tobacco Settlement Financing Corp., VA | | | | | |
5.50%, due 06/01/2026 | | 200 | | 218 | |
Tobacco Settlement Financing Corp./NJ Series 1 | | | | | |
5.00%, due 06/01/2041 | | 1,400 | | 1,200 | |
Tobacco Settlement Financing Corp./VA | | | | | |
5.25%, due 06/01/2019 | | 200 | | 208 | |
Total Long-Term Municipal Bonds (cost $6,480) | | | | 6,583 | |
| | | | | |
CORPORATE DEBT SECURITIES (22.7%) | | | | | |
Airlines (0.1%) | | | | | |
Continental Airlines, Inc. | | | | | |
7.06%, due 09/15/2009 | | 200 | | 204 | |
United Airlines, Inc. | | | | | |
6.20%, due 09/01/2008 | | 116 | | 116 | |
6.60%, due 09/01/2013 | | 51 | | 51 | |
Automobiles (0.4%) | | | | | |
Daimler Finance North America LLC | | | | | |
5.89%, due 10/31/2008 * | | 2,000 | | 1,999 | |
6.05%, due 03/13/2009 * | | 300 | | 300 | |
Capital Markets (2.0%) | | | | | |
Goldman Sachs Group, Inc. (The) | | | | | |
6.25%, due 09/01/2017 | | 4,500 | | 4,577 | |
Lehman Brothers Holdings, Inc. | | | | | |
5.24%, due 10/22/2008 * | | 200 | | 199 | |
5.26%, due 12/23/2008 * | | 1,600 | | 1,586 | |
Merrill Lynch & Co. | | | | | |
6.05%, due 08/15/2012 | | 200 | | 203 | |
Merrill Lynch & Co., Inc. | | | | | |
5.24%, due 12/22/2008 * | | $ | 300 | | $ | 299 | |
5.40%, due 10/23/2008 * | | 1,300 | | 1,295 | |
6.40%, due 08/28/2017 | | 400 | | 403 | |
Morgan Stanley | | | | | |
5.81%, due 10/18/2016 * | | 2,800 | | 2,724 | |
Chemicals (0.1%) | | | | | |
Equistar Chemicals, LP/Equistar | | | | | |
10.13%, due 09/01/2008 | | 354 | | 366 | |
Commercial Banks (8.5%) | | | | | |
Bank of America NA | | | | | |
5.51%, due 02/27/2009 * | | 3,000 | | 2,992 | |
Bank of Ireland | | | | | |
5.61%, due 12/19/2008 * | | 1,600 | | 1,599 | |
Barclays -144A | | | | | |
5.45%, due 09/12/2012 | | 4,100 | | 4,181 | |
7.43%, due (12/15/17) Ž | | 900 | | 954 | |
China Development Bank | | | | | |
5.00%, due 10/15/2015 | | 100 | | 97 | |
Deutsche Bank AG London | | | | | |
6.00%, due 09/01/2017 | | 3,600 | | 3,683 | |
Export-Import Bank of China -144A | | | | | |
5.25%, due 07/29/2014 | | 250 | | 250 | |
Export-Import Bank of Korea -144A | | | | | |
5.46%, due 10/04/2011 * | | 2,500 | | 2,502 | |
Fortis Bank SA/NV | | | | | |
5.07%, due 04/28/2008 * | | 800 | | 799 | |
5.15%, due 09/30/2008 * | | 2,400 | | 2,395 | |
General Electric Capital Corp. | | | | | |
5.43%, due 01/20/2010 * | | 2,000 | | 1,996 | |
5.73%, due 03/12/2010 * | | 2,800 | | 2,792 | |
HSBC Capital Funding LP -144A | | | | | |
10.18%, due 06/30/2030 Ž, (3) | | 150 | | 197 | |
KBC Bank Funding Trust III -144A | | | | | |
9.86%, due 11/29/2049 Ž | | 15 | | 16 | |
Nordea Bank Finland PLC | | | | | |
5.09%, due 12/01/2008 * | | 5,300 | | 5,292 | |
Nordea Bank Finland PLC/New York NY | | | | | |
5.44%, due 05/28/2008 * | | 1,500 | | 1,500 | |
Rabobank Capital Funding II -144A | | | | | |
5.26%, due 12/31/2013 Ž | | 210 | | 201 | |
Rabobank Capital Funding Trust -144A | | | | | |
5.25%, due 10/21/2016 Ž | | 280 | | 263 | |
Rabobank Nederland | | | | | |
0.20%, due 06/20/2008 | | 449,000 | | 3,876 | |
5.38%, due 01/15/2009 * | | 1,100 | | 1,099 | |
Santander US Debt SA Unipersonal -144A | | | | | |
5.42%, due 02/06/2009 * | | 1,100 | | 1,098 | |
5.73%, due 11/20/2009 * | | 1,500 | | 1,494 | |
Skandinaviska Enskilda Banken AB | | | | | |
5.48%, due 08/21/2008 * | | 2,200 | | 2,198 | |
Societe Generale | | | | | |
5.08%, due 03/28/2008 * | | 2,000 | | 2,001 | |
63
| | Principal | | Value | |
Commercial Banks (continued) | | | | | |
Sumitomo Mitsui Banking Corp. -144A | | | | | |
5.63%, due 10/15/2015 Ž, (3) | | $ | 150 | | $ | 140 | |
Unicredit Luxembourg Finance SA -144A | | | | | |
5.41%, due 10/24/2008 * | | 1,300 | | 1,297 | |
Unicredito Italiano/New York NY | | | | | |
5.51%, due 05/29/2008 * | | 1,600 | | 1,599 | |
VTB Capital SA for Vneshtorgbank -144A | | | | | |
5.96%, due 08/01/2008 * | | 700 | | 693 | |
Commercial Services & Supplies (0.0%) | | | | | |
Allied Waste North America, Inc. | | | | | |
7.88%, due 04/15/2013 | | 100 | | 103 | |
Waste Management, Inc. | | | | | |
6.38%, due 11/15/2012 | | 75 | | 78 | |
Communications Equipment (0.0%) | | | | | |
Nortel Networks, Ltd. -144A | | | | | |
10.13%, due 07/15/2013 | | 100 | | 102 | |
Computers & Peripherals (0.5%) | | | | | |
IBM Corp. | | | | | |
5.70%, due 09/14/2017 | | 2,700 | | 2,740 | |
Construction Materials (0.2%) | | | | | |
C8 Capital Spv, Ltd. -144A | | | | | |
6.64%, due 06/30/2049 * Ž | | 1,000 | | 975 | |
Consumer Finance (3.8%) | | | | | |
American Express | | | | | |
6.15%, due 08/28/2017 | | 1,400 | | 1,428 | |
American Honda Finance Corp. | | | | | |
5.78%, due 03/09/2009 * | | 2,000 | | 2,000 | |
Capital One Financial Co. | | | | | |
6.75%, due 09/15/2017 | | 1,500 | | 1,544 | |
Ford Motor Credit | | | | | |
7.88%, due 06/15/2010 | | 200 | | 193 | |
Ford Motor Credit Co. LLC | | | | | |
4.95%, due 01/15/2008 | | 400 | | 398 | |
5.80%, due 01/12/2009 | | 500 | | 482 | |
7.80%, due 06/01/2012 | | 1,100 | | 1,034 | |
GMAC LLC | | | | | |
4.38%, due 12/10/2007 | | 300 | | 299 | |
5.85%, due 01/14/2009 | | 300 | | 289 | |
6.63%, due 05/15/2012 | | 900 | | 808 | |
6.81%, due 05/15/2009 * | | 300 | | 282 | |
7.00%, due 02/01/2012 | | 1,500 | | 1,370 | |
HSBC Finance Corp. | | | | | |
5.78%, due 03/12/2010 * | | 2,400 | | 2,383 | |
HSBC Finance Corp. | | | | | |
5.81%, due 12/05/2008 * | | 2,100 | | 2,097 | |
6.38%, due 10/15/2011 | | 4,500 | | 4,651 | |
SLM Corp. -144A | | | | | |
5.51%, due 04/18/2008 * | | 2,000 | | 1,985 | |
Containers & Packaging (0.0%) | | | | | |
Jefferson Smurfit Corp. US | | | | | |
8.25%, due 10/01/2012 | | 100 | | 100 | |
Diversified Financial Services (1.8%) | | | | | |
C10 Capital Spv, Ltd. , Reg S | | | | | |
6.72%, due 12/31/2016 * Ž | | 1,300 | | 1,252 | |
Citigroup, Inc. | | | | | |
5.24%, due 12/26/2008 * | | 1,500 | | 1,500 | |
General Electric Capital Corp. -144A | | | | | |
6.50%, due 09/15/2067 * | | $ | 1,600 | | $ | 3,344 | |
Petroleum Export, Ltd. -144A | | | | | |
5.27%, due 06/15/2011 | | 140 | | 139 | |
Santander Perpetual SA Unipersonal -144A | | | | | |
6.67%, due 10/24/17 Ž | | 900 | | 896 | |
Williams Cos., Inc. Credit Linked | | | | | |
Certificate Trust (The) -144A | | | | | |
6.75%, due 04/15/2009 § | | 2,600 | | 2,632 | |
Diversified Telecommunication Services (1.2%) | | | | | |
AT&T, Inc. | | | | | |
4.13%, due 09/15/2009 | | 575 | | 566 | |
BellSouth Corp. -144A | | | | | |
4.24%, due 04/26/2008 | | 4,300 | | 4,281 | |
Deutsche Telekom International Finance BV | | | | | |
8.13%, due 05/29/2012 | | 124 | | 201 | |
France Telecom SA , Reg S | | | | | |
6.75%, due 03/14/2008 | | 307 | | 447 | |
KT Corp. -144A | | | | | |
4.88%, due 07/15/2015 | | 200 | | 190 | |
Qwest Capital Funding, Inc. | | | | | |
6.38%, due 07/15/2008 | | 1,000 | | 998 | |
Electric Utilities (0.2%) | | | | | |
Entergy Gulf States, Inc. | | | | | |
5.70%, due 06/01/2015 | | 200 | | 196 | |
Florida Power Corp. | | | | | |
4.80%, due 03/01/2013 | | 450 | | 439 | |
Niagara Mohawk Power Corp. | | | | | |
7.75%, due 10/01/2008 | | 250 | | 256 | |
PSEG Power LLC | | | | | |
6.95%, due 06/01/2012 | | 210 | | 223 | |
Electronic Equipment & Instruments (0.2%) | | | | | |
Koch Forest Products, Inc. | | | | | |
Zero Coupon, due 12/20/2012 * | | 1,000 | | 976 | |
Food & Staples Retailing (0.5%) | | | | | |
Albertsons LLC | | | | | |
6.95%, due 08/01/2009 | | 1,200 | | 1,228 | |
Wal-Mart Stores, Inc. | | | | | |
5.59%, due 06/16/2008 * | | 1,600 | | 1,601 | |
Food Products (0.4%) | | | | | |
Kellogg Co. | | | | | |
6.60%, due 04/01/2011 | | 2,000 | | 2,088 | |
Gas Utilities (0.2%) | | | | | |
Semco Energy, Inc. | | | | | |
7.13%, due 05/15/2008 | | 1,100 | | 1,113 | |
Health Care Providers & Services (0.1%) | | | | | |
HCA, Inc. | | | | | |
9.25%, due 11/15/2016 | | 200 | | 211 | |
Hotels, Restaurants & Leisure (0.3%) | | | | | |
Caesars Entertainment, Inc. | | | | | |
7.50%, due 09/01/2009 | | 350 | | 361 | |
Mandalay Resort Group | | | | | |
6.50%, due 07/31/2009 | | 300 | | 300 | |
Mirage Resorts, Inc. | | | | | |
6.75%, due 02/01/2008 | | 1,000 | | 1,000 | |
64
| | Principal | | Value | |
Independent Power Producers & Energy Traders (0.1%) | | | | | |
NRG Energy, Inc. | | | | | |
7.25%, due 02/01/2014 | | $ | 600 | | $ | 600 | |
7.38%, due 02/01/2016 | | 100 | | 100 | |
Insurance (0.4%) | | | | | |
American International Group, Inc. -144A | | | | | |
5.21%, due 06/23/2008 * | | 2,300 | | 2,301 | |
Media (0.0%) | | | | | |
Time Warner, Inc. | | | | | |
6.88%, due 05/01/2012 | | 20 | | 21 | |
Office Electronics (0.2%) | | | | | |
Xerox Corp. | | | | | |
9.75%, due 01/15/2009 | | 1,100 | | 1,155 | |
Oil, Gas & Consumable Fuels (0.3%) | | | | | |
Chesapeake Energy Corp. | | | | | |
7.00%, due 08/15/2014 | | 100 | | 101 | |
Dynegy Holdings, Inc. -144A | | | | | |
7.50%, due 06/01/2015 | | 200 | | 191 | |
El Paso Natural Gas | | | | | |
7.00%, due 06/15/2017 | | 100 | | 100 | |
Enterprise Products Operating, LP | | | | | |
4.95%, due 06/01/2010 | | 100 | | 99 | |
GAZ Capital for Gazprom, Reg S | | | | | |
8.63%, due 04/28/2034 | | 500 | | 634 | |
Ras Laffan Liquefied Natural Gas Co., Ltd. -144A | | | | | |
3.44%, due 09/15/2009 | | 39 | | 39 | |
Sonat, Inc. | | | | | |
7.63%, due 07/15/2011 | | 370 | | 381 | |
Southern Natural Gas Co. | | | | | |
8.00%, due 03/01/2032 | | 100 | | 114 | |
Williams Cos. | | | | | |
7.50%, due 01/15/2031 | | 100 | | 106 | |
Real Estate Investment Trusts (0.4%) | | | | | |
Ventas Realty, LP/Ventas Capital Corp. | | | | | |
6.75%, due 06/01/2010 | | 1,500 | | 1,507 | |
8.75%, due 05/01/2009 | | 700 | | 721 | |
Thrifts & Mortgage Finance (0.6%) | | | | | |
Nykredit Realkredit A/S | | | | | |
5.00%, due 10/01/2038 * | | 5,764 | | 1,074 | |
Realkredit Danmark A/S | | | | | |
5.00%, due 10/01/2038 * | | 11,545 | | 2,145 | |
Tobacco (0.2%) | | | | | |
Reynolds American, Inc. | | | | | |
7.63%, due 06/01/2016 | | 200 | | 216 | |
7.75%, due 06/01/2018 | | 1,000 | | 1,085 | |
Wireless Telecommunication Services (0.0%) | | | | | |
AT&T Mobility LLC | | | | | |
6.50%, due 12/15/2011 | | 180 | | 189 | |
Total Corporate Debt Securities (cost $125,336) | | | | 126,184 | |
| | | | | | | |
| | Shares | | Value | |
PREFERRED STOCKS (0.2%) | | | | | |
Thrifts & Mortgage Finance (0.2%) | | | | | |
DG Funding Trust -144A ‡* Ź, § | | 119 | | 1,252 | |
Total Preferred Stocks (cost $1,266) | | | | 1,252 | |
| | Principal | | Value | |
CERTIFICATE OF DEPOSIT (1.1%) | | | | | |
Commercial Banks (1.1%) | | | | | |
Barclays | | | | | |
5.71%, due 03/17/2008 * | | $ | 2,800 | | $ | 2,800 | |
Royal Bank of Scotland PLC | | | | | |
5.07%, due 03/26/2008 * | | 1,600 | | 1,600 | |
Societe Generale | | | | | |
5.08%, due 03/26/2008 * | | 1,600 | | 1,600 | |
Total Certificate of Deposit (cost $5,999) | | | | 5,999 | |
| | | | | |
SHORT-TERM U.S. GOVERNMENT OBLIGATIONS (0.5%) | | | | | |
U.S. Treasury Bill | | | | | |
Zero Coupon, due 12/13/2007 | | 3,035 | | 3,022 | |
Total Short-Term U.S. Government Obligations (cost $3,022) | | | | 3,022 | |
| | | | | | | |
| | Contracts (·) | | Value | |
PURCHASED OPTIONS (0.2%) | | | | | |
Covered Call Options (0.1%) | | | | | |
90-Day Euro Dollar Futures | | 184 | | $ | 149 | |
Call Strike $95.25 | | | | | |
Expires 03/17/2008 | | | | | |
90-Day Euro Dollar Futures | | 39 | | 19 | |
Call Strike $95.50 | | | | | |
Expires 03/17/2008 | | | | | |
JPY Currency Future | | 1,500,000 | | 1 | |
Call Strike $121.00 | | | | | |
Expires 01/18/2008 § | | | | | |
JPY Currency Future | | 2,400,000 | | 134 | |
Call Strike $103.80 | | | | | |
Expires 03/17/2010 § | | | | | |
JPY Currency Future | | 2,600,000 | | 143 | |
Call Strike $104.00 | | | | | |
Expires 03/17/2010 § | | | | | |
JPY Currency Future | | 1,900,000 | | 90 | |
Call Strike $105.40 | | | | | |
Expires 03/31/2010 § | | | | | |
US Bond Future | | 590 | | 9 | |
Call Strike $132.00 | | | | | |
Expires 11/20/2007 | | | | | |
IRO Euro | | | | | |
Expires 09/14/2009 § | | 42,600,000 | | 181 | |
| | | | | | |
65
| | Contracts (·) | | Value | |
Put Options (0.1%) | | | | | |
10-Year US Future | | 420 | | $ | 7 | |
Put Strike $98.00 | | | | | |
Expires 11/20/2007 | | | | | |
90-Day Euro Dollar Futures | | 600 | | 4 | |
Put Strike $91.50 | | | | | |
Expires 12/17/2007 | | | | | |
90-Day Euro Dollar Futures | | 221 | | 1 | |
Put Strike $91.75 | | | | | |
Expires 03/17/2008 | | | | | |
90-Day Euro Dollar Futures | | 392 | | 2 | |
Put Strike $93.00 | | | | | |
Expires 03/17/2008 | | | | | |
90-Day Euro Dollar Futures | | 124 | | 1 | |
Put Strike $92.75 | | | | | |
Expires 03/17/2008 | | | | | |
90-Day Euro Dollar Futures | | 409 | | 3 | |
Put Strike $92.50 | | | | | |
Expires 06/16/2008 | | | | | |
JPY Currency Future | | 2,400,000 | | 89 | |
Put Strike $103.80 | | | | | |
Expires 03/17/2010 § | | | | | |
JPY Currency Future | | 2,600,000 | | 98 | |
Put Strike $104.00 | | | | | |
Expires 03/17/2010 § | | | | | |
JPY Currency Future | | 1,900,000 | | 82 | |
Put Strike $105.40 | | | | | |
Expires 03/31/2010 § | | | | | |
Total Purchased Options (cost $1,035) | | | | 1,013 | |
| | | | | | |
| | Notional Amount | | Value | |
PURCHASED SWAPTIONS (0.7%) | | | | | |
Covered Call Options (0.7%) | | | | | |
LIBOR Rate Swaption | | | | | |
Call Strike $5.00 | | | | | |
Expires 12/20/2007 § | | 12,500 | | $ | 112 | |
LIBOR Rate Swaption | | | | | |
Call Strike $4.75 | | | | | |
Expires 02/01/2008 § | | 14,400 | | 45 | |
LIBOR Rate Swaption | | | | | |
Call Strike $5.00 | | | | | |
Expires 02/01/2008 § | | 12,500 | | 119 | |
LIBOR Rate Swaption | | | | | |
Call Strike $4.75 | | | | | |
Expires 03/31/2008 § | | 46,100 | | 322 | |
LIBOR Rate Swaption | | | | | |
Call Strike $4.75 | | | | | |
Expires 09/26/2008 § | | 27,700 | | 225 | |
LIBOR Rate Swaption | | | | | |
Call Strike $4.75 | | | | | |
Expires 09/26/2008 § | | 25,100 | | 204 | |
LIBOR Rate Swaption | | | | | |
Call Strike $4.75 | | | | | |
Expires 12/15/2008 § | | 34,700 | | 285 | |
LIBOR Rate Swaption | | | | | |
Call Strike $5.00 | | | | | |
Expires 12/15/2008 § | | 54,800 | | 596 | |
LIBOR Rate Swaption | | | | | |
Call Strike $5.30 | | | | | |
Expires 08/03/2009 § | | 67,600 | | $ | 898 | |
OTC EURO vs USD Currency | | | | | |
Call Strike $1.36 | | | | | |
Expires 05/19/2008 § | | 2,000 | | 185 | |
OTC EURO vs USD Currency | | | | | |
Call Strike $1.36 | | | | | |
Expires 05/21/2008 § | | 1,000 | | 98 | |
OTC EURO vs USD Currency | | | | | |
Call Strike $1.38 | | | | | |
Expires 05/21/2010 § | | 1,000 | | 99 | |
OTC EURO vs USD Currency | | | | | |
Call Strike $1.38 | | | | | |
Expires 05/21/2010 § | | 1,900 | | 52 | |
OTC EURO vs USD Currency | | | | | |
Call Strike $1.38 | | | | | |
Expires 05/21/2010 § | | 1,900 | | 188 | |
OTC EURO vs USD Currency | | | | | |
Call Strike $1.38 | | | | | |
Expires 06/03/2010 § | | 2,000 | | 198 | |
OTC EURO vs USD Currency | | | | | |
Call Strike $1.38 | | | | | |
Expires 06/03/2010 § | | 2,000 | | 55 | |
Put Options (0.0%) | | | | | |
Fannie Mae TBA Future | | | | | |
Put Strike $83.00 | | | | | |
Expires 11/06/2007 § | | 69,000 | | q | |
OTC EURO vs USD Currency | | | | | |
Put Strike $1.36 | | | | | |
Expires 05/19/2008 § | | 2,000 | | $ | 13 | |
OTC EURO vs USD Currency | | | | | |
Put Strike $1.36 | | | | | |
Expires 05/21/2008 § | | 1,000 | | 6 | |
OTC EURO vs USD Currency | | | | | |
Put Strike $1.38 | | | | | |
Expires 05/21/2010 § | | 1,000 | | 27 | |
Total Purchased Swaptions (cost $2,213) | | | | 3,727 | |
| | | | | |
Total Security Lending Collateral (cost $19,795) ± | | | | 19,795 | |
Total Investment Securities (cost $760,544) # | | | | $ | 763,704 | |
| | Contracts (·) | | Value | |
WRITTEN OPTIONS - 0.1% | | | | | |
10-Year U.S. Treasury Note Future | | 210 | | $ | 154 | |
Expires 2/22/2008 | | | | | |
1-Year EURO Dollar | | 20 | | 10 | |
Expires 3/14/2008 | | | | | |
IRO EURO Swaption | | 13,700,000 | | 185 | |
Expires 9/14/2009 | | | | | |
| | | | | | |
66
| | Contracts (·) | | Value | |
Covered Call Options - 0.0% | | | | | |
1-Year EURO Dollar | | 19 | | $ | 8 | |
Call Strike $95.88 | | | | | |
Expires 3/14/2008 | | | | | |
5-Year U.S. Treasury Note Future | | 110 | | 67 | |
Call Strike $107.00 | | | | | |
Expires 11/20/2007 | | | | | |
90-Day Euro Dollar Future | | 253 | | 82 | |
Call Strike $95.75 | | | | | |
Expires 3/17/2008 | | | | | |
90-Day Euro Dollar Future | | 122 | | 18 | |
Call Strike $96.00 | | | | | |
Expires 3/17/2008 | | | | | |
U.S. Treasury Bond Future | | 39 | | 21 | |
Call Strike $117.00 | | | | | |
Expires 2/22/2008 | | | | | |
Put Options - 0.0% | | | | | |
10-Year U.S. Treasury Note Future | | 210 | | 46 | |
Put Strike $106.00 | | | | | |
Expires 2/22/2008 | | | | | |
| | | | 591 | |
Total Written Options | | | | | |
(premiums: $730) | | | | | |
| | | | | | |
| | Notional Amount | | Value | |
WRITTEN SWAPTIONS - 0.4% | | | | | |
Put Swaptions - 0.0% | | | | | |
LIBOR Rate Swaption | | $ | 3,100 | | $ | 15 | |
Put Strike $1.70 | | | | | |
Expires 11/20/2007 | | | | | |
Covered Call Swaptions - 0.4% | | | | | |
LIBOR Rate Swaption | | 3,100 | | 1 | |
Call Strike $1.00 | | | | | |
Expires 11/20/2007 | | | | | |
LIBOR Rate Swaption | | 5,400 | | 85 | |
Call Strike $5.15 | | | | | |
Expires 12/20/2007 | | | | | |
LIBOR Rate Swaption | | 5,400 | | 81 | |
Call Strike $5.10 | | | | | |
Expires 2/1/2008 | | | | | |
LIBOR Rate Swaption | | 6,000 | | 75 | |
Call Strike $4.95 | | | | | |
Expires 3/31/2008 | | | | | |
LIBOR Rate Swaption | | 14,400 | | 164 | |
Call Strike $4.90 | | | | | |
Expires 3/31/2008 | | | | | |
LIBOR Rate Swaption | | 12,000 | | 179 | |
Call Strike $4.95 | | | | | |
Expires 9/26/2008 | | | | | |
LIBOR Rate Swaption | | 10,900 | | 162 | |
Call Strike $4.95 | | | | | |
Expires 9/26/2008 | | | | | |
LIBOR Rate Swaption | | 11,600 | | 210 | |
Call Strike $5.00 | | | | | |
Expires 12/15/2008 | | | | | |
LIBOR Rate Swaption | | 18,300 | | 433 | |
Call Strike $5.20 | | | | | |
Expires 12/15/2008 | | | | | |
LIBOR Rate Swaption | | $ | 29,400 | | $ | 835 | |
Call Strike $5.50 | | | | | |
Expires 8/3/2009 | | | | | |
LIBOR Rate Swaption | | 3,200 | | 31 | |
Call Strike $4.90 | | | | | |
Expires 2/1/2008 | | | | | |
Total Swaptions Written (premiums: $1,566) | | | | $ | 2,271 | |
SWAP AGREEMENTS
| | | | | | Net Unrealized | |
| | Expiration | | Notional | | Appreciation | |
| | Date | | Amount | | (Depreciation) | |
Receive a fixed rate equal to 0.06% and the Fund will pay to the counterparty at the notional amount in the event of default of American International Group Inc. 5.60% due 10/18/2016
Counterparty: Lehman Brothers Securities, Inc. | | 03/20/08 | | 2,800 | | $ | (3 | ) |
| | | | | | | |
Receive a fixed rate equal to 0.26% and the Fund will pay to the counterparty at the notional amount in the event of default of Russian Federation Government Bond 5.00% due 03/31/2030.
Counterparty: Deutsche Bank AG | | 12/20/07 | | 300 | | q | |
| | | | | | | |
Receive a fixed rate equal to 0.26% and the Fund will pay to the counterparty at the notional amount in the event of default of Russian Federation Government Bond, 5.00%, due 03/31/2030.
Counterparty: Morgan Stanley Capital Services, Inc. | | 12/20/07 | | 300 | | q | |
| | | | | | | |
Receive a fixed rate equal to 0.29% and the Fund will pay to the counterparty at the notional amount in the event of default of Pemex Project Funding Master Trust, 9.5%, due 9/15/2027. §
Counterparty: Barclays Bank PLC | | 12/22/08 | | 1,400 | | q | |
| | | | | | | |
Receive a fixed rate equal to 0.32% and the Fund will pay to the counterparty at the notional amount in the event of default of Morgan Stanley BP 5.82% due 10/18/2016. §
Counterparty: Royal Bank of Scotland PLC | | 12/20/16 | | 2,800 | | 78 | |
| | | | | | | | |
67
| | | | | | Net Unrealized | |
| | Expiration | | Notional | | Appreciation | |
| | Date | | Amount | | (Depreciation) | |
Receive a fixed rate equal to 0.40% and the Fund will pay to the counterparty at the notional amount in the event of default of Republic of Indonesia Government Bond 6.75% due 03/10/2014.
Counterparty: Royal Bank of Scotland PLC | | 12/22/08 | | $ | 200 | | $ | q | |
| | | | | | | |
Receive a fixed rate equal to 0.463% and the Fund will pay to the Counterparty in the event of default on any of the securities in the Dow Jones CDX.IG.5 10 Year Index the remaining interest payments on those defaulted securities.
Counterparty: Morgan Stanley Capital Services Inc. | | 12/21/15 | | 3,200 | | (54 | ) |
| | | | | | | |
Receive a fixed rate equal to 0.48% and the Fund will pay in the event of default on any of the securities in the Dow Jones CDX.HY-8 100 Index, the remaining interest payments on those defaulted securities.
Counterparty: Barclays Bank PLC | | 06/20/12 | | 3,300 | | (33 | ) |
| | | | | | | |
Receive a fixed rate equal to 0.71% and the Fund will pay to the counterparty at the notional amount in the event of default of Ukraine Government Bond 7.65% due 06/11/2013.
Counterparty: Barclays Bank PLC | | 12/22/08 | | 100 | | q | |
| | | | | | | |
Receive a fixed rate equal to 0.72% and the Fund will pay to the counterparty at the notional amount in the event of default of Ukraine Government Bond 7.65% due 06/11/2013.
Counterparty: Deutsche Bank AG | | 12/22/08 | | 100 | | q | |
| | | | | | | |
Receive a fixed rate equal to 0.72% and the Fund will pay to the counterparty at the notional amount in the event of default of Ukraine Government Bond, 7.65%, due 06/11/2013.
Counterparty: Barclays Bank PLC | | 12/22/08 | | 800 | | (1 | ) |
| | | | | | | |
Receive a fixed rate equal to 1.00% and the Fund will pay to the counterparty at the notional amount in the event of default of Chesapeake Energy Corp., 6.88%, due 1/15/2016.
Counterparty: Citibank NA | | 06/20/12 | | $ | 700 | | (6 | ) |
| | | | | | | |
Receive a fixed rate equal to 1.00% and the Fund will pay to the counterparty at the notional amount in the event of default of Chesapeake Energy Corp., 6.88%, due 1/15/2016.
Counterparty: Deutsche Bank AG | | 06/20/12 | | $ | 300 | | $ | (2) | |
| | | | | | | |
Receive a fixed rate equal to 1.60% and the Fund will pay to the counterparty at the notional amount in the event of default of Chesapeake Energy Corp., 6.88%, due 1/15/2016.
Counterparty: Lehman Brothers § Special Financing, Inc. | | 09/20/12 | | $ | 1,100 | | 17 | |
| | | | | | | |
Receive a fixed rate equal to 1.94% and the Fund will pay a floating rate based on FRC-Excluding Tobacco-Non-Revised Consumer Price Index.
Counterparty: Royal Bank of Scotland PLC | | 04/10/12 | | EUR | 600 | | (6 | ) |
| | | | | | | |
Receive a fixed rate equal to 1.94% and the Fund will pay a floating rate based on FRC-Excluding Tobacco-Non-Revised Consumer Price Index.
Counterparty: BNP Paribas | | 04/10/12 | | EUR | 600 | | (5 | ) |
| | | | | | | |
Receive a fixed rate equal to 1.95% and the Fund will pay a floating rate based on FRC-Excluding Tobacco-Non-Revised Consumer Price Index.
Counterparty: Barclays Bank PLC | | 03/15/12 | | EUR | 1,400 | | (23 | ) |
| | | | | | | | | | |
68
| | | | | | Net Unrealized | |
| | Expiration | | Notional | | Appreciation | |
| | Date | | Amount | | (Depreciation) | |
Receive a fixed rate equal to 1.95% and the Fund will pay a floating rate based on FRC-Excluding Tobacco-Non-Revised Consumer Price Index.
Counterparty: Royal Bank of Scotland PLC | | 03/30/12 | | EUR | $40 | | $ | (3 | ) |
| | | | | | | |
Receive a fixed rate equal to 1.95% and the Fund will pay a floating rate based on FRC-Excluding Tobacco-Non-Revised Consumer Price Index.
Counterparty: Barclays Bank PLC | | 04/30/12 | | EUR | 500 | | (4 | ) |
| | | | | | | |
Receive a fixed rate equal to 1.96% and the Fund will pay a floating rate based on FRC-Excluding Tobacco-Non-Revised Consumer Price Index.
Counterparty: Royal Bank of Scotland PLC | | 03/28/12 | | EUR | 400 | | (3 | ) |
| | | | | | | |
Receive a fixed rate equal to 1.96% and the Fund will pay a floating rate based on FRC-Excluding Tobacco-Non-Revised Consumer Price Index.
Counterparty: Goldman Sachs Capital Markets, LP | | 03/30/12 | | EUR | 400 | | (3 | ) |
| | | | | | | |
Receive a fixed rate equal to 1.96% and the Fund will pay a floating rate based on FRC-Excluding Tobacco-Non-Revised Consumer Price Index.
Counterparty: Barclays Bank PLC | | 04/05/12 | | EUR | 300 | | (2 | ) |
| | | | | | | |
Receive a fixed rate equal to 1.97% and the Fund will pay a floating rate based on FRC-Excluding Tobacco-Non-Revised Consumer Price Index.
Counterparty: Lehman Brothers Special Financing, Inc. | | 03/15/12 | | EUR | 400 | | (2 | ) |
| | | | | | | |
Receive a fixed rate equal to 10.12% and the Fund will pay a floating rate based on the Brazilian Real-CDI.
Counterparty: Morgan Stanley Capital Services Inc. | | 01/02/12 | | BRL | $21,800 | | $ | (526 | ) |
| | | | | | | |
Receive a fixed rate equal to 10.15% and the Fund will pay a floating rate based on the Brazilian Real-CDI.
Counterparty: Goldman Sachs Capital Markets, LP | | 01/02/12 | | BRL | 29,500 | | (695 | ) |
| | | | | | | |
Receive a fixed rate equal to 10.68% and the Fund will pay a floating rate based on the Brazilian Real-CDI.
Counterparty: Barclays Bank PLC | | 01/02/12 | | BRL | 20,800 | | (297 | ) |
| | | | | | | |
Receive a fixed rate equal to 2.00% and the Fund will pay a floating rate based on FRC– Excluding Tobacco-Non-Revised Consumer Price Index.
Counterparty: Goldman Sachs Capital Markets, LP | | 03/15/12 | | EUR | 1,300 | | (3 | ) |
| | | | | | | |
Receive a fixed rate equal to 2.09% and the Fund will pay a floating rate based on FRC Excluding Tobacco-Non-Revised Consumer Price Index. §
Counterparty: BNP Paribas | | 10/15/10 | | EUR | 2,000 | | 37 | |
| | | | | | | |
Receive a fixed rate equal to 2.1025% and the Fund will pay a floating rate based on FRC Excluding Tobacco-Non-Revised Consumer Price Index. §
Counterparty: Barclays Bank PLC | | 10/15/10 | | EUR | 1,000 | | 20 | |
| | | | | | | |
Receive a fixed rate equal to 2.1455% and the Fund will pay a floating rate based on FRC Excluding Tobacco-Non-Revised Consumer Price Index. §
Counterparty: UBS AG | | 10/15/10 | | EUR | 2,100 | | 46 | |
| | | | | | | | | | | |
69
| | | | | | Net Unrealized | |
| | Expiration | | Notional | | Appreciation | |
| | Date | | Amount | | (Depreciation) | |
Receive a fixed rate equal to 4.50% and pay a floating rate based on 6-month EURIBOR §
Counterparty: Lehman Securities, Inc. | | 03/19/10 | | EUR | $36,900 | | $ | 7 | |
| | | | | | | |
Receive a fixed rate equal to 4.50% and pay a floating rate based on 6-month EURIBOR
Counterparty: Goldman Sachs Capital Markets, LP | | 09/21/09 | | EUR | 1,200 | | (7 | ) |
| | | | | | | |
Receive a floating rate based on 6 month United States Dollar-LIBOR and pay a fixed rate equal to 6%.
Counterparty: Lehman Securities, Inc. | | 12/19/12 | | 6,800 | | 51 | |
| | | | | | | |
Receive a fixed rate equal to 5.00% and pay a floating rate based on 3-month United States Dollar-LIBOR. §
Counterparty: Lehman Securities, Inc. | | 06/19/34 | | EUR | 200 | | (28 | ) |
| | | | | | | |
Receive a fixed rate equal to 5.00% and pay a floating rate based on 3-month United States Dollar-LIBOR. §
Counterparty: Barclays Bank PLC | | 12/19/17 | | 3,400 | | (31 | ) |
| | | | | | | |
Receive a fixed rate equal to 5.00% and pay a floating rate based on 3-month United States Dollar-LIBOR. §
Counterparty: Lehman Securities, Inc. | | 12/21/09 | | 8,300 | | 73 | |
| | | | | | | |
Receive a fixed rate equal to 5.00% and pay a floating rate based on 3-month United States Dollar-LIBOR. §
Counterparty: Credit Suisse International | | 12/19/12 | | 12,700 | | 95 | |
| | | | | | | |
Receive a fixed rate equal to 5.00% and pay a floating rate based on 3-month United States Dollar-LIBOR.
Counterparty: Deutsche Bank AG | | 12/19/12 | | 9,300 | | 70 | |
| | | | | | | |
Receive a fixed rate equal to 5.00% and pay a floating rate based on 3-month United States Dollar-LIBOR. §
Counterparty: Royal Bank of Scotland PLC | | 12/19/14 | | 6,300 | | 11 | |
| | | | | | | |
Receive a fixed rate equal to 5.00% and pay a floating rate based on 3-month United States Dollar-LIBOR. §
Counterparty: Credit Suisse International | | 12/19/12 | | $ | 5,200 | | $ | 39 | |
| | | | | | | |
Receive a fixed rate equal to 5.00% and pay a floating rate based on 3-month United States Dollar-LIBOR. §
Counterparty: Royal Bank of Scotland PLC | | 12/21/09 | | 38,200 | | 333 | |
| | | | | | | |
Receive a fixed rate equal to 5.00% and pay a floating rate based on 3-month United States Dollar-LIBOR. §
Counterparty: Deutsche Bank AG | | 12/19/22 | | 4,200 | | (115 | ) |
| | | | | | | |
Receive a fixed rate equal to 5.00% and pay a floating rate based on 3-month United States Dollar-LIBOR. §
Counterparty: Deutsche Bank AG | | 12/19/17 | | 1,000 | | (9 | ) |
| | | | | | | |
Receive a fixed rate equal to 5.00% and pay a floating rate based on 3-month United States Dollar-LIBOR.
Counterparty: Barclays Bank PLC | | 12/21/09 | | 47,900 | | 420 | |
| | | | | | | |
Receive a fixed rate equal to 5.00% and pay a floating rate based on 3-month United States Dollar-LIBOR. §
Counterparty: Deutsche Bank AG | | 12/19/14 | | 5,900 | | 10 | |
| | | | | | | |
Receive a fixed rate equal to 5.00% and pay a floating rate based on 3-month United States Dollar-LIBOR. §
Counterparty: Deutsche Bank AG | | 12/21/09 | | 10,100 | | 88 | |
| | | | | | | |
Receive a fixed rate equal to 5.00% and pay a floating rate based on 6-month British Pound-LIBOR
Counterparty: Goldman Sachs Capital Markets LP | | 09/15/15 | | GBP | 500 | | (33 | ) |
| | | | | | | | | | | |
70
| | | | | | Net Unrealized | |
| | Expiration | | Notional | | Appreciation | |
| | Date | | Amount | | (Depreciation | |
Receive a fixed rate equal to 5.00% and pay a floating rate based on 6-month British Pound-LIBOR
Counterparty: Goldman Sachs Capital Markets, LP | | 09/15/15 | | GBP | $500 | | $ | (33 | ) |
| | | | | | | |
Receive a fixed rate equal to 5.00% and pay a floating rate based on 6-month EURIBOR §
Counterparty: UBS AG | | 07/13/37 | | EUR | 100 | | 4 | |
| | | | | | | |
Receive a fixed rate equal to 5.00% and the Fund will pay a floating rate based on 6-month British Pound–LIBOR
Counterparty: Barclays Bank PLC | | 09/15/10 | | GBP | 11,200 | | (462 | ) |
| | | | | | | |
Receive a fixed rate equal to 5.00% and the Fund will pay a floating rate based on 6-month British Pound–LIBOR
Counterparty: Royal Bank of Scotland PLC | | 09/15/10 | | GBP | 1,300 | | (54 | ) |
| | | | | | | |
Receive a fixed rate equal to 5.00% and the Fund will pay a floating rate based on the 3-month United States Dollar-LIBOR. §
Counterparty: Royal Bank of Scotland PLC | | 12/19/12 | | 14,000 | | 105 | |
| | | | | | | |
Receive a fixed rate equal to 5.00% and the Fund will pay a floating rate based on the 3-month United States Dollar-LIBOR. §
Counterparty: Barclays Bank PLC | | 12/19/12 | | 17,100 | | 128 | |
| | | | | | | |
Receive a fixed rate equal to 5.00% and the Fund will pay a floating rate based on the 3-month United States Dollar-LIBOR.
Counterparty: Deutsche Bank AG | | 12/17/35 | | 5,900 | | (296 | ) |
| | | | | | | |
Receive a fixed rate equal to 5.00% and the Fund will pay a floating rate based on the 3-month United States Dollar-LIBOR. §
Counterparty: UBS AG | | 06/18/09 | | 32,900 | | 177 | |
| | | | | | | |
Receive a fixed rate equal to 5.50% and the Fund will pay a floating rate based on the 6-month Great British Pound- LIBOR.
Counterparty: Lehman Securities, Inc. | | 03/20/13 | | GBP | $2,500 | | $ | (5 | ) |
| | | | | | | |
Receive a fixed rate equal to 6.00% and the Fund will pay a floating rate based on the 6-month Great British Pound- LIBOR. §
Counterparty: Deutsche Bank AG | | 03/20/09 | | GBP | 4,100 | | 22 | |
| | | | | | | |
Receive a fixed rate equal to 6.00% and the Fund will pay a floating rate based on the 6-month Great British Pound- LIBOR. §
Counterparty: Royal Bank of Scotland PLC | | 06/19/09 | | GBP | 6,100 | | 50 | |
| | | | | | | |
Receive a fixed rate equal to 7.00% and the Fund will pay a floating rate based on the 6-month Australian Dollar- Bank Bill Rate- BBSW (AUD- BBR-BBSW.)
Counterparty: Deutsche Bank AG | | 06/15/10 | | AUD | 27,300 | | (232 | ) |
| | | | | | | |
Receive a fixed rate equal to 7.00% and the Fund will pay a floating rate based on the 6-month Australian Dollar- Bank Bill Rate- BBSW (AUD- BBR-BBSW.)
Counterparty: Morgan Stanley Capital Services Inc. | | 06/15/10 | | AUD | 12,900 | | (110 | ) |
| | | | | | | |
Receive a fixed rate equal to 7.91% and the Fund will pay a floating rate based on the Mexican Peso Interbank Equilibrium Interest Rate (TIIE)-Banxico.
Counterparty: Morgan Stanley Capital Services Inc. | | 05/14/09 | | MXN | 112,000 | | (33 | ) |
| | | | | | | |
Receive a fixed rate equal to 7.91% and the Fund will pay a floating rate based on the Mexican Peso Interbank Equilibrium Interest Rate (TIIE)-Banxico.
Counterparty: Citibank NA. | | 05/14/09 | | MXN | 75,000 | | (22 | ) |
| | | | | | | | | | |
71
| | | | | | Net Unrealized | |
| | Expiration | | Notional | | Appreciation | |
| | Date | | Amount | | (Depreciation | |
Receive a floating rate based on 6-month British Pound-LIBOR and pay a fixed rate equal to 4.00%. §
Counterparty: Barclays Bank PLC | | 12/17/35 | | GBP | $800 | | $ | 62 | |
| | | | | | | |
Receive a floating rate based on 6-month British Pound-LIBOR and pay a fixed rate equal to 4.00%. §
Counterparty: Morgan Stanley Capital Services Inc. | | 12/17/35 | | GBP | 3,000 | | 233 | |
| | | | | | | |
Receive a floating rate based on 6-month British Pound-LIBOR and pay a fixed rate equal to 4.50%.
Counterparty: Deutsche Bank AG | | 12/17/35 | | GBP | 4,200 | | (40 | ) |
| | | | | | | |
Receive a floating rate based on 6-month British Pound-LIBOR and pay a fixed rate equal to 5.00%. §
Counterparty: Deutsche Bank AG | | 09/20/17 | | GBP | 4,200 | | 281 | |
| | | | | | | |
Receive a floating rate based on 6-month-EURIBOR and the Fund will pay a fixed rate equal to 4.00%. §
Counterparty: Barclays Bank PLC | | 12/15/11 | | EUR | 34,100 | | 1,416 | |
| | | | | | | |
Receive a floating rate based on the 3-month United States Dollar - LIBOR and pay a fixed rate equal to 5.00%. §
Counterparty: Royal Bank of Scotland PLC | | 12/21/37 | | 2,000 | | 107 | |
| | | | | | | |
Receive a floating rate based on the 3-month United States Dollar - LIBOR and pay a fixed rate equal to 5.00%. §
Counterparty: Deutsche Bank AG | | 12/21/37 | | 2,700 | | 145 | |
| | | | | | | |
Receive a floating rate based on the 3-month United States Dollar - LIBOR and pay a fixed rate equal to 5.00%. §
Counterparty: Royal Bank of Scotland PLC | | 12/20/27 | | 6,600 | | 270 | |
| | | | | | | |
Receive a floating rate based on the 6-month Japanese Yen-LIBOR and pay a fixed rate equal to 2.00%.
Counterparty: Morgan Stanley Capital Services Inc. | | 12/20/13 | | JPY | 140,000 | | (42 | ) |
| | | | | | | |
Receive from the Counterparty in the event of default on any of the securities in the Dow Jones CDX.IG.5 7 year Index the remaining interest payments on those defaulted securities and the Fund will pay a fixed rate equal to 0.142%. §
Counterparty: Morgan Stanley Capital Services Inc. | | 12/20/12 | | $ | 4,500 | | $ | 38 | |
| | | | | | | |
Receive from the counterparty a fixed rate equal to 0.17% and the Fund will pay at the notional amount in the event of default of Goldman Sachs Group, Inc., 6.60%, due 1/15/2012.
Counterparty: UBS AG | | 09/22/08 | | 2,000 | | (8 | ) |
| | | | | | | |
Receive from the counterparty a fixed rate equal to 0.19% and the Fund will pay at the notional amount in the event of default of Morgan Stanley, 6.60%, due 4/1/2012.
Counterparty: UBS AG | | 09/22/08 | | 2,000 | | (6 | ) |
| | | | | | | |
Receive from the counterparty a fixed rate equal to 0.72% and the Fund will pay at the notional amount in the event of default of Goldman Sachs Group, Inc., 6.60%, due 1/15/2012. §
Counterparty: BNP Paribas | | 09/20/12 | | 100 | | 1 | |
| | | | | | | |
Receive from the counterparty a fixed rate equal to 0.92% and the Fund will pay at the notional amount in the event of default of Goldman Sachs Group, Inc., 6.60%, due 1/15/2012. §
Counterparty: Citibank NA | | 09/20/12 | | 600 | | 8 | |
| | | | | | | |
Receive from the counterparty a fixed rate equal to 0.92% and the Fund will pay at the notional amount in the event of default of Merrill Lynch & Co., 5.00%, due 1/15/2015. §
Counterparty: Royal Bank of Scotland PLC | | 09/20/12 | | 600 | | 2 | |
| | | | | | | | | | | |
72
| | | | | | Net Unrealized | |
| | Expiration | | Notional | | Appreciation | |
| | Date | | Amount | | (Depreciation) | |
Receive from the counterparty at the notional amount in the event of default of Avebury Finance CDO PLC, 9.00%, due 01/08/2051 and the Fund will pay a fixed rate equal to 3.68%. §
Counterparty: Merrill Lynch International | | 01/09/51 | | $ | 3,000 | | $ | 2,944 | |
| | | | | | | |
Receive from the counterparty at the notional amount in the event of default of Diamond Offshore Drill, Zero Coupon, due 6/6/2020 and the Fund will pay a fixed rate equal to 0.44%.
Counterparty: Citibank NA | | 06/20/17 | | 1,400 | | (9 | ) |
| | | | | | | |
Receive from the counterparty at the notional amount in the event of default of HSBC Finance Corp BP, 6.38%, due 10/15/2011 and the Fund will pay a fixed rate equal to 0.20%. §
Counterparty: Royal Bank of Scotland PLC | | 12/20/11 | | 4,900 | | 39 | |
| | | | | | | |
Receive from the counterparty at the notional amount in the event of default of Kellogg Co, 5.75%, due 2/2/2001 and the Fund will pay a fixed rate equal to 0.11%. §
Counterparty: Lehman Brothers Special Financing, Inc. | | 06/20/11 | | 2,000 | | 5 | |
| | | | | | | |
Receive from the Counterparty at the notional amount in the event of default of Kohls, Inc., 6.33%, due 3/1/2011. and the Fund will pay a fixed rate equal to 0.44%. §
Counterparty: Lehman Brothers Special Financing, Inc. | | 12/20/12 | | 2,500 | | 9 | |
| | | | | | | |
Receive from the counterparty at the notional amount in the event of default of Limited Brands BP, due 6/20/2017 and the Fund will pay a fixed rate equal to 1.03%. §
Counterparty: Goldman Sachs Capital Markets, LP | | 06/20/17 | | 4,000 | | 170 | |
| | | | | | | |
Receive from the counterparty at the notional amount in the event of default of Noble Corp. BP, due 6/20/2012 and the Fund will pay a fixed rate equal to 0.52%.
Counterparty: Credit Suisse International | | 06/20/12 | | $ | 1,500 | | $ | (10 | ) |
| | | | | | | |
Receive from the counterparty at the notional amount in the event of default of Weyerhaeuser Co, 6.75%, due 3/15/2012 and the Fund will pay a fixed rate equal to 0.96%. §
Counterparty: UBS AG | | 06/20/17 | | 700 | | 8 | |
| | | | | | | |
Receive from the Counterparty in the event of default on any of the securities in the iTraxx Europe HiVol Series Version 1 Index the remaining interest payments on those defaulted securities and the Fund will pay a fixed rate equal to 0.85%.
Counterparty: HSBC Bank USA | | 12/20/16 | | EUR | 2,900 | | (26 | ) |
| | | | | | | |
Receive from the Counterparty in the event of default on any of the securities in the iTraxx Europe HiVol Series Version 1 Index the remaining interest payments on those defaulted securities and the Fund will pay a fixed rate equal to 0.85%.
Counterparty: Deutsche Bank AG | | 12/20/16 | | EUR | 2,600 | | (23 | ) |
| | | | | | | |
Receive from the Counterparty, in the event of default on any of the securities in the Dow Jones CDX.HY-8 Index, the remaining interest payments on those defaulted securities and the Fund will pay a fixed rate equal to 2.75%.
Counterparty: Lehman Securities, Inc. | | 06/20/12 | | 1,400 | | 43 | |
| | | | | | | |
Receive from the Counterparty, in the event of default on any of the securities in the Dow Jones CDX.HY-8 Index, the remaining interest payments on those defaulted securities and the Fund will pay a fixed rate equal to 2.75%. §
Counterparty: Lehman Securities, Inc. | | 06/20/12 | | 2,200 | | (68 | ) |
| | | | | | | | | | |
73
| | | | | | Net Unrealized | |
| | Expiration | | Notional | | Appreciation | |
| | Date | | Amount | | (Depreciation) | |
Receive from the Counterparty, in the event of default on any of the securities in the Dow Jones CDX.HY-8 Index, the remaining interest payments on those defaulted securities and the Fund will pay a fixed rate equal to 2.75%. §
Counterparty: Credit Suisse International | | 06/20/12 | | $ | 2,200 | | $ | 68 | |
| | | | | | | |
Receive from the counterparty, in the event of default on any of the securities in the Dow Jones CDX.IG 8.5 Year Index, the remaining interest payments on those defaulted securities and the Fund will pay a fixed rate equal to 0.17%.
Counterparty: Morgan Stanley Capital Services, Inc. | | 06/20/12 | | 20,100 | | (97 | ) |
| | | | | | | |
Receive from the Counterparty, in the event of default on any of the securities in the iTraxx Europe HiVol Series Version 1 Index, the remaining interest payments on those defaulted securities and the Fund will pay a fixed rate equal to 4.60%.
Counterparty: Morgan Stanley Capital Services, Inc. | | 12/20/17 | | EUR | 2,600 | | (124 | ) |
| | | | | | | |
Total Swap Agreements | | | | | | | |
(premium $-695) | | | | $ | 883,300 | | $ | 4,136 | |
| | | | | | | | | | |
74
FUTURES CONTRACTS:
| | | | | | | | Net Unrealized | |
| | | | Settlement | | | | Appreciation | |
| | Contracts (·) | | Date | | Amount | | (Depreciation) | |
10-Year Japan Bond | | 1 | | 12/20/2007 | | $ | 1,180 | | $ | 9 | |
10-Year US Treasury Note | | 322 | | 12/31/2007 | | 19,143 | | (89 | ) |
2-Year US Treasury Note | | (262 | ) | 12/31/2007 | | (79,323 | ) | (205 | ) |
3-Month Euro EURIBOR | | 217 | | 03/17/2008 | | 75,017 | | (47 | ) |
3-Month Euro EURIBOR | | 9 | | 06/16/2008 | | 3,113 | | (5 | ) |
3-Month Euro EURIBOR | | 152 | | 09/15/2008 | | 52,588 | | (31 | ) |
3-Month Euro EURIBOR | | 91 | | 12/15/2008 | | 31,492 | | (14 | ) |
3-Month GBP LIBOR | | 213 | | 06/18/2008 | | q | | (3 | ) |
5-Year US Treasury Note | | (713 | ) | 12/30/2007 | | (76,536 | ) | (101 | ) |
90-Day Euro Dollar | | 217 | | 03/16/2009 | | 51,893 | | 20 | |
90-Day Euro Dollar | | 200 | | 03/17/2008 | | 47,753 | | 33 | |
90-Day Euro Dollar | | 354 | | 06/16/2008 | | 84,624 | | 392 | |
90-Day Euro Dollar | | 578 | | 09/15/2008 | | 138,272 | | 1,120 | |
90-Day Euro Dollar | | 809 | | 12/15/2008 | | 193,553 | | 938 | |
90-Day Euro Dollar | | 35 | | 12/17/2007 | | 8,334 | | 19 | |
90-Day GBP LIBOR | | 717 | | 03/19/2008 | | 9 | | q | |
90-Day GBP LIBOR | | 17 | | 12/19/2007 | | 4,143 | | 10 | |
90-Day STERLING | | 68 | | 03/19/2008 | | 16,619 | | (25 | ) |
90-Day STERLING | | 88 | | 03/19/2009 | | 21,601 | | 5 | |
90-Day STERLING | | 15 | | 06/17/2009 | | 3,681 | | 5 | |
90-Day STERLING | | 594 | | 06/18/2008 | | 145,498 | | (16 | ) |
90-Day STERLING | | 117 | | 09/16/2009 | | 28,707 | | 11 | |
90-Day STERLING | | 293 | | 09/18/2008 | | 71,868 | | 236 | |
90-Day STERLING | | 79 | | 12/17/2008 | | 19,390 | | 11 | |
Euro-BOBL | | 161 | | 12/11/2007 | | 25,089 | | (45 | ) |
Euro-BUND | | (47 | ) | 12/10/2007 | | (7,706 | ) | (19 | ) |
Euro-SCHATZ | | 114 | | 11/23/2007 | | q | | q | |
Euro-Schatz | | (299 | ) | 12/10/2007 | | (44,646 | ) | 92 | |
Long Gilt | | (36 | ) | 12/30/2007 | | (8,024 | ) | (23 | ) |
US Long Bond | | 569 | | 12/30/2007 | | (66.881 | ) | (521 | ) |
| | | | | | $ | 760,451 | | $ | 1,757 | |
75
FORWARD FOREIGN CURRENCY CONTRACTS:
| | | | | | Amount in | | Net Unrealized | |
| | Bought | | Settlement | | U.S. Dollars | | Appreciation | |
Currency | | (Sold) | | Date | | Bought(Sold) | | (Depreciation) | |
Brazil Real | | 39,765 | | 03/04/2008 | | $ | 19,889 | | $ | 2,617 | |
Brazil Real | | (3,098 | ) | 03/04/2008 | | (1,579 | ) | (174 | ) |
Brazil Real | | 4,999 | | 07/02/2008 | | 2,778 | | 4 | |
Brazil Real | | (6,563 | ) | 07/02/2008 | | (3,496 | ) | (156 | ) |
Brazil Real | | 8,605 | | 11/05/2007 | | 4,742 | | 204 | |
Brazil Real | | (8,605 | ) | 11/05/2007 | | (4,732 | ) | (214 | ) |
Canadian Dollar | | (169 | ) | 11/01/2007 | | (167 | ) | (11 | ) |
Chinese Yuan Renminbi | | (24,023 | ) | 01/10/2008 | | (3,258 | ) | (8 | ) |
Chinese Yuan Renminbi | | 66,921 | | 07/02/2008 | | 9,226 | | 185 | |
Chinese Yuan Renminbi | | (9,873 | ) | 11/26/2007 | | (1,330 | ) | q | |
Danish Krone | | (16,910 | ) | 12/06/2007 | | (3,103 | ) | (181 | ) |
Euro Dollar | | (4,459 | ) | 11/05/2007 | | (6,315 | ) | (136 | ) |
Japanese Yen | | (418,763 | ) | 12/13/2007 | | (3,670 | ) | 21 | |
Malaysian Ringgit | | 1,408 | | 08/04/2008 | | 415 | | 11 | |
Mexican Peso | | 55,389 | | 03/13/2008 | | 4,999 | | 123 | |
Mexican Peso | | 34,833 | | 07/10/2008 | | 3,144 | | 44 | |
New Zealand Dollar | | (601 | ) | 11/01/2007 | | (459 | ) | (3 | ) |
New Zealand Dollar | | (601 | ) | 11/29/2007 | | (462 | ) | 1 | |
Poland zloty | | 1,158 | | 03/13/2008 | | 459 | | 2 | |
Poland zloty | | 4,457 | | 07/10/2008 | | 1,622 | | 149 | |
Republic of Korea Won | | 1,661,538 | | 01/30/2008 | | 1,830 | | 21 | |
Republic of Korea Won | | 1,195,844 | | 08/04/2008 | | 1,301 | | 33 | |
Russian Ruble | | 78,747 | | 01/11/2008 | | 3,103 | | 78 | |
Russian Ruble | | 83,505 | | 07/10/2008 | | 3,307 | | 48 | |
Russian Ruble | | 28,868 | | 12/07/2007 | | 1,101 | | 66 | |
Russian Ruble | | (28,868 | ) | 12/07/2007 | | (1,156 | ) | (12 | ) |
Singapore Dollar | | 1,559 | | 02/20/2008 | | 1,060 | | 24 | |
Singapore Dollar | | 1,886 | | 05/22/2008 | | 1,287 | | 30 | |
United Kingdom Pound | | 819 | | 11/01/2007 | | 1,668 | | 32 | |
United Kingdom Pound | | (4,617 | ) | 11/01/2007 | | (9,288 | ) | (303 | ) |
United Kingdom Pound | | (3,799 | ) | 12/20/2007 | | (7,841 | ) | (39 | ) |
| | | | | | $ | 108,787 | | $ | 2,447 | |
76
NOTES TO SCHEDULE OF INVESTMENTS
q Value is less than $1
^ At October 31, 2007, all or a portion of this security is on loan (see Note 1). The value at October 31, 2007 of all securities on loan is $19,384.
* Floating or variable rate note. Rate is listed as of October 31, 2007.
§ Illiquid
‡ Non Income Producing
· Contract Amounts are not in thousands
(1) At October 31, 2007, all or a portion of this security is segregated with the custodian to cover margin requirements for open futures contracts. The value of all securities segregated at October 31, 2007 is $623.
(2) IO - - Interest Only
(3) Coupon rate is fixed for a predetermined period of time and then converts to a floating rate until maturity/call date. Rate is listed as of October 31, 2007.
(4) Loan Participation
Ž The security has a perpetual maturity. The date shown is the next call date.
# Aggregate cost for federal income tax purposes is $760,831. Aggregate gross unrealized appreciation for all securities in which there is an excess of value over tax cost and aggregate gross unrealized depreciation for all securities in which there is an excess of tax cost over value were $4,820 and $1,948, respectively. Net unrealized appreciation for tax purposes is $2,872.
DEFINITIONS:
144A 144A Securities are registered pursuant to Rule 144A of the Securities Act of 1933. These securities are deemed to be liquid for purposes of compliance limitations on holdings of illiquid securities and may be resold as transactions exempt from registration, normally to qualified institutional buyers. At October 31, 2007, these securities aggregated $34,091, or 6.13%, of net assets of the Fund
TBA To Be Announced
TIPS Treasury Inflation Protected Security
BRL Brazil Real
DKK Denmark krone
EUR Euro Dollar
GBP United Kingdom pound
JPY Japan yen
77
TA IDEX Protected Principal Stock
MARKET ENVIRONMENT
The twelve months ended October 31, 2007 exhibited a seemingly benign stock market, with the Standard and Poor’s 500 Composite Stock Index (“S&P 500”) posting a total return of 14.56%. A closer look, however, reveals turbulence: the S&P 500 had monthly declines in February 2007 and also during June and July. Such price action caused the Chicago Board Options Exchange Volatility Index (“VIX”) to increase from 11.10 at the beginning of the period to 18.53 at the end – a nearly 67% increase.
PERFORMANCE
For the year ended October 31, 2007, TA IDEX Protected Principal Stock, Class A returned 6.82%. By comparison its benchmark, the S&P 500, returned 14.56%. As of October 31, 2007, the Fund’s net expense ratios for Class A, Class B, Class C, and Class M were 2.14%, 2.74%, 2.76%, and 2.60%, respectively.
STRATEGY REVIEW
As part of its strategy, the portfolio sells S&P 500 call options and purchases put options as well as invests in the stocks comprising the S&P 500. Higher volatility levels noted above enabled the portfolio to sell calls at higher prices than prevailed early in the year.
LIQUIDATION AND DISSOLUTION
The TA IDEX Protected Principal Stock filed a proxy statement in early October, outlining a proposed plan for dissolution. By late November, the securities positions were liquidated. The diminishing asset size of TA IDEX Protected Principal Stock was a primary factor in the Board of Trustees approving and recommending the plan of liquidation and dissolution.
Gateway Investment Advisers, L.P. appreciates the opportunity to have served the TA IDEX Protected Principal Stock since its July 2002 inception.
J. Patrick Rogers, CFA
Fund Manager
Gateway Investment Advisers, L.P.
78
(unaudited)
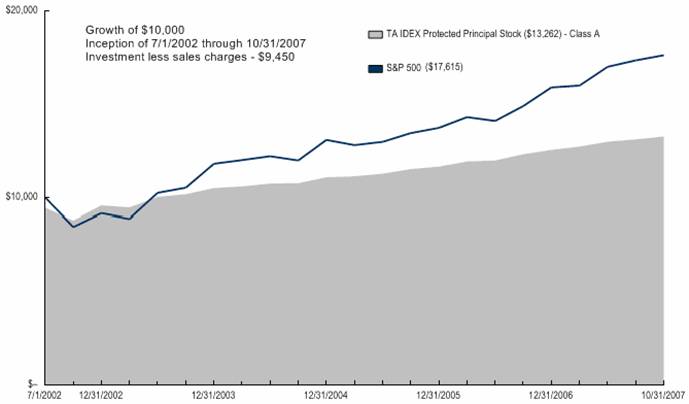
Average Annual Total Return for Periods Ended 10/31/2007
| | | | | | From | | Inception | |
| | 1 Year | | 5 Years | | Inception | | Date | |
Class A (NAV) | | 6.82 | % | 6.99 | % | 6.55 | % | 7/1/02 | |
Class A (POP) | | 0.93 | % | 5.79 | % | 5.43 | % | 7/1/02 | |
S&P 500 (1) | | 14.56 | % | 13.88 | % | 10.74 | % | 7/1/02 | |
| | | | | | | | | |
Class B (NAV) | | 6.02 | % | 6.49 | % | 6.09 | % | 7/1/02 | |
Class B (POP) | | 1.10 | % | 6.02 | % | 6.09 | % | 7/1/02 | |
| | | | | | | | | |
Class C (NAV) | | 5.94 | % | 6.46 | % | 6.06 | % | 7/1/02 | |
Class C (POP) | | 6.11 | % | 6.46 | % | 6.06 | % | 7/1/02 | |
| | | | | | | | | |
Class M (NAV) | | 5.75 | % | 6.47 | % | 6.07 | % | 7/1/02 | |
Class M (POP) | | 3.80 | % | 6.26 | % | 6.07 | % | 7/1/02 | |
NOTES
(1) The Standard and Poor’s 500 Composite Stock (S&P 500) Index is an unmanaged index used as a general measure of market performance. Calculations assume dividends and capital gains are reinvested and do not include any managerial expenses. From inception, calculation is based on life of Class A shares. You cannot invest directly in an index.
The performance data presented represents past performance; future results may vary. Performance data does not reflect the deduction of taxes that would be paid on fund distributions or the redemption of fund shares. Investment return and principal value will fluctuate so that an investor’s shares, when redeemed, may be worth more or less than their original cost.
Current performance may be lower or higher than performance quoted. Please see www.transamericaidex.com for performance data current to the most recent month-end.
Public Offering Price (POP) returns include the reinvestment of dividends and capital gains and reflect the maximum sales charge of 5.5% for A shares and 1% for M shares or the maximum applicable contingent deferred sales charge (5% in the 1st year, decreasing to 0% after 6 years) for Class B shares. Class C shares do not impose a sales charge. Shares purchased prior to March 1, 2004 are subject to a maximum applicable contingent deferred sales charge (5% in the 1st year, decreasing to 0% after 7 years) for Class B shares and (2% in the 1st year, decreasing to 0% after 2 years) for Class C shares.Net Asset Value (NAV) returns include the reinvestment of dividends and capital gains but do not reflect any sales charges.
Investments that utilize options strategies may be subject to specific risks, including limited opportunity to participate in rising stock markets or increased risk during market declines. In general, mutual funds that invest in stocks are subject to risks including weaknesses in the market as a whole, in a particular industry, or in a specific holding, and from adverse political or economic developments here or abroad. Shareholders may lose some or all of the value of their guaranteed amount if they redeem before the end of the 5-year Guarantee Period. This material must be preceded or accompanied by a current prospectus, which includes specific contents regarding the investment objectives and policies of this Fund. TA IDEX Protected Principal Stock has been liquidated effective November 29, 2007.
79
UNDERSTANDING YOUR FUNDS EXPENSES
(unaudited)
SHAREHOLDER EXPENSES
Fund shareholders may incur two types of costs: (1) transaction costs, including sales charges (loads) on purchases, contingent deferred sales charges on redemptions and redemption fees; and (2) ongoing costs, including management fees, 12b-1 distribution and service fees, and other fund expenses.
The following Example is intended to help you understand your ongoing costs (in dollars and cents) of investing in the Fund and to compare these costs with the ongoing costs of investing in other funds.
The Example is based on an investment of $1,000 invested at May 1, 2007 and held for the entire period until October 31, 2007.
ACTUAL EXPENSES
The first line in the table below provides information about actual account values and actual expenses. You may use the information in this line, together with the amount you invested, to estimate the expenses that you paid over the period. Simply divide your account value by $1,000 (for example, an $8,600 account value divided by $1,000 = 8.6), then multiply the result by the number in the first line of your Fund under the heading entitled “Expenses Paid During Period” to estimate the expenses you paid on your account during this period. If your account is an IRA, your expenses could have included a $15 annual fee. The amount of any fee paid through your account would increase the estimate of expenses you paid during the period and decrease your ending account value.
HYPOTHETICAL EXAMPLE FOR COMPARISON PURPOSES
The second line in the table below provides information about hypothetical account values and hypothetical expenses based on the Fund’s actual expense ratio and an assumed rate of return of 5% per year before expenses, which is not the Fund’s actual return. The hypothetical account values and expenses may not be used to estimate the actual ending account balance or expenses you paid for the period. You may use this information to compare the ongoing costs of investing in your Fund and other funds. To do so, compare this 5% hypothetical example with the 5% hypothetical examples that appear in the shareholder reports of the other funds. As in the case of the actual expense example, if your account is subject to an IRA fee, the amount of the fee paid through your account would increase the hypothetical expenses you would have paid during the period and decrease the hypothetical ending account value.
Please note that the expenses shown in the table are meant to highlight your ongoing costs only and do not reflect any transactional costs, such as sales charges, redemption fees, brokerage commissions paid on purchases and sales of fund shares. Therefore, the second line under the Fund in the table is useful in comparing ongoing costs only, and will not help you determine the relative total costs of owning different funds. If any of these transaction costs were included, your costs would be higher. The expenses shown in the table do not reflect any fees that may be charged to you by brokers, financial intermediaries or other financial institutions.
| | Beginning | | Ending | | Annualized | | Expenses | |
| | Account | | Account | | Expense | | Paid During | |
| | Value | | Value | | Ratio | | Period (a) | |
Class A | | | | | | | | | |
Actual | | $ | 1,000.00 | | $ | 1,030.93 | | 2.25 | % | $ | 11.49 | |
Hypothetical (b) | | 1,000.00 | | 1,013.83 | | 2.25 | | 11.39 | |
| | | | | | | | | |
Class B | | | | | | | | | |
Actual | | 1,000.00 | | 1,026.68 | | 2.90 | | 14.77 | |
Hypothetical (b) | | 1,000.00 | | 1,010.56 | | 2.90 | | 14.66 | |
| | | | | | | | | |
Class C | | | | | | | | | |
Actual | | 1,000.00 | | 1,026.72 | | 2.90 | | 14.77 | |
Hypothetical (b) | | 1,000.00 | | 1,010.56 | | 2.90 | | 14.66 | |
| | | | | | | | | |
Class M | | | | | | | | | |
Actual | | 1,000.00 | | 1,024.21 | | 2.80 | | 14.25 | |
Hypothetical (b) | | 1,000.00 | | 1,011.06 | | 2.80 | | 14.15 | |
| | | | | | | | | | | | |
(a) Expenses are calculated using the Fund’s annualized expense ratio (as disclosed in the table), multiplied by the average account value for the period, multiplied by the number of days in the period (184 days), and divided by the number of days in the year (365 days).
(b) 5% return per year before expenses.
GRAPHICAL PRESENTATION OF SCHEDULE OF INVESTMENTS
By Sector
At October 31, 2007
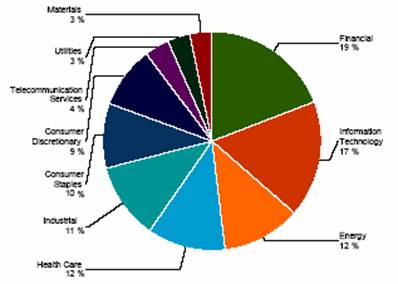
This chart shows the percentage breakdown by sector of the Fund’s total investment securities.
80
SCHEDULE OF INVESTMENTS
At October 31, 2007
(all amounts except share amounts in thousands)
| | Shares | | Value | |
CONVERTIBLE PREFERRED STOCKS (0.2%) | | | | | |
Hotels, Restaurants & Leisure (0.2%) | | | | | |
Carnival Corp. | | 290 | | $ | 14 | |
Total Preferred Stocks (cost $ 7) | | | | 14 | |
| | | | | |
COMMON STOCKS (99.5%) | | | | | |
Aerospace & Defense (2.8%) | | | | | |
Boeing Co. | | 537 | | 53 | |
General Dynamics Corp. | | 270 | | 24 | |
Goodrich Corp. | | 100 | | 7 | |
Honeywell International, Inc. | | 475 | | 29 | |
L-3 Communications Holdings, Inc. | | 95 | | 10 | |
Lockheed Martin Corp. | | 230 | | 25 | |
Northrop Grumman Corp. | | 242 | | 20 | |
Precision Castparts Corp. | | 105 | | 16 | |
Raytheon Co. | | 295 | | 19 | |
Rockwell Collins, Inc. | | 65 | | 5 | |
United Technologies Corp. | | 635 | | 49 | |
Air Freight & Logistics (0.9%) | | | | | |
CH Robinson Worldwide, Inc. | | 120 | | 6 | |
Expeditors International Washington | | 100 | | 5 | |
FedEx Corp. | | 200 | | 21 | |
United Parcel Service, Inc. Class B | | 665 | | 50 | |
Airlines (0.1%) | | | | | |
Southwest Airlines Co. | | 530 | | 8 | |
Auto Components (0.2%) | | | | | |
Goodyear Tire & Rubber Co. (The) ‡ | | 150 | | 4 | |
Johnson Controls, Inc. | | 410 | | 18 | |
Automobiles (0.4%) | | | | | |
Ford Motor Co. ‡ | | 1,365 | | 12 | |
General Motors Corp. | | 410 | | 16 | |
Harley-Davidson, Inc. | | 177 | | 9 | |
Beverages (2.3%) | | | | | |
Anheuser-Busch Cos., Inc. | | 517 | | 27 | |
Brown-Forman Corp. Class B | | 59 | | 4 | |
Coca-Cola Co. (The) | | 1,315 | | 81 | |
Coca-Cola Enterprises, Inc. | | 210 | | 5 | |
Constellation Brands, Inc. Class A ‡ | | 150 | | 4 | |
Molson Coors Brewing Co. Class B | | 100 | | 6 | |
Pepsi Bottling Group, Inc. | | 80 | | 4 | |
PepsiCo, Inc. | | 1,075 | | 79 | |
Biotechnology (1.3%) | | | | | |
Amgen, Inc. ‡ | | 690 | | 40 | |
Biogen IDEC, Inc. ‡ | | 198 | | 15 | |
Celgene Corp. ‡ | | 260 | | 17 | |
Genzyme Corp. ‡ | | 170 | | 13 | |
Gilead Sciences, Inc. ‡ | | 640 | | 29 | |
Building Products (0.1%) | | | | | |
American Standard Cos., Inc. | | 140 | | 5 | |
Masco Corp. | | 282 | | 7 | |
Capital Markets (3.1%) | | | | | |
American Capital Strategies, Ltd. | | 100 | | 4 | |
Ameriprise Financial, Inc. | | 150 | | 9 | |
Bear Stearns Cos., Inc. (The) | | 85 | | 10 | |
Charles Schwab Corp. (The) | | 629 | | 15 | |
E*Trade Financial Corp. ‡ | | 290 | | 3 | |
Federated Investors, Inc. Class B | | 80 | | $ | 3 | |
Franklin Resources, Inc. | | 120 | | 16 | |
Goldman Sachs Group, Inc. (The) | | 260 | | 64 | |
Janus Capital Group, Inc. | | 110 | | 4 | |
Legg Mason, Inc. | | 100 | | 8 | |
Lehman Brothers Holdings, Inc. | | 360 | | 23 | |
Merrill Lynch & Co., Inc. | | 545 | | 36 | |
Morgan Stanley | | 685 | | 46 | |
Northern Trust Corp. | | 140 | | 11 | |
State Street Corp. | | 250 | | 20 | |
T. Rowe Price Group, Inc. | | 170 | | 11 | |
Chemicals (1.7%) | | | | | |
Air Products & Chemicals, Inc. | | 130 | | 13 | |
Ashland, Inc. | | 40 | | 2 | |
Dow Chemical Co. (The) | | 605 | | 27 | |
Eastman Chemical Co. | | 80 | | 5 | |
Ecolab, Inc. | | 120 | | 6 | |
Ei DU Pont de Nemours & Co. | | 585 | | 29 | |
Hercules, Inc. | | 110 | | 2 | |
International Flavors & Fragrances, Inc. | | 65 | | 4 | |
Monsanto Co. | | 330 | | 32 | |
PPG Industries, Inc. | | 65 | | 5 | |
Praxair, Inc. | | 210 | | 18 | |
ROHM & Haas Co. | | 80 | | 4 | |
Sigma-Aldrich Corp. | | 80 | | 4 | |
Commercial Banks (3.7%) | | | | | |
Bank of New York Mellon Corp. | | 739 | | 36 | |
BB&T Corp. | | 390 | | 14 | |
Comerica, Inc. | | 55 | | 3 | |
Commerce Bancorp, Inc. | | 120 | | 5 | |
Fifth Third Bancorp | | 390 | | 12 | |
First Horizon National Corp. | | 120 | | 3 | |
Huntington Bancshares, Inc. | | 250 | | 4 | |
KeyCorp | | 280 | | 8 | |
M&T Bank Corp. | | 55 | | 5 | |
Marshall & Ilsley Corp. | | 180 | | 8 | |
National City Corp. | | 440 | | 11 | |
PNC Financial Services Group, Inc. | | 220 | | 16 | |
Regions Financial Corp. | | 453 | | 12 | |
SunTrust Banks, Inc. | | 230 | | 17 | |
Synovus Financial Corp. | | 244 | | 6 | |
US Bancorp | | 1,197 | | 40 | |
Wachovia Corp. | | 1,317 | | 60 | |
Wells Fargo & Co. | | 2,210 | | 75 | |
Zions Bancorporation | | 25 | | 2 | |
Commercial Services & Supplies (0.5%) | | | | | |
Allied Waste Industries, Inc. ‡ | | 200 | | 3 | |
Avery Dennison Corp. | | 50 | | 3 | |
Cintas Corp. | | 80 | | 3 | |
Equifax, Inc. | | 80 | | 3 | |
Monster Worldwide, Inc. ‡ | | 80 | | 3 | |
Pitney Bowes, Inc. | | 155 | | 6 | |
Robert Half International, Inc. | | 110 | | 3 | |
The notes to the financial statements are an integral part of this report.
81
| | Shares | | Value | |
Commercial Services & Supplies (continued) | | | | | |
RR Donnelley & Sons Co. | | 155 | | $ | 6 | |
Waste Management, Inc. | | 370 | | 14 | |
Communications Equipment (2.8%) | | | | | |
Ciena Corp. ‡ | | 10 | | 1 | |
Cisco Systems, Inc. ‡ | | 4,054 | | 134 | |
Corning, Inc. | | 1,110 | | 27 | |
JDS Uniphase Corp. ‡ | | 162 | | 2 | |
Juniper Networks, Inc. ‡ | | 305 | | 11 | |
Motorola, Inc. | | 1,555 | | 29 | |
Qualcomm, Inc. | | 1,118 | | 48 | |
Tellabs, Inc. ‡ | | 350 | | 3 | |
Computers & Peripherals (4.7%) | | | | | |
Apple, Inc. ‡ | | 610 | | 116 | |
Dell, Inc. ‡ | | 1,519 | | 46 | |
EMC Corp. ‡ | | 1,360 | | 35 | |
Hewlett-Packard Co. | | 1,735 | | 90 | |
International Business Machines Corp. | | 945 | | 110 | |
Lexmark International, Inc. Class A ‡ | | 50 | | 2 | |
Network Appliance, Inc. ‡ | | 205 | | 6 | |
QLogic Corp. ‡ | | 150 | | 2 | |
SanDisk Corp. ‡ | | 165 | | 7 | |
Sun Microsystems, Inc. ‡ | | 2,265 | | 13 | |
Teradata Corp. ‡ | | 140 | | 4 | |
Construction & Engineering (0.2%) | | | | | |
Fluor Corp. | | 65 | | 10 | |
Jacobs Engineering Group, Inc. ‡ | | 50 | | 5 | |
Construction Materials (0.1%) | | | | | |
Vulcan Materials Co. | | 90 | | 8 | |
Consumer Finance (0.9%) | | | | | |
American Express Co. | | 762 | | 47 | |
Capital One Financial Corp. | | 293 | | 19 | |
Discover Financial Services | | 350 | | 7 | |
SLM Corp. | | 280 | | 13 | |
Containers & Packaging (0.1%) | | | | | |
Ball Corp. | | 50 | | 2 | |
Bemis Co., Inc. | | 100 | | 3 | |
Pactiv Corp. ‡ | | 120 | | 3 | |
Sealed Air Corp. | | 75 | | 2 | |
Temple-Inland, Inc. | | 50 | | 3 | |
Diversified Consumer Services (0.1%) | | | | | |
Apollo Group, Inc. Class A ‡ | | 80 | | 6 | |
H&R Block, Inc. | | 250 | | 6 | |
Diversified Financial Services (4.8%) | | | | | |
Bank of America Corp. | | 2,960 | | 143 | |
CIT Group, Inc. | | 120 | | 4 | |
Citigroup, Inc. | | 3,340 | | 140 | |
CME Group, Inc. Class A | | 25 | | 17 | |
Intercontinental Exchange, Inc. ‡ | | 45 | | 8 | |
JPMorgan Chase & Co. | | 2,248 | | 106 | |
Leucadia National Corp. | | 106 | | 5 | |
Moody’s Corp. | | 140 | | 6 | |
NYSE Euronext | | 150 | | 14 | |
Diversified Telecommunication Services (3.1%) | | | | | |
AT&T, Inc. | | 4,074 | | $ | 170 | |
CenturyTel, Inc. | | 100 | | 4 | |
Citizens Communications Co. | | 260 | | 3 | |
Embarq Corp. | | 56 | | 3 | |
Qwest Communications International, Inc. ‡ | | 1,180 | | 9 | |
Verizon Communications, Inc. | | 1,955 | | 90 | |
Windstream Corp. | | 337 | | 5 | |
Electric Utilities (2.9%) | | | | | |
Allegheny Energy, Inc. ‡ | | 130 | | 8 | |
Ameren Corp. | | 130 | | 7 | |
American Electric Power Co., Inc. | | 270 | | 13 | |
CenterPoint Energy, Inc. | | 250 | | 4 | |
CMS Energy Corp. | | 180 | | 3 | |
Consolidated Edison, Inc. | | 170 | | 8 | |
Dominion Resources, Inc. | | 203 | | 19 | |
DTE Energy Co. | | 130 | | 6 | |
Duke Energy Corp. | | 889 | | 17 | |
Edison International | | 210 | | 12 | |
Entergy Corp. | | 85 | | 10 | |
Exelon Corp. | | 470 | | 39 | |
FirstEnergy Corp. | | 200 | | 14 | |
FPL Group, Inc. | | 235 | | 16 | |
NiSource, Inc. | | 210 | | 4 | |
PG&E Corp. | | 195 | | 10 | |
Pinnacle West Capital Corp. | | 50 | | 2 | |
PPL Corp. | | 260 | | 13 | |
Progress Energy, Inc. | | 180 | | 9 | |
Public Service Enterprise Group, Inc. | | 160 | | 15 | |
Sempra Energy | | 180 | | 11 | |
Southern Co. | | 511 | | 19 | |
TECO Energy, Inc. | | 170 | | 3 | |
Xcel Energy, Inc. | | 305 | | 7 | |
Electrical Equipment (0.4%) | | | | | |
Cooper Industries, Ltd. Class A | | 130 | | 7 | |
Emerson Electric Co. | | 543 | | 28 | |
Rockwell Automation, Inc. | | 55 | | 4 | |
Electronic Equipment & Instruments (0.5%) | | | | | |
Agilent Technologies, Inc. ‡ | | 250 | | 9 | |
Jabil Circuit, Inc. | | 150 | | 3 | |
Molex, Inc. ‡ | | 100 | | 3 | |
Tektronix, Inc. | | 61 | | 3 | |
Tyco Electronics, Ltd. | | 345 | | 12 | |
Tyco International, Ltd. | | 355 | | 15 | |
Energy Equipment & Services (2.3%) | | | | | |
Baker Hughes, Inc. | | 210 | | 18 | |
BJ Services Co. | | 210 | | 5 | |
Ensco International, Inc. | | 90 | | 5 | |
Halliburton Co. | | 600 | | 24 | |
Nabors Industries, Ltd. ‡ | | 210 | | 6 | |
National Oilwell Varco, Inc. ‡ | | 230 | | 17 | |
Noble Corp. | | 170 | | 9 | |
Rowan Cos. Inc. | | 85 | | 3 | |
The notes to the financial statements are an integral part of this report.
82
| | Shares | | Value | |
Energy Equipment & Services (continued) | | | | | |
Schlumberger, Ltd. | | 785 | | $ | 76 | |
Smith International, Inc. | | 140 | | 9 | |
Transocean, Inc. ‡ | | 190 | | 23 | |
Weatherford International, Ltd. ‡ | | 220 | | 14 | |
Food & Staples Retailing (2.2%) | | | | | |
Costco Wholesale Corp. | | 283 | | 19 | |
CVS Caremark Corp. | | 976 | | 41 | |
Kroger Co. (The) | | 445 | | 13 | |
Safeway, Inc. | | 290 | | 10 | |
Supervalu, Inc. | | 138 | | 5 | |
SYSCO Corp. | | 425 | | 14 | |
Walgreen Co. | | 645 | | 26 | |
Wal-Mart Stores, Inc. | | 1,585 | | 72 | |
Whole Foods Market, Inc. | | 80 | | 4 | |
Food Products (1.4%) | | | | | |
Archer-Daniels-Midland Co. | | 405 | | 14 | |
Campbell Soup Co. | | 170 | | 6 | |
ConAgra Foods, Inc. | | 360 | | 9 | |
Dean Foods Co. | | 120 | | 3 | |
General Mills, Inc. | | 220 | | 13 | |
Hershey Co. (The) | | 130 | | 6 | |
HJ Heinz Co. | | 220 | | 10 | |
Kellogg Co. | | 187 | | 10 | |
Kraft Foods, Inc. Class A | | 1,097 | | 37 | |
McCormick & Co., Inc. | | 70 | | 2 | |
Sara Lee Corp. | | 540 | | 9 | |
Tyson Foods, Inc. Class A | | 200 | | 3 | |
WM Wrigley Jr. Co. | | 165 | | 10 | |
Gas Utilities (0.1%) | | | | | |
Nicor, Inc. | | 20 | | 1 | |
Questar Corp. | | 120 | | 7 | |
Health Care Equipment & Supplies (1.6%) | | | | | |
Baxter International, Inc. | | 436 | | 26 | |
Becton Dickinson & Co. | | 150 | | 12 | |
Boston Scientific Corp. ‡ | | 935 | | 13 | |
Covidien, Ltd. | | 355 | | 15 | |
CR Bard, Inc. | | 80 | | 7 | |
Hospira, Inc. ‡ | | 100 | | 4 | |
Medtronic, Inc. | | 734 | | 35 | |
St Jude Medical, Inc. ‡ | | 185 | | 8 | |
Stryker Corp. | | 170 | | 12 | |
Varian Medical Systems, Inc. ‡ | | 70 | | 3 | |
Zimmer Holdings, Inc. ‡ | | 115 | | 8 | |
Health Care Providers & Services (2.2%) | | | | | |
Aetna, Inc. | | 335 | | 19 | |
AmerisourceBergen Corp. Class A | | 120 | | 6 | |
Cardinal Health, Inc. | | 250 | | 17 | |
Cigna Corp. | | 180 | | 10 | |
Coventry Health Care, Inc. ‡ | | 90 | | 5 | |
Express Scripts, Inc. Class A ‡ | | 180 | | 11 | |
Humana, Inc. ‡ | | 65 | | 5 | |
Laboratory Corp. of America Holdings ‡ | | 100 | | 7 | |
Manor Care, Inc. | | 30 | | 2 | |
McKesson Corp. | | 190 | | $ | 13 | |
Medco Health Solutions, Inc. ‡ | | 173 | | 16 | |
Patterson Cos., Inc. ‡ | | 80 | | 3 | |
Quest Diagnostics, Inc. | | 100 | | 5 | |
Tenet Healthcare Corp. ‡ | | 500 | | 2 | |
UnitedHealth Group, Inc. | | 875 | | 43 | |
WellPoint, Inc. ‡ | | 420 | | 33 | |
Health Care Technology (0.0%) | | | | | |
IMS Health, Inc. | | 150 | | 4 | |
Hotels, Restaurants & Leisure (1.3%) | | | | | |
Darden Restaurants, Inc. | | 80 | | 3 | |
Harrah’s Entertainment, Inc. | | 110 | | 10 | |
International Game Technology | | 185 | | 8 | |
Marriott International, Inc. Class A | | 220 | | 9 | |
McDonald’s Corp. | | 766 | | 46 | |
Starbucks Corp. ‡ | | 485 | | 13 | |
Starwood Hotels & Resorts Worldwide | | 140 | | 8 | |
Wendy’s International, Inc. | | 80 | | 3 | |
Wyndham Worldwide Corp. | | 110 | | 4 | |
Yum! Brands, Inc. | | 380 | | 15 | |
Household Durables (0.5%) | | | | | |
Black & Decker Corp. | | 50 | | 4 | |
Centex Corp. | | 120 | | 3 | |
Dr Horton, Inc. | | 260 | | 3 | |
Fortune Brands, Inc. | | 55 | | 5 | |
Harman International Industries, Inc. | | 50 | | 4 | |
KB Home | | 50 | | 1 | |
Leggett & Platt, Inc. | | 150 | | 3 | |
Lennar Corp. Class A | | 100 | | 2 | |
Newell Rubbermaid, Inc. | | 210 | | 6 | |
Pulte Homes, Inc. | | 175 | | 3 | |
Snap-On, Inc. | | 50 | | 3 | |
Stanley Works (The) | | 80 | | 5 | |
Whirlpool Corp. | | 75 | | 6 | |
Household Products (2.2%) | | | | | |
Clorox Co. | | 80 | | 5 | |
Colgate-Palmolive Co. | | 345 | | 26 | |
Kimberly-Clark Corp. | | 243 | | 17 | |
Procter & Gamble Co. | | 2,149 | | 150 | |
Independent Power Producers & Energy Traders (0.3%) | | | | | |
AES Corp. (The) ‡ | | 490 | | 11 | |
Constellation Energy Group, Inc. | | 130 | | 12 | |
Dynegy, Inc. Class A ‡ | | 428 | | 4 | |
Industrial Conglomerates (3.7%) | | | | | |
3M Co. | | 500 | | 43 | |
General Electric Co. | | 6,874 | | 283 | |
Textron, Inc. | | 170 | | 12 | |
Insurance (4.3%) | | | | | |
ACE, Ltd. | | 175 | | 11 | |
Aflac, Inc. | | 340 | | 21 | |
Allstate Corp. (The) | | 420 | | 22 | |
AMBAC Financial Group, Inc. | | 90 | | 3 | |
American International Group, Inc. | | 1,710 | | 108 | |
The notes to the financial statements are an integral part of this report.
83
| | Shares | | Value | |
Insurance (continued) | | | | | |
AON Corp. | | 219 | | $ | 10 | |
Assurant, Inc. | | 50 | | 3 | |
Chubb Corp. | | 260 | | 14 | |
Cincinnati Financial Corp. | | 112 | | 4 | |
Genworth Financial, Inc. Class A | | 300 | | 8 | |
Hartford Financial Services Group, Inc. | | 200 | | 19 | |
Lincoln National Corp. | | 179 | | 11 | |
Loews Corp. | | 300 | | 15 | |
Marsh & McLennan Cos., Inc. | | 390 | | 10 | |
MBIA, Inc. | | 98 | | 4 | |
MetLife, Inc. | | 520 | | 36 | |
Principal Financial Group, Inc. | | 170 | | 12 | |
Progressive Corp. (The) | | 520 | | 10 | |
Prudential Financial, Inc. | | 305 | | 30 | |
SAFECO Corp. | | 40 | | 2 | |
St. Paul Travelers Cos., Inc. (The) ‡ | | 402 | | 21 | |
Torchmark Corp. | | 75 | | 5 | |
Unum Group | | 260 | | 6 | |
XL Capital, Ltd. Class A | | 75 | | 5 | |
Internet & Catalog Retail (0.3%) | | | | | |
Amazon.Com, Inc. ‡ | | 190 | | 17 | |
Expedia, Inc. ‡ | | 150 | | 5 | |
IAC/InterActiveCorp ‡ | | 150 | | 4 | |
Internet Software & Services (2.0%) | | | | | |
Akamai Technologies, Inc. ‡ | | 100 | | 4 | |
eBay, Inc. ‡ | | 794 | | 29 | |
Google, Inc. Class A ‡ | | 165 | | 116 | |
VeriSign, Inc. ‡ | | 170 | | 6 | |
Yahoo!, Inc. ‡ | | 875 | | 27 | |
IT Services (0.8%) | | | | | |
Affiliated Computer Services, Inc. Class A ‡ | | 80 | | 4 | |
Automatic Data Processing, Inc. | | 365 | | 18 | |
Cognizant Technology Solutions Corp. Class A ‡ | | 200 | | 8 | |
Computer Sciences Corp. ‡ | | 130 | | 7 | |
Convergys Corp. ‡ | | 120 | | 2 | |
Electronic Data Systems Corp. | | 370 | | 8 | |
Fidelity National Information Services, | | 100 | | 5 | |
Fiserv, Inc. ‡ | | 65 | | 4 | |
Paychex, Inc. | | 185 | | 8 | |
Unisys Corp. ‡ | | 350 | | 2 | |
Western Union Co. (The) | | 500 | | 11 | |
Leisure Equipment & Products (0.2%) | | | | | |
Brunswick Corp. | | 100 | | 2 | |
Eastman Kodak Co. | | 210 | | 6 | |
Hasbro, Inc. | | 100 | | 3 | |
Mattel, Inc. | | 300 | | 6 | |
Life Sciences Tools & Services (0.3%) | | | | | |
Applera Corp. - Applied Biosystems | | 120 | | 5 | |
Millipore Corp. ‡ | | 40 | | 3 | |
PerkinElmer, Inc. | | 45 | | 1 | |
Thermo Fisher Scientific, Inc. ‡ | | 290 | | 17 | |
Waters Corp. ‡ | | 80 | | 6 | |
Machinery (1.6%) | | | | | |
Caterpillar, Inc. | | 42 | | $ | 32 | |
Cummins, Inc. | | 80 | | 9 | |
Danaher Corp. | | 150 | | 13 | |
Deere & Co. | | 105 | | 16 | |
Dover Corp. | | 130 | | 6 | |
Eaton Corp. | | 110 | | 10 | |
Illinois Tool Works, Inc. | | 290 | | 17 | |
Ingersoll-Rand Co., Ltd. Class A | | 180 | | 9 | |
ITT Corp. | | 75 | | 5 | |
PACCAR, Inc. | | 250 | | 14 | |
Pall Corp. | | 70 | | 3 | |
Parker Hannifin Corp. | | 100 | | 8 | |
Terex Corp. ‡ | | 80 | | 6 | |
Media (3.0%) | | | | | |
CBS Corp. Class B | | 480 | | 14 | |
Clear Channel Communications, Inc. | | 345 | | 13 | |
Comcast Corp. Class A ‡ | | 2,038 | | 43 | |
DIRECTV Group, Inc. (The) ‡ | | 495 | | 13 | |
Dow Jones & Co., Inc. | | 50 | | 3 | |
EW Scripps Co. Class A | | 80 | | 4 | |
Gannett Co., Inc. | | 165 | | 7 | |
Interpublic Group of Cos., Inc. ‡ | | 339 | | 4 | |
McGraw-Hill Cos., Inc. (The) | | 220 | | 11 | |
Meredith Corp. | | 40 | | 2 | |
New York Times Co. (The) Class A | | 75 | | 1 | |
News Corp. Class A | | 1,565 | | 34 | |
Omnicom Group, Inc. | | 200 | | 10 | |
Time Warner, Inc. | | 2,474 | | 45 | |
Tribune Co. | | 50 | | 2 | |
Viacom, Inc. Class B ‡ | | 490 | | 20 | |
Walt Disney Co. (The) | | 1,303 | | 45 | |
Metals & Mining (1.1%) | | | | | |
Alcoa, Inc. | | 620 | | 25 | |
Allegheny Technologies, Inc. | | 85 | | 9 | |
Freeport-McMoRan Copper & Gold, Inc. | | 259 | | 30 | |
Newmont Mining Corp. | | 320 | | 16 | |
Nucor Corp. | | 190 | | 12 | |
Titanium Metals Corp. ‡ | | 40 | | 1 | |
U.S. Steel Corp. | | 90 | | 10 | |
Multiline Retail (0.9%) | | | | | |
Big Lots, Inc. ‡ | | 100 | | 2 | |
Dillard’s, Inc. Class A | | 50 | | 1 | |
Family Dollar Stores, Inc. | | 100 | | 2 | |
JC Penney Co., Inc. | | 140 | | 8 | |
Kohl’s Corp. ‡ | | 210 | | 12 | |
Macy’s, Inc. | | 304 | | 10 | |
Nordstrom, Inc. | | 120 | | 5 | |
Sears Holdings Corp. ‡ | | 58 | | 8 | |
Target Corp. | | 535 | | 33 | |
Multi-Utilities (0.0%) | | | | | |
Integrys Energy Group, Inc. ‡ | | 32 | | 2 | |
The notes to the financial statements are an integral part of this report.
84
| | Shares | | Value | |
Office Electronics (0.1%) | | | | | |
Xerox Corp. ‡ | | 690 | | $ | 12 | |
Oil, Gas & Consumable Fuels (9.3%) | | | | | |
Anadarko Petroleum Corp. | | 320 | | 19 | |
Apache Corp. | | 220 | | 23 | |
Chesapeake Energy Corp. | | 280 | | 11 | |
Chevron Corp. | | 1,428 | | 131 | |
ConocoPhillips | | 1,082 | | 92 | |
Consol Energy, Inc. | | 105 | | 6 | |
Devon Energy Corp. | | 257 | | 24 | |
El Paso Corp. | | 490 | | 9 | |
EOG Resources, Inc. | | 150 | | 13 | |
Exxon Mobil Corp. | | 3,677 | | 338 | |
Hess Corp. | | 180 | | 13 | |
Marathon Oil Corp. | | 480 | | 28 | |
Murphy Oil Corp. | | 130 | | 10 | |
Noble Energy, Inc. | | 100 | | 8 | |
Occidental Petroleum Corp. | | 570 | | 39 | |
Peabody Energy Corp. | | 170 | | 10 | |
Spectra Energy Corp. | | 454 | | 12 | |
Sunoco, Inc. | | 100 | | 7 | |
Tesoro Corp. | | 100 | | 6 | |
Valero Energy Corp. | | 370 | | 26 | |
Williams Cos., Inc. | | 365 | | 13 | |
XTO Energy, Inc. | | 263 | | 17 | |
Paper & Forest Products (0.3%) | | | | | |
International Paper Co. | | 290 | | 11 | |
MeadWestvaco Corp. | | 120 | | 4 | |
Weyerhaeuser Co. | | 130 | | 10 | |
Personal Products (0.2%) | | | | | |
Avon Products, Inc. | | 300 | | 12 | |
Estee Lauder Cos., Inc. (The) Class A | | 70 | | 3 | |
Pharmaceuticals (6.2%) | | | | | |
Abbott Laboratories | | 1,005 | | 55 | |
Allergan, Inc. | | 200 | | 13 | |
Barr Pharmaceuticals, Inc. ‡ | | 25 | | 1 | |
Bristol-Myers Squibb Co. | | 1,368 | | 41 | |
Eli Lilly & Co. | | 686 | | 37 | |
Forest Laboratories, Inc. ‡ | | 200 | | 8 | |
Johnson & Johnson | | 1,936 | | 126 | |
King Pharmaceuticals, Inc. ‡ | | 250 | | 3 | |
Merck & Co., Inc. | | 1,435 | | 84 | |
Mylan Laboratories, Inc. | | 200 | | 3 | |
Pfizer, Inc. | | 4,660 | | 115 | |
Schering-Plough Corp. | | 1,065 | | 32 | |
Watson Pharmaceuticals, Inc. ‡ | | 100 | | 3 | |
Wyeth | | 878 | | 43 | |
Real Estate Investment Trusts (1.2%) | | | | | |
Apartment Investment & Management Co. Class A (2) | | 90 | | 4 | |
AvalonBay Communities, Inc. (2) | | 55 | | 7 | |
Boston Properties, Inc. (2) | | 60 | | 6 | |
Developers Diversified Realty Corp. (2) | | 70 | | 4 | |
Equity Residential (2) | | 170 | | $ | 7 | |
General Growth Properties, Inc. (2) | | 150 | | 8 | |
Host Hotels & Resorts, Inc. (2) | | 400 | | 9 | |
Kimco Realty Corp. (2) | | 169 | | 7 | |
Plum Creek Timber Co., Inc. (2) | | 120 | | 5 | |
ProLogis (2) | | 191 | | 14 | |
Public Storage, Inc. (2) | | 90 | | 7 | |
Simon Property Group, Inc. (2) | | 160 | | 17 | |
Vornado Realty Trust (2) | | 110 | | 12 | |
Real Estate Management & Development (0.0%) | | | | | |
CB Richard Ellis Group, Inc. Class A ‡ | | 150 | | 4 | |
Road & Rail (0.7%) | | | | | |
Burlington Northern Santa Fe Corp. | | 210 | | 18 | |
CSX Corp. | | 300 | | 14 | |
Norfolk Southern Corp. | | 270 | | 14 | |
Ryder System, Inc. | | 50 | | 2 | |
Union Pacific Corp. | | 135 | | 17 | |
Semiconductors & Semiconductor Equipment (2.7%) | | | | | |
Advanced Micro Devices, Inc. ‡ | | 400 | | 5 | |
Altera Corp. | | 265 | | 5 | |
Analog Devices, Inc. | | 200 | | 7 | |
Applied Materials, Inc. | | 981 | | 19 | |
Broadcom Corp. Class A ‡ | | 330 | | 11 | |
Intel Corp. | | 3,934 | | 106 | |
KLA-Tencor Corp. | | 135 | | 7 | |
Linear Technology Corp. | | 160 | | 5 | |
LSI Corp. ‡ | | 520 | | 3 | |
Memc Electronic Materials, Inc. ‡ | | 140 | | 10 | |
Microchip Technology, Inc. | | 112 | | 4 | |
Micron Technology, Inc. ‡ | | 590 | | 6 | |
National Semiconductor Corp. | | 190 | | 5 | |
Novellus Systems, Inc. ‡ | | 45 | | 1 | |
NVIDIA Corp. ‡ | | 370 | | 13 | |
Teradyne, Inc. ‡ | | 200 | | 3 | |
Texas Instruments, Inc. | | 1,000 | | 33 | |
Xilinx, Inc. | | 220 | | 5 | |
Software (3.7%) | | | | | |
Adobe Systems, Inc. ‡ | | 420 | | 20 | |
Autodesk, Inc. ‡ | | 170 | | 8 | |
BMC Software, Inc. ‡ | | 130 | | 4 | |
CA, Inc. | | 270 | | 7 | |
Citrix Systems, Inc. ‡ | | 120 | | 5 | |
Compuware Corp. ‡ | | 300 | | 3 | |
Electronic Arts, Inc. ‡ | | 210 | | 13 | |
Intuit, Inc. ‡ | | 235 | | 8 | |
Microsoft Corp. | | 5,380 | | 198 | |
Novell, Inc. ‡ | | 350 | | 3 | |
Oracle Corp. ‡ | | 2,636 | | 58 | |
Symantec Corp. ‡ | | 613 | | 12 | |
Specialty Retail (1.6%) | | | | | |
Abercrombie & Fitch Co. Class A | | 70 | | 6 | |
AutoNation, Inc. ‡ | | 150 | | 3 | |
AutoZone, Inc. ‡ | | 35 | | 4 | |
The notes to the financial statements are an integral part of this report.
85
| | Shares | | Value | |
Specialty Retail (continued) | | | | | |
Bed Bath & Beyond, Inc.‡ | | 210 | | $ | 7 | |
Best Buy Co., Inc. | | 270 | | 13 | |
Circuit City Stores, Inc. | | 110 | | 1 | |
Gap, Inc. (The) | | 370 | | 7 | |
Home Depot, Inc. | | 1,135 | | 36 | |
Limited Brands, Inc. | | 250 | | 5 | |
Lowe’s Cos., Inc. | | 985 | | 26 | |
Office Depot, Inc.‡ | | 210 | | 4 | |
OfficeMax, Inc. | | 65 | | 2 | |
RadioShack Corp. | | 100 | | 2 | |
Sherwin-Williams Co. (The) | | 25 | | 2 | |
Staples, Inc. | | 465 | | 11 | |
Tiffany & Co. | | 80 | | 4 | |
TJX Cos, Inc. | | 310 | | 9 | |
Textiles, Apparel & Luxury Goods (0.5%) | | | | | |
Coach, Inc.‡ | | 260 | | 10 | |
Jones Apparel Group, Inc. | | 100 | | 2 | |
Liz Claiborne, Inc. | | 100 | | 3 | |
Nike, Inc. Class B | | 260 | | 17 | |
Polo Ralph Lauren Corp. Class A | | 50 | | 3 | |
V.F. Corp. | | 80 | | 7 | |
Thrifts & Mortgage Finance (1.1%) | | | | | |
Countrywide Financial Corp. | | 430 | | 7 | |
Fannie Mae | | 676 | | 39 | |
Freddie Mac | | 443 | | 23 | |
Hudson City Bancorp, Inc. | | 350 | | 5 | |
MGIC Investment Corp. | | 80 | | 2 | |
Sovereign Bancorp, Inc. | | 285 | | 4 | |
Washington Mutual, Inc. | | 613 | | 17 | |
Tobacco (1.3%) | | | | | |
Altria Group, Inc. | | 1,394 | | 102 | |
Reynolds American, Inc. | | 125 | | 8 | |
UST, Inc. | | 100 | | 5 | |
Trading Companies & Distributors (0.1%) | | | | | |
Genuine Parts Co. | | 130 | | 6 | |
WW Grainger, Inc. | | 60 | | 6 | |
Wireless Telecommunication Services (0.5%) | | | | | |
ALLTEL Corp. | | 230 | | 16 | |
Sprint Nextel Corp. | | 1,958 | | 34 | |
Total Common Stocks (cost $5,024) | | | | 9,105 | |
| | | | | | |
| | Contracts (·) | | Value | |
PURCHASED OPTIONS (0.3%) | | | | | |
Put Options (0.3%) | | | | | |
S&P 500 Index | | 5 | | q | |
Put Strike $1,350.00 | | | | | |
Expires 11/17/2007 | | | | | |
S&P 500 Index | | 9 | | 4 | |
Put Strike $1,350.00 | | | | | |
Expires 12/22/2007 | | | | | |
S&P 500 Index | | 8 | | 1 | |
Put Strike $1,375.00 | | | | | |
Expires 11/17/2007 | | | | | |
S&P 500 Index | | 8 | | $ | 1 | |
Put Strike $1,400.00 | | | | | |
Expires 11/17/2007 | | | | | |
S&P 500 Index | | 7 | | 6 | |
Put Strike $1,400.00 | | | | | |
Expires 12/22/2007 | | | | | |
S&P 500 Index | | 10 | | 10 | |
Put Strike $1,425.00 | | | | | |
Expires 12/22/2007 | | | | | |
S&P 500 Index | | 10 | | 6 | |
Put Strike $1,375.00 | | | | | |
Expires 12/22/2007 | | | | | |
Total Purchased Options (cost $98) | | | | 28 | |
Total Investment Securities (cost $5,129) | | | | $ | 9,147 | |
| | Contracts (·) | | Value | |
WRITTEN OPTIONS - 3.3% | | | | | |
Covered Call Options - 3.3% | | | | | |
S&P 500 Index | | 14 | | 80 | |
Call Strike $1,525.00 | | | | | |
Expires 12/22/2007 | | | | | |
S&P 500 Index | | 7 | | 54 | |
Call Strike $1,475.00 | | | | | |
Expires 11/17/2007 | | | | | |
S&P 500 Index | | 12 | | 67 | |
Call Strike $1,500.00 | | | | | |
Expires 11/17/2007 | | | | | |
S&P 500 Index | | 7 | | 53 | |
Call Strike $1,500.00 | | | | | |
Expires 12/22/2007 | | | | | |
S&P 500 Index | | 7 | | 26 | |
Call Strike $1,525.00 | | | | | |
Expires 11/17/2007 | | | | | |
S&P 500 Index | | 10 | | 21 | |
Call Strike $1,550.00 | | | | | |
Expires 11/17/2007 | | | | | |
| | | | | |
Total Written Options (premiums: $340) | | | | 301 | |
The notes to the financial statements are an integral part of this report.
86
NOTES TO SCHEDULE OF INVESTMENTS
q Value is less than $1
‡ Non Income Producing
· Contract Amounts are not in thousands
# Aggregate cost for federal income tax purposes is $5,128. Aggregate gross unrealized appreciation for all securities in which there is an excess of value over tax cost and aggregate gross unrealized depreciation for all securities in which there is an excess of tax cost over value were $4,190 and $171, respectively. Net unrealized appreciation for tax purposes is $4,019.
(2) Real Estate Investment Trust
The notes to the financial statements are an integral part of this report.
87
STATEMENTS OF ASSETS & LIABILITIES
AT October 31, 2007
(all amounts except per share amounts in thousands)
| | TA IDEX | | | | | | | | | |
| | American | | TA IDEX Clarion | | TA IDEX | | TA IDEX | | TA IDEX Legg | |
| | Century Large | | Global Real | | Evergreen | | Jennison | | Mason Partners | |
| | Company Value | | Estate Securities | | Health Care | | Growth | | Investors Value | |
Assets: | | | | | | | | | | | |
Investment securities, at cost | | $ | 634,942 | | $ | 343,215 | | $ | 336,778 | | $ | 149,252 | | $ | 73,367 | |
Foreign currency cost | | — | | 1 | | — | | — | | — | |
Securities loaned, at value | | 16,592 | | 41,935 | | 56,194 | | 10,055 | | 9,472 | |
Investment securities, at value | | $ | 702,295 | | $ | 414,599 | | $ | 398,910 | | $ | 190,476 | | $ | 91,555 | |
Cash | | 31,761 | | 6,659 | | 29,112 | | 6,693 | | 4,892 | |
Foreign currency | | — | | — | | — | | — | | — | |
Receivables: | | | | | | | | | | | |
Investment securities sold | | — | | 4,404 | | 2,601 | | 4,515 | | — | |
Shares of beneficial interest sold | | 196 | | 207 | | — | | 112 | | — | |
Interest | | 81 | | 26 | | 76 | | 19 | | 11 | |
Income from loaned securities | | 13 | | 10 | | 32 | | 6 | | — | |
Dividends | | 1,149 | | 786 | | 155 | | 81 | | 92 | |
Dividend reclaims | | — | | 1 | | 137 | | 24 | | 6 | |
Variation margin | | 143 | | — | | — | | — | | — | |
Other | | 10 | | 6 | | 10 | | 8 | | 12 | |
| | $ | 735,648 | | $ | 426,698 | | $ | 431,033 | | $ | 201,934 | | $ | 96,568 | |
| | | | | | | | | | | |
Liabilities: | | | | | | | | | | | |
Investment securities purchased | | 1,376 | | 2,305 | | 915 | | 2,815 | | 1,084 | |
Accounts payable and accrued liabilities: | | | | | | | | | | | |
Shares of beneficial interest redeemed | | 43 | | 5 | | 134 | | 54 | | 4 | |
Management and advisory fees | | 516 | | 264 | | 278 | | 131 | | 62 | |
Transfer agent fees | | 6 | | 3 | | 2 | | 9 | | 6 | |
Administration fees | | 13 | | 7 | | 6 | | 3 | | 2 | |
Foreign currency payable | | — | | 371 | | — | | — | | — | |
Payable for collateral for securities on loan | | 17,187 | | 43,412 | | 58,335 | | 10,319 | | 9,828 | |
Unrealized depreciation on forward foreign currency contracts | | — | | — | | — | | — | | — | |
Other | | 67 | | 68 | | 67 | | 41 | | 38 | |
| | 19,208 | | 46,435 | | 59,737 | | 13,372 | | 11,024 | |
Net Assets | | $ | 716,440 | | $ | 380,263 | | $ | 371,296 | | $ | 188,562 | | $ | 85,544 | |
Net Assets Consist of: | | | | | | | | | | | |
Shares of beneficial interest, unlimited shares authorized, no par value | | $ | 629,600 | | $ | 271,398 | | $ | 280,440 | | $ | 147,409 | | $ | 63,373 | |
Undistributed (accumulated) net investment income (loss) | | 9,098 | | (119 | ) | 590 | | 224 | | 668 | |
Undistributed (accumulated) net realized gain (loss) from investments: | | 9,868 | | 37,593 | | 28,123 | | (296 | ) | 3,314 | |
Net unrealized appreciation (depreciation) on: | | | | | | | | | | | |
Investment securities | | 67,353 | | 71,384 | | 62,133 | | 41,225 | | 18,189 | |
Futures contracts | | 521 | | — | | — | | — | | — | |
Translation of assets and liabilities denominated in foreign currencies | | — | | 7 | | 10 | | — | | — | |
Net Assets | | $ | 716,440 | | $ | 380,263 | | $ | 371,296 | | $ | 188,562 | | $ | 85,544 | |
| | | | | | | | | | | | | | | | |
Net Assets by Class: | | | | | | | | | | | |
Class A | | $ | 6,612 | | $ | 6,050 | | $ | 3,188 | | $ | 9,065 | | $ | 9,238 | |
Class B | | 10,023 | | 4,004 | | 3,099 | | 13,754 | | 9,104 | |
Class C | | 4,474 | | 2,459 | | 1,530 | | 4,928 | | 2,469 | |
Class I | | 695,331 | | 367,750 | | 363,479 | | 160,815 | | 64,733 | |
Shares Outstanding: | | | | | | | | | | | |
Class A | | 516 | | 295 | | 229 | | 701 | | 914 | |
Class B | | 809 | | 196 | | 231 | | 1,138 | | 990 | |
Class C | | 362 | | 121 | | 115 | | 407 | | 270 | |
Class I | | 54,251 | | 17,958 | | 25,679 | | 12,326 | | 6,402 | |
Net Asset Value Per Share: | | | | | | | | | | | |
Class A | | $ | 12.82 | | $ | 20.53 | | $ | 13.93 | | $ | 12.93 | | $ | 10.11 | |
Class B | | 12.39 | | 20.47 | | 13.42 | | 12.09 | | 9.20 | |
Class C | | 12.37 | | 20.30 | | 13.35 | | 12.12 | | 9.13 | |
Class I | | 12.82 | | 20.48 | | 14.15 | | 13.05 | | 10.11 | |
| | | | | | | | | | | |
Maximum Offering Price Per Share (a) | | | | | | | | | | | |
Class A | | $ | 13.57 | | $ | 21.72 | | $ | 14.74 | | $ | 13.68 | | $ | 10.70 | |
Class M | | — | | — | | — | | — | | — | |
The notes to the financial statements are an integral part of this report.
88
| | | | TA IDEX MFS | | | | | | TA IDEX | |
| | TA IDEX Marsico | | International | | TA IDEX PIMCO | | TA IDEX PIMCO | | Protected | |
| | Growth | | Equity | | Real Return TIPS | | Total Return | | Principal Stock | |
Assets: | | | | | | | | | | | |
Investment securities, at cost | | $ | 342,913 | | $ | 24,234 | | $ | 1,206,903 | | $ | 760,544 | | $ | 5,129 | |
Foreign currency cost | | — | | 1 | | 4,929 | | 4,428 | | — | |
Securities loaned, at value | | 24,958 | | 112 | | — | | 19,384 | | — | |
Investment securities, at value | | $ | 441,229 | | $ | 29,202 | | $ | 1,220,522 | | $ | 763,704 | | $ | 9,147 | |
Cash | | 18,085 | | 195 | | 3,464 | | 4,462 | | 947 | |
Foreign currency | | — | | — | | 4,513 | | 4,580 | | — | |
Receivables: | | | | | | | | | | | |
Investment securities sold | | 2,069 | | 72 | | 241,511 | | 213,813 | | — | |
Shares of beneficial interest sold | | 436 | | — | | 140 | | — | | — | |
Interest | | 49 | | — | | 7,711 | | 3,291 | | 2 | |
Income from loaned securities | | 7 | | — | | — | | — | | — | |
Dividends | | 331 | | 83 | | — | | — | | 10 | |
Dividend reclaims | | 36 | | 58 | | — | | — | | — | |
Variation margin | | — | | — | | 540 | | — | | — | |
Swap agreements at value | | — | | — | | 990 | | 4,136 | | — | |
Unrealized appreciation on forward foreign currency contracts | | — | | — | | 2,617 | | 3,684 | | — | |
Other | | 6 | | 8 | | 14 | | 8 | | 4 | |
| | $ | 462,248 | | $ | 29,618 | | $ | 1,482,022 | | $ | 997,678 | | $ | 10,110 | |
Liabilities: | | | | | | | | | | | |
Premium on written option & swaption | | $ | — | | $ | — | | $ | (1,625 | ) | $ | (2,296 | ) | $ | (340 | ) |
Investment securities purchased | | 11,083 | | 13 | | 780,150 | | 412,537 | | — | |
Accounts payable and accrued liabilities: | | | | | | | | | | | |
Shares of beneficial interest redeemed | | 42 | | 41 | | 273 | | 40 | | 615 | |
Management and advisory fees | | 290 | | 24 | | 417 | | 332 | | 13 | |
Distribution and service fees | | — | | — | | — | | — | | 8 | |
Transfer agent fees | | 6 | | 10 | | 1 | | 4 | | 1 | |
Administration fees | | 7 | | 1 | | 12 | | 10 | | — | |
Foreign currency payable | | — | | — | | — | | — | | — | |
Payable for collateral for securities on loan | | 25,584 | | 118 | | — | | 19,795 | | — | |
Unrealized depreciation on forward foreign currency contracts | | — | | — | | 800 | | 1,237 | | — | |
Written swaptions and options | | — | | — | | 1,569 | | 2,874 | | 301 | |
Payable for when-issued securities | | — | | — | | — | | 3,941 | | — | |
Variation margin | | — | | — | | — | | 237 | | — | |
Other | | 48 | | 44 | | 152 | | 89 | | 21 | |
| | 37,060 | | 251 | | 783,374 | | 441,096 | | 959 | |
Net Assets | | $ | 425,188 | | $ | 29,367 | | $ | 698,648 | | $ | 556,582 | | $ | 9,151 | |
| | | | | | | | | | | |
Net Assets Consist of: | | | | | | | | | | | |
Shares of beneficial interest, unlimited shares authorized, no par value | | $ | 327,429 | | $ | 24,562 | | $ | 703,532 | | $ | 544,437 | | $ | (4,403 | ) |
Undistributed (accumulated) net investment income (loss) | | 398 | | (107 | ) | 5,132 | | 166 | | — | |
Undistributed (accumulated) net realized gain (loss) from investments: | | (955 | ) | (65 | ) | (24,856 | ) | 1,561 | | 9,496 | |
Net unrealized appreciation (depreciation) on: | | | | | | | | | | | |
Investment securities | | 98,316 | | 4,968 | | 13,619 | | 3,177 | | 4,019 | |
Futures contracts | | — | | — | | (1,135 | ) | 1,757 | | — | |
Written option and swaption contracts | | — | | — | | 57 | | (566 | ) | 39 | |
Swap agreements | | — | | — | | 262 | | 3,441 | | — | |
Translation of assets and liabilities denominated in foreign currencies | | — | | 9 | | 2,037 | | 2,609 | | — | |
Net Assets | | $ | 425,188 | | $ | 29,367 | | $ | 698,648 | | $ | 556,582 | | $ | 9,151 | |
Net Assets by Class: | | | | | | | | | | | |
Class A | | $ | 8,451 | | $ | 10,194 | | $ | 3,045 | | $ | 4,574 | | $ | 1,450 | |
Class B | | 11,589 | | 13,841 | | 2,616 | | 7,973 | | 6,683 | |
Class C | | 8,455 | | 5,332 | | 2,045 | | 3,725 | | 905 | |
Class I | | 396,693 | | — | | 690,942 | | 540,310 | | — | |
Class M | | — | | — | | — | | — | | 113 | |
Shares Outstanding: | | | | | | | | | | | |
Class A | | 590 | | 2,058 | | 298 | | 436 | | 112 | |
Class B | | 852 | | 3,235 | | 259 | | 760 | | 527 | |
Class C | | 621 | | 1,276 | | 203 | | 356 | | 71 | |
Class I | | 27,541 | | — | | 67,578 | | 51,586 | | — | |
Class M | | — | | — | | — | | — | | 9 | |
Net Asset Value Per Share: | | | | | | | | | | | |
Class A | | $ | 14.31 | | $ | 4.95 | | $ | 10.20 | | $ | 10.48 | | $ | 12.97 | |
Class B | | 13.61 | | 4.28 | | 10.10 | | 10.49 | | 12.68 | |
Class C | | 13.62 | | 4.18 | | 10.06 | | 10.46 | | 12.75 | |
Class I | | 14.40 | | — | | 10.21 | | 10.47 | | — | |
Class M | | — | | — | | — | | — | | 12.66 | |
| | | | | | | | | | | |
Maximum Offering Price Per Share (a) | | | | | | | | | | | |
Class A | | $ | 15.14 | | $ | 5.24 | | $ | 10.71 | | $ | 11.00 | | $ | 13.72 | |
Class M | | — | | — | | — | | — | | 12.82 | |
The notes to the financial statements are an integral part of this report.
89
(a) Includes the maximum selling commission (represented as a percentage of offering price) which is reduced on certain levels of sales as set forth in the Prospectus. Net asset value per share for classes B, C, and I shares represents offering price. The redemption price for Classes B and C shares equals net asset value less any applicable contingent deferred sales charge.
The notes to the financial statements are an integral part of this report.
90
STATEMENTS OF OPERATIONS
For the years ended October 31, 2007
(all amounts in thousands)
| | TA IDEX American | | TA IDEX Clarion | | | | | | TA IDEX Legg | |
| | Century Large | | Global Real Estate | | TA IDEX Evergreen | | TA IDEX Jennison | | Mason Partners | |
| | Company Value | | Securities | | Health Care | | Growth | | Investors Value | |
Investment Income: | | | | | | | | | | | |
Dividends | | $ | 14,687 | | $ | 8,108 | | $ | 3,960 | | $ | 1,409 | | $ | 1,675 | |
Less withholding taxes on foreign dividends | | (155 | ) | (863 | ) | (170 | ) | (37 | ) | (34 | ) |
Interest | | 1,039 | | 247 | | 508 | | 177 | | 104 | |
Income from loaned securities-net | | 73 | | 43 | | 189 | | 132 | | 6 | |
| | 15,644 | | 7,535 | | 4,487 | | 1,681 | | 1,751 | |
| | | | | | | | | | | |
Expenses: | | | | | | | | | | | |
Management and advisory fees | | 4,873 | | 2,751 | | 3,323 | | 1,230 | | 700 | |
Distribution and service fees: | | | | | | | | | | | |
Class A | | — | | — | | — | | — | | — | |
Class B | | — | | — | | — | | — | | — | |
Class C | | — | | — | | — | | — | | — | |
Class I | | — | | — | | — | | — | | — | |
Transfer agent fees: | | | | | | | | | | | |
Class A | | 24 | | 17 | | 11 | | 41 | | 33 | |
Class B | | 39 | | 14 | | 12 | | 54 | | 35 | |
Class C | | 11 | | 5 | | 4 | | 17 | | 9 | |
Class I | | — | (a) | — | (a) | — | (a) | — | (a) | — | (a) |
Printing and shareholder reports | | 18 | | 13 | | 15 | | 21 | | 18 | |
Custody fees | | 67 | | 178 | | 93 | | 25 | | 17 | |
Administration fees | | 121 | | 69 | | 79 | | 31 | | 18 | |
Legal fees | | 14 | | 8 | | 10 | | 4 | | 2 | |
Audit fees | | 20 | | 20 | | 21 | | 20 | | 20 | |
Trustees fees | | 22 | | 12 | | 15 | | 5 | | 4 | |
Registration fees | | 8 | | 6 | | 4 | | 2 | | — | |
Other | | 8 | | 7 | | 9 | | 4 | | 3 | |
Total expenses | | 5,225 | | 3,100 | | 3,596 | | 1,454 | | 859 | |
Net of Reimbursement/
Recapture expenses: | | | | | | | | | | | |
Class A | | — | | — | | — | | — | | (1 | ) |
Class B | | — | | — | | — | | — | | (1 | ) |
Class C | | — | | — | | 2 | | — | | (1 | ) |
Total reimbursed/recaptured expenses | | — | | — | | 2 | | — | | (3 | ) |
Net expenses | | 5,225 | | 3,100 | | 3,598 | | 1,454 | | 856 | |
| | | | | | | | | | | |
Net Investment Income | | 10,419 | | 4,435 | | 889 | | 227 | | 895 | |
| | | | | | | | | | | |
Net Realized Gain (Loss) from: | | | | | | | | | | | |
Investment securities | | 11,829 | | 46,081 | | 31,222 | | 2 | | 3,851 | |
Futures contracts | | (1,161 | ) | — | | — | | — | | — | |
Written option & swaption contracts | | — | | — | | — | | — | | — | |
Swap agreements | | — | | — | | — | | — | | — | |
Foreign currency transactions | | — | | (612 | ) | 23 | | — | | — | |
| | 10,668 | | 45,469 | | 31,245 | | 2 | | 3,851 | |
| | | | | | | | | | | |
Net Increase (Decrease) in Unrealized Appreciation (Depreciation) on: | | | | | | | | | | | |
Investment securities | | 28,418 | | (120 | ) | 23,570 | | 27,959 | | 5,342 | |
Futures contracts | | 521 | | — | | — | | — | | — | |
Translation of assets and liabilities denominated in foreign currencies | | — | | (6 | ) | 8 | | — | | — | |
| | 28,939 | | (126 | ) | 23,578 | | 27,959 | | 5,342 | |
Net Realized and Unrealized Gain:(b) | | 39,607 | | 45,343 | | 54,823 | | 27,961 | | 9,193 | |
Net Increase In Net Assets Resulting from Operations | | $ | 50,026 | | $ | 49,778 | | $ | 55,712 | | $ | 28,188 | | $ | 10,088 | |
The notes to the financial statements are an integral part of this report.
91
| | TA IDEX Marsico | | TA IDEX MFS | | TA IDEX PIMCO | | TA IDEX PIMCO | | TA IDEX Protected | |
| | Growth | | International Equity | | Real Return TIPS | | Total Return | | Principal Stock | |
Investment Income: | | | | | | | | | | | |
Dividends | | $ | 2,424 | | $ | 921 | | $ | — | | $ | 92 | | $ | 586 | |
Less withholding taxes on foreign dividends | | (64 | ) | (73 | ) | — | | — | | — | |
Interest | | 865 | | 8 | | 29,397 | | 24,425 | | 60 | |
Income from loaned securities-net | | 53 | | — | | — | | — | | — | |
| | 3,278 | | 856 | | 29,397 | | 24,517 | | 646 | |
| | | | | | | | | | | |
Expenses: | | | | | | | | | | | |
Management and advisory fees | | 2,246 | | 291 | | 4,335 | | 3,144 | | 391 | |
Distribution and service fees: | | | | | | | | | | | |
Class A | | — | | — | | — | | — | | 15 | |
Class B | | — | | — | | — | | — | | 221 | |
Class C | | — | | — | | — | | — | | 29 | |
Class I | | — | | — | | — | | — | | — | |
Class M | | — | | — | | — | | — | | 8 | |
Transfer agent fees: | | | | | | | | | | | |
Class A | | 28 | | 48 | | 5 | | 15 | | 3 | |
Class B | | 37 | | 62 | | 7 | | 26 | | 19 | |
Class C | | 13 | | 16 | | 4 | | 10 | | 3 | |
Class I | | — | | — | | — | (a) | — | (a) | — | |
Class M | | — | | — | | — | | — | | 1 | |
Printing and shareholder reports | | 18 | | 32 | | 13 | | 21 | | 20 | |
Custody fees | | 50 | | 77 | | 139 | | 209 | | 41 | |
Administration fees | | 56 | | 6 | | 130 | | 94 | | 6 | |
Legal fees | | 6 | | 1 | | 17 | | 12 | | 9 | |
Audit fees | | 20 | | 20 | | 20 | | 20 | | 20 | |
Trustees fees | | 10 | | 2 | | 25 | | 18 | | 1 | |
Registration fees | | 5 | | — | | 3 | | 13 | | — | |
Other | | 4 | | 2 | | 14 | | 9 | | 12 | |
Total expenses | | 2,493 | | 557 | | 4,712 | | 3,591 | | 799 | |
Net of Reimbursement/
Recapture expenses: | | | | | | | | | | | |
Class A | | — | | (21 | ) | — | | — | | — | |
Class B | | — | | (29 | ) | — | | — | | — | |
Class C | | — | | (8 | ) | — | | — | | — | |
Total reimbursed/recaptured expenses | | — | | (58 | ) | — | | — | | — | |
Net expenses | | 2,493 | | 499 | | 4,712 | | 3,591 | | 799 | |
| | | | | | | | | | | |
Net Investment Income (Loss) | | 785 | | 357 | | 24,685 | | 20,926 | | (153 | ) |
| | | | | | | | | | | |
Net Realized Gain (Loss) from: | | | | | | | | | | | |
Investment securities | | 2,571 | | 3,304 | | (5,539 | ) | 837 | | 11,546 | |
Futures contracts | | — | | — | | (4,039 | ) | (3,107 | ) | — | |
Written option & swaption contracts | | — | | — | | 366 | | 1,355 | | (1,965 | ) |
Swap agreements | | — | | — | | (260 | ) | 1,849 | | — | |
Foreign currency transactions | | (1 | ) | (44 | ) | 630 | | 210 | | — | |
| | 2,570 | | 3,260 | | (8,842 | ) | 1,144 | | 9,581 | |
| | | | | | | | | | | |
Net Increase (Decrease) in Unrealized Appreciation (Depreciation) on: | | | | | | | | | | | |
Investment securities | | 76,247 | | 2,229 | | 20,665 | | 2,370 | | (8,389 | ) |
Futures contracts | | — | | — | | (1,568 | ) | 1,084 | | — | |
Written option and swaption contracts | | — | | — | | 172 | | 28 | | 855 | |
Swap agreements | | — | | — | | 155 | | 2,791 | | — | |
Translation of assets and liabilities denominated in foreign currencies | | — | | 5 | | 1,969 | | 2,666 | | — | |
| | 76,247 | | 2,234 | | 21,393 | | 8,939 | | (7,534 | ) |
Net Realized and Unrealized Gain:(b) | | 78,817 | | 5,494 | | 12,551 | | 10,083 | | 2,047 | |
Net Increase In Net Assets Resulting from Operations | | $ | 79,602 | | $ | 5,851 | | $ | 37,236 | | $ | 31,009 | | $ | 1,894 | |
(a) Rounds to less than $1.
(b) Net realized and unrealized gain (loss) includes Investment Securities, Futures Contracts, Written Options and Swaptions, Swaps and Foreign Currency Transactions and Translations.
The notes to the financial statements are an integral part of this report.
92
STATEMENTS OF CHANGES IN NET ASSETS
(all amounts in thousands)
| | TA IDEX American Century | | TA IDEX Clarion Global Real | | TA IDEX Evergreen Health | | | |
| | Large Company Value | | Estate Securities | | Care | | TA IDEX Jennison Growth | |
| | Year Ended | | Year Ended | | Year Ended | | Year Ended | | Year Ended | | Year Ended | | Year Ended | | Year Ended | |
| | October 31, | | October 31, | | October 31, | | October 31, | | October 31, | | October 31, | | October 31, | | October 31, | |
| | 2007 | | 2006 | | 2007 | | 2006 | | 2007 | | 2006 | | 2007 | | 2006 | |
Increase (Decrease) in Net Assets From: | | | | | | | | | | | | | | | | | |
Operations: | | | | | | | | | | | | | | | | | |
Net investment income (loss) | | $ | 10,419 | | $ | 4,997 | | $ | 4,435 | | $ | 3,058 | | $ | 889 | | $ | (248 | ) | $ | 227 | | $ | (356 | ) |
Net realized gain (a) | | 10,668 | | 19,571 | | 45,469 | | 32,939 | | 31,245 | | 68,935 | | 2 | | 5,829 | |
Change in unrealized appreciation (depreciation) (b) | | 28,939 | | 28,231 | | (126 | ) | 49,130 | | 23,578 | | 13,323 | | 27,959 | | (1,651 | ) |
Net increase (decrease) in net assets resulting from operations | | 50,026 | | 52,799 | | 49,778 | | 85,127 | | 55,712 | | 82,010 | | 28,188 | | 3,822 | |
Distributions to Shareholders: | | | | | | | | | | | | | | | | | |
From net investment income: | | | | | | | | | | | | | | | | | |
Class A | | (72 | ) | (616 | ) | (264 | ) | (67 | ) | — | | — | | — | | — | |
Class B | | (99 | ) | (35 | ) | (225 | ) | (67 | ) | — | | — | | — | | — | |
Class C | | (45 | ) | (15 | ) | (110 | ) | (38 | ) | — | | — | | — | | — | |
Class I | | (4,642 | ) | (794 | ) | (13,154 | ) | (3,664 | ) | (125 | ) | — | | — | | — | |
| | (4,858 | ) | (1,460 | ) | (13,753 | ) | (3,836 | ) | (125 | ) | — | | — | | — | |
From net realized gains: | | | | | | | | | | | | | | | | | |
Class A | | (425 | ) | (372 | ) | (628 | ) | (603 | ) | (451 | ) | (229 | ) | (415 | ) | (277 | ) |
Class B | | (684 | ) | (629 | ) | (544 | ) | (537 | ) | (560 | ) | (300 | ) | (711 | ) | (623 | ) |
Class C | | (279 | ) | (255 | ) | (257 | ) | (345 | ) | (237 | ) | (127 | ) | (246 | ) | (208 | ) |
Class I | | (18,093 | ) | (10,623 | ) | (29,229 | ) | (14,489 | ) | (67,027 | ) | (22,213 | ) | (4,207 | ) | (1,276 | ) |
| | (19,481 | ) | (11,879 | ) | (30,658 | ) | (15,974 | ) | (68,275 | ) | (22,869 | ) | (5,579 | ) | (2,384 | ) |
| | | | | | | | | | | | | | | | | |
Capital Share Transactions: | | | | | | | | | | | | | | | | | |
Proceeds from shares sold: | | | | | | | | | | | | | | | | | |
Class A | | 23 | | 173 | | 29 | | 2,118 | | 6 | | 1,353 | | 23 | | 400 | |
Class B | | 10 | | 203 | | 4 | | 111 | | 2 | | 157 | | 10 | | 1,307 | |
Class C | | 37 | | 119 | | 3 | | 61 | | 21 | | 62 | | 3 | | 174 | |
Class I | | 335,997 | | 458,905 | | 50,905 | | 309,146 | | — | | 271,042 | | 41,824 | | 97,108 | |
| | 336,067 | | 459,400 | | 50,941 | | 311,436 | | 29 | | 272,614 | | 41,860 | | 98,989 | |
Dividends and distributions reinvested: | | | | | | | | | | | | | | | | | |
Class A | | 490 | | 983 | | 852 | | 649 | | 438 | | 219 | | 401 | | 266 | |
Class B | | 739 | | 617 | | 691 | | 541 | | 536 | | 290 | | 651 | | 544 | |
Class C | | 248 | | 218 | | 331 | | 339 | | 215 | | 107 | | 221 | | 189 | |
Class I | | 22,734 | | 11,417 | | 42,383 | | 18,153 | | 67,152 | | 22,213 | | 4,207 | | 1,276 | |
| | 24,211 | | 13,235 | | 44,257 | | 19,682 | | 68,341 | | 22,829 | | 5,480 | | 2,275 | |
Cost of shares redeemed: | | | | | | | | | | | | | | | | | |
Class A | | (2,863 | ) | (406,544 | ) | (2,241 | ) | (134,314 | ) | (997 | ) | (198,693 | ) | (3,663 | ) | (56,926 | ) |
Class B | | (3,969 | ) | (6,192 | ) | (2,797 | ) | (2,362 | ) | (1,662 | ) | (1,768 | ) | (6,039 | ) | (17,354 | ) |
Class C | | (1,257 | ) | (2,870 | ) | (847 | ) | (3,767 | ) | (421 | ) | (871 | ) | (2,052 | ) | (5,645 | ) |
Class I | | (4,990 | ) | (183,634 | ) | (62,522 | ) | (59,453 | ) | (205,593 | ) | (4,146 | ) | (550 | ) | (721 | ) |
| | (13,079 | ) | (599,240 | ) | (68,407 | ) | (199,896 | ) | (208,673 | ) | (205,478 | ) | (12,304 | ) | (80,646 | ) |
Redemption fee: | | | | | | | | | | | | | | | | | |
Class A | | — | | — | | — | | — | | — | | — | | — | | — | |
Class B | | — | | — | | — | | — | | — | | — | | — | | — | |
Class C | | — | | — | | — | | — | | — | | — | | — | | — | |
Class I | | — | | — | | — | | — | | — | | — | | — | | — | |
| | — | | — | | — | | — | | — | | — | | — | | — | |
Automatic conversions: | | | | | | | | | | | | | | | | | |
Class A | | 264 | | 40 | | 198 | | 18 | | 187 | | 14 | | 211 | | 300 | |
Class B | | (264 | ) | (40 | ) | (198 | ) | (18 | ) | (187 | ) | (14 | ) | (211 | ) | (300 | ) |
| | — | | — | | — | | — | | — | | — | | — | | — | |
| | 347,199 | | (126,605 | ) | 26,791 | | 131,222 | | (140,303 | ) | 89,965 | | 35,036 | | 20,620 | |
Net increase (decrease) in net assets | | 372,886 | | (87,145 | ) | 32,158 | | 196,539 | | (152,991 | ) | 149,106 | | 57,645 | | 22,056 | |
| | | | | | | | | | | | | | | | | |
Net Assets: | | | | | | | | | | | | | | | | | |
Beginning of year | | $ | 343,554 | | $ | 430,699 | | $ | 348,105 | | $ | 151,566 | | $ | 524,287 | | $ | 375,181 | | $ | 130,917 | | $ | 108,861 | |
End of year | | $ | 716,440 | | $ | 343,554 | | $ | 380,263 | | $ | 348,105 | | $ | 371,296 | | $ | 524,287 | | $ | 188,562 | | $ | 130,917 | |
Undistributed (Accumulated) Net Investment Income (Loss) | | $ | 9,098 | | $ | 3,537 | | $ | (119 | ) | $ | 1,448 | | $ | 590 | | $ | 1 | | $ | 224 | | $ | (2 | ) |
The notes to the financial statements are an integral part of this report.
93
| | TA IDEX American Century | | TA IDEX Clarion Global Real | | TA IDEX Evergreen Health | | | |
| | Large Company Value | | Estate Securities | | Care | | TA IDEX Jennison Growth | |
| | Year Ended | | Year Ended | | Year Ended | | Year Ended | | Year Ended | | Year Ended | | Year Ended | | Year Ended | |
| | October 31, | | October 31, | | October 31, | | October 31, | | October 31, | | October 31, | | October 31, | | October 31, | |
| | 2007 | | 2006 | | 2007 | | 2006 | | 2007 | | 2006 | | 2007 | | 2006 | |
Share Activity: | | | | | | | | | | | | | | | | | |
Shares issued: | | | | | | | | | | | | | | | | | |
Class A | | 2 | | 15 | | 1 | | 134 | | — | | 106 | | 2 | | 34 | |
Class B | | 1 | | 19 | | — | | 7 | | — | | 12 | | 1 | | 119 | |
Class C | | 3 | | 11 | | — | | 4 | | 2 | | 5 | | — | | 16 | |
Class I | | 27,331 | | 40,760 | | 2,565 | | 19,087 | | — | | 20,891 | | 3,554 | | 8,400 | |
| | 27,337 | | 40,805 | | 2,566 | | 19,232 | | 2 | | 21,014 | | 3,557 | | 8,569 | |
Shares issued-reinvested from | | | | | | | | | | | | | | | | | |
distributions: | | | | | | | | | | | | | | | | | |
Class A | | 40 | | 88 | | 45 | | 42 | | 35 | | 18 | | 36 | | 23 | |
Class B | | 63 | | 58 | | 37 | | 35 | | 44 | | 24 | | 62 | | 49 | |
Class C | | 21 | | 20 | | 18 | | 22 | | 18 | | 9 | | 22 | | 17 | |
Class I | | 1,888 | | 1,040 | | 2,256 | | 1,159 | | 5,283 | | 1,760 | | 375 | | 109 | |
| | 2,012 | | 1,206 | | 2,356 | | 1,258 | | 5,380 | | 1,811 | | 495 | | 198 | |
Shares redeemed: | | | | | | | | | | | | | | | | | |
Class A | | (227 | ) | (36,455 | ) | (116 | ) | (8,460 | ) | (76 | ) | (15,492 | ) | (318) | | (4,991 | ) |
Class B | | (328 | ) | (565 | ) | (143 | ) | (141 | ) | (131 | ) | (138 | ) | (560) | | (1,640 | ) |
Class C | | (104 | ) | (262 | ) | (44 | ) | (230 | ) | (34 | ) | (69 | ) | (190) | | (530 | ) |
Class I | | (395 | ) | (16,373 | ) | (3,242 | ) | (3,867 | ) | (15,782 | ) | (310 | ) | (46) | | (66 | ) |
| | (1,054 | ) | (53,655 | ) | (3,545 | ) | (12,698 | ) | (16,023 | ) | (16,009 | ) | (1,114) | | (7,227 | ) |
Automatic conversions: | | | | | | | | | | | | | | | | | |
Class A | | 21 | | 4 | | 10 | | 1 | | 14 | | 1 | | 18 | | 27 | |
Class B | | (21 | ) | (4 | ) | (10 | ) | (1 | ) | (15 | ) | (1 | ) | (19) | | (29 | ) |
| | — | | — | | — | | — | | (1 | ) | — | | (1) | | (2 | ) |
Net increase (decrease) in shares outstanding: | | | | | | | | | | | | | | | | | |
Class A | | (164 | ) | (36,348 | ) | (60 | ) | (8,283 | ) | (27 | ) | (15,367 | ) | (262 | ) | (4,907 | ) |
Class B | | (285 | ) | (492 | ) | (116 | ) | (100 | ) | (102 | ) | (103 | ) | (516 | ) | (1,501 | ) |
Class C | | (80 | ) | (231 | ) | (26 | ) | (204 | ) | (14 | ) | (55 | ) | (168 | ) | (497 | ) |
Class I | | 28,824 | | 25,427 | | 1,579 | | 16,379 | | (10,499 | ) | 22,341 | | 3,883 | | 8,443 | |
| | 28,295 | | (11,644 | ) | 1,377 | | 7,792 | | (10,642 | ) | 6,816 | | 2,937 | | 1,538 | |
The notes to the financial statements are an integral part of this report.
94
| | TA IDEX Legg Mason | | | | | | TA IDEX MFS International | | TA IDEX PIMCO Real Return | |
| | Partners Investors Value | | TA IDEX Marsico Growth | | Equity | | TIPS | |
| | Year Ended | | Year Ended | | Year Ended | | Year Ended | | Year Ended | | Year Ended | | Year Ended | | Year Ended | |
| | October 31, | | October 31, | | October 31, | | October 31, | | October 31, | | October 31, | | October 31, | | October 31, | |
| | 2007 | | 2006 | | 2007 | | 2006 | | 2007 | | 2006 | | 2007 | | 2006 | |
Increase (Decrease) in Net Assets From: | | | | | | | | | | | | | | | | | |
Operations: | | | | | | | | | | | | | | | | | |
Net investment income (loss) | | $ | 895 | | $ | 1,060 | | $ | 785 | | $ | (166 | ) | $ | 357 | | $ | 131 | | $ | 24,685 | | $ | 27,941 | |
Net realized gain (loss)(a) | | 3,851 | | 17,756 | | 2,570 | | 8,867 | | 3,260 | | 19,277 | | (8,842 | ) | (9,947 | ) |
Change in unrealized appreciation (depreciation)(b) | | 5,342 | | 360 | | 76,247 | | 626 | | 2,234 | | (7,441 | ) | 21,393 | | (3,150 | ) |
Net increase (decrease) in net assets resulting from operations | | 10,088 | | 19,176 | | 79,602 | | 9,327 | | 5,851 | | 11,967 | | 37,236 | | 14,844 | |
Distributions to Shareholders: | | | | | | | | | | | | | | | | | |
From net investment income: | | | | | | | | | | | | | | | | | |
Class A | | (73 | ) | (62 | ) | — | | — | | (248 | ) | (106 | ) | (117 | ) | (987 | ) |
Class B | | (70 | ) | (32 | ) | — | | — | | (348 | ) | (155 | ) | (124 | ) | (284 | ) |
Class C | | (19 | ) | (8 | ) | — | | — | | (133 | ) | (64 | ) | (86 | ) | (200 | ) |
Class I | | (730 | ) | (322 | ) | (144 | ) | — | | — | | (189 | ) | (24,683 | ) | (23,731 | ) |
| | (892 | ) | (424 | ) | (144 | ) | — | | (729 | ) | (514 | ) | (25,010 | ) | (25,202 | ) |
From net realized gains: | | | | | | | | | | | | | | | | | |
Class A | | (1,984 | ) | (4,033 | ) | — | | — | | (5,481 | ) | (4,776 | ) | — | | (4 | ) |
Class B | | (2,405 | ) | (6,299 | ) | — | | — | | (8,185 | ) | (7,874 | ) | — | | (5 | ) |
Class C | | (608 | ) | (1,640 | ) | — | | — | | (3,159 | ) | (3,241 | ) | — | | (4 | ) |
Class I | | (12,249 | ) | (32,188 | ) | — | | — | | — | | (8,013 | ) | — | | (265 | ) |
| | (17,246 | ) | (44,160 | ) | — | | — | | (16,825 | ) | (23,904 | ) | — | | (278 | ) |
| | | | | | | | | | | | | | | | | |
Capital Share Transactions: | | | | | | | | | | | | | | | | | |
Proceeds from shares sold: | | | | | | | | | | | | | | | | | |
Class A | | 28 | | 292 | | 17 | | 1,086 | | 23 | | 465 | | 20 | | 128 | |
Class B | | 4 | | 1,891 | | 24 | | 2,143 | | 80 | | 355 | | 3 | | 24 | |
Class C | | 6 | | 120 | | — | | 287 | | 132 | | 303 | | 13 | | 299 | |
Class I | | — | | 226,214 | | 226,184 | | 96,416 | | — | | 54,442 | | 93,236 | | 355,682 | |
| | 38 | | 228,517 | | 226,225 | | 99,932 | | 235 | | 55,565 | | 93,272 | | 356,133 | |
Dividends and distributions reinvested: | | | | | | | | | | | | | | | | | |
Class A | | 2,014 | | 4,016 | | — | | — | | 5,688 | | 4,834 | | 89 | | 940 | |
Class B | | 2,396 | | 6,142 | | — | | — | | 8,274 | | 7,686 | | 97 | | 219 | |
Class C | | 591 | | 1,518 | | — | | — | | 3,095 | | 3,056 | | 65 | | 134 | |
Class I | | 12,978 | | 32,510 | | 144 | | — | | — | | 8,202 | | 24,683 | | 23,996 | |
| | 17,979 | | 44,186 | | 144 | | — | | 17,057 | | 23,778 | | 24,934 | | 25,289 | |
Cost of shares redeemed: | | | | | | | | | | | | | | | | | |
Class A | | (3,689 | ) | (174,854 | ) | (3,548 | ) | (98,268 | ) | (3,740 | ) | (59,776 | ) | (1,253 | ) | (272,101 | ) |
Class B | | (3,867 | ) | (8,635 | ) | (4,384 | ) | (10,546 | ) | (4,523 | ) | (8,983 | ) | (2,626 | ) | (4,791 | ) |
Class C | | (831 | ) | (2,475 | ) | (1,791 | ) | (4,902 | ) | (1,743 | ) | (4,356 | ) | (1,139 | ) | (5,364 | ) |
Class I | | (8,371 | ) | (172,521 | ) | (2,025 | ) | — | | — | | (57,455 | ) | (42,707 | ) | (63,907 | ) |
| | (16,758 | ) | (358,485 | ) | (11,748 | ) | (113,716 | ) | (10,006 | ) | (130,570 | ) | (47,725 | ) | (346,163 | ) |
Redemption fee: | | | | | | | | | | | | | | | | | |
Class A | | — | | — | | — | | — | | — | | — | | — | | — | |
Class B | | — | | — | | — | | 1 | | — | | — | | — | | — | |
Class C | | — | | — | | — | | — | | — | | — | | — | | — | |
Class I | | — | | — | | — | | — | | — | | — | | — | | — | |
| | — | | — | | — | | 1 | | — | | — | | — | | — | |
Automatic conversions: | | | | | | | | | | | | | | | | | |
Class A | | 899 | | 533 | | 470 | | 104 | | 317 | | 173 | | 36 | | 12 | |
Class B | | (899 | ) | (533 | ) | (470 | ) | (104 | ) | (317 | ) | (173 | ) | (36 | ) | (12 | ) |
| | — | | — | | — | | — | | — | | — | | — | | — | |
| | 1,259 | | (85,782 | ) | 214,621 | | (13,783 | ) | 7,286 | | (51,227 | ) | 70,481 | | 35,259 | |
Net increase (decrease) in net assets | | (6,791 | ) | (111,190 | ) | 294,079 | | (4,456 | ) | (4,417 | ) | (63,678 | ) | 82,707 | | 24,623 | |
| | | | | | | | | | | | | | | | | |
Net Assets: | | | | | | | | | | | | | | | | | |
Beginning of year | | $ | 92,335 | | $ | 203,525 | | $ | 131,109 | | $ | 135,565 | | $ | 33,784 | | $ | 97,462 | | $ | 615,941 | | $ | 591,318 | |
End of year | | $ | 85,544 | | $ | 92,335 | | $ | 425,188 | | $ | 131,109 | | $ | 29,367 | | $ | 33,784 | | $ | 698,648 | | $ | 615,941 | |
Undistributed (Accumulated) Net Investment Income (Loss) | | $ | 668 | | $ | 664 | | $ | 398 | | $ | (1 | ) | $ | (107 | ) | $ | 92 | | $ | 132 | | $ | 1,356 | |
The notes to the financial statements are an integral part of this report.
95
| | TA IDEX Legg Mason | | | | TA IDEX MFS International | | TA IDEX PIMCO Real Return | |
| | Partners Investors Value | | TA IDEX Marsico Growth | | Equity | | TIPS | |
| | Year Ended | | Year Ended | | Year Ended | | Year Ended | | Year Ended | | Year Ended | | Year Ended | | Year Ended | |
| | October 31, | | October 31, | | October 31, | | October 31, | | October 31, | | October 31, | | October 31, | | October 31, | |
| | 2007 | | 2006 | | 2007 | | 2006 | | 2007 | | 2006 | | 2007 | | 2006 | |
Share Activity: | | | | | | | | | | | | | | | | | |
Shares issued: | | | | | | | | | | | | | | | | | |
Class A | | 2 | | 26 | | 1 | | 101 | | 4 | | 59 | | 2 | | 13 | |
Class B | | — | | 181 | | 2 | | 203 | | 21 | | 46 | | — | | 3 | |
Class C | | — | | 12 | | — | | 27 | | 35 | | 44 | | 1 | | 30 | |
Class I | | — | | 17,521 | | 18,626 | | 9,062 | | — | | 5,373 | | 9,357 | | 35,025 | |
| | 2 | | 17,740 | | 18,629 | | 9,393 | | 60 | | 5,522 | | 9,360 | | 35,071 | |
Shares issued-reinvested from distributions: | | | | | | | | | | | | | | | | | |
Class A | | 216 | | 403 | | — | | — | | 1,317 | | 699 | | 9 | | 93 | |
Class B | | 282 | | 668 | | — | | — | | 2,218 | | 1,196 | | 10 | | 22 | |
Class C | | 70 | | 166 | | — | | — | | 850 | | 481 | | 7 | | 13 | |
Class I | | 1,394 | | 3,284 | | 13 | | — | | — | | 1,189 | | 2,497 | | 2,398 | |
| | 1,962 | | 4,521 | | 13 | | — | | 4,385 | | 3,565 | | 2,523 | | 2,526 | |
Shares redeemed: | | | | | | | | | | | | | | | | | |
Class A | | (374 | ) | (12,273 | ) | (298 | ) | (9,231 | ) | (768 | ) | (6,059 | ) | (125 | ) | (26,811 | ) |
Class B | | (424 | ) | (876 | ) | (383 | ) | (1,022 | ) | (1,072 | ) | (1,262 | ) | (266 | ) | (479 | ) |
Class C | | (95 | ) | (249 | ) | (156 | ) | (474 | ) | (431 | ) | (618 | ) | (116 | ) | (539 | ) |
Class I | | (891 | ) | (14,906 | ) | (160 | ) | — | | — | | (6,562 | ) | (4,307 | ) | (6,267 | ) |
| | (1,784 | ) | (28,304 | ) | (997 | ) | (10,727 | ) | (2,271 | ) | (14,501 | ) | (4,814 | ) | (34,096 | ) |
Automatic conversions: | | | | | | | | | | | | | | | | | |
Class A | | 91 | | 50 | | 37 | | 10 | | 67 | | 22 | | 3 | | 1 | |
Class B | | (100 | ) | (54 | ) | (39 | ) | (10 | ) | (78 | ) | (24 | ) | (3 | ) | (1 | ) |
| | (9 | ) | (4 | ) | (2 | ) | — | | (11 | ) | (2 | ) | — | | — | |
Net increase (decrease) in shares outstanding: | | | | | | | | | | | | | | | | | |
Class A | | (65 | ) | (11,794 | ) | (260 | ) | (9,120 | ) | 620 | | (5,279 | ) | (111 | ) | (26,704 | ) |
Class B | | (242 | ) | (81 | ) | (420 | ) | (829 | ) | 1,089 | | (44 | ) | (259 | ) | (455 | ) |
Class C | | (25 | ) | (71 | ) | (156 | ) | (447 | ) | 454 | | (93 | ) | (108 | ) | (496 | ) |
Class I | | 503 | | 5,899 | | 18,479 | | 9,062 | | — | | — | | 7,547 | | 31,156 | |
| | 171 | | (6,047 | ) | 17,643 | | (1,334 | ) | 2,163 | | (5,416 | ) | 7,069 | | 3,501 | |
The notes to the financial statements are an integral part of this report.
96
| | | | | | TA IDEX Protected Principal | |
| | TA IDEX PIMCO Total Return | | Stock | |
| | Year Ended | | Year Ended | | Year Ended | | Year Ended | |
| | October 31, | | October 31, | | October 31, | | October 31, | |
| | 2007 | | 2006 | | 2007 | | 2006 | |
Increase (Decrease) in Net Assets From: | | | | | | | | | |
Operations: | | | | | | | | | |
Net investment income (loss) | | $ | 20,926 | | $ | 9,015 | | $ | (153 | ) | $ | (220 | ) |
Net realized gain (loss)(a) | | 1,144 | | (1,790 | ) | 9,581 | | 2,337 | |
Change in unrealized appreciation (depreciation)(b) | | 8,939 | | 3,810 | | (7,534 | ) | 1,185 | |
Net increase (decrease) in net assets resulting from operations | | 31,009 | | 11,035 | | 1,894 | | 3,302 | |
Distributions to Shareholders: | | | | | | | | | |
From net investment income: | | | | | | | | | |
Class A | | (195 | ) | (452 | ) | — | | — | |
Class B | | (423 | ) | (546 | ) | — | | — | |
Class C | | (168 | ) | (215 | ) | — | | — | |
Class I | | (19,388 | ) | (7,090 | ) | — | | — | |
| | (20,174 | ) | (8,303 | ) | — | | — | |
From net realized gains: | | | | | | | | | |
Class A | | (3 | ) | — | | — | | — | |
Class B | | (7 | ) | — | | — | | — | |
Class C | | (2 | ) | — | | — | | — | |
Class I | | (154 | ) | — | | — | | — | |
Class M | | — | | — | | — | | — | |
| | (166 | ) | — | | — | | — | |
| | | | | | | | | |
Capital Share Transactions: | | | | | | | | | |
Proceeds from shares sold: | | | | | | | | | |
Class A | | 9 | | 218 | | — | | — | |
Class B | | 10 | | 136 | | — | | — | |
Class C | | 11 | | 153 | | — | | — | |
Class I | | 248,086 | | 258,105 | | — | | — | |
| | 248,116 | | 258,612 | | — | | — | |
Dividends and distributions reinvested: | | | | | | | | | |
Class A | | 176 | | 419 | | — | | — | |
Class B | | 324 | | 394 | | — | | — | |
Class C | | 132 | | 182 | | — | | — | |
Class I | | 19,542 | | 7,090 | | — | | — | |
| | 20,174 | | 8,085 | | — | | — | |
Cost of shares redeemed: | | | | | | | | | |
Class A | | (1,715 | ) | (120,452 | ) | (4,557 | ) | (1,684 | ) |
Class B | | (5,548 | ) | (9,402 | ) | (24,959 | ) | (6,580 | ) |
Class C | | (1,248 | ) | (5,225 | ) | (3,098 | ) | (1,422 | ) |
Class I | | (5,873 | ) | (4 | ) | — | | — | |
Class M | | — | | — | | (1,307 | ) | (473 | ) |
| | (14,384 | ) | (135,083 | ) | (33,921 | ) | (10,159 | ) |
Redemption fee: | | | | | | | | | |
Class A | | — | | — | | — | | — | |
Class B | | — | | — | | — | | — | |
Class C | | — | | — | | — | | — | |
Class I | | — | | — | | — | | — | |
Class M | | — | | — | | — | | — | |
| | — | | — | | — | | — | |
Automatic conversions: | | | | | | | | | |
Class A | | 283 | | 46 | | — | | — | |
Class B | | (283 | ) | (46 | ) | — | | — | |
| | — | | — | | — | | — | |
| | 253,906 | | 131,614 | | (33,921 | ) | (10,159 | ) |
Net increase (decrease) in net assets | | 264,575 | | 134,346 | | (32,027 | ) | (6,857 | ) |
| | | | | | | | | |
Net Assets: | | | | | | | | | |
Beginning of year | | $ | 292,007 | | $ | 157,661 | | $ | 41,178 | | $ | 48,035 | |
End of year | | $ | 556,582 | | $ | 292,007 | | $ | 9,151 | | $ | 41,178 | |
Undistributed (Accumulated) Net Investment Income (Loss) | | $ | 166 | | $ | 611 | | $ | — | | $ | — | |
The notes to the financial statements are an integral part of this report.
97
| | | | | | TA IDEX Protected Principal | |
| | TA IDEX PIMCO Total Return | | Stock | |
| | Year Ended | | Year Ended | | Year Ended | | Year Ended | |
| | October 31, | | October 31, | | October 31, | | October 31, | |
| | 2007 | | 2006 | | 2007 | | 2006 | |
Share Activity: | | | | | | | | | |
Shares issued: | | | | | | | | | |
Class A | | 1 | | 21 | | — | | — | |
Class B | | 1 | | 13 | | — | | — | |
Class C | | 1 | | 15 | | — | | — | |
Class I | | 24,157 | | 25,391 | | — | | — | |
| | 24,160 | | 25,440 | | — | | — | |
Shares issued-reinvested from distributions: | | | | | | | | | |
Class A | | 17 | | 41 | | — | | — | |
Class B | | 32 | | 39 | | — | | — | |
Class C | | 13 | | 18 | | — | | — | |
Class I | | 1,908 | | 702 | | — | | — | |
| | 1,970 | | 800 | | — | | — | |
Shares redeemed: | | | | | | | | | |
Class A | | (167 | ) | (11,898 | ) | (358 | ) | (144 | ) |
Class B | | (541 | ) | (924 | ) | (2,001 | ) | (570 | ) |
Class C | | (122 | ) | (518 | ) | (249 | ) | (123 | ) |
Class I | | (572 | ) | — | | — | | — | |
Class M | | — | | — | | (104 | ) | (41 | ) |
| | (1,402 | ) | (13,341 | ) | (2,712 | ) | (878 | ) |
Automatic conversions: | | | | | | | | | |
Class A | | 28 | | 5 | | — | | — | |
Class B | | (28 | ) | (5 | ) | — | | — | |
| | — | | — | | — | | — | |
Net increase (decrease) in shares outstanding: | | | | | | | | | |
Class A | | (121 | ) | (11,831 | ) | (358 | ) | (144 | ) |
Class B | | (536 | ) | (877 | ) | (2,001 | ) | (570 | ) |
Class C | | (108 | ) | (485 | ) | (249 | ) | (123 | ) |
Class I | | 25,493 | | 26,093 | | — | | — | |
Class M | | — | | — | | (104 | ) | (41 | ) |
| | 24,728 | | 12,900 | | (2,712 | ) | (878 | ) |
(a) Net realized and unrealized gain (loss) includes Investment Securities, Futures Contracts, Written Options and Swaptions, Swaps and Foreign Currency Transactions.
(b) Change in unrealized appreciation (depreciation) includes Investment Securities, Futures Contracts, Written Options and Swaptions, Swaps and Foreign Currency Translation.
The notes to the financial statements are an integral part of this report.
98
FINANCIAL HIGHLIGHTS
For the years ended:
| | TA IDEX American Century Large Company Value | |
| | Class A | |
| | October 31, | | October 31, | | October 31, | | October 31, | | October 31, | |
| | 2007 | | 2006 | | 2005 | | 2004 | | 2003 | |
| | | | | | | | | | | |
Net Asset Value | | | | | | | | | | | |
Beginning of year | | $ | 12.44 | | $ | 10.98 | | $ | 10.20 | | $ | 9.09 | | $ | 7.55 | |
| | | | | | | | | | | |
Investment Operations(h) | | | | | | | | | | | |
Net Investment income (loss) | | 0.19 | | 0.39 | | 0.13 | | 0.11 | | 0.04 | |
Net realized and unrealized gain (loss) on investments | | 0.95 | | 1.50 | | 0.80 | | 1.01 | | 1.50 | |
Total from investment operations | | 1.14 | | 1.89 | | 0.93 | | 1.12 | | 1.54 | |
| | | | | | | | | | | |
Distributions | | | | | | | | | | | |
Net investment income | | (0.11 | ) | (0.02 | ) | (0.15 | ) | (0.01 | ) | — | |
Net realized gains on investments | | (0.65 | ) | (0.41 | ) | — | | — | | — | |
Total distributions | | (0.76 | ) | (0.43 | ) | (0.15 | ) | (0.01 | ) | — | |
| | | | | | | | | | | |
Net Asset Value | | | | | | | | | | | |
End of year | | $ | 12.82 | | $ | 12.44 | | $ | 10.98 | | $ | 10.20 | | $ | 9.09 | |
| | | | | | | | | | | |
Total Return(a) | | 9.54 | % | 17.66 | % | 9.10 | % | 12.38 | % | 20.40 | % |
| | | | | | | | | | | |
Net Assets End of Period | | $ | 6,612 | | $ | 8,453 | | $ | 406,609 | | $ | 157,103 | | $ | 8,988 | |
| | | | | | | | | | | |
Ratio and Supplemental Data | | | | | | | | | | | |
| | | | | | | | | | | |
Expenses to average net assets: | | | | | | | | | | | |
After reimbursement/fee waiver(b) | | 1.17 | %(c) | 1.30 | %(c) | 1.31 | %(c) | 1.54 | %(c) | 1.85 | %(c) |
Before reimbursement/fee waiver(b) | | 1.17 | %(d) | 1.30 | %(d) | 1.31 | %(d) | 1.54 | %(d) | 2.56 | %(d) |
Net investment income (loss), to average net assets(b) | | 1.49 | % | 3.44 | % | 1.16 | % | 1.11 | % | 0.53 | % |
Portfolio turnover rate(e) | | 13 | % | 24 | % | 28 | % | 61 | % | 76 | % |
| | TA IDEX American Century Large Company Value | |
| | Class B | |
| | October 31, | | October 31, | | October 31, | | October 31, | | October 31, | |
| | 2007 | | 2006 | | 2005 | | 2004 | | 2003 | |
| | | | | | | | | | | |
Net Asset Value | | | | | | | | | | | |
Beginning of year | | $ | 12.03 | | $ | 10.67 | | $ | 9.88 | | $ | 8.87 | | $ | 7.41 | |
| | | | | | | | | | | |
Investment Operations(h) | | | | | | | | | | | |
Net Investment income (loss) | | 0.18 | | 0.11 | | 0.02 | | 0.02 | | (0.01 | ) |
Net realized and unrealized gain (loss) on investments | | 0.92 | | 1.68 | | 0.77 | | 1.00 | | 1.47 | |
Total from investment operations | | 1.10 | | 1.79 | | 0.79 | | 1.02 | | 1.46 | |
| | | | | | | | | | | |
Distributions | | | | | | | | | | | |
Net investment income | | (0.09 | ) | (0.02 | ) | — | | (0.01 | ) | — | |
Net realized gains on investments | | (0.65 | ) | (0.41 | ) | — | | — | | — | |
Total distributions | | (0.74 | ) | (0.43 | ) | — | | (0.01 | ) | — | |
| | | | | | | | | | | |
Net Asset Value | | | | | | | | | | | |
End of year | | $ | 12.39 | | $ | 12.03 | | $ | 10.67 | | $ | 9.88 | | $ | 8.87 | |
| | | | | | | | | | | |
Total Return(a) | | 9.55 | % | 17.29 | % | 8.01 | % | 11.54 | % | 19.70 | % |
| | | | | | | | | | | |
Net Assets End of Period | | $ | 10,023 | | $ | 13,169 | | $ | 16,927 | | $ | 18,612 | | $ | 17,245 | |
| | | | | | | | | | | |
Ratio and Supplemental Data | | | | | | | | | | | |
| | | | | | | | | | | |
Expenses to average net assets: | | | | | | | | | | | |
After reimbursement/fee waiver(b) | | 1.19 | %(c) | 1.64 | %(c) | 2.36 | %(c) | 2.32 | %(c) | 2.50 | %(c) |
Before reimbursement/fee waiver(b) | | 1.19 | %(d) | 1.64 | %(d) | 2.36 | %(d) | 2.32 | %(d) | 3.21 | %(d) |
Net investment income (loss), to average net assets(b) | | 1.48 | % | 1.01 | % | 0.23 | % | 0.20 | % | (0.12 | )% |
Portfolio turnover rate(e) | | 13 | % | 24 | % | 28 | % | 61 | % | 76 | % |
The notes to the financial statements are an integral part of this report.
99
| | TA IDEX American Century Large Company Value | |
| | Class C(f) | |
| | October 31, | | October 31, | | October 31, | | October 31, | | October 31, | |
| | 2007 | | 2006 | | 2005 | | 2004 | | 2003 | |
| | | | | | | | | | | |
Net Asset Value | | | | | | | | | | | |
Beginning of year | | $ | 12.01 | | $ | 10.64 | | $ | 9.86 | | $ | 8.87 | | $ | 7.32 | |
Investment Operations(h) | | | | | | | | | | | |
Net Investment income (loss) | | 0.19 | | 0.12 | | 0.02 | | — | | (0.01 | ) |
Net realized and unrealized gain (loss) on investments | | 0.92 | | 1.68 | | 0.77 | | 1.00 | | 1.56 | |
Total from investment operations | | 1.11 | | 1.80 | | 0.79 | | 1.00 | | 1.55 | |
Distributions | | | | | | | | | | | |
Net investment income | | (0.10 | ) | (0.02 | ) | (0.01 | ) | (0.01 | ) | — | |
Net realized gains on investments | | (0.65 | ) | (0.41 | ) | — | | — | | — | |
Total distributions | | (0.75 | ) | (0.43 | ) | (0.01 | ) | (0.01 | ) | — | |
| | | | | | | | | | | |
Net Asset Value | | | | | | | | | | | |
End of year | | $ | 12.37 | | $ | 12.01 | | $ | 10.64 | | $ | 9.86 | | $ | 8.87 | |
| | | | | | | | | | | |
Total Return(a) | | 9.66 | % | 17.45 | % | 7.93 | % | 11.38 | % | 21.17 | % |
| | | | | | | | | | | |
Net Assets End of Period | | $ | 4,474 | | $ | 5,301 | | $ | 7,163 | | $ | 7,586 | | $ | 1,230 | |
| | | | | | | | | | | |
Ratio and Supplemental Data | | | | | | | | | | | |
| | | | | | | | | | | |
Expenses to average net assets: | | | | | | | | | | | |
After reimbursement/fee waiver(b) | | 1.07 | %(c) | 1.59 | %(c) | 2.42 | %(c) | 2.50 | %(c) | 2.50 | %(c) |
Before reimbursement/fee waiver(b) | | 1.07 | %(d) | 1.59 | %(d) | 2.42 | %(d) | 2.54 | %(d) | 3.21 | %(d) |
Net investment income (loss), to average net assets(b) | | 1.59 | % | 1.07 | % | 0.16 | % | 0.04 | % | (0.12 | )% |
Portfolio turnover rate(e) | | 13 | % | 24 | % | 28 | % | 61 | % | 76 | % |
| | TA IDEX American Century | |
| | Large Company Value | |
| | Class I | |
| | October 31, | | October 31, | |
| | 2007 | | 2006 | |
| | | | | |
Net Asset Value | | | | | |
Beginning of year | | $ | 12.45 | | $ | 11.15 | |
| | | | | |
Investment Operations(h) | | | | | |
Net Investment income (loss) | | 0.22 | | 0.17 | |
Net realized and unrealized gain (loss) on investments | | 0.97 | | 1.57 | |
Total from investment operations | | 1.19 | | 1.74 | |
| | | | | |
Distributions | | | | | |
Net investment income | | (0.17 | ) | (0.03 | ) |
Net realized gains on investments | | (0.65 | ) | (0.41 | ) |
Total distributions | | (0.82 | ) | (0.44 | ) |
| | | | | |
Net Asset Value | | | | | |
End of year | | $ | 12.82 | | $ | 12.45 | |
| | | | | |
Total Return(a) | | 9.95 | % | 16.11 | % |
| | | | | |
Net Assets End of Period | | $ | 695,331 | | $ | 316,631 | |
| | | | | |
Ratio and Supplemental Data | | | | | |
| | | | | |
Expenses to average net assets: | | | | | |
After reimbursement/fee waiver(b) | | 0.85 | %(c) | 0.91 | %(c) |
Before reimbursement/fee waiver(b) | | 0.85 | %(d) | 0.91 | %(d) |
Net investment income (loss), to average net assets(b) | | 1.73 | % | 1.57 | % |
Portfolio turnover rate(e) | | 13 | % | 24 | % |
The notes to the financial statements are an integral part of this report.
100
| | TA IDEX Clarion Global Real Estate Securities | |
| | Class A | |
| | October 31, | | October 31, | | October 31, | | October 31, | | October 31, | |
| | 2007 | | 2006 | | 2005 | | 2004 | | 2003 | |
| | | | | | | | | | | |
Net Asset Value | | | | | | | | | | | |
Beginning of year | | $ | 20.30 | | $ | 16.13 | | $ | 13.99 | | $ | 12.25 | | $ | 10.00 | |
| | | | | | | | | | | |
Investment Operations(h) | | | | | | | | | | | |
Net Investment income (loss) | | 0.31 | | 0.13 | | 0.27 | | 0.28 | | 0.43 | |
Net realized and unrealized gain (loss) on investments | | 2.45 | | 5.59 | | 2.46 | | 3.05 | | 1.95 | |
Total from investment operations | | 2.76 | | 5.72 | | 2.73 | | 3.33 | | 2.38 | |
| | | | | | | | | | | |
Distributions | | | | | | | | | | | |
Net investment income | | (0.75 | ) | (0.17 | ) | (0.41 | ) | (0.53 | ) | (0.13 | ) |
Net realized gains on investments | | (1.78 | ) | (1.38 | ) | (0.18 | ) | (1.06 | ) | — | |
Total distributions | | (2.53 | ) | (1.55 | ) | (0.59 | ) | (1.59 | ) | (0.13 | ) |
| | | | | | | | | | | |
Net Asset Value | | | | | | | | | | | |
End of year | | $ | 20.53 | | $ | 20.30 | | $ | 16.13 | | $ | 13.99 | | $ | 12.25 | |
| | | | | | | | | | | |
Total Return(a) | | 14.79 | % | 38.39 | % | 19.87 | % | 29.30 | % | 23.80 | % |
| | | | | | | | | | | |
Net Assets End of Period | | $ | 6,050 | | $ | 7,199 | | $ | 139,290 | | $ | 125,423 | | $ | 64,090 | |
| | | | | | | | | | | |
Ratio and Supplemental Data | | | | | | | | | | | |
| | | | | | | | | | | |
Expenses to average net assets: | | | | | | | | | | | |
After reimbursement/fee waiver(b) | | 1.13 | %(c) | 1.30 | %(c) | 1.25 | %(c) | 1.30 | %(c) | 1.75 | %(c) |
Before reimbursement/fee waiver(b) | | 1.13 | %(d) | 1.30 | %(d) | 1.25 | %(d) | 1.30 | %(d) | 1.76 | %(d) |
Net investment income (loss), to average net assets(b) | | 1.02 | % | 0.77 | % | 1.77 | % | 2.16 | % | 5.55 | % |
Portfolio turnover rate(e) | | 72 | % | 76 | % | 66 | % | 73 | % | 95 | % |
| | TA IDEX Clarion Global Real Estate Securities | |
| | Class B | |
| | October 31, | | October 31, | | October 31, | | October 31, | | October 31, | |
| | 2007 | | 2006 | | 2005 | | 2004 | | 2003 | |
| | | | | | | | | | | |
Net Asset Value | | | | | | | | | | | |
Beginning of year | | $ | 20.25 | | $ | 16.14 | | $ | 13.99 | | $ | 12.22 | | $ | 10.00 | |
| | | | | | | | | | | |
Investment Operations(h) | | | | | | | | | | | |
Net Investment income (loss) | | 0.31 | | 0.11 | | 0.06 | | 0.25 | | 0.38 | |
Net realized and unrealized gain (loss) on investments | | 2.44 | | 5.57 | | 2.49 | | 3.03 | | 1.95 | |
Total from investment operations | | 2.75 | | 5.68 | | 2.55 | | 3.28 | | 2.33 | |
| | | | | | | | | | | |
Distributions | | | | | | | | | | | |
Net investment income | | (0.75 | ) | (0.19 | ) | (0.22 | ) | (0.45 | ) | (0.11 | ) |
Net realized gains on investments | | (1.78 | ) | (1.38 | ) | (0.18 | ) | (1.06 | ) | — | |
Total distributions | | (2.53 | ) | (1.57 | ) | (0.40 | ) | (1.51 | ) | (0.11 | ) |
| | | | | | | | | | | |
Net Asset Value | | | | | | | | | | | |
End of year | | $ | 20.47 | | $ | 20.25 | | $ | 16.14 | | $ | 13.99 | | $ | 12.22 | |
| | | | | | | | | | | |
Total Return(a) | | 14.77 | % | 38.20 | % | 18.45 | % | 28.96 | % | 23.33 | % |
| | | | | | | | | | | |
Net Assets End of Period | | $ | 4,004 | | $ | 6,323 | | $ | 6,644 | | $ | 4,042 | | $ | 1,804 | |
| | | | | | | | | | | |
Ratio and Supplemental Data | | | | | | | | | | | |
| | | | | | | | | | | |
Expenses to average net assets: | | | | | | | | | | | |
After reimbursement/fee waiver(b) | | 1.14 | %(c) | 1.55 | %(c) | 2.38 | %(c) | 1.51 | %(c) | 2.40 | %(c) |
Before reimbursement/fee waiver(b) | | 1.14 | %(d) | 1.55 | %(d) | 2.38 | %(d) | 1.51 | %(d) | 2.41 | %(d) |
Net investment income (loss), to average net assets(b) | | 1.02 | % | 0.64 | % | 0.42 | % | 1.97 | % | 4.91 | % |
Portfolio turnover rate(e) | | 72 | % | 76 | % | 66 | % | 73 | % | 95 | % |
The notes to the financial statements are an integral part of this report.
101
| | TA IDEX Clarion Global Real Estate Securities | |
| | Class C(f) | |
| | October 31, | | October 31, | | October 31, | | October 31, | | October 31, | |
| | 2007 | | 2006 | | 2005 | | 2004 | | 2003 | |
| | | | | | | | | | | |
Net Asset Value | | | | | | | | | | | |
Beginning of year | | $ | 20.09 | | $ | 16.02 | | $ | 13.92 | | $ | 12.22 | | $ | 10.00 | |
| | | | | | | | | | | |
Investment Operations(h) | | | | | | | | | | | |
Net Investment income (loss) | | 0.32 | | 0.11 | | 0.11 | | 0.17 | | 0.38 | |
Net realized and unrealized gain (loss) on investments | | 2.44 | | 5.54 | | 2.44 | | 3.04 | | 1.95 | |
Total from investment operations | | 2.76 | | 5.65 | | 2.55 | | 3.21 | | 2.33 | |
| | | | | | | | | | | |
Distributions | | | | | | | | | | | |
Net investment income | | (0.77 | ) | (0.20 | ) | (0.27 | ) | (0.45 | ) | (0.11 | ) |
Net realized gains on investments | | (1.78 | ) | (1.38 | ) | (0.18 | ) | (1.06 | ) | — | |
Total distributions | | (2.55 | ) | (1.58 | ) | (0.45 | ) | (1.51 | ) | (0.11 | ) |
| | | | | | | | | | | |
Net Asset Value | | | | | | | | | | | |
End of year | | $ | 20.30 | | $ | 20.09 | | $ | 16.02 | | $ | 13.92 | | $ | 12.22 | |
| | | | | | | | | | | |
Total Return(a) | | 14.95 | % | 38.30 | % | 18.53 | % | 28.32 | % | 23.33 | % |
| | | | | | | | | | | |
Net Assets End of Period | | $ | 2,459 | | $ | 2,963 | | $ | 5,632 | | $ | 5,325 | | $ | 1,913 | |
| | | | | | | | | | | |
Ratio and Supplemental Data | | | | | | | | | | | |
| | | | | | | | | | | |
Expenses to average net assets: | | | | | | | | | | | |
After reimbursement/fee waiver(b) | | 1.06 | %(c) | 1.52 | %(c) | 2.27 | %(c) | 2.22 | %(c) | 2.40 | %(c) |
Before reimbursement/fee waiver(b) | | 1.06 | %(d) | 1.52 | %(d) | 2.27 | %(d) | 2.22 | %(d) | 2.41 | %(d) |
Net investment income (loss), to average net assets(b) | | 1.09 | % | 0.64 | % | 0.76 | % | 1.32 | % | 4.91 | % |
Portfolio turnover rate(e) | | 72 | % | 76 | % | 66 | % | 73 | % | 95 | % |
| | TA IDEX Clarion Global Real | |
| | Estate Securities | |
| | Class I | |
| | October 31, | | October 31, | |
| | 2007 | | 2006 | |
| | | | | |
Net Asset Value | | | | | |
Beginning of year | | $ | 20.25 | | $ | 15.85 | |
| | | | | |
Investment Operations(h) | | | | | |
Net Investment income (loss) | | 0.36 | | 0.21 | |
Net realized and unrealized gain (loss) on investments | | 2.45 | | 5.85 | |
Total from investment operations | | 2.81 | | 6.06 | |
| | | | | |
Distributions | | | | | |
Net investment income | | (0.80 | ) | (0.28 | ) |
Net realized gains on investments | | (1.78 | ) | (1.38 | ) |
Total distributions | | (2.58 | ) | (1.66 | ) |
| | | | | |
Net Asset Value | | | | | |
End of year | | $ | 20.48 | | $ | 20.25 | |
| | | | | |
Total Return(a) | | 15.11 | % | 41.43 | % |
| | | | | |
Net Assets End of Period | | $ | 367,750 | | $ | 331,620 | |
| | | | | |
Ratio and Supplemental Data | | | | | |
| | | | | |
Expenses to average net assets: | | | | | |
After reimbursement/fee waiver(b) | | 0.88 | %(c) | 0.91 | %(c) |
Before reimbursement/fee waiver(b) | | 0.88 | %(d) | 0.91 | %(d) |
Net investment income (loss), to average net assets(b) | | 1.29 | % | 1.27 | % |
Portfolio turnover rate(e) | | 72 | % | 76 | % |
The notes to the financial statements are an integral part of this report.
102
| | TA IDEX Evergreen Health Care | |
| | Class A | |
| | October 31, | | October 31, | | October 31, | | October 31, | | October 31, | |
| | 2007 | | 2006 | | 2005 | | 2004 | | 2003 | |
| | | | | | | | | | | |
Net Asset Value | | | | | | | | | | | |
Beginning of year | | $ | 14.06 | | $ | 12.44 | | $ | 10.84 | | $ | 10.14 | | $ | 8.28 | |
| | | | | | | | | | | |
Investment Operations(h) | | | | | | | | | | | |
Net Investment income (loss) | | (0.01 | ) | (0.07 | ) | (0.12 | ) | (0.13 | ) | (0.16 | ) |
Net realized and unrealized gain (loss) on investments | | 1.73 | | 2.41 | | 1.82 | | 1.18 | | 2.02 | |
Total from investment operations | | 1.72 | | 2.34 | | 1.70 | | 1.05 | | 1.86 | |
| | | | | | | | | | | |
Distributions | | | | | | | | | | | |
Net investment income | | — | | — | | — | | — | | — | |
Net realized gains on investments | | (1.85 | ) | (0.72 | ) | (0.10 | ) | (0.35 | ) | — | |
Total distributions | | (1.85 | ) | (0.72 | ) | (0.10 | ) | (0.35 | ) | — | |
| | | | | | | | | | | |
Net Asset Value | | | | | | | | | | | |
End of year | | $ | 13.93 | | $ | 14.06 | | $ | 12.44 | | $ | 10.84 | | $ | 10.14 | |
| | | | | | | | | | | |
Total Return(a) | | 13.71 | % | 19.48 | % | 15.69 | % | 10.19 | % | 22.46 | % |
| | | | | | | | | | | |
Net Assets End of Period | | $ | 3,188 | | $ | 3,592 | | $ | 194,414 | | $ | 154,957 | | $ | 59,115 | |
| | | | | | | | | | | |
Ratio and Supplemental Data | | | | | | | | | | | |
| | | | | | | | | | | |
Expenses to average net assets: | | | | | | | | | | | |
After reimbursement/fee waiver(b) | | 1.24 | %(c) | 1.47 | %(c) | 1.44 | %(c) | 1.53 | %(c) | 1.95 | %(c) |
Before reimbursement/fee waiver(b) | | 1.24 | %(d) | 1.47 | %(d) | 1.44 | %(d) | 1.53 | %(d) | 2.19 | %(d) |
Net investment income (loss), to average net assets(b) | | (0.08 | )% | (0.56 | )% | (1.02 | )% | (1.15 | )% | (1.61 | )% |
Portfolio turnover rate(e) | | 68 | % | 92 | % | 59 | % | 35 | % | 30 | % |
| | TA IDEX Evergreen Health Care | |
| | Class B | |
| | October 31, | | October 31, | | October 31, | | October 31, | | October 31, | |
| | 2007 | | 2006 | | 2005 | | 2004 | | 2003 | |
| | | | | | | | | | | |
Net Asset Value | | | | | | | | | | | |
Beginning of year | | $ | 13.61 | | $ | 12.10 | | $ | 10.66 | | $ | 10.03 | | $ | 8.24 | |
| | | | | | | | | | | |
Investment Operations(h) | | | | | | | | | | | |
Net Investment income (loss) | | (0.01 | ) | (0.10 | ) | (0.25 | ) | (0.17 | ) | (0.21 | ) |
Net realized and unrealized gain (loss) on investments | | 1.67 | | 2.33 | | 1.79 | | 1.15 | | 2.00 | |
Total from investment operations | | 1.66 | | 2.23 | | 1.54 | | 0.98 | | 1.79 | |
| | | | | | | | | | | |
Distributions | | | | | | | | | | | |
Net investment income | | — | | — | | — | | — | | — | |
Net realized gains on investments | | (1.85 | ) | (0.72 | ) | (0.10 | ) | (0.35 | ) | — | |
Total distributions | | (1.85 | ) | (0.72 | ) | (0.10 | ) | (0.35 | ) | — | |
| | | | | | | | | | | |
Net Asset Value | | | | | | | | | | | |
End of year | | $ | 13.42 | | $ | 13.61 | | $ | 12.10 | | $ | 10.66 | | $ | 10.03 | |
| | | | | | | | | | | |
Total Return(a) | | 13.73 | % | 19.11 | % | 14.45 | % | 9.59 | % | 21.72 | % |
| | | | | | | | | | | |
Net Assets End of Period | | $ | 3,099 | | $ | 4,528 | | $ | 5,274 | | $ | 4,590 | | $ | 2,952 | |
| | | | | | | | | | | |
Ratio and Supplemental Data | | | | | | | | | | | |
| | | | | | | | | | | |
Expenses to average net assets: | | | | | | | | | | | |
After reimbursement/fee waiver(b) | | 1.24 | %(c) | 1.71 | %(c) | 2.60 | %(c) | 2.09 | %(c) | 2.60 | %(c) |
Before reimbursement/fee waiver(b) | | 1.24 | %(d) | 1.71 | %(d) | 2.66 | %(d) | 2.09 | %(d) | 2.84 | %(d) |
Net investment income (loss), to average net assets(b) | | (0.06 | )% | (0.79 | )% | (2.18 | )% | (1.58 | )% | (2.26 | )% |
Portfolio turnover rate(e) | | 68 | % | 92 | % | 59 | % | 35 | % | 30 | % |
The notes to the financial statements are an integral part of this report.
103
| | TA IDEX Evergreen Health Care | |
| | Class C(f) | |
| | October 31, | | October 31, | | October 31, | | October 31, | | October 31, | |
| | 2007 | | 2006 | | 2005 | | 2004 | | 2003 | |
| | | | | | | | | | | |
Net Asset Value | | | | | | | | | | | |
Beginning of year | | $ | 13.55 | | $ | 12.07 | | $ | 10.63 | | $ | 10.03 | | $ | 8.10 | |
| | | | | | | | | | | |
Investment Operations(h) | | | | | | | | | | | |
Net Investment income (loss) | | (0.01 | ) | (0.13 | ) | (0.25 | ) | (0.24 | ) | (0.22 | ) |
Net realized and unrealized gain (loss) on investments | | 1.66 | | 2.33 | | 1.79 | | 1.19 | | 2.15 | |
Total from investment operations | | 1.65 | | 2.20 | | 1.54 | | 0.95 | | 1.93 | |
| | | | | | | | | | | |
Distributions | | | | | | | | | | | |
Net investment income | | — | | — | | — | | — | | — | |
Net realized gains on investments | | (1.85 | ) | (0.72 | ) | (0.10 | ) | (0.35 | ) | — | |
Total distributions | | (1.85 | ) | (0.72 | ) | (0.10 | ) | (0.35 | ) | — | |
| | | | | | | | | | | |
Net Asset Value | | | | | | | | | | | |
End of year | | $ | 13.35 | | $ | 13.55 | | $ | 12.07 | | $ | 10.63 | | $ | 10.03 | |
| | | | | | | | | | | |
Total Return(a) | | 13.71 | % | 18.90 | % | 14.44 | % | 9.28 | % | 23.83 | % |
| | | | | | | | | | | |
Net Assets End of Period | | $ | 1,530 | | $ | 1,748 | | $ | 2,223 | | $ | 2,081 | | $ | 201 | |
| | | | | | | | | | | |
Ratio and Supplemental Data | | | | | | | | | | | |
| | | | | | | | | | | |
Expenses to average net assets: | | | | | | | | | | | |
After reimbursement/fee waiver(b) | | 1.24 | %(c) | 1.89 | %(c) | 2.60 | %(c) | 2.60 | %(c) | 2.60 | %(c) |
Before reimbursement/fee waiver(b) | | 1.13 | %(d) | 1.89 | %(d) | 2.90 | %(d) | 3.41 | %(d) | 2.84 | %(d) |
Net investment income (loss), to average net assets(b) | | (0.11 | )% | (0.99 | )% | (2.18 | )% | (1.61 | )% | (2.26 | )% |
Portfolio turnover rate(e) | | 68 | % | 92 | % | 59 | % | 35 | % | 30 | % |
| | TA IDEX Evergreen Health Care | |
| | Class I | |
| | October 31, | | October 31, | | October 31, | |
| | 2007 | | 2006 | | 2005 | |
| | | | | | | |
Net Asset Value | | | | | | | |
Beginning of year | | $ | 14.22 | | $ | 12.52 | | $ | 11.26 | |
| | | | | | | |
Investment Operations(h) | | | | | | | |
Net Investment income (loss) | | 0.03 | | — | | (0.07 | ) |
Net realized and unrealized gain (loss) on investments | | 1.75 | | 2.42 | | 1.43 | |
Total from investment operations | | 1.78 | | 2.42 | | 1.36 | |
| | | | | | | |
| | | | | | | |
Distributions | | | | | | | |
Net investment income | | — | (g) | — | | — | |
Net realized gains on investments | | (1.85 | ) | (0.72 | ) | (0.10 | ) |
Total distributions | | (1.85 | ) | (0.72 | ) | (0.10 | ) |
| | | | | | | |
| | | | | | | |
Net Asset Value | | | | | | | |
End of year | | $ | 14.15 | | $ | 14.22 | | $ | 12.52 | |
| | | | | | | |
Total Return(a) | | 14.04 | % | 20.02 | % | 12.09 | % |
| | | | | | | |
Net Assets End of Period | | $ | 363,479 | | $ | 514,419 | | $ | 173,270 | |
| | | | | | | |
Ratio and Supplemental Data | | | | | | | |
| | | | | | | |
Expenses to average net assets: | | | | | | | |
After reimbursement/fee waiver(b) | | 0.90 | %(c) | 0.96 | %(c) | 1.06 | %(c) |
Before reimbursement/fee waiver(b) | | 0.90 | %(d) | 0.96 | %(d) | 1.06 | %(d) |
Net investment income (loss), to average net assets(b) | | 0.23 | % | (0.03 | )% | (0.65 | )% |
Portfolio turnover rate(e) | | 68 | % | 92 | % | 59 | % |
The notes to the financial statements are an integral part of this report.
104
| | TA IDEX Jennison Growth | |
| | Class A | |
| | October 31, | | October 31, | | October 31, | | October 31, | | October 31, | |
| | 2007 | | 2006 | | 2005 | | 2004 | | 2003 | |
| | | | | | | | | | | |
Net Asset Value | | | | | | | | | | | |
Beginning of year | | $ | 11.35 | | $ | 11.06 | | $ | 9.52 | | $ | 8.54 | | $ | 6.88 | |
| | | | | | | | | | | |
Investment Operations(h) | | | | | | | | | | | |
Net Investment income (loss) | | (0.02 | ) | (0.06 | ) | (0.03 | ) | (0.07 | ) | (0.04 | ) |
Net realized and unrealized gain (loss) on investments | | 2.06 | | 0.56 | | 1.57 | | 1.05 | | 1.70 | |
Total from investment operations | | 2.04 | | 0.50 | | 1.54 | | 0.98 | | 1.66 | |
| | | | | | | | | | | |
Distributions | | | | | | | | | | | |
Net investment income | | — | | — | | — | | — | | — | |
Net realized gains on investments | | (0.46 | ) | (0.21 | ) | — | | — | | — | |
Total distributions | | (0.46 | ) | (0.21 | ) | — | | — | | — | |
| | | | | | | | | | | |
Net Asset Value | | | | | | | | | | | |
End of year | | $ | 12.93 | | $ | 11.35 | | $ | 11.06 | | $ | 9.52 | | $ | 8.54 | |
| | | | | | | | | | | |
Total Return(a) | | 18.59 | % | 4.44 | % | 16.18 | % | 11.48 | % | 24.13 | % |
| | | | | | | | | | | |
Net Assets End of Period | | $ | 9,065 | | $ | 10,924 | | $ | 64,920 | | $ | 57,760 | | $ | 18,833 | |
| | | | | | | | | | | |
Ratio and Supplemental Data | | | | | | | | | | | |
| | | | | | | | | | | |
Expenses to average net assets: | | | | | | | | | | | |
After reimbursement/fee waiver(b) | | 1.30 | %(c) | 1.41 | %(c) | 1.41 | %(c) | 1.59 | %(c) | 1.75 | %(c) |
Before reimbursement/fee waiver(b) | | 1.30 | %(d) | 1.41 | %(d) | 1.41 | %(d) | 1.59 | %(d) | 1.90 | %(d) |
Net investment income (loss), to average net assets(b) | | (0.21 | )% | (0.56 | )% | (0.33 | )% | (0.79 | )% | (0.54 | )% |
Portfolio turnover rate(e) | | 63 | % | 80 | % | 86 | % | 147 | % | 100 | % |
| | TA IDEX Jennison Growth | |
| | Class B | |
| | October 31, | | October 31, | | October 31, | | October 31, | | October 31, | |
| | 2007 | | 2006 | | 2005 | | 2004 | | 2003 | |
| | | | | | | | | | | |
Net Asset Value | | | | | | | | | | | |
Beginning of year | | $ | 10.63 | | $ | 10.39 | | $ | 9.03 | | $ | 8.14 | | $ | 6.60 | |
| | | | | | | | | | | |
Investment Operations(h) | | | | | | | | | | | |
Net Investment income (loss) | | (0.01 | ) | (0.08 | ) | (0.11 | ) | (0.12 | ) | (0.08 | ) |
Net realized and unrealized gain (loss) on investments | | 1.93 | | 0.53 | | 1.47 | | 1.01 | | 1.62 | |
Total from investment operations | | 1.92 | | 0.45 | | 1.36 | | 0.89 | | 1.54 | |
| | | | | | | | | | | |
Distributions | | | | | | | | | | | |
Net investment income | �� | — | | — | | — | | — | | — | |
Net realized gains on investments | | (0.46 | ) | (0.21 | ) | — | | — | | — | |
Total distributions | | (0.46 | ) | (0.21 | ) | — | | — | | — | |
| | | | | | | | | | | |
Net Asset Value | | | | | | | | | | | |
End of year | | $ | 12.09 | | $ | 10.63 | | $ | 10.39 | | $ | 9.03 | | $ | 8.14 | |
| | | | | | | | | | | |
Total Return(a) | | 18.72 | % | 4.24 | % | 15.06 | % | 10.93 | % | 23.33 | % |
| | | | | | | | | | | |
Net Assets End of Period | | $ | 13,754 | | $ | 17,590 | | $ | 32,778 | | $ | 34,667 | | $ | 37,500 | |
| | | | | | | | | | | |
Ratio and Supplemental Data | | | | | | | | | | | |
| | | | | | | | | | | |
Expenses to average net assets: | | | | | | | | | | | |
After reimbursement/fee waiver(b) | | 1.23 | %(c) | 1.62 | %(c) | 2.27 | %(c) | 2.24 | %(c) | 2.40 | %(c) |
Before reimbursement/fee waiver(b) | | 1.23 | %(d) | 1.62 | %(d) | 2.27 | %(d) | 2.24 | %(d) | 2.55 | %(d) |
Net investment income (loss), to average net assets(b) | | (0.14 | )% | (0.75 | )% | (1.18 | )% | (1.37 | )% | (1.19 | )% |
Portfolio turnover rate(e) | | 63 | % | 80 | % | 86 | % | 147 | % | 100 | % |
The notes to the financial statements are an integral part of this report.
105
| | TA IDEX Jennison Growth | |
| | Class C(f) | |
| | October 31, | | October 31, | | October 31, | | October 31, | | October 31, | |
| | 2007 | | 2006 | | 2005 | | 2004 | | 2003 | |
| | | | | | | | | | | |
Net Asset Value | | | | | | | | | | | |
Beginning of year | | $ | 10.66 | | $ | 10.41 | | $ | 9.05 | | $ | 8.14 | | $ | 6.60 | |
| | | | | | | | | | | |
Investment Operations(h) | | | | | | | | | | | |
Net Investment income (loss) | | (0.01 | ) | (0.08 | ) | (0.12 | ) | (0.15 | ) | (0.09 | ) |
Net realized and unrealized gain (loss) on investments | | 1.93 | | 0.54 | | 1.48 | | 1.06 | | 1.63 | |
Total from investment operations | | 1.92 | | 0.46 | | 1.36 | | 0.91 | | 1.54 | |
| | | | | | | | | | | |
Distributions | | | | | | | | | | | |
Net investment income | | — | | — | | — | | — | | — | |
Net realized gains on investments | | (0.46 | ) | (0.21 | ) | — | | — | | — | |
Total distributions | | (0.46 | ) | (0.21 | ) | — | | — | | — | |
| | | | | | | | | | | |
Net Asset Value | | | | | | | | | | | |
End of year | | $ | 12.12 | | $ | 10.66 | | $ | 10.41 | | $ | 9.05 | | $ | 8.14 | |
| | | | | | | | | | | |
Total Return(a) | | 18.67 | % | 4.33 | % | 15.03 | % | 11.18 | % | 23.33 | % |
| | | | | | | | | | | |
Net Assets End of Period | | $ | 4,928 | | $ | 6,130 | | $ | 11,163 | | $ | 13,717 | | $ | 607 | |
| | | | | | | | | | | |
Ratio and Supplemental Data | | | | | | | | | | | |
| | | | | | | | | | | |
Expenses to average net assets: | | | | | | | | | | | |
After reimbursement/fee waiver(b) | | 1.20 | %(c) | 1.66 | %(c) | 2.37 | %(c) | 2.39 | %(c) | 2.40 | %(c) |
Before reimbursement/fee waiver(b) | | 1.20 | %(d) | 1.66 | %(d) | 2.37 | %(d) | 2.39 | %(d) | 2.55 | %(d) |
Net investment income (loss), to average net assets(b) | | (0.10 | )% | (0.79 | )% | (1.20 | )% | (1.68 | )% | (1.19 | )% |
Portfolio turnover rate(e) | | 63 | % | 80 | % | 86 | % | 147 | % | 100 | % |
| | TA IDEX Jennison Growth | |
| | Class I | |
| | October 31, | | October 31, | |
| | 2007 | | 2006 | |
| | | | | |
Net Asset Value | | | | | |
Beginning of year | | $ | 11.40 | | $ | 11.43 | |
| | | | | |
Investment Operations(h) | | | | | |
Net Investment income (loss) | | 0.03 | | — | |
Net realized and unrealized gain (loss) on investments | | 2.08 | | 0.18 | |
Total from investment operations | | 2.11 | | 0.18 | |
| | | | | |
Distributions | | | | | |
Net investment income | | — | | — | |
Net realized gains on investments | | (0.46 | ) | (0.21 | ) |
Total distributions | | (0.46 | ) | (0.21 | ) |
| | | | | |
Net Asset Value | | | | | |
End of year | | $ | 13.05 | | $ | 11.40 | |
| | | | | |
Total Return(a) | | 19.14 | % | 1.50 | % |
| | | | | |
Net Assets End of Period | | $ | 160,815 | | $ | 96,273 | |
| | | | | |
Ratio and Supplemental Data | | | | | |
| | | | | |
Expenses to average net assets: | | | | | |
After reimbursement/fee waiver(b) | | 0.87 | %(c) | 0.89 | %(c) |
Before reimbursement/fee waiver(b) | | 0.87 | %(d) | 0.89 | %(d) |
Net investment income (loss), to average net assets(b) | | 0.22 | % | (0.02 | )% |
Portfolio turnover rate(e) | | 63 | % | 80 | % |
The notes to the financial statements are an integral part of this report.
106
| | TA IDEX Legg Mason Partners Investors Value | |
| | Class A | |
| | October 31, | | October 31, | | October 31, | | October 31, | | October 31, | |
| | 2007 | | 2006 | | 2005 | | 2004 | | 2003 | |
| | | | | | | | | | | |
Net Asset Value | | | | | | | | | | | |
Beginning of year | | $ | 11.12 | | $ | 14.17 | | $ | 13.30 | | $ | 12.51 | | $ | 10.21 | |
| | | | | | | | | | | |
Investment Operations(h) | | | | | | | | | | | |
Net Investment income (loss) | | 0.08 | | 0.11 | | 0.16 | | 0.10 | | 0.08 | |
Net realized and unrealized gain (loss) on investments | | 1.07 | | 1.73 | | 1.11 | | 1.09 | | 2.31 | |
Total from investment operations | | 1.15 | | 1.84 | | 1.27 | | 1.19 | | 2.39 | |
| | | | | | | | | | | |
Distributions | | | | | | | | | | | |
Net investment income | | (0.08 | ) | (0.03 | ) | (0.19 | ) | (0.10 | ) | (0.02 | ) |
Net realized gains on investments | | (2.08 | ) | (4.86 | ) | (0.21 | ) | (0.30 | ) | (0.07 | ) |
Total distributions | | (2.16 | ) | (4.89 | ) | (0.40 | ) | (0.40 | ) | (0.09 | ) |
| | | | | | | | | | | |
Net Asset Value | | | | | | | | | | | |
End of year | | $ | 10.11 | | $ | 11.12 | | $ | 14.17 | | $ | 13.30 | | $ | 12.51 | |
| | | | | | | | | | | |
Total Return(a) | | 11.90 | % | 17.14 | % | 9.60 | % | 9.52 | % | 23.57 | % |
| | | | | | | | | | | |
Net Assets End of Period | | $ | 9,238 | | $ | 10,885 | | $ | 180,933 | | $ | 405,455 | | $ | 233,779 | |
| | | | | | | | | | | |
Ratio and Supplemental Data | | | | | | | | | | | |
| | | | | | | | | | | |
Expenses to average net assets: | | | | | | | | | | | |
After reimbursement/fee waiver(b) | | 1.21 | %(c) | 1.33 | %(c) | 1.25 | %(c) | 1.25 | %(c) | 1.42 | %(c) |
Before reimbursement/fee waiver(b) | | 1.22 | %(d) | 1.33 | %(d) | 1.25 | %(d) | 1.25 | %(d) | 1.42 | %(d) |
Net investment income (loss), to average net assets(b) | | 0.79 | % | 0.95 | % | 1.14 | % | 0.72 | % | 0.71 | % |
Portfolio turnover rate(e) | | 12 | % | 23 | % | 47 | % | 33 | % | 32 | % |
| | TA IDEX Legg Mason Partners Investors Value | |
| | Class B | |
| | October 31, | | October 31, | | October 31, | | October 31, | | October 31, | |
| | 2007 | | 2006 | | 2005 | | 2004 | | 2003 | |
| | | | | | | | | | | |
Net Asset Value | | | | | | | | | | | |
Beginning of year | | $ | 10.30 | | $ | 13.48 | | $ | 12.65 | | $ | 11.99 | | $ | 9.84 | |
| | | | | | | | | | | |
Investment Operations(h) | | | | | | | | | | | |
Net Investment income (loss) | | 0.07 | | 0.05 | | — | | 0.01 | | 0.01 | |
Net realized and unrealized gain (loss) on investments | | 0.97 | | 1.65 | | 1.08 | | 1.05 | | 2.23 | |
Total from investment operations | | 1.04 | | 1.70 | | 1.08 | | 1.06 | | 2.24 | |
| | | | | | | | | | | |
Distributions | | | | | | | | | | | |
Net investment income | | (0.06 | ) | (0.02 | ) | (0.04 | ) | (0.10 | ) | (0.02 | ) |
Net realized gains on investments | | (2.08 | ) | (4.86 | ) | (0.21 | ) | (0.30 | ) | (0.07 | ) |
Total distributions | | (2.14 | ) | (4.88 | ) | (0.25 | ) | (0.40 | ) | (0.09 | ) |
| | | | | | | | | | | |
Net Asset Value | | | | | | | | | | | |
End of year | | $ | 9.20 | | $ | 10.30 | | $ | 13.48 | | $ | 12.65 | | $ | 11.99 | |
| | | | | | | | | | | |
Total Return(a) | | 11.80 | % | 17.02 | % | 8.53 | % | 8.82 | % | 22.93 | % |
| | | | | | | | | | | |
Net Assets End of Period | | $ | 9,104 | | $ | 12,677 | | $ | 17,684 | | $ | 20,463 | | $ | 20,102 | |
| | | | | | | | | | | |
Ratio and Supplemental Data | | | | | | | | | | | |
| | | | | | | | | | | |
Expenses to average net assets: | | | | | | | | | | | |
After reimbursement/fee waiver(b) | | 1.20 | %(c) | 1.57 | %(c) | 2.20 | %(c) | 1.86 | %(c) | 2.07 | %(c) |
Before reimbursement/fee waiver(b) | | 1.21 | %(d) | 1.58 | %(d) | 2.24 | %(d) | 1.86 | %(d) | 2.07 | %(d) |
Net investment income (loss), to average net assets(b) | | 0.81 | % | 0.49 | % | 0.02 | % | 0.11 | % | 0.06 | % |
Portfolio turnover rate(e) | | 12 | % | 23 | % | 47 | % | 33 | % | 32 | % |
The notes to the financial statements are an integral part of this report.
107
| | TA IDEX Legg Mason Partners Investors Value | |
| | Class C(f) | |
| | October 31, | | October 31, | | October 31, | | October 31, | | October 31, | |
| | 2007 | | 2006 | | 2005 | | 2004 | | 2003 | |
| | | | | | | | | | | |
Net Asset Value | | | | | | | | | | | |
Beginning of year | | $ | 10.24 | | $ | 13.43 | | $ | 12.62 | | $ | 11.99 | | $ | 9.77 | |
| | | | | | | | | | | |
Investment Operations(h) | | | | | | | | | | | |
Net Investment income (loss) | | 0.07 | | 0.05 | | — | | (0.05 | ) | 0.01 | |
Net realized and unrealized gain (loss) on investments | | 0.96 | | 1.64 | | 1.08 | | 1.08 | | 2.30 | |
Total from investment operations | | 1.03 | | 1.69 | | 1.08 | | 1.03 | | 2.31 | |
| | | | | | | | | | | |
Distributions | | | | | | | | | | | |
Net investment income | | (0.06 | ) | (0.02 | ) | (0.06 | ) | (0.10 | ) | (0.02 | ) |
Net realized gains on investments | | (2.08 | ) | (4.86 | ) | (0.21 | ) | (0.30 | ) | (0.07 | ) |
Total distributions | | (2.14 | ) | (4.88 | ) | (0.27 | ) | (0.40 | ) | (0.09 | ) |
| | | | | | | | | | | |
Net Asset Value | | | | | | | | | | | |
End of year | | $ | 9.13 | | $ | 10.24 | | $ | 13.43 | | $ | 12.62 | | $ | 11.99 | |
| | | | | | | | | | | |
Total Return(a) | | 11.83 | % | 16.99 | % | 8.57 | % | 8.62 | % | 23.81 | % |
| | | | | | | | | | | |
Net Assets End of Period | | $ | 2,469 | | $ | 3,015 | | $ | 4,908 | | $ | 5,981 | | $ | 797 | |
| | | | | | | | | | | |
Ratio and Supplemental Data | | | | | | | | | | | |
| | | | | | | | | | | |
Expenses to average net assets: | | | | | | | | | | | |
After reimbursement/fee waiver(b) | | 1.19 | %(c) | 1.60 | %(c) | 2.20 | %(c) | 2.20 | %(c) | 2.07 | %(c) |
Before reimbursement/fee waiver(b) | | 1.22 | %(d) | 1.67 | %(d) | 2.38 | %(d) | 2.30 | %(d) | 2.07 | %(d) |
Net investment income (loss), to average net assets(b) | | 0.82 | % | 0.47 | % | 0.03 | % | (0.37 | )% | 0.05 | % |
Portfolio turnover rate(e) | | 12 | % | 23 | % | 47 | % | 33 | % | 32 | % |
| | TA IDEX Legg Mason Partners
Investors Value | |
| | Class I | |
| | October 31, | | October 31, | |
| | 2007 | | 2006 | |
| | | | | |
Net Asset Value | | | | | |
Beginning of year | | $ | 11.15 | | $ | 14.35 | |
| | | | | |
Investment Operations(h) | | | | | |
Net Investment income (loss) | | 0.11 | | 0.12 | |
Net realized and unrealized gain (loss) on investments | | 1.05 | | 1.59 | |
Total from investment operations | | 1.16 | | 1.71 | |
| | | | | |
Distributions | | | | | |
Net investment income | | (0.12 | ) | (0.05 | ) |
Net realized gains on investments | | (2.08 | ) | (4.86 | ) |
Total distributions | | (2.20 | ) | (4.91 | ) |
| | | | | |
Net Asset Value | | | | | |
End of year | | $ | 10.11 | | $ | 11.15 | |
| | | | | |
Total Return(a) | | 12.10 | % | 16.22 | % |
| | | | | |
Net Assets End of Period | | $ | 64,733 | | $ | 65,758 | |
| | | | | |
Ratio and Supplemental Data | | | | | |
| | | | | |
Expenses to average net assets: | | | | | |
After reimbursement/fee waiver(b) | | 0.89 | %(c) | 0.90 | %(c) |
Before reimbursement/fee waiver(b) | | 0.89 | %(d) | 0.90 | %(d) |
Net investment income (loss), to average net assets(b) | | 1.10 | % | 1.17 | % |
Portfolio turnover rate(e) | | 12 | % | 23 | % |
The notes to the financial statements are an integral part of this report.
108
| | TA IDEX Marsico Growth | |
| | Class A | |
| | October 31, | | October 31, | | October 31, | | October 31, | | October 31, | |
| | 2007 | | 2006 | | 2005 | | 2004 | | 2003 | |
| | | | | | | | | | | |
Net Asset Value | | | | | | | | | | | |
Beginning of year | | $ | 11.02 | | $ | 10.32 | | $ | 9.15 | | $ | 8.97 | | $ | 7.56 | |
| | | | | | | | | | | |
Investment Operations(h) | | | | | | | | | | | |
Net Investment income (loss) | | 0.01 | | (0.05 | ) | (0.03 | ) | (0.05 | ) | (0.08 | ) |
Net realized and unrealized gain (loss) on investments | | 3.28 | | 0.75 | | 1.20 | | 0.23 | | 1.49 | |
Total from investment operations | | 3.29 | | 0.70 | | 1.17 | | 0.18 | | 1.41 | |
| | | | | | | | | | | |
Distributions | | | | | | | | | | | |
Net investment income | | — | | — | | — | | — | | — | |
Net realized gains on investments | | — | | — | | — | | — | | — | |
Total distributions | | — | | — | | — | | — | | — | |
| | | | | | | | | | | |
Net Asset Value | | | | | | | | | | | |
End of year | | $ | 14.31 | | $ | 11.02 | | $ | 10.32 | | $ | 9.15 | | $ | 8.97 | |
| | | | | | | | | | | |
Total Return(a) | | 29.85 | % | 6.78 | % | 12.79 | % | 2.01 | % | 18.65 | % |
| | | | | | | | | | | |
Net Assets End of Period | | $ | 8,451 | | $ | 9,362 | | $ | 102,906 | | $ | 37,186 | | $ | 34,167 | |
| | | | | | | | | | �� | |
Ratio and Supplemental Data | | | | | | | | | | | |
| | | | | | | | | | | |
Expenses to average net assets: | | | | | | | | | | | |
After reimbursement/fee waiver(b) | | 1.20 | %(c) | 1.34 | %(c) | 1.35 | %(c) | 1.52 | %(c) | 1.75 | %(c) |
Before reimbursement/fee waiver(b) | | 1.20 | %(d) | 1.34 | %(d) | 1.35 | %(d) | 1.52 | %(d) | 1.80 | %(d) |
Net investment income (loss), to average net assets(b) | | 0.08 | % | (0.43 | )% | (0.30 | )% | (0.58 | )% | (0.97 | )% |
Portfolio turnover rate(e) | | 40 | % | 62 | % | 74 | % | 85 | % | 129 | % |
| | | | | | | | | | | |
| | TA IDEX Marsico Growth | |
| | Class B | |
| | October 31, | | October 31, | | October 31, | | October 31, | | October 31, | |
| | 2007 | | 2006 | | 2005 | | 2004 | | 2003 | |
| | | | | | | | | | | |
Net Asset Value | | | | | | | | | | | |
Beginning of year | | $ | 10.47 | | $ | 9.83 | | $ | 8.80 | | $ | 8.68 | | $ | 7.36 | |
| | | | | | | | | | | |
Investment Operations(h) | | | | | | | | | | | |
Net Investment income (loss) | | 0.01 | | (0.07 | ) | (0.12 | ) | (0.10 | ) | (0.12 | ) |
Net realized and unrealized gain (loss) on investments | | 3.13 | | 0.71 | | 1.15 | | 0.22 | | 1.44 | |
Total from investment operations | | 3.14 | | 0.64 | | 1.03 | | 0.12 | | 1.32 | |
| | | | | | | | | | | |
Distributions | | | | | | | | | | | |
Net investment income | | — | | — | | — | | — | | — | |
Net realized gains on investments | | — | | — | | — | | — | | — | |
Total distributions | | — | | — | | — | | — | | — | |
| | | | | | | | | | | |
Net Asset Value | | | | | | | | | | | |
End of year | | $ | 13.61 | | $ | 10.47 | | $ | 9.83 | | $ | 8.80 | | $ | 8.68 | |
| | | | | | | | | | | |
Total Return(a) | | 29.99 | % | 6.51 | % | 11.70 | % | 1.38 | % | 17.93 | % |
| | | | | | | | | | | |
Net Assets End of Period | | $ | 11,589 | | $ | 13,327 | | $ | 20,650 | | $ | 19,792 | | $ | 19,723 | |
| | | | | | | | | | | |
Ratio and Supplemental Data | | | | | | | | | | | |
| | | | | | | | | | | |
Expenses to average net assets: | | | | | | | | | | | |
After reimbursement/fee waiver(b) | | 1.17 | %(c) | 1.58 | %(c) | 2.31 | %(c) | 2.13 | %(c) | 2.40 | %(c) |
Before reimbursement/fee waiver(b) | | 1.17 | %(d) | 1.58 | %(d) | 2.31 | %(d) | 2.13 | %(d) | 2.45 | %(d) |
Net investment income (loss), to average net assets(b) | | 0.10 | % | (0.64 | )% | (1.24 | )% | (1.19 | )% | (1.62 | )% |
Portfolio turnover rate(e) | | 40 | % | 62 | % | 74 | % | 85 | % | 129 | % |
The notes to the financial statements are an integral part of this report.
109
| | TA IDEX Marsico Growth | |
| | Class C(f) | |
| | October 31, | | October 31, | | October 31, | | October 31, | | October 31, | |
| | 2007 | | 2006 | | 2005 | | 2004 | | 2003 | |
| | | | | | | | | | | |
Net Asset Value | | | | | | | | | | | |
Beginning of year | | $ | 10.47 | | $ | 9.81 | | $ | 8.78 | | $ | 8.68 | | $ | 7.18 | |
| | | | | | | | | | | |
Investment Operations(h) | | | | | | | | | | | |
Net Investment income (loss) | | 0.03 | | (0.05 | ) | (0.11 | ) | (0.12 | ) | (0.12 | ) |
Net realized and unrealized gain (loss) on investments | | 3.12 | | 0.71 | | 1.14 | | 0.22 | | 1.62 | |
Total from investment operations | | 3.15 | | 0.66 | | 1.03 | | 0.10 | | 1.50 | |
| | | | | | | | | | | |
Distributions | | | | | | | | | | | |
Net investment income | | — | | — | | — | | — | | — | |
Net realized gains on investments | | — | | — | | — | | — | | — | |
Total distributions | | — | | — | | — | | — | | — | |
| | | | | | | | | | | |
Net Asset Value | | | | | | | | | | | |
End of year | | $ | 13.62 | | $ | 10.47 | | $ | 9.81 | | $ | 8.78 | | $ | 8.68 | |
| | | | | | | | | | | |
Total Return(a) | | 30.09 | % | 6.73 | % | 11.69 | % | 1.27 | % | 20.89 | % |
| | | | | | | | | | | |
Net Assets End of Period | | $ | 8,455 | | $ | 8,140 | | $ | 12,009 | | $ | 9,379 | | $ | 1,200 | |
| | | | | | | | | | | |
Ratio and Supplemental Data | | | | | | | | | | | |
| | | | | | | | | | | |
Expenses to average net assets: | | | | | | | | | | | |
After reimbursement/fee waiver(b) | | 1.02 | %(c) | 1.46 | %(c) | 2.26 | %(c) | 2.40 | %(c) | 2.40 | %(c) |
Before reimbursement/fee waiver(b) | | 1.02 | %(d) | 1.46 | %(d) | 2.26 | %(d) | 2.40 | %(d) | 2.46 | %(d) |
Net investment income (loss), to average net assets(b) | | 0.23 | % | (0.52 | )% | (1.20 | )% | (1.38 | )% | (1.62 | )% |
Portfolio turnover rate(e) | | 40 | % | 62 | % | 74 | % | 85 | % | 129 | % |
| | TA IDEX Marsico Growth | |
| | Class I | |
| | October 31, | | October 31, | |
| | 2007 | | 2006 | |
| | | | | |
Net Asset Value | | | | | |
Beginning of year | | $ | 11.07 | | $ | 10.63 | |
| | | | | |
Investment Operations(h) | | | | | |
Net Investment income (loss) | | 0.04 | | 0.01 | |
Net realized and unrealized gain (loss) on investments | | 3.30 | | 0.43 | |
Total from investment operations | | 3.34 | | 0.44 | |
| | | | | |
Distributions | | | | | |
Net investment income | | (0.01 | ) | — | |
Net realized gains on investments | | — | | — | |
Total distributions | | (0.01 | ) | — | |
| | | | | |
Net Asset Value | | | | | |
End of year | | $ | 14.40 | | $ | 11.07 | |
| | | | | |
Total Return(a) | | 30.25 | % | 4.14 | % |
| | | | | |
Net Assets End of Period | | $ | 396,693 | | $ | 100,280 | |
| | | | | |
Ratio and Supplemental Data | | | | | |
| | | | | |
Expenses to average net assets: | | | | | |
After reimbursement/fee waiver(b) | | 0.86 | %(c) | 0.89 | %(c) |
Before reimbursement/fee waiver(b) | | 0.86 | %(d) | 0.89 | %(d) |
Net investment income (loss), to average net assets(b) | | 0.30 | % | 0.07 | % |
Portfolio turnover rate(e) | | 40 | % | 62 | % |
The notes to the financial statements are an integral part of this report.
110
| | TA IDEX MFS International Equity | |
| | Class A | |
| | October 31, | | October 31, | | October 31, | | October 31, | | October 31, | |
| | 2007 | | 2006 | | 2005 | | 2004 | | 2003 | |
| | | | | | | | | | | |
Net Asset Value | | | | | | | | | | | |
Beginning of year | | $ | 8.07 | | $ | 10.07 | | $ | 8.81 | | $ | 8.03 | | $ | 7.00 | |
| | | | | | | | | | | |
Investment Operations(h) | | | | | | | | | | | |
Net Investment income (loss) | | 0.05 | | 0.03 | | 0.03 | | — | | 0.02 | |
Net realized and unrealized gain (loss) on investments | | 0.96 | | 1.76 | | 1.30 | | 0.80 | | 1.01 | |
Total from investment operations | | 1.01 | | 1.79 | | 1.33 | | 0.80 | | 1.03 | |
| | | | | | | | | | | |
Distributions | | | | | | | | | | | |
Net investment income | | (0.18 | ) | (0.08 | ) | (0.07 | ) | (0.02 | ) | — | |
Net realized gains on investments | | (3.95 | ) | (3.71 | ) | — | | — | | — | |
Total distributions | | (4.13 | ) | (3.79 | ) | (0.07 | ) | (0.02 | ) | — | |
| | | | | | | | | | | |
Net Asset Value | | | | | | | | | | | |
End of year | | $ | 4.95 | | $ | 8.07 | | $ | 10.07 | | $ | 8.81 | | $ | 8.03 | |
| | | | | | | | | | | |
Total Return(a) | | 20.00 | % | 24.04 | % | 15.17 | % | 9.95 | % | 14.71 | % |
| | | | | | | | | | | |
Net Assets End of Period | | $ | 10,194 | | $ | 11,604 | | $ | 67,656 | | $ | 187,608 | | $ | 152,086 | |
| | | | | | | | | | | |
Ratio and Supplemental Data | | | | | | | | | | | |
| | | | | | | | | | | |
Expenses to average net assets: | | | | | | | | | | | |
After reimbursement/fee waiver(b) | | 1.61 | %(c) | 1.48 | %(c) | 1.56 | %(c) | 1.59 | %(c) | 1.78 | %(c) |
Before reimbursement/fee waiver(b) | | 1.81 | %(d) | 1.92 | %(d) | 1.56 | %(d) | 1.59 | %(d) | 2.39 | %(d) |
Net investment income (loss), to average net assets(b) | | 1.11 | % | 0.39 | % | 0.36 | % | (0.05 | )% | 0.23 | % |
Portfolio turnover rate(e) | | 26 | % | 131 | % | 82 | % | 159 | % | 220 | % |
| | TA IDEX MFS International Equity | |
| | Class B | |
| | October 31, | | October 31, | | October 31, | | October 31, | | October 31, | |
| | 2007 | | 2006 | | 2005 | | 2004 | | 2003 | |
| | | | | | | | | | | |
Net Asset Value | | | | | | | | | | | |
Beginning of year | | $ | 7.50 | | $ | 9.62 | | $ | 8.41 | | $ | 7.70 | | $ | 6.76 | |
| | | | | | | | | | | |
Investment Operations(h) | | | | | | | | | | | |
Net Investment income (loss) | | 0.05 | | 0.01 | | — | | (0.04 | ) | (0.03 | ) |
Net realized and unrealized gain (loss) on investments | | 0.85 | | 1.65 | | 1.21 | | 0.77 | | 0.97 | |
Total from investment operations | | 0.90 | | 1.66 | | 1.21 | | 0.73 | | 0.94 | |
| | | | | | | | | | | |
Distributions | | | | | | | | | | | |
Net investment income | | (0.17 | ) | (0.07 | ) | — | | (0.02 | ) | — | |
Net realized gains on investments | | (3.95 | ) | (3.71 | ) | — | | — | | — | |
Total distributions | | (4.12 | ) | (3.78 | ) | — | | (0.02 | ) | — | |
| | | | | | | | | | | |
Net Asset Value | | | | | | | | | | | |
End of year | | $ | 4.28 | | $ | 7.50 | | $ | 9.62 | | $ | 8.41 | | $ | 7.70 | |
| | | | | | | | | | | |
Total Return(a) | | 20.12 | % | 23.78 | % | 14.41 | % | 9.46 | % | 13.91 | % |
| | | | | | | | | | | |
Net Assets End of Period | | $ | 13,841 | | $ | 16,091 | | $ | 21,069 | | $ | 20,153 | | $ | 21,421 | |
| | | | | | | | | | | |
Ratio and Supplemental Data | | | | | | | | | | | |
| | | | | | | | | | | |
Expenses to average net assets: | | | | | | | | | | | |
After reimbursement/fee waiver(b) | | 1.59 | %(c) | 1.69 | %(c) | 2.34 | %(c) | 2.09 | %(c) | 2.44 | %(c) |
Before reimbursement/fee waiver(b) | | 1.79 | %(d) | 2.20 | %(d) | 2.72 | %(d) | 2.09 | %(d) | 3.05 | %(d) |
Net investment income (loss), to average net assets(b) | | 1.13 | % | 0.17 | % | (0.01 | )% | (0.46 | )% | (0.42 | )% |
Portfolio turnover rate(e) | | 26 | % | 131 | % | 82 | % | 159 | % | 220 | % |
The notes to the financial statements are an integral part of this report.
111
| | TA IDEX MFS International Equity | |
| | Class C(f) | |
| | October 31, | | October 31, | | October 31, | | October 31, | | October 31, | |
| | 2007 | | 2006 | | 2005 | | 2004 | | 2003 | |
| | | | | | | | | | | |
Net Asset Value | | | | | | | | | | | |
Beginning of year | | $ | 7.41 | | $ | 9.55 | | $ | 8.40 | | $ | 7.70 | | $ | 6.73 | |
| | | | | | | | | | | |
Investment Operations(h) | | | | | | | | | | | |
Net Investment income (loss) | | 0.05 | | 0.01 | | — | | (0.09 | ) | (0.03 | ) |
Net realized and unrealized gain (loss) on investments | | 0.84 | | 1.63 | | 1.20 | | 0.81 | | 1.00 | |
Total from investment operations | | 0.89 | | 1.64 | | 1.20 | | 0.72 | | 0.97 | |
| | | | | | | | | | | |
Distributions | | | | | | | | | | | |
Net investment income | | (0.17 | ) | (0.07 | ) | (0.05 | ) | (0.02 | ) | — | |
Net realized gains on investments | | (3.95 | ) | (3.71 | ) | — | | — | | — | |
Total distributions | | (4.12 | ) | (3.78 | ) | (0.05 | ) | (0.02 | ) | — | |
| | | | | | | | | | | |
Net Asset Value | | | | | | | | | | | |
End of year | | $ | 4.18 | | $ | 7.41 | | $ | 9.55 | | $ | 8.40 | | $ | 7.70 | |
| | | | | | | | | | | |
Total Return(a) | | 20.26 | % | 23.77 | % | 14.36 | % | 9.33 | % | 14.41 | % |
| | | | | | | | | | | |
Net Assets End of Period | | $ | 5,332 | | $ | 6,089 | | $ | 8,737 | | $ | 9,166 | | $ | 568 | |
| | | | | | | | | | | |
Ratio and Supplemental Data | | | | | | | | | | | |
| | | | | | | | | | | |
Expenses to average net assets: | | | | | | | | | | | |
After reimbursement/fee waiver(b) | | 1.51 | %(c) | 1.70 | %(c) | 2.34 | %(c) | 2.40 | %(c) | 2.44 | %(c) |
Before reimbursement/fee waiver(b) | | 1.66 | %(d) | 2.08 | %(d) | 2.70 | %(d) | 2.49 | %(d) | 3.04 | %(d) |
Net investment income (loss), to average net assets(b) | | 1.19 | % | 0.17 | % | (0.01 | )% | (1.07 | )% | (0.42 | )% |
Portfolio turnover rate(e) | | 26 | % | 131 | % | 82 | % | 159 | % | 220 | % |
| | TA IDEX PIMCO Real Return TIPS | |
| | Class A | |
| | October 31, | | October 31, | | October 31, | | October 31, | | October 31, | |
| | 2007 | | 2006 | | 2005 | | 2004 | | 2003 | |
| | | | | | | | | | | |
Net Asset Value | | | | | | | | | | | |
Beginning of year | | $ | 10.05 | | $ | 10.23 | | $ | 10.48 | | $ | 10.10 | | $ | 10.00 | |
| | | | | | | | | | | |
Investment Operations(h) | | | | | | | | | | | |
Net Investment income (loss) | | 0.33 | | 0.94 | | 0.30 | | 0.02 | | 0.14 | |
Net realized and unrealized gain (loss) on investments | | 0.18 | | (0.70 | ) | (0.06 | ) | 0.76 | | 0.07 | |
Total from investment operations | | 0.51 | | 0.24 | | 0.24 | | 0.78 | | 0.21 | |
| | | | | | | | | | | |
Distributions | | | | | | | | | | | |
Net investment income | | (0.36 | ) | (0.41 | ) | (0.32 | ) | (0.02 | ) | (0.11 | ) |
Net realized gains on investments | | — | | (0.01 | ) | (0.17 | ) | (0.38 | ) | — | |
Total distributions | | (0.36 | ) | (0.42 | ) | (0.49 | ) | (0.40 | ) | (0.11 | ) |
| | | | | | | | | | | |
Net Asset Value | | | | | | | | | | | |
End of year | | $ | 10.20 | | $ | 10.05 | | $ | 10.23 | | $ | 10.48 | | $ | 10.10 | |
| | | | | | | | | | | |
Total Return(a) | | 5.24 | % | 2.36 | % | 2.35 | % | 7.94 | % | 2.09 | % |
| | | | | | | | | | | |
Net Assets End of Period | | $ | 3,045 | | $ | 4,107 | | $ | 277,289 | | $ | 330,282 | | $ | 36,531 | |
| | | | | | | | | | | |
Ratio and Supplemental Data | | | | | | | | | | | |
| | | | | | | | | | | |
Expenses to average net assets: | | | | | | | | | | | |
After reimbursement/fee waiver(b) | | 0.87 | %(c) | 1.07 | %(c) | 1.10 | %(c) | 1.15 | %(c) | 1.65 | %(c) |
Before reimbursement/fee waiver(b) | | 0.87 | %(d) | 1.07 | %(d) | 1.10 | %(d) | 1.15 | %(d) | 2.03 | %(d) |
Net investment income (loss), to average net assets(b) | | 3.31 | % | 9.24 | % | 2.89 | % | 0.20 | % | 2.07 | % |
Portfolio turnover rate(e) | | 375 | % | 384 | % | 662 | % | 1438 | % | 480 | % |
The notes to the financial statements are an integral part of this report.
112
| | TA IDEX PIMCO Real Return TIPS | |
| | Class B | |
| | October 31, | | October 31, | | October 31, | | October 31, | | October 31, | |
| | 2007 | | 2006 | | 2005 | | 2004 | | 2003 | |
| | | | | | | | | | | |
Net Asset Value | | | | | | | | | | | |
Beginning of year | | $ | 9.95 | | $ | 10.17 | | $ | 10.42 | | $ | 10.08 | | $ | 10.00 | |
| | | | | | | | | | | |
Investment Operations(h) | | | | | | | | | | | |
Net Investment income (loss) | | 0.31 | | 0.42 | | 0.23 | | (0.02 | ) | 0.09 | |
Net realized and unrealized gain (loss) on investments | | 0.20 | | (0.21 | ) | (0.09 | ) | 0.75 | | 0.08 | |
Total from investment operations | | 0.51 | | 0.21 | | 0.14 | | 0.73 | | 0.17 | |
| | | | | | | | | | | |
Distributions | | | | | | | | | | | |
Net investment income | | (0.36 | ) | (0.42 | ) | (0.22 | ) | (0.01 | ) | (0.09 | ) |
Net realized gains on investments | | — | | (0.01 | ) | (0.17 | ) | (0.38 | ) | — | |
Total distributions | | (0.36 | ) | (0.43 | ) | (0.39 | ) | (0.39 | ) | (0.09 | ) |
| | | | | | | | | | | |
Net Asset Value | | | | | | | | | | | |
End of year | | $ | 10.10 | | $ | 9.95 | | $ | 10.17 | | $ | 10.42 | | $ | 10.08 | |
| | | | | | | | | | | |
Total Return(a) | | 5.31 | % | 2.09 | % | 1.39 | % | 7.51 | % | 1.72 | % |
| | | | | | | | | | | |
Net Assets End of Period | | $ | 2,616 | | $ | 5,155 | | $ | 9,896 | | $ | 7,496 | | $ | 3,194 | |
| | | | | | | | | | | |
Ratio and Supplemental Data | | | | | | | | | | | |
| | | | | | | | | | | |
Expenses to average net assets: | | | | | | | | | | | |
After reimbursement/fee waiver(b) | | 0.91 | %(c) | 1.28 | %(c) | 2.00 | %(c) | 1.51 | %(c) | 2.30 | %(c) |
Before reimbursement/fee waiver(b) | | 0.91 | %(d) | 1.28 | %(d) | 2.00 | %(d) | 1.51 | %(d) | 2.68 | %(d) |
Net investment income (loss), to average net assets(b) | | 3.12 | % | 4.21 | % | 2.26 | % | (0.20 | )% | 1.42 | % |
Portfolio turnover rate(e) | | 375 | % | 384 | % | 662 | % | 1438 | % | 480 | % |
| | TA IDEX PIMCO Real Return TIPS | |
| | Class C(f) | |
| | October 31, | | October 31, | | October 31, | | October 31, | | October 31, | |
| | 2007 | | 2006 | | 2005 | | 2004 | | 2003 | |
| | | | | | | | | | | |
Net Asset Value | | | | | | | | | | | |
Beginning of year | | $ | 9.91 | | $ | 10.13 | | $ | 10.39 | | $ | 10.08 | | $ | 10.00 | |
| | | | | | | | | | | |
Investment Operations(h) | | | | | | | | | | | |
Net Investment income (loss) | | 0.32 | | 0.39 | | 0.23 | | (0.06 | ) | 0.09 | |
Net realized and unrealized gain (loss) on investments | | 0.19 | | (0.18 | ) | (0.09 | ) | 0.76 | | 0.08 | |
Total from investment operations | | 0.51 | | 0.21 | | 0.14 | | 0.70 | | 0.17 | |
| | | | | | | | | | | |
Distributions | | | | | | | | | | | |
Net investment income | | (0.36 | ) | (0.42 | ) | (0.23 | ) | (0.01 | ) | (0.09 | ) |
Net realized gains on investments | | — | | (0.01 | ) | (0.17 | ) | (0.38 | ) | — | |
Total distributions | | (0.36 | ) | (0.43 | ) | (0.40 | ) | (0.39 | ) | (0.09 | ) |
| | | | | | | | | | | |
Net Asset Value | | | | | | | | | | | |
End of year | | $ | 10.06 | | $ | 9.91 | | $ | 10.13 | | $ | 10.39 | | $ | 10.08 | |
| | | | | | | | | | | |
Total Return(a) | | 5.38 | % | 2.09 | % | 1.35 | % | 7.20 | % | 1.72 | % |
| | | | | | | | | | | |
Net Assets End of Period | | $ | 2,045 | | $ | 3,082 | | $ | 8,167 | | $ | 6,601 | | $ | 3,148 | |
| | | | | | | | | | | |
Ratio and Supplemental Data | | | | | | | | | | | |
| | | | | | | | | | | |
Expenses to average net assets: | | | | | | | | | | | |
After reimbursement/fee waiver(b) | | 0.86 | %(c) | 1.33 | %(c) | 2.04 | %(c) | 1.87 | %(c) | 2.30 | %(c) |
Before reimbursement/fee waiver(b) | | 0.86 | %(d) | 1.33 | %(d) | 2.04 | %(d) | 1.87 | %(d) | 2.68 | %(d) |
Net investment income (loss), to average net assets(b) | | 3.27 | % | 3.95 | % | 2.22 | % | (0.52 | )% | 1.42 | % |
Portfolio turnover rate(e) | | 375 | % | 384 | % | 662 | % | 1438 | % | 480 | % |
The notes to the financial statements are an integral part of this report.
113
| | TA IDEX PIMCO Real Return TIPS | |
| | Class I | |
| | October 31, | | October 31, | | October 31, | |
| | 2007 | | 2006 | | 2005 | |
| | | | | | | |
Net Asset Value | | | | | | | |
Beginning of year | | $ | 10.05 | | $ | 10.25 | | $ | 10.45 | |
| | | | | | | |
Investment Operations(h) | | | | | | | |
Net Investment income (loss) | | 0.38 | | 0.48 | | 0.37 | |
Net realized and unrealized gain (loss) on investments | | 0.16 | | (0.22 | ) | (0.04 | ) |
Total from investment operations | | 0.54 | | 0.26 | | 0.33 | |
| | | | | | | |
Distributions | | | | | | | |
Net investment income | | (0.38 | ) | (0.45 | ) | (0.36 | ) |
Net realized gains on investments | | — | | (0.01 | ) | (0.17 | ) |
Total distributions | | (0.38 | ) | (0.46 | ) | (0.53 | ) |
| | | | | | | |
Net Asset Value | | | | | | | |
End of year | | $ | 10.21 | | $ | 10.05 | | $ | 10.25 | |
| | | | | | | |
Total Return(a) | | 5.54 | % | 2.55 | % | 3.20 | % |
| | | | | | | |
Net Assets End of Period | | $ | 690,942 | | $ | 603,597 | | $ | 295,966 | |
| | | | | | | |
Ratio and Supplemental Data | | | | | | | |
| | | | | | | |
Expenses to average net assets: | | | | | | | |
After reimbursement/fee waiver(b) | | 0.73 | %(c) | 0.73 | %(c) | 0.73 | %(c) |
Before reimbursement/fee waiver(b) | | 0.73 | %(d) | 0.73 | %(d) | 0.73 | %(d) |
Net investment income (loss), to average net assets(b) | | 3.82 | % | 4.79 | % | 3.60 | % |
Portfolio turnover rate(e) | | 375 | % | 384 | % | 662 | % |
| | TA IDEX PIMCO Total Return | |
| | Class A | |
| | October 31, | | October 31, | | October 31, | | October 31, | | October 31, | |
| | 2007 | | 2006 | | 2005 | | 2004 | | 2003 | |
| | | | | | | | | | | |
Net Asset Value | | | | | | | | | | | |
Beginning of year | | $ | 10.29 | | $ | 10.16 | | $ | 10.48 | | $ | 10.52 | | $ | 10.32 | |
| | | | | | | | | | | |
Investment Operations(h) | | | | | | | | | | | |
Net Investment income (loss) | | 0.42 | | 0.38 | | 0.26 | | 0.12 | | 0.20 | |
Net realized and unrealized gain (loss) on investments | | 0.19 | | 0.09 | | (0.17 | ) | 0.36 | | 0.39 | |
Total from investment operations | | 0.61 | | 0.47 | | 0.09 | | 0.48 | | 0.59 | |
| | | | | | | | | | | |
Distributions | | | | | | | | | | | |
Net investment income | | (0.41 | ) | (0.34 | ) | (0.28 | ) | (0.14 | ) | (0.25 | ) |
Net realized gains on investments | | (0.01 | ) | — | | (0.13 | ) | (0.38 | ) | (0.14 | ) |
Total distributions | | (0.42 | ) | (0.34 | ) | (0.41 | ) | (0.52 | ) | (0.39 | ) |
| | | | | | | | | | | |
Net Asset Value | | | | | | | | | | | |
End of year | | $ | 10.48 | | $ | 10.29 | | $ | 10.16 | | $ | 10.48 | | $ | 10.52 | |
| | | | | | | | | | | |
Total Return(a) | | 6.01 | % | 4.72 | % | 0.86 | % | 4.78 | % | 5.88 | % |
| | | | | | | | | | | |
Net Assets End of Period | | $ | 4,574 | | $ | 5,735 | | $ | 125,910 | | $ | 106,366 | | $ | 56,452 | |
| | | | | | | | | | | |
Ratio and Supplemental Data | | | | | | | | | | | |
| | | | | | | | | | | |
Expenses to average net assets: | | | | | | | | | | | |
After reimbursement/fee waiver(b) | | 1.06 | %(c) | 1.21 | %(c) | 1.20 | %(c) | 1.34 | %(c) | 1.43 | %(c) |
Before reimbursement/fee waiver(b) | | 1.06 | %(d) | 1.21 | %(d) | 1.20 | %(d) | 1.34 | %(d) | 1.43 | %(d) |
Net investment income (loss), to average net assets(b) | | 4.08 | % | 3.71 | % | 2.55 | % | 1.19 | % | 1.91 | % |
Portfolio turnover rate(e) | | 756 | % | 544 | % | 459 | % | 385 | % | 326 | % |
The notes to the financial statements are an integral part of this report.
114
| | TA IDEX PIMCO Total Return | |
| | Class B | |
| | October 31, | | October 31, | | October 31, | | October 31, | | October 31, | |
| | 2007 | | 2006 | | 2005 | | 2004 | | 2003 | |
| | | | | | | | | | | |
Net Asset Value | | | | | | | | | | | |
Beginning of year | | $ | 10.29 | | $ | 10.18 | | $ | 10.48 | | $ | 10.51 | | $ | 10.32 | |
| | | | | | | | | | | |
Investment Operations(h) | | | | | | | | | | | |
Net Investment income (loss) | | 0.43 | | 0.36 | | 0.17 | | 0.07 | | 0.13 | |
Net realized and unrealized gain (loss) on investments | | 0.19 | | 0.08 | | (0.16 | ) | 0.36 | | 0.38 | |
Total from investment operations | | 0.62 | | 0.44 | | 0.01 | | 0.43 | | 0.51 | |
| | | | | | | | | | | |
Distributions | | | | | | | | | | | |
Net investment income | | (0.41 | ) | (0.33 | ) | (0.18 | ) | (0.08 | ) | (0.18 | ) |
Net realized gains on investments | | (0.01 | ) | — | | (0.13 | ) | (0.38 | ) | (0.14 | ) |
Total distributions | | (0.42 | ) | (0.33 | ) | (0.31 | ) | (0.46 | ) | (0.32 | ) |
| | | | | | | | | | | |
Net Asset Value | | | | | | | | | | | |
End of year | | $ | 10.49 | | $ | 10.29 | | $ | 10.18 | | $ | 10.48 | | $ | 10.51 | |
| | | | | | | | | | | |
Total Return(a) | | 6.17 | % | 4.50 | % | 0.07 | % | 4.30 | % | 5.08 | % |
| | | | | | | | | | | |
Net Assets End of Period | | $ | 7,973 | | $ | 13,337 | | $ | 22,116 | | $ | 28,219 | | $ | 34,547 | |
| | | | | | | | | | | |
Ratio and Supplemental Data | | | | | | | | | | | |
| | | | | | | | | | | |
Expenses to average net assets: | | | | | | | | | | | |
After reimbursement/fee waiver(b) | | 0.99 | %(c) | 1.40 | %(c) | 2.06 | %(c) | 1.92 | %(c) | 2.08 | %(c) |
Before reimbursement/fee waiver(b) | | 0.99 | %(d) | 1.40 | %(d) | 2.06 | %(d) | 1.92 | %(d) | 2.08 | %(d) |
Net investment income (loss), to average net assets(b) | | 4.08 | % | 3.45 | % | 1.64 | % | 0.64 | % | 1.26 | % |
Portfolio turnover rate(e) | | 756 | % | 544 | % | 459 | % | 385 | % | 326 | % |
| | TA IDEX PIMCO Total Return | |
| | Class C(f) | |
| | October 31, | | October 31, | | October 31, | | October 31, | | October 31, | |
| | 2007 | | 2006 | | 2005 | | 2004 | | 2003 | |
| | | | | | | | | | | |
Net Asset Value | | | | | | | | | | | |
Beginning of year | | $ | 10.26 | | $ | 10.15 | | $ | 10.47 | | $ | 10.51 | | $ | 10.38 | |
| | | | | | | | | | | |
Investment Operations(h) | | | | | | | | | | | |
Net Investment income (loss) | | 0.43 | | 0.36 | | 0.16 | | 0.04 | | 0.13 | |
Net realized and unrealized gain (loss) on investments | | 0.19 | | 0.08 | | (0.16 | ) | 0.38 | | 0.32 | |
Total from investment operations | | 0.62 | | 0.44 | | — | | 0.42 | | 0.45 | |
| | | | | | | | | | | |
Distributions | | | | | | | | | | | |
Net investment income | | (0.41 | ) | (0.33 | ) | (0.19 | ) | (0.08 | ) | (0.18 | ) |
Net realized gains on investments | | (0.01 | ) | — | | (0.13 | ) | (0.38 | ) | (0.14 | ) |
Total distributions | | (0.42 | ) | (0.33 | ) | (0.32 | ) | (0.46 | ) | (0.32 | ) |
| | | | | | | | | | | |
Net Asset Value | | | | | | | | | | | |
End of year | | $ | 10.46 | | $ | 10.26 | | $ | 10.15 | | $ | 10.47 | | $ | 10.51 | |
| | | | | | | | | | | |
Total Return(a) | | 6.21 | % | 4.48 | % | — | % | 4.10 | % | 4.47 | % |
| | | | | | | | | | | |
Net Assets End of Period | | $ | 3,725 | | $ | 4,762 | | $ | 9,635 | | $ | 12,850 | | $ | 5,231 | |
| | | | | | | | | | | |
Ratio and Supplemental Data | | | | | | | | | | | |
| | | | | | | | | | | |
Expenses to average net assets: | | | | | | | | | | | |
After reimbursement/fee waiver(b) | | 0.97 | %(c) | 1.41 | %(c) | 2.11 | %(c) | 2.09 | %(c) | 2.08 | %(c) |
Before reimbursement/fee waiver(b) | | 0.97 | %(d) | 1.41 | %(d) | 2.11 | %(d) | 2.09 | %(d) | 2.08 | %(d) |
Net investment income (loss), to average net assets(b) | | 4.11 | % | 3.52 | % | 1.58 | % | 0.41 | % | 1.25 | % |
Portfolio turnover rate(e) | | 756 | % | 544 | % | 459 | % | 385 | % | 326 | % |
The notes to the financial statements are an integral part of this report.
115
| | TA IDEX PIMCO Total Return | |
| | Class I | |
| | October 31, | | October 31, | |
| | 2007 | | 2006 | |
| | | | | |
Net Asset Value | | | | | |
Beginning of year | | $ | 10.28 | | $ | 10.12 | |
| | | | | |
Investment Operations(h) | | | | | |
Net Investment income (loss) | | 0.46 | | 0.41 | |
Net realized and unrealized gain (loss) on investments | | 0.18 | | 0.12 | |
Total from investment operations | | 0.64 | | 0.53 | |
| | | | | |
Distributions | | | | | |
Net investment income | | (0.44 | ) | (0.37 | ) |
Net realized gains on investments | | (0.01 | ) | — | |
Total distributions | | (0.45 | ) | (0.37 | ) |
| | | | | |
Net Asset Value | | | | | |
End of year | | $ | 10.47 | | $ | 10.28 | |
| | | | | |
Total Return(a) | | 6.33 | % | 5.33 | % |
| | | | | |
Net Assets End of Period | | $ | 540,310 | | $ | 268,173 | |
| | | | | |
Ratio and Supplemental Data | | | | | |
| | | | | |
Expenses to average net assets: | | | | | |
After reimbursement/fee waiver(b) | | 0.75 | %(c) | 0.80 | %(c) |
Before reimbursement/fee waiver(b) | | 0.75 | %(d) | 0.80 | %(d) |
Net investment income (loss), to average net assets(b) | | 4.39 | % | 4.18 | % |
Portfolio turnover rate(e) | | 756 | % | 544 | % |
| | TA IDEX Protected Principal Stock | |
| | Class A | |
| | October 31, | | October 31, | | October 31, | | October 31, | | October 31, | |
| | 2007 | | 2006 | | 2005 | | 2004 | | 2003 | |
| | | | | | | | | | | |
Net Asset Value | | | | | | | | | | | |
Beginning of year | | $ | 12.17 | | $ | 11.24 | | $ | 10.64 | | $ | 10.15 | | $ | 10.01 | |
| | | | | | | | | | | |
Investment Operations(h) | | | | | | | | | | | |
Net Investment income (loss) | | — | (g) | 0.01 | | 0.01 | | (0.05 | ) | (0.04 | ) |
Net realized and unrealized gain (loss) on investments | | 0.80 | | 0.92 | | 0.59 | | 0.54 | | 0.92 | |
Total from investment operations | | 0.80 | | 0.93 | | 0.60 | | 0.49 | | 0.88 | |
| | | | | | | | | | | |
Distributions | | | | | | | | | | | |
Net investment income | | — | | — | | — | | — | | — | |
Net realized gains on investments | | — | | — | | — | | — | | (0.74 | ) |
Total distributions | | — | | — | | — | | — | | (0.74 | ) |
| | | | | | | | | | | |
Net Asset Value | | | | | | | | | | | |
End of year | | $ | 12.97 | | $ | 12.17 | | $ | 11.24 | | $ | 10.64 | | $ | 10.15 | |
| | | | | | | | | | | |
Total Return(a) | | 6.57 | % | 8.27 | % | 5.64 | % | 4.82 | % | 9.44 | % |
| | | | | | | | | | | |
Net Assets End of Period | | $ | 1,450 | | $ | 5,724 | | $ | 6,906 | | $ | 8,006 | | $ | 9,320 | |
| | | | | | | | | | | |
Ratio and Supplemental Data | | | | | | | | | | | |
| | | | | | | | | | | |
Expenses to average net assets: | | | | | | | | | | | |
After reimbursement/fee waiver(b) | | 2.14 | %(c) | 1.96 | %(c) | 2.12 | %(c) | 2.22 | %(c) | 2.25 | %(c) |
Before reimbursement/fee waiver(b) | | 2.14 | %(d) | 1.96 | %(d) | 2.12 | %(d) | 2.22 | %(d) | 2.25 | %(d) |
Net investment income (loss), to average net assets(b) | | 0.01 | % | 0.07 | % | 0.05 | % | (0.53 | )% | (0.46 | )% |
Portfolio turnover rate(e) | | 5 | % | 4 | % | 3 | % | 1 | % | 3 | % |
The notes to the financial statements are an integral part of this report.
116
| | TA IDEX Protected Principal Stock | |
| | Class B | |
| | October 31, | | October 31, | | October 31, | | October 31, | | October 31, | |
| | 2007 | | 2006 | | 2005 | | 2004 | | 2003 | |
| | | | | | | | | | | |
Net Asset Value | | | | | | | | | | | |
Beginning of year | | $ | 11.97 | | $ | 11.13 | | $ | 10.60 | | $ | 10.15 | | $ | 10.01 | |
| | | | | | | | | | | |
Investment Operations(h) | | | | | | | | | | | |
Net Investment income (loss) | | (0.07 | ) | (0.07 | ) | (0.06 | ) | (0.10 | ) | (0.11 | ) |
Net realized and unrealized gain (loss) on investments | | 0.79 | | 0.91 | | 0.59 | | 0.55 | | 0.99 | |
Total from investment operations | | 0.72 | | 0.84 | | 0.53 | | 0.45 | | 0.88 | |
| | | | | | | | | | | |
Distributions | | | | | | | | | | | |
Net investment income | | — | | — | | — | | — | | — | |
Net realized gains on investments | | — | | — | | — | | — | | (0.74 | ) |
Total distributions | | — | | — | | — | | — | | (0.74 | ) |
| | | | | | | | | | | |
Net Asset Value | | | | | | | | | | | |
End of year | | $ | 12.69 | | $ | 11.97 | | $ | 11.13 | | $ | 10.60 | | $ | 10.15 | |
| | | | | | | | | | | |
Total Return(a) | | 6.02 | % | 7.55 | % | 5.00 | % | 4.43 | % | 9.44 | % |
| | | | | | | | | | | |
Net Assets End of Period | | $ | 6,683 | | $ | 30,268 | | $ | 34,487 | | $ | 40,756 | | $ | 46,709 | |
| | | | | | | | | | | |
Ratio and Supplemental Data | | | | | | | | | | | |
| | | | | | | | | | | |
Expenses to average net assets: | | | | | | | | | | | |
After reimbursement/fee waiver(b) | | 2.74 | %(c) | 2.61 | %(c) | 2.69 | %(c) | 2.69 | %(c) | 2.90 | %(c) |
Before reimbursement/fee waiver(b) | | 2.74 | %(d) | 2.61 | %(d) | 2.69 | %(d) | 2.69 | %(d) | 2.90 | %(d) |
Net investment income (loss), to average net assets(b) | | (0.59 | )% | (0.59 | )% | (0.51 | )% | (0.97 | )% | (1.11 | )% |
Portfolio turnover rate(e) | | 5 | % | 400 | % | 3 | % | 1 | % | 3 | % |
| | TA IDEX Protected Principal Stock | |
| | Class C(f) | |
| | October 31, | | October 31, | | October 31, | | October 31, | | October 31, | |
| | 2007 | | 2006 | | 2005 | | 2004 | | 2003 | |
| | | | | | | | | | | |
Net Asset Value | | | | | | | | | | | |
Beginning of year | | $ | 11.95 | | $ | 11.12 | | $ | 10.58 | | $ | 10.15 | | $ | 10.01 | |
| | | | | | | | | | | |
Investment Operations(h) | | | | | | | | | | | |
Net Investment income (loss) | | (0.08 | ) | (0.07 | ) | (0.05 | ) | (0.12 | ) | (0.11 | ) |
Net realized and unrealized gain (loss) on investments | | 0.78 | | 0.90 | | 0.59 | | 0.55 | | 0.99 | |
Total from investment operations | | 0.71 | | 0.83 | | 0.54 | | 0.43 | | 0.88 | |
| | | | | | | | | | | |
Distributions | | | | | | | | | | | |
Net investment income | | — | | — | | — | | — | | — | |
Net realized gains on investments | | — | | — | | — | | — | | (0.74 | ) |
Total distributions | | — | | — | | — | | — | | (0.74 | ) |
| | | | | | | | | | | |
Net Asset Value | | | | | | | | | | | |
End of year | | $ | 12.66 | | $ | 11.95 | | $ | 11.12 | | $ | 10.58 | | $ | 10.15 | |
| | | | | | | | | | | |
Total Return(a) | | 5.94 | % | 7.46 | % | 5.10 | % | 4.24 | % | 9.44 | % |
| | | | | | | | | | | |
Net Assets End of Period | | $ | 905 | | $ | 3,826 | | $ | 4,924 | | $ | 6,423 | | $ | 7,041 | |
| | | | | | | | | | | |
Ratio and Supplemental Data | | | | | | | | | | | |
| | | | | | | | | | | |
Expenses to average net assets: | | | | | | | | | | | |
After reimbursement/fee waiver(b) | | 2.76 | %(c) | 2.62 | %(c) | 2.69 | %(c) | 2.82 | %(c) | 2.90 | %(c) |
Before reimbursement/fee waiver(b) | | 2.76 | %(d) | 2.62 | %(d) | 2.69 | %(d) | 2.82 | %(d) | 2.90 | %(d) |
Net investment income (loss), to average net assets(b) | | (0.61 | )% | (0.59 | )% | (0.50 | )% | (1.12 | )% | (1.11 | )% |
Portfolio turnover rate(e) | | 5 | % | 4 | % | 3 | % | 1 | % | 3 | % |
The notes to the financial statements are an integral part of this report.
117
| | TA IDEX Protected Principal Stock | |
| | Class M | |
| | October 31, | | October 31, | | October 31, | | October 31, | | October 31, | |
| | 2007 | | 2006 | | 2005 | | 2004 | | 2003 | |
| | | | | | | | | | | |
Net Asset Value | | | | | | | | | | | |
Beginning of year | | $ | 11.99 | | $ | 11.14 | | $ | 10.59 | | $ | 10.14 | | $ | 10.01 | |
| | | | | | | | | | | |
Investment Operations(h) | | | | | | | | | | | |
Net Investment income (loss) | | (0.05 | ) | (0.06 | ) | (0.04 | ) | (0.10 | ) | (0.10 | ) |
Net realized and unrealized gain (loss) on investments | | 0.74 | | 0.91 | | 0.59 | | 0.55 | | 0.97 | |
Total from investment operations | | 0.69 | | 0.85 | | 0.55 | | 0.45 | | 0.87 | |
| | | | | | | | | | | |
Distributions | | | | | | | | | | | |
Net investment income | | — | | — | | — | | — | | — | |
Net realized gains on investments | | — | | — | | — | | — | | (0.74 | ) |
Total distributions | | — | | — | | — | | — | | (0.74 | ) |
| | | | | | | | | | | |
Net Asset Value | | | | | | | | | | | |
End of year | | $ | 12.68 | | $ | 11.99 | | $ | 11.14 | | $ | 10.59 | | $ | 10.14 | |
| | | | | | | | | | | |
Total Return(a) | | 5.75 | % | 7.63 | % | 5.19 | % | 4.44 | % | 9.33 | % |
| | | | | | | | | | | |
Net Assets End of Period | | $ | 113 | | $ | 1,360 | | $ | 1,718 | | $ | 2,316 | | $ | 3,576 | |
| | | | | | | | | | | |
Ratio and Supplemental Data | | | | | | | | | | | |
| | | | | | | | | | | |
Expenses to average net assets: | | | | | | | | | | | |
After reimbursement/fee waiver(b) | | 2.60 | %(c) | 2.52 | %(c) | 2.59 | %(c) | 2.80 | %(c) | 2.80 | %(c) |
Before reimbursement/fee waiver(b) | | 2.60 | %(d) | 2.52 | %(d) | 2.59 | %(d) | 2.80 | %(d) | 2.80 | %(d) |
Net investment income (loss), to average net assets(b) | | (0.43 | )% | (0.50 | )% | (0.39 | )% | (1.01 | )% | (1.01 | )% |
Portfolio turnover rate(e) | | 5 | % | 4 | % | 3 | % | 1 | % | 3 | % |
(a) | | Total return has been calculated for the applicable period without deduction of a sales load, if any, on an initial purchase. Not annualized. |
(b) | | Annualized |
(c) | | Ratio of after Expenses to Average Net Assets is net of fee waivers and reimbursements by the investment adviser, if any (see Note 2). |
(d) | | Ratio of before Expenses to Average Net Assets includes all expenses before fee waivers and reimbursements by the investment adviser. |
(e) | | Not annualized |
(f) | | Class C was offered for investment on November 11, 2002. |
(g) | | Rounds to less than $(.01) per share. |
(h) | | Per share information is calculated based on average number of shares outstanding. |
The notes to the financial statements are an integral part of this report.
118
NOTES TO FINANCIAL STATEMENTS
At October 31, 2007
(all amounts in thousands)
NOTE 1. ORGANIZATION AND SIGNIFICANT ACCOUNTING POLICIES
Transamerica IDEX Mutual Funds (“TA IDEX”) is an open-end management investment company registered under the Investment Company Act of 1940, as amended (the “1940 Act”). TA IDEX American Century Large Company Value, TA IDEX Clarion Global Real Estate Securities, TA IDEX Evergreen Health Care, TA IDEX Jennison Growth, TA IDEX Legg Mason Partners Investors Value, TA IDEX Marsico Growth, TA IDEX MFS International Equity, TA IDEX PIMCO Real Return TIPS, TA IDEX PIMCO Total Return, and TA IDEX Protected Principal Stock, (each a “Fund” and collectively “the Funds”), are part of Transamerica IDEX Mutual Funds.
TA IDEX Clarion Global Real Estate Securities, TA IDEX Evergreen Health Care, and TA IDEX PIMCO Real Return TIPS are “non-diversified” under the 1940 Act. TA IDEX Protected Principal Stock was liquidated effective November 29, 2007.
In the normal course of business, the Funds enter into contracts that contain a variety of representations that provide general indemnifications. The Funds’ maximum exposure under these arrangements is unknown, as this would involve future claims that may be made against the Funds and/or their affiliates that have not yet occurred. However, based on experience, the Funds expect the risk of loss to be remote.
This report should be read in conjunction with the Funds’ current prospectus, which contain more complete information about the Funds.
In preparing the Funds’ financial statements in accordance with accounting principles generally accepted in the United States of America (“GAAP”), estimates or assumptions (which could differ from actual results) may be used that affect reported amounts and disclosures. The following is a summary of significant accounting policies followed by the Funds.
Multiple class operations, income and expenses: The Funds, except TA IDEX MFS International Equity and TA IDEX Protected Principal Stock, currently have four classes of shares, Class A, Class B, Class C and Class I. TA IDEX MFS International Equity currently has three classes of shares, Class A, Class B, and Class C. TA IDEX Protected Principal Stock currently has four classes of shares, Class A, Class B, Class C and Class M. Each of the above classes has a public offering price that reflects different sales charges, if any, and expense levels. Class I is only available for investment to certain affiliated asset allocation funds. Class B shares will convert to Class A shares eight years after purchase. Income, non-class specific expenses and realized and unrealized gains and losses, are allocated daily to each class, based upon the value of shares outstanding method as permitted under Rule 18f-3 of the 1940 Act. Each class bears its own specific expenses as well as a portion of general, common expenses.
Security valuations: The Funds value their investments at the close of the New York Stock Exchange (“NYSE”), normally 4 p.m. ET, each day the NYSE is open for business. The Funds’ investments are valued at the last sale price or closing price on the day of valuation taken from the primary exchange where the security is principally traded.
Securities traded in the over-the-counter market and listed securities for which no sale was reported on that date are valued at the last quoted bid price.
Debt securities are valued based on a price quotation or other equivalent indication of value supplied by an exchange, a pricing service or a major market maker; however, those that mature in sixty days or less are valued at amortized cost, which approximates market.
Investment company securities are valued at the net asset value of the underlying portfolio.
Foreign securities generally are valued based on quotations from the primary market in which they are traded. Because many foreign securities markets and exchanges close prior to the close of the NYSE, closing prices for foreign securities in those markets or on those exchanges do not reflect the events that occur after that close. If a significant market event impacting the value of a portfolio security (e.g., natural disaster, company announcement, market volatility) occurs subsequent to the close of trading in the security, but prior to the calculation of the Funds’ net asset value per share, market quotations for that security may be determined to be unreliable and, accordingly, not “readily available.” As a result, foreign equity securities held by the Funds may be valued at fair market value as determined in good faith by the Funds’ Administrative Valuation Committee, using guidelines adopted by the Board of Trustees.
Other securities for which quotations are not readily available or whose values have been determined to be unreliable are valued at fair market value as determined in good faith by the Funds’ Administrative Valuation Committee, using guidelines adopted by the Board of Trustees.
Cash: Each Fund may leave cash overnight in its cash account with the custodian, State Street Bank & Trust Company (“State Street”). On July 2, 2007, State Street acquired the parent company of Investors Bank & Trust Company. State Street has been contracted on behalf of the Funds to invest the excess cash into savings accounts, which at October 31, 2007 were paying an interest rate of 3.00%.
Throughout the year, the Funds may have cash overdraft balances. A fee is incurred on these overdrafts, calculated by multiplying the overdrafts by a rate based on the federal funds rate.
Commission recapture: The sub-advisers of certain Funds, to the extent consistent with the best execution and usual commission rate policies and practices, have elected to place security transactions of the Funds with broker/dealers with which Transamerica IDEX Mutual Funds has established a Commission Recapture Program. A Commission Recapture Program is any arrangement under which a broker/dealer applies a portion of the commissions received by such broker/dealer on the security transactions to the Funds. In no event will commissions paid by the Funds be used to pay expenses that would otherwise be borne by any other funds within Transamerica IDEX Mutual Funds, or by any other party.
119
Recaptured comissions during the year ended October 31, 2007 are included in net realized gains on the Statements of Operations and are summarized as follows:
Fund | | Commissions | |
TA IDEX American Century Large Company Value | | $ | — | |
TA IDEX Clarion Global Real Estate Securities | | 50 | |
TA IDEX Evergreen Health Care | | 63 | |
TA IDEX Jennison Growth | | 24 | |
TA IDEX Legg Mason Partners Investors Value | | — | |
TA IDEX Marsico Growth | | 23 | |
TA IDEX MFS International Equity | | — | |
TA IDEX PIMCO Real Return TIPS | | — | |
TA IDEX PIMCO Total Return | | — | |
TA IDEX Protected Principal Stock | | — | |
| | | | |
TBA purchase commitments: The Funds may enter into “TBA” (to be announced) purchase commitments to purchase securities for a fixed price at a future date, typically not to exceed 45 days. TBA purchase commitments are considered securities in themselves, and involve a risk of loss if the value of the security to be purchased declines prior to settlement date, in addition to the risk of decline in the value of the Funds’ other assets. Unsettled TBA purchase commitments are valued at the current value of the underlying securities, according to the procedures described under Security Valuations.
Repurchase agreements: The Funds are authorized to enter into repurchase agreements. The Funds, through their custodian, State Street, receive delivery of the underlying securities, the value of which at the time of purchase is required to be an amount equal to at least 100% of the resale price. The Funds will bear the risk of value fluctuations until the security can be sold and may encounter delays and incur costs in liquidating the security. In the event of bankruptcy or insolvency of the seller, delays and costs may be incurred.
Securities lending: The Funds may lend securities to qualified borrowers, with State Street acting as the Funds’ lending agent. The Funds earn negotiated lenders’ fees. The Funds receive cash and/or securities as collateral against the loaned securities. Cash collateral received is invested in short term, interest bearing securities. The Funds monitor the market value of securities loaned on a daily basis and require collateral in an amount at least equal to the value of the securities loaned. The values of loaned securities and related collateral outstanding at October 31, 2007, were as follows:
| | | | Cash | |
| | | | Collateral | |
Fund | | Value | | Received | |
TA IDEX American Century Large Company Value | | $ | 16,592 | | $ | 17,187 | |
TA IDEX Clarion Global Real Estate Securities | | 41,935 | | 43,412 | |
TA IDEX Evergreen Health Care | | 56,194 | | 58,335 | |
TA IDEX Jennison Growth | | 10,055 | | 10,319 | |
TA IDEX Legg Mason Partners Investors Value | | 9,472 | | 9,828 | |
TA IDEX Marsico Growth | | 24,958 | | 25,584 | |
TA IDEX MFS International Equity | | 112 | | 118 | |
TA IDEX PIMCO Total Return | | 19,384 | | 19,795 | |
| | | | | | | |
120
The Funds have invested the cash collateral received from securities loaned in the following short-term, interest-bearing securities:
| | TA IDEX American | | TA IDEX Clarion | | | |
| | Century Large | | Global Real Estate | | TA IDEX Evergreen | |
| | Company Value | | Securities | | Health Care | |
| | | | | | | |
Abbey National PLC, Eurodollar Term, 4.85%, 11/8/2007 | | $ | 315 | | $ | 797 | | $ | 1,071 | |
ABN AMRO Bank NV, Eurodollar Term, 4.95%, 11/21/2007 | | 1,183 | | 2,988 | | 4,014 | |
Bank of Nova Scotia, Eurodollar Term, 5.00%, 11/26/2007 | | 1,183 | | 2,987 | | 4,014 | |
Barclays, Eurodollar Term, 5.00%, 1/22/2008 | | 158 | | 398 | | 535 | |
BNP Paribas, Eurodollar Term, 4.72%, 11/23/2007 | | 1,892 | | 4,780 | | 6,423 | |
Calyon, Eurodollar Term, 4.88%, 11/7/2007 | | 473 | | 1,195 | | 1,606 | |
Canadian Imperial Bank of Commerce, Eurodollar Term, 5.34%, 11/9/2007 | | 237 | | 597 | | 803 | |
Credit Suisse First Boston Corp., Repurchase Agreement, 5.04%, 11/1/2007 | | 394 | | 996 | | 1,338 | |
Dexia Group, Eurodollar Term, 5.10%, 11/14/2007 | | 1,183 | | 2,988 | | 4,014 | |
Fifth Third Bancorp, Eurodollar Overnight, 4.62%, 11/1/2007 | | 237 | | 597 | | 803 | |
Lloyds TSB Bank, Eurodollar Term, 4.90%, 11/9/2007 | | 1,577 | | 3,983 | | 5,353 | |
Merrill Lynch & Co. (RPG), Repurchase Agreement, 4.82%, 11/1/2007 | | 1,340 | | 3,386 | | 4,550 | |
Morgan Stanley & Co. (Gvt Repo), Repurchase Agreement, 4.82%, 11/1/2007 | | 1,341 | | 3,386 | | 4,550 | |
Rabobank Nederland, Eurodollar Term, 4.82%, 11/15/2007 | | 1,183 | | 2,988 | | 4,015 | |
Reserve Primary Money Market Fund, Money Market Fund, 5.09%, 11/1/2007 | | 473 | | 1,195 | | 1,606 | |
Royal Bank of Canada, Eurodollar Term, 4.95%, 11/16/2007 | | 158 | | 398 | | 535 | |
Royal Bank of Scotland, Eurodollar Term, 5.33%, 1/22/2008 | | 1,419 | | 3,585 | | 4,817 | |
Societe Generale, Eurodollar Term, 5.05%, 11/1/2007 | | 867 | | 2,191 | | 2,944 | |
Svenska Handlesbanken, Eurodollar Overnight, 4.84%, 11/1/2007 | | 1,022 | | 2,583 | | 3,470 | |
Toronto Dominion Bank, Eurodollar Term, 4.88%, 11/6/2007 | | 473 | | 1,195 | | 1,606 | |
UBS AG, Eurodollar Term, 5.36%, 11/8/2007 | | 79 | | 199 | | 268 | |
| | | | | | | |
| | $ | 17,187 | | $ | 43,412 | | $ | 58,335 | |
| | | | TA IDEX Legg Mason | | | |
| | TA IDEX Jennison | | Partners Investors | | TA IDEX Marsico | |
| | Growth | | Value | | Growth | |
| | | | | | | |
Abbey National PLC, Eurodollar Term, 4.85%, 11/8/2007 | | $ | 189 | | $ | 180 | | $ | 470 | |
ABN AMRO Bank NV, Eurodollar Term, 4.95%, 11/21/2007 | | 710 | | 676 | | 1,761 | |
Bank of Nova Scotia, Eurodollar Term, 5.00%, 11/26/2007 | | 710 | | 676 | | 1,761 | |
Barclays, Eurodollar Term, 5.00%, 1/22/2008 | | 95 | | 90 | | 235 | |
BNP Paribas, Eurodollar Term, 4.72%, 11/23/2007 | | 1,136 | | 1,082 | | 2,817 | |
Calyon, Eurodollar Term, 4.88%, 11/7/2007 | | 284 | | 271 | | 704 | |
Canadian Imperial Bank of Commerce, Eurodollar Term, 5.34%, 11/9/2007 | | 142 | | 135 | | 352 | |
Credit Suisse First Boston Corp., Repurchase Agreement, 5.04%, 11/1/2007 | | 237 | | 225 | | 587 | |
Dexia Group, Eurodollar Term, 5.10%, 11/14/2007 | | 710 | | 676 | | 1,761 | |
Fifth Third Bancorp, Eurodollar Overnight, 4.62%, 11/1/2007 | | 142 | | 135 | | 352 | |
Lloyds TSB Bank, Eurodollar Term, 4.90%, 11/9/2007 | | 947 | | 902 | | 2,347 | |
Merrill Lynch & Co. (RPG), Repurchase Agreement, 4.82%, 11/1/2007 | | 805 | | 767 | | 1,995 | |
Morgan Stanley & Co. (Gvt Repo), Repurchase Agreement, 4.82%, 11/1/2007 | | 805 | | 767 | | 1,995 | |
Rabobank Nederland, Eurodollar Term, 4.82%, 11/15/2007 | | 710 | | 676 | | 1,761 | |
Reserve Primary Money Market Fund, Money Market Fund, 5.09%, 11/1/2007 | | 284 | | 271 | | 704 | |
Royal Bank of Canada, Eurodollar Term, 4.95%, 11/16/2007 | | 95 | | 90 | | 235 | |
Royal Bank of Scotland, Eurodollar Term, 5.33%, 1/22/2008 | | 852 | | 812 | | 2,113 | |
Societe Generale, Eurodollar Term, 5.05%, 11/1/2007 | | 521 | | 496 | | 1,291 | |
Svenska Handlesbanken, Eurodollar Overnight, 4.84%, 11/1/2007 | | 614 | | 585 | | 1,522 | |
Toronto Dominion Bank, Eurodollar Term, 4.88%, 11/6/2007 | | 284 | | 271 | | 704 | |
UBS AG, Eurodollar Term, 5.36%, 11/8/2007 | | 47 | | 45 | | 117 | |
| | | | | | | |
| | $ | 10,319 | | $ | 9,828 | | $ | 25,584 | |
121
| | TA IDEX MFS | | TA IDEX PIMCO | |
| | International Equity | | Total Return | |
| | | | | |
Abbey National PLC, Eurodollar Term, 4.85%, 11/8/2007 | | $ | 2 | | $ | 363 | |
ABN AMRO Bank NV, Eurodollar Term, 4.95%, 11/21/2007 | | 8 | | 1,362 | |
Bank of Nova Scotia, Eurodollar Term, 5.00%, 11/26/2007 | | 8 | | 1,362 | |
Barclays, Eurodollar Term, 5.00%, 1/22/2008 | | 1 | | 182 | |
BNP Paribas, Eurodollar Term, 4.72%, 11/23/2007 | | 13 | | 2,180 | |
Calyon, Eurodollar Term, 4.88%, 11/7/2007 | | 3 | | 545 | |
Canadian Imperial Bank of Commerce, Eurodollar Term, 5.34%, 11/9/2007 | | 2 | | 272 | |
Credit Suisse First Boston Corp., Repurchase Agreement, 5.04%, 11/1/2007 | | 3 | | 454 | |
Dexia Group, Eurodollar Term, 5.10%, 11/14/2007 | | 8 | | 1,362 | |
Fifth Third Bancorp, Eurodollar Overnight, 4.62%, 11/1/2007 | | 2 | | 272 | |
Lloyds TSB Bank, Eurodollar Term, 4.90%, 11/9/2007 | | 11 | | 1,816 | |
Merrill Lynch & Co. (RPG), Repurchase Agreement, 4.82%, 11/1/2007 | | 9 | | 1,544 | |
Morgan Stanley & Co. (Gvt Repo), Repurchase Agreement, 4.82%, 11/1/2007 | | 9 | | 1,544 | |
Rabobank Nederland, Eurodollar Term, 4.82%, 11/15/2007 | | 8 | | 1,362 | |
Reserve Primary Money Market Fund, Money Market Fund, 5.09%, 11/1/2007 | | 3 | | 545 | |
Royal Bank of Canada, Eurodollar Term, 4.95%, 11/16/2007 | | 1 | | 182 | |
Royal Bank of Scotland, Eurodollar Term, 5.33%, 1/22/2008 | | 10 | | 1,635 | |
Societe Generale, Eurodollar Term, 5.05%, 11/1/2007 | | 6 | | 999 | |
Svenska Handlesbanken, Eurodollar Overnight, 4.84%, 11/1/2007 | | 7 | | 1,178 | |
Toronto Dominion Bank, Eurodollar Term, 4.88%, 11/6/2007 | | 3 | | 545 | |
UBS AG, Eurodollar Term, 5.36%, 11/8/2007 | | 1 | | 91 | |
| | | | | |
| | $ | 118 | | $ | 19,795 | |
122
Income from loaned securities on the Statements of Operations is net of fees, earned by State Street for its services, in the following amounts:
Fund | | Fees | |
TA IDEX American Century Large Company Value | | $ | 31 | |
TA IDEX Clarion Global Real Estate Securities | | 165 | |
TA IDEX Evergreen Health Care | | 81 | |
TA IDEX Jennison Growth | | 56 | |
TA IDEX Legg Mason Partners Investors Value | | 3 | |
TA IDEX Marsico Growth | | 23 | |
TA IDEX MFS International Equity | | 0 | (a) |
TA IDEX PIMCO Real Return TIPS | | — | |
TA IDEX PIMCO Total Return | | 3 | |
TA IDEX Protected Principal Stock | | — | |
| | | | |
Real Estate Investment Trusts (“REITs”): There are certain additional risks involved in investing in REITs. These include, but are not limited to, economic conditions, changes in zoning laws, real estate values, property taxes and interest rates. Since some of the Funds invest primarily in real estate securities, the net asset value per share may fluctuate more widely than the value of shares of a fund that invests in a broad range of industries.
Dividend income is recorded at managements’ estimate of the income included in distributions from the REIT investments. Distributions received in excess of the estimated amount are recorded as a reduction of the cost of investments. The actual amounts of income, return of capital and capital gains are only determined by each REIT after the fiscal year end and may differ from the estimated amounts.
Loan participations/ assignments: The Funds may purchase participations/assignments in commercial loans. Such indebtedness may be secured or unsecured. These investments may include standby financing commitments, including revolving credit facilities that obligate the Funds to supply additional cash to the borrowers on demand. Loan participations/assignments involve risks of insolvency of the lending banks or other financial intermediaries. As such, the Funds assume the credit risks associated with the corporate borrowers and may assume the credit risks associated with the interposed banks or other financial intermediaries. The Funds may be contractually obligated to receive approval from the agent banks and/or borrowers prior to the sale of these investments. Loan participations typically represent direct participation in loans to corporate borrowers, and generally are offered by banks or other financial institutions or lending syndicates. The Funds may participate in such syndications, or can buy a portion of the loans, becoming part lenders. Loans are often administered by agent banks acting as agents for all holders. The agent banks administer the terms of the loans, as specified in the loan agreements. In addition, the agent banks are normally responsible for the collection of principal and interest payments from the corporate borrowers and the apportionment of these payments to the credit of all institutions that are parties to the loan agreements. Unless, under the terms of the loans or other indebtedness, the portfolios have direct recourse against the corporate borrowers, the Funds may have to rely on the agent banks or other financial intermediaries to apply appropriate credit remedies against corporate borrowers.
(a) Rounds to less than $1
Security transactions and investment income: Security transactions are recorded on the trade date. Security gains and losses are calculated on the specific identification basis. Dividend income, if any, is recorded on the ex-dividend date or, in the case of foreign securities, as soon as the Funds are informed of the ex-dividend date. Interest income, including accretion of discounts and amortization of premiums, is recorded on the accrual basis commencing on the settlement date.
Foreign currency denominated investments: The accounting records of the Funds are maintained in U.S. dollars. Securities and other assets and liabilities denominated in foreign currencies are translated into U.S. dollars at the closing exchange rate each day. The cost of foreign securities is translated at the exchange rate in effect when the investment was acquired. The Funds combine fluctuations from currency exchange rates and fluctuations in value when computing net realized and unrealized gains or losses from investments.
Net foreign currency gains and losses resulting from changes in exchange rates include: 1) foreign currency fluctuations between trade date and settlement date of investment security transactions; 2) gains and losses on forward foreign currency contracts; and 3) the difference between the receivable amounts of interest and dividends recorded in the accounting records in U.S. dollars and the amounts actually received.
Foreign currency denominated assets may involve risks not typically associated with domestic transactions. These risks include revaluation of currencies, adverse fluctuations in foreign currency values and possible adverse political, social and economic developments, including those particular to a specific industry, country or region.
Forward foreign currency contracts: The Funds may enter into forward foreign currency contracts to hedge against exchange rate risk arising from investments in securities denominated in foreign currencies. Contracts are valued at the contractual forward rate and are marked to market daily, with the change in value recorded as an unrealized gain or loss. When the contracts are settled a realized gain or loss is incurred. Risks may arise from changes in market value of the underlying currencies and from the possible inability of counterparties to meet the terms of their contracts.
Open forward foreign currency contracts at October 31, 2007 are listed in the Schedules of Investments.
Swap agreements: The Funds may enter into swap agreements to manage their exposure to interest rates and credit risk. Interest rate swap agreements involve commitments to pay/receive interest in exchange for a market-linked return, both based on notional amounts. In a credit default swap, one party makes a stream of payments to another party in exchange for the right to receive a specified return in the event of a default by a third party, typically corporate issues or sovereign issues of an emerging country, on its obligation. The portfolios may use credit default swaps to provide a measure of protection against defaults of sovereign issuers (i.e., to reduce risk where the portfolios owns or has exposure to the sovereign issuer) or to take an active long or short position with respect to the likelihood of a particular issuer’s default.
123
Entering into these agreements involves elements of credit, market and documentation risk in excess of the amounts recognized on the Statements of Assets and Liabilities. Such risks involve the possibility that there will be no liquid market for these agreements, that the counterparty to the agreements may default on its obligation to perform or disagree as to the meaning of contractual terms in the agreements, and that there may be unfavorable changes in interest rates.
Swaps are marked-to-market daily based upon quotations from market makers and vendors and the change in value, if any, is recorded as unrealized gain or loss in the Statements of Operations. Payments received or made at the beginning of the measurement period are reflected as such on the Statements of Assets and Liabilities. A liquidation payment received or made at the termination of the swap is recorded as realized gain or loss in the Statements of Operations. Net periodic payments are included as part of realized gain or loss on the Statements of Operations.
Open swaps agreements at October 31, 2007 are listed in the Schedule of Investments.
Futures contracts: The Funds may enter into futures contracts to manage exposure to market, interest rate or currency fluctuations. Futures contracts are valued at the settlement price established each day by the board of trade or exchange on which they are traded. The primary risks associated with futures contracts are imperfect correlation between the change in market value of the securities held and the prices of futures contracts; the possibility of an illiquid market and inability of the counterparty to meet the contract terms.
The underlying face amounts of open futures contracts at October 31, 2007 are listed in the Schedules of Investments. The variation margin receivable or payable, as applicable, is included in the Statements of Assets and Liabilities. Variation margin represents the additional payment due or excess deposits made in order to maintain the equity account at the required margin level.
Option contracts: The Funds may enter into options contracts to manage exposure to market fluctuations. Options are valued at the average of the bid and ask (“Mean Quote”) established each day at the close of the board of trade or exchange on which they are traded. The primary risks associated with options are imperfect correlation between the change in value of the securities held and the prices of the options contracts; the possibility of an illiquid market; and inability of the counterparty to meet the contracts terms. When the Funds write covered call or put options, an amount equal to the premium received by the Funds are included in the Funds’ Statements of Assets and Liabilities as an asset and as an equivalent liability. Options are marked-to-market daily to reflect the current value of the option written.
Transactions in written options were as follows:
TA IDEX PIMCO Real Return TIPS | | Premium | | Contracts * | |
Balance at October 31, 2006 | | $ | — | | — | |
Sales | | 407 | | 1,055 | |
Closing Buys | | (73 | ) | (188 | ) |
Expirations | | (287 | ) | (747 | ) |
Exercised | | — | | — | |
Balance at October 31, 2007 | | $ | 47 | | 120 | |
TA IDEX PIMCO Total Return | | Premium | | Contracts * | |
Balance at October 31, 2006 | | $ | 31 | | 81 | |
Sales | | 962 | | 2,616 | |
Closing Buys | | (117 | ) | (210 | ) |
Expirations | | (348 | ) | (1,504 | ) |
Exercised | | — | | — | |
Balance at October 31, 2007 | | $ | 528 | | 983 | |
TA IDEX Protected Principal Stock | | Premium | | Contracts * | |
Balance at October 31, 2006 | | $ | 1,250 | | 294 | |
Sales | | 5,848 | | 1,423 | |
Closing Buys | | (6,589 | ) | (1,620 | ) |
Expirations | | (169 | ) | (40 | ) |
Exercised | | — | | — | |
Balance at October 31, 2007 | | $ | 340 | | 57 | |
*Contracts not in thousands.
Swaptions contracts: The Funds are authorized to write swaption contracts to manage exposure to fluctuations in interest rates and to enhance fund yield. Swaption contracts written by the Funds represent an option that gives the purchaser the right, but not the obligation, to enter into a previously agreed upon swap contract on a future date. If a written call option is exercised, the writer will enter a swap and is obligated to pay the fixed rate and receive a variable rate in exchange. Swaptions are marked-to-market daily based upon quotations from market makers.
When the Funds write swaptions, the premiums received are recorded as a liability and are subsequently adjusted to the current value of the swaptions. Changes in the value of the swaptions are reported as unrealized gains or losses in written options in the Statements of Assets and Liabilities. Gain or loss is recognized when the swaption contract expires or is closed. Premiums received from writing swaptions that expire or are exercised are treated by the Funds as realized gains from written options. The difference between the premium and the amount paid on affecting a closing purchase transaction is treated as a realized gain or loss.
124
Transactions in written swaptions were as follows:
| | | | Notional | |
TA IDEX PIMCO Real Return TIPS | | Premium | | Amount | |
Balance at October 31, 2006 | | $ | 288 | | 35,000 | |
Sales | | 1,643 | | 101,200 | |
Closing Buys | | (170,930 | ) | (23,000 | ) |
Expirations | | (182 | ) | (55,000 | ) |
Exercised | | — | | — | |
Balance at October 31, 2007 | | $ | 1,578 | | 58,200 | |
| | | | Notional | |
TA IDEX PIMCO Total Return | | Premium | | Amount | |
Balance at October 31, 2006 | | $ | 871 | | 88,200 | |
Sales | | 2,357 | | 244,900 | |
Closing Buys | | (607 | ) | (58,500 | ) |
Expirations | | (842 | ) | (134,700 | ) |
Exercised | | — | | — | |
Balance at October 31, 2007 | | $ | 1,780 | | 139,900 | |
Redemption fees: A short-term trading redemption fee may be assessed on any Fund’s shares in a fund account that are sold during the first five (5) NYSE trading days following their purchase date. This redemption fee will equal 2% of the amount redeemed and shares held the longest will be treated as being redeemed first and shares held the shortest as being redeemed last. For the year ended October 31, 2007, the Funds received redemption fees which are located in the Funds’ Statements of Changes in Net Assets.
Dividend distributions: Distributions to shareholders are recorded on the ex-dividend date and are determined in accordance with federal income tax regulations.
Foreign capital gains taxes: The Funds may be subject to taxes imposed by countries in which they invest, with respect to their investments in issuers existing or operating in such countries. Such taxes are generally based on income earned or repatriated and capital gains realized on the sale of such investments. The Funds accrue such taxes when the related income or capital gains are earned. Some countries require governmental approval for the repatriation of investment income, capital or the proceeds of sales earned by foreign investors. In addition, if there is deterioration in a country’s balance of payments or for other reasons, a country may impose temporary restrictions on foreign capital remittances abroad.
NOTE 2. RELATED PARTY TRANSACTIONS
Transamerica Fund Advisors, Inc. (“TFAI”) is the Funds’ investment adviser. Transamerica Fund Services, Inc. (“TFS”) is the Funds’ administrator and transfer agent. Prior to May 1, 2007, AFSG Securities Corp., was the Funds’ distributor/principal underwriter. Transamerica Capital, Inc. (“TCI”) is the Funds’ distributor/principal underwriter. TFAI, TFS, and TCI are affiliates of AEGON, NV, a Netherlands corporation.
Certain officers and trustees of the Funds are also officers and/or directors of TFAI, TFS and TCI. The following schedules reflect the percentage of the Funds’ assets owned by affiliated investment companies at October 31, 2007:
TA IDEX American Century Large | | | | | |
Company Value | | Net Assets | | % of Net Assets | |
TA IDEX Asset Allocation-Conservative Portfolio | | $ | 25,059 | | 3.50 | % |
TA IDEX Asset Allocation-Growth Portfolio | | 238,415 | | 33.28 | |
TA IDEX Asset Allocation-Moderate Portfolio | | 126,043 | | 17.59 | |
TA IDEX Asset Allocation-Moderate Growth Portfolio | | 304,080 | | 42.44 | |
Total | | $ | 693,597 | | 96.81 | % |
TA IDEX Clarion Global Real Estate | | | | | |
Securities | | Net Assets | | % of Net Assets | |
TA IDEX Asset Allocation-Conservative Portfolio | | $ | 12,726 | | 3.35 | % |
TA IDEX Asset Allocation-Growth Portfolio | | 109,726 | | 28.85 | |
TA IDEX Asset Allocation-Moderate Portfolio | | 62,621 | | 16.47 | |
TA IDEX Asset Allocation-Moderate Growth Portfolio | | 150,547 | | 39.59 | |
TA IDEX Multi-Manager Alternative Strategies Fund | | 7,681 | | 2.02 | |
TA IDEX Multi-Manager International Fund | | 23,310 | | 6.13 | |
Total | | $ | 366,611 | | 96.41 | % |
TA IDEX Evergreen Health Care | | Net Assets | | % of Net Assets | |
TA IDEX Asset Allocation-Conservative Portfolio | | $ | 11,864 | | 3.20 | % |
TA IDEX Asset Allocation-Growth Portfolio | | 56,101 | | 15.11 | |
TA IDEX Asset Allocation-Moderate Portfolio | | 27,140 | | 7.31 | |
TA IDEX Asset Allocation-Moderate Growth Portfolio | | 40,398 | | 10.88 | |
Asset Allocation-Conservative Portfolio | | 23,121 | | 6.23 | |
Asset Allocation-Growth Portfolio | | 35,227 | | 9.49 | |
Asset Allocation-Moderate Growth Portfolio | | 116,476 | | 31.37 | |
Asset Allocation-Moderate Portfolio | | 53,264 | | 14.34 | |
Total | | $ | 363,591 | | 97.93 | % |
TA IDEX Jennison Growth | | Net Assets | | % of Net Assets | |
TA IDEX Asset Allocation-Conservative Portfolio | | $ | 1,223 | | 0.65 | % |
TA IDEX Asset Allocation-Growth Portfolio | | 126,641 | | 67.16 | |
TA IDEX Asset Allocation-Moderate Portfolio | | 6,599 | | 3.50 | |
TA IDEX Asset Allocation-Moderate Growth Portfolio | | 25,469 | | 13.51 | |
Total | | $ | 159,932 | | 84.82 | % |
TA IDEX Legg Mason Partners Investors | | | | | |
Value | | Net Assets | | % of Net Assets | |
TA IDEX Asset Allocation-Moderate Portfolio | | 143 | | 0.17 | |
TA IDEX Asset Allocation-Moderate Growth Portfolio | | 64,596 | | 75.51 | |
Total | | $ | 64,739 | | 75.68 | % |
| | | | | | |
TA IDEX Marsico Growth | | Net Assets | | % of Net Assets | |
TA IDEX Asset Allocation-Conservative Portfolio | | $ | 16,522 | | 3.89 | % |
TA IDEX Asset Allocation-Growth Portfolio | | 121,604 | | 28.60 | |
TA IDEX Asset Allocation-Moderate Portfolio | | 97,229 | | 22.87 | |
TA IDEX Asset Allocation-Moderate Growth Portfolio | | 159,503 | | 37.51 | |
Total | | $ | 394,858 | | 92.87 | % |
TA IDEX PIMCO Real Return TIPS | | Net Assets | | % of Net Assets | |
TA IDEX Asset Allocation-Conservative Portfolio | | $ | 44,018 | | 6.31 | % |
TA IDEX Asset Allocation-Moderate Portfolio | | 113,747 | | 16.30 | |
TA IDEX Asset Allocation-Moderate Growth Portfolio | | 116,803 | | 16.74 | |
Asset Allocation-Conservative Portfolio | | 61,525 | | 8.82 | |
Asset Allocation-Moderate Growth Portfolio | | 158,922 | | 22.77 | |
Asset Allocation-Moderate Portfolio | | 186,543 | | 26.73 | |
International Moderate Growth Fund | | 7,639 | | 1.09 | |
Total | | $ | 689,197 | | 98.76 | % |
TA IDEX PIMCO Total Return | | Net Assets | | % of Net Assets | |
TA IDEX Asset Allocation-Conservative Portfolio | | $ | 94,282 | | 16.94 | % |
TA IDEX Asset Allocation-Moderate Portfolio | | 210,803 | | 37.87 | |
TA IDEX Asset Allocation-Moderate Growth Portfolio | | 230,477 | | 41.41 | |
Total | | $ | 535,562 | | 96.22 | % |
125
Investment advisory fees: The Funds pay management fees to TFAI based on average daily net assets (“ANA”) at the following breakpoints:
Fund | | Breakpoints |
TA IDEX American Century Large | | 0.85% of the first $250 million of ANA |
Company Value | | 0.80% of the next $250 million of ANA |
From November 1, 2006 to | | 0.775% of the next $250 million of ANA |
December 31, 2006 | | 0.70% of ANA over $750 million |
| | |
TA IDEX American Century Large | | 0.835% of the first $250 million of ANA |
Company Value | | 0.80% of the next $150 million of ANA |
From January 1, 2007 on: | | 0.775% of the next $350 million of ANA |
| | 0.70% of ANA over $750 million |
| | |
TA IDEX Clarion Global Real | | 0.80% of the first $250 million of ANA |
Estate Securities | | 0.775% of the next $250 million of ANA |
| | 0.70% of the next $500 million of ANA |
| | 0.65% of ANA over $1 billion |
| | |
TA IDEX Evergreen Health Care | | 0.87% of the first $100 million of ANA |
| | 0.85% of the next $150 million of ANA |
| | 0.80% of ANA over $250 million |
| | |
TA IDEX Jennison Growth | | 0.80% of the first $250 million of ANA |
| | 0.775% of the next $250 million of ANA |
| | 0.70% of the next $500 million of ANA |
| | 0.675% of the next 500 million of ANA |
| | 0.65% of ANA over $1.5 billion |
| | |
TA IDEX Legg Mason Partners | | 0.80% of the first $500 million of ANA |
Investors Value | | 0.70% of ANA over $500 million |
| | |
TA IDEX Marsico Growth | | 0.80% of the first $500 million of ANA |
| | 0.70% of ANA over $500 million |
| | |
TA IDEX MFS International Equity | | 0.925% of the first $250 million of ANA |
| | 0.90% of the next $250 million of ANA |
| | 0.85% of the next $500 million of ANA |
| | 0.80% of ANA over $1 billion |
| | |
TA IDEX PIMCO Real Return | | 0.70% of the first $250 million of ANA |
TIPS | | 0.65% of the next $500 million of ANA |
| | 0.60% of ANA over $750 million |
| | |
TA IDEX PIMCO Total Return | | 0.70% of the first $250 million of ANA |
| | 0.65% of the next $500 million of ANA |
From November 1, 2006 to | | 0.60% of ANA over $750 million |
December 31, 2006: | | |
| | |
TA IDEX PIMCO Total Return | | 0.675% of the first $250 million of ANA |
| | 0.65% of the next $500 million of ANA |
From January 1, 2007 on: | | 0.60% of ANA over $750 million |
| | |
TA IDEX Protected Principal | | 1.30% of the first $100 million of ANA |
Stock | | 1.25% of ANA over $100 million |
Prior to March 1, 2007, TFAI had contractually agreed to waive its advisory fee and reimburse the Funds to the extent that operating expenses, excluding 12b-1 fees, exceeded the following stated annual limit:
| | Expense | |
Fund | | Limit | |
TA IDEX American Century Large Company Value | | 1.45 | % |
TA IDEX Clarion Global Real Estate Securities | | 1.40 | |
TA IDEX Evergreen Health Care | | 1.47 | |
TA IDEX Jennison Growth | | 1.40 | |
TA IDEX Legg Mason Partners Investors Value | | 1.20 | |
TA IDEX Marsico Growth | | 1.40 | |
TA IDEX MFS International Equity | | 1.32 | |
TA IDEX PIMCO Real Return TIPS | | 1.30 | |
TA IDEX PIMCO Total Return | | 1.30 | |
TA IDEX Protected Principal Stock * | | 1.90 | |
*The annual expense limit for TA IDEX Protected Principal Stock was in effect for the entire fiscal year.
As of March 1, 2007, the expense limits for the funds were removed.
Prior to March 1, 2007, if total Fund expenses fell below the annual expense limitation agreement agreed to by the advisers within the succeeding three years, the Funds may have been required to pay the advisers a portion or all of the reimbursed class expenses.
For the period ended February 28, 2007, TA IDEX Evergreen Health Care recaptured $2 of previously reimbursed expenses from Class C.
As of March 1, 2007, TFAI no longer requires the Funds to pay prior reimbursed class expenses.
Distribution and service fees: The Funds have 12b-1 distribution plans under the 1940 Act pursuant to which an annual fee, based on average daily net assets, is paid to the distributor for various disbursements such as broker-dealer account servicing fees and other promotional expenses of the Funds. The Funds are authorized under the 12b-1 plans to pay fees on each class up to the following limits: 0.35% for Class A, 1.00% for Class B, 1.00% for Class C, 0.90% for Class M and is not applicable for Class I.
From February 28, 2006 through October 31, 2007, the Funds, except for TA IDEX Protected Principal Stock, did not pay 12b-1 fees under these plans.
126
Underwriter commissions relate to front-end sales charges imposed for Class A shares and contingent deferred sales charges from Classes B, C, and certain A share redemptions. For the year ended October 31, 2007, the underwriter commissions were as follows:
TA IDEX American Century Large Company Value
Received by Underwriter | | $ | — | |
Retained by Underwriter | | — | |
Contingent Deferred Sales Charge | | — | |
TA IDEX Clarion Global Real Estate Securities
Received by Underwriter | | $ | — | |
Retained by Underwriter | | — | |
Contingent Deferred Sales Charge | | — | |
TA IDEX Evergreen Health Care
Received by Underwriter | | $ | — | |
Retained by Underwriter | | — | |
Contingent Deferred Sales Charge | | — | |
TA IDEX Jennison Growth
Received by Underwriter | | $ | — | |
Retained by Underwriter | | — | |
Contingent Deferred Sales Charge | | — | |
TA IDEX Legg Mason Partners Investors Value
Received by Underwriter | | $ | — | |
Retained by Underwriter | | — | |
Contingent Deferred Sales Charge | | — | |
TA IDEX Marsico Growth
Received by Underwriter | | $ | — | |
Retained by Underwriter | | — | |
Contingent Deferred Sales Charge | | — | |
TA IDEX MFS International Equity
Received by Underwriter | | $ | — | |
Retained by Underwriter | | — | |
Contingent Deferred Sales Charge | | — | |
TA IDEX PIMCO Real Return TIPS
Received by Underwriter | | $ | — | |
Retained by Underwriter | | — | |
Contingent Deferred Sales Charge | | — | |
TA IDEX PIMCO Total Return
Received by Underwriter | | $ | — | |
Retained by Underwriter | | — | |
Contingent Deferred Sales Charge | | — | |
TA IDEX Protected Principal Stock
Received by Underwriter | | $ | — | |
Retained by Underwriter | | — | |
Contingent Deferred Sales Charge | | 59 | |
Administrative services: The Funds have entered into agreements with TFS for financial and legal fund administration services. The Funds pay TFS an annual fee of 0.02% of ANA. The Legal fees on the Statements of Operations are for fees paid to external legal counsel.
Transfer agent fees: The Funds pay TFS an annual per-account charge for each open and closed account. The Funds paid TFS the following for the year ended October 31, 2007:
Fund | | Fees | |
TA IDEX American Century Large Company Value | | $ | 74 | |
TA IDEX Clarion Global Real Estate Securities | | 36 | |
TA IDEX Evergreen Health Care | | 27 | |
TA IDEX Jennison Growth | | 112 | |
TA IDEX Legg Mason Partners Investors Value | | 77 | |
TA IDEX Marsico Growth | | 78 | |
TA IDEX MFS International Equity | | 126 | |
TA IDEX PIMCO Real Return TIPS | | 16 | |
TA IDEX PIMCO Total Return | | 51 | |
TA IDEX Protected Principal Stock | | 25 | |
| | | | |
Brokerage commissions: There were no brokerage commissions incurred by the Funds on security transactions placed with affiliates of the advisers for the year ended October 31, 2007.
Deferred compensation plan: Each eligible independent Fund Trustee may elect to participate in a non-qualified deferred compensation plan (the “Plan”) maintained by Transamerica IDEX Mutual Funds. Under the Plan, such Trustees may defer payment of all or a portion of their total fees earned as a Fund Trustee. Each Trustee who is a participant in the Plan may elect that the earnings, losses or gains credited to his or her deferred fee amounts be determined based on a deemed investment in any series of Transamerica IDEX Mutual Funds, including the Funds. The right of a participant to receive a distribution from the Plan of the deferred fees is an unsecured claim against the general assets of all series of Transamerica IDEX Mutual Funds. The pro rata liability to the Funds of all deferred fees in the Plan as of October 31, 2007, amounted to the following:
Fund | | Deferred Fees | |
TA IDEX American Century Large Company Value | | $ | 10 | |
TA IDEX Clarion Global Real Estate Securities | | 6 | |
TA IDEX Evergreen Health Care | | 10 | |
TA IDEX Jennison Growth | | 8 | |
TA IDEX Legg Mason Partners Investors Value | | 11 | |
TA IDEX Marsico Growth | | 5 | |
TA IDEX MFS International Equity | | 7 | |
TA IDEX PIMCO Real Return TIPS | | 14 | |
TA IDEX PIMCO Total Return | | 8 | |
TA IDEX Protected Principal Stock | | 4 | |
| | | | |
Retirement plan: Under a retirement plan (the “Emeritus Plan”) available to the Independent Trustees, each Independent Trustee is deemed to have elected to serve as Trustee Emeritus of Transamerica IDEX upon his or her termination of service, other than removal for cause, for a maximum period of five years determined by his or her years of service as a Trustee.
The amounts shall be accrued by Transamerica IDEX Mutual Funds on a pro rata basis allocable to each Transamerica IDEX Mutual Fund based on the relative assets of the fund. If retainers increase in the future, past accruals (and credits) will be adjusted upward so that 50% of the Trustee’s current retainer is accrued and credited at all times. Upon death, disability or termination of service, other than removal for cause, amounts deferred become payable to a Trustee Emeritus (or his/her beneficiary). Upon the commencement of service as Trustee Emeritus, compensation will be paid on a quarterly basis during the time period that the Trustee Emeritus is allowed to serve as such.
For the year ended October 31, 2007, the amounts related to the Emeritus Plan were as follows:
| | Emeritus Fees | |
Fund | | Due | |
TA IDEX American Century Large Company Value | | $ | 16 | |
TA IDEX Clarion Global Real Estate Securities | | 13 | |
TA IDEX Evergreen Health Care | | 25 | |
TA IDEX Jennison Growth | | 7 | |
TA IDEX Legg Mason Partners Investors Value | | 6 | |
TA IDEX Marsico Growth | | 8 | |
TA IDEX MFS International Equity | | 3 | |
TA IDEX PIMCO Real Return TIPS | | 31 | |
TA IDEX PIMCO Total Return | | 12 | |
TA IDEX Protected Principal Stock | | 2 | |
| | | | |
127
As of October 31, 2007, the Funds have not made any payments related to the Emeritus Plan. Amounts deferred and accrued under the Deferred Compensation and Emeritus Plans are unfunded and unsecured claims against the general assets of Transamerica IDEX.
The Emeritus Plan was terminated effective October 30, 2007. Upon the termination, the Fund shall continue to pay any remaining benefits in accordance with the Plan, but no further compensation shall accrue under the Plan.
TA IDEX Protected Principal Stock Guarantee: This Fund’s investment adviser, TFAI, guarantees shareholders a Guaranteed Amount five years after the end of the Offering Period. The Guaranteed Amount will be no less than the value of the shareholders’ accounts on their Investment Date, less extraordinary charges, provided that shareholders have reinvested all dividends and distributions in additional shares and have redeemed no shares (“Guarantee”). This Fund has been liquidated effective November 29, 2007.
NOTE 3. INVESTMENT TRANSACTIONS
The cost of securities purchased and proceeds from securities sold (excluding short-term securities) for the year ended October 31, 2007 were as follows:
| | | | Proceeds from | |
| | Purchases of | | maturities and sales of | |
| | securities: | | securities: | |
| | | | U.S. | | | | U.S. | |
Fund | | Long-term | | Government | | Long-term | | Government | |
TA IDEX American Century Large Company Value | | $ | 393,753 | | $ | — | | $ | 74,350 | | $ | — | |
TA IDEX Clarion Global Real Estate Securities | | 246,507 | | — | | 263,869 | | — | |
TA IDEX Evergreen Health Care | | 263,976 | | — | | 497,037 | | — | |
TA IDEX Jennison Growth | | 117,328 | | — | | 94,533 | | — | |
TA IDEX Legg Mason Partners Investors Value | | 10,535 | | — | | 27,076 | | — | |
TA IDEX Marsico Growth | | 307,831 | | — | | 103,752 | | — | |
TA IDEX MFS International Equity | | 8,204 | | — | | 18,470 | | — | |
TA IDEX PIMCO Real Return TIPS | | 3,356,473 | | 24,570 | | 3,282,483 | | 15,685 | |
TA IDEX PIMCO Total Return | | 4,372,732 | | 364,040 | | 4,010,690 | | 328,420 | |
TA IDEX Protected Principal Stock | | 659 | | — | | 36,139 | | — | |
| | | | | | | | | | | | | |
NOTE 4. FEDERAL INCOME TAX MATTERS
The Funds have not made any provisions for federal income or excise taxes due to their policy to distribute all of their taxable income and capital gains to their shareholders and otherwise qualify as regulated investment companies under Subchapter M of the Internal Revenue Code. Income and capital gain distributions are determined in accordance with income tax regulations, which may differ from GAAP. These differences are primarily due to differing treatment for items including, but not limited to, wash sales, foreign currency transactions, swaps, option contracts, futures contracts and Post October loss deferrals.
Therefore, distributions determined in accordance with tax regulations may differ significantly in amount or character from net investment income and realized gains for financial reporting purposes. Financial reporting records are adjusted for permanent book/tax differences to reflect tax character. Financial records are not adjusted for temporary differences. These reclassifications are as follows:
Fund | | Shares of
beneficial
interest,
unlimited
shares
authorized | | Undistributed
(accumulated) net
investment
income (loss) | | Undistributed
(accumulated)
net realized
gain (loss)
from
investment
securities | |
TA IDEX American Century Large Company Value | | $ | — | | $ | — | | $ | — | |
TA IDEX Clarion Global Real Estate Securities | | 29 | | 7,749 | | (7,778 | ) |
TA IDEX Evergreen Health Care | | — | | (175 | ) | 175 | |
TA IDEX Jennison Growth | | — | | — | | — | |
TA IDEX Legg Mason Partners Investors Value | | — | | — | | — | |
TA IDEX Marsico Growth | | — | | (242 | ) | 242 | |
TA IDEX MFS International Equity | | — | | 173 | | (173 | ) |
TA IDEX PIMCO Real Return TIPS | | — | | 4,101 | | (4,101 | ) |
TA IDEX PIMCO Total Return | | — | | (1,197 | ) | 1,197 | |
TA IDEX Protected Principal Stock | | (159 | ) | 153 | | 6 | |
| | | | | | | | | | |
The capital loss carryforwards are available to offset future realized capital gains through the periods listed:
Fund | | Capital Loss
Carryforwards | | Available Through | |
TA IDEX Jennison Growth | | $ | 33 | | October 31, 2015 | |
TA IDEX Marsico Growth | | 1,067 | | October 31, 2011 | |
TA IDEX MFS International Equity | | 1,812 | * | October 31, 2010 | |
TA IDEX PIMCO Real Return TIPS | | 9,731 | | October 31, 2014 | |
TA IDEX PIMCO Real Return TIPS | | 11,449 | | October 31, 2015 | |
| | | | | | |
* Amount is limited under IRC 382-383.
The capital loss carryforwards utilized during the year ended October 31, 2007 were as follows:
Fund | | Capital Loss Carryforwards
Utilized During the Year Ended
October 31, 2007 | |
TA IDEX Marsico Growth | | 2,631 | |
TA IDEX MFS International Equity | | 1,326 | |
TA IDEX Protected Principal Stock | | 773 | |
The tax character of distributions paid may differ from the character of distributions shown in the Statements of Changes in Net Assets due to short-term gains being treated as ordinary income for tax purposes.
128
The tax character of distributions paid during 2006 and 2007 were as follows:
| | Distributions Paid
From: 2006 | | Distributions Paid
From: 2007 | |
| | | | Long- | | | | Long- | |
| | | | term | | | | term | |
| | Ordinary | | Capital | | Ordinary | | Capital | |
| | Income | | Gain | | Income | | Gain | |
TA IDEX American Century Large Company Value | | $ | 8,983 | | $ | 4,356 | | $ | 5,930 | | $ | 18,409 | |
TA IDEX Clarion Global Real Estate Securities | | 5,900 | | 13,910 | | 25,830 | | 18,581 | |
TA IDEX Evergreen Health Care | | 5,383 | | 17,486 | | 38,900 | | 29,500 | |
TA IDEX Jennison Growth | | 1 | | 2,384 | | — | | 5,579 | |
TA IDEX Legg Mason Partners Investors Value | | 7,358 | | 37,226 | | 3,536 | | 14,602 | |
TA IDEX Marsico Growth | | — | | — | | 144 | | — | |
TA IDEX MFS International Equity | | 514 | | 23,904 | | 6,897 | | 10,657 | |
TA IDEX PIMCO Real Return TIPS | | 25,202 | | 278 | | 25,010 | | — | |
TA IDEX PIMCO Total Return | | 8,303 | | — | | 20,174 | | 166 | |
| | | | | | | | | | | | | |
The tax basis components of distributable earnings as of October 31, 2007 are as follows:
| | | | | | | | | | Net* | |
| | Undistributed | | Undistributed | | | | Other | | Unrealized | |
| | Ordinary | | Long-term | | Capital Loss | | Temporary | | Appreciation | |
Fund | | Income | | Capital Gain | | Carryforward | | Differences | | (Depreciation) | |
TA IDEX American Century Large Company Value | | $ | 9,516 | | $ | 10,971 | | $ | — | | $ | (3 | ) | $ | 66,356 | |
TA IDEX Clarion Global Real Estate Securities | | 22,679 | | 32,341 | | — | | — | | 53,845 | |
TA IDEX Evergreen Health Care | | 8,671 | | 20,551 | | — | | (339 | ) | 61,973 | |
TA IDEX Jennison Growth | | 228 | | — | | (33 | ) | (3 | ) | 40,961 | |
TA IDEX Legg Mason Partners Investors Value | | 669 | | 3,788 | | — | | (2 | ) | 17,716 | |
TA IDEX Marsico Growth | | 398 | | — | | (1,067 | ) | — | | 98,428 | |
TA IDEX MFS International Equity | | 345 | | 1,491 | | (1,812 | ) | (2 | ) | 4,783 | |
TA IDEX PIMCO Real Return TIPS | | 5,298 | | — | | (21,180 | ) | (1 | ) | 10,998 | |
TA IDEX PIMCO Total Return | | 4,737 | | 1,673 | | — | | — | | 5,733 | |
TA IDEX Protected Principal Stock | | — | | 9,465 | | — | | — | | 4,089 | |
| | | | | | | | | | | | | | | | |
* Amounts include unrealized gain/loss from foreign currency and derivative instruments, if applicable.
129
NOTE 5. REGULATORY PROCEEDINGS
There continues to be significant federal and state regulatory activity relating to financial services companies, particularly mutual fund companies and their investment advisers. As part of an ongoing investigation regarding potential market timing, recordkeeping and trading compliance issues and matters affecting the Funds’ investment adviser, TFAI, and certain affiliates and former employees of TFAI, the SEC staff has indicated that it is likely to take some action against TFAI and certain of its affiliates at the conclusion of the investigation. The potential timing and the scope of any such action is difficult to predict. Although the impact of any action brought against TFAI and/or its affiliates is difficult to assess at the present time, the Funds currently believe that the likelihood that any such action will have a material adverse impact is remote. It is important to note that the Funds are not aware of any allegation of wrong doing against them and their Board at the time this annual report is printed. Although it is not anticipated that these developments will have an adverse impact on the Funds, there can be no assurance at this time. TFAI and its affiliates are actively working with the SEC in regard to this matter; however, the exact resolution cannot be determined at this time. TFAI will take such actions that it deems necessary or appropriate to continue providing management services to the Funds and to bring all matters to an appropriate conclusion. TFAI and/or its affiliates, and not the Funds, will bear the costs regarding these regulatory matters.
NOTE 6. RECENTLY ISSUED ACCOUNTING PRONOUNCEMENTS
In July 2006, the Financial Accounting Standards Board (“FASB”) released FASB Interpretation No. 48 “Accounting for Uncertainty in Income Taxes” (“FIN 48”), an interpretation of FASB Statement No. 109. FIN 48 provides guidance for how uncertain tax positions should be recognized, measured, presented and disclosed in the financial statements. FIN 48 requires the accounting and disclosure of tax positions taken or expected to be taken in the course of preparing the Funds’ tax returns to determine whether the tax positions are “more likely- than-not” of being sustained by the applicable tax authority. Tax positions not deemed to meet the more-likely-than-not threshold would be recorded as a tax benefit or expense in the current year.
Adoption of FIN 48 is effective during the first required financial reporting period for fiscal years beginning after December 15, 2006. Management adopted FIN 48 on September 28, 2007.
Implementation of FIN 48 requires Management of the Funds to analyze all open tax years, as defined by the Statute of Limitations, for all major jurisdictions, which includes federal and certain states. Open tax years are those that are open for exam by taxing authorities (i.e., the last 4 tax year ends and the interim tax period since then). The Funds have no examinations in progress and none are expected at this time.
As of September 28, 2007, Management of the Funds have reviewed all open tax years and major jurisdictions and concluded the adoption of FIN48 resulted in no impact the Funds’ net assets or results of operations. There is no tax liability resulting from unrecognized tax benefits relating to uncertain income tax positions taken or expected to be taken in future tax returns. The Funds are also not aware of any tax positions for which it is reasonably possible that the total amounts of unrecognized tax benefits will significantly change in the next 12 months
In September 2006, FASB issued its new Standard No. 157, “Fair Value Measurements” (“FAS 157”). FAS 157 is designed to unify guidance for the measurement of fair value of all types of assets, including financial instruments, and certain liabilities, throughout a number of accounting standards. FAS 157 also establishes a hierarchy for measuring fair value in generally accepted accounting principles and expands financial statement disclosures about fair value measurements that are relevant to mutual funds. FAS 157 is effective for financial statements issued for fiscal years beginning after November 15, 2007, and earlier application is permitted. Management is evaluating the application of FAS 157 to the Funds, and is not in a position at this time to estimate the significance of its impact, if any, on the Funds’ financial statements.
As of October 31, 2007, Management does not expect the adoption of FAS 157 to impact the amounts reported in the financial statements, however, additional disclosures will be required about the inputs used to develop the measurements of fair value and the effect of certain of the measurements reported in the statement of operations for a fiscal period.
NOTE 7. SUBSEQUENT EVENT
Effective January 1, 2008, Transamerica Fund Advisors, Inc. will change its name to Transamerica Asset Management, Inc.
130
Report of Independent Registered Certified Public Accounting Firm
To the Board of Trustees and Shareholders of TA IDEX American Century Large Company Value, TA IDEX Clarion Global Real Estate Securities, TA IDEX Evergreen Health Care, TA IDEX Jennison Growth, TA IDEX Legg Mason Partners Investors Value, TA IDEX Marsico Growth, TA IDEX MFS International Equity, TA IDEX PIMCO Real Return TIPS, TA IDEX PIMCO Total Return and TA IDEX Protected Principal Stock:
In our opinion, the accompanying statements of assets and liabilities, including the schedules of investments, and the related statements of operations and of changes in net assets and the financial highlights present fairly, in all material respects, the financial position of TA IDEX American Century Large Company Value, TA IDEX Clarion Global Real Estate Securities, TA IDEX Evergreen Health Care, TA IDEX Jennison Growth, TA IDEX Legg Mason Partners Investors Value, TA IDEX Marsico Growth, TA IDEX MFS International Equity, TA IDEX PIMCO Real Return TIPS, TA IDEX PIMCO Total Return and TA IDEX Protected Principal Stock (individually a “Fund”, collectively the “Funds”) at October 31, 2007, and the results of each of their operations, the changes in each of their net assets and the financial highlights for each of the periods indicated, in conformity with accounting principles generally accepted in the United States of America. These financial statements and financial highlights (hereafter referred to as “financial statements”) are the responsibility of the Funds’ management; our responsibility is to express an opinion on these financial statements based on our audits. We conducted our audits of these financial statements in accordance with the standards of the Public Company Accounting Oversight Board (United States). Those standards require that we plan and perform the audit to obtain reasonable assurance about whether the financial statements are free of material misstatement. An audit includes examining, on a test basis, evidence supporting the amounts and disclosures in the financial statements, assessing the accounting principles used and significant estimates made by management, and evaluating the overall financial statement presentation. We believe that our audits, which included confirmation of securities at October 31, 2007 by correspondence with the custodian and brokers, provide a reasonable basis for our opinion.
TA IDEX Protected Principal Stock liquidated effective November 29, 2007.

Tampa, Florida
December 28, 2007
131
SUPPLEMENTAL INFORMATION
TAX INFORMATION (unaudited)
For dividends paid during the year ended October 31, 2007, the Funds designated the following as qualified dividend income:
| | Qualified Dividend | |
Fund | | Income | |
TA IDEX American Century Large Company Value | | $ | 5,930 | |
TA IDEX Clarion Global Real Estate Securities | | 8,807 | |
TA IDEX Evergreen Health Care | | 3,953 | |
TA IDEX Jennison Growth | | — | |
TA IDEX Legg Mason Partners Investors Value | | 976 | |
TA IDEX Marsico Growth | | 144 | |
TA IDEX MFS International Equity | | 807 | |
TA IDEX PIMCO Real Return TIPS | | — | |
TA IDEX PIMCO Total Return | | 92 | |
TA IDEX Protected Principal Stock | | — | |
| | | | |
For corporate shareholders, investment income (dividend income plus short-term gains, if any) qualifies for the dividend received deductions as follows:
| | Dividend Received | |
Fund | | Deduction Percentage | |
TA IDEX American Century Large Company Value | | 100.00 | % |
TA IDEX Clarion Global Real Estate Securities | | 17.53 | % |
TA IDEX Evergreen Health Care | | 5.03 | % |
TA IDEX Jennison Growth | | — | |
TA IDEX Legg Mason Partners Investors Value | | 26.99 | % |
TA IDEX Marsico Growth | | 100.00 | % |
TA IDEX MFS International Equity | | — | |
TA IDEX PIMCO Real Return TIPS | | 2.83 | % |
TA IDEX PIMCO Total Return | | 0.46 | % |
TA IDEX Protected Principal Stock | | — | |
For tax purposes, the Long-Term Capital Gain Designations for the year ended October 31, 2007 were as follows:
| | Long-Term Capital | |
Fund | | Designation | |
TA IDEX American Century Large Company Value | | $ | 18,408 | |
TA IDEX Clarion Global Real Estate Securities | | 18,581 | |
TA IDEX Evergreen Health Care | | 29,500 | |
TA IDEX Jennison Growth | | 5,579 | |
TA IDEX Legg Mason Partners Investors Value | | 14,602 | |
TA IDEX Marsico Growth | | — | |
TA IDEX MFS International Equity | | 10,657 | |
TA IDEX PIMCO Real Return TIPS | | — | |
TA IDEX PIMCO Total Return | | 166 | |
TA IDEX Protected Principal Stock | | — | |
| | | | |
The information and distributions reported herein may differ from the information and distributions taxable to the shareholders for the calendar year ending December 31, 2007. Complete information will be computed and reported in conjunction with your 2007 Form 1099-DIV.
132
RESULTS OF SHAREHOLDER PROXY (unaudited)
Section 270.30e-1 under the Investment Company Act of 1940, as amended, titled “Reports to Stockholders of Management Companies,” requires regulated investment companies to report on all subject matters put to the vote of shareholders and provide final results. Accordingly, the Board of Trustees of the Fund solicited a vote by the shareholders for the following items.
At a special meeting of shareholders held on October 30, 2007, the results of the Proposals were as follows:
Proposal 1: To elect a new Board of Directors
| | For | | Withheld | |
John K. Carter | | 1,869,801,381.126 | | 75,092,910.077 | |
Leo J. Hill | | 1,870,292,020.404 | | 74,602,270.799 | |
Joyce Galpern Norden | | 1,870,010,162.690 | | 74,884,128.513 | |
Neal M. Jewell | | 1,869,085,986.703 | | 75,808,304.500 | |
Russell A. Kimball, Jr. | | 1,869,975,193.416 | | 74,919,097.787 | |
Eugene M. Mannella | | 1,869,732,073.896 | | 75,162,217.307 | |
Norm R. Nielsen | | 1,870,076,377.259 | | 74,817,913.944 | |
Patricia L. Sawyer | | 1,870,218,037.071 | | 74,676,254.132 | |
John W. Waechter | | 1,869,642,547.953 | | 75,251,743.250 | |
Proposal 2: To approve an amendment to the Agreement and Declaration of Trust
For | | Withheld | | Abstain | |
1,216,704,908.632 | | 76,054,434.614 | | 186,736,131.95 | |
At a special meeting of shareholders held on November 27, 2007, the results of Proposal 1 for Protected Principal Stock were as follows:
Proposal 1: To approve a Plan of Liquidation and Dissolution with respect to the Fund.
For | | Withheld | | Abstain | |
438,932.116 | | 24,107.601 | | 8,229.411 | |
133
TRANSAMERICA IDEX MUTUAL FUNDS
Management of the Funds
| | | | | | | | Number of | | |
| | | | | | | | Funds | | |
| | | | | | | | in Fund | | |
| | | | Length of | | | | Complex | | |
| | Position(s) | | Time | | Principal Occupation(s) | | Overseen | | Other Board |
Name, Address*** and Age | | Held | | Served* | | During Past Five Years | | by Trustee | | Memberships |
| | | | | | | | | | |
Independent Trustees :** | | | | | | | | | | |
| | | | | | | | | | |
Leo J. Hill
(DOB: 3/27/56) | | Trustee | | Since 2002 | | Principal, Advisor Network Solutions, LLC (business consulting) (2006 to present); Trustee, Diversified Investors Portfolios (“DIP”), The Diversified Investors Funds Group (“DIFG”), The Diversified Investors Funds Group II (“DIFG II”) and Diversified Investors Strategic Variable Funds (“DISVF”) (2007 to present); Trustee, Transamerica IDEX Mutual Funds (“TA IDEX”) (2002 to present); Director, Transamerica Income Shares, Inc. (“TIS”) (2002 to present); Trustee, AEGON/Transamerica Series Trust (“ATST”) (2001 to present); Owner and President, Prestige Automotive Group (2001 to 2005); President, L. J. Hill & Company (1999 to present); Market President, Nations Bank of Sun Coast Florida (1998 to 1999); President and Chief Executive Officer, Barnett Banks of Treasure Coast Florida (1994 to 1998); Executive Vice President and Senior Credit Officer, Barnett Banks of Jacksonville, Florida (1991 to 1994); Senior Vice President and Senior Loan Administration Officer, Wachovia Bank of Georgia (1976 to 1991). | | 160 | | None |
| | | | | | | | | | |
Russell A. Kimball, Jr.
(DOB: 8/17/44) | | Trustee | | Since 2002 | | Trustee, DIP, DIFG, DIFG II and DISVF (2007 to present); Trustee, TA IDEX (2002 to present); Director, TIS (2002 to present); Trustee, ATST (1986 to present); General Manager, Sheraton Sand Key Resort (1975 to present). | | 160 | | None |
| | | | | | | | | | |
Norm R. Nielsen
(DOB: 5/11/39) | | Trustee | | Since 2006 | | Retired (2005 to present); Trustee, DIP, DIFG, DIFG II and DISVF (2007 to present); Trustee, TA IDEX (2006 to present); Director, TIS (2006 to present); Trustee, ATST (2006 to present); Director, Iowa City Area Development (1996 to 2004); Director, Iowa Health Systems (1994 to 2003); Director, U.S. Bank (1987 to 2006); President, Kirkwood Community College (1979 to 2005). | | 160 | | Buena Vista University Board of Trustees (2004 to present) |
134
| | | | | | | | Number of | | |
| | | | | | | | Funds | | |
| | | | | | | | in Fund | | |
| | | | Length of | | | | Complex | | |
| | Position(s) | | Time | | Principal Occupation(s) | | Overseen | | Other Board |
Name, Address*** and Age | | Held | | Served* | | During Past Five Years | | by Trustee | | Memberships |
| | | | | | | | | | |
John W. Waechter
(DOB: 2/25/52) | | Trustee | | Since 2005 | | Trustee, DIP, DIFG, DIFG II and DISVF (2007 to present); Trustee, TA IDEX (2005 to present); Director, TIS (2004 to present); Trustee, ATST (2004 to present); employee, RBC Dain Rauscher (securities dealer) (March 2004 to May 2004); Executive Vice President, Chief Financial Officer and Chief Compliance Officer, William R. Hough & Co. (securities dealer) (1979 to 2004); Treasurer, The Hough Group of Funds (1993 to 2004). | | 160 | | None |
| | | | | | | | | | |
Neal M. Jewell
(DOB: 2/12/35) | | Trustee | | Since 2007 | | Retired (2004 to present); Trustee, TA IDEX and ATST (2007 to present); Director, TIS (2007 to present); Trustee, DIP, DIFG, DIFG II and DISVF (1993 to present); Independent Trustee, EAI Select Managers Equity Fund (mutual fund) (1996 to 2004). | | 160 | | None |
| | | | | | | | | | |
Eugene M. Mannella
(DOB: 2/1/54) | | Trustee | | Since 2007 | | Self-employed consultant (2006 to present); President, Arapain Partners LLC (limited purpose broker-dealer) (1998 to present); Trustee, TA IDEX and ATST (2007 to present); Director, TIS (2007 to present); Trustee, DIP, DIFG, DIFG II and DISVF (1994 to present); President, International Fund Services (alternative asset administration) (1993 to 2005). | | 160 | | None |
| | | | | | | | | | |
Joyce Galpern Norden
(DOB: 6/1/39) | | Trustee | | Since 2007 | | Retired (2004 to present); Trustee, TA IDEX and ATST (2007 to present); Director, TIS (2007 to present); Trustee, DIP (2002 to present); Trustee, DIFG, DIFG II, and DISVF (1993 to present); Vice President, Institutional Advancement, Reconstructionist Rabbinical College (1996 to 2004). | | 160 | | Board of Governors, Reconstructionist Rabbinical College (2007 to present) |
| | | | | | | | | | |
Patricia L. Sawyer
(DOB: 7/1/50) | | Trustee | | Since 2007 | | Trustee, TA IDEX and ATST (2007 to present); Director, TIS (2007 to present); Trustee, DIP, DIFG, DIFG II, and DISVF (1993 to present); President and Executive Search Consultant, Smith & Sawyer LLC (consulting) (1989 to present). | | 160 | | None |
135
| | | | | | | | Number of | | |
| | | | | | | | Funds | | |
| | | | | | | | in Fund | | |
| | | | Length of | | | | Complex | | |
| | Position(s) | | Time | | Principal Occupation(s) | | Overseen | | Other Board |
Name, Address*** and Age | | Held | | Served* | | During Past Five Years | | by Trustee | | Memberships |
| | | | | | | | | | |
Interested Trustee:**** | | | | | | | | | | |
| | | | | | | | | | |
John K. Carter
(DOB: 4/24/61) | | Trustee | | Since 2006 | | President and Chief Executive Officer, DIP, DIFG, DIFG II and DISVF (August 2007 to present); Trustee, DIP, DIFG, DIFG II and DISVF (October 2007 to present); Trustee (September 2006 to present), President and Chief Executive Officer (July 2006 to present), Senior Vice President (1999 to June 2006), Chief Compliance Officer, General Counsel and Secretary (1999 to August 2006), TA IDEX; Trustee (September 2006 to present), President and Chief Executive Officer (July 2006 to present), Senior Vice President (1999 to June 2006), Chief Compliance Officer, General Counsel and Secretary (1999 to August 2006), ATST; Director (September 2006 to present), President and Chief Executive Officer (July 2006 to present), Senior Vice President (2002 to June 2006), General Counsel, Secretary and Chief Compliance Officer (2002 to August 2006), TIS; President and Chief Executive Officer (July 2006 to present), Senior Vice President (1999 to June 2006), Director (2000 to present), General Counsel and Secretary (2000 to August 2006), Chief Compliance Officer (2004 to August 2006), TFAI; President and Chief Executive Officer (July 2006 to present), Senior Vice President (1999 to June 2006), Director (2001 to present), General Counsel and Secretary (2001 to August 2006), TFS; Vice President, AFSG Securities Corporation (2001 to present); Chief Executive Officer (July 2006 to present), Vice President, Secretary and Chief Compliance Officer, the Trust (2003 to August 2006) Transamerica Investors, Inc. (“TII”);Senior Vice President, General Counsel and Secretary, Transamerica Index Funds, Inc. (“TIF”) (2002 to 2004); Vice President, Transamerica Investment Services, Inc. (“TISI”) (2003 to 2005) and Transamerica Investment Management, LLC (“TIM”); (2001 to 2005). | | 160 | | None |
136
Officers
| | | | Length of | | |
| | | | Time | | Principal Occupation(s) |
Name, Address*** and Age | | Position(s) Held | | Served† | | During the Past Five Years |
| | | | | | |
John K. Carter
(DOB: 4/24/61) | | Chief Executive Officer and President | | Since 1999 | | See the table above. |
| | | | | | |
Dennis P. Gallagher
(DOB: 12/19/70) | | Vice President, General Counsel and
Secretary | | Since 2006 | | Vice President, General Counsel and Secretary, TA IDEX, ATST and TIS (September 2006 to present); Vice President, General Counsel and Secretary, DIP, DIFG, DIFG II and DISVF (August 2007 to present); Vice President and Secretary, TII (September 2006 to present); Director, Senior Vice President, General Counsel and Secretary, TFAI and TFS (September 2006 to present); Director, Deutsche Asset Management (1998 to 2006). |
| | | | | | |
Elizabeth L. Belanger
(DOB: 1/7/72) | | Deputy General Counsel, Assistant Secretary and Conflicts of Interest Officer | | Since 2007 | | Deputy General Counsel, Assistant Secretary and Conflicts of Interest Officer, TII (November 2007 to present); Deputy General Counsel, Assistant Secretary and Conflicts of Interest Officer, TA IDEX, ATST and TIS (July 2007 to present); Deputy General Counsel and Conflicts of Interest Officer (August 2007 to present), Assistant Secretary (August 2005 to present), DIP, DIFG, DIFG II and DISVF; Vice President and Senior Counsel, Diversified (since 2005); Director, TFLIC (April 2006 to present); Director of Compliance, Domini Social Investments LLC (November 2003 to May 2005); Associate, Bingham McCutchen LLP (September 1997 to October 2003). |
| | | | | | |
Joseph P. Carusone
(DOB: 9/8/65) | | Vice President, Treasurer and Principal Financial Officer | | Since 2007 | | Vice President, Treasurer and Principal Financial Officer, TII (November 2007 to present); Vice President, Treasurer and Principal Financial Officer, TA IDEX, ATST and TIS (July 2007 to present); Vice President (August 2007 to present), Treasurer and Principal Financial Officer (2001 to present), DIP, DIFG, DIFG II and DISVF; Vice President, Diversified (since 1999); President, Diversified Investors Securities Corp. (“DISC”) (February 2007 to present); Director, TFLIC (2004 to present). |
| | | | | | |
Christopher A. Staples
(DOB: 8/14/70) | | Vice President and Chief Investment Officer | | Since 2004 | | Vice President and Chief Investment Officer, TII (November 2007 to present); Vice President (July 2007 to present), Chief Investment Officer (June 2007 to present), Senior Vice President (June 2007 to July 2007), Senior Vice President - Investment Management (July 2006 to June 2007), Vice President - Investment Management (2004 to July 2006), TA IDEX, ATST and TIS; Vice President and Chief Investment Officer, DIP, DIFG, DIFG II and DISVF (August 2007 to present); Director, TFAI and TFS (2005 to present); Assistant Vice President, Raymond James & Associates (1999 to 2004). |
137
| | | | Length of | | |
| | | | Time | | Principal Occupation(s) |
Name, Address*** and Age | | Position(s) Held | | Served† | | During the Past Five Years |
| | | | | | |
T. Gregory Reymann, II
(DOB: 5/13/58) | | Chief Compliance Officer | | Since 2004 | | Chief Compliance Officer (September 2006 to present) and Vice President (2005 to present), TII; Chief Compliance Officer TA IDEX, ATST, TIS and TFAI (September 2006 to present); Senior Vice President, TFAI (September 2006 to present); Senior Vice President, TA IDEX, ATST and TIS (September 2006 to July 2007); Vice President and Senior Counsel, TFS (2005 to 2006); Vice President and Counsel, TA IDEX, ATST, TFAI and TIS (2004 to 2006), TFS (2004 to 2005) and TIF (2004); Attorney, Gould, Cooksey, et al. (2002 to 2004). |
| | | | | | |
Michael A. Masson
(DOB: 1/21/71) | | Assistant Treasurer | | Since 2007 | | Assistant Treasurer, TII (November 2007 to present); Assistant Treasurer, (July 2007 to present), Assistant Vice President (2005 to present), TA IDEX, ATST and TIS; Assistant Treasurer, DIP, DIFG, DIFG II and DISVF (August 2007 to present); Assistant Vice President, TII (2005 to present); Assistant Vice President, TFS and TFAI (2005 to present); Assistant Vice President, JPMorgan Chase & Co. (1999 to 2005). |
| | | | | | |
Suzanne Valerio-Montemurro
(DOB: 8/13/64) | | Assistant Treasurer | | Since 2007 | | Assistant Treasurer, TII (November 2007 to present); Assistant Treasurer, TA IDEX, ATST and TIS (July 2007 to present); Assistant Treasurer, DIP, DIFG, DIFG II and DISVF (August 2007 to present); Vice President, Diversified (since 1998). |
* | Each Trustee shall hold office until: 1) his or her successor is elected and qualified or 2) he or she resigns or his or her term as a Trustee is terminated in accordance with the Transamerica IDEX by-laws. |
** | Independent trustee (“Independent Trustee”) means a trustee who is not an “interested person” (as defined under the 1940 Act) of the Trust (the “Independent Trustees”). |
*** | The mailing address of each Trustee and Officer is c/o Secretary of the Funds, 570 Carillon Parkway, St. Petersburg, Florida 33716. |
**** | May be deemed an “interested person” (as that term is defined in Section 2(a)(19) of the 1940 Act) of the Trust because of his employment with the Advisor or an affiliate of the Advisor. |
† | If an officer has held offices for different Funds for different periods of time, the earliest applicable date is shown. |
Additional information about the Fund trustees can be found in the Statement of Additional Information, available, without charge, upon request, by calling toll free 1-888-233-4339.
138
PROXY VOTING POLICIES AND PROCEDURES AND QUARTERLY PORTFOLIO HOLDINGS
A description of the Transamerica IDEX Mutual Funds’ proxy voting policies and procedures is available in the Statements of Additional Information of the Funds, available without charge upon request by calling 1-888-233-4339 (toll free) or on the Securities and Exchange Commission website (http://www.sec.gov).
In addition, the Funds are required to file Form N-PX, with their complete proxy voting records for the 12 months ended June 30th, no later than August 31st of each year. The Form is available without charge: (1) from the Funds, upon request by calling
1-888-233-4339; and (2) on the SEC’s website at www.sec.gov.
The Funds file their complete schedule of portfolio holdings with the SEC for the first and third quarter of each fiscal year on Form
N-Q, which is available on the Commission’s website at www.sec.gov. The Funds’ Form N-Q may be reviewed and copied at the Commission’s Public Reference Room in Washington, D.C. Information on the operation of the Public Reference Room may be obtained by calling 1-800-SEC-0330.
Important Notice Regarding Delivery of Shareholder Documents
Every year we send shareholders informative materials such as the Transamerica IDEX Annual Report, the Transamerica IDEX Prospectus, and other required documents that keep you informed regarding your funds. Transamerica IDEX will only send one piece per mailing address, a method that saves your Funds money by reducing mailing and printing costs. We will continue to do this unless you tell us not to. To elect to receive individual mailings, simply call a Transamerica IDEX Customer Service Representative toll free at 1-888-233-4339, 8 a.m. to 7 p.m. Eastern Time, Monday–Friday. Your request will take effect within 30 days.
139
P.O. Box 9012
Clearwater, FL 33758-9012

Customer Service 1-888-233-IDEX (4339)
P.O. Box 9012 · Clearwater, FL 33758-9012
Distributor: Transamerica, Capital, Inc.

Open Funds
Annual Report
October 31, 2007
www.transamericaidex.com
Customer Service 1-888-233-IDEX (4339)
P.O. Box 9012 · Clearwater, FL 33758-9012
Distributor: Transamerica Capital, Inc.
Dear Fellow Shareholder,
On behalf of Transamerica IDEX Mutual Funds, I would like to thank you for your continued support and confidence in our products as we look forward to continuing to serve you and your financial advisor in the future. We value the trust you have placed in us.
This annual report is provided to you with the intent of presenting a comprehensive review of the investments of each of your funds. The Securities and Exchange Commission requires that annual and semi-annual reports be sent to all shareholders, and we believe this report to be an important part of the investment process. In addition to providing a comprehensive review, this report also provides a discussion of accounting policies as well as matters presented to shareholders that may have required their vote.
We believe it is important to recognize and understand current market conditions in order to provide a context for reading this report. The positive returns experienced in the equity markets for the trailing 12 months ending October 31, 2007, mask the volatility experienced along the way, with significant pullbacks occurring in February-March and July-August. The Federal Reserve board (“Federal Reserve”) was on hold for most of the past twelve months but more recently in September and October lowered its target for the federal funds rate by 0.50% and 0.25% respectively. The rate reductions by the Federal Reserve signaled an effort to inject liquidity and stability to the markets which have been adversely affected by concerns over subprime debt. While Gross Domestic Product growth remains positive, investor concerns over the extent to which subprime debt may affect consumer spending and persistently high oil prices have been a check on market returns. For the twelve months ending October 31, 2007, the Dow Jones Industrial Average returned 17.94%, the Standard & Poor’s 500 Composite Stock Index returned 14.56%, and the Lehman Brothers Aggregate Bond Index returned 5.38%. Please keep in mind it is important to maintain a diversified portfolio as investment returns have historically been difficult to predict.
In addition to your active involvement in the investment process, we firmly believe that a financial advisor is a key resource to help you build a complete picture of your current and future financial needs. Financial advisors are familiar with the market’s history, including long-term returns and volatility of various asset classes.
With your financial advisor, you can develop an investment program that incorporates factors such as your goals, your investment timeline, and your risk tolerance.
Please contact your financial advisor if you have any questions about the contents of this report, and thanks again for the confidence you have placed in us.
Sincerely,
John Carter | | Christopher Staples |
President & Chief Executive Officer | | Vice President & Chief Investment Officer |
Transamerica IDEX Mutual Funds | | Transamerica IDEX Mutual Funds |
The views expressed in this report reflect those of the portfolio managers only and may not necessarily represent the views of Transamerica IDEX Mutual Funds. These views are subject to change based upon market conditions. These views should not be relied upon as investment advice and are not indicative of trading intent on behalf of the Transamerica IDEX Mutual Funds.
TA IDEX Legg Mason Partners All Cap
MARKET ENVIRONMENT
The overall U.S. stock market performed favorably during fiscal 2007, but there were a number of factors that adversely affected the market, especially in the last few months of the portfolio’s fiscal year. For much of the year, private equity played an important role because ample funds, low interest rates and willing lenders of debt money made this an important factor in individual company and market valuations. Ten-year Treasury yields fluctuated between 4.35% and 5.35%, with most of the past twelve months being well below 5%.
Oil played an important role during the fiscal year, starting at about $60/Bbl before falling to about $50/Bbl in early 2007 and then rising sharply to the current level above $80/Bbl. Energy stocks did very well in this environment, especially in the last nine months.
The fiscal year began with the valuation spreads between lower and higher-rated assets being historically low. This began to change in July 2007, as the deterioration in the housing market and problems associated with sub-prime mortgages initiated a change in risk premiums and negatively impacted domestic and international equity markets. In September 2007, the Federal Reserve Board lowered the federal funds rate by 0.50% to 4.75%.
During the summer of 2007, larger companies began outperforming smaller companies for the first time in seven years. For the fiscal year ended October 31, 2007, large cap stocks outperformed their small cap counterparts.
PERFORMANCE
For the year ended October 31, 2007, TA IDEX Legg Mason Partners All Cap, Class A returned 9.27%. By comparison its benchmark, the Russell 3000 Index, returned 14.53%. For the year ended October 31, 2007, the Fund’s net expense ratios for Class A, Class B, and Class C were 1.55%, 2.19%, and 2.13%, respectively.
STRATEGY REVIEW
For the year, the industrial, energy and information technology sectors were the top contributors to the portfolio’s performance. The financial and health care sectors contributed the least to relative performance.
The top stock contributors to portfolio performance during the year were Vodafone Group Plc (“Vodafone”), Honeywell International Inc., Cisco Systems, Inc., Raytheon Company and Deere & Company. The largest detractors from performance were The PMI Group, Inc., MGIC Investment Corporation, Merrill Lynch & Co., Inc., Motorola, Inc., and The Home Depot, Inc.
The top ten holdings for the portfolio as of October 31, 2007 were: News Corporation – Class B, Raytheon Company, Vodafone, JPMorgan Chase & Co., Microsoft Corporation, State Street Corporation, Bank of America Corporation, Honeywell International Inc., Abbott Laboratories and General Electric Company.
The largest five sectors for the portfolio as of October 31, 2007 were: information technology (20.19%), financials (18.10%), health care (12.89%), industrials (12.20%), and consumer discretionary (11.94%).
It is our belief that larger companies will form the nucleus of the market leadership in the next few years. Not since 1983 have large cap stocks in general been available at a price-to-earnings ratio (“P/E”) discount to small cap stocks. In addition, large cap companies often have a significant share of their sales coming from foreign sources. With the dollar just breaking below its 1992 low, we believe, the exchange rate should benefit those companies with large and growing foreign sources of income.
John J. Goode
Peter J. Hable
Co-Portfolio Managers
ClearBridge Advisors, LLC
3
(unaudited)
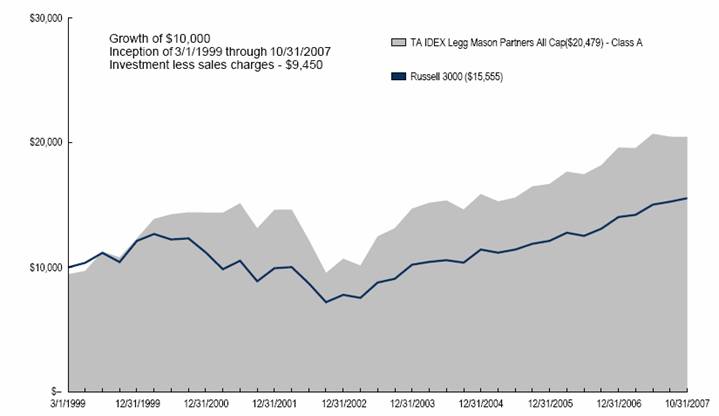
Average Annual Total Return for Periods Ended 10/31/2007
| | | | | | From | | Inception | |
| | 1 Year | | 5 Years | | Inception | | Date | |
Class A (NAV) | | 9.27 | % | 14.71 | % | 9.33 | % | 3/1/99 | |
Class A (POP) | | 3.25 | % | 13.43 | % | 8.62 | % | 3/1/99 | |
Russell 3000(1) | | 14.53 | % | 14.83 | % | 5.22 | % | 3/1/99 | |
| | | | | | | | | |
Class B (NAV) | | 8.57 | % | 13.96 | % | 8.66 | % | 3/1/99 | |
Class B (POP) | | 3.93 | % | 13.85 | % | 8.66 | % | 3/1/99 | |
| | | | | | | | | |
Class C (NAV) | | 8.70 | % | — | % | 13.68 | % | 11/11/02 | |
Class C (POP) | | 7.77 | % | — | % | 13.68 | % | 11/11/02 | |
NOTES
(1) The Russell 3000 (Russell 3000) Index is an unmanaged index used as a general measure of market performance. Calculations assume dividends and capital gains are reinvested and do not include any managerial expenses. From inception calculation is based on life of Class A shares.
The performance data presented represents past performance, future results may vary. Performance data does not reflect the deduction of taxes that would be paid on fund distributions nor the redemption of fund shares. Investment return and principal value will fluctuate so that an investor’s shares, when redeemed, may be worth more or less than their original cost. Current performance may be lower or higher than performance quoted. Please see www.transamericaidex.com for performance data current to the most recent month-end.
Public Offering Price (POP) returns include the reinvestment of dividends and capital gains and reflect the maximum sales charge of 5.5% for A shares or the maximum applicable contingent deferred sales charge (5% in the 1st year, decreasing to 0% after 6 years) for Class B shares and 1% (during the first 12 months) for Class C shares. Shares purchased prior to March 1, 2004 are subject to a maximum applicable contingent deferred sales charge (5% in the 1st year, decreasing to 0% after 7 years) for Class B shares and (2% in the 1st year, decreasing to 0% after 2 years) for Class C shares. Net Asset Value (NAV) returns include the reinvestment of dividends and capital gains but do not reflect any sales charges.
The Fund is non-diversified. Investments in a “non-diversified” fund may be subject to specific risks such as susceptibility to single economic, political, or regulatory events, and may be subject to greater loss than investments in a diversified fund. This material must be preceded or accompanied by a current prospectus, which includes specific contents regarding the investment objectives and policies of this Fund.
4
UNDERSTANDING YOUR FUND’S EXPENSES
(unaudited)
SHAREHOLDER EXPENSES
Fund shareholders may incur two types of costs: (1) transaction costs, including sales charges (loads) on purchases, contingent deferred sales charges on redemptions and redemption fees; and (2) ongoing costs, including management fees, 12b-1 distribution and service fees, and other fund expenses.
The following Example is intended to help you understand your ongoing costs (in dollars and cents) of investing in the Fund and to compare these costs with the ongoing costs of investing in other funds.
The Example is based on an investment of $1,000 invested at May 1, 2007 and held for the entire period until October 31, 2007.
ACTUAL EXPENSES
The first line in the table below provides information about actual account values and actual expenses. You may use the information in this line, together with the amount you invested, to estimate the expenses that you paid over the period. Simply divide your account value by $1,000 (for example, an $8,600 account value divided by $1,000 = 8.6), then multiply the result by the number in the first line of your Fund under the heading entitled “Expenses Paid During Period” to estimate the expenses you paid on your account during this period. If your account is an IRA, your expenses could have included a $15 annual fee. The amount of any fee paid through your account would increase the estimate of expenses you paid during the period and decrease your ending account value.
HYPOTHETICAL EXAMPLE FOR COMPARISON PURPOSES
The second line in the table below provides information about hypothetical account values and hypothetical expenses based on the Fund’s actual expense ratio and an assumed rate of return of 5% per year before expenses, which is not the Fund’s actual return. The hypothetical account values and expenses may not be used to estimate the actual ending account balance or expenses you paid for the period. You may use this information to compare the ongoing costs of investing in your Fund and other funds. To do so, compare this 5% hypothetical example with the 5% hypothetical examples that appear in the shareholder reports of the other funds. As in the case of the actual expense example, if your account is subject to an IRA fee, the amount of the fee paid through your account would increase the hypothetical expenses you would have paid during the period and decrease the hypothetical ending account value.
Please note that the expenses shown in the table are meant to highlight your ongoing costs only and do not reflect any transactional costs, such as sales charges, redemption fees, brokerage commissions paid on purchases and sales of fund shares. Therefore, the second line under the Fund in the table is useful in comparing ongoing costs only, and will not help you determine the relative total costs of owning different funds. If any of these transaction costs were included, your costs would be higher. The expenses shown in the table do not reflect any fees that may be charged to you by brokers, financial intermediaries or other financial institutions.
| | Beginning | | Ending | | Annualized | | Expenses | |
| | Account | | Account | | Expense | | Paid During | |
| | Value | | Value | | Ratio | | Period (a) | |
Class A | | | | | | | | | |
Actual | | $ | 1,000.00 | | $ | 998.84 | | 1.54 | % | $ | 7.74 | |
Hypothetical (b) | | 1,000.00 | | 1,017.39 | | 1.54 | | 7.81 | |
| | | | | | | | | |
Class B | | | | | | | | | |
Actual | | 1,000.00 | | 995.02 | | 2.17 | | 10.88 | |
Hypothetical (b) | | 1,000.00 | | 1,014.23 | | 2.17 | | 10.99 | |
| | | | | | | | | |
Class C | | | | | | | | | |
Actual | | 1,000.00 | | 996.28 | | 2.10 | | 10.54 | |
Hypothetical (b) | | 1,000.00 | | 1,014.58 | | 2.10 | | 10.63 | |
| | | | | | | | | | | | |
(a) | Expenses are calculated using the Fund’s annualized expense ratio (as disclosed in the table), multiplied by the average account value for the period, multiplied by the number of days in the period (184 days), and divided by the number of days in the year (365 days). |
| |
(b) | 5% return per year before expenses. |
GRAPHICAL PRESENTATION OF SCHEDULE OF INVESTMENTS
By Sector
At October 31, 2007

This chart shows the percentage breakdown by sector of the Fund’s total investment securities.
5
SCHEDULE OF INVESTMENTS
At October 31, 2007
(all amounts except share amounts in thousands)
| | Shares | | Value | |
COMMON STOCKS (100.0%) | | | | | |
Aerospace & Defense (7.1%) | | | | | |
Boeing Co. | | 29,600 | | $ | 2,918 | |
Honeywell International, Inc. | | 72,700 | | 4,392 | |
Raytheon Co. | | 78,600 | | 5,000 | |
Building Products (0.3%) | | | | | |
Simpson Manufacturing Co., Inc. ^ | | 18,500 | | 555 | |
Capital Markets (4.9%) | | | | | |
Franklin Resources, Inc. | | 5,800 | | 752 | |
Merrill Lynch & Co., Inc. | | 49,000 | | 3,235 | |
State Street Corp. | | 57,500 | | 4,587 | |
Chemicals (2.8%) | | | | | |
Dow Chemical Co. (The) | | 44,800 | | 2,018 | |
Ei DU Pont de Nemours & Co. | | 56,500 | | 2,797 | |
Communications Equipment (3.9%) | | | | | |
Cisco Systems, Inc. ‡ | | 97,300 | | 3,217 | |
Motorola, Inc. | | 189,100 | | 3,553 | |
Socket Communications, Inc. ‡ | | 7,400 | | 6 | |
Computers & Peripherals (1.7%) | | | | | |
International Business Machines Corp. | | 25,900 | | 3,007 | |
Consumer Finance (1.5%) | | | | | |
American Express Co. | | 44,200 | | 2,694 | |
Diversified Financial Services (5.3%) | | | | | |
Bank of America Corp. | | 93,733 | | 4,526 | |
JPMorgan Chase & Co. | | 99,200 | | 4,662 | |
Electronic Equipment & Instruments (1.1%) | | | | | |
Agilent Technologies, Inc. ‡ | | 51,500 | | 1,898 | |
Energy Equipment & Services (4.4%) | | | | | |
Baker Hughes, Inc. | | 15,600 | | 1,353 | |
BJ Services Co. | | 38,800 | | 977 | |
GlobalSantaFe Corp. | | 20,300 | | 1,645 | |
Halliburton Co. | | 38,800 | | 1,530 | |
Nabors Industries, Ltd. ‡ | | 15,400 | | 432 | |
Schlumberger, Ltd. | | 17,300 | | 1,671 | |
Food & Staples Retailing (1.9%) | | | | | |
Wal-Mart Stores, Inc. | | 72,900 | | 3,296 | |
Food Products (3.4%) | | | | | |
Kraft Foods, Inc. Class A | | 53,496 | | 1,787 | |
Unilever PLC | | 41,575 | | 1,404 | |
Unilever PLC | | 83,019 | | 2,811 | |
Household Products (1.5%) | | | | | |
Kimberly-Clark Corp. | | 36,200 | | 2,566 | |
Industrial Conglomerates (2.4%) | | | | | |
General Electric Co. | | 100,600 | | 4,141 | |
Insurance (4.6%) | | | | | |
Allied World Assurance Holdings | | 22,210 | | 1,064 | |
American International Group, Inc. | | 32,400 | | 2,045 | |
Chubb Corp. | | 58,360 | | 3,114 | |
Hartford Financial Services Group, Inc. | | 19,200 | | 1,863 | |
Internet Software & Services (1.6%) | | | | | |
Bridgeline Software, Inc. ‡ | | 10,100 | | 37 | |
eBay, Inc. ‡ | | 35,900 | | 1,296 | |
VeriSign, Inc. ‡^ | | 44,500 | | 1,517 | |
Life Sciences Tools & Services (1.2%) | | | | | |
ENZO Biochem, Inc. ‡^ | | 171,317 | | $ | 2,075 | |
Machinery (2.5%) | | | | | |
Caterpillar, Inc. | | 34,600 | | 2,582 | |
Dover Corp. | | 36,700 | | 1,688 | |
Media (8.9%) | | | | | |
Interpublic Group of Cos., Inc. ‡^ | | 268,600 | | 2,780 | |
News Corp. Class B ^ | | 243,900 | | 5,592 | |
Time Warner, Inc. | | 165,600 | | 3,024 | |
Walt Disney Co. (The) | | 119,200 | | 4,128 | |
Metals & Mining (1.5%) | | | | | |
Alcoa, Inc. | | 66,800 | | 2,645 | |
Oil, Gas & Consumable Fuels (4.8%) | | | | | |
Anadarko Petroleum Corp. | | 40,100 | | 2,367 | |
Chevron Corp. | | 14,600 | | 1,336 | |
ConocoPhillips | | 11,400 | | 968 | |
Exxon Mobil Corp. | | 18,000 | | 1,656 | |
Williams Cos., Inc. | | 55,500 | | 2,025 | |
Paper & Forest Products (1.4%) | | | | | |
Weyerhaeuser Co. | | 31,600 | | 2,399 | |
Pharmaceuticals (11.7%) | | | | | |
Abbott Laboratories | | 78,600 | | 4,293 | |
Bentley Pharmaceuticals, Inc. ‡ | | 1,489 | | 21 | |
Eli Lilly & Co. | | 29,800 | | 1,614 | |
GlaxoSmithKline PLC | | 49,900 | | 2,557 | |
Johnson & Johnson | | 50,700 | | 3,304 | |
Novartis AG | | 34,000 | | 1,808 | |
Pfizer, Inc. | | 131,400 | | 3,234 | |
Wyeth | | 73,500 | | 3,574 | |
Real Estate Investment Trusts (1.0%) | | | | | |
Annaly Capital Management, Inc. (1) | | 98,100 | | 1,676 | |
Semiconductors & Semiconductor Equipment (9.1%) | | | | | |
Applied Materials, Inc. | | 193,400 | | 3,756 | |
Novellus Systems, Inc. ‡ | | 65,000 | | 1,847 | |
Samsung Electronics Co., Ltd. - 144A | | 13,300 | | 4,056 | |
Taiwan Semiconductor Manufacturing | | 227,838 | | 2,426 | |
Texas Instruments, Inc. | | 104,600 | | 3,410 | |
Verigy, Ltd. ‡ | | 15,211 | | 350 | |
Software (2.8%) | | | | | |
Microsoft Corp. | | 125,500 | | 4,620 | |
Sybase, Inc. ‡ | | 1,300 | | 37 | |
Wave Systems Corp. Class A ‡^ | | 107,379 | | 182 | |
Specialty Retail (3.1%) | | | | | |
Gap, Inc. (The) | | 112,300 | | 2,122 | |
Home Depot, Inc. ^ | | 74,200 | | 2,338 | |
Williams-Sonoma, Inc. ^ | | 26,930 | | 847 | |
Thrifts & Mortgage Finance (0.8%) | | | | | |
PMI Group, Inc. (The) | | 84,800 | | 1,359 | |
Wireless Telecommunication Services (2.8%) | | | | | |
Vodafone Group PLC | | 123,237 | | 4,839 | |
Total Common Stocks (cost $135,899) | | | | 173,901 | |
| | | | | |
Total Security Lending Collateral (cost $12,983) ± | | | | 12,983 | |
Total Investment Securities (cost $148,882) # | | | | $ | 186,884 | |
| | | | | | | |
The notes to the financial statements are an integral part of this report.
6
NOTES TO SCHEDULE OF INVESTMENTS |
^ | | At October 31, 2007, all or a portion of this security is on loan (see Note 1). The value at October 31, 2007, of all securities on loan is $12,153. |
± | | Cash collateral for the Repurchase Agreements, valued at $2,369, that serve as collateral for securities lending, are invested in corporate and government bonds with interest rates and maturity dates ranging from 0.00% - 8.125% and 11/14/2007 - 9/15/2037. |
‡ | | Non Income Producing |
(1) | | Real Estate Investment Trust |
# | | Aggregate cost for federal income tax purposes is $149,529. Aggregate gross unrealized appreciation for all securities in which there is an excess of value over tax cost and aggregate gross unrealized depreciation for all securities in which there is an excess of tax cost over value were $40,935 and $3,581respectively. Net unrealized appreciation for tax purposes is $37,354. |
| | |
DEFINITIONS: |
144A | | 144A Securities are registered pursuant to Rule 144A of the Securities Act of 1933. These securities are deemed to be liquid for purposes of compliance limitations on holdings of illiquid securities and may be resold as transactions exempt from registration, normally to qualified institutional buyers. At October 31, 2007, these securities aggregated $4,056 or 2.33% of net assets of the Fund |
The notes to the financial statements are an integral part of this report.
7
TA IDEX Templeton Transamerica Global
MARKET ENVIRONMENT
Templeton Investment Counsel, LLC
In spite of elevated energy prices and a deteriorating U.S. housing sector that negatively affected U.S. economic growth, the global economy remained resilient throughout the twelve-month reporting period. Consumer and corporate demand strength, particularly in developing economies, reasonably low inflation, generally favorable labor markets, and moderate, though higher, global interest rates have supported the economic recovery, which began in 2002.
These factors also contributed to the strength of global equity markets during the twelve months under review. In addition, narrow corporate credit spreads and strong cash flows from the corporate sector in the world’s capital markets contributed to very strong global merger and acquisition activity during most of the reporting period. In particular, the private equity industry, which has grown substantially in recent years, played a pivotal role in a number of large and high-profile acquisitions.
However, concerns about slower growth and declining asset quality surfaced during the first quarter of 2007. These were initially centered on the U.S. sub-prime mortgage market but spread in August 2007 to global capital markets. In particular, the difficulties of assessing risk and the value of collateral in the structured finance industry contributed to a decline in risk appetite among both lenders and investors. The private equity industry, which is reliant on the availability of cheap credit, was particularly affected, and deal activity slowed toward the end of the period.
Accommodative actions by several central banks, including a larger-than-expected target interest rate cut of half a percent by the Federal Reserve Board (“Fed”) in September, helped restore investor confidence after a sharp, but short-lived sell-off in the summer. Most global equity markets ended the twelve-month period with double-digit total returns. Many stock market indexes in the U.S. and most European countries reached six-year highs, and many emerging market indexes in Asia, Europe and Latin America neared or reached all-time highs during the period. As the U.S. dollar declined versus the currencies of many major trading partners, equity returns of foreign-currency denominated stocks for U.S.-based investors generally became stronger when translated into the weaker greenback.
Transamerica Investment Management, LLC
U.S. equities overcame big challenges in the twelve months ended October 31, 2007, to generate positive returns. The Russell 1000 Growth Index rose 19.23%.
Throughout the period, the market struggled against the implications of weakness in the U.S. housing market. Because losses in home equity influence the major engine of economic growth, consumer spending, the downturn raised concerns that the economy and corporate profits would deteriorate as well. Added to this were fears that escalating energy prices, rising defaults for low-quality (sub-prime) mortgages and a liquidity crisis in the debt markets would push interest rates higher, further undermining the prospects for the housing sector.
These problems notwithstanding, economic growth and corporate earnings remained healthy, buoyed by a robust global economy and strong demand for U.S. exports. Other positives included growth in U.S. manufacturing, higher personal incomes, brisk spending on commercial construction and late-period interest-rate cuts by the Fed. In the end, these factors outweighed the housing and debt-market issues, and the market finished the period with solid, if widely dispersed, gains. Sectors most responsive to the global economy advanced most (up to 50%), while those most sensitive to U.S. consumer spending and interest rates were weakest (advancing less than 10%).
PERFORMANCE
For the year ended October 31, 2007, TA IDEX Templeton Transamerica Global, Class A returned 23.74%. By comparison its benchmark, the Morgan Stanley Capital International World Index (“MSCI World”), returned 20.97%. For the year ended October 31, 2007, the Fund’s net expense ratios for Class A, Class B, Class C, and Class I were 1.55%, 2.20%, 2.20%, and 0.96%, respectively.
STRATEGY REVIEW
Templeton Investment Counsel, LLC
From a sector perspective, our over weighted allocation and stock selection in the telecommunication services sector was the largest positive contributor to performance relative to the benchmark MSCI World for the reporting period. Most notably, our over weighted positions in Norwegian telecommunications carrier Telenor ASA and Spain’s leading fixed-line operator Telefonica, S.A. were key contributors. Our investment in non-index component Turkcell Iletisim Hizmetleri A.S., Turkey’s dominant mobile phone service provider, also performed well.
Our over weighted exposure and stock selection in the industrials sector also boosted relative results as our over weighted investment in Danish electrical products company Vestas Wind Systems A/S helped relative performance. Driven by stock selection, the consumer staples sector also positively affected relative performance for the period. Within the sector, United Kingdom (“UK”) based pharmacy chain Alliance Boots plc was a significant contributor to relative portfolio performance.
The U.S. dollar depreciated versus most foreign currencies for the period, which also contributed to the portfolio’s performance because investments in securities with non-U.S. currency exposure gained value as the dollar weakened.
Although our materials sector holdings contributed to the portfolio’s absolute performance, our underweighted allocation and stock selection negatively impacted the portfolio’s relative performance. In particular, Finland-based pulp and paper producer UPM-Kymmene Corporation declined in value.
Additionally, the portfolio’s relative performance for the period was negatively affected by its position in non-index company Samsung Electronics Co., Ltd., a South Korean semiconductor manufacturer.
From a geographic perspective, the portfolio’s Asian, European and Latin American equities benefited the portfolio’s performance in absolute and relative terms. By country, our underweighted position and stock selection in Japan contributed the most to relative performance. The portfolio’s North American holdings hindered relative performance, driven mainly by an underweighted allocation and stock selection in Canada.
8
Transamerica Investment Management, LLC:
We invest in large companies that we believe have capable management teams, stable balance sheets and highly competitive positions and stand to benefit from long-term secular trends. Chief among those trends is robust global economic growth, which has boosted worldwide business spending on infrastructure and manufacturing capacity as well as consumer spending on leisure activities and personal technology. Not surprisingly, given our emphasis on these areas, the largest contributors to total return were Apple Inc. (“Apple”), Research in Motion Limited (“RIMM”) and Jacobs Engineering Group Inc. (“Jacobs”).
Apple was already the dominant competitor in the personal music player (i.e., iPod) business when the period began, with a reputation for creating user-friendly devices. Expanding on that reputation, it launched the iPhone (an all-in-one camera phone, iPod and wireless e-mail tool) in late June. Likewise, RIMM, maker of the BlackBerry personal communication devices, successfully expanded its well-established business product line and introduced products for consumers. Jacobs designs and constructs major infrastructure projects and manufacturing facilities worldwide. Its cost-effective business model helped the company win major new contracts during the period.
These gains were partially countered by setbacks for McGraw-Hill Companies Inc. (“McGraw-Hill”), which is the parent company of debt-rating agency Standard & Poor’s Corporation (“Standard & Poor’s”); and for several consumer companies (e.g., Whole Foods Market, Inc. (“Whole Foods”), Starbucks Corporation (“Starbucks”) and Nordstrom, Inc. (“Nordstrom”)). Earnings at these companies remained healthy. Nevertheless, their stock prices fell as investors worried that the credit-and-housing crisis would negatively affect bond market activity (a factor for Standard & Poor’s) and consumer spending (a potential issue for the others). We believe McGraw-Hill will recover as the credit crisis is resolved and also believe that high-end consumers will continue to support Nordstrom. We exited Starbucks and Whole Foods, which are involved in costly, margin-squeezing expansions.
Tina Sadler, CFA
Gary U. Rolle, CFA
Co-Portfolio Managers
Transamerica Investment Management, LLC
Antonio T. Docal, CFA
Gary Motyl, CFA
Co-Portfolio Managers
Templeton Investment Counsel, LLC
9
(unaudited)
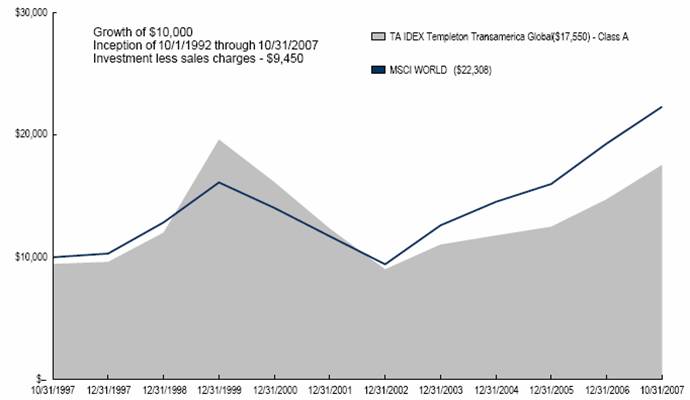
Average Annual Total Return for Periods Ended 10/31/2007
| | | | | | | | From | | Inception | |
| | 1 Year | | 5 Years | | 10 Years | | Inception | | Date | |
Class A (NAV) | | 23.74 | % | 13.93 | % | 6.39 | % | 11.61 | % | 10/1/92 | |
Class A (POP) | | 16.95 | % | 12.65 | % | 5.79 | % | 11.19 | % | 10/1/92 | |
MSCI WORLD(1) | | 20.97 | % | 18.88 | % | 8.35 | % | 10.52 | % | 10/1/92 | |
| | | | | | | | | | | |
Class B (NAV) | | 22.94 | % | 13.17 | % | 5.86 | % | 8.69 | % | 10/1/95 | |
Class B (POP) | | 17.94 | % | 13.05 | % | 5.86 | % | 8.69 | % | 10/1/95 | |
| | | | | | | | | | | |
Class C (NAV) | | 22.95 | % | — | % | — | % | 13.41 | % | 11/11/02 | |
Class C (POP) | | 21.95 | % | — | % | — | % | 13.41 | % | 11/11/02 | |
| | | | | | | | | | | |
Class I (NAV) | | 24.41 | % | — | % | — | % | 21.41 | % | 11/15/05 | |
NOTES
(1) The Morgan Stanley Capital International World (MSCIW) Index is an unmanaged index used as a general measure of market performance. Calculations assume dividends and capital gains are reinvested and do not include any managerial expenses. From inception calculation is based on life of Class A shares.
The performance data presented represents past performance, future results may vary. Performance data does not reflect the deduction of taxes that would be paid on fund distributions nor the redemption of fund shares. Investment return and principal value will fluctuate so that an investor’s shares, when redeemed, may be worth more or less than their original cost. Current performance may be lower or higher than performance quoted. Please see www.transamericaidex.com for performance data current to the most recent month-end.
Public Offering Price (POP) returns include the reinvestment of dividends and capital gains and reflect the maximum sales charge of 5.5% for A shares or the maximum applicable contingent deferred sales charge (5% in the 1st year, decreasing to 0% after 6 years) for Class B shares and 1% (during the first 12 months) for Class C shares. Shares purchased prior to March 1, 2004 are subject to a maximum applicable contingent deferred sales charge (5% in the 1st year, decreasing to 0% after 7 years) for Class B shares and (2% in the 1st year, decreasing to 0% after 2 years) for Class C shares. Net Asset Value (NAV) returns include the reinvestment of dividends and capital gains but do not reflect any sales charges.
International investing involves special risks including currency fluctuations, political instability, and different financial accounting standards. This material must be preceded or accompanied by a current prospectus, which includes specific contents regarding the investment objectives and policies of this Fund. Effective October 27, 2006, the portfolio changed its name from TA IDEX Templeton Great Companies Global to TA IDEX Templeton Transamerica Global and the domestic portion changed its sub-adviser on August 1, 2006 from Great Companies, L.L.C. to Transamerica Investment Management, LLC.
10
SCHEDULE OF INVESTMENTS
At October 31, 2007
(all amounts except share amounts in thousands)
UNDERSTANDING YOUR FUND’S EXPENSES
(unaudited)
SHAREHOLDER EXPENSES
Fund shareholders may incur two types of costs: (1) transaction costs, including sales charges (loads) on purchases, contingent deferred sales charges on redemptions and redemption fees; and (2) ongoing costs, including management fees, 12b-1 distribution and service fees, and other fund expenses.
The following Example is intended to help you understand your ongoing costs (in dollars and cents) of investing in the Fund and to compare these costs with the ongoing costs of investing in other funds.
The Example is based on an investment of $1,000 invested at May 1, 2007 and held for the entire period until October 31, 2007.
ACTUAL EXPENSES
The first line in the table below provides information about actual account values and actual expenses. You may use the information in this line, together with the amount you invested, to estimate the expenses that you paid over the period. Simply divide your account value by $1,000 (for example, an $8,600 account value divided by $1,000 = 8.6), then multiply the result by the number in the first line of your Fund under the heading entitled “Expenses Paid During Period” to estimate the expenses you paid on your account during this period. If your account is an IRA, your expenses could have included a $15 annual fee. The amount of any fee paid through your account would increase the estimate of expenses you paid during the period and decrease your ending account value.
HYPOTHETICAL EXAMPLE FOR COMPARISON PURPOSES
The second line in the table below provides information about hypothetical account values and hypothetical expenses based on the Fund’s actual expense ratio and an assumed rate of return of 5% per year before expenses, which is not the Fund’s actual return. The hypothetical account values and expenses may not be used to estimate the actual ending account balance or expenses you paid for the period. You may use this information to compare the ongoing costs of investing in your Fund and other funds. To do so, compare this 5% hypothetical example with the 5% hypothetical examples that appear in the shareholder reports of the other funds. As in the case of the actual expense example, if your account is subject to an IRA fee, the amount of the fee paid through your account would increase the hypothetical expenses you would have paid during the period and decrease the hypothetical ending account value.
Please note that the expenses shown in the table are meant to highlight your ongoing costs only and do not reflect any transactional costs, such as sales charges, redemption fees, brokerage commissions paid on purchases and sales of fund shares. Therefore, the second line under the Fund in the table is useful in comparing ongoing costs only, and will not help you determine the relative total costs of owning different funds. If any of these transaction costs were included, your costs would be higher. The expenses shown in the table do not reflect any fees that may be charged to you by brokers, financial intermediaries or other financial institutions.
| | Beginning | | Ending | | Annualized | | Expenses | |
| | Account | | Account | | Expense | | Paid During | |
| | Value | | Value | | Ratio | | Period (a) | |
Class A | | | | | | | | | |
Actual | | $ | 1,000.00 | | $ | 1,119.69 | | 1.55 | % | $ | 8.28 | |
Hypothetical (b) | | 1,000.00 | | 1,017.32 | | 1.55 | | 7.88 | |
| | | | | | | | | |
Class B | | | | | | | | | |
Actual | | 1,000.00 | | 1,115.85 | | 2.20 | | 11.73 | |
Hypothetical (b) | | 1,000.00 | | 1,014.05 | | 2.20 | | 11.17 | |
| | | | | | | | | |
Class C | | | | | | | | | |
Actual | | 1,000.00 | | 1,116.02 | | 2.20 | | 11.73 | |
Hypothetical (b) | | 1,000.00 | | 1,014.05 | | 2.20 | | 11.17 | |
| | | | | | | | | |
Class I | | | | | | | | | |
Actual | | 1,000.00 | | 1,122.77 | | 0.96 | | 5.12 | |
Hypothetical (b) | | 1,000.00 | | 1,020.31 | | 0.96 | | 4.88 | |
| | | | | | | | | | | | |
(a) | Expenses are calculated using the Fund’s annualized expense ratio (as disclosed in the table), multiplied by the average account value for the period, multiplied by the number of days in the period (184 days), and divided by the number of days in the year (365 days). |
| |
(b) | 5% return per year before expenses. |
GRAPHICAL PRESENTATION OF SCHEDULE OF INVESTMENTS
By Region
At October 31, 2007

This chart shows the percentage breakdown by region of the Fund’s total investment securities.
The notes to the financial statements are an integral part of this report.
11
| | Shares | | Value | |
COMMON STOCKS (99.0%) | | | | | |
Australia (0.6%) | | | | | |
National Australia Bank, Ltd. | | 40,441 | | $ | 1,615 | |
Austria (0.6%) | | | | | |
Telekom Austria AG | | 49,860 | | 1,428 | |
Brazil (1.1%) | | | | | |
Cia Vale do Rio Doce | | 34,820 | | 1,312 | |
Empresa Brasileira de Aeronautica SA | | 30,210 | | 1,473 | |
Canada (3.6%) | | | | | |
Jean Coutu Group PJC, Inc. (The) Class A | | 81,500 | | 1,198 | |
Research In Motion, Ltd. ‡ | | 42,500 | | 5,292 | |
Suncor Energy, Inc. | | 27,000 | | 2,949 | |
Cayman Islands (0.7%) | | | | | |
ACE, Ltd. | | 27,630 | | 1,675 | |
Denmark (0.7%) | | | | | |
Vestas Wind Systems A/S ‡ | | 19,740 | | 1,759 | |
Finland (1.0%) | | | | | |
Stora ENSO OYJ Class R ^ | | 75,940 | | 1,391 | |
UPM-Kymmene OYJ | | 47,570 | | 1,063 | |
France (6.3%) | | | | | |
Accor SA | | 8,440 | | 804 | |
AXA SA | | 43,800 | | 1,956 | |
France Telecom SA | | 79,180 | | 2,917 | |
Michelin (C.G.D.E.) Class B | | 12,107 | | 1,619 | |
Sanofi-Aventis | | 24,089 | | 2,110 | |
Suez SA ^ | | 23,850 | | 1,532 | |
Thomson | | 26,060 | | 457 | |
Thomson ‡ | | 49,160 | | 856 | |
Total SA | | 33,902 | | 2,729 | |
Vivendi | | 31,490 | | 1,416 | |
Germany (6.3%) | | | | | |
Bayerische Motoren Werke AG | | 29,050 | | 1,943 | |
Celesio AG | | 23,460 | | 1,329 | |
Daimler AG ^ | | 34,700 | | 3,822 | |
Deutsche Post AG | | 74,170 | | 2,244 | |
E.ON AG | | 29,740 | | 1,936 | |
Infineon Technologies AG ‡ | | 108,460 | | 1,590 | |
Muenchener Rueckversicherungs AG | | 5,790 | | 1,109 | |
Siemens AG | | 17,210 | | 2,333 | |
Hong Kong (0.9%) | | | | | |
Cheung Kong Holdings, Ltd. ‡ | | 74,000 | | 1,439 | |
Hutchison Whampoa International, Ltd. ‡ | | 75,000 | | 935 | |
Israel (0.5%) | | | | | |
Check Point Software Technologies ‡ | | 54,980 | | 1,389 | |
Italy (2.0%) | | | | | |
ENI SpA | | 23,565 | | 1,722 | |
Mediaset SpA | | 162,435 | | 1,679 | |
Unicredito Italiano SpA | | 206,413 | | 1,759 | |
Japan (4.5%) | | | | | |
Aiful Corp. ^ | | 38,750 | | 909 | |
Fujifilm Holdings Corp. | | 20,300 | | 968 | |
Hitachi, Ltd. | | 78,000 | | 528 | |
Konica Minolta Holdings, Inc. | | 87,500 | | 1,518 | |
Mabuchi Motor Co., Ltd. | | 15,200 | | $ | 1,023 | |
Mitsubishi UFJ Financial Group, Inc. | | 52,320 | | 521 | |
Nintendo Co., Ltd. | | 3,100 | | 1,933 | |
Olympus Corp. | | 23,800 | | 981 | |
Promise Co., Ltd. | | 31,500 | | 943 | |
Sony Corp. | | 12,610 | | 624 | |
Takeda Pharmaceutical Co., Ltd. | | 13,100 | | 814 | |
Uss Co., Ltd. | | 14,220 | | 928 | |
Korea, Republic of (1.6%) | | | | | |
Kookmin Bank | | 9,750 | | 797 | |
Korea Electric Power Corp. | | 25,580 | | 569 | |
KT Corp. | | 38,705 | | 910 | |
Samsung Electronics Co., Ltd. - 144A | | 6,130 | | 1,870 | |
Mexico (0.3%) | | | | | |
Telefonos de Mexico SAB de CV Class L ^ | | 18,300 | | 669 | |
Netherlands (2.5%) | | | | | |
ING Groep NV | | 11,170 | | 503 | |
ING Groep NV | | 38,940 | | 1,749 | |
Koninklijke Philips Electronics NV | | 39,730 | | 1,641 | |
Reed Elsevier NV | | 92,650 | | 1,789 | |
Vedior NV | | 37,910 | | 859 | |
Netherlands Antilles (1.1%) | | | | | |
Schlumberger, Ltd. | | 30,000 | | 2,897 | |
Norway (1.1%) | | | | | |
Telenor ASA ‡ | | 119,890 | | 2,802 | |
Portugal (0.4%) | | | | | |
Portugal Telecom SGPS SA | | 67,800 | | 907 | |
PT Multimedia Servicos de | | 9,550 | | 130 | |
Telecomunicacoes E Multimedia | | | | | |
Singapore (1.5%) | | | | | |
DBS Group Holdings, Ltd. | | 5,010 | | 307 | |
DBS Group Holdings, Ltd. | | 105,600 | | 1,633 | |
Flextronics International, Ltd. ‡ | | 58,610 | | 721 | |
Singapore Telecommunications, Ltd. | | 454,000 | | 1,279 | |
South Africa (0.6%) | | | | | |
Sasol, Ltd. | | 32,880 | | 1,672 | |
Spain (2.0%) | | | | | |
Banco Santander Central Hispano SA | | 66,304 | | 1,439 | |
Iberdrola SA ‡ | | 44,464 | | 715 | |
Telefonica SA | | 92,885 | | 3,062 | |
Sweden (1.1%) | | | | | |
Nordea Bank AB | | 79,740 | | 1,421 | |
Securitas AB Class B | | 41,770 | | 527 | |
Svenska Cellulosa AB Class B | | 56,610 | | 997 | |
Switzerland (2.9%) | | | | | |
Lonza Group AG | | 18,670 | | 2,173 | |
Nestle SA | | 14,810 | | 1,690 | |
Novartis AG | | 23,020 | | 1,224 | |
Swiss Reinsurance | | 10,660 | | 1,000 | |
UBS AG | | 24,170 | | 1,293 | |
Taiwan (0.5%) | | | | | |
Chunghwa Telecom Co., Ltd. | | 48,497 | | 931 | |
Lite-On Technology Corp. New | | 14,421 | | 265 | |
The notes to the financial statements are an integral part of this report.
12
| | Shares | | Value | |
Turkey (0.6%) | | | | | |
Turkcell Iletisim Hizmet As | | 68,680 | | $ | 1,651 | |
United Kingdom (11.9%) | | | | | |
Aviva PLC | | 110,580 | | 1,735 | |
BAE Systems PLC | | 257,280 | | 2,662 | |
BP PLC ^ | | 34,100 | | 2,659 | |
British Sky Broadcasting Group PLC | | 94,910 | | 1,342 | |
Cadbury Schweppes PLC | | 71,280 | | 942 | |
Compass Group PLC | | 333,240 | | 2,395 | |
GlaxoSmithKline PLC | | 70,599 | | 1,816 | |
Group 4 Securicor PLC | | 413,550 | | 1,819 | |
HSBC Holdings PLC ^ | | 7,650 | | 761 | |
HSBC Holdings PLC ‡ | | 46,099 | | 911 | |
Kingfisher PLC | | 62,900 | | 482 | |
Kingfisher PLC | | 146,210 | | 599 | |
Pearson PLC | | 70,490 | | 1,168 | |
Rentokil Initial PLC | | 314,430 | | 1,123 | |
Rolls-Royce Group PLC ‡ | | 141,270 | | 1,579 | |
Royal Bank of Scotland Group PLC | | 177,930 | | 1,909 | |
Royal Dutch Shell PLC Class B | | 58,490 | | 2,546 | |
Unilever PLC | | 41,067 | | 1,386 | |
Vodafone Group PLC | | 734,822 | | 2,885 | |
United States (42.1%) | | | | | |
Allergan, Inc. | | 56,000 | | 3,784 | |
American Express Co. | | 61,800 | | 3,767 | |
American International Group, Inc. | | 55,000 | | 3,472 | |
Ameriprise Financial, Inc. | | 56,000 | | 3,527 | |
Apple, Inc. ‡ | | 52,000 | | 9,877 | |
AT&T, Inc. | | 62,000 | | 2,591 | |
Boeing Co. | | 24,900 | | 2,455 | |
Caterpillar, Inc. | | 39,000 | | 2,910 | |
CME Group, Inc. Class A ^ | | 9,000 | | 5,996 | |
Electronic Arts, Inc. ‡ | | 60,000 | | 3,667 | |
Expeditors International Washington Inc. ^ | | 80,000 | | 4,052 | |
General Electric Co. | | 91,400 | | 3,762 | |
Gilead Sciences, Inc. ‡ | | 64,000 | | 2,956 | |
Google, Inc. Class A ‡ | | 7,500 | | 5,303 | |
Jacobs Engineering Group, Inc. ‡ | | 60,000 | | 5,229 | |
Johnson Controls, Inc. | | 92,700 | | 4,053 | |
Las Vegas Sands Corp. ‡ | | 5,700 | | 756 | |
Marriott International, Inc. Class A | | 73,000 | | 3,001 | |
McGraw-Hill Cos., Inc. (The) | | 82,000 | | 4,103 | |
Microsoft Corp. | | 72,000 | | 2,650 | |
Nordstrom, Inc. | | 62,000 | | 2,445 | |
PACCAR, Inc. | | 57,000 | | 3,167 | |
Praxair, Inc. | | 60,000 | | 5,129 | |
Qualcomm, Inc. | | 60,000 | | 2,564 | |
Raytheon Co. | | 28,000 | | 1,781 | |
State Street Corp. | | 50,000 | | 3,989 | |
T. Rowe Price Group, Inc. | | 46,500 | | 2,987 | |
Tyco Electronics, Ltd. | | 90,000 | | 3,210 | |
Varian Medical Systems, Inc. ‡ | | 41,000 | | 2,000 | |
Walgreen Co. | | 63,200 | | 2,506 | |
Zimmer Holdings, Inc. ‡ | | 17,700 | | 1,230 | |
Total Common Stocks (cost $185,719) | | | | 256,200 | |
| | | | | |
Total Security Lending Collateral (cost $14,815) ± | | | | 14,815 | |
Total Investment Securities (cost $200,534) # | | | | $ | 271,015 | |
| | | | | | | |
NOTES TO SCHEDULE OF INVESTMENTS |
^ | | At October 31, 2007, all or a portion of this security is on loan (see Note 1). The value at October 31, 2007, of all securities on loan is $14,386. |
± | | Cash collateral for the Repurchase Agreements, valued at $2,704, that serve as collateral for securities lending, are invested in corporate and government bonds with interest rates and maturity dates ranging from 0.00% - 8.125% and 11/14/2007 - 9/15/2037. |
‡ | | Non Income Producing |
# | | Aggregate cost for federal income tax purposes is $202,208. Aggregate gross unrealized appreciation for all securities in which there is an excess of value over tax cost and aggregate gross unrealized depreciation for all securities in which there is an excess of tax cost over value were $71,033 and $2,226, respectively. Net unrealized appreciation for tax purposes is $68,807. |
| | |
DEFINITIONS: |
144A | | 144A Securities are registered pursuant to Rule 144A of the Securities Act of 1933. These securities are deemed to be liquid for purposes of compliance limitations on holdings of illiquid securities and may be resold as transactions exempt from registration, normally to qualified institutional buyers. At October 31, 2007, these securities aggregated $1,870 or 0.72% of net assets of the Fund. |
The notes to the financial statements are an integral part of this report.
13
(all amounts except share amounts in thousands)
(unaudited)
| | Percentage of | | | |
| | Total Investments | | Value | |
INVESTMENTS BY INDUSTRY: | | | | | |
Diversified Telecommunication Services | | 6.5 | % | $ | 17,497 | |
Oil, Gas & Consumable Fuels | | 5.3 | % | 14,278 | |
Commercial Banks | | 4.8 | % | 13,073 | |
Capital Markets | | 4.3 | % | 11,796 | |
Media | | 4.3 | % | 11,627 | |
Insurance | | 4.0 | % | 10,946 | |
Computers & Peripherals | | 3.7 | % | 10,142 | |
Aerospace & Defense | | 3.7 | % | 9,950 | |
Pharmaceuticals | | 3.6 | % | 9,747 | |
Software | | 3.6 | % | 9,640 | |
Diversified Financial Services | | 3.0 | % | 8,247 | |
Communications Equipment | | 2.9 | % | 7,855 | |
Chemicals | | 2.7 | % | 7,302 | |
Industrial Conglomerates | | 2.6 | % | 7,030 | |
Hotels, Restaurants & Leisure | | 2.6 | % | 6,957 | |
Electronic Equipment & Instruments | | 2.4 | % | 6,452 | |
Air Freight & Logistics | | 2.3 | % | 6,296 | |
Machinery | | 2.2 | % | 6,077 | |
Automobiles | | 2.1 | % | 5,765 | |
Auto Components | | 2.1 | % | 5,672 | |
Consumer Finance | | 2.1 | % | 5,619 | |
Internet Software & Services | | 2.0 | % | 5,302 | |
Construction & Engineering | | 1.9 | % | 5,229 | |
Electric Utilities | | 1.7 | % | 4,752 | |
Wireless Telecommunication Services | | 1.7 | % | 4,536 | |
Commercial Services & Supplies | | 1.6 | % | 4,328 | |
Health Care Equipment & Supplies | | 1.5 | % | 4,210 | |
Food Products | | 1.5 | % | 4,019 | |
Food & Staples Retailing | | 1.4 | % | 3,704 | |
Household Durables | | 1.3 | % | 3,578 | |
Semiconductors & Semiconductor Equipment | | 1.3 | % | 3,459 | |
Paper & Forest Products | | 1.3 | % | 3,451 | |
Biotechnology | | 1.1 | % | 2,956 | |
Energy Equipment & Services | | 1.1 | % | 2,897 | |
Multiline Retail | | 0.9 | % | 2,445 | |
Specialty Retail | | 0.7 | % | 2,009 | |
Electrical Equipment | | 0.6 | % | 1,759 | |
Office Electronics | | 0.6 | % | 1,518 | |
Real Estate Management & Development | | 0.5 | % | 1,439 | |
Health Care Providers & Services | | 0.5 | % | 1,329 | |
Metals & Mining | | 0.5 | % | 1,312 | |
Investment Securities, at value | | 94.5 | % | 256,200 | |
Short-Term Investments | | 5.5 | % | 14,815 | |
Total Investments | | 100.0 | % | $ | 271,015 | |
The notes to the financial statements are an integral part of this report.
14
TA IDEX Transamerica Balanced
MARKET ENVIRONMENT
U.S. securities markets overcame big challenges in the twelve months ended October 31, 2007, to generate positive returns. Stocks outperformed bonds, as the Standard and Poor’s 500 Composite Stock Index (“S&P 500”) rose 14.56% and the Lehman Brothers U.S. Government/Credit Bond Index (“LBGC”) advanced 5.37%.
Throughout the period, the markets struggled against the implications of weakness in the U.S. housing market. Because losses in home equity influence the major engine of economic growth, consumer spending, the downturn raised concerns that the economy and corporate profits would deteriorate as well. Added to this were fears that escalating energy prices, rising defaults for low-quality (sub-prime) mortgages and a liquidity crisis in the debt markets would push interest rates higher, further undermining the prospects for housing.
These problems notwithstanding, economic growth and corporate earnings remained healthy, buoyed by a robust global economy and strong demand for U.S. exports. Other positives included growth in U.S. manufacturing, higher personal incomes, brisk spending on commercial construction and late-period interest-rate cuts by the Federal Reserve Board. In the end, these factors outweighed the housing and debt-market issues. Although many market segments — especially those most vulnerable to these issues (e.g., securities of financial services companies) — dropped sharply during the turmoil, both equities and bonds recovered to finish the twelve-month period with solid gains.
A 60% equity/40% bonds blend of the abovementioned indexes would have advanced 10.88% during the period.
PERFORMANCE
For the year ended October 31, 2007, TA IDEX Transamerica Balanced, Class A returned 17.28%. By comparison its primary and secondary benchmarks, the S&P 500 and the LBGC, returned 14.56% and 5.37%, respectively. For the year ended October 31, 2007, the Fund’s net expense ratios for Class A, Class B, and Class C were 1.56%, 2.14%, and 2.11%, respectively.
STRATEGY REVIEW
The portfolio benefited from an overweighting in equities (approximately 70% of total assets), which outperformed bonds. Additionally, the equity portfolio outperformed the S&P 500 by a wide margin, reflecting our emphasis on companies that have strong fundamentals and stand to benefit from robust global economic growth. Most were industrial, technology and consumer stocks. Strong gains for the first two sectors more than offset the effects of weakness among our holdings in the third.
Top-contributing stocks included Jacobs Engineering Group Inc. (“Jacobs”) and Apple Inc. (“Apple”). Jacobs, which designs and constructs major infrastructure projects and manufacturing facilities worldwide, won major new contracts during the period. Apple continued to dominate the personal music player (i.e., iPod) business, launched the iPhone (an all-in-one camera phone, iPod and wireless e-mail tool) and saw growth in its core personal computer business.
Detractors included McGraw-Hill Companies Inc. (“McGraw-Hill”), which is the parent company of debt-rating agency Standard & Poor’s Corporation (“Standard & Poor’s”), and several consumer companies (e.g., Harley-Davidson, Inc. (“Harley-Davidson”), Whole Foods Markets, Inc., and Nordstrom, Inc. (“Nordstrom”)). Their stock prices fell as investors worried that the credit-and-housing crisis would negatively affect bond market activity (a factor for Standard & Poor’s) and consumer spending (a potential issue for the others). We trimmed the investment in motorcycle maker Harley-Davidson.
In the bond portfolio, an overweighting in corporate bonds and high-quality mortgage-backed securities led to positive but below-index results. These non-government sectors generated attractive yields but underperformed Treasuries during the summer’s turmoil. Our defensive measures during that period were not sufficient to fully insulate the portfolio from the downturn.
Heidi Y. Hu, CFA
Gary U. Rolle, CFA
Co-Portfolio Managers
Transamerica Investment Management, LLC
15
(unaudited)
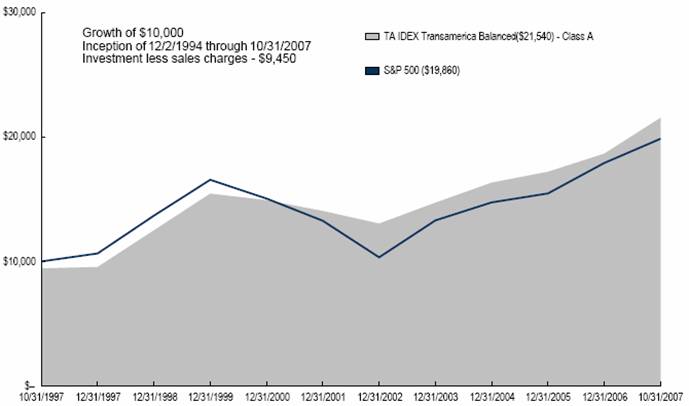
Average Annual Total Return for Periods Ended 10/31/2007
| | | | | | | | From | | Inception | |
| | 1 Year | | 5 Years | | 10 Years | | Inception | | Date | |
Class A (NAV) | | 17.28 | % | 10.48 | % | 8.59 | % | 11.29 | % | 12/2/94 | |
Class A (POP) | | 10.84 | % | 9.25 | % | 7.98 | % | 10.81 | % | 12/2/94 | |
S&P 500(1) | | 14.56 | % | 13.88 | % | 7.10 | % | 11.99 | % | 12/2/94 | |
LBGC(1) | | 5.37 | % | 4.55 | % | 5.95 | % | 6.95 | % | 12/2/94 | |
| | | | | | | | | | | |
Class B (NAV) | | 16.57 | % | 9.80 | % | 8.04 | % | 10.33 | % | 10/1/95 | |
Class B (POP) | | 11.57 | % | 9.66 | % | 8.04 | % | 10.33 | % | 10/1/95 | |
| | | | | | | | | | | |
Class C (NAV) | | 16.61 | % | — | % | — | % | 9.85 | % | 11/11/02 | |
Class C (POP) | | 15.61 | % | — | % | — | % | 9.85 | % | 11/11/02 | |
NOTES
(1) The Standard and Poor’s 500 Composite Stock (S&P 500) Index and Lehman Brothers U.S. Government/Credit Bond (LBGC) Index are unmanaged indices used as a general measure of market performance. Calculations assume dividends and capital gains are reinvested and do not include any managerial expenses. From inception calculation is based on life of Class A shares.
The performance data presented represents past performance, future results may vary. Performance data does not reflect the deduction of taxes that would be paid on fund distributions nor the redemption of fund shares. Investment return and principal value will fluctuate so that an investor’s shares, when redeemed, may be worth more or less than their original cost. Current performance may be lower or higher than performance quoted. Please see www.transamericaidex.com for performance data current to the most recent month-end.
Public Offering Price (POP) returns include the reinvestment of dividends and capital gains and reflect the maximum sales charge of 5.5% for A shares or the maximum applicable contingent deferred sales charge (5% in the 1st year, decreasing to 0% after 6 years) for Class B shares and 1% (during the first 12 months) for Class C shares. Shares purchased prior to March 1, 2004 are subject to a maximum applicable contingent deferred sales charge (5% in the 1st year, decreasing to 0% after 7 years) for Class B shares and (2% in the 1st year, decreasing to 0% after 2 years) for Class C shares. Net Asset Value (NAV) returns include the reinvestment of dividends and capital gains but do not reflect any sales charges.
This material must be preceded or accompanied by a current prospectus, which includes specific contents regarding the investment objectives and policies of this Fund.
16
UNDERSTANDING YOUR FUND’S EXPENSES
(unaudited)
SHAREHOLDER EXPENSES
Fund shareholders may incur two types of costs: (1) transaction costs, including sales charges (loads) on purchases, contingent deferred sales charges on redemptions and redemption fees; and (2) ongoing costs, including management fees, 12b-1 distribution and service fees, and other fund expenses.
The following Example is intended to help you understand your ongoing costs (in dollars and cents) of investing in the Fund and to compare these costs with the ongoing costs of investing in other funds.
The Example is based on an investment of $1,000 invested at May 1, 2007 and held for the entire period until October 31, 2007.
ACTUAL EXPENSES
The first line in the table below provides information about actual account values and actual expenses. You may use the information in this line, together with the amount you invested, to estimate the expenses that you paid over the period. Simply divide your account value by $1,000 (for example, an $8,600 account value divided by $1,000 = 8.6), then multiply the result by the number in the first line of your Fund under the heading entitled “Expenses Paid During Period” to estimate the expenses you paid on your account during this period. If your account is an IRA, your expenses could have included a $15 annual fee. The amount of any fee paid through your account would increase the estimate of expenses you paid during the period and decrease your ending account value.
HYPOTHETICAL EXAMPLE FOR COMPARISON PURPOSES
The second line in the table below provides information about hypothetical account values and hypothetical expenses based on the Fund’s actual expense ratio and an assumed rate of return of 5% per year before expenses, which is not the Fund’s actual return. The hypothetical account values and expenses may not be used to estimate the actual ending account balance or expenses you paid for the period. You may use this information to compare the ongoing costs of investing in your Fund and other funds. To do so, compare this 5% hypothetical example with the 5% hypothetical examples that appear in the shareholder reports of the other funds. As in the case of the actual expense example, if your account is subject to an IRA fee, the amount of the fee paid through your account would increase the hypothetical expenses you would have paid during the period and decrease the hypothetical ending account value.
Please note that the expenses shown in the table are meant to highlight your ongoing costs only and do not reflect any transactional costs, such as sales charges, redemption fees, brokerage commissions paid on purchases and sales of fund shares. Therefore, the second line under the Fund in the table is useful in comparing ongoing costs only, and will not help you determine the relative total costs of owning different funds. If any of these transaction costs were included, your costs would be higher. The expenses shown in the table do not reflect any fees that may be charged to you by brokers, financial intermediaries or other financial institutions.
| | Beginning | | Ending | | Annualized | | Expenses | |
| | Account | | Account | | Expense | | Paid During | |
| | Value | | Value | | Ratio | | Period (a) | |
Class A | | | | | | | | | |
Actual | | $ | 1,000.00 | | $ | 1,105.43 | | 1.53 | % | $ | 8.10 | |
Hypothetical (b) | | 1,000.00 | | 1,017.44 | | 1.53 | | 7.76 | |
| | | | | | | | | |
Class B | | | | | | | | | |
Actual | | 1,000.00 | | 1,102.04 | | 2.11 | | 11.18 | |
Hypothetical (b) | | 1,000.00 | | 1,014.50 | | 2.11 | | 10.71 | |
| | | | | | | | | |
Class C | | | | | | | | | |
Actual | | 1,000.00 | | 1,102.16 | | 2.09 | | 11.06 | |
Hypothetical (b) | | 1,000.00 | | 1,014.61 | | 2.09 | | 10.60 | |
| | | | | | | | | | | | |
(a) | Expenses are calculated using the Fund’s annualized expense ratio (as disclosed in the table), multiplied by the average account value for the period, multiplied by the number of days in the period (184 days), and divided by the number of days in the year (365 days). |
| |
(b) | 5% return per year before expenses. |
GRAPHICAL PRESENTATION OF SCHEDULE OF INVESTMENTS
By Asset Type
At October 31, 2007
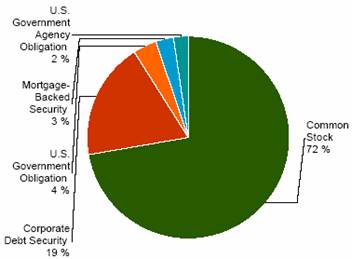
This chart shows the percentage breakdown by asset type of the Fund’s total investment securities.
17
SCHEDULE OF INVESTMENTS
At October 31, 2007
(all amounts except share amounts in thousands)
| | | | Principal | | Value | |
U.S. GOVERNMENT OBLIGATIONS (3.7%) | | | | | | | |
U.S. Treasury Bond | | | | | | | |
4.50%, due 02/15/2036 ^ | | | | $ | 640 | | $ | 614 | |
4.75%, due 02/15/2037 ^ | | | | 955 | | 955 | |
8.00%, due 11/15/2021 ^ | | | | 1,450 | | 1,930 | |
U.S. Treasury Note | | | | | | | |
4.00%, due 02/15/2015 ^ | | | | 1,715 | | 1,679 | |
4.25%, due 09/30/2012 – 11/15/2013 | | | | 998 | | 1,000 | |
4.75%, due 08/15/2017 ^ | | | | 862 | | 881 | |
Total U.S. Government Obligations (cost $6,931) | | | | | | 7,059 | |
| | | | | | | |
U.S. GOVERNMENT AGENCY OBLIGATIONS (2.3%) | | | | | | | |
Fannie Mae | | | | | | | |
5.00%, due 04/25/2034 | | | | 700 | | 675 | |
Freddie Mac | | | | | | | |
4.25%, due 10/15/2026 | | | | 980 | | 968 | |
5.00%, due 10/15/2030 | | | | 1,700 | | 1,669 | |
5.35%, due 11/14/2011 | | | | 1,070 | | 1,078 | |
Total U.S. Government Agency Obligations (cost $4,390) | | | | | | 4,390 | |
| | | | | | | |
MORTGAGE-BACKED SECURITIES (2.8%) | | | | | | | |
Bear Stearns Commercial Mortgage Securities | | | | | | | |
Series 2006-PW14, Class A4 | | | | | | | |
5.20%, due 12/11/2038 | | | | 1,060 | | 1,027 | |
Crown Castle Towers LLC | | | | | | | |
Series 2006-1A, Class AFX-144A | | | | | | | |
5.24%, due 11/15/2036 | | | | 989 | | 986 | |
Morgan Stanley Capital I | | | | | | | |
Series 2006-HQ10, Class A4 | | | | | | | |
5.33%, due 11/12/2041 | | | | 1,140 | | 1,116 | |
SBA CMBS Trust | | | | | | | |
Series 2006-1A, Class A-144A | | | | | | | |
5.31%, due 11/15/2036 | | | | 880 | | 878 | |
Wachovia Bank Commercial Mortgage Trust | | | | | | | |
Series 2006-C28, Class A4 | | | | | | | |
5.57%, due 10/15/2048 | | | | 1,114 | | 1,109 | |
Wachovia Bank Commercial Mortgage Trust | | | | | | | |
Series 2007-C32, Class H-144A | | | | | | | |
5.93%, due 06/15/2049 § | | | | 245 | | 198 | |
Total Mortgage-Backed Securities (cost $5,413) | | | | | | 5,314 | |
| | | | | | | |
ASSET-BACKED SECURITIES (0.3%) | | | | | | | |
USAA Auto Owner Trust | | | | | | | |
Series 2007-2, Class A3 | | | | | | | |
4.90%, due 02/15/2012 | | | | 605 | | 606 | |
Total Asset-Backed Securities (cost $605) | | | | | | 606 | |
| | | | | | | |
CORPORATE DEBT SECURITIES (18.4%) | | | | | | | |
Aerospace & Defense (0.8%) | | | | | | | |
Embraer Overseas, Ltd. | | | | | | | |
6.38%, due 01/24/2017 | | | | $ | 386 | | $ | 378 | |
Honeywell International | | | | | | | |
5.63%, due 08/01/2012 | | | | 405 | | 416 | |
Honeywell International, Inc. | | | | | | | |
6.13%, due 11/01/2011 | | | | 660 | | 686 | |
Airlines (0.3%) | | | | | | | |
Delta Air Lines, Inc. | | | | | | | |
7.57%, due 11/18/2010 | | | | 270 | | 279 | |
United Airlines, Inc. | | | | | | | |
6.64%, due 07/02/2022 | | | | 344 | | 340 | |
Beverages (0.4%) | | | | | | | |
Anheuser-Busch Cos., Inc. | | | | | | | |
6.45%, due 09/01/2037 | | | | 253 | | 273 | |
Diageo Capital PLC | | | | | | | |
5.75%, due 10/23/2017 | | | | 458 | | 456 | |
Capital Markets (0.3%) | | | | | | | |
Ameriprise Financial, Inc. | | | | | | | |
7.52%, due 06/01/2066 (1) | | | | 260 | | 266 | |
JP Morgan Chase Capital XVIII | | | | | | | |
6.95%, due 08/17/2036 | | | | 290 | | 286 | |
Chemicals (1.1%) | | | | | | | |
ICI Wilmington, Inc. | | | | | | | |
4.38%, due 12/01/2008 | | | | 791 | | 788 | |
Lubrizol Corp. | | | | | | | |
4.63%, due 10/01/2009 | | | | 1,350 | | 1,339 | |
Commercial Banks (1.0%) | | | | | | | |
Barclays PLC | | | | | | | |
6.28%, due 12/15/2034 Ž, (1) | | | | 290 | | 258 | |
HBOS PLC - 144A | | | | | | | |
6.66%, due 11/21/2049 Ž, (1) | | | | 285 | | 253 | |
ICICI Bank, Ltd. - 144A | | | | | | | |
6.63%, due 10/03/2012 | | | | 353 | | 356 | |
Rabobank Capital Funding II - 144A | | | | | | | |
5.26%, due 12/31/2013 Ž | | | | 215 | | 206 | |
Sumitomo Mitsui Banking Corp. - 144A | | | | | | | |
5.63%, due 10/15/2015 Ž, (1) | | | | 240 | | 224 | |
Wachovia Capital Trust III | | | | | | | |
5.80%, due 03/15/2011 Ž, (1) | | | | 260 | | 258 | |
ZFS Finance USA Trust II - 144A | | | | | | | |
6.45%, due 12/15/2065 (1) | | | | 260 | | 250 | |
Computers & Peripherals (0.4%) | | | | | | | |
Hewlett-Packard Co. | | | | | | | |
3.63%, due 03/15/2008 | | | | 765 | | 761 | |
Construction Materials (0.2%) | | | | | | | |
Lafarge SA | | | | | | | |
7.13%, due 07/15/2036 | | | | 385 | | 395 | |
Consumer Finance (1.3%) | | | | | | | |
Capital One Bank | | | | | | | |
5.75%, due 09/15/2010 | | | | 800 | | 808 | |
Discover Financial Services - 144A | | | | | | | |
6.23%, due 06/11/2010 * | | | | 635 | | 617 | |
The notes to the financial statements are an integral part of this report.
18
| | | | Principal | | Value | |
Consumer Finance (continued) | | | | | | | |
John Deere Capital Corp. | | | | | | | |
4.40%, due 07/15/2009 | | | | $ | 1,000 | | $ | 992 | |
Diversified Financial Services (1.3%) | | | | | | | |
Glencore Funding LLC - 144A | | | | | | | |
6.00%, due 04/15/2014 | | | | 292 | | 293 | |
ILFC E-Capital Trust II - 144A | | | | | | | |
6.25%, due 12/21/2065 (1) | | | | 410 | | 402 | |
Mizuho Preferred Capital Co. LLC - 144A | | | | | | | |
8.79%, due 12/29/2049 Ž | | | | 1,100 | | 1,124 | |
Pemex Finance, Ltd. | | | | | | | |
9.03%, due 02/15/2011 | | | | 595 | | 632 | |
Diversified Telecommunication Services (0.2%) | | | | | | | |
AT&T, Inc. | | | | | | | |
4.13%, due 09/15/2009 | | | | 304 | | 300 | |
Electric Utilities (0.1%) | | | | | | | |
FPL Group Capital, Inc. | | | | | | | |
5.55%, due 02/16/2008 | | | | 3 | | 3 | |
PSEG Funding Trust I | | | | | | | |
5.38%, due 11/16/2007 | | | | 235 | | 235 | |
Food & Staples Retailing (0.5%) | | | | | | | |
Costco Wholesale Corp. | | | | | | | |
5.50%, due 03/15/2017 | | | | 494 | | 486 | |
Wal-Mart Stores, Inc. | | | | | | | |
6.50%, due 08/15/2037 | | | | 500 | | 526 | |
Food Products (0.9%) | | | | | | | |
Archer-Daniels-Midland Co. | | | | | | | |
5.38%, due 09/15/2035 | | | | 250 | | 232 | |
Bunge, Ltd. Finance Corp. | | | | | | | |
4.38%, due 12/15/2008 | | | | 930 | | 922 | |
Cargill, Inc. - 144A | | | | | | | |
5.60%, due 09/15/2012 | | | | 225 | | 227 | |
Michael Foods, Inc. | | | | | | | |
8.00%, due 11/15/2013 | | | | 320 | | 320 | |
Gas Utilities (1.4%) | | | | | | | |
Oneok, Inc. | | | | | | | |
5.51%, due 02/16/2008 | | | | 1,730 | | 1,729 | |
Southern Union Co. | | | | | | | |
6.15%, due 08/16/2008 | | | | 926 | | 931 | |
Hotels, Restaurants & Leisure (1.0%) | | | | | | | |
Las Vegas Sands Corp. | | | | | | | |
6.38%, due 02/15/2015 | | | | 300 | | 292 | |
McDonald’s Corp. | | | | | | | |
5.80%, due 10/15/2017 | | | | 425 | | 429 | |
Royal Caribbean Cruises, Ltd. | | | | | | | |
8.75%, due 02/02/2011 | | | | 815 | | 869 | |
Starbucks Corp. | | | | | | | |
6.25%, due 08/15/2017 | | | | 285 | | 291 | |
Household Durables (0.3%) | | | | | | | |
Centex Corp. | | | | | | | |
4.75%, due 01/15/2008 | | | | 620 | | 616 | |
Household Products (0.1%) | | | | | | | |
Kimberly-Clark | | | | | | | |
6.63%, due 08/01/2037 | | | | 250 | | 275 | |
Industrial Conglomerates (0.5%) | | | | | | | |
Hutchison Whampoa International, Ltd. - 144A | | | | | | | |
5.45%, due 11/24/2010 | | | | $ | 950 | | $ | 957 | |
Insurance (0.2%) | | | | | | | |
Oil Insurance, Ltd. - 144A | | | | | | | |
7.56%, due 06/30/2011 Ž, (1) | | | | 325 | | 334 | |
Machinery (0.2%) | | | | | | | |
Tyco Electronics Group SA - 144A | | | | | | | |
6.55%, due 10/01/2017 | | | | 392 | | 400 | |
Media (1.2%) | | | | | | | |
Clear Channel Communications, Inc. | | | | | | | |
4.63%, due 01/15/2008 | | | | 545 | | 542 | |
Comcast Corp. | | | | | | | |
7.05%, due 03/15/2033 | | | | 325 | | 350 | |
Historic Tw, Inc. | | | | | | | |
9.13%, due 01/15/2013 | | | | 485 | | 558 | |
McGraw-Hill Cos., Inc. | | | | | | | |
5.38%, due 11/15/2012 | | | | 425 | | 422 | |
News America Holdings, Inc. | | | | | | | |
7.75%, due 12/01/2045 | | | | 392 | | 445 | |
Multiline Retail (0.2%) | | | | | | | |
Neiman-Marcus Group, Inc. | | | | | | | |
9.00%, due 10/15/2015 | | | | 200 | | 211 | |
Target Corp. | | | | | | | |
6.50%, due 10/15/2037 | | | | 242 | | 245 | |
Oil, Gas & Consumable Fuels (1.4%) | | | | | | | |
Husky Oil, Ltd. | | | | | | | |
8.90%, due 08/15/2028 (1) | | | | 570 | | 586 | |
Nexen, Inc. | | | | | | | |
6.40%, due 05/15/2037 | | | | 250 | | 249 | |
Petrobras International Finance Co. | | | | | | | |
5.88%, due 03/01/2018 | | | | 410 | | 403 | |
PetroHawk Energy Corp. | | | | | | | |
9.13%, due 07/15/2013 | | | | 360 | | 382 | |
Teppco Partners, LP | | | | | | | |
7.00%, due 06/01/2067 (1) | | | | 300 | | 271 | |
Valero Logistics Operations, LP | | | | | | | |
6.88%, due 07/15/2012 | | | | 710 | | 740 | |
Real Estate Investment Trusts (1.7%) | | | | | | | |
BRE Properties, Inc. | | | | | | | |
5.75%, due 09/01/2009 | | | | 1,115 | | 1,127 | |
iStar Financial, Inc. | | | | | | | |
4.88%, due 01/15/2009 | | | | 875 | | 857 | |
PPF Funding, Inc. - 144A | | | | | | | |
5.35%, due 04/15/2012 | | | | 781 | | 771 | |
Westfield Group - 144A | | | | | | | |
5.40%, due 10/01/2012 | | | | 520 | | 517 | |
Real Estate Management & Development (0.8%) | | | | | | | |
Duke Realty, LP | | | | | | | |
5.63%, due 08/15/2011 | | | | 570 | | 570 | |
ERP Operating, LP | | | | | | | |
5.38%, due 08/01/2016 | | | | 350 | | 335 | |
The notes to the financial statements are an integral part of this report.
19
| | | | Principal | | Value | |
Real Estate Management & Development (continued) | | | | | | | |
Post Apartment Homes, LP | | | | | | | |
6.30%, due 06/01/2013 | | | | $ | 569 | | $ | 578 | |
Road & Rail (0.2%) | | | | | | | |
Erac USA Finance Co. - 144A | | | | | | | |
6.38%, due 10/15/2017 | | | | 335 | | 334 | |
Specialty Retail (0.2%) | | | | | | | |
Lowe’s Companies, Inc. | | | | | | | |
6.65%, due 09/15/2037 | | | | 200 | | 206 | |
Petro Stopping Centers, LP / Petro | | | | | | | |
9.00%, due 02/15/2012 | | | | 250 | | 261 | |
Wireless Telecommunication Services (0.2%) | | | | | | | |
Nextel Communications, Inc. | | | | | | | |
7.38%, due 08/01/2015 | | | | 360 | | 364 | |
Total Corporate Debt Securities (cost $35,020) | | | | | | 35,034 | |
| | | | | | | | | |
| | | | Shares | | Value | |
PREFERRED STOCKS (0.1%) | | | | | | | |
Thrifts & Mortgage Finance (0.1%) | | | | | | | |
IndyMac Bank Fsb - 144A ‡ | | | | 11,000 | | 154 | |
Total Preferred Stocks (cost $275) | | | | | | 154 | |
| | | | | | | |
COMMON STOCKS (70.8%) | | | | | | | |
Aerospace & Defense (0.5%) | | | | | | | |
Boeing Co. | | | | 10,000 | | 986 | |
Air Freight & Logistics (2.1%) | | | | | | | |
Expeditors International Washington, | | | | 80,000 | | 4,052 | |
Auto Components (3.4%) | | | | | | | |
BorgWarner, Inc. | | | | 22,000 | | 2,326 | |
Johnson Controls, Inc. | | | | 96,000 | | 4,197 | |
Automobiles (1.7%) | | | | | | | |
Daimler AG ^ | | | | 20,000 | | 2,203 | |
Harley-Davidson, Inc. | | | | 20,000 | | 1,030 | |
Biotechnology (1.1%) | | | | | | | |
Gilead Sciences, Inc. ‡ | | | | 46,000 | | 2,125 | |
Capital Markets (3.6%) | | | | | | | |
Ameriprise Financial, Inc. | | | | 57,600 | | 3,628 | |
Charles Schwab Corp. (The) | | | | 42,000 | | 976 | |
T. Rowe Price Group, Inc. | | | | 36,000 | | 2,312 | |
Communications Equipment (2.7%) | | | | | | | |
Qualcomm, Inc. | | | | 90,000 | | 3,846 | |
Research In Motion, Ltd. ‡ | | | | 10,000 | | 1,245 | |
Computers & Peripherals (5.0%) | | | | | | | |
Apple, Inc. ‡ | | | | 50,000 | | 9,497 | |
Construction & Engineering (6.8%) | | | | | | | |
Jacobs Engineering Group, Inc. ‡ | | | | 148,800 | | 12,968 | |
Consumer Finance (2.1%) | | | | | | | |
American Express Co. | | | | 64,000 | | 3,901 | |
Diversified Financial Services (3.1%) | | | | | | | |
CME Group, Inc. Class A | | | | 9,000 | | 5,996 | |
Diversified Telecommunication Services (1.2%) | | | | | | | |
Verizon Communications, Inc. | | | | 50,000 | | 2,303 | |
Electronic Equipment & Instruments (1.4%) | | | | | | | |
Tyco Electronics, Ltd. | | | | 73,000 | | 2,604 | |
Energy Equipment & Services (2.0%) | | | | | | | |
Schlumberger, Ltd. | | | | 40,000 | | $ | 3,863 | |
Food & Staples Retailing (1.0%) | | | | | | | |
Walgreen Co. | | | | 47,500 | | 1,883 | |
Health Care Equipment & Supplies (1.9%) | | | | | | | |
Varian Medical Systems, Inc. ‡ | | | | 40,000 | | 1,951 | |
Zimmer Holdings, Inc. ‡ | | | | 25,000 | | 1,737 | |
Hotels, Restaurants & Leisure (3.1%) | | | | | | | |
Marriott International, Inc. Class A | | | | 86,000 | | 3,536 | |
MGM Mirage, Inc. ‡ | | | | 25,000 | | 2,290 | |
Industrial Conglomerates (1.7%) | | | | | | | |
General Electric Co. | | | | 80,000 | | 3,293 | |
Insurance (1.3%) | | | | | | | |
American International Group, Inc. | | | | 40,000 | | 2,525 | |
Internet Software & Services (2.6%) | | | | | | | |
Google, Inc. Class A ‡ | | | | 7,000 | | 4,949 | |
Machinery (8.5%) | | | | | | | |
Caterpillar, Inc. | | | | 60,000 | | 4,476 | |
Kennametal, Inc. | | | | 64,300 | | 5,865 | |
PACCAR, Inc. | | | | 105,000 | | 5,834 | |
Media (3.2%) | | | | | | | |
McGraw-Hill Cos., Inc. (The) | | | | 120,000 | | 6,005 | |
Multiline Retail (1.2%) | | | | | | | |
Nordstrom, Inc. | | | | 60,000 | | 2,366 | |
Oil, Gas & Consumable Fuels (2.0%) | | | | | | | |
Suncor Energy, Inc. | | | | 35,500 | | 3,878 | |
Pharmaceuticals (1.6%) | | | | | | | |
Allergan, Inc. | | | | 45,000 | | 3,041 | |
Semiconductors & Semiconductor Equipment (1.6%) | | | | | | | |
Intel Corp. | | | | 111,000 | | 2,986 | |
Software (2.6%) | | | | | | | |
Microsoft Corp. | | | | 105,000 | | 3,865 | |
Salesforce.Com, Inc. ‡^ | | | | 19,000 | | 1,071 | |
Trading Companies & Distributors (1.8%) | | | | | | | |
WW Grainger, Inc. | | | | 38,500 | | 3,462 | |
Total Common Stocks (cost $89,008) | | | | | | 135,071 | |
| | | | | | | |
Total Security Lending Collateral (cost $7,667) ± | | | | | | 7,667 | |
Total Investment Securities (cost $149,309) # | | | | | | $ | 195,295 | |
The notes to the financial statements are an integral part of this report.
20
NOTES TO SCHEDULE OF INVESTMENTS
^ | At October 31, 2007, all or a portion of this security is on loan (see Note 1). The value at October 31, 2007, of all securities on loan is $7,492. |
± | Cash collateral for the Repurchase Agreements, valued at $1,399, that serve as collateral for securities lending, are invested in corporate and government bonds with interest rates and maturity dates ranging from 0.00% - 8.125% and 11/14/2007 - 9/15/2037. |
* | Floating or variable rate note. Rate is listed as of October 31, 2007. |
§ | Illiquid |
‡ | Non Income Producing |
(1) | Coupon rate is fixed for a predetermined period of time and then converts to a floating rate until maturity/call date. Rate is listed as of October 31, 2007. |
Ž | The security has a perpetual maturity. The date shown is the next call date. |
# | Aggregate cost for federal income tax purposes is $149,572. Aggregate gross unrealized appreciation for all securities in which there is an excess of value over tax cost and aggregate gross unrealized depreciation for all securities in which there is an excess of tax cost over value were $47,726 and $2,003, respectively. Net unrealized appreciation for tax purposes is $45,723. |
| |
DEFINITIONS: |
144A | 144A Securities are registered pursuant to Rule 144A of the Securities Act of 1933. These securities are deemed to be liquid for purposes of compliance limitations on holdings of illiquid securities and may be resold as transactions exempt from registration, normally to qualified institutional buyers. At October 31, 2007, these securities aggregated $9,481 or 4.97% of net assets of the Fund. |
21
TA IDEX Transamerica Convertible Securities
MARKET ENVIRONMENT
During the twelve months ended October 31, 2007, the Standard and Poor’s 500 Composite Stock Index gained 14.56%. Convertibles, which are highly sensitive to equity-market trends, followed stocks higher; the Merrill Lynch All U.S. Convertible Securities Index (“MLCI”) rose 12.73%.
Throughout the period, the equity and fixed-income markets fluctuated, at times fairly violently, as investors struggled to decide how deeply a slowing U.S. housing market would affect consumer spending and domestic economic growth. Added to this were intermittent fears that inflation, fueled by escalating energy prices, would prevent the Federal Reserve Board (“Fed”) from lowering interest rates to relieve some of the pressures in the collapsing housing market. Matters took a turn for the worse in summer, when rising defaults for low-quality mortgages sparked still more trepidation about housing as well as crisis in the debt markets. Interest rates rose, causing the markets to swoon. The trend then reversed when the Fed intervened, instituting two interest-rate cuts between August and October.
Despite the concerns, economic growth and corporate earnings remained positive, due to a healthy global economy, strong demand for U.S. exports, and growth in U.S. manufacturing and personal incomes. In the end, these factors outweighed the housing and credit-market issues; both stocks and bonds ended the year in positive territory.
Buoyed by the upside potential of their equity features and the downside cushion of their fixed-income characteristics, convertibles’ total returns withstood the markets’ fluctuations well, generating positive returns throughout the period.
PERFORMANCE
For the year ended October 31, 2007, TA IDEX Transamerica Convertibles, Class A returned 27.41%. By comparison its benchmark, the MLCI, returned 12.73%. For the year ended October 31, 2007, the Fund’s net expense ratios for Class A, Class B, Class C, and Class I were 1.33%, 1.99%, 1.94%, and 0.82%, respectively.
STRATEGY REVIEW
We seek the convertibles of well-run companies that generate free cash flow and stand to benefit from positive changes in the companies, their industries, or the external forces driving their businesses. During this period, these parameters led us to focus on stocks benefiting from a robust global economy, which manifested in several ways, including higher expenditures on global infrastructure and manufacturing, increased demand for energy, and greater consumer spending for leisure and entertainment. As a result, the portfolio was tilted toward investments in technology, travel and leisure activities, and industrial and energy businesses.
The portfolio’s outperformance versus its index was due primarily to “synthetic” securities for casino operator Las Vegas Sands Corp. (“Las Vegas Sands”) and Research in Motion Ltd. (“RIMM”), maker of the BlackBerry personal communications devices. To create these securities, we pair a bond (usually AA-rated) with a call option on a company’s stock, thereby approximating a convertible’s blend of current income and potential to benefit from higher stock prices. Las Vegas Sands advanced strongly in response to the successful launch of a new facility, in Macao, China. RIMM performed well due to the expansion of its product line for businesses and the introduction of new products for consumers.
Other major contributors included two traditional energy-related convertibles, Schlumberger Limited and SunPower Corporation (“SunPower”). The former provides technology and information services to the rapidly expanding oil and gas industry. The latter is a vertically integrated provider of solar energy panels. The acquisition of a leading nationwide solar-panel installation company allowed SunPower to dramatically increase distribution and sales.
Other energy and industrial holdings in the portfolio did not fare so well. However, we believe the issues affecting them will be resolved relatively soon.
Kirk J. Kim
Peter O. Lopez
Co-Portfolio Managers
Transamerica Investment Management, LLC
22
(unaudited)
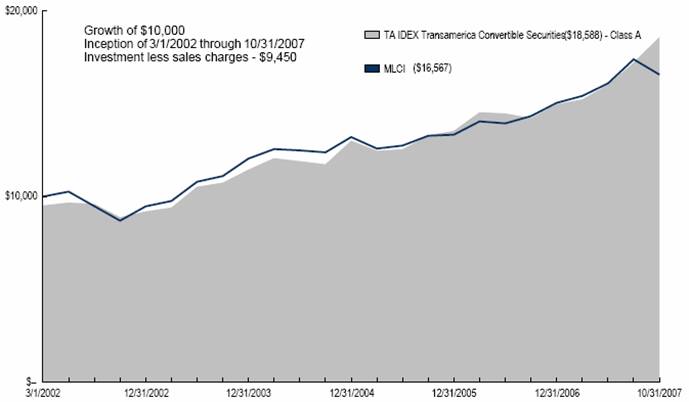
Average Annual Total Return for Periods Ended 10/31/2007
| | | | | | From | | Inception | |
| | 1 Year | | 5 Years | | Inception | | Date | |
Class A (NAV) | | 27.41 | % | 15.59 | % | 12.51 | % | 3/1/02 | |
Class A (POP) | | 21.32 | % | 14.47 | % | 11.55 | % | 3/1/02 | |
MLCI (1) | | 12.73 | % | 13.23 | % | 9.49 | % | 3/1/02 | |
| | | | | | | | | |
Class B (NAV) | | 26.54 | % | 14.77 | % | 11.75 | % | 3/1/02 | |
Class B (POP) | | 21.54 | % | 14.65 | % | 11.75 | % | 3/1/02 | |
| | | | | | | | | |
Class C (NAV) | | 26.69 | % | — | % | 14.87 | % | 11/11/02 | |
Class C (POP) | | 25.69 | % | — | % | 14.87 | % | 11/11/02 | |
| | | | | | | | | |
Class I (NAV) | | 28.10 | % | — | % | 19.80 | % | 11/15/05 | |
NOTES
(1) The Merrill Lynch All U.S. Convertibles (MLCI) Index is an unmanaged index used as a general measure of market performance. Calculations assume dividends and capital gains are reinvested and do not include any managerial expenses. From inception calculation is based on life of Class A shares.
The performance data presented represents past performance, future results may vary. Performance data does not reflect the deduction of taxes that would be paid on fund distributions nor the redemption of fund shares. Investment return and principal value will fluctuate so that an investor’s shares, when redeemed, may be worth more or less than their original cost.
Current performance may be lower or higher than performance quoted. Please see www.transamericaidex.com for performance data current to the most recent month-end.
Public Offering Price (POP) returns include the reinvestment of dividends and capital gains and reflect the maximum sales charge of 4.75% for A shares or the maximum applicable contingent deferred sales charge (5% in the 1st year, decreasing to 0% after 6 years) for Class B shares and 1% (during the first 12 months) for Class C shares. Shares purchased prior to March 1, 2004 are subject to a maximum applicable contingent deferred sales charge (5% in the 1st year, decreasing to 0% after 7 years) for Class B shares and (2% in the 1st year, decreasing to 0% after 2 years) for Class C shares. Net Asset Value (NAV) returns include the reinvestment of dividends and capital gains but do not reflect any sales charges.
This material must be preceded or accompanied by a current prospectus, which includes specific contents regarding the investment objectives and policies of this Fund.
23
UNDERSTANDING YOUR FUND’S EXPENSES
(unaudited)
SHAREHOLDER EXPENSES
Fund shareholders may incur two types of costs: (1) transaction costs, including sales charges (loads) on purchases, contingent deferred sales charges on redemptions and redemption fees; and (2) ongoing costs, including management fees, 12b-1 distribution and service fees, and other fund expenses.
The following Example is intended to help you understand your ongoing costs (in dollars and cents) of investing in the Fund and to compare these costs with the ongoing costs of investing in other funds.
The Example is based on an investment of $1,000 invested at May 1, 2007 and held for the entire period until October 31, 2007.
ACTUAL EXPENSES
The first line in the table below provides information about actual account values and actual expenses. You may use the information in this line, together with the amount you invested, to estimate the expenses that you paid over the period. Simply divide your account value by $1,000 (for example, an $8,600 account value divided by $1,000 = 8.6), then multiply the result by the number in the first line of your Fund under the heading entitled “Expenses Paid During Period” to estimate the expenses you paid on your account during this period. If your account is an IRA, your expenses could have included a $15 annual fee. The amount of any fee paid through your account would increase the estimate of expenses you paid during the period and decrease your ending account value.
HYPOTHETICAL EXAMPLE FOR COMPARISON PURPOSES
The second line in the table below provides information about hypothetical account values and hypothetical expenses based on the Fund’s actual expense ratio and an assumed rate of return of 5% per year before expenses, which is not the Fund’s actual return. The hypothetical account values and expenses may not be used to estimate the actual ending account balance or expenses you paid for the period. You may use this information to compare the ongoing costs of investing in your Fund and other funds. To do so, compare this 5% hypothetical example with the 5% hypothetical examples that appear in the shareholder reports of the other funds. As in the case of the actual expense example, if your account is subject to an IRA fee, the amount of the fee paid through your account would increase the hypothetical expenses you would have paid during the period and decrease the hypothetical ending account value.
Please note that the expenses shown in the table are meant to highlight your ongoing costs only and do not reflect any transactional costs, such as sales charges, redemption fees, brokerage commissions paid on purchases and sales of fund shares. Therefore, the second line under the Fund in the table is useful in comparing ongoing costs only, and will not help you determine the relative total costs of owning different funds. If any of these transaction costs were included, your costs would be higher. The expenses shown in the table do not reflect any fees that may be charged to you by brokers, financial intermediaries or other financial institutions.
| | Beginning
Account
Value | | Ending
Account
Value | | Annualized
Expense
Ratio | | Expenses
Paid During
Period (a) | |
Class A | | | | | | | | | |
Actual | | $ | 1,000.00 | | $ | 1,206.99 | | 1.33 | % | $ | 7.38 | |
Hypothetical (b) | | 1,000.00 | | 1,018.45 | | 1.33 | | 6.75 | |
| | | | | | | | | |
Class B | | | | | | | | | |
Actual | | 1,000.00 | | 1,203.19 | | 1.98 | | 10.99 | |
Hypothetical (b) | | 1,000.00 | | 1,015.16 | | 1.98 | | 10.06 | |
| | | | | | | | | |
Class C | | | | | | | | | |
Actual | | 1,000.00 | | 1,203.16 | | 1.94 | | 10.79 | |
Hypothetical (b) | | 1,000.00 | | 1,015.34 | | 1.94 | | 9.87 | |
| | | | | | | | | |
Class I | | | | | | | | | |
Actual | | 1,000.00 | | 1,209.77 | | 0.83 | | 4.62 | |
Hypothetical (b) | | 1,000.00 | | 1,020.95 | | 0.83 | | 4.23 | |
| | | | | | | | | | | | |
(a) | Expenses are calculated using the Fund’s annualized expense ratio (as disclosed in the table), multiplied by the average account value for the period, multiplied by the number of days in the period (184 days), and divided by the number of days in the year (365 days). |
| |
(b) | 5% return per year before expenses. |
GRAPHICAL PRESENTATION OF SCHEDULE OF INVESTMENTS
By Sector
At October 31, 2007

This chart shows the percentage breakdown by sector of the Fund’s total investment securities.
24
SCHEDULE OF INVESTMENTS
At October 31, 2007
(all amounts except share amounts in thousands)
| | | | Shares | | Value | |
CONVERTIBLE PREFERRED STOCKS (9.2%) | | | | | | | |
Automobiles (2.2%) | | | | | | | |
General Motors Corp., Convertible ‡ | | | | 145,000 | | $ | 3,716 | |
Capital Markets (2.1%) | | | | | | | |
Credit Suisse First Boston USA, Inc. Convertible ‡ | | | | 36,010 | | 3,624 | |
Chemicals (1.6%) | | | | | | | |
Celanese Corp., Convertible | | | | | | | |
4.25%, due 02/01/2010 ‡, Ž | | | | 49,700 | | 2,671 | |
Insurance (1.9%) | | | | | | | |
MetLife, Inc., Convertible ‡ | | | | 94,770 | | 3,187 | |
Oil, Gas & Consumable Fuels (0.8%) | | | | | | | |
Dune Energy, Inc. - 144A, Convertible | | | | | | | |
10.00%, due 12/01/2012 ‡, Ž | | | | 1,441 | | 1,383 | |
Pharmaceuticals (0.6%) | | | | | | | |
Schering-Plough , Convertible ‡ | | | | 4,150 | | 1,107 | |
Total Convertible Preferred Stocks (cost $11,447) | | | | | | 15,688 | |
| | | | | | | |
| | | | Principal | | Value | |
CONVERTIBLE BONDS (82.4%) | | | | | | | |
Aerospace & Defense (4.8%) | | | | | | | |
Alliant Techsystems, Inc., Convertible | | | | | | | |
2.75%, due 02/15/2024 | | | | $ | 3,305 | | $ | 4,776 | |
Lockheed Martin Corp., Convertible | | | | | | | |
5.31%, due 08/15/2033 * | | | | 2,170 | | 3,332 | |
Automobiles (3.5%) | | | | | | | |
Ford Motor Co., Convertible | | | | | | | |
4.25%, due 12/15/2036 | | | | 5,000 | | 5,987 | |
Biotechnology (2.2%) | | | | | | | |
Gilead Sciences, Inc., Convertible | | | | | | | |
0.63%, due 05/01/2013 | | | | 2,870 | | 3,810 | |
Capital Markets (13.1%) | | | | | | | |
BlackRock, Inc., Convertible | | | | | | | |
2.63%, due 02/15/2035 | | | | 2,250 | | 4,646 | |
Eksportfinans | | | | | | | |
0.25%, due 07/30/2014 | | | | 4,488 | | 4,645 | |
Goldman Sachs Group, Inc. (The) - 144A, Convertible | | | | | | | |
0.25%, due 01/25/2017 § | | | | 4,260 | | 7,700 | |
Lehman Brothers Holdings, Inc., Convertible | | | | | | | |
0.25%, due 12/12/2013 | | | | 4,680 | | 5,219 | |
Commercial Banks (7.7%) | | | | | | | |
Credit Suisse/New York NY Convertible | | | | | | | |
0.25%, due 04/21/2014 | | | | 2,800 | | 2,923 | |
Deutsche Bank AG/London - 144A, Convertible | | | | | | | |
0.25%, due 04/11/2013 § | | | | 1,700 | | 3,207 | |
Wachovia Bank NA - 144A, Convertible | | | | | | | |
0.25%, due 01/30/2014 § | | | | 2,880 | | 6,981 | |
Commercial Services & Supplies (1.4%) | | | | | | | |
Covanta Holding Corp., Convertible | | | | | | | |
1.00%, due 02/01/2027 | | | | $ | 2,125 | | $ | 2,343 | |
Computers & Peripherals (4.4%) | | | | | | | |
EMC CORP , Convertible | | | | | | | |
1.75%, due 12/01/2013 | | | | 4,417 | | 7,531 | |
Diversified Financial Services (5.2%) | | | | | | | |
Allegro Investment Corp. SA - 144A, Convertible | | | | | | | |
0.25%, due 06/06/2017 | | | | 3,108 | | 3,789 | |
WMT Debt Exchangeable Trust - 144A, Convertible | | | | | | | |
0.25%, due 05/02/2013 § | | | | 317 | | 5,071 | |
Electrical Equipment (3.4%) | | | | | | | |
Sunpower Corp., Convertible | | | | | | | |
1.25%, due 02/15/2027 | | | | 2,525 | | 5,719 | |
Electronic Equipment & Instruments (2.8%) | | | | | | | |
Itron, Inc., Convertible | | | | | | | |
2.50%, due 08/01/2026 | | | | 2,740 | | 4,805 | |
Energy Equipment & Services (4.1%) | | | | | | | |
Core Laboratories, LP , Convertible | | | | | | | |
0.25%, due 10/31/2011 ^ | | | | 2,444 | | 3,871 | |
Schlumberger, Ltd. , Convertible | | | | | | | |
2.13%, due 06/01/2023 | | | | 1,270 | | 3,068 | |
Health Care Equipment & Supplies (2.8%) | | | | | | | |
Inverness Medical Innovations, Inc. - 144A, Convertible | | | | | | | |
3.00%, due 05/15/2016 | | | | 3,400 | | 4,692 | |
Hotels, Restaurants & Leisure (0.9%) | | | | | | | |
Scientific Games Corp., Convertible | | | | | | | |
0.75 due 12/01/2024 (1) | | | | 1,120 | | 1,480 | |
IT Services (2.2%) | | | | | | | |
Verifone Holdings, Inc. - 144A, Convertible | | | | | | | |
1.38%, due 06/15/2012 | | | | 2,925 | | 3,729 | |
Machinery (2.3%) | | | | | | | |
Trinity Industries, Inc., Convertible | | | | | | | |
3.88%, due 06/01/2036 | | | | 3,807 | | 3,888 | |
Media (2.6%) | | | | | | | |
Lamar Advertising Co. Class B, Convertible | | | | | | | |
2.88%, due 12/31/2010 | | | | 3,608 | | 4,406 | |
Multiline Retail (1.7%) | | | | | | | |
Saks, Inc. Convertible Saks, Inc. | | | | | | | |
2.00%, due 03/15/2024 | | | | 1,590 | | 2,886 | |
Oil, Gas & Consumable Fuels (1.6%) | | | | | | | |
Chesapeake Energy Corp., Convertible | | | | | | | |
2.50%, due 05/15/2037 | | | | 2,510 | | 2,792 | |
Pharmaceuticals (2.4%) | | | | | | | |
Allergan, Inc./U.S. , Convertible | | | | | | | |
1.50%, due 04/01/2026 ^ | | | | 3,347 | | 4,000 | |
Real Estate Investment Trusts (2.8%) | | | | | | | |
BRE Properties, Inc., Convertible | | | | | | | |
4.13%, due 08/15/2026 ^ | | | | 2,460 | | 2,478 | |
The notes to the financial statements are an integral part of this report
25
| | | | Principal | | Value | |
Real Estate Investment Trusts (continued) | | | | | | | |
Vornado Realty Trust , Convertible | | | | | | | |
3.63%, due 11/15/2026 | | | | $ | 2,294 | | $ | 2,294 | |
Software (4.5%) | | | | | | | |
Informatica Corp., Convertible | | | | | | | |
3.00%, due 03/15/2026 | | | | 3,435 | | 3,774 | |
Macrovision Corp., Convertible | | | | | | | |
2.63%, due 08/15/2011 ^ | | | | 3,500 | | 3,833 | |
Specialty Retail (2.3%) | | | | | | | |
Penske Auto Group, Inc., Convertible | | | | | | | |
3.50%, due 04/01/2026 | | | | 3,515 | | 3,932 | |
Textiles, Apparel & Luxury Goods (1.8%) | | | | | | | |
Iconix Brand Group, Inc. - 144A, Convertible | | | | | | | |
1.88%, due 06/30/2012 | | | | 2,990 | | 3,136 | |
Wireless Telecommunication Services (1.9%) | | | | | | | |
NII Holdings, Inc., Convertible - 144A | | | | | | | |
2.75%, due 08/15/2025 | | | | 823 | | 1,127 | |
3.13%, due 06/15/2012 | | | | 2,304 | | 2,128 | |
Total Convertible Bonds (cost $108,607) | | | | | | 136,666 | |
Total Security Lending Collateral (cost $10,416) ± | | | | | | 10,416 | |
Total Investment Securities (cost $133,561) # | | | | | | $ | 166,102 | |
| | | | | | | | | |
NOTES TO SCHEDULE OF INVESTMENTS
^ | At October 31, 2007, all or a portion of this security is on loan (see Note 1). The value at October 31, 2007, of all securities on loan is $10,166. |
± | Cash collateral for the Repurchase Agreements, valued at $1,901, that serve as collateral for securities lending, are invested in corporate and government bonds with interest rates and maturity dates ranging from 0.00% - 8.125% and 11/14/2007 - 9/15/2037. |
* | Floating or variable rate note. Rate is listed as of October 31, 2007. |
§ | Illiquid |
‡ | Non Income Producing |
(1) | Step Up |
Ž | The security has a perpetual maturity. The date shown is the next call date. |
# | Aggregate cost for federal income tax purposes is $133,625. Aggregate gross unrealized appreciation for all securities in which there is an excess of value over tax cost and aggregate gross unrealized depreciation for all securities in which there is an excess of tax cost over value were $33,803 and $1,326, respectively. Net unrealized appreciation for tax purposes is $32,477. |
| |
DEFINITIONS: |
144A | 144A Securities are registered pursuant to Rule 144A of the Securities Act of 1933. These securities are deemed to be liquid for purposes of compliance limitations on holdings of illiquid securities and may be resold as transactions exempt from registration, normally to qualified institutional buyers. At October 31, 2007, these securities aggregated $41,816 or 24.60% of net assets of the Fund |
26
TA IDEX Transamerica Equity
MARKET ENVIRONMENT
U.S. equities overcame big challenges in the twelve months ended October 31, 2007, to generate strongly positive returns. The Standard and Poor’s 500 Composite Stock Index rose 14.56%, while the Russell 1000 Growth Index (“Russell 1000 Growth”) went up 19.23%.
Throughout the period, the market struggled against the implications of weakness in the U.S. housing market. Because losses in home equity influence the major engine of economic growth, consumer spending, the downturn raised concerns that the economy and corporate profits would deteriorate as well. Added to this were fears that escalating energy prices, rising defaults for low-quality (sub-prime) mortgages and a liquidity crisis in the debt markets would push interest rates higher, further undermining the prospects for housing.
These problems notwithstanding, economic growth and corporate earnings remained healthy, buoyed by a robust global economy and strong demand for U.S. exports. Other positives included growth in U.S. manufacturing, higher personal incomes, brisk spending on commercial construction and late-period interest-rate cuts by the Federal Reserve Board. In the end, these factors outweighed the housing and debt-market issues. With the exception of sectors highly vulnerable to those issues (e.g., financial services), the market finished the period with solid gains.
PERFORMANCE
For the year ended October 31, 2007, TA IDEX Transamerica Equity, Class A returned 22.79%. By comparison its benchmark, the Russell 1000 Growth, returned 19.23%. For the year ended October 31, 2007, the Fund’s net expense ratios for Class A, Class B, Class C, Class I, and Class T were 1.40%, 2.17%, 2.07%, 0.78%, and 0.91%, respectively.
STRATEGY REVIEW
We invest in large companies that we believe have capable management teams, stable balance sheets and highly competitive positions and stand to benefit from long-term secular trends. Chief among those trends is robust global economic growth, which has boosted worldwide business spending on infrastructure and manufacturing capacity as well as consumer spending on leisure activities and personal technology. Because many of the companies that meet these parameters are industrial, technology and consumer businesses, the portfolio was overweighted in those sectors.
The largest contributions to total return were Apple Inc. (“Apple”), Research in Motion Limited (“RIMM”) and Jacobs Engineering Group Inc. (“Jacobs”).
Apple was already the dominant competitor in the personal music player (i.e., iPod) business when the period began, with a reputation for creating user-friendly devices. Expanding on that reputation, it launched the iPhone (an all-in-one camera phone, iPod and wireless e-mail tool) in late June. Likewise, RIMM, maker of the BlackBerry personal communication devices, successfully expanded its well-established business product line and introduced products for consumers. Jacobs designs and constructs major infrastructure projects and manufacturing facilities worldwide. Its cost-effective business model helped the company win major new contracts during the period.
These gains were partially countered by setbacks for McGraw-Hill Companies Inc. (“McGraw-Hill”), which is the parent company of debt-rating agency Standard & Poor’s Corporation (“Standard & Poor’s”); and for several consumer companies (e.g., Whole Foods Markets, Inc. (“Whole Foods”), Starbucks Corporation (“Starbucks”) and Nordstrom, Inc. (“Nordstrom”)). Earnings at these companies remained healthy. Nevertheless, their stock prices fell as investors worried that the credit-and-housing crisis would negatively affect bond market activity (a factor for Standard & Poor’s) and consumer spending (a potential issue for the others). We believe McGraw-Hill will recover as the credit crisis is resolved and also believe that high-end consumers will continue to support Nordstrom. We exited Starbucks and Whole Foods, which are involved in costly, margin-squeezing expansions.
Gary U. Rollé, CFA
Fund Manager
Transamerica Investment Management, LLC
27
(unaudited)
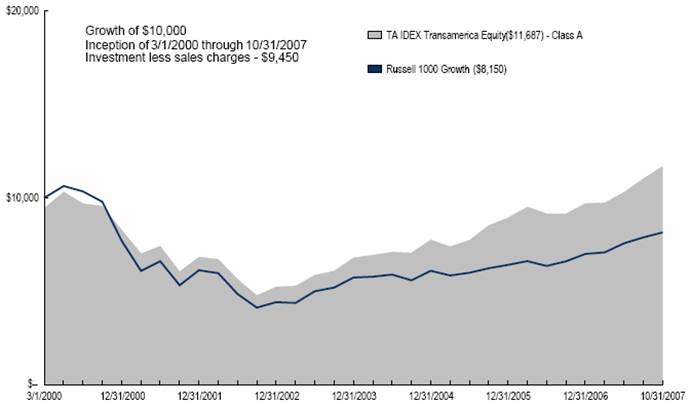
Average Annual Total Return for Periods Ended 10/31/2007
| | | | | | From | | Inception | |
| | 1 Year | | 5 Years | | Inception | | Date | |
Class A (NAV) | | 22.79 | % | 17.50 | % | 2.81 | % | 3/1/00 | |
Class A (POP) | | 16.06 | % | 16.19 | % | 2.05 | % | 3/1/00 | |
Russell 1000 Growth(1) | | 19.23 | % | 12.61 | % | (2.53 | )% | 3/1/00 | |
| | | | | | | | | |
Class B (NAV) | | 21.82 | % | 16.68 | % | 2.04 | % | 3/1/00 | |
Class B (POP) | | 16.82 | % | 16.57 | % | 2.04 | % | 3/1/00 | |
| | | | | | | | | |
Class C (NAV) | | 21.88 | % | — | % | 17.28 | % | 11/11/02 | |
Class C (POP) | | 20.88 | % | — | % | 17.28 | % | 11/11/02 | |
| | | | | | | | | |
Class I (NAV) | | 23.54 | % | — | % | 16.29 | % | 11/15/05 | |
| | | | | | | | | |
Class T (NAV) | | 23.36 | % | — | % | 23.37 | % | 10/27/06 | |
Class T (POP) | | 12.90 | % | — | % | 23.37 | % | 10/27/06 | |
NOTES
(1) The Russell 1000 Growth (Russell 1000 Growth) Index is an unmanaged index used as a general measure of market performance. Calculations assume dividends and capital gains are reinvested and do not include any managerial expenses. From inception calculation is based on life of Class A shares.
The performance data presented represents past performance, future results may vary. Performance data does not reflect the deduction of taxes that would be paid on fund distributions nor the redemption of fund shares. Investment return and principal value will fluctuate so that an investor’s shares, when redeemed, may be worth more or less than their original cost.
Current performance may be lower or higher than performance quoted. Please see www.transamericaidex.com for performance data current to the most recent month-end.
Public Offering Price (POP) returns include the reinvestment of dividends and capital gains and reflect the maximum sales charge of 5.5% for A shares or the maximum applicable contingent deferred sales charge (5% in the 1st year, decreasing to 0% after 6 years) for Class B shares and 1% (during the first 12 months) for Class C shares. Shares purchased prior to March 1, 2004 are subject to a maximum applicable contingent deferred sales charge (5% in the 1st year, decreasing to 0% after 7 years) for Class B shares and (2% in the 1st year, decreasing to 0% after 2 years) for Class C shares. Net Asset Value (NAV) returns include the reinvestment of dividends and capital gains but do not reflect any sales charges.
This material must be preceded or accompanied by a current prospectus, which includes specific contents regarding the investment objectives and policies of this Fund. Effective October 27, 2006, TA IDEX Great Companies-America and TA IDEX Janus Growth merged into the Fund.
The notes to the financial statements are an integral part of this report.
28
UNDERSTANDING YOUR FUND’S EXPENSES
(unaudited)
SHAREHOLDER EXPENSES
Fund shareholders may incur two types of costs: (1) transaction costs, including sales charges (loads) on purchases, contingent deferred sales charges on redemptions and redemption fees; and (2) ongoing costs, including management fees, 12b-1 distribution and service fees, and other fund expenses.
The following Example is intended to help you understand your ongoing costs (in dollars and cents) of investing in the Fund and to compare these costs with the ongoing costs of investing in other funds.
The Example is based on an investment of $1,000 invested at May 1, 2007 and held for the entire period until October 31, 2007.
ACTUAL EXPENSES
The first line in the table below provides information about actual account values and actual expenses. You may use the information in this line, together with the amount you invested, to estimate the expenses that you paid over the period. Simply divide your account value by $1,000 (for example, an $8,600 account value divided by $1,000 = 8.6), then multiply the result by the number in the first line of your Fund under the heading entitled “Expenses Paid During Period” to estimate the expenses you paid on your account during this period. If your account is an IRA, your expenses could have included a $15 annual fee. The amount of any fee paid through your account would increase the estimate of expenses you paid during the period and decrease your ending account value.
HYPOTHETICAL EXAMPLE FOR COMPARISON PURPOSES
The second line in the table below provides information about hypothetical account values and hypothetical expenses based on the Fund’s actual expense ratio and an assumed rate of return of 5% per year before expenses, which is not the Fund’s actual return. The hypothetical account values and expenses may not be used to estimate the actual ending account balance or expenses you paid for the period. You may use this information to compare the ongoing costs of investing in your Fund and other funds. To do so, compare this 5% hypothetical example with the 5% hypothetical examples that appear in the shareholder reports of the other funds. As in the case of the actual expense example, if your account is subject to an IRA fee, the amount of the fee paid through your account would increase the hypothetical expenses you would have paid during the period and decrease the hypothetical ending account value.
Please note that the expenses shown in the table are meant to highlight your ongoing costs only and do not reflect any transactional costs, such as sales charges, redemption fees, brokerage commissions paid on purchases and sales of fund shares. Therefore, the second line under the Fund in the table is useful in comparing ongoing costs only, and will not help you determine the relative total costs of owning different funds. If any of these transaction costs were included, your costs would be higher. The expenses shown in the table do not reflect any fees that may be charged to you by brokers, financial intermediaries or other financial institutions.
| | Beginning | | Ending | | Annualized | | Expenses | |
| | Account | | Account | | Expense | | Paid During | |
| | Value | | Value | | Ratio | | Period (a) | |
Class A | | | | | | | | | |
Actual | | $ | 1,000.00 | | $ | 1,172.99 | | 1.32 | % | $ | 7.21 | |
Hypothetical (b) | | 1,000.00 | | 1,018.50 | | 1.32 | | 6.70 | |
| | | | | | | | | |
Class B | | | | | | | | | |
Actual | | 1,000.00 | | 1,168.20 | | 2.07 | | 11.28 | |
Hypothetical (b) | | 1,000.00 | | 1,014.73 | | 2.07 | | 10.48 | |
| | | | | | | | | |
Class C | | | | | | | | | |
Actual | | 1,000.00 | | 1,168.88 | | 1.98 | | 10.79 | |
Hypothetical (b) | | 1,000.00 | | 1,015.18 | | 1.98 | | 10.03 | |
| | | | | | | | | |
Class I | | | | | | | | | |
Actual | | 1,000.00 | | 1,175.96 | | 0.76 | | 4.16 | |
Hypothetical (b) | | 1,000.00 | | 1,021.32 | | 0.76 | | 3.86 | |
| | | | | | | | | |
Class T | | | | | | | | | |
Actual | | 1,000.00 | | 1,175.26 | | 0.87 | | 4.76 | |
Hypothetical (b) | | 1,000.00 | | 1,020.76 | | 0.87 | | 4.42 | |
| | | | | | | | | | | | |
(a) | Expenses are calculated using the Fund’s annualized expense ratio (as disclosed in the table), multiplied by the average account value for the period, multiplied by the number of days in the period (184 days), and divided by the number of days in the year (365 days). |
| |
(b) | 5% return per year before expenses. |
GRAPHICAL PRESENTATION OF SCHEDULE OF INVESTMENTS
By Sector
At October 31, 2007
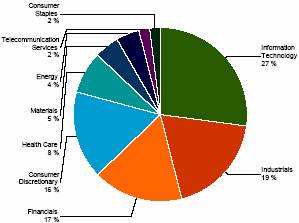
This chart shows the percentage breakdown by sector of the Fund’s total investment securities.
The notes to the financial statements are an integral part of this report.
29
SCHEDULE OF INVESTMENTS
At October 31, 2007
(all amounts except share amounts in thousands)
| | | | Shares | | Value | |
COMMON STOCKS (97.8%) | | | | | | | |
Aerospace & Defense (3.6%) | | | | | | | |
Boeing Co. | | | | 430,200 | | $ | 42,414 | |
Raytheon Co. | | | | 420,000 | | 26,716 | |
Air Freight & Logistics (2.5%) | | | | | | | |
Expeditors International Washington | | | | 927,000 | | 46,953 | |
Auto Components (3.2%) | | | | | | | |
Johnson Controls, Inc. | | | | 1,380,000 | | 60,334 | |
Automobiles (2.9%) | | | | | | | |
Daimler AG ^ | | | | 505,100 | | 55,637 | |
Biotechnology (2.2%) | | | | | | | |
Gilead Sciences, Inc. ‡ | | | | 920,000 | | 42,495 | |
Capital Markets (5.6%) | | | | | | | |
Ameriprise Financial, Inc. | | | | 800,000 | | 50,384 | |
State Street Corp. | | | | 705,000 | | 56,238 | |
Chemicals (4.5%) | | | | | | | |
Praxair, Inc. | | | | 1,000,000 | | 85,480 | |
Communications Equipment (6.8%) | | | | | | | |
Qualcomm, Inc. | | | | 865,000 | | 36,961 | |
Research In Motion, Ltd. ‡ | | | | 735,000 | | 91,515 | |
Computers & Peripherals (8.3%) | | | | | | | |
Apple, Inc. ‡ | | | | 830,000 | | 157,658 | |
Construction & Engineering (4.6%) | | | | | | | |
Jacobs Engineering Group, Inc. ‡ | | | | 991,700 | | 86,427 | |
Consumer Finance (3.1%) | | | | | | | |
American Express Co. | | | | 950,000 | | 57,902 | |
Diversified Financial Services (5.2%) | | | | | | | |
CME Group, Inc. Class A ^ | | | | 148,000 | | 98,605 | |
Diversified Telecommunication Services (2.0%) | | | | | | | |
AT&T, Inc. | | | | 900,000 | | 37,611 | |
Electronic Equipment & Instruments (2.5%) | | | | | | | |
Tyco Electronics, Ltd. | | | | 1,320,000 | | 47,084 | |
Energy Equipment & Services (2.3%) | | | | | | | |
Schlumberger, Ltd. | | | | 448,000 | | 43,263 | |
Food & Staples Retailing (1.9%) | | | | | | | |
Walgreen Co. | | | | 917,000 | | $ | 36,359 | |
Health Care Equipment & Supplies (2.4%) | | | | | | | |
Varian Medical Systems, Inc. ‡ | | | | 554,225 | | 27,030 | |
Zimmer Holdings, Inc. ‡ | | | | 270,000 | | 18,762 | |
Hotels, Restaurants & Leisure (5.0%) | | | | | | | |
Las Vegas Sands Corp. ‡ | | | | 83,000 | | 11,015 | |
Marriott International, Inc. Class A | | | | 1,040,000 | | 42,755 | |
MGM Mirage, Inc. ‡ | | | | 444,190 | | 40,692 | |
Industrial Conglomerates (2.9%) | | | | | | | |
General Electric Co. | | | | 1,329,200 | | 54,710 | |
Insurance (2.6%) | | | | | | | |
American International Group, Inc. | | | | 770,000 | | 48,602 | |
Internet Software & Services (4.1%) | | | | | | | |
Google, Inc. Class A ‡ | | | | 110,000 | | 77,770 | |
Machinery (4.9%) | | | | | | | |
Caterpillar, Inc. | | | | 650,000 | | 48,496 | |
PACCAR, Inc. | | | | 810,000 | | 45,004 | |
Media (3.3%) | | | | | | | |
McGraw-Hill Cos., Inc. (The) | | | | 1,250,000 | | 62,550 | |
Multiline Retail (1.6%) | | | | | | | |
Nordstrom, Inc. | | | | 770,000 | | $ | 30,369 | |
Oil, Gas & Consumable Fuels (2.0%) | | | | | | | |
Suncor Energy, Inc. | | | | 340,000 | | 37,138 | |
Pharmaceuticals (3.0%) | | | | | | | |
Allergan, Inc. | | | | 850,000 | | 57,443 | |
Software (4.8%) | | | | | | | |
Electronic Arts, Inc. ‡ | | | | 770,000 | | 47,062 | |
Microsoft Corp. | | | | 1,200,000 | | 44,172 | |
Total Common Stocks (cost $1,338,419) | | | | | | 1,853,606 | |
Total Security Lending Collateral (cost $82,379) ± | | | | | | 82,379 | |
Total Investment Securities (cost $1,420,798) # | | | | | | $ | 1,935,985 | |
NOTES TO SCHEDULE OF INVESTMENTS |
^ | At October 31, 2007, all or a portion of this security is on loan (see Note 1). The value at October 31, 2007, of all securities on loan is $80,483. |
± | Cash collateral for the Repurchase Agreements, valued at $15,035, that serve as collateral for securities lending, are invested in corporate and government bonds with interest rates and maturity dates ranging from 0.00% - 8.125% and 11/14/2007 - 9/15/2037. |
‡ | Non Income Producing |
# | Aggregate cost for federal income tax purposes is $1,424,187. Aggregate gross unrealized appreciation for all securities in which there is an excess of value over tax cost and aggregate gross unrealized depreciation for all securities in which there is an excess of tax cost over value were $547,551 and $32,364, respectively. Net unrealized appreciation for tax purposes is $515,187. |
The notes to the financial statements are an integral part of this report.
30
TA IDEX Transamerica Flexible Income
MARKET ENVIRONMENT
During the twelve months ended October 31, 2007, the Lehman Brothers U.S. Government/Credit Bond Index (“LBGC”) returned 5.37% as the economic and market environment changed dramatically.
Initially, the economic and investment backdrops were stable, and high levels of global liquidity helped to maintain prices for most asset classes. The notable exception was U.S. residential real estate, where higher interest rates from adjustable-rate mortgage resets, overbuilding and rising defaults for low-quality (sub-prime) mortgages created a buyers’ market and falling prices.
The pace of defaults rose sharply by summer, sparking concerns that housing would deteriorate further and have a spillover effect on consumer spending, which serves as a major driver of economic growth. Housing continued its downward slide while investors, perceiving more risk to the economy and corporate profits going forward, demanded higher yields on all non-government securities, not just mortgage securities, and increasingly withdrew support from the markets. In the absence of willing buyers, the turmoil expanded into a more serious liquidity crisis. As the crisis worsened between August and October, the Federal Reserve Board (“Fed”) intervened, reducing the discount and federal funds rates, 1.25% and 0.75%, respectively, to restore confidence.
Against this backdrop, U.S. Treasury yields declined, especially for the shortest-term securities, and the yield curve steepened. U.S. Treasury securities outperformed other sectors (corporate bonds and mortgage-backed securities). However, within the corporate realm, high-yield bonds fared better than investment grade, reflecting relatively strong results earlier in the period.
PERFORMANCE
For the year ended October 31, 2007, TA IDEX Transamerica Flexible Income, Class A returned 2.42%. By comparison its benchmark, the LBGC, returned 5.37%. For the year ended October 31, 2007, the Fund’s net expense ratios for Class A, Class B, Class C, and Class I were 1.40%, 2.04%, 2.00%, and 0.80%, respectively.
STRATEGY REVIEW
We attribute the portfolio’s positive but lagging returns to our emphasis on the non-government sectors, which provide higher yields than Treasuries. In keeping with the portfolio’s income objective, we invest primarily in corporate bonds, generally allocate approximately 25% to 30% of assets to high-yield bonds and invest selectively in asset-backed securities.
This positioning worked relatively well in the initial months of the period, when the stable economy and favorable corporate earnings environment led the corporate and high-yield sectors to outperform Treasuries. Within the investment-grade corporate portfolio, we overweighted the securities of large depository institutions (e.g., banks) because they appeared less likely to be purchased in a leverage buyout. (Such buyouts usually result in much higher debt for a company and lower credit quality.)
Among high-yield bonds, we favored securities from energy and retail companies. We maintained an average quality of B while capturing additional yield from a carefully picked selection of CCC-rated bonds. Later, anticipating that risk aversion would spread from mortgages to other areas of the market, we reduced overall portfolio risk by trading some of these CCC securities for BB-rated bonds.
As for our asset-backed holdings, we had no exposure to sub-prime residential mortgages. However, we did have modest exposure to commercial mortgage-backed securities (“CMBS”), which underperformed U.S. Treasuries. Commercial real estate fundamentals remain solid, in contrast to residential real estate, and CMBS have not experienced the same slippage in underwriting and rating standards.
Once the Fed intervened and the market began to settle, we took advantage of the generally lower prices for non-government bonds, buying corporate and high-yields that we believe will likely perform well as the market continues to recover.
Heidi Y. Hu, CFA
Peter O. Lopez
Brian W. Westhoff, CFA
Co-Portfolio Managers
Transamerica Investment Management, LLC
31
(unaudited)
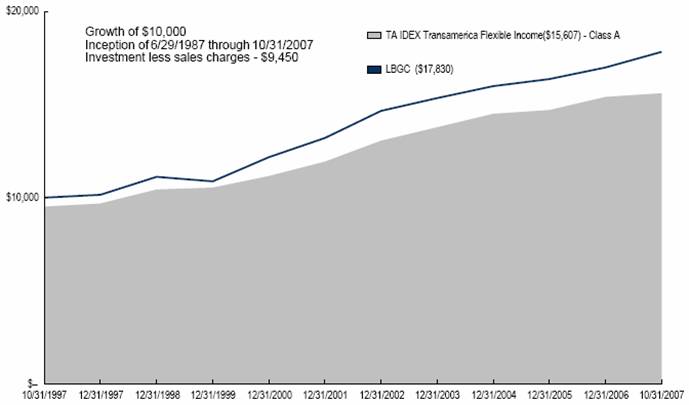
Average Annual Total Return for Periods Ended 10/31/2007
| | | | | | | | From | | Inception | |
| | 1 Year | | 5 Years | | 10 Years | | Inception | | Date | |
Class A (NAV) | | 2.42 | % | 4.04 | % | 5.07 | % | 6.82 | % | 6/29/87 | |
Class A (POP) | | (2.47 | )% | 3.03 | % | 4.55 | % | 6.57 | % | 6/29/87 | |
LBGC (1) | | 5.37 | % | 4.55 | % | 5.95 | % | 7.47 | % | 6/29/87 | |
| | | | | | | | | | | |
Class B (NAV) | | 1.66 | % | 3.34 | % | 4.49 | % | 5.39 | | 10/1/95 | |
Class B (POP) | | (3.20 | )% | 3.18 | % | 4.49 | % | 5.39 | | 10/1/95 | |
| | | | | | | | | | | |
Class C (NAV) | | 1.81 | % | — | % | — | % | 3.26 | | 11/11/02 | |
Class C (POP) | | 0.83 | % | — | % | — | % | 3.26 | | 11/11/02 | |
| | | | | | | | | | | |
Class I (NAV) | | 2.93 | % | — | % | — | % | 3.27 | | 11/8/04 | |
NOTES
(1) The Lehman Brothers U.S. Government/Credit Bond(LBGC) Index is an unmanaged index used as a general measure of market performance. Calculations assume dividends and capital gains are reinvested and do not include any managerial expenses. From inception calculation is based on life of Class A shares.
The performance data presented represents past performance, future results may vary. Performance data does not reflect the deduction of taxes that would be paid on fund distributions nor the redemption of fund shares. Investment return and principal value will fluctuate so that an investor’s shares, when redeemed, may be worth more or less than their original cost.
Current performance may be lower or higher than performance quoted. Please see www.transamericaidex.com for performance data current to the most recent month-end.
Public Offering Price (POP) returns include the reinvestment of dividends and capital gains and reflect the maximum sales charge of 4.75% for A shares or the maximum applicable contingent deferred sales charge (5% in the 1st year, decreasing to 0% after 6 years) for Class B shares and 1% (during the first 12 months) for Class C shares. Shares purchased prior to March 1, 2004 are subject to a maximum applicable contingent deferred sales charge (5% in the 1st year, decreasing to 0% after 7 years) for Class B shares and (2% in the 1st year, decreasing to 0% after 2 years) for Class C shares. Net Asset Value (NAV) returns include the reinvestment of dividends and capital gains but do not reflect any sales charges.
This material must be preceded or accompanied by a current prospectus, which includes specific contents regarding the investment objectives and policies of this Fund.
32
UNDERSTANDING YOUR FUND’S EXPENSES
(unaudited)
SHAREHOLDER EXPENSES
Fund shareholders may incur two types of costs: (1) transaction costs, including sales charges (loads) on purchases, contingent deferred sales charges on redemptions and redemption fees; and (2) ongoing costs, including management fees, 12b-1 distribution and service fees, and other fund expenses.
The following Example is intended to help you understand your ongoing costs (in dollars and cents) of investing in the Fund and to compare these costs with the ongoing costs of investing in other funds.
The Example is based on an investment of $1,000 invested at May 1, 2007 and held for the entire period until October 31, 2007.
ACTUAL EXPENSES
The first line in the table below provides information about actual account values and actual expenses. You may use the information in this line, together with the amount you invested, to estimate the expenses that you paid over the period. Simply divide your account value by $1,000 (for example, an $8,600 account value divided by $1,000 = 8.6), then multiply the result by the number in the first line of your Fund under the heading entitled “Expenses Paid During Period” to estimate the expenses you paid on your account during this period. If your account is an IRA, your expenses could have included a $15 annual fee. The amount of any fee paid through your account would increase the estimate of expenses you paid during the period and decrease your ending account value.
HYPOTHETICAL EXAMPLE FOR COMPARISON PURPOSES
The second line in the table below provides information about hypothetical account values and hypothetical expenses based on the Fund’s actual expense ratio and an assumed rate of return of 5% per year before expenses, which is not the Fund’s actual return. The hypothetical account values and expenses may not be used to estimate the actual ending account balance or expenses you paid for the period. You may use this information to compare the ongoing costs of investing in your Fund and other funds. To do so, compare this 5% hypothetical example with the 5% hypothetical examples that appear in the shareholder reports of the other funds. As in the case of the actual expense example, if your account is subject to an IRA fee, the amount of the fee paid through your account would increase the hypothetical expenses you would have paid during the period and decrease the hypothetical ending account value.
Please note that the expenses shown in the table are meant to highlight your ongoing costs only and do not reflect any transactional costs, such as sales charges, redemption fees, brokerage commissions paid on purchases and sales of fund shares. Therefore, the second line under the Fund in the table is useful in comparing ongoing costs only, and will not help you determine the relative total costs of owning different funds. If any of these transaction costs were included, your costs would be higher. The expenses shown in the table do not reflect any fees that may be charged to you by brokers, financial intermediaries or other financial institutions.
| | Beginning | | Ending | | Annualized | | Expenses | |
| | Account | | Account | | Expense | | Paid During | |
| | Value | | Value | | Ratio | | Period (a) | |
Class A | | | | | | | | | |
Actual | | $ | 1,000.00 | | $ | 987.81 | | 1.36 | % | $ | 6.83 | |
Hypothetical (b) | | 1,000.00 | | 1,018.26 | | 1.36 | | 6.94 | |
| | | | | | | | | |
Class B | | | | | | | | | |
Actual | | 1,000.00 | | 983.45 | | 2.01 | | 10.04 | |
Hypothetical (b) | | 1,000.00 | | 1,015.01 | | 2.01 | | 10.20 | |
| | | | | | | | | |
Class C | | | | | | | | | |
Actual | | 1,000.00 | | 984.63 | | 1.98 | | 9.89 | |
Hypothetical (b) | | 1,000.00 | | 1,015.17 | | 1.98 | | 10.04 | |
| | | | | | | | | |
Class I | | | | | | | | | |
Actual | | 1,000.00 | | 989.66 | | 0.79 | | 3.96 | |
Hypothetical (b) | | 1,000.00 | | 1,021.15 | | 0.79 | | 4.03 | |
| | | | | | | | | | | | |
(a) | Expenses are calculated using the Fund’s annualized expense ratio (as disclosed in the table), multiplied by the average account value for the period, multiplied by the number of days in the period (184 days), and divided by the number of days in the year (365 days). |
| |
(b) | 5% return per year before expenses. |
GRAPHICAL PRESENTATION OF SCHEDULE OF INVESTMENTS
By Asset Type
At October 31, 2007
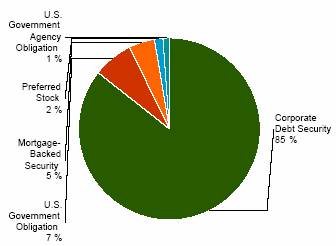
This chart shows the percentage breakdown by asset type of the Fund’s total investment securities.
33
SCHEDULE OF INVESTMENTS
At October 31, 2007
(all amounts except share amounts in thousands)
| | | | Principal | | Value | |
U.S. GOVERNMENT OBLIGATIONS (6.9%) | | | | | | | |
U.S. Treasury Bond | | | | | | | |
4.75%, due 02/15/2037 ^ | | | | $ | 1,010 | | $ | 1,009 | |
U.S. Treasury Note | | | | | | | |
4.13%, due 08/31/2012 ^ | | | | 11,700 | | 11,688 | |
4.25%, due 11/15/2013 ^ | | | | 2,175 | | 2,178 | |
4.75%, due 08/15/2017 ^ | | | | 3,542 | | 3,620 | |
4.88%, due 06/30/2012 ^ | | | | 9,740 | | 10,041 | |
Total U.S. Government Obligations (cost $28,246) | | | | | | 28,536 | |
| | | | | | | |
U.S. GOVERNMENT AGENCY OBLIGATIONS (1.1%) | | | | | | | |
Freddie Mac | | | | | | | |
5.50%, due 01/15/2029 | | | | 4,500 | | 4,537 | |
Total U.S. Government Agency Obligations (cost $4,423) | | | | | | 4,537 | |
| | | | | | | |
MORTGAGE-BACKED SECURITIES (4.4%) | | | | | | | |
American Tower Trust | | | | | | | |
Series 2007-1A, Class C- 144a | | | | | | | |
5.62%, due 04/15/2037 | | | | 3,590 | | 3,466 | |
Citigroup/Deutsche Bank Commercial Mortgage Trust | | | | | | | |
Series 2007-CD4, Class J- 144a | | | | | | | |
5.69%, due 12/11/2049 | | | | 4,750 | | 3,620 | |
Crown Castle Towers LLC | | | | | | | |
5.47%, due 11/15/2036 | | | | 3,300 | | 3,298 | |
SBA CMBS Trust - 144a | | | | | | | |
6.17%, due 11/15/2036 | | | | 1,460 | | 1,428 | |
SBA CMBS Trust | | | | | | | |
Series 2006-1A, Class D- 144a | | | | | | | |
5.85%, due 11/15/2036 | | | | 3,254 | | 3,172 | |
Wachovia Bank Commercial Mortgage Trust | | | | | | | |
Series 2006-C28, Class H- 144a | | | | | | | |
6.16%, due 10/15/2048 | | | | 3,760 | | 3,357 | |
Total Mortgage-Backed Securities (cost $19,329) | | | | | | 18,341 | |
| | | | | | | |
CORPORATE DEBT SECURITIES (83.1%) | | | | | | | |
Aerospace & Defense (2.3%) | | | | | | | |
Boeing Co. (The) | | | | | | | |
8.75%, due 08/15/2021 | | | | 2,500 | | 3,215 | |
Embraer Overseas, Ltd. | | | | | | | |
6.38%, due 01/24/2017 | | | | 2,975 | | 2,908 | |
Honeywell International | | | | | | | |
5.63%, due 08/01/2012 | | | | 3,180 | | 3,265 | |
Air Freight & Logistics (0.9%) | | | | | | | |
FedEx Corp. | | | | | | | |
9.65%, due 06/15/2012 | | | | 3,200 | | 3,754 | |
Airlines (3.9%) | | | | | | | |
Continental Airlines, Inc. Class A | | | | | | | |
5.98%, due 04/19/2022 | | | | 2,000 | | 1,966 | |
6.90%, due 04/19/2022 | | | | 3,000 | | 2,827 | |
Delta Air Lines -07-1 - 144A | | | | | | | |
6.82%, due 08/10/2022 | | | | 3,000 | | 2,970 | |
Southwest Airlines Co. | | | | | | | |
6.65%, due 08/01/2022 | | | | $ | 3,825 | | $ | 3,844 | |
United Airlines, Inc. | | | | | | | |
6.64%, due 07/02/2022 | | | | 4,321 | | 4,278 | |
Automobiles (0.1%) | | | | | | | |
General Motors Corp. | | | | | | | |
7.13%, due 07/15/2013 ^ | | | | 225 | | 209 | |
Beverages (0.9%) | | | | | | | |
Brown-Forman Corp. | | | | | | | |
5.20%, due 04/01/2012 | | | | 3,600 | | 3,620 | |
Building Products (1.0%) | | | | | | | |
CRH America, Inc. | | | | | | | |
5.30%, due 10/15/2013 | | | | 3,140 | | 3,021 | |
Goodman Global Holdings, Inc. | | | | | | | |
7.88%, due 12/15/2012 | | | | 1,025 | | 1,071 | |
Capital Markets (1.8%) | | | | | | | |
Ameriprise Financial, Inc. | | | | | | | |
7.52%, due 06/01/2066 (1) | | | | 3,100 | | 3,168 | |
Lazard Group | | | | | | | |
7.13%, due 05/15/2015 | | | | 3,000 | | 3,040 | |
Nuveen Investments, Inc. | | | | | | | |
5.00%, due 09/15/2010 | | | | 1,195 | | 1,049 | |
Chemicals (2.3%) | | | | | | | |
Cytec Industries, Inc. | | | | | | | |
6.75%, due 03/15/2008 | | | | 2,700 | | 2,714 | |
Lubrizol Corp. | | | | | | | |
4.63%, due 10/01/2009 | | | | 2,000 | | 1,984 | |
Mosaic Co. (The) - 144A | | | | | | | |
7.625 due 12/01/2016 ^ (2) | | | | 1,500 | | 1,616 | |
Nalco Co. | | | | | | | |
7.75%, due 11/15/2011 | | | | 3,000 | | 3,053 | |
Commercial Banks (7.5%) | | | | | | | |
HBOS PLC - 144A | | | | | | | |
6.66%, due 11/21/2049 Ž, (1) | | | | 173 | | 154 | |
HSBC Capital Funding, LP/Jersey Channel Islands - 144A | | | | | | | |
9.55%, due 06/30/2010 Ž | | | | 1,500 | | 1,637 | |
ICICI Bank, Ltd. - 144A | | | | | | | |
6.63%, due 10/03/2012 | | | | 4,257 | | 4,290 | |
M&i Marshall & Ilsley Bank | | | | | | | |
5.85%, due 12/04/2012 * | | | | 4,860 | | 4,729 | |
PNC Preferred Funding Trust I - 144A | | | | | | | |
6.52%, due 03/15/2012 * Ž | | | | 4,000 | | 4,023 | |
Rabobank Capital Funding II - 144A | | | | | | | |
5.26%, due 12/31/2013 Ž | | | | 3,600 | | 3,444 | |
Shinsei Finance Cayman, Ltd. - 144A | | | | | | | |
6.42%, due 07/20/2016 Ž, (1) | | | | 2,300 | | 2,142 | |
VTB Capital SA for Vneshtorgbank - 144A | | | | | | | |
5.96%, due 08/01/2008 * | | | | 3,500 | | 3,465 | |
Wachovia Capital Trust III | | | | | | | |
5.80%, due 03/15/2011 Ž, (1) | | | | 4,100 | | 4,067 | |
ZFS Finance USA Trust I - 144A | | | | | | | |
6.15%, due 12/15/2065 | | | | 2,000 | | 1,985 | |
The notes to the financial statements are an integral part of this report.
34
| | | | Principal | | Value | |
Commercial Banks (continued) | | | | | | | |
ZFS Finance USA Trust II - 144A | | | | | | | |
6.45%, due 12/15/2065 (1) | | | | $ | 1,000 | | $ | 962 | |
Commercial Services & Supplies (0.5%) | | | | | | | |
FTI Consulting, Inc. | | | | | | | |
7.75%, due 10/01/2016 | | | | 1,900 | | 1,985 | |
Construction Materials (0.6%) | | | | | | | |
Lafarge SA | | | | | | | |
7.13%, due 07/15/2036 | | | | 2,600 | | 2,670 | |
Containers & Packaging (0.1%) | | | | | | | |
Graham Packaging Co., Inc. | | | | | | | |
9.88%, due 10/15/2014 ^ | | | | 625 | | 619 | |
Diversified Financial Services (5.6%) | | | | | | | |
Galaxy Entertainment Finance Co., Ltd. - 144A | | | | | | | |
9.88%, due 12/15/2012 | | | | 1,400 | | 1,502 | |
Glencore Funding LLC - 144A | | | | | | | |
6.00%, due 04/15/2014 | | | | 3,950 | | 3,965 | |
ILFC E-Capital Trust II - 144A | | | | | | | |
6.25%, due 12/21/2065 (1) | | | | 3,200 | | 3,140 | |
Mangrove Bay Pass-Through Trust - 144a | | | | | | | |
6.10%, due 07/15/2033 | | | | 2,845 | | 2,656 | |
Mizuho JGB Investment LLC | | | | | | | |
9.87%, due 06/30/2008 * Ž, (1) | | | | 3,200 | | 3,292 | |
MUFG Capital Finance 1, Ltd. | | | | | | | |
6.35%, due 07/25/2016 Ž, (1) | | | | 2,360 | | 2,250 | |
Pemex Finance, Ltd. | | | | | | | |
9.03%, due 02/15/2011 | | | | 4,445 | | 4,718 | |
SB Treasury Co. LLC - 144a | | | | | | | |
9.40%, due 12/29/2049 * Ž | | | | 1,470 | | 1,500 | |
Diversified Telecommunication Services (0.7%) | | | | | | | |
Verizon Global Funding Corp. | | | | | | | |
7.75%, due 12/01/2030 | | | | 2,455 | | 2,892 | |
Electric Utilities (3.4%) | | | | | | | |
DPL, Inc. | | | | | | | |
8.00%, due 03/31/2009 | | | | 5,000 | | 5,190 | |
PSEG Funding Trust I | | | | | | | |
5.38%, due 11/16/2007 | | | | 3,250 | | 3,249 | |
Sempra Energy | | | | | | | |
7.95%, due 03/01/2010 | | | | 4,260 | | 4,517 | |
Texas Competitive Electric Holdings Co. LLC - 144a | | | | | | | |
10.25%, due 11/01/2015 | | | | 900 | | 904 | |
Electrical Equipment (0.2%) | | | | | | | |
Belden, Inc. | | | | | | | |
7.00%, due 03/15/2017 | | | | 1,000 | | 1,015 | |
Energy Equipment & Services (0.4%) | | | | | | | |
Ocean RIG Norway As - 144a | | | | | | | |
8.38%, due 07/01/2013 | | | | 1,600 | | 1,636 | |
Food & Staples Retailing (0.5%) | | | | | | | |
Stater Brothers Holdings, Inc. | | | | | | | |
8.13%, due 06/15/2012 | | | | 2,000 | | 2,020 | |
Food Products (0.7%) | | | | | | | |
ConAgra Foods, Inc. | | | | | | | |
9.75%, due 03/01/2021 | | | | $ | 325 | | $ | 423 | |
Michael Foods, Inc. | | | | | | | |
8.00%, due 11/15/2013 | | | | 2,575 | | 2,575 | |
Gas Utilities (0.9%) | | | | | | | |
Intergas Finance BV - 144a | | | | | | | |
6.38%, due 05/14/2017 | | | | 740 | | 692 | |
Southern Union Co. | | | | | | | |
6.15%, due 08/16/2008 | | | | 2,975 | | 2,991 | |
Health Care Equipment & Supplies (0.1%) | | | | | | | |
Bausch & Lomb, Inc. - 144A | | | | | | | |
9.88%, due 11/01/2015 | | | | 375 | | 386 | |
Hotels, Restaurants & Leisure (5.6%) | | | | | | | |
Harrah’s Operating Co., Inc. | | | | | | | |
5.50%, due 07/01/2010 | | | | 3,450 | | 3,329 | |
Las Vegas Sands Corp. | | | | | | | |
6.38%, due 02/15/2015 | | | | 1,500 | | 1,457 | |
Royal Caribbean Cruises, Ltd. | | | | | | | |
8.75%, due 02/02/2011 | | | | 5,000 | | 5,333 | |
Starbucks Corp. | | | | | | | |
6.25%, due 08/15/2017 | | | | 3,720 | | 3,796 | |
Starwood Hotels & Resorts Worldwide, | | | | | | | |
7.88%, due 05/01/2012 | | | | 2,500 | | 2,664 | |
Station Casinos, Inc. | | | | | | | |
6.88%, due 03/01/2016 | | | | 2,700 | | 2,234 | |
Wyndham Worldwide Corp. | | | | | | | |
6.00%, due 12/01/2016 | | | | 4,270 | | 4,176 | |
Household Durables (1.0%) | | | | | | | |
Centex Corp. | | | | | | | |
4.75%, due 01/15/2008 | | | | 3,990 | | 3,964 | |
Independent Power Producers & Energy Traders (1.9%) | | | | | | | |
AES Corp. (The) - 144a | | | | | | | |
8.00%, due 10/15/2017 | | | | 2,125 | | 2,144 | |
AES Gener SA | | | | | | | |
7.50%, due 03/25/2014 | | | | 2,000 | | 2,083 | |
Empresa Nacional de Electricidad SA/Chile Class B | | | | | | | |
8.50%, due 04/01/2009 | | | | 3,600 | | 3,755 | |
Industrial Conglomerates (0.6%) | | | | | | | |
Susser Holdings LLC | | | | | | | |
10.63%, due 12/15/2013 | | | | 2,412 | | 2,508 | |
Insurance (2.2%) | | | | | | | |
Oil Insurance, Ltd. - 144a | | | | | | | |
7.56%, due 06/30/2011 * Ž, (1) | | | | 4,750 | | 4,882 | |
Reinsurance Group of America, Inc. | | | | | | | |
6.75%, due 12/15/2065 (1) | | | | 2,730 | | 2,596 | |
Travelers Cos., Inc. (The) | | | | | | | |
6.75%, due 06/20/2036 | | | | 1,557 | | 1,648 | |
IT Services (1.7%) | | | | | | | |
ACE Cash Express, Inc. - 144A | | | | | | | |
10.25%, due 10/01/2014 | | | | 690 | | 692 | |
Aramark Corp. | | | | | | | |
8.50%, due 02/01/2015 | | | | 2,250 | | 2,278 | |
The notes to the financial statements are an integral part of this report.
35
| | | | Principal | | Value | |
IT Services (continued) | | | | | | | |
Cardtronics, Inc. | | | | | | | |
9.25%, due 08/15/2013 | | | | $ | 835 | | $ | 806 | |
Western Union Co. (The) | | | | | | | |
5.93%, due 10/01/2016 | | | | 3,335 | | 3,314 | |
Machinery (2.0%) | | | | | | | |
Cummins, Inc. | | | | | | | |
5.65%, due 03/01/2098 | | | | 2,000 | | 1,527 | |
Polypore, Inc. | | | | | | | |
8.75%, due 05/15/2012 | | | | 1,550 | | 1,535 | |
Titan International, Inc. | | | | | | | |
8.00%, due 01/15/2012 | | | | 1,200 | | 1,200 | |
Tyco Electronics Group SA - 144a | | | | | | | |
6.55%, due 10/01/2017 | | | | 4,000 | | 4,082 | |
Marine (0.2%) | | | | | | | |
US Shipping Partners, LP/US Shipping | | | | | | | |
13.00%, due 08/15/2014 | | | | 925 | | 953 | |
Media (6.7%) | | | | | | | |
Amfm, Inc. | | | | | | | |
8.00%, due 11/01/2008 | | | | 3,695 | | 3,755 | |
Echostar DBS Corp. | | | | | | | |
7.13%, due 02/01/2016 | | | | 425 | | 444 | |
Grupo Televisa SA | | | | | | | |
6.63%, due 03/18/2025 | | | | 2,000 | | 2,070 | |
Historic Tw, Inc. | | | | | | | |
9.13%, due 01/15/2013 | | | | 5,000 | | 5,748 | |
McGraw-Hill Cos., Inc. | | | | | | | |
5.38%, due 11/15/2012 | | | | 3,295 | | 3,276 | |
News America Holdings, Inc. | | | | | | | |
7.75%, due 12/01/2045 | | | | 3,400 | | 3,859 | |
Omnicom Group, Inc. | | | | | | | |
5.90%, due 04/15/2016 | | | | 3,120 | | 3,126 | |
RH Donnelley Corp. - 144a | | | | | | | |
8.88%, due 10/15/2017 | | | | 2,000 | | 2,000 | |
Time Warner, Inc. | | | | | | | |
7.63%, due 04/15/2031 | | | | 3,000 | | 3,338 | |
Metals & Mining (2.2%) | | | | | | | |
Freeport-McMoRan Copper & Gold, Inc. | | | | | | | |
8.38%, due 04/01/2017 | | | | 1,375 | | 1,506 | |
Pna Group, Inc. | | | | | | | |
10.75%, due 09/01/2016 | | | | 2,025 | | 2,070 | |
Steel Dynamics, Inc. - 144A | | | | | | | |
7.38%, due 11/01/2012 | | | | 1,800 | | 1,800 | |
Vale Overseas, Ltd. | | | | | | | |
6.25%, due 01/23/2017 | | | | 3,750 | | 3,792 | |
Multiline Retail (0.7%) | | | | | | | |
Neiman-Marcus Group, Inc. | | | | | | | |
9.00%, due 10/15/2015 | | | | 1,650 | | 1,741 | |
10.38%, due 10/15/2015 | | | | 1,000 | | 1,087 | |
Office Electronics (1.3%) | | | | | | | |
Xerox Corp. | | | | | | | |
9.75%, due 01/15/2009 | | | | 5,000 | | 5,249 | |
Oil, Gas & Consumable Fuels (7.2%) | | | | | | | |
Anadarko Petroleum Corp. | | | | | | | |
6.45%, due 09/15/2036 | | | | $ | 1,680 | | $ | 1,700 | |
Apache Corp. | | | | | | | |
6.00%, due 01/15/2037 | | | | 1,810 | | 1,785 | |
Burlington Resources, Inc. | | | | | | | |
9.88%, due 06/15/2010 | | | | 1,435 | | 1,612 | |
Chesapeake Energy Corp. | | | | | | | |
6.38%, due 06/15/2015 | | | | 1,000 | | 970 | |
Dune Energy, Inc. - 144A | | | | | | | |
10.50%, due 06/01/2012 | | | | 500 | | 489 | |
Dynegy Holdings, Inc. - 144A | | | | | | | |
7.75%, due 06/01/2019 | | | | 2,250 | | 2,112 | |
Enterprise Products Operating, LP | | | | | | | |
8.38%, due 08/01/2066 1 | | | | 2,150 | | 2,238 | |
Gazprom International SA - 144A | | | | | | | |
7.20%, due 02/01/2020 | | | | 2,810 | | 2,887 | |
Kinder Morgan Energy Partners, LP | | | | | | | |
7.75%, due 03/15/2032 | | | | 3,450 | | 3,850 | |
Markwest Energy Partners, LP | | | | | | | |
8.50%, due 07/15/2016 | | | | 700 | | 700 | |
Opti Canada, Inc. - 144A | | | | | | | |
8.25%, due 12/15/2014 | | | | 1,800 | | 1,805 | |
PetroHawk Energy Corp. | | | | | | | |
9.13%, due 07/15/2013 | | | | 1,300 | | 1,380 | |
Sabine Pass Lng, LP | | | | | | | |
7.50%, due 11/30/2016 | | | | 1,000 | | 980 | |
Teppco Partners, LP | | | | | | | |
7.00%, due 06/01/2067 (1) | | | | 3,800 | | 3,431 | |
Valero Logistics Operations, LP | | | | | | | |
6.88%, due 07/15/2012 | | | | 3,690 | | 3,849 | |
Paper & Forest Products (0.5%) | | | | | | | |
Exopack Holding, Inc. | | | | | | | |
11.25%, due 02/01/2014 | | | | 2,000 | | 2,025 | |
Real Estate Investment Trusts (5.4%) | | | | | | | |
Healthcare Realty Trust, Inc. | | | | | | | |
8.13%, due 05/01/2011 | | | | 2,650 | | 2,847 | |
Host Marriott, LP | | | | | | | |
7.13%, due 11/01/2013 | | | | 2,000 | | 2,030 | |
iStar Financial, Inc. | | | | | | | |
4.88%, due 01/15/2009 | | | | 6,000 | | 5,877 | |
Kimco Realty Corp. | | | | | | | |
3.95%, due 08/05/2008 | | | | 2,825 | | 2,800 | |
Rouse Co., LP/TRC Co-Issuer, Inc. - 144A | | | | | | | |
6.75%, due 05/01/2013 | | | | 1,500 | | 1,477 | |
Udr, Inc. | | | | | | | |
4.50%, due 03/03/2008 | | | | 3,000 | | 2,995 | |
Westfield Group - 144a | | | | | | | |
5.40%, due 10/01/2012 | | | | 4,100 | | 4,075 | |
The notes to the financial statements are an integral part of this report.
36
| | | | Principal | | Value | |
Road & Rail (3.3%) | | | | | | | |
Burlington North Santa F | | | | | | | |
5.65%, due 05/01/2017 | | | | $ | 3,325 | | $ | 3,289 | |
Erac USA Finance Co. - 144a | | | | | | | |
7.35%, due 06/15/2008 | | | | | 5,000 | | | 5,053 | |
Hertz Corp. | | | | | | | |
10.50%, due 01/01/2016 | | | | 3,000 | | 3,225 | |
Kansas City Southern Mex | | | | | | | |
7.63%, due 12/01/2013 | | | | 2,110 | | 2,152 | |
Specialty Retail (2.0%) | | | | | | | |
Asbury Automotive Group | | | | | | | |
7.63%, due 03/15/2017 | | | | 2,000 | | 1,870 | |
Claire’s Stores, Inc. - 144A | | | | | | | |
10.50%, due 06/01/2017 ^ | | | | 1,325 | | 1,007 | |
Penske Auto Group, Inc. | | | | | | | |
7.75%, due 12/15/2016 | | | | 1,750 | | 1,702 | |
Petro Stopping Centers, LP / Petro | | | | | | | |
9.00%, due 02/15/2012 | | | | 3,400 | | 3,553 | |
Thrifts & Mortgage Finance (1.3%) | | | | | | | |
Countrywide Financial Corp. | | | | | | | |
4.50%, due 06/15/2010 | | | | 1,960 | | 1,688 | |
Sovereign Capital Trust VI | | | | | | | |
7.91%, due 06/13/2036 | | | | 3,700 | | 3,806 | |
Tobacco (0.4%) | | | | | | | |
Alliance One International, Inc. | | | | | | | |
11.00%, due 05/15/2012 | | | | 1,425 | | 1,525 | |
Trading Companies & Distributors (0.2%) | | | | | | | |
Noble Group, Ltd. - 144a | | | | | | | |
6.63%, due 03/17/2015 | | | | 1,000 | | 937 | |
Wireless Telecommunication Services (2.3%) | | | | | | | |
American Tower Corp. - 144a | | | | | | | |
7.00%, due 10/15/2017 | | | | 2,075 | | 2,122 | |
New Cingular Wireless Services, Inc. | | | | | | | |
8.13%, due 05/01/2012 | | | | 3,600 | | 4,015 | |
| | | | | | | |
| | | | Shares | | Value | |
Nextel Communications, Inc. | | | | | | | |
7.38%, due 08/01/2015 | | | | 3,500 | | 3,535 | |
Total Corporate Debt Securities (cost $345,707) | | | | | | 342,467 | |
| | | | | | | |
CONVERTIBLE PREFERRED STOCKS (0.4%) | | | | | | | |
Automobiles (0.3%) | | | | | | | |
General Motors Corp., Convertible ‡ | | | | 44,000 | | 1,127 | |
Thrifts & Mortgage Finance (0.1%) | | | | | | | |
Sovereign Capital Trust, Convertible ‡ | | | | 9,500 | | 385 | |
Total Convertible Preferred Stocks (cost $1,491) | | | | | | 1,512 | |
| | | | | | | |
PREFERRED STOCKS (1.5%) | | | | | | | |
Diversified Telecommunication Services (0.5%) | | | | | | | |
Centaur Funding Corp. - 144a ‡ | | | | 1,661 | | 1,879 | |
Real Estate Investment Trusts (0.4%) | | | | | | | |
Saul Centers, Inc. ‡, Ž | | | | 1,850 | | 46 | |
Tanger Factory Outlet Centers ‡, Ž | | | | 66,666 | | 1,667 | |
Thrifts & Mortgage Finance (0.6%) | | | | | | | |
IndyMac Bank Fsb - 144a ‡ | | | | 177,600 | | 2,492 | |
Total Preferred Stocks (cost $7,874) | | | | | | 6,084 | |
| | | | | | | |
CONVERTIBLE BONDS (0.3%) | | | | | | | |
Semiconductors & Semiconductor Equipment (0.3%) | | | | | | | |
Intel Corp., Convertible | | | | | | | |
2.95%, due 12/15/2035 | | | | 1,000 | | 1,091 | |
Total Convertible Bonds (cost $940) | | | | | | 1,091 | |
| | | | | | | |
WARRANTS (0.0%) | | | | | | | |
Diversified Telecommunication Services (0.0%) | | | | | | | |
Versatel Telecom International NV | | | | | | | |
Expiration: 05/15/2008, | | | | 75 | | | o |
Exercise Price: $4 | | | | | | | |
Total Warrants (cost $1) | | | | | | — | |
Total Security Lending Collateral (cost $22,782) ± | | | | | | 22,782 | |
Total Investment Securities (cost $430,793) # | | | | | | $ | 425,350 | |
NOTES TO SCHEDULE OF INVESTMENTS
o | Value is less than $1. |
^ | At October 31, 2007, all or a portion of this security is on loan (see Note 1). The value at October 31, 2007, of all securities on loan is $22,335. |
* | Floating or variable rate note. Rate is listed as of October 31, 2007. |
± | Cash collateral for the Repurchase Agreements, valued at $4,158, that serve as collateral for securities lending, are invested in corporate and government bonds with interest rates and maturity dates ranging from 0.00% - 8.125% and 11/14/2007 - 9/15/2037. |
‡ | Non Income Producing |
(1) | Coupon rate is fixed for a predetermined period of time and then converts to a floating rate until maturity/call date. Rate is listed as of October 31, 2007. |
(2) | Step Up |
Ž | The security has a perpetual maturity. The date shown is the next call date. |
# | Aggregate cost for federal income tax purposes is $430,795. Aggregate gross unrealized appreciation for all securities in which there is an excess of value over tax cost and aggregate gross unrealized depreciation for all securities in which there is an excess of tax cost over value were $2,828 and $8,270, respectively. Net unrealized appreciation for tax purposes is $5,442. |
| |
DEFINITIONS: |
144A | 144A Securities are registered pursuant to Rule 144A of the Securities Act of 1933. These securities are deemed to be liquid for purposes of compliance limitations on holdings of illiquid securities and may be resold as transactions exempt from registration, normally to qualified institutional buyers. At October 31, 2007, these securities aggregated $96,689 or 23.47% of net assets of the Fund |
The notes to the financial statements are an integral part of this report.
37
TA IDEX Transamerica Growth Opportunities
MARKET ENVIRONMENT
The U.S. stock market experienced two distinct phases in the twelve months ended October 31, 2007. Through April, the market advanced strongly, driven by a combination of slowing economic growth (due to a downturn in the U.S. housing sector) and a wave of private equity buyouts. The first caused investors to anticipate that the Federal Reserve Board (“Fed”) would lower interest rates to stimulate growth. The second was fueled in part by easy credit; private equity firms were able to pay premiums for slower-growing, high-cash flow companies by financing the acquisitions with large, low-cost loans. This put upward pressure on stock prices.
After April, these trends reversed. A resurgent economy dimmed hopes of Fed interest-rate cuts. Meanwhile, the easy credit of the past several years created problems for the mortgage industry, where defaults on low-quality loans increased dramatically. Credit became more difficult to obtain, the buyout wave subsided, and equity markets turned highly volatile until the Fed intervened, reducing interest rates to restore confidence.
Despite the turbulence, the Russell Midcap Growth Index (“Russell Midcap Growth”) rose 19.72%, led by sectors that were not vulnerable to the housing industry and the credit-market problems.
PERFORMANCE
For the year ended October 31, 2007, TA IDEX Transamerica Growth Opportunities, Class A returned 36.20%. By comparison its benchmark, the Russell Midcap Growth, returned 19.72%. For the year ended October 31, 2007, the Fund’s net expense ratios for Class A, Class B, Class C, and Class I were 1.75%, 2.40%, 2.36%, and 0.88%, respectively.
STRATEGY REVIEW
We focus on companies with the potential to outperform over a three- to five-year time horizon, due to a combination of capable management, sustainable competitive advantages, and the ability to benefit from positive secular growth trends. Major themes in recent years have included strong global economic growth; increased consumer spending on leisure and entertainment; and new technologies. This emphasis paid off handsomely during the period.
The portfolio’s largest contributors to performance included two leisure-related companies: Hilton Hotels Corporation, which was bought out early in the quarter, and casino operator Las Vegas Sands Corp., which advanced rapidly after the successful launch of its newest facility in Macao, China. Other major contributors were companies leveraged to global economic growth and development (e.g., Jacobs Engineering Group Inc. (“Jacobs”) and Cameron International Corporation (“Cameron”)) and secularly growing businesses, including Intuitive Surgical, Inc. (“Intuitive Surgical”). Cameron, which manufactures pressure-control systems used in deep-sea drilling, benefited from strong energy prices. Jacobs, a designer and manager of large-scale engineering projects, continued to win new contracts worldwide. Shares of top contributor Intuitive Surgical, which develops systems for robotically assisted, minimally invasive surgery, rose rapidly after the company announced a double-digit rise in quarterly earnings.
During the period, we exited certain consumer and financial stocks that detracted from results and, in our view, had reached the end of their near-term growth trajectories. Among them were SanDisk Corporation (portable digital memory devices), P.F. Chang’s China Bistro, Inc. (restaurants) and Global Payments Inc. (worldwide electronic transaction processing and payment services). Conversely, we maintained the portfolio’s exposure to another detractor, Whole Foods Market, Inc. We believe this high-end grocer has tremendous opportunities to increase its market penetration and are watching to see how effectively management can execute the expansion.
Edward S. Han
John J. Huber, CFA
Co-Portfolio Managers
Transamerica Investment Management, LLC
38
(unaudited)
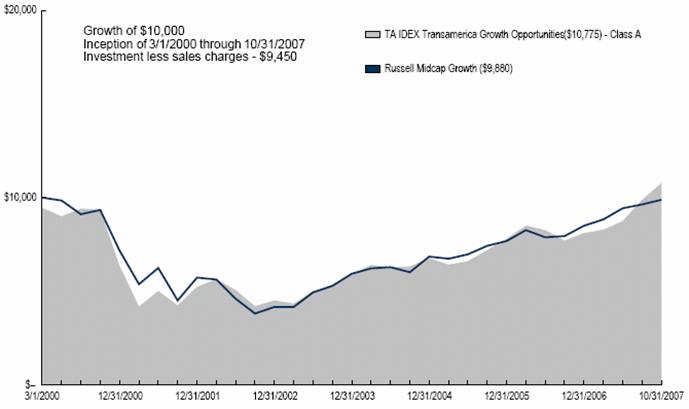
Average Annual Total Return for Periods Ended 10/31/2007
| | | | | | From | | Inception | |
| | 1 Year | | 5 Years | | Inception | | Date | |
Class A (NAV) | | 36.20 | % | 18.84 | % | 1.72 | % | 3/1/00 | |
Class A (POP) | | 28.67 | % | 17.50 | % | 0.98 | % | 3/1/00 | |
Russell Midcap Growth(1) | | 19.72 | % | 19.21 | % | 0.06 | % | 3/1/00 | |
| | | | | | | | | |
Class B (NAV) | | 35.35 | % | 17.93 | % | 0.91 | | 3/1/00 | |
Class B (POP) | | 30.35 | % | 17.83 | % | 0.91 | | 3/1/00 | |
| | | | | | | | | |
Class C (NAV) | | 35.26 | % | — | % | 18.49 | | 11/11/02 | |
Class C (POP) | | 34.26 | % | — | % | 18.49 | | 11/11/02 | |
| | | | | | | | | |
Class I (NAV) | | 37.49 | % | — | % | 20.88 | | 11/15/05 | |
NOTES
(1) The Russell Midcap Growth (Russell Midcap Growth) Index is an unmanaged index used as a general measure of market performance. Calculations assume dividends and capital gains are reinvested and do not include any managerial expenses. From inception calculation is based on life of Class A shares.
The performance data presented represents past performance, future results may vary. Performance data does not reflect the deduction of taxes that would be paid on fund distributions nor the redemption of fund shares. Investment return and principal value will fluctuate so that an investor’s shares, when redeemed, may be worth more or less than their original cost. Current performance may be lower or higher than performance quoted. Please see www.transamericaidex.com for performance data current to the most recent month-end.
Public Offering Price (POP) returns include the reinvestment of dividends and capital gains and reflect the maximum sales charge of 5.5% for A shares or the maximum applicable contingent deferred sales charge (5% in the 1st year, decreasing to 0% after 6 years) for Class B shares and 1% (during the first 12 months) for Class C shares. Shares purchased prior to March 1, 2004 are subject to a maximum applicable contingent deferred sales charge (5% in the 1st year, decreasing to 0% after 7 years) for Class B shares and (2% in the 1st year, decreasing to 0% after 2 years) for Class C shares. Net Asset Value (NAV) returns include the reinvestment of dividends and capital gains but do not reflect any sales charges.
Investing in small cap stocks generally involves greater risk and volatility, therefore an investment in the fund may not be appropriate for everyone. This material must be preceded or accompanied by a current prospectus, which includes specific contents regarding the investment objectives and policies of this Fund.
39
UNDERSTANDING YOUR FUND’S EXPENSES
(unaudited)
SHAREHOLDER EXPENSES
Fund shareholders may incur two types of costs: (1) transaction costs, including sales charges (loads) on purchases, contingent deferred sales charges on redemptions and redemption fees; and (2) ongoing costs, including management fees, 12b-1 distribution and service fees, and other fund expenses.
The following Example is intended to help you understand your ongoing costs (in dollars and cents) of investing in the Fund and to compare these costs with the ongoing costs of investing in other funds.
The Example is based on an investment of $1,000 invested at May 1, 2007 and held for the entire period until October 31, 2007.
ACTUAL EXPENSES
The first line in the table below provides information about actual account values and actual expenses. You may use the information in this line, together with the amount you invested, to estimate the expenses that you paid over the period. Simply divide your account value by $1,000 (for example, an $8,600 account value divided by $1,000 = 8.6), then multiply the result by the number in the first line of your Fund under the heading entitled “Expenses Paid During Period” to estimate the expenses you paid on your account during this period. If your account is an IRA, your expenses could have included a $15 annual fee. The amount of any fee paid through your account would increase the estimate of expenses you paid during the period and decrease your ending account value.
HYPOTHETICAL EXAMPLE FOR COMPARISON PURPOSES
The second line in the table below provides information about hypothetical account values and hypothetical expenses based on the Fund’s actual expense ratio and an assumed rate of return of 5% per year before expenses, which is not the Fund’s actual return. The hypothetical account values and expenses may not be used to estimate the actual ending account balance or expenses you paid for the period. You may use this information to compare the ongoing costs of investing in your Fund and other funds. To do so, compare this 5% hypothetical example with the 5% hypothetical examples that appear in the shareholder reports of the other funds. As in the case of the actual expense example, if your account is subject to an IRA fee, the amount of the fee paid through your account would increase the hypothetical expenses you would have paid during the period and decrease the hypothetical ending account value.
Please note that the expenses shown in the table are meant to highlight your ongoing costs only and do not reflect any transactional costs, such as sales charges, redemption fees, brokerage commissions paid on purchases and sales of fund shares. Therefore, the second line under the Fund in the table is useful in comparing ongoing costs only, and will not help you determine the relative total costs of owning different funds. If any of these transaction costs were included, your costs would be higher. The expenses shown in the table do not reflect any fees that may be charged to you by brokers, financial intermediaries or other financial institutions.
| | Beginning | | Ending | | Annualized | | Expenses | |
| | Account | | Account | | Expense | | Paid During | |
| | Value | | Value | | Ratio | | Period (a) | |
Class A | | | | | | | | | |
Actual | | $ | 1,000.00 | | $ | 1,289.59 | | 1.70 | % | $ | 9.78 | |
Hypothetical (b) | | 1,000.00 | | 1,016.59 | | 1.70 | | 8.62 | |
| | | | | | | | | |
Class B | | | | | | | | | |
Actual | | 1,000.00 | | 1,283.83 | | 2.38 | | 13.66 | |
Hypothetical (b) | | 1,000.00 | | 1,013.17 | | 2.38 | | 12.04 | |
| | | | | | | | | |
Class C | | | | | | | | | |
Actual | | 1,000.00 | | 1,284.69 | | 2.29 | | 13.15 | |
Hypothetical (b) | | 1,000.00 | | 1,013.62 | | 2.29 | | 11.59 | |
| | | | | | | | | |
Class I | | | | | | | | | |
Actual | | 1,000.00 | | 1,294.97 | | 0.87 | | 5.02 | |
Hypothetical (b) | | 1,000.00 | | 1,020.76 | | 0.87 | | 4.42 | |
| | | | | | | | | | | | |
(a) | | Expenses are calculated using the Fund’s annualized expense ratio (as disclosed in the table), multiplied by the average account value for the period, multiplied by the number of days in the period (184 days), and divided by the number of days in the year (365 days) |
| | |
(b) | | 5% return per year before expenses. |
GRAPHICAL PRESENTATION OF SCHEDULE OF INVESTMENTS
By Sector
At October 31, 2007

This chart shows the percentage breakdown by sector of the Fund’s total investment securities.
40
SCHEDULE OF INVESTMENTS
At October 31, 2007
(all amounts except share amounts in thousands)
| | Shares | | Value | |
COMMON STOCKS (97.5%) | | | | | |
Aerospace & Defense (0.9%) | | | | | |
Rockwell Collins, Inc. | | 45,500 | | $ | 3,404 | |
Air Freight & Logistics (3.3%) | | | | | |
Expeditors International Washington, Inc. ^ | | 237,700 | | 12,040 | |
Auto Components (3.8%) | | | | | |
BorgWarner, Inc. | | 127,600 | | 13,489 | |
Capital Markets (6.1%) | | | | | |
Ameriprise Financial, Inc. | | 150,015 | | 9,448 | |
T. Rowe Price Group, Inc. | | 193,195 | | 12,411 | |
Commercial Banks (0.9%) | | | | | |
Signature Bank ‡ | | 97,000 | | 3,313 | |
Commercial Services & Supplies (0.6%) | | | | | |
Costar Group, Inc. ‡ | | 35,000 | | 2,012 | |
Communications Equipment (2.0%) | | | | | |
Foundry Networks, Inc. ‡ | | 253,200 | | 5,353 | |
Riverbed Technology, Inc. ‡ | | 57,000 | | 1,926 | |
Construction & Engineering (3.6%) | | | | | |
Jacobs Engineering Group, Inc. ‡ | | 148,800 | | 12,968 | |
Diversified Consumer Services (3.6%) | | | | | |
Strayer Education, Inc. ^ | | 69,200 | | 12,903 | |
Diversified Financial Services (5.0%) | | | | | |
CME Group, Inc. Class A | | 14,000 | | 9,327 | |
Nymex Holdings, Inc. ^ | | 66,360 | | 8,529 | |
Diversified Telecommunication Services (2.3%) | | | | | |
NeuStar, Inc. Class A ‡ ^ | | 246,800 | | 8,441 | |
Electrical Equipment (1.1%) | | | | | |
Sunpower Corp. Class A ‡ ^ | | 31,500 | | 3,983 | |
Electronic Equipment & Instruments (3.5%) | | | | | |
Trimble Navigation, Ltd. ‡ | | 298,500 | | 12,447 | |
Energy Equipment & Services (4.9%) | | | | | |
Cameron International Corp. ‡ | | 123,464 | | 12,021 | |
Core Laboratories NV ‡ | | 38,100 | | 5,560 | |
Food & Staples Retailing (2.3%) | | | | | |
Whole Foods Market, Inc. ^ | | 168,245 | | 8,335 | |
Health Care Equipment & Supplies (8.2%) | | | | | |
Arthrocare Corp. ‡ ^ | | 104,700 | | 6,789 | |
Hologic, Inc. ‡ | | 13,000 | | 883 | |
Idexx Laboratories, Inc. ‡ | | 22,300 | | 2,716 | |
Intuitive Surgical, Inc. ‡ | | 47,500 | | 15,526 | |
Varian Medical Systems, Inc. ‡ | | 72,000 | | 3,511 | |
Health Care Technology (2.7%) | | | | | |
Cerner Corp. ‡ ^ | | 165,600 | | $ | 9,863 | |
Hotels, Restaurants & Leisure (4.3%) | | | | | |
International Game Technology | | 182,000 | | 7,937 | |
Las Vegas Sands Corp. ‡ | | 57,400 | | 7,618 | |
Household Durables (3.2%) | | | | | |
Guess?, Inc. ^ | | 169,865 | | 8,729 | |
Harman International Industries, Inc. | | 32,000 | | 2,695 | |
Internet Software & Services (1.4%) | | | | | |
Valueclick, Inc. ‡ ^ | | 190,850 | | 5,189 | |
IT Services (3.7%) | | | | | |
Verifone Holdings, Inc. ‡ ^ | | 269,300 | | 13,311 | |
Life Sciences Tools & Services (5.0%) | | | | | |
Covance, Inc. ‡ | | 154,710 | | 12,764 | |
Techne Corp. ‡ | | 77,566 | | 5,060 | |
Machinery (6.4%) | | | | | |
Joy Global, Inc. | | 156,400 | | 9,081 | |
Kennametal, Inc. | | 151,485 | | 13,817 | |
Media (3.1%) | | | | | |
Lamar Advertising Co. Class A ^ | | 211,100 | | 11,285 | |
Multiline Retail (2.6%) | | | | | |
Saks, Inc. | | 438,300 | | 9,274 | |
Oil, Gas & Consumable Fuels (1.0%) | | | | | |
Range Resources Corp. | | 78,000 | | 3,505 | |
Real Estate Investment Trusts (0.4%) | | | | | |
Kilroy Realty Corp. (1) | | 19,500 | | 1,268 | |
Semiconductors & Semiconductor Equipment (3.3%) | | | | | |
NVIDIA Corp. ‡ | | 93,000 | | 3,290 | |
Sirf Technology Holdings, Inc. ‡ ^ | | 285,600 | | 8,514 | |
Software (5.6%) | | | | | |
Activision, Inc. ‡ | | 244,075 | | 5,772 | |
Intuit, Inc. ‡ | | 97,100 | | 3,124 | |
Macrovision Corp. ‡ | | 393,500 | | 9,444 | |
Salesforce.Com, Inc. ‡^ | | 31,200 | | 1,759 | |
Vmware, Inc. Class A ‡^ | | 1,395 | | 174 | |
Trading Companies & Distributors (2.7%) | | | | | |
WW Grainger, Inc. | | 108,300 | | 9,738 | |
Total Common Stocks (cost $268,038) | | | | 350,546 | |
Total Security Lending Collateral (cost $76,488) ± | | | | 76,488 | |
Total Investment Securities (cost $344,526) # | | | | $ | 427,033 | |
NOTES TO SCHEDULE OF INVESTMENTS
^ | | At October 31, 2007, all or a portion of this security is on loan (see Note 1). The value at October 31, 2007, of all securities on loan is $74,436. |
± | | Cash collateral for the Repurchase Agreements, valued at $13,959, that serve as collateral for securities lending, are invested in corporate and government bonds with interest rates and maturity dates ranging from 0.00% - 8.125% and 11/14/2007 - 9/15/2037. |
‡ | | Non Income Producing |
# | | Aggregate cost for federal income tax purposes is $344,500. Aggregate gross unrealized appreciation for all securities in which there is an excess of value over tax cost and aggregate gross unrealized depreciation for all securities in which there is an excess of tax cost over value were $84,960 and $2,427, respectively. Net unrealized appreciation for tax purposes is $82,533. |
(1) | | Real Estate Investment Trust |
The notes to the financial statements are an integral part of this report.
41
TA IDEX Transamerica High-Yield Bond
MARKET ENVIRONMENT
Main Street has barely noticed that Wall Street is struggling. The recent financial shock caused by the sub-prime mortgage shock seems far in the distance to the average investor on Main Street. While the consumer did show signs of slowing over the past fiscal year, the economy, which has been led by the consumer, has remained quite resilient. So much so that growth has accelerated year-over-year during the past two quarters despite the worst housing slump in years. Wall Street’s retrenchment seems to indicate a significant slowdown on the horizon while Main Street so far has continued to shrug off a poor housing environment and rising energy prices.
The Federal Reserve Board (“Fed”) continues to be concerned that higher energy prices may flow through to final consumer prices and eventually raise investor’s inflation expectations. The Fed now has a balanced view of the risks – that the risk of slowing growth is matched against future inflation risks. The risks of a significant slowdown, and/or higher inflationary expectations pose the most challenging risks to the portfolio over the next fiscal year.
PERFORMANCE
For the year ended October 31, 2007, TA IDEX Transamerica High-Yield Bond, Class A returned 5.90%. By comparison its benchmark, the Merrill Lynch High Yield Cash Pay Index (“Merrill Lynch High Yield”), returned 6.76%. For the year ended October 31, 2007, the Fund’s net expense ratios for Class A, Class B, Class C, and Class I were 1.15%, 1.83%, 1.83%, and 0.65%, respectively.
STRATEGY REVIEW
A portion of the portfolio’s underperformance for the fiscal year versus the Merrill Lynch High Yield was attributable to the portfolio’s underweight in CCC securities, which is limited to 10%. This structural limitation had a negative influence on the securities performance for the period as the Merrill Lynch High Yield CCC sector index out-performed the Merrill Lynch High Yield BB-B sector index by 156bp (8.16% vs. 6.60%) during the one year period ended October 31, 2007.
Positive industry contributors during the period for the Merrill Lynch High Yield were non-electric utilities, auto parts and equipment, and metals/mining. Negative contributors included building and construction, integrated energy and beverage.
On a relative basis our underweight in automotive and wireless, along with our overweight in gaming hurt our performance versus the benchmark. Positive sector contributors included our underweight to the consumer cyclical space, specifically building and construction. Individual names that contributed positively to performance included our underweight in General Motors Acceptance Corporation (“GMAC”) while our underweight in General Motors Corporation and Ford Motor Company were negative contributors to performance. Other positive contributors included Smurfit-Stone Container Corporation, The DirectTV Group, Inc. and Las Vegas Sands Corp.
Our strategy of an up-in-quality bias, with select investments in lower-tier credits, provided a solid return for the portfolio, but short of the down-in-quality bias of the index. Over the past twelve months we have continued to see aggressive issuance patterns with the proportion of lower quality paper (CCC+ and below) increasing significantly. We believe we will continue to see these trends continue and believe that the broader high yield market will be composed of 25-30% of lower quality paper before the credit cycle turns. We continue to believe that our discipline of not chasing yield, particularly with the increased financial markets volatility and economic uncertainty, will reward shareholders for the upcoming fiscal period.
The high yield market remained resilient during the first six months of the year as market participants continued to have a strong bid for risk on the back of strong economic growth. In general, the theme for many high yield participants continued to be the down-in-quality trade. Given the backdrop of low credit volatility and tight spreads, investors felt comfortable stretching for additional yield in riskier situations during the first half of the year. Subsequently we have seen increased volatility in the broader marketplace, particularly in the structured asset classes as the sub-prime debacle and massive amount of leverage in the system has started to unwind.
With the portfolio now a total high yield portfolio, credit is the predominate risk to the portfolio. We believe a long sustained underperformance by the economy would be detrimental to the cash flows and balance sheets of below investment grade securities, which is mitigated somewhat by our very low weighting in CCC securities and generally a higher proportion of better quality credits within the portfolio versus our peers.
David R. Halfpap, CFA
Bradley J. Beman, CFA, CPA
Co-Portfolio Managers
AEGON USA Investment Management, LLC
42
(unaudited)

Average Annual Total Return for Periods Ended 10/31/2007
| | | | | | | | From | | Inception | |
| | 1 Year | | 5 Years | | 10 Years | | Inception | | Date | |
Class A (NAV) | | 5.90 | % | 9.62 | % | 5.42 | % | 8.33 | % | 6/14/85 | |
Class A (POP) | | 0.85 | % | 8.58 | % | 4.90 | % | 8.09 | % | 6/14/85 | |
MLHYCPD(1) | | 6.76 | % | 12.59 | % | 6.19 | % | 9.49 | % | 6/14/85 | |
| | | | | | | | | | | |
Class B (NAV) | | 5.19 | % | 8.86 | % | 4.86 | % | 5.85 | % | 10/1/95 | |
Class B (POP) | | 0.22 | % | 8.72 | % | 4.86 | % | 5.85 | % | 10/1/95 | |
| | | | | | | | | | | |
Class C (NAV) | | 5.21 | % | — | % | — | % | 8.46 | % | 11/11/02 | |
Class C (POP) | | 4.22 | % | — | % | — | % | 8.46 | % | 11/11/02 | |
| | | | | | | | | | | |
Class I (NAV) | | 6.39 | % | — | % | — | % | 6.17 | % | 11/8/04 | |
NOTES
(1) The Merrill Lynch High Yield Cash Pay (MLHYCP) Index is an unmanaged index used as a general measure of market performance. Calculations assume dividends and capital gains are reinvested and do not include any managerial expenses. From inception calculation is based on life of Class A shares.
The performance data presented represents past performance, future results may vary. Performance data does not reflect the deduction of taxes that would be paid on fund distributions nor the redemption of fund shares. Investment return and principal value will fluctuate so that an investor’s shares, when redeemed, may be worth more or less than their original cost. Current performance may be lower or higher than performance quoted. Please see www.transamericaidex.com for performance data current to the most recent month-end.
Public Offering Price (POP) returns include the reinvestment of dividends and capital gains and reflect the maximum sales charge of 4.75% for A shares or the maximum applicable contingent deferred sales charge (5% in the 1st year, decreasing to 0% after 6 years) for Class B shares and 1% (during the first 12 months) for Class C shares. Shares purchased prior to March 1, 2004 are subject to a maximum applicable contingent deferred sales charge (5% in the 1st year, decreasing to 0% after 7 years) for Class B shares and (2% in the 1st year, decreasing to 0% after 2 years) for Class C shares. Net Asset Value (NAV) returns include the reinvestment of dividends and capital gains but do not reflect any sales charges.
Investments in high-yield bonds (“junk bonds”) may be subject to greater volatility and risks as the income derived from these securities is not guaranteed and may be unpredictable. This material must be preceded or accompanied by a current prospectus, which includes specific contents regarding the investment objectives and policies of this Fund.
43
UNDERSTANDING YOUR FUND’S EXPENSES
(unaudited)
SHAREHOLDER EXPENSES
Fund shareholders may incur two types of costs: (1) transaction costs, including sales charges (loads) on purchases, contingent deferred sales charges on redemptions and redemption fees; and (2) ongoing costs, including management fees, 12b-1 distribution and service fees, and other fund expenses.
The following Example is intended to help you understand your ongoing costs (in dollars and cents) of investing in the Fund and to compare these costs with the ongoing costs of investing in other funds.
The Example is based on an investment of $1,000 invested at May 1, 2007 and held for the entire period until October 31, 2007.
ACTUAL EXPENSES
The first line in the table below provides information about actual account values and actual expenses. You may use the information in this line, together with the amount you invested, to estimate the expenses that you paid over the period. Simply divide your account value by $1,000 (for example, an $8,600 account value divided by $1,000 = 8.6), then multiply the result by the number in the first line of your Fund under the heading entitled “Expenses Paid During Period” to estimate the expenses you paid on your account during this period. If your account is an IRA, your expenses could have included a $15 annual fee. The amount of any fee paid through your account would increase the estimate of expenses you paid during the period and decrease your ending account value.
HYPOTHETICAL EXAMPLE FOR COMPARISON PURPOSES
The second line in the table below provides information about hypothetical account values and hypothetical expenses based on the Fund’s actual expense ratio and an assumed rate of return of 5% per year before expenses, which is not the Fund’s actual return. The hypothetical account values and expenses may not be used to estimate the actual ending account balance or expenses you paid for the period. You may use this information to compare the ongoing costs of investing in your Fund and other funds. To do so, compare this 5% hypothetical example with the 5% hypothetical examples that appear in the shareholder reports of the other funds. As in the case of the actual expense example, if your account is subject to an IRA fee, the amount of the fee paid through your account would increase the hypothetical expenses you would have paid during the period and decrease the hypothetical ending account value.
Please note that the expenses shown in the table are meant to highlight your ongoing costs only and do not reflect any transactional costs, such as sales charges, redemption fees, brokerage commissions paid on purchases and sales of fund shares. Therefore, the second line under the Fund in the table is useful in comparing ongoing costs only, and will not help you determine the relative total costs of owning different funds. If any of these transaction costs were included, your costs would be higher. The expenses shown in the table do not reflect any fees that may be charged to you by brokers, financial intermediaries or other financial institutions.
| | Beginning | | Ending | | Annualized | | Expenses | |
| | Account | | Account | | Expense | | Paid During | |
| | Value | | Value | | Ratio | | Period (a) | |
Class A | | | | | | | | | |
Actual | | $ | 1,000.00 | | $ | 999.80 | | 1.14 | % | $ | 5.77 | |
Hypothetical (b) | | 1,000.00 | | 1,019.37 | | 1.14 | | 5.82 | |
| | | | | | | | | |
Class B | | | | | | | | | |
Actual | | 1,000.00 | | 996.36 | | 1.81 | | 9.13 | |
Hypothetical (b) | | 1,000.00 | | 1,015.99 | | 1.81 | | 9.22 | |
| | | | | | | | | |
Class C | | | | | | | | | |
Actual | | 1,000.00 | | 996.47 | | 1.80 | | 9.04 | |
Hypothetical (b) | | 1,000.00 | | 1,016.08 | | 1.80 | | 9.13 | |
| | | | | | | | | |
Class I | | | | | | | | | |
Actual | | 1,000.00 | | 1,001.20 | | 0.66 | | 3.31 | |
Hypothetical (b) | | 1,000.00 | | 1,021.83 | | 0.66 | | 3.34 | |
| | | | | | | | | | | | |
(a) | Expenses are calculated using the fund’s annualized expense ratio (as disclosed in the table), multiplied by the average account value for the period, multiplied by the number of days in the period (184 days), and divided by the number of days in the year (365 days). |
| |
(b) | 5% return per year before expenses |
GRAPHICAL PRESENTATION OF SCHEDULE OF INVESTMENTS
By Bond Credit Quality (Moody’s Ratings)
At October 31, 2007
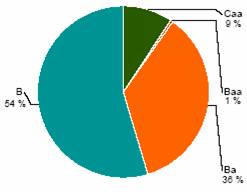
This chart shows the percentage breakdown by bond credit quality of the Fund’s total investment securities.
44
SCHEDULE OF INVESTMENTS
At October 31, 2007
(all amounts except share amounts in thousands)
| | Principal | | Value | |
CORPORATE DEBT SECURITIES (96.0%) | | | | | |
Aerospace & Defense (2.6%) | | | | | |
Alliant Techsystems, Inc. | | | | | |
6.75%, due 04/01/2016 | | $ | 3,290 | | $ | 3,273 | |
DRS Technologies, Inc. | | | | | |
6.88%, due 11/01/2013 | | 3,000 | | 3,000 | |
L-3 Communications Corp. | | | | | |
6.13%, due 07/15/2013 – 01/15/2014 | | 3,000 | | 2,975 | |
7.63%, due 06/15/2012 | | 1,000 | | 1,029 | |
Automobiles (1.0%) | | | | | |
General Motors Corp. | | | | | |
7.20%, due 01/15/2011 ^ | | 4,000 | | 3,830 | |
Beverages (1.7%) | | | | | |
Constellation Brands, Inc. | | | | | |
7.25%, due 09/01/2016 | | 3,500 | | 3,526 | |
Cott Beverages USA, Inc. | | | | | |
8.00%, due 12/15/2011 | | 3,300 | | 3,193 | |
Capital Markets (0.6%) | | | | | |
Nuveen Investments, Inc. - 144A | | | | | |
10.50%, due 11/15/2015 | | 2,500 | | 2,500 | |
Chemicals (4.1%) | | | | | |
Basell AF Sca -144A | | | | | |
8.38%, due 08/15/2015 ^ | | 3,975 | | 3,558 | |
Equistar Chemicals, LP/Equistar | | | | | |
10.13%, due 09/01/2008 | | 589 | | 608 | |
10.63%, due 05/01/2011 | | 1,143 | | 1,194 | |
Huntsman International LLC | | | | | |
7.38%, due 01/01/2015 | | 2,000 | | 2,115 | |
Huntsman LLC | | | | | |
11.63%, due 10/15/2010 | | 965 | | 1,023 | |
Ineos Group Holdings PLC -144A | | | | | |
8.50%, due 02/15/2016 ^ | | 1,750 | | 1,662 | |
Lyondell Chemical Co. | | | | | |
10.50%, due 06/01/2013 | | 1,000 | | 1,078 | |
Noranda Aluminium Acquisition Corp. -144A | | | | | |
9.36%, due 05/15/2015 * | | 1,800 | | 1,661 | |
Nova Chemicals Corp. | | | | | |
8.48%, due 11/15/2013 * | | 3,600 | | 3,537 | |
Commercial Services & Supplies (1.6%) | | | | | |
Allied Waste North America, Inc. | | | | | |
7.88%, due 04/15/2013 | | 3,170 | | 3,265 | |
Quebecor World, Inc. - 144A | | | | | |
9.75%, due 01/15/2015 | | 3,300 | | 3,218 | |
Computers & Peripherals (1.1%) | | | | | |
Seagate Technology HDD Holdings | | | | | |
6.38%, due 10/01/2011 | | 2,300 | | 2,283 | |
6.80%, due 10/01/2016 | | 2,125 | | 2,088 | |
Consumer Finance (3.3%) | | | | | |
Ford Motor Credit Co. LLC | | | | | |
9.88%, due 08/10/2011 | | 6,000 | | 5,991 | |
GMAC LLC | | | | | |
6.75%, due 12/01/2014 ^ | | 6,600 | | 5,848 | |
7.25%, due 03/02/2011 | | 1,450 | | 1,371 | |
Containers & Packaging (3.3%) | | | | | |
Graphic Packaging International, Inc. | | | | | |
8.50%, due 08/15/2011 | | $ | 3,500 | | $ | 3,552 | |
Jefferson Smurfit Corp. US | | | | | |
8.25%, due 10/01/2012 | | 6,475 | | 6,475 | |
Owens Brockway Glass Container, Inc. | | | | | |
6.75%, due 12/01/2014 | | 3,200 | | 3,208 | |
Diversified Consumer Services (0.6%) | | | | | |
Service Corp. International/US | | | | | |
6.75%, due 04/01/2016 | | 2,500 | | 2,419 | |
Diversified Financial Services (1.3%) | | | | | |
Hawker Beechcraft Acquisition Co. LLC / Hawker Beechcraft Notes Co. - 144A | | | | | |
8.50%, due 04/01/2015 ^ | | 2,135 | | 2,172 | |
9.75%, due 04/01/2017 ^ | | 800 | | 814 | |
Petroplus Finance, Ltd. -144A | | | | | |
6.75%, due 05/01/2014 | | 200 | | 190 | |
7.00%, due 05/01/2017 | | 2,000 | | 1,880 | |
Diversified Telecommunication Services (5.1%) | | | | | |
Cincinnati Bell, Inc. | | | | | |
7.00%, due 02/15/2015 | | 1,200 | | 1,173 | |
7.25%, due 07/15/2013 | | 1,000 | | 1,003 | |
Citizens Communications Co. | | | | | |
6.63%, due 03/15/2015 | | 2,200 | | 2,161 | |
7.13%, due 03/15/2019 | | 2,500 | | 2,462 | |
Level 3 Financing, Inc. | | | | | |
9.25%, due 11/01/2014 | | 3,500 | | 3,299 | |
Qwest Communications International, | | | | | |
7.50%, due 02/15/2014 | | 2,800 | | 2,835 | |
Telcordia Technologies, Inc. - 144A | | | | | |
9.11%, due 07/15/2012 * | | 2,675 | | 2,474 | |
Windstream Corp. | | | | | |
8.63%, due 08/01/2016 | | 4,425 | | 4,735 | |
Electric Utilities (2.4%) | | | | | |
Intergen NV -144A | | | | | |
9.00%, due 06/30/2017 | | 5,900 | | 6,239 | |
Texas Competitive Electric Holdings Co. LLC -144A | | | | | |
10.25%, due 11/01/2015 | | 3,150 | | 3,166 | |
Electronic Equipment & Instruments (2.7%) | | | | | |
Freescale Semiconductor | | | | | |
10.13%, due 12/15/2016 ^ | | 5,150 | | 4,667 | |
Nxp BV / Nxp Funding LLC | | | | | |
8.11%, due 10/15/2013 * | | 6,350 | | 6,017 | |
Food & Staples Retailing (1.3%) | | | | | |
Supervalu, Inc. | | | | | |
7.50%, due 11/15/2014 | | 5,000 | | 5,138 | |
Food Products (2.6%) | | | | | |
Del Monte Corp. | | | | | |
6.75%, due 02/15/2015 | | 250 | | 243 | |
8.63%, due 12/15/2012 | | 3,000 | | 3,060 | |
Dole Food Co., Inc. | | | | | |
7.25%, due 06/15/2010 | | 3,500 | | 3,325 | |
Smithfield Foods, Inc. | | | | | |
7.75%, due 07/01/2017 | | $ | 3,500 | | $ | 3,605 | |
The notes to the financial statements are an integral part of this report.
45
| | Principal | | Value | |
Health Care Equipment & Supplies (1.4%) | | | | | |
Bausch & Lomb, Inc. - 144A | | | | | |
9.88%, due 11/01/2015 | | $ | 2,270 | | $ | 2,338 | |
Universal Hospital Services, Inc. - 144A | | | | | |
8.50%, due 06/01/2015 | | 1,500 | | 1,526 | |
8.76%, due 06/01/2015 * | | 1,500 | | 1,504 | |
Health Care Providers & Services (5.0%) | | | | | |
Community Health Systems, Inc. - 144A | | | | | |
8.88%, due 07/15/2015 ^ | | 5,600 | | 5,670 | |
HCA, Inc./de | | | | | |
9.25%, due 11/15/2016 | | 8,000 | | 8,420 | |
Healthsouth Corp. | | | | | |
10.75%, due 06/15/2016 | | 3,600 | | 3,798 | |
Omnicare, Inc. | | | | | |
6.13%, due 06/01/2013 | | 1,550 | | 1,457 | |
6.88%, due 12/15/2015 | | 600 | | 576 | |
Hotels, Restaurants & Leisure (6.7%) | | | | | |
Caesars Entertainment, Inc. | | | | | |
7.88%, due 03/15/2010 | | 2,000 | | 2,070 | |
Las Vegas Sands Corp. | | | | | |
6.38%, due 02/15/2015 | | 4,750 | | 4,613 | |
MGM Mirage | | | | | |
5.88%, due 02/27/2014 | | 2,500 | | 2,319 | |
6.75%, due 04/01/2013 | | 4,100 | | 3,998 | |
Restaurant Co. (The) | | | | | |
10.00%, due 10/01/2013 ^ | | 2,500 | | 2,106 | |
Seminole Hard Rock Entertainment, | | | | | |
Inc./Seminole Hard Rock International LLC - 144A | | | | | |
8.19%, due 03/15/2014 * | | 4,380 | | 4,281 | |
Speedway Motorsports, Inc. | | | | | |
6.75%, due 06/01/2013 | | 425 | | 420 | |
Station Casinos, Inc. | | | | | |
6.00%, due 04/01/2012 | | 1,000 | | 928 | |
6.50%, due 02/01/2014 | | 2,000 | | 1,670 | |
Turning Stone Resort Casino Enterprise - 144A | | | | | |
9.13%, due 09/15/2014 | | 2,400 | | 2,484 | |
Wynn Las Vegas Capital Corp. | | | | | |
6.63%, due 12/01/2014 | | 2,000 | | 1,965 | |
Household Durables (0.6%) | | | | | |
Jarden Corp. | | | | | |
7.50%, due 05/01/2017 | | 2,660 | | 2,527 | |
Independent Power Producers & Energy Traders (3.7%) | | | | | |
AES Corp. (The) -144A | | | | | |
8.00%, due 10/15/2017 | | 800 | | 807 | |
8.75%, due 05/15/2013 | | 5,000 | | 5,288 | |
Edison Mission Energy | | | | | |
7.50%, due 06/15/2013 | | 2,710 | | 2,747 | |
NRG Energy, Inc. | | | | | |
7.25%, due 02/01/2014 | | 3,750 | | 3,750 | |
NRG Energy, Inc. | | | | | |
7.38%, due 01/15/2017 | | 2,000 | | 1,990 | |
IT Services (4.5%) | | | | | |
Aramark Corp. | | | | | |
8.50%, due 02/01/2015 | | $ | 5,100 | | $ | 5,164 | |
Ceridian Corp. -144A | | | | | |
11.25%, due 11/15/2015 | | 1,600 | | 1,584 | |
12.25%, due 11/15/2015 (1) | | 1,200 | | 1,188 | |
First Data Corp. -144A | | | | | |
9.88%, due 09/24/2015 | | 2,800 | | 2,681 | |
SunGard Data Systems, Inc. | | | | | |
9.13%, due 08/15/2013 | | 4,000 | | 4,080 | |
10.25%, due 08/15/2015 | | 1,275 | | 1,329 | |
Unisys Corp. | | | | | |
8.00%, due 10/15/2012 | | 2,000 | | 1,880 | |
Media (15.8%) | | | | | |
Cablevision Systems Corp. | | | | | |
8.00%, due 04/15/2012 | | 1,000 | | 977 | |
Charter Communications Operating LLC -144A | | | | | |
8.38%, due 04/30/2014 | | 8,500 | | 8,500 | |
Clear Channel Communications, Inc. | | | | | |
5.50%, due 09/15/2014 – 12/15/2016 | | 2,100 | | 1,659 | |
CSC Holdings, Inc. | | | | | |
7.63%, due 04/01/2011 – 07/15/2018 ^ | | 4,200 | | 4,039 | |
DEX Media East LLC | | | | | |
9.88%, due 11/15/2009 | | 1,000 | | 1,026 | |
DEX Media West LLC/DEX Media | | | | | |
8.50%, due 08/15/2010 | | 2,000 | | 2,053 | |
DEX Media, Inc. | | | | | |
8.00%, due 11/15/2013 | | 2,500 | | 2,506 | |
DIRECTV Financing Co. | | | | | |
8.38%, due 03/15/2013 | | 3,450 | | 3,605 | |
Echostar DBS Corp. | | | | | |
6.38%, due 10/01/2011 | | 4,190 | | 4,242 | |
Idearc, Inc. | | | | | |
8.00%, due 11/15/2016 | | 7,125 | | 7,143 | |
Intelsat Bermuda, Ltd. | | | | | |
9.25%, due 06/15/2016 | | 2,500 | | 2,594 | |
Intelsat Corp. | | | | | |
9.00%, due 08/15/2014 – 06/15/2016 | | 2,800 | | 2,860 | |
Intelsat Subsidiary Holding Co., Ltd. | | | | | |
8.63%, due 01/15/2015 | | 3,500 | | 3,553 | |
Knight-Ridder, Inc. | | | | | |
5.75%, due 09/01/2017 | | 2,000 | | 1,613 | |
Lamar Media Corp. -144A | | | | | |
6.63%, due 08/15/2015 | | 1,200 | | 1,149 | |
Medianews Group, Inc. | | | | | |
6.88%, due 10/01/2013 | | 4,000 | | 3,040 | |
Quebecor Media, Inc. | | | | | |
7.75%, due 03/15/2016 | | 4,750 | | 4,596 | |
RH Donnelley Corp. -144A | | | | | |
8.88%, due 01/15/2016 – 10/15/2017 | | 5,675 | | 5,675 | |
Univision Communications, Inc. - 144A | | | | | |
7.85%, due 07/15/2011 | | 500 | | 504 | |
Videotron LTEE | | | | | |
6.88%, due 01/15/2014 | | 1,500 | | 1,496 | |
The notes to the financial statements are an integral part of this report.
46
| | Principal | | Value | |
Metals & Mining (1.5%) | | | | | |
Freeport-McMoRan Copper & Gold, Inc. | | | | | |
8.25%, due 04/01/2015 | | $ | 2,635 | | $ | 2,846 | |
Steel Dynamics, Inc. - 144A | | | | | |
7.38%, due 11/01/2012 | | 3,200 | | 3,200 | |
Multiline Retail (0.9%) | | | | | |
BON-TON Stores, Inc. (The) | | | | | |
10.25%, due 03/15/2014 ^ | | 4,125 | | 3,609 | |
Oil, Gas & Consumable Fuels (12.1%) | | | | | |
Chesapeake Energy Corp. | | | | | |
6.88%, due 01/15/2016 | | 1,000 | | 995 | |
7.00%, due 08/15/2014 | | 3,000 | | 3,015 | |
7.50%, due 09/15/2013 | | 1,000 | | 1,028 | |
Cimarex Energy Co. | | | | | |
7.13%, due 05/01/2017 | | 3,700 | | 3,695 | |
Dynegy Holdings, Inc. - 144A | | | | | |
7.50%, due 06/01/2015 | | 1,000 | | 955 | |
7.75%, due 06/01/2019 | | 3,800 | | 3,567 | |
Forest Oil Corp. | | | | | |
7.75%, due 05/01/2014 | | 275 | | 278 | |
Kinder Morgan Finance Co. Ulc | | | | | |
5.70%, due 01/05/2016 | | 6,600 | | 6,008 | |
Mariner Energy, Inc. | | | | | |
8.00%, due 05/15/2017 | | 2,425 | | 2,395 | |
Newfield Exploration Co. | | | | | |
6.63%, due 09/01/2014 | | 2,500 | | 2,456 | |
Opti Canada, Inc. - 144A | | | | | |
7.88%, due 12/15/2014 | | 2,500 | | 2,481 | |
8.25%, due 12/15/2014 | | 500 | | 501 | |
Peabody Energy Corp. | | | | | |
7.38%, due 11/01/2016 | | 4,000 | | 4,160 | |
Pioneer Natural Resources Co. | | | | | |
6.65%, due 03/15/2017 | | 3,750 | | 3,533 | |
Plains Exploration & Production Co. | | | | | |
7.00%, due 03/15/2017 | | 2,175 | | 2,066 | |
7.75%, due 06/15/2015 | | 3,000 | | 2,985 | |
Verasun Energy Corp. -144A | | | | | |
9.38%, due 06/01/2017 ^ | | 3,325 | | 2,735 | |
9.88%, due 12/15/2012 | | 2,540 | | 2,518 | |
Whiting Petroleum Corp. | | | | | |
7.00%, due 02/01/2014 | | 3,000 | | 2,951 | |
Paper & Forest Products (3.5%) | | | | | |
Boise Cascade LLC | | | | | |
7.13%, due 10/15/2014 | | 1,500 | | 1,477 | |
Domtar, Inc. | | | | | |
7.88%, due 10/15/2011 | | 4,900 | | 5,035 | |
Georgia-Pacific Corp. -144A | | | | | |
7.00%, due 01/15/2015 | | 7,500 | | 7,350 | |
Personal Products (0.6%) | | | | | |
del Laboratories, Inc. | | | | | |
10.36%, due 11/01/2011 * | | 2,485 | | 2,535 | |
Real Estate Investment Trusts (0.5%) | | | | | |
Host Marriott, LP | | | | | |
7.13%, due 11/01/2013 | | 2,000 | | 2,030 | |
Real Estate Management & Development (1.0%) | | | | | |
Realogy Corp. -144A | | | | | |
10.50%, due 04/15/2014 ^ | | 4,930 | | 4,098 | |
Road & Rail (0.8%) | | | | | |
Hertz Corp. | | | | | |
8.88%, due 01/01/2014 | | $ | 3,000 | | $ | 3,090 | |
Semiconductors & Semiconductor Equipment (0.7%) | | | | | |
Stats ChipPAC, Ltd. | | | | | |
6.75%, due 11/15/2011 | | 2,750 | | 2,750 | |
Specialty Retail (0.5%) | | | | | |
Blockbuster, Inc. | | | | | |
9.00%, due 09/01/2012 ^ | | 2,400 | | 2,160 | |
Textiles, Apparel & Luxury Goods (0.9%) | | | | | |
Levi Strauss & Co. | | | | | |
9.75%, due 01/15/2015 | | 3,500 | | 3,653 | |
Total Corporate Debt Securities (cost $386,438) | | | | 382,281 | |
| | | | | |
COMMON STOCKS (0.0%) | | | | | |
Media (0.0%) | | | | | |
Golden Books Family Entertainment, Inc. ‡ | | 63,750 | | — | o |
| | | | | |
Total Common Stocks (cost $169) | | | | — | o |
| | | | | |
Total Security Lending Collateral (cost $30,525) ± | | | | 30,525 | |
Total Investment Securities (cost $417,132) # | | | | $ | 412,806 | |
The notes to the financial statements are an integral part of this report.
47
NOTES TO SCHEDULE OF INVESTMENTS
o | | Value is less than $1. |
^ | | At October 31, 2007, all or a portion of this security is on loan (see Note 1). The value at October 31, 2007, of all securities on loan is $29,711. |
* | | Floating or variable rate note. Rate is listed as of October 31, 2007. |
± | | Cash collateral for the Repurchase Agreements, valued at $5,571, that serve as collateral for securities lending, are invested in corporate and government bonds with interest rates and maturity dates ranging from 0.00% - 8.125% and 11/14/2007 - 9/15/2037. |
‡ | | Non Income Producing |
(1) | | Payment in Kind |
# | | Aggregate cost for federal income tax purposes is $417,132. Aggregate gross unrealized appreciation for all securities in which there is an excess of value over tax cost and aggregate gross unrealized depreciation for all securities in which there is an excess of tax cost over value were $3,727 and $8,053, respectively. Net unrealized depreciation for tax purposes is $4,326. |
| | |
DEFINITIONS: |
144A | | 144A Securities are registered pursuant to Rule 144A of the Securities Act of 1933. These securities are deemed to be liquid for purposes of compliance limitations on holdings of illiquid securities and may be resold as transactions exempt from registration, normally to qualified institutional buyers. At October 31, 2007, these securities aggregated $95,346 or 23.96% of net assets of the Fund |
The notes to the financial statements are an integral part of this report.
48
TA IDEX Transamerica Money Market
UNDERSTANDING YOUR FUND’S EXPENSES
(unaudited)
SHAREHOLDER EXPENSES
Fund shareholders may incur two types of costs: (1) transaction costs, including sales charges (loads) on purchases, contingent deferred sales charges on redemptions and redemption fees; and (2) ongoing costs, including management fees, 12b-1 distribution and service fees, and other fund expenses.
The following Example is intended to help you understand your ongoing costs (in dollars and cents) of investing in the Fund and to compare these costs with the ongoing costs of investing in other funds.
The Example is based on an investment of $1,000 invested at May 1, 2007 and held for the entire period until October 31, 2007.
ACTUAL EXPENSES
The first line in the table below provides information about actual account values and actual expenses. You may use the information in this line, together with the amount you invested, to estimate the expenses that you paid over the period. Simply divide your account value by $1,000 (for example, an $8,600 account value divided by $1,000 = 8.6), then multiply the result by the number in the first line of your Fund under the heading entitled “Expenses Paid During Period” to estimate the expenses you paid on your account during this period. If your account is an IRA, your expenses could have included a $15 annual fee. The amount of any fee paid through your account would increase the estimate of expenses you paid during the period and decrease your ending account value.
HYPOTHETICAL EXAMPLE FOR COMPARISON PURPOSES
The second line in the table below provides information about hypothetical account values and hypothetical expenses based on the Fund’s actual expense ratio and an assumed rate of return of 5% per year before expenses, which is not the Fund’s actual return. The hypothetical account values and expenses may not be used to estimate the actual ending account balance or expenses you paid for the period. You may use this information to compare the ongoing costs of investing in your Fund and other funds. To do so, compare this 5% hypothetical example with the 5% hypothetical examples that appear in the shareholder reports of the other funds. As in the case of the actual expense example, if your account is subject to an IRA fee, the amount of the fee paid through your account would increase the hypothetical expenses you would have paid during the period and decrease the hypothetical ending account value.
Please note that the expenses shown in the table are meant to highlight your ongoing costs only and do not reflect any transactional costs, such as sales charges, redemption fees, brokerage commissions paid on purchases and sales of fund shares. Therefore, the second line under the Fund in the table is useful in comparing ongoing costs only, and will not help you determine the relative total costs of owning different funds. If any of these transaction costs were included, your costs would be higher. The expenses shown in the table do not reflect any fees that may be charged to you by brokers, financial intermediaries or other financial institutions.
| | Beginning | | Ending | | Annualized | | Expenses | |
| | Account | | Account | | Expense | | Paid During | |
| | Value | | Value | | Ratio | | Period (a) | |
Class A | | | | | | | | | |
Actual | | $ | 1,000.00 | | $ | 1,022.97 | | 0.83 | % | $ | 4.22 | |
Hypothetical (b) | | 1,000.00 | | 1,020.96 | | 0.83 | | 4.22 | |
| | | | | | | | | |
Class B | | | | | | | | | |
Actual | | 1,000.00 | | 1,019.54 | | 1.48 | | 7.52 | |
Hypothetical (b) | | 1,000.00 | | 1,017.69 | | 1.48 | | 7.51 | |
| | | | | | | | | |
Class C | | | | | | | | | |
Actual | | 1,000.00 | | 1,019.56 | | 1.48 | | 7.52 | |
Hypothetical (b) | | 1,000.00 | | 1,017.69 | | 1.48 | | 7.52 | |
| | | | | | | | | |
Class I | | | | | | | | | |
Actual | | 1,000.00 | | 1,024.72 | | 0.48 | | 2.45 | |
Hypothetical (b) | | 1,000.00 | | 1,022.72 | | 0.48 | | 2.45 | |
| | | | | | | | | | | | |
(a) Expenses are calculated using the fund’s annualized expense ratio (as disclosed in the table), multiplied by the average account value for the period, multiplied by the number of days in the period (184 days), and divided by the number of days in the year (365 days).
(b) 5% return per year before expenses.
GRAPHICAL PRESENTATION OF SCHEDULE OF INVESTMENTS
By Maturity Distribution
At October 31, 2007

This chart shows the percentage breakdown by maturity distribution of the Fund’s total investment securities.
49
SCHEDULE OF INVESTMENTS
At October 31, 2007
(all amounts except share amounts in thousands)
| | Principal | | Value | |
COMMERCIAL PAPER (97.8%) | | | | | |
Beverages (4.0%) | | | | | |
Coca-Cola Co. (The) | | | | | |
5.25%, due 11/30/2007 – 12/14/2007 | | $ | 6,950 | | $ | 6,912 | |
Commercial Banks (22.5%) | | | | | |
Canadian Imperial Holdings, Inc. | | | | | |
4.65%, due 01/02/2008 | | 1,800 | | 1,786 | |
5.49%, due 11/14/2007 | | 4,800 | | 4,790 | |
HBOS Treasury Services PLC | | | | | |
5.07%, due 11/02/2007 – 11/16/2007 | | 3,970 | | 3,962 | |
5.25%, due 11/01/2007 | | 1,087 | | 1,087 | |
Royal Bank of Scotland PLC (The) | | | | | |
5.36%, due 11/26/2007 | | 4,450 | | 4,433 | |
5.56%, due 12/07/2007 | | 4,300 | | 4,276 | |
Toronto Domin Holding -144A | | | | | |
4.73%, due 11/30/2007 | | 1,800 | | 1,793 | |
4.78%, due 11/28/2007 – 11/29/2007 | | 5,500 | | 5,480 | |
4.87%, due 11/06/2007 | | 1,250 | | 1,249 | |
UBS Finance Delaware LLC | | | | | |
4.86%, due 01/22/2008 | | 700 | | 692 | |
5.01%, due 01/28/2008 | | 1,000 | | 988 | |
5.40% to 5.40%, due 01/14/2008 – 01/17/2008 | | 3,900 | | 3,857 | |
5.61%, due 11/05/2007 | | 2,500 | | 2,498 | |
Wells Fargo & Co. | | | | | |
4.79%, due 11/07/2007 | | 2,200 | | 2,198 | |
Consumer Finance (16.1%) | | | | | |
American Express Credit Corp. | | | | | |
5.27%, due 11/21/2007 | | 2,400 | | 2,393 | |
5.29%, due 11/08/2007 – 11/09/2007 | | 6,300 | | 6,293 | |
American Honda Finance Corp. | | | | | |
5.25%, due 11/07/2007 | | 2,050 | | 2,048 | |
PACCAR Financial Corp. | | | | | |
5.25%, due 11/16/2007 | | 2,600 | | 2,594 | |
5.26%, due 11/13/2007 – 11/15/2007 | | 4,800 | | 4,791 | |
5.35%, due 11/19/2007 | | 1,100 | | 1,097 | |
Toyota Motor Credit Corp. | | | | | |
4.83%, due 12/17/2007 | | 1,600 | | 1,590 | |
5.26%, due 11/14/2007 | | 1,500 | | 1,497 | |
5.28%, due 12/20/2007 | | 5,600 | | 5,560 | |
Diversified Financial Services (38.4%) | | | | | |
Corporate Asset Funding Co., Inc. - 144A | | | | | |
5.03%, due 12/21/2007 | | 2,550 | | 2,532 | |
5.05%, due 01/29/2008 | | 5,150 | | 5,086 | |
5.07%, due 11/27/2007 | | 1,100 | | 1,096 | |
General Electric Capital Corp. | | | | | |
4.25%, due 01/15/2008 | | 3,000 | | 2,994 | |
International Lease Finance Corp. | | | | | |
4.73%, due 02/05/2008 | | 1,300 | | 1,284 | |
4.78%, due 11/15/2007 | | 2,200 | | 2,196 | |
4.79%, due 11/09/2007 – 11/19/2007 | | 3,450 | | 3,444 | |
5.25%, due 11/13/2007 | | 1,675 | | 1,672 | |
Merrill Lynch & Co., Inc. | | | | | |
4.79%, due 12/04/2007 | | $ | 2,600 | | $ | 2,589 | |
4.80%, due 11/01/2007 – 11/20/2007 | | 2,950 | | 2,945 | |
5.27%, due 12/06/2007 | | 3,000 | | 2,985 | |
Met-Life Funding, Inc. | | | | | |
4.70%, due 12/07/2007 | | 1,050 | | 1,045 | |
4.77%, due 11/14/2007 | | 2,600 | | 2,596 | |
Old Line Funding Corp. -144A | | | | | |
5.10%, due 12/12/2007 | | 2,000 | | 1,988 | |
Rabobank USA FINL Corp. | | | | | |
4.70%, due 11/07/2007 | | 1,200 | | 1,199 | |
4.83%, due 11/01/2007 | | 1,000 | | 1,000 | |
4.86%, due 01/04/2008 | | 3,550 | | 3,519 | |
4.90%, due 11/13/2007 | | 2,900 | | 2,895 | |
Ranger Funding Co. LLC -144A | | | | | |
5.10%, due 12/13/2007 | | 1,650 | | 1,640 | |
5.12%, due 01/11/2008 | | 1,400 | | 1,386 | |
5.15%, due 12/14/2007 | | 2,525 | | 2,509 | |
5.50%, due 12/07/2007 | | 3,114 | | 3,097 | |
State Street Boston Corp. | | | | | |
4.82%, due 11/28/2007 | | 500 | | 498 | |
4.96%, due 01/16/2008 | | 2,300 | | 2,276 | |
4.97%, due 01/14/2008 | | 1,600 | | 1,584 | |
5.01%, due 11/15/2007 | | 2,000 | | 1,996 | |
Unilever Capital Corp. -144A | | | | | |
5.25%, due 11/29/2007 – 12/07/2007 | | 8,600 | | 8,560 | |
Food & Staples Retailing (1.3%) | | | | | |
Wal-Mart Stores, Inc. - 144A | | | | | |
4.74%, due 12/18/2007 | | 2,300 | | 2,286 | |
Industrial Conglomerates (2.1%) | | | | | |
General Electric Co. | | | | | |
4.85%, due 12/26/2007 | | 3,600 | | 3,573 | |
Insurance (0.8%) | | | | | |
Prudential Funding LLC | | | | | |
4.80%, due 12/03/2007 | | 1,450 | | 1,444 | |
Metals & Mining (4.9%) | | | | | |
BHP Bill Finance USA, Ltd. -144A | | | | | |
4.68%, due 12/04/2007 | | 2,100 | | 2,091 | |
4.73%, due 11/02/2007 | | 1,500 | | 1,500 | |
4.88%, due 11/08/2007 | | 1,650 | | 1,648 | |
4.90%, due 11/06/2007 | | 3,250 | | 3,248 | |
Multiline Retail (3.5%) | | | | | |
Walgreen Co. - 144A | | | | | |
4.55%, due 11/15/2007 | | 5,100 | | 5,091 | |
4.60%, due 11/20/2007 | | 900 | | 898 | |
Oil, Gas & Consumable Fuels (4.2%) | | | | | |
Total Capital SA -144A | | | | | |
4.77%, due 12/21/2007 | | 575 | | 571 | |
4.80%, due 11/23/2007 | | 2,400 | | 2,393 | |
4.81%, due 12/31/2007 | | 900 | | 893 | |
5.25%, due 11/15/2007 | | 3,400 | | 3,393 | |
Total Commercial Paper (cost $169,506) | | | | 169,506 | |
The notes to the financial statements are an integral part of this report.
50
| | Principal | | Value | |
CERTIFICATE OF DEPOSIT (2.5%) | | | | | |
Commercial Banks (2.5%) | | | | | |
Canadian Imperial Bank of Commerce | | | | | |
5.31%, due 11/01/2007 | | $ | 1,900 | | $ | 1,900 | |
HBOS Treasury Services NY | | | | | |
5.12%, due 01/08/2008 | | 1,050 | | 1,050 | |
Wells Fargo Bank NA | | | | | |
4.75%, due 11/20/2007 | | 1,400 | | 1,400 | |
Total Certificate of Deposit (cost $4,350) | | | | 4,350 | |
Total Investment Securities (cost $173,856) # | | | | $ | 173,856 | |
| | | | | | | |
NOTES TO SCHEDULE OF INVESTMENTS
# | Aggregate cost for federal income tax purposes is $173,856. |
| |
DEFINITIONS: |
144A | 144A Securities are registered pursuant to Rule 144A of the Securities Act of 1933. These securities are deemed to be liquid for purposes of compliance limitations on holdings of illiquid securities and may be resold as transactions exempt from registration, normally to qualified institutional buyers. At October 31, 2007, these securities aggregated $34,275 or 19.77% of net assets of the Fund |
The notes to the financial statements are an integral part of this report.
51
TA IDEX Transamerica Science & Technology
MARKET ENVIRONMENT
U.S. equities overcame big challenges in the twelve months ended October 31, 2007, to generate positive returns. The market struggled against the implications of weakness in the U.S. housing market. Because losses in home equity influence the major engine of economic growth, consumer spending, the downturn raised concerns that the economy and corporate profits would deteriorate as well. Added to this were fears that escalating energy prices, rising defaults for low-quality (sub-prime) mortgages and a liquidity crisis in the debt markets would push interest rates higher, further undermining the prospects for housing.
These problems notwithstanding, economic growth and corporate earnings remained healthy, buoyed by a robust global economy and strong demand for U.S. exports. Other positives included growth in U.S. manufacturing, higher personal incomes, brisk spending on commercial construction and late-period interest-rate cuts by the Federal Reserve Board (“Fed”). Against this backdrop, worldwide demand for new technologies continued to expand, and information technology stocks fared better than the market in general. The Dow Jones U.S. Technology Index (“DJ Technology”) achieved a twelve-month total return of 27.15%, versus 14.56% for the Standard and Poor’s 500 Composite Stock Index.
PERFORMANCE
For the year ended October 31, 2007, TA IDEX Transamerica Science & Technology, Class A returned 45.01%. By comparison its primary and former benchmarks, the DJ Technology and the NASDAQ 100 Index, returned 27.15% and 29.23%, respectively. For the year ended October 31, 2007, the Fund’s net expense ratios for Class A, Class B, Class C, and Class I were 1.55%, 2.19%, 2.15%, and 0.92%, respectively.
STRATEGY REVIEW
We seek well-run businesses that are positioned to benefit from at least one of several long-term secular trends. Among these are the digitization of media for mass consumer adoption; development and delivery of alternative energy; the unique application of technology to gain a competitive edge; or the development of biotechnology products and treatments that improve the quality and efficacy of health care. Reflecting these parameters, the portfolio was diversified across eight market sectors ranging from consumer discretionary to telecommunications services, with the largest weighting in information technology.
The portfolio’s outperformance can be attributed primarily to four stocks: Research in Motion Limited (“RIMM”), Apple Inc. (“Apple”), Intuitive Surgical, Inc. (“Intuitive Surgical”) and SunPower Corporation (“SunPower”). RIMM posted a triple-digit gain due to the continued successful expansion of its product line for businesses and the introduction of new products for consumers. Apple’s gains reflected continued dominance in the personal music player (i.e., iPod) business, the introduction of the iPhone (an all-in-one iPod, wireless e-mail device and camera phone) and a “halo effect” from the iPod and iPhone that boosted sales of the company’s personal computers. Shares of Intuitive Surgical, which develops systems for robotically assisted, minimally invasive surgery, rose rapidly after the company announced a double-digit rise in quarterly earnings. SunPower, a vertically integrated provider of solar energy panels, chalked up strong gains after the acquisition of a leading nationwide solar-panel installation company allowed it to dramatically increase distribution, sales and earnings.
Among the handful of stocks in the portfolio with negative returns for the period, the biggest detractor was Shuffle Master, Inc., a maker of automatic shufflers and other gaming-industry products.
Kirk J. Kim
Joshua D. Shaskan, CFA
Gary U. Rollé, CFA
Jeffrey J. Hoo, CFA
Co-Portfolio Managers
Transamerica Investment Management, LLC
52
TA IDEX Transamerica Science & Technology
(unaudited)
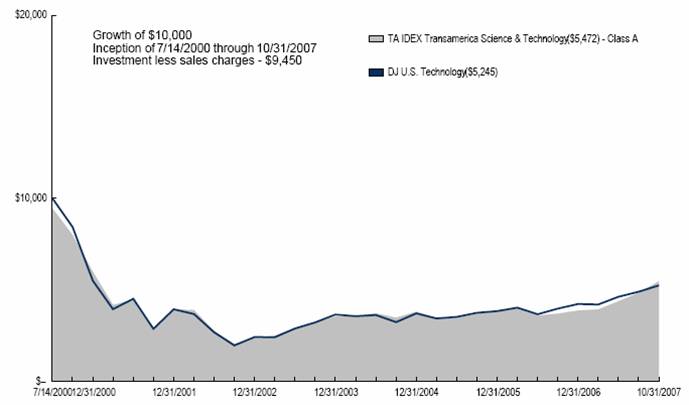
Average Annual Total Return for Periods Ended 10/31/2007
| | | | | | From | | Inception | |
| | 1 Year | | 5 Years | | Inception | | Date | |
Class A (NAV) | | 45.01 | % | 17.73 | % | (7.21 | )% | 7/14/00 | |
Class A (POP) | | 36.96 | % | 16.40 | % | (7.93 | )% | 7/14/00 | |
DJ U.S. Technology (1) | | 27.15 | % | 16.93 | % | (8.24 | )% | 7/14/00 | |
NASDAQ 100 (1) | | 29.23 | % | 17.74 | % | (7.50 | )% | 7/14/00 | |
| | | | | | | | | |
Class B (NAV) | | 44.39 | % | 16.99 | % | (7.91 | )% | 7/14/00 | |
Class B (POP) | | 39.39 | % | 16.88 | % | (7.91 | )% | 7/14/00 | |
| | | | | | | | | |
Class C (NAV) | | 44.50 | % | — | % | 17.52 | % | 11/11/02 | |
Class C (POP) | | 43.50 | % | — | % | 17.52 | % | 11/11/02 | |
| | | | | | | | | |
Class I (NAV) | | 46.06 | % | — | % | 21.38 | % | 11/15/05 | |
NOTES
(1) The Dow Jones U.S. Technology (DJ Technology) Index and the NASDAQ 100 (NASDAQ) Index are managed indices used as a general measure of market performance. Calculations assume dividends and capital gains are reinvested and do not include any managerial expenses. From inception calculation is based on life of Class A shares.
The performance data presented represents past performance, future results may vary. Performance data does not reflect the deduction of taxes that would be paid on fund distributions nor the redemption of fund shares. Investment return and principal value will fluctuate so that an investor’s shares, when redeemed, may be worth more or less than their original cost. Current performance may be lower or higher than performance quoted. Please see www.transamericaidex.com for performance data current to the most recent month-end. Public Offering Price (POP) returns include the reinvestment of dividends and capital gains and reflect the maximum sales charge of 5.5% for A shares or the maximum applicable contingent deferred sales charge (5% in the 1st year, decreasing to 0% after 6 years) for Class B shares and 1% (during the first 12 months) for Class C shares. Shares purchased prior to March 1, 2004 are subject to a maximum applicable contingent deferred sales charge (5% in the 1st year, decreasing to 0% after 7 years) for Class B shares and (2% in the 1st year, decreasing to 0% after 2 years) for ClassC shares. Net Asset Value (NAV) returns include the reinvestment of dividends and capital gains but do not reflect any sales charges.
Investing in technology stocks generally involves greater volatility and risks, so an investment in the Fund may not be appropriate for everyone. The Fund is non-diversified. Investments in a “non-diversified” fund may be subject to specific risks such as susceptibility to single economic, political or regulatory events, and may be subject to greater loss than investments in a diversified fund. This material must be preceded or accompanied by a current prospectus, which includes specific contents regarding the investment objectives and policies of this Fund. Effective October 27, 2006, the portfolio changed its name from TA IDEX Great Companies-TechnologySM to TA IDEX Transamerica Science & Technology and changed its sub-adviser from Great Companies, L.L.C. to Transamerica Investment Management, LLC.
53
UNDERSTANDING YOUR FUND’S EXPENSES
(unaudited)
SHAREHOLDER EXPENSES
Fund shareholders may incur two types of costs: (1) transaction costs, including sales charges (loads) on purchases, contingent deferred sales charges on redemptions and redemption fees; and (2) ongoing costs, including management fees, 12b-1 distribution and service fees, and other fund expenses.
The following Example is intended to help you understand your ongoing costs (in dollars and cents) of investing in the Fund and to compare these costs with the ongoing costs of investing in other funds.
The Example is based on an investment of $1,000 invested at May 1, 2007 and held for the entire period until October 31, 2007.
ACTUAL EXPENSES
The first line in the table below provides information about actual account values and actual expenses. You may use the information in this line, together with the amount you invested, to estimate the expenses that you paid over the period. Simply divide your account value by $1,000 (for example, an $8,600 account value divided by $1,000 = 8.6), then multiply the result by the number in the first line of your Fund under the heading entitled “Expenses Paid During Period” to estimate the expenses you paid on your account during this period. If your account is an IRA, your expenses could have included a $15 annual fee. The amount of any fee paid through your account would increase the estimate of expenses you paid during the period and decrease your ending account value.
HYPOTHETICAL EXAMPLE FOR COMPARISON PURPOSES
The second line in the table below provides information about hypothetical account values and hypothetical expenses based on the Fund’s actual expense ratio and an assumed rate of return of 5% per year before expenses, which is not the Fund’s actual return. The hypothetical account values and expenses may not be used to estimate the actual ending account balance or expenses you paid for the period. You may use this information to compare the ongoing costs of investing in your Fund and other funds. To do so, compare this 5% hypothetical example with the 5% hypothetical examples that appear in the shareholder reports of the other funds. As in the case of the actual expense example, if your account is subject to an IRA fee, the amount of the fee paid through your account would increase the hypothetical expenses you would have paid during the period and decrease the hypothetical ending account value.
Please note that the expenses shown in the table are meant to highlight your ongoing costs only and do not reflect any transactional costs, such as sales charges, redemption fees, brokerage commissions paid on purchases and sales of fund shares. Therefore, the second line under the Fund in the table is useful in comparing ongoing costs only, and will not help you determine the relative total costs of owning different funds. If any of these transaction costs were included, your costs would be higher. The expenses shown in the table do not reflect any fees that may be charged to you by brokers, financial intermediaries or other financial institutions.
| | Beginning | | Ending | | Annualized | | Expenses | |
| | Account | | Account | | Expense | | Paid During | |
| | Value | | Value | | Ratio | | Period (a) | |
Class A | | | | | | | | | |
Actual | | $ | 1,000.00 | | $ | 1,353.22 | | 1.53 | % | $ | 9.07 | |
Hypothetical (b) | | 1,000.00 | | 1,017.42 | | 1.53 | | 7.78 | |
| | | | | | | | | |
Class B | | | | | | | | | |
Actual | | 1,000.00 | | 1,350.00 | | 2.18 | | 12.91 | |
Hypothetical (b) | | 1,000.00 | | 1,014.15 | | 2.18 | | 11.07 | |
| | | | | | | | | |
Class C | | | | | | | | | |
Actual | | 1,000.00 | | 1,350.88 | | 2.18 | | 12.92 | |
Hypothetical (b) | | 1,000.00 | | 1,014.15 | | 2.18 | | 11.07 | |
| | | | | | | | | |
Class I | | | | | | | | | |
Actual | | 1,000.00 | | 1,356.98 | | 0.93 | | 5.53 | |
Hypothetical (b) | | 1,000.00 | | 1,020.45 | | 0.93 | | 4.74 | |
| | | | | | | | | | | | |
(a) Expenses are calculated using the fund’s annualized expense ratio (as disclosed in the table), multiplied by the average account value for the period, multiplied by the number of days in the period (184 days), and divided by the number of days in the year (365 days).
(b) 5% return per year before expenses.
GRAPHICAL PRESENTATION OF SCHEDULE OF INVESTMENTS
By Industry
At October 31, 2007
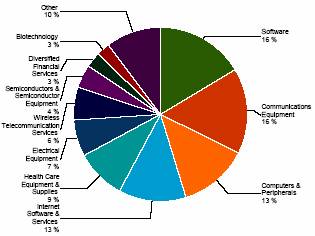
This chart shows the percentage breakdown by industry of the Fund’s total investment securities.
54
SCHEDULE OF INVESTMENTS
At October 31, 2007
(all amounts except share amounts in thousands)
| | Shares | | Value | |
COMMON STOCKS (99.9%) | | | | | |
Biotechnology (2.5%) | | | | | |
Gilead Sciences, Inc. ‡ | | 54,000 | | $ | 2,494 | |
Communications Equipment (15.9%) | | | | | |
F5 Networks, Inc. ‡ | | 60,000 | | 2,162 | |
Foundry Networks, Inc. ‡ | | 67,825 | | 1,434 | |
Polycom, Inc. ‡^ | | 64,500 | | 1,805 | |
Qualcomm, Inc. | | 40,870 | | 1,746 | |
Research In Motion, Ltd. ‡ | | 55,600 | | 6,923 | |
Riverbed Technology, Inc. ‡ | | 52,130 | | 1,761 | |
Computers & Peripherals (12.9%) | | | | | |
Apple, Inc. ‡ | | 33,750 | | 6,411 | |
EMC Corp. ‡ | | 167,200 | | 4,245 | |
Logitech International SA ‡ | | 64,000 | | 2,260 | |
Diversified Financial Services (2.8%) | | | | | |
CME Group, Inc. Class A | | 4,250 | | 2,832 | |
Diversified Telecommunication Services (1.5%) | | | | | |
AT&T, Inc. | | 36,850 | | 1,540 | |
Electrical Equipment (6.8%) | | | | | |
Fuelcell Energy, Inc. ‡^ | | 148,000 | | 1,489 | |
Sunpower Corp. Class A ‡^ | | 41,900 | | 5,299 | |
Electronic Equipment & Instruments (2.2%) | | | | | |
Trimble Navigation, Ltd. ‡ | | 53,000 | | 2,210 | |
Health Care Equipment & Supplies (9.3%) | | | | | |
Intuitive Surgical, Inc. ‡ | | 18,850 | | 6,161 | |
NuVasive, Inc. ‡^ | | 73,000 | | 3,124 | |
Health Care Technology (1.5%) | | | | | |
Cerner Corp. ‡^ | | 24,500 | | 1,459 | |
Hotels, Restaurants & Leisure (1.5%) | | | | | |
International Game Technology | | 34,000 | | 1,483 | |
Household Durables (1.8%) | | | | | |
Harman International Industries, Inc. | | 21,400 | | 1,802 | |
Internet & Catalog Retail (1.8%) | | | | | |
Shutterfly, Inc. ‡^ | | 52,500 | | $ | 1,752 | |
Internet Software & Services (12.6%) | | | | | |
Akamai Technologies, Inc. ‡^ | | 42,200 | | 1,654 | |
Equinix, Inc. ‡^ | | 34,100 | | 3,978 | |
Google, Inc. Class A ‡ | | 7,120 | | 5,034 | |
Valueclick, Inc. ‡ | | 68,200 | | 1,854 | |
Semiconductors & Semiconductor Equipment (4.3%) | | | | | |
NVIDIA Corp. ‡ | | 56,000 | | 1,981 | |
Sirf Technology Holdings, Inc. ‡^ | | 78,300 | | 2,334 | |
Software (16.4%) | | | | | |
Activision, Inc. ‡ | | 91,000 | | 2,152 | |
Adobe Systems, Inc. ‡ | | 39,500 | | 1,892 | |
Informatica Corp. ‡ | | 114,490 | | 1,955 | |
Macrovision Corp. ‡ | | 84,650 | | 2,032 | |
Nintendo Co., Ltd. | | 1,700 | | 1,060 | |
Nuance Communications, Inc. ‡^ | | 68,500 | | 1,515 | |
Salesforce.Com, Inc. ‡^ | | 51,800 | | 2,920 | |
Synchronoss Technologies, Inc. ‡^ | | 53,500 | | 2,140 | |
Veraz Networks, Inc. ‡ | | 86,000 | | 690 | |
Wireless Telecommunication Services (6.1%) | | | | | |
American Tower Corp. Class A ‡ | | 36,000 | | 1,590 | |
Metropcs Communications, Inc. ‡^ | | 127,450 | | $ | 2,868 | |
NII Holdings, Inc. ‡ | | 27,600 | | 1,601 | |
Total Common Stocks (cost $66,660) | | | | 99,642 | |
Total Security Lending Collateral (cost $22,564) ± | | | | 22,564 | |
Total Investment Securities (cost $89,225) # | | | | $ | 122,206 | |
| | | | | | | |
NOTES TO SCHEDULE OF INVESTMENTS |
^ | | At October 31, 2007, all or a portion of this security is on loan (see Note 1). The value at October 31, 2007, of all securities on loan is $21,900. |
± | | Cash collateral for the Repurchase Agreements, valued at $4,118, that serve as collateral for securities lending, are invested in corporate and government bonds with interest rates and maturity dates ranging from 0.00% - 8.125% and 11/14/2007 - 9/15/2037. |
‡ | | Non Income Producing |
# | | Aggregate cost for federal income tax purposes is $89,224. Aggregate gross unrealized appreciation for all securities in which there is an excess of value over tax cost and aggregate gross unrealized depreciation for all securities in which there is an excess of tax cost over value were $34,410 and $1,428, respectively. Net unrealized appreciation for tax purposes is $32,982. |
The notes to the financial statements are an integral part of this report.
55
TA IDEX Transamerica Small/Mid Cap Value
MARKET ENVIRONMENT
After dominating the market since 2002, value stocks ceded leadership to growth stocks during the twelve months ended October 31, 2007. A key reason was the U.S. economic cycle, which showed intermittent signs of slowing. That in turn was due largely to weakness in the housing market, intensified by a crisis in the mortgage and credit industries.
Against this backdrop, investors reasoned that companies with stronger growth in earnings per shares (growth stocks) would hold up better than companies with less earnings momentum (value stocks). Investor sentiment shifted strongly toward market sectors that are traditionally safe havens in a slow-growth environment (consumer staples) and sectors where secular growth trends will likely insulate companies from a tepid economy. At the same time, the market turned away from sectors that were greatly affected by the housing market slump, most notably consumer discretionary and financial services stocks.
PERFORMANCE
For the year ended October 31, 2007, TA IDEX Transamerica Small/Mid Cap Value, Class A returned 36.99%. By comparison its benchmark, the Russell 2500 Value Index, returned 4.63%. For the year ended October 31, 2007, the Fund’s net expense ratios for Class A, Class B, Class C, and Class I were 1.41%, 2.07%, 2.04%, and 0.85%, respectively.
STRATEGY REVIEW
Throughout the period, we believed that an economic slowdown was merely a matter of time; the underlying housing-related issues – overbuilding and excessive lending to poorly qualified buyers – are sizable and will take time to resolve. Furthermore, we believed the Federal Reserve Board’s (“Fed”) ability to help the situation, by reducing interest rates, was limited by the larger, global environment. Rapid economic expansion in nations like China and India spurred enormous demand and higher prices for finished goods, services and, most importantly, raw materials. The inflationary pressures made it difficult for the Fed to reduce rates; it did so only when the housing- and credit-related issues reached crisis level.
In keeping with our concerns about the economy and inflation, we overweighted businesses in industries that stood to benefit from rising demand for commodities (e.g., energy, materials/processing, producer durables and shipping), while underweighting companies dependent on U.S. interest rates (mostly financials) and being selective about consumer stocks. The portfolio’s strongly positive results were due largely to our emphasis on shipping and materials/processing stocks and our careful approach to the consumer sector.
The top contributors included DryShips Inc. and Genco Shipping & Trading Limited, both transporters of dry bulk items. Because global demand for raw materials is growing faster than the worldwide supply of tankers, charter prices set new highs this year, boosting profits for shippers. Other major contributors were Aegean Marine Petroleum Network Inc. (“Aegean”), McDermott International, Inc. (“McDermott”), and FTI Consulting, Inc. (“FTI”). Aegean provides fueling services to commercial vessels (e.g., oil tankers, cruise ships and ferries). McDermott provides engineering and construction services to oil and gas production companies, nuclear power plants and coal-fired power generators. FTI advises on corporate governance, compliance and other strategic management issues. An acquisition in Europe allowed FTI to expand its reach and opportunities for cross-selling.
The gains for these and other stocks were partially offset by losses for two natural gas exploration and production companies, Edge Petroleum Corporation and Aurora Oil & Gas Corporation, and downturns for stocks vulnerable to the domestic economy and credit-market turmoil (e.g., bond insurer Ambac Financial Group, Inc.). We attribute the weak showing for the energy companies to poor management and are watching developments there closely.
Michelle E. Stevens, CFA
Portfolio Manager
Transamerica Investment Management, LLC
56
(unaudited)
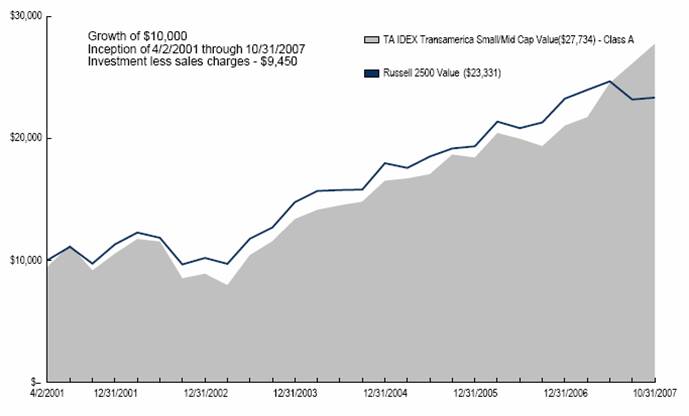
Average Annual Total Return for Periods Ended 10/31/2007
| | | | | | From | | Inception | |
| | 1 Year | | 5 Years | | Inception | | Date | |
Class A (NAV) | | 36.99 | % | 26.41 | % | 17.76 | % | 4/2/01 | |
Class A (POP) | | 29.49 | % | 24.99 | % | 16.76 | % | 4/2/01 | |
Russell 2500 Value (1) | | 4.63 | % | 18.94 | % | 13.56 | % | 4/2/01 | |
| | | | | | | | | |
Class B (NAV) | | 36.09 | % | 25.58 | % | 16.96 | % | 4/2/01 | |
Class B (POP) | | 31.09 | % | 25.50 | % | 16.96 | % | 4/2/01 | |
| | | | | | | | | |
Class C (NAV) | | 36.16 | % | — | % | 25.63 | % | 11/11/02 | |
Class C (POP) | | 35.16 | % | — | % | 25.63 | % | 11/11/02 | |
| | | | | | | | | |
Class I (NAV) | | 37.78 | % | — | % | 25.49 | % | 11/15/05 | |
NOTES
(1) The Russell 2500 Value (Russell 2500 Value) Index is an unmanaged index used as a general measure of market performance. Calculations assume dividends and capital gains are reinvested and do not include any managerial expenses. From inception calculation is based on life of Class A shares.
The performance data presented represents past performance, future results may vary. Performance data does not reflect the deduction of taxes that would be paid on fund distributions nor the redemption of fund shares. Investment return and principal value will fluctuate so that an investor’s shares, when redeemed, may be worth more or less than their original cost. Current performance may be lower or higher than performance quoted. Please see www.transamericaidex.com for performance data current to the most recent month-end.
Public Offering Price (POP) returns include the reinvestment of dividends and capital gains and reflect the maximum sales charge of 5.5% for A shares or the maximum applicable contingent deferred sales charge (5% in the 1st year, decreasing to 0% after 6 years) for Class B shares and 1% (during the first 12 months) for Class C shares. Shares purchased prior to March 1, 2004 are subject to a maximum applicable contingent deferred sales charge (5% in the 1st year, decreasing to 0% after 7 years) for Class B shares and (2% in the 1st year, decreasing to 0% after 2 years) for Class C shares. Net Asset Value (NAV) returns include the reinvestment of dividends and capital gains but do not reflect any sales charges.
Investing in small cap stocks generally involves greater risk and volatility, therefore an investment in the fund may not be appropriate for everyone. This material must be preceded or accompanied by a current prospectus, which includes specific contents regarding the investment objectives and policies of this Fund.
57
UNDERSTANDING YOUR FUND’S EXPENSES
(unaudited)
SHAREHOLDER EXPENSES
Fund shareholders may incur two types of costs: (1) transaction costs, including sales charges (loads) on purchases, contingent deferred sales charges on redemptions and redemption fees; and (2) ongoing costs, including management fees, 12b-1 distribution and service fees, and other fund expenses.
The following Example is intended to help you understand your ongoing costs (in dollars and cents) of investing in the Fund and to compare these costs with the ongoing costs of investing in other funds.
The Example is based on an investment of $1,000 invested at May 1, 2007 and held for the entire period until October 31, 2007.
ACTUAL EXPENSES
The first line in the table below provides information about actual account values and actual expenses. You may use the information in this line, together with the amount you invested, to estimate the expenses that you paid over the period. Simply divide your account value by $1,000 (for example, an $8,600 account value divided by $1,000 = 8.6), then multiply the result by the number in the first line of your Fund under the heading entitled “Expenses Paid During Period” to estimate the expenses you paid on your account during this period. If your account is an IRA, your expenses could have included a $15 annual fee. The amount of any fee paid through your account would increase the estimate of expenses you paid during the period and decrease your ending account value.
HYPOTHETICAL EXAMPLE FOR COMPARISON PURPOSES
The second line in the table below provides information about hypothetical account values and hypothetical expenses based on the Fund’s actual expense ratio and an assumed rate of return of 5% per year before expenses, which is not the Fund’s actual return. The hypothetical account values and expenses may not be used to estimate the actual ending account balance or expenses you paid for the period. You may use this information to compare the ongoing costs of investing in your Fund and other funds. To do so, compare this 5% hypothetical example with the 5% hypothetical examples that appear in the shareholder reports of the other funds. As in the case of the actual expense example, if your account is subject to an IRA fee, the amount of the fee paid through your account would increase the hypothetical expenses you would have paid during the period and decrease the hypothetical ending account value.
Please note that the expenses shown in the table are meant to highlight your ongoing costs only and do not reflect any transactional costs, such as sales charges, redemption fees, brokerage commissions paid on purchases and sales of fund shares. Therefore, the second line under the Fund in the table is useful in comparing ongoing costs only, and will not help you determine the relative total costs of owning different funds. If any of these transaction costs were included, your costs would be higher. The expenses shown in the table do not reflect any fees that may be charged to you by brokers, financial intermediaries or other financial institutions.
| | Beginning | | Ending | | Annualized | | Expenses | |
| | Account | | Account | | Expense | | Paid During | |
| | Value | | Value | | Ratio | | Period (a) | |
Class A | | | | | | | | | |
Actual | | $ | 1,000.00 | | $ | 1,196.18 | | 1.41 | % | $ | 7.78 | |
Hypothetical (b) | | 1,000.00 | | 1,018.05 | | 1.41 | | 7.15 | |
| | | | | | | | | |
Class B | | | | | | | | | |
Actual | | 1,000.00 | | 1,192.18 | | 2.05 | | 11.31 | |
Hypothetical (b) | | 1,000.00 | | 1,014.82 | | 2.05 | | 10.39 | |
| | | | | | | | | |
Class C | | | | | | | | | |
Actual | | 1,000.00 | | 1,192.37 | | 2.03 | | 11.21 | |
Hypothetical (b) | | 1,000.00 | | 1,014.91 | | 2.03 | | 10.30 | |
| | | | | | | | | |
Class I | | | | | | | | | |
Actual | | 1,000.00 | | 1,199.09 | | 0.85 | | 4.72 | |
Hypothetical (b) | | 1,000.00 | | 1,020.84 | | 0.85 | | 4.34 | |
| | | | | | | | | | | | |
(a) Expenses are calculated using the fund’s annualized expense ratio (as disclosed in the table), multiplied by the average account value for the period, multiplied by the number of days in the period (184 days), and divided by the number of days in the year (365 days).
(b) 5% return per year before expenses.
GRAPHICAL PRESENTATION OF SCHEDULE OF INVESTMENTS
By Sector
At October 31, 2007
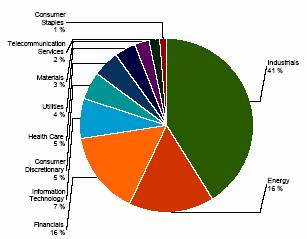
This chart shows the percentage breakdown by sector of the Fund’s total investment securities
58
SCHEDULE OF INVESTMENTS
At October 31, 2007
(all amounts except share amounts in thousands)
| | Shares | | Value | |
COMMON STOCKS (90.7%) | | | | | |
Commercial Services & Supplies (7.5%) | | | | | |
FTI Consulting, Inc. ‡^ | | 600,000 | | $ | 32,580 | |
Navigant Consulting, Inc. ‡^ | | 560,000 | | 7,381 | |
Republic Services, Inc. Class A | | 375,000 | | 12,821 | |
Computers & Peripherals (0.7%) | | | | | |
Hypercom Corp. ‡ | | 864,700 | | 4,678 | |
Diversified Telecommunication Services (1.8%) | | | | | |
Citizens Communications Co. | | 950,000 | | 12,502 | |
Electric Utilities (3.6%) | | | | | |
ALLETE, Inc. ^ | | 226,666 | | 9,903 | |
CMS Energy Corp. | | 900,000 | | 15,273 | |
Electrical Equipment (4.5%) | | | | | |
Acuity Brands, Inc. | | 330,000 | | 15,774 | |
Genlyte Group, Inc. ‡ | | 245,000 | | 15,949 | |
Electronic Equipment & Instruments (2.1%) | | | | | |
Cogent, Inc. ‡^ | | 998,615 | | 14,750 | |
Energy Equipment & Services (6.6%) | | | | | |
Allis-Chalmers Energy, Inc. ‡^ | | 255,000 | | 4,480 | |
Bronco Drilling Co., Inc. ‡^ | | 275,825 | | 3,751 | |
Hercules Offshore, Inc. ‡^ | | 412,927 | | 11,166 | |
Superior Energy Services, Inc. ‡ | | 730,000 | | 27,069 | |
Food Products (1.2%) | | | | | |
Dean Foods Co. ^ | | 295,000 | | 8,192 | |
Health Care Equipment & Supplies (1.7%) | | | | | |
Orthofix International NV ‡ | | 221,000 | | 11,912 | |
Health Care Providers & Services (2.7%) | | | | | |
Chemed Corp. | | 335,000 | | 19,202 | |
Hotels, Restaurants & Leisure (0.9%) | | | | | |
O’Charley’s, Inc. | | 400,000 | | 6,412 | |
Household Durables (1.6%) | | | | | |
Jarden Corp. ‡ | | 325,000 | | 11,544 | |
Industrial Conglomerates (8.0%) | | | | | |
McDermott International, Inc. ‡ | | 915,000 | | 55,870 | |
Insurance (3.5%) | | | | | |
HCC Insurance Holdings, Inc. | | 437,500 | | 13,077 | |
PartnerRe, Ltd. ^ | | 140,000 | | 11,655 | |
IT Services (2.0%) | | | | | |
Wright Express Corp. ‡ | | 360,000 | | 13,932 | |
Marine (14.1%) | | | | | |
Aries Maritime Transport, Ltd.^ | | 1,007,000 | | $ | 9,536 | |
DryShips, Inc. ^ | | 314,700 | | 37,091 | |
Genco Shipping & Trading, Ltd. ^ | | 579,700 | | 41,675 | |
Omega Navigation Enterprises, Inc. Class A | | 549,700 | | 10,433 | |
Metals & Mining (2.5%) | | | | | |
Claymont Steel Holdings, Inc. ‡ | | 352,835 | | 7,230 | |
Goldcorp, Inc. ^ | | 276,842 | | 9,725 | |
Western Copper Corp. ‡ | | 238,100 | | 403 | |
Oil, Gas & Consumable Fuels (7.8%) | | | | | |
Aurora Oil & Gas Corp. ‡ | | 2,100,345 | | 2,982 | |
Cabot Oil & Gas Corp. | | 177,000 | | 7,025 | |
Edge Petroleum Corp. ‡^ | | 500,000 | | 4,540 | |
Helix Energy Solutions Group, Inc. ‡^ | | 325,000 | | 15,031 | |
Newfield Exploration Co. ‡ | | 240,000 | | 12,922 | |
StealthGas, Inc. | | 670,500 | | 12,170 | |
Real Estate Investment Trusts (9.9%) | | | | | |
Annaly Capital Management, Inc. (1) | | 1,170,000 | | 19,995 | |
Host Hotels & Resorts, Inc. ^ (1) | | 620,000 | | 13,739 | |
LTC Properties, Inc. (1) | | 100,000 | | 2,534 | |
Omega Healthcare Investors, Inc. (1) | | 875,000 | | 14,639 | |
Parkway Properties, Inc. ^ (1) | | 116,700 | | 5,018 | |
Sunstone Hotel Investors, Inc. | | 480,000 | | 13,349 | |
Software (2.0%) | | | | | |
Fair Isaac Corp. ^ | | 370,000 | | 14,030 | |
Textiles, Apparel & Luxury Goods (2.1%) | | | | | |
Hanesbrands, Inc. ‡ | | 481,300 | | 14,940 | |
Thrifts & Mortgage Finance (0.7%) | | | | | |
Partners Trust Financial Group, Inc. | | 400,000 | | 4,968 | |
Transportation Infrastructure (3.2%) | | | | | |
Aegean Marine Petroleum Network, Inc. (1) ^ | | 550,190 | | 22,541 | |
Total Common Stocks (cost $407,690) | | | | 636,389 | |
| | | | | |
Total Security Lending Collateral (cost $145,058) ± | | | | 145,058 | |
Total Investment Securities (cost $552,748) # | | | | $ | 781,447 | |
NOTES TO SCHEDULE OF INVESTMENTS |
^ | | At October 31, 2007, all or a portion of this security is on loan (see Note 1). The value at October 31, 2007, of all securities on loan is $140,222 |
± | | Cash collateral for the Repurchase Agreements, valued at $26,474, that serve as collateral for securities lending, are invested in corporate and government bonds with interest rates and maturity dates ranging from 0.00% - 8.125% and 11/14/2007 - 9/15/2037. |
‡ | | Non Income Producing. |
# | | Aggregate cost for federal income tax purposes is $553,337. Aggregate gross unrealized appreciation for all securities in which there is an excess of value over tax cost and aggregate gross unrealized depreciation for all securities in which there is an excess of tax cost over value were $246,676 and $18,566, respectively. Net unrealized appreciation for tax purposes is $228,110. |
(1) | | Real Estate Investment Trust |
The notes to the financial statements are an integral part of this report.
59
TA IDEX Transamerica Value Balanced
MARKET ENVIRONMENT
After dominating the market since 2002, value stocks ceded leadership to growth stocks during the twelve months ended October 31, 2007. A key reason was the U.S. economic cycle, which showed intermittent signs of slowing. That in turn was due largely to weakness in the housing market, intensified by a crisis in the mortgage and credit industries.
Against this backdrop, investor sentiment shifted strongly toward market sectors that are traditionally safe havens in a slow-growth environment (consumer staples) and sectors where secular growth trends will likely insulate companies from a tepid economy. At the same time, the market turned away from sectors that were greatly affected by the housing market slump, most notably financial services stocks.
In the bond markets, the housing, mortgage and credit issues triggered considerable volatility and a liquidity crisis in the final months of the period, prompting the Federal Reserve Board (“Fed”) to reduce interest rates. Despite this confidence-boosting move, investors remained cautious; government securities outperformed corporate, mortgage- and asset-backed securities.
PERFORMANCE
For the year ended October 31, 2007, TA IDEX Transamerica Value Balanced, Class A returned 13.11%. By comparison its primary and secondary benchmarks, the Russell 1000 Value Index and the Lehman Brothers Aggregate Bond Index, returned 10.83% and 5.38%, respectively. For the year ended October 31, 2007, the Fund’s net expense ratios for Class A, Class B, and Class C were 1.55%, 2.20%, and 2.17%, respectively.
STRATEGY REVIEW
The portfolio was over weighted in equities, reflecting our belief that stocks would outperform bonds. We believed that an economic slowdown was merely a matter of time. Typically, such a deceleration would prompt the Fed to reduce interest rates, which is generally beneficial for bonds. In the present case, however, we believed the Fed’s ability to cut interest rates was limited by the larger, global environment. Rapid economic expansion in nations like China and India spurred enormous demand and higher prices for finished goods, services and raw materials. The inflationary pressures made it difficult for the Fed to reduce rates; it did so only when the housing- and credit-related issues reached crisis level.
In keeping with our concerns about the economy and inflation, at mid-year, we shifted the focus of the equity portfolio, overweighting businesses in industries that stood to benefit from rising demand for commodities (e.g., energy, materials/processing, producer durables and shipping), while underweighting companies dependent on U.S. interest rates (mostly financials) and being selective about consumer stocks. The portfolio’s strong positive results were due to our emphasis on health care and financial services stocks (early in the period); the culling of financial stocks before the financial crises set in; and the increased exposure to materials/processing (i.e., commodities) companies during the latter months. Top contributors included Microsoft Corporation (software), Companhia Vale Do Rio Doce (iron-ore mining), Bristol-Myers Squibb Company and Merck & Co., Inc. (pharmaceuticals) and AllianceBernstein L.P. (asset management).
Partially mitigating their gains were a handful of commercial bank stocks. Although we dramatically reduced these positions starting in June, the move did not fully insulate the portfolio from the mortgage-and-credit crisis. Likewise, the portfolio’s bond portfolio, which was over weighted in corporate bonds and owned mortgage-backed securities, was impacted by the turmoil. However, the portfolio contained no sub-prime residential exposure and only modest exposure to commercial mortgage-backed securities (“CMBS”) and was a net contributor to total return.
Heidi Y. Hu, CFA
Michelle E. Stevens, CFA
Co-Portfolio Managers
Transamerica Investment Management, LLC
60
(unaudited)
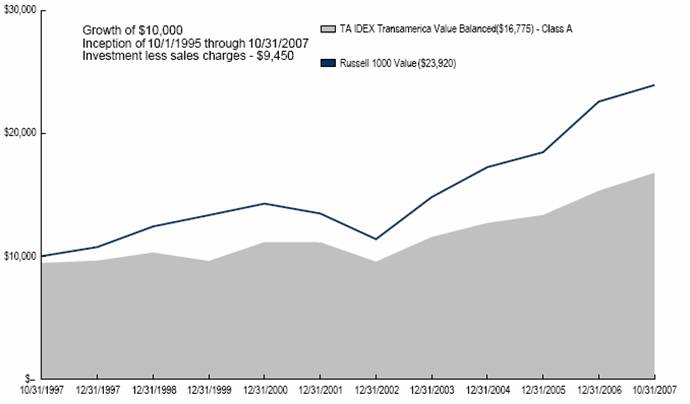
Average Annual Total Return for Periods Ended 10/31/2007
| | | | | | | | From | | Inception | |
| | 1 Year | | 5 Years | | 10 Years | | Inception | | Date | |
Class A (NAV) | | 13.11 | % | 12.69 | % | 5.91 | % | 7.51 | % | 10/1/95 | |
Class A (POP) | | 6.92 | % | 11.43 | % | 5.31 | % | 7.01 | % | 10/1/95 | |
Russell 1000 Value (1) | | 10.83 | % | 16.39 | % | 9.11 | % | 11.93 | % | 10/1/95 | |
LBAB (1) | | 5.38 | % | 4.41 | % | 5.91 | % | 6.22 | % | 10/1/95 | |
| | | | | | | | | | | |
Class B (NAV) | | 12.40 | % | 11.89 | % | 5.34 | % | 7.04 | | 10/1/95 | |
Class B (POP) | | 7.40 | % | 11.76 | % | 5.34 | % | 7.04 | | 10/1/95 | |
| | | | | | | | | | | |
Class C (NAV) | | 12.40 | % | — | % | — | % | 11.94 | | 11/11/02 | |
Class C (POP) | | 11.40 | % | — | % | — | % | 11.94 | | 11/11/02 | |
NOTES
(1) The Russell 1000 Value (Russell 1000 Value) Index and the Lehman Brothers Aggregate Bond (LBAB) Index are unmanaged indices used as a general measure of market performance. Calculations assume dividends and capital gains are reinvested and do not include any managerial expenses. From inception calculation is based on life of Class A shares.
The performance data presented represents past performance, future results may vary. Performance data does not reflect the deduction of taxes that would be paid on fund distributions nor the redemption of fund shares. Investment return and principal value will fluctuate so that an investor’s shares, when redeemed, may be worth more or less than their original cost. Current performance may be lower or higher than performance quoted. Please see www.transamericaidex.com for performance data current to the most recent month-end.
Public Offering Price (POP) returns include the reinvestment of dividends and capital gains and reflect the maximum sales charge of 5.5% for A shares or the maximum applicable contingent deferred sales charge (5% in the 1st year, decreasing to 0% after 6 years) for Class B shares and 1% (during the first 12 months) for Class C shares. Shares purchased prior to March 1, 2004 are subject to a maximum applicable contingent deferred sales charge (5% in the 1st year, decreasing to 0% after 7 years) for Class B shares and (2% in the 1st year, decreasing to 0% after 2 years) for Class C shares. Net Asset Value (NAV) returns include the reinvestment of dividends and capital gains but do not reflect any sales charges.
This material must be preceded or accompanied by a current prospectus, which includes specific contents regarding the investment objectives and policies of this Fund.
61
UNDERSTANDING YOUR FUND’S EXPENSES
(unaudited)
SHAREHOLDER EXPENSES
Fund shareholders may incur two types of costs: (1) transaction costs, including sales charges (loads) on purchases, contingent deferred sales charges on redemptions and redemption fees; and (2) ongoing costs, including management fees, 12b-1 distribution and service fees, and other fund expenses.
The following Example is intended to help you understand your ongoing costs (in dollars and cents) of investing in the Fund and to compare these costs with the ongoing costs of investing in other funds.
The Example is based on an investment of $1,000 invested at May 1, 2007 and held for the entire period until October 31, 2007.
ACTUAL EXPENSES
The first line in the table below provides information about actual account values and actual expenses. You may use the information in this line, together with the amount you invested, to estimate the expenses that you paid over the period. Simply divide your account value by $1,000 (for example, an $8,600 account value divided by $1,000 = 8.6), then multiply the result by the number in the first line of your Fund under the heading entitled “Expenses Paid During Period” to estimate the expenses you paid on your account during this period. If your account is an IRA, your expenses could have included a $15 annual fee. The amount of any fee paid through your account would increase the estimate of expenses you paid during the period and decrease your ending account value.
HYPOTHETICAL EXAMPLE FOR COMPARISON PURPOSES
The second line in the table below provides information about hypothetical account values and hypothetical expenses based on the Fund’s actual expense ratio and an assumed rate of return of 5% per year before expenses, which is not the Fund’s actual return. The hypothetical account values and expenses may not be used to estimate the actual ending account balance or expenses you paid for the period. You may use this information to compare the ongoing costs of investing in your Fund and other funds. To do so, compare this 5% hypothetical example with the 5% hypothetical examples that appear in the shareholder reports of the other funds. As in the case of the actual expense example, if your account is subject to an IRA fee, the amount of the fee paid through your account would increase the hypothetical expenses you would have paid during the period and decrease the hypothetical ending account value.
Please note that the expenses shown in the table are meant to highlight your ongoing costs only and do not reflect any transactional costs, such as sales charges, redemption fees, brokerage commissions paid on purchases and sales of fund shares. Therefore, the second line under the Fund in the table is useful in comparing ongoing costs only, and will not help you determine the relative total costs of owning different funds. If any of these transaction costs were included, your costs would be higher. The expenses shown in the table do not reflect any fees that may be charged to you by brokers, financial intermediaries or other financial institutions.
| | Beginning | | Ending | | Annualized | | Expenses | |
| | Account | | Account | | Expense | | Paid During | |
| | Value | | Value | | Ratio | | Period (a) | |
Class A | | | | | | | | | |
Actual | | $ | 1,000.00 | | $ | 1,046.23 | | 1.55 | % | $ | 7.99 | |
Hypothetical (b) | | 1,000.00 | | 1,017.32 | | 1.55 | | 7.88 | |
| | | | | | | | | |
Class B | | | | | | | | | |
Actual | | 1,000.00 | | 1,041.98 | | 2.20 | | 11.32 | |
Hypothetical (b) | | 1,000.00 | | 1,014.05 | | 2.20 | | 11.17 | |
| | | | | | | | | |
Class C | | | | | | | | | |
Actual | | 1,000.00 | | 1,042.60 | | 2.14 | | 11.04 | |
Hypothetical (b) | | 1,000.00 | | 1,014.32 | | 2.14 | | 10.89 | |
| | | | | | | | | | | | |
(a) Expenses are calculated using the Fund’s annualized expense ratio (as disclosed in the table), multiplied by the average account value for the period, multiplied by the number of days in the period (184 days), and divided by the number of days in the year (365 days).
(b) 5% return per year before expenses.
GRAPHICAL PRESENTATION OF SCHEDULE OF INVESTMENTS
By Asset Type
At October 31, 2007
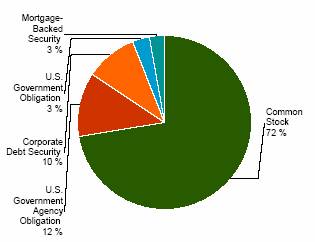
This chart shows the percentage breakdown by asset type of the Fund’s total investment securities.
62
SCHEDULE OF INVESTMENTS
At October 31, 2007
(all amounts except share amounts in thousands)
| | Principal | | Value | |
U.S. GOVERNMENT OBLIGATIONS (3.2%) | | | | | |
U.S. Treasury Bond | | | | | |
4.75%, due 02/15/2037 | | $ | 147 | | $ | 147 | |
8.00%, due 11/15/2021 | | 25 | | 33 | |
U.S. Treasury Note | | | | | |
4.00%, due 09/30/2009 | | 550 | | 551 | |
4.25%, due 11/15/2013 | | 175 | | 175 | |
4.50%, due 04/30/2012 | | 500 | | 507 | |
4.75%, due 08/15/2017 | | 528 | | 540 | |
Total U.S. Government Obligations (cost $1,920) | | | | 1,953 | |
| | | | | |
U.S. GOVERNMENT AGENCY OBLIGATIONS (11.9%) | | | | | |
Fannie Mae | | | | | |
5.00%, due 05/01/2018 – 07/01/2035 | | 677 | | 654 | |
5.50%, due 07/01/2019 – 07/01/2036 | | 1,556 | | 1,543 | |
6.00%, due 04/01/2033 – 08/01/2036 | | 996 | | 1,005 | |
Freddie Mac | | | | | |
5.00%, due 04/01/2018 – 07/01/2035 | | 1,485 | | 1,457 | |
5.35%, due 11/14/2011 | | 120 | | 121 | |
5.50%, due 09/01/2018 – 01/01/2036 | | 1,385 | | 1,369 | |
6.00%, due 12/01/2033 – 01/01/2037 | | 959 | | 967 | |
Ginnie Mae | | | | | |
6.00%, due 06/15/2034 | | 166 | | 169 | |
6.50%, due 10/15/2027 | | 66 | | 68 | |
Total U.S. Government Agency Obligations (cost $7,444) | | | | 7,353 | |
| | | | | |
MORTGAGE-BACKED SECURITIES (2.8%) | | | | | |
American Tower Trust | | | | | |
Series 2007-1A, Class C-144A | | | | | |
5.62%, due 04/15/2037 | | 155 | | 150 | |
Bear Stearns Commercial Mortgage Securities | | | | | |
Series 2006-PW14, Class A4 | | | | | |
5.20%, due 12/11/2038 | | 338 | | 328 | |
Crown Castle Towers LLC | | | | | |
Series 2006-1A, Class AFX-144A | | | | | |
5.24%, due 11/15/2036 | | 290 | | 289 | |
Morgan Stanley Capital I | | | | | |
Series 2006-HQ10, Class A4 | | | | | |
5.33%, due 11/12/2041 | | 332 | | 325 | |
SBA CMBS Trust | | | | | |
Series 2006-1A, Class A-144A | | | | | |
5.31%, due 11/15/2036 | | 250 | | 249 | |
Wachovia Bank Commercial Mortgage Trust | | | | | |
Series 2006-C28, Class A4 | | | | | |
5.57%, due 10/15/2048 | | 323 | | 321 | |
Wachovia Bank Commercial Mortgage Trust | | | | | |
Series 2007-C32, Class H-144A | | | | | |
5.93%, due 06/15/2049 § | | 85 | | 69 | |
Total Mortgage-Backed Securities (cost $1,769) | | | | 1,731 | |
| | | | | |
CORPORATE DEBT SECURITIES (9.7%) | | | | | |
Aerospace & Defense (0.2%) | | | | | |
Honeywell International | | | | | |
5.63%, due 08/01/2012 | | $ | 130 | | $ | 133 | |
Airlines (0.5%) | | | | | |
Continental Airlines, Inc. | | | | | |
7.49%, due 10/02/2010 | | 75 | | 76 | |
Delta Air Lines, Inc. | | | | | |
7.57%, due 11/18/2010 | | 85 | | 88 | |
United Airlines, Inc. | | | | | |
6.64%, due 07/02/2022 | | 116 | | 115 | |
Beverages (0.2%) | | | | | |
Diageo Capital PLC | | | | | |
5.75%, due 10/23/2017 | | 148 | | 147 | |
Building Products (0.2%) | | | | | |
CRH America, Inc. | | | | | |
5.30%, due 10/15/2013 | | 100 | | 96 | |
Capital Markets (0.4%) | | | | | |
JP Morgan Chase Capital XVIII | | | | | |
6.95%, due 08/17/2036 | | 95 | | 94 | |
Nuveen Investments, Inc. | | | | | |
5.00%, due 09/15/2010 | | 200 | | 175 | |
Commercial Banks (0.6%) | | | | | |
ICICI Bank, Ltd. -144A | | | | | |
5.90%, due 01/12/2010 * | | 135 | | 134 | |
Rabobank Capital Funding II -144A | | | | | |
5.26%, due 12/31/2013 Ž | | 70 | | 67 | |
Wachovia Capital Trust III | | | | | |
5.80%, due 03/15/2011 Ž, (1) | | 75 | | 74 | |
ZFS Finance USA Trust II -144A | | | | | |
6.45%, due 12/15/2065 (1) | | 85 | | 82 | |
Consumer Finance (0.3%) | | | | | |
Discover Financial Services -144A | | | | | |
6.23%, due 06/11/2010 * | | 215 | | 209 | |
Diversified Financial Services (1.1%) | | | | | |
BNP US Funding LLC -144A | | | | | |
7.74%, due 12/05/2007 Ž, (1) | | 250 | | 251 | |
Glencore Funding LLC -144A | | | | | |
6.00%, due 04/15/2014 | | 138 | | 138 | |
ILFC E-Capital Trust II -144A | | | | | |
6.25%, due 12/21/2065 (1) | | 135 | | 132 | |
Pemex Finance, Ltd. | | | | | |
9.03%, due 02/15/2011 | | 175 | | 186 | |
Electric Utilities (0.1%) | | | | | |
PSEG Funding Trust I | | | | | |
5.38%, due 11/16/2007 | | 50 | | 50 | |
Food & Staples Retailing (0.2%) | | | | | |
Stater Brothers Holdings, Inc. | | | | | |
8.13%, due 06/15/2012 | | 100 | | 101 | |
Food Products (0.9%) | | | | | |
Archer-Daniels-Midland Co. | | | | | |
5.38%, due 09/15/2035 | | 100 | | 92 | |
Bunge, Ltd. Finance Corp. | | | | | |
4.38%, due 12/15/2008 | | 270 | | 268 | |
The notes to the financial statements are an integral part of this report.
63
| | Principal | | Value | |
Food Products (continued) | | | | | |
Cargill, Inc. - 144A | | | | | |
5.60%, due 09/15/2012 | | $ | 80 | | $ | 81 | |
Michael Foods, Inc. | | | | | |
8.00%, due 11/15/2013 | | 90 | | 90 | |
Hotels, Restaurants & Leisure (1.0%) | | | | | |
Carnival Corp. | | | | | |
3.75%, due 11/15/2007 | | 380 | | 380 | |
Las Vegas Sands Corp. | | | | | |
6.38%, due 02/15/2015 | | 100 | | 97 | |
Royal Caribbean Cruises, Ltd. | | | | | |
8.75%, due 02/02/2011 | | 135 | | 144 | |
Household Products (0.1%) | | | | | |
Kimberly-Clark | | | | | |
6.63%, due 08/01/2037 | | 80 | | 88 | |
Insurance (0.4%) | | | | | |
Oil Insurance, Ltd. -144A | | | | | |
7.56%, due 06/30/2011 Ž, (1) | | 100 | | 103 | |
Travelers Cos., Inc. (The) | | | | | |
6.75%, due 06/20/2036 | | 140 | | 148 | |
Machinery (0.2%) | | | | | |
Tyco Electronics Group SA -144A | | | | | |
6.55%, due 10/01/2017 | | 96 | | 98 | |
Media (0.4%) | | | | | |
Amfm, Inc. | | | | | |
8.00%, due 11/01/2008 | | 100 | | 102 | |
Comcast Corp. | | | | | |
7.05%, due 03/15/2033 | | 95 | | 102 | |
News America Holdings, Inc. | | | | | |
7.75%, due 12/01/2045 | | 65 | | 74 | |
Multiline Retail (0.3%) | | | | | |
Neiman-Marcus Group, Inc. | | | | | |
9.00%, due 10/15/2015 | | 100 | | 106 | |
Target Corp. | | | | | |
6.50%, due 10/15/2037 | | 79 | | 80 | |
Oil, Gas & Consumable Fuels (0.5%) | | | | | |
Husky Oil, Ltd. | | | | | |
8.90%, due 08/15/2028 (1) | | 100 | | 103 | |
Nexen, Inc. | | | | | |
6.40%, due 05/15/2037 | | 80 | | 80 | |
PetroHawk Energy Corp. | | | | | |
9.13%, due 07/15/2013 | | 100 | | 106 | |
Paper & Forest Products (0.3%) | | | | | |
Celulosa Arauco y Constitucion SA | | | | | |
8.63%, due 08/15/2010 | | 171 | | 186 | |
Real Estate Investment Trusts (0.9%) | | | | | |
iStar Financial, Inc. | | | | | |
4.88%, due 01/15/2009 (2) | | 375 | | 367 | |
Westfield Group -144A | | | | | |
5.40%, due 10/01/2012 (2) | | 168 | | 167 | |
Real Estate Management & Development (0.5%) | | | | | |
ERP Operating, LP | | | | | |
5.38%, due 08/01/2016 | | 133 | | 127 | |
Post Apartment Homes, LP | | | | | |
6.30%, due 06/01/2013 | | $ | 171 | | $ | 174 | |
Specialty Retail (0.2%) | | | | | |
Lowe’s Companies, Inc. | | | | | |
6.65%, due 09/15/2037 | | 65 | | 67 | |
Petro Stopping Centers, LP / Petro | | | | | |
9.00%, due 02/15/2012 | | 70 | | 73 | |
Wireless Telecommunication Services (0.2%) | | | | | |
Nextel Communications, Inc. | | | | | |
7.38%, due 08/01/2015 | | 100 | | 101 | |
Total Corporate Debt Securities (cost $5,977) | | | | 5,952 | |
| | | | | | | | |
| | Shares | | Value | |
CONVERTIBLE PREFERRED STOCKS (0.9%) | | | | | |
Metals & Mining (0.9%) | | | | | |
Fording Canadian Coal Trust | | 15,000 | | 546 | |
Total Convertible Preferred Stocks (cost $426) | | | | 546 | |
| | | | | |
PREFERRED STOCKS (0.1%) | | | | | |
Thrifts & Mortgage Finance (0.1%) | | | | | |
IndyMac Bank Fsb -144A | | 3,600 | | 51 | |
Total Preferred Stocks (cost $90) | | | | 51 | |
| | | | | |
COMMON STOCKS (72.3%) | | | | | |
Capital Markets (4.8%) | | | | | |
AllianceBernstein Holding, LP | | 30,000 | | 2,563 | |
Raymond James Financial, Inc. | | 10,450 | | 389 | |
Commercial Banks (2.9%) | | | | | |
PNC Financial Services Group, Inc. | | 10,000 | | 721 | |
Wachovia Corp. | | 16,700 | | 764 | |
Wells Fargo & Co. | | 9,000 | | 306 | |
Diversified Financial Services (4.7%) | | | | | |
Bank of America Corp. | | 31,256 | | 1,509 | |
Citigroup, Inc. | | 32,540 | | 1,364 | |
Electric Utilities (0.5%) | | | | | |
Dominion Resources, Inc. | | 3,000 | | 275 | |
Energy Equipment & Services (1.5%) | | | | | |
GlobalSantaFe Corp. | | 11,400 | | 924 | |
Food Products (1.1%) | | | | | |
Kraft Foods, Inc. Class A | | 21,037 | | 703 | |
Household Products (1.4%) | | | | | |
Colgate-Palmolive Co. | | 7,000 | | 534 | |
Kimberly-Clark Corp. | | 5,000 | | 354 | |
Industrial Conglomerates (3.7%) | | | | | |
General Electric Co. | | 24,000 | | 988 | |
McDermott International, Inc. ‡ | | 21,000 | | 1,282 | |
Insurance (1.0%) | | | | | |
American International Group, Inc. | | 10,000 | | 631 | |
IT Services (1.3%) | | | | | |
Fiserv, Inc. ‡ | | 14,420 | | 799 | |
Marine (3.2%) | | | | | |
Genco Shipping & Trading, Ltd. | | 27,700 | | 1,991 | |
The notes to the financial statements are an integral part of this report.
64
| | Shares | | Value | |
Media (4.6%) | | | | | |
Citadel Broadcasting Corp. | | 1,366 | | $ | 6 | |
Time Warner, Inc. | | 122,000 | | 2,228 | |
Walt Disney Co. (The) | | 17,800 | | 616 | |
Metals & Mining (2.3%) | | | | | |
Cia Vale do Rio Doce | | 38,000 | | 1,432 | |
Oil, Gas & Consumable Fuels (10.2%) | | | | | |
Anadarko Petroleum Corp. | | 11,000 | | 649 | |
BP PLC | | 25,050 | | 1,954 | |
Chesapeake Energy Corp. | | 7,500 | | 296 | |
EOG Resources, Inc. | | 5,500 | | 487 | |
Exxon Mobil Corp. | | 8,000 | | 736 | |
Marathon Oil Corp. | | 25,500 | | 1,508 | |
Valero Energy Corp. | | 9,000 | | 634 | |
Pharmaceuticals (11.6%) | | | | | |
Bristol-Myers Squibb Co. | | 90,000 | | 2,699 | |
Merck & Co., Inc. | | 42,000 | | 2,447 | |
Pfizer, Inc. | | 45,000 | | 1,107 | |
Schering-Plough Corp. | | 30,000 | | 916 | |
Real Estate Investment Trusts (1.2%) | | | | | |
Rayonier, Inc. (2) | | 15,000 | | 724 | |
Road & Rail (2.1%) | | | | | |
Union Pacific Corp. | | 10,000 | | 1,281 | |
Software (5.9%) | | | | | |
Microsoft Corp. | | 98,000 | | 3,607 | |
Textiles, Apparel & Luxury Goods (1.3%) | | | | | |
Hanesbrands, Inc. ‡ | | 26,200 | | 813 | |
Thrifts & Mortgage Finance (1.5%) | | | | | |
Washington Mutual, Inc. | | 33,920 | | 946 | |
Tobacco (5.1%) | | | | | |
Altria Group, Inc. | | 30,400 | | 2,217 | |
Loews Corp. - Carolina Group | | 11,000 | | 944 | |
Wireless Telecommunication Services (0.4%) | | | | | |
Sprint Nextel Corp. | | 15,000 | | 257 | |
Total Common Stocks (cost $31,286) | | | | 44,601 | |
Total Investment Securities (cost $48,912) # | | | | $ | 62,187 | |
| | Contracts (·) | | Value | |
WRITTEN OPTIONS – (0.6%) | | | | | |
Dominion Resources, Inc. | | 60 | | $ | 1 | |
Expires 1/19/2008 | | | | | |
Covered Call Options - 0.1% | | | | | |
Altria Group, Inc. | | 100 | | 10 | |
Call Strike $100.00 | | | | | |
Expires 1/19/2008 | | | | | |
Cisco Systems, Inc. | | 350 | | | o |
Call Strike $15.00 | | | | | |
Expires 1/19/2008 | | | | | |
Washington Mutual, Inc. | | 45 | | 55 | |
Call Strike $40.00 | | | | | |
Expires 1/19/2008 | | | | | |
Put Options - 0.5% | | | | | |
American International Group, Inc. | | 190 | | 29 | |
Put Strike $55.00 | | | | | |
Expires 1/19/2008 | | | | | |
Duke Energy Corp. | | 350 | | $ | 10 | |
Put Strike $17.50 | | | | | |
Expires 1/19/2008 | | | | | |
Great Plains Energy | | 320 | | 33 | |
Put Strike $30.00 | | | | | |
Expires 12/22/2007 | | | | | |
Johnson & Johnson | | 250 | | 39 | |
Put Strike $55.00 | | | | | |
Expires 1/17/2009 | | | | | |
Pfizer, Inc. | | 313 | | 2 | |
Put Strike $20.00 | | | | | |
Expires 1/19/2008 | | | | | |
Schering-Plough Corp. | | 250 | | 1 | |
Put Strike $20.00 | | | | | |
Expires 1/19/2008 | | | | | |
United Health Group | | 150 | | 51 | |
Put Strike $45.00 | | | | | |
Expires 1/17/2009 | | | | | |
United Health Group | | 150 | | 82 | |
Put Strike $50.00 | | | | | |
Expires 1/17/2009 | | | | | |
Vodafone Group PLC | | 425 | | 14 | |
Put Strike $22.50 | | | | | |
Expires 1/17/2009 | | | | | |
Yahoo!, Inc. | | 300 | | 58 | |
Put Strike $25.00 | | | | | |
Expires 1/17/2009 | | | | | |
Total Written Options
(premiums: $418) | | | | 385 | |
The notes to the financial statements are an integral part of this report.
65
SCHEDULE OF INVESTMENTS
At October 31, 2007
(all amounts except share amounts in thousands)
NOTES TO SCHEDULE OF INVESTMENTS |
o | | Value is less than $1. |
* | | Floating or variable rate note. Rate is listed as of October 31, 2007. |
‡ | | Non Income Producing |
· | | Contract Amounts are not in thousands. |
(1) | | Coupon rate is fixed for a predetermined period of time and then converts to a floating rate until maturity/call date. Rate is listed as of October 31, 2007. |
§ | | Illiquid |
(2) | | Real Estate Investment Trust |
Ž | | The security has a perpetual maturity. The date shown is the next call date. |
# | | Aggregate cost for federal income tax purposes is $48,701. Aggregate gross unrealized appreciation for all securities in which there is an excess of value over tax cost and aggregate gross unrealized depreciation for all securities in which there is an excess of tax cost over value were $14,011 and $514, respectively. Net unrealized appreciation for tax purposes is $13,497. |
| | |
DEFINITIONS: |
144A | | 144A Securities are registered pursuant to Rule 144A of the Securities Act of 1933. These securities are deemed to be liquid for purposes of compliance limitations on holdings of illiquid securities and may be resold as transactions exempt from registration, normally to qualified institutional buyers. At October 31, 2007, these securities aggregated $2,650 or 4.30% of net assets of the Fund |
The notes to the financial statements are an integral part of this report.
66
STATEMENTS OF ASSETS AND LIABILITIES
At October 31, 2007
(all amounts except share amounts in thousands)
| | | | TA IDEX | | | | TA IDEX | | | |
| | TA IDEX Legg | | Templeton | | TA IDEX | | Transamerica | | TA IDEX | |
| | Mason Partners | | Transamerica | | Transamerica | | Convertible | | Transamerica | |
| | All Cap | | Global | | Balanced | | Securities | | Equity | |
Assets: | | | | | | | | | | | |
Investment, at cost | | $ | 148,882 | | $ | 200,534 | | $ | 149,309 | | $ | 133,561 | | $ | 1,420,798 | |
Securities loaned, at value | | 12,153 | | 14,386 | | 7,492 | | 10,166 | | 80,483 | |
Investment securities, at value | | $ | 186,884 | | $ | 271,015 | | $ | 195,295 | | $ | 166,102 | | $ | 1,935,985 | |
Cash | | 495 | | 2,644 | | 3,458 | | 11,291 | | 29,312 | |
Foreign currency | | — | | — | | — | | — | | — | |
Receivables: | | | | | | | | | | | |
Investment securities sold | | — | | 262 | | 572 | | 2,415 | | 16,198 | |
Shares of beneficial interest sold | | 8 | | 3 | | 56 | | 326 | | 1,221 | |
Interest | | 6 | | 10 | | 689 | | 619 | | 95 | |
Income from loaned securities | | 6 | | 7 | | 6 | | 2 | | 21 | |
Dividends | | 185 | | 322 | | 69 | | 67 | | 970 | |
Dividend reclaims | | 13 | | 143 | | 59 | | — | | 334 | |
Other | | 29 | | 260 | | 41 | | 8 | | 427 | |
| | $ | 187,626 | | $ | 274,666 | | $ | 200,245 | | $ | 180,830 | | $ | 1,984,563 | |
| | | | | | | | | | | |
Liabilities: | | | | | | | | | | | |
Investment securities purchased | | — | | 30 | | 1,053 | | — | | 2,078 | |
Accounts payable and accrued liabilities: | | | | | | | | | | | |
Shares of beneficial interest redeemed | | 477 | | 449 | | 408 | | 278 | | 1,477 | |
Management and advisory fees | | 129 | | 180 | | 136 | | 109 | | 1,248 | |
Distribution and service fees | | 130 | | 122 | | 135 | | 12 | | 423 | |
Transfer agent fees | | 43 | | 63 | | 37 | | 2 | | 226 | |
Administration fees | | 3 | | 4 | | 3 | | 3 | | 33 | |
Foreign currency payable | | — | | — | | — | | — | | — | |
Dividends to shareholders | | 1 | | — | | — | | — | | — | |
Payable for collateral for securities on loan | | 12,983 | | 14,815 | | 7,667 | | 10,416 | | 82,379 | |
Other | | 86 | | 223 | | 99 | | 42 | | 701 | |
| | 13,852 | | 15,886 | | 9,538 | | 10,862 | | 88,565 | |
Net Assets | | $ | 173,774 | | $ | 258,780 | | $ | 190,707 | | $ | 169,968 | | $ | 1,895,998 | |
Net Assets Consist of: | | | | | | | | | | | |
Shares of beneficial interest, unlimited shares authorized,no par value | | $ | 121,186 | | $ | 496,018 | | $ | 140,162 | | $ | 101,196 | | $ | 1,978,836 | |
Undistributed (accumulated) net investment income (loss) | | (7 | ) | 337 | | 4 | | 93 | | (411 | ) |
Undistributed (accumulated) net realized gain (loss) from investments: | | 14,591 | | (308,073 | ) | 4,547 | | 36,137 | | (597,636 | ) |
Net unrealized appreciation (depreciation) on: | | | | | | | | | | | |
Investment securities | | 38,004 | | 70,488 | | 45,989 | | 32,542 | | 515,209 | |
Translation of assets and liabilities denominated in foreign currencies | | — | | 10 | | 5 | | — | | — | |
Net Assets | | $ | 173,774 | | $ | 258,780 | | $ | 190,707 | | $ | 169,968 | | $ | 1,895,998 | |
Net Assets by Class: | | | | | | | | | | | |
Class A | | $ | 49,938 | | $ | 118,738 | | $ | 61,565 | | $ | 11,276 | | $ | 532,251 | |
Class B | | 88,268 | | 63,876 | | 96,573 | | 6,533 | | 191,007 | |
Class C | | 35,568 | | 31,506 | | 32,569 | | 3,598 | | 101,226 | |
Class I | | — | | 44,660 | | — | | 148,562 | | 888,019 | |
Class T | | — | | — | | — | | — | | 183,495 | |
Shares Outstanding: | | | | | | | | | | | |
Class A | | 2,924 | | 3,315 | | 2,395 | | 737 | | 44,104 | |
Class B | | 5,513 | | 1,906 | | 3,776 | | 429 | | 16,775 | |
Class C | | 2,218 | | 942 | | 1,277 | | 237 | | 8,864 | |
Class I | | — | | 1,239 | | — | | 9,704 | | 72,630 | |
Class T | | — | | — | | — | | — | | 5,472 | |
Net Asset Value Per Share: | | | | | | | | | | | |
Class A | | $ | 17.08 | | $ | 35.83 | | $ | 25.70 | | $ | 15.30 | | $ | 12.07 | |
Class B | | 16.01 | | 33.52 | | 25.58 | | 15.22 | | 11.39 | |
Class C | | 16.04 | | 33.47 | | 25.50 | | 15.17 | | 11.42 | |
Class I | | — | | 36.03 | | — | | 15.31 | | 12.23 | |
Class T | | — | | — | | — | | — | | 33.53 | |
| | | | | | | | | | | |
Maximum Offering Price Per Share (a) | | | | | | | | | | | |
Class A | | $ | 18.07 | | $ | 37.92 | | $ | 27.20 | | $ | 16.06 | | $ | 12.77 | |
Class M | | — | | — | | — | | — | | — | |
Class T | | — | | — | | — | | — | | 36.64 | |
The notes to the financial statements are an integral part of this report.
67
| | | | TA IDEX | | | | | | TA IDEX | |
| | TA IDEX | | Transamerica | | TA IDEX | | TA IDEX | | Transamerica | |
| | Transamerica | | Growth | | Transamerica | | Transamerica | | Science & | |
| | Flexible Income | | Opportunities | | High-Yield Bond | | Money Market | | Technology | |
Assets: | | | | | | | | | | | |
Investment, at cost | | $ | 430,793 | | $ | 344,526 | | $ | 417,132 | | $ | 173,856 | | $ | 89,225 | |
Securities loaned, at value | | 22,335 | | 74,436 | | 29,711 | | — | | 21,900 | |
Investment securities, at value | | $ | 425,350 | | $ | 427,033 | | $ | 412,806 | | $ | 173,856 | | $ | 122,206 | |
Cash | | 4,745 | | 9,397 | | 9,971 | | 164 | | 1,104 | |
Receivables: | | | | | | | | | | | |
Investment securities sold | | 4,835 | | 1,001 | | 2,858 | | — | | — | |
Shares of beneficial interest sold | | 86 | | 72 | | 195 | | 82 | | 21 | |
Interest | | 6,814 | | 31 | | 8,338 | | 110 | | 6 | |
Income from loaned securities | | 22 | | 35 | | 49 | | — | | 32 | |
Dividends | | 31 | | 22 | | — | | — | | 15 | |
Dividend reclaims | | 3 | | — | | — | | — | | — | |
Other | | 17 | | 19 | | 29 | | 13 | | 4 | |
| | $ | 441,903 | | $ | 437,610 | | $ | 434,246 | | $ | 174,225 | | $ | 123,388 | |
| | | | | | | | | | | |
Liabilities: | | | | | | | | | | | |
Investment securities purchased | | 6,438 | | 940 | | 5,300 | | — | | 920 | |
Accounts payable and accrued liabilities: | | | | | | | | | | | |
Shares of beneficial interest redeemed | | 288 | | 184 | | 92 | | 264 | | 2 | |
Management and advisory fees | | 268 | | 270 | | 211 | | 4 | | 64 | |
Distribution and service fees | | 29 | | 96 | | 40 | | 70 | | 8 | |
Transfer agent fees | | 9 | | 60 | | 9 | | 33 | | 5 | |
Administration fees | | 7 | | 6 | | 7 | | 3 | | 2 | |
Foreign currency payable | | — | | — | | — | | — | | — | |
Dividends to shareholders | | — | | — | | — | | 354 | | — | |
Payable for collateral for securities on loan | | 22,782 | | 76,488 | | 30,525 | | — | | 22,564 | |
Other | | 73 | | 99 | | 85 | | 94 | | 31 | |
| | 29,894 | | 78,143 | | 36,269 | | 822 | | 23,596 | |
Net Assets | | $ | 412,009 | | $ | 359,467 | | $ | 397,977 | | $ | 173,403 | | $ | 99,792 | |
Net Assets Consist of: | | | | | | | | | | | |
Shares of beneficial interest, unlimited shares authorized,no par value | | $ | 429,081 | | $ | 444,723 | | $ | 402,276 | | $ | 173,309 | | $ | 63,702 | |
Undistributed (accumulated) net investment income (loss) | | 1,265 | | (17 | ) | 1,537 | | 94 | | (2 | ) |
Undistributed (accumulated) net realized gain (loss) from investments: | | (12,896 | ) | (167,747 | ) | (1,512 | ) | — | | 3,110 | |
Net unrealized appreciation (depreciation) on: | | | | | | | | | | | |
Investment securities | | (5,441 | ) | 82,508 | | (4,324 | ) | — | | 32,982 | |
Net Assets | | $ | 412,009 | | $ | 359,467 | | $ | 397,977 | | $ | 173,403 | | $ | 99,792 | |
Net Assets by Class: | | | | | | | | | | | |
Class A | | $ | 15,409 | | $ | 64,825 | | $ | 35,147 | | $ | 95,766 | | $ | 7,874 | |
Class B | | 17,007 | | 65,123 | | 21,370 | | 23,324 | | 4,913 | |
Class C | | 8,982 | | 22,656 | | 10,160 | | 19,638 | | 2,799 | |
Class I | | 370,611 | | 206,863 | | 331,300 | | 34,673 | | 84,206 | |
Shares Outstanding: | | | | | | | | | | | |
Class A | | 1,686 | | 5,688 | | 3,855 | | 95,767 | | 1,388 | |
Class B | | 1,860 | | 6,074 | | 2,346 | | 23,323 | | 910 | |
Class C | | 985 | | 2,109 | | 1,117 | | 19,632 | | 520 | |
Class I | | 40,397 | | 17,853 | | 36,118 | | 34,673 | | 14,664 | |
Net Asset Value Per Share: | | | | | | | | | | | |
Class A | | $ | 9.14 | | $ | 11.40 | | $ | 9.12 | | $ | 1.00 | | $ | 5.67 | |
Class B | | 9.14 | | 10.72 | | 9.11 | | 1.00 | | 5.40 | |
Class C | | 9.12 | | 10.74 | | 9.10 | | 1.00 | | 5.39 | |
Class I | | 9.17 | | 11.59 | | 9.17 | | 1.00 | | 5.74 | |
| | | | | | | | | | | |
Maximum Offering Price Per Share (a) | | | | | | | | | | | |
Class A | | $ | 9.60 | | $ | 12.06 | | $ | 9.57 | | $ | 1.00 | | $ | 6.00 | |
Class M | | — | | — | | — | | — | | — | |
The notes to the financial statements are an integral part of this report.
68
| | TA IDEX | | | |
| | Transamerica | | TA IDEX | |
| | Small/Mid Cap | | Transamerica | |
| | Value | | Value Balanced | |
Assets: | | | | | |
Investment, at cost | | $ | 552,748 | | $ | 48,912 | |
Securities loaned, at value | | 140,222 | | — | |
Investment securities, at value | | $ | 781,447 | | $ | 62,187 | |
Cash | | 61,461 | | — | |
Receivables: | | | | | |
Investment securities sold | | 8,113 | | 313 | |
Shares of beneficial interest sold | | 3,795 | | 3 | |
Interest | | 156 | | 156 | |
Income from loaned securities | | 65 | | — | |
Dividends | | 387 | | 52 | |
Other | | 17 | | 15 | |
| | $ | 855,441 | | $ | 62,726 | |
| | | | | |
Liabilities: | | | | | |
Premium on written option & swaption | | $ | — | | $ | 418 | |
Investment securities purchased | | 7,905 | | 421 | |
Accounts payable and accrued liabilities: | | | | | |
Shares of beneficial interest redeemed | | 340 | | 50 | |
Management and advisory fees | | 476 | | 37 | |
Distribution and service fees | | 126 | | 36 | |
Transfer agent fees | | 26 | | 13 | |
Administration fees | | 12 | | 1 | |
Foreign currency payable | | — | | — | |
Due to custodian | | — | | 80 | |
Dividends to shareholders | | — | | — | |
Payable for collateral for securities on loan | | 145,058 | | — | |
Written swaptions and options | | — | | 372 | |
Other | | 85 | | 49 | |
| | 154,028 | | 1,059 | |
Net Assets | | $ | 701,413 | | $ | 61,667 | |
Net Assets Consist of: | | | | | |
Shares of beneficial interest, unlimited shares authorized, no par value | | $ | 392,420 | | $ | 45,070 | |
Undistributed (accumulated) net investment income | | 5,056 | | 260 | |
Undistributed (accumulated) net realized gain from investments: | | 75,238 | | 3,015 | |
Net unrealized appreciation (depreciation) on: | | | | | |
Investment securities | | 228,699 | | 13,288 | |
Written swaption contracts | | — | | 34 | |
Net Assets | | $ | 701,413 | | $ | 61,667 | |
Net Assets by Class: | | | | | |
Class A | | $ | 96,667 | | $ | 32,485 | |
Class B | | 53,285 | | 17,508 | |
Class C | | 63,856 | | 11,674 | |
Class I | | 487,605 | | — | |
Shares Outstanding: | | | | | |
Class A | | 4,066 | | 2,260 | |
Class B | | 2,329 | | 1,222 | |
Class C | | 2,801 | | 816 | |
Class I | | 20,398 | | — | |
Net Asset Value Per Share: | | | | | |
Class A | | $ | 23.78 | | $ | 14.38 | |
Class B | | 22.89 | | 14.32 | |
Class C | | 22.81 | | 14.31 | |
Class I | | 23.91 | | — | |
| | | | | |
Maximum Offering Price Per Share (a) | | | | | |
Class A | | $ | 25.16 | | $ | 15.22 | |
Class M | | — | | — | |
(a) Includes the maximum selling commission (represented as a percentage of offering price) which is reduced on certain levels of sales as set forth in the Prospectus. Net asset value per share for classes B, C, and I shares represents offering price. The redemption price for Classes B and C shares equals net asset value less any applicable contingent deferred sales charge.
The notes to the financial statements are an integral part of this report.
69
STATEMENTS OF OPERATIONS
For the year ended October 31, 2007
(all amounts except share amounts in thousands)
| | | | | | | | TA IDEX | | | |
| | TA IDEX Legg | | | | TA IDEX | | Transamerica | | | |
| | Mason Partners All | | TA IDEX Templeton | | Transamerica | | Convertible | | TA IDEX | |
| | Cap | | Transamerica Global | | Balanced | | Securities | | Transamerica Equity | |
Investment Income: | | | | | | | | | | | |
Dividends | | $ | 3,758 | | $ | 5,610 | | $ | 1,510 | | $ | 1,060 | | $ | 14,700 | |
Less withholding taxes on foreign dividends | | (39 | ) | (374 | ) | (18 | ) | — | | (156 | ) |
Interest | | 79 | | 203 | | 2,945 | | 3,060 | | 1,124 | |
Income from loaned securities-net | | 52 | | 30 | | 37 | | 30 | | 186 | |
| | 3,850 | | 5,469 | | 4,474 | | 4,150 | | 15,854 | |
| | | | | | | | | | | |
Expenses: | | | | | | | | | | | |
Management and advisory fees | | 1,560 | | 2,051 | | 1,561 | | 1,504 | | 12,280 | |
Distribution and service fees: | | | | | | | | | | | |
Class A | | 186 | | 406 | | 193 | | 26 | | 1,713 | |
Class B | | 1,022 | | 689 | | 1,068 | | 65 | | 1,998 | |
Class C | | 395 | | 313 | | 333 | | 32 | | 949 | |
Class I | | — | | — | | — | | — | | — | |
Class T | | — | | — | | — | | –– | | — | (a) |
Transfer agent fees: | | | | | | | | | | | |
Class A | | 156 | | 378 | | 160 | | 10 | | 1,315 | |
Class B | | 279 | | 301 | | 242 | | 10 | | 848 | |
Class C | | 82 | | 112 | | 67 | | 4 | | 277 | |
Class I | | — | (b) | — | (b) | — | (b) | — | (b) | — | (b) |
Class T | | — | (b) | — | (b) | — | (b) | — | (b) | 236 | (a) |
Printing and shareholder reports | | 77 | | 150 | | 71 | | 14 | | 310 | |
Custody fees | | 36 | | 94 | | 35 | | 25 | | 190 | |
Administration fees | | 39 | | 51 | | 39 | | 40 | | 344 | |
Legal fees | | 5 | | 6 | | 4 | | 5 | | 42 | |
Audit fees | | 20 | | 23 | | 20 | | 20 | | 20 | |
Trustees fees | | 7 | | 9 | | 7 | | 8 | | 65 | |
Registration fees | | 43 | | 40 | | 39 | | 38 | | 137 | |
Other | | 6 | | 25 | | 7 | | 5 | | 60 | |
Total expenses | | 3,913 | | 4,648 | | 3,846 | | 1,806 | | 20,784 | |
Less: Reimbursement of class expense: | | | | | | | | | | | |
Class A | | (6 | ) | (94 | ) | — | | — | | — | |
Class B | | — | | (131 | ) | — | | — | | (75 | ) |
Class C | | — | | (35 | ) | — | | — | | — | |
Total reimbursed expenses | | (6 | ) | (260 | ) | — | | — | | (75 | ) |
Net expenses | | 3,907 | | 4,388 | | 3,846 | | 1,806 | | 20,709 | |
| | | | | | | | | | | |
Net Investment Income (Loss) | | (57 | ) | 1,081 | | 628 | | 2,344 | | (4,855 | ) |
| | | | | | | | | | | |
Net Realized Gain (Loss) from: | | | | | | | | | | | |
Investment securities | | 15,449 | | 21,800 | | 24,203 | | 36,172 | | 189,147 | |
Futures contracts | | — | | — | | — | | — | | — | |
Written option & swaption contracts | | — | | — | | — | | — | | — | |
Swap agreements | | — | | — | | — | | — | | — | |
Foreign currency transactions | | 3 | | (2 | ) | 1 | | — | | 2 | |
| | 15,452 | | 21,798 | | 24,204 | | 36,172 | | 189,149 | |
| | | | | | | | | | | |
Net Increase (Decrease) in Unrealized Appreciation
(Depreciation) on: | | | | | | | | | | | |
Investment securities | | 1,844 | | 31,375 | | 5,142 | | 6,185 | | 179,881 | |
Translation of assets and liabilities denominated in foreign currencies | | — | | (68 | ) | 4 | | — | | (3 | ) |
| | 1,844 | | 31,307 | | 5,146 | | 6,185 | | 179,878 | |
| | | | | | | | | | | |
Net Realized and Unrealized Gain: (c) | | 17,296 | | 53,105 | | 29,350 | | 42,357 | | 369,027 | |
Net Increase In Net Assets Resulting from Operations | | $ | 17,239 | | $ | 54,186 | | $ | 29,978 | | $ | 44,701 | | $ | 364,172 | |
The notes to the financial statements are an integral part of this report.
70
| | | | | | | | | | TA IDEX | |
| | TA IDEX | | TA IDEX | | TA IDEX | | TA IDEX | | Transamerica | |
| | Transamerica | | Transamerica Growth | | Transamerica High- | | Transamerica Money | | Science & | |
| | Flexible Income | | Opportunities | | Yield Bond | | Market | | Technology | |
Investment Income: | | | | | | | | | | | |
Dividends | | $ | 445 | | $ | 1,758 | | $ | 160 | | $ | — | | $ | 163 | |
Less withholding taxes on foreign dividends | | — | | — | | — | | — | | (2 | ) |
Interest | | 23,385 | | 355 | | 29,367 | | 9,237 | | 61 | |
Income from loaned securities-net | | 94 | | 260 | | 124 | | — | | 172 | |
| | 23,924 | | 2,373 | | 29,651 | | 9,237 | | 394 | |
| | | | | | | | | | | |
Expenses: | | | | | | | | | | | |
Management and advisory fees | | 2,685 | | 2,542 | | 2,298 | | 690 | | 597 | |
Distribution and service fees: | | | | | | | | | | | |
Class A | | 58 | | 192 | | 138 | | 300 | | 20 | |
Class B | | 207 | | 616 | | 253 | | 250 | | 41 | |
Class C | | 107 | | 208 | | 105 | | 181 | | 20 | |
Class I | | — | | — | | — | | — | | — | |
Transfer agent fees: | | | | | | | | | | | |
Class A | | 41 | | 296 | | 58 | | 274 | | 28 | |
Class B | | 49 | | 352 | | 43 | | 75 | | 25 | |
Class C | | 22 | | 101 | | 18 | | 35 | | 8 | |
Class I | | — | (b) | — | (b) | — | (b) | — | (b) | — | (b) |
Printing and shareholder reports | | 29 | | 99 | | 29 | | 39 | | 19 | |
Custody fees | | 56 | | 38 | | 52 | | 28 | | 11 | |
Administration fees | | 74 | | 64 | | 78 | | 35 | | 15 | |
Legal fees | | 9 | | 9 | | 10 | | 14 | | 2 | |
Audit fees | | 20 | | 20 | | 20 | | 20 | | 20 | |
Trustees fees | | 14 | | 13 | | 15 | | 18 | | 4 | |
Registration fees | | 41 | | 40 | | 37 | | 59 | | 35 | |
Other | | 7 | | 7 | | 11 | | 11 | | 3 | |
Total expenses | | 3,419 | | 4,597 | | 3,165 | | 2,029 | | 848 | |
Less: Reimbursement of class expense: | | | | | | | | | | | |
Class A | | — | | (10 | ) | — | | (321 | ) | (13 | ) |
Class B | | — | | (31 | ) | — | | (88 | ) | (14 | ) |
Class C | | — | | — | | — | | (45 | ) | (4 | ) |
Class I | | — | | — | | — | | (18 | ) | — | |
Total reimbursed expenses | | — | | (41 | ) | — | | (472 | ) | (31 | ) |
Net expenses | | 3,419 | | 4,556 | | 3,165 | | 1,557 | | 817 | |
| | | | | | | | | | | |
Net Investment Income (Loss) | | 20,505 | | (2,183 | ) | 26,486 | | 7,680 | | (423 | ) |
| | | | | | | | | | | |
Net Realized Gain (Loss) from: | | | | | | | | | | | |
Investment securities | | (6,948 | ) | 91,882 | | 3,703 | | — | | 4,033 | |
Futures contracts | | — | | — | | — | | — | | — | |
Written option & swaption contracts | | — | | — | | — | | — | | — | |
Swap agreements | | — | | — | | — | | — | | — | |
Foreign currency transactions | | — | | — | | — | | — | | — | |
| | (6,948 | ) | 91,882 | | 3,703 | | — | | 4,033 | |
| | | | | | | | | | | |
Net Increase (Decrease) in Unrealized Appreciation
(Depreciation) on: | | | | | | | | | | | |
Investment securities | | (5,878 | ) | 13,074 | | (6,943 | ) | — | | 27,561 | |
| | (5,878 | ) | 13,074 | | (6,943 | ) | — | | 27,561 | |
Net Realized and Unrealized Gain (Loss):(c) | | (12,826 | ) | 104,956 | | (3,240 | ) | — | | 31,594 | |
Net Increase In Net Assets Resulting from Operations | | $ | 7,679 | | $ | 102,773 | | $ | 23,246 | | $ | 7,680 | | $ | 31,171 | |
The notes to the financial statements are an integral part of this report.
71
| | TA IDEX | | TA IDEX | |
| | Transamerica | | Transamerica Value | |
| | Small/Mid Cap Value | | Balanced | |
Investment Income: | | | | | |
Dividends | | $ | 12,114 | | $ | 1,317 | |
Less withholding taxes on foreign dividends | | (7 | ) | (1 | ) |
Interest | | 62 | | 988 | |
Income from loaned securities-net | | 348 | | — | |
| | 12,517 | | 2,304 | |
| | | | | |
Expenses: | | | | | |
Management and advisory fees | | 4,624 | | 472 | |
Distribution and service fees: | | | | | |
Class A | | 201 | | 113 | |
Class B | | 476 | | 193 | |
Class C | | 386 | | 114 | |
Class I | | — | | — | |
Transfer agent fees: | | | | | |
Class A | | 120 | | 85 | |
Class B | | 104 | | 59 | |
Class C | | 70 | | 23 | |
Class I | | — | (b) | — | (b) |
Printing and shareholder reports | | 52 | | 33 | |
Custody fees | | 68 | | 24 | |
Administration fees | | 117 | | 13 | |
Legal fees | | 13 | | 2 | |
Audit fees | | 26 | | 20 | |
Trustees fees | | 21 | | 2 | |
Registration fees | | 48 | | 39 | |
Other | | 11 | | 3 | |
Total expenses | | 6,337 | | 1,195 | |
Less: Reimbursement of class expense: | | | | | |
Class A | | — | | (11 | ) |
Class B | | — | | (13 | ) |
Total reimbursed expenses | | — | | (24 | ) |
Net expenses | | 6,337 | | 1,171 | |
| | | | | |
Net Investment Income | | 6,180 | | 1,133 | |
| | | | | |
Net Realized Gain (Loss) from: | | | | | |
Investment securities | | 77,381 | | 3,539 | |
Futures contracts | | — | | — | |
Written option & swaption contracts | | — | | 660 | |
Swap agreements | | — | | — | |
Foreign currency transactions | | — | | — | |
| | 77,381 | | 4,199 | |
| | | | | |
Net Increase (Decrease) in Unrealized Appreciation (Depreciation) on: | | | | | |
Investment securities | | 101,180 | | 2,373 | |
Written swaption contracts | | — | | (189 | ) |
| | 101,180 | | 2,184 | |
Net Realized and Unrealized Gain:(c) | | 178,561 | | 6,383 | |
Net Increase In Net Assets Resulting from Operations | | $ | 184,741 | | $ | 7,516 | |
(a)Class T was offered for investment on October 27, 2006.
(b)Rounds to less than $1.
(a)Class T was offered for investment on October 27, 2006.
(c)Net realized and and unrealized gain (loss) includes Investment Securities, Futures Contracts, Written Options and Swaptions, Swaps and Foreign Currency Transactions.
The notes to the financial statements are an integral part of this report.
72
STATEMENTS OF CHANGES IN NET ASSETS
For the years ended:
(all amounts in thousands)
| | TA IDEX Legg Mason
Partners All Cap | | TA IDEX Templeton
Transamerica Global | | TA IDEX Transamerica
Balanced | | TA IDEX
Transamerica
Convertible
Securities | |
| | Year Ended | | Year Ended | | Year Ended | | Year Ended | | Year Ended | | Year Ended | | Year Ended | |
| | October 31, | | October 31, | | October 31, | | October 31, | | October 31, | | October 31, | | October 31, | |
| | 2007 | | 2006 | | 2007 | | 2006 | | 2007 | | 2006 | | 2007 | |
Increase (Decrease) in Net Assets From: | | | | | | | | | | | | | | | |
Operations: | | | | | | | | | | | | | | | |
Net investment income (loss) | | $ | (57 | ) | $ | 172 | | $ | 1,081 | | $ | 1,207 | | $ | 628 | | $ | 359 | | $ | 2,344 | |
Net realized gain (a) | | 15,452 | | 29,576 | | 21,798 | | 45,126 | | 24,204 | | 16,546 | | 36,172 | |
Change in unrealized appreciation (b) | | 1,843 | | 8,372 | | 31,307 | | 10,954 | | 5,146 | | 7,466 | | 6,185 | |
Net increase (decrease) in net assets resulting from operations | | 17,238 | | 38,120 | | 54,186 | | 57,287 | | 29,978 | | 24,371 | | 44,701 | |
Distributions to Shareholders: | | | | | | | | | | | | | | | |
From net investment income: | | | | | | | | | | | | | | | |
Class A | | (175 | ) | (73 | ) | (1,297 | ) | (31 | ) | (334 | ) | (248 | ) | (60 | ) |
Class B | | — | | (31 | ) | (375 | ) | — | | (175 | ) | (110 | ) | (18 | ) |
Class C | | — | | (12 | ) | (173 | ) | — | | (62 | ) | (35 | ) | (10 | ) |
Class I (c) | | — | | — | | (688 | ) | — | | — | | — | | (2,421 | ) |
| | (175 | ) | (116 | ) | (2,533 | ) | (31 | ) | (571 | ) | (393 | ) | (2,509 | ) |
Return of capital | | | | | | | | | | | | | | | |
Class A | | — | | — | | — | | — | | — | | — | | — | |
Class B | | — | | — | | — | | — | | — | | — | | — | |
Class C | | — | | — | | — | | — | | — | | — | | — | |
Class I(c) | | — | | — | | — | | — | | — | | — | | — | |
| | — | | — | | — | | — | | — | | — | | — | |
From net realized gains: | | | | | | | | | | | | | | | |
Class A | | (7,681 | ) | (1,963 | ) | — | | — | | — | | — | | (337 | ) |
Class B | | (16,118 | ) | (4,251 | ) | — | | — | | — | | — | | (351 | ) |
Class C | | (6,121 | ) | (1,665 | ) | — | | — | | — | | — | | (180 | ) |
Class I(c) | | — | | (1,431 | ) | — | | — | | — | | — | | (13,541 | ) |
| | (29,920 | ) | (9,310 | ) | — | | — | | — | | — | | (14,409 | ) |
Capital Share Transactions: | | | | | | | | | | | | | | | |
Proceeds from shares sold: | | | | | | | | | | | | | | | |
Class A | | 4,462 | | 5,337 | | 6,194 | | 5,127 | | 3,526 | | 4,157 | | 5,352 | |
Class B | | 4,191 | | 5,189 | | 3,166 | | 2,562 | | 2,783 | | 3,947 | | 852 | |
Class C | | 1,569 | | 2,352 | | 1,684 | | 1,794 | | 1,128 | | 2,027 | | 704 | |
Class I(c) | | — | | 115,961 | | — | | 265,295 | | — | | — | | 14,218 | |
| | 10,222 | | 128,839 | | 11,044 | | 274,778 | | 7,437 | | 10,131 | | 21,126 | |
Dividends and distributions reinvested: | | | | | | | | | | | | | | | |
Class A | | 7,515 | | 1,945 | | 1,262 | | 31 | | 320 | | 239 | | 368 | |
Class B | | 14,734 | | 3,948 | | 356 | | — | | 163 | | 102 | | 303 | |
Class C | | 5,461 | | 1,557 | | 164 | | — | | 56 | | 32 | | 122 | |
Class I(c) | | — | | 1,431 | | 688 | | — | | — | | — | | 15,962 | |
| | 27,710 | | 8,881 | | 2,470 | | 31 | | 539 | | 373 | | 16,755 | |
Cost of shares redeemed: | | | | | | | | | | | | | | | |
Class A | | (17,017 | ) | (134,522 | ) | (39,581 | ) | (303,291 | ) | (16,478 | ) | (19,168 | ) | (2,550 | ) |
Class B | | (30,724 | ) | (35,861 | ) | (19,012 | ) | (25,962 | ) | (30,403 | ) | (40,189 | ) | (2,301 | ) |
Class C | | (10,089 | ) | (17,534 | ) | (8,953 | ) | (12,100 | ) | (10,378 | ) | (12,737 | ) | (1,357 | ) |
Class I(c) | | — | | (119,300 | ) | (3,733 | ) | (239,142 | ) | — | | — | | (162,514 | ) |
| | (57,830) | | (307,217 | ) | (71,279 | ) | (580,495 | ) | (57,259 | ) | (72,094 | ) | (168,722 | ) |
Redemption fee: | | | | | | | | | | | | | | | |
Class A | | — | | — | | 1 | | — | | — | | — | | — | |
Class B | | — | | — | | — | | 1 | | — | | — | | — | |
Class C | | — | | — | | — | | 1 | | — | | — | | — | |
Class I(c) | | — | | — | | — | | — | | — | | — | | — | |
| | — | | –– | | 1 | | 2 | | — | | — | | — | |
Automatic conversions: | | | | | | | | | | | | | | | |
Class A | | 2,342 | | 350 | | 9,939 | | 5,471 | | 10,022 | | 1,663 | | 99 | |
Class B | | (2,342 | ) | (350 | ) | (9,939 | ) | (5,471 | ) | (10,022 | ) | (1,663 | ) | (99 | ) |
| | — | | — | | — | | — | | — | | — | | — | |
| | (19,898 | ) | (169,497 | ) | (57,764 | ) | (305,684 | ) | (49,283 | ) | (61,590 | ) | (130,841 | ) |
Net increase (decrease) in net assets | | (32,755 | ) | (140,803 | ) | (6,111 | ) | (248,428 | ) | (19,876 | ) | (37,612 | ) | (103,058 | ) |
| | | | | | | | | | | | | | | |
Net Assets: | | | | | | | | | | | | | | | |
Beginning of year | | $ | 206,529 | | $ | 347,332 | | $ | 264,891 | | $ | 513,319 | | $ | 210,583 | | $ | 248,195 | | $ | 273,026 | |
End of year | | $ | 173,774 | | $ | 206,529 | | $ | 258,780 | | $ | 264,891 | | $ | 190,707 | | $ | 210,583 | | $ | 169,968 | |
Undistributed (Accumulated) Net Investment Income (Loss) | | $ | (7 | ) | $ | 40 | | $ | 337 | | $ | 1,468 | | $ | 4 | | $ | (26 | ) | $ | 93 | |
The notes to the financial statements are an integral part of this report
73
| | TA IDEX Legg Mason
Partners All Cap | | TA IDEX Templeton
Transamerica Global | | TA IDEX Transamerica
Balanced | | TA IDEX
Transamerica
Convertible
Securities | |
| | Year Ended | | Year Ended | | Year Ended | | Year Ended | | Year Ended | | Year Ended | | Year Ended | |
| | October 31, | | October 31, | | October 31, | | October 31, | | October 31, | | October 31, | | October 31, | |
| | 2007 | | 2006 | | 2007 | | 2006 | | 2007 | | 2006 | | 2007 | |
Share Activity: | | | | | | | | | | | | | | | |
Shares issued: | | | | | | | | | | | | | | | |
Class A | | 263 | | 313 | | 197 | | 188 | | 151 | | 196 | | 397 | |
Class B | | 260 | | 320 | | 108 | | 101 | | 120 | | 186 | | 66 | |
Class C | | 99 | | 146 | | 57 | | 71 | | 49 | | 96 | | 52 | |
Class I(c) | | — | | — | | — | | 10,591 | | — | | — | | 1,104 | |
| | 622 | | 7,860 | | 362 | | 10,951 | | 320 | | 478 | | 1,619 | |
Shares issued-reinvested from distributions: | | | | | | | | | | | | | | | |
Class A | | 462 | | 119 | | 42 | | 1 | | 14 | | 11 | | 29 | |
Class B | | 960 | | 253 | | 12 | | — | | 7 | | 5 | | 24 | |
Class C | | 355 | | 100 | | 6 | | — | | 2 | | 1 | | 10 | |
Class I(c) | | — | | — | | 23 | | — | | — | | — | | 1,262 | |
| | 1,777 | | 560 | | 83 | | 1 | | 23 | | 17 | | 1,325 | |
Shares redeemed: | | | | | | | | | | | | | | | |
Class A | | (997 | ) | (8,195 | ) | (1,245 | ) | (12,007 | ) | (710 | ) | (903 | ) | (194 | ) |
Class B | | (1,916 | ) | (2,220 | ) | (645 | ) | (1,031 | ) | (1,310 | ) | (1,897 | ) | (176 | ) |
Class C | | (632 | ) | (1,092 | ) | (303 | ) | (480 | ) | (451 | ) | (604 | ) | (105 | ) |
Class I(c) | | — | | — | | (124 | ) | (9,251 | ) | — | | — | | (12,760 | ) |
| | (3,545 | ) | (18,676 | ) | (2,317 | ) | (22,769 | ) | (2,471 | ) | (3,404 | ) | (13,235 | ) |
Automatic conversions: | | | | | | | | | | | | | | | |
Class A | | 136 | | 21 | | 312 | | 204 | | 421 | | 78 | | 7 | |
Class B | | (145 | ) | (22 | ) | (332 | ) | (217 | ) | (423 | ) | (78 | ) | (8 | ) |
| | (9 | ) | (1 | ) | (20 | ) | (13 | ) | (2 | ) | — | | (1 | ) |
Net increase (decrease) in shares outstanding: | | | | | | | | | | | | | | | |
Class A | | (136 | ) | (7,742 | ) | (694 | ) | (11,614 | ) | (124 | ) | (618 | ) | 239 | |
Class B | | (841 | ) | (1,669 | ) | (857 | ) | (1,147 | ) | (1,606 | ) | (1,784 | ) | (94 | ) |
Class C | | (178 | ) | (846 | ) | (240 | ) | (409 | ) | (400 | ) | (507 | ) | (43 | ) |
Class I | | — | | — | | (101 | ) | 1,340 | | — | | — | | (10,394 | ) |
| | (1,155 | ) | (10,257 | ) | (1,892 | ) | (11,830 | ) | (2,130 | ) | (2,909 | ) | (10,292 | ) |
The notes to the financial statements are an integral part of this report.
74
| | TA IDEX | | | | | | | | | | | | | |
| | Transamerica | | | | | | | | | | | | | |
| | Convertible | | TA IDEX Transamerica | | TA IDEX Transamerica | | TA IDEX Transamerica | |
| | Securities | | Equity | | Flexible Income | | Growth Opportunities | |
| | Year Ended | | Year Ended | | Year Ended | | Year Ended | | Year Ended | | Year Ended | | Year Ended | |
| | October 31, | | October 31, | | October 31, | | October 31, | | October 31, | | October 31, | | October 31, | |
| | 2006 | | 2007 | | 2006 | | 2007 | | 2006 | | 2007 | | 2006 | |
Increase (Decrease) in Net Assets From: | | | | | | | | | | | | | | | |
Operations: | | | | | | | | | | | | | | | |
Net investment income (loss) | | $ | 2,591 | | $ | (4,855 | ) | $ | (1,682 | ) | $ | 20,505 | | $ | 14,063 | | $ | (2,183 | ) | $ | (2,271 | ) |
Net realized gain (loss) (a) | | 14,409 | | 189,148 | | 1,388 | | (6,948 | ) | (4,820 | ) | 91,882 | | 46,326 | |
Change in unrealized appreciation (depreciation) (b) | | 8,663 | | 179,879 | | 66,056 | | (5,879 | ) | 6,532 | | 13,074 | | (19,089 | ) |
Net increase (decrease) in net assets resulting from operations | | 25,663 | | 364,172 | | 65,762 | | 7,678 | | 15,775 | | 102,773 | | 24,966 | |
Distributions to Shareholders: | | | | | | | | | | | | | | | |
From net investment income: | | | | | | | | | | | | | | | |
Class A | | (62 | ) | — | | — | | (829 | ) | (969 | ) | — | | — | |
Class B | | (10 | ) | — | | — | | (899 | ) | (1,067 | ) | — | | — | |
Class C | | (5 | ) | — | | — | | (472 | ) | (471 | ) | — | | — | |
Class I(c) | | (2,253 | ) | — | | — | | (17,840 | ) | (10,865 | ) | — | | — | |
| | (2,330 | ) | –– | | — | | (20,040 | ) | (13,372 | ) | –– | | –– | |
From net realized gains: | | | | | | | | | | | | | | | |
Class A | | (69 | ) | — | | (623 | ) | — | | — | | — | | — | |
Class B | | (74 | ) | — | | (446 | ) | — | | — | | — | | — | |
Class C | | (51 | ) | — | | (214 | ) | — | | — | | — | | — | |
Class I(c) | | (1,987 | ) | — | | (3,129 | ) | — | | — | | — | | — | |
Class T | | — | | — | | — | | — | | — | | — | | — | |
| | (2,181 | ) | | | — | | | | (4,412 | ) | | | — | |
Capital Share Transactions: | | | | | | | | | | | | | | | |
Proceeds from shares sold: | | | | | | | | | | | | | | | |
Class A | | 3,899 | | 44,265 | | 56,726 | | 4,630 | | 1,843 | | 8,951 | | 13,592 | |
Class B | | 882 | | 7,379 | | 8,675 | | 1,542 | | 1,579 | | 2,481 | | 5,530 | |
Class C | | 1,213 | | 9,600 | | 14,235 | | 3,467 | | 6,215 | | 1,087 | | 4,993 | |
Class I(c) | | 276,702 | | 92,884 | | 520,048 | | 166,452 | | 118,332 | | 7,155 | | 205,074 | |
Class T | | — | | 1,657 | | 7 | | — | | — | | — | | — | |
| | 282,696 | | 155,785 | | 599,691 | | 176,091 | | 127,969 | | 19,674 | | 229,189 | |
Issued from fund acquisition: | | | | | | | | | | | | | | | |
Class A | | — | | — | | 397,128 | | — | | — | | — | | — | |
Class B | | — | | — | | 172,096 | | — | | — | | — | | — | |
Class C | | — | | — | | 62,104 | | — | | — | | — | | — | |
Class I(c) | | — | | — | | 157,501 | | — | | — | | — | | — | |
Class T | | — | | — | | 195,217 | | — | | — | | — | | — | |
| | — | | — | | 984,046 | | — | | — | | — | | — | |
Dividends and distributions reinvested: | | | | | | | | | | | | | | | |
Class A | | 107 | | — | | 613 | | 695 | | 846 | | — | | — | |
Class B | | 66 | | — | | 434 | | 720 | | 851 | | — | | — | |
Class C | | 46 | | — | | 198 | | 352 | | 372 | | — | | — | |
Class I(c) | | 4,240 | | — | | 3,129 | | 17,840 | | 10,865 | | — | | — | |
| | 4,459 | | — | | 4,374 | | 19,607 | | 12,934 | | — | | — | |
Cost of shares redeemed: | | | | | | | | | | | | | | | |
Class A | | (210,248 | ) | (136,142 | ) | (275,131 | ) | (7,258 | ) | (126,306 | ) | (20,501 | ) | (221,734 | ) |
Class B | | (1,615 | ) | (55,373 | ) | (12,898 | ) | (7,431 | ) | (11,445 | ) | (19,854 | ) | (17,905 | ) |
Class C | | (2,598 | ) | (24,350 | ) | (6,283 | ) | (7,097 | ) | (7,662 | ) | (6,452 | ) | (10,382 | ) |
Class I(c) | | (41,315 | ) | (86,650 | ) | — | | (23,682 | ) | (20,664 | ) | (75,323 | ) | (1,565 | ) |
Class T | | — | | (51,342 | ) | (409 | ) | — | | — | | — | | — | |
| | (255,776 | ) | (353,857 | ) | (294,721 | ) | (45,468 | ) | (166,077 | ) | (122,130 | ) | (251,586 | ) |
Redemption fee: | | | | | | | | | | | | | | | |
Class A | | — | | 1 | | 1 | | — | | — | | 1 | | — | |
Class B | | — | | — | | — | | — | | 1 | | — | | — | |
Class C | | — | | — | | — | | — | | — | | — | | — | |
Class I(c) | | — | | — | �� | — | | — | | — | | — | | — | |
Class T | | — | | — | | — | | — | | — | | — | | — | |
| | — | | 1 | | 1 | | — | | 1 | | 1 | | — | |
Automatic conversions: | | | | | | | | | | | | | | | |
Class A | | 4 | | 21,409 | | 1,408 | | 809 | | 203 | | 2,209 | | 538 | |
Class B | | (4 | ) | (21,409 | ) | (1,408 | ) | (809 | ) | (203 | ) | (2,209 | ) | (538 | ) |
| | — | | — | | — | | — | | — | | | | — | |
| | 31,379 | | (198,071 | ) | 1,293,391 | | 150,230 | | (25,173 | ) | (102,455 | ) | (22,397 | ) |
Net increase (decrease) in net assets | | 52,531 | | 166,101 | | 1,354,741 | | 137,868 | | (22,770 | ) | 318 | | 2,569 | |
| | | | | | | | | | | | | | | |
Net Assets: | | | | | | | | | | | | | | | |
Beginning of year | | $ | 220,495 | | $ | 1,729,897 | | $ | 375,156 | | $ | 274,141 | | $ | 296,911 | | $ | 359,149 | | $ | 356,580 | |
End of year | | $ | 273,026 | | $ | 1,895,998 | | $ | 1,729,897 | | $ | 412,009 | | $ | 274,141 | | $ | 359,467 | | $ | 359,149 | |
Undistributed (Accumulated) Net Investment Income (Loss) | | $ | 258 | | $ | (411 | ) | $ | (411 | ) | $ | 1,265 | | $ | 800 | | $ | (17 | ) | $ | (17 | ) |
The notes to the financial statements are an integral part of this report.
75
| | TA IDEX | | | | | | | | | | | | | |
| | Transamerica | | | | | | | | | | | | | |
| | Convertible | | TA IDEX Transamerica | | TA IDEX Transamerica | | TA IDEX Transamerica | |
| | Securities | | Equity | | Flexible Income | | Growth Opportunities | |
| | Year Ended | | Year Ended | | Year Ended | | Year Ended | | Year Ended | | Year Ended | | Year Ended | |
| | October 31, | | October 31, | | October 31, | | October 31, | | October 31, | | October 31, | | October 31, | |
| | 2006 | | 2007 | | 2006 | | 2007 | | 2006 | | 2007 | | 2006 | |
Share Activity: | | | | | | | | | | | | | | | |
Shares issued: | | | | | | | | | | | | | | | |
Class A | | 311 | | 4,226 | | 6,055 | | 493 | | 198 | | 939 | | 1,620 | |
Class B | | 72 | | 747 | | 956 | | 164 | | 171 | | 288 | | 684 | |
Class C | | 98 | | 963 | | 1,599 | | 372 | | 676 | | 125 | | 622 | |
Class I(c) | | 23,177 | | 8,822 | | 55,914 | | 17,539 | | 12,656 | | 796 | | 25,652 | |
Class T | | — | | 57 | | — | | — | | — | | — | | — | |
| | 23,658 | | 14,815 | | 64,524 | | 18,568 | | 13,701 | | 2,148 | | 28,578 | |
Shares issued-reinvested from distributions: | | | | | | | | | | | | | | | |
Class A | | 9 | | — | | 65 | | 75 | | 92 | | — | | — | |
Class B | | 5 | | — | | 48 | | 77 | | 92 | | — | | — | |
Class C | | 4 | | — | | 22 | | 38 | | 40 | | — | | — | |
Class I(c) | | 346 | | — | | 331 | | 1,912 | | 1,172 | | — | | — | |
| | 364 | | — | | 466 | | 2,102 | | 1,396 | | — | | — | |
Issued from fund acquisition: | | | | | | | | | | | | | | | |
Class A | | — | | — | | 40,523 | | — | | — | | — | | — | |
Class B | | — | | — | | 18,465 | | — | | — | | — | | — | |
Class C | | — | | — | | 6,649 | | — | | — | | — | | — | |
Class I(c) | | — | | — | | 15,958 | | — | | — | | — | | — | |
Class T | | — | | — | | 7,204 | | — | | — | | — | | — | |
| | — | | — | | 88,799 | | — | | — | | — | | — | |
Shares redeemed: | | | | | | | | | | | | | | | |
Class A | | (17,934 | ) | (13,041 | ) | (29,894 | ) | (781 | ) | (13,562 | ) | (2,247 | ) | (27,610 | ) |
Class B | | (130 | ) | (5,614 | ) | (1,425 | ) | (797 | ) | (1,232 | ) | (2,313 | ) | (2,243 | ) |
Class C | | (210 | ) | (2,460 | ) | (693 | ) | (762 | ) | (825 | ) | (749 | ) | (1,283 | ) |
Class I(c) | | (3,425 | ) | (8,395 | ) | — | | (2,524 | ) | (2,202 | ) | (8,408 | ) | (187 | ) |
Class T | | — | | (1,774 | ) | (15 | ) | — | | — | | — | | — | |
| | (21,699 | ) | (31,284 | ) | (32,027 | ) | (4,864 | ) | (17,821 | ) | (13,717 | ) | (31,323 | ) |
Automatic conversions: | | | | | | | | | | | | | | | |
Class A | | — | | 2,009 | | 148 | | 87 | | 22 | | 231 | | 64 | |
Class B | | — | | (2,121 | ) | (155 | ) | (87 | ) | (22 | ) | (245 | ) | (68 | ) |
| | — | | (112 | ) | (7 | ) | — | | — | | (14 | ) | (4 | ) |
Net increase (decrease) in shares outstanding: | | | | | | | | | | | | | | | |
Class A | | (17,614 | ) | (6,806 | ) | 16,897 | | (126 | ) | (13,250 | ) | (1,077 | ) | (25,926 | ) |
Class B | | (53 | ) | (6,988 | ) | 17,889 | | (643 | ) | (991 | ) | (2,270 | ) | (1,627 | ) |
Class C | | (108 | ) | (1,497 | ) | 7,577 | | (352 | ) | (109 | ) | (624 | ) | (661 | ) |
Class I | | 20,098 | | 427 | | 72,203 | | 16,927 | | 11,626 | | (7,612 | ) | 25,465 | |
Class T | | — | | (1,717 | ) | 7,189 | | — | | — | | — | | — | |
| | 2,323 | | (16,581 | ) | 121,755 | | 15,806 | | (2,724 | ) | (11,583 | ) | (2,749 | ) |
The notes to the financial statements are an integral part of this report.
76
| | TA IDEX Transamerica
High- Yield Bond | | TA IDEX Transamerica
Money Market | | TA IDEX Transamerica
Science & Technology | | TA IDEX Transamerica
Small/Mid Cap
Value | |
| | Year Ended
October 31,
2007 | | Year Ended
October 31,
2006 | | Year Ended
October 31,
2007 | | Year Ended
October 31,
2006 | | Year Ended
October 31,
2007 | | Year Ended
October 31,
2006 | | Year Ended
October 31,
2007 | |
|
|
Increase (Decrease) in Net Assets From: | | | | | | | | | | | | | | | |
Operations: | | | | | | | | | | | | | | | |
Net investment income (loss) | | $ | 26,486 | | $ | 27,863 | | $ | 7,680 | | $ | 5,358 | | $ | (423 | ) | $ | (379 | ) | $ | 6,180 | |
Net realized gain (loss) (a) | | 3,704 | | 2,550 | | — | | — | | 4,033 | | (509 | ) | 77,381 | |
Change in unrealized appreciation (depreciation) (b) | | (6,944 | ) | 5,827 | | — | | — | | 27,561 | | 4,065 | | 101,180 | |
Net increase (decrease) in net assets | | | | | | | | | | | | | | | |
resulting from operations | | 23,246 | | 36,240 | | 7,680 | | 5,358 | | 31,171 | | 3,177 | | 184,741 | |
Distributions to Shareholders: | | | | | | | | | | | | | | | |
From net investment income: | | | | | | | | | | | | | | | |
Class A | | (2,554 | ) | (2,884 | ) | (3,876 | ) | (3,130 | ) | — | | — | | (339 | ) |
Class B | | (1,470 | ) | (1,848 | ) | (966 | ) | (942 | ) | — | | — | | — | |
Class C | | (615 | ) | (734 | ) | (700 | ) | (504 | ) | — | | — | | (64 | ) |
Class I(c) | | (21,811 | ) | (20,919 | ) | (2,136 | ) | (782 | ) | — | | — | | (6,046 | ) |
| | (26,450 | ) | (26,385 | ) | (7,678 | ) | (5,358 | ) | — | | — | | (6,449 | ) |
Return of capital | | | | | | | | | | | | | | | |
Class A | | — | | — | | — | | — | | — | | — | | — | |
Class B | | — | | — | | — | | — | | — | | — | | — | |
Class C | | — | | — | | — | | — | | — | | — | | — | |
Class I(c) | | — | | — | | — | | — | | — | | — | | — | |
| | — | | — | | — | | — | | — | | — | | — | |
From net realized gains: | | | | | | | | | | | | | | | |
Class A | | — | | — | | — | | — | | — | | (105 | ) | (849 | ) |
Class B | | — | | — | | — | | — | | — | | (81 | ) | (821 | ) |
Class C | | — | | — | | — | | — | | — | | (42 | ) | (535 | ) |
Class I(c) | | — | | — | | — | | — | | — | | (839 | ) | (8,419 | ) |
| | — | | — | | — | | — | | — | | (1,067 | ) | (10,624 | ) |
Capital Share Transactions: | | | | | | | | | | | | | | | |
Proceeds from shares sold: | | | | | | | | | | | | | | | |
Class A | | 10,896 | | 18,259 | | 110,732 | | 88,535 | | 1,923 | | 551 | | 50,011 | |
Class B | | 1,207 | | 1,519 | | 18,357 | | 15,370 | | 488 | | 329 | | 7,596 | |
Class C | | 2,753 | | 2,968 | | 17,851 | | 24,772 | | 689 | | 258 | | 29,511 | |
Class I(c) | | 61,746 | | 326,422 | | 209,116 | | 113,779 | | — | | 60,735 | | 23,041 | |
| | 76,602 | | 349,168 | | 356,056 | | 242,456 | | 3,100 | | 61,873 | | 110,159 | |
Dividends and distributions reinvested: | | | | | | | | | | | | | | | |
Class A | | 1,803 | | 2,129 | | 3,727 | | 3,107 | | — | | 103 | | 1,137 | |
Class B | | 980 | | 1,230 | | 893 | | 857 | | — | | 76 | | 750 | |
Class C | | 358 | | 425 | | 655 | | 468 | | — | | 37 | | 502 | |
Class I(c) | | 21,811 | | 20,919 | | 2,120 | | 731 | | — | | 839 | | 14,464 | |
| | 24,952 | | 24,703 | | 7,395 | | 5,163 | | — | | 1,055 | | 16,853 | |
Cost of shares redeemed: | | | | | | | | | | | | | | | |
Class A | | (21,615 | ) | (314,046 | ) | (98,923 | ) | (163,975 | ) | (1,961 | ) | (63,110 | ) | (21,331 | ) |
Class B | | (7,614 | ) | (12,527 | ) | (20,138 | ) | (21,902 | ) | (1,317 | ) | (1,611 | ) | (14,052 | ) |
Class C | | (4,201 | ) | (8,273 | ) | (16,155 | ) | (23,951 | ) | (712 | ) | (1,065 | ) | (7,577 | ) |
Class I(c) | | (64,779 | ) | (81,130 | ) | (203,029 | ) | (88,044 | ) | — | | (3,259 | ) | (152,163 | ) |
| | (98,209 | ) | (415,976 | ) | (338,245 | ) | (297,872 | ) | (3,990 | ) | (69,045 | ) | (195,123 | ) |
Redemption fee: | | | | | | | | | | | | | | | |
Class A | | — | | — | | — | | — | | — | | — | | — | |
Class B | | — | | — | | — | | — | | — | | — | | 2 | |
Class C | | — | | — | | — | | — | | — | | — | | — | |
Class I(c) | | — | | — | | — | | — | | — | | — | | — | |
| | — | | — | | — | | — | | — | | — | | 2 | |
Automatic conversions: | | | | | | | | | | | | | | | |
Class A | | 794 | | 242 | | 1,515 | | 246 | | 31 | | 7 | | 1,995 | |
Class B | | (794 | ) | (242 | ) | (1,515 | ) | (246 | ) | (31 | ) | (7 | ) | (1,995 | ) |
| | — | | — | | — | | — | | — | | — | | — | |
| | 3,345 | | (42,105 | ) | 25,206 | | (50,253 | ) | (890 | ) | (6,117 | ) | (68,109 | ) |
Net increase (decrease) in net assets | | 141 | | (32,250 | ) | 25,208 | | (50,253 | ) | 30,281 | | (4,007 | ) | 99,559 | |
| | | | | | | | | | | | | | | |
Net Assets: | | | | | | | | | | | | | | | |
Beginning of year | | $ | 397,836 | | $ | 430,086 | | $ | 148,195 | | $ | 198,448 | | $ | 69,511 | | $ | 73,518 | | $ | 601,854 | |
End of year | | $ | 397,977 | | $ | 397,836 | | $ | 173,403 | | $ | 148,195 | | $ | 99,792 | | $ | 69,511 | | $ | 701,413 | |
Undistributed (Accumulated) Net Investment Income (Loss) | | $ | 1,537 | | $ | 1,050 | | $ | 94 | | $ | 90 | | $ | (2 | ) | $ | — | | $ | 5,056 | |
The notes to the financial statements are an integral part of this report.
77
| | | | | | | | | | | | | | TA IDEX
Transamerica
Small/Mid Cap
Value | |
| | TA IDEX Transamerica
High-Yield Bond | | TA IDEX Transamerica
Money Market | | TA IDEX Transamerica
Science & Technology | | |
| | | | | |
| | Year Ended | | Year Ended | | Year Ended | | Year Ended | | Year Ended | | Year Ended | | Year Ended | |
| | October 31, | | October 31, | | October 31, | | October 31, | | October 31, | | October 31, | | October 31, | |
| | 2007 | | 2006 | | 2007 | | 2006 | | 2007 | | 2006 | | 2007 | |
Share Activity: | | | | | | | | | | | | | | | |
Shares issued: | | | | | | | | | | | | | | | |
Class A | | 1,171 | | 2,011 | | 110,732 | | 88,535 | | 404 | | 138 | | 2,339 | |
Class B | | 130 | | 168 | | 18,357 | | 15,370 | | 110 | | 85 | | 385 | |
Class C | | 299 | | 328 | | 17,852 | | 24,772 | | 149 | | 68 | | 1,464 | |
Class I(c) | | 6,700 | | 36,198 | | 209,116 | | 113,779 | | — | | 15,252 | | 1,173 | |
| | 8,300 | | 38,705 | | 356,057 | | 242,456 | | 663 | | 15,543 | | 5,361 | |
Shares issued-reinvested from distributions: | | | | | | | | | | | | | | | |
Class A | | 196 | | 236 | | 3,727 | | 3,107 | | — | | 25 | | 62 | |
Class B | | 106 | | 136 | | 893 | | 857 | | — | | 19 | | 43 | |
Class C | | 39 | | 47 | | 655 | | 468 | | — | | 9 | | 29 | |
Class I(c) | | 2,352 | | 2,303 | | 2,120 | | 731 | | — | | 206 | | 797 | |
| | 2,693 | | 2,722 | | 7,395 | | 5,163 | | — | | 259 | | 931 | |
Shares redeemed: | | | | | | | | | | | | | | | |
Class A | | (2,333 | ) | (35,041 | ) | (98,924 | ) | (163,975 | ) | (461 | ) | (15,859 | ) | (1,076 | ) |
Class B | | (826 | ) | (1,382 | ) | (20,138 | ) | (21,902 | ) | (318 | ) | (422 | ) | (745 | ) |
Class C | | (455 | ) | (914 | ) | (16,155 | ) | (23,952 | ) | (177 | ) | (285 | ) | (395 | ) |
Class I(c) | | (7,039 | ) | (8,925 | ) | (203,029 | ) | (88,044 | ) | — | | (794 | ) | (8,356 | ) |
| | (10,653 | ) | (46,262 | ) | (338,246 | ) | (297,873 | ) | (956 | ) | (17,360 | ) | (10,572 | ) |
Automatic conversions: | | | | | | | | | | | | | | | |
Class A | | 86 | | 27 | | 1,515 | | 246 | | 7 | | 2 | | 96 | |
Class B | | (86 | ) | (27 | ) | (1,515 | ) | (246 | ) | (7 | ) | (2 | ) | (100 | ) |
| | — | | — | | — | | — | | — | | — | | (4 | ) |
Net increase (decrease) in shares outstanding: | | | | | | | | | | | | | | | |
Class A | | (880 | ) | (32,767 | ) | 17,050 | | (72,087 | ) | (50 | ) | (15,694 | ) | 1,421 | |
Class B | | (676 | ) | (1,105 | ) | (2,403 | ) | (5,921 | ) | (215 | ) | (320 | ) | (417 | ) |
Class C | | (117 | ) | (539 | ) | 2,352 | | 1,288 | | (28 | ) | (208 | ) | 1,098 | |
Class I | | 2,013 | | 29,576 | | 8,207 | | 26,466 | | — | | 14,664 | | (6,386 | ) |
| | 340 | | (4,835 | ) | 25,206 | | (50,254 | ) | (293 | ) | (1,558 | ) | (4,284 | ) |
The notes to the financial statements are an integral part of this report.
78
| | TA IDEX | | | | | |
| | Transamerica | | | | | |
| | Small/Mid Cap | | TA IDEX Transamerica Value | |
| | Value | | Balanced | |
| | Year Ended | | Year Ended | | Year Ended | |
| | October 31, | | October 31, | | October 31, | |
| | 2006 | | 2007 | | 2006 | |
Increase (Decrease) in Net Assets From: | | | | | | | |
Operations: | | | | | | | |
Net investment income | | $ | 5,153 | | $ | 1,133 | | $ | 999 | |
Net realized gain (a) | | 10,807 | | 4,199 | | 3,329 | |
Change in unrealized appreciation (b) | | 50,680 | | 2,184 | | 4,745 | |
Net increase (decrease) in net assets resulting from operations | | 66,640 | | 7,516 | | 9,073 | |
Distributions to Shareholders: | | | | | | | |
From net investment income: | | | | | | | |
Class A | | (780 | ) | (537 | ) | (608 | ) |
Class B | | (88 | ) | (205 | ) | (274 | ) |
Class C | | (40 | ) | (131 | ) | (148 | ) |
| | (908 | ) | (873 | ) | (1,030 | ) |
Return of capital | | | | | | | |
Class A | | — | | — | | — | |
Class B | | — | | — | | — | |
Class C | | — | | — | | — | |
Class I | | — | | — | | — | |
| | — | | — | | — | |
From net realized gains: | | | | | | | |
Class A | | (2,553 | ) | (898 | ) | (474 | ) |
Class B | | (3,216 | ) | (564 | ) | (346 | ) |
Class C | | (1,477 | ) | (319 | ) | (175 | ) |
Class I | | (24,100 | ) | — | | — | |
| | (31,346 | ) | (1,781 | ) | (995 | ) |
Capital Share Transactions: | | | | | | | |
Proceeds from shares sold: | | | | | | | |
Class A | | 21,467 | | 2,339 | | 2,465 | |
Class B | | 9,292 | | 1,826 | | 1,016 | |
Class C | | 12,958 | | 1,172 | | 1,075 | |
Class I | | 435,985 | | — | | — | |
| | 479,702 | | 5,337 | | 4,556 | |
Dividends and distributions reinvested: | | | | | | | |
Class A | | 3,203 | | 1,403 | | 1,057 | |
Class B | | 3,023 | | 725 | | 592 | |
Class C | | 1,204 | | 437 | | 311 | |
Class I | | 24,100 | | — | | — | |
| | 31,530 | | 2,565 | | 1,960 | |
Cost of shares redeemed: | | | | | | | |
Class A | | (370,179 | ) | (8,665 | ) | (8,605 | ) |
Class B | | (14,077 | ) | (4,679 | ) | (6,283 | ) |
Class C | | (7,913 | ) | (2,140 | ) | (3,221 | ) |
Class I | | (5,884 | ) | — | | — | |
| | (398,053 | ) | (15,484 | ) | (18,109 | ) |
Redemption fee: | | | | | | | |
Class A | | — | | — | | — | |
Class B | | 1 | | — | | — | |
Class C | | — | | — | | — | |
| | 1 | | — | | — | |
Automatic conversions: | | | | | | | |
Class A | | 350 | | 2,221 | | 1,363 | |
Class B | | (350 | ) | (2,221 | ) | (1,363 | ) |
| | — | | — | | — | |
| | 113,180 | | (7,582 | ) | (11,593 | ) |
Net increase (decrease) in net assets | | 147,566 | | (2,720 | ) | (4,545 | ) |
| | | | | | | |
Net Assets: | | | | | | | | |
Beginning of year | | $ | 454,288 | | $ | 64,387 | | $ | 68,932 | |
End of year | | $ | 601,854 | | $ | 61,667 | | $ | 64,387 | |
Undistributed (Accumulated) Net Investment Income (Loss) | | $ | 3,756 | | $ | 260 | | $ | 157 | |
The notes to the financial statements are an integral part of this report.
79
| | TA IDEX | | | | | |
| | Transamerica | | | | | |
| | Small/Mid Cap | | TA IDEX Transamerica Value | |
| | Value | | Balanced | |
| | Year Ended | | Year Ended | | Year Ended | |
| | October 31, | | October 31, | | October 31, | |
| | 2006 | | 2007 | | 2006 | |
Share Activity: | | | | | | | |
Shares issued: | | | | | | | |
Class A | | 1,238 | | 171 | | 195 | |
Class B | | 556 | | 134 | | 82 | |
Class C | | 774 | | 87 | | 86 | |
Class I | | 25,681 | | — | | — | |
| | 28,249 | | 392 | | 363 | |
Shares issued-reinvested from distributions: | | | | | | | |
Class A | | 193 | | 106 | | 85 | |
Class B | | 189 | | 55 | | 48 | |
Class C | | 75 | | 33 | | 25 | |
Class I | | 1,461 | | — | | — | |
| | 1,918 | | 194 | | 158 | |
Shares redeemed: | | | | | | | |
Class A | | (21,959 | ) | (636 | ) | (689 | ) |
Class B | | (841 | ) | (344 | ) | (502 | ) |
Class C | | (477 | ) | (158 | ) | (258 | ) |
Class I | | (358 | ) | — | | — | |
| | (23,635 | ) | (1,138 | ) | (1,449 | ) |
Automatic conversions: | | | | | | | |
Class A | | 20 | | 162 | | 109 | |
Class B | | (21 | ) | (163 | ) | (109 | ) |
| | (1 | ) | (1 | ) | — | |
Net increase (decrease) in shares outstanding: | | | | | | | |
Class A | | (20,508 | ) | (197 | ) | (300 | ) |
Class B | | (117 | ) | (318 | ) | (481 | ) |
Class C | | 372 | | (38 | ) | (147 | ) |
Class I | | 26,784 | | — | | — | |
| | 6,531 | | (553 | ) | (928 | ) |
(a) | Net realized and and unrealized gain (loss) includes Investment Securities, Futures Contracts, Written Options and Swaptions, Swaps and Foreign Currency Transactions. |
(b) | Change in unrealized appreciation (depreciation) includes investment securities, futures contracts, written options and swaptions, swaps and foreign currency translation. |
(c) | Class I was offered for investment on November 15, 2005 |
The notes to the financial statements are an integral part of this report.
80
FINANCIAL HIGHLIGHTS
For years ended:
| | TA IDEX Legg Mason Partners All Cap | |
| | Class A | |
| | October 31, | | October 31, | | October 31, | | October 31, | | October 31, | |
| | 2007 | | 2006 | | 2005 | | 2004 | | 2003 | |
| | | | | | | | | | | |
Net Asset Value | | | | | | | | | | | |
Beginning of year | | $ | 18.18 | | $ | 16.10 | | $ | 14.80 | | $ | 13.95 | | $ | 10.34 | |
| | | | | | | | | | | |
Investment Operations (h) | | | | | | | | | | | |
Net Investment income (loss) | | 0.07 | | 0.09 | | 0.06 | | (0.03 | ) | (0.04 | ) |
Net realized and unrealized gain (loss) on investments | | 1.49 | | 2.55 | | 1.24 | | 0.88 | | 3.65 | |
Total from investment operations | | 1.56 | | 2.64 | | 1.30 | | 0.85 | | 3.61 | |
| | | | | | | | | | | |
Distributions | | | | | | | | | | | |
Net investment income | | (0.06 | ) | (0.01 | ) | — | | — | | — | |
Net realized gains on investments | | (2.60 | ) | (0.55 | ) | — | | — | | — | |
Total distributions | | (2.66 | ) | (0.56 | ) | — | | — | | — | |
| | | | | | | | | | | |
Net Asset Value | | | | | | | | | | | |
End of year | | $ | 17.08 | | $ | 18.18 | | $ | 16.10 | | $ | 14.80 | | $ | 13.95 | |
| | | | | | | | | | | |
Total Return(a) | | 9.27 | % | 16.74 | % | 8.79 | % | 6.09 | % | 34.91 | % |
| | | | | | | | | | | |
Net Assets End of Period | | $ | 49,938 | | $ | 55,622 | | $ | 173,929 | | $ | 438,047 | | $ | 271,958 | |
| | | | | | | | | | | |
Ratio and Supplemental Data | | | | | | | | | | | |
| | | | | | | | | | | |
Expenses to average net assets: | | | | | | | | | | | |
After reimbursement/fee waiver(b) | | 1.55 | %(c) | 1.55 | %(c) | 1.32 | %(c) | 1.33 | %(c) | 1.55 | %(c) |
Before reimbursement/fee waiver(b) | | 1.56 | %(d) | 1.57 | %(d) | 1.32 | %(d) | 1.33 | %(d) | 1.64 | %(d) |
Net investment income (loss), to average net assets(b) | | 0.42 | % | 0.52 | % | 0.36 | % | (0.17 | )% | (0.36 | )% |
Portfolio turnover rate(e) | | 17 | % | 25 | % | 27 | % | 25 | % | 30 | % |
| | TA IDEX Legg Mason Partners All Cap | |
| | Class B | |
| | October 31, | | October 31, | | October 31, | | October 31, | | October 31, | |
| | 2007 | | 2006 | | 2005 | | 2004 | | 2003 | |
| | | | | | | | | | | |
Net Asset Value | | | | | | | | | | | |
Beginning of year | | $ | 17.24 | | $ | 15.39 | | $ | 14.27 | | $ | 13.53 | | $ | 10.08 | |
| | | | | | | | | | | |
Investment Operations (h) | | | | | | | | | | | |
Net Investment income (loss) | | (0.03 | ) | (0.03 | ) | (0.09 | ) | (0.11 | ) | (0.12 | ) |
Net realized and unrealized gain (loss) on investments | | 1.40 | | 2.43 | | 1.21 | | 0.85 | | 3.57 | |
Total from investment operations | | 1.37 | | 2.40 | | 1.12 | | 0.74 | | 3.45 | |
| | | | | | | | | | | |
Distributions | | | | | | | | | | | |
Net investment income | | — | | — | | — | | — | | — | |
Net realized gains on investments | | (2.60 | ) | (0.55 | ) | — | | — | | — | |
Total distributions | | (2.60 | ) | (0.55 | ) | — | | — | | — | |
| | | | | | | | | | | |
Net Asset Value | | | | | | | | | | | |
End of year | | $ | 16.01 | | $ | 17.24 | | $ | 15.39 | | $ | 14.27 | | $ | 13.53 | |
| | | | | | | | | | | |
Total Return(a) | | 8.57 | % | 15.97 | % | 7.84 | % | 5.48 | % | 34.23 | % |
| | | | | | | | | | | |
Net Assets End of Period | | $ | 88,268 | | $ | 109,567 | | $ | 123,494 | | $ | 150,829 | | $ | 158,147 | |
| | | | | | | | | | | |
Ratio and Supplemental Data | | | | | | | | | | | |
| | | | | | | | | | | |
Expenses to average net assets: | | | | | | | | | | | |
After reimbursement/fee waiver(b) | | 2.19 | %(c) | 2.20 | %(c) | 2.19 | %(c) | 1.97 | %(c) | 2.20 | %(c) |
Before reimbursement/fee waiver(b) | | 2.19 | %(d) | 2.21 | %(d) | 2.19 | %(d) | 1.97 | %(d) | 2.29 | %(d) |
Net investment income (loss), to average net assets(b) | | (0.22 | )% | (0.17 | )% | (0.58 | )% | (0.80 | )% | (1.01 | )% |
Portfolio turnover rate(e) | | 17 | % | 25 | % | 27 | % | 25 | % | 30 | % |
The notes to the financial statements are an integral part of this report
81
| | TA IDEX Legg Mason Partners All Cap | |
| | Class C | |
| | October 31, | | October 31, | | October 31, | | October 31, | | October 31, | |
| | 2007 | | 2006 | | 2005 | | 2004 | | 2003 | |
| | | | | | | | | | | |
Net Asset Value | | | | | | | | | | | |
Beginning of year | | $ | 17.25 | | $ | 15.39 | | $ | 14.26 | | $ | 13.53 | | $ | 10.26 | |
| | | | | | | | | | | |
Investment Operations (h) | | | | | | | | | | | |
Net Investment income (loss) | | (0.02 | ) | (0.02 | ) | (0.08 | ) | (0.12 | ) | (0.12 | ) |
Net realized and unrealized gain (loss) on investments | | 1.41 | | 2.43 | | 1.21 | | 0.85 | | 3.39 | |
Total from investment operations | | 1.39 | | 2.41 | | 1.13 | | 0.73 | | 3.27 | |
| | | | | | | | | | | |
Distributions | | | | | | | | | | | |
Net investment income | | — | | — | (f) | — | | — | | — | |
Net realized gains on investments | | (2.60 | ) | (0.55 | ) | — | | — | | — | |
Total distributions | | (2.60 | ) | (0.55 | ) | — | | — | | — | |
| | | | | | | | | | | |
Net Asset Value | | | | | | | | | | | |
End of year | | $ | 16.04 | | $ | 17.25 | | $ | 15.39 | | $ | 14.26 | | $ | 13.53 | |
| | | | | | | | | | | |
Total Return(a) | | 8.70 | % | 16.04 | % | 7.89 | % | 5.43 | % | 31.87 | % |
| | | | | | | | | | | |
Net Assets End of Period | | $ | 35,568 | | $ | 41,340 | | $ | 49,909 | | $ | 65,391 | | $ | 2,547 | |
| | | | | | | | | | | |
Ratio and Supplemental Data | | | | | | | | | | | |
| | | | | | | | | | | |
Expenses to average net assets: | | | | | | | | | | | |
After reimbursement/fee waiver(b) | | 2.13 | %(c) | 2.15 | %(c) | 2.15 | %(c) | 1.99 | %(c) | 2.20 | %(c) |
Before reimbursement/fee waiver(b) | | 2.13 | %(d) | 2.15 | %(d) | 2.15 | %(d) | 1.99 | %(d) | 2.29 | %(d) |
Net investment income (loss), to average net assets(b) | | (0.15 | )% | (0.12 | )% | (0.53 | )% | (0.83 | )% | (1.01 | )% |
Portfolio turnover rate(e) | | 17 | % | 25 | % | 27 | % | 25 | % | 30 | % |
| | TA IDEX Templeton Transamerica Global | |
| | Class A | |
| | October 31, | | October 31, | | October 31, | | October 31, | | October 31, | |
| | 2007 | | 2006 | | 2005 | | 2004 | | 2003 | |
| | | | | | | | | | | |
Net Asset Value | | | | | | | | | | | |
Beginning of year | | $ | 29.28 | | $ | 24.68 | | $ | 22.57 | | $ | 21.41 | | $ | 19.06 | |
| | | | | | | | | | | |
Investment Operations (h) | | | | | | | | | | | |
Net Investment income (loss) | | 0.19 | | 0.15 | | 0.21 | | (0.07 | ) | (0.05 | ) |
Net realized and unrealized gain (loss) on investments | | 6.70 | | 4.45 | | 2.14 | | 1.23 | | 2.40 | |
Total from investment operations | | 6.89 | | 4.60 | | 2.35 | | 1.16 | | 2.35 | |
| | | | | | | | | | | |
Distributions | | | | | | | | | | | |
Net investment income | | (0.34 | ) | — | | (0.24 | ) | — | | — | |
Net realized gains on investments | | — | | — | | — | | — | | — | |
Total distributions | | (0.34 | ) | — | | (0.24 | ) | — | | — | |
| | | | | | | | | | | |
Net Asset Value | | | | | | | | | | | |
End of year | | $ | 35.83 | | $ | 29.28 | | $ | 24.68 | | $ | 22.57 | | $ | 21.41 | |
| | | | | | | | | | | |
Total Return(a) | | 23.74 | % | 18.65 | % | 10.41 | % | 5.41 | % | 12.33 | % |
| | | | | | | | | | | |
Net Assets End of Period | | $ | 118,738 | | $ | 117,367 | | $ | 385,504 | | $ | 226,517 | | $ | 189,046 | |
| | | | | | | | | | | |
Ratio and Supplemental Data | | | | | | | | | | | |
| | | | | | | | | | | |
Expenses to average net assets: | | | | | | | | | | | |
After reimbursement/fee waiver(b) | | 1.55 | %(c) | 1.55 | %(c) | 1.42 | %(c) | 1.85 | %(c) | 2.07 | %(c) |
Before reimbursement/fee waiver(b) | | 1.63 | %(d) | 1.62 | %(d) | 1.42 | %(d) | 1.85 | %(d) | 2.07 | %(d) |
Net investment income (loss), to average net assets(b) | | 0.59 | % | 0.55 | % | 0.85 | % | (0.31 | )% | (0.26 | )% |
Portfolio turnover rate(e) | | 30 | % | 55 | % | 79 | % | 140 | % | 103 | % |
The notes to the financial statements are an integral part of this report
82
| | TA IDEX Templeton Transamerica Global | |
| | Class B | |
| | October 31, | | October 31, | | October 31, | | October 31, | | October 31, | |
| | 2007 | | 2006 | | 2005 | | 2004 | | 2003 | |
| | | | | | | | | | | |
Net Asset Value | | | | | | | | | | | |
Beginning of year | | $ | 27.40 | | $ | 23.24 | | $ | 21.23 | | $ | 20.25 | | $ | 18.14 | |
| | | | | | | | | | | |
Investment Operations (h) | | | | | | | | | | | |
Net Investment income (loss) | | (0.02 | ) | (0.01 | ) | 0.02 | | (0.20 | ) | (0.17 | ) |
Net realized and unrealized gain (loss) on investments | | 6.28 | | 4.17 | | 1.99 | | 1.18 | | 2.28 | |
Total from investment operations | | 6.26 | | 4.16 | | 2.01 | | 0.98 | | 2.11 | |
| | | | | | | | | | | |
Distributions | | | | | | | | | | | |
Net investment income | | (0.14 | ) | — | | — | | — | | — | |
Net realized gains on investments | | — | | — | | — | | — | | — | |
Total distributions | | (0.14 | ) | — | | — | | — | | — | |
| | | | | | | | | | | |
Net Asset Value | | | | | | | | | | | |
End of year | | $ | 33.52 | | $ | 27.40 | | $ | 23.24 | | $ | 21.23 | | $ | 20.25 | |
| | | | | | | | | | | |
Total Return(a) | | 22.94 | % | 17.90 | % | 9.48 | % | 4.83 | % | 11.57 | % |
| | | | | | | | | | | |
Net Assets End of Period | | $ | 63,876 | | $ | 75,711 | | $ | 90,877 | | $ | 117,409 | | $ | 153,046 | |
| | | | | | | | | | | |
Ratio and Supplemental Data | | | | | | | | | | | |
| | | | | | | | | | | |
Expenses to average net assets: | | | | | | | | | | | |
After reimbursement/fee waiver(b) | | 2.20 | %(c) | 2.20 | %(c) | 2.20 | %(c) | 2.49 | %(c) | 2.72 | %(c) |
Before reimbursement/fee waiver(b) | | 2.39 | %(d) | 2.42 | %(d) | 2.41 | %(d) | 2.49 | %(d) | 2.72 | %(d) |
Net investment income (loss), to average net assets(b) | | (0.07 | )% | (0.05 | )% | 0.07 | % | (0.93 | )% | (0.91 | )% |
Portfolio turnover rate(e) | | 30 | % | 55 | % | 79 | % | 140 | % | 103 | % |
| | TA IDEX Templeton Transamerica Global | |
| | Class C | |
| | October 31, | | October 31, | | October 31, | | October 31, | | October 31, | |
| | 2007 | | 2006 | | 2005 | | 2004 | | 2003 | |
| | | | | | | | | | | |
Net Asset Value | | | | | | | | | | | |
Beginning of year | | $ | 27.37 | | $ | 23.21 | | $ | 21.21 | | $ | 20.25 | | $ | 18.00 | |
| | | | | | | | | | | |
Investment Operations (h) | | | | | | | | | | | |
Net Investment income (loss) | | (0.02 | ) | (0.01 | ) | 0.02 | | (0.15 | ) | (0.17 | ) |
Net realized and unrealized gain (loss) on investments | | 6.27 | | 4.17 | | 1.99 | | 1.11 | | 2.42 | |
Total from investment operations | | 6.25 | | 4.16 | | 2.01 | | 0.96 | | 2.25 | |
| | | | | | | | | | | |
Distributions | | | | | | | | | | | |
Net investment income | | (0.15 | ) | — | | (0.01 | ) | — | | — | |
Net realized gains on investments | | — | | — | | — | | — | | — | |
Total distributions | | (0.15 | ) | — | | (0.01 | ) | — | | — | |
| | | | | | | | | | | |
Net Asset Value | | | | | | | | | | | |
End of year | | $ | 33.47 | | $ | 27.37 | | $ | 23.21 | | $ | 21.21 | | $ | 20.25 | |
| | | | | | | | | | | |
Total Return(a) | | 22.95 | % | 17.87 | % | 9.52 | % | 4.74 | % | 12.50 | % |
| | | | | | | | | | | |
Net Assets End of Period | | $ | 31,506 | | $ | 32,341 | | $ | 36,938 | | $ | 48,378 | | $ | 163 | |
| | | | | | | | | | | |
Ratio and Supplemental Data | | | | | | | | | | | |
| | | | | | | | | | | |
Expenses to average net assets: | | | | | | | | | | | |
After reimbursement/fee waiver(b) | | 2.20 | %(c) | 2.20 | %(c) | 2.20 | %(c) | 2.18 | %(c) | 2.72 | %(c) |
Before reimbursement/fee waiver(b) | | 2.31 | %(d) | 2.35 | %(d) | 2.38 | %(d) | 2.18 | %(d) | 2.72 | %(d) |
Net investment income (loss), to average net assets(b) | | (0.07 | )% | (0.05 | )% | 0.07 | % | (0.72 | )% | (0.92 | )% |
Portfolio turnover rate(e) | | 30 | % | 55 | % | 79 | % | 140 | % | 103 | % |
The notes to the financial statements are an integral part of this report
83
| | TA IDEX Templeton
Transamerica Global | |
| | Class I | |
| | October 31, | | October 31, | |
| | 2007 | | 2006 | |
| | | | | |
Net Asset Value | | | | | |
Beginning of year | | $ | 29.46 | | $ | 25.05 | |
| | | | | |
Investment Operations (h) | | | | | |
Net Investment income (loss) | | 0.38 | | 0.25 | |
Net realized and unrealized gain (loss) on investments | | 6.71 | | 4.16 | |
Total from investment operations | | 7.09 | | 4.41 | |
| | | | | |
Distributions | | | | | |
Net investment income | | (0.52 | ) | — | |
Net realized gains on investments | | — | | — | |
Total distributions | | (0.52 | ) | — | |
| | | | | |
Net Asset Value | | | | | |
End of year | | $ | 36.03 | | $ | 29.46 | |
| | | | | |
Total Return(a) | | 24.41 | % | 17.60 | % |
| | | | | |
Net Assets End of Period | | $ | 44,660 | | $ | 39,472 | |
| | | | | |
Ratio and Supplemental Data | | | | | |
| | | | | |
Expenses to average net assets: | | | | | |
After reimbursement/fee waiver(b) | | 0.96 | %(c) | 0.94 | %(c) |
Before reimbursement/fee waiver(b) | | 0.96 | %(d) | 0.94 | %(d) |
Net investment income (loss), to average net assets(b) | | 1.18 | % | 0.99 | % |
Portfolio turnover rate(e) | | 30 | % | 55 | % |
| | TA IDEX Transamerica Balanced | |
| | Class A | |
| | October 31, | | October 31, | | October 31, | | October 31, | | October 31, | |
| | 2007 | | 2006 | | 2005 | | 2004 | | 2003 | |
| | | | | | | | | | | |
Net Asset Value | | | | | | | | | | | |
Beginning of year | | $ | 22.05 | | $ | 19.90 | | $ | 18.53 | | $ | 17.43 | | $ | 16.23 | |
| | | | | | | | | | | |
Investment Operations (h) | | | | | | | | | | | |
Net Investment income (loss) | | 0.17 | | 0.12 | | 0.15 | | 0.14 | | 0.19 | |
Net realized and unrealized gain (loss) on investments | | 3.62 | | 2.12 | | 1.41 | | 1.08 | | 1.21 | |
Total from investment operations | | 3.79 | | 2.24 | | 1.56 | | 1.22 | | 1.40 | |
| | | | | | | | | | | |
Distributions | | | | | | | | | | | |
Net investment income | | (0.14 | ) | (0.09 | ) | (0.19 | ) | (0.12 | ) | (0.20 | ) |
Net realized gains on investments | | — | | — | | — | | — | | — | |
Total distributions | | (0.14 | ) | (0.09 | ) | (0.19 | ) | (0.12 | ) | (0.20 | ) |
| | | | | | | | | | | |
Net Asset Value | | | | | | | | | | | |
End of year | | $ | 25.70 | | $ | 22.05 | | $ | 19.90 | | $ | 18.53 | | $ | 17.43 | |
| | | | | | | | | | | |
Total Return(a) | | 17.28 | % | 11.27 | % | 8.41 | % | 7.03 | % | 8.71 | % |
| | | | | | | | | | | |
Net Assets End of Period | | $ | 61,565 | | $ | 55,547 | | $ | 62,440 | | $ | 72,997 | | $ | 89,335 | |
| | | | | | | | | | | |
Ratio and Supplemental Data | | | | | | | | | | | |
| | | | | | | | | | | |
Expenses to average net assets: | | | | | | | | | | | |
After reimbursement/fee waiver(b) | | 1.56 | %(c) | 1.58 | %(c) | 1.59 | %(c) | 1.70 | %(c) | 1.73 | %(c) |
Before reimbursement/fee waiver(b) | | 1.56 | %(d) | 1.58 | %(d) | 1.59 | %(d) | 1.70 | %(d) | 1.73 | %(d) |
Net investment income (loss), to average net assets(b) | | 0.73 | % | 0.57 | % | 0.75 | % | 0.76 | % | 1.13 | % |
Portfolio turnover rate(e) | | 52 | % | 51 | % | 27 | % | 107 | % | 69 | % |
The notes to the financial statements are an integral part of this report
84
| | TA IDEX Transamerica Balanced | |
| | Class B | |
| | October 31, | | October 31, | | October 31, | | October 31, | | October 31, | |
| | 2007 | | 2006 | | 2005 | | 2004 | | 2003 | |
| | | | | | | | | | | |
Net Asset Value | | | | | | | | | | | |
Beginning of year | | $ | 21.98 | | $ | 19.88 | | $ | 18.47 | | $ | 17.39 | | $ | 16.22 | |
| | | | | | | | | | | |
Investment Operations (h) | | | | | | | | | | | |
Net Investment income (loss) | | 0.04 | | — | | 0.04 | | 0.04 | | 0.08 | |
Net realized and unrealized gain (loss) on investments | | 3.60 | | 2.12 | | 1.40 | | 1.08 | | 1.18 | |
Total from investment operations | | 3.64 | | 2.12 | | 1.44 | | 1.12 | | 1.26 | |
| | | | | | | | | | | |
Distributions | | | | | | | | | | | |
Net investment income | | (0.04 | ) | (0.02 | ) | (0.03 | ) | (0.04 | ) | (0.09 | ) |
Net realized gains on investments | | — | | — | | — | | — | | — | |
Total distributions | | (0.04 | ) | (0.02 | ) | (0.03 | ) | (0.04 | ) | (0.09 | ) |
| | | | | | | | | | | |
Net Asset Value | | | | | | | | | | | |
End of year | | $ | 25.58 | | $ | 21.98 | | $ | 19.88 | | $ | 18.47 | | $ | 17.39 | |
| | | | | | | | | | | |
Total Return(a) | | 16.57 | % | 10.65 | % | 7.80 | % | 6.44 | % | 7.84 | % |
| | | | | | | | | | | |
Net Assets End of Period | | $ | 96,573 | | $ | 118,286 | | $ | 142,479 | | $ | 170,630 | | $ | 199,472 | |
| | | | | | | | | | | |
Ratio and Supplemental Data | | | | | | | | | | | |
| | | | | | | | | | | |
Expenses to average net assets: | | | | | | | | | | | |
After reimbursement/fee waiver(b) | | 2.14 | %(c) | 2.15 | %(c) | 2.14 | %(c) | 2.26 | %(c) | 2.37 | %(c) |
Before reimbursement/fee waiver(b) | | 2.14 | %(d) | 2.15 | %(d) | 2.14 | %(d) | 2.26 | %(d) | 2.37 | %(d) |
Net investment income (loss), to average net assets(b) | | 0.15 | % | 0.01 | % | 0.20 | % | 0.19 | % | 0.48 | % |
Portfolio turnover rate(e) | | 52 | % | 51 | % | 27 | % | 107 | % | 69 | % |
| | TA IDEX Transamerica Balanced | |
| | Class C | |
| | October 31, | | October 31, | | October 31, | | October 31, | | October 31, | |
| | 2007 | | 2006 | | 2005 | | 2004 | | 2003 | |
| | | | | | | | | | | |
Net Asset Value | | | | | | | | | | | |
Beginning of year | | $ | 21.91 | | $ | 19.82 | | $ | 18.45 | | $ | 17.39 | | $ | 16.22 | |
| | | | | | | | | | | |
Investment Operations (h) | | | | | | | | | | | |
Net Investment income (loss) | | 0.04 | | 0.01 | | 0.04 | | (0.01 | ) | 0.08 | |
Net realized and unrealized gain (loss) on investments | | 3.59 | | 2.10 | | 1.41 | | 1.11 | | 1.18 | |
Total from investment operations | | 3.63 | | 2.11 | | 1.45 | | 1.10 | | 1.26 | |
| | | | | | | | | | | |
Distributions | | | | | | | | | | | |
Net investment income | | (0.04 | ) | (0.02 | ) | (0.08 | ) | (0.04 | ) | (0.09 | ) |
Net realized gains on investments | | — | | — | | — | | — | | — | |
Total distributions | | (0.04 | ) | (0.02 | ) | (0.08 | ) | (0.04 | ) | (0.09 | ) |
| | | | | | | | | | | |
Net Asset Value | | | | | | | | | | | |
End of year | | $ | 25.50 | | $ | 21.91 | | $ | 19.82 | | $ | 18.45 | | $ | 17.39 | |
| | | | | | | | | | | |
Total Return(a) | | 16.61 | % | 10.64 | % | 7.85 | % | 6.33 | % | 7.84 | % |
| | | | | | | | | | | |
Net Assets End of Period | | $ | 32,569 | | $ | 36,750 | | $ | 43,276 | | $ | 53,990 | | $ | 4,354 | |
| | | | | | | | | | | |
Ratio and Supplemental Data | | | | | | | | | | | |
| | | | | | | | | | | |
Expenses to average net assets: | | | | | | | | | | | |
After reimbursement/fee waiver(b) | | 2.11 | %(c) | 2.12 | %(c) | 2.13 | %(c) | 2.28 | %(c) | 2.39 | %(c) |
Before reimbursement/fee waiver(b) | | 2.11 | %(d) | 2.12 | %(d) | 2.13 | %(d) | 2.28 | %(d) | 2.38 | %(d) |
Net investment income (loss), to average net assets(b) | | 0.18 | % | 0.03 | % | 0.21 | % | (0.08 | )% | 0.48 | % |
Portfolio turnover rate(e) | | 52 | % | 51 | % | 27 | % | 107 | % | 69 | % |
The notes to the financial statements are an integral part of this report
85
| | TA IDEX Transamerica Convertible Securities | |
| | Class A | |
| | October 31, | | October 31, | | October 31, | | October 31, | | October 31, | |
| | 2007 | | 2006 | | 2005 | | 2004 | | 2003 | |
| | | | | | | | | | | |
Net Asset Value | | | | | | | | | | | |
Beginning of year | | $ | 12.76 | | $ | 11.56 | | $ | 11.00 | | $ | 11.32 | | $ | 9.39 | |
| | | | | | | | | | | |
Investment Operations (h) | | | | | | | | | | | |
Net Investment income (loss) | | 0.10 | | 0.07 | | 0.20 | | 0.21 | | 0.24 | |
Net realized and unrealized gain (loss) on investments | | 3.22 | | 1.33 | | 0.81 | | 0.56 | | 1.92 | |
Total from investment operations | | 3.32 | | 1.40 | | 1.01 | | 0.77 | | 2.16 | |
| | | | | | | | | | | |
Distributions | | | | | | | | | | | |
Net investment income | | (0.11 | ) | (0.07 | ) | (0.20 | ) | (0.22 | ) | (0.23 | ) |
Net realized gains on investments | | (0.67 | ) | (0.13 | ) | (0.25 | ) | (0.87 | ) | — | |
Total distributions | | (0.78 | ) | (0.20 | ) | (0.45 | ) | (1.09 | ) | (0.23 | ) |
| | | | | | | | | | | |
Net Asset Value | | | | | | | | | | | |
End of year | | $ | 15.30 | | $ | 12.76 | | $ | 11.56 | | $ | 11.00 | | $ | 11.32 | |
| | | | | | | | | | | |
Total Return(a) | | 27.41 | % | 12.15 | % | 9.24 | % | 7.06 | % | 23.49 | % |
| | | | | | | | | | | |
Net Assets End of Period | | $ | 11,276 | | $ | 6,350 | | $ | 209,374 | | $ | 188,049 | | $ | 175,175 | |
| | | | | | | | | | | |
Ratio and Supplemental Data | | | | | | | | | | | |
| | | | | | | | | | | |
Expenses to average net assets: | | | | | | | | | | | |
After reimbursement/fee waiver(b) | | 1.33 | %(c) | 1.25 | %(c) | 1.17 | %(c) | 1.20 | %(c) | 1.33 | %(c) |
Before reimbursement/fee waiver(b) | | 1.33 | %(d) | 1.25 | %(d) | 1.17 | %(d) | 1.20 | %(d) | 1.33 | %(d) |
Net investment income (loss), to average net assets(b) | | 0.75 | % | 0.59 | % | 1.74 | % | 1.83 | % | 2.27 | % |
Portfolio turnover rate(e) | | 92 | % | 69 | % | 87 | % | 157 | % | 119 | % |
| | TA IDEX Transamerica Convertible Securities | |
| | Class B | |
| | October 31, | | October 31, | | October 31, | | October 31, | | October 31, | |
| | 2007 | | 2006 | | 2005 | | 2004 | | 2003 | |
| | | | | | | | | | | |
Net Asset Value | | | | | | | | | | | |
Beginning of year | | $ | 12.71 | | $ | 11.54 | | $ | 11.00 | | $ | 11.31 | | $ | 9.38 | |
| | | | | | | | | | | |
Investment Operations (h) | | | | | | | | | | | |
Net Investment income (loss) | | 0.01 | | — | | 0.09 | | 0.14 | | 0.17 | |
Net realized and unrealized gain (loss) on investments | | 3.21 | | 1.32 | | 0.80 | | 0.57 | | 1.93 | |
Total from investment operations | | 3.22 | | 1.32 | | 0.89 | | 0.71 | | 2.10 | |
| | | | | | | | | | | |
Distributions | | | | | | | | | | | |
Net investment income | | (0.04 | ) | (0.02 | ) | (0.10 | ) | (0.15 | ) | (0.17 | ) |
Net realized gains on investments | | (0.67 | ) | (0.13 | ) | (0.25 | ) | (0.87 | ) | — | |
Total distributions | | (0.71 | ) | (0.15 | ) | (0.35 | ) | (1.02 | ) | (0.17 | ) |
| | | | | | | | | | | |
Net Asset Value | | | | | | | | | | | |
End of year | | $ | 15.22 | | $ | 12.71 | | $ | 11.54 | | $ | 11.00 | | $ | 11.31 | |
| | | | | | | | | | | |
Total Return(a) | | 26.54 | % | 11.47 | % | 8.09 | % | 6.52 | % | 22.58 | % |
| | | | | | | | | | | |
Net Assets End of Period | | $ | 6,533 | | $ | 6,651 | | $ | 6,656 | | $ | 6,379 | | $ | 6,508 | |
| | | | | | | | | | | |
Ratio and Supplemental Data | | | | | | | | | | | |
| | | | | | | | | | | |
Expenses to average net assets: | | | | | | | | | | | |
After reimbursement/fee waiver(b) | | 1.99 | %(c) | 1.99 | %(c) | 2.15 | %(c) | 1.79 | %(c) | 1.98 | %(c) |
Before reimbursement/fee waiver(b) | | 1.99 | %(d) | 1.99 | %(d) | 2.15 | %(d) | 1.79 | %(d) | 1.98 | %(d) |
Net investment income (loss), to average net assets(b) | | 0.10 | % | — | % | 0.76 | % | 1.24 | % | 1.62 | % |
Portfolio turnover rate(e) | | 92 | % | 69 | % | 87 | % | 157 | % | 119 | % |
The notes to the financial statements are an integral part of this report
86
| | TA IDEX Transamerica Convertible Securities | |
| | Class C | |
| | October 31, | | October 31, | | October 31, | | October 31, | | October 31, | |
| | 2007 | | 2006 | | 2005 | | 2004 | | 2003 | |
| | | | | | | | | | | |
Net Asset Value | | | | | | | | | | | |
Beginning of year | | $ | 12.66 | | $ | 11.50 | | $ | 10.97 | | $ | 11.31 | | $ | 9.36 | |
| | | | | | | | | | | |
Investment Operations (h) | | | | | | | | | | | |
Net Investment income (loss) | | 0.02 | | — | | 0.08 | | 0.11 | | 0.17 | |
Net realized and unrealized gain (loss) on investments | | 3.20 | | 1.31 | | 0.82 | | 0.57 | | 1.95 | |
Total from investment operations | | 3.22 | | 1.31 | | 0.90 | | 0.68 | | 2.12 | |
| | | | | | | | | | | |
Distributions | | | | | | | | | | | |
Net investment income | | (0.04 | ) | (0.02 | ) | (0.12 | ) | (0.15 | ) | (0.17 | ) |
Net realized gains on investments | | (0.67 | ) | (0.13 | ) | (0.25 | ) | (0.87 | ) | — | |
Total distributions | | (0.71 | ) | (0.15 | ) | (0.37 | ) | (1.02 | ) | (0.17 | ) |
| | | | | | | | | | | |
Net Asset Value | | | | | | | | | | | |
End of year | | $ | 15.17 | | $ | 12.66 | | $ | 11.50 | | $ | 10.97 | | $ | 11.31 | |
| | | | | | | | | | | |
Total Return(a) | | 26.69 | % | 11.44 | % | 8.17 | % | 6.33 | % | 22.84 | % |
| | | | | | | | | | | |
Net Assets End of Period | | $ | 3,598 | | $ | 3,551 | | $ | 4,465 | | $ | 5,204 | | $ | 5,048 | |
| | | | | | | | | | | |
Ratio and Supplemental Data | | | | | | | | | | | |
| | | | | | | | | | | |
Expenses to average net assets: | | | | | | | | | | | |
After reimbursement/fee waiver(b) | | 1.94 | %(c) | 1.94 | %(c) | 2.16 | %(c) | 2.05 | %(c) | 1.98 | %(c) |
Before reimbursement/fee waiver(b) | | 1.94 | %(d) | 1.94 | %(d) | 2.16 | %(d) | 2.05 | %(d) | 1.98 | %(d) |
Net investment income (loss), to average net assets(b) | | 0.15 | % | 0.02 | % | 0.73 | % | 0.98 | % | 1.62 | % |
Portfolio turnover rate(e) | | 92 | % | 69 | % | 87 | % | 157 | % | 119 | % |
| | TA IDEX Transamerica | |
| | Convertible Securities | |
| | Class I | |
| | October 31, | | October 31, | |
| | 2007 | | 2006 | |
| | | | | |
Net Asset Value | | | | | |
Beginning of year | | $ | 12.76 | | $ | 11.71 | |
| | | | | |
Investment Operations (h) | | | | | |
Net Investment income (loss) | | 0.16 | | 0.14 | |
Net realized and unrealized gain (loss) on investments | | 3.23 | | 1.17 | |
Total from investment operations | | 3.39 | | 1.31 | |
| | | | | |
Distributions | | | | | |
Net investment income | | (0.17 | ) | (0.13 | ) |
Net realized gains on investments | | (0.67 | ) | (0.13 | ) |
Total distributions | | (0.84 | ) | (0.26 | ) |
| | | | | |
Net Asset Value | | | | | |
End of year | | $ | 15.31 | | $ | 12.76 | |
| | | | | |
Total Return(a) | | 28.10 | % | 11.26 | % |
| | | | | |
Net Assets End of Period | | $ | 148,562 | | $ | 256,474 | |
| | | | | |
Ratio and Supplemental Data | | | | | |
| | | | | |
Expenses to average net assets: | | | | | |
After reimbursement/fee waiver(b) | | 0.82 | %(c) | 0.82 | %(c) |
Before reimbursement/fee waiver(b) | | 0.82 | %(d) | 0.82 | %(d) |
Net investment income (loss), to average net assets(b) | | 1.24 | % | 1.20 | % |
Portfolio turnover rate(e) | | 92 | % | 69 | % |
The notes to the financial statements are an integral part of this report
87
| | TA IDEX Transamerica Equity | |
| | Class A | |
| | October 31, | | October 31, | | October 31, | | October 31, | | October 31, | |
| | 2007 | | 2006 | | 2005 | | 2004 | | 2003 | |
| | | | | | | | | | | |
Net Asset Value | | | | | | | | | | | |
Beginning of year | | $ | 9.83 | | $ | 8.87 | | $ | 7.44 | | $ | 6.86 | | $ | 5.52 | |
| | | | | | | | | | | |
Investment Operations (h) | | | | | | | | | | | |
Net Investment income (loss) | | (0.05 | ) | (0.07 | ) | (0.02 | ) | (0.07 | ) | (0.05 | ) |
Net realized and unrealized gain (loss) on investments | | 2.29 | | 1.11 | | 1.58 | | 0.65 | | 1.39 | |
Total from investment operations | | 2.24 | | 1.04 | | 1.56 | | 0.58 | | 1.34 | |
| | | | | | | | | | | |
Distributions | | | | | | | | | | | |
Net investment income | | — | | — | | — | | — | | — | |
Net realized gains on investments | | — | | (0.08 | ) | (0.13 | ) | — | | — | |
Total distributions | | — | | (0.08 | ) | (0.13 | ) | — | | — | |
| | | | | | | | | | | |
Net Asset Value | | | | | | | | | | | |
End of year | | $ | 12.07 | | $ | 9.83 | | $ | 8.87 | | $ | 7.44 | | $ | 6.86 | |
| | | | | | | | | | | |
Total Return(a) | | 22.79 | % | 11.71 | % | 21.16 | % | 8.45 | % | 24.28 | % |
| | | | | | | | | | | |
Net Assets End of Period | | $ | 532,251 | | $ | 500,483 | | $ | 301,635 | | $ | 176,851 | | $ | 56,618 | |
| | | | | | | | | | | |
Ratio and Supplemental Data | | | | | | | | | | | |
| | | | | | | | | | | |
Expenses to average net assets: | | | | | | | | | | | |
After reimbursement/fee waiver(b) | | 1.40 | %(c) | 1.51 | %(c) | 1.36 | %(c) | 1.50 | %(c) | 1.56 | %(c) |
Before reimbursement/fee waiver(b) | | 1.40 | %(d) | 1.51 | %(d) | 1.36 | %(d) | 1.50 | %(d) | 1.56 | %(d) |
Net investment income (loss), to average net assets(b) | | (0.48 | )% | (0.70 | )% | (0.27 | )% | (0.90 | )% | (0.87 | )% |
Portfolio turnover rate(e) | | 62 | % | 19 | % | 39 | % | 97 | % | 55 | % |
| | TA IDEX Transamerica Equity | |
| | Class B | |
| | October 31, | | October 31, | | October 31, | | October 31, | | October 31, | |
| | 2007 | | 2006 | | 2005 | | 2004 | | 2003 | |
| | | | | | | | | | | |
Net Asset Value | | | | | | | | | | | |
Beginning of year | | $ | 9.35 | | $ | 8.49 | | $ | 7.19 | | $ | 6.68 | | $ | 5.40 | |
| | | | | | | | | | | |
Investment Operations (h) | | | | | | | | | | | |
Net Investment income (loss) | | (0.12 | ) | (0.12 | ) | (0.08 | ) | (0.11 | ) | (0.09 | ) |
Net realized and unrealized gain (loss) on investments | | 2.16 | | 1.06 | | 1.51 | | 0.62 | | 1.37 | |
Total from investment operations | | 2.04 | | 0.94 | | 1.43 | | 0.51 | | 1.28 | |
| | | | | | | | | | | |
Distributions | | | | | | | | | | | |
Net investment income | | — | | — | | — | | — | | — | |
Net realized gains on investments | | — | | (0.08 | ) | (0.13 | ) | — | | — | |
Total distributions | | — | | (0.08 | ) | (0.13 | ) | — | | — | |
| | | | | | | | | | | |
Net Asset Value | | | | | | | | | | | |
End of year | | $ | 11.39 | | $ | 9.35 | | $ | 8.49 | | $ | 7.19 | | $ | 6.68 | |
| | | | | | | | | | | |
Total Return(a) | | 21.82 | % | 11.06 | % | 20.03 | % | 7.68 | % | 23.70 | % |
| | | | | | | | | | | |
Net Assets End of Period | | $ | 191,007 | | $ | 222,144 | | $ | 49,865 | | $ | 47,928 | | $ | 4,613 | |
| | | | | | | | | | | |
Ratio and Supplemental Data | | | | | | | | | | | |
| | | | | | | | | | | |
Expenses to average net assets: | | | | | | | | | | | |
After reimbursement/fee waiver(b) | | 2.17 | %(c) | 2.17 | %(c) | 2.18 | %(c) | 2.20 | %(c) | 2.21 | %(c) |
Before reimbursement/fee waiver(b) | | 2.21 | %(d) | 2.34 | %(d) | 2.61 | %(d) | 2.72 | %(d) | 2.21 | %(d) |
Net investment income (loss), to average net assets(b) | | (1.25 | )% | (1.34 | )% | (0.99 | )% | (1.62 | )% | (1.52 | )% |
Portfolio turnover rate(e) | | 62 | % | 19 | % | 39 | % | 97 | % | 55 | % |
The notes to the financial statements are an integral part of this report
88
| | TA IDEX Transamerica Equity | |
| | Class C | |
| | October 31, | | October 31, | | October 31, | | October 31, | | October 31, | |
| | 2007 | | 2006 | | 2005 | | 2004 | | 2003 | |
| | | | | | | | | | | |
Net Asset Value | | | | | | | | | | | |
Beginning of year | | $ | 9.37 | | $ | 8.50 | | $ | 7.20 | | $ | 6.68 | | $ | 5.30 | |
| | | | | | | | | | | |
Investment Operations (h) | | | | | | | | | | | |
Net Investment income (loss) | | (0.11 | ) | (0.12 | ) | (0.08 | ) | (0.11 | ) | (0.09 | ) |
Net realized and unrealized gain (loss) on investments | | 2.16 | | 1.07 | | 1.51 | | 0.63 | | 1.47 | |
Total from investment operations | | 2.05 | | 0.95 | | 1.43 | | 0.52 | | 1.38 | |
| | | | | | | | | | | |
Distributions | | | | | | | | | | | |
Net investment income | | — | | — | | — | | — | | — | |
Net realized gains on investments | | — | | (0.08 | ) | (0.13 | ) | — | | — | |
Total distributions | | — | | (0.08 | ) | (0.13 | ) | — | | — | |
| | | | | | | | | | | |
Net Asset Value | | | | | | | | | | | |
End of year | | $ | 11.42 | | $ | 9.37 | | $ | 8.50 | | $ | 7.20 | | $ | 6.68 | |
| | | | | | | | | | | |
Total Return(a) | | 21.88 | % | 11.16 | % | 20.05 | % | 7.78 | % | 26.04 | % |
| | | | | | | | | | | |
Net Assets End of Period | | $ | 101,226 | | $ | 97,047 | | $ | 23,656 | | $ | 21,808 | | $ | 1,435 | |
| | | | | | | | | | | |
Ratio and Supplemental Data | | | | | | | | | | | |
| | | | | | | | | | | |
Expenses to average net assets: | | | | | | | | | | | |
After reimbursement/fee waiver(b) | | 2.07 | %(c) | 2.10 | %(c) | 2.18 | %(c) | 2.20 | %(c) | 2.21 | %(c) |
Before reimbursement/fee waiver(b) | | 2.07 | %(d) | 2.10 | %(d) | 2.31 | %(d) | 2.55 | %(d) | 2.21 | %(d) |
Net investment income (loss), to average net assets(b) | | (1.15 | )% | (1.27 | )% | (1.00 | )% | (1.63 | )% | (1.52 | )% |
Portfolio turnover rate(e) | | 62 | % | 19 | % | 39 | % | 97 | % | 55 | % |
| | TA IDEX Transamerica Equity | |
| | Class I | |
| | October 31, | | October 31, | |
| | 2007 | | 2006 | |
| | | | | |
Net Asset Value | | | | | |
Beginning of year | | $ | 9.90 | | $ | 9.17 | |
| | | | | |
Investment Operations (h) | | | | | |
Net Investment income (loss) | | 0.01 | | — | |
Net realized and unrealized gain (loss) on investments | | 2.32 | | 0.81 | |
Total from investment operations | | 2.33 | | 0.81 | |
| | | | | |
Distributions | | | | | |
Net investment income | | — | | — | |
Net realized gains on investments | | — | | (0.08 | ) |
Total distributions | | — | | (0.08 | ) |
| | | | | |
Net Asset Value | | | | | |
End of year | | $ | 12.23 | | $ | 9.90 | |
| | | | | |
Total Return(a) | | 23.54 | % | 8.83 | % |
| | | | | |
Net Assets End of Period | | $ | 888,019 | | $ | 714,803 | |
| | | | | |
Ratio and Supplemental Data | | | | | |
| | | | | |
Expenses to average net assets: | | | | | |
After reimbursement/fee waiver(b) | | 0.78 | %(c) | 0.81 | %(c) |
Before reimbursement/fee waiver(b) | | 0.78 | %(d) | 0.81 | %(d) |
Net investment income (loss), to average net assets(b) | | 0.13 | % | 0.02 | % |
Portfolio turnover rate(e) | | 62 | % | 19 | % |
The notes to the financial statements are an integral part of this report
89
| | TA IDEX Transamerica Equity | |
| | Class T (g) | |
| | October 31, | | October 31, | |
| | 2007 | | 2006 | |
| | | | | |
Net Asset Value | | | | | |
Beginning of year | | $ | 27.18 | | $ | 27.10 | |
| | | | | |
Investment Operations (h) | | | | | |
Net Investment income (loss) | | — | (f) | — | |
Net realized and unrealized gain (loss) on investments | | 6.35 | | 0.08 | |
Total from investment operations | | 6.35 | | 0.08 | |
| | | | | |
Distributions | | | | | |
Net investment income | | — | | — | |
Net realized gains on investments | | — | | — | |
Total distributions | | — | | — | |
| | | | | |
Net Asset Value | | | | | |
End of year | | $ | 33.53 | | $ | 27.18 | |
| | | | | |
Total Return(a) | | 23.36 | % | 0.30 | % |
| | | | | |
Net Assets End of Period | | $ | 183,495 | | $ | 195,420 | |
| | | | | |
Ratio and Supplemental Data | | | | | |
| | | | | |
Expenses to average net assets: | | | | | |
After reimbursement/fee waiver(b) | | 0.91 | %(c) | 0.84 | %(c) |
Before reimbursement/fee waiver(b) | | 0.91 | %(d) | 0.84 | %(d) |
Net investment income (loss), to average net assets(b) | | 0.01 | % | (0.21 | )% |
Portfolio turnover rate(e) | | 62 | % | 19 | % |
| | TA IDEX Transamerica Flexible Income | |
| | Class A | |
| | October 31, | | October 31, | | October 31, | | October 31, | | October 31, | |
| | 2007 | | 2006 | | 2005 | | 2004 | | 2003 | |
| | | | | | | | | | | |
Net Asset Value | | | | | | | | | | | |
Beginning of year | | $ | 9.38 | | $ | 9.31 | | $ | 9.68 | | $ | 10.21 | | $ | 9.94 | |
| | | | | | | | | | | |
Investment Operations (h) | | | | | | | | | | | |
Net Investment income (loss) | | 0.48 | | 0.43 | | 0.37 | | 0.38 | | 0.36 | |
Net realized and unrealized gain (loss) on investments | | (0.25 | ) | 0.05 | | (0.32 | ) | 0.14 | | 0.27 | |
Total from investment operations | | 0.23 | | 0.48 | | 0.05 | | 0.52 | | 0.63 | |
| | | | | | | | | | | |
Distributions | | | | | | | | | | | |
Net investment income | | (0.47 | ) | (0.41 | ) | (0.38 | ) | (0.38 | ) | (0.36 | ) |
Net realized gains on investments | | — | | — | | — | | (0.63 | ) | — | |
Total distributions | | (0.47 | ) | (0.41 | ) | (0.42 | ) | (1.05 | ) | (0.36 | ) |
| | | | | | | | | | | |
Net Asset Value | | | | | | | | | | | |
End of year | | $ | 9.14 | | $ | 9.38 | | $ | 9.31 | | $ | 9.68 | | $ | 10.21 | |
| | | | | | | | | | | |
Total Return(a) | | 2.42 | % | 5.34 | % | 0.47 | % | 5.72 | % | 6.39 | % |
| | | | | | | | | | | |
Net Assets End of Period | | $ | 15,409 | | $ | 17,005 | | $ | 140,203 | | $ | 80,201 | | $ | 87,898 | |
| | | | | | | | | | | |
Ratio and Supplemental Data | | | | | | | | | | | |
| | | | | | | | | | | |
Expenses to average net assets: | | | | | | | | | | | |
After reimbursement/fee waiver(b) | | 1.40 | %(c) | 1.47 | %(c) | 1.25 | %(c) | 1.43 | %(c) | 1.49 | %(c) |
Before reimbursement/fee waiver(b) | | 1.40 | %(d) | 1.47 | %(d) | 1.25 | %(d) | 1.43 | %(d) | 1.50 | %(d) |
Net investment income (loss), to average net assets(b) | | 5.12 | % | 4.64 | % | 3.85 | % | 3.89 | % | 3.56 | % |
Portfolio turnover rate(e) | | 108 | % | 110 | % | 58 | % | 169 | % | 164 | % |
The notes to the financial statements are an integral part of this report
90
| | TA IDEX Transamerica Flexible Income | |
| | Class B | |
| | October 31, | | October 31, | | October 31, | | October 31, | | October 31, | |
| | 2007 | | 2006 | | 2005 | | 2004 | | 2003 | |
| | | | | | | | | | | |
Net Asset Value | | | | | | | | | | | |
Beginning of year | | $ | 9.39 | | $ | 9.32 | | $ | 9.68 | | $ | 10.20 | | $ | 9.94 | |
| | | | | | | | | | | |
Investment Operations (h) | | | | | | | | | | | |
Net Investment income (loss) | | 0.42 | | 0.38 | | 0.29 | | 0.32 | | 0.30 | |
Net realized and unrealized gain (loss) on investments | | (0.26 | ) | 0.06 | | (0.32 | ) | 0.15 | | 0.25 | |
Total from investment operations | | 0.16 | | 0.44 | | (0.03 | ) | 0.47 | | 0.55 | |
| | | | | | | | | | | |
Distributions | | | | | | | | | | | |
Net investment income | | (0.41 | ) | (0.37 | ) | (0.29 | ) | (0.32 | ) | (0.29 | ) |
Net realized gains on investments | | — | | — | | — | | (0.63 | ) | — | |
Total distributions | | (0.41 | ) | (0.37 | ) | (0.33 | ) | (0.99 | ) | (0.29 | ) |
| | | | | | | | | | | |
Net Asset Value | | | | | | | | | | | |
End of year | | $ | 9.14 | | $ | 9.39 | | $ | 9.32 | | $ | 9.68 | | $ | 10.20 | |
| | | | | | | | | | | |
Total Return(a) | | 1.66 | % | 4.81 | % | (0.36 | )% | 5.13 | % | 5.59 | % |
| | | | | | | | | | | |
Net Assets End of Period | | $ | 17,007 | | $ | 23,501 | | $ | 32,560 | | $ | 45,338 | | $ | 69,502 | |
| | | | | | | | | | | |
Ratio and Supplemental Data | | | | | | | | | | | |
| | | | | | | | | | | |
Expenses to average net assets: | | | | | | | | | | | |
After reimbursement/fee waiver(b) | | 2.04 | %(c) | 2.08 | %(c) | 2.08 | %(c) | 2.03 | %(c) | 2.14 | %(c) |
Before reimbursement/fee waiver(b) | | 2.04 | %(d) | 2.08 | %(d) | 2.08 | %(d) | 2.03 | %(d) | 2.15 | %(d) |
Net investment income (loss), to average net assets(b) | | 4.48 | % | 4.08 | % | 3.02 | % | 3.25 | % | 2.91 | % |
Portfolio turnover rate(e) | | 108 | % | 110 | % | 58 | % | 169 | % | 164 | % |
| | TA IDEX Transamerica Flexible Income | |
| | Class C | |
| | October 31, | | October 31, | | October 31, | | October 31, | | October 31, | |
| | 2007 | | 2006 | | 2005 | | 2004 | | 2003 | |
| | | | | | | | | | | |
Net Asset Value | | | | | | | | | | | |
Beginning of year | | $ | 9.36 | | $ | 9.30 | | $ | 9.67 | | $ | 10.20 | | $ | 9.98 | |
| | | | | | | | | | | |
Investment Operations (h) | | | | | | | | | | | |
Net Investment income (loss) | | 0.42 | | 0.39 | | 0.29 | | 0.33 | | 0.29 | |
Net realized and unrealized gain (loss) on investments | | (0.25 | ) | 0.04 | | (0.33 | ) | 0.13 | | 0.22 | |
Total from investment operations | | 0.17 | | 0.43 | | (0.04 | ) | 0.46 | | 0.51 | |
| | | | | | | | | | | |
Distributions | | | | | | | | | | | |
Net investment income | | (0.41 | ) | (0.37 | ) | (0.29 | ) | (0.32 | ) | (0.29 | ) |
Net realized gains on investments | | — | | — | | — | | (0.63 | ) | — | |
Total distributions | | (0.41 | ) | (0.37 | ) | (0.33 | ) | (0.99 | ) | (0.29 | ) |
| | | | | | | | | | | |
Net Asset Value | | | | | | | | | | | |
End of year | | $ | 9.12 | | $ | 9.36 | | $ | 9.30 | | $ | 9.67 | | $ | 10.20 | |
| | | | | | | | | | | |
Total Return(a) | | 1.81 | % | 4.74 | % | (0.40 | )% | 5.02 | % | 5.16 | % |
| | | | | | | | | | | |
Net Assets End of Period | | $ | 8,982 | | $ | 12,519 | | $ | 13,439 | | $ | 19,675 | | $ | 8,178 | |
| | | | | | | | | | | |
Ratio and Supplemental Data | | | | | | | | | | | |
| | | | | | | | | | | |
Expenses to average net assets: | | | | | | | | | | | |
After reimbursement/fee waiver(b) | | 2.00 | %(c) | 2.07 | %(c) | 2.11 | %(c) | 2.10 | %(c) | 2.14 | %(c) |
Before reimbursement/fee waiver(b) | | 2.00 | %(d) | 2.07 | %(d) | 2.11 | %(d) | 2.10 | %(d) | 2.15 | %(d) |
Net investment income (loss), to average net assets(b) | | 4.51 | % | 4.15 | % | 2.99 | % | 3.37 | % | 2.91 | % |
Portfolio turnover rate(e) | | 108 | % | 110 | % | 58 | % | 169 | % | 164 | % |
The notes to the financial statements are an integral part of this report
91
| | TA IDEX Transamerica Flexible Income | |
| | Class I | |
| | October 31, | | October 31, | | October 31, | |
| | 2007 | | 2006 | | 2005 | |
| | | | | | | |
Net Asset Value | | | | | | | |
Beginning of year | | $ | 9.42 | | $ | 9.35 | | $ | 9.68 | |
| | | | | | | |
Investment Operations (h) | | | | | | | |
Net Investment income (loss) | | 0.53 | | 0.50 | | 0.40 | |
Net realized and unrealized gain (loss) on investments | | (0.26 | ) | 0.05 | | (0.32 | ) |
Total from investment operations | | 0.27 | | 0.55 | | 0.08 | |
| | | | | | | |
Distributions | | | | | | | |
Net investment income | | (0.52 | ) | (0.48 | ) | (0.37 | ) |
Net realized gains on investments | | — | | — | | — | |
Total distributions | | (0.52 | ) | (0.48 | ) | (0.41 | ) |
| | | | | | | |
Net Asset Value | | | | | | | |
End of year | | $ | 9.17 | | $ | 9.42 | | $ | 9.35 | |
| | | | | | | |
Total Return(a) | | 2.93 | % | 6.04 | % | 0.85 | % |
| | | | | | | |
Net Assets End of Period | | $ | 370,611 | | $ | 221,116 | | $ | 110,709 | |
| | | | | | | |
Ratio and Supplemental Data | | | | | | | |
| | | | | | | |
Expenses to average net assets: | | | | | | | |
After reimbursement/fee waiver(b) | | 0.80 | %(c) | 0.86 | %(c) | 0.85 | %(c) |
Before reimbursement/fee waiver(b) | | 0.80 | %(d) | 0.86 | %(d) | 0.85 | %(d) |
Net investment income (loss), to average net assets(b) | | 5.71 | % | 5.35 | % | 4.25 | % |
Portfolio turnover rate(e) | | 108 | % | 110 | % | 58 | % |
| | TA IDEX Transamerica Growth Opportunities | |
| | Class A | |
| | October 31, | | October 31, | | October 31, | | October 31, | | October 31, | |
| | 2007 | | 2006 | | 2005 | | 2004 | | 2003 | |
| | | | | | | | | | | |
Net Asset Value | | | | | | | | | | | |
Beginning of year | | $ | 8.36 | | $ | 7.85 | | $ | 6.61 | | $ | 5.95 | | $ | 4.81 | |
| | | | | | | | | | | |
Investment Operations (h) | | | | | | | | | | | |
Net Investment income (loss) | | (0.09 | ) | (0.07 | ) | (0.02 | ) | (0.03 | ) | (0.06 | ) |
Net realized and unrealized gain (loss) on investments | | 3.13 | | 0.58 | | 1.26 | | 0.69 | | 1.20 | |
Total from investment operations | | 3.04 | | 0.51 | | 1.24 | | 0.66 | | 1.14 | |
| | | | | | | | | | | |
Distributions | | | | | | | | | | | |
Net investment income | | — | | — | | — | | — | | — | |
Net realized gains on investments | | — | | — | | — | | — | | — | |
Total distributions | | — | | — | | — | | — | | — | |
| | | | | | | | | | | |
Net Asset Value | | | | | | | | | | | |
End of year | | $ | 11.40 | | $ | 8.36 | | $ | 7.85 | | $ | 6.61 | | $ | 5.95 | |
| | | | | | | | | | | |
Total Return(a) | | 36.20 | % | 6.62 | % | 18.76 | % | 11.09 | % | 23.70 | % |
| | | | | | | | | | | |
Net Assets End of Period | | $ | 64,825 | | $ | 56,588 | | $ | 256,559 | | $ | 230,633 | | $ | 147,340 | |
| | | | | | | | | | | |
Ratio and Supplemental Data | | | | | | | | | | | |
| | | | | | | | | | | |
Expenses to average net assets: | | | | | | | | | | | |
After reimbursement/fee waiver(b) | | 1.75 | %(c) | 1.72 | %(c) | 1.41 | %(c) | 1.43 | %(c) | 1.75 | %(c) |
Before reimbursement/fee waiver(b) | | 1.77 | %(d) | 1.72 | %(d) | 1.41 | %(d) | 1.43 | %(d) | 2.21 | %(d) |
Net investment income (loss), to average net assets(b) | | (1.00 | )% | (0.89 | )% | (0.30 | )% | (0.47 | )% | (1.11 | )% |
Portfolio turnover rate(e) | | 85 | % | 59 | % | 34 | % | 43 | % | 97 | % |
The notes to the financial statements are an integral part of this report
92
| | TA IDEX Transamerica Growth Opportunities | |
| | Class B | |
| | October 31, | | October 31, | | October 31, | | October 31, | | October 31, | |
| | 2007 | | 2006 | | 2005 | | 2004 | | 2003 | |
| | | | | | | | | | | |
Net Asset Value | | | | | | | | | | | |
Beginning of year | | $ | 7.92 | | $ | 7.48 | | $ | 6.37 | | $ | 5.79 | | $ | 4.70 | |
| | | | | | | | | | | |
Investment Operations (h) | | | | | | | | | | | |
Net Investment income (loss) | | (0.14 | ) | (0.13 | ) | (0.09 | ) | (0.09 | ) | (0.09 | ) |
Net realized and unrealized gain (loss) on investments | | 2.94 | | 0.57 | | 1.20 | | 0.67 | | 1.18 | |
Total from investment operations | | 2.80 | | 0.44 | | 1.11 | | 0.58 | | 1.09 | |
| | | | | | | | | | | |
Distributions | | | | | | | | | | | |
Net investment income | | — | | — | | — | | — | | — | |
Net realized gains on investments | | — | | — | | — | | — | | — | |
Total distributions | | — | | — | | — | | — | | — | |
| | | | | | | | | | | |
Net Asset Value | | | | | | | | | | | |
End of year | | $ | 10.72 | | $ | 7.92 | | $ | 7.48 | | $ | 6.37 | | $ | 5.79 | |
| | | | | | | | | | | |
Total Return(a) | | 35.35 | % | 5.88 | % | 17.43 | % | 10.02 | % | 23.19 | % |
| | | | | | | | | | | |
Net Assets End of Period | | $ | 65,123 | | $ | 66,098 | | $ | 74,589 | | $ | 77,869 | | $ | 52,492 | |
| | | | | | | | | | | |
Ratio and Supplemental Data | | | | | | | | | | | |
| | | | | | | | | | | |
Expenses to average net assets: | | | | | | | | | | | |
After reimbursement/fee waiver(b) | | 2.40 | %(c) | 2.40 | %(c) | 2.40 | %(c) | 2.40 | %(c) | 2.41 | %(c) |
Before reimbursement/fee waiver(b) | | 2.45 | %(d) | 2.46 | %(d) | 2.61 | %(d) | 2.64 | %(d) | 2.87 | %(d) |
Net investment income (loss), to average net assets(b) | | (1.66 | )% | (1.57 | )% | (1.29 | )% | (1.44 | )% | (1.76 | )% |
Portfolio turnover rate(e) | | 85 | % | 59 | % | 34 | % | 43 | % | 97 | % |
| | TA IDEX Transamerica Growth Opportunities | |
| | Class C | |
| | October 31, | | October 31, | | October 31, | | October 31, | | October 31, | |
| | 2007 | | 2006 | | 2005 | | 2004 | | 2003 | |
| | | | | | | | | | | |
Net Asset Value | | | | | | | | | | | |
Beginning of year | | $ | 7.94 | | $ | 7.49 | | $ | 6.38 | | $ | 5.79 | | $ | 4.62 | |
| | | | | | | | | | | |
Investment Operations (h) | | | | | | | | | | | |
Net Investment income (loss) | | (0.14 | ) | (0.12 | ) | (0.09 | ) | (0.10 | ) | (0.09 | ) |
Net realized and unrealized gain (loss) on investments | | 2.94 | | 0.57 | | 1.20 | | 0.69 | | 1.26 | |
Total from investment operations | | 2.80 | | 0.45 | | 1.11 | | 0.59 | | 1.17 | |
| | | | | | | | | | | |
Distributions | | | | | | | | | | | |
Net investment income | | — | | — | | — | | — | | — | |
Net realized gains on investments | | — | | — | | — | | — | | — | |
Total distributions | | — | | — | | — | | — | | — | |
| | | | | | | | | | | |
Net Asset Value | | | | | | | | | | | |
End of year | | $ | 10.74 | | $ | 7.94 | | $ | 7.49 | | $ | 6.38 | | $ | 5.79 | |
| | | | | | | | | | | |
Total Return(a) | | 35.26 | % | 6.01 | % | 17.40 | % | 10.19 | % | 25.32 | % |
| | | | | | | | | | | |
Net Assets End of Period | | $ | 22,656 | | $ | 21,688 | | $ | 25,432 | | $ | 28,103 | | $ | 483 | |
| | | | | | | | | | | |
Ratio and Supplemental Data | | | | | | | | | | | |
| | | | | | | | | | | |
Expenses to average net assets: | | | | | | | | | | | |
After reimbursement/fee waiver(b) | | 2.36 | %(c) | 2.38 | %(c) | 2.40 | %(c) | 2.40 | %(c) | 2.42 | %(c) |
Before reimbursement/fee waiver(b) | | 2.36 | %(d) | 2.38 | %(d) | 2.54 | %(d) | 2.65 | %(d) | 2.89 | %(d) |
Net investment income (loss), to average net assets(b) | | (1.61 | )% | (1.54 | )% | (1.29 | )% | (1.58 | )% | (1.78 | )% |
Portfolio turnover rate(e) | | 85 | % | 59 | % | 34 | % | 43 | % | 97 | % |
The notes to the financial statements are an integral part of this report
93
| | TA IDEX Transamerica Growth
Opportunities | |
| | Class I | |
| | October 31, | | October 31, | |
| | 2007 | | 2006 | |
| | | | | |
Net Asset Value | | | | | |
Beginning of year | | $ | 8.43 | | $ | 7.99 | |
| | | | | |
Investment Operations (h) | | | | | |
Net Investment income (loss) | | (0.01 | ) | — | |
Net realized and unrealized gain (loss) on investments | | 3.17 | | 0.44 | |
Total from investment operations | | 3.16 | | 0.44 | |
| | | | | |
Distributions | | | | | |
Net investment income | | — | | — | |
Net realized gains on investments | | — | | — | |
Total distributions | | — | | — | |
| | | | | |
Net Asset Value | | | | | |
End of year | | $ | 11.59 | | $ | 8.43 | |
| | | | | |
Total Return(a) | | 37.49 | % | 5.51 | % |
| | | | | |
Net Assets End of Period | | $ | 206,863 | | $ | 214,775 | |
| | | | | |
Ratio and Supplemental Data | | | | | |
| | | | | |
Expenses to average net assets: | | | | | |
After reimbursement/fee waiver(b) | | 0.88 | %(c) | 0.88 | %(c) |
Before reimbursement/fee waiver(b) | | 0.88 | %(d) | 0.88 | %(d) |
Net investment income (loss), to average net assets(b) | | (0.15 | )% | (0.06 | )% |
Portfolio turnover rate(e) | | 85 | % | 59 | % |
| | TA IDEX Transamerica High-Yield Bond | |
| | Class A | |
| | October 31, | | October 31, | | October 31, | | October 31, | | October 31, | |
| | 2007 | | 2006 | | 2005 | | 2004 | | 2003 | |
| | | | | | | | | | | |
Net Asset Value | | | | | | | | | | | |
Beginning of year | | $ | 9.19 | | $ | 8.97 | | $ | 9.37 | | $ | 9.08 | | $ | 7.93 | |
| | | | | | | | | | | |
Investment Operations (h) | | | | | | | | | | | |
Net Investment income (loss) | | 0.60 | | 0.61 | | 0.56 | | 0.52 | | 0.57 | |
Net realized and unrealized gain (loss) on investments | | (0.07 | ) | 0.19 | | (0.37 | ) | 0.29 | | 1.16 | |
Total from investment operations | | 0.53 | | 0.80 | | 0.19 | | 0.81 | | 1.73 | |
| | | | | | | | | | | |
Distributions | | | | | | | | | | | |
Net investment income | | (0.60 | ) | (0.58 | ) | (0.59 | ) | (0.52 | ) | (0.58 | ) |
Net realized gains on investments | | — | | — | | — | | — | | — | |
Total distributions | | (0.60 | ) | (0.58 | ) | (0.59 | ) | (0.52 | ) | (0.58 | ) |
| | | | | | | | | | | |
Net Asset Value | | | | | | | | | | | |
End of year | | $ | 9.12 | | $ | 9.19 | | $ | 8.97 | | $ | 9.37 | | $ | 9.08 | |
| | | | | | | | | | | |
Total Return(a) | | 5.90 | % | 9.27 | % | 2.06 | % | 9.23 | % | 22.74 | % |
| | | | | | | | | | | |
Net Assets End of Period | | $ | 35,147 | | $ | 43,514 | | $ | 336,340 | | $ | 309,223 | | $ | 193,708 | |
| | | | | | | | | | | |
Ratio and Supplemental Data | | | | | | | | | | | |
| | | | | | | | | | | |
Expenses to average net assets: | | | | | | | | | | | |
After reimbursement/fee waiver(b) | | 1.15 | %(c) | 1.16 | %(c) | 1.05 | %(c) | 1.08 | %(c) | 1.22 | %(c) |
Before reimbursement/fee waiver(b) | | 1.15 | %(d) | 1.16 | %(d) | 1.05 | %(d) | 1.08 | %(d) | 1.22 | %(d) |
Net investment income (loss), to average net assets(b) | | 6.45 | % | 6.77 | % | 6.04 | % | 5.67 | % | 6.57 | % |
Portfolio turnover rate(e) | | 80 | % | 73 | % | 71 | % | 49 | % | 46 | % |
The notes to the financial statements are an integral part of this report
94
| | TA IDEX Transamerica High-Yield Bond | |
| | Class B | |
| | October 31, | | October 31, | | October 31, | | October 31, | | October 31, | |
| | 2007 | | 2006 | | 2005 | | 2004 | | 2003 | |
| | | | | | | | | | | |
Net Asset Value | | | | | | | | | | | |
Beginning of year | | $ | 9.18 | | $ | 8.97 | | $ | 9.37 | | $ | 9.08 | | $ | 7.93 | |
| | | | | | | | | | | |
Investment Operations (h) | | | | | | | | | | | |
Net Investment income (loss) | | 0.53 | | 0.55 | | 0.48 | | 0.46 | | 0.51 | |
Net realized and unrealized gain (loss) on investments | | (0.06 | ) | 0.19 | | (0.37 | ) | 0.29 | | 1.17 | |
Total from investment operations | | 0.47 | | 0.74 | | 0.11 | | 0.75 | | 1.68 | |
| | | | | | | | | | | |
Distributions | | | | | | | | | | | |
Net investment income | | (0.54 | ) | (0.53 | ) | (0.51 | ) | (0.46 | ) | (0.53 | ) |
Net realized gains on investments | | — | | — | | — | | — | | — | |
Total distributions | | (0.54 | ) | (0.53 | ) | (0.51 | ) | (0.46 | ) | (0.53 | ) |
| | | | | | | | | | | |
Net Asset Value | | | | | | | | | | | |
End of year | | $ | 9.11 | | $ | 9.18 | | $ | 8.97 | | $ | 9.37 | | $ | 9.08 | |
| | | | | | | | | | | |
Total Return(a) | | 5.19 | % | 8.53 | % | 1.21 | % | 8.52 | % | 21.94 | % |
| | | | | | | | | | | |
Net Assets End of Period | | $ | 21,370 | | $ | 27,753 | | $ | 37,006 | | $ | 49,422 | | $ | 51,511 | |
| | | | | | | | | | | |
Ratio and Supplemental Data | | | | | | | | | | | |
| | | | | | | | | | | |
Expenses to average net assets: | | | | | | | | | | | |
After reimbursement/fee waiver(b) | | 1.83 | %(c) | 1.83 | %(c) | 1.85 | %(c) | 1.72 | %(c) | 1.87 | %(c) |
Before reimbursement/fee waiver(b) | | 1.83 | %(d) | 1.83 | %(d) | 1.85 | %(d) | 1.72 | %(d) | 1.87 | %(d) |
Net investment income (loss), to average net assets(b) | | 5.77 | % | 6.12 | % | 5.18 | % | 5.05 | % | 5.92 | % |
Portfolio turnover rate(e) | | 80 | % | 73 | % | 71 | % | 49 | % | 46 | % |
| | TA IDEX Transamerica High-Yield Bond | |
| | Class C | |
| | October 31, | | October 31, | | October 31, | | October 31, | | October 31, | |
| | 2007 | | 2006 | | 2005 | | 2004 | | 2003 | |
| | | | | | | | | | | |
Net Asset Value | | | | | | | | | | | |
Beginning of year | | $ | 9.17 | | $ | 8.96 | | $ | 9.36 | | $ | 9.08 | | $ | 8.08 | |
| | | | | | | | | | | |
Investment Operations (h) | | | | | | | | | | | |
Net Investment income (loss) | | 0.53 | | 0.55 | | 0.47 | | 0.46 | | 0.51 | |
Net realized and unrealized gain (loss) on investments | | (0.06 | ) | 0.19 | | (0.36 | ) | 0.28 | | 1.02 | |
Total from investment operations | | 0.47 | | 0.74 | | 0.11 | | 0.74 | | 1.53 | |
| | | | | | | | | | | |
Distributions | | | | | | | | | | | |
Net investment income | | (0.54 | ) | (0.53 | ) | (0.51 | ) | (0.46 | ) | (0.53 | ) |
Net realized gains on investments | | — | | — | | — | | — | | — | |
Total distributions | | (0.54 | ) | (0.53 | ) | (0.51 | ) | (0.46 | ) | (0.53 | ) |
| | | | | | | | | | | |
Net Asset Value | | | | | | | | | | | |
End of year | | $ | 9.10 | | $ | 9.17 | | $ | 8.96 | | $ | 9.36 | | $ | 9.08 | |
| | | | | | | | | | | |
Total Return(a) | | 5.21 | % | 8.54 | % | 1.21 | % | 8.41 | % | 19.52 | % |
| | | | | | | | | | | |
Net Assets End of Period | | $ | 10,160 | | $ | 11,317 | | $ | 15,880 | | $ | 25,379 | | $ | 8,403 | |
| | | | | | | | | | | |
Ratio and Supplemental Data | | | | | | | | | | | |
| | | | | | | | | | | |
Expenses to average net assets: | | | | | | | | | | | |
After reimbursement/fee waiver(b) | | 1.83 | %(c) | 1.83 | %(c) | 1.88 | %(c) | 1.78 | %(c) | 1.87 | %(c) |
Before reimbursement/fee waiver(b) | | 1.83 | %(d) | 1.83 | %(d) | 1.88 | %(d) | 1.78 | %(d) | 1.87 | %(d) |
Net investment income (loss), to average net assets(b) | | 5.77 | % | 6.12 | % | 5.11 | % | 4.95 | % | 5.92 | % |
Portfolio turnover rate(e) | | 80 | % | 73 | % | 71 | % | 49 | % | 46 | % |
The notes to the financial statements are an integral part of this report
95
| | TA IDEX Transamerica High-Yield Bond | |
| | Class I | |
| | October 31, | | October 31, | | October 31, | |
| | 2007 | | 2006 | | 2005 | |
| | | | | | | |
Net Asset Value | | | | | | | |
Beginning of year | | $ | 9.24 | | $ | 9.02 | | $ | 9.39 | |
| | | | | | | |
Investment Operations (h) | | | | | | | |
Net Investment income (loss) | | 0.65 | | 0.67 | | 0.59 | |
Net realized and unrealized gain (loss) on investments | | (0.07 | ) | 0.18 | | (0.37 | ) |
Total from investment operations | | 0.58 | | 0.85 | | 0.22 | |
| | | | | | | |
Distributions | | | | | | | |
Net investment income | | (0.65 | ) | (0.63 | ) | (0.59 | ) |
Net realized gains on investments | | — | | — | | — | |
Total distributions | | (0.65 | ) | (0.63 | ) | (0.59 | ) |
| | | | | | | |
Net Asset Value | | | | | | | |
End of year | | $ | 9.17 | | $ | 9.24 | | $ | 9.02 | |
| | | | | | | |
Total Return(a) | | 6.39 | % | 9.81 | % | 2.33 | % |
| | | | | | | |
Net Assets End of Period | | $ | 331,300 | | $ | 315,252 | | $ | 40,860 | |
| | | | | | | |
Ratio and Supplemental Data | | | | | | | |
| | | | | | | |
Expenses to average net assets: | | | | | | | |
After reimbursement/fee waiver(b) | | 0.65 | %(c) | 0.66 | %(c) | 0.66 | %(c) |
Before reimbursement/fee waiver(b) | | 0.65 | %(d) | 0.66 | %(d) | 0.66 | %(d) |
Net investment income (loss), to average net assets(b) | | 6.96 | % | 7.29 | % | 6.60 | % |
Portfolio turnover rate(e) | | 80 | % | 73 | % | 71 | % |
| | TA IDEX Transamerica Money Market | |
| | Class A | |
| | October 31, | | October 31, | | October 31, | | October 31, | | October 31, | |
| | 2007 | | 2006 | | 2005 | | 2004 | | 2003 | |
| | | | | | | | | | | |
Net Asset Value | | | | | | | | | | | |
Beginning of year | | $ | 1.00 | | $ | 1.00 | | $ | 1.00 | | $ | 1.00 | | $ | 1.00 | |
| | | | | | | | | | | |
Investment Operations (h) | | | | | | | | | | | |
Net Investment income (loss) | | 0.05 | | 0.04 | | 0.02 | | — | (f) | — | (f) |
Net realized and unrealized gain (loss) on investments | | — | | — | | — | | — | | — | |
Total from investment operations | | 0.05 | | 0.04 | | 0.02 | | — | | — | |
| | | | | | | | | | | |
Distributions | | | | | | | | | | | |
Net investment income | | (0.05 | ) | (0.04 | ) | (0.02 | ) | — | (f) | — | (f) |
Net realized gains on investments | | — | | — | | — | | — | | — | |
Total distributions | | (0.05 | ) | (0.04 | ) | (0.02 | ) | — | (f) | — | (f) |
| | | | | | | | | | | |
Net Asset Value | | | | | | | | | | | |
End of year | | $ | 1.00 | | $ | 1.00 | | $ | 1.00 | | $ | 1.00 | | $ | 1.00 | |
| | | | | | | | | | | |
Total Return(a) | | 4.61 | % | 4.09 | % | 2.10 | % | 0.42 | % | 0.39 | % |
| | | | | | | | | | | |
Net Assets End of Period | | $ | 95,766 | | $ | 78,716 | | $ | 150,804 | | $ | 185,311 | | $ | 109,794 | |
| | | | | | | | | | | |
Ratio and Supplemental Data | | | | | | | | | | | |
| | | | | | | | | | | |
Expenses to average net assets: | | | | | | | | | | | |
After reimbursement/fee waiver(b) | | 0.83 | %(c) | 0.83 | %(c) | 0.83 | %(c) | 0.83 | %(c) | 0.83 | %(c) |
Before reimbursement/fee waiver(b) | | 1.20 | %(d) | 1.23 | %(d) | 1.05 | %(d) | 1.19 | %(d) | 1.22 | %(d) |
Net investment income (loss), to average net assets(b) | | 4.54 | % | 3.98 | % | 2.08 | % | 0.45 | % | 0.42 | % |
The notes to the financial statements are an integral part of this report
96
| | TA IDEX Transamerica Money Market | |
| | Class B | |
| | October 31, | | October 31, | | October 31, | | October 31, | | October 31, | |
| | 2007 | | 2006 | | 2005 | | 2004 | | 2003 | |
| | | | | | | | | | | |
Net Asset Value | | | | | | | | | | | |
Beginning of year | | $ | 1.00 | | $ | 1.00 | | $ | 1.00 | | $ | 1.00 | | $ | 1.00 | |
| | | | | | | | | | | |
Investment Operations (h) | | | | | | | | | | | |
Net Investment income (loss) | | 0.04 | | 0.03 | | 0.02 | | — | (f) | — | (f) |
Net realized and unrealized gain (loss) on investments | | — | | — | | — | | — | | — | |
Total from investment operations | | 0.04 | | 0.03 | | 0.02 | | — | | — | |
| | | | | | | | | | | |
Distributions | | | | | | | | | | | |
Net investment income | | (0.04 | ) | (0.03 | ) | (0.02 | ) | — | (f) | — | (f) |
Net realized gains on investments | | — | | — | | — | | — | | — | |
Total distributions | | (0.04 | ) | (0.03 | ) | (0.02 | ) | — | (f) | — | (f) |
| | | | | | | | | | | |
Net Asset Value | | | | | | | | | | | |
End of year | | $ | 1.00 | | $ | 1.00 | | $ | 1.00 | | $ | 1.00 | | $ | 1.00 | |
| | | | | | | | | | | |
Total Return(a) | | 3.92 | % | 3.41 | % | 1.60 | % | 0.14 | % | 0.12 | % |
| | | | | | | | | | | |
Net Assets End of Period | | $ | 23,324 | | $ | 25,727 | | $ | 31,647 | | $ | 40,203 | | $ | 54,324 | |
| | | | | | | | | | | |
Ratio and Supplemental Data | | | | | | | | | | | |
| | | | | | | | | | | |
Expenses to average net assets: | | | | | | | | | | | |
After reimbursement/fee waiver(b) | | 1.48 | %(c) | 1.48 | %(c) | 1.32 | %(c) | 1.10 | %(c) | 1.16 | %(c) |
Before reimbursement/fee waiver(b) | | 1.83 | %(d) | 1.80 | %(d) | 1.79 | %(d) | 1.81 | %(d) | 1.87 | %(d) |
Net investment income (loss), to average net assets(b) | | 3.87 | % | 3.50 | % | 1.57 | % | 0.13 | % | 0.08 | % |
| | TA IDEX Transamerica Money Market | |
| | Class C | |
| | October 31, | | October 31, | | October 31, | | October 31, | | October 31, | |
| | 2007 | | 2006 | | 2005 | | 2004 | | 2003 | |
| | | | | | | | | | | |
Net Asset Value | | | | | | | | | | | |
Beginning of year | | $ | 1.00 | | $ | 1.00 | | $ | 1.00 | | $ | 1.00 | | $ | 1.00 | |
| | | | | | | | | | | |
Investment Operations (h) | | | | | | | | | | | |
Net Investment income (loss) | | 0.04 | | 0.03 | | 0.02 | | — | (f) | — | (f) |
Net realized and unrealized gain (loss) on investments | | — | | — | | — | | — | | — | |
Total from investment operations | | 0.04 | | 0.03 | | 0.02 | | — | | — | |
| | | | | | | | | | | |
Distributions | | | | | | | | | | | |
Net investment income | | (0.04 | ) | (0.03 | ) | (0.02 | ) | — | (f) | — | (f) |
Net realized gains on investments | | — | | — | | — | | — | | — | |
Total distributions | | (0.04 | ) | (0.03 | ) | (0.02 | ) | — | (f) | — | (f) |
| | | | | | | | | | | |
Net Asset Value | | | | | | | | | | | |
End of year | | $ | 1.00 | | $ | 1.00 | | $ | 1.00 | | $ | 1.00 | | $ | 1.00 | |
| | | | | | | | | | | |
Total Return(a) | | 3.92 | % | 3.16 | % | 1.87 | % | 0.14 | % | 0.12 | % |
| | | | | | | | | | | |
Net Assets End of Period | | $ | 19,638 | | $ | 17,286 | | $ | 15,997 | | $ | 22,277 | | $ | 3,542 | |
| | | | | | | | | | | |
Ratio and Supplemental Data | | | | | | | | | | | |
| | | | | | | | | | | |
Expenses to average net assets: | | | | | | | | | | | |
After reimbursement/fee waiver(b) | | 1.48 | %(c) | 1.48 | %(c) | 1.26 | %(c) | 0.98 | %(c) | 1.04 | %(c) |
Before reimbursement/fee waiver(b) | | 1.73 | %(d) | 1.82 | %(d) | 1.89 | %(d) | 1.96 | %(d) | 1.87 | %(d) |
Net investment income (loss), to average net assets(b) | | 3.88 | % | 3.40 | % | 1.61 | % | 0.43 | % | 0.21 | % |
The notes to the financial statements are an integral part of this report
97
| | TA IDEX Transamerica Money
Market | |
| | Class I | |
| | October 31, | | October 31, | |
| | 2007 | | 2006 | |
| | | | | |
Net Asset Value | | | | | |
Beginning of year | | $ | 1.00 | | $ | 1.00 | |
| | | | | |
Investment Operations (h) | | | | | |
Net Investment income (loss) | | 0.05 | | 0.04 | |
Net realized and unrealized gain (loss) on investments | | — | | — | |
Total from investment operations | | 0.05 | | 0.04 | |
| | | | | |
Distributions | | | | | |
Net investment income | | (0.05 | ) | (0.04 | ) |
Net realized gains on investments | | — | | — | |
Total distributions | | (0.05 | ) | (0.04 | ) |
| | | | | |
Net Asset Value | | | | | |
End of year | | $ | 1.00 | | $ | 1.00 | |
| | | | | |
Total Return(a) | | 4.98 | % | 4.30 | % |
| | | | | |
Net Assets End of Period | | $ | 34,673 | | $ | 26,466 | |
| | | | | |
Ratio and Supplemental Data | | | | | |
| | | | | |
Expenses to average net assets: | | | | | |
After reimbursement/fee waiver(b) | | 0.48 | %(c) | 0.48 | %(c) |
Before reimbursement/fee waiver(b) | | 0.52 | %(d) | 0.51 | %(d) |
Net investment income (loss), to average net assets(b) | | 4.88 | % | 4.39 | % |
| | TA IDEX Transamerica Science & Technology | |
| | Class A | |
| | October 31, | | October 31, | | October 31, | | October 31, | | October 31, | |
| | 2007 | | 2006 | | 2005 | | 2004 | | 2003 | |
| | | | | | | | | | | |
Net Asset Value | | | | | | | | | | | |
Beginning of year | | $ | 3.91 | | $ | 3.82 | | $ | 3.80 | | $ | 3.61 | | $ | 2.56 | |
| | | | | | | | | | | |
Investment Operations (h) | | | | | | | | | | | |
Net Investment income (loss) | | (0.05 | ) | (0.03 | ) | 0.03 | | (0.04 | ) | (0.04 | ) |
Net realized and unrealized gain (loss) on investments | | 1.81 | | 0.18 | | 0.02 | | 0.23 | | 1.09 | |
Total from investment operations | | 1.76 | | 0.15 | | 0.05 | | 0.19 | | 1.05 | |
| | | | | | | | | | | |
Distributions | | | | | | | | | | | |
Net investment income | | — | | — | | (0.03 | ) | — | | — | |
Net realized gains on investments | | — | | (0.06 | ) | — | | — | | — | |
Total distributions | | — | | (0.06 | ) | (0.03 | ) | — | | — | |
| | | | | | | | | | | |
Net Asset Value | | | | | | | | | | | |
End of year | | $ | 5.67 | | $ | 3.91 | | $ | 3.82 | | $ | 3.80 | | $ | 3.61 | |
| | | | | | | | | | | |
Total Return(a) | | 45.01 | % | 3.78 | % | 1.23 | % | 5.26 | % | 41.02 | % |
| | | | | | | | | | | |
Net Assets End of Period | | $ | 7,874 | | $ | 5,616 | | $ | 65,423 | | $ | 119,985 | | $ | 78,289 | |
| | | | | | | | | | | |
Ratio and Supplemental Data | | | | | | | | | | | |
| | | | | | | | | | | |
Expenses to average net assets: | | | | | | | | | | | |
After reimbursement/fee waiver(b) | | 1.55 | %(c) | 1.53 | %(c) | 1.32 | %(c) | 1.36 | %(c) | 1.55 | %(c) |
Before reimbursement/fee waiver(b) | | 1.78 | %(d) | 1.67 | %(d) | 1.32 | %(d) | 1.36 | %(d) | 1.90 | %(d) |
Net investment income (loss), to average net assets(b) | | (1.03 | )% | (0.72 | )% | 0.63 | % | (1.12 | )% | (1.23 | )% |
Portfolio turnover rate(e) | | 66 | % | 94 | % | 73 | % | 41 | % | 24 | % |
The notes to the financial statements are an integral part of this report
98
| | TA IDEX Transamerica Science & Technology | |
| | Class B | |
| | October 31, | | October 31, | | October 31, | | October 31, | | October 31, | |
| | 2007 | | 2006 | | 2005 | | 2004 | | 2003 | |
| | | | | | | | | | | |
Net Asset Value | | | | | | | | | | | |
Beginning of year | | $ | 32.74 | | $ | 3.68 | | $ | 3.68 | | $ | 3.51 | | $ | 2.50 | |
| | | | | | | | | | | |
Investment Operations (h) | | | | | | | | | | | |
Net Investment income (loss) | | (0.07 | ) | (0.06 | ) | (0.02 | ) | (0.06 | ) | (0.06 | ) |
Net realized and unrealized gain (loss) on investments | | 1.73 | | 0.18 | | 0.02 | | 0.23 | | 1.07 | |
Total from investment operations | | 1.66 | | 0.12 | | — | | 0.17 | | 1.01 | |
| | | | | | | | | | | |
Distributions | | | | | | | | | | | |
Net investment income | | — | | — | | — | | — | | — | |
Net realized gains on investments | | — | | (0.06 | ) | — | | — | | — | |
Total distributions | | — | | (0.06 | ) | — | | — | | — | |
| | | | | | | | | | | |
Net Asset Value | | | | | | | | | | | |
End of year | | $ | 5.40 | | $ | 3.74 | | $ | 3.68 | | $ | 3.68 | | $ | 3.51 | |
| | | | | | | | | | | |
Total Return(a) | | 44.39 | % | 3.10 | % | — | % | 4.84 | % | 40.40 | % |
| | | | | | | | | | | |
Net Assets End of Period | | $ | 4,913 | | $ | 4,208 | | $ | 5,316 | | $ | 6,874 | | $ | 7,864 | |
| | | | | | | | | | | |
Ratio and Supplemental Data | | | | | | | | | | | |
| | | | | | | | | | | |
Expenses to average net assets: | | | | | | | | | | | |
After reimbursement/fee waiver(b) | | 2.19 | %(c) | 2.18 | %(c) | 2.20 | %(c) | 1.91 | %(c) | 2.20 | %(c) |
Before reimbursement/fee waiver(b) | | 2.53 | %(d) | 2.57 | %(d) | 2.68 | %(d) | 1.91 | %(d) | 2.55 | %(d) |
Net investment income (loss), to average net assets(b) | | (1.67 | )% | (1.58 | )% | (0.58 | )% | (1.68 | )% | (1.88 | )% |
Portfolio turnover rate(e) | | 66 | % | 94 | % | 73 | % | 41 | % | 24 | % |
| | TA IDEX Transamerica Science & Technology | |
| | Class C | |
| | October 31, | | October 31, | | October 31, | | October 31, | | October 31, | |
| | 2007 | | 2006 | | 2005 | | 2004 | | 2003 | |
| | | | | | | | | | | |
Net Asset Value | | | | | | | | | | | |
Beginning of year | | $ | 3.73 | | $ | 3.67 | | $ | 3.67 | | $ | 3.51 | | $ | 2.45 | |
| | | | | | | | | | | |
Investment Operations (h) | | | | | | | | | | | |
Net Investment income (loss) | | (0.07 | ) | (0.06 | ) | (0.02 | ) | (0.07 | ) | (0.06 | ) |
Net realized and unrealized gain (loss) on investments | | 1.73 | | 0.18 | | 0.02 | | 0.23 | | 1.12 | |
Total from investment operations | | 1.66 | | 0.12 | | — | | 0.16 | | 1.06 | |
| | | | | | | | | | | |
Distributions | | | | | | | | | | | |
Net investment income | | — | | — | | — | | — | | — | |
Net realized gains on investments | | — | | (0.06 | ) | — | | — | | — | |
Total distributions | | — | | (0.06 | ) | — | | — | | — | |
| | | | | | | | | | | |
Net Asset Value | | | | | | | | | | | |
End of year | | $ | 5.39 | | $ | 3.73 | | $ | 3.67 | | $ | 3.67 | | $ | 3.51 | |
| | | | | | | | | | | |
Total Return(a) | | 44.50 | % | 3.11 | % | — | % | 4.56 | % | 43.27 | % |
| | | | | | | | | | | |
Net Assets End of Period | | $ | 2,799 | | $ | 2,045 | | $ | 2,779 | | $ | 4,089 | | $ | 739 | |
| | | | | | | | | | | |
Ratio and Supplemental Data | | | | | | | | | | | |
| | | | | | | | | | | |
Expenses to average net assets: | | | | | | | | | | | |
After reimbursement/fee waiver(b) | | 2.15 | %(c) | 2.18 | %(c) | 2.20 | %(c) | 2.20 | %(c) | 2.20 | %(c) |
Before reimbursement/fee waiver(b) | | 2.36 | %(d) | 2.35 | %(d) | 2.65 | %(d) | 2.60 | %(d) | 2.55 | %(d) |
Net investment income (loss), to average net assets(b) | | (1.63 | )% | (1.57 | )% | (0.51 | )% | (1.94 | )% | (1.88 | )% |
Portfolio turnover rate(e) | | 66 | % | 94 | % | 73 | % | 41 | % | 24 | % |
The notes to the financial statements are an integral part of this report
99
| | TA IDEX Transamerica Science
& Technology | |
| | Class I | |
| | October 31, | | October 31, | |
| | 2007 | | 2006 | |
| | | | | |
Net Asset Value | | | | | |
Beginning of year | | $ | 3.93 | | $ | 3.98 | |
| | | | | |
Investment Operations (h) | | | | | |
Net Investment income (loss) | | (0.02 | ) | (0.01 | ) |
Net realized and unrealized gain (loss) on investments | | 1.83 | | 0.02 | |
Total from investment operations | | 1.81 | | 0.01 | |
| | | | | |
Distributions | | | | | |
Net investment income | | — | | — | |
Net realized gains on investments | | — | | (0.06 | ) |
Total distributions | | — | | (0.06 | ) |
| | | | | |
Net Asset Value | | | | | |
End of year | | $ | 5.74 | | $ | 3.93 | |
| | | | | |
Total Return(a) | | 46.06 | % | 0.12 | % |
| | | | | |
Net Assets End of Period | | $ | 84,206 | | $ | 57,642 | |
| | | | | |
Ratio and Supplemental Data | | | | | |
| | | | | |
Expenses to average net assets: | | | | | |
After reimbursement/fee waiver(b) | | 0.92 | %(c) | 0.92 | %(c) |
Before reimbursement/fee waiver(b) | | 0.92 | %(d) | 0.92 | %(d) |
Net investment income (loss), to average net assets(b) | | (0.41 | )% | (0.35 | )% |
Portfolio turnover rate(e) | | 66 | % | 94 | % |
| | TA IDEX Transamerica Small/Mid Cap Value | |
| | Class A | |
| | October 31, | | October 31, | | October 31, | | October 31, | | October 31, | |
| | 2007 | | 2006 | | 2005 | | 2004 | | 2003 | |
| | | | | | | | | | | |
Net Asset Value | | | | | | | | | | | |
Beginning of year | | $ | 17.78 | | $ | 16.69 | | $ | 14.32 | | $ | 12.94 | | $ | 9.09 | |
| | | | | | | | | | | |
Investment Operations (h) | | | | | | | | | | | |
Net Investment income (loss) | | 0.14 | | 0.28 | | 0.03 | | 0.04 | | (0.11 | ) |
Net realized and unrealized gain (loss) on investments | | 6.30 | | 1.96 | | 2.85 | | 2.56 | | 3.96 | |
Total from investment operations | | 6.44 | | 2.24 | | 2.88 | | 2.60 | | 3.85 | |
| | | | | | | | | | | |
Distributions | | | | | | | | | | | |
Net investment income | | (0.13 | ) | (0.03 | ) | (0.09 | ) | — | | — | |
Net realized gains on investments | | (0.31 | ) | (1.12 | ) | (0.42 | ) | (1.22 | ) | — | |
Total distributions | | (0.44 | ) | (1.15 | ) | (0.51 | ) | (1.22 | ) | — | |
| | | | | | | | | | | |
Net Asset Value | | | | | | | | | | | |
End of year | | $ | 23.78 | | $ | 17.78 | | $ | 16.69 | | $ | 14.32 | | $ | 12.94 | |
| | | | | | | | | | | |
Total Return(a) | | 36.99 | % | 13.97 | % | 20.41 | % | 20.61 | % | 42.35 | % |
| | | | | | | | | | | |
Net Assets End of Period | | $ | 96,667 | | $ | 47,014 | | $ | 386,346 | | $ | 334,763 | | $ | 149,557 | |
| | | | | | | | | | | |
Ratio and Supplemental Data | | | | | | | | | | | |
| | | | | | | | | | | |
Expenses to average net assets: | | | | | | | | | | | |
After reimbursement/fee waiver(b) | | 1.41 | %(c) | 1.39 | %(c) | 1.24 | %(c) | 1.32 | %(c) | 1.73 | %(c) |
Before reimbursement/fee waiver(b) | | 1.41 | %(d) | 1.39 | %(d) | 1.24 | %(d) | 1.32 | %(d) | 1.73 | %(d) |
Net investment income (loss), to average net assets(b) | | 0.71 | % | 1.61 | % | 0.20 | % | 0.31 | % | (1.04 | )% |
Portfolio turnover rate(e) | | 22 | % | 21 | % | 42 | % | 81 | % | 55 | % |
The notes to the financial statements are an integral part of this report
100
| | TA IDEX Transamerica Small/Mid Cap Value | |
| | Class B | |
| | October 31, | | October 31, | | October 31, | | October 31, | | October 31, | |
| | 2007 | | 2006 | | 2005 | | 2004 | | 2003 | |
| | | | | | | | | | | |
Net Asset Value | | | | | | | | | | | |
Beginning of year | | $ | 17.12 | | $ | 16.21 | | $ | 13.97 | | $ | 12.73 | | $ | 8.98 | |
| | | | | | | | | | | |
Investment Operations (h) | | | | | | | | | | | |
Net Investment income (loss) | | 0.02 | | (0.01 | ) | (0.11 | ) | (0.06 | ) | (0.17 | ) |
Net realized and unrealized gain (loss) on investments | | 6.06 | | 2.07 | | 2.77 | | 2.52 | | 3.92 | |
Total from investment operations | | 6.08 | | 2.06 | | 2.66 | | 2.46 | | 3.75 | |
| | | | | | | | | | | |
Distributions | | | | | | | | | | | |
Net investment income | | — | | (0.03 | ) | — | | — | | — | |
Net realized gains on investments | | (0.31 | ) | (1.12 | ) | (0.42 | ) | (1.22 | ) | — | |
Total distributions | | (0.31 | ) | (1.15 | ) | (0.42 | ) | (1.22 | ) | — | |
| | | | | | | | | | | |
Net Asset Value | | | | | | | | | | | |
End of year | | $ | 22.89 | | $ | 17.12 | | $ | 16.21 | | $ | 13.97 | | $ | 12.73 | |
| | | | | | | | | | | |
Total Return(a) | | 36.09 | % | 13.21 | % | 19.30 | % | 19.85 | % | 41.76 | % |
| | | | | | | | | | | |
Net Assets End of Period | | $ | 53,285 | | $ | 47,007 | | $ | 46,410 | | $ | 40,477 | | $ | 33,196 | |
| | | | | | | | | | | |
Ratio and Supplemental Data | | | | | | | | | | | |
| | | | | | | | | | | |
Expenses to average net assets: | | | | | | | | | | | |
After reimbursement/fee waiver(b) | | 2.07 | %(c) | 2.10 | %(c) | 2.14 | %(c) | 1.97 | %(c) | 2.38 | %(c) |
Before reimbursement/fee waiver(b) | | 2.07 | %(d) | 2.10 | %(d) | 2.14 | %(d) | 1.97 | %(d) | 2.38 | %(d) |
Net investment income (loss), to average net assets(b) | | 0.12 | % | (0.06 | )% | (0.70 | )% | (0.43 | )% | (1.69 | )% |
Portfolio turnover rate(e) | | 22 | % | 21 | % | 42 | % | 81 | % | 55 | % |
| | TA IDEX Transamerica Small/Mid Cap Value | |
| | Class C | |
| | October 31, | | October 31, | | October 31, | | October 31, | | October 31, | |
| | 2007 | | 2006 | | 2005 | | 2004 | | 2003 | |
| | | | | | | | | | | |
Net Asset Value | | | | | | | | | | | |
Beginning of year | | $ | 17.09 | | $ | 16.18 | | $ | 13.96 | | $ | 12.73 | | $ | 9.01 | |
| | | | | | | | | | | |
Investment Operations (h) | | | | | | | | | | | |
Net Investment income (loss) | | 0.02 | | — | | (0.12 | ) | (0.01 | ) | (0.18 | ) |
Net realized and unrealized gain (loss) on investments | | 6.05 | | 2.06 | | 2.77 | | 2.46 | | 3.90 | |
Total from investment operations | | 6.07 | | 2.06 | | 2.65 | | 2.45 | | 3.72 | |
| | | | | | | | | | | |
Distributions | | | | | | | | | | | |
Net investment income | | (0.04 | ) | (0.03 | ) | (0.01 | ) | — | | — | |
Net realized gains on investments | | (0.31 | ) | (1.12 | ) | (0.42 | ) | (1.22 | ) | — | |
Total distributions | | (0.35 | ) | (1.15 | ) | (0.43 | ) | (1.22 | ) | — | |
| | | | | | | | | | | |
Net Asset Value | | | | | | | | | | | |
End of year | | $ | 22.81 | | $ | 17.09 | | $ | 16.18 | | $ | 13.96 | | $ | 12.73 | |
| | | | | | | | | | | |
Total Return(a) | | 36.16 | % | 13.23 | % | 19.22 | % | 19.78 | % | 41.29 | % |
| | | | | | | | | | | |
Net Assets End of Period | | $ | 63,856 | | $ | 29,105 | | $ | 21,532 | | $ | 19,678 | | $ | 1,995 | |
| | | | | | | | | | | |
Ratio and Supplemental Data | | | | | | | | | | | |
| | | | | | | | | | | |
Expenses to average net assets: | | | | | | | | | | | |
After reimbursement/fee waiver(b) | | 2.04 | %(c) | 2.08 | %(c) | 2.20 | %(c) | 2.07 | %(c) | 2.38 | %(c) |
Before reimbursement/fee waiver(b) | | 2.04 | %(d) | 2.08 | %(d) | 2.20 | %(d) | 2.07 | %(d) | 2.38 | %(d) |
Net investment income (loss), to average net assets(b) | | 0.10 | % | (0.03 | )% | (0.76 | )% | (0.02 | )% | (1.69 | )% |
Portfolio turnover rate(e) | | 22 | % | 21 | % | 42 | % | 81 | % | 55 | % |
The notes to the financial statements are an integral part of this report
101
| | TA IDEX Transamerica
Small/Mid Cap Value | |
| | Class I | |
| | October 31, | | October 31, | |
| | 2007 | | 2006 | |
| | | | | |
Net Asset Value | | | | | |
Beginning of year | | $ | 17.87 | | $ | 16.84 | |
| | | | | |
Investment Operations (h) | | | | | |
Net Investment income (loss) | | 0.26 | | 0.18 | |
Net realized and unrealized gain (loss) on investments | | 6.32 | | 1.97 | |
Total from investment operations | | 6.58 | | 2.15 | |
| | | | | |
Distributions | | | | | |
Net investment income | | (0.23 | ) | — | |
Net realized gains on investments | | (0.31 | ) | (1.12 | ) |
Total distributions | | (0.54 | ) | (1.12 | ) |
| | | | | |
Net Asset Value | | | | | |
End of year | | $ | 23.91 | | $ | 17.87 | |
| | | | | |
Total Return(a) | | 37.78 | % | 13.30 | % |
| | | | | |
Net Assets End of Period | | $ | 487,605 | | $ | 478,728 | |
| | | | | |
Ratio and Supplemental Data | | | | | |
| | | | | |
Expenses to average net assets: | | | | | |
After reimbursement/fee waiver(b) | | 0.85 | %(c) | 0.86 | %(c) |
Before reimbursement/fee waiver(b) | | 0.85 | %(d) | 0.86 | %(d) |
Net investment income (loss), to average net assets(b) | | 1.30 | % | 1.05 | % |
Portfolio turnover rate(e) | | 22 | % | 21 | % |
| | TA IDEX Transamerica Value Balanced | |
| | Class A | |
| | October 31, | | October 31, | | October 31, | | October 31, | | October 31, | |
| | 2007 | | 2006 | | 2005 | | 2004 | | 2003 | |
| | | | | | | | | | | |
Net Asset Value | | | | | | | | | | | |
Beginning of year | | $ | 13.30 | | $ | 11.95 | | $ | 12.11 | | $ | 11.49 | | $ | 9.69 | |
| | | | | | | | | | | |
Investment Operations (h) | | | | | | | | | | | |
Net Investment income (loss) | | 0.28 | | 0.23 | | 0.24 | | 0.18 | | 0.18 | |
Net realized and unrealized gain (loss) on investments | | 1.41 | | 1.54 | | 0.69 | | 0.61 | | 1.83 | |
Total from investment operations | | 1.69 | | 1.77 | | 0.93 | | 0.79 | | 2.01 | |
| | | | | | | | | | | |
Distributions | | | | | | | | | | | |
Net investment income | | (0.23 | ) | (0.24 | ) | (0.25 | ) | (0.17 | ) | (0.21 | ) |
Net realized gains on investments | | (0.38 | ) | (0.18 | ) | (0.84 | ) | — | | — | |
Total distributions | | (0.61 | ) | (0.42 | ) | (1.09 | ) | (0.17 | ) | (0.21 | ) |
| | | | | | | | | | | |
Net Asset Value | | | | | | | | | | | |
End of year | | $ | 14.38 | | $ | 13.30 | | $ | 11.95 | | $ | 12.11 | | $ | 11.49 | |
| | | | | | | | | | | |
Total Return(a) | | 13.11 | % | 15.09 | % | 7.79 | % | 6.99 | % | 21.04 | % |
| | | | | | | | | | | |
Net Assets End of Period | | $ | 32,485 | | $ | 32,666 | | $ | 32,934 | | $ | 37,393 | | $ | 11,832 | |
| | | | | | | | | | | |
Ratio and Supplemental Data | | | | | | | | | | | |
| | | | | | | | | | | |
Expenses to average net assets: | | | | | | | | | | | |
After reimbursement/fee waiver(b) | | 1.55 | %(c) | 1.55 | %(c) | 1.55 | %(c) | 1.55 | %(c) | 1.55 | %(c) |
Before reimbursement/fee
waiver(b) | | 1.58 | %(d) | 1.63 | %(d) | 1.59 | %(d) | 1.63 | %(d) | 2.20 | %(d) |
Net investment income (loss), to average net assets(b) | | 2.06 | % | 1.84 | % | 2.03 | % | 1.50 | % | 1.75 | % |
Portfolio turnover rate(e) | | 42 | % | 42 | % | 57 | % | 122 | % | 50 | % |
The notes to the financial statements are an integral part of this report
102
| | TA IDEX Transamerica Value Balanced | |
| | Class B | |
| | October 31, | | October 31, | | October 31, | | October 31, | | October 31, | |
| | 2007 | | 2006 | | 2005 | | 2004 | | 2003 | |
| | | | | | | | | | | |
Net Asset Value | | | | | | | | | | | |
Beginning of year | | $ | 13.25 | | $ | 11.91 | | $ | 12.07 | | $ | 11.46 | | $ | 9.69 | |
| | | | | | | | | | | |
Investment Operations (h) | | | | | | | | | | | |
Net Investment income (loss) | | 0.19 | | 0.15 | | 0.17 | | 0.10 | | 0.11 | |
Net realized and unrealized gain (loss) on investments | | 1.41 | | 1.53 | | 0.68 | | 0.61 | | 1.80 | |
Total from investment operations | | 1.60 | | 1.68 | | 0.85 | | 0.71 | | 1.91 | |
| | | | | | | | | | | |
Distributions | | | | | | | | | | | |
Net investment income | | (0.15 | ) | (0.16 | ) | (0.17 | ) | (0.10 | ) | (0.14 | ) |
Net realized gains on investments | | (0.38 | ) | (0.18 | ) | (0.84 | ) | — | | — | |
Total distributions | | (0.53 | ) | (0.34 | ) | (1.01 | ) | (0.10 | ) | (0.14 | ) |
| | | | | | | | | | | |
Net Asset Value | | | | | | | | | | | |
End of year | | $ | 14.32 | | $ | 13.25 | | $ | 11.91 | | $ | 12.07 | | $ | 11.46 | |
| | | | | | | | | | | |
Total Return(a) | | 12.40 | % | 14.28 | % | 7.13 | % | 6.23 | % | 19.98 | % |
| | | | | | | | | | | |
Net Assets End of Period | | $ | 17,508 | | $ | 20,405 | | $ | 24,072 | | $ | 29,409 | | $ | 13,744 | |
| | | | | | | | | | | |
Ratio and Supplemental Data | | | | | | | | | | | |
| | | | | | | | | | | |
Expenses to average net assets: | | | | | | | | | | | |
After reimbursement/fee waiver(b) | | 2.20 | %(c) | 2.20 | %(c) | 2.20 | %(c) | 2.20 | %(c) | 2.20 | %(c) |
Before reimbursement/fee waiver(b) | | 2.27 | %(d) | 2.28 | %(d) | 2.27 | %(d) | 2.30 | %(d) | 2.85 | %(d) |
Net investment income (loss), to average net assets(b) | | 1.43 | % | 1.20 | % | 1.39 | % | 0.81 | % | 1.10 | % |
Portfolio turnover rate(e) | | 42 | % | 42 | % | 57 | % | 122 | % | 50 | % |
| | TA IDEX Transamerica Value Balanced | |
| | Class C | |
| | October 31, | | October 31, | | October 31, | | October 31, | | October 31, | |
| | 2007 | | 2006 | | 2005 | | 2004 | | 2003 | |
| | | | | | | | | | | |
Net Asset Value | | | | | | | | | | | |
Beginning of year | | $ | 13.25 | | $ | 11.91 | | $ | 12.07 | | $ | 11.46 | | $ | 9.71 | |
| | | | | | | | | | | |
Investment Operations (h) | | | | | | | | | | | |
Net Investment income (loss) | | 0.19 | | 0.15 | | 0.17 | | 0.11 | | 0.12 | |
Net realized and unrealized gain (loss) on investments | | 1.41 | | 1.53 | | 0.69 | | 0.60 | | 1.77 | |
Total from investment operations | | 1.60 | | 1.68 | | 0.86 | | 0.71 | | 1.89 | |
| | | | | | | | | | | |
Distributions | | | | | | | | | | | |
Net investment income | | (0.16 | ) | (0.16 | ) | (0.18 | ) | (0.10 | ) | (0.14 | ) |
Net realized gains on investments | | (0.38 | ) | (0.18 | ) | (0.84 | ) | — | | — | |
Total distributions | | (0.54 | ) | (0.34 | ) | (1.02 | ) | (0.10 | ) | (0.14 | ) |
| | | | | | | | | | | |
Net Asset Value | | | | | | | | | | | |
End of year | | $ | 14.31 | | $ | 13.25 | | $ | 11.91 | | $ | 12.07 | | $ | 11.46 | |
| | | | | | | | | | | |
Total Return(a) | | 12.40 | % | 14.33 | % | 7.18 | % | 6.31 | % | 19.73 | % |
| | | | | | | | | | | |
Net Assets End of Period | | $ | 11,674 | | $ | 11,316 | | $ | 11,926 | | $ | 14,285 | | $ | 530 | |
| | | | | | | | | | | |
Ratio and Supplemental Data | | | | | | | | | | | |
| | | | | | | | | | | |
Expenses to average net assets: | | | | | | | | | | | |
After reimbursement/fee waiver(b) | | 2.17 | %(c) | 2.20 | %(c) | 2.16 | %(c) | 2.20 | %(c) | 2.20 | %(c) |
Before reimbursement/fee waiver(b) | | 2.17 | %(d) | 2.20 | %(d) | 2.16 | %(d) | 2.39 | %(d) | 2.86 | %(d) |
Net investment income (loss), to average net assets(b) | | 1.44 | % | 1.19 | % | 1.43 | % | 0.78 | % | 1.10 | % |
Portfolio turnover rate(e) | | 42 | % | 42 | % | 57 | % | 122 | % | 50 | % |
The notes to the financial statements are an integral part of this report
103
(a) Total return has been calculated for the applicable period without deduction of a sales load, if any, on an initial purchase. Not annualized.
(b) Annualized
(c) Ratio of Net Expenses to Average Net Assets is net of fee waivers and reimbursements by the investment advisor, if any (see Note 2).
(d) Ratio of Total Expenses to Average Net Assets includes all expenses before fee waivers and reimbursements by the investment advisor.
(e) Not annualized
(f) Rounds to less than $(.01) per share.
(g) Class T was offered for investment on October 27, 2006.
(h) Per share information is calculated based on average number of shares outstanding.
The notes to the financial statements are an integral part of this report
104
NOTES TO FINANCIAL STATEMENTS
At October 31, 2007
(all amounts in thousands)
NOTE 1. ORGANIZATION AND SIGNIFICANT ACCOUNTING POLICIES
Transamerica IDEX Mutual Funds (“TA IDEX”) is an open-end management investment company registered under the Investment Company Act of 1940, as amended (the “1940 Act”). TA IDEX Legg Mason Partners All Cap, TA IDEX Templeton Transamerica Global, TA IDEX Transamerica Balanced, TA IDEX Transamerica Convertible Securities, TA IDEX Transamerica Equity, TA IDEX Transamerica Flexible Income, TA IDEX Transamerica Growth Opportunities, TA IDEX Transamerica High-Yield Bond, TA IDEX Transamerica Money Market, TA IDEX Transamerica Science & Technology, TA IDEX Transamerica Small/Mid Cap Value and TA IDEX Transamerica Value Balanced (each, a “Fund”; collectively, the “Funds”), are part of Transamerica IDEX Mutual Funds.
TA IDEX Legg Mason Partners All Cap and TA IDEX Transamerica Science & Technology are “non-diversified” under the 1940 Act.
In the normal course of business, the Funds enter into contracts that contain a variety of representations that provide general indemnifications. The Funds’ maximum exposure under these arrangements is unknown, as this would involve future claims that may be made against the Funds and/or their affiliates that have not yet occurred. However, based on experience, the Funds expect the risk of loss to be remote.
This report should be read in conjunction with the Funds’ current prospectus, which contains more complete information about the Funds.
In preparing the Funds’ financial statements in accordance with accounting principles generally accepted in the United States of America (“GAAP”), estimates or assumptions (which could differ from actual results) may be used that affect reported amounts and disclosures. The following is a summary of significant accounting policies followed by the Funds.
Multiple class operations, income and expenses: The Funds, except TA IDEX Legg Mason Partners All Cap and TA IDEX Transamerica Equity, currently have four classes of shares, Class A, Class B, Class C and Class I. TA IDEX Legg Mason Partners All Cap currently has three classes of shares, Class A, Class B and Class C. TA IDEX Transamerica Equity currently has five classes of shares, Class A, Class B, Class C, Class I and Class T. Class T shares are not available to new investors. Each of the above classes has a public offering price that reflects different sales charges, if any, and expense levels. Class I is only available for investment to certain affiliated asset allocation funds. Class B shares will convert to Class A shares eight years after purchase. Income, non-class specific expenses and realized and unrealized gains and losses are allocated daily to each class, based upon the value of shares outstanding method as permitted under Rule 18f-3 of the 1940 Act. Each class bears its own specific expenses as well as a portion of general, common expenses.
Security valuations: The Funds value their investments at the close of the New York Stock Exchange (“NYSE”), normally 4 p.m. ET, each day the NYSE is open for business. The Funds’ investments are valued at the last sale price or closing price on the day of valuation taken from the primary exchange where the security is principally traded.
Securities traded in the over-the-counter market and listed securities for which no sale was reported on that date are valued at the last quoted bid price.
Debt securities are valued based on a price quotation or other equivalent indication of value supplied by an exchange, a pricing service or a major market maker; however, those that mature in sixty days or less are valued at amortized cost, which approximates market.
Foreign securities generally are valued based on quotations from the primary market in which they are traded. Because many foreign securities markets and exchanges close prior to the close of the NYSE, closing prices for foreign securities in those markets or on those exchanges do not reflect the events that occur after that close. If a significant market event impacting the value of a portfolio security (e.g., natural disaster, company announcement, market volatility) occurs subsequent to the close of trading in the security, but prior to the calculation of the Funds’ net asset value per share, market quotations for that security may be determined to be unreliable and, accordingly, not “readily available.” As a result, foreign equity securities held by the Funds may be valued at fair market value as determined in good faith by the Funds’ Administrative Valuation Committee, using guidelines adopted by the Board of Trustees.
Other securities for which quotations are not readily available or whose values have been determined to be unreliable are valued at fair market value as determined in good faith by the Funds’ Administrative Valuation Committee, using guidelines adopted by the Board of Trustees.
Cash: Each Fund may leave cash overnight in its cash account with the custodian, State Street Bank & Trust Company (“State Street”). On July 2, 2007, State Street acquired the parent company of Investors Bank & Trust Company (“IBT”). State Street has been contracted on behalf of the Funds to invest excess cash into savings accounts, which at October 31, 2007 were paying an interest rate of 3.00%.
Throughout the year, the Funds may have cash overdraft balances. A fee is incurred on these overdrafts, calculated by multiplying the overdrafts by a rate based on the federal funds rate.
105
Repurchase agreements: The Funds are authorized to enter into repurchase agreements. The Funds, through their custodian, State Street, receive delivery of the underlying securities, the value of which at the time of purchase is required to be an amount equal to at least 100% of the resale price. The Funds will bear the risk of value fluctuations until the securities can be sold and may encounter delays and incur costs in liquidating the securities. In the event of bankruptcy or insolvency of the seller, delays and costs may be incurred.
Commission recapture: The sub-advisers of certain Funds, to the extent consistent with the best execution and usual commission rate policies and practices, have elected to place security transactions of the Funds with broker/dealers with which Transamerica IDEX Mutual Funds has established a Commission Recapture Program. A Commission Recapture Program is any arrangement under which a broker/dealer applies a portion of the commissions received by such broker/dealer on the security transactions to the Funds. In no event will commissions paid by the Funds be used to pay expenses that would otherwise be borne by any other funds within Transamerica IDEX Mutual Funds, or by any other party.
Recaptured comissions during the year ended October 31, 2007 included in net realized gains on the Statement of Operations, were as follows:
Fund | | Commissions | |
TA IDEX Legg Mason Partners All Cap | | $ | 10 | |
TA IDEX Templeton Transamerica Global | | 15 | |
TA IDEX Transamerica Balanced | | 5 | |
TA IDEX Transamerica Convertible Securities | | — | |
TA IDEX Transamerica Equity | | 143 | |
TA IDEX Transamerica Flexible Income | | — | |
TA IDEX Transamerica Growth Opportunities | | 37 | |
TA IDEX Transamerica High-Yield Bond | | — | |
TA IDEX Transamerica Money Market | | — | |
TA IDEX Transamerica Science & Technology | | 5 | |
TA IDEX Transamerica Small/Mid Cap Value | | 30 | |
TA IDEX Transamerica Value Balanced | | 2 | |
| | | | |
Securities lending: The Funds may lend securities to qualified borrowers with State Street acting as the Funds’ lending agent. The Funds earn negotiated lenders’ fees. The Funds receive cash and/or securities as collateral against the loaned securities. Cash collateral received is invested in short term, interest bearing securities. The Funds monitor the market value of securities loaned on a daily basis and require collateral in an amount at least equal to the value of the securities loaned. The value of loaned securities and related collateral outstanding at October 31, 2007 were as follows:
| | | | Cash | |
| | | | Collateral | |
Fund | | Value | | Received | |
TA IDEX Legg Mason Partners All Cap | | $ | 12,153 | | $ | 12,983 | |
TA IDEX Templeton Transamerica Global | | 14,386 | | 14,815 | |
TA IDEX Transamerica Balanced | | 7,492 | | 7,667 | |
TA IDEX Transamerica Convertible Securities | | 10,166 | | 10,416 | |
TA IDEX Transamerica Equity | | 80,483 | | 82,378 | |
TA IDEX Transamerica Flexible Income | | 22,335 | | 22,782 | |
TA IDEX Transamerica Growth Opportunities | | 74,436 | | 76,488 | |
TA IDEX Transamerica High-Yield Bond | | 29,711 | | 30,525 | |
TA IDEX Transamerica Science & Technology | | 21,900 | | 22,564 | |
TA IDEX Transamerica Small/Mid Cap Value | | 140,222 | | 145,058 | |
| | | | | | | |
106
The Funds have invested the cash collateral received from securities loaned in the following short term, interest bearing securities:
| | | | | | | | TA IDEX | |
| | | | | | TA IDEX | | Transamerica | |
| | TA IDEX Legg Mason | | TA IDEX Templeton | | Transamerica | | Convertible | |
| | Partners All Cap | | Transamerica Global | | Balanced | | Securities | |
| | | | | | | | | |
Abbey National PLC, Eurodollar Term, 4.85%, 11/8/2007 | | $ | 238 | | $ | 272 | | $ | 141 | | $ | 191 | |
ABN AMRO Bank NV, Eurodollar Term, 4.95%, 11/21/2007 | | 893 | | 1,019 | | 528 | | 717 | |
Bank of Nova Scotia, Eurodollar Term, 5.00%, 11/26/2007 | | 893 | | 1,020 | | 528 | | 717 | |
Barclays, Eurodollar Term, 5.00%, 1/22/2008 | | 119 | | 136 | | 70 | | 95 | |
BNP Paribas, Eurodollar Term, 4.72%, 11/23/2007 | | 1,430 | | 1,631 | | 844 | | 1,147 | |
Calyon, Eurodollar Term, 4.88%, 11/7/2007 | | 357 | | 408 | | 211 | | 287 | |
Canadian Imperial Bank of Commerce, Eurodollar Term, 5.34%, 11/9/2007 | | 179 | | 204 | | 105 | | 143 | |
Credit Suisse First Boston Corp., Repurchase Agreement, 5.04%, 11/1/2007 | | 298 | | 340 | | 176 | | 239 | |
Dexia Group, Eurodollar Term, 5.10%, 11/14/2007 | | 894 | | 1,020 | | 528 | | 717 | |
Fifth Third Bancorp, Eurodollar Overnight, 4.62%, 11/1/2007 | | 179 | | 204 | | 106 | | 143 | |
Lloyds TSB Bank, Eurodollar Term, 4.90%, 11/9/2007 | | 1,191 | | 1,359 | | 703 | | 956 | |
Merrill Lynch & Co. (RPG), Repurchase Agreement, 4.82%, 11/1/2007 | | 1,013 | | 1,155 | | 598 | | 812 | |
Morgan Stanley & Co. (Gvt Repo), Repurchase Agreement, 4.82%, 11/1/2007 | | 1,013 | | 1,155 | | 598 | | 812 | |
Rabobank Nederland, Eurodollar Term, 4.82%, 11/15/2007 | | 894 | | 1,020 | | 528 | | 717 | |
Reserve Primary Money Market Fund, Money Market Fund, 5.09%, 11/1/2007 | | 357 | | 408 | | 211 | | 287 | |
Royal Bank of Canada, Eurodollar Term, 4.95%, 11/16/2007 | | 119 | | 136 | | 70 | | 95 | |
Royal Bank of Scotland, Eurodollar Term, 5.33%, 1/22/2008 | | 1,072 | | 1,223 | | 633 | | 860 | |
Societe Generale, Eurodollar Term, 5.05%, 11/1/2007 | | 655 | | 748 | | 387 | | 526 | |
Svenska Handlesbanken, Eurodollar Overnight, 4.84%, 11/1/2007 | | 772 | | 881 | | 456 | | 620 | |
Toronto Dominion Bank, Eurodollar Term, 4.88%, 11/6/2007 | | 357 | | 408 | | 211 | | 287 | |
UBS AG, Eurodollar Term, 5.36%, 11/8/2007 | | 60 | | 68 | | 35 | | 48 | |
| | $ | 12,983 | | $ | 14,815 | | $ | 7,667 | | $ | 10,416 | |
| | | | | | TA IDEX | | | |
| | | | TA IDEX | | Transamerica | | TA IDEX | |
| | TA IDEX | | Transamerica | | Growth | | Transamerica High- | |
| | Transamerica Equity | | Flexible Income | | Opportunities | | Yield Bond | |
| | | | | | | | | |
Abbey National PLC, Eurodollar Term, 4.85%, 11/8/2007 | | $ | 1,512 | | $ | 418 | | $ | 1,404 | | $ | 560 | |
ABN AMRO Bank NV, Eurodollar Term, 4.95%, 11/21/2007 | | 5,669 | | 1,568 | | 5,264 | | 2,101 | |
Bank of Nova Scotia, Eurodollar Term, 5.00%, 11/26/2007 | | 5,669 | | 1,568 | | 5,264 | | 2,101 | |
Barclays, Eurodollar Term, 5.00%, 1/22/2008 | | 756 | | 209 | | 702 | | 280 | |
BNP Paribas, Eurodollar Term, 4.72%, 11/23/2007 | | 9,070 | | 2,508 | | 8,422 | | 3,361 | |
Calyon, Eurodollar Term, 4.88%, 11/7/2007 | | 2,267 | | 627 | | 2,105 | | 840 | |
Canadian Imperial Bank of Commerce, Eurodollar Term, 5.34%, 11/9/2007 | | 1,134 | | 314 | | 1,053 | | 420 | |
Credit Suisse First Boston Corp., Repurchase Agreement, 5.04%, 11/1/2007 | | 1,890 | | 523 | | 1,755 | | 700 | |
Dexia Group, Eurodollar Term, 5.10%, 11/14/2007 | | 5,669 | | 1,568 | | 5,264 | | 2,101 | |
Fifth Third Bancorp, Eurodollar Overnight, 4.62%, 11/1/2007 | | 1,134 | | 314 | | 1,053 | | 420 | |
Lloyds TSB Bank, Eurodollar Term, 4.90%, 11/9/2007 | | 7,559 | | 2,090 | | 7,018 | | 2,801 | |
Merrill Lynch & Co. (RPG), Repurchase Agreement, 4.82%, 11/1/2007 | | 6,425 | | 1,777 | | 5,965 | | 2,381 | |
Morgan Stanley & Co. (Gvt Repo), Repurchase Agreement, 4.82%, 11/1/2007 | | 6,425 | | 1,777 | | 5,965 | | 2,381 | |
Rabobank Nederland, Eurodollar Term, 4.82%, 11/15/2007 | | 5,669 | | 1,568 | | 5,264 | | 2,101 | |
Reserve Primary Money Market Fund, Money Market Fund, 5.09%, 11/1/2007 | | 2,268 | | 627 | | 2,105 | | 840 | |
Royal Bank of Canada, Eurodollar Term, 4.95%, 11/16/2007 | | 756 | | 209 | | 702 | | 280 | |
Royal Bank of Scotland, Eurodollar Term, 5.33%, 1/22/2008 | | 6,803 | | 1,881 | | 6,316 | | 2,521 | |
Societe Generale, Eurodollar Term, 5.05%, 11/1/2007 | | 4,157 | | 1,150 | | 3,860 | | 1,540 | |
Svenska Handlesbanken, Eurodollar Overnight, 4.84%, 11/1/2007 | | 4,900 | | 1,355 | | 4,550 | | 1,816 | |
Toronto Dominion Bank, Eurodollar Term, 4.88%, 11/6/2007 | | 2,268 | | 627 | | 2,105 | | 840 | |
UBS AG, Eurodollar Term, 5.36%, 11/8/2007 | | 378 | | 104 | | 351 | | 140 | |
| | $ | 82,378 | | $ | 22,782 | | $ | 76,488 | | $ | 30,525 | |
107
| | TA IDEX | | | |
| | Transamerica | | TA IDEX | |
| | Science & | | Transamerica | |
| | Technology | | Small/Mid Cap Value | |
| | | | | |
Abbey National PLC, Eurodollar Term, 4.85%, 11/8/2007 | | $ | 414 | | $ | 2,662 | |
ABN AMRO Bank NV, Eurodollar Term, 4.95%, 11/21/2007 | | 1,553 | | 9,983 | |
Bank of Nova Scotia, Eurodollar Term, 5.00%, 11/26/2007 | | 1,553 | | 9,983 | |
Barclays, Eurodollar Term, 5.00%, 1/22/2008 | | 207 | | 1,331 | |
BNP Paribas, Eurodollar Term, 4.72%, 11/23/2007 | | 2,484 | | 15,972 | |
Calyon, Eurodollar Term, 4.88%, 11/7/2007 | | 621 | | 3,993 | |
Canadian Imperial Bank of Commerce, Eurodollar Term, 5.34%, 11/9/2007 | | 311 | | 1,996 | |
Credit Suisse First Boston Corp., Repurchase Agreement, 5.04%, 11/1/2007 | | 518 | | 3,327 | |
Dexia Group, Eurodollar Term, 5.10%, 11/14/2007 | | 1,553 | | 9,983 | |
Fifth Third Bancorp, Eurodollar Overnight, 4.62%, 11/1/2007 | | 311 | | 1,996 | |
Lloyds TSB Bank, Eurodollar Term, 4.90%, 11/9/2007 | | 2,070 | | 13,310 | |
Merrill Lynch & Co. (RPG), Repurchase Agreement, 4.82%, 11/1/2007 | | 1,760 | | 11,314 | |
Morgan Stanley & Co. (Gvt Repo), Repurchase Agreement, 4.82%, 11/1/2007 | | 1,760 | | 11,314 | |
Rabobank Nederland, Eurodollar Term, 4.82%, 11/15/2007 | | 1,553 | | 9,983 | |
Reserve Primary Money Market Fund, Money Market Fund, 5.09%, 11/1/2007 | | 621 | | 3,993 | |
Royal Bank of Canada, Eurodollar Term, 4.95%, 11/16/2007 | | 207 | | 1,331 | |
Royal Bank of Scotland, Eurodollar Term, 5.33%, 1/22/2008 | | 1,863 | | 11,979 | |
Societe Generale, Eurodollar Term, 5.05%, 11/1/2007 | | 1,139 | | 7,321 | |
Svenska Handlesbanken, Eurodollar Overnight, 4.84%, 11/1/2007 | | 1,342 | | 8,629 | |
Toronto Dominion Bank, Eurodollar Term, 4.88%, 11/6/2007 | | 621 | | 3,993 | |
UBS AG, Eurodollar Term, 5.36%, 11/8/2007 | | 103 | | 665 | |
| | $ | 22,564 | | $ | 145,058 | |
108
Income from loaned securities earned by State Street for its services is net of fees on the Statements of Operations in the following amounts:
Fund | | Fees | |
TA IDEX Legg Mason Partners All Cap | | $ | 22 | |
TA IDEX Templeton Transamerica Global | | 13 | |
TA IDEX Transamerica Balanced | | 16 | |
TA IDEX Transamerica Convertible Securities | | 13 | |
TA IDEX Transamerica Equity | | 79 | |
TA IDEX Transamerica Flexible Income | | 40 | |
TA IDEX Transamerica Growth Opportunities | | 111 | |
TA IDEX Transamerica High-Yield Bond | | 53 | |
TA IDEX Transamerica Science & Technology | | 74 | |
TA IDEX Transamerica Small/Mid Cap Value | | 149 | |
| | | | |
Real Estate Investment Trusts (“REITs”): There are certain additional risks involved in investing in REITs. These include, but are not limited to, economic conditions, changes in zoning laws, real estate values, property taxes and interest rates. Since some of the Funds invest primarily in real estate securities, the net asset value per share may fluctuate more widely than the value of shares of a fund that invests in a broad range of industries.
Dividend income is recorded at management estimate of the income included in distributions from the REIT investments. Distributions received in excess of the estimated amount are recorded as a reduction of the cost of investments. The actual amounts of income, return of capital and capital gains are only determined by each REIT after the fiscal year end and may differ from the estimated amounts.
Security transactions and investment income: Security transactions are recorded on the trade date. Security gains and losses are calculated on the specific identification basis. Dividend income, if any, is recorded on the ex-dividend date or, in the case of foreign securities, as soon as the Funds are informed of the ex-dividend date. Interest income, including accretion of discounts and amortization of premiums, is recorded on the accrual basis commencing on the settlement date.
Foreign currency denominated investments: The accounting records of the Funds are maintained in U.S. dollars. Securities and other assets and liabilities denominated in foreign currencies are translated into U.S. dollars at the closing exchange rate each day. The cost of foreign securities is translated at the exchange rate in effect when the investment was acquired. The Funds combine fluctuations from currency exchange rates and fluctuations in value when computing net realized and unrealized gains or losses from investments.
Net foreign currency gains and losses resulting from changes in exchange rates include: 1) foreign currency fluctuations between trade date and settlement date of investment security transactions; 2) gains and losses on forward foreign currency contracts; and 3) the difference between the receivable amounts of interest and dividends recorded in the accounting records in U.S. dollars and the amounts actually received.
Foreign currency denominated assets may involve risks not typically associated with domestic transactions. These risks include revaluation of currencies, adverse fluctuations in foreign currency values and possible adverse political, social and economic developments, including those particular to a specific industry, country or region.
Option contracts: The Funds may enter into options contracts to manage exposure to market fluctuations. Options are valued at the average of the bid and ask (“Mean Quote”) established each day at the close of the board of trade or exchange on which they are traded. The primary risks associated with options are imperfect correlation between the change in value of the securities held and the prices of the options contracts; the possibility of an illiquid market; and inability of the counterparty to meet the contracts terms. When the Funds write covered call or put options, an amount equal to the premiums received by the Funds are included in the Funds’ Statements of Assets and Liabilities as an asset and as an equivalent liability. Options are marked-to-market daily to reflect the current value of the options written.
Transactions in written options were as follows:
TA IDEX Transamerica Value | | | | | |
Balanced | | Premium | | Contracts * | |
Balance at October 31, 2006 | | $ | 608 | | 5,994 | |
Sales | | 718 | | 5,847 | |
Closing Buys | | — | | — | |
Expirations | | (660 | ) | (6,396 | ) |
Exercised | | (247 | ) | (2,192 | ) |
Balance at October 31, 2007 | | $ | 418 | | 3,153 | |
*Contracts not in thousands.
Redemption fees: A short-term trading redemption fee may be assessed on any Fund shares in a fund account that are sold during the first five (5) NYSE trading days following their purchase date. This redemption fee will equal 2% of the amount redeemed and shares held the longest will be treated as being redeemed first and shares held the shortest as being redeemed last. For the year ended October 31, 2007, the Funds received redemption fees, which are located in the Funds’ Statements of Changes in Net Assets.
Dividend distributions: Distributions to shareholders are recorded on the ex-dividend date and are determined in accordance with federal income tax regulations.
NOTE 2. RELATED PARTY TRANSACTIONS
Transamerica Fund Advisors, Inc. (“TFAI”) is the Funds’ investment adviser. Transamerica Fund Services, Inc. (“TFS”) is the Funds’ administrator and transfer agent. AFSG Securities Corp. (“AFSG”), was the Funds’ distributor/principal underwriter. Effective May 1, 2007, Transamerica Capital Inc. (“TCI”) is the Funds’ distributor/principal underwriter. TFAI, TFS, and TCI are affiliates of AEGON, NV, a Netherlands corporation.
Certain officers and trustees of the Funds are also officers and/or directors of TFAI, TFS and TCI.
109
The following schedules reflect the percentage of the Funds assets owned by affiliated investment companies at October 31, 2007:
TA IDEX Templeton Transamerica Global | | Net Assets | | % of Net Assets | |
TA IDEX Asset Allocation-Conservative Portfolio | | $ | 2,510 | | 0.97 | % |
TA IDEX Asset Allocation-Growth Portfolio | | 7,085 | | 2.74 | |
TA IDEX Asset Allocation-Moderate Portfolio | | 25,805 | | 9.97 | |
TA IDEX Asset Allocation-Moderate Growth Portfolio | | 9,261 | | 3.58 | |
Total | | $ | 44,661 | | 17.26 | % |
TA IDEX Transamerica Convertible
Securities | | Net Assets | | % of Net Assets | |
TA IDEX Asset Allocation-Conservative Portfolio | | $ | 23,971 | | 14.11 | % |
TA IDEX Asset Allocation-Moderate Portfolio | | 60,014 | | 35.31 | |
TA IDEX Asset Allocation-Moderate Growth Portfolio | | 64,203 | | 37.77 | |
Total | | $ | 148,188 | | 87.19 | % |
TA IDEX Transamerica Equity | | Net Assets | | % of Net Assets | |
TA IDEX Asset Allocation-Conservative Portfolio | | $ | 33,764 | | 1.78 | % |
TA IDEX Asset Allocation-Growth Portfolio | | 278,873 | | 14.71 | |
TA IDEX Asset Allocation-Moderate Portfolio | | 155,516 | | 8.20 | |
TA IDEX Asset Allocation-Moderate Growth Portfolio | | 418,118 | | 22.05 | |
Total | | $ | 886,271 | | 46.74 | % |
TA IDEX Transamerica Flexible Income | | Net Assets | | % of Net Assets | |
TA IDEX Asset Allocation-Conservative Portfolio | | $ | 23,883 | | 5.80 | % |
TA IDEX Asset Allocation-Moderate Portfolio | | 69,001 | | 16.75 | |
TA IDEX Asset Allocation-Moderate Growth Portfolio | | 66,707 | | 16.19 | |
Asset Allocation-Conservative Portfolio | | 51,247 | | 12.44 | |
Asset Allocation-Moderate Growth Portfolio | | 91,712 | | 22.26 | |
Asset Allocation-Moderate Portfolio | | 67,922 | | 16.48 | |
Total | | $ | 370,472 | | 89.92 | % |
TA IDEX Transamerica Growth
Opportunities | | Net Assets | | % of Net Assets | |
TA IDEX Asset Allocation-Conservative Portfolio | | $ | 9,204 | | 2.56 | % |
TA IDEX Asset Allocation-Growth Portfolio | | 56,792 | | 15.80 | |
TA IDEX Asset Allocation-Moderate Portfolio | | 37,418 | | 10.41 | |
TA IDEX Asset Allocation-Moderate Growth Portfolio | | 103,409 | | 28.77 | |
Total | | $ | 206,823 | | 57.54 | % |
TA IDEX Transamerica High-Yield Bond | | Net Assets | | % of Net Assets | |
TA IDEX Asset Allocation-Conservative Portfolio | | $ | 43,255 | | 10.87 | % |
TA IDEX Asset Allocation-Moderate Portfolio | | 96,618 | | 24.28 | |
TA IDEX Asset Allocation-Moderate Growth Portfolio | | 115,040 | | 28.91 | |
Asset Allocation-Conservative Portfolio | | 17,226 | | 4.33 | |
Asset Allocation-Moderate Growth Portfolio | | 34,833 | | 8.75 | |
Asset Allocation-Moderate Portfolio | | 23,424 | | 5.88 | |
Total | | $ | 330,396 | | 83.02 | % |
TA IDEX Transamerica Money Market | | Net Assets | | % of Net Assets | |
TA IDEX Asset Allocation-Conservative Portfolio | | $ | 8,041 | | 4.64 | % |
TA IDEX Asset Allocation-Growth Portfolio | | 5,257 | | 3.03 | |
TA IDEX Asset Allocation-Moderate Portfolio | | 5,635 | | 3.25 | |
TA IDEX Asset Allocation-Moderate Growth Portfolio | | 11,590 | | 6.69 | |
TA IDEX Multi-Manager Alternative Strategies Fund | | 4,150 | | 2.39 | |
Total | | $ | 34,673 | | 20.00 | % |
TA IDEX Transamerica Science &
Technology | | Net Assets | | % of Net Assets | |
TA IDEX Asset Allocation-Growth Portfolio | | 22,645 | | 22.69 | |
TA IDEX Asset Allocation-Moderate Portfolio | | 17,558 | | 17.60 | |
TA IDEX Asset Allocation-Moderate Growth Portfolio | | 44,011 | | 44.10 | |
Total | | $ | 84,214 | | 84.39 | % |
| | | | | | |
TA IDEX Transamerica Small/Mid Cap
Value | | Net Assets | | % of Net Assets | |
TA IDEX Asset Allocation-Conservative Portfolio | | $ | 23,732 | | 3.38 | % |
TA IDEX Asset Allocation-Growth Portfolio | | 164,208 | | 23.41 | |
TA IDEX Asset Allocation-Moderate Portfolio | | 85,176 | | 12.15 | |
TA IDEX Asset Allocation-Moderate Growth Portfolio | | 213,802 | | 30.48 | |
Total | | $ | 486,918 | | 69.42 | % |
Investment advisory fees: The Funds pay management fees to TFAI based on average daily net assets (“ANA”) at the following breakpoints:
Fund | | Breakpoints |
TA IDEX Legg Mason Partners All Cap | | 0.80% of the first $500 million of ANA |
From November 1, 2006 to December 31, 2006: | | 0.70% of ANA over $500 million |
| | |
TA IDEX Legg Mason Partners All Cap | | 0.80% of the first $500 million of ANA |
From January 1, 2007 on: | | 0.675% of ANA over $500 million |
| | |
TA IDEX Templeton Transamerica Global | | 0.80% of the first $500 million of ANA |
| | 0.70% of ANA over $500 million |
| | |
TA IDEX Transamerica Balanced | | 0.80% of the first $250 million of ANA |
| | 0.75% of the next $250 million of ANA |
| | 0.70% of the next $1 billion of ANA |
| | 0.625% of ANA over $1.5 billion |
| | |
TA IDEX Transamerica Convertible Securities | | 0.75% of the first $250 million of ANA |
| | 0.70% of ANA over $250 million |
| | |
TA IDEX Transamerica Equity | | 0.75% of the first $500 million of ANA |
| | 0.70% of the next $2 billion of ANA |
| | 0.65% of ANA over $2.5 billion |
| | |
TA IDEX Transamerica Flexible Income | | 0.80% of the first $100 million of ANA |
From November 1, 2006 to December 31, 2006: | | 0.775% of the next $150 million of ANA |
| | 0.675% of ANA over $250 million |
| | |
TA IDEX Transamerica Flexible Income | | 0.775% of the first $100 million of ANA |
From January 1, 2007 on: | | 0.75% of the next $150 million of ANA |
| | 0.675% of the next $100 million of ANA |
| | 0.625% of ANA over $350 million |
| | |
TA IDEX Transamerica Growth Opportunities | | 0.80% of the first $250 million of ANA |
| | 0.75% of the next $250 million of ANA |
| | 0.70% of ANA over $500 million |
| | |
TA IDEX Transamerica High-Yield Bond | | 0.59% of the first $400 million of ANA |
| | 0.575% of the next $350 million of ANA |
| | 0.55% of ANA over $750 million |
| | |
TA IDEX Transamerica Money Market | | 0.40% of ANA |
| | |
TA IDEX Transamerica Science & Technology | | 0.78% of the first $500 million of ANA |
| | 0.70% of ANA over $500 million |
| | |
TA IDEX Transamerica Small/Mid Cap Value | | 0.80% of the first $500 million of ANA |
| | 0.75% of ANA over $500 million |
| | |
TA IDEX Transamerica Value Balanced | | 0.75% of the first $500 million of ANA |
| | 0.65% of the next $500 million of ANA |
| | 0.60% of ANA over $1 billion |
110
TFAI has contractually agreed to waive its advisory fee and will reimburse the Funds to the extent that operating expenses, excluding 12b-1 fees, exceed the following stated annual limit:
| | Expense | |
Fund | | Limit | |
TA IDEX Legg Mason Partners All Cap | | 1.20 | % |
TA IDEX Templeton Transamerica Global | | 1.20 | |
TA IDEX Transamerica Balanced | | 1.45 | |
TA IDEX Transamerica Convertible Securities | | 1.35 | |
TA IDEX Transamerica Equity | | 1.17 | |
TA IDEX Transamerica Flexible Income | | 1.50 | |
TA IDEX Transamerica Growth Opportunities | | 1.40 | |
TA IDEX Transamerica High-Yield Bond | | 1.24 | |
TA IDEX Transamerica Money Market | | 0.48 | |
TA IDEX Transamerica Science & Technology | | 1.18 | |
TA IDEX Transamerica Small/Mid Cap Value | | 1.40 | |
TA IDEX Transamerica Value Balanced | | 1.20 | |
If total Fund expenses fall below the annual expense limitation agreement agreed to by the advisers within the succeeding three years, the Funds may be required to pay the advisers a portion or all of the reimbursed class expenses.
TA IDEX Templeton | | Reimbursement of | | Available for | |
Transamerica Global | | Class Expenses | | Recapture Through | |
| | | | | |
Fiscal Year 2007: | | | | 10/31/2010 | |
Class A | | $ | 94 | | | |
Class B | | 131 | | | |
Class C | | 35 | | | |
| | | | | |
Fiscal Year 2006: | | | | 10/31/2009 | |
Class A | | 97 | | | |
Class B | | 184 | | | |
Class C | | 53 | | | |
| | | | | |
Fiscal Year 2005: | | | | 10/31/2008 | |
Class B | | 226 | | | |
Class C | | 77 | | | |
| | | | | | |
TA IDEX Transamerica | | Reimbursement of | | Available for | |
Money Market | | Class Expenses | | Recapture Through | |
| | | | | |
Fiscal Year 2007: | | | | 10/31/2010 | |
Class A | | $ | 321 | | | |
Class B | | 88 | | | |
Class C | | 45 | | | |
Class I | | 18 | | | |
| | | | | |
Fiscal Year 2006: | | | | 10/31/2009 | |
Class A | | 290 | | | |
Class B | | 81 | | | |
Class C | | 47 | | | |
| | | | | |
Fiscal Year 2005: | | | | 10/31/2008 | |
Class A | | 334 | | | |
Class B | | 101 | | | |
Class C | | 66 | | | |
| | | | | | |
TA IDEX Transamerica Science | | Reimbursement of | | Available for | |
& Technology | | Class Expenses | | Recapture Through | |
| | | | | |
Fiscal Year 2007: | | | | 10/31/2010 | |
Class A | | $ | 13 | | | |
Class B | | 14 | | | |
Class C | | 4 | | | |
| | | | | |
Fiscal Year 2006: | | | | 10/31/2009 | |
Class A | | 12 | | | |
Class B | | 19 | | | |
Class C | | 4 | | | |
| | | | | |
Fiscal Year 2005: | | | | 10/31/2008 | |
Class B | | 30 | | | |
Class C | | 15 | | | |
| | | | | | |
The following Funds did not participate in the recapture program: TA IDEX Legg Mason Partners All Cap, TA IDEX Transamerica Equity, TA IDEX Transamerica Global Opportunities, and TA IDEX Value Balanced.
Distribution and service fees: The Funds have 12b-1 distribution plans under the 1940 Act pursuant to which an annual fee, based on average daily net assets, is paid to the distributor for various disbursements such as broker-dealer account servicing fees and other promotional expenses of the Funds. The Funds are authorized under the 12b-1 plans to pay fees on each class up to the following limits: 0.35% for Class A, 1.00% for Class B, 1.00% for Class C, and is not applicable for Class I and Class T.
Underwriter commissions relate to front-end sales charges imposed for Class A shares and contingent deferred sales charges from Classes B, C, and certain A share redemptions. For the year ended October 31, 2007, the underwriter commissions were as follows:
TA IDEX Legg Mason Partners All Cap | | | |
Received by Underwriter | | $ | 71 | |
Retained by Underwriter | | 11 | |
Contingent Deferred Sales Charge | | 125 | |
| | | |
TA IDEX Templeton Transamerica Global | | | |
Received by Underwriter | | $ | 86 | |
Retained by Underwriter | | 13 | |
Contingent Deferred Sales Charge | | 26 | |
| | | |
TA IDEX Transamerica Balanced | | | |
Received by Underwriter | | $ | 75 | |
Retained by Underwriter | | 12 | |
Contingent Deferred Sales Charge | | 78 | |
| | | |
TA IDEX Transamerica Convertible Securities | | | |
Received by Underwriter | | $ | 26 | |
Retained by Underwriter | | 5 | |
Contingent Deferred Sales Charge | | 18 | |
| | | |
TA IDEX Transamerica Equity | | | |
Received by Underwriter | | $ | 544 | |
Retained by Underwriter | | 82 | |
Contingent Deferred Sales Charge | | 202 | |
| | | |
TA IDEX Transamerica Flexible Income | | | |
Received by Underwriter | | $ | 38 | |
Retained by Underwriter | | 8 | |
Contingent Deferred Sales Charge | | 30 | |
| | | |
TA IDEX Transamerica Growth Opportunities | | | |
Received by Underwriter | | $ | 99 | |
Retained by Underwriter | | 15 | |
Contingent Deferred Sales Charge | | 68 | |
| | | |
TA IDEX Transamerica High-Yield Bond | | | |
Received by Underwriter | | $ | 124 | |
Retained by Underwriter | | 25 | |
Contingent Deferred Sales Charge | | 64 | |
| | | |
TA IDEX Transamerica Money Market | | | |
Received by Underwriter | | $ | — | |
Retained by Underwriter | | — | |
Contingent Deferred Sales Charge | | 98 | |
| | | |
TA IDEX Transamerica Science & Technology | | | |
Received by Underwriter | | $ | 13 | |
Retained by Underwriter | | 2 | |
Contingent Deferred Sales Charge | | 7 | |
| | | |
TA IDEX Transamerica Small/Mid Cap Value | | | |
Received by Underwriter | | $ | 296 | |
Retained by Underwriter | | 46 | |
Contingent Deferred Sales Charge | | 63 | |
| | | |
TA IDEX Transamerica Value Balanced | | | |
Received by Underwriter | | $ | 40 | |
Retained by Underwriter | | 6 | |
Contingent Deferred Sales Charge | | 15 | |
111
Administrative services: The Funds have entered into agreements with TFS for financial and legal fund administration services. The Funds pay TFS an annual fee of 0.02% of ANA. The Legal fees on the Statements of Operations are for fees paid to external legal counsel.
Transfer agent fees: The Funds pay TFS an annual per-account charge for each open and closed account. The Funds paid TFS the following for the year ended October 31, 2007:
Fund | | Fees | |
TA IDEX Legg Mason Partners All Cap | | $ | 517 | |
TA IDEX Templeton Transamerica Global | | 791 | |
TA IDEX Transamerica Balanced | | 469 | |
TA IDEX Transamerica Convertible Securities | | 24 | |
TA IDEX Transamerica Equity | | 2,675 | |
TA IDEX Transamerica Flexible Income | | 113 | |
TA IDEX Transamerica Growth Opportunities | | 748 | |
TA IDEX Transamerica High-Yield Bond | | 119 | |
TA IDEX Transamerica Money Market | | 384 | |
TA IDEX Transamerica Science & Technology | | 61 | |
TA IDEX Transamerica Small/Mid Cap Value | | 294 | |
TA IDEX Transamerica Value Balanced | | 167 | |
| | | | |
Brokerage commissions: There were no brokerage commissions incurred on security transactions placed with affiliates of the advisers for the year ended October 31, 2007.
Deferred compensation plan: Each eligible independent Fund Trustee may elect to participate in a non-qualified deferred compensation plan (the “Plan”) maintained by Transamerica IDEX Mutual Funds Under the Plan, such Trustees may defer payment of all or a portion of their total fees earned as a Fund Trustee. Each Trustee who is a participant in the Plan may elect that the earnings, losses or gains credited to his or her deferred fee amounts be determined based on a deemed investment in any series of Transamerica IDEX Mutual Funds. The right of a participant to receive a distribution from the Plan of the deferred fees is an unsecured claim against the general assets of all series of Transamerica IDEX Mutual Funds. The pro rata liability to the Funds of all deferred fees in the Plan as of October 31, 2007, amounted to the following:
Fund | | Deferred Fees | |
TA IDEX Legg Mason Partners All Cap | | $ | 29 | |
TA IDEX Templeton Transamerica Global | | 119 | |
TA IDEX Transamerica Balanced | | 41 | |
TA IDEX Transamerica Convertible Securities | | 8 | |
TA IDEX Transamerica Equity | | 427 | |
TA IDEX Transamerica Flexible Income | | 17 | |
TA IDEX Transamerica Growth Opportunities | | 19 | |
TA IDEX Transamerica High-Yield Bond | | 29 | |
TA IDEX Transamerica Money Market | | 13 | |
TA IDEX Transamerica Science & Technology | | 4 | |
TA IDEX Transamerica Small/Mid Cap Value | | 18 | |
TA IDEX Transamerica Value Balanced | | 16 | |
| | | | |
Retirement plan: Under a retirement plan (the “Emeritus Plan”) available to the Independent Trustees, each Independent Trustee is deemed to have elected to serve as Trustee Emeritus of Transamerica IDEX Mutual Funds upon his or her termination of service, other than removal for cause, for a maximum period of five years determined by his or her years of service as a Trustee.
The amounts shall be accrued by Transamerica IDEX Mutual Funds on a pro rata basis allocable to each Transamerica IDEX Mutual Funds based on the relative assets of the fund. If retainers increase in the future, past accruals (and credits) will be adjusted upward so that 50% of the Trustee’s current retainer is accrued and credited at all times. Upon death, disability or termination of service, other than removal for cause, amounts deferred become payable to a Trustee Emeritus (or his/her beneficiary). Upon the commencement of service as Trustee Emeritus, compensation will be paid on a quarterly basis during the time period that the Trustee Emeritus is allowed to serve as such.
For the year ended October 31, 2007, the amounts related to the Emeritus Plan were as follows:
| | Emeritus Fees | |
Fund | | Due | |
TA IDEX Legg Mason Partners All Cap | | $ | 13 | |
TA IDEX Templeton Transamerica Global | | 17 | |
TA IDEX Transamerica Balanced | | 13 | |
TA IDEX Transamerica Convertible Securities | | 13 | |
TA IDEX Transamerica Equity | | 96 | |
TA IDEX Transamerica Flexible Income | | 15 | |
TA IDEX Transamerica Growth Opportunities | | 21 | |
TA IDEX Transamerica High-Yield Bond | | 22 | |
TA IDEX Transamerica Money Market | | 8 | |
TA IDEX Transamerica Science & Technology | | 4 | |
TA IDEX Transamerica Small/Mid Cap Value | | 30 | |
TA IDEX Transamerica Value Balanced | | 4 | |
| | | | |
As of October 31, 2007, the Funds have not made any payments related to the Emeritus Plan. Amounts deferred and accrued under the Deferred Compensation and Emeritus Plans are unfunded and unsecured claims against the general assets of Transamerica IDEX Mutual Funds. The Emeritus Plan was terminated effective October 30, 2007. Upon the termination, the Fund shall continue to pay any remaining benefits in accordance with the Plan, but no further compensation shall accrue under the Plan.
NOTE 3. INVESTMENT TRANSACTIONS
The cost of securities purchased and proceeds from securities sold (excluding short-term securities) for the year ended October 31, 2007 were as follows:
| | | | Proceeds from | |
| | Purchases of | | maturities and | |
| | securities: | | sales of securities: | |
| | | | U.S. | | | | U.S. | |
Fund | | Long-term | | Government | | Long-term | | Government | |
TA IDEX Legg Mason Partners All Cap | | $ | 32,245 | | $ | — | | $ | 76,244 | | $ | — | |
TA IDEX Templeton Transamerica Global | | 74,221 | | — | | 125,844 | | — | |
TA IDEX Transamerica Balanced | | 73,851 | | 27,065 | | 115,628 | | 37,272 | |
TA IDEX Transamerica Convertible Securities | | 177,518 | | — | | 331,232 | | — | |
TA IDEX Transamerica Equity | | 1,042,256 | | — | | 1,231,478 | | — | |
TA IDEX Transamerica Flexible Income | | 383,640 | | 152,556 | | 260,420 | | 125,278 | |
TA IDEX Transamerica Growth Opportunities | | 267,323 | | — | | 366,016 | | — | |
TA IDEX Transamerica High-Yield Bond | | 302,870 | | — | | 295,676 | | — | |
TA IDEX Transamerica Money Market | | — | | — | | — | | — | |
TA IDEX Transamerica Science & Technology | | 51,416 | | — | | 49,768 | | — | |
TA IDEX Transamerica Small/Mid Cap Value | | 122,950 | | — | | 237,241 | | — | |
TA IDEX Transamerica Value Balanced | | 17,526 | | 8,583 | | 22,784 | | 9,581 | |
| | | | | | | | | | | | | |
112
NOTE 4. FEDERAL INCOME TAX MATTERS
The Funds have not made any provisions for federal income or excise taxes due to their policy to distribute all of their taxable income and capital gains to their shareholders and otherwise qualify as regulated investment companies under Subchapter M of the Internal Revenue Code. Income and capital gain distributions are determined in accordance with income tax regulations, which may differ from GAAP. These differences are primarily due to differing treatment for items including, but not limited to, wash sales, foreign currency transactions, swaps, option contracts, partnerships, net operating losses and PFIC’s. Therefore, distributions determined in accordance with tax regulations may differ significantly in amount or character from net investment income and realized gains for financial reporting purposes. Financial reporting records are adjusted for permanent book/tax differences to reflect tax character. Financial records are not adjusted for temporary differences. These reclassifications are as follows:
| | | | | | Undistributed | |
| | Shares of | | | | (accumulated) | |
| | beneficial | | | | net realized | |
| | interest, | | Undistributed | | gain (loss) | |
| | unlimited | | (accumulated) net | | from | |
| | shares | | investment | | investment | |
Fund | | authorized | | income (loss) | | securities | |
TA IDEX Legg Mason Partners All Cap | | $ | — | | $ | 185 | | $ | (185 | ) |
TA IDEX Templeton Transamerica Global | | — | | 321 | | (321 | ) |
TA IDEX Transamerica Balanced | | — | | (27 | ) | 27 | |
TA IDEX Transamerica Equity | | (4,552 | ) | 4,856 | | (304 | ) |
TA IDEX Transamerica Growth Opportunities | | (2,307 | ) | 2,183 | | 124 | |
TA IDEX Transamerica High-Yield Bond | | — | | 451 | | (451 | ) |
TA IDEX Transamerica Money Market | | (2 | ) | 2 | | — | |
TA IDEX Transamerica Science & Technology | | (4 | ) | 421 | | (417 | ) |
TA IDEX Transamerica Small/Mid Cap Value | | — | | 1,568 | | (1,568 | ) |
TA IDEX Transamerica Value Balanced | | (10 | ) | (107 | ) | 117 | |
| | | | | | | | | | |
The capital loss carryforwards are available to offset future realized capital gains through the periods listed:
| | Capital Loss | | | |
Fund | | Carryforwards | | Available Through | |
TA IDEX Templeton Transamerica Global | | 44,986 | | October 31, 2009 | |
TA IDEX Templeton Transamerica Global | | 205,203 | | October 31, 2010 | |
TA IDEX Templeton Transamerica Global | | 57,944 | | October 31, 2011 | |
TA IDEX Transamerica Equity | | 192,099 | | October 31, 2008 | |
TA IDEX Transamerica Equity | | 308,384 | | October 31, 2009 | |
TA IDEX Transamerica Equity | | 94,612 | | October 31, 2010 | |
TA IDEX Transamerica Flexible Income | | 890 | | October 31, 2013 | |
TA IDEX Transamerica Flexible Income | | 5,058 | | October 31, 2014 | |
TA IDEX Transamerica Flexible Income | | 6,946 | | October 31, 2015 | |
TA IDEX Transamerica Growth Opportunities | | 56,518 | | October 31, 2008 | |
TA IDEX Transamerica Growth Opportunities | | 99,199 | | October 31, 2009 | |
TA IDEX Transamerica Growth Opportunities | | 4,618 | | October 31, 2010 | |
TA IDEX Transamerica Growth Opportunities | | 7,437 | | October 31, 2011 | |
TA IDEX Transamerica High-Yield Bond | | 1,511 | | October 31, 2014 | |
TA IDEX Transamerica Money Market | | 1 | | October 31, 2013 | |
TA IDEX Transamerica Money Market | | 1 | | October 31, 2014 | |
TA IDEX Transamerica Money Market | | — | | October 31, 2015 | |
The capital loss carryforwards utilized during the year ended October 31, 2007 were as follows:
| | Capital Loss Carryforwards | |
| | Utilized During the Year Ended | |
Fund | | October 31, 2007 | |
TA IDEX Legg Mason Partners All Cap | | $ | — | |
TA IDEX Templeton Transamerica Global | | 21,477 | |
TA IDEX Transamerica Balanced | | 19,417 | |
TA IDEX Transamerica Convertible Securities | | — | |
TA IDEX Transamerica Equity | | 187,996 | |
TA IDEX Transamerica Flexible Income | | — | |
TA IDEX Transamerica Growth Opportunities | | 91,981 | |
TA IDEX Transamerica High-Yield Bond | | 3,253 | |
TA IDEX Transamerica Money Market | | — | |
TA IDEX Transamerica Science & Technology | | 509 | |
TA IDEX Transamerica Small/Mid Cap Value | | — | |
TA IDEX Transamerica Value Balanced | | 1,100 | |
| | | | |
113
The tax character of distributions paid may differ from the character of distributions shown in the Statements of Changes in Net Assets due to short-term gains being treated as ordinary income for tax purposes. The tax character of distributions paid during 2006 and 2007 was as follows:
| | Distributions Paid | | Distributions Paid | |
| | From: 2006 | | From: 2007 | |
| | | | Long- | | | | Long- | |
| | | | term | | | | term | |
| | Ordinary | | Capital | | Ordinary | | Capital | |
| | Income | | Gain | | Income | | Gain | |
TA IDEX Legg Mason Partners All Cap | | $ | 116 | | $ | 9,310 | | $ | 390 | | $ | 29,704 | |
TA IDEX Templeton Transamerica Global | | 31 | | — | | 2,533 | | — | |
TA IDEX Transamerica Balanced | | 393 | | — | | 571 | | — | |
TA IDEX Transamerica Convertible Securities | | 3,250 | | 1,261 | | 2,509 | | 14,409 | |
TA IDEX Transamerica Flexible Income | | 13,372 | | — | | 20,040 | | — | |
TA IDEX Transamerica High- Yield Bond | | 26,385 | | — | | 26,450 | | — | |
TA IDEX Transamerica Money Market | | 5,358 | | — | | 7,678 | | — | |
TA IDEX Transamerica Science & Technology | | — | | 1,067 | | — | | — | |
TA IDEX Transamerica Small/Mid Cap Value | | 12,306 | | 19,948 | | 8,052 | | 9,021 | |
TA IDEX Transamerica Value Balanced | | 1,030 | | 995 | | 864 | | 1,791 | |
| | | | | | | | | | | | | |
The tax basis components of distributable earnings as of October 31, 2007 are as follows:
| | | | | | | | | | Net* | |
| | Undistributed | | Undistributed | | Total Capital | | Other | | Unrealized | |
| | Ordinary | | Long-term | | Loss | | Temporary | | Appreciation | |
Fund | | Income | | Capital Gain | | Carryforward | | Differences | | (Depreciation) | |
TA IDEX Legg Mason Partners All Cap | | $ | 441 | | $ | 14,798 | | $ | — | | $ | (7 | ) | $ | 37,356 | |
TA IDEX Templeton Transamerica Global | | 2,125 | | — | | (329,610 | ) | (115 | ) | 68,824 | |
TA IDEX Transamerica Balanced | | 4 | | 4,811 | | (19,417 | ) | (26 | ) | 45,730 | |
TA IDEX Transamerica Convertible Securities | | 8,160 | | 28,135 | | — | | — | | 32,477 | |
TA IDEX Transamerica Equity | | — | | — | | (783,091 | ) | (411 | ) | 2,668 | |
TA IDEX Transamerica Flexible Income | | 1,265 | | — | | (12,894 | ) | (6 | ) | (5,445 | ) |
TA IDEX Transamerica Growth Opportunities | | — | | — | | (259,753 | ) | (17 | ) | 82,533 | |
TA IDEX Transamerica High-Yield Bond | | 1,538 | | — | | (4,764 | ) | (15 | ) | (4,324 | ) |
TA IDEX Transamerica Money Market | | 452 | | — | | (2 | ) | (4 | ) | 1 | |
TA IDEX Transamerica Science & Technology | | — | | 3,109 | | (509 | ) | — | | 32,982 | |
TA IDEX Transamerica Small/Mid Cap Value | | 5,056 | | 76,038 | | — | | — | | 228,110 | |
TA IDEX Transamerica Value Balanced | | 48 | | 3,016 | | (1,100 | ) | (12 | ) | 13,532 | |
| | | | | | | | | | | | | | | | |
*The amount includes unrealized appreciation (depreciation) from foreign currency translation and derivatives, if applicable.
NOTE 5. REGULATORY PROCEEDINGS
There continues to be significant federal and state regulatory activity relating to financial services companies, particularly mutual fund companies and their investment advisers. As part of an ongoing investigation regarding potential market timing, recordkeeping and trading compliance issues and matters affecting the Funds’ investment adviser, TFAI, and certain affiliates and former employees of TFAI, the SEC staff has indicated that it is likely to take some action against TFAI and certain of its affiliates at the conclusion of the investigation. The potential timing and the scope of any such action is difficult to predict. Although the impact of any action brought against TFAI and/or its affiliates is difficult to assess at the present time, the Funds currently believe that the likelihood that any such action will have a material adverse impact is remote. It is important to note that the Funds are not aware of any allegation of wrongdoing against them and their Board at the time this annual report is printed. Although it is not anticipated that these developments will have an adverse impact on the Funds, there can be no assurance at this time. TFAI and its affiliates are actively working with the SEC in regard to this matter; however, the exact resolution cannot be determined at this time. TFAI will take such actions that it deems necessary or appropriate to continue providing management services to the Funds and to bring all matters to an appropriate conclusion.
TFAI and/or its affiliates, and not the Funds, will bear the costs regarding these regulatory matters.
114
NOTE 6. RECENTLY ISSUED ACCOUNTING PRONOUNCEMENTS
In July 2006, the Financial Accounting Standards Board (“FASB”) released FASB Interpretation No. 48 “Accounting for Uncertainty in Income Taxes” (“FIN 48”), an interpretation of FASB Statement No. 109. FIN 48 provides guidance for how uncertain tax positions should be recognized, measured, presented and disclosed in the financial statements. FIN 48 requires the accounting and disclosure of tax positions taken or expected to be taken in the course of preparing the Funds’ tax returns to determine whether the tax positions are “more likely-than-not” of being sustained by the applicable tax authority. Tax positions not deemed to meet the more-likely-than-not threshold would be recorded as a tax benefit or expense in the current year. Adoption of FIN 48 is effective during the first required financial reporting period for fiscal years beginning after December 15, 2006.
Implementation of FIN 48 requires Management of the Funds to analyze all open tax years, as defined by the Statute of Limitations, for all major jurisdictions, which includes federal and certain states. Open tax years are those that are open for exam by taxing authorities (i.e., the last 4 tax year ends and the interim tax period since then). The Funds have no examinations in progress and none are expected at this time.
As of September 28, 2007, Management of the Funds have reviewed all open tax years and major jurisdictions and concluded the adoption of FIN48 resulted in no impact the Funds’ net assets or results of operations. There is no tax liability resulting from unrecognized tax benefits relating to uncertain income tax positions taken or expected to be taken in future tax returns. The Funds are also not aware of any tax positions for which it is reasonably possible that the total amounts of unrecognized tax benefits will significantly change in the next 12 months.
In September 2006, FASB issued its new Standard No. 157, “Fair Value Measurements” (“FAS 157”). FAS 157 is designed to unify guidance for the measurement of fair value of all types of assets, including financial instruments, and certain liabilities, throughout a number of accounting standards. FAS 157 also establishes a hierarchy for measuring fair value in generally accepted accounting principles and expands financial statement disclosures about fair value measurements that are relevant to mutual funds. FAS 157 is effective for financial statements issued for fiscal years beginning after November 15, 2007, and earlier application is permitted.
As of October 31, 2007, Management does not expect the adoption of FAS 157 to impact the amounts reported in the financial statements, however, additional disclosures will be required about the inputs used to develop the measurements of fair value and the effect of certain of the measurements reported in the statement of operations for a fiscal period.
NOTE 7. SUBSEQUENT EVENT
Effective January 1, 2008, Transamerica Fund Advisors, Inc. will change its name to Transamerica Asset Management, Inc.
115
Report of Independent Registered Certified Public Accounting Firm
To the Board of Trustees and Shareholders of TA IDEX Legg Mason Partners All Cap, TA IDEX Templeton Transamerica Global, TA IDEX Transamerica Balanced, TA IDEX Transamerica Convertible Securities, TA IDEX Transamerica Equity, TA IDEX Transamerica Flexible Income, TA IDEX Transamerica Growth Opportunities, TA IDEX Transamerica High-Yield Bond, TA IDEX Transamerica Money Market, TA IDEX Transamerica Science & Technology, TA IDEX Transamerica Small/Mid Cap Value and TA IDEX Transamerica Value Balanced:
In our opinion, the accompanying statements of assets and liabilities, including the schedules of investments, and the related statements of operations and of changes in net assets and the financial highlights present fairly, in all material respects, the financial position of TA IDEX Legg Mason Partners All Cap, TA IDEX Templeton Transamerica Global, TA IDEX Transamerica Balanced, TA IDEX Transamerica Convertible Securities, TA IDEX Transamerica Equity, TA IDEX Transamerica Flexible Income, TA IDEX Transamerica Growth Opportunities, TA IDEX Transamerica High-Yield Bond, TA IDEX Transamerica Money Market, TA IDEX Transamerica Science & Technology, TA IDEX Transamerica Small/Mid Cap Value and TA IDEX Transamerica Value Balanced (individually a “Fund”, collectively the “Funds”) at October 31, 2007, and the results of each of their operations, the changes in each of their net assets and the financial highlights for each of the periods indicated, in conformity with accounting principles generally accepted in the United States of America. These financial statements and financial highlights (hereafter referred to as “financial statements”) are the responsibility of the Funds’ management; our responsibility is to express an opinion on these financial statements based on our audits. We conducted our audits of these financial statements in accordance with the standards of the Public Company Accounting Oversight Board (United States). Those standards require that we plan and perform the audit to obtain reasonable assurance about whether the financial statements are free of material misstatement. An audit includes examining, on a test basis, evidence supporting the amounts and disclosures in the financial statements, assessing the accounting principles used and significant estimates made by management, and evaluating the overall financial statement presentation. We believe that our audits, which included confirmation of securities at October 31, 2007 by correspondence with the custodian and brokers, provide a reasonable basis for our opinion.

Tampa, Florida
December 28, 2007
116
SUPPLEMENTAL INFORMATION
TAX INFORMATION
For dividends paid during the year ended October 31, 2007, the Funds designated the following as qualified dividend income:
| | Qualified Dividend | |
Fund | | Income | |
TA IDEX Legg Mason Partners All Cap | | $ | 390 | |
TA IDEX Templeton Transamerica Global | | 2,125 | |
TA IDEX Transamerica Balanced | | 571 | |
TA IDEX Transamerica Convertible Securities | | 1,071 | |
TA IDEX Transamerica Equity | | — | |
TA IDEX Transamerica Flexible Income | | 429 | |
TA IDEX Transamerica Growth Opportunities | | — | |
TA IDEX Transamerica High-Yield Bond | | 160 | |
TA IDEX Transamerica Money Market | | — | |
TA IDEX Transamerica Science & Technology | | — | |
TA IDEX Transamerica Small/Mid Cap Value | | 7,260 | |
TA IDEX Transamerica Value Balanced | | 874 | |
| | | | |
For corporate shareholders, investment income (dividend income plus short-term gains, if any) qualifies for the dividends received deductions as follows:
| | Dividend Received | |
Fund | | Deduction Percentage | |
TA IDEX Legg Mason Partners All Cap | | 100.00 | % |
TA IDEX Templeton Transamerica Global | | 47.60 | % |
TA IDEX Transamerica Balanced | | 100.00 | % |
TA IDEX Transamerica Convertible Securities | | 35.90 | % |
TA IDEX Transamerica Equity | | — | |
TA IDEX Transamerica Flexible Income | | 1.29 | % |
TA IDEX Transamerica Growth Opportunities | | — | |
TA IDEX Transamerica High-Yield Bond | | .60 | % |
TA IDEX Transamerica Money Market | | — | |
TA IDEX Transamerica Science & Technology | | — | |
TA IDEX Transamerica Small/Mid Cap Value | | 88.69 | % |
TA IDEX Transamerica Value Balanced | | 100.00 | % |
For tax purposes, the Long-Term Capital Gain Designations for the year ended October 31, 2007 were as follows:
| | Long-Term Capital | |
Fund | | Designation | |
TA IDEX Legg Mason Partners All Cap | | — | |
TA IDEX Templeton Transamerica Global | | $ | 29,704 | |
TA IDEX Transamerica Balanced | | — | |
TA IDEX Transamerica Convertible Securities | | — | |
TA IDEX Transamerica Equity | | 14,409 | |
TA IDEX Transamerica Flexible Income | | — | |
TA IDEX Transamerica Growth Opportunities | | — | |
TA IDEX Transamerica High-Yield Bond | | — | |
TA IDEX Transamerica Money Market | | — | |
TA IDEX Transamerica Science & Technology | | — | |
TA IDEX Transamerica Small/Mid Cap Value | | 9,021 | |
TA IDEX Transamerica Value Balanced | | 1,791 | |
| | | | |
The information and distributions reported herein may differ from the information and distributions taxable to the shareholders for the calendar year ending December 31, 2007. Complete information will be computed and reported in conjunction with your 2007 Form 1099-DIV.
117
RESULTS OF SHAREHOLDER PROXY (unaudited)
Section 270.30e-1 under the Investment Company Act of 1940, as amended, titled “Reports to Stockholders of Management Companies,” requires regulated investment companies to report on all subject matters put to the vote of shareholders and provide final results. Accordingly, the Board of Trustees of the Fund solicited a vote by the shareholders for the following items.
At a special meeting of shareholders held on October 30, 2007, the results of the Proposals were as follows:
Proposal 1: To elect a new Board of Directors
| | For | | Withheld | |
John K. Carter | | 1,869,801,381.126 | | 75,092,910.077 | |
Leo J. Hill | | 1,870,292,020.404 | | 74,602,270.799 | |
Joyce Galpern Norden | | 1,870,010,162.690 | | 74,884,128.513 | |
Neal M. Jewell | | 1,869,085,986.703 | | 75,808,304.500 | |
Russell A. Kimball, Jr. | | 1,869,975,193.416 | | 74,919,097.787 | |
Eugene M. Mannella | | 1,869,732,073.896 | | 75,162,217.307 | |
Norm R. Nielsen | | 1,870,076,377.259 | | 74,817,913.944 | |
Patricia L. Sawyer | | 1,870,218,037.071 | | 74,676,254.132 | |
John W. Waechter | | 1,869,642,547.953 | | 75,251,743.250 | |
Proposal 2: To approve an amendment to the Agreement and Declaration of Trust
For | | Withheld | | Abstain | |
1,216,704,908.632 | | 76,054,434.614 | | 186,736,131.957 | |
118
TRANSAMERICA IDEX MUTUAL FUNDS
Management of the Funds
| | | | | | | | Number of | | | |
| | | | | | | | Funds | | | |
| | | | | | | | in Fund | | | |
| | | | Length of | | | | Complex | | | |
| | Position(s) | | Time | | Principal Occupation(s) | | Overseen | | Other Board | |
Name, Address*** and Age | | Held | | Served* | | During Past Five Years | | by Trustee | | Memberships | |
| | | | | | | | | | | |
Independent Trustees :** | | | | | | | | | | | |
| | | | | | | | | | | |
Leo J. Hill
(DOB: 3/27/56) | | Trustee | | Since 2002 | | Principal, Advisor Network Solutions, LLC (business consulting) (2006 to present); Trustee, Diversified Investors Portfolios (“DIP”), The Diversified Investors Funds Group (“DIFG”), The Diversified Investors Funds Group II (“DIFG II”) and Diversified Investors Strategic Variable Funds (“DISVF”) (2007 to present); Trustee, Transamerica IDEX Mutual Funds (“TA IDEX”) (2002 to present); Director, Transamerica Income Shares, Inc. (“TIS”) (2002 to present); Trustee, AEGON/Transamerica Series Trust (“ATST”) (2001 to present); Owner and President, Prestige Automotive Group (2001 to 2005); President, L. J. Hill & Company (1999 to present); Market President, Nations Bank of Sun Coast Florida (1998 to 1999); President and Chief Executive Officer, Barnett Banks of Treasure Coast Florida (1994 to 1998); Executive Vice President and Senior Credit Officer, Barnett Banks of Jacksonville, Florida (1991 to 1994); Senior Vice President and Senior Loan Administration Officer, Wachovia Bank of Georgia (1976 to 1991). | | 160 | | None | |
| | | | | | | | | | | |
Russell A. Kimball, Jr.
(DOB: 8/17/44) | | Trustee | | Since 2002 | | Trustee, DIP, DIFG, DIFG II and DISVF (2007 to present); Trustee, TA IDEX (2002 to present); Director, TIS (2002 to present); Trustee, ATST (1986 to present); General Manager, Sheraton Sand Key Resort (1975 to present). | | 160 | | None | |
| | | | | | | | | | | |
Norm R. Nielsen
(DOB: 5/11/39) | | Trustee | | Since 2006 | | Retired (2005 to present); Trustee, DIP, DIFG, DIFG II and DISVF (2007 to present); Trustee, TA IDEX (2006 to present); Director, TIS (2006 to present); Trustee, ATST (2006 to present); Director, Iowa City Area Development (1996 to 2004); Director, Iowa Health Systems (1994 to 2003); Director, U.S. Bank (1987 to 2006); President, Kirkwood Community College (1979 to 2005). | | 160 | | Buena Vista University Board of Trustees (2004 to present) | |
119
| | | | | | | | Number of | | | |
| | | | | | | | Funds | | | |
| | | | | | | | in Fund | | | |
| | | | Length of | | | | Complex | | | |
| | Position(s) | | Time | | Principal Occupation(s) | | Overseen | | Other Board | |
Name, Address*** and Age | | Held | | Served* | | During Past Five Years | | by Trustee | | Memberships | |
| | | | | | | | | | | |
John W. Waechter
(DOB: 2/25/52) | | Trustee | | Since 2005 | | Trustee, DIP, DIFG, DIFG II and DISVF (2007 to present); Trustee, TA IDEX (2005 to present); Director, TIS (2004 to present); Trustee, ATST (2004 to present); employee, RBC Dain Rauscher (securities dealer) (March 2004 to May 2004); Executive Vice President, Chief Financial Officer and Chief Compliance Officer, William R. Hough & Co. (securities dealer) (1979 to 2004); Treasurer, The Hough Group of Funds (1993 to 2004). | | 160 | | None | |
| | | | | | | | | | | |
Neal M. Jewell
(DOB: 2/12/35) | | Trustee | | Since 2007 | | Retired (2004 to present); Trustee, TA IDEX and ATST (2007 to present); Director, TIS (2007 to present); Trustee, DIP, DIFG, DIFG II and DISVF (1993 to present); Independent Trustee, EAI Select Managers Equity Fund (mutual fund) (1996 to 2004). | | 160 | | None | |
| | | | | | | | | | | |
Eugene M. Mannella
(DOB: 2/1/54) | | Trustee | | Since 2007 | | Self-employed consultant (2006 to present); President, Arapain Partners LLC (limited purpose broker-dealer) (1998 to present); Trustee, TA IDEX and ATST (2007 to present); Director, TIS (2007 to present); Trustee, DIP, DIFG, DIFG II and DISVF (1994 to present); President, International Fund Services (alternative asset administration) (1993 to 2005). | | 160 | | None | |
| | | | | | | | | | | |
Joyce Galpern Norden
(DOB: 6/1/39) | | Trustee | | Since 2007 | | Retired (2004 to present); Trustee, TA IDEX and ATST (2007 to present); Director, TIS (2007 to present); Trustee, DIP (2002 to present); Trustee, DIFG, DIFG II, and DISVF (1993 to present); Vice President, Institutional Advancement, Reconstructionist Rabbinical College (1996 to 2004). | | 160 | | Board of Governors, Reconstructionist Rabbinical College (2007 to present) | |
| | | | | | | | | | | |
Patricia L. Sawyer
(DOB: 7/1/50) | | Trustee | | Since 2007 | | Trustee, TA IDEX and ATST (2007 to present); Director, TIS (2007 to present); Trustee, DIP, DIFG, DIFG II, and DISVF (1993 to present); President and Executive Search Consultant, Smith & Sawyer LLC (consulting) (1989 to present). | | 160 | | None | |
120
| | | | | | | | Number of | | | |
| | | | | | | | Funds | | | |
| | | | | | | | in Fund | | | |
| | | | Length of | | | | Complex | | | |
| | Position(s) | | Time | | Principal Occupation(s) | | Overseen | | Other Board | |
Name, Address*** and Age | | Held | | Served* | | During Past Five Years | | by Trustee | | Memberships | |
| | | | | | | | | | | |
Interested Trustee:**** | | | | | | | | | | | |
| | | | | | | | | | | |
John K. Carter
(DOB: 4/24/61) | | Trustee | | Since 2006 | | President and Chief Executive Officer, DIP, DIFG, DIFG II and DISVF (August 2007 to present); Trustee, DIP, DIFG, DIFG II, and DISVF (October 2007 to present); Trustee (September 2006 to present), President and Chief Executive Officer (July 2006 to present), Senior Vice President (1999 to June 2006), Chief Compliance Officer, General Counsel and Secretary (1999 to August 2006), TA IDEX; Trustee (September 2006 to present), President and Chief Executive Officer (July 2006 to present), Senior Vice President (1999 to June 2006), Chief Compliance Officer, General Counsel and Secretary (1999 to August 2006), ATST; Director (September 2006 to present), President and Chief Executive Officer (July 2006 to present), Senior Vice President (2002 to June 2006), General Counsel, Secretary and Chief Compliance Officer (2002 to August 2006), TIS; President and Chief Executive Officer (July 2006 to present), Senior Vice President (1999 to June 2006), Director (2000 to present), General Counsel and Secretary (2000 to August 2006), Chief Compliance Officer (2004 to August 2006), TFAI; President and Chief Executive Officer (July 2006 to present), Senior Vice President (1999 to June 2006), Director (2001 to present), General Counsel and Secretary (2001 to August 2006), (“TFS”); Vice President, AFSG Securities Corporation (2001 to present);Chief Executive Officer (July 2006 to present), Vice President, Secretary and Chief Compliance Officer (2003 to August 2006), Transamerica Investors, Inc. (“TII”); Senior Vice President, General Counsel and Secretary, Transamerica Index Funds, Inc. (2002 to 2004); Vice President, Transamerica Investment Services, Inc. (“TISI”) (2003 to 2005) and Transamerica Investment Management, LLC (“TIM”) (2001 to 2005). | | 160 | | None | |
121
Officers
| | | | Length of | | | |
| | | | Time | | Principal Occupation(s) | |
Name, Address*** and Age | | Position(s) Held | | Served† | | During the Past Five Years | |
| | | | | | | |
John K. Carter
(DOB: 4/24/61) | | Chief Executive Officer and President | | Since 1999 | | See the table above. | |
| | | | | | | |
Dennis P. Gallagher
(DOB: 12/19/70) | | Vice President, General Counsel and Secretary | | Since 2006 | | Vice President, General Counsel and Secretary, TA IDEX, ATST and TIS (September 2006 to present); Vice President, General Counsel and Secretary, DIP, DIFG, DIFG II and DISVF (August 2007 to present); Vice President and Secretary, TII (September 2006 to present); Director, Senior Vice President, General Counsel and Secretary, TFAI and TFS (September 2006 to present); Director, Deutsche Asset Management (1998 to 2006). | |
| | | | | | | |
Elizabeth L. Belanger
(DOB: 1/7/72) | | Deputy General Counsel, Assistant Secretary and Conflicts of Interest Officer | | Since 2007 | | Deputy General Counsel, Assistant Secretary and Conflicts of Interest Officer, TII (November 2007 to present); Deputy General Counsel, Assistant Secretary and Conflicts of Interest Officer, TA IDEX, ATST and TIS (July 2007 to present); Deputy General Counsel and Conflicts of Interest Officer (August 2007 to present), Assistant Secretary (August 2005 to present), DIP, DIFG, DIFG II and DISVF; Vice President and Senior Counsel, Diversified (with Diversified since 2005); Director, TFLIC (April 2006 to present); Director of Compliance, Domini Social Investments LLC (November 2003 to May 2005); Associate, Bingham McCutchen LLP (September 1997 to October 2003). | |
| | | | | | | |
Joseph P. Carusone
(DOB: 9/8/65) | | Vice President, Treasurer and Principal Financial Officer | | Since 2007 | | Vice President, Treasurer and Principal Financial Officer, TII (November 2007 to present); Vice President, Treasurer and Principal Financial Officer, TA IDEX, ATST and TIS (July 2007 to present); Vice President (August 2007 to present), Treasurer and Principal Financial Officer (2001 to present), DIP, DIFG, DIFG II and DISVF; Vice President, Diversified (since 1999); President, Diversified Investors Securities Corp. (“DISC”) (February 2007 to present); Director, TFLIC (2004 to present). | |
| | | | | | | |
Christopher A. Staples
(DOB: 8/14/70) | | Vice President and Chief Investment Officer | | Since 2004 | | Vice President and Chief Investment Officer, TII (November 2007 to present); Vice President (July 2007 to present), Chief Investment Officer (June 2007 to present), Senior Vice President (June 2007 to July 2007), Senior Vice President - Investment Management (July 2006 to June 2007), Vice President - Investment Management (2004 to July 2006), TA IDEX, ATST and TIS; Vice President and Chief Investment Officer, DIP, DIFG, DIFG II and DISVF (August 2007 to present); Director, TFAI and TFS (2005 to present); Assistant Vice President, Raymond James & Associates (1999 to 2004). | |
122
| | | | Length of | | | |
| | | | Time | | Principal Occupation(s) | |
Name, Address*** and Age | | Position(s) Held | | Served† | | During the Past Five Years | |
| | | | | | | |
T. Gregory Reymann, II
(DOB: 5/13/58) | | Chief Compliance Officer | | Since 2004 | | Chief Compliance Officer (September 2006 to present) and Vice President (2005 to present), Chief Compliance Officer, TA IDEX, ATST, TIS and TFAI (September 2006 to present); Senior Vice President, TFAI (September 2006 to present); Senior Vice President, TA IDEX, ATST and TIS (September 2006 to July 2007); Vice President and Senior Counsel, TFS (2005 to 2006); Vice President and Counsel, TA IDEX, ATST, TFAI and TIS (2004 to 2006), TFS (2004 to 2005) and TIF (2004); Attorney, Gould, Cooksey, et al. (2002 to 2004). | |
| | | | | | | |
Michael A. Masson
(DOB: 1/21/71) | | Assistant Treasurer | | Since 2007 | | Assistant Treasurer, TII (November 2007 to present); Assistant Treasurer (July 2007 to present), Assistant Vice President (2005 to present), TA IDEX, ATST and TIS; Assistant Treasurer, DIP, DIFG, DIFG II and DISVF (August 2007 to present); Assistant Vice President, ATST and TIS (2005 to present); Assistant Vice President, TII (2005 to present); Assistant Vice President, TFS and TFAI (2005 to present); Assistant Vice President, JPMorgan Chase & Co. (1999 to 2005). | |
| | | | | | | |
Suzanne Valerio-Montemurro
(DOB: 8/13/64) | | Assistant Treasurer | | Since 2007 | | Assistant Treasurer, the Trust (November 2007 to present); Assistant Treasurer, TA IDEX, ATST and TIS (July 2007 to present); Assistant Treasurer, DIP, DIFG, DIFG II and DISVF (August 2007 to present); Vice President, Diversified (with Diversified since 1998). | |
* | | Each Trustee shall hold office until: 1) his or her successor is elected and qualified or 2) he or she resigns or his or her term as a Trustee is terminated in accordance with the Transamerica IDEX by-laws. |
** | | Independent trustee (“Independent Trustee”) means a trustee who is not an “interested person” (as defined under the 1940 Act) of the Trust (the “Independent Trustees”). |
*** | | The mailing address of each Trustee and Officer is c/o Secretary of the Funds, 570 Carillon Parkway, St. Petersburg, Florida 33716. |
**** | | May be deemed an “interested person” (as that term is defined in Section 2(a)(19) of the 1940 Act) of the Trust because of his employment with the Advisor or an affiliate of the Advisor. |
† | | If an officer has held offices for different Funds for different periods of time, the earliest applicable date is shown. |
Additional information about the Fund trustees can be found in the Statement of Additional Information, available, without charge, upon request, by calling toll free 1-888-233-4339.
123
PROXY VOTING POLICIES AND PROCEDURES AND QUARTERLY PORTFOLIO HOLDINGS
A description of the Transamerica IDEX Mutual Funds’ proxy voting policies and procedures is available in the Statements of Additional Information of the Funds, available without charge upon request by calling 1-888-233-4339 (toll free) or on the Securities and Exchange Commission website at www.sec.gov.
In addition, the Funds are required to file Form N-PX, with their complete proxy voting records for the 12 months ended June 30th, no later than August 31st of each year. The Form is available without charge: (1) from the Funds, upon request by calling 1-888-233-4339; and (2) on the SEC’s website at www.sec.gov.
The Funds file their complete schedule of portfolios holdings with the SEC for the first and third quarter of each fiscal year on Form N-Q, which is available on the Commission’s website at www.sec.gov. The Funds’ Form N-Q may be reviewed and copied at the Commission’s Public Reference Room in Washington, D.C. Information on the operation of the Public Reference Room may be obtained by calling 1-800-SEC-0330.
Important Notice Regarding Delivery of Shareholder Documents
Every year we send shareholders informative materials such as the Transamerica IDEX Annual Report, the Transamerica IDEX Prospectus, and other required documents that keep you informed regarding your funds. Transamerica IDEX will only send one piece per mailing address, a method that saves your Funds money by reducing mailing and printing costs. We will continue to do this unless you tell us not to. To elect to receive individual mailings, simply call a Transamerica IDEX Customer Service Representative toll free at 1-888-233-4339, 8 a.m. to 7 p.m. Eastern Time, Monday–Friday. Your request will take effect within 30 days.
124
P.O. Box 9012
Clearwater, FL 33758-9012

Customer Service 1-888-233-IDEX (4339)
P.O. Box 9012 · Clearwater, FL 33758-9012
Distributor: Transamerica Capital, Inc.

Fund of Funds
Annual Report
October 31, 2007
www.transamericaidex.com
Customer Service 1-888-233-IDEX (4339)
P.O. Box 9012 · Clearwater, FL 33758-9012
Distributor: Transamerica Capital, Inc.
Dear Fellow Shareholder,
On behalf of Transamerica IDEX Mutual Funds, I would like to thank you for your continued support and confidence in our products as we look forward to continuing to serve you and your financial adviser in the future. We value the trust you have placed in us.
This annual report is provided to you with the intent of presenting a comprehensive review of the investments of each of your funds. The Securities and Exchange Commission requires that annual and semi-annual reports be sent to all shareholders, and we believe this report to be an important part of the investment process. In addition to providing a comprehensive review, this report also provides a discussion of accounting policies as well as matters presented to shareholders that may have required their vote.
We believe it is important to recognize and understand current market conditions in order to provide a context for reading this report. The positive returns experienced in the equity markets for the trailing 12 months ending October 31, 2007, mask the volatility experienced along the way, with significant pullbacks occurring in February-March and July-August. The Federal Reserve Board (“Federal Reserve”) was on hold for most of the past twelve months but more recently in September and October lowered its target for the federal funds rate by 0.50% and 0.25% respectively. The rate reductions by the Federal Reserve signaled an effort to inject liquidity and stability to the markets which have been adversely affected by concerns over subprime debt. While Gross Domestic Product growth remains positive, investor concerns over the extent to which subprime debt may affect consumer spending and persistently high oil prices have been a check on market returns. For the 12 months ending October 31, 2007, the Dow Jones Industrial Average returned 17.94%, the Standard & Poor’s 500 Composite Stock Index returned 14.56%, and the Lehman Brothers Aggregate Bond Index returned 5.38%. Please keep in mind it is important to maintain a diversified portfolio as investment returns have historically been difficult to predict.
In addition to your active involvement in the investment process, we firmly believe that a financial adviser is a key resource to help you build a complete picture of your current and future financial needs. Financial advisers are familiar with the market’s history, including long-term returns and volatility of various asset classes. With your financial adviser, you can develop an investment program that incorporates factors such as your goals, your investment timeline, and your risk tolerance.
Please contact your financial adviser if you have any questions about the contents of this report, and thanks again for the confidence you have placed in us.
Sincerely,
John K. Carter | | Christopher A. Staples | | | |
President & Chief Executive Officer
Transamerica IDEX Mutual Funds | | Vice Preident & Chief Investment Officer
Transamerica IDEX Mutual Funds | | | |
The views expressed in this report reflect those of the portfolio managers only and may not necessarily represent the views of Transamerica IDEX Mutual Funds. These views are subject to change based upon market conditions. These views should not be relied upon as investment advice and are not indicative of trading intent on behalf of the Transamerica IDEX Mutual Funds.
TA IDEX Asset Allocation – Conservative Portfolio
MARKET ENVIRONMENT
Although the twelve-month period through October 31, 2007 witnessed plenty of market volatility, the stock and bond markets notched respectable gains. The Standard and Poor’s 500 Composite Stock Index returned 14.56%, while the broad Dow Jones Wilshire 5000 Total Market Index (“DJ Wilshire 5000”) gained 15.29%. These gains were not without interruption, however. A February tumble in China’s red-hot market upset stocks all around the world that month. And in the summer, gathering concern in the U.S. about the mortgage and housing markets reached alarming levels. The mortgage industry’s loose lending standards of recent years came back to haunt lenders, investors, and borrowers alike in 2007. Lenders responded by tightening lending standards, many borrowers could no longer qualify for loans, and home sales and refinancings slowed. These developments along with soaring oil prices made investors wary of U.S. economy’s direction.
Investors took some solace from strong growth abroad, but U.S. stocks nonetheless fell in June and July. The stocks of financial companies were hardest hit by the mortgage market’s woes. Investors had already been favoring the relative safety of larger stocks by then; and as they migrated toward large caps while also steering away from financials and other economically sensitive stocks, they boosted the prices of large-cap growth stocks in sectors such as technology. Large growth companies were also rewarded for being significant exporters, which was an advantage given weakness in the U.S. dollar. Moreover, many people felt growth stocks, and particularly large-cap growth stocks, were ripe for a rebound after lagging for several years. For the twelve-month period, growth stocks rose more than value stocks across all market-cap ranges; and large caps significantly outpaced small caps (although mid-caps beat both, benefiting from a wave of merger and acquisition activity early in the year).
Foreign stock returns surpassed the U.S. indices, partly because the major foreign currencies strengthened against the dollar. The Morgan Stanley Capital International-EAFE Index rose 25.43% for the period. Emerging markets were especially strong as high oil and commodity prices bolstered developing economies. The Morgan Stanley Capital International Emerging Markets Index returned 68.33%.
Bond returns were mixed early on but improved as nervous investors sought safety from the summer’s shaky stock market. The Federal Reserve Board’s rate cuts in September and October also helped boost bond prices. The Lehman Brothers Aggregate Bond Index (“LBAB”) finished the twelve-month period with a 5.38% return. Riskier high-yield bonds weakened as credit conditions worsened, but already had strong gains from earlier in the period.
PERFORMANCE
For the year ended October 31, 2007, TA IDEX Asset Allocation—Conservative Portfolio Class A returned 12.06%. By comparison, its primary and secondary benchmarks, the LBAB and the DJ Wilshire 5000, returned 5.38% and 15.29%, respectively. As of October 31, 2007, the Fund’s net expense ratios for Class A, Class B, Class C, and Class R were 0.62%, 1.25%, 1.22%, and 0.86%, respectively.
STRATEGY REVIEW
This fund-of-funds portfolio is structured to provide an approximately 35%, 55%, 10% mix of stocks, bonds and cash, respectively. Its equity exposure is intended to provide broadly diversified coverage of domestic and international equity markets, across a range of market capitalizations and investment styles. The fixed-income portion is also well diversified, covering investment-grade and credit-sensitive holdings, as well as international bonds. The portfolio also includes emerging markets, global real estate, and absolute-return strategies.
The portfolio’s 12.06% return for the twelve-month period performed well versus its peer group, the Morningstar Conservative Allocation fund category. The portfolio’s largest position, bond fund TA IDEX PIMCO Total Return, performed well relative to the LBAB, and the next-largest bond holding, TA IDEX JPMorgan International Bond, posted even better returns. The best-performing bond fund was the TA IDEX Van Kampen Emerging Markets Debt. The equity funds delivered higher returns in many cases. TA IDEX Oppenheimer Developing Markets was the portfolio’s overall top gainer as emerging markets soared. The portfolio’s international exposure in general was a positive as the weakening dollar boosted returns for U.S. investors. With growth stocks leading the domestic market, several of the portfolio’s growth funds also posted strong gains, including the two heaviest-weighted growth funds.
In early 2007, we conducted a broad rebalancing, mainly to better diversify the bond position, correct a small-cap overweight, and rebalance the portfolio’s value and growth exposure. We believe the portfolio’s strong returns for this period demonstrate the effectiveness of maintaining disciplined and balanced market coverage while focusing on identifying excellent managers in each style.
During the year, five new funds were added to the menu available for use in the portfolio: TA IDEX BlackRock Natural Resources, TA IDEX Loomis Sayles Bond, TA IDEX Third Avenue Value, and two absolute-return strategies—TA IDEX Mellon Market Neutral Strategy and TA IDEX UBS Dynamic Alpha. The portfolio currently owns all of these new funds.
Michael Stout, CFA
Jon Hale, Ph.D., CFA
Jeff McConnell, CFA
Maciej Kowara, Ph.D., CFA
Co-Portfolio Managers
Morningstar Associates, LLC
1
(unaudited)
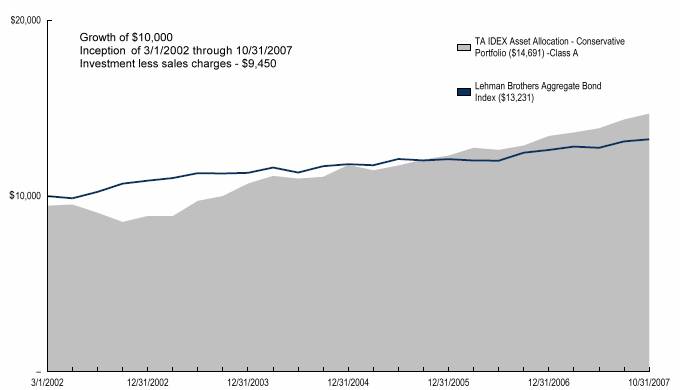
Average Annual Total Return for Periods Ended10/31/2007
| | | | | | From | | Inception | |
| | 1 Year | | 5 Years | | Inception | | Date | |
Class A (NAV) | | 12.06 | % | 11.01 | % | 8.09 | % | 3/1/02 | |
Class A (POP) | | 5.93 | % | 9.75 | % | 7.02 | % | 3/1/02 | |
Lehman Brothers Aggregate Bond Index(1) | | 5.38 | % | 4.41 | % | 4.98 | % | 3/1/02 | |
DJ Wilshire 5000(1) | | 15.29 | % | 15.31 | % | 9.41 | % | 3/1/02 | |
| | | | | | | | | |
Class B (NAV) | | 11.34 | % | 10.28 | % | 7.38 | % | 3/1/02 | |
Class B (POP) | | 6.34 | % | 10.15 | % | 7.38 | % | 3/1/02 | |
| | | | | | | | | |
Class C (NAV) | | 11.31 | % | — | % | 10.33 | % | 11/11/02 | |
Class C (POP) | | 10.31 | % | — | % | 10.33 | % | 11/11/02 | |
| | | | | | | | | |
Class R (NAV) | | 11.89 | % | — | % | 12.65 | % | 6/15/06 | |
NOTES
(1) The Lehman Brothers Aggregate Bond (LBAB) Index and the Dow Jones Wilshire 5000 Total Market (DJ Wilshire 5000) Index are unmanaged indices used as a general measure of market performance. Calculations assume dividends and capital gains are reinvested and do not include any managerial expenses. From inception calculation is based on life of Class A shares. You cannot invest directly in an index.
The performance data presented represents past performance; future results may vary. Performance data does not reflect the deduction of taxes that would be paid on fund distributions nor the redemption of fund shares. Investment return and principal value will fluctuate so that an investor’s shares, when redeemed, may be worth more or less than their original cost.
Current performance may be lower or higher than performance quoted. Please see www.transamericaidex.com for performance data current to the most recent month-end.
Public Offering Price (POP) returns include the reinvestment of dividends and capital gains and reflect the maximum sales charge of 5.5% for A shares or the maximum applicable contingent deferred sales charge (5% in the 1st year, decreasing to 0% after 6 years) for Class B shares and 1% (during the first 12 months) for Class C shares. Shares purchased prior to March 1, 2004 are subject to a maximum applicable contingent deferred sales charge (5% in the 1st year, decreasing to 0% after 7 years) for Class B shares and (2% in the 1st year, decreasing to 0% after 2 years) for Class C shares.
Net Asset Value (NAV) returns include the reinvestment of dividends and capital gains but do not reflect any sales charges.
This material must be preceded or accompanied by a current prospectus, which includes specific contents regarding the investment objectives and policies of this Fund.
2
UNDERSTANDING YOUR FUND’S EXPENSES
(unaudited)
SHAREHOLDER EXPENSES
Fund shareholders may incur two types of costs: (1) transaction costs, including sales charges (loads) on purchases, contingent deferred sales charges on redemptions and redemption fees; and (2) ongoing costs, including management fees, 12b-1 distribution and service fees, and other fund expenses.
The following Example is intended to help you understand your ongoing costs (in dollars and cents) of investing in the Fund and to compare these costs with the ongoing costs of investing in other funds.
The Example is based on an investment of $1,000 invested at May 1, 2007 and held for the entire period until October 31, 2007.
ACTUAL EXPENSES
The first line in the table below provides information about actual account values and actual expenses. You may use the information in this line, together with the amount you invested, to estimate the expenses that you paid over the period. Simply divide your account value by $1,000 (for example, an $8,600 account value divided by $1,000 = 8.6), then multiply the result by the number in the first line of your Fund under the heading entitled “Expenses Paid During Period” to estimate the expenses you paid on your account during this period. If your account is an IRA, your expenses could have included a $15 annual fee. The amount of any fee paid through your account would increase the estimate of expenses you paid during the period and decrease your ending account value.
HYPOTHETICAL EXAMPLE FOR COMPARISON PURPOSES
The second line in the table below provides information about hypothetical account values and hypothetical expenses based on the Fund’s actual expense ratio and an assumed rate of return of 5% per year before expenses, which is not the Fund’s actual return. The hypothetical account values and expenses may not be used to estimate the actual ending account balance or expenses you paid for the period. You may use this information to compare the ongoing costs of investing in your Fund and other funds. To do so, compare this 5% hypothetical example with the 5% hypothetical examples that appear in the shareholder reports of the other funds. As in the case of the actual expense example, if your account is subject to an IRA fee, the amount of the fee paid through your account would increase the hypothetical expenses you would have paid during the period and decrease the hypothetical ending account value.
Please note that the expenses shown in the table are meant to highlight your ongoing costs only and do not reflect any transactional costs, such as sales charges, redemption fees, brokerage commissions paid on purchases and sales of fund shares. Therefore, the second line under the Fund in the table is useful in comparing ongoing costs only, and will not help you determine the relative total costs of owning different funds. If any of these transaction costs were included, your costs would be higher. The expenses shown in the table do not reflect any fees that may be charged to you by brokers, financial intermediaries or other financial institutions.
The expenses shown in the table do not reflect any expenses from the Fund’s investment in other affiliated investment companies. The average weighted annualized expense ratio of the underlying investment companies at October 31, 2007 was 0.81%.
| | Beginning | | Ending | | Annualized | | Expenses | |
| | Account | | Account | | Expense | | Paid During | |
| | Value | | Value | | Ratio | | Period (a) | |
| | | | | | | | | |
Class A | | | | | | | | | |
Actual | | $ | 1,000.00 | | $ | 1,060.50 | | 0.64 | % | $ | 3.31 | |
Hypothetical (b) | | 1,000.00 | | 1,021.92 | | 0.64 | | 3.25 | |
| | | | | | | | | |
Class B | | | | | | | | | |
Actual | | 1,000.00 | | 1,057.08 | | 1.25 | | 6.46 | |
Hypothetical (b) | | 1,000.00 | | 1,018.85 | | 1.25 | | 6.34 | |
| | | | | | | | | |
Class C | | | | | | | | | |
Actual | | 1,000.00 | | 1,056.59 | | 1.22 | | 6.31 | |
Hypothetical (b) | | 1,000.00 | | 1,019.00 | | 1.22 | | 6.19 | |
| | | | | | | | | |
Class R | | | | | | | | | |
Actual | | 1,000.00 | | 1,058.45 | | 0.75 | | 3.88 | |
Hypothetical (b) | | 1,000.00 | | 1,021.37 | | 0.75 | | 3.81 | |
| | | | | | | | | | | | |
(a) Expenses are calculated using the Fund’s annualized expense ratio (as disclosed in the table), multiplied by the average account value for the period, multiplied by the number of days in the period (184 days), and divided by the number of days in the year (365 days).
(b) 5% return per year before expenses.
GRAPHICAL PRESENTATION OF SCHEDULE OF INVESTMENTS
By Investment Type
At October 31, 2007
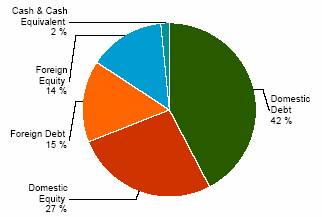
This chart shows the percentage breakdown by investment type of the aggregate portfolio holdings of the underlying affiliated investment companies in which the Fund invests. The security lending collateral in the underlying funds is excluded from this calculation.
3
SCHEDULE OF INVESTMENTS
At October 31, 2007
(all amounts except share amounts in thousands)
| | Shares | | Value | |
INVESTMENT COMPANIES (99.8%)(€) | | | | | |
Bond (43.3%) | | | | | |
TA IDEX JPMorgan International Bond | | 4,510,989 | | $ | 49,621 | |
TA IDEX PIMCO Total Return | | 9,001,761 | | 94,248 | |
TA IDEX Transamerica Convertible Securities | | 1,565,868 | | 23,973 | |
TA IDEX Transamerica Flexible Income | | 2,603,468 | | 23,874 | |
TA IDEX Transamerica High-Yield Bond | | 4,715,575 | | 43,242 | |
TA IDEX Transamerica Short-Term Bond | | 4,926,060 | | 48,374 | |
TA IDEX Van Kampen Emerging Markets Debt | | 1,624,764 | | 18,246 | |
Capital Preservation (1.2%) | | | | | |
TA IDEX Transamerica Money Market | | 8,041,180 | | 8,041 | |
Global/International Stock (7.4%) | | | | | |
TA IDEX AllianceBernstein International Value | | 797,615 | | 11,868 | |
TA IDEX Evergreen International Small Cap | | 733,718 | | 13,809 | |
TA IDEX Marsico International Growth | | 326,886 | | 5,309 | |
TA IDEX Neuberger Berman International | | 439,765 | | 5,959 | |
TA IDEX Oppenheimer Developing Markets | | 703,380 | | 12,007 | |
TA IDEX Templeton Transamerica Global | | 69,669 | | 2,510 | |
Inflation-Protected Securities (6.3%) | | | | | |
TA IDEX PIMCO Real Return TIPS | | 4,309,954 | | 44,005 | |
Tactical and Specialty (16.9%) | | | | | |
TA IDEX BlackRock Global Allocation | | 1,420,581 | | 18,794 | |
TA IDEX BlackRock Natural Resources W | | 856,607 | | $ | 12,087 | |
TA IDEX Clarion Global Real Estate Securities | | 621,425 | | 12,727 | |
TA IDEX Evergreen Health Care | | 838,192 | | 11,860 | |
TA IDEX Federated Market Opportunity | | 561,477 | | 5,239 | |
TA IDEX Loomis Sayles Bond | | 4,134,260 | | 42,128 | |
TA IDEX Mellon Market Neutral Strategy W | | 651,792 | | 6,374 | |
TA IDEX UBS Dynamic Alpha W | | 868,354 | | 8,536 | |
U.S. Stock (24.7%) | | | | | |
TA IDEX American Century Large Company Value | | 1,955,135 | | 25,065 | |
TA IDEX Bjurman, Barry Micro Emerging Growth W | | 65,630 | | 821 | |
TA IDEX BlackRock Large Cap Value | | 1,125,603 | | 14,723 | |
TA IDEX Jennison Growth | | 93,738 | | 1,223 | |
TA IDEX JPMorgan Mid Cap Value | | 899,661 | | 11,084 | |
TA IDEX Marsico Growth | | 1,147,158 | | 16,519 | |
TA IDEX Oppenheimer Small- & Mid-Cap Value | | 87,118 | | 1,148 | |
TA IDEX Third Avenue Value | | 26,257 | | 760 | |
TA IDEX Transamerica Equity W | | 2,761,450 | | 33,772 | |
TA IDEX Transamerica Growth Opportunities W | | 794,357 | | 9,207 | |
TA IDEX Transamerica Small/Mid Cap Value | | 992,532 | | 23,731 | |
TA IDEX UBS Large Cap Value | | 2,184,115 | | 30,119 | |
TA IDEX Van Kampen Mid-Cap Growth | | 123,258 | | 1,745 | |
TA IDEX Van Kampen Small Company Growth | | 176,985 | | 2,503 | |
Total Investment Companies (cost $611,460) # | | | | $ | 695,251 | |
NOTES TO SCHEDULE OF INVESTMENTS
€ The Fund invests its assets in the Class I shares of the affiliated Transamerica IDEX Mutual Funds.
# Aggregate cost for federal income tax purposes is $611,646. Aggregate gross unrealized appreciation for all securities in which there is an excess of value over tax cost and aggregate gross unrealized depreciation for all securities in which there is an excess of tax cost over value were $85,440 and $1,835, respectively. Net unrealized appreciation for tax purposes is $83,605.
W Non-income producing.
The notes to the financial statements are an integral part of this report.
4
TA IDEX Asset Allocation – Growth Portfolio
MARKET ENVIRONMENT
Although the twelve-month period through October 31, 2007 witnessed plenty of market volatility, the stock and bond markets notched respectable gains. The Standard and Poor’s 500 Composite Stock Index returned 14.56%, while the broad Dow Jones Wilshire 5000 Total Market Index (“DJ Wilshire 5000”) gained 15.29%. These gains were not without interruption, however. A February tumble in China’s red-hot market upset stocks all around the world that month. And in the summer, gathering concern in the U.S. about the mortgage and housing markets reached alarming levels. The mortgage industry’s loose lending standards of recent years came back to haunt lenders, investors, and borrowers alike in 2007. Lenders responded by tightening lending standards, many borrowers could no longer qualify for loans, and home sales and refinancings slowed. These developments along with soaring oil prices made investors wary of U.S. economy’s direction.
Investors took some solace from strong growth abroad, but U.S. stocks nonetheless fell in June and July. The stocks of financial companies were hardest hit by the mortgage market’s woes. Investors had already been favoring the relative safety of larger stocks by then; and as they migrated toward large caps while also steering away from financials and other economically sensitive stocks, they boosted the prices of large-cap growth stocks in sectors such as technology. Large growth companies were also rewarded for being significant exporters, which was an advantage given weakness in the U.S. dollar. Moreover, many people felt growth stocks, and particularly large-cap growth stocks, were ripe for a rebound after lagging for several years. For the twelve-month period, growth stocks rose more than value stocks across all market-cap ranges; and large caps significantly outpaced small caps (although mid-caps beat both, benefiting from a wave of merger and acquisition activity early in the year).
Foreign stock returns surpassed the U.S. indices, partly because the major foreign currencies strengthened against the dollar. The Morgan Stanley Capital International-EAFE Index rose 25.43% for the period. Emerging markets were especially strong as high oil and commodity prices bolstered developing economies. The Morgan Stanley Capital International Emerging Markets Index returned 68.33%.
Bond returns were mixed early on but improved as nervous investors sought safety from the summer’s shaky stock market. The Federal Reserve Board’s rate cuts in September and October also helped boost bond prices. The Lehman Brothers Aggregate Bond Index finished the twelve-month period with a 5.38% return. Riskier high-yield bonds weakened as credit conditions worsened, but already had strong gains from earlier in the period.
PERFORMANCE
For the year ended October 31, 2007, TA IDEX Asset Allocation—Growth Portfolio Class A returned 21.35%. By comparison, its benchmark, the DJ Wilshire 5000, returned 15.29%. As of October 31, 2007, the Fund’s net expense ratios for Class A, Class B, Class C, and Class R were 0.64%, 1.29%, 1.25%, and 0.68%, respectively.
STRATEGY REVIEW
This fund-of-funds portfolio is structured to provide broadly diversified coverage of domestic and international equity markets, across a range of market capitalizations and investment styles. The portfolio also includes emerging markets, global real estate, and a modest allocation to absolute-return strategies.
The portfolio’s 21.35% return for the twelve-month period performed well versus its peer group, the Morningstar Large Blend fund category. The best-performing underlying fund was TA IDEX Oppenheimer Developing Markets as emerging markets soared. The portfolio’s international exposure in general was a positive as the weakening dollar boosted returns for U.S. investors. With growth stocks leading the domestic market, several of the portfolio’s growth funds also posted strong gains, particularly TA IDEX Transamerica Growth Opportunities, TA IDEX Van Kampen Mid-Cap Growth, TA IDEX Marsico Growth, and TA IDEX Transamerica Equity. Although value stocks lagged, most of the portfolio’s value funds performed well relative to their categories, including the small-cap funds, TA IDEX Transamerica Small/Mid Cap Value and TA IDEX Oppenheimer Small-& Mid-Cap Value.
In early 2007, we conducted a broad rebalancing, mainly to correct a small-cap weighting that had grown too large and to better balance the portfolio’s value and growth exposure. We believe the portfolio’s excellent returns for this period demonstrate the effectiveness of maintaining disciplined and balanced market coverage while focusing on identifying excellent managers in each style.
During the year five new funds were added to the menu available for use in the portfolio: TA IDEX BlackRock Natural Resources, TA IDEX Loomis Sayles Bond, TA IDEX Third Avenue Value, and two absolute-return strategies—TA IDEX Mellon Market Neutral Strategy and TA IDEX UBS Dynamic Alpha. The portfolio currently owns all of these new funds except TA IDEX Loomis Sayles Bond.
Michael Stout, CFA
Jon Hale, PhD, CFA
Jeff McConnell, CFA
Maciej Kowara, PhD, CFA
Co-Portfolio Managers
Morningstar Associates, LLC
5
(unaudited)
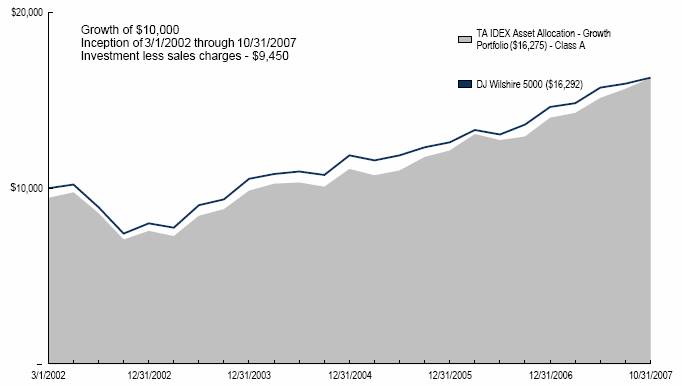
Average Annual Total Return for Periods Ended 10/31/2007
| | | | | | From | | Inception | |
| | 1 Year | | 5 Years | | Inception | | Date | |
| | | | | | | | | |
Class A (NAV) | | 21.35 | % | 16.72 | % | 10.06 | % | 3/1/02 | |
Class A (POP) | | 14.69 | % | 15.41 | % | 8.97 | % | 3/1/02 | |
DJ Wilshire 5000(1) | | 15.29 | % | 15.31 | % | 9.41 | % | 3/1/02 | |
| | | | | | | | | |
Class B (NAV) | | 20.54 | % | 15.97 | % | 9.34 | % | 3/1/02 | |
Class B (POP) | | 15.54 | % | 15.86 | % | 9.34 | % | 3/1/02 | |
| | | | | | | | | |
Class C (NAV) | | 20.60 | % | — | % | 16.26 | % | 11/11/02 | |
Class C (POP) | | 19.60 | % | — | % | 16.26 | % | 11/11/02 | |
| | | | | | | | | |
Class R (NAV) | | 21.20 | % | — | % | 22.06 | % | 6/15/06 | |
NOTES
(1) The Dow Jones Wilshire 5000 Total Market (DJ Wilshire 5000) Index is an unmanaged index used as a general measure of market performance. Calculations assume dividends and capital gains are reinvested and do not include any managerial expenses. From inception calculation is based on life of Class A shares. You cannot invest directly in an index.
The performance data presented represents past performance; future results may vary. Performance data does not reflect the deduction of taxes that would be paid on fund distributions nor the redemption of fund shares. Investment return and principal value will fluctuate so that an investor’s shares, when redeemed, may be worth more or less than their original cost.
Current performance may be lower or higher than performance quoted. Please see www.transamericaidex.com for performance data current to the most recent month-end.
Public Offering Price (POP) returns include the reinvestment of dividends and capital gains and reflect the maximum sales charge of 5.5% for A shares or the maximum applicable contingent deferred sales charge (5% in the 1st year, decreasing to 0% after 6 years) for Class B shares and 1% (during the first 12 months) for Class C shares. Shares purchased prior to March 1, 2004 are subject to a maximum applicable contingent deferred sales charge (5% in the 1st year, decreasing to 0% after 7 years) for Class B shares and (2% in the 1st year, decreasing to 0% after 2 years) for Class C shares.
Net Asset Value (NAV) returns include the reinvestment of dividends and capital gains but do not reflect any sales charges.
This material must be preceded or accompanied by a current prospectus, which includes specific contents regarding the investment objectives and policies of this Fund.
6
UNDERSTANDING YOUR FUND’S EXPENSES
(unaudited)
SHAREHOLDER EXPENSES
Fund shareholders may incur two types of costs: (1) transaction costs, including sales charges (loads) on purchases, contingent deferred sales charges on redemptions and redemption fees; and (2) ongoing costs, including management fees, 12b-1 distribution and service fees, and other fund expenses.
The following Example is intended to help you understand your ongoing costs (in dollars and cents) of investing in the Fund and to compare these costs with the ongoing costs of investing in other funds.
The Example is based on an investment of $1,000 invested at May 1, 2007 and held for the entire period until October 31, 2007.
ACTUAL EXPENSES
The first line in the table below provides information about actual account values and actual expenses. You may use the information in this line, together with the amount you invested, to estimate the expenses that you paid over the period. Simply divide your account value by $1,000 (for example, an $8,600 account value divided by $1,000 = 8.6), then multiply the result by the number in the first line of your Fund under the heading entitled “Expenses Paid During Period” to estimate the expenses you paid on your account during this period. If your account is an IRA, your expenses could have included a $15 annual fee. The amount of any fee paid through your account would increase the estimate of expenses you paid during the period and decrease your ending account value.
HYPOTHETICAL EXAMPLE FOR COMPARISON PURPOSES
The second line in the table below provides information about hypothetical account values and hypothetical expenses based on the Fund’s actual expense ratio and an assumed rate of return of 5% per year before expenses, which is not the Fund’s actual return. The hypothetical account values and expenses may not be used to estimate the actual ending account balance or expenses you paid for the period. You may use this information to compare the ongoing costs of investing in your Fund and other funds. To do so, compare this 5% hypothetical example with the 5% hypothetical examples that appear in the shareholder reports of the other funds. As in the case of the actual expense example, if your account is subject to an IRA fee, the amount of the fee paid through your account would increase the hypothetical expenses you would have paid during the period and decrease the hypothetical ending account value.
Please note that the expenses shown in the table are meant to highlight your ongoing costs only and do not reflect any transactional costs, such as sales charges, redemption fees, brokerage commissions paid on purchases and sales of fund shares. Therefore, the second line under the Fund in the table is useful in comparing ongoing costs only, and will not help you determine the relative total costs of owning different funds. If any of these transaction costs were included, your costs would be higher. The expenses shown in the table do not reflect any fees that may be charged to you by brokers, financial intermediaries or other financial institutions.
The expenses shown in the table do not reflect any expenses from the Fund’s investment in other affiliated investment companies. The average weighted annualized expense ratio of the underlying investment companies at October 31, 2007 was 0.92%.
| | Beginning | | Ending | | Annualized | | Expenses | |
| | Account | | Account | | Expense | | Paid During | |
| | Value | | Value | | Ratio | | Period (a) | |
| | | | | | | | | |
Class A | | | | | | | | | |
Actual | | $ | 1,000.00 | | $ | 1,099.58 | | 0.65 | % | $ | 3.43 | |
Hypothetical (b) | | 1,000.00 | | 1,021.87 | | 0.65 | | 3.30 | |
| | | | | | | | | |
Class B | | | | | | | | | |
Actual | | 1,000.00 | | 1,095.58 | | 1.30 | | 6.85 | |
Hypothetical (b) | | 1,000.00 | | 1,018.60 | | 1.30 | | 6.60 | |
| | | | | | | | | |
Class C | | | | | | | | | |
Actual | | 1,000.00 | | 1,096.38 | | 1.25 | | 6.59 | |
Hypothetical (b) | | 1,000.00 | | 1,018.85 | | 1.25 | | 6.34 | |
| | | | | | | | | |
Class R | | | | | | | | | |
Actual | | 1,000.00 | | 1,098.44 | | 0.66 | | 3.48 | |
Hypothetical (b) | | 1,000.00 | | 1,021.82 | | 0.66 | | 3.35 | |
| | | | | | | | | | | | |
(a) Expenses are calculated using the Fund’s annualized expense ratio (as disclosed in the table), multiplied by the average account value for the period, multiplied by the number of days in the period (184 days), and divided by the number of days in the year (365 days).
(b) 5% return per year before expenses.
GRAPHICAL PRESENTATION OF SCHEDULE OF INVESTMENTS
By Investment Type
At October 31, 2007
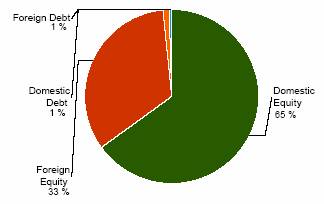
This chart shows the percentage breakdown by investment type of the aggregate portfolio holdings of the underlying affiliated investment companies in which the Fund invests. The security lending collateral in the underlying funds is excluded from this calculation.
7
SCHEDULE OF INVESTMENTS
At October 31, 2007
(all amounts except share amounts in thousands)
| | Shares | | Value | |
INVESTMENT COMPANIES (99.9%)(€) | | | | | |
Capital Preservation (0.2%) | | | | | |
TA IDEX Transamerica Money Market | | 5,256,936 | | $ | 5,257 | |
Global/International Stock (19.5%) | | | | | |
TA IDEX AllianceBernstein InternationalValue | | 4,908,121 | | 73,033 | |
TA IDEX Evergreen International Small Cap | | 5,966,855 | | 112,296 | |
TA IDEX Marsico International Growth | | 4,642,979 | | 75,402 | |
TA IDEX Neuberger Berman International | | 7,658,420 | | 103,772 | |
TA IDEX Oppenheimer Developing Markets | | 5,820,904 | | 99,363 | |
TA IDEX Templeton Transamerica Global | | 196,623 | | 7,084 | |
Tactical and Specialty (13.9%) | | | | | |
TA IDEX BlackRock Global Allocation | | 5,167,862 | | 68,371 | |
TA IDEX BlackRock Natural ResourcesW | | 2,375,594 | | 33,520 | |
TA IDEX Clarion Global Real Estate Securities | | 5,358,043 | | 109,733 | |
TA IDEX Evergreen Health Care | | 3,963,361 | | 56,081 | |
TA IDEX Federated Market Opportunity | | 962,026 | | 8,976 | |
TA IDEX Mellon Market Neutral StrategyW | | 2,039,984 | | 19,951 | |
TA IDEX Transamerica Science & TechnologyW | | 3,943,100 | | 22,633 | |
TA IDEX UBS Dynamic AlphaW | | 1,704,112 | | 16,751 | |
U.S. Stock (66.3%) | | | | | |
TA IDEX American Century Large Company Value | | 18,601,658 | | 238,473 | |
TA IDEX Bjurman, Barry Micro Emerging GrowthW | | 1,259,541 | | 15,757 | |
TA IDEX BlackRock Large Cap Value | | 17,949,078 | | 234,774 | |
TA IDEX Jennison Growth | | 9,706,852 | | 126,675 | |
TA IDEX JPMorgan Mid Cap Value | | 6,583,989 | | 81,115 | |
TA IDEX Marsico Growth | | 8,443,079 | | 121,580 | |
TA IDEX Oppenheimer Small- & Mid-Cap Value | | 1,762,507 | | 23,230 | |
TA IDEX Third Avenue Value | | 298,000 | | 8,621 | |
TA IDEX Transamerica EquityW | | 22,808,527 | | 278,948 | |
TA IDEX Transamerica Growth OpportunitiesW | | 4,901,238 | | 56,805 | |
TA IDEX Transamerica Small/Mid Cap Value | | 6,867,619 | | 164,205 | |
TA IDEX UBS Large Cap Value | | 10,647,846 | | 146,834 | |
TA IDEX Van Kampen Mid-Cap Growth | | 4,941,517 | | 69,972 | |
TA IDEX Van Kampen Small Company Growth | | 2,786,094 | | 39,395 | |
Total Investment Companies (cost $1,875,025) # | | | | $ | 2,418,607 | |
NOTES TO SCHEDULE OF INVESTMENTS
€ The Fund invests its assets in the Class I shares of the affiliated Transamerica IDEX Mutual Funds.
# Aggregate cost for federal income tax purposes is $1,876,742. Aggregate gross unrealized appreciation for all securities in which there is an excess of value over tax cost and aggregate gross unrealized depreciation for all securities in which there is an excess of tax cost over value were$542,418 and $553, respectively. Net unrealized appreciation for tax purposes is $541,865.
W Non-income producing.
The notes to the financial statements are an integral part of this report.
8
TA IDEX Asset Allocation – Moderate Growth Portfolio
MARKET ENVIRONMENT
Although the twelve-month period through October 31, 2007 witnessed plenty of market volatility, the stock and bond markets notched respectable gains. The Standard and Poor’s 500 Composite Stock Index returned 14.56%, while the broad Dow Jones Wilshire 5000 Total Market Index (“DJ Wilshire 5000”) gained 15.29%. These gains were not without interruption, however. A February tumble in China’s red-hot market upset stocks all around the world that month. And in the summer, gathering concern in the U.S. about the mortgage and housing markets reached alarming levels. The mortgage industry’s loose lending standards of recent years came back to haunt lenders, investors, and borrowers alike in 2007. Lenders responded by tightening lending standards, many borrowers could no longer qualify for loans, and home sales and refinancings slowed. These developments along with soaring oil prices made investors wary of U.S. economy’s direction.
Investors took some solace from strong growth abroad, but U.S. stocks nonetheless fell in June and July. The stocks of financial companies were hardest hit by the mortgage market’s woes. Investors had already been favoring the relative safety of larger stocks by then; and as they migrated toward large caps while also steering away from financials and other economically sensitive stocks, they boosted the prices of large-cap growth stocks in sectors such as technology. Large growth companies were also rewarded for being significant exporters, which was an advantage given weakness in the U.S. dollar. Moreover, many people felt growth stocks, and particularly large-cap growth stocks, were ripe for a rebound after lagging for several years. For the twelve-month period, growth stocks rose more than value stocks across all market-cap ranges; and large caps significantly outpaced small caps (although mid-caps beat both, benefiting from a wave of merger and acquisition activity early in the year).
Foreign stock returns surpassed the U.S. indices, partly because the major foreign currencies strengthened against the dollar. The Morgan Stanley Capital International-EAFE Index rose 25.43% for the period. Emerging markets were especially strong as high oil and commodity prices bolstered developing economies. The Morgan Stanley Capital International Emerging Markets Index returned 68.33%.
Bond returns were mixed early on but improved as nervous investors sought safety from the summer’s shaky stock market. The Federal Reserve Board’s rate cuts in September and October also helped boost bond prices. The Lehman Brothers Aggregate Bond Index (“LBAB”) finished the twelve-month period with a 5.38% return. Riskier high-yield bonds weakened as credit conditions worsened, but already had strong gains from earlier in the period.
PERFORMANCE
For the year ended October 31, 2007, TA IDEX Asset Allocation—Moderate Growth Portfolio Class A returned 17.48%. By comparison, its primary and secondary benchmarks, the DJ Wilshire 5000 and the LBAB, returned 15.29% and 5.38%, respectively. As of October 31, 2007, the Fund’s net expense ratios for Class A, Class B, Class C, and Class R were 0.60%, 1.27%, 1.23%, and 0.67%, respectively.
STRATEGY REVIEW
This fund-of-funds portfolio is structured to provide an approximately 70%, 25%, 5% mix of stocks, bonds and cash, respectively. Its equity exposure is intended to provide broadly diversified coverage of domestic and international equity markets, across a range of market capitalizations and investment styles. The fixed-income portion covers investment-grade and credit-sensitive holdings, as well as international bonds. The portfolio also includes emerging markets, global real estate, and absolute-return strategies.
The portfolio’s 17.48% return for the twelve-month period performed well versus its peer group, the Morningstar Moderate Allocation fund category. The best-performing underlying fund was TA IDEX Oppenheimer Developing Markets as emerging markets soared. The portfolio’s international exposure in general was a positive as the weakening dollar boosted returns for U.S. investors. With growth stocks leading the domestic market, several of the portfolio’s growth funds also posted strong gains, particularly TA IDEX Transamerica Growth Opportunities, TA IDEX Van Kampen Mid-Cap Growth, TA IDEX Marsico Growth, and TA IDEX Transamerica Equity. Although value stocks lagged, most of the portfolio’s value funds performed well relative to their categories, most notably TA IDEX Transamerica Small/Mid Cap Value. Meanwhile, the portfolio’s two largest bond-fund positions, TA IDEX PIMCO Total Return and TA IDEX JPMorgan International Bond, both posted strong absolute returns.
In early 2007, we conducted a broad rebalancing, mainly to correct a small-cap overweight, rebalance the portfolio’s value and growth exposure, and better diversify the bond position. We believe the portfolio’s excellent returns for this period demonstrate the effectiveness of maintaining disciplined and balanced market coverage while focusing on identifying excellent managers in each style.
During the year, five new funds were added to the menu available for use in the portfolio: TA IDEX BlackRock Natural Resources, TA IDEX Loomis Sayles Bond, TA IDEX Third Avenue Value, and two absolute-return strategies—TA IDEX Mellon Market Neutral Strategy and TA IDEX UBS Dynamic Alpha. The portfolio currently owns all of these new funds.
Michael Stout, CFA
Jon Hale, Ph.D., CFA
Jeff McConnell, CFA
Maciej Kowara, Ph.D., CFA
Co-Portfolio Managers
Morningstar Associates, LLC
9
(unaudited)
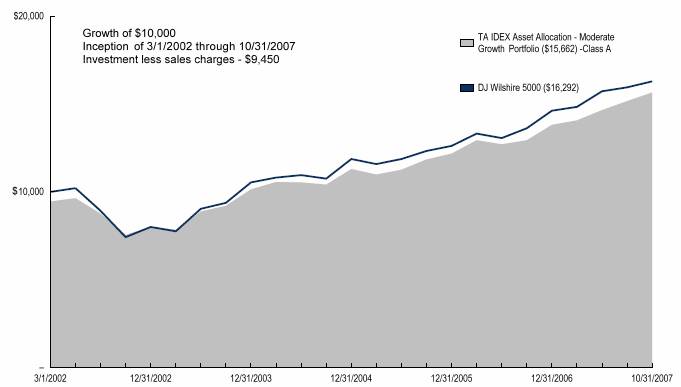
Average Annual Total Return for Periods Ended 10/31/2007
| | | | | | From | | Inception | |
| | 1 Year | | 5 Years | | Inception | | Date | |
| | | | | | | | | |
Class A (NAV) | | 17.48 | % | 14.64 | % | 9.31 | % | 3/1/02 | |
Class A (POP) | | 11.02 | % | 13.34 | % | 8.23 | % | 3/1/02 | |
DJ Wilshire 5000(1) | | 15.29 | % | 15.31 | % | 9.41 | % | 3/1/02 | |
Lehman Brothers Aggregate Bond Index(1) | | 5.38 | % | 4.41 | % | 4.98 | % | 3/1/02 | |
| | | | | | | | | |
Class B (NAV) | | 16.69 | % | 13.88 | % | 8.59 | % | 3/1/02 | |
Class B (POP) | | 11.69 | % | 13.76 | % | 8.59 | % | 3/1/02 | |
| | | | | | | | | |
Class C (NAV) | | 16.74 | % | — | % | 14.07 | % | 11/11/02 | |
Class C (POP) | | 15.74 | % | — | % | 14.07 | % | 11/11/02 | |
| | | | | | | | | |
Class R (NAV) | | 17.31 | % | — | % | 18.36 | % | 6/15/06 | |
NOTES
(1) The Dow Jones Wilshire 5000 Total Market (DJ Wilshire 5000) Index and the Lehman Brothers Aggregate Bond (LBAB) Index are unmanaged indices used as a general measure of market performance. Calculations assume dividends and capital gains are reinvested and do not include any managerial expenses. From inception calculation is based on life of Class A shares. You cannot invest directly in an index.
The performance data presented represents past performance; future results may vary. Performance data does not reflect the deduction of taxes that would be paid on fund distributions nor the redemption of fund shares. Investment return and principal value will fluctuate so that an investor’s shares, when redeemed, may be worth more or less than their original cost.
Current performance may be lower or higher than performance quoted. Please see www.transamericaidex.com for performance data current to the most recent month-end.
Public Offering Price (POP) returns include the reinvestment of dividends and capital gains and reflect the maximum sales charge of 5.5% for A shares or the maximum applicable contingent deferred sales charge (5% in the 1st year, decreasing to 0% after 6 years) for Class B shares and 1% (during the first 12 months) for Class C shares. Shares purchased prior to March 1, 2004 are subject to a maximum applicable contingent deferred sales charge (5% in the 1st year, decreasing to 0% after 7 years) for Class B shares and (2% in the 1st year, decreasing to 0% after 2 years) for Class C shares.
Net Asset Value (NAV) returns include the reinvestment of dividends and capital gains but do not reflect any sales charges.
This material must be preceded or accompanied by a current prospectus, which includes specific contents regarding the investment objectives and policies of this Fund.
10
UNDERSTANDING YOUR FUND’S EXPENSES
(unaudited)
SHAREHOLDER EXPENSES
Fund shareholders may incur two types of costs: (1) transaction costs, including sales charges (loads) on purchases, contingent deferred sales charges on redemptions and redemption fees; and (2) ongoing costs, including management fees, 12b-1 distribution and service fees, and other fund expenses.
The following Example is intended to help you understand your ongoing costs (in dollars and cents) of investing in the Fund and to compare these costs with the ongoing costs of investing in other funds.
The Example is based on an investment of $1,000 invested at May 1, 2007 and held for the entire period until October 31, 2007.
ACTUAL EXPENSES
The first line in the table below provides information about actual account values and actual expenses. You may use the information in this line, together with the amount you invested, to estimate the expenses that you paid over the period. Simply divide your account value by $1,000 (for example, an $8,600 account value divided by $1,000 = 8.6), then multiply the result by the number in the first line of your Fund under the heading entitled “Expenses Paid During Period” to estimate the expenses you paid on your account during this period. If your account is an IRA, your expenses could have included a $15 annual fee. The amount of any fee paid through your account would increase the estimate of expenses you paid during the period and decrease your ending account value.
HYPOTHETICAL EXAMPLE FOR COMPARISON PURPOSES
The second line in the table below provides information about hypothetical account values and hypothetical expenses based on the Fund’s actual expense ratio and an assumed rate of return of 5% per year before expenses, which is not the Fund’s actual return. The hypothetical account values and expenses may not be used to estimate the actual ending account balance or expenses you paid for the period. You may use this information to compare the ongoing costs of investing in your Fund and other funds. To do so, compare this 5% hypothetical example with the 5% hypothetical examples that appear in the shareholder reports of the other funds. As in the case of the actual expense example, if your account is subject to an IRA fee, the amount of the fee paid through your account would increase the hypothetical expenses you would have paid during the period and decrease the hypothetical ending account value.
Please note that the expenses shown in the table are meant to highlight your ongoing costs only and do not reflect any transactional costs, such as sales charges, redemption fees, brokerage commissions paid on purchases and sales of fund shares. Therefore, the second line under the Fund in the table is useful in comparing ongoing costs only, and will not help you determine the relative total costs of owning different funds. If any of these transaction costs were included, your costs would be higher. The expenses shown in the table do not reflect any fees that may be charged to you by brokers, financial intermediaries or other financial institutions.
The expenses shown in the table do not reflect any expenses from the Fund’s investment in other affiliated investment companies. The average weighted annualized expense ratio of the underlying investment companies at October 31, 2007 was 0.88%.
| | Beginning | | Ending | | Annualized | | Expenses | |
| | Account | | Account | | Expense | | Paid During | |
| | Value | | Value | | Ratio | | Period (a) | |
| | | | | | | | | |
Class A | | | | | | | | | |
Actual | | $ | 1,000.00 | | $ | 1,083.21 | | 0.61 | % | $ | 3.19 | |
Hypothetical (b) | | 1,000.00 | | 1,022.07 | | 0.61 | | 3.10 | |
| | | | | | | | | |
Class B | | | | | | | | | |
Actual | | 1,000.00 | | 1,079.17 | | 1.27 | | 6.64 | |
Hypothetical (b) | | 1,000.00 | | 1,018.75 | | 1.27 | | 6.44 | |
| | | | | | | | | |
Class C | | | | | | | | | |
Actual | | 1,000.00 | | 1,079.96 | | 1.23 | | 6.43 | |
Hypothetical (b) | | 1,000.00 | | 1,018.95 | | 1.23 | | 6.24 | |
| | | | | | | | | |
Class R | | | | | | | | | |
Actual | | 1,000.00 | | 1,082.65 | | 0.65 | | 3.40 | |
Hypothetical (b) | | 1,000.00 | | 1,021.87 | | 0.65 | | 3.30 | |
| | | | | | | | | | | | |
(a) Expenses are calculated using the Fund’s annualized expense ratio (as disclosed in the table), multiplied by the average account value for the period, multiplied by the number of days in the period (184 days), and divided by the number of days in the year (365 days).
(b) 5% return per year before expenses.
GRAPHICAL PRESENTATION OF SCHEDULE OF INVESTMENTS
By Investment Type
At October 31, 2007
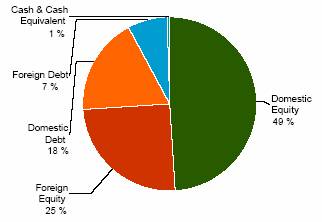
This chart shows the percentage breakdown by investment type of the aggregate portfolio holdings of the underlying affiliated investment companies in which the Fund invests. The security lending collateral in the underlying funds is excluded from this calculation.
11
SCHEDULE OF INVESTMENTS
At October 31, 2007
(all amounts except share amounts in thousands)
| | Shares | | Value | |
INVESTMENT COMPANIES (99.9%)(€) | | | | | |
Bond (19.1%) | | | | | |
TA IDEX JPMorgan International Bond | | 12,615,469 | | $ | 138,770 | |
TA IDEX PIMCO Total Return | | 22,005,384 | | 230,396 | |
TA IDEX Transamerica Convertible Securities | | 4,193,892 | | 64,209 | |
TA IDEX Transamerica Flexible Income | | 7,271,547 | | 66,680 | |
TA IDEX Transamerica High-Yield Bond | | 12,541,638 | | 115,007 | |
TA IDEX Transamerica Short-Term Bond | | 9,961,080 | | 97,818 | |
TA IDEX Van Kampen Emerging Markets Debt | | 5,430,216 | | 60,981 | |
Capital Preservation (0.3%) | | | | | |
TA IDEX Transamerica Money Market | | 11,589,403 | | 11,589 | |
Global/International Stock (13.9%) | | | | | |
TA IDEX AllianceBernstein International Value | | 5,253,278 | | 78,169 | |
TA IDEX Evergreen International Small Cap | | 6,329,860 | | 119,128 | |
TA IDEX Marsico International Growth | | 7,928,945 | | 128,766 | |
TA IDEX Neuberger Berman International | | 8,397,144 | | 113,781 | |
TA IDEX Oppenheimer Developing Markets | | 6,623,725 | | 113,067 | |
TA IDEX Templeton Transamerica Global | | 257,019 | | 9,261 | |
Inflation-Protected Securities (2.9%) | | | | | |
TA IDEX PIMCO Real Return TIPS | | 11,436,666 | | 116,768 | |
Tactical and Specialty (14.6%) | | | | | |
TA IDEX BlackRock Global Allocation | | 7,153,976 | | 94,647 | |
TA IDEX BlackRock Natural Resources W | | 3,735,496 | | 52,708 | |
TA IDEX Clarion Global Real Estate Securities | | 7,351,380 | | 150,556 | |
TA IDEX Evergreen Health Care | | 2,854,022 | | 40,385 | |
TA IDEX Federated Market Opportunity | | 1,662,604 | | 15,512 | |
TA IDEX Loomis Sayles Bond | | 6,903,302 | | 70,345 | |
TA IDEX Mellon Market Neutral Strategy W | | 3,184,073 | | $ | 31,140 | |
TA IDEX Transamerica Science & Technology W | | 7,663,388 | | 43,988 | |
TA IDEX UBS Dynamic Alpha W | | 9,345,287 | | 91,864 | |
U.S. Stock (49.1%) | | | | | |
TA IDEX American Century Large Company Value | | 23,724,923 | | 304,153 | |
TA IDEX Bjurman, Barry Micro Emerging Growth W | | 1,538,892 | | 19,251 | |
TA IDEX BlackRock Large Cap Value | | 20,813,097 | | 272,235 | |
TA IDEX Jennison Growth | | 1,952,125 | | 25,475 | |
TA IDEX JPMorgan Mid Cap Value | | 11,132,353 | | 137,151 | |
TA IDEX Legg Mason Partners Investors Value | | 6,388,053 | | 64,583 | |
TA IDEX Marsico Growth | | 11,074,414 | | 159,472 | |
TA IDEX Oppenheimer Small- & Mid-Cap Value | | 3,080,170 | | 40,597 | |
TA IDEX Third Avenue Value | | 364,897 | | 10,556 | |
TA IDEX Transamerica Equity W | | 34,197,067 | | 418,230 | |
TA IDEX Transamerica Growth Opportunities W | | 8,924,313 | | 103,433 | |
TA IDEX Transamerica Small/Mid Cap Value | | 8,941,781 | | 213,798 | |
TA IDEX UBS Large Cap Value | | 11,178,653 | | 154,154 | |
TA IDEX Van Kampen Mid-Cap Growth | | 2,916,148 | | 41,293 | |
TA IDEX Van Kampen Small Company Growth | | 1,613,011 | | 22,808 | |
Total Investment Companies (cost $3,267,571) # | | | | $ | 4,042,724 | |
NOTES TO SCHEDULE OF INVESTMENTS
€ The Fund invests its assets in the Class I shares of the affiliated Transamerica IDEX Mutual Funds.
# Aggregate cost for federal income tax purposes is $3,272,172. Aggregate gross unrealized appreciation for all securities in which there is an excess of value over tax cost and aggregate gross unrealized depreciation for all securities in which there is an excess of tax cost over value were $776,471 and $5,919, respectively. Net unrealized appreciation for tax purposes is $770,552.
W Non-income producing.
The notes to the financial statements are an integral part of this report.
12
TA IDEX Asset Allocation – Moderate Portfolio
MARKET ENVIRONMENT
Although the twelve-month period through October 31, 2007 witnessed plenty of market volatility, the stock and bond markets notched respectable gains. The Standard and Poor’s 500 Composite Stock Index returned 14.56%, while the broad Dow Jones Wilshire 5000 Total Market Index (“DJ Wilshire 5000”) gained 15.29%. These gains were not without interruption, however. A February tumble in China’s red-hot market upset stocks all around the world that month. And in the summer, gathering concern in the U.S. about the mortgage and housing markets reached alarming levels. The mortgage industry’s loose lending standards of recent years came back to haunt lenders, investors, and borrowers alike in 2007. Lenders responded by tightening lending standards, many borrowers could no longer qualify for loans, and home sales and refinancings slowed. These developments along with soaring oil prices made investors wary of U.S. economy’s direction.
Investors took some solace from strong growth abroad, but U.S. stocks nonetheless fell in June and July. The stocks of financial companies were hardest hit by the mortgage market’s woes. Investors had already been favoring the relative safety of larger stocks by then; and as they migrated toward large caps while also steering away from financials and other economically sensitive stocks, they boosted the prices of large-cap growth stocks in sectors such as technology. Large growth companies were also rewarded for being significant exporters, which was an advantage given weakness in the U.S. dollar. Moreover, many people felt growth stocks, and particularly large-cap growth stocks, were ripe for a rebound after lagging for several years. For the twelve-month period, growth stocks rose more than value stocks across all market-cap ranges; and large caps significantly outpaced small caps (although mid-caps beat both, benefiting from a wave of merger and acquisition activity early in the year).
Foreign stock returns surpassed the U.S. indices, partly because the major foreign currencies strengthened against the dollar. The Morgan Stanley Capital International-EAFE Index rose 25.43% for the period. Emerging markets were especially strong as high oil and commodity prices bolstered developing economies. The Morgan Stanley Capital International Emerging Markets Index returned 68.33%.
Bond returns were mixed early on but improved as nervous investors sought safety from the summer’s shaky stock market. The Federal Reserve Board’s rate cuts in September and October also helped boost bond prices. The Lehman Brothers Aggregate Bond Index (“LBAB”) finished the twelve-month period with a 5.38% return. Riskier high-yield bonds weakened as credit conditions worsened, but already had strong gains from earlier in the period.
PERFORMANCE
For the year ended October 31, 2007, TA IDEX Asset Allocation—Moderate Portfolio Class A returned 14.51%. By comparison, its primary and secondary benchmarks, the DJ Wilshire 5000 and the LBAB, returned 15.29% and 5.38%, respectively. As of October 31, 2007, the Fund’s net expense ratios for Class A, Class B, Class C, and Class R were 0.59%, 1.25%, 1.21%, and 0.72%, respectively.
STRATEGY REVIEW
This fund-of-funds portfolio is structured to provide an approximately 50%, 45%, 5% mix of stocks, bonds and cash, respectively. Its equity exposure is intended to provide broadly diversified coverage of domestic and international equity markets, across a range of market capitalizations and investment styles. The fixed-income portion covers investment-grade and credit-sensitive holdings, as well as international bonds. The portfolio also includes emerging markets, global real estate, and absolute-return strategies.
The portfolio’s 14.51% return for the twelve-month period performed well versus its peer group, the Morningstar Moderate Allocation fund category. The best-performing underlying fund was TA IDEX Oppenheimer Developing Markets as emerging markets soared. The portfolio’s international exposure in general was a positive as the weakening dollar boosted returns for U.S. investors. With growth stocks leading the domestic market, several of the portfolio’s growth funds also posted strong gains - including the two heaviest-weighted growth funds, TA IDEX Marsico Growth and TA IDEX Transamerica Equity. Although value stocks lagged, most of the portfolio’s value funds posted competitive returns relative to their categories, most notably TA IDEX Transamerica Small/Mid Cap Value. The portfolio’s largest bond position, bond fund TA IDEX PIMCO Total Return, performed well relative to the LBAB; and the next-largest bond position, TA IDEX JPMorgan International Bond, posted even better returns on an absolute return basis.
In early 2007, we conducted a broad rebalancing, mainly to correct a small-cap overweight, rebalance the portfolio’s value and growth exposure, and better diversify the bond position. We believe the portfolio’s strong returns for this period demonstrate the effectiveness of maintaining disciplined and balanced market coverage while focusing on identifying excellent managers in each style.
During the year, five new funds were added to the menu available for use in the portfolio: TA IDEX BlackRock Natural Resources, TA IDEX Loomis Sayles Bond, TA IDEX Third Avenue Value, and two absolute-return strategies -TA IDEX Mellon Market Neutral Strategy and TA IDEX UBS Dynamic Alpha. The portfolio currently owns all of these new funds.
Michael Stout, CFA
Jon Hale, Ph.D., CFA
Jeff McConnell, CFA
Maciej Kowara, Ph.D., CFA
Co-Portfolio Managers
Morningstar Associates, LLC
13
(unaudited)
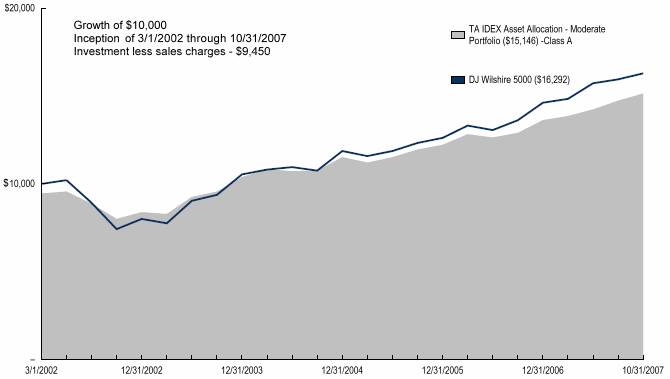
Average Annual Total Return for Periods Ended 10/31/2007
| | | | | | From | | Inception | |
| | 1 Year | | 5 Years | | Inception | | Date | |
| | | | | | | | | |
Class A (NAV) | | 14.51 | % | 12.84 | % | 8.67 | % | 3/1/02 | |
Class A (POP) | | 8.18 | % | 11.57 | % | 7.60 | % | 3/1/02 | |
DJ Wilshire 5000(1) | | 15.29 | % | 15.31 | % | 9.41 | % | 3/1/02 | |
Lehman Brothers Aggregate Bond Index(1) | | 5.38 | % | 4.41 | % | 4.98 | % | 3/1/02 | |
| | | | | | | | | |
Class B (NAV) | | 13.73 | % | 12.13 | % | 7.96 | % | 3/1/02 | |
Class B (POP) | | 8.73 | % | 12.01 | % | 7.96 | % | 3/1/02 | |
| | | | | | | | | |
Class C (NAV) | | 13.86 | % | — | % | 12.24 | % | 11/11/02 | |
Class C (POP) | | 12.86 | % | — | % | 12.24 | % | 11/11/02 | |
| | | | | | | | | |
Class R (NAV) | | 14.31 | % | — | % | 15.37 | % | 6/15/06 | |
NOTES
(1) The Dow Jones Wilshire 5000 Total Market (DJ Wilshire 5000) Index and the Lehman Brothers Aggregate Bond (LBAB) Index are unmanaged indices used as a general measure of market performance. Calculations assume dividends and capital gains are reinvested and do not include any managerial expenses. From inception calculation is based on life of Class A shares. You cannot invest directly in an index.
The performance data presented represents past performance; future results may vary. Performance data does not reflect the deduction of taxes that would be paid on fund distributions nor the redemption of fund shares. Investment return and principal value will fluctuate so that an investor’s shares, when redeemed, may be worth more or less than their original cost.
Current performance may be lower or higher than performance quoted. Please see www.transamericaidex.com for performance data current to the most recent month-end.
Public Offering Price (POP) returns include the reinvestment of dividends and capital gains and reflect the maximum sales charge of 5.5% for A shares or the maximum applicable contingent deferred sales charge (5% in the 1st year, decreasing to 0% after 6 years) for Class B shares and 1% (during the first 12 months) for Class C shares. Shares purchased prior to March 1, 2004 are subject to a maximum applicable contingent deferred sales charge (5% in the 1st year, decreasing to 0% after 7 years) for Class B shares and (2% in the 1st year, decreasing to 0% after 2 years) for Class C shares.
Net Asset Value (NAV) returns include the reinvestment of dividends and capital gains but do not reflect any sales charges.
This material must be preceded or accompanied by a current prospectus, which includes specific contents regarding the investment objectives and policies of this Fund.
14
UNDERSTANDING YOUR FUND’S EXPENSES
(unaudited)
SHAREHOLDER EXPENSES
Fund shareholders may incur two types of costs: (1) transaction costs, including sales charges (loads) on purchases, contingent deferred sales charges on redemptions and redemption fees; and (2) ongoing costs, including management fees, 12b-1 distribution and service fees, and other fund expenses.
The following Example is intended to help you understand your ongoing costs (in dollars and cents) of investing in the Fund and to compare these costs with the ongoing costs of investing in other funds.
The Example is based on an investment of $1,000 invested at May 1, 2007 and held for the entire period until October 31, 2007.
ACTUAL EXPENSES
The first line in the table below provides information about actual account values and actual expenses. You may use the information in this line, together with the amount you invested, to estimate the expenses that you paid over the period. Simply divide your account value by $1,000 (for example, an $8,600 account value divided by $1,000 = 8.6), then multiply the result by the number in the first line of your Fund under the heading entitled “Expenses Paid During Period” to estimate the expenses you paid on your account during this period. If your account is an IRA, your expenses could have included a $15 annual fee. The amount of any fee paid through your account would increase the estimate of expenses you paid during the period and decrease your ending account value.
HYPOTHETICAL EXAMPLE FOR COMPARISON PURPOSES
The second line in the table below provides information about hypothetical account values and hypothetical expenses based on the Fund’s actual expense ratio and an assumed rate of return of 5% per year before expenses, which is not the Fund’s actual return. The hypothetical account values and expenses may not be used to estimate the actual ending account balance or expenses you paid for the period. You may use this information to compare the ongoing costs of investing in your Fund and other funds. To do so, compare this 5% hypothetical example with the 5% hypothetical examples that appear in the shareholder reports of the other funds. As in the case of the actual expense example, if your account is subject to an IRA fee, the amount of the fee paid through your account would increase the hypothetical expenses you would have paid during the period and decrease the hypothetical ending account value.
Please note that the expenses shown in the table are meant to highlight your ongoing costs only and do not reflect any transactional costs, such as sales charges, redemption fees, brokerage commissions paid on purchases and sales of fund shares. Therefore, the second line under the Fund in the table is useful in comparing ongoing costs only, and will not help you determine the relative total costs of owning different funds. If any of these transaction costs were included, your costs would be higher. The expenses shown in the table do not reflect any fees that may be charged to you by brokers, financial intermediaries or other financial institutions.
The expenses shown in the table do not reflect any expenses from the Fund’s investment in other affiliated investment companies. The average weighted annualized expense ratio of the underlying investment companies at October 31, 2007 was 0.85%.
| | Beginning | | Ending | | Annualized | | Expenses | |
| | Account | | Account | | Expense | | Paid During | |
| | Value | | Value | | Ratio | | Period (a) | |
| | | | | | | | | |
Class A | | | | | | | | | |
Actual | | $ | 1,000.00 | | $ | 1,069.53 | | 0.60 | % | $ | 3.12 | |
Hypothetical (b) | | 1,000.00 | | 1,022.12 | | 0.60 | | 3.05 | |
| | | | | | | | | |
Class B | | | | | | | | | |
Actual | | 1,000.00 | | 1,065.88 | | 1.25 | | 6.49 | |
Hypothetical (b) | | 1,000.00 | | 1,018.85 | | 1.25 | | 6.34 | |
| | | | | | | | | |
Class C | | | | | | | | | |
Actual | | 1,000.00 | | 1,066.78 | | 1.21 | | 6.29 | |
Hypothetical (b) | | 1,000.00 | | 1,019.05 | | 1.21 | | 6.14 | |
| | | | | | | | | |
Class R | | | | | | | | | |
Actual | | 1,000.00 | | 1,067.24 | | 0.66 | | 3.43 | |
Hypothetical (b) | | 1,000.00 | | 1,021.82 | | 0.66 | | 3.35 | |
| | | | | | | | | | | | |
(a) Expenses are calculated using the Fund’s annualized expense ratio (as disclosed in the table), multiplied by the average account value for the period, multiplied by the number of days in the period (184 days), and divided by the number of days in the year (365 days).
(b) 5% return per year before expenses.
GRAPHICAL PRESENTATION OF SCHEDULE OF INVESTMENTS
By Investment Type
At October 31, 2007

This chart shows the percentage breakdown by investment type of the aggregate portfolio holdings of the underlying affiliated investment companies in which the Fund invests. The security lending collateral in the underlying funds is excluded from this calculation.
15
SCHEDULE OF INVESTMENTS
At October 31, 2007
(all amounts except share amounts in thousands)
| | Shares | | Value | |
INVESTMENT COMPANIES (99.9%)(€) | | | | | |
Bond (32.2%) | | | | | |
TA IDEX JPMorgan International Bond | | 12,577,899 | | $ | 138,357 | |
TA IDEX PIMCO Total Return | | 20,126,969 | | 210,729 | |
TA IDEX Transamerica Convertible Securities | | 3,920,271 | | 60,019 | |
TA IDEX Transamerica Flexible Income | | 7,521,616 | | 68,973 | |
TA IDEX Transamerica High-Yield Bond | | 10,533,210 | | 96,590 | |
TA IDEX Transamerica Short-Term Bond | | 8,664,061 | | 85,081 | |
TA IDEX Van Kampen Emerging Markets Debt | | 3,827,922 | | 42,988 | |
Capital Preservation (0.3%) | | | | | |
TA IDEX Transamerica Money Market | | 5,635,044 | | 5,635 | |
Global/International Stock (10.0%) | | | | | |
TA IDEX AllianceBernstein International Value | | 2,371,881 | | 35,294 | |
TA IDEX Evergreen International Small Cap | | 1,962,010 | | 36,925 | |
TA IDEX Marsico International Growth | | 2,349,827 | | 38,161 | |
TA IDEX Neuberger Berman International | | 2,540,361 | | 34,422 | |
TA IDEX Oppenheimer Developing Markets | | 2,743,785 | | 46,836 | |
TA IDEX Templeton Transamerica Global | | 716,132 | | 25,802 | |
Inflation-Protected Securities (5.2%) | | | | | |
TA IDEX PIMCO Real Return TIPS | | 11,137,419 | | 113,713 | |
Tactical and Specialty (15.3%) | | | | | |
TA IDEX BlackRock Global Allocation | | 3,266,469 | | 43,215 | |
TA IDEX BlackRock Natural Resources W | | 1,311,629 | | 18,507 | |
TA IDEX Clarion Global Real Estate Securities | | 3,057,846 | | 62,625 | |
TA IDEX Evergreen Health Care | | 1,917,362 | | 27,131 | |
TA IDEX Federated Market Opportunity | | 1,508,322 | | 14,072 | |
TA IDEX Loomis Sayles Bond | | 7,680,364 | | 78,263 | |
TA IDEX Mellon Market Neutral Strategy W | | 2,771,058 | | 27,101 | |
TA IDEX Transamerica Science & Technology W | | 3,057,294 | | 17,549 | |
TA IDEX UBS Dynamic Alpha W | | 4,680,687 | | 46,011 | |
U.S. Stock (36.9%) | | | | | |
TA IDEX American Century Large Value | | 9,834,154 | | $ | 126,074 | |
TA IDEX Bjurman, Barry Micro Emerging Growth W | | 435,245 | | 5,445 | |
TA IDEX BlackRock Large Cap Value | | 6,640,275 | | 86,855 | |
TA IDEX Jennison Growth | | 505,828 | | 6,601 | |
TA IDEX JPMorgan Mid Cap Value | | 3,363,049 | | 41,433 | |
TA IDEX Legg Mason Partners Investors Value | | 14,157 | | 143 | |
TA IDEX Marsico Growth | | 6,750,730 | | 97,211 | |
TA IDEX Oppenheimer Small- & Mid- Cap Value | | 1,898,712 | | 25,025 | |
TA IDEX Third Avenue Value | | 60,518 | | 1,751 | |
TA IDEX Transamerica Equity W | | 12,719,384 | | 155,558 | |
TA IDEX Transamerica Growth Opportunities W | | 3,229,188 | | 37,426 | |
TA IDEX Transamerica Small/Mid Cap Value | | 3,562,305 | | 85,175 | |
TA IDEX UBS Large Cap Value | | 7,791,601 | | 107,446 | |
TA IDEX Van Kampen Mid-Cap Growth | | 505,739 | | 7,161 | |
TA IDEX Van Kampen Small Company Growth | | 1,630,718 | | 23,058 | |
Total Investment Companies (cost $1,820,820) # | | | | $ | 2,180,361 | |
NOTES TO SCHEDULE OF INVESTMENTS
€ | | The Fund invests its assets in the Class I shares of the affiliated Transamerica IDEX Mutual Funds. |
# | | Aggregate cost for federal income tax purposes is $1,821,909. Aggregate gross unrealized appreciation for all securities in which there is an excess of value over tax cost and aggregate gross unrealized depreciation for all securities in which there is an excess of tax cost over value were $364,959 and $6,507, respectively. Net unrealized appreciation for tax purposes is $358,452. |
W | | Non-income producing. |
The notes to financial statements are an integral part of this report
16
TA IDEX Multi-Manager Alternative Strategies Fund
MARKET ENVIRONMENT
Although the twelve-month period through October 31, 2007 witnessed plenty of market volatility, the stock and bond markets notched respectable gains. The Standard and Poor’s 500 Composite Stock Index returned 14.56%, while the broad Dow Jones Wilshire 5000 Total Market Index gained 15.29%. These gains were not without interruption, however. A February tumble in China’s red-hot market upset stocks all around the world that month. And the summer brought troubles in the U.S. mortgage and housing markets. These developments along with soaring oil prices made investors wary of U.S. economy’s direction.
The stocks of financial companies were hit hard by the mortgage market’s woes. Investors had already been favoring the relative safety of larger stocks by then; and as they migrated toward large caps while also steering away from financials and other economically sensitive stocks, they boosted the prices of large-cap growth stocks in sectors such as technology. Moreover, many people felt growth stocks, and particularly large-cap growth stocks, were ripe for a rebound after lagging for several years. For the twelve-month period, growth stocks rose more than value stocks across all market-cap ranges.
Foreign stock returns surpassed the U.S. indices, partly because the major foreign currencies strengthened against the dollar. The Morgan Stanley Capital International- EAFE Index rose 25.43% for the period. Emerging markets were especially strong as high oil and commodity prices bolstered developing economies. The Morgan Stanley Capital International Emerging Markets Index returned 68.33%.
Bond returns were mixed early on but improved as nervous investors sought safety from the summer’s shaky stock market. The Federal Reserve Board’s rate cuts in September and October also helped boost bond prices. The Lehman Brothers Aggregate Bond Index finished the twelve-month period with a 5.38% return. Riskier high-yield bonds weakened as credit conditions worsened, but already had strong gains from earlier in the period.
PERFORMANCE
For the period from inception, December 28, 2006 to October 31, 2007, TA IDEX Multi-Manager Alternative Strategies Fund, Class A returned 7.80%. By comparison its benchmark, the Merrill Lynch 3-Month Treasury Bill + 3% Wrap, returned 6.94%. As of October 31, 2007, the Fund’s net expense ratios for Class A and Class C were 0.90% and 1.55%, respectively.
STRATEGY REVIEW
The portfolio’s targeted return is between the equity markets and the bond markets while its target volatility is closer to that of the bond market. Thus far it has met both goals;-since inception, the volatility of its daily returns was roughly 35% that of the stock market’s.
Morningstar, Inc. categorizes the portfolio as a World Allocation portfolio. This categorization is something of a compromise, because the portfolio’s strategy is unique enough that it does not fit well into any existing category. Since the average World Allocation portfolio has 60% of its assets in stocks, and equities have performed well so far in 2007, our portfolio’s return ranking looks poor compared with that category.
This fund-of-funds portfolio is structured to have roughly 40% exposure to absolute-return-like strategies and 28% exposure to each of the less-correlated equity and fixed income sub-asset classes/strategies, with the remainder in cash. The absolute-return-like portion was by far the weakest performer so far in 2007. Three of the four funds which make up that portion of the portfolio—TA IDEX UBS Dynamic Alpha, TA IDEX Federated Market Opportunity, and TA IDEX Mellon Market Neutral Strategy, each weighed at about 11% of assets—posted slightly negative returns for the period. From among the absolute-return-like strategies, only TA IDEX BlackRock Global Allocation did well in this rising market environment, mainly because it is a more traditional, though tactical, long-only portfolio.
If the absolute-return strategies disappointed so far in 2007, the less-correlated equity and fixed income sleeves made up for it. The rising prices of commodities, oil in particular, propelled TA IDEX BlackRock Natural Resources to a significant gain since its inception of January 3, 2007. The underlying international offerings were also very strong, with TA IDEX Oppenheimer Developing Markets and TA IDEX Evergreen International Small Cap posting significant gains for the ten months ended October 31, 2007; for the same period, TA IDEX Bjurman, Barry Emerging Micro Growth and TA IDEX Clarion Global Real Estate Securities posted a relatively modest return. On the bond side, TA IDEX Loomis Sayles Bond was a little hampered by its below-investment-grade exposure but TA IDEX JPMorgan International Bond benefited from the dollar’s weakness.
Overall, we are pleased with the portfolio’s results in its first ten months of existence, particularly given the sluggish performance of the absolute-return strategies that make up the largest portion of its assets. The portfolio’s solid showing in spite of that obstacle is a demonstration of the benefits of diversifying among a solid group of underlying managers.
Jon Hale, Ph.D., CFA
Michael Stout, CFA
Jeff McConnell, CFA
Maciej Kowara, Ph.D., CFA
Co-Portfolio Managers
Morningstar Associates, LLC
17
(unaudited)
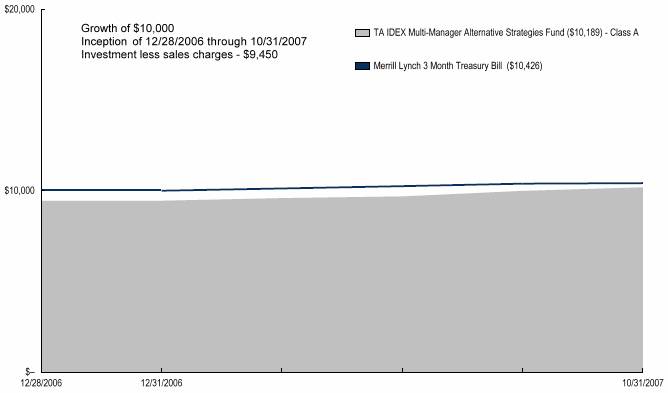
Average Annual Total Return for Period Ended 10/31/2007
| | From Inception | | Inception Date | |
| | | | | |
Class A (NAV) | | 7.80 | % | 12/28/06 | |
Class A (POP) | | 1.89 | % | 12/28/06 | |
Merrill Lynch 3 Month Treasury Bill (1) | | 6.94 | % | 12/28/06 | |
| | | | | |
Class C (NAV) | | 7.20 | % | 12/28/06 | |
Class C (POP) | | 6.20 | % | 12/28/06 | |
NOTES
(1) The Merrill Lynch 3 Month Treasury Bill Index is an unmanaged index used as a general measure of market performance. Calculations assume dividends and capital gains are reinvested and do not include any managerial expenses. From inception, calculation is based on life of Class A shares. You cannot invest directly in an index.
The performance data presented represents past performance; future results may vary. Performance data does not reflect the deduction of taxes that would be paid on fund distributions nor the redemption of fund shares. Investment return and principal value will fluctuate so that an investor’s shares, when redeemed, may be worth more or less than their original cost.
Current performance may be lower or higher than performance quoted. Please see www.transamericaidex.com for performance data current to the most recent month-end.
Public Offering Price (POP) returns include the reinvestment of dividends and capital gains and reflect the maximum sales charge of 5.5% for A shares or the maximum applicable contingent deferred sales charge (5% in the 1st year, decreasing to 0% after 6 years) for Class B shares and 1% (during the first 12 months) for Class C shares. Shares purchased prior to March 1, 2004 are subject to a maximum applicable contingent deferred sales charge (5% in the 1st year, decreasing to 0% after 7 years) for Class B shares and (2% in the 1st year, decreasing to 0% after 2 years) for Class C shares.
Net Asset Value (NAV) returns include the reinvestment of dividends and capital gains but do not reflect any sales charges.
This material must be preceded or accompanied by a current prospectus, which includes specific contents regarding the investment objectives and policies of this Fund.
18
UNDERSTANDING YOUR FUND’S EXPENSES
(unaudited)
SHAREHOLDER EXPENSES
Fund shareholders may incur two types of costs: (1) transaction costs, including sales charges (loads) on purchases, contingent deferred sales charges on redemptions and redemption fees; and (2) ongoing costs, including management fees, 12b-1 distribution and service fees, and other fund expenses.
The following Example is intended to help you understand your ongoing costs (in dollars and cents) of investing in the Fund and to compare these costs with the ongoing costs of investing in other funds.
The Example is based on an investment of $1,000 invested at May 1, 2007 and held for the entire period until October 31, 2007.
ACTUAL EXPENSES
The first line in the table below provides information about actual account values and actual expenses. You may use the information in this line, together with the amount you invested, to estimate the expenses that you paid over the period. Simply divide your account value by $1,000 (for example, an $8,600 account value divided by $1,000 = 8.6), then multiply the result by the number in the first line of your Fund under the heading entitled “Expenses Paid During Period” to estimate the expenses you paid on your account during this period. If your account is an IRA, your expenses could have included a $15 annual fee. The amount of any fee paid through your account would increase the estimate of expenses you paid during the period and decrease your ending account value.
HYPOTHETICAL EXAMPLE FOR COMPARISON PURPOSES
The second line in the table below provides information about hypothetical account values and hypothetical expenses based on the Fund’s actual expense ratio and an assumed rate of return of 5% per year before expenses, which is not the Fund’s actual return. The hypothetical account values and expenses may not be used to estimate the actual ending account balance or expenses you paid for the period. You may use this information to compare the ongoing costs of investing in your Fund and other funds. To do so, compare this 5% hypothetical example with the 5% hypothetical examples that appear in the shareholder reports of the other funds. As in the case of the actual expense example, if your account is subject to an IRA fee, the amount of the fee paid through your account would increase the hypothetical expenses you would have paid during the period and decrease the hypothetical ending account value.
Please note that the expenses shown in the table are meant to highlight your ongoing costs only and do not reflect any transactional costs, such as sales charges, redemption fees, brokerage commissions paid on purchases and sales of fund shares. Therefore, the second line under the Fund in the table is useful in comparing ongoing costs only, and will not help you determine the relative total costs of owning different funds. If any of these transaction costs were included, your costs would be higher. The expenses shown in the table do not reflect any fees that may be charged to you by brokers, financial intermediaries or other financial institutions.
The expenses shown in the table do not reflect any expenses from the Fund’s investment in other affiliated investment companies. The average weighted annualized expense ratio of the underlying investment companies at October 31, 2007 was 0.97%.
| | Beginning | | Ending | | Annualized | | Expenses | |
| | Account | | Account | | Expense | | Paid During | |
| | Value | | Value | | Ratio | | Period (a) | |
| | | | | | | | | |
Class A | | | | | | | | | |
Actual | | $ | 1,000.00 | | $ | 1,049.66 | | 0.90 | % | $ | 4.64 | |
Hypothetical (b) | | 1,000.00 | | 1,020.61 | | 0.90 | | 4.57 | |
| | | | | | | | | |
Class C | | | | | | | | | |
Actual | | 1,000.00 | | 1,045.85 | | 1.55 | | 7.97 | |
Hypothetical (b) | | 1,000.00 | | 1,017.34 | | 1.55 | | 7.86 | |
| | | | | | | | | | | | |
(a) | | Expenses are calculated using the Fund’s annualized expense ratio (as disclosed in the table), multiplied by the average account value for the period, multiplied by the number of days in the period (184 days), and divided by the number of days in the year (365 days). |
| | |
(b) | | 5% return per year before expenses. |
GRAPHICAL PRESENTATION OF SCHEDULE OF INVESTMENTS
By Investment Type
At October 31, 2007
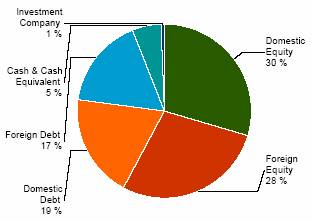
This chart shows the percentage breakdown by investment type of the aggregate portfolio holdings of the underlying affiliated investment companies in which the Fund invests. The security lending collateral in the underlying funds is excluded from this calculation.
19
| | Shares | | Value | |
INVESTMENT COMPANIES (97.8%)(€) | | | | | |
Bond (10.8%) | | | | | |
TA IDEX JPMorgan International Bond | | 864,159 | | $ | 9,506 | |
Capital Preservation (4.7%) | | | | | |
TA IDEX Transamerica Money Market | | 4,150,141 | | 4,150 | |
Global International Stock (7.0%) | | | | | |
TA IDEX Evergreen International Small Cap | | 162,422 | | 3,057 | |
TA IDEX Oppenheimer Developing Markets | | 185,025 | | 3,158 | |
Tactical and Specialty (72.2%) | | | | | |
TA IDEX BlackRock Global Allocation | | 427,458 | | 5,655 | |
TA IDEX BlackRock Natural Resources W | | 625,362 | | 8,824 | |
TA IDEX Clarion Global Real Estate Securities | | 375,062 | | 7,681 | |
TA IDEX Federated Market Opportunity | | 989,897 | | 9,236 | |
TA IDEX Loomis Sayles Bond | | 1,400,843 | | 14,275 | |
TA IDEX Mellon Market Neutral Strategy W | | 932,799 | | 9,123 | |
TA IDEX UBS Dynamic Alpha W | | 906,076 | | 8,907 | |
U.S. Stock (3.1%) | | | | | |
TA IDEX Bjurman, Barry Micro Emerging Growth W | | 216,651 | | 2,710 | |
Total Investment Companies (cost $82,648) # | | | | $ | 86,282 | |
NOTES TO SCHEDULE OF INVESTMENTS
€ | | The Fund invests its assets in the Class I shares of the affiliated Transamerica IDEX Mutual Funds. |
# | | Aggregate cost for federal income tax purposes is $82,651. Aggregate gross unrealized appreciation for all securities in which there is an excess of value over tax cost and aggregate gross unrealized depreciation for all securities in which there is an excess of tax cost over value were $4,042 and $411, respectively. Net unrealized appreciation for tax purposes is $3,631. |
W | | Non-income producing. |
The notes to the financial statements are an integral part of this report.
20
TA IDEX Multi-Manager International Fund
MARKET ENVIRONMENT
Although the twelve-month period through October 31, 2007 witnessed plenty of volatility in international markets, foreign stocks posted strong gains, especially for U.S. investors, whose returns were enhanced because of the weakening dollar. The Morgan Stanley Capital International-World ex-U.S. Index (“MSCIW ex. USA”) returned 26.87% in dollars, but a more modest 15.14% in local currency. Large-cap stocks in developed markets posted slightly higher gains than smaller-cap stocks, reversing a multi-year streak in which smaller-caps had outperformed significantly. The Morgan Stanley Capital International EAFE Small Cap Index rose 22.44% in dollars. Emerging-markets stocks posted stunning gains, with the Morgan Stanley Capital International Emerging Markets Index rising 68.33% in dollars.
The ride was not particularly smooth. After shooting upward in November and December 2006, international stocks took a breather at the beginning of 2007. On February 27, China’s Shanghai Stock Index fell 9%, sending shockwaves through global markets. Those losses did not derail the momentum in foreign markets for long, however, and international markets rebounded until mid-summer, driven by global economic growth, corporate profitability, and record-setting merger-and-acquisition activity. In mid-July, however, gathering concern about the spread of problems in the U.S. mortgage and housing markets sent returns into the red. More risky fare in emerging markets and in the smaller-cap reaches of developed markets fell, as the market essentially re-priced risk. Beginning in mid-August, investor confidence was bolstered by the efforts of the U.S. and European central banks to restore liquidity and international markets rebounded strongly through the end of October.
Growth stocks, which many investors thought were due to rebound after lagging for several years, outperformed value stocks, which were weakened during the liquidity crunch. Asia ex-Japan was the best performing developed-markets region, followed by Europe, the United Kingdom, and Japan. Emerging markets were paced by China and Brazil, where stock markets more than doubled in value during the twelve-month period.
PERFORMANCE
For the year ended October 31, 2007, TA IDEX Multi-Manager International Fund Class A returned 31.30%. By comparison, its benchmark, the MSCIW ex USA, returned 26.87%. As of October 31, 2007, the Fund’s net expense ratios for Class A, Class B, and Class C were 0.65%, 1.43%, and 1.31%, respectively.
STRATEGY REVIEW
This fund-of-funds is structured to provide broad coverage of international equity markets. Its underlying fund holdings cover a range of international investing styles, including large value, large growth, all cap, small cap, emerging markets, and global real estate. The portfolio typically devotes approximately 30% to 35% of assets to international mid-cap and small-cap stocks and about 20% of assets to emerging-markets stocks.
The portfolio’s 31.30% return for the twelve-month period performed well versus its peer group, the Morningstar Foreign Large Blend fund category. The portfolio was helped by its emerging-markets exposure, which was higher than that of the index or the fund peer group. The best-performing underlying fund was TA IDEX Oppenheimer Developing Markets. The large-growth-oriented TA IDEX Marsico International Growth posted a significant gain, partly on the strength of its emerging-markets holdings, and the smaller-cap TA IDEX Evergreen International Small Cap surpassed the small-cap index.
Although it lagged the index, the portfolio’s underlying large-value portfolio, TA IDEX AllianceBernstein International Value had a gain. The all-cap TA IDEX Neuberger Berman International also performed well; held below the index by its housing-related stocks. After an incredible multi-year run, global real estate cooled during the twelve-month period, and TA IDEX Clarion Global Real Estate Securities return detracted from the portfolio’s overall performance.
Jon Hale, Ph.D., CFA
Michael Stout, CFA
Jeff McConnell, CFA
Maciej Kowara, Ph.D., CFA
Co-Portfolio Managers
Morningstar Associates, LLC
21
(unaudited)

Average Annual Total Return for Periods Ended 10/31/2007
| | | | From | | Inception | |
| | 1 Year | | Inception | | Date | |
| | | | | | | |
Class A (NAV) | | 31.30 | % | 22.08 | % | 3/1/06 | |
Class A (POP) | | 24.06 | % | 18.03 | % | 3/1/06 | |
MSCI World ex USA (USD)(1) | | 26.87 | % | 23.64 | % | 3/1/06 | |
| | | | | | | |
Class B (NAV) | | 30.32 | % | 21.26 | % | 3/1/06 | |
Class B (POP) | | 25.32 | % | 19.14 | % | 3/1/06 | |
| | | | | | | |
Class C (NAV) | | 30.45 | % | 21.27 | % | 3/1/06 | |
Class C (POP) | | 29.45 | % | 21.27 | % | 3/1/06 | |
NOTES
(1) The Morgan Stanley Capital International World ex USA (MSCI World ex USA) Index is an unmanaged index used as a general measure of market performance. Calculations assume dividends and capital gains are reinvested and do not include any managerial expenses. From inception calculation is based on life of Class A shares. You cannot invest directly in an index.
The performance data presented represents past performance; future results may vary. Performance data does not reflect the deduction of taxes that would be paid on fund distributions nor the redemption of fund shares. Investment return and principal value will fluctuate so that an investor’s shares, when redeemed, may be worth more or less than their original cost.
Current performance may be lower or higher than performance quoted. Please see www.transamericaidex.com for performance data current to the most recent month-end.
Public Offering Price (POP) returns include the reinvestment of dividends and capital gains and reflect the maximum sales charge of 5.5% for A shares or the maximum applicable contingent deferred sales charge (5% in the 1st year, decreasing to 0% after 6 years) for Class B shares and 1% (during the first 12 months) for Class C shares.
Net Asset Value (NAV) returns include the reinvestment of dividends and capital gains but do not reflect any sales charges.
This material must be preceded or accompanied by a current prospectus, which includes specific contents regarding the investment objectives and policies of this Fund. The ability of the Fund to achieve its objective depends largely on the performance of the underlying funds in which it invests, a pro-rata portion of whose operating expenses the Fund bears. Investments in global/international markets involve risks not associated with U.S. markets, such as currency fluctuations, adverse social and political developments, and the relatively small size and lesser liquidity of the markets. The Fund may utilize strategies and hedging techniques in matched combinations that are designed to neutralize or offset the risks of each strategy employing these techniques separately. Some strategies include long/short and market neutral strategies; bear market strategies; tactical investment strategies (debt and/or equity); foreign currency trading strategies; global real estate securities; commodities and/or natural resources and/or precious metals; and non-traditional investments (such as micro-cap stocks and emerging market stocks). There is no assurance that these strategies will protect against losses. Certain hedging techniques and leverage employed in the management of the Fund may accelerate the velocity of possible losses.
22
UNDERSTANDING YOUR FUND’S EXPENSES
(unaudited)
SHAREHOLDER EXPENSES
Fund shareholders may incur two types of costs: (1) transaction costs, including sales charges (loads) on purchases, contingent deferred sales charges on redemptions and redemption fees; and (2) ongoing costs, including management fees, 12b-1 distribution and service fees, and other fund expenses.
The following Example is intended to help you understand your ongoing costs (in dollars and cents) of investing in the Fund and to compare these costs with the ongoing costs of investing in other funds.
The Example is based on an investment of $1,000 invested at May 1, 2007 and held for the entire period until October 31, 2007.
ACTUAL EXPENSES
The first line in the table below provides information about actual account values and actual expenses. You may use the information in this line, together with the amount you invested, to estimate the expenses that you paid over the period. Simply divide your account value by $1,000 (for example, an $8,600 account value divided by $1,000 = 8.6), then multiply the result by the number in the first line of your Fund under the heading entitled “Expenses Paid During Period” to estimate the expenses you paid on your account during this period. If your account is an IRA, your expenses could have included a $15 annual fee. The amount of any fee paid through your account would increase the estimate of expenses you paid during the period and decrease your ending account value.
HYPOTHETICAL EXAMPLE FOR COMPARISON PURPOSES
The second line in the table below provides information about hypothetical account values and hypothetical expenses based on the Fund’s actual expense ratio and an assumed rate of return of 5% per year before expenses, which is not the Fund’s actual return. The hypothetical account values and expenses may not be used to estimate the actual ending account balance or expenses you paid for the period. You may use this information to compare the ongoing costs of investing in your Fund and other funds. To do so, compare this 5% hypothetical example with the 5% hypothetical examples that appear in the shareholder reports of the other funds. As in the case of the actual expense example, if your account is subject to an IRA fee, the amount of the fee paid through your account would increase the hypothetical expenses you would have paid during the period and decrease the hypothetical ending account value.
Please note that the expenses shown in the table are meant to highlight your ongoing costs only and do not reflect any transactional costs, such as sales charges, redemption fees, brokerage commissions paid on purchases and sales of fund shares. Therefore, the second line under the Fund in the table is useful in comparing ongoing costs only, and will not help you determine the relative total costs of owning different funds. If any of these transaction costs were included, your costs would be higher. The expenses shown in the table do not reflect any fees that may be charged to you by brokers, financial intermediaries or other financial institutions.
The expenses shown in the table do not reflect any expenses from the Fund’s investment in other affiliated investment companies. The average weighted annualized expense ratio of the underlying investment companies at October 31, 2007 was 1.10%.
| | Beginning | | Ending | | Annualized | | Expenses | |
| | Account | | Account | | Expense | | Paid During | |
| | Value | | Value | | Ratio | | Period (a) | |
| | | | | | | | | |
Class A | | | | | | | | | |
Actual | | $ | 1,000.00 | | $ | 1,138.44 | | 0.66 | % | $ | 3.55 | |
Hypothetical (b) | | 1,000.00 | | 1,021.82 | | 0.66 | | 3.35 | |
| | | | | | | | | |
Class B | | | | | | | | | |
Actual | | 1,000.00 | | 1,133.85 | | 1.43 | | 7.67 | |
Hypothetical (b) | | 1,000.00 | | 1,017.95 | | 1.43 | | 7.25 | |
| | | | | | | | | |
Class C | | | | | | | | | |
Actual | | 1,000.00 | | 1,134.83 | | 1.32 | | 7.08 | |
Hypothetical (b) | | 1,000.00 | | 1,018.50 | | 1.32 | | 6.70 | |
| | | | | | | | | | | | |
(a) | | Expenses are calculated using the Fund’s annualized expense ratio (as disclosed in the table), multiplied by the average account value for the period, multiplied by the number of days in the period (184 days), and divided by the number of days in the year (365 days). |
| | |
(b) | | 5% return per year before expenses. |
GRAPHICAL PRESENTATION OF SCHEDULE OF INVESTMENTS
By Investment Type
At October 31, 2007

This chart shows the percentage breakdown by investment type of the aggregate portfolio holdings of the underlying affiliated investment companies in which the Fund invests. The security lending collateral in the underlying funds is excluded from this calculation.
23
TA IDEX Multi-Manager International Fund
SCHEDULE OF INVESTMENTS
At October 31, 2007
(all amounts except share amounts in thousands)
| | Shares | | Value | |
INVESTMENT COMPANIES (99.3%)(€) | | | | | |
Global/International Stock (89.5%) | | | | | |
TA IDEX AllianceBernstein International Value | | 5,568,342 | | $ | 82,857 | |
TA IDEX Evergreen International Small Cap | | 2,011,218 | | 37,851 | |
TA IDEX Marsico International Growth | | 5,863,004 | | 95,215 | |
TA IDEX Neuberger Berman International | | 7,066,304 | | 95,748 | |
TA IDEX Oppenheimer Developing Markets | | 5,800,989 | | 99,023 | |
Tactical and Specialty (9.8%) | | | | | |
TA IDEX BlackRock Global Allocation | | 1,627,194 | | 21,528 | |
TA IDEX Clarion Global Real Estate Securities | | 1,138,270 | | 23,312 | |
| | | | | |
Total Investment Companies (cost $379,522) # | | | | $ | 455,534 | |
NOTES TO SCHEDULE OF INVESTMENTS
€ | | The Fund invests its assets in the Class I shares of the affiliated Transamerica IDEX Mutual Funds. |
# | | Aggregate cost for federal income tax purposes is $379,809. Aggregate gross unrealized appreciation for all securities in which there is an excess of value over tax cost and aggregate gross unrealized depreciation for all securities in which there is an excess of tax cost over value were $75,725 and $0, respectively. Net unrealized appreciation for tax purposes is $75,725. |
The notes to the financial statements are an integral part of this report.
24
STATEMENTS OF ASSETS AND LIABILITIES
At October 31, 2007
(all amounts except per share amounts in thousands)
| | | | | | TA IDEX Asset | | | | TA IDEX Multi- | | | |
| | TA IDEX Asset | | TA IDEX Asset | | Allocation - | | TA IDEX Asset | | Manager | | TA IDEX Multi- | |
| | Allocation - | | Allocation - | | Moderate | | Allocation - | | Alternative | | Manager | |
| | Conservative | | Growth | | Growth | | Moderate | | Strategies | | International | |
| | Portfolio | | Portfolio | | Portfolio | | Portfolio | | Fund | | Fund | |
Assets: | | | | | | | | | | | | | |
Investment in affiliated investment companies, at cost | | $ | 611,460 | | $ | 1,875,025 | | $ | 3,267,571 | | $ | 1,820,820 | | $ | 82,648 | | $ | 379,522 | |
Investment in affiliated investment companies, at value | | 695,251 | | 2,418,607 | | 4,042,724 | | 2,180,361 | | 86,282 | | 455,534 | |
Cash | | — | | — | | — | | — | | — | | 4 | |
Receivables: | | | | | | | | | | | | | |
Investment securities sold | | 157 | | — | | — | | — | | — | | — | |
Shares of beneficial interest sold | | 3,397 | | 9,349 | | 14,535 | | 7,128 | | 2,718 | | 5,326 | |
Interest | | — | | — | | — | | — | | — | | — | |
Dividends | | 17 | | 11 | | 24 | | 12 | | 8 | | — | |
Due from investment advisor | | — | | — | | — | | — | | 29 | | — | |
Other | | 17 | | 32 | | 63 | | 44 | | — | | 1 | |
| | 698,839 | | 2,427,999 | | 4,057,346 | | 2,187,545 | | 89,037 | | 460,865 | |
Liabilities: | | | | | | | | | | | | | |
Investment securities purchased | | — | | 802 | | 1,433 | | 211 | | 659 | | 1,008 | |
Accounts payable and accrued liabilities: | | | | | | | | | | | | | |
Shares of beneficial interest redeemed | | 1,613 | | 3,256 | | 5,010 | | 3,185 | | 121 | | 548 | |
Management and advisory fees | | 62 | | 212 | | 357 | | 193 | | — | | 39 | |
Distribution and service fees | | 478 | | 1,679 | | 2,825 | | 1,550 | | 51 | | 289 | |
Transfer agent fees | | 49 | | 223 | | 308 | | 141 | | 6 | | 39 | |
Administration fees | | 8 | | 26 | | 44 | | 24 | | 1 | | 5 | |
Due to custodian | | 3 | | 11 | | 21 | | 8 | | — | | — | |
Other | | 89 | | 213 | | 351 | | 215 | | 23 | | 36 | |
| | 2,302 | | 6,422 | | 10,349 | | 5,527 | | 861 | | 1,964 | |
Net Assets | | $ | 696,537 | | $ | 2,421,577 | | $ | 4,046,997 | | $ | 2,182,018 | | $ | 88,176 | | $ | 458,901 | |
| | | | | | | | | | | | | |
Net Assets Consist of: | | | | | | | | | | | | | |
Shares of beneficial interest, unlimited shares authorized,no par value | | 598,843 | | 1,810,915 | | 3,160,230 | | 1,745,919 | | 84,471 | | 379,844 | |
Undistributed (accumulated) net investment income (loss) | | 293 | | 1 | | 1,068 | | 12,555 | | 74 | | — | |
Undistributed (accumulated) net realized gain (loss) from investment in affiliated investment companies | | 13,609 | | 67,077 | | 110,542 | | 64,000 | | (2 | ) | 3,045 | |
Net unrealized appreciation (depreciation) on investment in affiliated investment companies | | 83,792 | | 543,584 | | 775,157 | | 359,544 | | 3,633 | | 76,012 | |
Net Assets | | $ | 696,537 | | $ | 2,421,577 | | $ | 4,046,997 | | $ | 2,182,018 | | $ | 88,176 | | $ | 458,901 | |
| | | | | | | | | | | | | |
Net Assets by Class: | | | | | | | | | | | | | |
Class A | | $ | 242,342 | | $ | 781,872 | | $ | 1,295,568 | | $ | 665,013 | | $ | 38,870 | | $ | 178,422 | |
Class B | | 116,569 | | 368,186 | | 651,359 | | 357,175 | | — | | 30,060 | |
Class C | | 336,981 | | 1,270,635 | | 2,098,087 | | 1,159,220 | | 49,306 | | 250,419 | |
Class R | | 645 | | 884 | | 1,983 | | 610 | | — | | — | |
Shares Outstanding: | | | | | | | | | | | | | |
Class A | | 19,552 | | 50,579 | | 88,884 | | 48,571 | | 3,607 | | 13,477 | |
Class B | | 9,431 | | 24,332 | | 45,074 | | 26,287 | | — | | 2,289 | |
Class C | | 27,276 | | 83,982 | | 145,235 | | 85,391 | | 4,599 | | 19,068 | |
Class R | | 52 | | 57 | | 136 | | 45 | | — | | — | |
Net Asset Value Per Share: | | | | | | | | | | | | | |
Class A | | $ | 12.40 | | $ | 15.46 | | $ | 14.58 | | $ | 13.69 | | $ | 10.78 | | $ | 13.24 | |
Class B | | 12.36 | | 15.13 | | 14.45 | | 13.59 | | — | | 13.13 | |
Class C | | 12.35 | | 15.13 | | 14.45 | | 13.58 | | 10.72 | | 13.13 | |
Class R | | 12.47 | | 15.40 | | 14.54 | | 13.65 | | — | | — | |
| | | | | | | | | | | | | |
Maximum Offering Price Per Share: (a) | | | | | | | | | | | | | |
Class A | | $ | 13.12 | | $ | 16.36 | | $ | 15.43 | | $ | 14.49 | | $ | 11.41 | | $ | 14.01 | |
(a) Includes the maximum selling commission (represented as a percentage of offering price) which is reduced on certain levels of sales as set forth in the Prospectus. Net asset value per share for classes B, C, and R shares represents offering price. The redemption price for Classes B and C shares equals net asset value less any applicable contingent deferred sales charge.
The notes to the financial statements are an integral part of this report.
25
STATEMENTS OF OPERATIONS
For the year ended October 31, 2007
(all amounts in thousands)
| | TA IDEX Asset | | | | TA IDEX Asset | | TA IDEX Asset | | TA IDEX Multi- | | TA IDEX Multi- | |
| | Allocation - | | TA IDEX Asset | | Allocation - | | Allocation - | | Manager | | Manager | |
| | Conservative
Portfolio | | Allocation -
Growth Portfolio | | Moderate Growth
Portfolio | | Moderate
Portfolio | | Alternative
Strategies Fund | | International
Fund (a) | |
Investment Income: | | | | | | | | | | | | | |
Dividends from affiliated investment companies | | $ | 22,955 | | $ | 46,077 | | $ | 105,500 | | $ | 66,133 | | $ | 455 | | $ | 9,702 | |
Interest | | 4 | | 8 | | 10 | | 5 | | — | | — | |
| | 22,959 | | 46,085 | | 105,510 | | 66,138 | | 455 | | 9,702 | |
Expenses: | | | | | | | | | | | | | |
Management and advisory fees | | 601 | | 2,026 | | 3,494 | | 1,929 | | 62 | | 285 | |
Distribution and service fees: | | | | | | | | | | | | | |
Class A | | 700 | | 2,212 | | 3,859 | | 1,971 | | 48 | | 392 | |
Class B | | 1,127 | | 3,270 | | 5,993 | | 3,459 | | — | | 193 | |
Class C | | 2,884 | | 10,644 | | 17,905 | | 10,189 | | 170 | | 1,536 | |
Class R | | 1 | | 12 | | 10 | | 4 | | — | | — | |
Transfer agent fees: | | | | | | | | | | | | | |
Class A | | 216 | | 868 | | 1,152 | | 519 | | 14 | | 130 | |
Class B | | 109 | | 478 | | 739 | | 360 | | — | | 46 | |
Class C | | 183 | | 1,057 | | 1,503 | | 676 | | 23 | | 193 | |
Class R | | — | | 1 | | — | | 1 | | — | | — | |
Printing and shareholder reports | | 71 | | 302 | | 442 | | 212 | | 31 | | 49 | |
Custody fees | | 57 | | 81 | | 120 | | 86 | | 28 | | 31 | |
Administration fees | | 75 | | 253 | | 437 | | 241 | | 4 | | 36 | |
Legal fees | | 15 | | 48 | | 83 | | 46 | | 13 | | 6 | |
Audit fees | | 20 | | 20 | | 20 | | 20 | | 19 | | 20 | |
Trustees fees | | 22 | | 73 | | 128 | | 71 | | 1 | | 10 | |
Registration fees | | 80 | | 162 | | 194 | | 129 | | 102 | | 94 | |
Other | | 11 | | 29 | | 51 | | 30 | | 2 | | 4 | |
Total expenses | | 6,172 | | 21,536 | | 36,130 | | 19,943 | | 517 | | 3,025 | |
Less: Reimbursement of class expense: | | | | | | | | | | | | | |
Class A | | — | | — | | — | | — | | (54 | ) | — | |
Class C | | — | | — | | — | | — | | (75 | ) | — | |
Total reimbursed expenses | | — | | — | | — | | — | | (129 | ) | — | |
Net expenses | | 6,172 | | 21,536 | | 36,130 | | 19,943 | | 388 | | 3,025 | |
| | | | | | | | | | | | | |
Net Investment Income | | 16,787 | | 24,549 | | 69,380 | | 46,195 | | 67 | | 6,677 | |
| | | | | | | | | | | | | |
Net Realized and Unrealized Gain (Loss) on Investment in Affiliated Investment Companies: | | | | | | | | | | | | | |
Realized gain (loss) from investment in affiliated investment companies | | 6,209 | | 28,288 | | 49,026 | | 36,330 | | (2 | ) | (212 | ) |
Realized gain distributions from investment in affiliated investment companies | | 7,454 | | 39,811 | | 64,328 | | 28,121 | | — | | 3,396 | |
| | 13,663 | | 68,099 | | 113,354 | | 64,451 | | (2 | ) | 3,184 | |
Increase (decrease) in unrealized appreciation (depreciation) on investment in affiliated investment companies | | 37,555 | | 295,990 | | 370,393 | | 144,762 | | 3,633 | | 69,364 | |
Net Realized and Unrealized Gain on Investment inAffiliated Investment Companies | | 51,218 | | 364,089 | | 483,747 | | 209,213 | | 3,631 | | 72,548 | |
Net Increase In Net Assets Resulting from Operations | | $ | 68,005 | | $ | 388,638 | | $ | 553,127 | | $ | 255,408 | | $ | 3,698 | | $ | 79,225 | |
(a) TA IDEX Multi-Manager Alternative Strategies Fund commenced operations on December 28, 2006.
The notes to the financial statements are an integral part of this report.
26
STATEMENTS OF CHANGES IN NET ASSETS
For the years ended
(all amounts in thousands)
| | TA IDEX Asset Allocation - | | TA IDEX Asset Allocation - | | TA IDEX Asset Allocation - | |
| | Conservative Portfolio | | Growth Portfolio | | Moderate Growth Portfolio | |
| | October 31, | | October 31, | | October 31, | | October 31, | | October 31, | | October 31, | |
| | 2007 | | 2006 | | 2007 | | 2006 | | 2007 | | 2006 | |
Increase (Decrease) in Net Assets From: | | | | | | | | | | | | | |
Operations: | | | | | | | | | | | | | |
Net investment income (loss) | | $ | 16,787 | | $ | 9,649 | | $ | 24,549 | | $ | (2,908 | ) | $ | 69,380 | | $ | 18,034 | |
Net realized gain on investment in affiliated investment companies | | 13,663 | | 14,708 | | 68,099 | | 57,402 | | 113,354 | | 73,212 | |
Change in unrealized appreciation on investment in affiliated investment companies | | 37,555 | | 19,377 | | 295,990 | | 129,165 | | 370,393 | | 218,530 | |
| | 68,005 | | 43,734 | | 388,638 | | 183,659 | | 553,127 | | 309,776 | |
Distributions to Shareholders: | | | | | | | | | | | | | |
From net investment income: | | | | | | | | | | | | | |
Class A | | (6,469 | ) | (4,299 | ) | (11,060 | ) | (2,674 | ) | (24,869 | ) | (9,785 | ) |
Class B | | (3,116 | ) | (2,547 | ) | (4,453 | ) | (676 | ) | (10,915 | ) | (4,719 | ) |
Class C | | (7,803 | ) | (5,527 | ) | (14,821 | ) | (1,942 | ) | (32,530 | ) | (11,391 | ) |
Class R(a) | | (4 | ) | — | | (2 | ) | — | | (1 | ) | — | |
| | (17,392 | ) | (12,373 | ) | (30,336 | ) | (5,292 | ) | (68,315 | ) | (25,895 | ) |
From net realized gains: | | | | | | | | | | | | | |
Class A | | (4,600 | ) | (3,698 | ) | (17,257 | ) | (8,870 | ) | (23,406 | ) | (15,305 | ) |
Class B | | (3,022 | ) | (2,932 | ) | (9,884 | ) | (6,584 | ) | (13,762 | ) | (11,562 | ) |
Class C | | (7,045 | ) | (5,989 | ) | (30,473 | ) | (16,475 | ) | (38,769 | ) | (26,861 | ) |
Class R(a) | | (1 | ) | — | | (3 | ) | — | | (1 | ) | — | |
| | (14,668 | ) | (12,619 | ) | (57,617 | ) | (31,929 | ) | (75,938 | ) | (53,728 | ) |
Capital Share Transactions: | | | | | | | | | | | | | |
Proceeds from shares sold: | | | | | | | | | | | | | |
Class A | | 110,335 | | 67,139 | | 287,509 | | 235,562 | | 425,757 | | 401,400 | |
Class B | | 20,738 | | 20,499 | | 65,898 | | 77,616 | | 101,261 | | 126,518 | |
Class C | | 121,288 | | 104,425 | | 364,585 | | 369,374 | | 590,661 | | 594,117 | |
Class R(a),(b) | | 1,052 | | 50 | | 5,073 | | 79 | | 4,964 | | 50 | |
| | 253,413 | | 192,113 | | 723,065 | | 682,631 | | 1,122,643 | | 1,122,085 | |
Dividends and distributions reinvested: | | | | | | | | | | | | | |
Class A | | 9,577 | | 6,952 | | 25,197 | | 10,031 | | 43,963 | | 22,752 | |
Class B | | 5,017 | | 4,555 | | 12,443 | | 6,220 | | 21,734 | | 14,113 | |
Class C | | 10,160 | | 8,214 | | 33,562 | | 13,231 | | 51,610 | | 27,388 | |
Class R(a) | | 6 | | — | | 5 | | — | | 3 | | — | |
| | 24,760 | | 19,721 | | 71,207 | | 29,482 | | 117,310 | | 64,253 | |
Cost of shares redeemed: | | | | | | | | | | | | | |
Class A | | (56,463 | ) | (44,648 | ) | (132,044 | ) | (73,397 | ) | (224,493 | ) | (139,736 | ) |
Class B | | (24,793 | ) | (24,686 | ) | (43,321 | ) | (34,182 | ) | (84,631 | ) | (64,931 | ) |
Class C | | (69,341 | ) | (72,878 | ) | (161,336 | ) | (109,442 | ) | (273,735 | ) | (197,486 | ) |
Class R(a) | | (493 | ) | — | | (4,750 | ) | — | | (3,399 | ) | — | |
| | (151,090 | ) | (142,212 | ) | (341,451 | ) | (217,021 | ) | (586,258 | ) | (402,153 | ) |
Redemption fees: | | | | | | | | | | | | | |
Class A | | 5 | | 2 | | 6 | | 1 | | 6 | | 8 | |
Class B | | 1 | | — | | 1 | | 1 | | 1 | | — | |
Class C | | 3 | | 2 | | 4 | | 1 | | 3 | | 8 | |
Class R(a) | | — | | — | | — | | — | | — | | — | |
| | 9 | | 4 | | 11 | | 3 | | 10 | | 16 | |
Automatic conversions: | | | | | | | | | | | | | |
Class A | | 1,159 | | 182 | | 2,818 | | 574 | | 4,277 | | 952 | |
Class B | | (1,159 | ) | (182 | ) | (2,818 | ) | (574 | ) | (4,277 | ) | (952 | ) |
| | — | | — | | — | | — | | — | | — | |
| | 127,092 | | 69,626 | | 452,832 | | 495,095 | | 653,705 | | 784,201 | |
Net increase (decrease) in net assets | | 163,037 | | 88,368 | | 753,517 | | 641,533 | | 1,062,579 | | 1,014,354 | |
| | | | | | | | | | | | | |
Net Assets: | | | | | | | | | | | | | |
Beginning of year | | $ | 533,500 | | $ | 445,132 | | $ | 1,668,060 | | $ | 1,026,527 | | $ | 2,984,418 | | $ | 1,970,064 | |
End of year | | $ | 696,537 | | $ | 533,500 | | $ | 2,421,577 | | $ | 1,668,060 | | $ | 4,046,997 | | $ | 2,984,418 | |
Undistributed (Accumulated) Net Investment Income (Loss) | | $ | 293 | | $ | 898 | | $ | 1 | | $ | 1 | | $ | 1,068 | | $ | 2 | |
The notes to the financial statements are an integral part of this report.
27
| | TA IDEX Asset Allocation - | | TA IDEX Asset Allocation - | | TA IDEX Asset Allocation - | |
| | Conservative Portfolio | | Growth Portfolio | | Moderate Growth Portfolio | |
| | October 31, | | October 31, | | October 31, | | October 31, | | October 31, | | October 31, | |
| | 2007 | | 2006 | | 2007 | | 2006 | | 2007 | | 2006 | |
Share Activity: | | | | | | | | | | | | | |
Shares issued: | | | | | | | | | | | | | |
Class A | | 9,383 | | 5,850 | | 20,485 | | 18,382 | | 31,722 | | 32,172 | |
Class B | | 1,766 | | 1,793 | | 4,805 | | 6,166 | | 7,610 | | 10,206 | |
Class C | | 10,331 | | 9,138 | | 26,582 | | 29,329 | | 44,282 | | 47,903 | |
Class R(a),(b) | | 89 | | 4 | | 380 | | 6 | | 381 | | 4 | |
| | 21,569 | | 16,785 | | 52,252 | | 53,883 | | 83,995 | | 90,285 | |
Shares issued-reinvested from distributions: | | | | | | | | | | | | | |
Class A | | 827 | | 621 | | 1,890 | | 826 | | 3,411 | | 1,915 | |
Class B | | 435 | | 408 | | 948 | | 520 | | 1,691 | | 1,191 | |
Class C | | 881 | | 736 | | 2,558 | | 1,105 | | 4,019 | | 2,311 | |
Class R(a) | | — | | — | | — | | — | | — | | — | |
| | 2,143 | | 1,765 | | 5,396 | | 2,451 | | 9,121 | | 5,417 | |
Shares redeemed: | | | | | | | | | | | | | |
Class A | | (4,789 | ) | (3,884 | ) | (9,390 | ) | (5,738 | ) | (16,663 | ) | (11,211 | ) |
Class B | | (2,110 | ) | (2,154 | ) | (3,143 | ) | (2,719 | ) | (6,326 | ) | (5,242 | ) |
Class C | | (5,909 | ) | (6,365 | ) | (11,695 | ) | (8,752 | ) | (20,484 | ) | (15,934 | ) |
Class R(a) | | (41 | ) | — | | (329 | ) | — | | (249 | ) | — | |
| | (12,849 | ) | (12,403 | ) | (24,557 | ) | (17,209 | ) | (43,722 | ) | (32,387 | ) |
Automatic conversions: | | | | | | | | | | | | | |
Class A | | 98 | | 16 | | 198 | | 44 | | 315 | | 76 | |
Class B | | (98 | ) | (16 | ) | (202 | ) | (45 | ) | (317 | ) | (76 | ) |
| | — | | — | | (4 | ) | (1 | ) | (2 | ) | — | |
Net increase (decrease) in shares outstanding: | | | | | | | | | | | | | |
Class A | | 5,519 | | 2,603 | | 13,183 | | 13,514 | | 18,785 | | 22,952 | |
Class B | | (7 | ) | 31 | | 2,408 | | 3,922 | | 2,658 | | 6,079 | |
Class C | | 5,303 | | 3,509 | | 17,445 | | 21,682 | | 27,817 | | 34,280 | |
Class R(a) | | 48 | | 4 | | 51 | | 6 | | 132 | | 4 | |
| | 10,863 | | 6,147 | | 33,087 | | 39,124 | | 49,392 | | 63,315 | |
The notes to the financial statements are an integral part of this report.
28
| | | | | | TA IDEX Multi- | | | | | |
| | | | | | Manager | | | | | |
| | | | | | Alternative | | | | | |
| | TA IDEX Asset Allocation - | | Strategies | | TA IDEX Multi-Manager | |
| | Moderate Portfolio | | Fund(c) | | International Fund(d) | |
| | October 31, | | October 31, | | October 31, | | October 31, | | October 31, | |
| | 2007 | | 2006 | | 2007 | | 2007 | | 2006 | |
Increase (Decrease) in Net Assets From: | | | | | | | | | | | |
Operations: | | | | | | | | | | | |
Net investment income (loss) | | $ | 46,195 | | $ | 22,736 | | $ | 67 | | $ | 6,677 | | $ | (542 | ) |
Net realized gain (loss) on investment in affiliated investment companies | | 64,451 | | 46,259 | | (2 | ) | 3,184 | | (139 | ) |
Change in unrealized appreciation on investment in affiliated investment companies | | 144,762 | | 93,731 | | 3,633 | | 69,364 | | 6,648 | |
| | 255,408 | | 162,726 | | 3,698 | | 79,225 | | 5,967 | |
Distributions to Shareholders: | | | | | | | | | | | |
From net investment income: | | | | | | | | | | | |
Class A | | (14,293 | ) | (8,158 | ) | — | | (3,679 | ) | — | |
Class B | | (7,540 | ) | (5,251 | ) | — | | (592 | ) | — | |
Class C | | (21,651 | ) | (12,581 | ) | — | | (4,542 | ) | — | |
Class R(a) | | (2 | ) | — | | — | | — | | — | |
| | (43,486 | ) | (25,990 | ) | — | | (8,813 | ) | — | |
From net realized gains: | | | | | | | | | | | |
Class A | | (12,968 | ) | (7,262 | ) | — | | — | | — | |
Class B | | (8,962 | ) | (6,368 | ) | — | | — | | — | |
Class C | | (24,569 | ) | (14,834 | ) | — | | — | | — | |
Class R(a) | | (1 | ) | — | | — | | — | | — | |
| | (46,500 | ) | (28,464 | ) | — | | — | | — | |
Capital Share Transactions: | | | | | | | | | | | |
Proceeds from shares sold: | | | | | | | | | | | |
Class A | | 237,736 | | 191,547 | | 40,667 | | 112,597 | | 58,484 | |
Class B | | 47,072 | | 57,008 | | — | | 17,724 | | 9,775 | |
Class C | | 310,667 | | 291,146 | | 49,499 | | 150,866 | | 77,781 | |
Class R(a) (b) | | 1,971 | | 50 | | — | | — | | — | |
| | 597,446 | | 539,751 | | 90,166 | | 281,187 | | 146,040 | |
Dividends and distributions reinvested: | | | | | | | | | | | |
Class A | | 24,128 | | 13,604 | | — | | 2,473 | | — | |
Class B | | 13,765 | | 9,722 | | — | | 488 | | — | |
Class C | | 32,295 | | 19,404 | | — | | 2,851 | | — | |
Class R(a) | | 3 | | — | | — | | — | | — | |
| | 70,191 | | 42,730 | | — | | 5,812 | | — | |
Cost of shares redeemed: | | | | | | | | | | | |
Class A | | (122,784 | ) | (92,905 | ) | (3,466 | ) | (22,998 | ) | (2,871 | ) |
Class B | | (64,262 | ) | (47,850 | ) | — | | (2,241 | ) | (316 | ) |
Class C | | (175,916 | ) | (140,834 | ) | (2,222 | ) | (17,915 | ) | (4,181 | ) |
Class R(a) | | (1,488 | ) | — | | — | | — | | — | |
| | (364,450 | ) | (281,589 | ) | (5,688 | ) | (43,154 | ) | (7,368 | ) |
Redemption fees: | | | | | | | | | | | |
Class A | | 4 | | 4 | | — | | 1 | | — | |
Class B | | 1 | | 1 | | — | | — | | — | |
Class C | | 3 | | 3 | | — | | 2 | | 2 | |
Class R(a) | | — | | — | | — | | — | | — | |
| | 8 | | 8 | | — | | 3 | �� | 2 | |
Automatic conversions: | | | | | | | | | | | |
Class A | | 3,866 | | 674 | | — | | 364 | | 10 | |
Class B | | (3,866 | ) | (674 | ) | — | | (364 | ) | (10 | ) |
| | — | | — | | — | | — | | — | |
| | 303,195 | | 300,900 | | 84,478 | | 243,848 | | 138,674 | |
Net increase (decrease) in net assets | | 468,617 | | 409,172 | | 88,176 | | 314,260 | | 144,641 | |
| | | | | | | | | | | |
Net Assets: | | | | | | | | | | | |
Beginning of year | | $ | 1,713,401 | | $ | 1,304,229 | | $ | — | | $ | 144,641 | | $ | — | |
End of year | | $ | 2,182,018 | | $ | 1,713,401 | | $ | 88,176 | | $ | 458,901 | | $ | 144,641 | |
Undistributed (Accumulated) Net Investment Income (Loss) | | $ | 12,555 | | $ | 9,845 | | $ | 74 | | $ | — | | $ | — | |
The notes to the financial statements are an integral part of this report.
29
| | | | | | TA IDEX Multi- | | | | | |
| | | | | | Manager | | | | | |
| | | | | | Alternative | | | | | |
| | TA IDEX Asset Allocation - | | Strategies | | TA IDEX Multi-Manager | |
| | Moderate Portfolio | | Fund(c) | | International Fund(d) | |
| | October 31, | | October 31, | | October 31, | | October 31, | | October 31, | |
| | 2007 | | 2006 | | 2007 | | 2007 | | 2006 | |
Share Activity: | | | | | | | | | | | |
Shares issued: | | | | | | | | | | | |
Class A | | 18,578 | | 15,775 | | 3,939 | | 9,713 | | 5,756 | |
Class B | | 3,704 | | 4,729 | | — | | 1,538 | | 963 | |
Class C | | 24,461 | | 24,146 | | 4,814 | | 13,097 | | 7,679 | |
Class R(a) (b) | | 157 | | 4 | | — | | — | | — | |
| | 46,900 | | 44,654 | | 8,753 | | 24,348 | | 14,398 | |
Shares issued-reinvested from distributions: | | | | | | | | | | | |
Class A | | 1,955 | | 1,169 | | — | | 231 | | — | |
Class B | | 1,117 | | 837 | | — | | 46 | | — | |
Class C | | 2,623 | | 1,671 | | — | | 267 | | — | |
Class R(a) | | — | | — | | — | | — | | — | |
| | 5,695 | | 3,677 | | — | | 544 | | — | |
Shares redeemed: | | | | | | | | | | | |
Class A | | (9,589 | ) | (7,664 | ) | (332 | ) | (1,970 | ) | (285 | ) |
Class B | | (5,043 | ) | (3,968 | ) | — | | (194 | ) | (32 | ) |
Class C | | (13,843 | ) | (11,684 | ) | (215 | ) | (1,540 | ) | (435 | ) |
Class R(a) | | (116 | ) | — | | — | | — | | — | |
| | (28,591 | ) | (23,316 | ) | (547 | ) | (3,704 | ) | (752 | ) |
Automatic conversions: | | | | | | | | | | | |
Class A | | 301 | | 55 | | — | | 31 | | 1 | |
Class B | | (302 | ) | (56 | ) | — | | (31 | ) | (1 | ) |
| | (1 | ) | (1 | ) | — | | — | | — | |
Net increase (decrease) in shares outstanding: | | | | | | | | | | | |
Class A | | 11,245 | | 9,335 | | 3,607 | | 8,005 | | 5,472 | |
Class B | | (524 | ) | 1,542 | | — | | 1,359 | | 930 | |
Class C | | 13,241 | | 14,133 | | 4,599 | | 11,824 | | 7,244 | |
Class R(a) | | 41 | | 4 | | — | | — | | — | |
| | 24,003 | | 25,014 | | 8,206 | | 21,188 | | 13,646 | |
(a) Class R was offered for investment on June 15, 2006.
(b) Amount represents the initial seeding of the class.
(c) TA IDEX Multi-Manager Alternative Strategies Fund commenced operations on December 28, 2006.
(d) TA IDEX Multi-Manager International Fund commenced operations on March 1, 2006.
The notes to the financial statements are an integral part of this report.
30
FINANCIAL HIGHLIGHTS
For the years ended
| | TA IDEX Asset Allocation - Conservative Portfolio | |
| | Class A | |
| | October 31, | | October 31, | | October 31, | | October 31, | | October 31, | |
| | 2007 | | 2006 | | 2005 | | 2004 | | 2003 | |
| | | | | | | | | | | |
Net Asset Value | | | | | | | | | | | |
Beginning of period | | $ | 11.76 | | $ | 11.35 | | $ | 11.07 | | $ | 10.67 | | $ | 9.22 | |
| | | | | | | | | | | |
Investment Operations(b) | | | | | | | | | | | |
From net investment income (loss) | | 0.38 | | 0.28 | | 0.32 | | 0.17 | | 0.18 | |
From net realized and unrealized gain (loss) on investments | | 0.82 | | 0.80 | | 0.37 | | 0.77 | | 1.47 | |
Total from investment operations | | 1.20 | | 1.08 | | 0.69 | | 0.94 | | 1.65 | |
| | | | | | | | | | | |
Distributions | | | | | | | | | | | |
Net investment income | | (0.24 | ) | (0.35 | ) | (0.22 | ) | (0.51 | ) | (0.20 | ) |
Net realized gains on investments | | (0.32 | ) | (0.32 | ) | (0.19 | ) | (0.03 | ) | — | |
Total distributions | | (0.56 | ) | (0.67 | ) | (0.41 | ) | (0.54 | ) | (0.20 | ) |
| | | | | | | | | | | |
Net Asset Value | | | | | | | | | | | |
End of year | | $ | 12.40 | | $ | 11.76 | | $ | 11.35 | | $ | 11.07 | | $ | 10.67 | |
| | | | | | | | | | | |
Total Return(c) | | 12.06 | % | 9.90 | % | 6.30 | % | 8.97 | % | 18.18 | % |
| | | | | | | | | | | |
Net Assets End of Period | | $ | 242,342 | | $ | 165,071 | | $ | 129,724 | | $ | 99,811 | | $ | 59,250 | |
| | | | | | | | | | | |
Ratio and Supplemental Data | | | | | | | | | | | |
| | | | | | | | | | | |
Expenses to average net assets:(d),(e) | | | | | | | | | | | |
After reimbursement/fee waiver(f) | | 0.62 | % | 0.60 | %(a) | 0.28 | % | 0.29 | %(k) | 0.41 | % |
Before reimbursement/fee waiver(g) | | 0.62 | % | 0.60 | %(a) | 0.28 | % | 0.29 | %(k) | 0.41 | % |
Net investment income (loss), to average net assets(e),(h) | | 3.18 | % | 2.44 | %(l) | 2.85 | %(l) | 1.55 | % | 1.80 | % |
Portfolio turnover rate(i) | | 32 | % | 29 | % | 32 | % | 11 | % | 22 | % |
| | TA IDEX Asset Allocation - Conservative Portfolio | |
| | Class B | |
| | October 31, | | October 31, | | October 31, | | October 31, | | October 31, | |
| | 2007 | | 2006 | | 2005 | | 2004 | | 2003 | |
| | | | | | | | | | | |
Net Asset Value | | | | | | | | | | | |
Beginning of period | | $ | 11.73 | | $ | 11.32 | | $ | 11.05 | | $ | 10.66 | | $ | 9.18 | |
| | | | | | | | | | | |
Investment Operations(b) | | | | | | | | | | | |
From net investment income (loss) | | 0.30 | | 0.20 | | 0.24 | | 0.10 | | 0.11 | |
From net realized and unrealized gain (loss) on investments | | 0.86 | | 0.81 | | 0.38 | | 0.76 | | 1.47 | |
Total from investment operations | | 1.16 | | 1.01 | | 0.62 | | 0.86 | | 1.58 | |
| | | | | | | | | | | |
Distributions | | | | | | | | | | | |
Net investment income | | (0.21 | ) | (0.28 | ) | (0.16 | ) | (0.44 | ) | (0.10 | ) |
Net realized gains on investments | | (0.32 | ) | (0.32 | ) | (0.19 | ) | (0.03 | ) | — | |
Total distributions | | (0.53 | ) | (0.60 | ) | (0.35 | ) | (0.47 | ) | (0.10 | ) |
| | | | | | | | | | | |
Net Asset Value | | | | | | | | | | | |
End of year | | $ | 12.36 | | $ | 11.73 | | $ | 11.32 | | $ | 11.05 | | $ | 10.66 | |
| | | | | | | | | | | |
Total Return(c) | | 11.34 | % | 9.19 | % | 5.65 | % | 8.21 | % | 17.38 | % |
| | | | | | | | | | | |
Net Assets End of Period | | $ | 116,569 | | $ | 110,701 | | $ | 106,449 | | $ | 106,601 | | $ | 85,134 | |
| | | | | | | | | | | |
Ratio and Supplemental Data | | | | | | | | | | | |
| | | | | | | | | | | |
Expenses to average net assets:(d),(e) | | | | | | | | | | | |
After reimbursement/fee waiver(f) | | 1.25 | % | 1.26 | %(a) | 0.93 | % | 0.92 | %(k) | 1.06 | % |
Before reimbursement/fee waiver(g) | | 1.25 | % | 1.26 | %(a) | 0.93 | % | 0.92 | %(k) | 1.06 | % |
Net investment income (loss), to average net assets(e),(h) | | 2.59 | % | 1.78 | %(l) | 2.15 | %(l) | 0.93 | % | 1.15 | % |
Portfolio turnover rate(i) | | 32 | % | 29 | % | 32 | % | 11 | % | 22 | % |
The notes to the financial statements are an integral part of this report.
31
| | TA IDEX Asset Allocation - Conservative Portfolio | |
| | Class C | |
| | October 31, | | October 31, | | October 31, | | October 31, | | October 31, | |
| | 2007 | | 2006 | | 2005 | | 2004 | | 2003 | |
| | | | | | | | | | | |
Net Asset Value | | | | | | | | | | | |
Beginning of period | | $ | 11.73 | | $ | 11.32 | | $ | 11.05 | | $ | 10.66 | | $ | 9.19 | |
| | | | | | | | | | | |
Investment Operations(b) | | | | | | | | | | | |
From net investment income (loss) | | 0.30 | | 0.21 | | 0.25 | | 0.10 | | 0.11 | |
From net realized and unrealized gain (loss) on investments | | 0.86 | | 0.80 | | 0.37 | | 0.76 | | 1.46 | |
Total from investment operations | | 1.16 | | 1.01 | | 0.62 | | 0.86 | | 1.57 | |
| | | | | | | | | | | |
Distributions | | | | | | | | | | | |
Net investment income | | (0.22 | ) | (0.28 | ) | (0.16 | ) | (0.44 | ) | (0.10 | ) |
Net realized gains on investments | | (0.32 | ) | (0.32 | ) | (0.19 | ) | (0.03 | ) | — | |
Total distributions | | (0.54 | ) | (0.60 | ) | (0.35 | ) | (0.47 | ) | (0.10 | ) |
| | | | | | | | | | | |
Net Asset Value | | | | | | | | | | | |
End of year | | $ | 12.35 | | $ | 11.73 | | $ | 11.32 | | $ | 11.05 | | $ | 10.66 | |
| | | | | | | | | | | |
Total Return(c) | | 11.31 | % | 9.25 | % | 5.61 | % | 8.26 | % | 17.25 | % |
| | | | | | | | | | | |
Net Assets End of Period | | $ | 336,981 | | $ | 257,675 | | $ | 208,959 | | $ | 182,112 | | $ | 83,165 | |
| | | | | | | | | | | |
Ratio and Supplemental Data | | | | | | | | | | | |
| | | | | | | | | | | |
Expenses to average net assets:(d),(e) | | | | | | | | | | | |
After reimbursement/fee waiver(f) | | 1.22 | % | 1.23 | %(a) | 0.90 | % | 0.93 | %(k) | 1.06 | % |
Before reimbursement/fee waiver(g) | | 1.22 | % | 1.23 | %(a) | 0.90 | % | 0.93 | %(k) | 1.06 | % |
Net investment income (loss), to average net assets(e),(h) | | 2.60 | % | 1.82 | %(l) | 2.21 | %(l) | 0.89 | % | 1.15 | % |
Portfolio turnover rate(i) | | 32 | % | 29 | % | 32 | % | 11 | % | 22 | % |
| | | | | | | | | | | |
| | TA IDEX Asset Allocation - | | | | | | | |
| | Conservative Portfolio(j) | | | | | | | |
| | Class R | | | | | | | |
| | October 31, | | October 31, | | | | | | | |
| | 2007 | | 2006 | | | | | | | |
| | | | | | | | | | | |
Net Asset Value | | | | | | | | | | | |
Beginning of period | | $ | 11.84 | | $ | 11.30 | | | | | | | |
| | | | | | | | | | | |
Investment Operations(b) | | | | | | | | | | | |
From net investment income (loss) | | 0.33 | | 0.13 | | | | | | | |
From net realized and unrealized gain (loss) on investments | | 0.85 | | 0.47 | | | | | | | |
Total from investment operations | | 1.18 | | 0.60 | | | | | | | |
| | | | | | | | | | | |
Distributions | | | | | | | | | | | |
Net investment income | | (0.23 | ) | (0.06 | ) | | | | | | |
Net realized gains on investments | | (0.32 | ) | — | | | | | | | |
Total distributions | | (0.55 | ) | (0.06 | ) | | | | | | |
| | | | | | | | | | | |
Net Asset Value | | | | | | | | | | | |
End of year | | $ | 12.47 | | $ | 11.84 | | | | | | | |
| | | | | | | | | | | |
Total Return(c) | | 11.89 | % | 5.35 | % | | | | | | |
| | | | | | | | | | | |
Net Assets End of Period | | $ | 645 | | $ | 53 | | | | | | | |
| | | | | | | | | | | |
Ratio and Supplemental Data | | | | | | | | | | | |
| | | | | | | | | | | |
Expenses to average net assets:(d),(e) | | | | | | | | | | | |
After reimbursement/fee waiver(f) | | 0.86 | % | 0.66 | %(a) | | | | | | |
Before reimbursement/fee waiver(g) | | 0.86 | % | 0.66 | %(a) | | | | | | |
Net investment income (loss), to average net assets(e),(h) | | 2.71 | % | 3.03 | % | | | | | | |
Portfolio turnover rate(i) | | 32 | % | 29 | % | | | | | | |
The notes to the financial statements are an integral part of this report.
32
| | TA IDEX Asset Allocation - Growth Portfolio | |
| | Class A | |
| | October 31, | | October 31, | | October 31, | | October 31, | | October 31, | |
| | 2007 | | 2006 | | 2005 | | 2004 | | 2003 | |
| | | | | | | | | | | |
Net Asset Value | | | | | | | | | | | |
Beginning of period | | $ | 13.44 | | $ | 11.99 | | $ | 10.75 | | $ | 9.82 | | $ | 7.95 | |
| | | | | | | | | | | |
Investment Operations(b) | | | | | | | | | | | |
From net investment income (loss) | | 0.23 | | 0.03 | | 0.05 | | (0.02 | ) | (0.03 | ) |
From net realized and unrealized gain (loss) on investments | | 2.53 | | 1.89 | | 1.38 | | 0.95 | | 1.90 | |
Total from investment operations | | 2.76 | | 1.92 | | 1.43 | | 0.93 | | 1.87 | |
| | | | | | | | | | | |
Distributions | | | | | | | | | | | |
Net investment income | | (0.29 | ) | (0.11 | ) | (0.12 | ) | — | | — | |
Net realized gains on investments | | (0.45 | ) | (0.36 | ) | (0.07 | ) | — | | — | |
Total distributions | | (0.74 | ) | (0.47 | ) | (0.19 | ) | — | | — | |
| | | | | | | | | | | |
Net Asset Value | | | | | | | | | | | |
End of year | | $ | 15.46 | | $ | 13.44 | | $ | 11.99 | | $ | 10.75 | | $ | 9.82 | |
| | | | | | | | | | | |
Total Return(c) | | 21.35 | % | 16.38 | % | 13.42 | % | 9.47 | % | 23.52 | % |
| | | | | | | | | | | |
Net Assets End of Period | | $ | 781,872 | | $ | 502,488 | | $ | 286,412 | | $ | 171,708 | | $ | 55,209 | |
| | | | | | | | | | | |
Ratio and Supplemental Data | | | | | | | | | | | |
| | | | | | | | | | | |
Expenses to average net assets:(d),(e) | | | | | | | | | | | |
After reimbursement/fee waiver(f) | | 0.64 | % | 0.65 | %(a) | 0.34 | % | 0.43 | %(k) | 0.45 | % |
Before reimbursement/fee waiver(g) | | 0.64 | % | 0.65 | %(a) | 0.34 | % | 0.43 | %(k) | 0.60 | % |
Net investment income (loss), to average net assets(e),(h) | | 1.62 | % | 0.22 | %(l) | 0.42 | %(l) | (0.22 | )% | (0.30 | )% |
Portfolio turnover rate(i) | | 18 | % | 22 | % | 35 | % | 5 | % | 25 | % |
| | TA IDEX Asset Allocation - Growth Portfolio | |
| | Class B | |
| | October 31, | | October 31, | | October 31, | | October 31, | | October 31, | |
| | 2007 | | 2006 | | 2005 | | 2004 | | 2003 | |
| | | | | | | | | | | |
Net Asset Value | | | | | | | | | | | |
Beginning of period | | $ | 13.17 | | $ | 11.77 | | $ | 10.57 | | $ | 9.71 | | $ | 7.91 | |
| | | | | | | | | | | |
Investment Operations(b) | | | | | | | | | | | |
From net investment income (loss) | | 0.14 | | (0.05 | ) | (0.03 | ) | (0.09 | ) | (0.08 | ) |
From net realized and unrealized gain (loss) on investments | | 2.47 | | 1.85 | | 1.36 | | 0.95 | | 1.88 | |
Total from investment operations | | 2.61 | | 1.80 | | 1.33 | | 0.86 | | 1.80 | |
| | | | | | | | | | | |
Distributions | | | | | | | | | | | |
Net investment income | | (0.20 | ) | (0.04 | ) | (0.06 | ) | — | | — | |
Net realized gains on investments | | (0.45 | ) | (0.36 | ) | (0.07 | ) | — | | — | |
Total distributions | | (0.65 | ) | (0.40 | ) | (0.13 | ) | — | | — | |
| | | | | | | | | | | |
Net Asset Value | | | | | | | | | | | |
End of year | | $ | 15.13 | | $ | 13.17 | | $ | 11.77 | | $ | 10.57 | | $ | 9.71 | |
| | | | | | | | | | | |
Total Return(c) | | 20.54 | % | 15.57 | % | 12.55 | % | 8.96 | % | 22.76 | % |
| | | | | | | | | | | |
Net Assets End of Period | | $ | 368,186 | | $ | 288,719 | | $ | 211,904 | | $ | 160,959 | | $ | 82,318 | |
| | | | | | | | | | | |
Ratio and Supplemental Data | | | | | | | | | | | |
| | | | | | | | | | | |
Expenses to average net assets:(d),(e) | | | | | | | | | | | |
After reimbursement/fee waiver(f) | | 1.29 | % | 1.31 | %(a) | 0.99 | % | 1.05 | %(k) | 1.10 | % |
Before reimbursement/fee waiver(g) | | 1.29 | % | 1.31 | %(a) | 0.99 | % | 1.05 | %(k) | 1.25 | % |
Net investment income (loss), to average net assets(e),(h) | | 1.02 | % | (0.42 | )%(l) | (0.24 | )%(l) | (0.82 | )% | (0.95 | )% |
Portfolio turnover rate(i) | | 18 | % | 22 | % | 35 | % | 5 | % | 25 | % |
The notes to the financial statements are an integral part of this report.
33
| | TA IDEX Asset Allocation - Growth Portfolio | |
| | Class C | |
| | October 31, | | October 31, | | October 31, | | October 31, | | October 31, | |
| | 2007 | | 2006 | | 2005 | | 2004 | | 2003 | |
| | | | | | | | | | | |
Net Asset Value | | | | | | | | | | | |
Beginning of period | | $ | 13.18 | | $ | 11.78 | | $ | 10.57 | | $ | 9.71 | | $ | 7.86 | |
| | | | | | | | | | | |
Investment Operations(b) | | | | | | | | | | | |
From net investment income (loss) | | 0.14 | | (0.05 | ) | (0.02 | ) | (0.08 | ) | (0.08 | ) |
From net realized and unrealized gain (loss) on investments | | 2.48 | | 1.85 | | 1.37 | | 0.94 | | 1.93 | |
Total from investment operations | | 2.62 | | 1.80 | | 1.35 | | 0.86 | | 1.85 | |
| | | | | | | | | | | |
Distributions | | | | | | | | | | | |
Net investment income | | (0.22 | ) | (0.04 | ) | (0.07 | ) | — | | — | |
Net realized gains on investments | | (0.45 | ) | (0.36 | ) | (0.07 | ) | — | | — | |
Total distributions | | (0.67 | ) | (0.40 | ) | (0.14 | ) | — | | — | |
| | | | | | | | | | | |
Net Asset Value | | | | | | | | | | | |
End of year | | $ | 15.13 | | $ | 13.18 | | $ | 11.78 | | $ | 10.57 | | $ | 9.71 | |
| | | | | | | | | | | |
Total Return(c) | | 20.60 | % | 15.61 | % | 12.82 | % | 8.86 | % | 23.54 | % |
| | | | | | | | | | | |
Net Assets End of Period | | $ | 1,270,635 | | $ | 876,768 | | $ | 528,211 | | $ | 356,543 | | $ | 116,956 | |
| | | | | | | | | | | |
Ratio and Supplemental Data | | | | | | | | | | | |
| | | | | | | | | | | |
Expenses to average net assets:(d),(e) | | | | | | | | | | | |
After reimbursement/fee waiver(f) | | 1.25 | % | 1.26 | %(a) | 0.93 | % | 0.99 | %(k) | 1.10 | % |
Before reimbursement/fee waiver(g) | | 1.25 | % | 1.26 | %(a) | 0.93 | % | 0.99 | %(k) | 1.25 | % |
Net investment income (loss), to average net assets(e),(h) | | 1.03 | % | (0.38 | )%(l) | (0.17 | )%(l) | (0.78 | )% | (0.95 | )% |
Portfolio turnover rate(i) | | 18 | % | 22 | % | 35 | % | 5 | % | 25 | % |
| | | | | | | | | | | |
| | TA IDEX Asset Allocation - | | | | | | | |
| | Growth Portfolio(j) | | | | | | | |
| | Class R | | | | | | | |
| | October 31, | | October 31, | | | | | | | |
| | 2007 | | 2006 | | | | | | | |
| | | | | | | | | | | |
Net Asset Value | | | | | | | | | | | |
Beginning of period | | $ | 13.43 | | $ | 12.36 | | | | | | | |
| | | | | | | | | | | |
Investment Operations(b) | | | | | | | | | | | |
From net investment income (loss) | | 0.13 | | 0.05 | | | | | | | |
From net realized and unrealized gain (loss) on investments | | 2.60 | | 1.02 | | | | | | | |
Total from investment operations | | 2.73 | | 1.07 | | | | | | | |
| | | | | | | | | | | |
Distributions | | | | | | | | | | | |
Net investment income | | (0.31 | ) | — | | | | | | | |
Net realized gains on investments | | (0.45 | ) | — | | | | | | | |
Total distributions | | (0.76 | ) | — | | | | | | | |
| | | | | | | | | | | |
Net Asset Value | | | | | | | | | | | |
End of year | | $ | 15.40 | | $ | 13.43 | | | | | | | |
| | | | | | | | | | | |
Total Return(c) | | 21.20 | % | 8.66 | % | | | | | | |
| | | | | | | | | | | |
Net Assets End of Period | | $ | 884 | | $ | 85 | | | | | | | |
| | | | | | | | | | | |
Ratio and Supplemental Data | | | | | | | | | | | |
| | | | | | | | | | | |
Expenses to average net assets:(d),(e) | | | | | | | | | | | |
After reimbursement/fee waiver(f) | | 0.68 | % | 0.67 | %(a) | | | | | | |
Before reimbursement/fee waiver(g) | | 0.68 | % | 0.67 | %(a) | | | | | | |
Net investment income (loss), to average net assets(e),(h) | | 0.94 | % | 1.08 | % | | | | | | |
Portfolio turnover rate(i) | | 18 | % | 22 | % | | | | | | |
| | | | | | | | | | | | | | | | | | |
The notes to the financial statements are an integral part of this report.
34
| | TA IDEX Asset Allocation - Moderate Growth Portfolio | |
| | Class A | |
| | October 31, | | October 31, | | October 31, | | October 31, | | October 31, | |
| | 2007 | | 2006 | | 2005 | | 2004 | | 2003 | |
| | | | | | | | | | | |
Net Asset Value | | | | | | | | | | | |
Beginning of period | | $ | 13.05 | | $ | 11.88 | | $ | 10.97 | | $ | 10.13 | | $ | 8.37 | |
| | | | | | | | | | | |
Investment Operations(b) | | | | | | | | | | | |
From net investment income (loss) | | 0.33 | | 0.15 | | 0.16 | | 0.05 | | 0.04 | |
From net realized and unrealized gain (loss) on investments | | 1.86 | | 1.53 | | 1.00 | | 0.87 | | 1.77 | |
Total from investment operations | | 2.19 | | 1.68 | | 1.16 | | 0.92 | | 1.81 | |
| | | | | | | | | | | |
Distributions | | | | | | | | | | | |
Net investment income | | (0.34 | ) | (0.20 | ) | (0.20 | ) | (0.08 | ) | (0.05 | ) |
Net realized gains on investments | | (0.32 | ) | (0.31 | ) | (0.05 | ) | — | | — | |
Total distributions | | (0.66 | ) | (0.51 | ) | (0.25 | ) | (0.08 | ) | (0.05 | ) |
| | | | | | | | | | | |
Net Asset Value | | | | | | | | | | | |
End of year | | $ | 14.58 | | $ | 13.05 | | $ | 11.88 | | $ | 10.97 | | $ | 10.13 | |
| | | | | | | | | | | |
Total Return(c) | | 17.48 | % | 14.59 | % | 10.69 | % | 9.09 | % | 21.79 | % |
| | | | | | | | | | | |
Net Assets End of Period | | $ | 1,295,568 | | $ | 914,835 | | $ | 560,231 | | $ | 352,852 | | $ | 136,295 | |
| | | | | | | | | | | |
Ratio and Supplemental Data | | | | | | | | | | | |
| | | | | | | | | | | |
Expenses to average net assets:(d),(e) | | | | | | | | | | | |
After reimbursement/fee waiver(f) | | 0.60 | % | 0.61 | %(a) | 0.28 | % | 0.32 | %(k) | 0.44 | % |
Before reimbursement/fee waiver(g) | | 0.60 | % | 0.61 | %(a) | 0.28 | % | 0.32 | %(k) | 0.44 | % |
Net investment income (loss), to average net assets(e),(h) | | 2.42 | % | 1.17 | %(l) | 1.37 | %(l) | 0.45 | % | 0.48 | % |
Portfolio turnover rate(i) | | 19 | % | 21 | % | 26 | % | 3 | % | 15 | % |
| | TA IDEX Asset Allocation - Moderate Growth Portfolio | |
| | Class B | |
| | October 31, | | October 31, | | October 31, | | October 31, | | October 31, | |
| | 2007 | | 2006 | | 2005 | | 2004 | | 2003 | |
| | | | | | | | | | | |
Net Asset Value | | | | | | | | | | | |
Beginning of period | | $ | 12.94 | | $ | 11.80 | | $ | 10.90 | | $ | 10.09 | | $ | 8.33 | |
| | | | | | | | | | | |
Investment Operations(b) | | | | | | | | | | | |
From net investment income (loss) | | 0.24 | | 0.06 | | 0.08 | | (0.02 | ) | (0.02 | ) |
From net realized and unrealized gain (loss) on investments | | 1.85 | | 1.52 | | 1.01 | | 0.85 | | 1.78 | |
Total from investment operations | | 2.09 | | 1.58 | | 1.09 | | 0.83 | | 1.76 | |
| | | | | | | | | | | |
Distributions | | | | | | | | | | | |
Net investment income | | (0.26 | ) | (0.13 | ) | (0.14 | ) | (0.02 | ) | — | |
Net realized gains on investments | | (0.32 | ) | (0.31 | ) | (0.05 | ) | — | | — | |
Total distributions | | (0.58 | ) | (0.44 | ) | (0.19 | ) | (0.02 | ) | — | |
| | | | | | | | | | | |
Net Asset Value | | | | | | | | | | | |
End of year | | $ | 14.45 | | $ | 12.94 | | $ | 11.80 | | $ | 10.90 | | $ | 10.09 | |
| | | | | | | | | | | |
Total Return(c) | | 16.69 | % | 13.74 | % | 10.05 | % | 8.25 | % | 21.15 | % |
| | | | | | | | | | | |
Net Assets End of Period | | $ | 651,359 | | $ | 549,040 | | $ | 428,677 | | $ | 333,533 | | $ | 190,621 | |
| | | | | | | | | | | |
Ratio and Supplemental Data | | | | | | | | | | | |
| | | | | | | | | | | |
Expenses to average net assets:(d),(e) | | | | | | | | | | | |
After reimbursement/fee waiver(f) | | 1.27 | % | 1.28 | %(a) | 0.95 | % | 0.97 | %(k) | 1.09 | % |
Before reimbursement/fee waiver(g) | | 1.27 | % | 1.28 | %(a) | 0.95 | % | 0.97 | %(k) | 1.09 | % |
Net investment income (loss), to average net assets(e),(h) | | 1.78 | % | 0.51 | %(l) | 0.68 | %(l) | (0.19 | )% | (0.17 | )% |
Portfolio turnover rate(i) | | 19 | % | 21 | % | 26 | % | 3 | % | 15 | % |
The notes to the financial statements are an integral part of this report.
35
| | TA IDEX Asset Allocation - Moderate Growth Portfolio | |
| | Class C | |
| | October 31, | | October 31, | | October 31, | | October 31, | | October 31, | |
| | 2007 | | 2006 | | 2005 | | 2004 | | 2003 | |
| | | | | | | | | | | |
Net Asset Value | | | | | | | | | | | |
Beginning of period | | $ | 12.95 | | $ | 11.80 | | $ | 10.91 | | $ | 10.09 | | $ | 8.31 | |
| | | | | | | | | | | |
Investment Operations(b) | | | | | | | | | | | |
From net investment income (loss) | | 0.24 | | 0.07 | | 0.08 | | (0.02 | ) | (0.02 | ) |
From net realized and unrealized gain (loss) on investments | | 1.85 | | 1.52 | | 1.01 | | 0.86 | | 1.80 | |
Total from investment operations | | 2.09 | | 1.59 | | 1.09 | | 0.84 | | 1.78 | |
| | | | | | | | | | | |
Distributions | | | | | | | | | | | |
Net investment income | | (0.27 | ) | (0.13 | ) | (0.15 | ) | (0.02 | ) | — | |
Net realized gains on investments | | (0.32 | ) | (0.31 | ) | (0.05 | ) | — | | — | |
Total distributions | | (0.59 | ) | (0.44 | ) | (0.20 | ) | (0.02 | ) | — | |
| | | | | | | | | | | |
Net Asset Value | | | | | | | | | | | |
End of year | | $ | 14.45 | | $ | 12.95 | | $ | 11.80 | | $ | 10.91 | | $ | 10.09 | |
| | | | | | | | | | | |
Total Return(c) | | 16.74 | % | 13.87 | % | 10.02 | % | 8.35 | % | 21.44 | % |
| | | | | | | | | | | |
Net Assets End of Period | | $ | 2,098,087 | | $ | 1,520,489 | | $ | 981,156 | | $ | 675,562 | | $ | 239,043 | |
| | | | | | | | | | | |
Ratio and Supplemental Data | | | | | | | | | | | |
| | | | | | | | | | | |
Expenses to average net assets:(d),(e) | | | | | | | | | | | |
After reimbursement/fee waiver(f) | | 1.23 | % | 1.24 | %(a) | 0.90 | % | 0.92 | %(k) | 1.09 | % |
Before reimbursement/fee waiver(g) | | 1.23 | % | 1.24 | %(a) | 0.90 | % | 0.92 | %(k) | 1.09 | % |
Net investment income (loss), to average net assets(e),(h) | | 1.79 | % | 0.55 | %(l) | 0.74 | %(l) | (0.15 | )% | (0.17 | )% |
Portfolio turnover rate(i) | | 19 | % | 21 | % | 26 | % | 3 | % | 15 | % |
| | TA IDEX Asset Allocation - | |
| | Moderate Growth Portfolio(j) | |
| | Class R | |
| | October 31, | | October 31, | |
| | 2007 | | 2006 | |
| | | | | |
Net Asset Value | | | | | |
Beginning of period | | $ | 13.05 | | $ | 12.13 | |
| | | | | |
Investment Operations(b) | | | | | |
From net investment income (loss) | | 0.24 | | 0.10 | |
From net realized and unrealized gain (loss) on investments | | 1.93 | | 0.82 | |
Total from investment operations | | 2.17 | | 0.92 | |
| | | | | |
Distributions | | | | | |
Net investment income | | (0.36 | ) | — | |
Net realized gains on investments | | (0.32 | ) | — | |
Total distributions | | (0.68 | ) | — | |
| | | | | |
Net Asset Value | | | | | |
End of year | | $ | 14.54 | | $ | 13.05 | |
| | | | | |
Total Return(c) | | 17.31 | % | 7.58 | % |
| | | | | |
Net Assets End of Period | | $ | 1,983 | | $ | 54 | |
| | | | | |
Ratio and Supplemental Data | | | | | |
| | | | | |
Expenses to average net assets:(d),(e) | | | | | |
After reimbursement/fee waiver(f) | | 0.67 | % | 0.66 | %(a) |
Before reimbursement/fee waiver(g) | | 0.67 | % | 0.66 | %(a) |
Net investment income (loss), to average net assets(e),(h) | | 1.80 | % | 2.08 | % |
Portfolio turnover rate(i) | | 19 | % | 21 | % |
The notes to the financial statements are an integral part of this report.
36
| | TA IDEX Asset Allocation - Moderate Portfolio | |
| | Class A | |
| | October 31, | | October 31, | | October 31, | | October 31, | | October 31, | |
| | 2007 | | 2006 | | 2005 | | 2004 | | 2003 | |
| | | | | | | | | | | |
Net Asset Value | | | | | | | | | | | |
Beginning of period | | $ | 12.64 | | $ | 11.78 | | $ | 11.23 | | $ | 10.42 | | $ | 8.76 | |
| | | | | | | | | | | |
Investment Operations(b) | | | | | | | | | | | |
From net investment income (loss) | | 0.36 | | 0.24 | | 0.27 | | 0.12 | | 0.12 | |
From net realized and unrealized gain (loss) on investments | | 1.40 | | 1.15 | | 0.67 | | 0.84 | | 1.62 | |
Total from investment operations | | 1.76 | | 1.39 | | 0.94 | | 0.96 | | 1.74 | |
| | | | | | | | | | | |
Distributions | | | | | | | | | | | |
Net investment income | | (0.37 | ) | (0.28 | ) | (0.33 | ) | (0.15 | ) | (0.08 | ) |
Net realized gains on investments | | (0.34 | ) | (0.25 | ) | (0.06 | ) | — | | — | |
Total distributions | | (0.71 | ) | (0.53 | ) | (0.39 | ) | (0.15 | ) | (0.08 | ) |
| | | | | | | | | | | |
Net Asset Value | | | | | | | | | | | |
End of year | | $ | 13.69 | | $ | 12.64 | | $ | 11.78 | | $ | 11.23 | | $ | 10.42 | |
| | | | | | | | | | | |
Total Return(c) | | 14.51 | % | 12.22 | % | 8.54 | % | 9.32 | % | 19.98 | % |
| | | | | | | | | | | |
Net Assets End of Period | | $ | 665,013 | | $ | 471,902 | | $ | 329,797 | | $ | 232,748 | | $ | 116,102 | |
| | | | | | | | | | | |
Ratio and Supplemental Data | | | | | | | | | | | |
| | | | | | | | | | | |
Expenses to average net assets:(d),(e) | | | | | | | | | | | |
After reimbursement/fee waiver(f) | | 0.59 | % | 0.58 | %(a) | 0.26 | % | 0.28 | % | 0.37 | % |
Before reimbursement/fee waiver(g) | | 0.59 | % | 0.58 | %(a) | 0.26 | % | 0.28 | % | 0.37 | % |
Net investment income (loss), to average net assets(e),(h) | | 2.83 | % | 1.98 | %(l) | 2.31 | %(l) | 1.13 | % | 1.22 | % |
Portfolio turnover rate(i) | | 23 | % | 22 | % | 19 | % | 1 | % | 18 | % |
| | TA IDEX Asset Allocation - Moderate Portfolio | |
| | Class B | |
| | October 31, | | October 31, | | October 31, | | October 31, | | October 31, | |
| | 2007 | | 2006 | | 2005 | | 2004 | | 2003 | |
| | | | | | | | | | | |
Net Asset Value | | | | | | | | | | | |
Beginning of period | | $ | 12.55 | | $ | 11.70 | | $ | 11.16 | | $ | 10.37 | | $ | 8.71 | |
| | | | | | | | | | | |
Investment Operations(b) | | | | | | | | | | | |
From net investment income (loss) | | 0.28 | | 0.16 | | 0.18 | | 0.05 | | 0.05 | |
From net realized and unrealized gain (loss) on investments | | 1.39 | | 1.15 | | 0.68 | | 0.83 | | 1.63 | |
Total from investment operations | | 1.67 | | 1.31 | | 0.86 | | 0.88 | | 1.68 | |
| | | | | | | | | | | |
Distributions | | | | | | | | | | | |
Net investment income | | (0.28 | ) | (0.21 | ) | (0.26 | ) | (0.09 | ) | (0.02 | ) |
Net realized gains on investments | | (0.34 | ) | (0.25 | ) | (0.06 | ) | — | | — | |
Total distributions | | (0.62 | ) | (0.46 | ) | (0.32 | ) | (0.09 | ) | (0.02 | ) |
| | | | | | | | | | | |
Net Asset Value | | | | | | | | | | | |
End of year | | $ | 13.59 | | $ | 12.55 | | $ | 11.70 | | $ | 11.16 | | $ | 10.37 | |
| | | | | | | | | | | |
Total Return(c) | | 13.73 | % | 11.50 | % | 7.81 | % | 8.62 | % | 19.39 | % |
| | | | | | | | | | | |
Net Assets End of Period | | $ | 357,175 | | $ | 336,385 | | $ | 295,649 | | $ | 261,772 | | $ | 183,148 | |
| | | | | | | | | | | |
Ratio and Supplemental Data | | | | | | | | | | | |
| | | | | | | | | | | |
Expenses to average net assets:(d),(e) | | | | | | | | | | | |
After reimbursement/fee waiver(f) | | 1.25 | % | 1.25 | %(a) | 0.92 | % | 0.93 | % | 1.02 | % |
Before reimbursement/fee waiver(g) | | 1.25 | % | 1.25 | %(a) | 0.92 | % | 0.93 | % | 1.02 | % |
Net investment income (loss), to average net assets(e),(h) | | 2.21 | % | 1.31 | %(l) | 1.61 | %(l) | 0.48 | % | 0.57 | % |
Portfolio turnover rate(i) | | 23 | % | 22 | % | 19 | % | 1 | % | 18 | % |
The notes to the financial statements are an integral part of this report.
37
| | TA IDEX Asset Allocation - Moderate Portfolio | |
| | Class C | |
| | October 31, | | October 31, | | October 31, | | October 31, | | October 31, | |
| | 2007 | | 2006 | | 2005 | | 2004 | | 2003 | |
| | | | | | | | | | | |
Net Asset Value | | | | | | | | | | | |
Beginning of period | | $ | 12.55 | | $ | 11.70 | | $ | 11.17 | | $ | 10.37 | | $ | 8.71 | |
| | | | | | | | | | | |
Investment Operations(b) | | | | | | | | | | | |
From net investment income (loss) | | 0.28 | | 0.16 | | 0.19 | | 0.05 | | 0.05 | |
From net realized and unrealized gain (loss) on investments | | 1.39 | | 1.14 | | 0.67 | | 0.84 | | 1.63 | |
Total from investment operations | | 1.67 | | 1.30 | | 0.86 | | 0.89 | | 1.68 | |
| | | | | | | | | | | |
Distributions | | | | | | | | | | | |
Net investment income | | (0.30 | ) | (0.21 | ) | (0.27 | ) | (0.09 | ) | (0.02 | ) |
Net realized gains on investments | | (0.34 | ) | (0.25 | ) | (0.06 | ) | — | | — | |
Total distributions | | (0.64 | ) | (0.46 | ) | (0.33 | ) | (0.09 | ) | (0.02 | ) |
| | | | | | | | | | | |
Net Asset Value | | | | | | | | | | | |
End of year | | $ | 13.58 | | $ | 12.55 | | $ | 11.70 | | $ | 11.16 | | $ | 10.37 | |
| | | | | | | | | | | |
Total Return(c) | | 13.86 | % | 11.46 | % | 7.85 | % | 8.67 | % | 19.39 | % |
| | | | | | | | | | | |
Net Assets End of Period | | $ | 1,159,220 | | $ | 905,061 | | $ | 678,783 | | $ | 518,527 | | $ | 201,774 | |
| | | | | | | | | | | |
Ratio and Supplemental Data | | | | | | | | | | | |
| | | | | | | | | | | |
Expenses to average net assets:(d),(e) | | | | | | | | | | | |
After reimbursement/fee waiver(f) | | 1.21 | % | 1.22 | %(a) | 0.89 | % | 0.89 | % | 1.02 | % |
Before reimbursement/fee waiver(g) | | 1.21 | % | 1.22 | %(a) | 0.89 | % | 0.89 | % | 1.02 | % |
Net investment income (loss), to average net assets(e),(h) | | 2.22 | % | 1.35 | %(l) | 1.67 | %(l) | 0.50 | % | 0.57 | % |
Portfolio turnover rate(i) | | 23 | % | 22 | % | 19 | % | 1 | % | 18 | % |
| | | | | | TA IDEX Multi- | |
| | | | | | Manager | |
| | | | | | Alternative | |
| | TA IDEX Asset Allocation - | | Strategies | |
| | Moderate Portfolio(j) | | Fund(n) | |
| | Class R | | Class A | |
| | October 31, | | October 31, | | October 31, | |
| | 2007 | | 2006 | | 2007 | |
| | | | | | | |
Net Asset Value | | | | | | | |
Beginning of period | | $ | 12.64 | | $ | 11.86 | | $ | 10.00 | |
| | | | | | | |
Investment Operations(b) | | | | | | | |
From net investment income (loss) | | 0.31 | | 0.13 | | 0.05 | |
From net realized and unrealized gain (loss) on investments | | 1.42 | | 0.65 | | 0.73 | |
Total from investment operations | | 1.73 | | 0.78 | | 0.78 | |
| | | | | | | |
Distributions | | | | | | | |
Net investment income | | (0.38 | ) | — | | — | |
Net realized gains on investments | | (0.34 | ) | — | | — | |
Total distributions | | (0.72 | ) | — | | — | |
| | | | | | | |
Net Asset Value | | | | | | | |
End of year | | $ | 13.65 | | $ | 12.64 | | $ | 10.78 | |
| | | | | | | |
Total Return(c) | | 14.31 | % | 6.58 | % | 7.80 | % |
| | | | | | | |
Net Assets End of Period | | $ | 610 | | $ | 53 | | $ | 38,870 | |
| | | | | | | |
Ratio and Supplemental Data | | | | | | | |
| | | | | | | |
Expenses to average net assets:(d),(e) | | | | | | | |
After reimbursement/fee waiver(f) | | 0.72 | % | 0.66 | %(a) | 0.90 | % |
Before reimbursement/fee waiver(g) | | 0.72 | % | 0.66 | %(a) | 1.29 | % |
Net investment income (loss), to average net assets(e),(h) | | 2.44 | % | 2.73 | % | 0.58 | % |
Portfolio turnover rate(i) | | 23 | % | 22 | % | — | % |
The notes to the financial statements are an integral part of this report.
38
| | TA IDEX Multi- | | | | | |
| | Manager | | | | | |
| | Alternative | | | | | |
| | Strategies | | TA IDEX Multi-Manager | |
| | Fund(n) | | International Fund(m) | |
| | Class C | | Class A | |
| | October 31, | | October 31, | | October 31, | |
| | 2007 | | 2007 | | 2006 | |
| | | | | | | |
Net Asset Value | | | | | | | |
Beginning of period | | $ | 10.00 | | $ | 10.63 | | $ | 10.00 | |
| | | | | | | |
Investment Operations(b) | | | | | | | |
From net investment income (loss) | | (0.01 | ) | — | | (0.04 | ) |
From net realized and unrealized gain (loss) on investments | | 0.73 | | 3.19 | | 0.67 | |
Total from investment operations | | 0.72 | | 3.19 | | 0.63 | |
| | | | | | | |
Distributions | | | | | | | |
Net investment income | | — | | (0.58 | ) | — | |
Net realized gains on investments | | — | | — | | — | |
Total distributions | | — | | (0.58 | ) | — | |
| | | | | | | |
Net Asset Value | | | | | | | |
End of year | | $ | 10.72 | | $ | 13.24 | | $ | 10.63 | |
| | | | | | | |
Total Return(c) | | 7.20 | % | 31.30 | % | 6.30 | % |
| | | | | | | |
Net Assets End of Period | | $ | 49,306 | | $ | 178,422 | | $ | 58,142 | |
| | | | | | | |
Ratio and Supplemental Data | | | | | | | |
| | | | | | | |
Expenses to average net assets:(d),(e) | | | | | | | |
After reimbursement/fee waiver(f) | | 1.55 | % | 0.65 | % | 0.80 | % |
Before reimbursement/fee waiver(g) | | 1.99 | % | 0.65 | % | 0.88 | % |
Net investment income (loss), to average net assets(e),(h) | | (0.07 | )% | (0.02 | )% | (0.67 | )%(l) |
Portfolio turnover rate(i) | | — | % | 1 | % | 1 | % |
| | TA IDEX Multi-Manager | |
| | International Fund(m) | |
| | Class B | |
| | October 31, | | October 31, | |
| | 2007 | | 2006 | |
| | | | | |
Net Asset Value | | | | | |
Beginning of period | | $ | 10.59 | | $ | 10.00 | |
| | | | | |
Investment Operations(b) | | | | | |
From net investment income (loss) | | (0.09 | ) | (0.09 | ) |
From net realized and unrealized gain (loss) on investments | | 3.18 | | 0.68 | |
Total from investment operations | | 3.09 | | 0.59 | |
| | | | | |
Distributions | | | | | |
Net investment income | | (0.55 | ) | — | |
Net realized gains on investments | | — | | — | |
Total distributions | | (0.55 | ) | — | |
| | | | | |
Net Asset Value | | | | | |
End of year | | $ | 13.13 | | $ | 10.59 | |
| | | | | |
Total Return(c) | | 30.32 | % | 5.90 | % |
| | | | | |
Net Assets End of Period | | $ | 30,060 | | $ | 9,849 | |
| | | | | |
Ratio and Supplemental Data | | | | | |
| | | | | |
Expenses to average net assets:(d),(e) | | | | | |
After reimbursement/fee waiver(f) | | 1.43 | % | 1.45 | % |
Before reimbursement/fee waiver(g) | | 1.43 | % | 1.53 | % |
Net investment income (loss), to average net assets(e),(h) | | 1.20 | % | (1.32 | )%(l) |
Portfolio turnover rate(i) | | 1 | % | 1 | % |
The notes to the financial statements are an integral part of this report.
39
| | TA IDEX Multi-Manager | |
| | International Fund(m) | |
| | Class C | |
| | October 31, | | October 31, | |
| | 2007 | | 2006 | |
| | | | | |
Net Asset Value | | | | | |
Beginning of period | | $ | 10.58 | | $ | 10.00 | |
| | | | | |
Investment Operations(b) | | | | | |
From net investment income (loss) | | (0.08 | ) | (0.09 | ) |
From net realized and unrealized gain (loss) on investments | | 3.18 | | 0.67 | |
Total from investment operations | | 3.10 | | 0.58 | |
| | | | | |
Distributions | | | | | |
Net investment income | | (0.55 | ) | — | |
Net realized gains on investments | | — | | — | |
Total distributions | | (0.55 | ) | — | |
| | | | | |
Net Asset Value | | | | | |
End of year | | $ | 13.13 | | $ | 10.58 | |
| | | | | |
Total Return(c) | | 30.45 | % | 5.80 | % |
| | | | | |
Net Assets End of Period | | $ | 250,419 | | $ | 76,650 | |
| | | | | |
Ratio and Supplemental Data | | | | | |
| | | | | |
Expenses to average net assets:(d),(e) | | | | | |
After reimbursement/fee waiver(f) | | 1.31 | % | 1.45 | % |
Before reimbursement/fee waiver(g) | | 1.31 | % | 1.53 | % |
Net investment income (loss), to average net assets(e),(h) | | (0.71 | )% | (1.32 | )%(l) |
Portfolio turnover rate(i) | | 1 | % | 1 | % |
(a) | | On November 15, 2005, the Fund was authorized under the 12b-1 plan to pay fees on each class up to the following limits: Class A 0.35%, Class B 1.00%, Class C 1.00%, and Class R 0.50%. |
(b) | | Per share information is calculated based on average number of shares outstanding. |
(c) | | Total return has been calculated for the applicable period without deduction of a sales load, if any, on an initial purchase. Not annualized. |
(d) | | Does not include expenses of the investment companies in which the Fund invests. |
(e) | | Annualized. |
(f) | | Ratio of Net Expenses to Average Net Assets is net of fee waivers and reimbursements by the investment adviser, if any (see
Note 2). |
(g) | | Ratio of Total Expenses to Average Net Assets includes all expenses before fee waivers and reimbursements by the investment adviser. |
(h) | | Recognition of net investment income by the Fund is affected by the timing of the declaration of dividends by the underlying investment companies in which the Fund invests. |
(i) | | Not Annualized. |
(j) | | Class R was offered for investment on June 15, 2006. |
(k) | | Ratios of Total Expenses to Average Net Assets and net Expenses to Average Net Assets are inclusive of recaptured expenses by the investment adviser, if any. The impact of recaptured expenses was 0.01%, 0.01%, and 0.01% for Class A, Class B, and Class C, respectively (see Note 2). |
(l) | | Ratios of Net Investment Income (Loss) to Average Net Assets are inclusive of Redemption Fees, if any. The impact of Redemption Fees is less than 0.01% for Class A, Class B, and Class C, respectively. |
(m) | | TA IDEX Multi-Manager International Fund (“the Fund”) commenced operations on March 1, 2006. |
(n) | | TA IDEX Multi-Manager Alternative Strategies Fund (“the Fund”) commenced operations on December 28, 2006. |
The notes to the financial statements are an integral part of this report.
40
NOTES TO FINANCIAL STATEMENTS
At October 31, 2007
(all amounts in thousands)
NOTE 1. ORGANIZATION AND SIGNIFICANT ACCOUNTING POLICIES
Transamerica IDEX Mutual Funds is an open-end management investment company registered under the Investment Company Act of 1940, as amended (the “1940 Act”). TA IDEX Asset Allocation–Conservative Portfolio, TA IDEX Asset Allocation–Growth Portfolio, TA IDEX Asset Allocation–Moderate Growth Portfolio, TA IDEX Asset Allocation–Moderate Portfolio, TA IDEX Multi–Manager Alternative Strategies Fund and TA IDEX Multi–Manager International Fund, (each, a “Fund” collectively the “Funds”), are part of Transamerica IDEX Mutual Funds.
In the normal course of business, the Funds enter into contracts that contain a variety of representations that provide general indemnifications. The Funds’ maximum exposure under these arrangements is unknown, as this would involve future claims that may be made against the Funds and/or their affiliates that have not yet occurred. However, based on experience, the Funds expect the risk of loss to be remote.
This report should be read in conjunction with the Funds’ current prospectuses, which contains more complete information about the Funds.
In preparing the Funds’ financial statements in accordance with accounting principles generally accepted in the United States of America (“GAAP”), estimates or assumptions (which could differ from actual results) may be used that affect reported amounts and disclosures. The following is a summary of significant accounting policies followed by the Funds.
Multiple class operations, income and expenses: The Funds, with the exception of TA IDEX Multi–Manager International Fund and TA IDEX Multi- Manager Alternative Strategies Fund, currently offer four classes of shares, Class A, Class B, Class C and Class R, each with a public offering price that reflects different sales charges, if any, and expense levels. Class R commenced operations on June 15, 2006. TA IDEX Multi–Manager International Fund currently offers three classes of shares, Class A, Class B and Class C, each with a public offering price that reflects different sales charges, if any, and expense levels. TA IDEX Multi–Manager Alternative Strategies Fund currently offers two classes of shares, Class A and Class C, each with a public offering price that reflects different sales charges, if any, and expense levels. Class B shares will convert to Class A shares eight years after purchase. Income, non-class specific expenses and realized and unrealized gains and losses, are allocated daily to each class, based upon the value of shares outstanding method as permitted under Rule 18f-3 of the 1940 Act. Each class bears its own specific expenses as well as a portion of general, common expenses.
Security valuations: Investment company securities are valued at the net asset value of the underlying portfolio.
Cash: Each Fund may leave cash overnight in its cash account with the custodian, State Street Bank & Trust Company (“State Street”). On July 2, 2007, State Street acquired the parent company of Investors Bank & Trust Company (“IBT”). State Street has been contracted on behalf of the Funds to invest the excess cash into their savings accounts, which at October 31, 2007 were paying an interest rate of 3.00%.
Throughout the year, the Funds may have cash overdraft balances. A fee is incurred on these overdrafts, calculated by multiplying the overdrafts by a rate based on the federal funds rate.
Security transactions and investment income: Security transactions are recorded on the trade date. Security gains and losses are calculated on the specific identification basis. Dividend income, if any, is recorded on the ex-dividend date. Dividends and net realized gain (loss) from investment securities for the Funds are from investments in shares of affiliated investment companies.
Redemption fees: A short-term trading redemption fee may be assessed on any Fund shares in a fund account that are sold during the first five (5) New York Stock Exchange (“NYSE”) trading days following their purchase date. This redemption fee will equal 2% of the amount redeemed and shares held the longest will be treated as being redeemed first and shares held the shortest as being redeemed last. For the year ended October 31, 2007, the Funds received redemption fees, which are located in the Funds’ Statements of Changes in Net Assets.
Dividend distributions: Distributions to shareholders are recorded on the ex-dividend date and are determined in accordance with federal income tax regulations.
NOTE 2. RELATED PARTY TRANSACTIONS
Transamerica Fund Advisors, Inc. (“TFAI”) is the Funds’ investment adviser. Transamerica Fund Services, Inc. (“TFS”) is the Funds’ administrator and transfer agent. Transamerica Capital Inc. (“TCI”) is the Funds’ distributor/principal underwriter. Prior to May 1, 2007, AFSG Securities Corp. (“AFSG”) was the Funds’ distributor/principal underwriter. TFAI, TFS, and TCI are affiliates of AEGON NV, a Netherlands corporation.
Transamerica Investment Management, LLC (“TIM”) is an affiliate of the Funds and a sub-adviser to other funds within Transamerica IDEX Mutual Funds.
Certain officers and trustees of the Funds are also officers and/or directors of TFAI, TFS and TCI.
Because the underlying funds have varied expense and fee levels and the Funds may own different proportions of underlying funds at different times, the amount of fees and expenses incurred indirectly by the Funds will vary.
Investment advisory fees: The Funds pay management fees to TFAI based on average daily net assets (“ANA”) at the following rates:
41
Fund | | Rate of ANA |
TA IDEX Asset Allocation - Conservative Portfolio | | 0.10% of ANA |
| | |
TA IDEX Asset Allocation - Growth Portfolio | | 0.10% of ANA |
| | |
TA IDEX Asset Allocation - Moderate Growth Portfolio | | 0.10% of ANA |
| | |
TA IDEX Asset Allocation - Moderate Portfolio | | 0.10% of ANA |
| | |
TA IDEX Multi-Manager Alternative Strategies Fund | | 0.20% of the first $500 million of ANA
0.19% of the next $500 million of ANA
0.18% of ANA over $1 billion |
| | |
TA IDEX Multi-Manager International Fund | | 0.10% of ANA |
TFAI has contractually agreed to waive its advisory fees and will reimburse the Funds to the extent that operating expenses, excluding 12b-1 fees, exceed the following stated annual limit:
Fund | | Expense Limit | |
TA IDEX Asset Allocation - Conservative Portfolio | | 0.45 | % |
TA IDEX Asset Allocation - Growth Portfolio | | 0.45 | |
TA IDEX Asset Allocation - Moderate Growth Portfolio | | 0.45 | |
TA IDEX Asset Allocation - Moderate Portfolio | | 0.45 | |
TA IDEX Multi-Manager Alternative Strategies Fund | | 0.55 | |
TA IDEX Multi-Manager International Fund | | 0.45 | |
If total Fund expenses fall below the annual expense limitation agreement agreed to by the adviser within the succeeding three years, the Funds may be required to pay the adviser a portion or all of the reimbursed class expenses. The following Fund had an amount available to recapture at October 31, 2007:
TA IDEX Multi-Manager | | Reimbursement of | | Available for | |
Alternate Strategies Fund | | Class Expenses | | Recapture Through | |
| | | | | |
Fiscal Year 2007: | | | | 10/31/2010 | |
Class A | | $ | 54 | | | |
Class C | | 75 | | | |
| | | | | | |
Distribution and service fees: The Funds have 12b-1 distribution plans under the 1940 Act pursuant to which an annual fee, based on average daily net assets, is paid to the distributor for various disbursements such as broker-dealer account servicing fees and other promotional expenses of the Funds. The Funds are authorized under the 12b-1 plans to pay fees on each available class up to the following limits: 0.35% for Class A; 1.00% for Class B; 1.00% for Class C; and 0.50% for Class R.
In the case the Funds or a class of shares of the Funds is closed to new investors or investments, the Funds are authorized to pay 12b-1 fees for past sales and distribution efforts and present and past investor services.
Underwriter commissions relate to front-end sales charges imposed for Class A shares and contingent deferred sales charges from Classes B, C, and certain A share redemptions. For the year ended October 31, 2007, the underwriter commissions were as follows:
TA IDEX Asset Allocation - Conservative Portfolio
Received by Underwriter | | $ | 1,830 | |
Retained by Underwriter | | 314 | |
Contingent Deferred Sales Charge | | 268 | |
TA IDEX Asset Allocation - Growth Portfolio
Received by Underwriter | | $ | 6,221 | |
Retained by Underwriter | | 990 | |
Contingent Deferred Sales Charge | | 809 | |
TA IDEX Asset Allocation - Moderate Growth Portfolio
Received by Underwriter | | $ | 11,055 | |
Retained by Underwriter | | 1,799 | |
Contingent Deferred Sales Charge | | 1,476 | |
TA IDEX Asset Allocation - Moderate Portfolio
Received by Underwriter | | $ | 5,077 | |
Retained by Underwriter | | 842 | |
Contingent Deferred Sales Charge | | 824 | |
TA IDEX Multi-Manager Alternative Strategies Fund
Received by Underwriter | | $ | 813 | |
Retained by Underwriter | | 130 | |
Contingent Deferred Sales Charge | | 17 | |
TA IDEX Multi-Manager International Fund
Received by Underwriter | | $ | 1,477 | |
Retained by Underwriter | | 228 | |
Contingent Deferred Sales Charge | | 97 | |
Administrative services: The Funds have entered into agreements with TFS for financial and legal fund administration services. The Funds pay TFS an annual fee of 0.0125% of ANA. The Legal fees on the Statements of Operations are fees paid to external legal counsel.
Transfer agent fees: The Funds pay TFS an annual per-account charge for each open and closed account. The Funds paid TFS the following for the year ended October 31, 2007:
Fund | | Fees | |
TA IDEX Asset Allocation - Conservative Portfolio | | $ | 508 | |
TA IDEX Asset Allocation - Growth Portfolio | | 2,404 | |
TA IDEX Asset Allocation - Moderate Growth Portfolio | | 3,394 | |
TA IDEX Asset Allocation - Moderate Portfolio | | 1,556 | |
TA IDEX Multi-Manager Alternative Strategies Fund | | 37 | |
TA IDEX Multi-Manager International Fund | | 369 | |
| | | | |
Deferred compensation plan: Each eligible independent Fund Trustee may elect to participate in a non-qualified deferred compensation plan (the “Plan”) maintained by Transamerica IDEX Mutual Funds. Under the Plan, such Trustees may defer payment of all or a portion of their total fees earned as a Fund Trustee. Each Trustee who is a participant in the Plan may elect that the earnings, losses or gains credited to his or her deferred fee amounts be determined based on a deemed investment in any series of Transamerica IDEX Mutual Funds, including the Funds. The right of a participant to receive a distribution from the Plan of the deferred fees is an unfunded and unsecured claim against the general assets of all series of Transamerica IDEX Mutual Funds. The pro rata liability to the Funds of all deferred fees in the Plan amounted, as of October 31, 2007, to the following:
Fund | | Deferred Fees | |
TA IDEX Asset Allocation - Conservative Portfolio | | $ | 17 | |
TA IDEX Asset Allocation - Growth Portfolio | | 31 | |
TA IDEX Asset Allocation - Moderate Growth Portfolio | | 63 | |
TA IDEX Asset Allocation - Moderate Portfolio | | 44 | |
TA IDEX Multi-Manager Alternative Strategies Fund | | — | (a) |
TA IDEX Multi-Manager International Fund | | 1 | |
| | | | |
(a) Rounds to less than $1
42
Retirement plan: Under a retirement plan (the “Emeritus Plan”) available to the Independent Trustees, each Independent Trustee is deemed to have elected to serve as Trustee Emeritus of Transamerica IDEX Mutual Funds upon his or her termination of service, other than removal for cause, for a maximum period of five years determined by his or her years of service as a Trustee.
The amounts shall be accrued by Transamerica IDEX Mutual Funds on a pro rata basis allocable to each Transamerica IDEX Mutual Fund based on the relative assets of the fund. If retainers increase in the future, past accruals (and credits) will be adjusted upward so that 50% of the Trustee’s current retainer is accrued and credited at all times. Upon death, disability or termination of service, other than removal for cause, amounts deferred become payable to an Emeritus Trustee (or his/her beneficiary). Upon the commencement of service as Trustee Emeritus, compensation will be paid on a quarterly basis during the time period that the Trustee Emeritus is allowed to serve as such.
For the year ended October 31, 2007, the amounts related to the Emeritus Plan were as follows:
| | Emeritus Fees | |
Fund | | Due | |
TA IDEX Asset Allocation - Conservative Portfolio | | $ | 26 | |
TA IDEX Asset Allocation - Growth Portfolio | | 73 | |
TA IDEX Asset Allocation - Moderate Growth Portfolio | | 135 | |
TA IDEX Asset Allocation - Moderate Portfolio | | 82 | |
TA IDEX Multi-Manager Alternative Strategies Fund | | — | |
TA IDEX Multi-Manager International Fund | | 4 | |
| | | | |
As of October 31, 2007, the Funds had not made any payments related to the Emeritus Plan. Amounts deferred and accrued under the Deferred Compensation and Emeritus Plans are unfunded and unsecured claims against the general assets of Transamerica IDEX.
The Emeritus Plan was terminated effective October 30, 2007. Upon the termination, the Fund shall continue to pay any remaining benefits in accordance with the Plan, but no further compensation shall accrue under the Plan.
NOTE 3. INVESTMENT TRANSACTIONS
The cost of securities purchased and proceeds from securities sold (excluding short-term securities) for the year ended October 31, 2007 were as follows:
| | Purchases of
securities: | | Proceeds from
maturities and sales
of securities: | |
Fund | | Long-term | | U.S.
Government | | Long-term | | U.S.
Government | |
TA IDEX Asset Allocation - Conservative Portfolio | | $ | 308,752 | | $ | — | | $ | 189,891 | | $ | — | |
TA IDEX Asset Allocation - Growth Portfolio | | 793,114 | | — | | 364,508 | | — | |
TA IDEX Asset Allocation - Moderate Growth Portfolio | | 1,311 ,098 | | — | | 669,391 | | — | |
TA IDEX Asset Allocation - Moderate Portfolio | | 728,496 | | — | | 440,825 | | — | |
TA IDEX Multi-Manager Alternative Strategies Fund | | 82,756 | | — | | 105 | | — | |
TA IDEX Multi-Manager International Fund | | 245,571 | | — | | 2,714 | | — | |
| | | | | | | | | | | | | |
NOTE 4. FEDERAL INCOME TAX MATTERS
The Funds have not made any provision for federal income or excise taxes due to their policy to distribute all of their taxable income and capital gains to their shareholders and otherwise qualify as regulated investment companies under Subchapter M of the Internal Revenue Code. Income and capital gain distributions are determined in accordance with income tax regulations, which may differ from GAAP. These differences are primarily due to differing treatment for items including, but not limited to, wash sales and distribution reclasses.
Therefore, distributions determined in accordance with tax regulations may differ significantly in amount or character from net investment income and realized gains for financial reporting purposes. Financial reporting records are adjusted for permanent book/tax differences to reflect tax character. Financial records are not adjusted for temporary differences. These reclassifications are as follows:
Fund | | Shares of
beneficial
interest,
unlimited
shares
authorized | | Undistributed
(accumulated) net
investment
income (loss) | | Undistributed
(accumulated)
net realized
gain (loss)
from
investment
securities | |
TA IDEX Asset Allocation - Growth Portfolio | | $ | (8,809 | ) | $ | 5,787 | | $ | 3,022 | |
TA IDEX Asset Allocation - Moderate Growth Portfolio | | — | | 1 | | (1 | ) |
TA IDEX Asset Allocation - Moderate Portfolio | | — | | 1 | | (1 | ) |
TA IDEX Multi-Manager Alternative Strategies Fund | | (7 | ) | 7 | | — | |
TA IDEX Multi-Manager International Fund | | (2,136 | ) | 2,136 | | — | |
| | | | | | | | | | |
43
The capital loss carryforwards utilized during the year ended October 31, 2007 were as follows:
Fund | | Capital Loss Carryforwards
Utilized During the Year Ended
October 31, 2007 | |
TA IDEX Multi-Manager International Fund | | $ | 1,516 | |
| | | | |
The tax character of distributions paid may differ from the character of distributions shown in the Statements of Changes in Net Assets due to short-term gains being treated as ordinary income for tax purposes.
The tax character of distributions paid during 2006 and 2007 was as follows:
| | Distributions Paid | | Distributions Paid | |
| | From: 2006 | | From: 2007 | |
| | | | Long-term | | | | Long-term | |
| | Ordinary | | Capital | | Ordinary | | Capital | |
| | Income | | Gain | | Income | | Gain | |
TA IDEX Asset Allocation - Conservative Portfolio | | $12,373 | | $12,619 | | $19,157 | | $12,903 | |
TA IDEX Asset Allocation - Growth Portfolio | | 5 ,292 | | 31,929 | | 34,305 | | 53,648 | |
TA IDEX Asset Allocation - Moderate Growth Portfolio | | 25,895 | | 53,728 | | 73,568 | | 70,685 | |
TA IDEX Asset Allocation - Moderate Portfolio | | 25,990 | | 28,464 | | 44,697 | | 45,290 | |
TA IDEX Multi-Manager International Fund | | — | | — | | 8,813 | | — | |
The tax basis components of distributable earnings as of October 31, 2007 are as follows:
| | | | | | | | | | Net* | |
| | Undistributed | | Undistributed | | | | Other | | Unrealized | |
| | Ordinary | | Long-term | | Capital Loss | | Temporary | | Appreciation | |
Fund | | Income | | Capital Gain | | Carryforward | | Differences | | (Depreciation) | |
TA IDEX Asset Allocation - Conservative Portfolio | | $ | 294 | | $ | 13,795 | | $ | — | | $ | — | | $ | 83,606 | |
TA IDEX Asset Allocation - Growth Portfolio | | — | | 68,794 | | — | | — | | 541,867 | |
TA IDEX Asset Allocation - Moderate Growth Portfolio | | 1,066 | | 115,144 | | — | | — | | 770,556 | |
TA IDEX Asset Allocation - Moderate Portfolio | | 12,555 | | 65,089 | | — | | — | | 358,455 | |
TA IDEX Multi- Manager Alternative Strategies Fund | | 75 | | — | | — | | — | | 3,632 | |
TA IDEX Multi- Manager International Fund | | — | | 3,331 | | (1,516 | ) | — | | 75,725 | |
| | | | | | | | | | | | | | | | |
*The amount includes unrealized appreciation (depreciation) from foreign currency translation and derivatives, if applicable.
NOTE 5. REGULATORY PROCEEDINGS
There continues to be significant federal and state regulatory activity relating to financial services companies, particularly mutual fund companies and their investment advisers. As part of an ongoing investigation regarding potential market timing, recordkeeping and trading compliance issues and matters affecting the Funds’ investment adviser, TFAI, and certain affiliates and former employees of TFAI, the SEC staff has indicated that it is likely to take some action against TFAI and certain of its affiliates at the conclusion of the investigation. The potential timing and the scope of any such action is difficult to predict. Although the impact of any action brought against TFAI and/or its affiliates is difficult to assess at the present time, the Funds currently believe that the likelihood that any such action will have a material adverse impact is remote. It is important to note that the Funds are not aware of any allegation of wrongdoing against them and their Boards at the time this annual report is printed. Although it is not anticipated that these developments will have an adverse impact on the Funds, there can be no assurance at this time. TFAI and its affiliates are actively working with the SEC in regard to this matter; however, the exact resolution cannot be determined at this time. TFAI will take such actions that it deems necessary or appropriate to continue providing management services to the Funds and to bring all matters to an appropriate conclusion.
TFAI and/or its affiliates, and not the Funds, will bear the costs regarding these regulatory matters.
NOTE 6. RECENTLY ISSUED ACCOUNTING PRONOUNCEMENTS
In July 2006, the Financial Accounting Standards Board (“FASB”) released FASB Interpretation No. 48 “Accounting for Uncertainty in Income Taxes” (“FIN 48”), an interpretation of FASB Statement No. 109. FIN 48 provides guidance for how uncertain tax positions should be recognized, measured, presented and disclosed in the financial statements. FIN 48 requires the accounting and disclosure of tax positions taken or expected to be taken in the course of preparing the Funds’ tax returns to determine whether the tax positions are “more likely- than-not” of being sustained by the applicable tax authority. Tax positions not deemed to meet the more-likely-than-not threshold would be recorded as a tax benefit or expense in the current year. Adoption of FIN 48 is effective during the first required financial reporting period for fiscal years beginning after December 15, 2006.
Implementation of FIN 48 requires Management of the Funds to analyze all open tax years, as defined by the Statute of Limitations, for all major jurisdictions, which includes federal and certain states. Open tax years are those that are open for exam by taxing authorities (i.e., the last 4 tax year ends and the interim tax period since then). The Funds have no examinations in progress and none are expected at this time.
As of September 28, 2007, Management of the Funds have reviewed all open tax years and major jurisdictions and concluded the adoption of FIN 48 resulted in no impact the Funds’ net assets or results of operations. There is no tax liability resulting from unrecognized tax benefits relating to uncertain income tax positions taken or expected to be taken in future tax returns. The Funds are also not aware of any tax
44
positions for which it is reasonably possible that the total amounts of unrecognized tax benefits will significantly change in the next 12 months.
In September 2006, FASB issued its new Standard No. 157, “Fair Value Measurements” (“FAS 157”). FAS 157 is designed to unify guidance for the measurement of fair value of all types of assets, including financial instruments, and certain liabilities, throughout a number of accounting standards. FAS 157 also establishes a hierarchy for measuring fair value in generally accepted accounting principles and expands financial statement disclosures about fair value measurements that are relevant to mutual funds. FAS 157 is effective for financial statements issued for fiscal years beginning after November 15, 2007, and earlier application is permitted.
As of October 31, 2007, Management does not expect the adoption of FAS 157 to impact the amounts reported in the financial statements, however, additional disclosures will be required about the inputs used to develop the measurements of fair value and the effect of certain of the measurements reported in the statement of operations for a fiscal period.
NOTE 7. SUBSEQUENT EVENT
Effective January 1, 2008, Transamerica Fund Advisors, Inc. will change its name to Transamerica Asset Management, Inc.
45
Report of Independent Registered Certified Public Accounting Firm
To the Board of Trustees and Shareholders of TA IDEX Asset Allocation - Conservative Portfolio, TA IDEX Asset Allocation - Growth Portfolio, TA IDEX Asset Allocation - Moderate Growth Portfolio, TA IDEX Asset Allocation - Moderate Portfolio, TA IDEX Multi-Manager Alternative Strategies Fund, and TA IDEX Multi-Manager International Fund:
In our opinion, the accompanying statements of assets and liabilities, including the schedules of investments, and the related statements of operations and of changes in net assets and the financial highlights present fairly, in all material respects, the financial position of TA IDEX Asset Allocation - Conservative Portfolio, TA IDEX Asset Allocation - Growth Portfolio, TA IDEX Asset Allocation - Moderate Growth Portfolio, TA IDEX Asset Allocation - Moderate Portfolio, TA IDEX Multi-Manager Alternative Strategies Fund, and TA IDEX Multi-Manager International Fund (individually a “Fund”, collectively the “Funds”) at October 31, 2007, and the results of each of their operations, the changes in each of their net assets and the financial highlights for each of the periods indicated, in conformity with accounting principles generally accepted in the United States of America. These financial statements and financial highlights (hereafter referred to as “financial statements”) are the responsibility of the Funds’ management; our responsibility is to express an opinion on these financial statements based on our audits. We conducted our audits of these financial statements in accordance with the standards of the Public Company Accounting Oversight Board (United States). Those standards require that we plan and perform the audit to obtain reasonable assurance about whether the financial statements are free of material misstatement. An audit includes examining, on a test basis, evidence supporting the amounts and disclosures in the financial statements, assessing the accounting principles used and significant estimates made by management, and evaluating the overall financial statement presentation. We believe that our audits, which included confirmation of securities at October 31, 2007 by correspondence with the custodian and brokers, provide a reasonable basis for our opinion.

|
|
Tampa, Florida |
December 28, 2007 |
46
SUPPLEMENTAL INFORMATION (unaudited)
TAX INFORMATION
For dividends paid during the year ended October 31, 2007, the Funds designated the following as qualified dividend income:
| | Qualified Dividend | |
Fund | | Income | |
TA IDEX Asset Allocation - Conservative Portfolio | | $ | 1,476 | |
TA IDEX Asset Allocation - Growth Portfolio | | 10,897 | |
TA IDEX Asset Allocation - Moderate Growth Portfolio | | 15,418 | |
TA IDEX Asset Allocation - Moderate Portfolio | | 6,802 | |
TA IDEX Multi-Manager Alternative Strategies Fund | | 9 | |
TA IDEX Multi-Manager International Fund | | 1,112 | |
| | | | |
For corporate shareholders, investment income (dividend income plus short-term gains, if any) qualifies for the dividends received deductions as follows:
| | Dividend Received | |
Fund | | Deduction Percentage | |
TA IDEX Asset Allocation - Conservative Portfolio | | 5.31 | % |
TA IDEX Asset Allocation - Growth Portfolio | | 41.18 | % |
TA IDEX Asset Allocation - Moderate Growth Portfolio | | 14.16 | % |
TA IDEX Asset Allocation - Moderate Portfolio | | 10.16 | % |
TA IDEX Multi-Manager Alternative Strategies Fund | | 1.18 | % |
TA IDEX Multi-Manager International Fund | | 5.84 | % |
For tax purposes, the Long-Term Capital Gain Designations for the year ended October 31, 2007 were as follows:
| | Long-Term Capital | |
Fund | | Designation | |
TA IDEX Asset Allocation – Conservative Portfolio | | $ | 12,903 | |
TA IDEX Asset Allocation - Growth Portfolio | | 53,648 | |
TA IDEX Asset Allocation - Moderate Growth Portfolio | | 70,685 | |
TA IDEX Asset Allocation - Moderate Portfolio | | 45,290 | |
TA IDEX Multi-Manager Alternative Strategies Fund | | — | |
TA IDEX Multi-Manager International Fund | | — | |
| | | | |
The information and distributions reported herein may differ from the information and distributions taxable to the shareholders for the calendar year ending December 31, 2007. Complete information will be computed and reported in conjunction with your 2007 Form 1099-DIV.
47
RESULTS OF SHAREHOLDER PROXY (unaudited)
Section 270.30e-1 under the Investment Company Act of 1940, as amended, titled “Reports to Stockholders of Management Companies,” requires regulated investment companies to report on all subject matters put to the vote of shareholders and provide final results. Accordingly, the Board of Trustees of the Fund solicited a vote by the shareholders for the following items.
At a special meeting of shareholders held on October 30, 2007, the results of the Proposals were as follows:
Proposal 1: | To elect a new Board of Trustees |
| | For | | Withheld | |
John K. Carter | | 1,869,801,381.126 | | 75,092,910.077 | |
Leo J. Hill | | 1,870,292,020.404 | | 74,602,270.799 | |
Joyce Galpern Norden | | 1,870,010,162.690 | | 74,884,128.513 | |
Neal M. Jewell | | 1,869,085,986.703 | | 75,808,304.500 | |
Russell A. Kimball, Jr. | | 1,869,975,193.416 | | 74,919,097.787 | |
Eugene M. Mannella | | 1,869,732,073.896 | | 75,162,217.307 | |
Norm R. Nielsen | | 1,870,076,377.259 | | 74,817,913.944 | |
Patricia L. Sawyer | | 1,870,218,037.071 | | 74,676,254.132 | |
John W. Waechter | | 1,869,642,547.953 | | 75,251,743.250 | |
Proposal 2: | To approve an amendment to the Agreement and Declaration of Trust |
For | | Withheld | | Abstain | |
1,216,704,908.632 | | 76,054,434.614 | | 186,736,131.957 | |
48
TRANSAMERICA IDEX MUTUAL FUNDS
Management of the Funds
Name, Address*** and Age | | Position(s)
Held | | Length of
Time
Served* | | Principal Occupation(s)
During Past Five Years | | Number of
Funds
in Fund
Complex
Overseen
by Trustee | | Other Board
Memberships |
| | | | | | | | | | |
Independent Trustees :** | | | | | | | | | | |
| | | | | | | | | | |
Leo J. Hill
(DOB: 3/27/56) | | Trustee | | Since 2002 | | Principal, Advisor Network Solutions, LLC (business consulting) (2006 to present); Trustee, Diversified Investors Portfolios (“DIP”), The Diversified Investors Funds Group (“DIFG”), The Diversified Investors Funds Group II (“DIFG II”) and Diversified Investors Strategic Variable Funds (“DISVF”) (2007 to present); Trustee, Transamerica IDEX Mutual Funds (“TA IDEX”) (2002 to present); Director, Transamerica Income Shares, Inc. (“TIS”) (2002 to present); Trustee, AEGON/Transamerica Series Trust (“ATST”) (2001 to present); Owner and President, Prestige Automotive Group (2001 to 2005); President, L. J. Hill & Company (1999 to present); Market President, Nations Bank of Sun Coast Florida (1998 to 1999); President and Chief Executive Officer, Barnett Banks of Treasure Coast Florida (1994 to 1998); Executive Vice President and Senior Credit Officer, Barnett Banks of Jacksonville, Florida (1991 to 1994); Senior Vice President and Senior Loan Administration Officer, Wachovia Bank of Georgia (1976 to 1991). | | 160 | | None |
| | | | | | | | | | |
Russell A. Kimball, Jr.
(DOB: 8/17/44) | | Trustee | | Since 2002 | | Trustee, DIP, DIFG, DIFG II and DISVF (2007 to present); Trustee, TA IDEX (2002 to present); Director, TIS (2002 to present); Trustee, ATST (1986 to present); General Manager, Sheraton Sand Key Resort (1975 to present). | | 160 | | None |
| | | | | | | | | | |
Norm R. Nielsen
(DOB: 5/11/39) | | Trustee | | Since 2006 | | Retired (2005 to present); Trustee, DIP, DIFG, DIFG II and DISVF (2007 to present); Trustee, TA IDEX (2006 to present); Director, TIS (2006 to present); Trustee, ATST (2006 to present); Director, Iowa City Area Development (1996 to 2004); Director, Iowa Health Systems (1994 to 2003); Director, U.S. Bank (1987 to 2006); President, Kirkwood Community College (1979 to 2005). | | 160 | | Buena Vista University
Board of Trustees
(2004 to present) |
49
Name, Address*** and Age | | Position(s)
Held | | Length of
Time
Served* | | Principal Occupation(s)
During Past Five Years | | Number of
Funds
in Fund
Complex
Overseen
by Trustee | | Other Board
Memberships |
| | | | | | | | | | |
John W. Waechter
(DOB: 2/25/52) | | Trustee | | Since 2005 | | Trustee, DIP, DIFG, DIFG II and DISVF (2007 to present); Trustee, TA IDEX (2005 to present); Director, TIS (2004 to present); Trustee, ATST (2004 to present); employee, RBC Dain Rauscher (securities dealer) (March 2004 to May 2004); Executive Vice President, Chief Financial Officer and Chief Compliance Officer, William R. Hough & Co. (securities dealer) (1979 to 2004); Treasurer, The Hough Group of Funds (1993 to 2004). | | 160 | | None |
| | | | | | | | | | |
Neal M. Jewell
(DOB: 2/12/35) | | Trustee | | Since 2007 | | Retired (2004 to present); Trustee, TA IDEX and ATST (2007 to present); Director, TIS (2007 to present); Trustee, DIP, DIFG, DIFG II and DISVF (1993 to present); Independent Trustee, EAI Select Managers Equity Fund (mutual fund) (1996 to 2004). | | 160 | | None |
| | | | | | | | | | |
Eugene M. Mannella
(DOB: 2/1/54) | | Trustee | | Since 2007 | | Self-employed consultant (2006 to present); President, Arapain Partners LLC (limited purpose broker-dealer) (1998 to present); Trustee, TA IDEX and ATST (2007 to present); Director, TIS (2007 to present); Trustee, DIP, DIFG, DIFG II and DISVF (1994 to present); President, International Fund Services (alternative asset administration) (1993 to 2005). | | 160 | | None |
| | | | | | | | | | |
Joyce Galpern Norden
(DOB: 6/1/39) | | Trustee | | Since 2007 | | Retired (2004 to present); Trustee, TA IDEX and ATST (2007 to present); Director, TIS (2007 to present); Trustee, DIP (2002 to present); Trustee, DIFG, DIFG II, and DISVF (1993 to present); Vice President, Institutional Advancement, Reconstructionist Rabbinical College (1996 to 2004). | | 160 | | Board of Governors, Reconstructionist Rabbinical College (2007 to present) |
| | | | | | | | | | |
Patricia L. Sawyer
(DOB: 7/1/50) | | Trustee | | Since 2007 | | Trustee, TA IDEX and ATST (2007 to present); Director, TIS (2007 to present); Trustee, DIP, DIFG, DIFG II, and DISVF (1993 to present); President and Executive Search Consultant, Smith & Sawyer LLC (consulting) (1989 to present). | | 160 | | None |
50
Name, Address*** and Age | | Position(s)
Held | | Length of
Time
Served* | | Principal Occupation(s)
During Past Five Years | | Number of
Funds
in Fund
Complex
Overseen
by Trustee | | Other Board
Memberships |
| | | | | | | | | | |
Interested Trustee:**** | | | | | | | | | | |
| | | | | | | | | | |
John K. Carter
(DOB: 4/24/61) | | Trustee | | Since 2006 | | President and Chief Executive Officer, DIP, DIFG, DIFG II and DISVF (August 2007 to present); Trustee, DIP, DIFG, DIFG II, and DISVF (2007 to present); Trustee (September 2006 to present), President and Chief Executive Officer (July 2006 to present), Senior Vice President (1999 to June 2006), Chief Compliance Officer, General Counsel and Secretary (1999 to August 2006), TA IDEX; Trustee (September 2006 to present), President and Chief Executive Officer (July 2006 to present), Senior Vice President (1999 to June 2006), Chief Compliance Officer, General Counsel and Secretary (1999 to August 2006), ATST; Director (September 2006 to present), President and Chief Executive Officer (July 2006 to present), Senior Vice President (2002 to June 2006), General Counsel, Secretary and Chief Compliance Officer (2002 to August 2006), TIS; President and Chief Executive Officer (July 2006 to present), Senior Vice President (1999 to June 2006), Director (2000 to present), General Counsel and Secretary (2000 to August 2006), Chief Compliance Officer (2004 to August 2006), TFAI; President and Chief Executive Officer (July 2006 to present), Senior Vice President (1999 to June 2006), Director (2001 to present), General Counsel and Secretary (2001 to August 2006), TFS; Vice President, AFSG Securities Corporation (2001 to present); Chief Executive Officer (July 2006 to present), Vice President, Secretary and Chief Compliance Officer, (2003 to August 2006), Transamerica Investors, Inc. (“TII”); Senior Vice President, General Counsel and Secretary, Transamerica Index Funds, Inc. (“TIF”) (2002 to 2004); Vice President, Transamerica Investment Services, Inc. (“TISI”) (2003 to 2005) and Transamerica Investment Management, LLC (“TIM”) (2001 to 2005). | | 160 | | None |
51
Officers
Name, Address*** and Age | | Position(s) Held | | Length of
Time
Served† | | Principal Occupation(s)
During the Past Five Years |
| | | | | | |
John K. Carter
(DOB: 4/24/61) | | Chief Executive Officer and President | | Since 1999 | | See the table above. |
| | | | | | |
Dennis P. Gallagher
(DOB: 12/19/70) | | Vice President, General Counsel and Secretary | | Since 2006 | | Vice President, General Counsel and Secretary, TA IDEX, ATST and TIS (September 2006 to present); Vice President, General Counsel and Secretary, DIP, DIFG, DIFG II and DISVF (August 2007 to present); Vice President and Secretary, TII (September 2006 to present); Director, Senior Vice President, General Counsel and Secretary, TFAI and TFS (September 2006 to present); Director, Deutsche Asset Management (1998 to 2006). |
| | | | | | |
Elizabeth L. Belanger
(DOB: 1/7/72) | | Deputy General Counsel, Assistant Secretary and Conflicts of Interest Officer | | Since 2007 | | Deputy General Counsel, Assistant Secretary and Conflicts of Interest Officer, TII (November 2007 to present); Deputy General Counsel, Assistant Secretary and Conflicts of Interest Officer, TA IDEX, ATST and TIS (July 2007 to present); Deputy General Counsel and Conflicts of Interest Officer (August 2007 to present), Assistant Secretary (August 2005 to present), DIP, DIFG, DIFG II and DISVF; Vice President and Senior Counsel, Diversified since 2005); Director, TFLIC (April 2006 to present); Director of Compliance, Domini Social Investments LLC (November 2003 to May 2005); Associate, Bingham McCutchen LLP (September 1997 to October 2003). |
| | | | | | |
Joe P. Carusone
(DOB: 9/8/65) | | Vice President, Treasurer and Principal Financial Officer | | Since 2007 | | Vice President, Treasurer and Principal Financial Officer, TII (November 2007 to present); Vice President, Treasurer and Principal Financial Officer, TA IDEX, ATST and TIS (July 2007 to present); Vice President (August 2007 to present), Treasurer and Principal Financial Officer (2001 to present), DIP, DIFG, DIFG II and DISVF; Vice President, Diversified (since 1999); President, Diversified Investors Securities Corp. (“DISC”) (February 2007 to present); Director, TFLIC (2004 to present). |
| | | | | | |
Christopher A. Staples
(DOB: 8/14/70) | | Vice President and Chief Investment Officer | | Since 2004 | | Vice President and Chief Investment Officer, TII (November 2007 to present); Vice President (July 2007 to present), Chief Investment Officer (June 2007 to present), Senior Vice President (June 2007 to July 2007), Senior Vice President - Investment Management (July 2006 to June 2007), Vice President - Investment Management (2004 to July 2006), TA IDEX, ATST and TIS; Vice President and Chief Investment Officer, DIP, DIFG, DIFG II and DISVF (August 2007 to present); Director, TFAI and TFS (2005 to present); Assistant Vice President, Raymond James & Associates (1999 to 2004). |
52
Name, Address*** and Age | | Position(s) Held | | Length of
Time
Served† | | Principal Occupation(s)
During the Past Five Years |
| | | | | | |
T. Gregory Reymann, II
(DOB: 5/13/58) | | Chief Compliance Officer | | Since 2004 | | Chief Compliance Officer (September 2006 to present) and Vice President (2005 to present), TII; Chief Compliance Officer TA IDEX, ATST, TIS and TFAI (September 2006 to present); Senior Vice President, TFAI (September 2006 to present); Senior Vice President, TA IDEX, ATST and TIS (September 2006 to July 2007); Vice President and Senior Counsel, TFS (2005 to 2006); Vice President and Counsel, TA IDEX, ATST, TFAI and TIS (2004 to 2006), TFS (2004 to 2005) and TIF (2004); Attorney, Gould, Cooksey, et al. (2002 to 2004). |
| | | | | | |
Michael A. Masson
(DOB: 1/21/71) | | Assistant Treasurer | | Since 2007 | | Assistant Treasurer, TII (November 2007 to present); Assistant Treasurer (July 2007 to present) , Assistant Vice President (2005 to present), TA IDEX, ATST and TIS; Assistant Treasurer, DIP, DIFG, DIFG II and DISVF (August 2007 to present); Assistant Vice President, TII (2005 to present); Assistant Vice President, TFS and TFAI (2005 to present); Assistant Vice President, JPMorgan Chase & Co. (1999 to 2005). |
| | | | | | |
Suzanne Valerio-Montemurro
(DOB: 8/13/64) | | Assistant Treasurer | | Since 2007 | | Assistant Treasurer, TII (November 2007 to present); Assistant Treasurer, TA IDEX, ATST and TIS (July 2007 to present); Assistant Treasurer, DIP, DIFG, DIFG II and DISVF (August 2007 to present); Vice President, Diversified (with Diversified since 1998). |
* | | Each Trustee shall hold office until: 1) his or her successor is elected and qualified or 2) he or she resigns or his or her term as a Trustee is terminated in accordance with the Transamerica IDEX by-laws. |
** | | Independent trustee (“Independent Trustee”) means a trustee who is not an “interested person” (as defined under the 1940 Act) of the Trust (the “Independent Trustees”). |
*** | | The mailing address of each Trustee and Officer is c/o Secretary of the Funds, 570 Carillon Parkway, St. Petersburg, Florida 33716. |
**** | | May be deemed an “interested person” (as that term is defined in Section 2(a)(19) of the 1940 Act) of the Trust because of his employment with the Advisor or an affiliate of the Advisor. |
† | | If an officer has held offices for different Funds for different periods of time, the earliest applicable date is shown. |
Additional information about the Fund trustees can be found in the Statement of Additional Information, available, without charge, upon request, by calling toll free 1-888-233-4339.
53
PROXY VOTING POLICIES AND PROCEDURES AND QUARTERLY PORTFOLIO HOLDINGS
A description of the Transamerica IDEX Mutual Funds’ proxy voting policies and procedures is available in the Statement of Additional Information of the Funds, available without charge upon request by calling 1-888-233-4339 (toll free) or on the Securities and Exchange Commission website (http://www.sec.gov).
In addition, the Funds are required to file Form N-PX, with their complete proxy voting records for the 12 months ended June 30th, no later than August 31st of each year. The Form is available without charge: (1) from the Funds, upon request by calling 1-888-233-4339; and (2) on the SEC’s website at (http://www.sec.gov).
The Funds file their complete schedule of portfolio holdings with the SEC for the first and third quarter of each fiscal year on Form N-Q, which is available on the Commission’s website at (http://www.sec.gov). The Funds’ Form N-Q may be reviewed and copied at the Commission’s Public Reference Room in Washington, D.C. Information on the operation of the Public Reference Room may be obtained by calling 1-800-SEC-0330.
Important Notice Regarding Delivery of Shareholder Documents
Every year we send shareholders informative materials such as the Transamerica IDEX Annual Report, the Transamerica IDEX Prospectus, and other required documents that keep you informed regarding your funds. Transamerica IDEX will only send one piece per mailing address, a method that saves your Funds money by reducing mailing and printing costs. We will continue to do this unless you tell us. To elect to receive individual mailings, simply call a Transamerica IDEX Customer Service Representative toll free at 1-888-233-4339, 8 a.m. to 7 p.m. Eastern Time, Monday–Friday. Your request will take effect within 30 days.
P.O. Box 9012
Clearwater, FL 33758-9012

Customer Service 1-888-233-IDEX (4339)
P.O. Box 9012 · Clearwater, FL 33758-9012
Distributor: Transamerica Capital, Inc.

Class I Funds
Annual Report
October 31, 2007
www.transamericaidex.com
Customer Service 1-888-233-IDEX (4339)
P.O. Box 9012 · Clearwater, FL 33758-9012
Distributor: Transamerica Capital, Inc.
Dear Fellow Shareholder,
On behalf of Transamerica IDEX Mutual Funds, I would like to thank you for your continued support and confidence in our products as we look forward to continuing to serve you and your financial adviser in the future. We value the trust you have placed in us.
This annual report is provided to you with the intent of presenting a comprehensive review of the investments of each of your funds. The Securities and Exchange Commission requires that annual and semi-annual reports be sent to all shareholders, and we believe this report to be an important part of the investment process. In addition to providing a comprehensive review, this report also provides a discussion of accounting policies as well as matters presented to shareholders that may have required their vote.
We believe it is important to recognize and understand current market conditions in order to provide a context for reading this report. The positive returns experienced in the equity markets for the trailing 12 months ending October 31, 2007, mask the volatility experienced along the way, with significant pullbacks occurring in February-March and July-August. The Federal Reserve Board (“Federal Reserve”) was on hold for most of the past twelve months but more recently in September and October lowered its target for the federal funds rate by 0.50% and 0.25% respectively. The rate reductions by the Federal Reserve signaled an effort to inject liquidity and stability to the markets which have been adversely affected by concerns over subprime debt. While Gross Domestic Product growth remains positive, investor concerns over the extent to which subprime debt may affect consumer spending and persistently high oil prices have been a check on market returns. For the twelve months ending October 31, 2007, the Dow Jones Industrial Average returned 17.94%, the Standard & Poor’s 500 Composite Stock Index returned 14.56%, and the Lehman Brothers Aggregate Bond Index returned 5.38%. Please keep in mind it is important to maintain a diversified portfolio as investment returns have historically been difficult to predict.
In addition to your active involvement in the investment process, we firmly believe that a financial adviser is a key resource to help you build a complete picture of your current and future financial needs. Financial advisors are familiar with the market’s history, including long-term returns and volatility of various asset classes.
With your financial adviser, you can develop an investment program that incorporates factors such as your goals, your investment timeline, and your risk tolerance.
Please contact your financial adviser if you have any questions about the contents of this report, and thanks again for the confidence you have placed in us.
Sincerely,
John K. Carter | Christopher A. Staples |
President & Chief Executive Officer | Vice President & Chief Investment Officer |
Transamerica IDEX Mutual Funds | Transamerica IDEX Mutual Funds |
The views expressed in this report reflect those of the portfolio managers only and may not necessarily represent the views of Transamerica IDEX Mutual Funds. These views are subject to change based upon market conditions. These views should not be relied upon as investment advice and are not indicative of trading intent on behalf of the Transamerica IDEX Mutual Funds.
TA IDEX AllianceBernstein International Value
MARKET ENVIRONMENT
International equity markets were strong for the twelve months ending October 31, 2007, as the Morgan Stanley Capital International (EAFE) Index (“MSCI-EAFE”) rose 25.43%. Gains were witnessed through the middle of 2006 as markets were boosted by optimism about the outlook for global economic growth and corporate profitability. However, by the end of the second quarter, markets suffered a severe bout of turbulence amid a liquidity crisis in short-term money markets triggered by mounting problems in the US sub-prime mortgage market. Markets rebounded through October after injections of liquidity by many central banks and a cut in US interest rates helped to ease investor anxiety. Most sectors posted double digit returns for the period, although finance and medical stocks lagged.
PERFORMANCE
For the year ended October 31, 2007, TA IDEX AllianceBernstein International Value Class I returned 23.99%. By comparison its benchmark, the MSCI-EAFE, returned 25.43%. For the year ended October 31, 2007, the net expense ratio of the Fund was 0.93%.
STRATEGY REVIEW
Contributors to our performance premium during the period were concentrated in the transportation and industrial commodities sector. Steelmakers JFE Holdings, Inc., ArcelorMittal and voestalpine AG benefited from high steel prices, while commodity price strength lifted shares of diversified Anglo-Swiss miner Xstrata plc. In the transportation sector, Japanese shipping company Mitsui O.S.K. Lines, Ltd. benefited from strong demand and a recovery in shipping rates. Our overweight of the industrial commodities sector, and our underweight of the medical sector, also contributed to performance.
Detractors from relative returns were both our overweight and the relative weakness of some of our holdings within the financial sector. The biggest detractors in terms of stock selection included some of our Japanese financial holdings, notably leasing and consumer finance group ORIX Corporation and Sumitomo Mitsui Financial Group Inc., one of Japan’s three biggest nationwide banking groups. Both stocks suffered due to the market’s jitters over the sub-prime loan crisis despite having limited exposure to sub-prime mortgages or related financial products. The Bank of Japan’s decision to delay an expected increase in interest rates also dampened the market’s hopes that higher rates would help to widen banks’ lending margins. Also suffering from the sub-prime crisis were positions in financial companies ING Groep N.V. and HBOS plc. Meanwhile, investors reacted negatively to Fortis SA/NV’s participation in a consortium that is bidding for ABN AMRO Holding N.V., fearing that it will overpay for the Dutch bank.
Sharon E. Fay
Kevin F. Simms
Henry S. D’Auria, CFA
Marilyn G. Fedak
John P. Mahedy, CPA
Co-Portfolio Managers
AllianceBernstein L.P.
1
(unaudited)
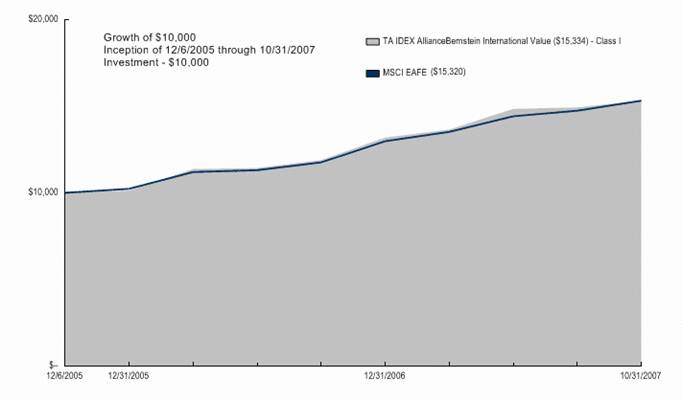
Average Annual Total Return for Periods Ended 10/31/2007
| | 1 Year | | From Inception | | Inception Date | |
Class I (NAV) | | 23.99 | % | 25.17 | % | 12/6/05 | |
MSCI EAFE (1) | | 25.43 | % | 25.33 | % | 12/6/05 | |
NOTES
(1) The Morgan Stanley Capital International Europe, Australasia, and Far East (MSCI-EAFE) Index is an unmanaged index used as a general measure of market performance. Calculations assume dividends and capital gains are reinvested and do not include any managerial expenses. From inception calculation is based on life of the Fund.
The performance data presented represents past performance, future results may vary. Performance data does not reflect the deduction of taxes that would be paid on fund distributions or the redemption of fund shares. Investment return and principal value will fluctuate so that an investor’s shares, when redeemed, may be worth more or less than their original cost. Current performance may be lower or higher than performance quoted. Please see www.transamericaidex.com for performance data current to the most recent month-end.
Net Asset Value (NAV) returns include the reinvestment of dividends and capital gains. Fund shares are sold without a sales load.
International investing involves special risks including currency fluctuations, political instability, and different financial accounting standards.
This material must be preceded or accompanied by a current prospectus, which includes specific contents regarding the investment objectives and policies of this Fund.
This Fund is only available in Class I shares, which are not available for direct investment by the public.
2
UNDERSTANDING YOUR FUND’S EXPENSES
(unaudited)
SHAREHOLDER EXPENSES
Fund shareholders may incur two types of costs: (1) transaction costs, including sales charges (loads) on purchases, contingent deferred sales charges on redemptions and redemption fees; and (2) ongoing costs, including management fees, dividend expense on short-sales, and other fund expenses.
The following Example is intended to help you understand your ongoing costs (in dollars and cents) of investing in the Fund and to compare these costs with the ongoing costs of investing in other funds.
The Example is based on an investment of $1,000 invested at May 1, 2007 and held for the entire period until October 31, 2007.
ACTUAL EXPENSES
The first line in the table below provides information about actual account values and actual expenses. You may use the information in this line, together with the amount you invested, to estimate the expenses that you paid over the period. Simply divide your account value by $1,000 (for example, an $8,600 account value divided by $1,000 = 8.6), then multiply the result by the number in the first line of your Fund under the heading entitled “Expenses Paid During Period” to estimate the expenses you paid on your account during this period.
HYPOTHETICAL EXAMPLE FOR COMPARISON PURPOSES
The second line in the table below provides information about hypothetical account values and hypothetical expenses based on the Fund’s actual expense ratio and an assumed rate of return of 5% per year before expenses, which is not the Fund’s actual return. The hypothetical account values and expenses may not be used to estimate the actual ending account balance or expenses you paid for the period. You may use this information to compare the ongoing costs of investing in your Fund and other funds. To do so, compare this 5% hypothetical example with the 5% hypothetical examples that appear in the shareholder reports of the other funds.
Please note that the expenses shown in the table are meant to highlight your ongoing costs only and do not reflect any transactional costs, such as sales charges, redemption fees, brokerage commissions paid on purchases and sales of fund shares. Therefore, the second line under the Fund in the table is seful in comparing ongoing costs only, and will not help you determine the relative total costs of owning different funds. If any of these transaction costs were included, your costs would be higher. The expenses shown in the table do not reflect any fees that may be charged to you by brokers, financial intermediaries or other financial institutions.
| | Beginning | | Ending | | Annualized | | Expenses | |
| | Account | | Account | | Expense | | Paid During | |
| | Value | | Value | | Ratio | | Period (a) | |
Class I | | | | | | | | | |
Actual | | $ | 1,000.00 | | $ | 1,073.59 | | 0.93 | % | $ | 4.85 | |
Hypothetical (b) | | 1,000.00 | | 1,020.46 | | 0.93 | | 4.72 | |
| | | | | | | | | | | | |
(a) Expenses are calculated using the Fund’s annualized expense ratio (as disclosed in the table), multiplied by the average account value for the period, multiplied by the number of days in the period (184 days), and divided by the number of days in the year (365 days).
(b) 5% return per year before expenses.
GRAPHICAL PRESENTATION OF SCHEDULE OF INVESTMENTS
By Region
At October 31, 2007
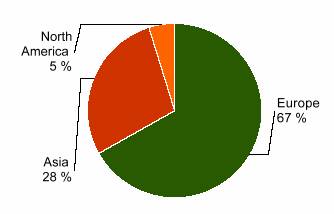
This chart shows the percentage breakdown by region of the Fund’s total investment securities.
3
SCHEDULE OF INVESTMENTS
At October 31, 2007
(all amounts except share amounts in thousands)
| | Shares | | Value | |
COMMON STOCKS (97.5%) | | | | | |
Australia (4.0%) | | | | | |
Australia & New Zealand Banking | | 62,700 | | $ | 1,749 | |
BHP Billiton, Ltd. | | 82,300 | | 3,516 | |
National Australia Bank, Ltd. | | 148,521 | | 5,933 | |
Oxiana, Ltd. ‡ | | 589,700 | | 2,295 | |
QBE Insurance Group, Ltd. | | 113,379 | | 3,415 | |
Zinifex, Ltd. | | 254,500 | | 3,927 | |
Austria (0.9%) | | | | | |
Voestalpine AG | | 49,100 | | 4,409 | |
Belgium (1.5%) | | | | | |
Fortis | | 241,333 | | 7,702 | |
Fortis-Strip Vvpr ‡ | | 96,532 | | 2 | |
Canada (4.7%) | | | | | |
Canadian Imperial Bank of Commerce | | 35,400 | | 3,802 | |
Fairfax Financial Holdings, Ltd. | | 4,500 | | 1,238 | |
Gerdau Ameristeel Corp. | | 226,700 | | 3,081 | |
ING Canada, Inc. | | 37,566 | | 1,780 | |
Methanex Corp. | | 76,500 | | 2,324 | |
Petro-Canada | | 46,600 | | 2,674 | |
Royal Bank of Canada | | 43,104 | | 2,543 | |
Sun Life Financial, Inc. | | 54,900 | | 3,173 | |
Teck Cominco, Ltd. Class B | | 73,000 | | 3,636 | |
Finland (1.6%) | | | | | |
Nokia OYJ | | 87,300 | | 3,454 | |
Stora ENSO OYJ Class R ^ | | 264,600 | | 4,847 | |
France (12.8%) | | | | | |
Air France-KLM | | 77,800 | | 2,953 | |
Arkema ‡ | | 30,400 | | 2,065 | |
BNP Paribas | | 67,820 | | 7,466 | |
Credit Agricole SA | | 153,465 | | 6,059 | |
France Telecom SA | | 121,400 | | 4,472 | |
Lagardere Sca | | 56,400 | | 4,760 | |
Michelin (C.G.D.E.) Class B | | 39,000 | | 5,215 | |
Renault SA | | 70,800 | | 11,872 | |
Sanofi-Aventis | | 78,600 | | 6,884 | |
Societe Generale | | 39,020 | | 6,541 | |
Total SA | | 102,900 | | 8,285 | |
Germany (12.7%) | | | | | |
Allianz SE | | 48,200 | | 10,824 | |
BASF AG | | 66,200 | | 9,146 | |
Daimler AG | | 9,200 | | 1,011 | |
Deutsche Bank AG | | 50,800 | | 6,765 | |
Deutsche Lufthansa AG | | 160,600 | | 4,738 | |
Deutsche Telekom AG | | 242,200 | | 4,958 | |
E.ON AG | | 58,200 | | 11,359 | |
Epcos AG | | 30,200 | | 608 | |
Fresenius Medical Care AG | | 19,500 | | 1,029 | |
Muenchener Rueckversicherungs AG | | 43,800 | | 8,391 | |
RWE AG | | 53,810 | | 7,336 | |
Italy (2.9%) | | | | | |
Buzzi Unicem SpA | | 80,900 | | 2,288 | |
ENI SpA | | 239,500 | | 8,704 | |
Fondiaria-Sai SpA | | 43,700 | | 2,113 | |
Fondiaria-Sai SpA | | 5,900 | | $ | 201 | |
Italcementi SpA | | 72,400 | | 1,657 | |
Japan (23.2%) | | | | | |
Aisin Seiki Co., Ltd. | | 56,200 | | 2,291 | |
ALPS Electric Co., Ltd. | | 163,800 | | 2,037 | |
Canon, Inc. | | 50 | | 3 | |
Dainippon Ink & Chemical, Inc. | | 190,000 | | 905 | |
Edion Corp. | | 134,400 | | 1,532 | |
Fujitsu, Ltd. | | 628,000 | | 4,903 | |
Hachijuni Bank, Ltd. (The) ‡ | | 270,000 | | 2,056 | |
Honda Motor Co., Ltd. | | 132,900 | | 4,957 | |
Isuzu Motors, Ltd. ^ | | 659,000 | | 3,247 | |
ITOCHU Corp. | | 166,000 | | 2,075 | |
JFE Holdings, Inc. | | 116,300 | | 6,749 | |
Kyushu Electric Power Co., Inc. | | 122,200 | | 2,973 | |
Mitsubishi Chemical Holdings Corp. | | 467,000 | | 3,836 | |
Mitsubishi Corp. | | 136,700 | | 4,209 | |
Mitsubishi UFJ Financial Group, Inc. | | 761,000 | | 7,519 | |
Mitsui & Co., Ltd. | | 204,000 | | 5,220 | |
Mitsui Chemicals, Inc. | | 333,000 | | 3,099 | |
Mitsui O.S.K. Lines, Ltd. | | 335,000 | | 5,475 | |
Namco Bandai Holdings, Inc. | | 126,000 | | 1,932 | |
Nippon Mining Holdings, Inc. | | 259,000 | | 2,422 | |
Nippon Steel Corp. | | 269,000 | | 1,771 | |
Nippon Telegraph & Telephone Corp. | | 1,108 | | 5,075 | |
Nippon Yusen Kabushiki Kaisha | | 229,000 | | 2,344 | |
Nissan Motor Co., Ltd. | | 600,600 | | 6,908 | |
Oki Electric Industry Co., Ltd. ‡^ | | 309,000 | | 523 | |
ORIX Corp. | | 21,240 | | 4,276 | |
Sharp Corp. | | 295,000 | | 4,619 | |
Sumitomo Mitsui Financial Group, Inc. | | 921 | | 7,462 | |
Tokyo Electric Power Co., Inc. (The) | | 209,700 | | 5,311 | |
Toshiba Corp. ^ | | 638,000 | | 5,340 | |
Tosoh Corp. | | 303,000 | | 1,921 | |
Toyota Motor Corp. | | 132,900 | | 7,574 | |
Netherlands (5.4%) | | | | | |
Arcelor Mittal | | 114,647 | | 9,189 | |
ING Groep NV | | 219,800 | | 9,870 | |
Koninklijke Ahold NV ‡ | | 289,760 | | 4,343 | |
Koninklijke BAM Groep NV | | 93,900 | | 2,474 | |
Wolters Kluwer NV | | 73,200 | | 2,291 | |
Singapore (0.4%) | | | | | |
Neptune Orient Lines, Ltd. | | 637,000 | | 2,242 | |
Spain (2.2%) | | | | | |
Banco Santander Central Hispano SA | | 241,200 | | 5,234 | |
Repsol YPF SA | | 151,600 | | 5,977 | |
Sweden (1.0%) | | | | | |
Nordea Bank AB | | 120,400 | | 2,150 | |
Svenska Cellulosa AB Class B | | 182,400 | | 3,212 | |
Switzerland (2.1%) | | | | | |
Credit Suisse Group | | 100,000 | | 6,721 | |
Novartis AG | | 77,530 | | 4,120 | |
4
| | Shares | | Value | |
United Kingdom (22.1%) | | | | | |
Antofagasta PLC | | 24,700 | | $ | 430 | |
Associated British Foods PLC | | 21,600 | | 409 | |
AstraZeneca PLC | | 123,400 | | 6,083 | |
Aviva PLC | | 368,500 | | 5,783 | |
BAE Systems PLC | | 568,700 | | 5,883 | |
Barclays PLC | | 593,500 | | 7,447 | |
BHP Billiton PLC | | 72,000 | | 2,739 | |
BP PLC | | 365,700 | | 4,748 | |
British American Tobacco PLC | | 114,100 | | 4,338 | |
GlaxoSmithKline PLC | | 385,000 | | 9,901 | |
HBOS PLC | | 436,500 | | 7,916 | |
Home Retail Group PLC | | 376,000 | | 3,406 | |
ITV PLC | | 1,473,770 | | 3,034 | |
Marston’s PLC | | 231,200 | | $ | 1,652 | |
Mitchells & Butlers PLC | | 180,200 | | 2,491 | |
Rio Tinto PLC | | 40,300 | | 3,759 | |
Royal & Sun Alliance Insurance Group | | 659,161 | | 2,159 | |
Royal Bank of Scotland Group PLC | | 836,300 | | 8,973 | |
Royal Dutch Shell PLC Class A | | 315,630 | | 13,800 | |
Sabmiller PLC | | 21,119 | | 634 | |
Trinity Mirror PLC | | 98,700 | | 824 | |
Vodafone Group PLC | | 3,086,312 | | 12,117 | |
Xstrata PLC | | 84,840 | | 6,075 | |
Total Common Stocks (cost $421,818) | | | | 506,188 | |
| | | | | |
Total Security Lending Collateral (cost $8,918) ± | | | | 8,918 | |
Total Investment Securities (cost $430,736) # | | | | $ | 515,106 | |
NOTES TO SCHEDULE OF INVESTMENTS
^ | | At October 31, 2007, all or a portion of this security is on loan (see Note 1). The value at October 31, 2007 of all securities on loan is $8,344. |
± | | Cash collateral for the Repurchase Agreements, valued at $1,627, that serve as collateral for securities lending, is invested in corporate and government bonds with interest rates and maturity dates ranging from 0.00% - 8.125% and 11/14/2007 - 9/15/2037. |
‡ | | Non Income Producing |
# | | Aggregate cost for federal income tax purposes is $430,736. Aggregate gross unrealized appreciation for all securities in which there is an excess of value over tax cost and aggregate gross unrealized depreciation for all securities in which there is an excess of tax cost over value were $95,074 and $10,704, respectively. Net unrealized appreciation for tax purposes is $84,370. |
The notes to the financial statements are an integral part of this report.
5
(unaudited)
| | Percentage of | | | |
| | Total Investments | | Value | |
INVESTMENTS BY INDUSTRY: | | | | | |
Commercial Banks | | 16.1 | % | $ | 82,849 | |
Metals & Mining | | 10.0 | % | 51,576 | |
Oil, Gas & Consumable Fuels | | 9.1 | % | 46,609 | |
Insurance | | 7.6 | % | 39,077 | |
Automobiles | | 6.9 | % | 35,568 | |
Pharmaceuticals | | 5.2 | % | 26,989 | |
Chemicals | | 4.5 | % | 23,297 | |
Electric Utilities | | 3.8 | % | 19,643 | |
Diversified Financial Services | | 3.4 | % | 17,574 | |
Diversified Telecommunication Services | | 2.8 | % | 14,505 | |
Capital Markets | | 2.6 | % | 13,486 | |
Wireless Telecommunication Services | | 2.4 | % | 12,117 | |
Trading Companies & Distributors | | 2.2 | % | 11,505 | |
Media | | 2.1 | % | 10,909 | |
Computers & Peripherals | | 2.0 | % | 10,243 | |
Marine | | 2.0 | % | 10,061 | |
Paper & Forest Products | | 1.6 | % | 8,058 | |
Airlines | | 1.5 | % | 7,691 | |
Auto Components | | 1.5 | % | 7,506 | |
Multi-Utilities | | 1.4 | % | 7,337 | |
Aerospace & Defense | | 1.1 | % | 5,883 | |
Household Durables | | 0.9 | % | 4,619 | |
Food & Staples Retailing | | 0.8 | % | 4,343 | |
Tobacco | | 0.8 | % | 4,338 | |
Consumer Finance | | 0.8 | % | 4,276 | |
Construction Materials | | 0.8 | % | 3,945 | |
Communications Equipment | | 0.7 | % | 3,454 | |
Internet & Catalog Retail | | 0.7 | % | 3,406 | |
Electronic Equipment & Instruments | | 0.6 | % | 3,168 | |
Hotels, Restaurants & Leisure | | 0.5 | % | 2,491 | |
Construction & Engineering | | 0.5 | % | 2,474 | |
Beverages | | 0.4 | % | 2,286 | |
Leisure Equipment & Products | | 0.4 | % | 1,932 | |
Specialty Retail | | 0.3 | % | 1,532 | |
Health Care Providers & Services | | 0.2 | % | 1,029 | |
Food Products | | 0.1 | % | 409 | |
Office Electronics | | 0.0 | % | 3 | |
Investment Securities, at value | | 98.3 | % | 506,188 | |
Short-Term Investments | | 1.7 | % | 8,918 | |
Total Investments | | 100.0 | % | $ | 515,106 | |
The notes to the financial statements are an integral part of this report.
6
TA IDEX Bjurman, Barry Micro Emerging Growth
MARKET ENVIRONMENT
US equities have sustained a strong performance for the fiscal year period, credited to a mix of strong corporate profits, expanding global economies, and relatively low interest rates. However, the stock market’s tone progressively turned less optimistic as troubles in the market for risky mortgages surfaced.
Volatility in financial markets surged, faced with the effects of a spreading credit crunch that brought about massive losses in several banks and hedge funds. Rising energy prices further helped to sour investors’ mood, raising concerns about a possible drag on corporate profits and consumer spending. Nevertheless, the Federal Reserve Board lowered its federal funds rate in consecutive meetings, successfully revitalizing the market.
PERFORMANCE
For the year ended October 31, 2007, TA IDEX Bjurman, Barry Micro Emerging Growth Class I returned 19.48%. By comparison its benchmark, the Russell 2000 Growth Index (“Russell 2000 Growth”), returned 16.73%. For the year ended October 31, 2007, the net expense ratio of the Fund was 1.16%.
STRATEGY REVIEW
Corporate profits have weakened relative to earlier periods, as a result of the economic slowdown induced by the credit turmoil. The sectors that performed the best were energy, technology, manufacturing, and basic materials, with financials, transportation, and consumer sector components clearly lagging behind.
The portfolio outperformed the Russell 2000 Growth due to positive results in both sector allocation and selection. The portfolio was appropriately overweighted in the faster earnings growth sectors such as technology, energy, and manufacturing; at the same time it avoided the worse performing retail and financial stocks. The selection results were helped in large part by good performance in select energy (Flowtech Industries Ag, Arena Resources, Inc.), transportation (TBS International Limited, Navios Maritime Holdings Inc.), and consumer staples (Jones Soda Co.) stocks. The stocks that had the greatest negative impact were C-COR Incorporated, Premier Exhibitions, Inc., and Portfolio Recovery Associates, Inc.
Company size was a key contributor of performance. Within the small cap arena, investors have gravitated towards larger capitalization stocks, benefiting the sizeweighted Russell 2000 Growth. The portfolio had a heavier weighting in the smaller capitalization and micro-cap stocks, disadvantaging its stocks.
Though value-oriented stocks dominated in 2006, growth stocks have outperformed for most of 2007, coming off several years of underperformance. The marketplace has increasingly favored companies characterized by high earnings growth and momentum; attributes that we favor and are typically found in the portfolio.
O. Thomas Barry, III, CFA, CIC
Portfolio Manager
Bjurman, Barry & Associates
7
(unaudited)
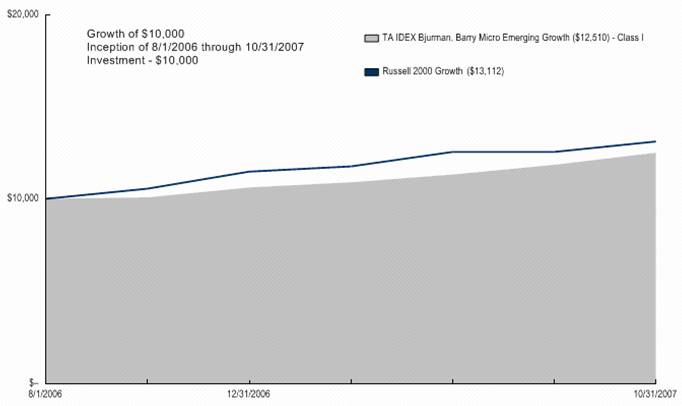
Average Annual Total Return for Periods Ended 10/31/2007
| | | | From | | Inception | |
| | 1 Year | | Inception | | Date | |
Class I (NAV) | | 19.48 | % | 19.59 | % | 8/1/06 | |
Russell 2000 Growth (1) | | 16.73 | % | 22.40 | % | 8/1/06 | |
NOTES
(1) The Russell 2000 Growth (Russell 2000 Growth) Index is an unmanaged index used as a general measure of market performance. Calculations assume dividends and capital gains are reinvested and do not include any managerial expenses. From inception calculation is based on life of the Fund.
The performance data presented represents past performance, future results may vary. Performance data does not reflect the deduction of taxes that would be paid on fund distributions or the redemption of fund shares. Investment return and principal value will fluctuate so that an investor’s shares, when redeemed, may be worth more or less than their original cost. Current performance may be lower or higher than performance quoted. Please see www.transamericaidex.com for performance data current to the most recent month-end.
Net Asset Value (NAV) returns include the reinvestment of dividends and capital gains. Fund shares are sold without a sales load.
Investing in small cap stocks generally involves greater risks so an investment in the Fund may not be appropriate for everyone.
This material must be preceded or accompanied by a current prospectus, which includes specific contents regarding the investment objectives and policies of this Fund.
This Fund is only available in Class I shares, which are not available for direct investment by the public.
8
UNDERSTANDING YOUR FUND’S EXPENSES
(unaudited)
SHAREHOLDER EXPENSES
Fund shareholders may incur two types of costs: (1) transaction costs, including sales charges (loads) on purchases, contingent deferred sales charges on redemptions and redemption fees; and (2) ongoing costs, including management fees, dividend expense on short-sales, and other fund expenses.
The following Example is intended to help you understand your ongoing costs (in dollars and cents) of investing in the Fund and to compare these costs with the ongoing costs of investing in other funds.
The Example is based on an investment of $1,000 invested at May 1, 2007 and held for the entire period until October 31, 2007.
ACTUAL EXPENSES
The first line in the table below provides information about actual account values and actual expenses. You may use the information in this line, together with the amount you invested, to estimate the expenses that you paid over the period. Simply divide your account value by $1,000 (for example, an $8,600 account value divided by $1,000 = 8.6), then multiply the result by the number in the first line of your Fund under the heading entitled “Expenses Paid During Period” to estimate the expenses you paid on your account during this period.
HYPOTHETICAL EXAMPLE FOR COMPARISON PURPOSES
The second line in the table below provides information about hypothetical account values and hypothetical expenses based on the Fund’s actual expense ratio and an assumed rate of return of 5% per year before expenses, which is not the Fund’s actual return. The hypothetical account values and expenses may not be used to estimate the actual ending account balance or expenses you paid for the period. You may use this information to compare the ongoing costs of investing in your Fund and other funds. To do so, compare this 5% hypothetical example with the 5% hypothetical examples that appear in the shareholder reports of the other funds.
Please note that the expenses shown in the table are meant to highlight your ongoing costs only and do not reflect any transactional costs, such as sales charges, redemption fees, brokerage commissions paid on purchases and sales of fund shares. Therefore, the second line under the Fund in the table is useful in comparing ongoing costs only, and will not help you determine the relative total costs of owning different funds. If any of these transaction costs were included, your costs would be higher. The expenses shown in the table do not reflect any fees that may be charged to you by brokers, financial intermediaries or other financial institutions.
| | Beginning | | Ending | | Annualized | | Expenses | |
| | Account | | Account | | Expense | | Paid During | |
| | Value | | Value | | Ratio | | Period (a) | |
Class I | | | | | | | | | |
Actual | | $ | 1,000.00 | | $ | 1,129.07 | | 1.14 | % | $ | 6.10 | |
Hypothetical (b) | | 1,000.00 | | 1,019.41 | | 1.14 | | 5.79 | |
| | | | | | | | | | | | |
(a) | Expenses are calculated using the Fund’s annualized expense ratio (as disclosed in the table), multiplied by the average account value for the period, multiplied by the number of days in the period (184 days), and divided by the number of days in the year (365 days). |
| | |
(b) | 5% return per year before expenses. |
GRAPHICAL PRESENTATION OF SCHEDULE OF INVESTMENTS
By Sector
At October 31, 2007

This chart shows the percentage breakdown by sector of the Fund’s total investment securities.
9
SCHEDULE OF INVESTMENTS
At October 31, 2007
(all amounts except share amounts in thousands)
| | Shares | | Value | |
COMMON STOCKS (99.3%) | | | | | |
Aerospace & Defense (4.4%) | | | | | |
Cubic Corp. | | 53,500 | | $ | 2,407 | |
Stanley, Inc. ‡ | | 63,100 | | 1,671 | |
Auto Components (0.9%) | | | | | |
Spartan Motors, Inc. | | 57,400 | | 806 | |
Beverages (1.5%) | | | | | |
Boston Beer Co., Inc. Class A ‡ | | 26,300 | | 1,374 | |
Building Products (1.3%) | | | | | |
Apogee Enterprises, Inc. | | 52,000 | | 1,224 | |
Chemicals (4.1%) | | | | | |
Calgon Carbon Corp. ‡^ | | 82,200 | | 1,225 | |
Flotek Industries, Inc. ‡^ | | 49,800 | | 2,530 | |
Commercial Services & Supplies (4.9%) | | | | | |
Huron Consulting Group, Inc. ‡^ | | 20,500 | | 1,433 | |
ICF International, Inc. ‡ | | 28,200 | | 876 | |
Team, Inc. ‡^ | | 67,800 | | 2,182 | |
Communications Equipment (2.2%) | | | | | |
Harmonic Lightwaves, Inc. ‡ | | 161,900 | | 1,995 | |
Computers & Peripherals (1.7%) | | | | | |
Stratasys, Inc. ‡^ | | 59,000 | | 1,536 | |
Construction & Engineering (2.7%) | | | | | |
Furmanite Corp. ‡ | | 60,300 | | 748 | |
Michael Baker Corp. ‡ | | 33,500 | | 1,769 | |
Diversified Financial Services (1.2%) | | | | | |
Portfolio Recovery Associates, Inc. ^ | | 24,800 | | 1,119 | |
Diversified Telecommunication Services (2.8%) | | | | | |
Atlantic Tele-Network, Inc. | | 24,800 | | 891 | |
Cbeyond, Inc. ‡ | | 37,600 | | 1,471 | |
Surewest Communications | | 8,500 | | 225 | |
Electronic Equipment & Instruments (0.7%) | | | | | |
Mesa Laboratories, Inc. | | 29,300 | | 655 | |
Energy Equipment & Services (7.1%) | | | | | |
Dawson Geophysical Co. ‡ | | 22,100 | | 1,764 | |
Gulfmark Offshore, Inc. ‡ | | 14,900 | | 694 | |
Matrix Service Co. ‡ | | 30,700 | | 905 | |
Oyo Geospace Corp. ‡ | | 14,470 | | 1,565 | |
Superior Well Services, Inc. ‡ | | 27,000 | | 551 | |
T-3 Energy Services, Inc. ‡ | | 21,400 | | 1,017 | |
Food & Staples Retailing (0.7%) | | | | | |
Susser Holdings Corp. ‡ | | 26,400 | | 658 | |
Health Care Equipment & Supplies (4.5%) | | | | | |
Abaxis, Inc. ‡ | | 57,500 | | 1,686 | |
Anika Therapeutics, Inc. ‡ | | 85,100 | | 1,599 | |
Cynosure, Inc. Class A ‡ | | 23,100 | | 878 | |
Health Care Providers & Services (3.7%) | | | | | |
HMS Holdings Corp. ‡^ | | 70,500 | | 2,007 | |
Sun Healthcare Group, Inc. ‡ | | 85,100 | | 1,374 | |
Health Care Technology (1.7%) | | | | | |
Omnicell, Inc. ‡ | | 60,600 | | 1,600 | |
Hotels, Restaurants & Leisure (1.2%) | | | | | |
Premier Exhibitions, Inc. ‡^ | | 98,600 | | 1,093 | |
Insurance (2.5%) | | | | | |
American Physicians Capital, Inc. ‡ | | 34,700 | | 1,511 | |
Darwin Professional Underwriters, Inc. ‡ | | 9,800 | | $ | 222 | |
National Interstate Corp. | | 18,800 | | 602 | |
Internet & Catalog Retail (2.3%) | | | | | |
1-800-Flowers.Com, Inc. Class A ‡ | | 82,500 | | 989 | |
GSI Commerce, Inc. ‡ | | 39,500 | | 1,126 | |
Internet Software & Services (5.7%) | | | | | |
S1 Corp. ‡ | | 190,200 | | 1,602 | |
TheStreet.com, Inc. ^ | | 128,900 | | 1,740 | |
Vocus, Inc. ‡ | | 54,200 | | 1,950 | |
IT Services (0.1%) | | | | | |
Exlservice Holdings, Inc. ‡ | | 4,700 | | 127 | |
Leisure Equipment & Products (1.3%) | | | | | |
Smith & Wesson Holding Corp. ‡^ | | 100,000 | | 1,209 | |
Life Sciences Tools & Services (3.8%) | | | | | |
Icon PLC ‡ | | 34,300 | | 1,990 | |
Parexel International Corp. ‡ | | 33,400 | | 1,536 | |
Machinery (4.9%) | | | | | |
Dynamic Materials Corp. | | 39,700 | | 2,184 | |
K-Tron International, Inc. ‡ | | 14,000 | | 1,484 | |
LB Foster Co. Class A ‡ | | 19,200 | | 827 | |
Marine (4.1%) | | | | | |
Navios Maritime Holdings, Inc. | | 104,100 | | 1,881 | |
TBS International, Ltd. Class A ‡^ | | 29,681 | | 1,865 | |
Metals & Mining (1.1%) | | | | | |
Hecla Mining Co. ‡ | | 104,600 | | 1,006 | |
Oil, Gas & Consumable Fuels (4.2%) | | | | | |
Arena Resources, Inc. ‡ | | 58,200 | | 2,125 | |
Gulfport Energy Corp. ‡ | | 42,900 | | 950 | |
Petroquest Energy, Inc. ‡ | | 59,800 | | 771 | |
Paper & Forest Products (1.3%) | | | | | |
Buckeye Technologies, Inc. ‡ | | 66,966 | | 1,200 | |
Pharmaceuticals (0.3%) | | | | | |
Cypress Bioscience, Inc. ‡ | | 18,600 | | 251 | |
Semiconductors & Semiconductor Equipment (7.9%) | | | | | |
Anadigics, Inc. ‡^ | | 48,500 | | 715 | |
Microtune, Inc. ‡ | | 151,900 | | 916 | |
O2micro International, Ltd. ‡ | | 109,500 | | 1,901 | |
Sigma Designs, Inc. ‡ | | 44,100 | | 2,592 | |
Standard Microsystems Corp. ‡ | | 28,600 | | 1,115 | |
Software (7.7%) | | | | | |
Bsquare Corp. ‡ | | 308,800 | | 2,223 | |
Epiq Systems, Inc. ‡ | | 80,063 | | 1,553 | |
Jda Software Group, Inc. ‡ | | 77,600 | | 1,937 | |
Netscout Systems, Inc. ‡ | | 92,200 | | 1,425 | |
Textiles, Apparel & Luxury Goods (0.9%) | | | | | |
Movado Group, Inc. | | 28,900 | | 870 | |
Trading Companies & Distributors (2.1%) | | | | | |
Kaman Corp. Class A | | 51,600 | | 1,946 | |
Wireless Telecommunication Services (1.8%) | | | | | |
Novatel Wireless, Inc. ‡^ | | 63,400 | | 1,648 | |
Total Common Stocks (cost $70,943) | | | | 91,517 | |
| | | | | |
Total Security Lending Collateral (cost $14,430) ± | | | | 14,430 | |
Total Investment Securities (cost $85,373) # | | | | $ | 105,947 | |
| | | | | | | |
The notes to the financial statements are an integral part of this report.
10
NOTES TO SCHEDULE OF INVESTMENTS
^ | At October 31, 2007, all or a portion of this security is on loan (see Note 1). The value at October 31, 2007 of all securities on loan is $13,702 |
± | Cash collateral for the Repurchase Agreements, valued at $2,634, that serves as collateral for securities lending, is invested in corporate and government bonds with interest rates and maturity dates ranging from 0.00% - 8.125% and 11/14/2007 - 9/15/2037. |
‡ | Non Income Producing |
# | Aggregate cost for federal income tax purposes is $85,373. Aggregate gross unrealized appreciation for all securities in which there is an excess of value over tax cost and aggregate gross unrealized depreciation for all securities in which there is an excess of tax cost over value were $21,737 and $1,163, respectively. Net unrealized appreciation for tax purposes is $20,574. |
11
TA IDEX BlackRock Global Allocation
MARKET ENVIRONMENT
For the period November 1, 2006 through October 31, 2007, global equity and bond markets posted favorable returns. Strong global growth, coupled with relatively low interest rates allowed global equities, as measured by the Financial Times Stock Exchange World Index (“FTSE World”) to post a solid twelve-month return of 23.44%. The environment for bonds, while not quite as favorable as that for equities, was also positive, with the Lehman Brothers Global Aggregate Bond Index returning 8.91% in U.S. dollar terms for the twelve-month period ended October 31, 2007. Despite this favorable economic backdrop, rising interest rates outside the U.S., credit issues related to U.S. sub-prime mortgages, and rising oil prices all contributed to making the period more volatile than the final performance numbers would lead one to assume.
PERFORMANCE
For the year ended October 31, 2007, TA IDEX BlackRock Global Allocation Class I returned 21.95%. By comparison its primary and former benchmarks, the FTSE World and the Morgan Stanley Capital International World Index, returned 23.44% and 20.97%, respectively. For the year ended October 31, 2007, the net expense ratio of the Fund was 0.85%.
STRATEGY REVIEW
The portfolio invests in a combination of equities and bonds; therefore, provides both a truer representation of the portfolio’s composition and a more comparable means for measurement. Returns for each component of the portfolio for the twelve-months ended October 31, 2007, were as follows; the Standard and Poor’s 500 Composite Stock Index (“S&P 500”) returned +14.56%, the FTSE World Index (ex-U.S.) returned +30.99%; the Merrill Lynch current 5-year Treasury Index returned +6.39%; and the Citigroup (non-USD) World Government Bond Index returned +10.33%. The portfolio outpaced the 18.60% average return of the Lipper Global Flexible Portfolio Funds category for the same twelve-month period..
The portfolio capitalized on favorable equity performance in most markets around the world. Although underweight equities relative to its benchmark, the portfolio’s overweight in non-U.S. equities contributed favorably to returns. The portfolio benefited from an overweight exposure to Asian equities, including India, China, and South Korea, in addition to Brazil. Effective security selection within these countries – and within the U.S. (although underweight relative to the benchmark) also contributed favorably. Although underweight in bonds, the portfolio benefited from the composition of its fixed income component. This included a sizeable allocation to U.S. Treasury Inflation Protected Securities (“TIPS”) and nominal Treasuries, and an overweight in Asian convertibles and short-dated (local currency-denominated) fixed income in emerging markets (notably Brazil). Also contributing to performance was the portfolio’s underweight U.S. dollar-denominated assets relative to its benchmark. Detracting moderately from the portfolio’s relative twelve-month performance was its overweight Japanese equities and underweight within the information technology sector.
Relative to its benchmark, the portfolio is moderately underweight equities at 54%. Although relatively neutral in terms of allocation to equities as an asset class, the portfolio has a meaningful overweight position in Asian stocks and a meaningful underweight position in U.S. stocks. At 29%, the portfolio is also underweight fixed income securities relative to its benchmark. The portfolio’s allocation to fixed income is relatively neutral in terms of U.S. bonds but is underweight non-U.S. bonds relative to its benchmark, reflecting the assessment that available yields outside the U.S. are not attractive relative to the risks of higher long-term interest rates. Credit quality of the portfolio’s fixed income component is quite high, with substantial allocations to nominal Treasuries and TIPS. The portfolio is overweight cash equivalents (17%) relative to its benchmark, partially due to our desire to keep portfolio duration low, notably in non-U.S. bonds.
Dennis W. Stattman
Romualdo Roldan
Dan Chamby
James MacMillan
Co-Portfolio Managers
BlackRock Investment Management, LLC
The notes to the financial statements are an integral part of this report.
12
(unaudited)

Average Annual Total Return for Periods Ended 10/31/2007
| | | | From | | Inception | |
| | 1 Year | | Inception | | Date | |
Class I (NAV) | | 21.95 | % | 18.09 | % | 12/6/05 | |
FTSE World (1) | | 23.44 | % | 21.13 | % | 12/6/05 | |
MSCI WORLD (USD) | | 20.97 | % | 19.58 | % | 12/6/05 | |
NOTES
(1) The Financial Times Stock Exchange World (FTSE World) Index and the Morgan Stanley Capital International Natural Resources (MSCIW) Index are unmanaged indices used as a general measure of market performance. Calculations assume dividends and capital gains are reinvested and do not include any managerial expenses. From inception calculation is based on life of the Fund.
The performance data presented represents past performance, future results may vary. Performance data does not reflect the deduction of taxes that would be paid on fund distributions or the redemption of fund shares. Investment return and principal value will fluctuate so that an investor’s shares, when redeemed, may be worth more or less than their original cost. Current performance may be lower or higher than performance quoted. Please see www.transamericaidex.com for performance data current to the most recent month-end.
Net Asset Value (NAV) returns include the reinvestment of dividends and capital gains. Fund shares are sold without a sales load. International investing involves special risks including currency fluctuations, political instability, and different financial accounting standards.This material must be preceded or accompanied by a current prospectus, which includes specific contents regarding the investment objectives and policies of this Fund. This Fund are only available in Class I shares, which are not available for direct investment by the public.
The notes to the financial statements are an integral part of this report.
13
UNDERSTANDING YOUR FUND’S EXPENSES
(unaudited)
SHAREHOLDER EXPENSES
Fund shareholders may incur two types of costs: (1) transaction costs, including sales charges (loads) on purchases, contingent deferred sales charges on redemptions and redemption fees; and (2) ongoing costs, including management fees, dividend expense on short-sales, and other fund expenses.
The following Example is intended to help you understand your ongoing costs (in dollars and cents) of investing in the Fund and to compare these costs with the ongoing costs of investing in other funds.
The Example is based on an investment of $1,000 invested at May 1, 2007 and held for the entire period until October 31, 2007.
ACTUAL EXPENSES
The first line in the table below provides information about actual account values and actual expenses. You may use the information in this line, together with the amount you invested, to estimate the expenses that you paid over the period. Simply divide your account value by $1,000 (for example, an $8,600 account value divided by $1,000 = 8.6), then multiply the result by the number in the first line of your Fund under the heading entitled “Expenses Paid During Period” to estimate the expenses you paid on your account during this period.
HYPOTHETICAL EXAMPLE FOR COMPARISON PURPOSES
The second line in the table below provides information about hypothetical account values and hypothetical expenses based on the Fund’s actual expense ratio and an assumed rate of return of 5% per year before expenses, which is not the Fund’s actual return. The hypothetical account values and expenses may not be used to estimate the actual ending account balance or expenses you paid for the period. You may use this information to compare the ongoing costs of investing in your Fund and other funds. To do so, compare this 5% hypothetical example with the 5% hypothetical examples that appear in the shareholder reports of the other funds.
Please note that the expenses shown in the table are meant to highlight your ongoing costs only and do not reflect any transactional costs, such as sales charges, redemption fees, brokerage commissions paid on purchases and sales of fund shares. Therefore, the second line under the Fund in the table is useful in comparing ongoing costs only, and will not help you determine the relative total costs of owning different funds. If any of these transaction costs were included, your costs would be higher. The expenses shown in the table do not reflect any fees that may be charged to you by brokers, financial intermediaries or other financial institutions.
| | Beginning | | Ending | | Annualized | | Expenses | |
| | Account | | Account | | Expense | | Paid During | |
| | Value | | Value | | Ratio | | Period (a) | |
Class I | | | | | | | | | |
Actual | | $ | 1,000.00 | | $ | 1,119.28 | | 0.84 | % | $ | 4.47 | |
Hypothetical (b) | | 1,000.00 | | 1,020.91 | | 0.84 | | 4.27 | |
| | | | | | | | | | | | |
(a) Expenses are calculated using the Fund’s annualized expense ratio (as disclosed in the table), multiplied by the average account value for the period, multiplied by the number of days in the period (184 days), and divided by the number of days in the year (365 days).
(b) 5% return per year before expenses.
GRAPHICAL PRESENTATION OF SCHEDULE OF INVESTMENTS
By Region
At October 31, 2007
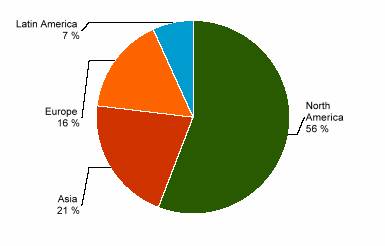
This chart shows the percentage breakdown by region of the Fund’s total investment securities.
The notes to the financial statements are an integral part of this report.
14
SCHEDULE OF INVESTMENTS
At October 31, 2007
(all amounts except share amounts in thousands)
| | Principal | | Value | |
U.S. GOVERNMENT OBLIGATIONS (19.3%) | | | | | | | |
U.S. Treasury Bill Zero Coupon, due 11/01/2007 | | $ | | | 3,000 | | $ | 3,000 | |
3.55%, due 01/03/2008 | | | | 2,000 | | 1,987 | |
4.75%, due 01/31/2008 | | | | 3,000 | | 2,964 | |
4.82%, due 11/08/2007 | | | | 9,900 | | 9,891 | |
U.S. Treasury Inflation Indexed Bond, TIPS | | | | | | | |
2.38%, due 01/15/2027 | | | | 5,104 | | 5,235 | |
U.S. Treasury Inflation Indexed Note, TIPS | | | | | | | |
0.88%, due 04/15/2010 | | | | 5,186 | | 5,067 | |
1.88%, due 07/15/2015 (1) | | | | 4,730 | | 4,671 | |
2.00%, due 04/15/2012 – 01/15/2016 | | | | 11,750 | | 11,668 | |
2.38%, due 04/15/2011 (1) | | | | 15,714 | | 15,958 | |
2.38%, due 01/15/2017 | | | | 670 | | 684 | |
2.50%, due 07/15/2016 | | | | 14,041 | | 14,501 | |
2.63%, due 07/15/2017 | | | | 903 | | 943 | |
U.S. Treasury Note | | | | | | | |
4.00%, due 06/15/2009 | | | | 1,600 | | 1,601 | |
4.25%, due 11/15/2014 | | | | 1,750 | | 1,744 | |
4.38%, due 12/31/2007 | | | | 700 | | 700 | |
4.63%, due 07/31/2009 – 02/29/2012 | | | | 13,365 | | 13,577 | |
4.88%, due 04/30/2008 – 05/31/2011 | | | | 6,250 | | 6,412 | |
Total U.S. Government Obligations (cost $99,327) | | | | | | 100,603 | |
| | | | | | | |
FOREIGN GOVERNMENT OBLIGATIONS (6.3%) | | | | | | | |
Australia (0.5%) | | | | | | | |
Australia Government Bond | | | | | | | |
5.25%, due 08/15/2010 | | AUD | | 1,350 | | 1,206 | |
7.50%, due 09/15/2009 | | AUD | | 675 | | 634 | |
8.75%, due 08/15/2008 | | AUD | | 675 | | 635 | |
Brazil (0.1%) | | | | | | | |
Brazil Notas Do Tesouro Nacional Serie | | | | | | | |
10.00%, due 01/01/2012 – 01/01/2017 | | BRL | | 876 | | 482 | |
Canada (0.6%) | | | | | | | |
Canada Government | | | | | | | |
4.00%, due 09/01/2010 | | CAD | | 2,150 | | 2,252 | |
Canadian Government Bond | | | | | | | |
4.00%, due 06/01/2016 | | CAD | | 715 | | 737 | |
Germany (2.8%) | | | | | | | |
Bundesrepub. Deutschland | | | | | | | |
4.25%, due 07/04/2017 | | EUR | | 3,350 | | 4,849 | |
Federal Republic of Germany | | | | | | | |
4.00%, due 07/04/2016 | | EUR | | 5,200 | | 7,405 | |
KFW | | | | | | | |
4.25%, due 07/04/2014 | | EUR | | 1,500 | | 2,166 | |
Malaysia (0.8%) | | | | | | | |
Bank Negara Malaysia Monetary Notes Zero Coupon, due 04/01/2008 | | MYR | | 3,750 | | 1,108 | |
Johor Corp. | | | | | | | |
1.00%, due 07/31/2009 | | MYR | | 1,925 | | 670 | |
Malaysia Government | | | | | | | |
3.76%, due 04/28/2011 | | MYR | | 5,100 | | $ | 1,540 | |
Malaysia Government Bond | | | | | | | |
3.87%, due 04/13/2010 | | MYR | | 3,500 | | 1,059 | |
Netherlands (0.3%) | | | | | | | |
Kingdom of the Netherlands | | | | | | | |
3.75%, due 07/15/2014 | | EUR | | 1,200 | | 1,690 | |
New Zealand (0.1%) | | | | | | | |
New Zealand Government, TIPS | | | | | | | |
4.50%, due 02/15/2016 | | NZD | | 400 | | 409 | |
Poland (0.2%) | | | | | | | |
Republic of Poland, TIPS | | | | | | | |
3.00%, due 08/24/2016 | | PLN | | 3,011 | | 1,207 | |
Sweden (0.3%) | | | | | | | |
Kingdom of Sweden, TIPS | | | | | | | |
4.00%, due 12/01/2008 | | SEK | | 7,000 | | 1,341 | |
United Kingdom (0.6%) | | | | | | | |
United Kingdom | | | | | | | |
4.25%, due 03/07/2011 | | GBP | | 1,605 | | 3,254 | |
Total Foreign Government Obligations (cost $29,653) | | | | | | 32,644 | |
| | | | | | | |
ASSET-BACKED SECURITIES (0.0%) | | | | | | | |
Cayman Islands (0.0%) | | | | | | | |
Latitude CLO, Ltd. | | | | | | | |
Series 2005-1I, | | | | | | | |
Zero Coupon, due 12/15/2017 | | | | 200 | | 168 | |
Total Asset-Backed Securities (cost $177) | | | | | | 168 | |
| | | | | | | |
CORPORATE DEBT SECURITIES (3.0%) | | | | | | | |
Brazil (0.0%) | | | | | | | |
Cosan Finance, Ltd. - 144A | | | | | | | |
7.00%, due 02/01/2017 § | | | | 90 | | 87 | |
Canada (0.1%) | | | | | | | |
Rogers Wireless, Inc. | | | | | | | |
7.63%, due 12/15/2011 | | CAD | | 500 | | 568 | |
Cayman Islands (0.7%) | | | | | | | |
ASIF II | | | | | | | |
1.20%, due 03/20/2008 | | JPY | | 90,000 | | 780 | |
Chaoda Modern Agriculture, Reg S | | | | | | | |
7.75%, due 02/08/2010 | | | | 1,633 | | 1,613 | |
Hutchison Whampoa International 03/33, Ltd., Reg S | | | | | | | |
5.45%, due 11/24/2010 | | | | 1,194 | | 1,211 | |
France (0.7%) | | | | | | | |
ERAP | | | | | | | |
3.38%, due 04/25/2008 | | EUR | | 1,250 | | 1,802 | |
Unedic | | | | | | | |
3.50%, due 09/18/2008 | | EUR | | 1,250 | | 1,793 | |
Germany (0.3%) | | | | | | | |
Norddeutsche Landesbank Girozentrale | | | | | | | |
0.45%, due 01/19/2009 | | JPY | | 150,000 | | 1,294 | |
Supranational (0.4%) | | | | | | | |
European Investment Bank Zero Coupon, due 05/01/2008 | | BRL | | 4,000 | | 2,184 | |
United States (0.8%) | | | | | | | |
Calpine Corp. | | | | | | | |
8.75%, due 07/15/2013 §, (2) | | | | 2,142 | | 2,313 | |
General Electric Capital Corp. | | | | | | | |
0.80%, due 01/15/2010 * | | JPY | | 204,000 | | 1,770 | |
Total Corporate Debt Securities (cost $14,120) | | | | | | 15,415 | |
| | | | | | | | | |
The notes to the financial statements are an integral part of this report.
15
| | Principal | | Value | |
SHORT-TERM OBLIGATIONS (0.3%) | | | | | |
Singapore (0.3%) | | | | | |
Singapore Dollar Time Deposit | | | | | |
2.45%, due 09/14/2007 | | SGD | 2,132 | | $ | 1,472 | |
Total Short-Term Obligations (cost $1,455) | | | | 1,472 | |
| | | | | |
STRUCTURED NOTE DOMESTIC DEBTS (3.0%) | | | | | |
United States (3.0%) | | | | | |
JPMorgan Chase & Co. | | | | | |
Zero Coupon, due 06/17/2008 – 05/04/2009 | | 5,225 | | 5,426 | |
Morgan Stanley Bear Note | | | | | |
Zero Coupon, due 05/07/2009 § | | 3,229 | | 3,133 | |
Rabobank Nederland NV/NY | | | | | |
Zero Coupon, due 01/28/2008 | | 3,250 | | 3,239 | |
Republic of Brazil Credit Linked Note | | | | | |
Zero Coupon, due 08/16/2010 § | | 800 | | 755 | |
UBS Gold Linked Notes | | | | | |
Zero Coupon, due 01/31/2008 § | | 2,310 | | 2,776 | |
Total Structured Note Domestic Debts (cost $14,543) | | | | 15,329 | |
| | | | | |
STRUCTURED NOTE FOREIGN DEBTS (0.9%) | | | | | |
Brazil (0.7%) | | | | | |
Republic of Brazil Credit Linked Note | | | | | |
6.00%, due 08/15/2010 § | | 3,790 | | 3,576 | |
Switzerland (0.2%) | | | | | |
UBS Gold Linked Notes | | | | | |
Zero Coupon, due 03/23/2009 § | | 1,200 | | 1,307 | |
Total Structured Note Foreign Debts (cost $3,691) | | | | 4,883 | |
| | | | | | | |
| | Shares | | Value | |
CONVERTIBLE PREFERRED STOCKS (0.3%) | | | | | |
Brazil (0.1%) | | | | | |
All America Latina Logistica SA | | 41,200 | | 649 | |
United States (0.2%) | | | | | |
Fannie Mae, Convertible ‡ | | 8 | | 786 | |
Total Convertible Preferred Stocks (cost $1,051) | | | | 1,435 | |
| | | | | |
PREFERRED STOCKS (0.7%) | | | | | |
Brazil (0.2%) | | | | | |
Banco Bradesco SA | | 10,000 | | 338 | |
Cia Brasileira de Distribuicao Grupo Pao de Acucar | | 9,557 | | 153 | |
Usinas Siderurgicas de Minas Gerais SA Class A | | 6,300 | | 491 | |
United States (0.5%) | | | | | |
Goldman Sachs Group, Inc. (The), Private Placement ‡ | | 2,225 | | 2,543 | |
Total Preferred Stocks (cost $2,792) | | | | 3,525 | |
| | | | | |
COMMON STOCKS (54.2%) | | | | | |
Australia (1.0%) | | | | | |
BHP Billiton, Ltd. | | 32,000 | | 1,367 | |
Coca-Cola Amatil, Ltd. | | 21,900 | | 207 | |
Great Southern, Ltd. | | 33,800 | | 69 | |
Macquarie Airports | | 94,000 | | 382 | |
Macquarie Infrastructure Group | | 183,000 | | 536 | |
Newcrest Mining, Ltd. | | 13,770 | | $ | 413 | |
Rio Tinto, Ltd. | | 10,500 | | 1,070 | |
Transurban Group ‡ | | 87,675 | | 591 | |
Woodside Petroleum, Ltd. | | 10,800 | | 520 | |
Zinifex, Ltd. | | 20,800 | | 321 | |
Austria (0.0%) | | | | | |
Telekom Austria AG | | 3,500 | | 100 | |
Belgium (0.5%) | | | | | |
Fortis | | 31,903 | | 1,019 | |
RHJ International ‡, § | | 26,600 | | 466 | |
RHJ International ‡ | | 75,000 | | 1,315 | |
Bermuda (1.0%) | | | | | |
Accenture, Ltd. Class A | | 300 | | 12 | |
Axis Capital Holdings, Ltd. | | 400 | | 16 | |
Cheung Kong Infrastructure Holdings, Ltd. | | 104,000 | | 405 | |
Covidien, Ltd. | | 4,925 | | 205 | |
Endurance Specialty Holdings, Ltd. | | 18,100 | | 710 | |
Everest RE Group, Ltd. | | 900 | | 96 | |
Foster Wheeler, Ltd. ‡ | | 16,000 | | 2,372 | |
Ingersoll-Rand Co., Ltd. Class A | | 400 | | 20 | |
IPC Holdings, Ltd. | | 10,000 | | 299 | |
Noble Group, Ltd. | | 89,891 | | 146 | |
Platinum Underwriters Holdings, Ltd. | | 7,700 | | 277 | |
RenaissanceRe Holdings, Ltd. | | 5,000 | | 292 | |
Tyco International, Ltd. | | 4,925 | | 203 | |
Weatherford International, Ltd. ‡ | | 4,500 | | 292 | |
Brazil (2.0%) | | | | | |
Cia de Saneamento de Minas Gerais-Copasa ‡ | | 13,300 | | 248 | |
Cia Energetica de Minas Gerais | | 9,300 | | 201 | |
Cia Vale do Rio Doce ‡ | | 42,000 | | 1,326 | |
Cosan SA Industria E Comercio | | 13,900 | | 216 | |
Datasul SA | | 24,000 | | 317 | |
Gafisa SA | | 20,500 | | 366 | |
Jbs SA ‡ | | 56,000 | | 257 | |
Obrascon Huarte Lain Brasil SA | | 12,600 | | 225 | |
Petroleo Brasileiro SA Class A | | 40,400 | | 3,361 | |
Petroleo Brasileiro SA | | 29,000 | | 2,773 | |
Slc Agricola SA ‡ | | 37,000 | | 350 | |
Unibanco - Uniao de Bancos Brasileiros SA ‡ | | 1,800 | | 285 | |
VIVO Participacoes SA | | 52,500 | | 309 | |
Canada (1.6%) | | | | | |
Alamos Gold, Inc. ‡ | | 44,500 | | 341 | |
Barrick Gold Corp. | | 7,795 | | 344 | |
BCE, Inc. | | 600 | | 26 | |
Canadian Natural Resources, Ltd. | | 3,500 | | 291 | |
Canadian Pacific Railway, Ltd. | | 22,800 | | 1,598 | |
EnCana Corp. | | 300 | | 21 | |
Imperial Oil, Ltd. ‡ | | 400 | | 22 | |
Kinross Gold Corp. ‡ | | 99,119 | | 1,950 | |
Magna International, Inc. Class A | | 200 | | 19 | |
Nortel Networks Corp. ‡ | | 22,300 | | 360 | |
Peak Gold LTD R1933 ‡ | | 82,000 | | 55 | |
Petro-Canada | | 7,500 | | 430 | |
| | | | | | |
16
| | Shares | | Value | |
Canada (continued) | | | | | |
Rogers Communications, Inc. Class B | | 28,400 | | $ | 1,447 | |
Saskatchewan Wheat Pool, Inc. ‡ | | 23,400 | | 315 | |
Sino-Forest Corp. Class A ‡ | | 14,000 | | 370 | |
Sun Life Financial, Inc. | | 200 | | 12 | |
Suncor Energy, Inc. | | 5,800 | | 634 | |
Talisman Energy, Inc. | | 4,500 | | 97 | |
Cayman Islands (0.9%) | | | | | |
ACE, Ltd. | | 15,200 | | 921 | |
Chaoda Modern Agriculture | | 956,800 | | 866 | |
GlobalSantaFe Corp. | | 9,850 | | 798 | |
Noble Corp. | | 5,800 | | 307 | |
Seagate Technology | | 800 | | 22 | |
Transocean, Inc. ‡ | | 2,900 | | 346 | |
XL Capital, Ltd. Class A | | 20,000 | | 1,439 | |
Chile (0.1%) | | | | | |
Banco Santander Chile SA | | 10,300 | | 546 | |
Enersis SA | | 8,100 | | 160 | |
China (0.8%) | | | | | |
China Communications Services Corp. Ltd. Class H ‡ | | 9,300 | | 8 | |
China Life Insurance Co., Ltd. | | 5,633 | | 573 | |
China Shenhua Energy Co., Ltd. Class H | | 393,000 | | 2,492 | |
Hainan Meilan International Airport Co. Ltd. Class H ‡ | | 93,400 | | 121 | |
Jiangsu Express Class H | | 88,400 | | 102 | |
Ping An Insurance Group Co. of China Ltd. Class H | | 29,200 | | 404 | |
Shanghai Electric Group Co., Ltd. Class H | | 423,600 | | 415 | |
Xiamen International Port Co., Ltd. Class H | | 493,900 | | 187 | |
Denmark (0.1%) | | | | | |
Danske Bank A/S Class R | | 15,131 | | 666 | |
Finland (0.1%) | | | | | |
Fortum OYJ | | 9,653 | | 418 | |
Nokia OYJ | | 600 | | 24 | |
France (1.3%) | | | | | |
Alcatel-Lucent | | 6,000 | | 58 | |
AXA SA | | 18,987 | | 848 | |
Electricite de France | | 8,749 | | 1,048 | |
France Telecom SA | | 31,000 | | 1,142 | |
Renault SA | | 5,798 | | 972 | |
Societe Generale | | 5,258 | | 881 | |
Total SA | | 17,035 | | 1,372 | |
Vallourec | | 2,325 | | 673 | |
Germany (1.9%) | | | | | |
Allianz SE | | 4,573 | | 1,027 | |
Bayer AG | | 13,217 | | 1,100 | |
Bayerische Motoren Werke AG | | 13,881 | | 928 | |
Daimler AG | | 13,010 | | 1,430 | |
Deutsche Post AG | | 24,470 | | 740 | |
Deutsche Telekom AG | | 66,701 | | 1,366 | |
E.ON AG | | 5,195 | | 1,014 | |
RWE AG | | 7,976 | | $ | 1,087 | |
Siemens AG | | 9,058 | | 1,228 | |
Hong Kong (1.4%) | | | | | |
Beijing Enterprises Holdings, Ltd. | | 339,189 | | 2,087 | |
Cheung Kong Holdings, Ltd. ‡ | | 38,500 | | 749 | |
China Mobile, Ltd. | | 46,000 | | 932 | |
Denway Motors, Ltd. | | 172,000 | | 120 | |
Hutchison Whampoa International, Ltd. ‡ | | 87,000 | | 1,084 | |
Sun Hung KAI Properties, Ltd. | | 46,300 | | 877 | |
Tianjin Development Holdings | | 368,500 | | 616 | |
Wharf Holdings, Ltd. ‡ | | 125,000 | | 747 | |
India (2.5%) | | | | | |
Ambuja Cements, Ltd. | | 137,500 | | 506 | |
Bajaj Auto, Ltd. | | 3,900 | | 245 | |
Container Corp. of India | | 10,600 | | 533 | |
Hindustan Petroleum Corp., Ltd. | | 6,450 | | 39 | |
Housing Development Finance Corp. | | 11,000 | | 776 | |
Infosys Technologies, Ltd. | | 10,500 | | 491 | |
Karnataka Bank, Ltd. | | 9,200 | | 52 | |
Larsen & Toubro, Ltd. | | 4,700 | | 507 | |
Reliance Capital, Ltd. | | 5,250 | | 283 | |
Reliance Communications, Ltd. | | 39,000 | | 766 | |
Reliance Energy, Ltd. | | 6,525 | | 310 | |
Reliance Industries, Ltd. | | 91,000 | | 6,439 | |
Reliance Natural Resources, Ltd. ‡ | | 120,400 | | 368 | |
State Bank of India, Ltd. | | 12,400 | | 652 | |
Tata Motors, Ltd. | | 19,000 | | 366 | |
Wockhardt, Ltd. | | 4,800 | | 51 | |
ZEE Entertainment Enterprises, Ltd. | | 84,960 | | 717 | |
Ireland (0.3%) | | | | | |
Allied Irish Banks PLC | | 21,460 | | 536 | |
CRH PLC | | 20,400 | | 777 | |
Israel (0.1%) | | | | | |
Ectel, Ltd. ‡ | | 4,795 | | 16 | |
Teva Pharmaceutical Industries, Ltd. | | 7,023 | | 309 | |
Italy (0.6%) | | | | | |
ENI SpA | | 33,751 | | 1,226 | |
Intesa Sanpaolo SpA | | 116,320 | | 920 | |
Unicredito Italiano SpA | | 105,016 | | 895 | |
Japan (5.3%) | | | | | |
AIOI Insurance Co., Ltd. | | 165,100 | | 954 | |
Ajinomoto Co., Inc. | | 12,000 | | 135 | |
Asahi Glass Co., Ltd. | | 37,500 | | 511 | |
Asics Corp. | | 9,500 | | 150 | |
Bank of Yokohama, Ltd. (The) | | 13,000 | | 92 | |
Canon, Inc. | | 17,100 | | 853 | |
Coca-Cola Central Japan Co., Ltd. | | 23 | | 171 | |
Coca-Cola West Holdings Co., Ltd. | | 37,071 | | 857 | |
Credit Saison Co., Ltd. | | 12,500 | | 396 | |
Daikin Industries, Ltd. | | 6,400 | | 321 | |
East Japan Railway Co. | | 85 | | 698 | |
Fukuoka Financial Group, Inc. | | 60,500 | | 388 | |
Hokkaido Coca-Cola Bottling Co., Ltd. | | 12,000 | | 71 | |
17
| | Shares | | Value | |
Japan (continued) | | | | | |
Honda Motor Co., Ltd. | | 6,600 | | $ | 246 | |
House Foods Corp. | | 4,000 | | 63 | |
Japan Tobacco, Inc. | | 120 | | 696 | |
JGC Corp. | | 28,000 | | 555 | |
Kinden Corp. | | 35,000 | | 309 | |
Kirin Holdings Co., Ltd. | | 34,500 | | 480 | |
Kubota Corp. | | 49,600 | | 416 | |
Mikuni Coca-Cola Bottling Co., Ltd. | | 21,800 | | 242 | |
Millea Holdings, Inc. | | 52,600 | | 2,062 | |
Ministop Co., Ltd. | | 3,200 | | 58 | |
Mitsubishi Corp. | | 42,300 | | 1,302 | |
Mitsubishi Rayon Co., Ltd. | | 103,000 | | 580 | |
Mitsubishi Tanabe Pharma Corp. | | 16,000 | | 183 | |
Mitsui Sumitomo Insurance Co., Ltd. | | 149,000 | | 1,696 | |
Murata Manufacturing Co., Ltd. | | 10,000 | | 603 | |
Nipponkoa Insurance Co., Ltd. | | 143,900 | | 1,311 | |
NTT DoCoMo, Inc. | | 825 | | 1,188 | |
NTT Urban Development Corp. | | 280 | | 624 | |
Okinawa Cellular Telephone Co. | | 14 | | 41 | |
Okumura Corp. | | 97,400 | | 514 | |
Rinnai Corp. | | 5,200 | | 161 | |
Sekisui House, Ltd. | | 42,000 | | 534 | |
Seven & I Holdings Co., Ltd. | | 27,500 | | 706 | |
Shimachu Co., Ltd. | | 1,500 | | 43 | |
Shin-Etsu Chemical Co., Ltd. | | 13,000 | | 828 | |
Shinsei Bank, Ltd. | | 47,000 | | 151 | |
Sumitomo Chemical Co., Ltd. | | 104,000 | | 919 | |
Sumitomo Mitsui Financial Group, Inc. | | 20 | | 162 | |
Suzuki Motor Corp. | | 45,100 | | 1,471 | |
Tadano, Ltd. | | 5,000 | | 62 | |
Takeda Pharmaceutical Co., Ltd. | | 24,000 | | 1,491 | |
Toda Corp. | | 49,000 | | 255 | |
Toho Co., Ltd./Tokyo | | 21,600 | | 429 | |
Tokyo Gas Co., Ltd. | | 168,000 | | 745 | |
Toyota Industries Corp. | | 14,100 | | 599 | |
Ube Industries, Ltd. | | 35,000 | | 125 | |
Korea, Republic of (2.4%) | | | | | |
Cheil Industries, Inc. | | 4,700 | | 308 | |
Cj Cheiljedang Corp. ‡ | | 1,665 | | 552 | |
CJ Corp. | | 2,835 | | 314 | |
Daegu Bank | | 9,600 | | 168 | |
Dongbu Insurance Co., Ltd. | | 10,000 | | 601 | |
Fine DNC Co., Ltd. | | 16,300 | | 85 | |
Hana Financial Group, Inc. | | 5,300 | | 267 | |
Interflex Co., Ltd. ‡ | | 16,100 | | 114 | |
Kookmin Bank | | 6,600 | | 536 | |
Korea Electric Power Corp. | | 14,400 | | 633 | |
Korean Reinsurance Co. | | 29,900 | | 528 | |
KT Corp. | | 46,800 | | 1,101 | |
KT&G Corp. | | 13,700 | | 1,101 | |
Lotte Shopping Co., Ltd. - 144A § | | 3,600 | | 84 | |
LS Cable, Ltd. | | 7,500 | | 1,149 | |
Meritz Fire & Marine Insurance Co., Ltd. | | 42,163 | | 609 | |
Nong Shim Co., Ltd. | | 500 | | $ | 110 | |
Paradise Co., Ltd. | | 58,539 | | 257 | |
POSCO | | 5,900 | | 1,084 | |
POSCO | | 1,700 | | 1,217 | |
Pusan Bank | | 10,400 | | 185 | |
Samsung Fine Chemicals Co., Ltd. | | 12,600 | | 944 | |
SK Telecom Co., Ltd. | | 2,200 | | 517 | |
Malaysia (0.5%) | | | | | |
British American Tobacco Malaysia BHD ‡ | | 24,500 | | 296 | |
IOI Corp. BHD ‡ | | 543,130 | | 1,230 | |
Plus Expressways BHD | | 78,300 | | 78 | |
Telekom Malaysia BHD | | 86,000 | | 263 | |
Tenaga Nasional BHD | | 243,657 | | 683 | |
Mexico (0.3%) | | | | | |
Fomento Economico Mexicano SAB de CV | | 14,700 | | 524 | |
Grupo Televisa SA | | 32,800 | | 815 | |
URBI Desarrollos Urbanos SA de CV ‡ | | 12,500 | | 48 | |
Netherlands (0.5%) | | | | | |
AKZO Nobel NV | | 12,661 | | 1,017 | |
Arcelor Mittal | | 11,947 | | 957 | |
ASML Holding NV Class G ‡ | | 700 | | 25 | |
European Aeronautic Defense and Space Co. | | 21,000 | | 712 | |
Netherlands Antilles (0.2%) | | | | | |
Schlumberger, Ltd. | | 10,500 | | 1,014 | |
New Zealand (0.1%) | | | | | |
Contact Energy, Ltd. | | 23,500 | | 164 | |
Telecom Corp. of New Zealand, Ltd. | | 36,533 | | 122 | |
Norway (0.2%) | | | | | |
Statoil ASA | | 28,846 | | 971 | |
Telenor ASA ‡ | | 10,000 | | 234 | |
Russian Federation (0.0%) | | | | | |
Polyus Gold Co. | | 5,700 | | 257 | |
Singapore (1.3%) | | | | | |
Capitaland, Ltd. | | 152,225 | | 846 | |
Fraser And Neave, Ltd. | | 178,000 | | 737 | |
Keppel Corp., Ltd. | | 160,200 | | 1,625 | |
Keppel Land, Ltd. | | 53,262 | | 305 | |
MobileOne, Ltd. ‡ | | 195,030 | | 283 | |
Oversea-Chinese Banking Corp. | | 70,000 | | 445 | |
Parkway Holdings, Ltd. | | 208,650 | | 599 | |
Parkway Life Real Estate REIT | | 11,732 | | 10 | |
Singapore Telecommunications, Ltd. | | 604,150 | | 1,701 | |
South Africa (0.1%) | | | | | |
Gold Fields, Ltd. | | 11,700 | | 211 | |
Sasol, Ltd. | | 3,200 | | 163 | |
Spain (0.3%) | | | | | |
Banco Santander Central Hispano SA | | 56,426 | | 1,225 | |
Cintra Concesiones de Infraestructuras de Transporte SA | | 12,050 | | 210 | |
Telefonica SA | | 4,000 | | 398 | |
18
| | Shares | | Value | |
Sweden (0.1%) | | | | | |
Investor AB Class B | | 23,997 | | $ | 592 | |
Switzerland (1.1%) | | | | | |
Credit Suisse Group | | 12,072 | | 811 | |
Nestle SA | | 5,282 | | 2,436 | |
Novartis AG | | 22,910 | | 1,218 | |
Swiss Reinsurance | | 5,951 | | 558 | |
UBS AG | | 14,387 | | 769 | |
Taiwan (0.9%) | | | | | |
Cathay Financial Holding Co., Ltd. | | 134,209 | | 347 | |
Chinatrust Financial Holding Co., Ltd. ‡ | | 238,320 | | 174 | |
Chunghwa Telecom Co., Ltd. | | 70,763 | | 1,359 | |
Chunghwa Telecom Co., Ltd. | | 114,950 | | 220 | |
Delta Electronics, Inc. | | 203,270 | | 815 | |
Fubon Financial Holding Co., Ltd. | | 157,000 | | 152 | |
HON HAI Precision Industry Co., Ltd. | | 42,000 | | 319 | |
Sinopac Financial Holdings Co., Ltd. | | 104,000 | | 48 | |
Taishin Financial Holdings Co., Ltd. ‡ | | 109,000 | | 53 | |
Taiwan Cement Corp. | | 603,258 | | 1,028 | |
Thailand (0.7%) | | | | | |
Airports of Thailand PCL | | 49,000 | | 88 | |
Bangkok Expressway PCL | | 101,600 | | 74 | |
Hana Microelectronics PCL | | 249,000 | | 183 | |
PTT Exploration & Production PCL | | 128,500 | | 613 | |
PTT PCL | | 92,400 | | 1,142 | |
Siam Cement PCL | | 61,600 | | 475 | |
Siam Commercial Bank PCL | | 285,000 | | 792 | |
Thai Union Frozen Products PCL | | 67,700 | | 48 | |
United Kingdom (2.9%) | | | | | |
Anglo American PLC | | 17,211 | | 1,185 | |
BAE Systems PLC | | 87,843 | | 909 | |
Barclays PLC | | 39,104 | | 491 | |
British American Tobacco PLC | | 24,677 | | 938 | |
Cadbury Schweppes PLC | | 24,100 | | 1,283 | |
Diageo PLC | | 10,100 | | 927 | |
GlaxoSmithKline PLC | | 24,568 | | 632 | |
Guinness Peat Group PLC | | 120,087 | | 176 | |
HBOS PLC | | 47,647 | | 864 | |
Premier Foods PLC | | 29,000 | | 136 | |
Prudential PLC | | 37,622 | | 611 | |
Royal Dutch Shell PLC Class A | | 4,200 | | 367 | |
Royal Dutch Shell PLC Class B | | 40,674 | | 1,770 | |
Unilever PLC | | 34,721 | | 1,172 | |
Vodafone Group PLC | | 705,955 | | 2,772 | |
Vodafone Group PLC | | 18,061 | | 709 | |
United States (21.1%) | | | | | |
3Com Corp. ‡ | | 165,500 | | 808 | |
Abbott Laboratories | | 6,500 | | 355 | |
AES Corp. (The) ‡ | | 9,400 | | 201 | |
Aetna, Inc. | | 7,150 | | 402 | |
AK Steel Holding Corp. ‡ | | 400 | | 20 | |
Albemarle Corp. | | 400 | | 19 | |
Alcoa, Inc. | | 15,100 | | 598 | |
Allstate Corp. (The) | | 6,000 | | 314 | |
ALLTEL Corp. | | 7,500 | | $ | 534 | |
Altria Group, Inc. | | 6,700 | | 489 | |
American Commercial Lines, Inc. ‡ | | 34,900 | | 520 | |
American International Group, Inc. | | 51,000 | | 3,219 | |
AmerisourceBergen Corp. Class A | | 4,600 | | 217 | |
Anadarko Petroleum Corp. | | 5,700 | | 336 | |
Apache Corp. | | 3,500 | | 363 | |
Apple, Inc. ‡ | | 15,600 | | 2,963 | |
Applied Materials, Inc. | | 17,200 | | 334 | |
Assurant, Inc. | | 5,400 | | 316 | |
AT&T, Inc. | | 29,860 | | 1,248 | |
Avnet, Inc. ‡ | | 500 | | 21 | |
Avon Products, Inc. | | 5,500 | | 225 | |
Baker Hughes, Inc. | | 2,400 | | 208 | |
Ball Corp. | | 400 | | 20 | |
Bank of America Corp. | | 11,700 | | 565 | |
Bank of New York Mellon Corp. | | 27,081 | | 1,323 | |
Baxter International, Inc. | | 4,600 | | 276 | |
Big Lots, Inc. ‡ | | 800 | | 19 | |
BMC Software, Inc. ‡ | | 500 | | 17 | |
Boeing Co. | | 2,500 | | 246 | |
Borland Software Corp. ‡ | | 6,300 | | 28 | |
Boston Scientific Corp. ‡ | | 18,600 | | 258 | |
Bristol-Myers Squibb Co. | | 40,000 | | 1,200 | |
Burlington Northern Santa Fe Corp. | | 21,700 | | 1,891 | |
CA, Inc. | | 43,500 | | 1,151 | |
Cadence Design Systems, Inc. ‡ | | 700 | | 14 | |
CBS Corp. Class B | | 600 | | 17 | |
Celanese Corp. Series A, Class A | | 500 | | 21 | |
CenterPoint Energy, Inc. | | 1,000 | | 17 | |
CenturyTel, Inc. | | 400 | | 18 | |
Chevron Corp. | | 14,000 | | 1,281 | |
Chubb Corp. | | 200 | | 11 | |
Ciena Corp. ‡ | | 31,100 | | 1,488 | |
Cigna Corp. | | 300 | | 16 | |
Cisco Systems, Inc. ‡ | | 75,700 | | 2,503 | |
Citigroup, Inc. | | 58,000 | | 2,430 | |
CMS Energy Corp. | | 11,000 | | 187 | |
CNA Financial Corp. | | 400 | | 16 | |
Coca-Cola Co. (The) | | 9,600 | | 593 | |
Coca-Cola Enterprises, Inc. | | 900 | | 23 | |
Comcast Corp. Class A ‡ | | 90,850 | | 1,912 | |
Complete Production Services, Inc. ‡ | | 16,900 | | 336 | |
Computer Sciences Corp. ‡ | | 300 | | 18 | |
Comverse Technology, Inc. ‡ | | 74,300 | | 1,428 | |
ConAgra Foods, Inc. | | 9,100 | | 216 | |
ConocoPhillips | | 11,600 | | 986 | |
Consol Energy, Inc. | | 36,200 | | 2,045 | |
Constellation Brands, Inc. Class A ‡ | | 6,600 | | 166 | |
Continental Airlines, Inc. Class A ‡ | | 400 | | 14 | |
Coventry Health Care, Inc. ‡ | | 300 | | 18 | |
Crown Holdings, Inc. ‡ | | 9,400 | | 233 | |
CSX Corp. | | 500 | | 22 | |
19
| | Shares | | Value | |
United States (continued) | | | | | |
Cummins, Inc. | | 200 | | $ | 24 | |
CVS Caremark Corp. | | 6,801 | | 284 | |
Darwin Professional Underwriters, Inc. ‡ | | 2,800 | | 63 | |
Davita, Inc. ‡ | | 2,800 | | 183 | |
Deere & Co. | | 200 | | 31 | |
Devon Energy Corp. | | 9,400 | | 878 | |
Discover Financial Services | | 100 | | 2 | |
Discovery Holding Co. Class A ‡ | | 1,000 | | 28 | |
Dst Systems, Inc. ‡ | | 200 | | 17 | |
Duke Energy Corp. | | 1,000 | | 19 | |
Dun & Bradstreet Corp. | | 200 | | 19 | |
Dynegy, Inc. Class A ‡ | | 15,700 | | 145 | |
Eaton Corp. | | 200 | | 18 | |
eBay, Inc. ‡ | | 11,500 | | 415 | |
Edison International | | 400 | | 23 | |
Ei DU Pont de Nemours & Co. | | 4,400 | | 218 | |
El Paso Corp. | | 153,100 | | 2,704 | |
Electronic Data Systems Corp. | | 600 | | 13 | |
Eli Lilly & Co. | | 10,300 | | 558 | |
Embarq Corp. | | 1,565 | | 83 | |
EMC Corp. ‡ | | 1,000 | | 25 | |
Energizer Holdings, Inc. ‡ | | 200 | | 21 | |
Ensco International, Inc. | | 5,700 | | 316 | |
Exelon Corp. | | 9,200 | | 762 | |
Expedia, Inc. ‡ | | 700 | | 23 | |
Express Scripts, Inc. Class A ‡ | | 400 | | 25 | |
Extreme Networks ‡ | | 11,700 | | 51 | |
Exxon Mobil Corp. | | 33,600 | | 3,091 | |
Family Dollar Stores, Inc. | | 600 | | 15 | |
Fannie Mae | | 4,000 | | 228 | |
FedEx Corp. | | 900 | | 93 | |
Fidelity National Financial, Inc. Class A | | 68,100 | | 1,048 | |
Foundation Coal Holdings, Inc. | | 11,600 | | 496 | |
Freeport-McMoRan Copper & Gold, Inc. | | 5,000 | | 588 | |
General Communication, Inc. Class A ‡ | | 11,300 | | 133 | |
General Dynamics Corp. | | 1,600 | | 146 | |
General Electric Co. | | 144,600 | | 5,952 | |
General Motors Corp. | | 5,900 | | 231 | |
Genesis Microchip, Inc. ‡ | | 20,400 | | 151 | |
Genuine Parts Co. | | 400 | | 20 | |
Genworth Financial, Inc. Class A | | 500 | | 14 | |
Goldman Sachs Group, Inc. (The) | | 100 | | 25 | |
Goodrich Corp. | | 300 | | 21 | |
Google, Inc. Class A ‡ | | 2,640 | | 1,866 | |
Grant Prideco, Inc. ‡ | | 16,800 | | 826 | |
Halliburton Co. | | 12,680 | | 500 | |
Hanesbrands, Inc. ‡ | | 862 | | 27 | |
Hartford Financial Services Group, Inc. | | 4,300 | | 417 | |
Hasbro, Inc. | | 600 | | 18 | |
Health Net, Inc. ‡ | | 300 | | 16 | |
Healthsouth Corp. ‡ | | 8,020 | | 161 | |
Hess Corp. | | 5,100 | | 365 | |
Hewlett-Packard Co. | | 9,400 | | 486 | |
Honeywell International, Inc. | | 300 | | $ | 18 | |
Humana, Inc. ‡ | | 2,300 | | 172 | |
Idearc, Inc. | | 1,532 | | 41 | |
Intel Corp. | | 15,200 | | 409 | |
International Business Machines Corp. | | 16,300 | | 1,893 | |
International Paper Co. | | 8,700 | | 322 | |
Intersil Corp. Class A | | 600 | | 18 | |
ITT Corp. | | 300 | | 20 | |
JDS Uniphase Corp. ‡ | | 4,925 | | 75 | |
Johnson & Johnson | | 39,700 | | 2,587 | |
Johnson Controls, Inc. | | 600 | | 26 | |
JPMorgan Chase & Co. | | 5,700 | | 268 | |
Juniper Networks, Inc. ‡ | | 600 | | 22 | |
KBR, Inc. ‡ | | 6,077 | | 261 | |
Key Energy Services, Inc. ‡ | | 10,600 | | 146 | |
King Pharmaceuticals, Inc. ‡ | | 800 | | 8 | |
Kraft Foods, Inc. Class A | | 16,436 | | 549 | |
Kroger Co. (The) | | 700 | | 21 | |
L-3 Communications Holdings, Inc. | | 200 | | 22 | |
Liberty Media Corp. - Capital Series A, Class A ‡ | | 4 | | q | |
Liberty Media Corp. - Interactive Class A ‡ | | 762 | | 16 | |
Lincoln National Corp. | | 200 | | 12 | |
Lockheed Martin Corp. | | 200 | | 22 | |
Loews Corp. - Carolina Group | | 200 | | 17 | |
Loews Corp. | | 400 | | 20 | |
LSI Corp. ‡ | | 4,968 | | 33 | |
Lubrizol Corp. | | 300 | | 20 | |
Macquarie Infrastructure Co. LLC | | 34,000 | | 1,420 | |
Manor Care, Inc. | | 5,900 | | 393 | |
Manpower, Inc. | | 200 | | 15 | |
Marathon Oil Corp. | | 8,200 | | 485 | |
Marsh & McLennan Cos., Inc. | | 5,400 | | 140 | |
McDonald’s Corp. | | 14,000 | | 836 | |
McKesson Corp. | | 4,600 | | 304 | |
Medco Health Solutions, Inc. ‡ | | 4,600 | | 434 | |
Medtronic, Inc. | | 11,400 | | 541 | |
Merck & Co., Inc. | | 16,600 | | 967 | |
Microsoft Corp. | | 142,400 | | 5,242 | |
Mirant Corp. ‡ | | 12,500 | | 529 | |
Mohawk Industries, Inc. ‡ | | 200 | | 17 | |
Morgan Stanley | | 200 | | 13 | |
Motorola, Inc. | | 20,000 | | 376 | |
Murphy Oil Corp. | | 5,700 | | 420 | |
National Oilwell Varco, Inc. ‡ | | 7,600 | | 557 | |
NCR Corp. ‡ | | 300 | | 8 | |
Newmont Mining Corp. | | 49,000 | | 2,492 | |
Noble Energy, Inc. | | 300 | | 23 | |
Norfolk Southern Corp. | | 19,000 | | 981 | |
Northern Trust Corp. | | 18,300 | | 1,376 | |
Northrop Grumman Corp. | | 200 | | 17 | |
Novell, Inc. ‡ | | 12,000 | | 91 | |
20
| | Shares | | Value | |
United States (continued) | | | | | |
Novellus Systems, Inc. ‡ | | 600 | | $ | 17 | |
NRG Energy, Inc. ‡ | | 2,500 | | 114 | |
NTL, Inc. ‡ | | 7,800 | | 172 | |
NVIDIA Corp. ‡ | | 600 | | 21 | |
Occidental Petroleum Corp. | | 8,900 | | 615 | |
Oneok, Inc. | | 400 | | 20 | |
Oracle Corp. ‡ | | 1,000 | | 22 | |
Owens-Illinois, Inc. ‡ | | 500 | | 22 | |
Panera Bread Co. Class A ‡ | | 24,900 | | 1,021 | |
Parker Hannifin Corp. | | 300 | | 24 | |
Peabody Energy Corp. | | 15,600 | | 870 | |
Pepsi Bottling Group, Inc. | | 500 | | 22 | |
PepsiAmericas, Inc. | | 3,700 | | 132 | |
Pfizer, Inc. | | 86,200 | | 2,121 | |
Pharmerica Corp. ‡ | | 383 | | 6 | |
PPL Corp. | | 13,800 | | 713 | |
Procter & Gamble Co. | | 3,500 | | 243 | |
Prudential Financial, Inc. | | 2,600 | | 251 | |
Qualcomm, Inc. | | 27,500 | | 1,175 | |
Qwest Communications International, Inc. ‡ | | 1,100 | | 8 | |
Raytheon Co. | | 300 | | 19 | |
Republic Services, Inc. Class A | | 600 | | 20 | |
Sara Lee Corp. | | 6,600 | | 109 | |
Schering-Plough Corp. | | 20,500 | | 626 | |
Sempra Energy | | 300 | | 18 | |
Senomyx, Inc. ‡ | | 7,600 | | 88 | |
Sherwin-Williams Co. (The) | | 300 | | 19 | |
Sierra Health Services ‡ | | 600 | | 25 | |
SLM Corp. | | 3,500 | | 165 | |
Smith International, Inc. | | 10,300 | | 680 | |
Smurfit-Stone Container Corp. ‡ | | 10,400 | | 126 | |
Spirit Aerosystems Holdings, Inc. Class A ‡ | | 7,100 | | 246 | |
Sprint Nextel Corp. | | 72,100 | | 1,233 | |
SPX Corp. | | 300 | | 30 | |
St Joe Co. (The) | | 22,800 | | 772 | |
St. Paul Travelers Cos., Inc. (The) ‡ | | 17,600 | | 919 | |
State Street Corp. | | 9,200 | | 734 | |
Stone Energy Corp. ‡ | | 4,100 | | 183 | |
Sun Microsystems, Inc. ‡ | | 93,800 | | 536 | |
Sunoco, Inc. | | 200 | | 15 | |
Supervalu, Inc. | | 3,272 | | 127 | |
Synopsys, Inc. ‡ | | 600 | | 17 | |
Telephone & Data Systems, Inc. | | 300 | | 21 | |
Tellabs, Inc. ‡ | | 4,100 | | 36 | |
Teradata Corp. ‡ | | 300 | | 9 | |
Terex Corp. ‡ | | 300 | | 22 | |
Thermo Fisher Scientific, Inc. ‡ | | 3,400 | | 200 | |
TIBCO Software, Inc. ‡ | | 49,400 | | 453 | |
Time Warner, Inc. | | 8,600 | | 157 | |
Tyco Electronics, Ltd. | | 4,925 | | 176 | |
Tyson Foods, Inc. Class A | | 800 | | 13 | |
U.S. Steel Corp. | | 200 | | $ | 22 | |
Unifi, Inc. ‡ | | 27,000 | | 75 | |
Union Pacific Corp. | | 29,700 | | 3,803 | |
UnitedHealth Group, Inc. | | 17,325 | | 852 | |
US Cellular Corp. ‡ | | 200 | | 19 | |
Valeant Pharmaceuticals International ‡ | | 16,300 | | 237 | |
Valero Energy Corp. | | 300 | | 21 | |
Ventas, Inc. REIT | | 2,300 | | 99 | |
Verizon Communications, Inc. | | 29,400 | | 1,354 | |
Viacom, Inc. Class B ‡ | | 4,000 | | 165 | |
Wabco Holdings, Inc. | | 100 | | 5 | |
Wachovia Corp. | | 1,500 | | 69 | |
Wal-Mart Stores, Inc. | | 3,100 | | 140 | |
Waters Corp. ‡ | | 6,800 | | 523 | |
WellPoint, Inc. ‡ | | 10,050 | | 796 | |
Wells Fargo & Co. | | 6,100 | | 207 | |
Western Digital Corp. ‡ | | 800 | | 21 | |
Windstream Corp. | | 6,322 | | 85 | |
WW Grainger, Inc. | | 200 | | 18 | |
Wyeth | | 9,100 | | 443 | |
Xerox Corp. ‡ | | 14,800 | | 258 | |
Total Common Stocks (cost $209,787) | | | | 282,248 | |
| | | | | |
STRUCTURED NOTE DOMESTIC EQUITIES (0.2%) | | | | | |
United States (0.2%) | | | | | |
Preferred Term Secs XXV Note ‡, § | | 175,000 | | 143 | |
Preferred Term Secs XXVI Note ‡, § | | 190,000 | | 161 | |
Preferred Term Secs XXIV Note - 144A ‡, § | | 350,000 | | 291 | |
Preferred Term Secs Xxvii Note ‡, § | | 200,000 | | 204 | |
Total Structured Note Domestic Equities (cost $904) | | | | 799 | |
| | Principal | | Value | |
U.S. GOVERNMENT AGENCY OBLIGATIONS (5.1%) | | | | | |
United States (5.1%) | | | | | |
Fannie Mae | | | | | |
4.52%, due 12/17/2007 | | $ | 1,033 | | $ | 1,027 | |
5.40%, due 02/01/2008 | | 842 | | 843 | |
4.53%, due 11/28/2007 | | 1,000 | | 997 | |
4.40%, due 11/01/2007 | | 8,784 | | 8,784 | |
4.36%, due 01/02/2008 | | 2,000 | | 1,985 | |
4.48%, due 12/28/2007 | | 3,000 | | 2,979 | |
Freddie Mac | | | | | |
4.62%, due 11/19/2007 | | 10,000 | | 9,977 | |
Total U.S. Government Agency Obligations (cost $26,591) | | | | 26,592 | |
| | | | | | | |
21
| | Contracts (·) | | Value | |
PURCHASED OPTIONS (0.2%) | | | | | |
Covered Call Options (0.1%) | | | | | |
Bristol-Myers Squib | | 226 | | $ | 23 | |
Call Strike $35.00 | | | | | |
Expires 01/17/2009 | | | | | |
Gap, Inc. (The) | | 235 | | 5 | |
Call Strike $22.50 | | | | | |
Expires 01/19/2008 | | | | | |
General Motors | | 125 | | 61 | |
Call Strike $50.00 | | | | | |
Expires 01/16/2010 | | | | | |
General Motors | | 32 | | 9 | |
Call Strike $60.00 | | | | | |
Expires 01/16/2010 | | | | | |
Goldcorp, Inc. | | 206 | | 95 | |
Call Strike $32.50 | | | | | |
Expires 01/19/2008 | | | | | |
Medtronic, Inc. | | 34 | | 17 | |
Call Strike $50.00 | | | | | |
Expires 01/17/2009 | | | | | |
Medtronic, Inc. | | 78 | | 16 | |
Call Strike $60.00 | | | | | |
Expires 01/16/2010 | | | | | |
Newmont Mining Corp. | | 130 | | 51 | |
Call Strike $50.00 | | | | | |
Expires 01/19/2008 | | | | | |
Newmont Mining Corp. | | 235 | | 43 | |
Call Strike $55.00 | | | | | |
Expires 01/19/2008 | | | | | |
Put Options (0.1%) | | | | | |
Bank of America | | 389 | | 9 | |
Put Strike $45.00 | | | | | |
Expires 11/17/2007 | | | | | |
Bed Bath & Beyond, Inc. | | 200 | | 30 | |
Put Strike $35.00 | | | | | |
Expires 11/17/2007 | | | | | |
Black & Decker Corp. | | 113 | | 2 | |
Put Strike $80.00 | | | | | |
Expires 11/17/2007 | | | | | |
Carnival Corp. | | 230 | | 11 | |
Put Strike $40.00 | | | | | |
Expires 01/19/2008 | | | | | |
iShares Russell 2000 | | 1,512 | | 87 | |
Put Strike $78.00 | | | | | |
Expires 11/17/2007 | | | | | |
iShares Russell 2000 | | 939 | | 24 | |
Put Strike $75.00 | | | | | |
Expires 11/17/2007 | | | | | |
iShares Russell 2000 | | 2,559 | | 243 | |
Put Strike $80.00 | | | | | |
Expires 11/17/2007 | | | | | |
Masco Corp. | | 230 | | 28 | |
Put Strike $22.50 | | | | | |
Expires 01/19/2008 | | | | | |
Royal Caribbean Cruises | | 230 | | $ | 8 | |
Put Strike $35.00 | | | | | |
Expires 12/22/2007 | | | | | |
Russell 2000 Index | | 93 | | 177 | |
Put Strike $800.00 | | | | | |
Expires 12/22/2007 | | | | | |
S & P 500 Index | | 30 | | 15 | |
Put Strike $1,475.00 | | | | | |
Expires 11/17/2007 | | | | | |
S & P 500 Index | | 60 | | 48 | |
Put Strike $1,500.00 | | | | | |
Expires 11/17/2007 | | | | | |
Sears Holdings Corp. | | 114 | | 37 | |
Put Strike $120.00 | | | | | |
Expires 12/22/2007 | | | | | |
Sherwin-Williams Co. | | 224 | | 40 | |
Put Strike $60.00 | | | | | |
Expires 12/22/2007 | | | | | |
Williams-Sonoma, Inc. | | 200 | | 18 | |
Put Strike $30.00 | | | | | |
Expires 11/17/2007 | | | | | |
JPY Currency Future | | 1,311 | | 8 | |
Put Strike $106.90 | | | | | |
Expires 02/28/2008 | | | | | |
Total Purchased Options (cost $2,893) | | | | 1,105 | |
| | Principal | | Value | |
CONVERTIBLE BONDS (3.2%) | | | | | |
Bermuda (0.0%) | | | | | |
Hongkong Land Ltd. | | | | | |
2.75%, due 12/21/2012 | | $ | 200 | | $ | 277 | |
Cayman Islands (0.3%) | | | | | |
Chaoda Modern Agriculture | | | | | |
Zero Coupon, due 05/08/2011 | | HKD | 2,710 | | $ | 444 | |
YTL Power Finance Cayman, Ltd., | | | | | |
Zero Coupon, due 05/09/2010 | | 800 | | 964 | |
Hong Kong (0.1%) | | | | | |
Brilliance China Finance, Ltd., | | | | | |
Zero Coupon, due 06/07/2011 | | 400 | | 493 | |
India (1.0%) | | | | | |
Gujarat NRE Coke, Ltd. | | | | | |
Zero Coupon, due 04/12/2011 | | 200 | | 389 | |
Housing Development Finance Corp., | | | | | |
Zero Coupon, due 09/27/2010 | | 400 | | 845 | |
Punj Lloyd, Ltd., convertible | | | | | |
Zero Coupon, due 04/08/2011 | | 500 | | 905 | |
Reliance Communications, Ltd., | | | | | |
Zero Coupon, due 05/10/2011 – 03/01/2012 | | 1,575 | | 2,296 | |
| | | | | | | | |
22
| | Principal | | Value | |
India (continued) | | | | | |
Tata Motors, Ltd., | | | | | |
1.00%, due 04/27/2011 | | $ | 750 | | $ | 916 | |
United Spirits, Ltd., | | | | | |
2.00%, due 03/30/2011 | | 40 | | 109 | |
Japan (0.2%) | | | | | |
Bank of Kyoto, Ltd. (The), | | | | | |
1.90%, due 09/30/2009 | | JPY | 44,000 | | 882 | |
Jersey, C.I. (0.4%) | | | | | |
Aldar Funding, Ltd., | | | | | |
5.77%, due 11/10/2011 | | 1,000 | | 1,690 | |
Dana Gas Sukuk, Ltd., | | | | | |
7.50%, due 10/31/2012 | | 400 | | 427 | |
Malaysia (0.8%) | | | | | |
Berjaya Land BHD, | | | | | |
8.00%, due 08/15/2011 | | MYR | 840 | | 255 | |
Feringghi Capital, Ltd., , Reg S | | | | | |
Zero Coupon, due 12/22/2009 | | 600 | | 725 | |
IOI Capital BHD, | | | | | |
Zero Coupon, due 12/18/2011 | | 750 | | 1,266 | |
Rafflesia Capital, Ltd., | | | | | |
Zero Coupon, due 10/04/2011 | | 1,600 | | 1,902 | |
Resorts World BHD, | | | | | |
Zero Coupon, due 09/19/2008 | | MYR | 380 | | 161 | |
Singapore (0.3%) | | | | | |
Capitaland, Ltd., | | | | | |
2.10%, due 11/15/2016 | | SGD | 500 | | 412 | |
Enercoal Resources Pte, Ltd., Convertible | | | | | |
Zero Coupon, due 06/22/2012 | | 300 | | 555 | |
Keppel Land, Ltd., | | | | | |
2.50%, due 06/23/2013 | | SGD | 400 | | 371 | |
Taiwan (0.0%) | | | | | |
Shin Kong Financial Holding Co., Ltd., Convertible | | | | | |
Zero Coupon, due 06/17/2009 | | 20 | | 23 | |
United States (0.1%) | | | | | |
Cell Genesys, Inc., | | | | | |
3.13%, due 11/01/2011 | | 70 | | 57 | |
McMoRan Exploration Co., | | | | | |
5.25%, due 10/06/2011 | | 370 | | 392 | |
NABI Biopharmaceuticals, | | | | | |
2.88%, due 04/15/2025 | | 80 | | 68 | |
Total Convertible Bonds (cost $13,744) | | | | 16,824 | |
| | | | | | | | |
| | Shares | | Value | |
INVESTMENT COMPANIES (3.5%) | | | | | |
Cayman Islands (0.1%) | | | | | |
Dragon Capital - Vietnam Enterprise Investments, Ltd. | | 108,768 | | $ | 658 | |
United States (3.2%) | | | | | |
Consumer Staples Select Sector SPDR Fund | | 25,400 | | 722 | |
Health Care Select Sector SPDR Fund | | 25,500 | | 919 | |
iShares Dow Jones US Telecommunications Sector Index Fund | | 17,900 | | 576 | |
iShares Dow Jones US Utilities Sector Index Fund | | 1,300 | | 134 | |
iShares Silver Trust | | 8,200 | | 1,178 | |
Streettracks Gold Trust | | 121,200 | | 9,536 | |
Telecom Holdrs Trust | | 4,600 | | 189 | |
Utilities Select Sector SPDR Fund | | 76,200 | | 3,235 | |
Vanguard Telecommunication Services | | 500 | | 41 | |
Vietnam (0.2%) | | | | | |
Vinaland, Ltd. | | 647,100 | | 1,009 | |
Total Investment Companies (cost $15,499) | | | | 18,197 | |
| | | | | |
RIGHTS (0.0%) | | | | | |
Canada (0.0%) | | | | | |
Peak Gold LTD Warrants | | 41,000 | | 11 | |
Total Rights (cost $13) | | | | 11 | |
| | | | | |
Total Investment Securities (cost $436,241) # | | | | $ | 521,250 | |
| | | | | | | |
| | Contracts (·) | | Value | |
WRITTEN OPTIONS - 0.9% | | | | | |
Covered Call Options - 0.8% | | | | | |
Burlington Northern Santa Fe Corp. | | 28 | | $ | 10 | |
Call Strike $90.00 | | | | | |
Expires 1/19/2008 | | | | | |
Burlington Northern Santa Fe Corp. | | 71 | | 13 | |
Call Strike $95.00 | | | | | |
Expires 1/19/2008 | | | | | |
Petroleo Brasileiro S.A. - ADR | | 94 | | 413 | |
Call Strike $105.00 | | | | | |
Expires 1/19/2008 | | | | | |
Petroleo Brasileiro S.A. - ADR | | 70 | | 292 | |
Call Strike $110.00 | | | | | |
Expires 1/19/2008 | | | | | |
3Com Corp. | | 1,153 | | 14 | |
Call Strike $5.00 | | | | | |
Expires 1/19/2008 | | | | | |
American Commercial | | 121 | | 13 | |
Call Strike $17.50 | | | | | |
Expires 3/22/2008 | | | | | |
Apple, Inc. | | 156 | | 1,648 | |
Call Strike $85.00 | | | | | |
Expires 1/19/2008 | | | | | |
| | | | | | |
23
| | Contracts (·) | | Value | |
WRITTEN OPTIONS (continued) | | | | | |
Covered Call Options (continued) | | | | | |
Burlington Northern | | 56 | | $ | 61 | |
Call Strike $90.00 | | | | | |
Expires 1/17/2009 | | | | | |
Ciena Corp. | | 237 | | 225 | |
Call Strike $40.00 | | | | | |
Expires 1/19/2008 | | | | | |
Comcast Corp.-CL A | | 452 | | 9 | |
Call Strike $27.50 | | | | | |
Expires 4/19/2008 | | | | | |
Comverse Technology, Inc. | | 10 | | 1 | |
Call Strike $20.00 | | | | | |
Expires 1/19/2008 | | | | | |
Comverse Technology, Inc. | | 708 | | 174 | |
Call Strike $17.50 | | | | | |
Expires 1/19/2008 | | | | | |
Consol Energy, Inc. | | 103 | | 176 | |
Call Strike $45.00 | | | | | |
Expires 1/17/2009 | | | | | |
eBay, Inc. | | 61 | | 99 | |
Call Strike $20.00 | | | | | |
Expires 1/19/2008 | | | | | |
eBay, Inc. | | 54 | | 61 | |
Call Strike $25.00 | | | | | |
Expires 1/19/2008 | | | | | |
Exelon Corp. | | 92 | | 92 | |
Call Strike $75.00 | | | | | |
Expires 1/19/2008 | | | | | |
Foster Wheeler, Ltd. | | 37 | | 97 | |
Call Strike $130.00 | | | | | |
Expires 1/19/2008 | | | | | |
Foster Wheeler, Ltd. | | 11 | | 45 | |
Call Strike $135.00 | | | | | |
Expires 1/17/2009 | | | | | |
Motorola, Inc. | | 158 | | 8 | |
Call Strike $20.00 | | | | | |
Expires 1/19/2008 | | | | | |
Norfolk Southern Corp. | | 87 | | 36 | |
Call Strike $50.00 | | | | | |
Expires 1/19/2008 | | | | | |
Norfolk Southern | | 103 | | 63 | |
Call Strike $55.00 | | | | | |
Expires 1/17/2009 | | | | | |
Nortel Networks Corp. | | 223 | | 3 | |
Call Strike $22.50 | | | | | |
Expires 1/19/2008 | | | | | |
Novell, Inc. | | 88 | | 5 | |
Call Strike $7.50 | | | | | |
Expires 1/19/2008 | | | | | |
Panera Bread Co. | | 97 | | 5 | |
Call Strike $50.00 | | | | | |
Expires 1/19/2008 | | | | | |
Panera Bread Co. | | 137 | | 2 | |
Call Strike $55.00 | | | | | |
Expires 1/19/2008 | | | | | |
Peabody Energy Corp. | | 102 | | $ | 167 | |
Call Strike $40.00 | | | | | |
Expires 1/19/2008 | | | | | |
Qualcomm Inc | | 275 | | 120 | |
Call Strike $40.00 | | | | | |
Expires 1/19/2008 | | | | | |
Smith International, Inc. | | 53 | | 139 | |
Call Strike $40.00 | | | | | |
Expires 1/19/2008 | | | | | |
Sprint Nextel Corp. | | 115 | | 3 | |
Call Strike $20.00 | | | | | |
Expires 1/19/2008 | | | | | |
Sprint Nextel Corp. | | 177 | | 1 | |
Call Strike $22.50 | | | | | |
Expires 1/19/2008 | | | | | |
The St Joe Co. | | 38 | | 14 | |
Call Strike $40.00 | | | | | |
Expires 1/17/2009 | | | | | |
The St Joe Co. | | 68 | | 38 | |
Call Strike $35.00 | | | | | |
Expires 1/17/2009 | | | | | |
The St Joe Co. | | 92 | | 27 | |
Call Strike $35.00 | | | | | |
Expires 3/22/2008 | | | | | |
State Street Corp. | | 23 | | 26 | |
Call Strike $75.00 | | | | | |
Expires 5/17/2008 | | | | | |
State Street Corp. | | 23 | | 19 | |
Call Strike $80.00 | | | | | |
Expires 5/17/2008 | | | | | |
Suncor Energy, Inc. | | 58 | | 205 | |
Call Strike $75.00 | | | | | |
Expires 1/19/2008 | | | | | |
Valeant Pharmaceuticals International | | 163 | | 33 | |
Call Strike $15.00 | | | | | |
Expires 1/17/2009 | | | | | |
Xerox Corp. | | 148 | | 21 | |
Call Strike $20.00 | | | | | |
Expires 1/17/2009 | | | | | |
Put Options - 0.1% | | | | | |
Ciena Corp. | | 74 | | 135 | |
Put Strike $30.00 | | | | | |
Expires 1/19/2008 | | | | | |
El Paso Corp. | | 160 | | 46 | |
Put Strike $15.00 | | | | | |
Expires 1/19/2008 | | | | | |
Russell 2000 Index | | 93 | | 35 | |
Put Strike $700.00 | | | | | |
Expires 12/22/2007 | | | | | |
S & P 500 Index | | 60 | | 11 | |
Put Strike $1,425.00 | | | | | |
Expires 11/17/2007 | | | | | |
Total Written Options (premiums: $2,496) | | | | 4,605 | |
24
FUTURES CONTRACTS:
| | | | | | | | Net Unrealized | |
| | | | Settlement | | | | Appreciation | |
| | Contracts (·) | | Date | | Amount | | (Depreciation) | |
10 Year Japan Government Bond | | (4) | | 12/20/2007 | | $ | (4,718 | ) | $ | (22 | ) |
10 Year US Note | | (15) | | 12/31/2007 | | (1,650 | ) | (2 | ) |
2 Year US Note | | 23 | | 12/31/2007 | | 4,764 | | (1 | ) |
90-Day Euro Dollar | | (1) | | 09/14/2009 | | (239 | ) | (1 | ) |
90-Day Euro Dollar | | 1 | | 09/15/2008 | | 239 | | 1 | |
DAX Index | | 4 | | 12/19/2007 | | 1,166 | | 30 | |
DJ Euro STOXX 50 Index | | 2 | | 12/15/2007 | | 130 | | 6 | |
FTSE 100 Index | | 4 | | 12/16/2007 | | 561 | | 19 | |
Hang Seng Index | | (1) | | 12/28/2007 | | (202 | ) | (14 | ) |
MSCI Taiwan Index | | (12) | | 11/29/2007 | | (460 | ) | (1 | ) |
Russell 2000 Index | | (7) | | 12/14/2007 | | (2,913 | ) | (27 | ) |
S&P 500 Index | | (24) | | 12/14/2007 | | (10,496 | ) | (298 | ) |
S&P/TSE 60 Index | | 2 | | 12/20/2007 | | 359 | | 19 | |
SPI 200 Index | | (2) | | 12/20/2007 | | (315 | ) | (3 | ) |
| | | | | | $ | (13,774 | ) | $ | (294 | ) |
FORWARD FOREIGN CURRENCY CONTRACTS:
| | | | | | Amount in | | Net Unrealized | |
| | Bought | | Settlement | | U.S. Dollars | | Appreciation | |
Currency | | (Sold) | | Date | | Bought(Sold) | | (Depreciation) | |
Canadian Dollar | | (505 | ) | 11/16/2007 | | $ | (519 | ) | $ | (13 | ) |
Dong | | 3,612,150 | | 05/08/2008 | | 225 | | (1 | ) |
Dong | | 5,935,278 | | 05/21/2008 | | 371 | | (3 | ) |
Euro Dollar | | 5,967 | | 11/16/2007 | | 8,496 | | 139 | |
Euro Dollar | | 9,612 | | 12/07/2007 | | 13,679 | | 235 | |
Great British Pound | | (578 | ) | 12/07/2007 | | (502 | ) | (2 | ) |
Indian Rupee | | 9,792 | | 04/23/2008 | | 225 | | 22 | |
Indian Rupee | | 8,310 | | 12/12/2007 | | 200 | | 11 | |
Indian Rupee | | (8,310 | ) | 12/12/2007 | | (201 | ) | (10 | ) |
Japanese Yen | | 1,590,756 | | 11/01/2007 | | 13,619 | | 179 | |
Japanese Yen | | 1,772,724 | | 11/30/2007 | | 15,269 | | 157 | |
Japanese Yen | | 1,590,756 | | 12/14/2007 | | 13,920 | | (55 | ) |
Singapore Dollar | | 1,014 | | 11/16/2007 | | 700 | | 1 | |
Swiss Franc | | 5,634 | | 11/16/2007 | | 4,780 | | 86 | |
United Kingdom Pound | | (1,029 | ) | 12/07/2007 | | (2,105 | ) | (31 | ) |
| | | | | | $ | 68,157 | | $ | 715 | |
| | | | | | | | | | | | | |
FORWARD FOREIGN CROSS CURRENCY CONTRACTS
| | | | | | | | | | Net Unrealized | |
| | | | | | | | Settlement | | Appreciation | |
Currency Bought | | | | Currency Sold | | Date | | (Depreciation) | |
Australian Dollar | | 1,436 | | United Kingdom Pound | | 630 | | 11/07/2007 | | $ | 22 | |
Japanese Yen | | 113,834 | | Euro Dollar | | 690 | | 11/30/2007 | | (9 | ) |
Swiss Franc | | 578 | | United Kingdom Pound | | 500 | | 12/14/2007 | | q | |
Swiss Franc | | 1,495 | | United Kingdom Pound | | 625 | | 11/07/2007 | | (8 | ) |
| | | | | | | | | | $ | 5 | |
25
| | Percentage of | | | |
(unaudited) | | Total Investments | | Value | |
INVESTMENTS BY INDUSTRY: | | | | | |
U.S. Government Obligation | | 19.3 | % | $ | 100,603 | |
Oil, Gas & Consumable Fuels | | 7.7 | % | 40,313 | |
Capital Markets | | 6.0 | % | 31,044 | |
Sovereign Government Obligation | | 5.7 | % | 29,808 | |
Commercial Banks | | 5.1 | % | 26,417 | |
Insurance | | 4.6 | % | 23,752 | |
Diversified Financial Services | | 4.4 | % | 22,940 | |
Metals & Mining | | 3.2 | % | 16,700 | |
Industrial Conglomerates | | 2.9 | % | 14,856 | |
Wireless Telecommunication Services | | 2.6 | % | 13,633 | |
Pharmaceuticals | | 2.5 | % | 12,985 | |
Food Products | | 2.3 | % | 12,110 | |
Automobiles | | 2.2 | % | 11,267 | |
Diversified Telecommunication Services | | 2.1 | % | 10,968 | |
Road & Rail | | 2.0 | % | 10,176 | |
Communications Equipment | | 1.6 | % | 8,403 | |
Software | | 1.4 | % | 7,367 | |
Electric Utilities | | 1.3 | % | 6,776 | |
Energy Equipment & Services | | 1.2 | % | 6,326 | |
Computers & Peripherals | | 1.1 | % | 5,963 | |
Chemicals | | 1.1 | % | 5,792 | |
Real Estate Management & Development | | 1.1 | % | 5,702 | |
Construction & Engineering | | 1.1 | % | 5,678 | |
Independent Power Producers & Energy Traders | | 0.9 | % | 4,634 | |
Health Care Providers & Services | | 0.9 | % | 4,619 | |
Beverages | | 0.9 | % | 4,523 | |
Media | | 0.9 | % | 4,456 | |
Transportation Infrastructure | | 0.8 | % | 4,013 | |
Tobacco | | 0.7 | % | 3,537 | |
Construction Materials | | 0.5 | % | 2,785 | |
Thrifts & Mortgage Finance | | 0.5 | % | 2,634 | |
Machinery | | 0.5 | % | 2,623 | |
Hotels, Restaurants & Leisure | | 0.5 | % | 2,529 | |
Electronic Equipment & Instruments | | 0.5 | % | 2,519 | |
Aerospace & Defense | | 0.5 | % | 2,378 | |
Internet Software & Services | | 0.4 | % | 2,282 | |
Electrical Equipment | | 0.3 | % | 1,564 | |
Food & Staples Retailing | | 0.3 | % | 1,488 | |
Trading Companies & Distributors | | 0.3 | % | 1,487 | |
Health Care Equipment & Supplies | | 0.2 | % | 1,280 | |
Biotechnology | | 0.2 | % | 1,131 | |
Household Durables | | 0.2 | % | 1,127 | |
Derivative | | 0.2 | % | 1,117 | |
Office Electronics | | 0.2 | % | 1,111 | |
Multi-Utilities | | 0.2 | % | 1,087 | |
Semiconductors & Semiconductor Equipment | | 0.2 | % | 1,007 | |
Air Freight & Logistics | | 0.2 | % | 833 | |
Building Products | | 0.2 | % | 832 | |
Gas Utilities | | 0.1 | % | 765 | |
Paper & Forest Products | | 0.1 | % | 761 | |
Life Sciences Tools & Services | | 0.1 | % | 723 | |
Sovereign Government Agency Obligation | | 0.1 | % | 670 | |
Auto Components | | 0.1 | % | 650 | |
Consumer Finance | | 0.1 | % | 563 | |
| | | | | | |
26
| | Percentage of | | | |
(unaudited) | | Total Investments | | Value | |
INVESTMENTS BY INDUSTRY (continued): | | | | | |
Textiles, Apparel & Luxury Goods | | 0.1 | % | $ | 560 | |
IT Services | | 0.1 | % | 550 | |
Marine | | 0.1 | % | 520 | |
Containers & Packaging | | 0.1 | % | 401 | |
Household Products | | 0.1 | % | 264 | |
Water Utilities | | 0.1 | % | 248 | |
Personal Products | | 0.0 | % | 225 | |
Asset-Backed Securities | | 0.0 | % | 168 | |
Multiline Retail | | 0.0 | % | 118 | |
Real Estate Investment Trusts | | 0.0 | % | 109 | |
Specialty Retail | | 0.0 | % | 62 | |
Commercial Services & Supplies | | 0.0 | % | 55 | |
Internet & Catalog Retail | | 0.0 | % | 39 | |
Leisure Equipment & Products | | 0.0 | % | 18 | |
Airlines | | 0.0 | % | 14 | |
Investment Securities, at value | | 94.9 | % | 494,658 | |
Short-Term Investments | | 5.1 | % | 26,592 | |
Total Investments | | 100.0 | % | $ | 521,250 | |
NOTES TO SCHEDULE OF INVESTMENTS
q | Value is less than $1 |
* | Floating or variable rate note. Rate is listed as of October 31, 2007. |
§ | Illiquid |
‡ | Non Income Producing |
· | Contract Amounts are not in thousands |
(1) | At October 31, 2007, all or a portion of this security is segregated with the custodian to cover margin requirements for open futures contracts. The value of all securities segregated at October 31, 2007 is $4,471. |
(2) | In Default |
# | Aggregate cost for federal income tax purposes is $437,429. Aggregate gross unrealized appreciation for all securities in which there is an excess of value over tax cost and aggregate gross unrealized depreciation for all securities in which there is an excess of tax cost over value were $90,534 and $6,713 respectively. Net unrealized appreciation for tax purposes is $83,821. |
DEFINITIONS:
144A | | 144A Securities are registered pursuant to Rule 144A of the Securities Act of 1933. These securities are deemed to be liquid for purposes of compliance limitations on holdings of illiquid securities and may be resold as transactions exempt from registration, normally to qualified institutional buyers. At October 31, 2007, these securities aggregated $462 or 0.09% of net assets of the Fund. |
ADR | | American Depositary Receipt |
PCL | | Public Company Limited |
REIT | | Real Estate Investment Trust |
SPDR | | Standard & Poor’s Depository Receipts |
TIPS | | Treasury Inflation Protected Security |
AUD | | Australia dollar |
BRL | | Brazil Real |
CAD | | Canada dollar |
EUR | | Euro Dollar |
GBP | | United Kingdom pound |
HKD | | Hong Kong dollar |
JPY | | Japan yen |
MYR | | Malaysia ringgit |
NZD | | New Zealand dollar |
PLN | | Poland new zloty |
SEK | | Sweden krona |
SGD | | Singapore dollar |
27
TA IDEX BlackRock Large Cap Value
MARKET ENVIRONMENT
In light of the Federal Reserve Board (“Fed”) rate decisions in September and October, a new monetary easing cycle has begun, which is normally a bullish signal for risk assets. Stocks typically do well when the Fed starts to cut rates, even though the economic and earnings outlook is deteriorating. But the outlook is not without its challenges. There is no precedent in the post-WWII period for the ongoing destruction in housing wealth, which creates considerable uncertainty about the outlook for consumer spending and the economy.
Even if recession is avoided, as we believe, earnings expectations are too high. The bottom-up consensus of analysts’ projections implies the Standard and Poor’s 500 operating earnings growth of 11-12% in 2008. We believe earnings growth will be half that at best. Those companies most exposed to international trade will fare well, while those most dependent on domestic growth will struggle. So, while the liquidity and interest rate backdrop is supportive for equities, there is still a big question mark over earnings. The good news is that these economic events are occurring from a starting point of very strong consumer and corporate sector balance sheets. The combination of a decent global economic backdrop, reasonable valuations, plentiful liquidity and what will become more stimulative policy conditions will continue to support equity prices. There could be considerable volatility in the months ahead, but we believe that the path of least resistance is for equity prices to move higher.
A relatively healthy global economy and a weaker dollar support the case for emphasizing globally-focused assets rather than ones that depend heavily on U.S. domestic demand. We still recommend a two-pronged approach to equity investing. Prong #1 is a recognition that the U.S. economy is sluggish, requiring a focus on higher quality and higher predictability. This points one to health care, selected technology and other growth stocks. Prong #2 recognizes that the rest of the world, especially Asia, is growing nicely. This points one to technology and selected energy, materials and industrial stocks with an emphasis on non-U.S. earnings.
PERFORMANCE
For the year ended October 31, 2007, TA IDEX BlackRock Large Cap Value, Class I returned 11.80%. By comparison its benchmark, the Russell 1000 Value, returned 10.83%. For the year ended October 31, 2007, the net expense ratio of the Fund was 0.84%.
STRATEGY REVIEW
Sector allocation decisions proved additive, with an underweight to financials and an overweight to energy accounting for most of outperformance. Stock selection was also positive in financials, healthcare and industrials; however these positive effects were offset by selection issues in consumer discretionary, consumer staples and telecommunications. Individual names that proved most additive included Tesoro Corporation (energy), EMC Corporation (information technology (“IT”)), Medco Health Solutions, Inc. (healthcare), Cummins, Inc. (industrials) and United States Steel Corporation (materials). Companies that detracted included AMR Corporation (industrials), Time Warner Inc. (consumer discretionary), Lehman Brothers Holdings Inc. (financials), Sun Microsystems (IT) and an underweight exposure to AT&T Inc. (telecommunications).
Late July and early August were challenging periods for the portfolio. There were a number of causes that contributed to the August market turmoil, but the selling pressure on some stocks is believed to have been the result of many large quantitative, model-driven, multi-strategy, highly levered funds that experienced losses across many of their strategies and were forced to raise cash and de-lever in order to fund investor withdrawals. With many of these quantitative managers unwinding significant factor based portfolios in tandem, these factors started to behave in perverse (i.e. exactly reverse) ways. Because many quantitative managers employ similar factors in their models, this abnormal factor phenomenon was not confined to a few funds, and the contagion spread broadly to a number of quantitative managers. It is important and worth remembering, however, that the TA IDEX BlackRock Large Cap Value investment strategy is not purely a quantitative strategy but rather a blend of quantitative and fundamental approaches. That said, however, our process is biased enough to the quantitative side that we were not shielded from the extreme, exogenous events of July and August. None-the-less, we have not made changes to and remain confident in our quantitative model as it helps us identify well managed companies with good earnings growth rates that are trading at reasonable valuations. Likewise, the fundamental and portfolio construction components of our strategy also remain unchanged.
In terms of portfolio positioning, we continue to maintain overweight positions in IT and health care along with underweight positions in financials and consumer related sectors.
Robert C. Doll, Jr. CFA, CPA
Fund Manager
BlackRock Investment Management, LLC
28
(unaudited)

Average Annual Total Return for Periods Ended 10/31/2007
| | 1 Year | | From
Inception | | Inception
Date | |
Class A (NAV) | | — | % | — | % | 11/15/05 | |
Class I (NAV) | | 11.80 | % | 14.35 | % | 11/15/05 | |
Russell 1000 Value (1) | | 10.83 | % | 15.19 | % | 11/15/05 | |
NOTES
(1) The Russell 1000 Value (Russell 1000 Value) Index is an unmanaged index used as a general measure of market performance. Calculations assume dividends and capital gains are reinvested and do not include any managerial expenses. From inception calculation is based on life of Class I shares.
The performance data presented represents past performance, future results may vary. Performance data does not reflect the deduction of taxes that would be paid on fund distributions or the redemption of fund shares. Investment return and principal value will fluctuate so that an investor’s shares, when redeemed, may be worth more or less than their original cost. Current performance may be lower or higher than performance quoted. Please see www.transamericaidex.com for performance data current to the most recent month-end.
Net Asset Value (NAV) returns include the reinvestment of dividends and capital gains but do not reflect any sales charges.
This material must be preceded or accompanied by a current prospectus, which includes specific contents regarding the investment objectives and policies of this fund.
This fund is only available in Class I shares, which are not available for direct investment by the public.
29
UNDERSTANDING YOUR FUND’S EXPENSES
(unaudited)
SHAREHOLDER EXPENSES
Fund shareholders may incur two types of costs: (1) transaction costs, including sales charges (loads) on purchases, contingent deferred sales charges on redemptions and redemption fees; and (2) ongoing costs, including management fees, dividend expense on short-sales, and other fund expenses.
The following Example is intended to help you understand your ongoing costs (in dollars and cents) of investing in the Fund and to compare these costs with the ongoing costs of investing in other funds.
The Example is based on an investment of $1,000 invested at May 1, 2007 and held for the entire period until October 31, 2007.
ACTUAL EXPENSES
The first line in the table below provides information about actual account values and actual expenses. You may use the information in this line, together with the amount you invested, to estimate the expenses that you paid over the period. Simply divide your account value by $1,000 (for example, an $8,600 account value divided by $1,000 = 8.6), then multiply the result by the number in the first line of your Fund under the heading entitled “Expenses Paid During Period” to estimate the expenses you paid on your account during this period.
HYPOTHETICAL EXAMPLE FOR COMPARISON PURPOSES
The second line in the table below provides information about hypothetical account values and hypothetical expenses based on the Fund’s actual expense ratio and an assumed rate of return of 5% per year before expenses, which is not the Fund’s actual return. The hypothetical account values and expenses may not be used to estimate the actual ending account balance or expenses you paid for the period. You may use this information to compare the ongoing costs of investing in your Fund and other funds. To do so, compare this 5% hypothetical example with the 5% hypothetical examples that appear in the shareholder reports of the other funds.
Please note that the expenses shown in the table are meant to highlight your ongoing costs only and do not reflect any transactional costs, such as sales charges, redemption fees, brokerage commissions paid on purchases and sales of fund shares. Therefore, the second line under the Fund in the table is useful in comparing ongoing costs only, and will not help you determine the relative total costs of owning different funds. If any of these transaction costs were included, your costs would be higher. The expenses shown in the table do not reflect any fees that may be charged to you by brokers, financial intermediaries or other financial institutions.
| | Beginning | | Ending | | Annualized | | Expenses | |
| | Account | | Account | | Expense | | Paid During | |
| | Value | | Value | | Ratio | | Period (a) | |
Class I | | | | | | | | | |
Actual | | $ | 1,000.00 | | $ | 1,017.90 | | 0.84 | % | $ | 4.26 | |
Hypothetical (b) | | 1,000.00 | | 1,020.91 | | 0.84 | | 4.27 | |
| | | | | | | | | | | | |
(a) | | Expenses are calculated using the Fund’s annualized expense ratio (as disclosed in the table), multiplied by the average account value for the period, multiplied by the number of days in the period (184 days), and divided by the number of days in the year (365 days). |
| | |
(b) | | 5% return per year before expenses. |
GRAPHICAL PRESENTATION OF SCHEDULE OF INVESTMENTS
By Sector
At October 31, 2007
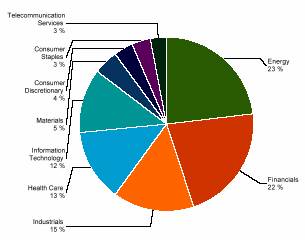
This chart shows the percentage breakdown by sector of the Fund’s total investment securities.
30
SCHEDULE OF INVESTMENTS
At October 31, 2007
(all amounts except share amounts in thousands)
| | Shares | | Value | |
COMMON STOCKS (99.6%) | | | | | |
Aerospace & Defense (5.0%) | | | | | |
Honeywell International, Inc. | | 113,000 | | $ | 6,826 | |
Lockheed Martin Corp. | | 50,000 | | 5,502 | |
Northrop Grumman Corp. | | 102,000 | | 8,529 | |
Raytheon Co. | | 118,000 | | 7,506 | |
United Technologies Corp. | | 28,000 | | 2,145 | |
Automobiles (0.1%) | | | | | |
General Motors Corp. | | 20,000 | | 784 | |
Biotechnology (1.1%) | | | | | |
Biogen IDEC, Inc. ‡ | | 93,000 | | 6,923 | |
Capital Markets (1.8%) | | | | | |
Goldman Sachs Group, Inc. (The) | | 44,000 | | 10,909 | |
Chemicals (2.3%) | | | | | |
Dow Chemical Co. (The) | | 183,000 | | 8,243 | |
Ei DU Pont de Nemours & Co. | | 118,000 | | 5,842 | |
Commercial Banks (0.9%) | | | | | |
Comerica, Inc. | | 115,000 | | 5,368 | |
Commercial Services & Supplies (0.1%) | | | | | |
Allied Waste Industries, Inc. ‡ | | 41,000 | | 518 | |
Communications Equipment (2.1%) | | | | | |
ADC Telecommunications, Inc. ‡ | | 316,000 | | 5,909 | |
Juniper Networks, Inc. ‡ | | 190,000 | | 6,840 | |
Computers & Peripherals (3.6%) | | | | | |
EMC Corp. ‡ | | 270,000 | | 6,855 | |
Hewlett-Packard Co. | | 117,000 | | 6,047 | |
International Business Machines Corp. | | 76,000 | | 8,825 | |
Diversified Financial Services (4.6%) | | | | | |
Bank of America Corp. | | 107,000 | | 5,166 | |
Citigroup, Inc. | | 117,000 | | 4,902 | |
JPMorgan Chase & Co. | | 382,000 | | 17,954 | |
Diversified Telecommunication Services (3.0%) | | | | | |
AT&T, Inc. | | 209,000 | | 8,734 | |
CenturyTel, Inc. | | 94,000 | | 4,141 | |
Qwest Communications International, | | 751,000 | | 5,392 | |
Inc. ‡^ | | | | | |
Electric Utilities (0.4%) | | | | | |
CMS Energy Corp. ^ | | 159,000 | | 2,698 | |
Electronic Equipment & Instruments (0.8%) | | | | | |
Agilent Technologies, Inc. ‡ | | 133,000 | | 4,901 | |
Energy Equipment & Services (1.7%) | | | | | |
Ensco International, Inc. | | 101,000 | | 5,604 | |
Tidewater, Inc. | | 85,000 | | 4,647 | |
Food & Staples Retailing (2.2%) | | | | | |
Kroger Co. (The) | | 224,000 | | 6,583 | |
Safeway, Inc. | | 206,000 | | 7,004 | |
Food Products (1.3%) | | | | | |
HJ Heinz Co. | | 128,000 | | 5,988 | |
Tyson Foods, Inc. Class A | | 106,000 | | 1,675 | |
Health Care Providers & Services (6.4%) | | | | | |
Aetna, Inc. | | 120,000 | | 6,740 | |
AmerisourceBergen Corp. Class A | | 106,000 | | 4,994 | |
Humana, Inc. ‡ | | 73,000 | | 5,471 | |
McKesson Corp. | | 109,000 | | 7,205 | |
Medco Health Solutions, Inc. ‡ | | 67,000 | | $ | 6,324 | |
WellPoint, Inc. ‡ | | 102,000 | | 8,081 | |
Industrial Conglomerates (2.9%) | | | | | |
General Electric Co. | | 438,000 | | 18,028 | |
Insurance (13.9%) | | | | | |
ACE, Ltd. | | 125,000 | | 7,576 | |
Alleghany Corp. ‡^ | | 2,040 | | 802 | |
Allstate Corp. (The) | | 121,000 | | 6,340 | |
American Financial Group, Inc. | | 79,500 | | 2,377 | |
American International Group, Inc. | | 266,000 | | 16,790 | |
Chubb Corp. | | 147,000 | | 7,843 | |
Genworth Financial, Inc. Class A | | 46,000 | | 1,256 | |
Lincoln National Corp. | | 65,000 | | 4,054 | |
Loews Corp. | | 46,000 | | 2,258 | |
MBIA, Inc. | | 106,000 | | 4,562 | |
MetLife, Inc. | | 128,000 | | 8,813 | |
Prudential Financial, Inc. | | 89,000 | | 8,608 | |
SAFECO Corp. | | 81,000 | | 4,690 | |
St. Paul Travelers Cos., Inc. (The) ‡ | | 167,000 | | 8,719 | |
IT Services (1.4%) | | | | | |
Computer Sciences Corp. ‡ | | 118,000 | | 6,890 | |
Electronic Data Systems Corp. | | 66,000 | | 1,425 | |
Machinery (5.1%) | | | | | |
AGCO Corp. ‡ | | 94,000 | | 5,610 | |
Deere & Co. | | 59,000 | | 9,139 | |
ITT Corp. | | 30,000 | | 2,008 | |
Parker Hannifin Corp. | | 61,000 | | 4,903 | |
SPX Corp. | | 47,000 | | 4,761 | |
Terex Corp. ‡ | | 66,000 | | 4,898 | |
Media (3.0%) | | | | | |
Time Warner, Inc. | | 525,000 | | 9,587 | |
Walt Disney Co. (The) | | 250,000 | | 8,657 | |
Metals & Mining (1.1%) | | | | | |
U.S. Steel Corp. | | 64,000 | | 6,906 | |
Multiline Retail (0.4%) | | | | | |
Dollar Tree Stores, Inc. ‡ | | 69,000 | | 2,643 | |
Office Electronics (0.6%) | | | | | |
Xerox Corp. ‡ | | 221,000 | | 3,854 | |
Oil, Gas & Consumable Fuels (21.4%) | | | | | |
Chevron Corp. | | 239,000 | | 21,871 | |
ConocoPhillips | | 203,000 | | 17,247 | |
Exxon Mobil Corp. | | 427,000 | | 39,280 | |
Frontier Oil Corp. | | 135,000 | | 6,182 | |
Marathon Oil Corp. | | 165,000 | | 9,756 | |
Noble Energy, Inc. | | 93,000 | | 7,118 | |
Occidental Petroleum Corp. | | 153,000 | | 10,565 | |
Overseas Shipholding Group, Inc. | | 11,000 | | 818 | |
Sunoco, Inc. | | 71,000 | | 5,226 | |
Tesoro Corp. ^ | | 97,000 | | 5,871 | |
Valero Energy Corp. | | 92,000 | | 6,479 | |
Paper & Forest Products (1.1%) | | | | | |
International Paper Co. | | 187,000 | | 6,912 | |
The notes to the financial statements are an integral part of this report.
31
| | Shares | | Value | |
Pharmaceuticals (5.9%) | | | | | |
Eli Lilly & Co. | | 146,000 | | $ | 7,906 | |
Merck & Co., Inc. | | 139,000 | | 8,098 | |
Pfizer, Inc. | | 815,000 | | 20,057 | |
Road & Rail (1.2%) | | | | | |
CSX Corp. | | 162,000 | | 7,253 | |
Semiconductors & Semiconductor Equipment (1.9%) | | | | | |
Integrated Device Technology, Inc. ‡ | | 204,000 | | 2,740 | |
Intersil Corp. Class A | | 29,000 | | 880 | |
KLA-Tencor Corp. ^ | | 93,000 | | 4,896 | |
Teradyne, Inc. ‡ | | 228,000 | | 2,814 | |
Software (1.6%) | | | | | |
CA, Inc. ^ | | 121,000 | | 3,201 | |
Compuware Corp. ‡ | | 450,000 | | 4,500 | |
McAfee, Inc. ‡ | | 47,000 | | 1,943 | |
Trading Companies & Distributors (0.7%) | | | | | |
WW Grainger, Inc. | | 49,000 | | $ | 4,406 | |
Total Common Stocks (cost $515,027) | | | | 607,791 | |
| | | | | |
INVESTMENT COMPANIES (0.6%) | | | | | |
Capital Markets (0.6%) | | | | | |
Merrill Lynch Money Market Mutual Fund
5.33%, due 06/15/2009 | | 3,757 | | 3,757 | |
Total Investment Companies (cost $3,757) | | | | 3,757 | |
| | | | | |
Total Security Lending Collateral (cost $15,304) | | | | 15,304 | |
Total Investment Securities (cost $534,088) # | | | | $ | 626,852 | |
NOTES TO SCHEDULE OF INVESTMENTS
^ | At October 31, 2007, all or a portion of this security is on loan (see Note 1). The value at October 31, 2007, of all securities on loan is$14,369. |
‡ | Non Income Producing |
# | Aggregate cost for federal income tax purposes is $534,428. Aggregate gross unrealized appreciation for all securities in which there is an excess of value over tax cost and aggregate gross unrealized depreciation for all securities in which there is an excess of tax cost over value were $106,045 and $13,621, respectively. Net unrealized appreciation for tax purposes is $92,424. |
The notes to the financial statements are an integral part of this report.
32
TA IDEX BlackRock Natural Resources
MARKET ENVIRONMENT
Since the inception of TA IDEX BlackRock Natural Resources in January of this year, energy and commodities prices have moved mostly higher, driven by strong global demand and the continued weakening of the US Dollar. Notably, high refining margins and sustained energy demand at elevated price levels has served as a catalyst for energy stocks. Natural gas prices have lagged relative to oil prices, however, due primarily to elevated storage levels. As a result, larger cap energy stocks have outperformed smaller cap energy stocks (many of the natural gas producers are smaller cap companies), with oil service and integrated oil stocks leading the way.
PERFORMANCE
For the period from inception December 27, 2006 through October 31, 2007, TA IDEX BlackRock Natural Resources, Class I returned 41.10%. By comparison its benchmark, the Morgan Stanley Capital International Natural Resources Index (“MSCI Natural Resources”), returned 33.02%. For the year ended October 31, 2007, the net expense ratio of the Fund was 0.89%.
STRATEGY REVIEW
More recently, sub prime-related credit concerns have dominated market sentiment. However, energy prices and stocks have managed to hold their own, rallying substantially through the third quarter. While volatility in the overall market has risen dramatically throughout the year, natural resources stocks have benefited as investors seek real assets, inflation hedges, and industries with strong growth potential that are removed from the turmoil of the financial sector. Gold and other commodity prices have also benefited from recent interest rate cuts by the Federal Reserve Board and the resulting downward pressure exerted on the US Dollar. Going forward, we believe, the primary threat to a continued strong outlook for natural resources prices would be a negative shift in global demand. Given the seemingly ever-growing credit problems, the risks to downward pressure on natural resource demand resulting from an economic slowdown should not be overlooked. However, our overall outlook for the sector remains optimistic, as demand from developing countries should continue to support prices over the long term.
Since inception, the portfolio has outperformed its benchmark, the MSCI Natural Resources. Throughout the period, the portfolio maintained its long-term focus and benefited from superior stock selection, particularly within the equipment and services, aluminum, and integrated oil and gas sectors. Positions with the greatest positive impact on performance included National Oilwell Varco, Inc., Aluminum Corporation of China Limited, and Murphy Oil Corporation. Additionally, our overweight in oil and gas exploration and production and our exposure to Brazil and China aided relative performance. While we did not own many negative performing stocks in the portfolio, TUSK Energy Corporation. and Crew Energy Inc. were the largest detractors from performance.
Given record-high storage levels and the potential for another warmer than expected winter heating season, we have reduced our exposure to natural gas companies. We remain leveraged to the tight supply balance in global oil markets, as well as energy service and equipment companies that are benefiting from increased spending. We also maintain exposure to metals and mining companies, including gold miners.
Robert Shearer, CFA
Fund Manager
BlackRock Investment Management, LLC
33
(unaudited)

Average Annual Total Return for Period Ended 10/31/2007
| | From Inception | | Inception Date | |
Class I (NAV) | | 41.10 | % | 1/3/07 | |
MSCI Natural Resources (1) | | 33.02 | % | 1/3/07 | |
NOTES
(1)The Morgan Stanley Capital International-Natural Resources Index is an unmanaged index used as a general measure of market performance. Calculations assume dividends and capital gains are reinvested and do not include any managerial expenses. From inception calculation is based on life of the Fund.
The performance data presented represents past performance, future results may vary. Performance data does not reflect the deduction of taxes that would be paid on fund distributions or the redemption of fund shares. Investment return and principal value will fluctuate so that an investor’s shares, when redeemed, may be worth more or less than their original cost. Current performance may be lower or higher than performance quoted. Please see www.transamericaidex.com for performance data current to the most recent month-end.
Net Asset Value (NAV) returns include the reinvestment of dividends and capital gains. Fund shares are sold without a sales load. International investing involves special risks including currency fluctuations, political instability, and different financial accounting standards. This material must be preceded or accompanied by a current prospectus, which includes specific contents regarding the investment objectives and policies of this fund.
This fund is only available in Class I shares, which are not available for direct investment by the public.
34
UNDERSTANDING YOUR FUND’S EXPENSES
(unaudited)
SHAREHOLDER EXPENSES
Fund shareholders may incur two types of costs: (1) transaction costs, including sales charges (loads) on purchases, contingent deferred sales charges on redemptions and redemption fees; and (2) ongoing costs, including management fees, dividend expense on short-sales, and other fund expenses.
The following Example is intended to help you understand your ongoing costs (in dollars and cents) of investing in the Fund and to compare these costs with the ongoing costs of investing in other funds.
The Example is based on an investment of $1,000 invested at May 1, 2007 and held for the entire period until October 31, 2007.
ACTUAL EXPENSES
The first line in the table below provides information about actual account values and actual expenses. You may use the information in this line, together with the amount you invested, to estimate the expenses that you paid over the period. Simply divide your account value by $1,000 (for example, an $8,600 account value divided by $1,000 = 8.6), then multiply the result by the number in the first line of your Fund under the heading entitled “Expenses Paid During Period” to estimate the expenses you paid on your account during this period.
HYPOTHETICAL EXAMPLE FOR COMPARISON PURPOSES
The second line in the table below provides information about hypothetical account values and hypothetical expenses based on the Fund’s actual expense ratio and an assumed rate of return of 5% per year before expenses, which is not the Fund’s actual return. The hypothetical account values and expenses may not be used to estimate the actual ending account balance or expenses you paid for the period. You may use this information to compare the ongoing costs of investing in your Fund and other funds. To do so, compare this 5% hypothetical example with the 5% hypothetical examples that appear in the shareholder reports of the other funds.
Please note that the expenses shown in the table are meant to highlight your ongoing costs only and do not reflect any transactional costs, such as sales charges, redemption fees, brokerage commissions paid on purchases and sales of fund shares. Therefore, the second line under the Fund in the table is useful in comparing ongoing costs only, and will not help you determine the relative total costs of owning different funds. If any of these transaction costs were included, your costs would be higher. The expenses shown in the table do not reflect any fees that may be charged to you by brokers, financial intermediaries or other financial institutions.
| | Beginning | | Ending | | Annualized | | Expenses | |
| | Account | | Account | | Expense | | Paid During | |
| | Value | | Value | | Ratio | | Period (a) | |
Class I | | | | | | | | | |
Actual | | $ | 1,000.00 | | $ | 1,265.47 | | 0.87 | % | $ | 4.95 | |
Hypothetical (b) | | 1,000.00 | | 1,020.76 | | 0.87 | | 4.42 | |
| | | | | | | | | | | | |
(a) | Expenses are calculated using the Fund’s annualized expense ratio (as disclosed in the table), multiplied by the average account value for the period, multiplied by the number of days in the period (184 days), and divided by the number of days in the year (365 days). |
| |
(b) | 5% return per year before expenses. |
GRAPHICAL PRESENTATION OF SCHEDULE OF INVESTMENTS
By Sector
At October 31, 2007

35
SCHEDULE OF INVESTMENTS
At October 31, 2007
(all amounts except share amounts in thousands)
| | Shares | | Value | |
COMMON STOCKS (93.2%) | | | | | |
Chemicals (0.6%) | | | | | |
Ei DU Pont de Nemours & Co. | | 9,500 | | $ | 470 | |
Praxair, Inc. | | 5,000 | | 428 | |
Energy Equipment & Services (29.7%) | | | | | |
Acergy SA | | 24,200 | | 700 | |
Baker Hughes, Inc. | | 31,800 | | 2,758 | |
BJ Services Co. ^ | | 26,900 | | 678 | |
Cameron International Corp. ‡ | | 26,600 | | 2,590 | |
Complete Production Services, Inc. ‡ | | 11,800 | | 235 | |
Diamond Offshore Drilling, Inc. | | 14,100 | | 1,597 | |
Dresser-Rand Group, Inc. ‡ | | 51,300 | | 1,985 | |
Dril-Quip, Inc. ‡ | | 16,100 | | 859 | |
Ensco International, Inc. ^ | | 9,100 | | 505 | |
Exterran Holdings, Inc. ‡ | | 130 | | 11 | |
FMC Technologies, Inc. ‡^ | | 40,700 | | 2,468 | |
GlobalSantaFe Corp. | | 39,700 | | 3,217 | |
Grant Prideco, Inc. ‡ | | 13,500 | | 664 | |
Halliburton Co. ^ | | 40,000 | | 1,577 | |
Helmerich & Payne, Inc. | | 26,200 | | 828 | |
Hercules Offshore, Inc. ‡^ | | 17,800 | | 481 | |
Nabors Industries, Ltd. ‡ | | 18,500 | | 519 | |
National Oilwell Varco, Inc. ‡^ | | 62,600 | | 4,585 | |
Noble Corp. | | 40,500 | | 2,144 | |
Oil States International, Inc. ‡^ | | 22,500 | | 972 | |
Pride International, Inc. ‡ | | 19,500 | | 720 | |
Rowan Cos., Inc. | | 13,200 | | 514 | |
Saipem SpA | | 45,300 | | 2,000 | |
Schlumberger, Ltd. | | 21,700 | | 2,096 | |
Smith International, Inc. | | 27,800 | | 1,836 | |
Technip SA | | 18,500 | | 1,617 | |
Tesco Corp. ‡ | | 30,300 | | 893 | |
Transocean, Inc. ‡^ | | 33,500 | | 3,999 | |
Trican Well Service, Ltd. | | 12,400 | | 261 | |
Weatherford International, Ltd. ‡ | | 49,800 | | 3,232 | |
Gas Utilities (1.0%) | | | | | |
Equitable Resources, Inc. | | 27,900 | | 1,571 | |
Independent Power Producers & Energy Traders (0.0%) | | | | | |
Dynegy, Inc. Class A ‡ | | 700 | | 7 | |
Metals & Mining (10.4%) | | | | | |
Alcoa, Inc. | | 6,500 | | 257 | |
Alumina, Ltd. | | 42,300 | | 262 | |
Aluminum Corp. of China, Ltd. ^ | | 54,800 | | 4,014 | |
Barrick Gold Corp. | | 14,300 | | 632 | |
BHP Billiton, Ltd. | | 17,300 | | 739 | |
Cia Vale do Rio Doce | | 49,800 | | 1,876 | |
Eldorado Gold Corp. ‡ | | 115,400 | | 801 | |
Goldcorp, Inc. | | 38,200 | | 1,337 | |
Hudbay Minerals, Inc. ‡ | | 53,700 | | 1,540 | |
Inmet Mining Corp. ‡ | | 3,700 | | 393 | |
Newcrest Mining, Ltd. | | 42,795 | | 1,285 | |
Newmont Mining Corp. | | 2,400 | | 122 | |
Southern Copper Corp. ^ | | 12,600 | | 1,760 | |
Teck Cominco, Ltd. Class B | | 24,916 | | 1,241 | |
Oil, Gas & Consumable Fuels (50.5%) | | | | | |
Addax Petroleum Corp. | | 13,000 | | $ | 566 | |
Apache Corp. | | 36,200 | | 3,758 | |
Arch Coal, Inc. ^ | | 9,900 | | 406 | |
Bill Barrett Corp. ‡^ | | 2,800 | | 131 | |
BP PLC ^ | | 5,300 | | 413 | |
Cabot Oil & Gas Corp. | | 25,100 | | 996 | |
Canadian Natural Resources, Ltd. | | 25,100 | | 2,076 | |
Carrizo Oil & Gas, Inc. ‡ | | 16,300 | | 838 | |
Chevron Corp. | | 39,800 | | 3,642 | |
Cimarex Energy Co. | | 5,600 | | 227 | |
CNOOC, Ltd. ^ | | 9,000 | | 1,948 | |
Coastal Energy Co. ‡ | | 550,200 | | 406 | |
Compton Petroleum Corp. ‡ | | 56,700 | | 497 | |
ConocoPhillips | | 36,500 | | 3,101 | |
Consol Energy, Inc. | | 19,500 | | 1,102 | |
Crew Energy, Inc. ‡ | | 77,300 | | 724 | |
Devon Energy Corp. | | 56,300 | | 5,259 | |
EnCana Corp. ‡ | | 35,200 | | 2,450 | |
ENI SpA | | 5,300 | | 387 | |
EOG Resources, Inc. | | 60,200 | | 5,334 | |
Exxon Mobil Corp. | | 36,900 | | 3,395 | |
Forest Oil Corp. ‡ | | 13,100 | | 637 | |
Hess Corp. | | 21,800 | | 1,561 | |
Holly Corp. | | 8,000 | | 502 | |
Husky Energy, Inc. | | 29,000 | | 1,344 | |
Kereco Energy, Ltd. ‡ | | 32,400 | | 145 | |
Marathon Oil Corp. | | 40,700 | | 2,407 | |
Mariner Energy, Inc. ‡ | | 10,600 | | 265 | |
Murphy Oil Corp. | | 70,700 | | 5,206 | |
Newfield Exploration Co. ‡ | | 19,700 | | 1,061 | |
Nexen, Inc. | | 32,400 | | 1,091 | |
Noble Energy, Inc. | | 18,100 | | 1,385 | |
Occidental Petroleum Corp. | | 34,400 | | 2,375 | |
Oilexco, Inc. ‡ | | 22,500 | | 408 | |
Pan Orient Energy Corp. ‡ | | 61,600 | | 619 | |
Paramount Resources, Ltd. Class A ‡ | | 19,800 | | 385 | |
Peabody Energy Corp. | | 39,700 | | 2,213 | |
Petro-Canada | | 34,200 | | 1,962 | |
Proex Energy, Ltd. ‡ | | 42,500 | | 653 | |
Range Resources Corp. | | 44,800 | | 2,013 | |
Sikanni Services LTD -144A ‡ § | | 400,000 | | 126 | |
Southwestern Energy Co. ‡ | | 8,900 | | 460 | |
Suncor Energy, Inc. ‡ | | 35,000 | | 3,812 | |
Sunoco, Inc. | | 7,300 | | 537 | |
Talisman Energy, Inc. | | 158,800 | | 3,441 | |
Total SA ^ | | 26,000 | | 2,096 | |
Tristar Oil And Gas, Ltd. ‡ | | 61,348 | | 696 | |
Tusk Energy Corp. ‡ | | 192,200 | | 310 | |
Uranium One, Inc. ‡^ | | 34,300 | | 379 | |
Uts Energy Corp. ‡ | | 82,500 | | 531 | |
Valero Energy Corp. | | 25,400 | | 1,789 | |
Williams Cos., Inc. | | 19,400 | | 708 | |
XTO Energy, Inc. | | 5,900 | | 392 | |
The notes to the financial statements are an integral part of this report.
36
| | Shares | | Value | |
Paper & Forest Products (0.5%) | | | | | |
Votorantim Celulose E Papel SA ‡ | | 26,400 | | $ | 828 | |
Transportation Infrastructure (0.5%) | | | | | |
Aegean Marine Petroleum Network, Inc. | | 19,900 | | 815 | |
Total Common Stocks (cost $104,179) | | | | 146,084 | |
Total Security Lending Collateral (cost $21,371) ± | | | | 21,371 | |
Total Investment Securities (cost $125,550) # | | | | $ | 167,455 | |
NOTES TO SCHEDULE OF INVESTMENTS
^ | At October 31, 2007, all or a portion of this security is on loan (see Note 1). The value at October 31, 2007, of all securities on loan is$20,710. |
± | Cash collateral for the Repurchase Agreements, valued at $3,900, that serve as collateral for securities lending, are invested incorporate and government bonds with interest rates and maturity dates ranging from 0.00% - 8.125% and 11/14/2007 - 9/15/2037. |
‡ | Non Income Producing |
§ | Illiquid |
# | Aggregate cost for federal income tax purposes is $125,555. Aggregate gross unrealized appreciation for all securities in which there is an excess of value over tax cost and aggregate gross unrealized depreciation for all securities in which there is an excess of tax cost over value were $42,500 and $600, respectively. Net unrealized appreciation for tax purposes is $41,900. |
DEFINITIONS:
144A | 144A Securities are registered pursuant to Rule 144A of the Securities Act of 1933. These securities are deemed to be liquid for purposes of compliance limitations on holdings of illiquid securities and may be resold as transactions exempt from registration, normally to qualified institutional buyers. At October 31, 2007, these securities aggregated $126 or 0.08% of net assets of the fund. |
37
TA IDEX Evergreen International Small Cap
MARKET ENVIRONMENT
The strong absolute performance of international small cap equity market during the year ended October 31, 2007 masked a number of periods of extreme volatility in the period. The most recent of these took place in July and August driven by problems in the U.S. sub-prime mortgage market, the impact of which quickly spread to global bond and equity markets. Despite the recovery in equity markets from mid August to the end of the fiscal year, lingering nervousness and uncertainties remained in investors’ minds.
Over the year, all sectors and geographic regions, with the exception of Japan, achieved positive double digit gains. Japan’s return was slightly negative. The portfolio participated in the market strength providing strong investment returns and outperforming the benchmark index in the process.
PERFORMANCE
For the year ended October 31, 2007, TA IDEX Evergreen International Small Cap, Class I returned 34.72%. By comparison its benchmark, the S&P/Citigroup Global ex-U.S. EMI Index, returned 34.18%. For the year ended October 31, 2007, the net expense ratio of the Fund was 1.13%.
STRATEGY REVIEW
The portfolio maintained its focus on small and mid cap stocks throughout the year. Changes in the portfolio were driven largely by stock specific issues, such as strong moves, corporate takeovers, etc. However, in the periods of market disruption, top-down influences played some part. Increases in Europe, Asia ex-Japan and emerging markets were funded by reductions in the United Kingdom (“UK”), Japan and cash levels. Sectorially, the moves translated into increases in consumer discretionary, industrials, materials and energy with consumer staples, utilities and financials being the largest reductions. There was a combination of new and eliminated stock holdings as well as increases and reductions in existing positions. Notable new names included Rhodia and Technip, both French companies with interests in specialty chemicals and in oil, gas and petrochemical industries, respectively. SINA Corporation, the online Chinese media company and internet service provider and Balfour Beatty plc, the UK-based construction and engineering firm, were other significant additions. Among the larger increases were Adidas AG, Germany’s leader in sports apparel, Nokian Renkaat Oyi, the Finnish specialist tire manufacturer with a sizeable exposure to the Russian marketplace, and Compania de Distribucion Integral Logista, S.A., the Spanish distributor of tobacco products. Larger eliminations included C&C Group plc (“C&C Group”), the Irish soft drink and alcoholic beverage producer that suffered from the impact of poor summer conditions in the UK; and Swedish Match AB, Anglo Irish Bank Corporation plc and Photo-Me International plc (“Photo-Me”), all of which were strong performers in prior periods and for which the outlook, we believed, appeared less favorable. The year also saw a number of takeovers, particularly in utilities and this led to a reduction in exposure to this sector.
On a sector basis, the major contributions came from consumer discretionary, industrials, health care and utilities. Of the top ten contributors for the period, five came from industrials and many of the top ten stocks had returns of over 100% in the year. On a regional basis, strong stock outperformance catapulted Europe and the UK to being the largest contributors. Within Europe, the strength was broadly based. An underweight in the negative performing Japanese market coupled with outperformance from our holdings there, supported its positive relative contribution. The UK’s The GAME Group plc, a leading specialist retailer of interactive entertainment, reflected the attractiveness of the sector given the launches during the year of new game consoles such as the Nintendo Wii and Sony PlayStation 3, was the best individual holding. A close second in contribution was Dutch-based Royal Boskalis Westminster N.V., a global leader in dredging, which announced that order books are still swelling; pricing is increasing; and some very large projects are still coming into the pipeline. Spain’s Grifols S.A., whose principal activities are the procurement, manufacture, preparation and sale of therapeutic products, also performed strongly. It continued to benefit from the increased demand of plasma derivative products due to improvement of health standards in emerging countries.
Detractors by sector for the period came from an underweight and some stock underperformances in materials and energy. Cash levels in the portfolio in a year of robust performance also detracted. On a regional basis, the portfolio’s underweight positions in emerging markets and Asia ex-Japan proved negative. The majority of the larger detracting holdings were stocks which had contributed strongly in prior periods and turned in poor performance during this year. Among those were C&C Group, already highlighted, and Photo-Me, the UK-based manufacturer of photographic printing equipment, both of which were eliminated during the year. Others included Neopost S.A., the French developer and manufacturer of office equipment and mail solutions, and Germany’s PATRIZIA Immobilien AG, which specializes in the redevelopment and sale of residential properties.
We have witnessed a clear negative impact from the credit crunch that originated with the negative developments in the sub-prime loan and asset-backed security markets. Financial stocks have been the most hurt, but the impact has been felt in the market overall. In addition, weak employment and housing reports in the U.S. economic have caused further anxieties, helping spur the Federal Reserve Board and other central banks to loosen monetary policies.
On the international investment scene, we believe these factors will continue to have an influence on markets. We are being very vigilant in assessing the impact of any slowdown on the companies in the portfolio and we are increasingly inclined towards companies that, we believe, have more certain or visible growth prospects.
Francis Claro, CFA
Portfolio Manager
Evergreen Investment Management Company, LLC
38
(unaudited)
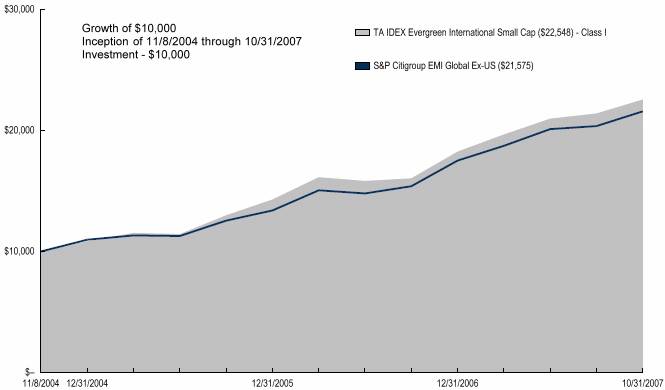
Average Annual Total Return for Periods Ended 10/31/2007
| | 1 Year | | From Inception | | Inception Date | |
Class I (NAV) | | 34.72 | % | 31.36 | % | 11/8/04 | |
Citigroup Global Ex-US (1) | | 34.18 | % | 29.44 | % | 11/8/04 | |
NOTES
(1) The S&P/Citigroup Global ex-U.S. EMI (Citigroup) Index is an unmanaged index used as a general measure of market performance. Calculations assume dividends and capital gains are reinvested and do not include any managerial expenses. From inception calculation is based on life of the Fund.
The performance data presented represents past performance, future results may vary. Performance data does not reflect the deduction of taxes that would be paid on fund distributions nor the redemption of fund shares. Investment return and principal value will fluctuate so that an investor’s shares, when redeemed, may be worth more or less than their original cost. Current performance may be lower or higher than performance quoted. Please see ww.transamericaidex.com for performance data current to the most recent month-end.
Net Asset Value (NAV) returns include the reinvestment of dividends and capital gains. Fund shares are sold without a sales load. International investing involves special risks including currency fluctuations, political instability, and different financial accounting standards.
This material must be preceded or accompanied by a current prospectus, which includes specific contents regarding the investment objectives and policies of this fund. This fund is only available in Class I shares, which are not available for direct investment by the public.
39
UNDERSTANDING YOUR FUND’S EXPENSES
(unaudited)
SHAREHOLDER EXPENSES
Fund shareholders may incur two types of costs: (1) transaction costs, including sales charges (loads) on purchases, contingent deferred sales charges on redemptions and redemption fees; and (2) ongoing costs, including management fees, dividend expense on short-sales, and other fund expenses.
The following Example is intended to help you understand your ongoing costs (in dollars and cents) of investing in the Fund and to compare these costs with the ongoing costs of investing in other funds.
The Example is based on an investment of $1,000 invested at May 1, 2007 and held for the entire period until October 31, 2007.
ACTUAL EXPENSES
The first line in the table below provides information about actual account values and actual expenses. You may use the information in this line, together with the amount you invested, to estimate the expenses that you paid over the period. Simply divide your account value by $1,000 (for example, an $8,600 account value divided by $1,000 = 8.6), then multiply the result by the number in the first line of your Fund under the heading entitled “Expenses Paid During Period” to estimate the expenses you paid on your account during this period.
HYPOTHETICAL EXAMPLE FOR COMPARISON PURPOSES
The second line in the table below provides information about hypothetical account values and hypothetical expenses based on the Fund’s actual expense ratio and an assumed rate of return of 5% per year before expenses, which is not the Fund’s actual return. The hypothetical account values and expenses may not be used to estimate the actual ending account balance or expenses you paid for the period. You may use this information to compare the ongoing costs of investing in your Fund and other funds. To do so, compare this 5% hypothetical example with the 5% hypothetical examples that appear in the shareholder reports of the other funds.
Please note that the expenses shown in the table are meant to highlight your ongoing costs only and do not reflect any transactional costs, such as sales charges, redemption fees, brokerage commissions paid on purchases and sales of fund shares. Therefore, the second line under the Fund in the table is useful in comparing ongoing costs only, and will not help you determine the relative total costs of owning different funds. If any of these transaction costs were included, your costs would be higher. The expenses shown in the table do not reflect any fees that may be charged to you by brokers, financial intermediaries or other financial institutions.
| | Beginning | | Ending | | Annualized | | Expenses | |
| | Account | | Account | | Expense | | Paid During | |
| | Value | | Value | | Ratio | | Period (a) | |
Class I | | | | | | | | | |
Actual | | $ | 1,000.00 | | $ | 1,104.45 | | 1.13 | % | $ | 5.98 | |
Hypothetical (b) | | 1,000.00 | | 1,019.46 | | 1.13 | | 5.74 | |
| | | | | | | | | | | | |
(a) Expenses are calculated using the Fund’s annualized expense ratio (as disclosed in the table), multiplied by the average account value for the period, multiplied by the number of days in the period (184 days), and divided by the number of days in the year (365 days).
(b) 5% return per year before expenses.
GRAPHICAL PRESENTATION OF SCHEDULE OF INVESTMENTS
By Region
At October 31, 2007

This chart shows the percentage breakdown by region of the Fund’s total investment securities.
40
SCHEDULE OF INVESTMENTS
At October 31, 2007
(all amounts except share amounts in thousands)
| | Shares | | Value | |
CONVERTIBLE PREFERRED STOCKS (0.2%) | | | | | |
Canada (0.2%) | | | | | |
Eveready Income Fund | | 315,500 | | $ | 1,535 | |
COMMON STOCKS (97.4%) | | | | | |
Argentina (0.7%) | | | | | |
IRSA Inversiones y Representaciones SA ‡ | | 235,361 | | 4,204 | |
Australia (1.1%) | | | | | |
QBE Insurance Group, Ltd. | | 222,028 | | 6,687 | |
Belgium (3.1%) | | | | | |
Ackermans & Van Haaren | | 59,167 | | 6,146 | |
Umicore | | 55,177 | | 13,730 | |
Bermuda (2.3%) | | | | | |
China Gas Holdings, Ltd. | | 18,450,000 | | 8,736 | |
Chinese Estates Holdings, Ltd. ‡ | | 844,000 | | 1,696 | |
Gome Electrical Appliances Holdings, Ltd. ‡ | | 1,089,000 | | 2,431 | |
Great Eagle Holdings, Ltd. ‡ | | 378,000 | | 1,561 | |
Brazil (0.5%) | | | | | |
Empresa Brasileira de Aeronautica SA | | 68,842 | | 3,357 | |
Canada (1.3%) | | | | | |
Allen-Vanguard Corp. ‡ | | 574,033 | | 6,346 | |
Eldorado Gold Corp. ‡ | | 255,400 | | 1,772 | |
Cayman Islands (1.3%) | | | | | |
SINA Corp. ‡ | | 149,439 | | 8,567 | |
China (0.7%) | | | | | |
Sinotrans, Ltd. Class H | | 7,521,000 | | 4,755 | |
Denmark (0.8%) | | | | | |
Rockwool International AS Class B | | 16,910 | | 5,386 | |
Finland (2.9%) | | | | | |
Amer Sports OYJ Class A ^ | | 79,150 | | 2,102 | |
Nokian Renkaat OYJ | | 442,997 | | 16,664 | |
France (13.6%) | | | | | |
Carbone Lorraine | | 104,188 | | 9,311 | |
Eurofins Scientific | | 96,089 | | 10,273 | |
FLO Groupe | | 195,830 | | 3,485 | |
Michelin (C.G.D.E.) Class B | | 128,736 | | 17,215 | |
Neopost SA | | 72,210 | | 8,375 | |
Remy Cointreau SA | | 77,468 | | 5,946 | |
Rhodia SA ‡ | | 367,351 | | 14,217 | |
Sechilienne-Sidec | | 50,928 | | 4,567 | |
Societe BIC SA | | 80,644 | | 6,259 | |
Technip SA | | 81,676 | | 7,311 | |
Germany (11.7%) | | | | | |
Adidas AG | | 407,062 | | 27,120 | |
Bauer AG ^ | | 59,546 | | 4,551 | |
Bilfinger Berger AG | | 66,891 | | 5,947 | |
Continental AG | | 43,810 | | 6,617 | |
D+S Europe AG ‡ | | 273,043 | | 5,135 | |
Hochtief AG | | 44,189 | | 6,093 | |
Leoni AG | | 58,212 | | 3,690 | |
Mtu Aero Engines Holding AG | | 105,293 | | 6,419 | |
Patrizia Immobilien AG ^ | | 183,045 | | 2,439 | |
Premiere AG ‡ | | 126,345 | | 2,587 | |
Software AG | | 46,691 | | $ | 4,353 | |
Greece (1.5%) | | | | | |
Greek Postal Savings Bank | | 223,348 | | 4,556 | |
Intralot SA | | 70,194 | | 3,026 | |
J&P-Avax SA | | 179,532 | | 2,026 | |
Hong Kong (0.7%) | | | | | |
Melco International Development | | 864,000 | | 1,617 | |
Sino Land Co. | | 1,014,000 | | 3,146 | |
Ireland (0.2%) | | | | | |
Kingspan Group PLC | | 50,301 | | 1,183 | |
Italy (6.3%) | | | | | |
Astaldi SpA | | 408,903 | | 3,768 | |
CIR-Compagnie Industriali Riunite SpA | | 1,184,082 | | 4,831 | |
Davide Campari-Milano SpA | | 572,265 | | 6,133 | |
Erg SpA ^ | | 235,328 | | 4,824 | |
GEOX SpA | | 298,002 | | 7,114 | |
Gruppo Coin SpA ‡ | | 833,649 | | 7,561 | |
Impregilo SpA ‡ | | 516,722 | | 4,126 | |
Saras SpA | | 305,020 | | 1,836 | |
Japan (11.6%) | | | | | |
Ariake Japan Co., Ltd. ^ | | 140,200 | | 2,894 | |
Bank of Yokohama, Ltd. (The) | | 227,000 | | 1,599 | |
Capcom Co., Ltd. ^ | | 300,700 | | 8,555 | |
Isetan Co., Ltd. | | 219,000 | | 2,948 | |
Japan Securities Finance Co., Ltd. | | 132,100 | | 1,380 | |
Kawasaki Heavy Industries, Ltd. | | 444,000 | | 1,591 | |
Koei Co., Ltd. ^ | | 91,100 | | 1,723 | |
Megachips Corp. ^ | | 78,700 | | 1,655 | |
Message Co., Ltd. | | 1,238 | | 2,266 | |
Mitsubishi Gas Chemical Co., Inc. | | 199,000 | | 1,971 | |
Mitsubishi UFJ Lease & Finance Co., | | 36,400 | | 1,253 | |
Nidec Corp. | | 42,100 | | 3,159 | |
Nipponkoa Insurance Co., Ltd. | | 250,000 | | 2,277 | |
Nissha Printing Co., Ltd. | | 106,800 | | 3,057 | |
Okumura Corp. ^ | | 532,000 | | 2,806 | |
Square Enix Co., Ltd. | | 216,300 | | 7,092 | |
Sugi Pharmacy Co., Ltd. | | 220,900 | | 6,362 | |
Sumitomo Bakelite Co., Ltd. | | 281,000 | | 1,709 | |
Sundrug Co., Ltd. | | 236,000 | | 5,568 | |
Toho Co., Ltd./Tokyo | | 103,800 | | 2,062 | |
Tokuyama Corp. | | 205,000 | | 2,838 | |
Tokyo Tatemono Co., Ltd. | | 348,000 | | 4,434 | |
Toray Industries, Inc. | | 619,000 | | 4,746 | |
Jersey, C.I. (0.4%) | | | | | |
Randgold Resources, Ltd. | | 66,528 | | 2,391 | |
Korea, Republic of (0.9%) | | | | | |
Lotte Confectionery Co., Ltd. | | 1,481 | | 2,432 | |
Taeyoung Engineering & Construction | | 277,850 | | 3,486 | |
Mexico (0.4%) | | | | | |
Alsea SAB de CV | | 1,555,700 | | 2,310 | |
Netherlands (4.6%) | | | | | |
Boskalis Westminster | | 364,577 | | 22,095 | |
Koninklijke BAM Groep NV | | 189,045 | | 4,980 | |
The notes to the financial statements are an integral part of this report.
41
| | Shares | | Value | |
Netherlands (continued) | | | | | |
SBM Offshore NV | | 68,519 | | $ | 2,633 | |
Norway (0.6%) | | | | | |
Aker Yards AS | | 232,720 | | 3,831 | |
Portugal (0.8%) | | | | | |
Banco Bpi SA Class G | | 371,368 | | 3,245 | |
Impresa SGPS ‡ | | 541,016 | | 2,012 | |
Singapore (0.6%) | | | | | |
Capitacommercial Trust REIT ‡ | | 1,249,000 | | 2,319 | |
Starhub, Ltd. ‡ | | 785,833 | | 1,693 | |
Spain (9.3%) | | | | | |
CIA de Distribucion Integral Logista SA | | 128,027 | | 9,974 | |
Cintra Concesiones de Infraestructuras | | 417,216 | | 7,280 | |
Grifols SA | | 381,377 | | 10,070 | |
La Seda de Barcelona SA ‡ | | 1,250,349 | | 4,197 | |
Promotora de Informaciones SA | | 533,293 | | 10,431 | |
Sol Melia SA | | 61,095 | | 1,171 | |
Tecnicas Reunidas SA | | 126,658 | | 10,628 | |
Uralita SA | | 537,925 | | 5,463 | |
Switzerland (3.2%) | | | | | |
Julius Baer Holding AG | | 71,379 | | 6,171 | |
Lindt & Spruengli AG | | 1,499 | | 5,173 | |
Logitech International SA ‡ | | 258,509 | | 8,979 | |
Taiwan (0.3%) | | | | | |
Tatung Co., Ltd. ‡ | | 3,852,000 | | 2,098 | |
United Kingdom (16.0%) | | | | | |
AMEC PLC | | 257,913 | | 4,471 | |
Arriva PLC | | 328,951 | | 5,726 | |
Ashtead Group PLC | | 354,568 | | 803 | |
Balfour Beatty PLC | | 1,075,328 | | $ | 11,058 | |
Carphone Warehouse Group PLC | | 814,041 | | 5,927 | |
Charter PLC ‡ | | 233,956 | | 5,268 | |
Enterprise Inns PLC | | 59,819 | | 783 | |
FirstGroup PLC | | 281,195 | | 4,644 | |
Game Group PLC | | 3,994,392 | | 16,554 | |
ICAP PLC | | 248,113 | | 3,015 | |
ITV PLC | | 1,047,999 | | 2,157 | |
Kelda Group PLC @ | | 268,406 | | q | |
Kelda Group PLC ‡ | | 185,641 | | 3,658 | |
Keller Group PLC | | 124,029 | | 2,922 | |
Kier Group PLC | | 51,312 | | 2,288 | |
Marston’s PLC | | 293,053 | | 2,094 | |
National Express Group PLC | | 186,975 | | 5,119 | |
Pennon Group PLC | | 286,512 | | 3,732 | |
Premier Oil PLC ‡ | | 50,946 | | 1,312 | |
Punch Taverns PLC | | 52,106 | | 1,088 | |
RAB Capital PLC | | 752,094 | | 1,711 | |
Regent Inns PLC ‡ | | 1,243,403 | | 1,763 | |
Rexam PLC | | 287,317 | | 3,238 | |
Stagecoach Group PLC | | 809,437 | | 4,548 | |
Stagecoach Group PLC ‡ @ | | 1,316,695 | | q | |
Star Energy Group PLC ‡ | | 276,344 | | 1,470 | |
Tullow Oil PLC | | 172,612 | | 2,288 | |
Whitbread PLC | | 127,602 | | 4,694 | |
Total Common Stocks (cost $469,316) | | | | 623,134 | |
| | | | | |
Total Security Lending Collateral (cost $11,795) ± | | | | 11,795 | |
Total Investment Securities (cost $482,598) # | | | | $ | 636,464 | |
NOTES TO SCHEDULE OF INVESTMENTS
q | Value is less than $1 |
@ | Securities valued as determined in good faith in accordance with procedures established by the Fund’s Board of Trustees. |
^ | At October 31, 2007, all or a portion of this security is on loan (see Note 1). The value at October 31, 2007, of all securities on loan is $11,216. |
± | Cash collateral for the Repurchase Agreements, valued at $2,153, that serve as collateral for securities lending, are invested in corporate and government bonds with interest rates and maturity dates ranging from 0.00% - 8.125% and 11/14/2007 - 9/15/2037. |
‡ | Non Income Producing |
# | Aggregate cost for federal income tax purposes is $482,667. Aggregate gross unrealized appreciation for all securities in which there is an excess of value over tax cost and aggregate gross unrealized depreciation for all securities in which there is an excess of tax cost over value were $162,823 and $9,026, respectively. Net unrealized appreciation for tax purposes is $153,797. |
DEFINITIONS
REIT Real Estate Investment Trust
The notes to the financial statements are an integral part of this report.
42
| | Percentage of | | | |
(unaudited) | | Total Investments | | Value | |
INVESTMENTS BY INDUSTRY: | | | | | |
Construction & Engineering | | 14.3 | % | $ | 91,244 | |
Auto Components | | 6.9 | % | 44,185 | |
Chemicals | | 6.2 | % | 39,211 | |
Textiles, Apparel & Luxury Goods | | 6.0 | % | 38,430 | |
Specialty Retail | | 5.1 | % | 32,473 | |
Software | | 3.4 | % | 21,723 | |
Road & Rail | | 3.1 | % | 20,038 | |
Media | | 3.0 | % | 19,249 | |
Hotels, Restaurants & Leisure | | 2.9 | % | 18,320 | |
Real Estate Management & Development | | 2.7 | % | 17,480 | |
Aerospace & Defense | | 2.5 | % | 16,123 | |
Commercial Services & Supplies | | 2.3 | % | 14,452 | |
Beverages | | 2.2 | % | 14,173 | |
Computers & Peripherals | | 2.0 | % | 12,733 | |
Building Products | | 1.9 | % | 12,032 | |
Food & Staples Retailing | | 1.9 | % | 11,930 | |
Oil, Gas & Consumable Fuels | | 1.8 | % | 11,730 | |
Energy Equipment & Services | | 1.8 | % | 11,478 | |
Capital Markets | | 1.7 | % | 10,897 | |
Trading Companies & Distributors | | 1.7 | % | 10,777 | |
Machinery | | 1.7 | % | 10,690 | |
Food Products | | 1.7 | % | 10,500 | |
Life Sciences Tools & Services | | 1.6 | % | 10,273 | |
Biotechnology | | 1.6 | % | 10,070 | |
Commercial Banks | | 1.5 | % | 9,400 | |
Electrical Equipment | | 1.5 | % | 9,311 | |
Insurance | | 1.4 | % | 8,964 | |
Diversified Financial Services | | 1.4 | % | 8,779 | |
Gas Utilities | | 1.4 | % | 8,736 | |
Internet Software & Services | | 1.3 | % | 8,567 | |
Office Electronics | | 1.3 | % | 8,375 | |
Water Utilities | | 1.2 | % | 7,390 | |
Transportation Infrastructure | | 1.1 | % | 7,280 | |
Industrial Conglomerates | | 1.0 | % | 6,447 | |
Air Freight & Logistics | | 0.7 | % | 4,755 | |
Multi-Utilities | | 0.7 | % | 4,567 | |
Metals & Mining | | 0.7 | % | 4,163 | |
Containers & Packaging | | 0.5 | % | 3,238 | |
Electronic Equipment & Instruments | | 0.5 | % | 3,159 | |
Multiline Retail | | 0.5 | % | 2,948 | |
Real Estate Investment Trusts | | 0.4 | % | 2,319 | |
Health Care Providers & Services | | 0.4 | % | 2,266 | |
Leisure Equipment & Products | | 0.3 | % | 2,102 | |
Wireless Telecommunication Services | | 0.3 | % | 1,692 | |
Investment Securities, at value | | 98.1 | % | 624,669 | |
Short-Term Investments | | 1.9 | % | 11,795 | |
Total Investments | | 100.0 | % | $ | 636,464 | |
The notes to the financial statements are an integral part of this report.
43
TA IDEX Federated Market Opportunity
MARKET ENVIRONMENT
The fiscal year was generally quite strong for major equity markets. In the United States, the Standard and Poor’s 500 Composite Stock Index (“S&P 500), for example, returned 14.56%. Despite rapidly spreading cracks in the credit markets, equity markets rebounded late in the fiscal year. In terms of currencies and their impact on investment results for international holdings, the U.S. dollar declined against most currencies, including a 10.40% decline against the U.S. dollar index (“DXY”). This increases the value in U.S. dollar terms of returns on international holdings.
The long, unprecedented credit boom evidently has peaked and is on its way to a credit bust, with consequences that reach far beyond the sub-prime segment of the residential mortgage market. This credit boom was accompanied by massive risk-taking and trend following by market participants, who shunned the notion of capital preservation. This has been based on the widespread belief that “they” (the authorities and heads of the major financial firms) are all-powerful and will not let anything bad happen to markets. It is management’s belief that unprecedented financial leverage, high degrees of speculation and asset prices, and deteriorating economic conditions make sharp market declines probable. This is based on market history, regardless of what “they” may want.
PERFORMANCE
For the year ended October 31, 2007, TA IDEX Federated Market Opportunity, Class I returned (1.03)%. By comparison its primary and secondary benchmarks, the Russell 3000 Value Index and the Merrill Lynch 3-Month T-Bill Index, returned 10.06% and 5.13%, respectively. For the year ended October 31, 2007, the net expense ratio of the Fund was 0.93%.
STRATEGY REVIEW
The portfolio is managed with an emphasis on moderate capital appreciation with low volatility, and an emphasis on capital preservation when valuations and risks are high. It is not managed specifically towards an equity benchmark or with regard to the individual components of an equity benchmark. The portfolio’s strategy is an unconventional one that includes holding substantial cash reserves and using put options to emphasize capital preservation when market risks seem high. This will cause the portfolio’s returns to lag those of market benchmarks and peers during periods of sharply rising stock prices. In addition, the portfolio tends to have substantial non-U.S. investments that are generally not hedged against changes in currency values. Periods of rising values of the U.S. dollar in foreign exchange markets will tend to cause currency losses on the portfolio’s non-U.S. investments as international market prices become worth less when converted into more expensive U.S. dollars. The reverse would cause currency gains for the portfolio’s foreign holdings.
The portfolio has been positioned to benefit from a significant decline in U.S. equity prices. The portfolio had substantial cash reserves in addition to put options as a hedge against an anticipated decline in stock prices. The put options on U.S. equity indexes would increase in value if stock prices fell. Since the market rose over the course of the year, the portfolio had significant net losses on the put options that aggravated the missed profit opportunity from holding cash reserves and short-term government notes instead of holding more in equities. The rationale for the portfolio’s strategy was that market bubble history and market valuation history in general, and rapidly deteriorating economic and financial conditions, supported a highly risk-averse strategy during the period.
Among equity sector returns, gold and energy securities generally had positive returns for the portfolio. On a net basis, securities in other sectors had a modest net loss.
In terms of currency impact on the portfolio, the general decline in the foreign-exchange value of the U.S. dollar had a positive impact on the portfolio. It enhanced the U.S. dollar based returns of the portfolio’s international holdings relative to their local market returns, as international returns were converted into (more) cheaper U.S. dollars. In particular, the Canadian dollar, Japanese Yen, and Swiss Franc had positive returns for the portfolio.
Among the several positive contributors to the portfolio’s performance, the best was Goldcorp Inc., a Canadian gold mining company. The worst contributor was from the put options on the S & P 500. From a country perspective, Canadian stocks were the top contributors to the portfolio.
Steven J. Lehman, CFA
Federated Equity Management Company of Pennsylvania
This Fund is only available for investment by the Asset Allocation Portfolios.
44
(unaudited)
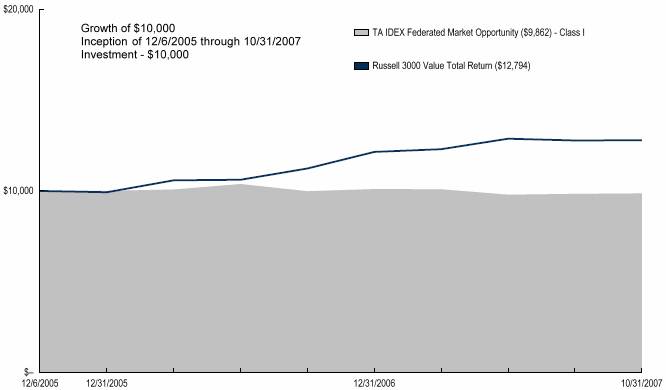
Average Annual Total Return for Periods Ended 10/31/2007
| | | | From | | Inception | |
| | 1 Year | | Inception | | Date | |
Class I (NAV) | | (1.03 | )% | (0.73 | )% | 12/6/05 | |
Russell 3000 Value (1) | | 10.06 | % | 13.86 | % | 12/6/05 | |
Merrill Lynch 3 Month Treasury Bill (1) | | 5.13 | % | 8.12 | % | 12/6/05 | |
NOTES
(1) The Russell 3000 Value (Russell 3000 Value) Index and the Merrill Lynch 3-Month Treasury Bill (ML3-Month T-Bill) Index are unmanaged indices used as a general measure of market performance. Calculations assume dividends and capital gains are reinvested and do not include any managerial expenses. From inception calculation is based on life of the Fund.
The performance data presented represents past performance, future results may vary. The portfolio’s investment return and net asset value will fluctuate. Past performance does not guarantee future results. Investor’s units when redeemed, may be worth more or less than their original cost.
Current performance may be higher or lower than the performance data quoted. Please visit your insurance company’s website for contractor policy level standardized total returns current to the most recent month-end. Portfolio performance is net of investment fees and fund expenses, but not product charges, which, if included, would significantly lower the performance quoted. Net Asset Value (NAV) returns includes the reinvestment of dividends and capital gains but do not reflect any sales charges.
This material must be preceded or accompanied by a current prospectus, which includes specific contents regarding the investment objectives, explanation of share classes and policies of this portfolio.
This fund is only available in Class I shares, which are not available for direct investment by the public.
45
UNDERSTANDING YOUR FUND’S EXPENSES
(unaudited)
SHAREHOLDER EXPENSES
Fund shareholders may incur two types of costs: (1) transaction costs, including sales charges (loads) on purchases, contingent deferred sales charges on redemptions and redemption fees; and (2) ongoing costs, including management fees, dividend expense on short-sales, and other fund expenses.
The following Example is intended to help you understand your ongoing costs (in dollars and cents) of investing in the Fund and to compare these costs with the ongoing costs of investing in other funds.
The Example is based on an investment of $1,000 invested at May 1, 2007 and held for the entire period until October 31, 2007.
ACTUAL EXPENSES
The first line in the table below provides information about actual account values and actual expenses. You may use the information in this line, together with the amount you invested, to estimate the expenses that you paid over the period. Simply divide your account value by $1,000 (for example, an $8,600 account value divided by $1,000 = 8.6), then multiply the result by the number in the first line of your Fund under the heading entitled “Expenses Paid During Period” to estimate the expenses you paid on your account during this period.
HYPOTHETICAL EXAMPLE FOR COMPARISON PURPOSES
The second line in the table below provides information about hypothetical account values and hypothetical expenses based on the Fund’s actual expense ratio and an assumed rate of return of 5% per year before expenses, which is not the Fund’s actual return. The hypothetical account values and expenses may not be used to estimate the actual ending account balance or expenses you paid for the period. You may use this information to compare the ongoing costs of investing in your Fund and other funds. To do so, compare this 5% hypothetical example with the 5% hypothetical examples that appear in the shareholder reports of the other funds.
Please note that the expenses shown in the table are meant to highlight your ongoing costs only and do not reflect any transactional costs, such as sales charges, redemption fees, brokerage commissions paid on purchases and sales of fund shares. Therefore, the second line under the Fund in the table is useful in comparing ongoing costs only, and will not help you determine the relative total costs of owning different funds. If any of these transaction costs were included, your costs would be higher. The expenses shown in the table do not reflect any fees that may be charged to you by brokers, financial intermediaries or other financial institutions.
| | Beginning | | Ending | | Annualized | | Expenses | |
| | Account | | Account | | Expense | | Paid During | |
| | Value | | Value | | Ratio | | Period (a) | |
Class I | | | | | | | | | |
Actual | | $ | 1,000.00 | | $ | 998.84 | | 0.95 | % | $ | 4.77 | |
Hypothetical (b) | | 1,000.00 | | 1,020.36 | | 0.95 | | 4.82 | |
| | | | | | | | | |
| | | | | | | | | | | | |
(a) Expenses are calculated using the Fund’s annualized expense ratio (as disclosed in the table), multiplied by the average account value for the period, multiplied by the number of days in the period (184 days), and divided by the number of days in the year (365 days)
(b) 5% return per year before expenses.
GRAPHICAL PRESENTATION OF SCHEDULE OF INVESTMENTS
By Region
At October 31, 2007
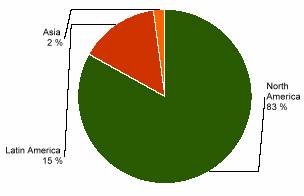
This chart shows the percentage breakdown by region of the Fund’s total investment securities.
46
SCHEDULE OF INVESTMENTS
At October 31, 2007
(all amounts except share amounts in thousands)
| | | | Principal | | Value | |
U.S. GOVERNMENT OBLIGATIONS (22.2%) | | | | | | | |
U.S. Treasury Note | | | | | | | |
3.50%, due 02/15/2010 | | | | $ | 8,000 | | $ | 7,925 | |
4.75%, due 02/28/2009 | | | | 4,000 | | 4,039 | |
Total U.S. Government Obligations (cost $11,806) | | | | | | 11,964 | |
| | | | | | | |
FOREIGN GOVERNMENT OBLIGATIONS (6.5%) | | | | | | | |
Japan Government Five Year Bond | | | | | | | |
0.30%, due 12/20/2007 | | JPY | | 201,000 | | 1,742 | |
Japan Government Two Year Bond | | | | | | | |
0.20%, due 12/15/2007 | | JPY | | 115,000 | | 996 | |
0.30%, due 11/15/2007 | | JPY | | 86,000 | | 746 | |
Total Foreign Government Obligations (cost $3,274) | | | | | | 3,484 | |
| | | | | | | | | |
| | | | Shares | | Value | |
CONVERTIBLE PREFERRED STOCKS (3.3%) | | | | | | | |
Canada (3.3%) | | | | | | | |
Canetic Resources Trust | | | | 43,000 | | $ | 699 | |
Pengrowth Energy Trust | | | | 32,000 | | 606 | |
Penn West Energy Trust | | | | 14,000 | | 447 | |
Total Convertible Preferred Stocks (cost $1,588) | | | | | | 1,752 | |
| | | | | | | |
COMMON STOCKS (16.2%) | | | | | | | |
Canada (3.7%) | | | | | | | |
Goldcorp, Inc. | | | | 51,000 | | 1,792 | |
Iamgold Corp. | | | | 24,000 | | 210 | |
Japan (3.2%) | | | | | | | |
NTT DoCoMo, Inc. | | JPY | | 577 | | 831 | |
Sankyo Co., Ltd. | | | | 14,200 | | 604 | |
Sega Sammy Holdings, Inc. | | | | 23,000 | | 316 | |
South Africa (2.0%) | | | | | | | |
Gold Fields, Ltd. | | | | 50,000 | | 903 | |
Harmony Gold Mining Co., Ltd. ‡ | | | | 14,000 | | 157 | |
United Kingdom (0.8%) | | | | | | | |
Tate & Lyle PLC | | | | 45,000 | | 407 | |
United States (6.5%) | | | | | | | |
Cimarex Energy Co. | | | | 8,600 | | 349 | |
Electronic Data Systems Corp. | | | | 20,000 | | 432 | |
Forest Laboratories, Inc. ‡ | | | | 13,800 | | $ | 539 | |
Johnson & Johnson | | | | 4,500 | | 293 | |
Lexmark International, Inc. Class A ‡^ | | | | 9,000 | | 378 | |
Office Depot, Inc. ‡ | | | | 25,000 | | 469 | |
Patterson-UTI Energy, Inc. ^ | | | | 32,100 | | 640 | |
Progressive Corp. (The) | | | | 22,000 | | 407 | |
Total Common Stocks (cost $8,352) | | | | | | 8,727 | |
| | | | | | | |
Total Security Lending Collateral (cost $630) | | | | | | 630 | |
| | Contracts (·) | | Value | |
PURCHASED OPTIONS (2.1%) | | | | | |
Put Options (2.1%) | | | | | |
Mdy | | 111 | | $ | 95 | |
Put Strike $170.00 | | | | | |
Expires 01/19/2008 | | | | | |
NASDAQ 100 | | 265 | | 56 | |
Put Strike $55.00 | | | | | |
Expires 01/19/2008 | | | | | |
Russell 200 Index | | 35 | | 117 | |
Put Strike $840.00 | | | | | |
Expires 12/22/2007 | | | | | |
S&P 500 Index | | 116 | | 441 | |
Put Strike $1,550.00 | | | | | |
Expires 12/22/2007 | | | | | |
SanDisk Corp. | | 180 | | 201 | |
Put Strike $55.00 | | | | | |
Expires 01/19/2008 | | | | | |
Sector SPDR-Finance | | 397 | | 214 | |
Put Strike $39.00 | | | | | |
Expires 12/22/2007 | | | | | |
Total Purchased Options (cost $2,058) | | | | 1,124 | |
Total Investment Securities (cost $27,708) # | | | | $ | 27,681 | |
NOTES TO SCHEDULE OF INVESTMENTS
^ | At October 31, 2007, all or a portion of this security is on loan (see Note 1). The value at October 31, 2007, of all securities on loan is $610. |
‡ | Non Income Producing |
· | Contract Amounts are not in thousands |
# | Aggregate cost for federal income tax purposes is $27,744. Aggregate gross unrealized appreciation for all securities in which there is an excess of value over tax cost and aggregate gross unrealized depreciation for all securities in which there is an excess of tax cost over value were $469 and $532, respectively. Net unrealized depreciation for tax purposes is $63. |
DEFINITIONS
JPY Japanese yen
47
FORWARD FOREIGN CURRENCY CONTRACTS:
| | | | | | Amount in | | Net Unrealized | |
| | Bought | | Settlement | | U.S. Dollars | | Appreciation | |
Currency | | (Sold) | | Date | | Bought(Sold) | | (Depreciation) | |
Swiss Franc | | 3,709 | | 01/31/2008 | | $ | 3,200 | | $ | 17 | |
| | | | | | $ | 3,200 | | $ | 17 | |
(unaudited)
| | Percentage of | | | |
| | Total Investments | | Value | |
INVESTMENTS BY INDUSTRY: | | | | | |
U.S. Government Obligation | | 43.2 | % | $ | 11,964 | |
Sovereign Government Obligation | | 12.6 | % | 3,484 | |
Metals & Mining | | 11.1 | % | 3,062 | |
Oil, Gas & Consumable Fuels | | 7.6 | % | 2,101 | |
Put Options | | 4.0 | % | 1,124 | |
Leisure Equipment & Products | | 3.3 | % | 920 | |
Pharmaceuticals | | 3.0 | % | 832 | |
Wireless Telecommunication Services | | 3.0 | % | 831 | |
Energy Equipment & Services | | 2.3 | % | 640 | |
Specialty Retail | | 1.7 | % | 469 | |
IT Services | | 1.5 | % | 432 | |
Food Products | | 1.5 | % | 407 | |
Insurance | | 1.5 | % | 407 | |
Computers & Peripherals | | 1.4 | % | 378 | |
Investment Securities, at value | | 97.7 | % | 27,051 | |
Short-Term Investments | | 2.3 | % | 630 | |
Total Investments | | 100.0 | % | $ | 27,681 | |
The notes to the financial statements are an integral part of this report.
48
TA IDEX JPMorgan International Bond
MARKET ENVIRONMENT
TA IDEX JPMorgan International Bond is primarily invested in three major developed bond markets: Europe, the United Kingdom (“UK”) and Japan.
During the period, the European Central Bank (“ECB”) kept a tightening bias and regularly met market expectations, indicating the timing of rate hikes in advance. The refinancing rate increased from 3.25% to 4.00% by June 2007. The ECB had indicated that another hike to 4.25% should occur in September, however, uncertainties raised by the sub-prime mortgage lending crisis held the ECB from further increases, with the period ending with the rate at 4.00%. Economic data throughout the year indicated strong growth potential in Europe, with business confidence at high levels, and historically high levels of monetary growth. Inflation, as measured by the consumer price index (“CPI”), remained relatively low, but high levels of credit and increases in commodity prices contributed to increased concerns about medium-term inflation risks. Late in the period, fears surrounding U.S. sub-prime lending had a contagion effect in Europe, as uncertainties regarding the banking sector’s exposure led to a sharp increase in liquidity costs. The ECB responded by providing ample amounts of liquidity to money markets.
In the UK, the Bank of England’s Monetary Policy Committee (“MPC”) kept a tightening bias until July 2007, increasing rates from 4.75% to end at 5.75% on October 31. Inflation, as measured by the CPI figure, was a major cause of concern for the MPC. The CPI rose to 3.0% in December, with a further increase of 3.1% in March 2007, the highest inflation level since the independence of the Bank of England in 1997. Economic growth remained strong, after accelerating in the fourth quarter of 2006, and the housing market was buoyant for a large part of the year. The increase in borrowing costs in the UK was one of the sharpest in developed markets, which caused problems for some highly cash-dependant financial institutions, such as Northern Rock plc. The Bank of England has resisted reducing rates, instead providing guarantees to the market. However, we now believe there will be a slower pace of growth for the UK economy, and possibly rate cuts in 2008.
In Japan, the Bank of Japan (“BoJ”) continued to renormalize its monetary policy and raised rates from 0.25% to 0.50% in the first quarter of 2007. Japan appeared to emerge from a long deflationary period, with the CPI inflation measure above 0.0% and accelerating economic growth in the fourth quarter of 2006 and the first quarter of 2007. The BoJ was prevented from tightening rates further by upper house elections in July, when the governing party lost ground, initiating a period of political turmoil. Weak personal consumption was a cause of an unexpected decline in gross domestic product (“GDP”) in the second quarter, and BoJ Governor Toshihiko Fukui noted that downside risks to growth were increasing. Consequently, it appeared extremely unlikely that the bank would be able to continue renormalizing its monetary policy in the near term.
PERFORMANCE
For the year ended October 31, 2007, TA IDEX JPMorgan International Bond, Class I returned 8.55%. By comparison its benchmark, the JPMorgan Government Bond Index (GBI) ex-U.S. unhedged Index, returned 9.94%. For the year ended October 31, 2007, the net expense ratio of the Fund was 0.61%.
STRATEGY REVIEW
Major central banks remained in tightening mode over most of the past year and, consequently, we kept a cautious bias on international bonds, maintaining the duration of the portfolio at a neutral or shorter position compared to its index. Market conditions changed sharply in July and the spreads of all non-government bonds widened significantly. We had implemented a modest exposure to credit in high-quality financial corporates and AAA-rated mortgage debt because we believed the credit cycle to be relatively mature and, historically, financial institutions outperform late in the cycle. The sharp spread widening witnessed during the summer affected all qualities of issues and our position underperformed as a result. During the summer, we implemented a number of short positions in government issues to benefit from the changes in rate expectations, and these positions also performed well. For a large part of the year, yield curve flattening positions were held across markets in the portfolio (Europe and the UK) and contributed to performance. Starting in July, we believed that the increase in uncertainties and volatility would contribute to a steepening of yield curves in many markets. We, therefore, implemented a number of steepening positions to reflect these expectations. Our Europe steepeners suffered from slight underperformance, while our UK steepeners performed well. Currency positions detracted from performance in the period.
Our investment philosophy is to diversify, specialize and implement our portfolios while monitoring and managing risk at all times. Diversification allows us to improve the risk-return profile of the portfolio, as it either generates a higher return for each unit of risk that we take, or allows us to take less risk to achieve an identical level of return. We believe in specialization. Our scale allows us to invest in our own macroeconomic, quantitative and credit research. With any specialized process, the actual implementation of a client’s portfolio is one of the most crucial areas of portfolio management; our goal is to make sure that each client portfolio has the investment insight from the specialist teams. The key point here is that each portfolio is managed by a named portfolio manager, who is fully aware of the client’s guidelines and objectives on the one hand, as well as our strategy insights.
Jon B. Jonsson
Fund Manager
J.P. Morgan Investment Management Inc.
49
(unaudited)
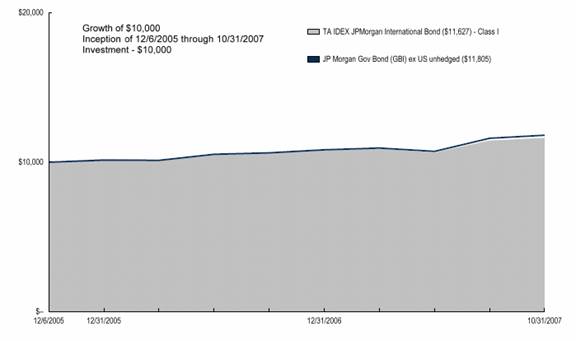
Average Annual Total Return for Periods Ended 10/31/2007
| | 1 Year | | From Inception | | Inception Date | |
Class I (NAV) | | 8.55 | % | 8.24 | % | 12/6/05 | |
JP Morgan Gov Bond (GBI) ex US unhedged (1) | | 9.94 | % | 9.24 | % | 12/6/05 | |
NOTES
(1) The J.P.Morgan Government Bond Index (GBI) ex-U.S. unhedged (JPM Gov’t Bond ex-U.S.) Index is an unmanaged index used as a general measure of market performance. Calculations assume dividends and capital gains are reinvested and do not include any managerial expenses. From inception calculation is based on life of the Fund.
The performance data presented represents past performance, future results may vary. Performance data does not reflect the deduction of taxes that would be paid on fund distributions nor the redemption of fund shares. Investment return and principal value will fluctuate so that an investor’s shares, when redeemed, may be worth more or less than their original cost. Current performance may be lower or higher than performance quoted. Please see www.transamericaidex.com for performance data current to the most recent month-end.
Net Asset Value (NAV) returns include the reinvestment of dividends and capital gains. Fund shares are sold without a sales load.
International investing involves special risks including currency fluctuations, political instability, and different financial accounting standards.
This material must be preceded or accompanied by a current prospectus, which includes specific contents regarding the investment objectives and policies of this fund.
This Fund is only available in Class I shares, which are not available for direct investment by the public.
50
UNDERSTANDING YOUR FUND’S EXPENSES
(unaudited)
SHAREHOLDER EXPENSES
Fund shareholders may incur two types of costs: (1) transaction costs, including sales charges (loads) on purchases, contingent deferred sales charges on redemptions and redemption fees; and (2) ongoing costs, including management fees, dividend expense on short-sales, and other fund expenses.
The following Example is intended to help you understand your ongoing costs (in dollars and cents) of investing in the Fund and to compare these costs with the ongoing costs of investing in other funds.
The Example is based on an investment of $1,000 invested at May 1, 2007 and held for the entire period until October 31, 2007.
ACTUAL EXPENSES
The first line in the table below provides information about actual account values and actual expenses. You may use the information in this line, together with the amount you invested, to estimate the expenses that you paid over the period. Simply divide your account value by $1,000 (for example, an $8,600 account value divided by $1,000 = 8.6), then multiply the result by the number in the first line of your Fund under the heading entitled “Expenses Paid During Period” to estimate the expenses you paid on your account during this period.
HYPOTHETICAL EXAMPLE FOR COMPARISON PURPOSES
The second line in the table below provides information about hypothetical account values and hypothetical expenses based on the Fund’s actual expense ratio and an assumed rate of return of 5% per year before expenses, which is not the Fund’s actual return. The hypothetical account values and expenses may not be used to estimate the actual ending account balance or expenses you paid for the period. You may use this information to compare the ongoing costs of investing in your Fund and other funds. To do so, compare this 5% hypothetical example with the 5% hypothetical examples that appear in the shareholder reports of the other funds.
Please note that the expenses shown in the table are meant to highlight your ongoing costs only and do not reflect any transactional costs, such as sales charges, redemption fees, brokerage commissions paid on purchases and sales of fund shares. Therefore, the second line under the Fund in the table is useful in comparing ongoing costs only, and will not help you determine the relative total costs of owning different funds. If any of these transaction costs were included, your costs would be higher. The expenses shown in the table do not reflect any fees that may be charged to you by brokers, financial intermediaries or other financial institutions.
| | Beginning | | Ending | | Annualized | | Expenses | |
| | Account | | Account | | Expense | | Paid During | |
| | Value | | Value | | Ratio | | Period (a) | |
Class I | | | | | | | | | |
Actual | | $ | 1,000.00 | | $ | 1,055.97 | | 0.60 | % | $ | 3.10 | |
Hypothetical (b) | | 1,000.00 | | 1,022.12 | | 0.60 | | 3.05 | |
| | | | | | | | | | | | |
(a) Expenses are calculated using the Fund’s annualized expense ratio (as disclosed in the table), multiplied by the average account value for the period, multiplied by the number of days in the period (184 days), and divided by the number of days in the year (365 days).
(b) 5% return per year before expenses.
GRAPHICAL PRESENTATION OF SCHEDULE OF INVESTMENTS
By Region
At October 31, 2007
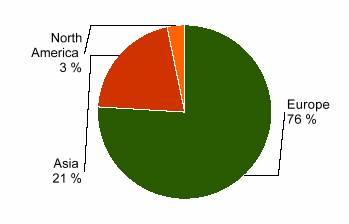
This chart shows the percentage breakdown by region of the Fund’s total investment securities.
51
SCHEDULE OF INVESTMENTS
At October 31, 2007
(all amounts except share amounts in thousands)
| | | | Principal | | Value | |
FOREIGN GOVERNMENT OBLIGATIONS (65.1%) | | | | | | | |
Belgium (4.7%) | | | | | | | |
Belgium Government Bond | | | | | | | |
5.00%, due 09/28/2011 | | EUR | | $ | 19,300 | | $ | 28,736 | |
8.00%, due 03/28/2015 | | EUR | | 3,950 | | 7,038 | |
Canada (0.8%) | | | | | | | |
Canadian Government Bond | | | | | | | |
5.75%, due 06/01/2033 | | CAD | | 4,626 | | 5,884 | |
Denmark (2.7%) | | | | | | | |
Denmark Government Bond | | | | | | | |
6.00%, due 11/15/2009 | | DKK | | 100,920 | | 20,234 | |
France (6.3%) | | | | | | | |
Caisse D’amortissement de La Dette | | | | | | | |
3.13%, due 07/12/2010 | | EUR | | 8,900 | | 12,490 | |
3.75%, due 10/25/2020 | | EUR | | 4,520 | | 6,029 | |
France Government Bond Oat | | | | | | | |
3.75%, due 04/25/2017 | | EUR | | 13,900 | | 19,216 | |
4.75%, due 04/25/2035 | | EUR | | 632 | | 941 | |
5.75%, due 10/25/2032 | | EUR | | 3,000 | | 5,089 | |
8.50%, due 04/25/2023 | | EUR | | 500 | | 1,042 | |
French Discount T-Bill | | | | | | | |
Zero Coupon, due 01/31/2008 (1) | | EUR | | 1,993 | | 2,855 | |
Germany (3.5%) | | | | | | | |
Bundesobligation | | | | | | | |
3.50%, due 10/14/2011 | | EUR | | 19,000 | | 26,852 | |
Ireland (1.1%) | | | | | | | |
Ireland Government Bond | | | | | | | |
4.50%, due 04/18/2020 | | EUR | | 6,000 | | 8,714 | |
Italy (6.5%) | | | | | | | |
Italy Buoni Poliennali del Tesoro | | | | | | | |
4.00%, due 02/01/2037 | | EUR | | 9,100 | | 11,484 | |
5.00%, due 08/01/2034 | | EUR | | 9,660 | | 14,344 | |
5.25%, due 08/01/2017 | | EUR | | 15,200 | | 23,326 | |
Japan (19.8%) | | | | | | | |
Development Bank of Japan | | | | | | | |
1.05%, due 06/20/2023 | | JPY | | 2,311,000 | | 17,435 | |
1.60%, due 06/20/2014 | | JPY | | 510,000 | | 4,513 | |
2.30%, due 03/19/2026 | | JPY | | 500,000 | | 4,403 | |
Japan Finance Corp. for Municipal | | | | | | | |
1.55%, due 02/21/2012 | | JPY | | 3,656,000 | | 32,409 | |
Japan Government Five Year Bond | | | | | | | |
1.20%, due 03/20/2012 | | JPY | | 3,450,000 | | 30,136 | |
Japan Government Ten Year Bond | | | | | | | |
1.30%, due 03/20/2015 | | JPY | | 3,756,450 | | 32,515 | |
1.70%, due 12/20/2016 | | JPY | | 792,000 | | 6,976 | |
Japan Government Twenty Year Bond | | | | | | | |
1.90%, due 06/20/2025 | | JPY | | 860,000 | | 7,265 | |
2.10%, due 09/20/2024 – 12/20/2026 | | | | 1,275,000 | | 11,008 | |
Japanese Government CPI Linked Bond, TIPS | | | | | | | |
1.10%, due 09/10/2016 | | JPY | | 519,480 | | 4,501 | |
Netherlands (4.6%) | | | | | | | |
Netherlands Government Bond | | | | | | | |
4.00%, due 01/15/2037 | | EUR | | 25,050 | | 33,073 | |
New South Wales Treasury Corp. | | | | | | | |
5.50%, due 03/01/2017 | | EUR | | 2,700 | | 2,286 | |
Spain (3.7%) | | | | | | | |
Spain Government Bond | | | | | | | |
5.40%, due 07/30/2011 | | EUR | | $ | 18,500 | | $ | 27,866 | |
Sweden (1.0%) | | | | | | | |
Sweden Government Bond | | | | | | | |
5.50%, due 10/08/2012 | | SEK | | 47,500 | | 7,873 | |
United Kingdom (10.4%) | | | | | | | |
U.K. Gilt | | | | | | | |
4.25%, due 06/07/2032 | | GPB | | 3,800 | | 7,482 | |
4.50%, due 12/07/2042 | | GPB | | 6,000 | | 12,449 | |
4.75%, due 12/07/2038 | | GPB | | 5,310 | | 11,434 | |
6.25%, due 11/25/2010 | | GPB | | 19,650 | | 42,224 | |
8.00%, due 06/07/2021 | | GPB | | 2,260 | | 6,115 | |
Total Foreign Government Obligations (cost $469,948) | | | | | | 496,237 | |
| | | | | | | |
ASSET-BACKED SECURITIES (1.3%) | | | | | | | |
Spain (1.3%) | | | | | | | |
Fondo de Titulizacion de Activos Santander Auto Series 1, Class A | | | | | | | |
4.77%, due 11/25/2021 | | EUR | | 1,296 | | 1,865 | |
UCI | | | | | | | |
Series 15, Class A, Reg S | | | | | | | |
4.86%, due 12/18/2048 | | EUR | | 5,382 | | 7,681 | |
Total Asset-Backed Securities (cost $8,817) | | | | | | 9,546 | |
| | | | | | | |
CORPORATE DEBT SECURITIES (27.6%) | | | | | | | |
France (5.4%) | | | | | | | |
Compagnie de Financement Foncier | | | | | | | |
1.25%, due 12/01/2011 | | JPY | | 2,230,000 | | 19,436 | |
3.63%, due 01/28/2008 | | EUR | | 3,450 | | 4,982 | |
Dexia Municipal Agency | | | | | | | |
3.50%, due 09/21/2009 | | EUR | | 11,530 | | 16,410 | |
Germany (8.2%) | | | | | | | |
Kreditanstalt Fuer Wiederaufbau | | | | | | | |
5.50%, due 09/15/2009 – 12/07/2015 | | GPB | | 11,450 | | 23,774 | |
Bayerische Landesbank | | | | | | | |
1.40%, due 04/22/2013 | | JPY | | 1,508,000 | | 13,178 | |
Eurohypo AG | | | | | | | |
3.75%, due 04/11/2011 | | EUR | | 14,800 | | 20,957 | |
Kreditanstalt Fuer Wiederaufbau | | | | | | | |
2.50%, due 11/17/2008 | | EUR | | 2,500 | | 3,559 | |
Landwirtschaftliche Rentenbank | | | | | | | |
1.38%, due 04/25/2013 | | JPY | | 101,000 | | 881 | |
Ireland (1.6%) | | | | | | | |
Depfa ACS Bank | | | | | | | |
1.65%, due 12/20/2016 | | JPY | | 800,000 | | 6,849 | |
Ulster Bank Finance PLC | | | | | | | |
4.82%, due 03/29/2011 * | | EUR | | 4,000 | | 5,765 | |
The notes to the financial statements are an integral part of this report.
52
| | | | Principal | | Value | |
Spain (3.6%) | | | | | | | |
Ayt Cedulas Cajas VII Fondo de | | | | | | | |
4.00%, due 06/23/2011 | | EUR | | $ | 15,700 | | $ | 22,291 | |
La CAJA de Ahorros y Pensiones de | | | | | | | |
3.25%, due 10/05/2015 | | EUR | | 3,900 | | 5,102 | |
Supranational (4.5%) | | | | | | | |
European Investment Bank | | | | | | | |
1.40%, due 06/20/2017 | | EUR | | 2,646,000 | | 22,577 | |
European Investment Bank | | | | | | | |
5.63%, due 10/15/2010 | | EUR | | 7,900 | | 11,862 | |
United Kingdom (4.3%) | | | | | | | |
Bank of Scotland PLC | | | | | | | |
4.85%, due 06/14/2012 * | | EUR | | 4,000 | | 5,745 | |
Barclays PLC | | | | | | | |
4.40%, due 04/20/2016 * | | EUR | | 4,000 | | 5,661 | |
Network Rail Finance PLC | | | | | | | |
4.88%, due 03/06/2009 | | GPB | | 2,100 | | 4,317 | |
Network Rail Infrastructure Finance PLC | | | | | | | |
4.38%, due 01/18/2011 | | GPB | | 5,870 | | 11,788 | |
4.75%, due 11/29/2035 | | GPB | | 2,530 | | 5,179 | |
Total Corporate Debt Securities (cost $193,350) | | | | | | 210,313 | |
| | | | | | | |
SHORT-TERM OBLIGATIONS (2.4%) | | | | | | | |
United States (2.4%) | | | | | | | |
ING Bank NV Amsterdam Time Deposit | | | | | | | |
4.89%, due 11/01/2007 | | | | $ | 18,000 | | $ | 18,000 | |
Total Short-Term Obligations (cost $18,000) | | | | | | 18,000 | |
| | | | | | | |
CONVERTIBLE BONDS (0.4%) | | | | | | | |
Germany (0.4%) | | | | | | | |
Kreditanstalt Fuer Wiederaufbau | | | | | | | |
2.60%, due 06/20/2037 | | JPY | | 355,000 | | 3,136 | |
Total Convertible Bonds (cost $2,898) | | | | | | 3,136 | |
Total Investment Securities (cost $693,013) # | | | | | | $ | 737,232 | |
FUTURES CONTRACTS:
| | | | | | | | Net Unrealized | |
| | | | Settlement | | | | Appreciation | |
| | Contracts (·) | | Date | | Amount | | (Depreciation) | |
10 Year Canadian Bond | | 54 | | 12/17/2007 | | $ | 6,413 | | $ | 42 | |
10 Year Japan Bond | | 17 | | 12/20/2007 | | 20,053 | | 171 | |
Euro-BOBL | | (898 | ) | 12/11/2007 | | (139,935 | ) | 462 | |
Euro-Bund | | 150 | | 12/10/2007 | | 24,594 | | (172 | ) |
Euro-Schatz | | (30 | ) | 12/10/2007 | | (4,480 | ) | 7 | |
Long Gilt | | (206 | ) | 12/30/2007 | | (45,917 | ) | 130 | |
| | | | | | $ | (139,272 | ) | $ | 640 | |
| | | | | | | | | | | | |
The notes to the financial statements are an integral part of this report.
53
FORWARD FOREIGN CURRENCY CONTRACTS:
| | | | | | Amount in | | Net Unrealized | |
| | Bought | | Settlement | | U.S. Dollars | | Appreciation | |
Currency | | (Sold) | | Date | | Bought(Sold) | | (Depreciation) | |
Australian Dollar | | 11,936 | | 11/27/2007 | | $ | 10,321 | | $ | 726 | |
Australian Dollar | | (1,353 | ) | 11/27/2007 | | (1,248 | ) | (4 | ) |
Canadian Dollar | | 5,961 | | 11/27/2007 | | 5,960 | | 316 | |
Canadian Dollar | | (7,100 | ) | 11/27/2007 | | (7,384 | ) | (92 | ) |
Danish Krone | | 27,945 | | 11/27/2007 | | 5,296 | | 130 | |
Danish Krone | | (97,805 | ) | 11/27/2007 | | (18,514 | ) | (476 | ) |
Euro Dollar | | 32,883 | | 11/27/2007 | | 46,400 | | 1,193 | |
Euro Dollar | | (50,753 | ) | 11/27/2007 | | (71,637 | ) | (1,820 | ) |
Japanese Yen | | 9,031,392 | | 11/27/2007 | | 78,616 | | (52 | ) |
Japanese Yen | | (355,351 | ) | 11/27/2007 | | (3,061 | ) | (30 | ) |
New Zealand Dollar | | 581 | | 11/27/2007 | | 430 | | 15 | |
Norwegian Krone | | 142,729 | | 11/27/2007 | | 25,886 | | 576 | |
Norwegian Krone | | (94,975 | ) | 11/27/2007 | | (17,503 | ) | (106 | ) |
Singapore Dollar | | 5,380 | | 11/27/2007 | | 3,607 | | 112 | |
Singapore Dollar | | (5,380 | ) | 11/27/2007 | | (3,599 | ) | (121 | ) |
Swedish Krona | | 10,458 | | 11/27/2007 | | 1,610 | | 35 | |
Swiss Franc | | 15,260 | | 11/27/2007 | | 12,933 | | 256 | |
Swiss Franc | | (5,607 | ) | 11/27/2007 | | (4,763 | ) | (83 | ) |
United Kingdom Pound | | 2,660 | | 11/27/2007 | | 5,406 | | 115 | |
United Kingdom Pound | | (22,234 | ) | 11/27/2007 | | (44,952 | ) | (1,200 | ) |
| | | | | | $ | 369,126 | | $ | (510 | ) |
FORWARD FOREIGN CROSS CURRENCY CONTRACTS
| | | | Settlement | | Net Unrealized Appreciation | |
Currency Bought | | Currency Sold | | Date | | (Depreciation) | |
Australian Dollar | | 6,977 | | Japanese Yen | | 704,374 | | 11/27/2007 | | $ | 330 | |
Australian Dollar | | 4,697 | | United Kingdom Pound | | 2,000 | | 11/27/2007 | | 196 | |
Australian Dollar | | 12,303 | | Euro Dollar | | 7,690 | | 11/27/2007 | | 256 | |
Australian Dollar | | 3,415 | | Canadian Dollar | | 3,009 | | 11/27/2007 | | (7 | ) |
Australian Dollar | | 3,906 | | Norwegian Krone | | 19,218 | | 11/27/2007 | | 52 | |
Canadian Dollar | | 802 | | Norwegian Krone | | 4,395 | | 11/27/2007 | | 29 | |
Canadian Dollar | | 3,465 | | Swedish Krona | | 22,680 | | 11/27/2007 | | 81 | |
Canadian Dollar | | 836 | | United Kingdom Pound | | 416 | | 11/27/2007 | | 16 | |
Euro Dollar | | 2,851 | | United Kingdom Pound | | 1,989 | | 11/27/2007 | | (3 | ) |
Euro Dollar | | 12,641 | | Norwegian Krone | | 98,436 | | 11/27/2007 | | 46 | |
Euro Dollar | | 2,458 | | Canadian Dollar | | 3,469 | | 11/27/2007 | | (95 | ) |
Euro Dollar | | 6,413 | | Swedish Krona | | 59,184 | | 11/27/2007 | | (26 | ) |
Euro Dollar | | 3,368 | | Australian Dollar | | 5,367 | | 11/27/2007 | | (93 | ) |
Euro Dollar | | 6,730 | | Japanese Yen | | 1,105,787 | | 11/27/2007 | | 121 | |
Japanese Yen | | 139,720 | | United Kingdom Pound | | 616 | | 11/27/2007 | | (62 | ) |
Japanese Yen | | 986,929 | | Euro Dollar | | 6,028 | | 11/27/2007 | | (139 | ) |
Japanese Yen | | 706,784 | | Canadian Dollar | | 5,928 | | 11/27/2007 | | (93 | ) |
Japanese Yen | | 163,051 | | Swedish Krona | | 9,233 | | 11/27/2007 | | (33 | ) |
Norwegian Krone | | 60,783 | | United Kingdom Pound | | 5,465 | | 11/27/2007 | | (75 | ) |
Norwegian Krone | | 35,506 | | Japanese Yen | | 730,245 | | 11/27/2007 | | 231 | |
Norwegian Krone | | 66,005 | | Australian Dollar | | 13,559 | | 11/27/2007 | | (311 | ) |
Norwegian Krone | | 15,095 | | Euro Dollar | | 1,940 | | 11/27/2007 | | (9 | ) |
Norwegian Krone | | 7,309 | | Canadian Dollar | | 1,342 | | 11/27/2007 | | (58 | ) |
Norwegian Krone | | 84,338 | | Swedish Krona | | 100,826 | | 11/27/2007 | | (220 | ) |
Swedish Krona | | 71,813 | | United Kingdom Pound | | 5,501 | | 11/27/2007 | | (124 | ) |
Swedish Krona | | 63,703 | | Norwegian Krone | | 53,664 | | 11/27/2007 | | 69 | |
Swiss Franc | | 7,255 | | United Kingdom Pound | | 3,090 | | 11/27/2007 | | (144 | ) |
United Kingdom Pound | | 2,022 | | Japanese Yen | | 467,414 | | 11/27/2007 | | 131 | |
| | | | | | | | | | $ | 66 | |
The notes to the financial statements are an integral part of this report.
54
NOTES TO SCHEDULE OF INVESTMENTS
*Floating or variable rate note. Rate is listed as of October 31, 2007.
(•)Contract Amounts are not in thousands
(1) At October 31, 2007, all or a portion of this security is segregated with the custodian to cover margin requirements for open futurescontracts. The value of all securities segregated at October 31, 2007 is $2,855.
# Aggregate cost for federal income tax purposes is $693,438. Aggregate gross unrealized appreciation for all securities in which there is an excess of value over tax cost and aggregate gross unrealized depreciation for all securities in which there is an excess of tax cost over value were $43,809 and $16, respectively. Net unrealized appreciation for tax purposes is $43,793.
DEFINITIONS:
TIPS Treasury Inflation Protected Security
EUR Euro Dollar
GBP United Kingdom pound
JPY Japan Yen
SEK Sweden krona
| | Percentage of | | | |
(unaudited) | | Total Investments | | Value | |
INVESTMENTS BY INDUSTRY: | | | | | |
Sovereign Government Obligation | | 56.5 | % | $ | 416,672 | |
Commercial Banks | | 19.2 | % | 141,466 | |
Sovereign Government Agency Obligation | | 10.5 | % | 77,279 | |
Thrifts & Mortgage Finance | | 6.2 | % | 45,375 | |
Diversified Financial Services | | 3.6 | % | 26,608 | |
Asset-Backed Securities | | 1.3 | % | 9,546 | |
Soverign Government Ageny Obligation | | 0.3 | % | 2,286 | |
Investment Securities, at value | | 97.6 | % | 719,232 | |
Short-Term Investments | | 2.4 | % | 18,000 | |
Total Investments | | 100.0 | % | $ | 737,232 | |
The notes to the financial statements are an integral part of this report.
55
TA IDEX JPMorgan Mid Cap Value
MARKET ENVIRONMENT
U.S. equity markets advanced over the period despite lingering concerns over disruptions in the credit markets, the continued decline in the U.S. housing market and energy prices reaching record highs. Many economic releases pointed to continued growth, giving investors hope that the problems originating in the housing and the mortgage sectors may not have yet spilled over into the broader U.S. economy. Investors were also encouraged that inflation data throughout the period remained fairly tame. This allowed the Federal Reserve Board (“Fed”) to stop short of signaling renewed inflation concerns, giving it the flexibility to cut interest rates if the threats to economic growth increased.
It became apparent that, in order to avoid a major credit crisis, central banks globally needed to take a series of corrective measures by injecting liquidity into the capital markets. On September 18, the Fed lowered the federal funds target rate (“fed funds”) by a larger-than-expected 50 basis points (“bps”) in order to offset the broad economic effects resulting from deteriorating conditions in the credit markets; increased weakness in the housing sector; and sagging consumer confidence. Acting preemptively in an effort to promote economic growth, the Fed delivered an additional rate cut of 25 bps the following month, ending the period at 4.50%.
Over the period, the Standard and Poor’s 500 Composite Stock Index rose by 14.56%, while small-cap stocks, represented by the Russell 2000 Index, underperformed the broader market, returning 9.27% and the Russell Midcap Value Index (“Russell Midcap Value”) returned 9.73%.
PERFORMANCE
For the year ended October 31, 2007, TA IDEX JPMorgan Mid Cap Value, Class I returned 11.12%. By comparison its benchmark, the Russell Midcap Value, returned 9.73%. For the year ended October 31, 2007, the net expense ratio of the Fund was 0.87%.
STRATEGY REVIEW
The portfolio outperformed its benchmark for the year ending October 31, 2007. Performance relative to the benchmark was positively affected by stock selection in the financials and consumer discretionary sectors while stock selection in consumer staples and industrials hurt returns.
At the individual stock level, shares of Hilton Hotels Corporation (“Hilton”) surged after The Blackstone Group, Inc. announced plans to acquire the company at a premium in an all-cash transaction. Many lodging companies had recently gone private in similar transactions but, as the largest, Hilton continued to demonstrate strong industry fundamentals in the U.S. and internationally.
Shares of The Williams Companies, Inc. (“Williams”) soared in the period, prompted by the sale of the majority of its power trading business to The Bear Stearns Companies Inc. The sale should reduce both earnings volatility and borrowing costs while allowing the company to focus efforts on its natural gas business. Williams expects to completely exit the power business by the end of the year, with the anticipated sale of its remaining assets.
Alternatively, Old Republic International Corporation’s earnings fell over the year, due partly to a significant decrease in mortgage guaranty operating income, resulting from higher year-over-year claim costs associated with rising residential home delinquencies. Despite the difficult mortgage guaranty environment, the company plans to organically grow its presence in the construction business within its general insurance segment. In addition, the stock has been attractively valued, trading at a modest discount-to-book value.
Another top detractor in the period was The McClatchy Company (“McClatchy”), a large U.S. newspaper company. The company experienced declining advertising revenues in part due to declining real estate and classified advertisements. Despite industry headwinds, McClatchy has been a strong operator of newspapers in mid-sized markets, offering above-average growth prospects. Its recent acquisition of Knight-Ridder, Inc. also sets up the possibility of better-than expected growth from cost synergies.
The dedicated investment philosophy of JPMorgan Mid Cap Value is based on the premise that stock selection, focused on undervalued mid-cap companies with durable franchises that are led by strong management teams, should generate consistent returns over the long term. We employ a bottom-up approach to stock selection, constructing portfolios based on company fundamentals, quantitative screening and proprietary fundamental analysis. Our aim is to identify undervalued companies that have the potential to grow their intrinsic values per share and to purchase these companies at a discount.
We have maintained our focus throughout the period by continuing to invest in undervalued mid-cap companies that are durable franchises, possessing both stability and predictability in earnings and cash flow. These characteristics are often sought after as high-quality companies tend to hold their value and attract greater capital flows when markets turn more volatile. Despite different investment styles/themes coming in and going out of favor, we have not wavered in what is important to us and continue to implement the same disciplined process.
Jonathan K.L. Simon
Lawrence Playford, CPA, CFA
Gloria Fu, CFA
Co-Portfolio Managers
J.P. Morgan Investment Management Inc.
56
(unaudited)
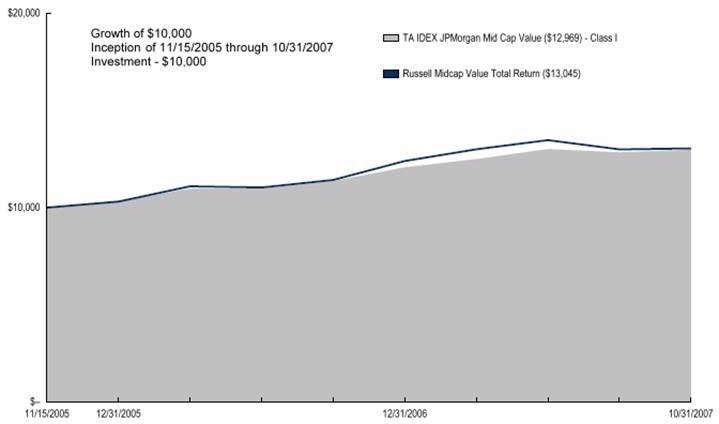
Average Annual Total Return for Periods Ended 10/31/2007
| | 1 Year | | From Inception | | Inception Date | |
Class I (NAV) | | 11.12 | % | 14.17 | % | 11/15/05 | |
Russell Midcap Value Total Return (1) | | 9.73 | % | 14.28 | % | 11/15/05 | |
NOTES
(1) The Russell Midcap Value (Russell Midcap Value) index is an unmanaged index used as a general measure of market performance. Calculations assume dividends and capital gains are reinvested and do not include any managerial expenses. From inception calculation is based on life of the Fund.
The performance data presented represents past performance, future results may vary. Performance data does not reflect the deduction of taxes that would be paid on fund distributions or the redemption of fund shares. Investment return and principal value will fluctuate so that an investor’s shares, when redeemed, may be worth more or less than their original cost. Current performance may be lower or higher than performance quoted. Please see www.transamericaidex.com for performance data current to the most recent month-end.
Net Asset Value (NAV) returns include the reinvestment of dividends and capital gains. Fund shares are sold without a sales load.
This material must be preceded or accompanied by a current prospectus, which includes specific contents regarding the investment objectives and policies of this fund. This fund is only available in Class I shares, which are not available for direct investment by the public
57
UNDERSTANDING YOUR FUND’S EXPENSES
(unaudited)
SHAREHOLDER EXPENSES
Fund shareholders may incur two types of costs: (1) transaction costs, including sales charges (loads) on purchases, contingent deferred sales charges on redemptions and redemption fees; and (2) ongoing costs, including management fees, dividend
expense on short-sales, and other fund expenses.
The following Example is intended to help you understand your ongoing costs (in dollars and cents) of investing in the Fund and to compare these costs with the ongoing costs of investing in other funds.
The Example is based on an investment of $1,000 invested at May 1, 2007 and held for the entire period until October 31, 2007.
ACTUAL EXPENSES
The first line in the table below provides information about actual account values and actual expenses. You may use the information in this line, together with the amount you invested, to estimate the expenses that you paid over the period. Simply divide your account value by $1,000 (for example, an $8,600 account value divided by $1,000 = 8.6), then multiply the result by the number in the first line of your Fund under the heading entitled “Expenses Paid During Period” to estimate the expenses you paid on your account during this period.
HYPOTHETICAL EXAMPLE FOR COMPARISON PURPOSES
The second line in the table below provides information about hypothetical account values and hypothetical expenses based on the Fund’s actual expense ratio and an assumed rate of return of 5% per year before expenses, which is not the Fund’s actual return. The hypothetical account values and expenses may not be used to estimate the actual ending account balance or expenses you paid for the period. You may use this information to compare the ongoing costs of investing in your Fund and other funds. To do so, compare this 5% hypothetical example with the 5% hypothetical examples that appear in the shareholder reports of the other funds.
Please note that the expenses shown in the table are meant to highlight your ongoing costs only and do not reflect any transactional costs, such as sales charges, redemption fees, brokerage commissions paid on purchases and sales of fund shares. Therefore, the second line under the Fund in the table is useful in comparing ongoing costs only, and will not help you determine the relative total costs of owning different funds. If any of these transaction costs were included, your costs would be higher. The expenses shown in the table do not reflect any fees that may be charged to you by brokers, financial intermediaries or other financial institutions.
| | Beginning | | Ending | | Annualized | | Expenses | |
| | Account | | Account | | Expense | | Paid During | |
| | Value | | Value | | Ratio | | Period (a) | |
Class I | | | | | | | | | |
Actual | | 1,000.00 | | 1,008.18 | | 0.87 | | 4.39 | |
Hypothetical (b) | | 1,000.00 | | 1,020.76 | | 0.87 | | 4.42 | |
(a) Expenses are calculated using the Fund’s annualized expense ratio (as disclosed in the table), multiplied by the average account value for the period, multiplied by the number of days in the period (184 days), and divided by the number of days in the year (365 days).
(b) 5% return per year before expenses.
GRAPHICAL PRESENTATION OF SCHEDULE OF INVESTMENTS
By Sector
At October 31, 2007
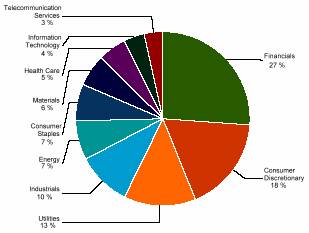
This chart shows the percentage breakdown by sector of the Fund’s total investment securities.
58
SCHEDULE OF INVESTMENTS
At October 31, 2007
(all amounts except share amounts in thousands)
| | | | Shares | | Value | |
COMMON STOCKS (96.8%) | | | | | | | |
Aerospace & Defense (1.0%) | | | | | | | |
Alliant Techsystems, Inc. ‡^ | | | | 25,700 | | $ | 2,837 | |
Auto Components (0.7%) | | | | | | | |
Wabco Holdings, Inc. | | | | 38,800 | | 1,972 | |
Beverages (2.6%) | | | | | | | |
Brown-Forman Corp. Class B ^ | | | | 65,300 | | 4,831 | |
Constellation Brands, Inc. Class A ‡ | | | | 89,050 | | 2,237 | |
Building Products (0.4%) | | | | | | | |
Owens Corning, Inc. ‡^ | | | | 46,500 | | 1,075 | |
Capital Markets (2.9%) | | | | | | | |
Affiliated Managers Group, Inc. ‡^ | | | | 12,850 | | 1,691 | |
Legg Mason, Inc. | | | | 12,300 | | 1,020 | |
Northern Trust Corp. | | | | 32,400 | | 2,437 | |
T. Rowe Price Group, Inc. | | | | 41,100 | | 2,640 | |
Chemicals (3.7%) | | | | | | | |
Albemarle Corp. | | | | 79,972 | | 3,819 | |
PPG Industries, Inc. | | | | 42,200 | | 3,154 | |
Sigma-Aldrich Corp. | | | | 59,100 | | 3,054 | |
Commercial Banks (6.5%) | | | | | | | |
Cullen/Frost Bankers, Inc. | | | | 46,400 | | 2,467 | |
M&T Bank Corp. | | | | 52,600 | | 5,233 | |
Synovus Financial Corp. | | | | 240,900 | | 6,350 | |
Wilmington Trust Corp. | | | | 58,100 | | 2,113 | |
Zions Bancorporation | | | | 25,800 | | 1,525 | |
Commercial Services & Supplies (1.3%) | | | | | | | |
Republic Services, Inc. Class A | | | | 99,500 | | 3,402 | |
Computers & Peripherals (0.8%) | | | | | | | |
NCR Corp. ‡ | | | | 78,900 | | 2,177 | |
Construction Materials (0.6%) | | | | | | | |
Vulcan Materials Co. ^ | | | | 18,700 | | 1,599 | |
Containers & Packaging (1.2%) | | | | | | | |
Ball Corp. | | | | 65,600 | | 3,252 | |
Diversified Telecommunication Services (1.9%) | | | | | | | |
CenturyTel, Inc. | | | | 47,100 | | 2,075 | |
Windstream Corp. | | | | 230,254 | | 3,097 | |
Electric Utilities (8.8%) | | | | | | | |
American Electric Power Co., Inc. | | | | 101,900 | | 4,913 | |
CMS Energy Corp. ^ | | | | 183,100 | | 3,107 | |
FirstEnergy Corp. | | | | 66,900 | | 4,663 | |
PG&E Corp. | | | | 99,800 | | 4,883 | |
Westar Energy, Inc. | | | | 125,300 | | 3,335 | |
Xcel Energy, Inc. | | | | 124,300 | | 2,803 | |
Electrical Equipment (1.1%) | | | | | | | |
Ametek, Inc. | | | | 64,750 | | 3,043 | |
Electronic Equipment & Instruments (2.2%) | | | | | | | |
Amphenol Corp. Class A | | | | 48,400 | | 2,143 | |
Arrow Electronics, Inc. ‡ | | | | 94,100 | | 3,762 | |
Food & Staples Retailing (1.9%) | | | | | | | |
Safeway, Inc. | | | | 31,600 | | 1,074 | |
Supervalu, Inc. | | | | 108,200 | | 4,193 | |
Food Products (0.9%) | | | | | | | |
Dean Foods Co. | | | | 33,600 | | 933 | |
WM Wrigley Jr. Co. | | | | 23,100 | | 1,425 | |
Gas Utilities (4.2%) | | | | | | | |
Energen Corp. | | | | 67,300 | | $ | 4,307 | |
Oneok, Inc. | | | | 40,900 | | 2,043 | |
Questar Corp. | | | | 50,000 | | 2,854 | |
UGI Corp. | | | | 76,700 | | 2,042 | |
Health Care Providers & Services (4.0%) | | | | | | | |
Community Health Systems, Inc. ‡ | | | | 68,100 | | 2,242 | |
Coventry Health Care, Inc. ‡^ | | | | 97,550 | | 5,883 | |
Henry Schein, Inc. ‡ | | | | 4,425 | | 265 | |
Lincare Holdings, Inc. ‡ | | | | 73,500 | | 2,556 | |
Hotels, Restaurants & Leisure (1.4%) | | | | | | | |
Applebees International, Inc. | | | | 57,600 | | 1,459 | |
Burger King Holdings, Inc. | | | | 66,900 | | 1,769 | |
Marriott International, Inc. Class A | | | | 15,000 | | 617 | |
Household Durables (2.2%) | | | | | | | |
Fortune Brands, Inc. | | | | 48,200 | | 4,038 | |
Jarden Corp. ‡^ | | | | 53,600 | | 1,904 | |
Household Products (1.2%) | | | | | | | |
Clorox Co. | | | | 50,600 | | 3,166 | |
Industrial Conglomerates (1.0%) | | | | | | | |
Carlisle Cos., Inc. | | | | 67,500 | | 2,663 | |
Insurance (9.7%) | | | | | | | |
AMBAC Financial Group, Inc. ^ | | | | 9,600 | | 354 | |
Assurant, Inc. | | | | 99,900 | | 5,838 | |
Cincinnati Financial Corp. | | | | 110,555 | | 4,398 | |
Everest RE Group, Ltd. | | | | 28,200 | | 3,004 | |
MBIA, Inc. | | | | 17,500 | | 753 | |
Old Republic International Corp. | | | | 207,250 | | 3,177 | |
OneBeacon Insurance Group, Ltd. | | | | 110,209 | | 2,371 | |
Class A | | | | | | | |
Principal Financial Group, Inc. | | | | 55,100 | | 3,729 | |
W.R. Berkley Corp. | | | | 88,600 | | 2,666 | |
IT Services (0.6%) | | | | | | | |
Western Union Co. (The) | | | | 68,600 | | 1,512 | |
Machinery (2.6%) | | | | | | | |
Crane Co. | | | | 5,500 | | 261 | |
Dover Corp. | | | | 91,700 | | 4,218 | |
Oshkosh Truck Corp. | | | | 48,000 | | 2,602 | |
Media (5.0%) | | | | | | | |
Cablevision Systems Corp. Class A ‡ | | | | 99,200 | | 2,910 | |
Clear Channel Communications, Inc. | | | | 96,100 | | 3,630 | |
Clear Channel Outdoor Holdings, Inc. Class A ‡^ | | | | 45,173 | | 1,148 | |
Lamar Advertising Co. Class A ^ | | | | 24,800 | | 1,326 | |
Omnicom Group, Inc. | | | | 25,000 | | 1,274 | |
Washington Post Co. (The) Class B | | | | 3,870 | | 3,286 | |
Metals & Mining (0.3%) | | | | | | | |
Carpenter Technology Corp. | | | | 5,600 | | 812 | |
Oil, Gas & Consumable Fuels (7.1%) | | | | | | | |
CVR Energy, Inc. ‡ | | | | 23,600 | | 538 | |
Devon Energy Corp. | | | | 56,500 | | 5,277 | |
Helix Energy Solutions Group, Inc. ‡ | | | | 67,500 | | 3,122 | |
Kinder Morgan Management LLC ‡ | | | | 26,291 | | 1,335 | |
Teekay Corp. | | | | 47,900 | | 2,680 | |
The notes to the financial statements are an integral part of this report.
59
| | | | Shares | | Value | |
Oil, Gas & Consumable Fuels (continued) | | | | | | | |
Williams Cos., Inc. | | | | 168,200 | | $ | 6,138 | |
Pharmaceuticals (1.0%) | | | | | | | |
Warner Chilcott, Ltd. Class A ‡^ | | | | 148,000 | | 2,742 | |
Real Estate Investment Trusts (3.8%) | | | | | | | |
Plum Creek Timber Co., Inc. REIT | | | | 32,000 | | 1,429 | |
Public Storage, Inc. REIT | | | | 32,500 | | 2,632 | |
Rayonier, Inc. REIT | | | | 84,685 | | 4,089 | |
Vornado Realty Trust REIT ^ | | | | 18,900 | | 2,112 | |
Real Estate Management & Development (1.4%) | | | | | | | |
Brookfield Properties Corp. ^ | | | | 124,550 | | 3,110 | |
Forest City Enterprises, Inc. Class A | | | | 9,650 | | 549 | |
Road & Rail (0.7%) | | | | | | | |
Norfolk Southern Corp. | | | | 37,200 | | 1,921 | |
Software (0.2%) | | | | | | | |
Jack Henry & Associates, Inc. | | | | 18,900 | | 552 | |
Specialty Retail (5.5%) | | | | | | | |
AutoNation, Inc. ‡ | | | | 67,361 | | 1,191 | |
AutoZone, Inc. ‡^ | | | | 28,600 | | 3,558 | |
Limited Brands, Inc. | | | | 93,500 | | $ | 2,058 | |
Staples, Inc. | | | | 105,800 | | 2,469 | |
Tiffany & Co. | | | | 42,500 | | 2,303 | |
TJX Cos., Inc. | | | | 114,300 | | 3,307 | |
Textiles, Apparel & Luxury Goods (2.4%) | | | | | | | |
Columbia Sportswear Co. ^ | | | | 38,600 | | 1,882 | |
V.F. Corp. | | | | 51,400 | | 4,478 | |
Thrifts & Mortgage Finance (1.0%) | | | | | | | |
People’s United Financial, Inc. | | | | 152,600 | | 2,713 | |
Trading Companies & Distributors (1.6%) | | | | | | | |
Genuine Parts Co. | | | | 90,300 | | 4,431 | |
Wireless Telecommunication Services (1.4%) | | | | | | | |
Telephone & Data Systems, Inc. Class L | | | | 59,500 | | 3,918 | |
Total Common Stocks (cost $225,127) | | | | | | 261,954 | |
| | | | | | | |
Total Security Lending Collateral (cost $30,899) | | | | | | 30,899 | |
Total Investment Securities (cost $256,026) # | | | | | | $ | 292,853 | |
NOTES TO SCHEDULE OF INVESTMENTS
^ At October 31, 2007, all or a portion of this security is on loan (see Note 1). The value at October 31, 2007, of all securities on loan is $30,037.
‡ Non Income Producing
# Aggregate cost for federal income tax purposes is $256,715. Aggregate gross unrealized appreciation for all securities in which there is an excess of value over tax cost and aggregate gross unrealized depreciation for all securities in which there is an excess of tax cost over value were $42,577 and $6,438, respectively. Net unrealized appreciation for tax purposes is $36,139.
DEFINITIONS
REIT Real Estate Investment Trust
The notes to the financial statements are an integral part of this report.
60
TA IDEX Loomis Sayles Bond
MARKET ENVIRONMENT
After a sustained period of strong growth, the bond market vacillated between risk appetite and aversion in 2007. Blooming concerns over housing weakness and softening consumer and business spending mixed with an immense supply of Leveraged Buyout (“LBO”)-related debt and yield hungry investors. By the summer, the weight of the sub-prime mortgage debacle and fears that lax lending practices might spread to other credit areas culminated in a sharp reappraisal of risk amid a credit crunch, followed by aggressive action by the Federal Reserve Board (“Fed”). After holding rates steady for several quarters, the Fed cut its benchmark rate by 0.50% in September and by 0.25% in October in a bid to help keep the economy on course. Overseas, global markets continued to thrive, aided in part by currency gains relative to the US dollar.
PERFORMANCE
For the period from inception, December 27, 2007 to October 31, 2007, TA IDEX Loomis Sayles Bond, Class I returned 4.50%. By comparison its benchmark, the Lehman Brothers U.S. Government Credit/Bond Index, returned 4.82%. For the year ended October 31, 2007, the net expense ratio of the Fund was 0.73%.
STRATEGY REVIEW
The portfolio incorporates a multi-sector strategy with the flexibility of using a variety of sectors within fixed income, including governments, investment grade credit, high yield and non-dollar. Security selection, rather than sector allocation, drove performance in this environment. When the US yield curve steepened late in the period, our longer duration strategy relative to its benchmark also contributed favorably to the portfolio’s outperformance. Non-US-dollar holdings, which are not represented in the benchmark, were consistently among the leading drivers of returns as the global economy continued to chug along. Bonds denominated in the currencies of Canada and Brazil were strongest thanks to continued economic growth in those countries. From a quality perspective, the portfolio remained positioned to capitalize on the shift in credit trends. High yield securities comprised just over 20% of the portfolio and these securities maintained a performance edge at the beginning of the year. By third quarter 2007, the higher rated portion of the portfolio took the lead – domestic and non-US dollar government securities and investment grade corporate credit comprised 70% of the portfolio’s market value as of October 31. Still, extreme market weakness in the third quarter reduced the favorable impact of the allocation to higher quality buckets.
Individual holdings with the greatest positive impact included Canadian and Brazilian sovereign bonds, a long maturity US Treasury bond, Columbia/HCA healthcare after its leveraged buyout, and short-dated Federal Home Loan Mortgage Corporation (“Freddie Mac”) debt. Individual holdings with the greatest negative contribution to total return included Nektar Therapeutics convertible debt, the homebuilder K. Hovnanian Enterprises, Inc., information technology concern Level 3 Communications, Inc., LBO-target Tribune Company, and mortgage lender Countrywide Financial Corporation. Investment grade credit US dollar denominated corporates contributed positively to performance, while high yield was a drag on absolute and relative performance. Non-US dollar denominated securities, primarily higher quality corporates or foreign government bonds, were the most significant positive drivers of performance. Convertibles, agencies and emerging market debt were neutral.
Kathleen C. Gaffney, CFA
Daniel J. Fuss, CFA, CIC
Elaine M. Stokes
Mathew J. Eagan, CFA
Co-Portfolio Managers
Loomis, Sayles & Company, L.P.
61
(unaudited)
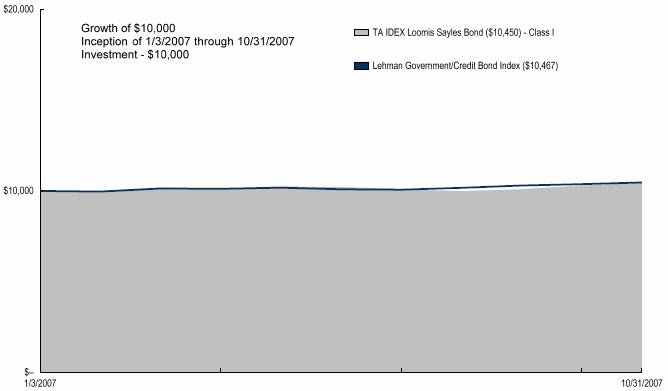
Average Annual Total Return for Period Ended 10/31/2007
| | From Inception | | Inception Date | |
Class I (NAV) | | 4.50 | % | 1/3/07 | |
Lehman Intermediate Government/Credit Index (1) | | 4.82 | % | 1/3/07 | |
NOTES
(1) The Lehman Brother Government/Credit Bond (LBGC) Index is an unmanaged index used as a general measure of market performance. Calculations assume dividends and capital gains are reinvested and do not include any managerial expenses. From inception calculation is based on life of the Fund.
The performance data presented represents past performance, future results may vary. Performance data does not reflect the deduction of taxes that would be paid on fund distributions nor the redemption of fund shares. Investment return and principal value will fluctuate so that an investor’s shares, when redeemed, may be worth more or less than their original cost. Current performance may be lower or higher than performance quoted. Please see www.transamericaidex.com for performance data current to the most recent month-end.
Net Asset Value (NAV) returns include the reinvestment of dividends and capital gains. Fund shares are sold without a sales load. International investing involves special risks including currency fluctuations, political instability, and different financial accounting standards. This material must be preceded or accompanied by a current prospectus, which includes specific contents regarding the investment objectives and policies of this fund.
This fund is only available in Class I shares, which are not available for direct investment by the public.
62
UNDERSTANDING YOUR FUND’S EXPENSES
(unaudited)
SHAREHOLDER EXPENSES
Fund shareholders may incur two types of costs: (1) transaction costs, including sales charges (loads) on purchases, contingent deferred sales charges on redemptions and redemption fees; and (2) ongoing costs, including management fees, dividend expense on short-sales, and other fund expenses.
The following Example is intended to help you understand your ongoing costs (in dollars and cents) of investing in the Fund and to compare these costs with the ongoing costs of investing in other funds.
The Example is based on an investment of $1,000 invested at May 1, 2007 and held for the entire period until October 31, 2007.
ACTUAL EXPENSES
The first line in the table below provides information about actual account values and actual expenses. You may use the information in this line, together with the amount you invested, to estimate the expenses that you paid over the period. Simply divide your account value by $1,000 (for example, an $8,600 account value divided by $1,000 = 8.6), then multiply the result by the number in the first line of your Fund under the heading entitled “Expenses Paid During Period” to estimate the expenses you paid on your account during this period.
HYPOTHETICAL EXAMPLE FOR COMPARISON PURPOSES
The second line in the table below provides information about hypothetical account values and hypothetical expenses based on the Fund’s actual expense ratio and an assumed rate of return of 5% per year before expenses, which is not the Fund’s actual return. The hypothetical account values and expenses may not be used to estimate the actual ending account balance or expenses you paid for the period. You may use this information to compare the ongoing costs of investing in your Fund and other funds. To do so, compare this 5% hypothetical example with the 5% hypothetical examples that appear in the shareholder reports of the other funds.
Please note that the expenses shown in the table are meant to highlight your ongoing costs only and do not reflect any transactional costs, such as sales charges, redemption fees, brokerage commissions paid on purchases and sales of fund shares. Therefore, the second line under the Fund in the table is useful in comparing ongoing costs only, and will not help you determine the relative total costs of owning different funds. If any of these transaction costs were included, your costs would be higher. The expenses shown in the table do not reflect any fees that may be charged to you by brokers, financial intermediaries or other financial institutions.
| | Beginning | | Ending | | Annualized | | Expenses | |
| | Account | | Account | | Expense | | Paid During | |
| | Value | | Value | | Ratio | | Period (a) | |
Class I | | | | | | | | | |
Actual | | $ | 1,000.00 | | $ | 1,020.61 | | 0.71 | % | $ | 3.61 | |
Hypothetical (b) | | 1,000.00 | | 1,021.57 | | 0.71 | | 3.61 | |
| | | | | | | | | | | | |
(a) Expenses are calculated using the Fund’s annualized expense ratio (as disclosed in the table), multiplied by the average account value for the period, multiplied by the number of days in the period (184 days), and divided by the number of days in the year (365 days).
(b) 5% return per year before expenses.
GRAPHICAL PRESENTATION OF SCHEDULE OF INVESTMENTS
By Bond Credit Quality (Moody Ratings)
At October 31, 2007

This chart shows the percentage breakdown by Bond Credit Quality (Moody Ratings) of the Fund’s total investment securities.
63
SCHEDULE OF INVESTMENTS
At October 31, 2007
(all amounts except share amounts in thousands)
| | Principal | | Value | |
U.S. GOVERNMENT OBLIGATIONS (10.1%) | | | | | | | |
U.S. Treasury Bond | | | | | | | |
4.50%, due 02/15/2036 ^ | | $ | | 43,975 | | $ | 42,216 | |
4.75%, due 02/15/2037 ^ | | | | 3,000 | | 2,999 | |
U.S. Treasury Note | | | | | | | |
4.50%, due 04/30/2009 ^ | | | | 6,500 | | 6,551 | |
Total U.S. Government Obligations (cost $50,843) | | | | | | 51,766 | |
| | | | | | | |
U.S. GOVERNMENT AGENCY OBLIGATIONS (1.0%) | | | | | | | |
Freddie Mac | | | | | | | |
4.63%, due 12/19/2008 | | | | 5,000 | | 5,009 | |
Total U.S. Government Agency Obligations (cost $4,973) | | | | | | 5,009 | |
| | | | | | | |
FOREIGN GOVERNMENT OBLIGATIONS (8.9%) | | | | | | | |
Austria (1.6%) | | | | | | | |
Oesterreichische Kontrollbank AG | | | | | | | |
1.80%, due 03/22/2010 | | JPY | | 952,000 | | 8,428 | |
Brazil (1.4%) | | | | | | | |
Republic of Brazil | | | | | | | |
10.25%, due 01/10/2028 | | BRL | | 12,000 | | 6,941 | |
Canada (2.3%) | | | | | | | |
Canadian Government Bond | | | | | | | |
5.25%, due 06/01/2012 | | CAD | | 4,835 | | 5,303 | |
5.75%, due 06/01/2033 | | CAD | | 5,300 | | 6,741 | |
Colombia (0.5%) | | | | | | | |
Republic of Columbia | | | | | | | |
9.85%, due 06/28/2027 | | COP | | 665,000 | | 341 | |
12.00%, due 10/22/2015 | | COP | | 3,500,000 | | 1,986 | |
Mexico (2.9%) | | | | | | | |
Mexican Bonos | | | | | | | |
8.00%, due 12/17/2015 – 12/07/2023 | | MXN | | 160,530 | | 15,114 | |
South Africa (0.2%) | | | | | | | |
Republic of South Africa | | | | | | | |
13.00%, due 08/31/2010 | | ZAR | | 5,050 | | 852 | |
Total Foreign Government Obligations (cost $42,485) | | | | | | 45,706 | |
| | | | | | | |
CORPORATE DEBT SECURITIES (72.4%) | | | | | | | |
Australia (0.8%) | | | | | | | |
FBG Finance, Ltd. - 144A | | | | | | | |
5.88%, due 06/15/2035 | | | | 4,450 | | 3,986 | |
Belgium (0.1%) | | | | | | | |
Delhaize Group | | | | | | | |
6.50%, due 06/15/2017 | | | | 400 | | 409 | |
Bermuda (1.2%) | | | | | | | |
Weatherford International, Ltd. | | | | | | | |
6.50%, due 08/01/2036 | | | | 2,340 | | 2,355 | |
White Mountains RE Group, Ltd. - 144A | | | | | | | |
6.38%, due 03/20/2017 | | | | 3,955 | | 3,874 | |
Canada (2.8%) | | | | | | | |
Barrick Gold Finance Co. | | | | | | | |
5.80%, due 11/15/2034 | | | | 2,400 | | 2,236 | |
Bell Canada - 144A | | | | | | | |
5.00%, due 02/15/2017 | | CAD | | 130 | | 116 | |
6.10%, due 03/16/2035 | | CAD | | 400 | | 354 | |
6.55%, due 05/01/2029 | | CAD | | 375 | | 349 | |
7.30%, due 02/23/2032 | | CAD | | 45 | | 45 | |
Bombardier, Inc. - 144A | | | | | | | |
6.30%, due 05/01/2014 | | | | 1,510 | | 1,476 | |
7.45%, due 05/01/2034 | | | | 1,815 | | 1,815 | |
EnCana Corp. | | | | | | | |
6.63%, due 08/15/2037 | | $ | | 1,360 | | $ | 1,436 | |
Kinder Morgan Finance Co. Ulc | | | | | | | |
6.40%, due 01/05/2036 | | | | 735 | | 629 | |
Nortel Networks Corp. | | | | | | | |
6.88%, due 09/01/2023 | | | | 425 | | 340 | |
Talisman Energy, Inc. | | | | | | | |
5.85%, due 02/01/2037 | | | | 635 | | 585 | |
6.25%, due 02/01/2038 | | | | 4,935 | | 4,805 | |
TELUS Corp. | | | | | | | |
4.95%, due 03/15/2017 | | | | 1,665 | | 1,618 | |
Cayman Islands (0.7%) | | | | | | | |
Embraer Overseas, Ltd. | | | | | | | |
6.38%, due 01/24/2017 | | | | 140 | | 137 | |
Vale Overseas, Ltd. | | | | | | | |
6.88%, due 11/21/2036 | | | | 3,330 | | 3,462 | |
Germany (0.2%) | | | | | | | |
Kreditanstalt Fuer Wiederaufbau | | | | | | | |
8.50%, due 07/16/2010 | | ZAR | | 8,505 | | 1,255 | |
India (0.5%) | | | | | | | |
Canara Bank | | | | | | | |
6.37%, due 11/28/2021 * | | | | 1,400 | | 1,324 | |
ICICI Bank, Ltd. - 144A | | | | | | | |
6.38%, due 04/30/2022 * (1) | | | | 1,300 | | 1,204 | |
Ireland (0.3%) | | | | | | | |
Elan Finance PLC/Elan Finance Corp. | | | | | | | |
7.75%, due 11/15/2011 | | | | 625 | | 617 | |
8.88%, due 12/01/2013 | | | | 840 | | 842 | |
Korea, Republic of (0.6%) | | | | | | | |
SK Telecom Co., Ltd. - 144A | | | | | | | |
6.63%, due 07/20/2027 | | | | 2,825 | | 2,925 | |
Luxembourg (0.4%) | | | | | | | |
Telecom Italia Capital SA | | | | | | | |
6.00%, due 09/30/2034 | | | | 1,450 | | 1,389 | |
6.38%, due 11/15/2033 | | | | 548 | | 546 | |
Mexico (0.2%) | | | | | | | |
America Movil SAB de CV - 144A | | | | | | | |
8.46%, due 12/18/2036 | | MXN | | 14,000 | | 1,293 | |
Spain (0.1%) | | | | | | | |
Telefonica Emisiones Sau | | | | | | | |
7.05%, due 06/20/2036 | | | | 450 | | 494 | |
Supranational (0.4%) | | | | | | | |
Inter-American Development Bank | | | | | | | |
13.00%, due 06/20/2008 | | ISK | | 129,100 | | 2,147 | |
The notes to the financial statements are an integral part of this report.
64
| | Principal | | Value | |
United Kingdom (2.1%) | | | | | | | |
AstraZeneca PLC | | | | | | | |
6.45%, due 09/15/2037 | | | | 3,375 | | 3,556 | |
Bskyb Finance UK PLC - 144A | | | | | | | |
5.63%, due 10/15/2015 | | | | 860 | | 834 | |
6.50%, due 10/15/2035 | | | | 855 | | 838 | |
National Grid PLC | | | | | | | |
6.30%, due 08/01/2016 | | | | 500 | | 514 | |
Vodafone Group PLC | | | | | | | |
6.15%, due 02/27/2037 | | | | 5,160 | | 5,065 | |
United States (61.3%) | | | | | | | |
Abitibibowater, Inc. | | | | | | | |
6.50%, due 06/15/2013 | | $ | | 910 | | $ | 723 | |
AES Corp. (The) - 144A | | | | | | | |
7.75%, due 10/15/2015 | | | | 430 | | 431 | |
8.00%, due 10/15/2017 | | | | 860 | | 868 | |
Albertson’s, Inc. | | | | | | | |
6.63%, due 06/01/2028 | | | | 4,020 | | 3,670 | |
7.45%, due 08/01/2029 | | | | 630 | | 626 | |
7.75%, due 06/15/2026 | | | | 460 | | 470 | |
ALLTEL Corp. | | | | | | | |
6.80%, due 05/01/2029 | | | | 375 | | 276 | |
7.00%, due 07/01/2012 | | | | 275 | | 248 | |
7.88%, due 07/01/2032 | | | | 1,505 | | 1,208 | |
American Water Capital Corp. - 144A | | | | | | | |
6.59%, due 10/15/2037 | | | | 3,550 | | 3,607 | |
Amgen, Inc. - 144A | | | | | | | |
6.38%, due 06/01/2037 | | | | 4,035 | | 4,081 | |
Amkor Technology, Inc. | | | | | | | |
7.75%, due 05/15/2013 | | | | 725 | | 701 | |
Anadarko Petroleum Corp. | | | | | | | |
6.45%, due 09/15/2036 | | | | 1,810 | | 1,831 | |
Aramark Corp. | | | | | | | |
5.00%, due 06/01/2012 | | | | 2,200 | | 1,914 | |
AT&T, Inc. | | | | | | | |
6.50%, due 03/15/2029 – 09/01/2037 | | | | 850 | | 892 | |
Avnet, Inc. | | | | | | | |
6.00%, due 09/01/2015 | | | | 1,210 | | 1,199 | |
Barclays LLC - 144A | | | | | | | |
4.06%, due 09/16/2010 | | KRW | | 440,000 | | 484 | |
4.46%, due 09/23/2010 | | KRW | | 550,000 | | 596 | |
Blockbuster, Inc. | | | | | | | |
9.00%, due 09/01/2012 ^ | | | | 220 | | 198 | |
Borden, Inc. | | | | | | | |
7.88%, due 02/15/2023 | | | | 690 | | 531 | |
9.20%, due 03/15/2021 | | | | 375 | | 311 | |
Boston Scientific Corp. | | | | | | | |
5.45%, due 06/15/2014 | | | | 55 | | 50 | |
6.40%, due 06/15/2016 | | | | 625 | | 584 | |
7.00%, due 11/15/2035 | | | | 1,205 | | 1,078 | |
Bruce Mansfield Unit | | | | | | | |
6.85%, due 06/01/2034 | | | | 2,810 | | 2,940 | |
Centex Corp. | | | | | | | |
5.25%, due 06/15/2015 | | | | 455 | | 385 | |
Chesapeake Energy Corp. | | | | | | | |
6.50%, due 08/15/2017 | | | | 215 | | 207 | |
6.88%, due 11/15/2020 | | | | 1,115 | | 1,090 | |
Cigna Corp. | | | | | | | |
6.15%, due 11/15/2036 | | | | 2,450 | | 2,404 | |
Citizens Communications Co. | | | | | | | |
7.13%, due 03/15/2019 | | | | 1,665 | | 1,640 | |
7.88%, due 01/15/2027 | | | | 55 | | 54 | |
Comcast Corp. | | | | | | | |
5.65%, due 06/15/2035 | | $ | | 6,650 | | $ | 6,105 | |
6.50%, due 11/15/2035 | | | | 1,400 | | 1,420 | |
6.95%, due 08/15/2037 | | | | 1,735 | | 1,857 | |
Community Health Systems, Inc. - 144A | | | | | | | |
8.88%, due 07/15/2015 | | | | 695 | | 704 | |
Countrywide Financial Corp. | | | | | | | |
6.25%, due 05/15/2016 | | | | 1,520 | | 1,210 | |
Countrywide Home Loans, Inc. | | | | | | | |
4.00%, due 03/22/2011 | | | | 105 | | 89 | |
COX Communications, Inc. - 144A | | | | | | | |
6.45%, due 12/01/2036 | | | | 2,830 | | 2,804 | |
CSC Holdings, Inc. | | | | | | | |
7.63%, due 07/15/2018 | | | | 1,480 | | 1,421 | |
CSX Corp. | | | | | | | |
6.00%, due 10/01/2036 | | | | 3,790 | | 3,549 | |
6.25%, due 03/15/2018 | | | | 3,460 | | 3,486 | |
CVS Caremark Corp. | | | | | | | |
4.88%, due 09/15/2014 | | | | 400 | | 383 | |
Delta Air Lines -07-1 | | | | | | | |
6.82%, due 08/10/2022 | | | | 3,005 | | 2,975 | |
Delta Air Lines, Inc. - 144A | | | | | | | |
8.02%, due 08/10/2022 | | | | 2,790 | | 2,805 | |
Dillard’s, Inc. | | | | | | | |
7.13%, due 08/01/2018 | | | | 990 | | 908 | |
Dr Horton, Inc. | | | | | | | |
5.63%, due 09/15/2014 | | | | 540 | | 469 | |
Dynegy Holdings, Inc. - 144A | | | | | | | |
7.50%, due 06/01/2015 | | | | 65 | | 62 | |
7.63%, due 10/15/2026 | | | | 450 | | 399 | |
7.75%, due 06/01/2019 | | | | 625 | | 587 | |
El Paso Natural Gas Co. - 144A | | | | | | | |
5.95%, due 04/15/2017 | | | | 1,590 | | 1,558 | |
Embarq Corp. | | | | | | | |
7.08%, due 06/01/2016 | | | | 515 | | 538 | |
Energy Future Holdings | | | | | | | |
6.50%, due 11/15/2024 | | | | 1,045 | | 768 | |
Energy Transfer Partners | | | | | | | |
6.13%, due 02/15/2017 | | | | 4,840 | | 4,777 | |
Enterprise Products Operating, LP | | | | | | | |
6.30%, due 09/15/2017 | | | | 1,900 | | 1,935 | |
Equifax, Inc. | | | | | | | |
7.00%, due 07/01/2037 | | | | 500 | | 507 | |
Ford Motor Co. | | | | | | | |
6.50%, due 08/01/2018 | | | | 100 | | 81 | |
6.63%, due 02/15/2028 — 10/01/2028 | | | | 4,788 | | 3,520 | |
7.45%, due 07/16/2031 ^ | | | | 3,010 | | 2,378 | |
7.50%, due 08/01/2026 | | | | 115 | | 90 | |
Ford Motor Credit Co. | | | | | | | |
5.70%, due 01/15/2010 | | | | 4,395 | | 4,076 | |
Freescale Semiconductor | | | | | | | |
10.13%, due 12/15/2016 ^ | | | | 1,480 | | 1,341 | |
The notes to the financial statements are an integral part of this report.
65
| | Principal | | Value | |
United States (continued) | | | | | | | |
General Electric Capital Corp. | | | | | | | |
2.96%, due 05/18/2012 | | SGD | | $2,500 | | $ | 1,707 | |
3.49%, due 03/08/2012 | | SGD | | 2,600 | | 1,824 | |
General Motors Corp. | | | | | | | |
7.40%, due 09/01/2025 | | | | 20 | | 17 | |
8.25%, due 07/15/2023 | | | | 95 | | 86 | |
8.38%, due 07/15/2033 ^ | | | | 35 | | 32 | |
Georgia-Pacific Corp. | | | | | | | |
7.25%, due 06/01/2028 | | | | 190 | | 175 | |
7.38%, due 12/01/2025 | | | | 1,000 | | 935 | |
7.70%, due 06/15/2015 | | | | 235 | | 231 | |
7.75%, due 11/15/2029 | | | | 875 | | 836 | |
8.00%, due 01/15/2024 | | | | 2,500 | | 2,463 | |
8.88%, due 05/15/2031 | | | | 2,125 | | 2,125 | |
GMAC LLC | | | | | | | |
6.00%, due 12/15/2011 | | | | 2,360 | | 2,094 | |
6.63%, due 05/15/2012 | | | | 2,695 | | 2,419 | |
6.75%, due 12/01/2014 | | | | 1,658 | | 1,469 | |
6.88%, due 09/15/2011 – 08/28/2012 | | | | 480 | | 438 | |
8.00%, due 11/01/2031 | | | | 490 | | 453 | |
Goldman Sachs Group, Inc. | | | | | | | |
5.63%, due 01/15/2017 | | | | 370 | | 358 | |
Harrahs Operating Co., Inc. | | | | | | | |
6.50%, due 06/01/2016 | | | | 1,095 | | 868 | |
Hasbro, Inc. | | | | | | | |
6.60%, due 07/15/2028 | | | | 4,730 | | 4,703 | |
HCA, Inc. | | | | | | | |
5.75%, due 03/15/2014 | | | | 615 | | 517 | |
6.38%, due 01/15/2015 | | | | 1,585 | | 1,353 | |
6.50%, due 02/15/2016 | | | | 4,915 | | 4,196 | |
7.05%, due 12/01/2027 | | | | 55 | | 42 | |
7.50%, due 12/15/2023 – 11/06/2033 | | | | 2,680 | | 2,237 | |
7.58%, due 09/15/2025 | | | | 755 | | 621 | |
7.69%, due 06/15/2025 | | | | 620 | | 514 | |
7.75%, due 07/15/2036 | | | | 125 | | 102 | |
Hercules, Inc. | | | | | | | |
6.50%, due 06/30/2029 | | | | 1,260 | | 1,008 | |
Highwoods Properties, Inc. | | | | | | | |
5.85%, due 03/15/2017 | | | | 1,175 | | 1,106 | |
Home Depot, Inc. | | | | | | | |
5.88%, due 12/16/2036 | | | | 4,219 | | 3,684 | |
HSBC Bank USA NA - 144A | | | | | | | |
Zero Coupon, due 05/17/2012 | | MYR | | 10,920 | | 2,806 | |
International Paper Co. | | | | | | | |
5.25%, due 04/01/2016 | | | | 1,800 | | 1,721 | |
Intuit, Inc. | | | | | | | |
5.75%, due 03/15/2017 | | | | 680 | | 661 | |
iStar Financial, Inc. | | | | | | | |
5.15%, due 03/01/2012 | | | | 1,355 | | 1,237 | |
5.38%, due 04/15/2010 | | | | 375 | | 362 | |
5.65%, due 09/15/2011 | | | | 425 | | 393 | |
JC Penney Corp., Inc. | | | | | | | |
6.38%, due 10/15/2036 | | | | 2,820 | | 2,690 | |
Joy Global, Inc. | | | | | | | |
6.63%, due 11/15/2036 | | | | $2,320 | | $ | 2,358 | |
JPMorgan Chase & Co. | | | | | | | |
Zero Coupon, due 09/10/2012 | | MYR | | 41,477,425 | | 5,112 | |
5.15%, due 10/01/2015 | | | | 370 | | 359 | |
K Hovnanian Enterprises, Inc. | | | | | | | |
6.25%, due 01/15/2015 – 01/15/2016 | | | | 4,080 | | 3,142 | |
6.38%, due 12/15/2014 | | | | 95 | | 74 | |
6.50%, due 01/15/2014 | | | | 300 | | 236 | |
7.50%, due 05/15/2016 | | | | 10 | | 8 | |
7.75%, due 05/15/2013 | | | | 40 | | 28 | |
Kar Holdings, Inc. - 144A | | | | | | | |
10.00%, due 05/01/2015 | | | | 775 | | 740 | |
KB Home | | | | | | | |
5.75%, due 02/01/2014 | | | | 455 | | 409 | |
5.88%, due 01/15/2015 | | | | 2,265 | | 2,005 | |
6.25%, due 06/15/2015 ^ | | | | 1,055 | | 950 | |
7.25%, due 06/15/2018 | | | | 60 | | 56 | |
Kinder Morgan Ener Part | | | | | | | |
6.50%, due 02/01/2037 | | | | 2,600 | | 2,573 | |
Kinder Morgan Energy Partners, LP | | | | | | | |
6.95%, due 01/15/2038 | | | | 5,730 | | 6,005 | |
KN Capital Trust III | | | | | | | |
7.63%, due 04/15/2028 | | | | 510 | | 462 | |
Kraft Foods, Inc. | | | | | | | |
6.50%, due 11/01/2031 | | | | 330 | | 336 | |
7.00%, due 08/11/2037 | | | | 545 | | 592 | |
Lehman Brothers Holdings | | | | | | | |
5.75%, due 01/03/2017 | | | | 940 | | 900 | |
Lennar Corp. | | | | | | | |
5.50%, due 09/01/2014 | | | | 900 | | 771 | |
5.60%, due 05/31/2015 | | | | 440 | | 378 | |
Level 3 Financing, Inc. | | | | | | | |
8.75%, due 02/15/2017 | | | | 4,045 | | 3,691 | |
9.25%, due 11/01/2014 | | | | 445 | | 419 | |
Lowe’s Companies, Inc. | | | | | | | |
6.65%, due 09/15/2037 | | | | 530 | | 545 | |
Lucent Technologies, Inc. | | | | | | | |
6.45%, due 03/15/2029 | | | | 6,210 | | 5,185 | |
6.50%, due 01/15/2028 | | | | 1,275 | | 1,065 | |
Mackinaw Power LLC - 144A | | | | | | | |
6.30%, due 10/31/2023 | | | | 1,810 | | 1,888 | |
Macys Retail Holdings, Inc. | | | | | | | |
6.38%, due 03/15/2037 | | | | 3,000 | | 2,723 | |
6.79%, due 07/15/2027 | | | | 1,065 | | 991 | |
6.90%, due 04/01/2029 | | | | 1,070 | | 1,018 | |
Masco Corp. | | | | | | | |
5.85%, due 03/15/2017 | | | | 2,270 | | 2,211 | |
McDonald’s Corp. | | | | | | | |
6.30%, due 10/15/2037 | | | | 4,200 | | 4,286 | |
Merrill Lynch & Co., Inc. | | | | | | | |
5.70%, due 05/02/2017 | | | | 300 | | 287 | |
6.40%, due 08/28/2017 | | | | 2,625 | | 2,648 | |
10.71%, due 03/08/2017 | | BRL | | 2,000 | | 1,121 | |
The notes to the financial statements are an integral part of this report.
66
| | | | Principal | | Value | |
United States (continued) | | | | | | | |
Miller Brewing Co. - 144A | | | | | | | |
5.50%, due 08/15/2013 | | | | $ | 265 | | $ | 264 | |
Morgan Stanley | | | | | | | |
5.45%, due 01/09/2017 | | | | 455 | | 440 | |
Mosaic Global Holdings, Inc. | | | | | | | |
7.30%, due 01/15/2028 | | | | 420 | | 416 | |
7.38%, due 08/01/2018 | | | | 400 | | 393 | |
Motorola, Inc. | | | | | | | |
6.63%, due 11/15/2037 | | | | 5,055 | | 4,956 | |
Newmont Mining Corp. | | | | | | | |
5.88%, due 04/01/2035 | | | | 2,090 | | 1,838 | |
News America, Inc. | | | | | | | |
6.15%, due 03/01/2037 | | | | 3,205 | | 3,076 | |
6.20%, due 12/15/2034 | | | | 870 | | 843 | |
6.40%, due 12/15/2035 | | | | 185 | | 184 | |
Ngc Corp. Capital Trust | | | | | | | |
8.32%, due 06/01/2027 | | | | 200 | | 185 | |
NiSource Finance Corp. | | | | | | | |
6.40%, due 03/15/2018 | | | | 5,855 | | 5,950 | |
Northern Telecom Capital | | | | | | | |
7.88%, due 06/15/2026 | | | | 300 | | 252 | |
Northwest Airlines, Inc. | | | | | | | |
7.03%, due 11/01/2019 | | | | 6,708 | | 6,825 | |
Oneok Partners, LP | | | | | | | |
6.65%, due 10/01/2036 | | | | 2,355 | | 2,398 | |
Owens & Minor, Inc. | | | | | | | |
6.35%, due 04/15/2016 | | | | 835 | | 839 | |
Owens Corning, Inc. | | | | | | | |
7.00%, due 12/01/2036 | | | | 2,830 | | 2,644 | |
Owens-Illinois, Inc. | | | | | | | |
7.80%, due 05/15/2018 | | | | 900 | | 902 | |
Pioneer Natural Resource | | | | | | | |
6.88%, due 05/01/2018 | | | | 435 | | 410 | |
Pioneer Natural Resources | | | | | | | |
7.20%, due 01/15/2028 | | | | 280 | | 255 | |
Pioneer Natural Resources Co. | | | | | | | |
5.88%, due 07/15/2016 | | | | 3,415 | | 3,091 | |
Pulte Homes, Inc. | | | | | | | |
6.38%, due 05/15/2033 | | | | 1,700 | | 1,349 | |
Qwest Capital Funding | | | | | | | |
7.63%, due 08/03/2021 | | | | 1,000 | | 933 | |
Qwest Capital Funding, Inc. | | | | | | | |
6.50%, due 11/15/2018 | | | | 965 | | 856 | |
6.88%, due 07/15/2028 | | | | 2,505 | | 2,129 | |
7.75%, due 02/15/2031 | | | | 530 | | 485 | |
Qwest Corp. - 144A | | | | | | | |
6.50%, due 06/01/2017 | | | | 565 | | 557 | |
R.H. Donnelley Corp. | | | | | | | |
6.88%, due 01/15/2013 | | | | 950 | | 893 | |
Realty Income Corp. | | | | | | | |
6.75%, due 08/15/2019 | | | | 3,795 | | 3,825 | |
Reynolds American, Inc. | | | | | | | |
6.75%, due 06/15/2017 | | | | 358 | | 369 | |
7.25%, due 06/15/2037 | | | | 880 | | 936 | |
RH Donnelley Corp. - 144A | | | | | | | |
6.88%, due 01/15/2013 | | | | $ | 745 | | $ | 700 | |
8.88%, due 10/15/2017 | | | | 655 | | 655 | |
Sara Lee Corp. | | | | | | | |
6.13%, due 11/01/2032 | | | | 2,195 | | 2,071 | |
Schering-Plough Corp. | | | | | | | |
6.55%, due 09/15/2037 | | | | 2,835 | | 2,938 | |
Simon Property Group, LP | | | | | | | |
4.88%, due 08/15/2010 | | | | 2,735 | | 2,703 | |
SLM Corp. | | | | | | | |
5.00%, due 10/01/2013 – 06/15/2018 | | | | 2,643 | | 2,252 | |
5.05%, due 11/14/2014 | | | | 435 | | 376 | |
5.38%, due 05/15/2014 | | | | 477 | | 424 | |
5.63%, due 08/01/2033 | | | | 779 | | 609 | |
6.50%, due 06/15/2010 | | | | 2,805 | | 1,935 | |
Southern Natural Gas Co. - 144A | | | | | | | |
5.90%, due 04/01/2017 | | | | 380 | | 372 | |
Sprint Capital Corp. | | | | | | | |
6.88%, due 11/15/2028 | | | | 4,990 | | 4,780 | |
Sprint Nextel Corp. | | | | | | | |
6.00%, due 12/01/2016 | | | | 967 | | 930 | |
Starwood Hotels & Resorts Worldwide, | | | | | | | |
6.25%, due 02/15/2013 | | | | 3,255 | | 3,266 | |
Steel Dynamics, Inc. - 144A | | | | | | | |
7.38%, due 11/01/2012 | | | | 1,800 | | 1,800 | |
Target Corp. | | | | | | | |
6.50%, due 10/15/2037 | | | | 6,000 | | 6,079 | |
Teva Pharmaceutical Finance LLC | | | | | | | |
6.15%, due 02/01/2036 | | | | 870 | | 856 | |
Time Warner Cable, Inc. - 144A | | | | | | | |
6.55%, due 05/01/2037 | | | | 2,900 | | 2,923 | |
Time Warner, Inc. | | | | | | | |
6.50%, due 11/15/2036 | | | | 4,220 | | 4,167 | |
Toro Co. | | | | | | | |
6.63%, due 05/01/2037 | | | | 2,500 | | 2,486 | |
Toys “R” US, Inc. | | | | | | | |
7.38%, due 10/15/2018 | | | | 6,000 | | 4,680 | |
7.88%, due 04/15/2013 | | | | 355 | | 303 | |
Tribune Co. | | | | | | | |
5.25%, due 08/15/2015 | | | | 1,755 | | 1,189 | |
Unisys Corp. | | | | | | | |
8.00%, due 10/15/2012 | | | | 615 | | 578 | |
United Airlines, Inc. | | | | | | | |
6.64%, due 07/02/2022 | | | | 7,795 | | 7,717 | |
USG Corp. | | | | | | | |
6.30%, due 11/15/2016 | | | | 3,000 | | 2,745 | |
7.75%, due 01/15/2018 | | | | 780 | | 790 | |
Verizon Communications, Inc. | | | | | | | |
6.25%, due 04/01/2037 | | | | 2,590 | | 2,679 | |
Viacom, Inc. | | | | | | | |
6.88%, due 04/30/2036 | | | | 4,345 | | 4,409 | |
Western Union Co. (The) | | | | | | | |
6.20%, due 11/17/2036 | | | | 1,240 | | 1,209 | |
The notes to the financial statements are an integral part of this report.
67
| | | | Principal | | Value | |
United States (continued) | | | | | | | |
XTO Energy, Inc. | | | | | | | |
6.10%, due 04/01/2036 | | | | $ | 1,835 | | $ | 1,818 | |
Yum! Brands, Inc. | | | | | | | |
6.88%, due 11/15/2037 | | | | 5,695 | | 5,691 | |
Total Corporate Debt Securities (cost $370,626) | | | | | | 371,647 | |
| | | | | | | |
STRUCTURED NOTES (1.7%) | | | | | | | |
United States (1.7%) | | | | | | | |
HSBC Bank USA NA - 144A, | | | | | | | |
Zero Coupon, due 04/18/2012 | | | | MYR | 3,000 | | 788 | |
JPMorgan Chase & Co. - 144A | | | | | | | |
Zero Coupon, | | | | KRW | 28,716,155 | | 7,640 | |
due 04/12/2012 – 10/22/2012 | | | | | | | |
Total Structured Notes (cost $8,178) | | | | | | 8,428 | |
| | | | | | | | | | | |
| | | | Shares | | Value | |
CONVERTIBLE PREFERRED STOCKS (0.7%) | | | | | | | |
United States (0.7%) | | | | | | | |
AES Trust III, Convertible ‡ | | | | 5,450 | | 271 | |
Chesapeake Energy Corp., Convertible ‡ | | | | 3,730 | | 452 | |
Chesapeake Energy Corp., Convertible ‡ | | | | 16,685 | | 1,804 | |
El Paso Energy Capital Trust I, | | | | 3,700 | | 150 | |
Convertible ‡ | | | | | | | |
Newell Financial Trust I, Convertible ‡ | | | | 10,000 | | 470 | |
Owens-Illinois, Inc., Convertible ‡ | | | | 11,375 | | 540 | |
Total Convertible Preferred Stocks (cost $3,335) | | | | | | 3,687 | |
CONVERTIBLE BONDS (1.8%) | | | | | | | |
United States (1.8%) | | | | | | | |
Countrywide Financial Corp. - 144A, Convertible | | | | | | | |
1.74%, due 04/15/2037 * | | | | 120 | | $ | 106 | |
3.31%, due 05/15/2037 * | | | | 295 | | 253 | |
Human Genome Sciences, Inc., Convertible | | | | | | | |
2.25%, due 08/15/2012 | | | | 1,170 | | 983 | |
Incyte Corp., Convertible | | | | | | | |
3.50%, due 02/15/2011 | | | | 700 | | 662 | |
JDS Uniphase Corp., Convertible | | | | | | | |
Zero Coupon, due 11/15/2010 | | | | 570 | | 538 | |
Level 3 Communications, Convertible | | | | | | | |
3.50%, due 06/15/2012 | | | | 1,345 | | 1,179 | |
Level 3 Communications, Inc., Convertible | | | | | | | |
6.00%, due 09/15/2009 — 03/15/2010 | | | | 3,140 | | 2,881 | |
Liberty Media LLC, Convertible | | | | | | | |
3.50%, due 01/15/2031 | | | | 125 | | 118 | |
Nektar Therapeutics, Convertible | | | | | | | |
3.25%, due 09/28/2012 | | | | 1,960 | | 1,568 | |
Valeant Pharmaceuticals International, Convertible | | | | | | | |
4.00%, due 11/15/2013 | | | | 1,300 | | 1,152 | |
Total Convertible Bonds (cost $9,927) | | | | | | 9,440 | |
| | | | | | | |
Total Security Lending Collateral (cost $53,498) | | | | | | 53,498 | |
Total Investment Securities (cost $543,865) # | | | | | | $ | 549,181 | |
NOTES TO SCHEDULE OF INVESTMENTS
^ | | At October 31, 2007, all or a portion of this security is on loan (see Note 1). The value at October 31, 2007, of all securities on loan is $52,156. |
* | | Floating or variable rate note. Rate is listed as of October 31, 2007. |
‡ | | Non Income Producing |
(1) | | Coupon rate is fixed for a predetermined period of time and then converts to a floating rate until maturity/call date. Rate is listed as of October 31, 2007. |
# | | Aggregate cost for federal income tax purposes is $543,879. Aggregate gross unrealized appreciation for all securities in which there is an excess of value over tax cost and aggregate gross unrealized depreciation for all securities in which there is an excess of tax cost over value were $10,898 and $5,597, respectively. Net unrealized appreciation for tax purposes is $5,301. |
DEFINITIONS:
144A 144A Securities are registered pursuant to Rule 144A of the Securities Act of 1933. These securities are deemed to be liquid for purposes of compliance limitations on holdings of illiquid securities and may be resold as transactions exempt from registration, normally to qualified institutional buyers. At October 31, 2007, these securities aggregated $43,759 or 8.98% of net assets of the Fund.
BRL Brazilian Real
CAD Canadian Dollar
COP Colombian Peso
ISK Icelandic Krona
JPY Japanese Yen
KRW Korean Won
MXN Mexican Peso
MYR Malaysian Ringgit
SGD Singapore Dollar
ZAR South African Rand
The notes to the financial statements are an integral part of this report.
68
| | Percentage of | | | |
(unaudited) | | Total Investments | | Value | |
INVESTMENTS BY INDUSTRY: | | | | | |
U.S. Government Obligation | | 9.4 | % | $ | 51,766 | |
Oil, Gas & Consumable Fuels | | 7.3 | % | 39,878 | |
Sovereign Government Obligation | | 6.8 | % | 37,278 | |
Media | | 6.3 | % | 34,436 | |
Diversified Telecommunication Services | | 5.7 | % | 31,549 | |
Commercial Banks | | 4.1 | % | 22,563 | |
Airlines | | 3.7 | % | 20,322 | |
Consumer Finance | | 3.0 | % | 16,546 | |
Multiline Retail | | 2.6 | % | 14,409 | |
Hotels, Restaurants & Leisure | | 2.6 | % | 14,110 | |
Diversified Financial Services | | 2.5 | % | 13,851 | |
Health Care Providers & Services | | 2.5 | % | 13,530 | |
Communications Equipment | | 2.3 | % | 12,336 | |
Household Durables | | 2.0 | % | 10,728 | |
Pharmaceuticals | | 1.8 | % | 9,962 | |
Real Estate Investment Trusts | | 1.8 | % | 9,626 | |
Specialty Retail | | 1.7 | % | 9,409 | |
Metals & Mining | | 1.7 | % | 9,336 | |
Paper & Forest Products | | 1.7 | % | 9,209 | |
Wireless Telecommunication Services | | 1.6 | % | 9,018 | |
Building Products | | 1.5 | % | 8,390 | |
Electric Utilities | | 1.4 | % | 7,838 | |
Road & Rail | | 1.3 | % | 7,034 | |
Automobiles | | 1.1 | % | 6,203 | |
Capital Markets | | 1.1 | % | 5,754 | |
Biotechnology | | 1.0 | % | 5,726 | |
Machinery | | 1.0 | % | 5,686 | |
Food & Staples Retailing | | 1.0 | % | 5,558 | |
Independent Power Producers & Energy Traders | | 1.0 | % | 5,277 | |
U.S. Government Agency Obligation | | 0.9 | % | 5,009 | |
Leisure Equipment & Products | | 0.9 | % | 4,703 | |
Beverages | | 0.8 | % | 4,251 | |
Insurance | | 0.7 | % | 3,874 | |
IT Services | | 0.7 | % | 3,701 | |
Water Utilities | | 0.7 | % | 3,607 | |
Aerospace & Defense | | 0.6 | % | 3,428 | |
Food Products | | 0.5 | % | 2,999 | |
Electronic Equipment & Instruments | | 0.5 | % | 2,541 | |
Energy Equipment & Services | | 0.4 | % | 2,355 | |
Chemicals | | 0.3 | % | 1,817 | |
Health Care Equipment & Supplies | | 0.3 | % | 1,713 | |
Thrifts & Mortgage Finance | | 0.3 | % | 1,658 | |
Life Sciences Tools & Services | | 0.3 | % | 1,568 | |
Containers & Packaging | | 0.3 | % | 1,443 | |
Tobacco | | 0.2 | % | 1,305 | |
Semiconductors & Semiconductor Equipment | | 0.1 | % | 701 | |
Software | | 0.1 | % | 661 | |
Multi-Utilities | | 0.1 | % | 514 | |
Commercial Services & Supplies | | 0.1 | % | 507 | |
Investment Securities, at value | | 90.3 | % | 495,683 | |
Short-Term Investments | | 9.7 | % | 53,498 | |
Total Investments | | 100.0 | % | $ | 549,181 | |
The notes to the financial statements are an integral part of this report.
69
TA IDEX Marsico International Growth
MARKET ENVIRONMENT
International equity performance in developed markets was solid during the fiscal year ending October 31, 2007. The portfolio’s benchmark, Morgan Stanley Capital International EAFE Index (“MSCI-EAFE”), posted a return of 25.43% for the reporting period.
Within the EAFE Index, economic sector strength was widespread. All ten Global Industry Classification Standards Classifications (“GICS”) sectors in the MSCI-EAFE posted gains, led by materials, telecommunication services, industrials, and utilities. At an industry level, results were also strong. All but one industry group had a positive return. The top-performing areas included software and services, capital goods, food beverage and tobacco, and automobiles and components.
Currency fluctuations were quite significant throughout the fiscal year. For the reporting period as a whole, the dollar weakened, as demonstrated by the MSCI-EAFE’s total twelve-month return of (US$) 25.43% and comparing it to the MSCI-EAFE “local” return of 14.47%.
PERFORMANCE
For the year ended October 31, 2007, TA IDEX Marsico International Growth, Class I returned 38.11%. By comparison its benchmark, the MSCI-EAFE, returned 25.43%. For the year ended October 31, 2007, the net expense ratio of the Fund was 1.13%.
STRATEGY REVIEW
During the reporting period, the portfolio’s average sector allocations emphasized the consumer discretionary and financials sectors. The portfolio invested in every GICS economic sector during the twelve-month period, with the utilities and energy sectors averaging an underweighted posture relative to the portfolio’s benchmark, the MSCI- EAFE.
The portfolio outperformed the MSCI-EAFE for the period. The areas of investment that was the largest positive contributor to the portfolio’s twelve-month performance were the financials and energy sectors. Positions in Brazilian bank Unibanco-Uniao De Bancos Brasileiros S/A (US$ +106%), India-headquartered ICICI Bank Limited (US$ +98%), China’s Industrial and Commercial Bank of China (US$ +17% prior to being sold), and diversified financials companies Macquarie Bank Limited (US$ +40%) and Man Group plc (US$ +33%), were among the portfolio’s largest positive individual contributors in the period. The portfolio also benefited by maintaining an underweighted posture, on average, in the financials sector. Energy holdings CNOOC Limited (US$ +141%) and PETROLEO BRASILEIRO S.A. - PETROBRAS (US$ +71%) were strong performers, and an underweighted posture in the sector also aided performance. In addition, telecommunication services companies China Mobile Limited (US$ +149%) and America Movil, S.A. de C.V. (US$ +53%) were among the top individual contributors to performance for the period.
Although active currency management is not a central facet of the portfolio’s investment process, currency fluctuations may at times affect the portfolio’s performance positively or negatively. For the one-year fiscal period, currency fluctuations had a material adverse affect on performance results. On average, the portfolio had more exposure to securities economically tied to the US than did the MSCI-EAFE during the fiscal year. This positioning presented a currency “cost” to the portfolio, as the US dollar weakened in the quarter relative to many other world currencies such as the euro. The portfolio generally had less exposure to companies whose securities are priced in euros and traded in countries that utilize the euro; therefore a smaller portion of the portfolio, compared with its benchmark index, benefited from the euro’s valuation increase.
Several of the portfolio’s Japanese positions negatively impacted performance. Chugai Pharmaceutical Co., Ltd. (“Chugai”) (US$ -27% prior to being sold), finance company Mitsui Trust Holdings, Inc. (US$ -32%) and amusement game manufacturer Sega Sammy Holdings Inc. (“Sega Sammy”) (US$ -11% prior to being sold) were among the portfolio’s weakest-performing individual positions (Chugai and Sega Sammy were sold prior to October 31, 2007).
The portfolio’s largest country-level allocations were in Switzerland, Japan, United Kingdom and France. Country allocation, on balance, contributed positively to the portfolio’s investment results. That was primarily due to the fact that the portfolio had investments in several countries — including Canada, Brazil, and India — that performed well. That said, we should note that country weightings typically are a residual of the portfolio’s bottom-up stock selection process.
James G. Gendelman
Fund Manager
Columbia Management Advisors, LLC
70
(unaudited)
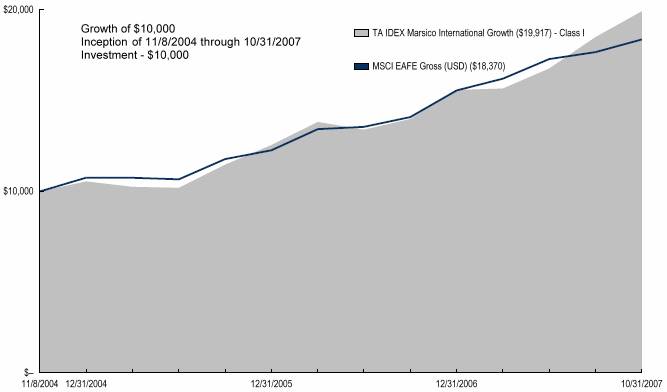
Average Annual Total Return for Periods Ended 10/31/2007
| | | | From | | Inception | |
| | 1 Year | | Inception | | Date | |
Class A (NAV) | | — | % | — | % | 11/8/04 | |
Class I (NAV) | | 38.11 | % | 26.00 | % | 11/8/04 | |
MSCI EAFE (USD) (1) | | 25.43 | % | 22.62 | % | 11/8/04 | |
NOTES
(1) The Morgan Stanley Capital International-Europe, Australasia, and Far East (MSCI-EAFE) Index is an unmanaged index used as a general measure of market performance. Calculations assume dividends and capital gains are reinvested and do not include any managerial expenses. From inception calculation is based on life of the Fund.
The performance data presented represents past performance, future results may vary. Performance data does not reflect the deduction of taxes that would be paid on fund distributions or the redemption of fund shares. Investment return and principal value will fluctuate so that an investor’s shares, when redeemed, may be worth more or less than their original cost. Current performance may be lower or higher than performance quoted. Please see www.transamericaidex.com for performance data current to the most recent month-end.
Net Asset Value (NAV) returns include the reinvestment of dividends and capital gains. Fund shares are sold without a sales load.
International investing involves special risks including currency fluctuations, political instability, and different financial accounting standards.
This material must be preceded or accompanied by a current prospectus, which includes specific contents regarding the investment objectives and policies of this fund.
This fund is only available in Class I shares, which are not available for direct investment by the public.
71
UNDERSTANDING YOUR FUND’S EXPENSES
(unaudited)
SHAREHOLDER EXPENSES
Fund shareholders may incur two types of costs: (1) transaction costs, including sales charges (loads) on purchases, contingent deferred sales charges on redemptions and redemption fees; and (2) ongoing costs, including management fees, dividend expense on short-sales, and other fund expenses.
The following Example is intended to help you understand your ongoing costs (in dollars and cents) of investing in the Fund and to compare these costs with the ongoing costs of investing in other funds.
The Example is based on an investment of $1,000 invested at May 1, 2007 and held for the entire period until October 31, 2007
ACTUAL EXPENSES
The first line in the table below provides information about actual account values and actual expenses. You may use the information in this line, together with the amount you invested, to estimate the expenses that you paid over the period. Simply divide your account value by $1,000 (for example, an $8,600 account value divided by $1,000 = 8.6), then multiply the result by the number in the first line of your Fund under the heading entitled “Expenses Paid During Period” to estimate the expenses you paid on your account during this period.
HYPOTHETICAL EXAMPLE FOR COMPARISON PURPOSES
The second line in the table below provides information about hypothetical account values and hypothetical expenses based on the Fund’s actual expense ratio and an assumed rate of return of 5% per year before expenses, which is not the Fund’s actual return. The hypothetical account values and expenses may not be used to estimate the actual ending account balance or expenses you paid for the period. You may use this information to compare the ongoing costs of investing in your Fund and other funds. To do so, compare this 5% hypothetical example with the 5% hypothetical examples that appear in the shareholder reports of the other funds.
Please note that the expenses shown in the table are meant to highlight your ongoing costs only and do not reflect any transactional costs, such as sales charges, redemption fees, brokerage commissions paid on purchases and sales of fund shares. Therefore, the second line under the Fund in the table is useful in comparing ongoing costs only, and will not help you determine the relative total costs of owning different funds. If any of these transaction costs were included, your costs would be higher. The expenses shown in the table do not reflect any fees that may be charged to you by brokers, financial intermediaries or other financial institutions.
| | Beginning | | Ending | | Annualized | | Expenses | |
| | Account | | Account | | Expense | | Paid During | |
| | Value | | Value | | Ratio | | Period (a) | |
Class I | | | | | | | | | |
Actual | | $ | 1,000.00 | | $ | 1,216.47 | | 1.13 | % | $ | 6.30 | |
Hypothetical (b) | | 1,000.00 | | 1,019.46 | | 1.13 | | 5.74 | |
| | | | | | | | | | | | |
(a) Expenses are calculated using the Fund’s annualized expense ratio (as disclosed in the table), multiplied by the average account value for the period, multiplied by the number of days in the period (184 days), and divided by the number of days in the year (365 days).
(b) 5% return per year before expenses.
GRAPHICAL PRESENTATION OF SCHEDULE OF INVESTMENTS
By Region
At October 31, 2007
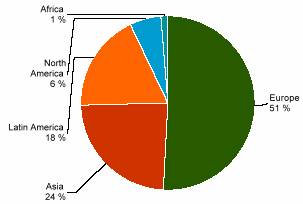
This chart shows the percentage breakdown by region of the Fund’s total investment securities
72
SCHEDULE OF INVESTMENTS
At October 31, 2007
(all amounts except share amounts in thousands)
| | | | Shares | | Value | |
CONVERTIBLE PREFERRED STOCKS (0.6%) | | | | | | | |
Brazil (0.6%) | | | | | | | |
All America Latina Logistica SA | | | | 233,751 | | $ | 3,681 | |
COMMON STOCKS (95.3%) | | | | | | | |
Australia (2.0%) | | | | | | | |
CSL Limited ‡ | | | | 192,780 | | 6,521 | |
Macquarie Bank, Ltd. | | | | 79,304 | | 6,177 | |
Austria (1.0%) | | | | | | | |
Erste Bank DER Oesterreichischen | | | | 76,214 | | 6,175 | |
Bermuda (2.1%) | | | | | | | |
Esprit Holdings, Ltd. | | | | 409,000 | | 6,754 | |
Shangri-La Asia, Ltd. | | | | 2,042,000 | | 6,481 | |
Brazil (8.5%) | | | | | | | |
Bovespa Holding SA ‡ | | | | 507,700 | | 9,616 | |
Gafisa SA | | | | 306,927 | | 5,487 | |
Jhsf Participacoes SA ‡ | | | | 563,900 | | 2,804 | |
Petroleo Brasileiro SA ^ | | | | 145,029 | | 13,869 | |
Redecard SA ‡ | | | | 213,000 | | 4,481 | |
Unibanco - Uniao de Bancos Brasileiros SA ‡ | | | | 107,883 | | 17,050 | |
Canada (3.6%) | | | | | | | |
Potash Corp. of Saskatchewan | | | | 91,698 | | 11,262 | |
Research In Motion, Ltd. ‡ | | | | 92,287 | | 11,491 | |
Cayman Islands (1.7%) | | | | | | | |
Alibaba.Com, Ltd. ‡ @ | | | | 328,240 | | 572 | |
Baidu.Com ‡^ | | | | 15,530 | | 5,940 | |
Melco PBL Entertainment Macau, Ltd. ‡^ | | | | 261,680 | | 4,160 | |
France (11.8%) | | | | | | | |
Accor SA | | | | 129,714 | | 12,361 | |
Alstom | | | | 27,666 | | 6,520 | |
Compagnie Generale de Geophysi ‡ | | | | 17,896 | | 5,855 | |
Electricite de France | | | | 115,598 | | 13,846 | |
JC Decaux SA | | | | 253,290 | | 9,319 | |
PPR SA | | | | 57,656 | | 11,413 | |
Veolia Environnement | | | | 165,720 | | 14,781 | |
Germany (8.4%) | | | | | | | |
Continental AG | | | | 165,531 | | 24,999 | |
Daimler AG | | | | 184,148 | | 20,234 | |
Gea Group AG ‡ | | | | 116,644 | | 4,371 | |
Mtu Aero Engines Holding AG | | | | 51,121 | | 3,117 | |
Hong Kong (5.5%) | | | | | | | |
China Merchants Holdings International | | | | 980,000 | | 6,841 | |
China Mobile, Ltd. | | | | 907,500 | | 18,382 | |
CNOOC, Ltd. | | | | 4,308,000 | | 8,982 | |
India (2.0%) | | | | | | | |
ICICI Bank, Ltd. | | | | 178,853 | | 12,420 | |
Japan (9.5%) | | | | | | | |
Chuo Mitsui Trust Holdings, Inc. | | | | 708,000 | | 5,619 | |
Daikin Industries, Ltd. | | | | 117,029 | | 5,867 | |
Fujitsu, Ltd. | | | | 380,000 | | 2,967 | |
Marubeni Corp. | | | | 1,050,000 | | 8,908 | |
Mitsui O.S.K. Lines, Ltd. | | | | 179,000 | | 2,925 | |
Nintendo Co., Ltd. | | | | 31,900 | | 19,895 | |
Nomura Holdings, Inc. | | | | 175,400 | | $ | 3,119 | |
Toyota Motor Corp. | | | | 79,000 | | 4,502 | |
Yamada Denki Co., Ltd. | | | | 59,100 | | 6,049 | |
Korea, Republic of (1.4%) | | | | | | | |
Samsung Electronics Co., Ltd. | | | | 14,750 | | 9,007 | |
Mexico (3.2%) | | | | | | | |
America Movil SAB de CV Series R, Class R | | | | 131,213 | | 8,580 | |
Grupo Televisa SA ^ | | | | 454,153 | | 11,286 | |
Netherlands (2.0%) | | | | | | | |
Arcelor Mittal | | | | 79,318 | | 6,355 | |
Heineken NV | | | | 91,127 | | 6,368 | |
Netherlands Antilles (1.5%) | | | | | | | |
Schlumberger, Ltd. | | | | 96,905 | | 9,358 | |
Singapore (1.7%) | | | | | | | |
Capitaland, Ltd. | | | | 1,947,000 | | 10,818 | |
South Africa (1.2%) | | | | | | | |
MTN Group, Ltd. | | | | 401,835 | | 7,758 | |
Switzerland (14.1%) | | | | | | | |
ABB, Ltd. | | | | 439,203 | | 13,202 | |
Actelion, Ltd. ‡ | | | | 130,585 | | 6,484 | |
Holcim, Ltd. | | | | 184,239 | | 20,982 | |
Julius Baer Holding AG | | | | 139,033 | | 12,020 | |
Keuhne & Nagel International | | | | 28,026 | | 3,003 | |
Lonza Group AG | | | | 96,170 | | 11,193 | |
Nestle SA | | | | 27,578 | | 12,718 | |
Roche Holding AG | | | | 51,560 | | 8,790 | |
Taiwan (0.7%) | | | | | | | |
HON HAI Precision Industry Co., Ltd. | | | | 526,000 | | 3,994 | |
United Kingdom (11.4%) | | | | | | | |
British Sky Broadcasting Group PLC | | | | 1,162,312 | | 16,431 | |
Johnson Matthey PLC | | | | 88,708 | | 3,289 | |
Man Group PLC | | | | 813,358 | | 9,935 | |
Reckitt Benckiser Group PLC ‡ | | | | 114,275 | | 6,621 | |
Rio Tinto PLC | | | | 105,306 | | 9,822 | |
Tesco PLC | | | | 2,523,634 | | 25,583 | |
United States (2.0%) | | | | | | | |
Las Vegas Sands Corp. ‡ | | | | 91,753 | | 12,177 | |
Total Common Stocks (cost $453,055) | | | | | | 597,906 | |
| | | | | | | |
Total Security Lending Collateral (cost $14,624) | | | | | | 14,624 | |
Total Investment Securities (cost $471,052) # | | | | | | $ | 616,211 | |
The notes to the financial statements are an integral part of this report.
73
NOTES TO SCHEDULE OF INVESTMENTS
q Value is less than $1
^ At October 31, 2007, all or a portion of this security is on loan (see Note 1). The value at October 31, 2007, of all securities on loan is $14,046.
@ Securities valued as determined in good faith in accordance with procedures established by the Fund’s Board of Trustees.
‡ Non Income Producing
# Aggregate cost for federal income tax purposes is $472,113. Aggregate gross unrealized appreciation for all securities in which there is an excess of value over tax cost and aggregate gross unrealized depreciation for all securities in which there is an excess of tax cost over value were $148,033 and $3,935, respectively. Net unrealized appreciation for tax purposes is $144,098.
DEFINITIONS
144A 144A Securities are registered pursuant to Rule 144A of the Securities Act of 1933. These securities are deemed to be liquid for purposes of compliance limitations on holdings of illiquid securities and may be resold as transactions exempt from registration, normally to qualified institutional buyers. At October 31, 2007, these securities aggregated $10,680 or 0.02% or net assets of the Fund.
FORWARD FOREIGN CURRENCY CONTRACTS:
| | | | | | Amount in | | Net Unrealized | |
| | Bought | | Settlement | | U.S. Dollars | | Appreciation | |
Currency | | (Sold) | | Date | | Bought(Sold) | | (Depreciation) | |
Euro Dollar | | 2,570 | | 11/06/2007 | | $ | 3,708 | | $ | 11 | |
Hong Kong Dollar | | 4,476 | | 11/06/2007 | | 578 | | (1 | ) |
South African Rand | | 5,023 | | 11/02/2007 | | 772 | | (3 | ) |
South African Rand | | 1,845 | | 11/05/2007 | | 281 | | q | |
| | | | | | $ | 5,339 | | $ | 7 | |
| | Percentage of | | | |
(unaudited) | | Total Investments | | Value | |
INVESTMENTS BY INDUSTRY: | | | | | |
Commercial Banks | | 6.7 | % | $ | 41,263 | |
Media | | 6.0 | % | 37,035 | |
Hotels, Restaurants & Leisure | | 5.7 | % | 35,180 | |
Wireless Telecommunication Services | | 5.6 | % | 34,720 | |
Capital Markets | | 5.1 | % | 31,251 | |
Chemicals | | 4.2 | % | 25,745 | |
Food & Staples Retailing | | 4.1 | % | 25,583 | |
Auto Components | | 4.1 | % | 24,999 | |
Automobiles | | 4.0 | % | 24,736 | |
Oil, Gas & Consumable Fuels | | 3.7 | % | 22,851 | |
Construction Materials | | 3.4 | % | 20,982 | |
Software | | 3.2 | % | 19,895 | |
Electrical Equipment | | 3.2 | % | 19,722 | |
Metals & Mining | | 2.6 | % | 16,177 | |
Energy Equipment & Services | | 2.5 | % | 15,213 | |
Multi-Utilities | | 2.4 | % | 14,781 | |
Electric Utilities | | 2.2 | % | 13,846 | |
Real Estate Management & Development | | 2.2 | % | 13,622 | |
Biotechnology | | 2.1 | % | 13,005 | |
Specialty Retail | | 2.1 | % | 12,804 | |
Food Products | | 2.1 | % | 12,718 | |
Communications Equipment | | 1.9 | % | 11,491 | |
Multiline Retail | | 1.8 | % | 11,413 | |
Diversified Financial Services | | 1.6 | % | $ | 9,616 | |
Semiconductors & Semiconductor Equipment | | 1.5 | % | 9,007 | |
Trading Companies & Distributors | | 1.4 | % | 8,907 | |
Pharmaceuticals | | 1.4 | % | 8,790 | |
Transportation Infrastructure | | 1.1 | % | 6,840 | |
The notes to the financial statements are an integral part of this report.
74
| | Percentage of | | | |
(unaudited) | | Total Investments | | Value | |
INVESTMENTS BY INDUSTRY (continued): | | | | | |
Household Products | | 1.1 | % | 6,621 | |
Beverages | | 1.0 | % | 6,368 | |
Internet Software & Services | | 1.0 | % | 5,940 | |
Marine | | 1.0 | % | 5,928 | |
Building Products | | 1.0 | % | 5,867 | |
Household Durables | | 0.9 | % | 5,487 | |
IT Services | | 0.7 | % | 4,481 | |
Machinery | | 0.7 | % | 4,371 | |
Electronic Equipment & Instruments | | 0.6 | % | 3,994 | |
Road & Rail | | 0.6 | % | 3,682 | |
Aerospace & Defense | | 0.5 | % | 3,117 | |
Computers & Peripherals | | 0.5 | % | 2,967 | |
Internet & Catalog Retail | | 0.1 | % | 572 | |
Investment Securities, at value | | 97.6 | % | 601,587 | |
Short-Term Investments | | 2.4 | % | 14,624 | |
Total Investments | | 100.0 | % | $ | 616,211 | |
| | | | | | |
The notes to the financial statements are an integral part of this report.
75
TA IDEX Mellon Market Neutral Strategy
MARKET ENVIRONMENT
Through October, U.S. markets had positive returns in all capitalization ranges, despite concerns about the sub-prime mortgage collapse, rising energy prices, and declining consumer confidence. Continued momentum in the markets was primarily driven by the Federal Reserve Board easing rates over the period; and a sense that even if double-digit corporate earnings increases would fall off a bit, overall earnings would hold up due to growth outside the U.S. combined with a tailwind from the falling dollar helping U.S. exports.
Growth is ahead of value by most metrics, as year to date, January through October, the Russell 1000 Growth Index is up 16.51%, versus the Russell 1000 Value index return of 5.98%. At the same time, large cap indexes have outperformed small cap this year as the Russell 1000 Index returned 11.21% through October, versus the small cap Russell 2000 Index return of 6.12%.
PERFORMANCE
For the period from inception December 27, 2006 through October 31, 2007, TA IDEX Mellon Market Neutral Strategy, Class I returned (2.20)%. By comparison its benchmark, the Merrill Lynch 3-Month T-Bill +3 Index, returned 6.82%. For the year ended October 31, 2007, the net expense ratio of the Fund was 3.05%.
STRATEGY REVIEW
The Franklin Portfolio Associates’ Market Neutral strategy is a long/short stock selection strategy based on our quantitative implementation of fundamental and technical valuation concepts. Our daily investment process combines approximately 45 factors, or characteristics, including value-based metrics (based on income statement, balance sheet, and future value characteristics), growth/momentum metrics (based on earnings momentum, longer term growth and sustainability, and technical price action characteristics), and factors based on corporate and management stock buying/selling activity. We blend these measures into a single composite rank for each stock using a dynamic weighting scheme that reflects the overall success, consistency, and independence of each factor; and keeping a balanced overall weighting between value and growth/momentum based factors. Then we construct long and short portfolios that are carefully controlled along several dimensions of risk. These include the requirement that the net of the long and short portfolios always be near neutral in terms of beta, sector/industry exposure, and capitalization, among other risk factors. Subject to these risk constraints, the target portfolio consists of long positions in the most attractive stocks and short positions in the least attractive stocks, with controlled tilts toward the more attractive portfolio-level characteristics.
The portfolio underperformed its benchmark from inception through October 31, 2007. Underperformance was attributable mainly to stock selection. Specifically, the market has failed to reward the value-based components of our stock ranking model so far this year. Each of the three primary groups of value factors noted above (income statement, balance sheet, and future value characteristics) detracted significantly from performance. While growth/momentum factors in the model generally added value, these were not sufficient to generate overall positive returns.
We do not make tactical changes in the implementation of the strategy based on market conditions, and continued to maintain an even blend of value and growth/momentum factors despite the recent underperformance of the value components of the process. We do monitor and control risk exposures that develop in the market. For example, during this period we did carefully control our exposure to companies impacted by the sub-prime crisis and residential construction collapse, so these events did not contribute to the sub-par performance. Also, by maintaining our standard process in August, we were able to produce slight out-performance despite the liquidity problems experienced by some quantitative strategies in the month.
The most successful stock selections among long holdings were computer and music player maker Apple Inc., insurer Ohio Casualty Corporation (which was acquired by Liberty Mutual Holding Company Inc. during the period), and mining company Massey Energy Company. On the short side, the strongest stock selections were clothing retailer Coldwater Creek Inc., Starbucks Corporation, and mortgage insurer MGIC Investment Corporation.
Holdings including managed health care provider WellCare Health Plans, Inc., pharmaceutical maker Forest Laboratories, and storage technology firm Network Appliance Inc. were the most significant long detractors to stock selection performance. Short holdings which detracted most from stock selection performance were engineering and construction services provider The Shaw Group Inc., packaging manufacturer Owens-Illinois, Inc., and fertilizer maker The Mosaic Company.
Our investment process seeks to minimize the impact of sector/industry weightings on the performance of the portfolio by maintaining approximately equal weightings of long and short positions in each sector and industry. Nevertheless, slight net long and short sector/industry positions, such as our net long position in the industrials sector, did have an overall positive impact on performance.
Michael F. Dunn, CFA
Oliver E. Buckley, CIO
John S. Cone, CEO
Co-Portfolio Managers
Franklin Portfolio Associates, LLC
76
(unaudited)

Average Annual Total Return for Period Ended 10/31/2007
| | From Inception | | Inception Date | |
Class I (NAV) | | (2.20 | )% | 1/3/07 | |
M L 3 Month T Bill (1) | | 6.82 | % | 1/3/07 | |
NOTES
(1) The Merrill Lynch 3 Month Treasury Bill (ML 3) Index is an unmanaged index used as a general measure of market performance. Calculations assume dividends and capital gains are reinvested and do not include any managerial expenses. From inception calculation is based on life of the Fund.
The performance data presented represents past performance, future results may vary. Performance data does not reflect the deduction of taxes that would be paid on fund distributions nor the redemption of fund shares. Investment return and principal value will fluctuate so that an investor’s shares, when redeemed, may be worth more or less than their original cost. Current performance may be lower or higher than performance quoted. Please see www.transamericaidex.com for performance data current to the most recent month-end.
Net Asset Value (NAV) returns include the reinvestment of dividends and capital gains. Fund shares are sold without a sales load.
This material must be preceded or accompanied by a current prospectus, which includes specific contents regarding the investment objectives and policies of this fund.
This fund is only available in Class I shares, which are not available for direct investment by the public.
77
UNDERSTANDING YOUR FUND’S EXPENSES
(unaudited)
SHAREHOLDER EXPENSES
Fund shareholders may incur two types of costs: (1) transaction costs, including sales charges (loads) on purchases, contingent deferred sales charges on redemptions and redemption fees; and (2) ongoing costs, including management fees, dividend expense on short-sales, and other fund expenses.
The following Example is intended to help you understand your ongoing costs (in dollars and cents) of investing in the Fund and to compare these costs with the ongoing costs of investing in other funds.
The Example is based on an investment of $1,000 invested at May 1, 2007 and held for the entire period until October 31, 2007.
ACTUAL EXPENSES
The first line in the table below provides information about actual account values and actual expenses. You may use the information in this line, together with the amount you invested, to estimate the expenses that you paid over the period. Simply divide your account value by $1,000 (for example, an $8,600 account value divided by $1,000 = 8.6), then multiply the result by the number in the first line of your Fund under the heading entitled “Expenses Paid During Period” to estimate the expenses you paid on your account during this period.
HYPOTHETICAL EXAMPLE FOR COMPARISON PURPOSES
The second line in the table below provides information about hypothetical account values and hypothetical expenses based on the Fund’s actual expense ratio and an assumed rate of return of 5% per year before expenses, which is not the Fund’s actual return. The hypothetical account values and expenses may not be used to estimate the actual ending account balance or expenses you paid for the period. You may use this information to compare the ongoing costs of investing in your Fund and other funds. To do so, compare this 5% hypothetical example with the 5% hypothetical examples that appear in the shareholder reports of the other funds.
Please note that the expenses shown in the table are meant to highlight your ongoing costs only and do not reflect any transactional costs, such as sales charges, redemption fees, brokerage commissions paid on purchases and sales of fund shares. Therefore, the second line under the Fund in the table is useful in comparing ongoing costs only, and will not help you determine the relative total costs of owning different funds. If any of these transaction costs were included, your costs would be higher. The expenses shown in the table do not reflect any fees that may be charged to you by brokers, financial intermediaries or other financial institutions.
| | Beginning | | Ending | | Annualized | | Expenses | |
| | Account | | Account | | Expense | | Paid During | |
| | Value | | Value | | Ratio | | Period (a) | |
Class I | | | | | | | | | |
Actual | | $ | 1,000.00 | | $ | 969.28 | | 2.75 | % | $ | 13.65 | |
Hypothetical (b) | | 1,000.00 | | 1,017.95 | | 2.75 | | 13.99 | |
| | | | | | | | | | | | |
(a) Expenses are calculated using the Fund’s annualized expense ratio (as disclosed in the table), multiplied by the average account value for the period, multiplied by the number of days in the period (184 days), and divided by the number of days in the year (365 days).
(b) 5% return per year before expenses.
GRAPHICAL PRESENTATION OF SCHEDULE OF INVESTMENTS
By Sector
At October 31, 2007
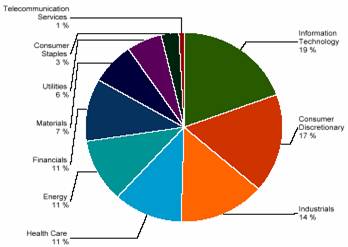
This chart shows the percentage breakdown by sector of the Fund’s total investment securities
78
SCHEDULE OF INVESTMENTS
At October 31, 2007
(all amounts except share amounts in thousands)
| | Shares | | Value | |
COMMON STOCKS (95.2%) | | | | | |
Aerospace & Defense (1.6%) | | | | | |
Boeing Co. | | 8,000 | | $ | 789 | |
Lockheed Martin Corp. | | 8,900 | | 979 | |
Airlines (1.2%) | | | | | |
AMR Corp. ‡ | | 24,000 | | 576 | |
Continental Airlines, Inc. Class A ‡ | | 23,900 | | 821 | |
Auto Components (0.3%) | | | | | |
Goodyear Tire & Rubber Co. (The) ‡ | | 9,900 | | 298 | |
Automobiles (0.5%) | | | | | |
Harley-Davidson, Inc. | | 10,600 | | 546 | |
Capital Markets (0.2%) | | | | | |
Legg Mason, Inc. | | 2,900 | | 240 | |
Chemicals (2.4%) | | | | | |
Cf Industries Holdings, Inc. | | 3,600 | | 316 | |
Dow Chemical Co. (The) | | 21,600 | | 973 | |
Mosaic Co. (The) ‡ | | 5,200 | | 363 | |
Olin Corp. | | 32,000 | | 729 | |
Terra Industries, Inc. ‡ | | 8,700 | | 321 | |
Commercial Banks (0.5%) | | | | | |
National City Corp. | | 11,600 | | 281 | |
Whitney Holding Corp. | | 12,800 | | 329 | |
Commercial Services & Supplies (5.2%) | | | | | |
Allied Waste Industries, Inc. ‡ | | 99,300 | | 1,255 | |
Dun & Bradstreet Corp. | | 7,400 | | 717 | |
HNI Corp. | | 37,500 | | 1,626 | |
Manpower, Inc. | | 22,000 | | 1,644 | |
Steelcase, Inc. Class A | | 33,700 | | 602 | |
Communications Equipment (3.1%) | | | | | |
ADC Telecommunications, Inc. ‡ | | 60,500 | | 1,132 | |
Ciena Corp. ‡ | | 23,800 | | 1,139 | |
Harris Corp. | | 11,200 | | 678 | |
Qualcomm, Inc. | | 13,600 | | 581 | |
Computers & Peripherals (2.3%) | | | | | |
Apple, Inc. ‡ | | 8,200 | | 1,557 | |
Dell, Inc. ‡ | | 21,800 | | 667 | |
Network Appliance, Inc. ‡ | | 10,600 | | 334 | |
Construction Materials (0.5%) | | | | | |
Eagle Materials, Inc. | | 13,100 | | 518 | |
Consumer Finance (0.4%) | | | | | |
AmeriCredit Corp. ‡ | | 33,400 | | 471 | |
Containers & Packaging (1.7%) | | | | | |
Crown Holdings, Inc. ‡ | | 28,100 | | 697 | |
Packaging Corp. of America | | 20,700 | | 659 | |
Pactiv Corp. ‡ | | 8,800 | | 242 | |
Sealed Air Corp. | | 13,800 | | 344 | |
Diversified Consumer Services (0.9%) | | | | | |
Sotheby’s | | 19,300 | | 1,045 | |
Diversified Financial Services (0.8%) | | | | | |
CIT Group, Inc. | | 14,600 | | 515 | |
Citigroup, Inc. | | 9,600 | | 402 | |
Diversified Telecommunication Services (0.8%) | | | | | |
CenturyTel, Inc. | | 5,100 | | 225 | |
Qwest Communications International, Inc. ‡ | | 93,100 | | $ | 668 | |
Electric Utilities (3.6%) | | | | | |
CMS Energy Corp. | | 32,900 | | 558 | |
Duke Energy Corp. | | 30,200 | | 579 | |
PG&E Corp. | | 11,800 | | 578 | |
Puget Energy, Inc. | | 9,700 | | 274 | |
Sempra Energy | | 4,200 | | 258 | |
Sierra Pacific Resources | | 78,000 | | 1,316 | |
Wisconsin Energy Corp. | | 9,400 | | 450 | |
Electrical Equipment (0.9%) | | | | | |
Hubbell, Inc. Class B | | 8,100 | | 446 | |
Thomas & Betts Corp. ‡ | | 10,500 | | 588 | |
Electronic Equipment & Instruments (4.3%) | | | | | |
Arrow Electronics, Inc. ‡ | | 8,400 | | 336 | |
Avnet, Inc. ‡ | | 45,500 | | 1,898 | |
AVX Corp. | | 19,000 | | 294 | |
Dolby Laboratories, Inc. Class A ‡ | | 9,000 | | 373 | |
Ingram Micro, Inc. Class A ‡ | | 25,900 | | 550 | |
Tech Data Corp. ‡ | | 23,500 | | 924 | |
Teleflex, Inc. ‡ | | 6,000 | | 439 | |
Energy Equipment & Services (4.2%) | | | | | |
Ensco International, Inc. | | 7,700 | | 427 | |
Global Industries, Ltd. ‡ | | 78,900 | | 1,942 | |
Helmerich & Payne, Inc. | | 7,700 | | 243 | |
National Oilwell Varco, Inc. ‡ | | 25,200 | | 1,846 | |
Superior Energy Services, Inc. ‡ | | 7,000 | | 260 | |
Food & Staples Retailing (2.0%) | | | | | |
Kroger Co. (The) | | 18,000 | | 529 | |
Safeway, Inc. | | 24,500 | | 833 | |
Supervalu, Inc. | | 8,800 | | 341 | |
SYSCO Corp. | | 16,500 | | 566 | |
Gas Utilities (0.9%) | | | | | |
Energen Corp. | | 7,800 | | 499 | |
Southern Union Co. | | 7,500 | | 236 | |
UGI Corp. | | 9,800 | | 261 | |
Health Care Equipment & Supplies (1.8%) | | | | | |
Intuitive Surgical, Inc. ‡ | | 2,100 | | 687 | |
Kinetic Concepts, Inc. ‡ | | 13,800 | | 829 | |
Zimmer Holdings, Inc. ‡ | | 7,100 | | 493 | |
Health Care Providers & Services (6.0%) | | | | | |
AmerisourceBergen Corp. Class A | | 27,700 | | 1,305 | |
Apria Healthcare Group, Inc. ‡ | | 43,500 | | 1,051 | |
LifePoint Hospitals, Inc. ‡ | | 14,400 | | 440 | |
Lincare Holdings, Inc. ‡ | | 44,700 | | 1,554 | |
McKesson Corp. | | 6,400 | | 423 | |
Patterson Cos., Inc. ‡ | | 25,400 | | 993 | |
UnitedHealth Group, Inc. | | 20,600 | | 1,013 | |
Health Care Technology (0.8%) | | | | | |
Hlth Corp. ‡ | | 64,900 | | 916 | |
Hotels, Restaurants & Leisure (2.6%) | | | | | |
Bob Evans Farms, Inc. | | 9,700 | | 273 | |
Brinker International, Inc. | | 16,200 | | 411 | |
| | | | | | | |
The notes to the financial statements are an integral part of this report.
79
| | Shares | | Value | |
Hotels, Restaurants & Leisure (continued) | | | | | |
Choice Hotels International, Inc. | | 12,000 | | $ | 465 | |
Regal Entertainment Group Class A ‡ | | 21,800 | | 492 | |
Starwood Hotels & Resorts Worldwide, Inc. | | 4,500 | | 256 | |
Wynn Resorts, Ltd. | | 6,200 | | 1,001 | |
Household Durables (0.6%) | | | | | |
American Greetings Corp. Class A | | 25,600 | | 674 | |
Independent Power Producers & Energy Traders (1.1%) | | | | | |
Mirant Corp. ‡ | | 17,900 | | 758 | |
NRG Energy, Inc. ‡ | | 9,600 | | 439 | |
Industrial Conglomerates (1.4%) | | | | | |
McDermott International, Inc. ‡ | | 26,400 | | 1,612 | |
Insurance (6.5%) | | | | | |
American International Group, Inc. | | 21,000 | | 1,326 | |
Cincinnati Financial Corp. | | 31,600 | | 1,257 | |
HCC Insurance Holdings, Inc. | | 63,500 | | 1,898 | |
Lincoln National Corp. | | 8,700 | | 543 | |
Prudential Financial, Inc. | | 12,100 | | 1,170 | |
Reinsurance Group of America, Inc. | | 4,700 | | 268 | |
SAFECO Corp. | | 14,500 | | 840 | |
Internet & Catalog Retail (0.4%) | | | | | |
NutriSystem, Inc. ‡ | | 15,600 | | 470 | |
IT Services (3.3%) | | | | | |
Accenture, Ltd. Class A | | 18,100 | | 707 | |
Computer Sciences Corp. ‡ | | 4,100 | | 239 | |
Convergys Corp. ‡ | | 48,000 | | 880 | |
Electronic Data Systems Corp. | | 12,600 | | 272 | |
MPS Group, Inc. ‡ | | 39,500 | | 482 | |
Total System Services, Inc. | | 38,900 | | 1,166 | |
Leisure Equipment & Products (1.7%) | | | | | |
Brunswick Corp. | | 25,900 | | 578 | |
Hasbro, Inc. | | 20,200 | | 603 | |
Mattel, Inc. | | 34,600 | | 723 | |
Machinery (1.9%) | | | | | |
Federal Signal Corp. | | 35,800 | | 479 | |
Gardner Denver, Inc. ‡ | | 20,600 | | 744 | |
Manitowoc Co., Inc. (The) | | 13,800 | | 680 | |
Oshkosh Truck Corp. | | 4,900 | | 266 | |
Media (3.6%) | | | | | |
Belo Corp. | | 14,700 | | 272 | |
CBS Corp. Class B | | 24,000 | | 689 | |
Gannett Co., Inc. | | 11,000 | | 467 | |
Meredith Corp. | | 19,700 | | 1,226 | |
Time Warner, Inc. | | 21,100 | | 385 | |
Viacom, Inc. Class B ‡ | | 23,200 | | 958 | |
Metals & Mining (1.6%) | | | | | |
AK Steel Holding Corp. ‡ | | 27,200 | | 1,364 | |
Titanium Metals Corp. ‡ | | 12,400 | | 436 | |
Multiline Retail (2.4%) | | | | | |
Big Lots, Inc. ‡ | | 35,500 | | 851 | |
Family Dollar Stores, Inc. | | 53,000 | | 1,344 | |
Kohl’s Corp. ‡ | | 9,600 | | 528 | |
Office Electronics (1.1%) | | | | | |
Xerox Corp. ‡ | | 21,600 | | $ | 377 | |
Zebra Technologies Corp. Class A ‡ | | 22,500 | | 879 | |
Oil, Gas & Consumable Fuels (6.1%) | | | | | |
Chesapeake Energy Corp. | | 52,400 | | 2,069 | |
Devon Energy Corp. | | 8,700 | | 812 | |
Frontline, Ltd. | | 10,700 | | 486 | |
Holly Corp. | | 28,200 | | 1,771 | |
Massey Energy Co. | | 18,300 | | 580 | |
Tesoro Corp. | | 19,000 | | 1,150 | |
Paper & Forest Products (0.6%) | | | | | |
International Paper Co. | | 18,700 | | 691 | |
Personal Products (0.8%) | | | | | |
Nbty, Inc. ‡ | | 23,800 | | 847 | |
Pharmaceuticals (2.2%) | | | | | |
Endo Pharmaceuticals Holdings, Inc. ‡ | | 35,000 | | 1,026 | |
Schering-Plough Corp. | | 13,200 | | 403 | |
Wyeth | | 20,300 | | 987 | |
Real Estate Management & Development (1.7%) | | | | | |
CB Richard Ellis Group, Inc. Class A ‡ | | 10,000 | | 244 | |
Jones Lang Lasalle, Inc. | | 17,000 | | 1,620 | |
Road & Rail (0.9%) | | | | | |
CON-Way, Inc. | | 23,500 | | 1,001 | |
Semiconductors & Semiconductor Equipment (3.4%) | | | | | |
Applied Materials, Inc. | | 19,500 | | 379 | |
Intersil Corp. Class A | | 19,600 | | 595 | |
LAM Research Corp. ‡ | | 5,900 | | 296 | |
Memc Electronic Materials, Inc. ‡ | | 4,000 | | 293 | |
Micrel, Inc. | | 72,400 | | 655 | |
Novellus Systems, Inc. ‡ | | 28,300 | | 804 | |
NVIDIA Corp. ‡ | | 16,200 | | 573 | |
Texas Instruments, Inc. | | 7,600 | | 248 | |
Software (0.9%) | | | | | |
Synopsys, Inc. ‡ | | 36,100 | | 1,020 | |
Specialty Retail (2.3%) | | | | | |
Aeropostale, Inc. ‡ | | 25,900 | | 593 | |
RadioShack Corp. | | 14,300 | | 295 | |
Sherwin-Williams Co. (The) | | 18,000 | | 1,151 | |
TJX Cos., Inc. | | 18,600 | | 538 | |
Textiles, Apparel & Luxury Goods (0.9%) | | | | | |
Coach, Inc. ‡ | | 26,000 | | 951 | |
Trading Companies & Distributors (0.3%) | | | | | |
GATX Corp. | | 7,100 | | 291 | |
Total Common Stocks (cost $104,924) | | | | 106,944 | |
Total Investment Securities (cost $104,924) # | | | | $ | 106,944 | |
| | | | | |
SECURITIES SOLD SHORT (94.7%) | | | | | |
COMMON STOCKS (94.7%) | | | | | |
Aerospace & Defense (0.4%) | | | | | |
Alliant Techsystems, Inc. ‡ | | (2,200 | ) | $ | (243 | ) |
DRS Technologies, Inc. | | (4,200 | ) | (241 | ) |
| | | | | | | |
The notes to the financial statements are an integral part of this report.
80
| | Shares | | Value | |
SECURITIES SOLD SHORT (94.7%) | | | | | |
Air Freight & Logistics (0.2%) | | | | | |
Expeditors International Washington, | | (5,200 | ) | $ | (263 | ) |
Airlines (1.3%) | | | | | |
AirTran Holdings, Inc. ‡ | | (41,900 | ) | (436 | ) |
Alaska Air Group, Inc. ‡ | | (40,400 | ) | (1,026 | ) |
Auto Components (1.5%) | | | | | |
Autoliv, Inc. ‡ | | (3,600 | ) | (227 | ) |
BorgWarner, Inc. | | (13,400 | ) | (1,417 | ) |
Beverages (0.7%) | | | | | |
Brown-Forman Corp. Class B | | (6,000 | ) | (444 | ) |
Coca-Cola Co. (The) | | (5,700 | ) | (352 | ) |
Capital Markets (3.0%) | | | | | |
Bear Stearns Cos., Inc. (The) | | (7,100 | ) | (806 | ) |
Northern Trust Corp. | | (6,800 | ) | (511 | ) |
T. Rowe Price Group, Inc. | | (22,100 | ) | (1,420 | ) |
Waddell & Reed Financial, Inc. | | (20,100 | ) | (668 | ) |
Chemicals (2.7%) | | | | | |
Air Products & Chemicals, Inc. | | (7,500 | ) | (734 | ) |
Albemarle Corp. | | (15,400 | ) | (735 | ) |
Monsanto Co. | | (4,600 | ) | (449 | ) |
Westlake Chemical Corp. | | (43,800 | ) | (1,075 | ) |
Commercial Banks (0.8%) | | | | | |
Bancorpsouth, Inc. ‡ | | (11,100 | ) | (269 | ) |
Bank of Hawaii Corp. ‡ | | (4,300 | ) | (229 | ) |
First Community Bancorp /CA | | (8,700 | ) | (424 | ) |
Commercial Services & Supplies (1.6%) | | | | | |
Corporate Executive Board Co. | | (16,600 | ) | (1,183 | ) |
Pitney Bowes, Inc. | | (5,100 | ) | (204 | ) |
Rollins, Inc. ‡ | | (13,500 | ) | (410 | ) |
Communications Equipment (2.3%) | | | | | |
Avocent Corp. ‡ | | (21,400 | ) | (579 | ) |
Cisco Systems, Inc. ‡ | | (7,300 | ) | (241 | ) |
JDS Uniphase Corp. ‡ | | (27,900 | ) | (426 | ) |
Motorola, Inc. | | (68,400 | ) | (1,285 | ) |
Computers & Peripherals (0.4%) | | | | | |
SanDisk Corp. ‡ | | (9,500 | ) | (422 | ) |
Construction & Engineering (1.5%) | | | | | |
Shaw Group, Inc. (The) ‡ | | (23,200 | ) | (1,731 | ) |
Diversified Consumer Services (1.6%) | | | | | |
Career Education Corp. ‡ | | (6,800 | ) | (243 | ) |
Corinthian Colleges, Inc. ‡ | | (64,500 | ) | (1,057 | ) |
H&R Block, Inc. | | (25,000 | ) | (545 | ) |
Diversified Financial Services (1.9%) | | | | | |
Bank of America Corp. 1 | | (22,600 | ) | (1,091 | ) |
Leucadia National Corp. | | (20,800 | ) | (1,054 | ) |
Electric Utilities (3.3%) | | | | | |
Ameren Corp. | | (6,000 | ) | (324 | ) |
Black Hills Corp. | | (9,600 | ) | (427 | ) |
Exelon Corp. | | (16,700 | ) | (1,383 | ) |
Great Plains Energy, Inc. ‡ | | (10,700 | ) | (319 | ) |
Idacorp, Inc. | | (35,000 | ) | (1,221 | ) |
Electronic Equipment & Instruments (1.1%) | | | | | |
Imation Corp. ‡ | | (32,300 | ) | $ | (720 | ) |
Jabil Circuit, Inc. | | (21,600 | ) | (469 | ) |
Energy Equipment & Services (4.5%) | | | | | |
Baker Hughes, Inc. | | (14,400 | ) | (1,249 | ) |
Diamond Offshore Drilling, Inc. | | (10,900 | ) | (1,234 | ) |
Halliburton Co. | | (5,700 | ) | (225 | ) |
Oceaneering International, Inc. ‡ | | (5,300 | ) | (409 | ) |
Schlumberger, Ltd. | | (8,800 | ) | (850 | ) |
TETRA Technologies, Inc. ‡ | | (55,600 | ) | (1,095 | ) |
Food & Staples Retailing (0.4%) | | | | | |
Ruddick Corp. | | (12,400 | ) | (422 | ) |
Food Products (1.8%) | | | | | |
Archer-Daniels-Midland Co. | | (33,400 | ) | (1,195 | ) |
Sara Lee Corp. | | (53,300 | ) | (882 | ) |
Gas Utilities (3.3%) | | | | | |
Equitable Resources, Inc. | | (34,900 | ) | (1,966 | ) |
National Fuel Gas Co. | | (17,000 | ) | (824 | ) |
Questar Corp. | | (16,400 | ) | (936 | ) |
Health Care Equipment & Supplies (1.9%) | | | | | |
Beckman Coulter, Inc. | | (3,000 | ) | (213 | ) |
Boston Scientific Corp. ‡ | | (45,000 | ) | (624 | ) |
Cooper Cos. (The), Inc. | | (13,800 | ) | (580 | ) |
Idexx Laboratories, Inc. ‡ | | (2,300 | ) | (280 | ) |
ResMed, Inc. ‡ | | (10,700 | ) | (443 | ) |
Health Care Providers & Services (2.4%) | | | | | |
Omnicare, Inc. | | (33,300 | ) | (982 | ) |
Psychiatric Solutions, Inc. ‡ | | (28,100 | ) | (1,113 | ) |
Quest Diagnostics, Inc. | | (10,800 | ) | (574 | ) |
Health Care Technology (0.8%) | | | | | |
Cerner Corp. ‡ | | (15,000 | ) | (893 | ) |
Hotels, Restaurants & Leisure (6.3%) | | | | | |
International Game Technology | | (6,800 | ) | (296 | ) |
Las Vegas Sands Corp. ‡ | | (11,500 | ) | (1,526 | ) |
McDonald’s Corp. | | (22,800 | ) | (1,361 | ) |
Orient-Express Hotels, Ltd. Class A | | (15,600 | ) | (1,011 | ) |
Panera Bread Co. Class A ‡ | | (8,000 | ) | (328 | ) |
Scientific Games Corp. Class A ‡ | | (37,000 | ) | (1,338 | ) |
Starbucks Corp. ‡ | | (46,400 | ) | (1,238 | ) |
Household Durables (0.7%) | | | | | |
Centex Corp. | | (19,800 | ) | (496 | ) |
Stanley Works (The) | | (5,500 | ) | (317 | ) |
Insurance (4.3%) | | | | | |
AON Corp. | | (11,500 | ) | (521 | ) |
Arch Capital Group, Ltd. ‡ | | (11,200 | ) | (837 | ) |
Conseco, Inc. ‡ | | (84,600 | ) | (1,336 | ) |
Fidelity National Financial, Inc. Class A | | (14,500 | ) | (223 | ) |
First American Corp. | | (10,700 | ) | (322 | ) |
MBIA, Inc. | | (7,300 | ) | (314 | ) |
Principal Financial Group, Inc. | | (3,600 | ) | (244 | ) |
Progressive Corp. (The) | | (57,000 | ) | (1,055 | ) |
The notes to the financial statements are an integral part of this report.
81
| | Shares | | Value | |
SECURITIES SOLD SHORT (94.7%) | | | | | |
IT Services (2.6%) | | | | | |
Gartner, Inc. ‡ | | (10,300 | ) | $ | (225 | ) |
Global Payments, Inc. | | (13,100 | ) | (623 | ) |
Iron Mountain, Inc. ‡ | | (35,900 | ) | (1,247 | ) |
Verifone Holdings, Inc. ‡ | | (17,900 | ) | (885 | ) |
Leisure Equipment & Products (0.5%) | | | | | |
Eastman Kodak Co. | | (20,700 | ) | (593 | ) |
Life Sciences Tools & Services (2.2%) | | | | | |
Covance, Inc. ‡ | | (12,400 | ) | (1,023 | ) |
Pharmaceutical Product Development, | | (33,100 | ) | (1,398 | ) |
Machinery (2.4%) | | | | | |
Deere & Co. | | (2,000 | ) | (310 | ) |
Kennametal, Inc. | | (6,500 | ) | (593 | ) |
Nordson Corp. ‡ | | (21,500 | ) | (1,150 | ) |
Timken Co. | | (20,400 | ) | (678 | ) |
Media (0.5%) | | | | | |
Hearst-Argyle Television, Inc. Class A | | (23,700 | ) | (529 | ) |
Metals & Mining (2.0%) | | | | | |
Carpenter Technology Corp. | | (4,200 | ) | (609 | ) |
Nucor Corp. | | (20,300 | ) | (1,259 | ) |
Steel Dynamics, Inc. | | (7,200 | ) | (383 | ) |
Multiline Retail (3.2%) | | | | | |
99 Cents Only Stores ‡ | | (47,400 | ) | (510 | ) |
Macy’s, Inc. | | (34,900 | ) | (1,118 | ) |
Nordstrom, Inc. | | (27,600 | ) | (1,089 | ) |
Sears Holdings Corp. ‡ | | (4,600 | ) | (620 | ) |
Target Corp. | | (4,800 | ) | (294 | ) |
Multi-Utilities (1.1%) | | | | | |
Integrys Energy Group, Inc. ‡ | | (22,400 | ) | (1,205 | ) |
Oil, Gas & Consumable Fuels (6.0%) | | | | | |
Cabot Oil & Gas Corp. | | (6,000 | ) | (238 | ) |
Chevron Corp. | | (4,900 | ) | (448 | ) |
CNX Gas Corp. ‡ | | (7,800 | ) | (249 | ) |
Encore Acquisition Co. ‡ | | (34,600 | ) | (1,270 | ) |
Exxon Mobil Corp. | | (6,200 | ) | (570 | ) |
Foundation Coal Holdings, Inc. | | (32,600 | ) | (1,393 | ) |
Peabody Energy Corp. | | (25,000 | ) | (1,394 | ) |
Range Resources Corp. | | (26,400 | ) | (1,186 | ) |
Paper & Forest Products (1.5%) | | | | | |
Louisiana-Pacific Corp. | | (64,000 | ) | (1,053 | ) |
MeadWestvaco Corp. | | (18,600 | ) | (626 | ) |
Pharmaceuticals (3.4%) | | | | | |
Abbott Laboratories | | (18,000 | ) | (983 | ) |
Allergan, Inc. | | (13,600 | ) | (919 | ) |
Barr Pharmaceuticals, Inc. ‡ | | (17,900 | ) | (1,026 | ) |
Bristol-Myers Squibb Co. | | (19,600 | ) | (588 | ) |
Valeant Pharmaceuticals International ‡ | | (18,700 | ) | (272 | ) |
Real Estate Management & Development (0.9%) | | | | | |
Forest City Enterprises, Inc. Class A | | (17,400 | ) | (990 | ) |
Road & Rail (1.1%) | | | | | |
Burlington Northern Santa Fe Corp. | | (14,000 | ) | (1,220 | ) |
Semiconductors & Semiconductor Equipment (5.3%) | | | | | |
Advanced Micro Devices, Inc. ‡ | | (80,400 | ) | $ | (1,052 | ) |
Broadcom Corp. Class A ‡ | | (35,100 | ) | (1,142 | ) |
Intel Corp. | | (20,000 | ) | (538 | ) |
Marvell Technology Group, Ltd. ‡ | | (69,700 | ) | (1,257 | ) |
Micron Technology, Inc. ‡ | | (100,000 | ) | (1,051 | ) |
Silicon Laboratories, Inc. ‡ | | (20,100 | ) | (878 | ) |
Software (3.1%) | | | | | |
Aci Worldwide, Inc. ‡ | | (49,200 | ) | (1,125 | ) |
Citrix Systems, Inc. ‡ | | (5,500 | ) | (237 | ) |
Electronic Arts, Inc. ‡ | | (25,300 | ) | (1,546 | ) |
Intuit, Inc. ‡ | | (9,000 | ) | (290 | ) |
Parametric Technology Corp. ‡ | | (14,500 | ) | (277 | ) |
Specialty Retail (3.4%) | | | | | |
Abercrombie & Fitch Co. Class A | | (14,500 | ) | (1,148 | ) |
Circuit City Stores, Inc. | | (95,300 | ) | (756 | ) |
Coldwater Creek, Inc. ‡ | | (69,900 | ) | (626 | ) |
Office Depot, Inc. ‡ | | (18,900 | ) | (354 | ) |
Pacific Sunwear of California ‡ | | (26,000 | ) | (435 | ) |
Urban Outfitters, Inc. ‡ | | (20,000 | ) | (505 | ) |
Textiles, Apparel & Luxury Goods (1.5%) | | | | | |
Jones Apparel Group, Inc. | | (40,600 | ) | (850 | ) |
Timberland Co. Class A ‡ | | (43,600 | ) | (851 | ) |
Thrifts & Mortgage Finance (1.3%) | | | | | |
Freddie Mac | | (8,100 | ) | (423 | ) |
Washington Federal, Inc. | | (43,600 | ) | (1,053 | ) |
Wireless Telecommunication Services (2.0%) | | | | | |
Crown Castle International Corp. ‡ | | (22,700 | ) | (932 | ) |
SBA Communications Corp. Class A ‡ | | (29,600 | ) | (1,054 | ) |
Sprint Nextel Corp. | | (13,600 | ) | (233 | ) |
Total Common Stocks (proceeds $102,438) | | | | (106,434 | ) |
Total Securities Sold Short (proceeds $102,438) # | | | | $ | (106,434 | ) |
The notes to the financial statements are an integral part of this report.
82
NOTES TO SCHEDULE OF INVESTMENTS
‡ | Non Income Producing |
# | Aggregate cost for federal income tax purposes is $105,118. Aggregate gross unrealized appreciation for all securities in which there is an excess of value over tax cost and aggregate gross unrealized depreciation for all securities in which there is an excess of tax cost over value were $7,394 and $5,569, respectively. Net unrealized appreciation for tax purposes is $1,825. |
The notes to the financial statements are an integral part of this report.
83
TA IDEX Neuberger Berman International
MARKET ENVIRONMENT
International stocks as measured by the Morgan Stanley Capital International-EAFE Index (“MSCI-EAFE”) continued to outpace the Standard and Poor’s 500 Composite Stock Index over the last twelve months. In a shift from previous years, international small cap stocks under performed larger capitalization companies. This became especially pronounced in the third quarter of 2007, when credit market disruptions caused many investors to seek safety in size. The portfolio performed well, but fell short of matching the return from its MSCI-EAFE benchmark, partially due to the all-cap nature of the portfolio and the relative overweight of mid and small cap names.
PERFORMANCE
For the year ended October 31, 2007, TA IDEX Neuberger Berman International, Class I returned 22.37%. By comparison, its benchmark, the MSCI-EAFE, returned 25.43%. For the year ended October 31, 2007, the net expense ratio of the Fund was 1.06%.
STRATEGY REVIEW
Our goal has remained identifying quality companies trading at a reasonable price. Our investments must pass liquidity screens and quality controls (market cap, daily turnover, return of investment capital, earnings per share growth, leverage profile) before we will consider investing in a company. If a candidate meets the criteria, we then assess the company from a strategic framework and develop discounted cash flow models to determine the company’s fundamental value. We view ourselves as investors in businesses rather than buyers and sellers of stock, and we have a three-year investment horizon. Through the third quarter market turmoil, we have maintained our philosophy and process.
Strong stock selection in the energy sector led by Canadian exploration and production company, Addax Petroleum Corp. (“Addax”), more than doubled the return of MSCI-EAFE’s energy component. Brazilian mining company Companhia Vale Do Rio Doce, one of the world’s low cost producers of high-quality iron ore, led materials sector investments, which also produced strong absolute and relative returns. Although the portfolio was underweight in health care, the investments, outperformed the benchmark sector, and contributed to relative and absolute returns.
Our consumer discretionary sector investments trailed the MSCI-EAFE peer group, with British homebuilders Barrat Developments and Redrow plc significantly underperforming. Japanese pachinko machine manufacturer Daiichi Sankyo Company, Limited, and used car auctioneer Gulliver both also contributed to the underperformance.
The portfolio also underperformed in the industrials sector due largely to a substantial decline in Japanese employment firms Pasona Sourcing Inc. and Fullcast Co. Ltd., as well as, pachinko card reading machine manufacturer Mars Engineering Corporation.
Results from holdings in non-MSCI-EAFE countries were mixed. Investments in Argentina, Brazil, and Canada produced well above market average returns, led by energy companies Tenaris S.A., PETROLEO BRASILEIRO S.A.- PETROBRAS, and Addax. Investments in Korea underperformed the benchmark especially telecommunications companies, KT Corporation and SK Telecom Co., Ltd.
The United Kingdom (“UK”) and Hong Kong were the worst performing countries in the portfolio on a relative basis. In the case of the UK homebuilders and financials, particularly mortgage lenders Kensington Group plc and Northern Rock plc, both of which have been eliminated from the portfolio, dragged down performance. In Hong Kong, flat panel monitor assembler, TPV Technology Limited, declined in the face of new aggressive competition.
The portfolio continues to have significant over-weights in the energy sector. We continue to use a long-term price of oil of $50 per barrel in our valuation models.
Benjamin Segal, CFA
Portfolio Manager
Neuberger Berman Management, Inc.
84
(unaudited)
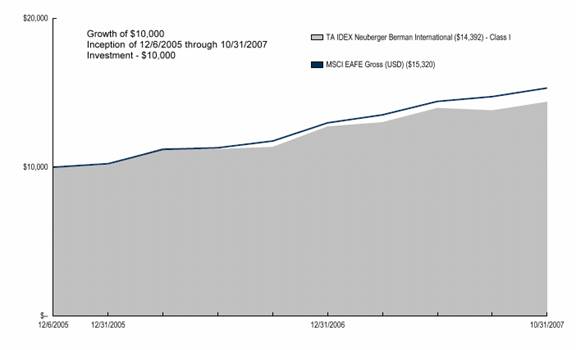
Average Annual Total Return for Periods Ended 10/31/2007
| | 1 Year | | From Inception | | Inception Date | |
Class I (NAV) | | 22.37 | % | 21.07 | % | 12/6/05 | |
MSCI EAFE (1) | | 25.43 | % | 25.33 | % | 12/6/05 | |
NOTES
(1) The Morgan Stanley Capital International-Europe, Australasia, and Far East (MSCI-EAFE) Index is an unmanaged index used as a general measure of market performance. Calculations assume dividends and capital gains are reinvested and do not include any managerial expenses. From inception calculation is based on life of the Fund.
The performance data presented represents past performance, future results may vary. Performance data does not reflect the deduction of taxes that would be paid on fund distributions or the redemption of fund shares. Investment return and principal value will fluctuate so that an investor’s shares, when redeemed, may be worth more or less than their original cost. Current performance may be lower or higher than performance quoted. Please see www.transamericaidex.com for performance data current to the most recent month-end.
Net Asset Value (NAV) returns include the reinvestment of dividends and capital gains. Fund shares are sold without a sales load.
International investing involves special risks including currency fluctuations, political instability, and different financial accounting standards.
This material must be preceded or accompanied by a current prospectus, which includes specific contents regarding the investment objectives and policies of this fund.
This fund is only available in Class I shares, which are not available for direct investment by the public.
85
UNDERSTANDING YOUR FUND’S EXPENSES
(unaudited)
SHAREHOLDER EXPENSES
Fund shareholders may incur two types of costs: (1) transaction costs, including sales charges (loads) on purchases, contingent deferred sales charges on redemptions and redemption fees; and (2) ongoing costs, including management fees, dividend expense on short-sales, and other fund expenses.
The following Example is intended to help you understand your ongoing costs (in dollars and cents) of investing in the Fund and to compare these costs with the ongoing costs of investing in other funds.
The Example is based on an investment of $1,000 invested at May 1, 2007 and held for the entire period until October 31, 2007
ACTUAL EXPENSES
The first line in the table below provides information about actual account values and actual expenses. You may use the information in this line, together with the amount you invested, to estimate the expenses that you paid over the period. Simply divide your account value by $1,000 (for example, an $8,600 account value divided by $1,000 = 8.6), then multiply the result by the number in the first line of your Fund under the heading entitled “Expenses Paid During Period” to estimate the expenses you paid on your account during this period.
HYPOTHETICAL EXAMPLE FOR COMPARISON PURPOSES
The second line in the table below provides information about hypothetical account values and hypothetical expenses based on the Fund’s actual expense ratio and an assumed rate of return of 5% per year before expenses, which is not the Fund’s actual return. The hypothetical account values and expenses may not be used to estimate the actual ending account balance or expenses you paid for the period. You may use this information to compare the ongoing costs of investing in your Fund and other funds. To do so, compare this 5% hypothetical example with the 5% hypothetical examples that appear in the shareholder reports of the other funds.
Please note that the expenses shown in the table are meant to highlight your ongoing costs only and do not reflect any transactional costs, such as sales charges, redemption fees, brokerage commissions paid on purchases and sales of fund shares. Therefore, the second line under the Fund in the table is useful in comparing ongoing costs only, and will not help you determine the relative total costs of owning different funds. If any of these transaction costs were included, your costs would be higher. The expenses shown in the table do not reflect any fees that may be charged to you by brokers, financial intermediaries or other financial institutions.
| | Beginning | | Ending | | Annualized | | Expenses | |
| | Account | | Account | | Expense | | Paid During | |
| | Value | | Value | | Ratio | | Period (a) | |
Class I | | | | | | | | | |
Actual | | $ | 1,000.00 | | $ | 1,057.77 | | 1.06 | % | $ | 5.48 | |
Hypothetical (b) | | 1,000.00 | | 1,019.81 | | 1.06 | | 5.38 | |
| | | | | | | | | | | | |
(a) Expenses are calculated using the Fund’s annualized expense ratio (as disclosed in the table), multiplied by the average account value for the period, multiplied by the number of days in the period (184 days), and divided by the number of days in the year (365 days).
(b) 5% return per year before expenses.
GRAPHICAL PRESENTATION OF SCHEDULE OF INVESTMENTS
By Region
At October 31, 2007

This chart shows the percentage breakdown by region of the Fund’s total investment securities.
86
SCHEDULE OF INVESTMENTS
At October 31, 2007
(all amounts except share amounts in thousands)
| | Shares | | Value | |
PREFERRED STOCKS (1.8%) | | | | | |
Brazil (0.7%) | | | | | |
Universo Online SA ‡ § | | 504,691 | | $ | 4,033 | |
Germany (1.1%) | | | | | |
Porsche AG | | 2,459 | | 6,542 | |
Total Preferred Stocks (cost $6,374) | | | | 10,575 | |
| | | | | |
COMMON STOCKS (93.7%) | | | | | |
Australia (2.4%) | | | | | |
Paladin Resources, Ltd. ‡ | | 1,116,820 | | 8,477 | |
Woodside Petroleum, Ltd. | | 127,409 | | 6,140 | |
Austria (2.0%) | | | | | |
Cat Oil AG ‡^ § | | 281,000 | | 7,521 | |
Zumtobel AG | | 104,341 | | 4,453 | |
Belgium (5.0%) | | | | | |
Colruyt SA ‡ | | 10,300 | | 2,200 | |
Euronav NV ^ | | 142,779 | | 4,235 | |
Fortis @ | | 180,835 | | 5,771 | |
ICOS Vision Systems NV ‡^ § | | 44,421 | | 2,024 | |
InBev NV | | 138,910 | | 13,095 | |
Option NV ‡^ | | 278,096 | | 2,676 | |
Bermuda (0.7%) | | | | | |
TPV Technology, Ltd. | | 6,258,000 | | 4,190 | |
Brazil (5.3%) | | | | | |
Cia Vale do Rio Doce ‡ | | 339,760 | | 10,726 | |
Natura Cosmeticos SA | | 313,935 | | 3,708 | |
Petroleo Brasileiro SA ^ | | 121,685 | | 11,637 | |
Ultrapar Participacoes SA ^ § | | 130,815 | | 5,298 | |
Canada (11.4%) | | | | | |
Addax Petroleum Corp. | | 174,312 | | 7,593 | |
Addax Petroleum Corp. - 144A ‡ @ | | 98,900 | | 4,308 | |
Canadian Natural Resources, Ltd. | | 157,890 | | 13,059 | |
Corus Entertainment, Inc. Class B | | 96,245 | | 5,041 | |
First Calgary Petroleums, Ltd. ‡ | | 900,075 | | 3,971 | |
MacDonald Dettwiler & Associates, Ltd. ‡ | | 260,985 | | 12,365 | |
Stantec, Inc. ‡ | | 99,540 | | 3,877 | |
Suncor Energy, Inc. ‡ | | 105,448 | | 11,485 | |
Talisman Energy, Inc. | | 303,365 | | 6,573 | |
Cyprus (0.8%) | | | | | |
Prosafe Se | | 266,500 | | 4,706 | |
France (8.0%) | | | | | |
Alten ‡ | | 25,100 | | 988 | |
BNP Paribas | | 47,406 | | 5,219 | |
Groupe Steria SCA ^ | | 81,553 | | 3,827 | |
IPSOS | | 148,177 | | 5,411 | |
Kaufman & Broad SA | | 67,819 | | 3,856 | |
Pernod-Ricard SA | | 13,280 | | 3,064 | |
Rexel SA ‡^ | | 154,710 | | 3,257 | |
Societe Generale | | 13,220 | | 2,216 | |
Total SA ^ | | 86,830 | | 6,999 | |
Vallourec | | 44,561 | | 12,898 | |
Germany (10.4%) | | | | | |
Continental AG | | 60,143 | | 9,083 | |
Gerresheimer AG ‡ | | 91,745 | | $ | 5,044 | |
HYPO Real Estate Holding AG @ | | 161,952 | | 9,609 | |
Kloeckner & Co. AG | | 89,023 | | 4,720 | |
Leoni AG | | 125,000 | | 7,925 | |
Pfeiffer Vacuum Technology AG | | 44,080 | | 3,753 | |
Wacker Chemie AG | | 50,375 | | 12,353 | |
Wincor Nixdorf AG | | 93,461 | | 9,270 | |
Greece (0.5%) | | | | | |
Titan Cement Co. SA | | 59,725 | | 2,909 | |
Ireland (6.8%) | | | | | |
Allied Irish Banks PLC | | 184,362 | | 4,604 | |
Anglo Irish Bank Corp. PLC | | 635,484 | | 10,628 | |
CRH PLC | | 335,408 | | 12,796 | |
DCC PLC | | 98,285 | | 2,699 | |
Dragon Oil PLC ‡ § | | 1,487,132 | | 9,646 | |
Italy (2.2%) | | | | | |
Marazzi Group SpA § | | 417,087 | | 5,327 | |
Milano Assicurazioni SpA | | 737,030 | | 6,238 | |
Nice SpA ^ | | 272,373 | | 1,471 | |
Japan (12.6%) | | | | | |
AICA Kogyo Co., Ltd. | | 151,100 | | 1,540 | |
Bosch Corp. | | 229,200 | | 1,191 | |
Chiyoda Corp. | | 288,000 | | 5,296 | |
FCC Co., Ltd. ^ | | 326,100 | | 6,082 | |
Fullcast Co., Ltd. | | 175 | | 100 | |
Gulliver International Co., Ltd. | | 4,700 | | 266 | |
Heiwa Corp. | | 371,200 | | 4,154 | |
Hogy Medical Co., Ltd. | | 55,200 | | 2,428 | |
Ibiden Co., Ltd. | | 60,600 | | 5,115 | |
Kaga Electronics Co., Ltd. | | 147,800 | | 2,161 | |
Mars Engineering Corp. ^ | | 181,700 | | 2,583 | |
Maruichi Steel Tube, Ltd. ^ | | 140,300 | | 3,967 | |
Nihon Kohden Corp. | | 149,900 | | 2,848 | |
Nissan Motor Co., Ltd. | | 813,100 | | 9,352 | |
Pasona, Inc. | | 1,742 | | 2,236 | |
Sankyo Co., Ltd. | | 93,500 | | 3,974 | |
Sumitomo Metal Industries, Ltd. | | 1,068,000 | | 5,216 | |
Takuma Co., Ltd. | | 346,000 | | 1,780 | |
Tenma Corp. | | 89,900 | | 1,554 | |
Topcon Corp. | | 172,400 | | 2,500 | |
Toray Industries, Inc. | | 995,000 | | 7,630 | |
Yamaha Motor Co., Ltd. | | 103,100 | | 2,915 | |
Jersey, C.I. (0.7%) | | | | | |
Experian Group, Ltd. | | 399,965 | | 4,192 | |
Korea, Republic of (2.7%) | | | | | |
Daegu Bank | | 149,070 | | 2,615 | |
Hyundai Mobis | | 37,113 | | 3,704 | |
KT Corp. | | 116,870 | | 5,560 | |
SK Telecom Co., Ltd. | | 17,359 | | 4,076 | |
Luxembourg (1.0%) | | | | | |
Tenaris SA ^ | | 112,195 | | 6,036 | |
Netherlands (1.7%) | | | | | |
Aalberts Industries NV ‡ | | 118,300 | | 2,843 | |
The notes to the financial statements are an integral part of this report.
87
| | Shares | | Value | |
Netherlands (continued) | | | | | |
OPG Groep NV | | 86,830 | | $ | 3,001 | |
Wavin NV | | 243,355 | | 4,193 | |
Norway (1.7%) | | | | | |
DNB NOR ASA | | 523,495 | | 8,593 | |
Pronova Biopharma As ‡ | | 397,830 | | 1,823 | |
Spain (0.4%) | | | | | |
Renta Corp. Real Estate SA | | 75,915 | | 2,567 | |
Sweden (0.2%) | | | | | |
Nobia AB | | 148,595 | | 1,302 | |
Switzerland (1.8%) | | | | | |
Advanced Digital Broadcast Holdings SA ‡ § | | 60,535 | | 2,611 | |
Swiss Reinsurance | | 83,650 | | 7,845 | |
United Kingdom (15.4%) | | | | | |
Amlin PLC | | 481,752 | | 3,213 | |
Barclays PLC | | 308,276 | | 3,868 | |
Barratt Developments PLC | | 287,830 | | 3,901 | |
Burren Energy PLC | | 300,756 | | 7,560 | |
Chemring Group | | 64,700 | | 2,972 | |
GlaxoSmithKline PLC | | 93,118 | | 2,395 | |
Informa PLC | | 398,170 | | 4,425 | |
Laird Group PLC ‡ | | 29,400 | | $ | 388 | |
Lloyds TSB Group PLC | | 890,244 | | 10,088 | |
Northern Rock PLC | | 155,247 | | 595 | |
Northgate PLC | | 182,437 | | 3,657 | |
Paragon Group of Cos. PLC | | 289,630 | | 1,426 | |
Premier Foods PLC | | 460,530 | | 2,157 | |
Punch Taverns PLC | | 371,308 | | 7,752 | |
Raymarine PLC | | 480,830 | | 2,817 | |
Redrow PLC | | 445,525 | | 3,688 | |
RPS Group PLC | | 401,628 | | 3,250 | |
Sepura, Ltd. ‡ | | 377,000 | | 1,374 | |
Tullow Oil PLC | | 484,179 | | 6,417 | |
Vodafone Group PLC | | 3,663,246 | | 14,383 | |
William Hill PLC | | 436,767 | | 5,616 | |
Total Common Stocks (cost $478,197) | | | | 558,730 | |
| | | | | |
Total Security Lending Collateral (cost $37,741) ± | | | | 37,741 | |
Total Investment Securities (cost $522,312) # | | | | $ | 607,046 | |
NOTES TO SCHEDULE OF INVESTMENTS
^ | | At October 31, 2007, all or a portion of this security is on loan (see Note 1). The value at October 31, 2007, of all securities on loan is $36,101. |
± | | Cash collateral for the Repurchase Agreements, valued at $6,888, that serve as collateral for securities lending, are invested in corporate and government bonds with interest rates and maturity dates ranging from 0.0% - 8.125% and 11/14/2007 - 9/15/2037. |
‡ | | Non Income Producing |
§ | | Illiquid |
@ | | Securities valued as determined in good faith in accordance with procedures established by the Fund’s Board of Trustees. |
# | | Aggregate cost for federal income tax purposes is $523,475. Aggregate gross unrealized appreciation for all securities in which there is an excess of value over tax cost and aggregate gross unrealized depreciation for all securities in which there is an excess of tax cost over value were $111,289 and $27,718, respectively. Net unrealized appreciation for tax purposes is $83,571. |
DEFINITIONS:
144A 144A Securities are registered pursuant to Rule 144A of the Securities Act of 1933. These securities are deemed to be liquid for purposes of compliance limitations on holdings of illiquid securities and may be resold as transactions exempt from registration, normally to qualified institutional buyers. At October 31, 2007, these securities aggregated $4,308 or 0.72% of net assets of the fund.
The notes to the financial statements are an integral part of this report.
88
| | Percentage of | | | |
(unaudited) | | Total Investments | | Value | |
INVESTMENTS BY INDUSTRY: | | | | | |
Oil, Gas & Consumable Fuels | | 18.7 | % | $ | 113,397 | |
Commercial Banks | | 9.5 | % | 57,440 | |
Auto Components | | 4.6 | % | 27,985 | |
Chemicals | | 3.5 | % | 21,537 | |
Machinery | | 3.5 | % | 21,273 | |
Metals & Mining | | 3.3 | % | 19,909 | |
Automobiles | | 3.1 | % | 18,810 | |
Wireless Telecommunication Services | | 3.0 | % | 18,459 | |
Energy Equipment & Services | | 3.0 | % | 18,263 | |
Insurance | | 2.9 | % | 17,295 | |
Beverages | | 2.7 | % | 16,160 | |
Construction Materials | | 2.6 | % | 15,705 | |
Media | | 2.5 | % | 14,877 | |
Household Durables | | 2.3 | % | 14,057 | |
Computers & Peripherals | | 2.2 | % | 13,461 | |
Hotels, Restaurants & Leisure | | 2.2 | % | 13,368 | |
Construction & Engineering | | 2.2 | % | 13,366 | |
Software | | 2.0 | % | 12,365 | |
Electronic Equipment & Instruments | | 1.9 | % | 11,635 | |
Leisure Equipment & Products | | 1.8 | % | 10,711 | |
Commercial Services & Supplies | | 1.6 | % | 9,778 | |
Trading Companies & Distributors | | 1.3 | % | 7,977 | |
Building Products | | 1.1 | % | 6,867 | |
Communications Equipment | | 1.1 | % | 6,867 | |
Diversified Financial Services | | 1.0 | % | 5,772 | |
Diversified Telecommunication Services | | 0.9 | % | 5,560 | |
Health Care Equipment & Supplies | | 0.9 | % | 5,275 | |
Life Sciences Tools & Services | | 0.8 | % | 5,044 | |
IT Services | | 0.8 | % | 4,816 | |
Electrical Equipment | | 0.7 | % | 4,453 | |
Pharmaceuticals | | 0.7 | % | 4,217 | |
Internet Software & Services | | 0.7 | % | 4,032 | |
Personal Products | | 0.6 | % | 3,708 | |
Road & Rail | | 0.6 | % | 3,657 | |
Health Care Providers & Services | | 0.5 | % | 3,001 | |
Aerospace & Defense | | 0.5 | % | 2,972 | |
Industrial Conglomerates | | 0.4 | % | 2,699 | |
Real Estate Management & Development | | 0.4 | % | 2,567 | |
Food & Staples Retailing | | 0.4 | % | 2,200 | |
Food Products | | 0.4 | % | 2,157 | |
Semiconductors & Semiconductor Equipment | | 0.3 | % | 2,024 | |
Thrifts & Mortgage Finance | | 0.3 | % | 2,021 | |
Specialty Retail | | 0.3 | % | 1,568 | |
Investment Securities, at value | | 93.8 | % | 569,305 | |
Short-Term Investments | | 6.2 | % | 37,741 | |
Total Investments | | 100.0 | % | $ | 607,046 | |
The notes to the financial statements are an integral part of this report.
89
TA IDEX Oppenheimer Developing Markets
MARKET ENVIRONMENT
Emerging markets chalked up yet another period of exceptional returns during the fiscal year ended October 31, 2007. These returns were framed against a backdrop of strong global growth, supportive of healthy earnings expansion, and a low cost of capital globally. The portfolio performed strongly on an absolute basis during the reporting period; however, it underperformed that of the benchmark, the Morgan Stanley Capital International Emerging Markets Index (“MSCI-EMI”).
PERFORMANCE
For the year ended October 31, 2007, TA IDEX Oppenheimer Developing Markets, Class I returned 55.27%. By comparison, its benchmark, the MSCI-EMI, returned 68.33%. For the year ended October 31, 2007, the net expense ratio of the Fund was 1.34%.
STRATEGY REVIEW
Broad macroeconomic forces influencing portfolio performance during the year included robust economic growth in emerging markets, generally low interest rates and sustained high commodity prices. The commodity boom persisted alongside high levels of global expansion. A demand shock from the emerging markets (most notably China) over the past five years coupled with supply inelasticity in the short term for energy (oil and gas) and industrial metals had sent commodity prices surging, widely ahead of marginal production costs. The strong revenue, tax and cash flow gains associated with high commodity prices had an obvious beneficial impact on the resource-blessed geographies of the developing world. Brazil and South Africa, among the larger economies, have been very large beneficiaries. By contrast, resource poor economies, such as Turkey and Taiwan, have suffered somewhat.
Growth ranged from good to spectacular across the developing world during the period. The most visible growth remained in the two largest economies, China and India, which both saw strong expansion in nominal gross domestic product (“GDP”). Brazil and Indonesia were two other large economies which observed a growth stimulus from declining nominal (and more importantly real) interest rates. Globalization, restructuring and concomitant productivity gains and capital deepening remained significant forces of growth in the developing world during the period.
Two broad themes dominated our best performing shares during the period - commodity stocks and India. PETROLEO BRASILEIRO SA-PETROBRAS the leading global offshore oil company was one of the largest contributors to portfolio performance during the period. During the year significant new finds in both oil and gas drove the stock up. PT Aneka Tambang (Persero) Tbk, the Indonesian nickel giant, and CVRD Inco Limited, the Brazilian iron ore miner, were also among the largest contributors to portfolio performance during the period. The portfolio’s Indian holdings continued to chalk up impressive performance. Larsen & Toubro Limited, the engineering and construction major, and Bharti Airtel Limited, the mobile operator, were among the best performing stocks during the fiscal year.
Gold stocks, broadly, were an area of disappointing returns. Although gold bullion traded higher through the year, many of the gold mining companies faired poorly as they struggled with labor negotiations, rising equipment costs and mining accidents. Highland Gold Mining Limited and Polymetal, GDR were each drags on performance.
Justin Leverenz, CFA
Fund Manager
OppenheimerFunds, Inc.
90
(unaudited)
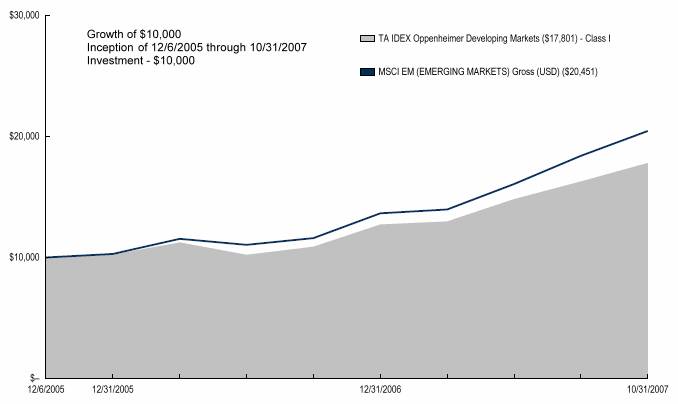
Average Annual Total Return for Periods Ended 10/31/2007
| | 1 Year | | From Inception | | Inception Date | |
Class I (NAV) | | 55.27 | % | 35.37 | % | 12/6/05 | |
MSCI EMI(1) | | 68.33 | % | 46.15 | % | 12/6/05 | |
NOTES
(1) The Morgan Stanley Capital International Emerging Markets (MSCI-EMI) Index is an unmanaged index used as a general measure of market performance. Calculations assume dividends and capital gains are reinvested and do not include any managerial expenses. From inception calculation is based on life of the Fund.
The performance data presented represents past performance, future results may vary. Performance data does not reflect the deduction of taxes that would be paid on fund distributions or the redemption of fund shares. Investment return and principal value will fluctuate so that an investor’s shares, when redeemed, may be worth more or less than their original cost. Current performance may be lower or higher than performance quoted. Please see www.transamericaidex.com for performance data current to the most recent month-end.
Net Asset Value (NAV) returns include the reinvestment of dividends and capital gains. Fund shares are sold without a sales load.
International investing involves special risks including currency fluctuations, political instability, and different financial accounting standards.
This material must be preceded or accompanied by a current prospectus, which includes specific contents regarding the investment objectives and policies of this fund.
This fund is only available in Class I shares, which are not available for direct investment by the public.
91
UNDERSTANDING YOUR FUND’S EXPENSES
(unaudited)
SHAREHOLDER EXPENSES
Fund shareholders may incur two types of costs: (1) transaction costs, including sales charges (loads) on purchases, contingent deferred sales charges on redemptions and redemption fees; and (2) ongoing costs, including management fees, dividend expense on short-sales, and other fund expenses.
The following Example is intended to help you understand your ongoing costs (in dollars and cents) of investing in the Fund and to compare these costs with the ongoing costs of investing in other funds.
The Example is based on an investment of $1,000 invested at May 1, 2007 and held for the entire period until October 31, 2007
ACTUAL EXPENSES
The first line in the table below provides information about actual account values and actual expenses. You may use the information in this line, together with the amount you invested, to estimate the expenses that you paid over the period. Simply divide your account value by $1,000 (for example, an $8,600 account value divided by $1,000 = 8.6), then multiply the result by the number in the first line of your Fund under the heading entitled “Expenses Paid During Period” to estimate the expenses you paid on your account during this period.
HYPOTHETICAL EXAMPLE FOR COMPARISON PURPOSES
The second line in the table below provides information about hypothetical account values and hypothetical expenses based on the Fund’s actual expense ratio and an assumed rate of return of 5% per year before expenses, which is not the Fund’s actual return. The hypothetical account values and expenses may not be used to estimate the actual ending account balance or expenses you paid for the period. You may use this information to compare the ongoing costs of investing in your Fund and other funds. To do so, compare this 5% hypothetical example with the 5% hypothetical examples that appear in the shareholder reports of the other funds.
Please note that the expenses shown in the table are meant to highlight your ongoing costs only and do not reflect any transactional costs, such as sales charges, redemption fees, brokerage commissions paid on purchases and sales of fund shares. Therefore, the second line under the Fund in the table is useful in comparing ongoing costs only, and will not help you determine the relative total costs of owning different funds. If any of these transaction costs were included, your costs would be higher. The expenses shown in the table do not reflect any fees that may be charged to you by brokers, financial intermediaries or other financial institutions.
| | Beginning | | Ending | | Annualized | | Expenses | |
| | Account | | Account | | Expense | | Paid During | |
| | Value | | Value | | Ratio | | Period (a) | |
Class I | | | | | | | | | |
Actual | | $ | 1,000.00 | | $ | 1,306.04 | | 1.36 | % | $ | 7.90 | |
Hypothetical (b) | | 1,000.00 | | 1,018.28 | | 1.36 | | 6.92 | |
| | | | | | | | | | | | |
(a) Expenses are calculated using the Fund’s annualized expense ratio (as disclosed in the table), multiplied by the average account value for the period, multiplied by the number of days in the period (184 days), and divided by the number of days in the year (365 days).
(b) 5% return per year before expenses.
GRAPHICAL PRESENTATION OF SCHEDULE OF INVESTMENTS
By Region
At October 31, 2007
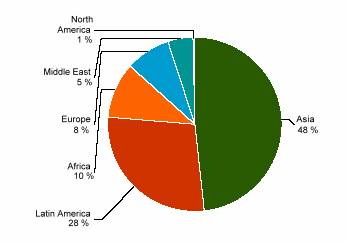
This chart shows the percentage breakdown by region of the Fund’s total investment securities.
92
SCHEDULE OF INVESTMENTS
At October 31, 2007
(all amounts except share amounts in thousands)
| | Shares | | Value | |
CONVERTIBLE PREFERRED STOCKS (2.7%) | | | | | |
Brazil (1.9%) | | | | | |
All America Latina Logistica SA | | 795,000 | | $ | 12,521 | |
Mexico (0.8%) | | | | | |
Fomento Economico Mexicano SA de | | 1,523,000 | | 5,325 | |
Total Convertible Preferred Stocks (cost $11,631) | | | | 17,846 | |
| | | | | |
PREFERRED STOCKS (3.7%) | | | | | |
Brazil (3.5%) | | | | | |
Banco Bradesco SA | | 286,560 | | 9,685 | |
Lojas Americanas SA | | 741,990 | | 8,590 | |
NET Servicos de Comuni-PREF ‡ | | 96,600 | | 1,542 | |
Sadia SA ‡ | | 441,100 | | 2,992 | |
Tele Norte Leste Participacoes SA | | 42,000 | | 910 | |
Korea, Republic of (0.2%) | | | | | |
Hyundai Motor Co. | | 17,560 | | 670 | |
S-Oil Corp. | | 10,512 | | 785 | |
Total Preferred Stocks (cost $14,059) | | | | 25,174 | |
| | | | | |
COMMON STOCKS (86.5%) | | | | | |
Bermuda (0.4%) | | | | | |
Bunge, Ltd. | | 17,800 | | 2,051 | |
Varitronix International, Ltd. | | 1,262,000 | | 941 | |
Brazil (12.7%) | | | | | |
B2w Com Global Do Varejo | | 15,000 | | 805 | |
Banco Bradesco SA | | 124,600 | | 4,255 | |
Bovespa Holding SA ‡ | | 38,000 | | 720 | |
Camargo Correa Desenvolvimento | | 154,500 | | 1,012 | |
Cia Brasileira de Distribuicao Grupo | | 76,919 | | 2,475 | |
Cia de Bebidas DAS Americas | | 8,500 | | 680 | |
Cia Vale do Rio Doce ‡ | | 276,300 | | 8,723 | |
Cia Vale do Rio Doce | | 171,800 | | 6,473 | |
Cyrela Brazil Realty SA ^ § 144A | | 18,400 | | 6,276 | |
Diagnosticos DA America SA | | 103,200 | | 2,397 | |
Empresa Brasileira de Aeronautica SA | | 219,000 | | 10,681 | |
Natura Cosmeticos SA | | 438,600 | | 5,181 | |
Petroleo Brasileiro SA Class A | | 20,000 | | 1,664 | |
Petroleo Brasileiro SA ^ | | 308,012 | | 29,455 | |
Tele Norte Leste Participacoes SA | | 124,000 | | 4,740 | |
Canada (0.3%) | | | | | |
Yamana Gold, Inc. | | 144,300 | | 2,167 | |
Cayman Islands (0.6%) | | | | | |
SINA Corp. ‡ | | 55,600 | | 3,188 | |
Tencent Holdings, Ltd. | | 70,000 | | 593 | |
China (2.2%) | | | | | |
China Oilfield Services, Ltd. Class H | | 796,000 | | 1,924 | |
China Shenhua Energy Co., Ltd. Class H | | 1,277,500 | | 8,101 | |
PetroChina Co., Ltd. | | 1,890,000 | | 4,731 | |
Travelsky Technology, Ltd. ‡ | | 264,000 | | 315 | |
Egypt (3.6%) | | | | | |
Commercial International Bank - 144A | | 122,300 | | 1,712 | |
Commercial International Bank ^ § | | 202,585 | | 2,806 | |
Eastern Tobacco ‡ | | 41,918 | | 3,198 | |
Medinet NASR Housing | | 306,860 | | 3,119 | |
Orascom Telecom Holding SAE | | 943,629 | | $ | 13,596 | |
France (0.8%) | | | | | |
Technip SA | | 58,800 | | 5,263 | |
Hong Kong (4.0%) | | | | | |
China Mobile, Ltd. | | 131,900 | | 13,676 | |
China Unicom, Ltd. | | 1,686,000 | | 4,050 | |
Hutchison Whampoa International, Ltd. ‡ | | 457,000 | | 5,696 | |
Television Broadcasts, Ltd. | | 519,000 | | 3,341 | |
India (15.8%) | | | | | |
Amtek Auto, Ltd. | | 291,764 | | 3,753 | |
Bajaj Auto, Ltd. | | 54,800 | | 3,448 | |
Bharat Electronics, Ltd. | | 62,800 | | 2,915 | |
Bharat Forge, Ltd. | | 35,000 | | 335 | |
Bharat Heavy Electricals, Ltd. | | 44,409 | | 2,951 | |
Divi’s Laboratories, Ltd. | | 145,397 | | 6,370 | |
Gail India, Ltd. | | 187,195 | | 1,960 | |
HCL Technologies, Ltd. | | 321,040 | | 2,539 | |
HDFC Bank LTD | | 7,800 | | 1,084 | |
Hindustan Lever, Ltd. | | 604,400 | | 3,191 | |
Housing Development Finance Corp. | | 217,300 | | 15,325 | |
ICICI Bank, Ltd. ^ | | 145,500 | | 10,104 | |
Infosys Technologies, Ltd. | | 412,400 | | 19,287 | |
ITC, Ltd. | | 431,600 | | 1,966 | |
Larsen & Toubro, Ltd. | | 113,600 | | 12,262 | |
Mahindra & Mahindra, Ltd. | | 153,395 | | 2,944 | |
Reliance Capital, Ltd. | | 35,900 | | 1,937 | |
Reliance Industries, Ltd. | | 60,700 | | 4,295 | |
Rico Auto Industries, Ltd. | | 19,100 | | 17 | |
Siemens India, Ltd. | | 48,800 | | 2,424 | |
Tata Consultancy Services, Ltd. | | 283,952 | | 7,495 | |
Indonesia (4.3%) | | | | | |
Aneka Tambang TBK PT | | 14,066,500 | | 5,180 | |
Gudang Garam TBK PT | | 2,300,349 | | 2,554 | |
Indosat TBK PT | | 6,512,000 | | 6,228 | |
PT Astra International TBK | | 1,516,000 | | 4,249 | |
Ramayana Lestari Sentosa TBK PT | | 3,011,010 | | 291 | |
Telekomunikasi Indonesia TBK PT | | 8,803,000 | | 10,403 | |
Israel (0.4%) | | | | | |
Bank Hapoalim Bm | | 315,773 | | 1,734 | |
Israel Discount Bank, Ltd. Class A ‡ | | 526,000 | | 1,333 | |
Korea, Republic of (6.7%) | | | | | |
Amorepacific Corp. | | 4,027 | | 3,832 | |
Finetec Corp. | | 81,580 | | 1,594 | |
GS Engineering & Construction Corp. | | 16,093 | | 3,368 | |
Humax Co., Ltd. | | 60,845 | | 1,034 | |
Hyundai Development Co. | | 27,600 | | 3,058 | |
Hyundai Engineering & Construction Co., Ltd. ‡ | | 53,561 | | 5,417 | |
Hyundai Motor Co. | | 42,177 | | 3,325 | |
Jeonbuk Bank | | 119,020 | | 1,143 | |
KIA Motors Corp. ‡ | | 79,800 | | 917 | |
Kookmin Bank | | 31,800 | | 2,598 | |
Korea Exchange Bank | | 75,060 | | 1,233 | |
The notes to the financial statements are an integral part of this report.
93
| | Shares | | Value | |
Korea, Republic of (continued) | | | | | |
Pusan Bank | | 94,010 | | $ | 1,670 | |
Samsung Electronics Co., Ltd. | | 9,472 | | 5,784 | |
Shinsegae Co., Ltd. | | 3,938 | | 3,082 | |
SK Telecom Co., Ltd. ^ | | 101,600 | | 3,130 | |
S-Oil Corp. | | 42,053 | | 3,800 | |
Telechips, Inc. | | 5,696 | | 94 | |
Luxembourg (0.4%) | | | | | |
Tenaris SA ^ | | 52,300 | | 2,814 | |
Mexico (5.8%) | | | | | |
America Movil SAB de CV Series R, Class R | | 147,800 | | 9,665 | |
Corp. Geo SAB de CV Series B, Class B ‡ | | 681,200 | | 2,507 | |
Corp. Interamericana de Entretenimiento SAB de CV Class B ‡ | | 325,700 | | 955 | |
Empresas ICA SAB de CV ‡ | | 237,500 | | 1,643 | |
Fomento Economico Mexicano SAB de | | 103,100 | | 3,671 | |
Grupo Financiero Banorte SAB de CV Class O ‡ | | 1,907,900 | | 8,610 | |
Grupo Financiero Inbursa SA Class O | | 748,300 | | 1,993 | |
Grupo Televisa SA | | 178,400 | | 4,433 | |
Impulsora del Desarrollo y El Empleo EN America Latina SAB de CV ‡ | | 1,616,400 | | 2,520 | |
Sare Holding SAB de CV Class B ‡ | | 1,746,782 | | 3,024 | |
Norway (0.3%) | | | | | |
Dno ASA ‡^ | | 1,213,900 | | 2,263 | |
Panama (0.4%) | | | | | |
Banco Latinoamericano de Exportaciones SA Class E | | 137,500 | | 2,677 | |
Philippines (1.4%) | | | | | |
Jollibee Foods Corp. | | 1,507,000 | | 1,760 | |
SM Prime Holdings, Inc. | | 27,839,370 | | 7,648 | |
Portugal (0.3%) | | | | | |
Jeronimo Martins SGPS SA | | 234,300 | | 1,736 | |
Russian Federation (4.2%) | | | | | |
Gazprom OAO | | 239,300 | | 11,917 | |
Gazprom OAO ^ | | 29,700 | | 1,457 | |
LUKOIL | | 83,600 | | 7,428 | |
Polymetal - 144A ‡ § | | 314,100 | | 2,151 | |
Tmk OAO - 144A § | | 116,400 | | 5,122 | |
South Africa (6.0%) | | | | | |
Anglo Platinum, Ltd. | | 58,000 | | 9,889 | |
AngloGold Ashanti, Ltd. ^ | | 88,400 | | 4,106 | |
Aspen Pharmacare Holdings, Ltd. ‡ | | 158,924 | | 922 | |
Firstrand, Ltd. ‡ | | 413,200 | | 1,624 | |
Impala Platinum Holdings, Ltd. | | 128,400 | | 4,791 | |
Liberty Group, Ltd. | | 111,600 | | $ | 1,621 | |
Massmart Holdings, Ltd. | | 257,400 | | 3,193 | |
MTN Group, Ltd. | | 68,400 | | 1,320 | |
Murray & Roberts Holdings, Ltd. | | 259,870 | | 3,954 | |
Standard Bank Group, Ltd. ‡ | | 292,300 | | 5,243 | |
Steinhoff International Holdings, Ltd. | | 581,400 | | 1,796 | |
Tiger Brands, Ltd. | | 67,694 | | 1,940 | |
Taiwan (9.4%) | | | | | |
Cathay Financial Holding Co., Ltd. | | 1,936,180 | | 5,002 | |
Fubon Financial Holding Co., Ltd. | | 1,550,000 | | 1,500 | |
HON HAI Precision Industry Co., Ltd. | | 1,616,160 | | 12,271 | |
Lite-On Technology Corp. | | 10,927 | | 20 | |
Mediatek, Inc. | | 799,300 | | 15,616 | |
President Chain Store Corp. | | 867,000 | | 2,569 | |
Synnex Technology International Corp. | | 1,043,115 | | 3,477 | |
Taiwan Semiconductor Manufacturing | | 261,391 | | 2,784 | |
Taiwan Semiconductor Manufacturing | | 10,335,307 | | 20,351 | |
Thailand (0.8%) | | | | | |
Advanced Info Service PCL | | 717,600 | | 1,890 | |
Kiatnakin Bank PCL | | 1,059,087 | | 927 | |
Tisco Bank PCL | | 868,212 | | 760 | |
TMB Bank PCL ‡ @ | | 41,721,194 | | 2,013 | |
Turkey (3.9%) | | | | | |
Aksigorta AS | | 462,986 | | 3,400 | |
Anadolu EFES Biracilik VE Malt Sanayii | | 132,209 | | 1,603 | |
Anadolu Sigorta | | 0 | | q | |
Bim Birlesik Magazalar As | | 31,500 | | 2,582 | |
Coca-Cola Icecek As ‡ | | 73,700 | | 629 | |
Enka Insaat VE Sanayi As ‡ | | 2,000 | | 31 | |
Ford Otomotiv Sanayi AS | | 146,360 | | 1,712 | |
Haci Omer Sabanci Holding AS | | 731,350 | | 1,241 | |
Haci OMER Sabanci Holding As | | 606,000 | | 4,113 | |
KOC Holding AS ‡ | | 0 | | q | |
Turkcell Iletisim Hizmet AS | | 750,300 | | 7,175 | |
Turkiye Is Bankasi Class C | | 1 | | q | |
Turkiye Vakiflar Bankasi Tao Class D | | 978,852 | | 3,694 | |
United Kingdom (1.8%) | | | | | |
HSBC Holdings PLC (Hk REG) ‡ | | 618,400 | | 12,088 | |
Total Common Stocks (cost $405,406) | | | | 583,499 | |
| | | | | |
Total Security Lending Collateral (cost $19,776) ± | | | | 19,776 | |
Total Investment Securities (cost $450,872) # | | | | $ | 646,295 | |
The notes to the financial statements are an integral part of this report.
94
NOTES TO SCHEDULE OF INVESTMENTS
q | Value is less than $1 |
^ | At October 31, 2007, all or a portion of this security is on loan (see Note 1). The value at October 31, 2007, of all securities on loan is $19,109. |
@ | Securities valued as determined in good faith in accordance with procedures established by the Fund’s Board of Trustees. |
± | Cash collateral for the Repurchase Agreements, valued at $3,609, that serve as collateral for securities lending, are invested in corporate and government bonds with interest rates and maturity dates ranging from 0.00% - 8.125% and 11/14/2007 - 9/15/2037. |
‡ | Non Income Producing |
§ | Illiquid |
# | Aggregate cost for federal income tax purposes is $451,815. Aggregate gross unrealized appreciation for all securities in which there is an excess of value over tax cost and aggregate gross unrealized depreciation for all securities in which there is an excess of tax cost over value were $199,122 and $4,642, respectively. Net unrealized appreciation for tax purposes is $194,480. |
DEFINITIONS:
144A | 144A Securities are registered pursuant to Rule 144A of the Securities Act of 1933. These securities are deemed to be liquid for purposes of compliance limitations on holdings of illiquid securities and may be resold as transactions exempt from registration, normally to qualified institutional buyers. At October 31, 2007, these securities aggregated $8,985 or 1.33% of net assets of the fund. |
| |
PCL | Public Company Limited |
The notes to the financial statements are an integral part of this report.
95
| | Percentage of | | | |
(unaudited) | | Total Investments | | Value | |
INVESTMENTS BY INDUSTRY: | | | | | |
Oil, Gas & Consumable Fuels | | 11.7 | % | $ | 75,896 | |
Commercial Banks | | 9.8 | % | 63,587 | |
Wireless Telecommunication Services | | 7.8 | % | 50,452 | |
Semiconductors & Semiconductor Equipment | | 6.9 | % | 44,629 | |
Metals & Mining | | 6.7 | % | 43,481 | |
IT Services | | 4.6 | % | 29,636 | |
Construction & Engineering | | 4.4 | % | 28,269 | |
Diversified Telecommunication Services | | 4.1 | % | 26,330 | |
Diversified Financial Services | | 3.6 | % | 23,223 | |
Automobiles | | 2.7 | % | 17,265 | |
Electronic Equipment & Instruments | | 2.6 | % | 16,689 | |
Food & Staples Retailing | | 2.4 | % | 15,636 | |
Thrifts & Mortgage Finance | | 2.4 | % | 15,325 | |
Energy Equipment & Services | | 2.3 | % | 15,123 | |
Household Durables | | 2.3 | % | 14,637 | |
Aerospace & Defense | | 2.1 | % | 13,596 | |
Road & Rail | | 1.9 | % | 12,521 | |
Industrial Conglomerates | | 1.9 | % | 12,104 | |
Beverages | | 1.8 | % | 11,908 | |
Real Estate Management & Development | | 1.8 | % | 11,779 | |
Media | | 1.6 | % | 10,272 | |
Insurance | | 1.5 | % | 10,022 | |
Personal Products | | 1.4 | % | 9,013 | |
Multiline Retail | | 1.4 | % | 8,881 | |
Tobacco | | 1.2 | % | 7,719 | |
Pharmaceuticals | | 1.1 | % | 7,293 | |
Food Products | | 1.1 | % | 6,982 | |
Auto Components | | 0.6 | % | 4,105 | |
Internet Software & Services | | 0.6 | % | 3,781 | |
Household Products | | 0.5 | % | 3,191 | |
Electrical Equipment | | 0.5 | % | 2,951 | |
Health Care Providers & Services | | 0.4 | % | 2,397 | |
Gas Utilities | | 0.3 | % | 1,960 | |
Hotels, Restaurants & Leisure | | 0.3 | % | 1,760 | |
Consumer Finance | | 0.3 | % | 1,687 | |
Chemicals | | 0.2 | % | 1,594 | |
Internet & Catalog Retail | | 0.1 | % | 805 | |
Computers & Peripherals | | 0.0 | % | 20 | |
Investment Securities, at value | | 96.9 | % | 626,519 | |
Short-Term Investments | | 3.1 | % | 19,776 | |
Total Investments | | 100.0 | % | $ | 646,295 | |
The notes to the financial statements are an integral part of this report.
96
TA IDEX Oppenheimer Small- & Mid - Cap Value
MARKET ENVIRONMENT
TA IDEX Oppenheimer Small- & Mid-Cap Value outperformed its benchmark, the Russell 2500 Value Index (“Russell 2500 Value”) for the annual reporting period. We attribute a majority of the portfolio’s outperformance to the success of our research driven, bottom-up stock selection process, which produced especially attractive results in the industrials, materials and information technology (“IT”) sectors. In addition, the portfolio also benefited from our shift toward mid-cap stocks, which outperformed small-cap securities over the period. Conversely, the financials sector detracted from performance.
The U.S. stock market continued to expand during the period, accompanied by solid corporate earnings, stable inflation and an active merger and acquisition environment. Bolstered by the economy’s strength, the market continued its steady rise through the end of February. At that point, the market environment quickly changed due to a confluence of negative events, which included new concerns over a slowdown in the economy and a brief but sharp stock market sell-off in China. By the start of the second quarter, the stock market had resumed its upward momentum, buoyed by strong economic growth, tame inflation and high levels of liquidity. However, market volatility increased by mid-summer, as turmoil in the debt markets sent stock prices down. Against this backdrop, the Federal Reserve Board moved aggressively to stop the spreading credit crunch from sinking the economy by cutting its target for the federal funds rate. The markets, in response, rebounded despite persistent inflation concerns. Market performance continued on a relatively positive course through the end of the reporting period; however, economic data remained mixed and commodity prices continued to rise.
PERFORMANCE
For the year ended October 31, 2007, TA IDEX Oppenheimer Small- & Mid-Cap Value, Class I returned 22.57%. By comparison its benchmark, the Russell 2500 Value, returned 4.63%. For the year ended October 31, 2007, the net expense ratio of the Fund was 1.03%.
STRATEGY REVIEW
Over the past year, we have seen a shift in valuations between small and mid-cap stocks, with mid-caps becoming more attractively valued. Given this, we increased the portfolio’s market capitalization weighting, a decision that helped performance as mid-caps outperformed small-caps stocks.
The portfolio’s best relative gains were achieved by holdings within the industrials, materials and IT sectors. Within the industrials sector, a top contributor included Foster Wheeler Ltd., an international engineering, construction and energy specialist that benefited as many energy companies continued to heavily invest in new infrastructure projects. In the materials sector, the portfolio’s holding in The Mosaic Company (“Mosaic”) added to performance. Mosaic, a producer of fertilizer, advanced on higher demand and better prices for its products, which enabled the company to increase prices. We eventually sold the portfolio’s position in Mosaic and took profits. Within the IT sector, a top-performer included Juniper Networks, Inc. (“Juniper”). Juniper, a provider of infrastructure and routers for internet service providers and telephone companies, posted strong results due to a highly successful new product cycle. We also exited this position and took profits.
The portfolio’s performance was slightly hindered by holdings in the financials sector. Within financials, a significant detractor included investments in online trading company, E*TRADE Financial Corporation (“E*TRADE”). Although the portfolio maintained an underweight position in the sub-prime mortgage area, it did have exposure through E*TRADE. Over the past few years, E*TRADE sought to diversify its business model and entered the mortgage market. However, this move hurt the company as it was negatively affected by credit concerns stemming from the sub-prime lending market.
As always, we will follow our research driven, bottom-up stock selection process in our pursuit of finding what, we believe, are good investment opportunities within the small- and mid-cap value universe. Accordingly, we will continue to search for companies across all market sectors that, in our view, offer strong earnings growth prospects, accomplished management teams and are trading at attractive valuations. We remain confident that our investment process is working to the benefit of our shareholders and believe it will continue to yield strong results over the long term.
John Damian
Portfolio Manager
OppenheimerFunds, Inc.
97
(unaudited)
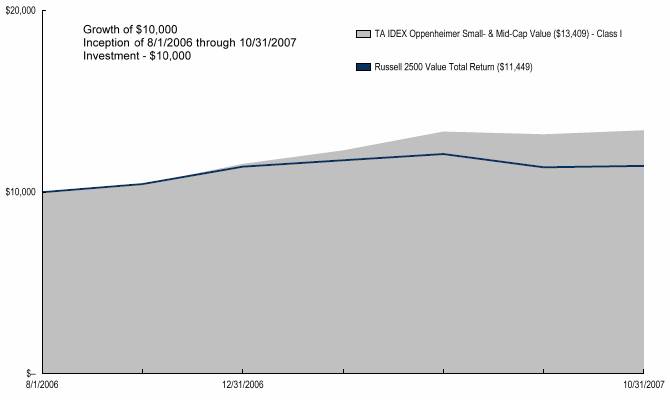
Average Annual Total Return for Periods Ended 10/31/2007
| | 1 Year | | From Inception | | Inception Date | |
Class I (NAV) | | 22.57 | % | 26.40 | % | 8/1/06 | |
Russell 2500 Value (1) | | 4.63 | % | 10.72 | % | 8/1/06 | |
NOTES
(1) The Russell 2500 Value (Russell 2500 Value) Index is an unmanaged index used as a general measure of market performance. Calculations assume dividends and capital gains are reinvested and do not include any managerial expenses. From inception calculation is based on life of Class I shares.
The performance data presented represents past performance, future results may vary. Performance data does not reflect the deduction of taxes that would be paid on fund distributions or the redemption of fund shares. Investment return and principal value will fluctuate so that an investor’s shares, when redeemed, may be worth more or less than their original cost. Current performance may be lower or higher than performance quoted. Please see www.transamericaidex.com for performance data current to the most recent month-end.
Net Asset Value (NAV) returns include the reinvestment of dividends and capital gains but do not reflect any sales charges.
Investing in small cap stocks generally involves greater risk and volatility, therefore an investment in the fund may not be appropriate for everyone.
This material must be preceded or accompanied by a current prospectus, which includes specific contents regarding the investment objectives and policies of this Fund.
The fund is only available in Class I shares, which are not available for direct investment by the public.
98
UNDERSTANDING YOUR FUND’S EXPENSES
(unaudited)
SHAREHOLDER EXPENSES
Fund shareholders may incur two types of costs: (1) transaction costs, including sales charges (loads) on purchases, contingent deferred sales charges on redemptions and redemption fees; and (2) ongoing costs, including management fees, dividend expense on short-sales, and other fund expenses.
The following Example is intended to help you understand your ongoing costs (in dollars and cents) of investing in the Fund and to compare these costs with the ongoing costs of investing in other funds.
The Example is based on an investment of $1,000 invested at May 1, 2007 and held for the entire period until October 31, 2007
ACTUAL EXPENSES
The first line in the table below provides information about actual account values and actual expenses. You may use the information in this line, together with the amount you invested, to estimate the expenses that you paid over the period. Simply divide your account value by $1,000 (for example, an $8,600 account value divided by $1,000 = 8.6), then multiply the result by the number in the first line of your Fund under the heading entitled “Expenses Paid During Period” to estimate the expenses you paid on your account during this period.
HYPOTHETICAL EXAMPLE FOR COMPARISON PURPOSES
The second line in the table below provides information about hypothetical account values and hypothetical expenses based on the Fund’s actual expense ratio and an assumed rate of return of 5% per year before expenses, which is not the Fund’s actual return. The hypothetical account values and expenses may not be used to estimate the actual ending account balance or expenses you paid for the period. You may use this information to compare the ongoing costs of investing in your Fund and other funds. To do so, compare this 5% hypothetical example with the 5% hypothetical examples that appear in the shareholder reports of the other funds.
Please note that the expenses shown in the table are meant to highlight your ongoing costs only and do not reflect any transactional costs, such as sales charges, redemption fees, brokerage commissions paid on purchases and sales of fund shares. Therefore, the second line under the Fund in the table is useful in comparing ongoing costs only, and will not help you determine the relative total costs of owning different funds. If any of these transaction costs were included, your costs would be higher. The expenses shown in the table do not reflect any fees that may be charged to you by brokers, financial intermediaries or other financial institutions.
| | Beginning
Account
Value | | Ending
Account
Value | | Annualized
Expense
Ratio | | Expenses
Paid During
Period (a) | |
Class I | | | | | | | | | |
Actual | | $ | 1,000.00 | | $ | 1,043.55 | | 1.00 | % | $ | 5.14 | |
Hypothetical (b) | | 1,000.00 | | 1,020.11 | | 1.00 | | 5.08 | |
| | | | | | | | | | | | |
(a) Expenses are calculated using the Fund’s annualized expense ratio (as disclosed in the table), multiplied by the average account value for the period, multiplied by the number of days in the period (184 days), and divided by the number of days in the year (365 days).
(b) 5% return per year before expenses.
GRAPHICAL PRESENTATION OF SCHEDULE OF INVESTMENTS
By Sector
At October 31, 2007

This chart shows the percentage breakdown by sector of the Fund’s total investment securities.
The notes to the financial statements are an integral part of this report.
99
SCHEDULE OF INVESTMENTS
At October 31, 2007
(all amounts except share amounts in thousands)
| | Shares | | Value | |
COMMON STOCKS (95.3%) | | | | | |
Aerospace & Defense (3.9%) | | | | | |
Alliant Techsystems, Inc. ‡^ | | 17,694 | | $ | 1,953 | |
Goodrich Corp. ^ | | 39,840 | | 2,776 | |
Spirit Aerosystems Holdings, Inc. | | 70,797 | | 2,458 | |
Class A ‡ | | | | | |
Air Freight & Logistics (0.6%) | | | | | |
Atlas Air Worldwide Holdings, Inc. ‡ | | 18,834 | | 1,104 | |
Auto Components (1.6%) | | | | | |
Goodyear Tire & Rubber Co. (The) ‡ | | 96,870 | | 2,921 | |
Biotechnology (0.4%) | | | | | |
Vanda Pharmaceuticals, Inc. ‡^ | | 50,860 | | 763 | |
Capital Markets (3.7%) | | | | | |
Affiliated Managers Group, Inc. ‡^ | | 17,694 | | 2,328 | |
E*Trade Financial Corp. ‡^ | | 233,194 | | 2,598 | |
Investment Technology Group, Inc. ‡ | | 45,811 | | 1,919 | |
Chemicals (3.2%) | | | | | |
Albemarle Corp. | | 36,213 | | 1,729 | |
FMC Corp. ‡ | | 30,010 | | 1,726 | |
Lubrizol Corp. | | 35,080 | | 2,381 | |
Commercial Banks (2.9%) | | | | | |
Colonial Bancgroup, Inc. (The) | | 91,820 | | 1,761 | |
East-West Bancorp, Inc. | | 58,085 | | 1,960 | |
Sterling Financial Corp./Wa | | 70,390 | | 1,584 | |
Computers & Peripherals (0.3%) | | | | | |
Seagate Technology | | 17,401 | | 484 | |
Construction & Engineering (1.1%) | | | | | |
Foster Wheeler, Ltd. ‡ | | 6,857 | | 1,016 | |
KBR, Inc. ‡ | | 22,430 | | 962 | |
Construction Materials (1.7%) | | | | | |
Martin Marietta Materials, Inc. ^ | | 9,736 | | 1,259 | |
Texas Industries, Inc. | | 24,753 | | 1,809 | |
Electric Utilities (3.1%) | | | | | |
Cleco Corp. | | 99,540 | | 2,623 | |
CMS Energy Corp. | | 176,988 | | 3,003 | |
Electrical Equipment (2.2%) | | | | | |
Ametek, Inc. | | 49,348 | | 2,319 | |
Cooper Industries, Ltd. Class A | | 31,858 | | 1,669 | |
Electronic Equipment & Instruments (2.3%) | | | | | |
Agilent Technologies, Inc. ‡ | | 60,274 | | 2,221 | |
Amphenol Corp. Class A | | 45,708 | | 2,024 | |
Energy Equipment & Services (2.3%) | | | | | |
Exterran Holdings, Inc. ‡ | | 21,970 | | 1,850 | |
National Oilwell Varco, Inc. ‡ | | 14,172 | | 1,038 | |
Weatherford International, Ltd. ‡ | | 21,036 | | 1,365 | |
Food & Staples Retailing (2.0%) | | | | | |
Costco Wholesale Corp. | | 14,060 | | 946 | |
Longs Drug Stores Corp. | | 18,590 | | 976 | |
Pantry, Inc. (The) ‡^ | | 63,386 | | 1,776 | |
Food Products (1.8%) | | | | | |
Chiquita Brands International, Inc. ‡^ | | 79,300 | | 1,487 | |
ConAgra Foods, Inc. | | 77,340 | | 1,835 | |
Gas Utilities (1.2%) | | | | | |
Southern Union Co. | | 72,573 | | 2,286 | |
Health Care Equipment & Supplies (1.3%) | | | | | |
Hospira, Inc. ‡ | | 56,010 | | $ | 2,315 | |
Health Care Providers & Services (4.6%) | | | | | |
Community Health Systems, Inc. ‡ | | 52,750 | | 1,737 | |
Davita, Inc. ‡ | | 35,157 | | 2,292 | |
Health Net, Inc. ‡ | | 43,939 | | 2,355 | |
Medco Health Solutions, Inc. ‡ | | 21,231 | | 2,004 | |
Hotels, Restaurants & Leisure (4.3%) | | | | | |
Gaylord Entertainment Co. ‡ | | 35,160 | | 1,916 | |
Panera Bread Co. Class A ‡^ | | 35,200 | | 1,443 | |
Penn National Gaming, Inc. ‡ | | 24,131 | | 1,490 | |
Pinnacle Entertainment, Inc. ‡ | | 70,310 | | 2,053 | |
Scientific Games Corp. Class A ‡ | | 27,566 | | 996 | |
Household Durables (0.8%) | | | | | |
Jarden Corp. ‡ | | 42,418 | | 1,507 | |
Independent Power Producers & Energy Traders (3.9%) | | | | | |
AES Corp. (The) ‡ | | 106,158 | | 2,273 | |
Dynegy, Inc. Class A ‡ | | 176,990 | | 1,630 | |
Mirant Corp. ‡ | | 30,093 | | 1,275 | |
NRG Energy, Inc. ‡ | | 42,240 | | 1,928 | |
Insurance (6.4%) | | | | | |
ACE, Ltd. | | 19,438 | | 1,178 | |
Everest RE Group, Ltd. | | 28,144 | | 2,998 | |
Fidelity National Financial, Inc. Class A | | 58,351 | | 898 | |
National Financial Partners Corp. | | 52,218 | | 2,855 | |
Platinum Underwriters Holdings, Ltd. | | 10,413 | | 375 | |
Protective Life Corp. | | 52,570 | | 2,254 | |
Validus Holdings, Ltd. ‡^ | | 42,180 | | 1,092 | |
IT Services (1.2%) | | | | | |
Affiliated Computer Services, Inc. | | 41,800 | | 2,118 | |
Class A ‡ | | | | | |
Leisure Equipment & Products (1.8%) | | | | | |
Brunswick Corp. | | 46,330 | | 1,034 | |
Mattel, Inc. | | 105,470 | | 2,203 | |
Life Sciences Tools & Services (0.8%) | | | | | |
Thermo Fisher Scientific, Inc. ‡ | | 25,944 | | 1,526 | |
Machinery (4.6%) | | | | | |
Greenbrier Cos., Inc. ^ | | 42,690 | | 1,140 | |
Joy Global, Inc. | | 52,649 | | 3,057 | |
Kaydon Corp. ^ | | 42,180 | | 2,269 | |
Navistar International Corp. ‡ | | 29,881 | | 1,882 | |
Marine (1.4%) | | | | | |
Eagle Bulk Shipping, Inc. ‡^ | | 56,790 | | 1,936 | |
Navios Maritime Holdings, Inc. | | 30,090 | | 544 | |
Media (2.8%) | | | | | |
Cablevision Systems Corp. Class A ‡ | | 17,383 | | 510 | |
Cinemark Holdings, Inc. | | 53,090 | | 914 | |
Liberty Global, Inc. Class A ‡ | | 46,859 | | 1,839 | |
Liberty Global, Inc. Series C, Class C ‡^ | | 48,778 | | 1,789 | |
Metals & Mining (1.7%) | | | | | |
Carpenter Technology Corp. | | 21,970 | | 3,184 | |
Oil, Gas & Consumable Fuels (5.3%) | | | | | |
Capital Product Partners LP ^ | | 35,390 | | 952 | |
Continental Resources, Inc./Ok ‡ | | 61,050 | | 1,435 | |
The notes to the financial statements are an integral part of this report.
100
| | Shares | | Value | |
Oil, Gas & Consumable Fuels (continued) | | | | | |
CVR Energy, Inc. ‡ | | 35,160 | | $ | 802 | |
Delta Petroleum Corp. ‡^ | | 70,790 | | 1,324 | |
Murphy Oil Corp. | | 23,810 | | 1,753 | |
Peabody Energy Corp. | | 26,561 | | 1,481 | |
Range Resources Corp. | | 44,253 | | 1,988 | |
Personal Products (1.2%) | | | | | |
Herbalife, Ltd. | | 52,060 | | 2,295 | |
Real Estate Investment Trusts (1.6%) | | | | | |
American Financial Realty Trust REIT | | 84,507 | | 570 | |
BioMed Realty Trust, Inc. REIT | | 38,946 | | 930 | |
Dupont Fabros Technology, Inc. REIT ‡ | | 26,390 | | 567 | |
General Growth Properties, Inc. REIT | | 17,660 | | 960 | |
Real Estate Management & Development (0.1%) | | | | | |
Meruelo Maddux Properties, Inc. ‡ | | 33,910 | | 163 | |
Road & Rail (0.5%) | | | | | |
JB Hunt Transport Services, Inc. | | 35,406 | | 982 | |
Semiconductors & Semiconductor Equipment (4.9%) | | | | | |
ASML Holding NV Class G ‡^ | | 52,731 | | 1,841 | |
FormFactor, Inc. ‡ | | 35,347 | | 1,383 | |
LAM Research Corp. ‡ | | 36,980 | | 1,856 | |
Maxim Integrated Products, Inc. | | 70,440 | | 1,909 | |
Varian Semiconductor Equipment Associates, Inc. | | 43,420 | | 1,998 | |
Software (5.6%) | | | | | |
Activision, Inc. ‡ | | 35,231 | | $ | 833 | |
Amdocs, Ltd. ‡ | | 53,090 | | 1,826 | |
Electronic Arts, Inc. ‡^ | | 35,190 | | 2,151 | |
McAfee, Inc. ‡ | | 63,540 | | 2,628 | |
THQ, Inc. ‡^ | | 104,978 | | 2,844 | |
Specialty Retail (2.8%) | | | | | |
Advance Auto Parts, Inc. | | 56,249 | | 1,919 | |
OfficeMax, Inc. ^ | | 58,000 | | 1,836 | |
Urban Outfitters, Inc. ‡^ | | 52,729 | | 1,332 | |
Thrifts & Mortgage Finance (1.3%) | | | | | |
NewAlliance Bancshares, Inc. ^ | | 176,990 | | 2,476 | |
Wireless Telecommunication Services (2.1%) | | | | | |
Crown Castle International Corp. ‡ | | 53,096 | | 2,180 | |
NII Holdings, Inc. ‡ | | 28,100 | | 1,630 | |
Total Common Stocks (cost $157,578) | | | | 174,562 | |
| | | | | |
Total Security Lending Collateral (cost $31,688) ± | | | | 31,688 | |
Total Investment Securities (cost $189,266) # | | | | $ | 206,250 | |
NOTES TO SCHEDULE OF INVESTMENTS
^ At October 31, 2007, all or a portion of this security is on loan (see Note 1). The value at October 31, 2007, of all securities on loan is $30,374.
± Cash collateral for the Repurchase Agreements, valued at $5,783, that serve as collateral for securities lending, are invested in corporate and government bonds with interest rates and maturity dates ranging from 0.00% - 8.125% and 11/14/2007 - 9/15/2037.
‡ Non Income Producing
# Aggregate cost for federal income tax purposes is $189,798. Aggregate gross unrealized appreciation for all securities in which there is an excess of value over tax cost and aggregate gross unrealized depreciation for all securities in which there is an excess of tax cost over value were $22,521 and $6,069, respectively. Net unrealized appreciation for tax purposes is $16,452.
DEFINITIONS
REIT Real Estate Investment Trust
The notes to the financial statements are an integral part of this report.
101
TA IDEX Third Avenue Value
MARKET ENVIRONMENT
During the summer, the market in the U.S. in particular, experienced a real credit crisis, which has been most severe for those companies that require access to the capital markets on a regular basis. While the portfolio was negatively impacted by these events, we emphasize that these are not the types of companies in which TA IDEX Third Avenue Value invests. Throughout our management firm’s more than two decades of existence, we have experienced several bear markets, yet the macro market environment has never influenced our investment process. We are long-term investors focused on well-capitalized companies, with strong management teams, trading at discounts to readily ascertainable net asset values.
PERFORMANCE
For the period from inception May 1, 2007 through October 31, 2007, TA IDEX Third Avenue Value, Class I returned 3.29%. By comparison its benchmark, the Russell 3000 Value Index, returned 0.53%. For the year ended October 31, 2007, the net expense ratio of the Fund was 0.86%.
STRATEGY REVIEW
How did you manage the portfolio in this market environment?
While we are benchmark agnostic, bottom-up focused investors, we have been pleased with the portfolio’s strong outperformance for the period. Note that our strategy does not change, regardless of general macro conditions. We do not manage portfolios in response to near-term market conditions. We remain opportunistic, focusing on attractively priced issues of companies with robust balance sheets and strong management teams.
We remain pleased with the overall quality of the portfolio, and are encouraged by the solid business fundamentals of our holdings.
Which individual holdings had the greatest positive impact on performance?
Korean steel maker POSCO was the portfolio’s top contributor for the period, as it was positively impacted by strong steel prices and a favorable global demand environment. This was followed by the Canadian exploration and production company, Encana Corporation (which has benefited from an attractive resource base and a disciplined approach, despite ongoing volatility in the energy market) and Cheung Kong (Holdings) Limited. The latter is a diversified holding company in Hong Kong, which was positively influenced by a favorable market environment in Hong Kong, particularly in the real estate arena.
Which individual holdings had the greatest negative impact on performance?
On the downside, the portfolio was negatively impacted by MBIA Inc., Radian Asset Assurance Inc. and Ambac Financial Group, Inc., all of which have seen deterioration amid the recent credit crunch and mortgage upheaval in the U.S. Despite these macro headwinds, we believe our holdings remain well-capitalized and well-managed with valuations that have become even more compelling.
Which sectors/industries had the greatest impact on performance?
On the positive side, it has been materials (steel in particular), energy and select real estate, that contributed to the portfolio’s performance, while on the downside, it has been the financial sector which has created the most notable drag to performance.
Which countries had the greatest impact on performance?
On the positive side, the Asia region (Korea and Hong Kong) and Canada had the most beneficial impact. On the downside, the U.S. market detracted from performance.
Ian Lapey
Curtis R. Jensen
Kathleen Crawford
Co-Portfolio Managers
Third Avenue Management LLC
102
(unaudited)
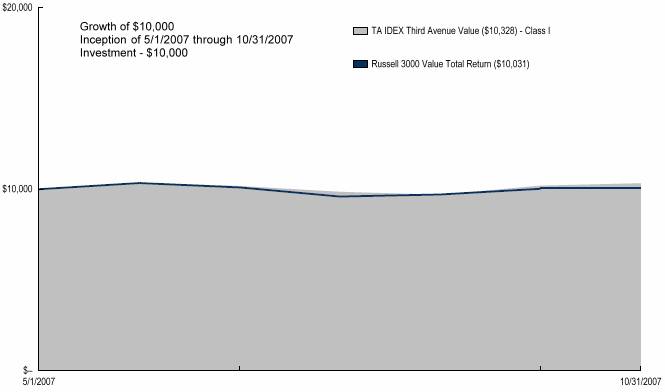
Average Annual Total Return for Period Ended 10/31/2007
| | From Inception | | Inception Date | |
Class I (NAV) | | 3.29 | % | 5/1/07 | |
Russell 3000 Value Total Return(1) | | 0.53 | % | 5/1/07 | |
NOTES
(1) The Russell 3000 Value (Russell 3000 Value) Index is unmanaged index used as a general measure of market performance. Calculations assume dividends and capital gains are reinvested and do not include any managerial expenses. From inception calculation is based on life of Class I shares.
The performance data presented represents past performance, future results may vary. The portfolio’s investment return and net asset value will fluctuate. Past performance does not guarantee future results. Investor’s units when redeemed, may be worth more or less than their original cost.
Current performance may be higher or lower than the performance data quoted. Please see www.transamericaidex.com for performance data curren to the most recent month-end. Portfolio performance is net of investment fees and fund expenses, but not product charges, which, if included, would significantly lower the performance quoted.
This material must be preceded or accompanied by a current prospectus, which includes specific contents regarding the investment objectives, explanation of share classes and policies of this portfolio.
This fund is only available in Class I shares, which are not available for direct investment by the public.
103
UNDERSTANDING YOUR FUND’S EXPENSES
(unaudited)
SHAREHOLDER EXPENSES
Fund shareholders may incur two types of costs: (1) transaction costs, including sales charges (loads) on purchases, contingent deferred sales charges on redemptions and redemption fees; and (2) ongoing costs, including management fees, dividend expense on short-sales, and other fund expenses.
The following Example is intended to help you understand your ongoing costs (in dollars and cents) of investing in the Fund and to compare these costs with the ongoing costs of investing in other funds.
The Example is based on an investment of $1,000 invested at May 1, 2007 and held for the entire period until October 31, 2007.
ACTUAL EXPENSES
The first line in the table below provides information about actual account values and actual expenses. You may use the information in this line, together with the amount you invested, to estimate the expenses that you paid over the period. Simply divide your account value by $1,000 (for example, an $8,600 account value divided by $1,000 = 8.6), then multiply the result by the number in the first line of your Fund under the heading entitled “Expenses Paid During Period” to estimate the expenses you paid on your account during this period.
HYPOTHETICAL EXAMPLE FOR COMPARISON PURPOSES
The second line in the table below provides information about hypothetical account values and hypothetical expenses based on the Fund’s actual expense ratio and an assumed rate of return of 5% per year before expenses, which is not the Fund’s actual return. The hypothetical account values and expenses may not be used to estimate the actual ending account balance or expenses you paid for the period. You may use this information to compare the ongoing costs of investing in your Fund and other funds. To do so, compare this 5% hypothetical example with the 5% hypothetical examples that appear in the shareholder reports of the other funds.
Please note that the expenses shown in the table are meant to highlight your ongoing costs only and do not reflect any transactional costs, such as sales charges, redemption fees, brokerage commissions paid on purchases and sales of fund shares. Therefore, the second line under the Fund in the table is useful in comparing ongoing costs only, and will not help you determine the relative total costs of owning different funds. If any of these transaction costs were included, your costs would be higher. The expenses shown in the table do not reflect any fees that may be charged to you by brokers, financial intermediaries or other financial institutions.
| | Beginning
Account
Value | | Ending
Account
Value | | Annualized
Expense
Ratio | | Expenses
Paid During
Period (a) | |
Class I | | | | | | | | | |
Actual | | $ | 1,000.00 | | $ | 1,032.86 | | 0.86 | % | $ | 4.39 | |
Hypothetical (b) | | 1,000.00 | | 1,020.81 | | 0.86 | | 4.37 | |
| | | | | | | | | | | | |
(a) Expenses are calculated using the Fund’s annualized expense ratio (as disclosed in the table), multiplied by the average account value for the period, multiplied by the number of days in the period (184 days), and divided by the number of days in the year (365 days).
(b) 5% return per year before expenses.
GRAPHICAL PRESENTATION OF SCHEDULE OF INVESTMENTS
By Sector
At October 31, 2007
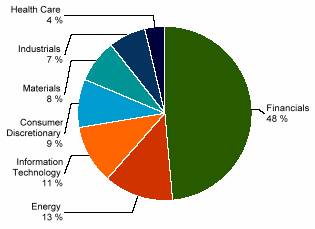
This chart shows the percentage breakdown by sector of the Fund’s total investment securities.
104
SCHEDULE OF INVESTMENTS
At October 31, 2007
(all amounts except share amounts in thousands)
| | Shares | | Value | |
CONVERTIBLE PREFERRED STOCKS (1.1%) | | | | | |
Canada (1.1%) | | | | | |
Canfor Pulp Income Fund | | 148,410 | | $ | 1,935 | |
Timberwest Forest Corp. | | 362,500 | | 5,725 | |
Total Convertible Preferred Stocks (cost $7,619) | | | | 7,660 | |
| | | | | |
COMMON STOCKS (86.7%) | | | | | |
Bermuda (3.2%) | | | | | |
Arch Capital Group, Ltd. ‡ | | 159,444 | | 11,921 | |
Montpelier RE Holdings, Ltd. | | 256,461 | | 4,591 | |
Nabors Industries, Ltd. ‡ | | 196,865 | | 5,528 | |
Canada (12.8%) | | | | | |
Brookfield Asset Management, Inc. Class A | | 730,436 | | 29,794 | |
Canfor Corp. ‡ | | 1,087,723 | | 10,021 | |
E-L Financial Corp., Ltd. | | 4,786 | | 3,149 | |
EnCana Corp. | | 377,000 | | 26,277 | |
Power Corp. of Canada | | 421,664 | | 17,989 | |
Hong Kong (10.0%) | | | | | |
Cheung Kong Holdings, Ltd. ‡ | | 939,153 | | 18,260 | |
Chong Hing Bank, Ltd. | | 1,391,190 | | 3,249 | |
Hang Lung Group, Ltd. | | 383,692 | | 2,247 | |
Hang Lung Properties, Ltd. | | 1,703,749 | | 8,100 | |
Henderson Land Development Co., Ltd. | | 1,465,538 | | 13,047 | |
Hutchison Whampoa International, Ltd. ‡ | | 1,391,888 | | 17,347 | |
Wharf Holdings, Ltd. ‡ | | 897,884 | | 5,364 | |
Japan (9.1%) | | | | | |
AIOI Insurance Co., Ltd. | | 424,627 | | 2,453 | |
Daiichi Sankyo Co., Ltd. | | 260,386 | | 7,386 | |
Millea Holdings, Inc. | | 350,080 | | 13,338 | |
Mitsui Fudosan Co., Ltd. | | 357,462 | | 9,798 | |
Mitsui Sumitomo Insurance Co., Ltd. | | 422,173 | | 4,804 | |
Sapporo Breweries ^ | | 1,018,000 | | 7,638 | |
Toyota Industries Corp. | | 384,807 | | 16,356 | |
Korea, Republic of (4.3%) | | | | | |
POSCO ^ | | 159,261 | | 29,264 | |
Norway (0.5%) | | | | | |
Bw Gas ASA ^ | | 260,194 | | 3,499 | |
Sweden (1.3%) | | | | | |
Investor AB Class A | | 357,146 | | 8,647 | |
United States (45.5%) | | | | | |
Alamo Group, Inc. | | 215,771 | | 4,678 | |
Alexander & Baldwin, Inc. ^ | | 67,120 | | 3,516 | |
Alliance Data Systems Corp. ‡ | | 106,600 | | 8,571 | |
AMBAC Financial Group, Inc. | | 99,945 | | 3,681 | |
Applied Materials, Inc. | | 163,961 | | 3,184 | |
AVX Corp. ^ | | 765,024 | | 11,820 | |
Bank of New York Mellon Corp. | | 680,052 | | $ | 33,221 | |
BEL Fuse, Inc. Class A | | 67,927 | | 2,359 | |
BEL Fuse, Inc. Class B | | 32,539 | | 1,035 | |
Borland Software Corp. ‡^ | | 859,390 | | 3,764 | |
Brookline Bancorp, Inc. | | 360,858 | | 3,883 | |
Capital Southwest Corp. ^ | | 17,256 | | 2,108 | |
Cimarex Energy Co. | | 426,128 | | 17,262 | |
CIT Group, Inc. | | 107,017 | | 3,771 | |
Cross Country Healthcare, Inc. ‡ | | 230,156 | | 3,616 | |
Electro Scientific Industries, Inc. ‡ | | 211,867 | | 4,623 | |
Forest City Enterprises, Inc. Class A | | 266,577 | | 15,174 | |
Handleman Co. | | 666,618 | | 1,567 | |
IDT Corp. Class B ^ | | 335,786 | | 2,696 | |
Intel Corp. | | 395,961 | | 10,651 | |
Jakks Pacific, Inc. ‡ | | 240,256 | | 6,367 | |
Leapfrog Enterprises, Inc. Class A ‡^ | | 681,689 | | 5,106 | |
Legg Mason, Inc. | | 157,952 | | 13,101 | |
Lexmark International, Inc. Class A ‡^ | | 159,108 | | 6,681 | |
Liberty Media Corp. - Capital Series A, | | 25,096 | | 3,136 | |
Class A ‡ | | | | | |
Liberty Media Corp. - Interactive | | 125,481 | | 2,664 | |
Class A ‡ | | | | | |
MBIA, Inc. | | 166,694 | | 7,174 | |
MDC Holdings, Inc. | | 183,324 | | 7,426 | |
MGIC Investment Corp. ^ | | 185,000 | | 3,582 | |
NewAlliance Bancshares, Inc. ^ | | 487,535 | | 6,821 | |
Nuveen Investments, Inc. Class A | | 122,351 | | 7,928 | |
Pfizer, Inc. | | 439,423 | | 10,814 | |
Phoenix Cos., Inc. (The) | | 191,009 | | 2,632 | |
Pogo Producing Co. | | 298,559 | | 17,782 | |
ProLogis REIT | | 73,930 | | 5,304 | |
Radian Group, Inc. ^ | | 360,585 | | 4,540 | |
St Joe Co. (The) ^ | | 172,829 | | 5,852 | |
St. Mary Land & Exploration Co. | | 124,198 | | 5,261 | |
Superior Industries International, Inc. ^ | | 497,876 | | 10,062 | |
Sycamore Networks, Inc. ‡ | | 1,383,183 | | 5,906 | |
Tejon Ranch Co. ‡^ | | 76,574 | | 3,069 | |
Tellabs, Inc. ‡ | | 594,679 | | 5,239 | |
Trinity Industries, Inc. ^ | | 171,156 | | 6,186 | |
USG Corp. ‡^ | | 218,401 | | 8,681 | |
Westwood Holdings Group, Inc. | | 159,653 | | 6,067 | |
Total Common Stocks (cost $579,641) | | | | 588,628 | |
| | | | | |
Total Security Lending Collateral (cost $101,498) | | | | 101,498 | |
Total Investment Securities (cost $688,758) # | | | | $ | 697,786 | |
| | | | | | | |
The notes to the financial statements are an integral part of this report.
105
NOTES TO SCHEDULE OF INVESTMENTS
^ At October 31, 2007, all or a portion of this security is on loan (see Note 1). The value at October 31, 2007, of all securities on loan is $97,709.
‡ Non Income Producing
# Aggregate cost for federal income tax purposes is $694,804. Aggregate gross unrealized appreciation for all securities in which there is an excess of value over tax cost and aggregate gross unrealized depreciation for all securities in which there is an excess of tax cost over value were $56,785 and $53,803, respectively. Net unrealized appreciation for tax purposes is $2,982.
DEFINITIONS
REIT Real Estate Investment Trust
The notes to the financial statements are an integral part of this report.
106
(unaudited) | | Percentage of
Total Investments | | Value | |
INVESTMENTS BY INDUSTRY: | | | | | |
Real Estate Management & Development | | 15.9 | % | $ | 110,705 | |
Insurance | | 10.3 | % | 71,734 | |
Oil, Gas & Consumable Fuels | | 10.0 | % | 70,081 | |
Commercial Banks | | 5.2 | % | 36,469 | |
Metals & Mining | | 4.2 | % | 29,264 | |
Capital Markets | | 4.2 | % | 29,204 | |
Auto Components | | 3.8 | % | 26,418 | |
Thrifts & Mortgage Finance | | 2.7 | % | 18,825 | |
Pharmaceuticals | | 2.6 | % | 18,200 | |
Paper & Forest Products | | 2.5 | % | 17,680 | |
Industrial Conglomerates | | 2.5 | % | 17,347 | |
Electronic Equipment & Instruments | | 2.4 | % | 16,443 | |
Communications Equipment | | 2.1 | % | 14,540 | |
Semiconductors & Semiconductor Equipment | | 2.0 | % | 13,835 | |
Diversified Financial Services | | 1.8 | % | 12,418 | |
Leisure Equipment & Products | | 1.6 | % | 11,473 | |
Machinery | | 1.6 | % | 10,863 | |
Building Products | | 1.2 | % | 8,681 | |
IT Services | | 1.2 | % | 8,571 | |
Beverages | | 1.1 | % | 7,638 | |
Household Durables | | 1.1 | % | 7,426 | |
Computers & Peripherals | | 1.0 | % | 6,681 | |
Energy Equipment & Services | | 0.8 | % | 5,528 | |
Real Estate Investment Trusts | | 0.8 | % | 5,304 | |
Software | | 0.5 | % | 3,764 | |
Health Care Providers & Services | | 0.5 | % | 3,616 | |
Marine | | 0.5 | % | 3,516 | |
Media | | 0.4 | % | 3,137 | |
Diversified Telecommunication Services | | 0.4 | % | 2,696 | |
Internet & Catalog Retail | | 0.4 | % | 2,664 | |
Trading Companies & Distributors | | 0.2 | % | 1,567 | |
Investment Securities, at value | | 85.5 | % | 596,288 | |
Short-Term Investments | | 14.5 | % | 101,498 | |
Total Investments | | 100.0 | % | $ | 697,786 | |
The notes to the financial statements are an integral part of this report.
107
TA IDEX Transamerica Short-Term Bond
MARKET ENVIRONMENT
The twelve months ended October 31, 2007, and in particular the last three months, was a volatile period for U.S. bond markets as hopes of a Federal Reserve Board (“Fed”) interest-rate cut alternately grew, faded and rose again over the course of the year.
Initially, bond markets responded positively to signs that the housing market and economy were slowing. By spring, unexpected vigor in the economy, as evidenced by strong consumer spending in the face of high gas prices and weaker home prices, caused the market to retreat. Market volatility then intensified when news of growing defaults in higher-yielding (sub-prime) mortgages spread at the same time that banks needed to remove from their balance sheets (i.e., sell) a large number of leveraged-buyout loans. Major banks and others had invested in pools of the sub-prime mortgages, in many cases using those investments as collateral for their own debt securities. Suddenly concerned about how much sub-prime exposure borrowers were carrying in their portfolios, lenders and bond investors tightened credit standards and demanded higher yields on non-Treasury debt. Wary buyers withdrew support from the markets. The sub-prime debacle escalated, liquidity diminished, and the differences between yields on Treasuries and other fixed-income securities (i.e., credit spreads) widened until the Fed intervened.
Throughout the period, inflation was a key concern for the Fed. However, with housing continuing to slide and the economy and employment growth showing signs of slowing, during August to October, the Fed lowered the discount and federal funds rates by 1.25% and 0.75%, respectively, to restore confidence and bolster the economy.
Against this backdrop, U.S. Treasury yields declined, especially for the shortest-term securities, and the yield curve steepened. Treasuries outperformed other sectors (corporate bonds and mortgage-backed securities). The Merrill Lynch U.S. Corporate & Government 1-3 Year Index (“MLCG”) generated a twelve-month total return of 5.67%.
PERFORMANCE
For the year ended October 31, 2007, TA IDEX Short-Term Bond, Class I returned 4.45%. By comparison its benchmark, the MLCG, returned 5.67%. For the year ended October 31, 2007, the net expense ratio of the Fund was 0.67%.
STRATEGY REVIEW
Throughout the period, the portfolio generated strong yields, due to an overweighting in corporate securities and carefully defined investments in mortgage-backed securities (“MBS”). The portfolio had no sub-prime exposure and invested only in high-quality MBS guaranteed by agencies of the federal government.
Later, we anticipated the general turmoil in non-government bonds and reduced the overweighting in corporate bonds. We also underweighted the homebuilding and financial industries while overweighting high-quality industrial bonds. Nonetheless, the portfolio lagged its index during the heightened turmoil, as short-term credit spreads widened and investors favored Treasuries over non-government bonds. We used this opportunity to purchase bonds in the more stable industrial, utilities and real estate investment trust (“REIT”) industries.
Greg D. Haendel, CFA
Heidi Y. Hu, CFA
Derek S. Brown, CFA
Co-Portfolio Managers
Transamerica Investment Management, LLC
108
(unaudited)
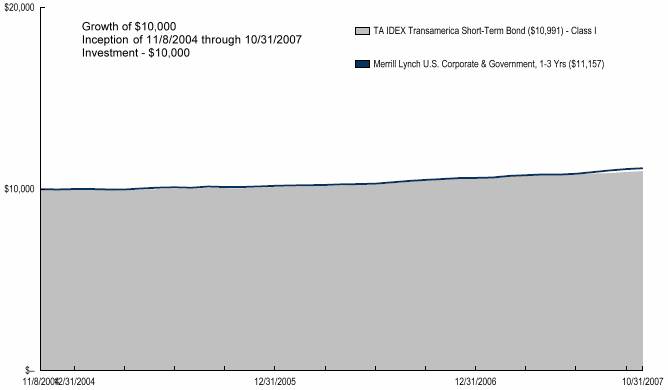
Average Annual Total Return for Periods Ended 10/31/2007
| | 1 Year | | From Inception | | Inception Date | |
Class I (NAV) | | 4.45 | % | 3.22 | % | 11/8/04 | |
Merrill Lynch U.S. Corporate & Government, 1-3 Yrs(1) | | 5.67 | % | 3.74 | % | 11/8/04 | |
NOTES
(1) The Merrill Lynch U.S. Corporate and Government 1-3 year (MLCG) Index is an unmanaged index used as a general measure of market performance. Calculations assume dividends and capital gains are reinvested and do not include any managerial expenses. From inception calculation is based on life of the Fund.
The performance data presented represents past performance, future results may vary. Performance data does not reflect the deduction of taxes that would be paid on fund distributions or the redemption of fund shares. Investment return and principal value will fluctuate so that an investor’s shares, when redeemed, may be worth more or less than their original cost. Current performance may be lower or higher than performance quoted. Please see www.transamericaidex.com for performance data current to the most recent month-end.
Net Asset Value (NAV) returns include the reinvestment of dividends and capital gains. Fund shares are sold without a sales load.
This material must be preceded or accompanied by a current prospectus, which includes specific contents regarding the investment objectives and policies of this fund.
This fund is only available in Class I shares, which are not available for direct investment by the public.
109
UNDERSTANDING YOUR FUND’S EXPENSES
(unaudited)
SHAREHOLDER EXPENSES
Fund shareholders may incur two types of costs: (1) transaction costs, including sales charges (loads) on purchases, contingent deferred sales charges on redemptions and redemption fees; and (2) ongoing costs, including management fees, dividend expense on short-sales, and other fund expenses.
The following Example is intended to help you understand your ongoing costs (in dollars and cents) of investing in the Fund and to compare these costs with the ongoing costs of investing in other funds.
The Example is based on an investment of $1,000 invested at May 1, 2007 and held for the entire period until October 31, 2007.
ACTUAL EXPENSES
The first line in the table below provides information about actual account values and actual expenses. You may use the information in this line, together with the amount you invested, to estimate the expenses that you paid over the period. Simply divide your account value by $1,000 (for example, an $8,600 account value divided by $1,000 = 8.6), then multiply the result by the number in the first line of your Fund under the heading entitled “Expenses Paid During Period” to estimate the expenses you paid on your account during this period.
HYPOTHETICAL EXAMPLE FOR COMPARISON PURPOSES
The second line in the table below provides information about hypothetical account values and hypothetical expenses based on the Fund’s actual expense ratio and an assumed rate of return of 5% per year before expenses, which is not the Fund’s actual return. The hypothetical account values and expenses may not be used to estimate the actual ending account balance or expenses you paid for the period. You may use this information to compare the ongoing costs of investing in your Fund and other funds. To do so, compare this 5% hypothetical example with the 5% hypothetical examples that appear in the shareholder reports of the other funds.
Please note that the expenses shown in the table are meant to highlight your ongoing costs only and do not reflect any transactional costs, such as sales charges, redemption fees, brokerage commissions paid on purchases and sales of fund shares. Therefore, the second line under the Fund in the table is useful in comparing ongoing costs only, and will not help you determine the relative total costs of owning different funds. If any of these transaction costs were included, your costs would be higher. The expenses shown in the table do not reflect any fees that may be charged to you by brokers, financial intermediaries or other financial institutions.
| | Beginning
Account
Value | | Ending
Account
Value | | Annualized
Expense
Ratio | | Expenses
Paid During
Period (a) | |
Class I | | | | | | | | | |
Actual | | $ | 1,000.00 | | $ | 1,016.80 | | 0.67 | % | $ | 3.40 | |
Hypothetical (b) | | 1,000.00 | | 1,021.77 | | 0.67 | | 3.40 | |
| | | | | | | | | | | | |
(a) Expenses are calculated using the Fund’s annualized expense ratio (as disclosed in the table), multiplied by the average account value for the period, multiplied by the number of days in the period (184 days), and divided by the number of days in the year (365 days).
(b) 5% return per year before expenses.
GRAPHICAL PRESENTATION OF SCHEDULE OF INVESTMENTS
By Bond Credit Quality (Moody Ratings)
At October 31, 2007

This chart shows the percentage breakdown by bond credit quality of the Fund’s total investment securities.
110
SCHEDULE OF INVESTMENTS
At October 31, 2007
(all amounts except share amounts in thousands)
| | Principal | | Value | |
U.S. GOVERNMENT AGENCY OBLIGATIONS (18.1%) | | | | | |
Fannie Mae | | | | | |
4.50%, due 09/25/2020 | | $ | 6,475 | | $ | 6,400 | |
5.00%, due 10/25/2032 – 06/25/2034 * | | 23,539 | | 23,284 | |
5.50%, due 03/25/2026 | | 10,643 | | 10,670 | |
Freddie Mac | | | | | |
5.00%, due 06/15/2027 – 11/15/2032 | | 20,140 | | 19,964 | |
5.35%, due 11/14/2011 | | 11,000 | | 11,088 | |
5.50%, due 04/15/2024 – 01/15/2029 | | 21,901 | | 22,068 | |
Ginnie Mae | | | | | |
4.50%, due 01/17/2033 | | 8,595 | | 8,521 | |
Total U.S. Government Agency Obligations (cost $100,850) | | | | 101,995 | |
| | | | | |
MORTGAGE-BACKED SECURITIES (3.5%) | | | | | |
Crown Castle Towers LLC | | | | | |
5.47%, due 11/15/2036 | | 5,000 | | 4,997 | |
Global Signal Trust | | | | | |
Series 2004-2A, Class D | | | | | |
5.09%, due 12/15/2014 | | 9,750 | | 9,591 | |
SBA CMBS Trust | | | | | |
6.17%, due 11/15/2036 | | 5,000 | | 4,889 | |
Total Mortgage-Backed Securities (cost $19,611) | | | | 19,477 | |
| | | | | |
ASSET-BACKED SECURITIES (0.7%) | | | | | |
USAA Auto Owner Trust | | | | | |
Series 2007-2, Class A3 | | | | | |
4.90%, due 02/15/2012 | | 4,000 | | 4,010 | |
Total Asset-Backed Securities (cost $3,999) | | | | 4,010 | |
| | | | | |
CORPORATE DEBT SECURITIES (76.3%) | | | | | |
Aerospace & Defense (1.5%) | | | | | |
General Dynamics Corp. | | | | | |
4.50%, due 08/15/2010 | | 4,000 | | 3,975 | |
Honeywell International, Inc. | | | | | |
7.50%, due 03/01/2010 | | 4,485 | | 4,751 | |
Air Freight & Logistics (1.0%) | | | | | |
FedEx Corp. | | | | | |
3.50%, due 04/01/2009 | | 6,000 | | 5,859 | |
Airlines (1.5%) | | | | | |
American Airlines, Inc. Series 99-1 | | | | | |
7.02%, due 10/15/2009 | | 1,250 | | 1,269 | |
Continental Airlines, Inc. | | | | | |
7.49%, due 10/02/2010 | | 3,061 | | 3,130 | |
Delta Air Lines, Inc. | | | | | |
7.57%, due 11/18/2010 | | 4,000 | | 4,130 | |
Automobiles (1.0%) | | | | | |
Daimler Finance North America LLC | | | | | |
4.75%, due 01/15/2008 | | 5,950 | | 5,942 | |
Beverages (1.6%) | | | | | |
Coca-Cola Enterprises, Inc. | | | | | |
4.38%, due 09/15/2009 | | 4,100 | | 4,064 | |
Diageo Capital PLC | | | | | |
4.38%, due 05/03/2010 | | 4,870 | | 4,816 | |
Capital Markets (2.0%) | | | | | |
Nuveen Investments, Inc. | | | | | |
5.00%, due 09/15/2010 | | $ | 6,884 | | $ | 6,044 | |
Xstrata Finance Dubai, Ltd. - 144A | | | | | |
5.85%, due 11/13/2009 * | | 5,000 | | 4,983 | |
Chemicals (2.9%) | | | | | |
Cytec Industries, Inc. | | | | | |
6.75%, due 03/15/2008 | | 2,700 | | 2,714 | |
Dow Chemical Co. (The) | | | | | |
5.00%, due 11/15/2007 | | 4,870 | | 4,870 | |
ICI Wilmington, Inc. | | | | | |
4.38%, due 12/01/2008 | | 2,002 | | 1,994 | |
Potash Corp. | | | | | |
7.75%, due 05/31/2011 | | 6,380 | | 6,901 | |
Commercial Banks (7.8%) | | | | | |
General Elec Capital Corp. | | | | | |
4.13%, due 09/01/2009 | | 6,070 | | 6,009 | |
ICICI Bank, Ltd. - 144A | | | | | |
5.90%, due 01/12/2010 * | | 4,465 | | 4,413 | |
Keybank NA | | | | | |
6.50%, due 04/15/2008 | | 3,105 | | 3,149 | |
M&i Marshall & Ilsley Bank | | | | | |
5.85%, due 12/04/2012 * | | 7,500 | | 7,298 | |
PNC Preferred Funding Trust I - 144A | | | | | |
6.52%, due 03/15/2012 * Ž | | 3,000 | | 3,017 | |
Popular North America, Inc. | | | | | |
5.20%, due 12/12/2007 | | 5,000 | | 5,000 | |
VTB Capital SA for Vneshtorgbank - 144A | | | | | |
5.96%, due 08/01/2008 * | | 9,000 | | 8,910 | |
Wachovia Capital Trust III | | | | | |
5.80%, due 03/15/2011 Ž, (1) | | 3,000 | | 2,976 | |
ZFS Finance USA Trust I - 144A | | | | | |
6.15%, due 12/15/2065 | | 3,000 | | 2,978 | |
Construction Materials (0.5%) | | | | | |
Lafarge Corp. | | | | | |
6.50%, due 07/15/2008 | | 2,900 | | 2,924 | |
Consumer Finance (2.0%) | | | | | |
American Express Credit Corp. | | | | | |
5.25%, due 02/24/2012 * | | 4,300 | | 4,197 | |
Discover Financial Services - 144A | | | | | |
6.23%, due 06/11/2010 * | | 7,500 | | 7,290 | |
Diversified Financial Services (7.3%) | | | | | |
Caterpillar Financial Services Corp. | | | | | |
4.30%, due 06/01/2010 | | 4,224 | | 4,165 | |
Citigroup, Inc. | | | | | |
6.20%, due 03/15/2009 | | 4,260 | | 4,332 | |
ILFC E-Capital Trust I - 144A | | | | | |
5.90%, due 12/21/2065 | | 3,000 | | 2,999 | |
Mizuho JGB Investment LLC | | | | | |
9.87%, due 06/30/2008 * Ž, (1) | | 10,000 | | 10,288 | |
Pemex Finance, Ltd. | | | | | |
9.03%, due 02/15/2011 | | 3,780 | | 4,012 | |
SB Treasury Co. LLC - 144A | | | | | |
9.40%, due 12/29/2049 * Ž | | 9,470 | | 9,664 | |
The notes to the financial statements are an integral part of this report.
111
| | Principal | | Value | |
Diversified Financial Services (continued) | | | | | |
Unilever Capital Corp. | | | | | |
7.13%, due 11/01/2010 | | $ | 5,230 | | $ | 5,577 | |
Diversified Telecommunication Services (1.4%) | | | | | |
Telecom Italia Capital SA | | | | | |
4.00%, due 11/15/2008 | | 8,010 | | 7,913 | |
Electric Utilities (4.2%) | | | | | |
Dominion Resources, Inc. | | | | | |
5.687 due 05/15/2008 (2) | | 6,150 | | 6,157 | |
FPL Group Capital, Inc. | | | | | |
5.55%, due 02/16/2008 | | 6,000 | | 6,002 | |
Midamerican Energy Holdings Co. | | | | | |
Class B | | | | | |
7.52%, due 09/15/2008 | | 5,500 | | 5,607 | |
Sempra Energy | | | | | |
7.95%, due 03/01/2010 | | 5,500 | | 5,831 | |
Energy Equipment & Services (0.8%) | | | | | |
Halliburton Co. | | | | | |
5.50%, due 10/15/2010 | | 4,517 | | 4,590 | |
Food & Staples Retailing (2.2%) | | | | | |
Fred Meyer, Inc. | | | | | |
7.45%, due 03/01/2008 | | 9,600 | | 9,666 | |
Safeway, Inc. | | | | | |
4.13%, due 11/01/2008 | | 2,610 | | 2,597 | |
Food Products (2.3%) | | | | | |
Cargill, Inc. - 144A | | | | | |
3.63%, due 03/04/2009 | | 5,000 | | 4,906 | |
ConAgra Foods, Inc. | | | | | |
7.88%, due 09/15/2010 | | 4,880 | | 5,246 | |
Michael Foods, Inc. | | | | | |
8.00%, due 11/15/2013 | | 2,815 | | 2,815 | |
Gas Utilities (2.2%) | | | | | |
Oneok, Inc. | | | | | |
5.51%, due 02/16/2008 | | 6,300 | | 6,297 | |
Southern Union Co. | | | | | |
6.15%, due 08/16/2008 | | 6,000 | | 6,032 | |
Hotels, Restaurants & Leisure (1.1%) | | | | | |
Caesars Entertainment, Inc. | | | | | |
8.88%, due 09/15/2008 | | 1,400 | | 1,419 | |
Mirage Resorts, Inc. | | | | | |
6.75%, due 02/01/2008 | | 1,500 | | 1,500 | |
Royal Caribbean Cruises, Ltd. | | | | | |
8.75%, due 02/02/2011 | | 3,000 | | 3,200 | |
Household Durables (0.9%) | | | | | |
Centex Corp. | | | | | |
4.75%, due 01/15/2008 | | 4,960 | | 4,927 | |
Independent Power Producers & Energy Traders (1.8%) | | | | | |
Empresa Nacional de Electricidad | | | | | |
SA/Chile Class B | | | | | |
8.50%, due 04/01/2009 | | 9,610 | | 10,024 | |
Insurance (1.4%) | | | | | |
Hartford Financial Services Group, Inc. | | | | | |
5.55%, due 08/16/2008 | | 3,000 | | 3,011 | |
Oil Insurance, Ltd. - 144A | | | | | |
7.56%, due 06/30/2011 * Ž, (1) | | $ | 4,550 | | $ | 4,677 | |
IT Services (1.1%) | | | | | |
Western Union Co. (The) | | | | | |
5.67%, due 11/17/2008 * | | 6,500 | | 6,503 | |
Leisure Equipment & Products (0.5%) | | | | | |
Leslie’s Poolmart | | | | | |
7.75%, due 02/01/2013 | | 2,930 | | 2,784 | |
Machinery (0.4%) | | | | | |
Case New Holland, Inc. | | | | | |
6.00%, due 06/01/2009 | | 2,500 | | 2,500 | |
Media (4.0%) | | | | | |
Amfm, Inc. | | | | | |
8.00%, due 11/01/2008 | | 2,000 | | 2,033 | |
British Sky Broadcasting Group PLC | | | | | |
8.20%, due 07/15/2009 | | 6,000 | | 6,283 | |
Comcast Cable Communications LLC | | | | | |
6.88%, due 06/15/2009 | | 5,500 | | 5,640 | |
McGraw-Hill Cos., Inc. | | | | | |
5.38%, due 11/15/2012 | | 4,500 | | 4,473 | |
News America, Inc. | | | | | |
6.63%, due 01/09/2008 | | 4,000 | | 4,007 | |
Metals & Mining (1.1%) | | | | | |
BHP Billiton Finance USA, Ltd. | | | | | |
5.00%, due 12/15/2010 | | 6,000 | | 6,026 | |
Office Electronics (0.7%) | | | | | |
Xerox Corp. | | | | | |
9.75%, due 01/15/2009 | | 4,000 | | 4,199 | |
Oil, Gas & Consumable Fuels (0.6%) | | | | | |
Husky Oil, Ltd. | | | | | |
8.90%, due 08/15/2028 (1) | | 1,000 | | 1,028 | |
Ras Laffan Liquefied Natural Gas Co., | | | | | |
Ltd. - 144A | | | | | |
3.44%, due 09/15/2009 | | 1,950 | | 1,939 | |
TE Products Pipeline | | | | | |
6.45%, due 01/15/2008 | | 530 | | 532 | |
Real Estate Investment Trusts (12.9%) | | | | | |
Archstone-Smith Operating Trust | | | | | |
3.00%, due 06/15/2008 | | 2,000 | | 2,000 | |
BRE Properties, Inc. | | | | | |
5.75%, due 09/01/2009 | | 10,000 | | 10,108 | |
Developers Divers Realty | | | | | |
4.63%, due 08/01/2010 | | 4,500 | | 4,433 | |
Federal Realty INVS Trust | | | | | |
8.75%, due 12/01/2009 | | 2,680 | | 2,872 | |
Healthcare Realty Trust, Inc. | | | | | |
8.13%, due 05/01/2011 | | 3,000 | | 3,223 | |
iStar Financial, Inc. | | | | | |
6.07%, due 03/09/2010 * | | 10,000 | | 9,448 | |
Kimco Realty Corp. | | | | | |
4.62%, due 05/06/2010 | | 5,000 | | 4,922 | |
PPF Funding, Inc. - 144A | | | | | |
5.35%, due 04/15/2012 | | 4,000 | | 3,947 | |
The notes to the financial statements are an integral part of this report.
112
| | Principal | | Value | |
Real Estate Investment Trusts (continued) | | | | | |
ProLogis | | | | | |
5.25%, due 11/15/2010 | | $ | 7,020 | | $ | 7,002 | |
Simon Property Group, LP | | | | | |
3.75%, due 01/30/2009 | | 5,335 | | 5,221 | |
Tanger Properties, LP | | | | | |
9.13%, due 02/15/2008 | | 6,753 | | 6,810 | |
Udr, Inc. | | | | | |
4.50%, due 03/03/2008 | | 8,000 | | 7,988 | |
Westfield Group - 144A | | | | | |
5.40%, due 10/01/2012 | | 5,000 | | 4,970 | |
Real Estate Management & Development (1.4%) | | | | | |
Colonial Realty, LP | | | | | |
4.75%, due 02/01/2010 | | 2,380 | | 2,352 | |
Post Apartment Homes, LP | | | | | |
7.70%, due 12/20/2010 | | 5,000 | | 5,358 | |
Road & Rail (2.1%) | | | | | |
Erac USA Finance Co. 144A | | | | | |
7.95%, due 12/15/2009 | | 5,500 | | 5,794 | |
Norfolk Southern Corp. | | | | | |
6.20%, due 04/15/2009 | | $ | 6,000 | | $ | 6,088 | |
Specialty Retail (1.9%) | | | | | |
Petro Stopping Centers, LP / Petro | | | | | |
9.00%, due 02/15/2012 | | 10,195 | | 10,654 | |
Thrifts & Mortgage Finance (1.1%) | | | | | |
Countrywide Financial Corp. | | | | | |
5.43%, due 03/24/2009 * | | 7,000 | | 6,367 | |
Wireless Telecommunication Services (1.1%) | | | | | |
Vodafone Group PLC | | | | | |
3.95%, due 01/30/2008 | | 6,000 | | 5,979 | |
Total Corporate Debt Securities (cost $432,602) | | | | 430,540 | |
Total Investment Securities (cost $557,062) # | | | | $ | 556,022 | |
NOTES TO SCHEDULE OF INVESTMENTS
* Floating or variable rate note. Rate is listed as of October 31, 2007.
(1) Coupon rate is fixed for a predetermined period of time and then converts to a floating rate until maturity/call date. Rate is listed as of October 31, 2007.
(2) Step Up
Ž The security has a perpetual maturity. The date shown is the next call date.
# Aggregate cost for federal income tax purposes is $557,213. Aggregate gross unrealized appreciation for all securities in which there is an excess of value over tax cost and aggregate gross unrealized depreciation for all securities in which there is an excess of tax cost over value were $2,300 and $3,492, respectively. Net unrealized depreciation for tax purposes is $1,191.
DEFINITIONS:
144A 144A Securities are registered pursuant to Rule 144A of the Securities Act of 1933. These securities are deemed to be liquid for purposes of compliance limitations on holdings of illiquid securities and may be resold as transactions exempt from registration, normally to qualified institutional buyers. At October 31, 2007, these securities aggregated $64,693 or 11.47% of net assets of the fund.
The notes to the financial statements are an integral part of this report.
113
TA IDEX UBS Dynamic Alpha
MARKET ENVIRONMENT
During the reporting period, global economic activity continued its steady expansion of the past few years. After a very modest expansion in the first quarter of 2007, the US economy recovered during the second quarter, with gross domestic product (“GDP”) growth of 3.8%. However, the housing sector, mortgage market and credit market conditions remain threats to US economic activity, and most economists expect US growth to slow in upcoming quarters. Outside the US, GDP growth continues to be particularly strong in China, India and other emerging markets. Economists believe the Eurozone economy will moderate in the near term, although out-gain the US for the full year 2007. Japan’s economy has slowed significantly, posting a negative growth rate in the second quarter.
The problems in the US mortgage market, together with signs of general credit tightening, has led to a shift toward neutrality or even easing in many central banks’ policies. The Federal Reserve Board (“Fed”) cut the federal funds 50 basis points in September. (The federal funds rate, or “fed funds” rate, is the rate that banks charge one another for funds they borrow on an overnight basis.) This was the first reduction in the fed funds rate since June 2003. The Fed lowered rates another 25 basis points in October, bringing the fed funds rate to 4.50%. The European Central Bank (“ECB”) began a tightening cycle in 2006, and hiked rates 25 basis points at both its March and June 2007 meetings. Since that time it has held rates steady. The Bank of Japan has begun tightening from its zero interest rate policy. However, the scope and pace of tightening remain to be seen, given more tepid economic growth in Japan. Consensus expectations for 2007 indicate trend-like growth rates on a global basis.
PERFORMANCE
For the period from inception December 27, 2006 through October 31, 2007, TA IDEX UBS Dynamic Alpha, Class I returned (1.70)%. By comparison its benchmark, the Consumer Price Index + 5%, returned 7.91%. For the year ended October 31, 2007, the net expense ratio of the Fund was 1.51%.
STRATEGY REVIEW
The portfolio focuses on real (after inflation) returns in an effort to maintain purchasing power and manage risk. It seeks to achieve its goal and reduce volatility through the dynamic management of three uncorrelated sources: active global asset allocation; opportunistic security selection; and currency management. The manager has the flexibility to adjust its exposure to alpha (active risk or security selection) and beta (market and currency risk) independently from each other to capitalize on changing market conditions, using derivatives. The manger employs a proprietary risk management system to help ensure the portfolio is compensated for the level of risk it assumes at both the security and market levels.
During the reporting period, the portfolio’s global asset allocation was a positive contributor to performance, while its currency allocation and security selection detracted from results.
In terms of key market exposures, the portfolio benefited the most from its positions in emerging market equities, US equities and, to a lesser extent, United Kingdom (“UK”) equities. In contrast, the portfolio’s short exposure to equities in several markets, including Germany, Australia and Canada, as well as a short position in real return bonds, detracted from results.
From a currency perspective, the portfolio’s euro, Canadian dollar, UK pound sterling and Australian dollar positions detracted from results during the reporting period.
As discussed, security selection was an overall negative contributor to performance over the reporting period. More specifically, the portfolio’s global (ex-US), UK equity, and US equity security selection detracted from results. This more than offset the positive performance generated by the portfolio’s security selection within the US large-cap growth equity asset class.
Brian D. Singer, CFA
Portfolio Manager
UBS Global Asset Management (Americas) Inc.
114
(unaudited)
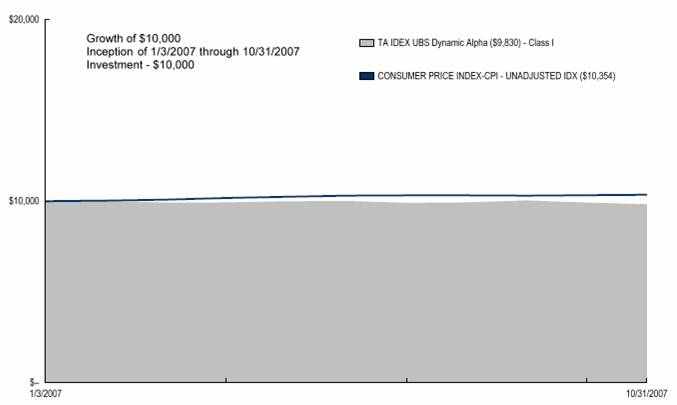
Average Annual Total Return for Period Ended 10/31/2007
| | From Inception | | Inception Date | |
| | | | | |
Class I (NAV) | | (1.70 | )% | 1/3/07 | |
CONSUMER PRICE INDEX-CPI - UNADJUSTED IDX(1) | | 7.91 | % | 1/3/07 | |
NOTES
(1) The CONSUMER PRICE CPI - UNADJUSTED IDX Index is an unmanaged index used as a general measure of market performance. Calculations assume dividends and capital gains are reinvested and do not include any managerial expenses. From inception calculation is based on life of the Fund.
The performance data presented represents past performance, future results may vary. Performance data does not reflect the deduction of taxes that would be paid on fund distributions or the redemption of fund shares. Investment return and principal value will fluctuate so that an investor’s shares,when redeemed, may be worth more or less than their original cost. Current performance may be lower or higher than performance quoted. Please see www.transamericaidex.com for performance data current to the most recent month-end.
Net Asset Value (NAV) returns include the reinvestment of dividends and capital gains. Fund shares are sold without a sales load.
This material must be preceded or accompanied by a current prospectus, which includes specific contents regarding the investment objectives and policies of this fund.
This fund is only available in Class I shares, which are not available for direct investment by the public.
115
UNDERSTANDING YOUR FUND’S EXPENSES
(unaudited)
SHAREHOLDER EXPENSES
Fund shareholders may incur two types of costs: (1) transaction costs, including sales charges (loads) on purchases, contingent deferred sales charges on redemptions and redemption fees; and (2) ongoing costs, including management fees, dividend expense on short-sales, and other fund expenses.
The following Example is intended to help you understand your ongoing costs (in dollars and cents) of investing in the Fund and to compare these costs with the ongoing costs of investing in other funds.
The Example is based on an investment of $1,000 invested at May 1, 2007 and held for the entire period until October 31, 2007.
ACTUAL EXPENSES
The first line in the table below provides information about actual account values and actual expenses. You may use the information in this line, together with the amount you invested, to estimate the expenses that you paid over the period. Simply divide your account value by $1,000 (for example, an $8,600 account value divided by $1,000 = 8.6), then multiply the result by the number in the first line of your Fund under the heading entitled “Expenses Paid During Period” to estimate the expenses you paid on your account during this period.
HYPOTHETICAL EXAMPLE FOR COMPARISON PURPOSES
The second line in the table below provides information about hypothetical account values and hypothetical expenses based on the Fund’s actual expense ratio and an assumed rate of return of 5% per year before expenses, which is not the Fund’s actual return. The hypothetical account values and expenses may not be used to estimate the actual ending account balance or expenses you paid for the period. You may use this information to compare the ongoing costs of investing in your Fund and other funds. To do so, compare this 5% hypothetical example with the 5% hypothetical examples that appear in the shareholder reports of the other funds.
Please note that the expenses shown in the table are meant to highlight your ongoing costs only and do not reflect any transactional costs, such as sales charges, redemption fees, brokerage commissions paid on purchases and sales of fund shares. Therefore, the second line under the Fund in the table is useful in comparing ongoing costs only, and will not help you determine the relative total costs of owning different funds. If any of these transaction costs were included, your costs would be higher. The expenses shown in the table do not reflect any fees that may be charged to you by brokers, financial intermediaries or other financial institutions.
| | Beginning | | Ending | | Annualized | | Expenses | |
| | Account | | Account | | Expense | | Paid During | |
| | Value | | Value | | Ratio | | Period (a) | |
| | | | | | | | | |
Class I | | | | | | | | | |
Actual | | $ | 1,000.00 | | $ | 983.98 | | 1.52 | % | $ | 7.58 | |
Hypothetical (b) | | 1,000.00 | | 1,017.50 | | 1.52 | | 7.71 | |
| | | | | | | | | | | | |
(a) Expenses are calculated using the Fund’s annualized expense ratio (as disclosed in the table), multiplied by the average account value for the period, multiplied by the number of days in the period (184 days), and divided by the number of days in the year (365 days).
(b) 5% return per year before expenses.
GRAPHICAL PRESENTATION OF SCHEDULE OF INVESTMENTS
By Region
At October 31, 2007
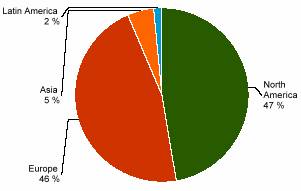
This chart shows the percentage breakdown by region of the Fund’s total investment securities.
116
SCHEDULE OF INVESTMENTS
At October 31, 2007
(all amounts except share amounts in thousands)
| | Shares | | Value | |
CONVERTIBLE PREFERRED STOCKS (0.4%) | | | | | |
Panama (0.4%) | | | | | |
Carnival Corp. ^ | | 19,300 | | $ | 926 | |
Total Convertible Preferred Stocks (cost $994) | | | | 926 | |
| | | | | |
PREFERRED STOCKS (0.5%) | | | | | |
Germany (0.5%) | | | | | |
Henkel KGAA | | 19,727 | | 1,005 | |
Total Preferred Stocks (cost $1,986) | | | | 1,005 | |
| | | | | |
COMMON STOCKS (91.0%) | | | | | |
Australia (0.8%) | | | | | |
National Australia Bank, Ltd. | | 10,532 | | 421 | |
Qantas Airways, Ltd. | | 100,590 | | 551 | |
QBE Insurance Group, Ltd. | | 22,085 | | 665 | |
Austria (0.2%) | | | | | |
Telekom Austria AG | | 15,657 | | 448 | |
Belgium (0.3%) | | | | | |
Fortis | | 14,444 | | 461 | |
KBC Groep NV | | 1,841 | | 258 | |
Bermuda (0.4%) | | | | | |
Catlin Group, Ltd. | | 12,510 | | 130 | |
Esprit Holdings, Ltd. | | 21,500 | | 355 | |
Lancashire Holdings, Ltd. ‡ | | 2,921 | | 23 | |
Weatherford International, Ltd. ‡ | | 5,000 | | 324 | |
YUE Yuen Industrial Holdings, Ltd. | | 25,000 | | 77 | |
Canada (1.0%) | | | | | |
Canadian National Railway Co. | | 5,800 | | 324 | |
Canadian Pacific Railway, Ltd. | | 3,200 | | 224 | |
Cott Corp. ‡ | | 8,500 | | 60 | |
Jumptv, Inc. ‡ | | 2,226 | | 4 | |
Manulife Financial Corp. | | 6,000 | | 279 | |
Research In Motion, Ltd. ‡ | | 2,600 | | 324 | |
Toronto-Dominion Bank | | 7,900 | | 593 | |
Transcanada Corp. ‡ | | 5,200 | | 220 | |
Cayman Islands (0.3%) | | | | | |
GlobalSantaFe Corp. | | 7,900 | | 640 | |
Leaf Clean Energy Co. ‡ | | 28,581 | | 64 | |
Denmark (0.3%) | | | | | |
AP Moeller - Maersk A/S Class B | | 24 | | 331 | |
NOVO Nordisk A/S Class B | | 2,275 | | 281 | |
Finland (0.9%) | | | | | |
Nokia OYJ | | 25,679 | | 1,016 | |
Stora ENSO OYJ Class R ^ | | 42,113 | | 771 | |
Tietoenator OYJ | | 5,612 | | 138 | |
France (5.9%) | | | | | |
AXA SA | | 38,212 | | 1,706 | |
BNP Paribas | | 8,333 | | 917 | |
Bouygues | | 2,847 | | 273 | |
Carrefour SA | | 686 | | 49 | |
France Telecom SA | | 72,010 | | 2,653 | |
Michelin (C.G.D.E.) Class B | | 2,807 | | 375 | |
Neuf Cegetel | | 1,101 | | 56 | |
Renault SA | | 2,985 | | 501 | |
Sanofi-Aventis | | 1,244 | | 109 | |
Suez SA ‡ | | 28,747 | | 1,867 | |
Total SA | | 44,255 | | $ | 3,563 | |
Unibail-Rodamco | | 1,100 | | 273 | |
Germany (5.3%) | | | | | |
Allianz SE | | 7,045 | | 1,582 | |
Bayerische Motoren Werke AG | | 2,875 | | 192 | |
Celesio AG | | 2,675 | | 152 | |
Daimler AG | | 11,850 | | 1,302 | |
Deutsche Bank AG | | 6,928 | | 923 | |
Deutsche Post AG | | 13,661 | | 413 | |
Deutsche Postbank AG | | 4,985 | | 364 | |
Deutsche Telekom AG | | 20,217 | | 414 | |
E.ON AG | | 4,451 | | 869 | |
Fresenius Medical Care AG | | 6,733 | | 355 | |
Gerresheimer AG ‡ | | 4,117 | | 226 | |
Heidelberger Druckmaschinen AG | | 3,259 | | 133 | |
Man AG | | 1,920 | | 342 | |
Metro AG | | 10,238 | | 928 | |
SAP AG | | 18,311 | | 989 | |
Siemens AG | | 12,511 | | 1,697 | |
Stada Arzneimittel AG | | 4,115 | | 261 | |
Greece (0.6%) | | | | | |
Alpha Bank A.E. | | 18,451 | | 682 | |
National Bank of Greece SA | | 6,876 | | 477 | |
Hong Kong (0.2%) | | | | | |
Sun Hung KAI Properties, Ltd. | | 16,000 | | 303 | |
Ireland (1.1%) | | | | | |
Anglo Irish Bank Corp. PLC | | 7,504 | | 126 | |
Bank of Ireland | | 59,927 | | 1,105 | |
CRH PLC | | 14,407 | | 549 | |
Ecosecurities Group PLC ‡ | | 10,887 | | 59 | |
Irish Life & Permanent PLC | | 14,338 | | 345 | |
Smurfit Kappa Group PLC ‡ | | 9,114 | | 183 | |
Isle of Man (0.1%) | | | | | |
Lamprell PLC | | 14,293 | | 143 | |
Italy (1.3%) | | | | | |
Banco Popolare SpA ‡ | | 4,060 | | 97 | |
ENI SpA | | 18,463 | | 671 | |
Intesa Sanpaolo SpA | | 197,536 | | 1,562 | |
Unicredito Italiano SpA | | 40,551 | | 345 | |
Japan (3.7%) | | | | | |
AEON Co., Ltd. | | 9,300 | | 145 | |
Asahi Breweries, Ltd. | | 16,800 | | 277 | |
Bank of Yokohama, Ltd. (The) | | 27,000 | | 190 | |
Bridgestone Corp. | | 10,900 | | 240 | |
Canon, Inc. | | 7,900 | | 394 | |
East Japan Railway Co. | | 20 | | 164 | |
Fast Retailing Co., Ltd. | | 1,600 | | 92 | |
Honda Motor Co., Ltd. | | 12,500 | | 466 | |
Hoya Corp. | | 9,600 | | 347 | |
Japan Tobacco, Inc. | | 58 | | 337 | |
JFE Holdings, Inc. | | 3,700 | | 215 | |
KDDI Corp. | | 23 | | 173 | |
Komatsu, Ltd. | | 5,800 | | 192 | |
The notes to the financial statements are an integral part of this report.
117
| | Shares | | Value | |
Japan (continued) | | | | | |
Kubota Corp. | | 22,000 | | $ | 184 | |
Mitsubishi Corp. | | 16,200 | | 499 | |
Mitsui Fudosan Co., Ltd. | | 7,000 | | 192 | |
Mitsui O.S.K. Lines, Ltd. | | 9,000 | | 147 | |
Mitsui Sumitomo Insurance Co., Ltd. | | 26,000 | | 296 | |
Nitto Denko Corp. | | 6,000 | | 291 | |
Nok Corp. | | 5,800 | | 128 | |
Nomura Holdings, Inc. | | 10,000 | | 178 | |
NTN Corp. | | 16,000 | | 152 | |
NTT DoCoMo, Inc. | | 149 | | 215 | |
ROHM Co., Ltd. | | 3,300 | | 288 | |
Shin-Etsu Chemical Co., Ltd. | | 4,700 | | 299 | |
SMC Corp./Japan | | 1,200 | | 160 | |
Sompo Japan Insurance, Inc. | | 14,000 | | 163 | |
Sumitomo Mitsui Financial Group, Inc. | | 50 | | 405 | |
Sumitomo Trust & Banking Co., Ltd. | | 26,000 | | 192 | |
Tokyo Gas Co., Ltd. | | 33,000 | | 146 | |
Toyota Motor Corp. | | 8,200 | | 467 | |
Yamada Denki Co., Ltd. | | 1,950 | | 200 | |
Jersey, C.I. (0.1%) | | | | | |
ACP Capital, Ltd. | | 25,225 | | 46 | |
Experian Group, Ltd. | | 22,152 | | 232 | |
Liberia (0.1%) | | | | | |
Royal Caribbean Cruises, Ltd. | | 3,100 | | 133 | |
Luxembourg (0.2%) | | | | | |
SES | | 16,481 | | 406 | |
Netherlands (2.4%) | | | | | |
ASML Holding NV ‡ | | 32,320 | | 1,124 | |
ING Groep NV | | 27,829 | | 1,250 | |
Koninklijke Philips Electronics NV | | 4,538 | | 187 | |
Ordina NV | | 1,325 | | 26 | |
Reed Elsevier NV | | 15,266 | | 295 | |
Royal KPN NV | | 62,698 | | 1,181 | |
STMicroelectronics NV | | 12,202 | | 209 | |
TNT NV | | 18,071 | | 738 | |
Netherlands Antilles (0.2%) | | | | | |
Schlumberger, Ltd. ^ | | 5,000 | | 483 | |
Norway (0.5%) | | | | | |
Statoil ASA | | 13,850 | | 467 | |
Telenor ASA ‡ | | 26,800 | | 626 | |
Spain (1.4%) | | | | | |
Altadis SA | | 4,032 | | 288 | |
Banco Santander Central Hispano SA | | 106,735 | | 2,316 | |
Repsol YPF SA | | 10,299 | | 406 | |
Sweden (1.1%) | | | | | |
Electrolux AB Series B, Class B | | 10,600 | | 205 | |
Holmen AB Class B | | 4,500 | | 177 | |
Sandvik AB | | 20,000 | | 377 | |
Skandinaviska Enskilda Banken AB Class A | | 5,200 | | 159 | |
Svenska Cellulosa AB Class B | | 28,700 | | 505 | |
Telefonaktiebolaget LM Ericsson Class B | | 291,000 | | 869 | |
Switzerland (4.7%) | | | | | |
Alcon, Inc. | | 2,600 | | $ | 396 | |
Clariant AG ‡ | | 8,866 | | 113 | |
Credit Suisse Group | | 29,886 | | 2,008 | |
Holcim, Ltd. | | 7,804 | | 889 | |
Nestle SA | | 2,587 | | 1,193 | |
Novartis AG | | 42,444 | | 2,256 | |
Roche Holding AG | | 16,012 | | 2,730 | |
Straumann Holding AG | | 682 | | 190 | |
United Kingdom (17.2%) | | | | | |
Aberdeen Asset Management PLC | | 45,909 | | 195 | |
Anite PLC | | 15,595 | | 21 | |
Ashtead Group PLC | | 38,910 | | 88 | |
Associated British Foods PLC | | 9,481 | | 180 | |
AstraZeneca PLC | | 15,049 | | 742 | |
Aviva PLC | | 20,892 | | 328 | |
Barclays PLC | | 186,806 | | 2,344 | |
BP PLC | | 349,691 | | 4,540 | |
BPP Holdings PLC | | 8,036 | | 102 | |
British Airways PLC ‡ | | 9,042 | | 84 | |
British American Tobacco PLC | | 7,619 | | 290 | |
British Polythene Industries | | 5,103 | | 35 | |
British Sky Broadcasting Group PLC | | 18,836 | | 266 | |
Brixton PLC REIT | | 5,961 | | 46 | |
BT Group PLC Class A | | 47,633 | | 323 | |
Cadbury Schweppes PLC | | 8,924 | | 118 | |
Carnival PLC | | 13,278 | | 619 | |
Cattles PLC | | 50,579 | | 358 | |
Centaur Media PLC | | 23,474 | | 57 | |
Centrica PLC | | 24,798 | | 190 | |
Chemring Group | | 772 | | 35 | |
Cobham PLC | | 10,038 | | 44 | |
Compass Group PLC | | 49,556 | | 356 | |
Computacenter PLC | | 2,326 | | 10 | |
Daily Mail & General Trust | | 22,829 | | 291 | |
Diageo PLC | | 64,100 | | 1,465 | |
Dignity PLC | | 3,396 | | 55 | |
DSG International PLC | | 34,459 | | 93 | |
Eaga PLC ‡ | | 3,900 | | 15 | |
Electrocomponents PLC | | 25,064 | | 130 | |
Enodis PLC | | 16,802 | | 73 | |
Entertainment Rights PLC ‡ | | 109,902 | | 49 | |
Fenner PLC | | 10,911 | | 63 | |
Foseco PLC | | 12,441 | | 74 | |
Galiform PLC ‡ | | 40,234 | | 96 | |
Galliford Try PLC | | 27,349 | | 89 | |
Georgica PLC ‡ | | 12,555 | | 26 | |
GlaxoSmithKline PLC | | 72,721 | | 1,870 | |
Gyrus Group PLC ‡ | | 1,903 | | 17 | |
HBOS PLC | | 96,488 | | 1,750 | |
Highway Insurance Holdings PLC | | 16,719 | | 27 | |
Home Retail Group PLC | | 31,670 | | 287 | |
HSBC Holdings PLC ‡ | | 39,377 | | 778 | |
ICAP PLC | | 5,368 | | 65 | |
The notes to the financial statements are an integral part of this report.
118
| | Shares | | Value | |
United Kingdom (continued) | | | | | |
KESA Electricals PLC | | 17,567 | | $ | 116 | |
Kingfisher PLC | | 74,508 | | 305 | |
Land Securities Group PLC REIT | | 5,133 | | 175 | |
LogicaCMG PLC | | 83,623 | | 283 | |
Lookers PLC | | 18,674 | | 70 | |
Majestic Wine PLC | | 7,003 | | 50 | |
Meggitt PLC | | 29,753 | | 211 | |
National Grid PLC | | 6,764 | | 113 | |
Northgate Information Solutions PLC | | 94,234 | | 154 | |
Old Mutual PLC | | 137,427 | | 525 | |
Paypoint PLC | | 5,496 | | 71 | |
Phoenix IT Group, Ltd. | | 6,180 | | 50 | |
Prudential PLC | | 131,729 | | 2,140 | |
Psion PLC | | 5,546 | | 16 | |
Quintain Estates & Development PLC | | 3,547 | | 45 | |
Reed Elsevier PLC | | 37,048 | | 483 | |
Rentokil Initial PLC | | 68,894 | | 246 | |
Restaurant Group PLC | | 13,925 | | 79 | |
Rexam PLC | | 5,576 | | 63 | |
Rio Tinto PLC | | 6,002 | | 560 | |
Royal Bank of Scotland Group PLC | | 222,877 | | 2,391 | |
Royal Dutch Shell PLC Class B | | 25,656 | | 1,117 | |
Safestore Holdings, Ltd. | | 11,369 | | 42 | |
Scottish & Southern Energy PLC | | 23,132 | | 748 | |
Southern Cross Healthcare, Ltd. | | 8,877 | | 111 | |
Speedy Hire PLC | | 2,555 | | 58 | |
Sports Direct International PLC | | 28,717 | | 86 | |
SSL International PLC | | 5,334 | | 57 | |
Standard Chartered PLC | | 6,396 | | 248 | |
Taylor Nelson Sofres PLC | | 12,913 | | 58 | |
Ted Baker PLC | | 5,108 | | 57 | |
Telent PLC | | 5,188 | | 56 | |
Tesco PLC | | 133,333 | | 1,352 | |
Tomkins PLC | | 6,814 | | 31 | |
Travis Perkins PLC | | 1,585 | | 48 | |
Vectura Group PLC ‡ | | 12,081 | | 17 | |
Vodafone Group PLC | | 988,871 | | 3,882 | |
Wolseley PLC | | 50,179 | | 869 | |
WPP Group PLC | | 13,434 | | 183 | |
Zetar PLC ‡ | | 6,516 | | 75 | |
United States (40.7%) | | | | | |
Abbott Laboratories | | 2,300 | | 126 | |
Abercrombie & Fitch Co. Class A ^ | | 2,200 | | 174 | |
Adobe Systems, Inc. ‡ | | 6,300 | | 302 | |
Aflac, Inc. | | 13,000 | | 816 | |
Allergan, Inc. | | 31,400 | | 2,122 | |
Allstate Corp. (The) | | 4,800 | | 252 | |
American Eagle Outfitters, Inc. | | 9,400 | | 224 | |
American Electric Power Co., Inc. | | 11,800 | | 569 | |
American Tower Corp. Class A ‡^ | | 3,500 | | 155 | |
Amgen, Inc. ‡ | | 6,000 | | 349 | |
Analog Devices, Inc. | | 28,600 | | 957 | |
Anheuser-Busch Cos., Inc. | | 11,200 | | 574 | |
Apache Corp. | | 2,000 | | $ | 208 | |
Apple, Inc. ‡ | | 5,300 | | 1,007 | |
AT&T, Inc. (2) | | 21,300 | | 890 | |
Automatic Data Processing, Inc. | | 4,900 | | 243 | |
Baker Hughes, Inc. | | 2,500 | | 217 | |
Bank of New York Mellon Corp. | | 28,026 | | 1,369 | |
Baxter International, Inc. | | 7,100 | | 426 | |
Becton Dickinson & Co. | | 4,000 | | 334 | |
BlackRock, Inc. Class A ^ | | 400 | | 83 | |
Blackstone Group, LP (The) ‡^ | | 5,550 | | 141 | |
Boeing Co. | | 1,900 | | 187 | |
BorgWarner, Inc. | | 8,800 | | 930 | |
Bristol-Myers Squibb Co. | | 16,500 | | 495 | |
Broadcom Corp. Class A ‡ | | 9,800 | | 319 | |
Burlington Northern Santa Fe Corp. | | 18,000 | | 1,569 | |
CB Richard Ellis Group, Inc. Class A ‡ | | 1,700 | | 41 | |
Cephalon, Inc. ‡^ | | 3,300 | | 243 | |
Chevron Corp. | | 4,800 | | 439 | |
Chico’s FAS, Inc. ‡ | | 22,900 | | 301 | |
Cisco Systems, Inc. ‡ | | 22,200 | | 734 | |
Citigroup, Inc. | | 58,700 | | 2,460 | |
Citrix Systems, Inc. ‡ | | 5,400 | | 232 | |
City National Corp. | | 3,700 | | 250 | |
Coach, Inc. ‡^ | | 9,600 | | 351 | |
Comcast Corp. Class A ‡ | | 29,500 | | 621 | |
ConocoPhillips | | 3,200 | | 272 | |
Consol Energy, Inc. | | 2,600 | | 147 | |
Constellation Brands, Inc. Class A ‡ | | 34,200 | | 859 | |
Costco Wholesale Corp. | | 12,900 | | 868 | |
CR Bard, Inc. | | 4,100 | | 343 | |
Dell, Inc. ‡^ | | 23,900 | | 731 | |
Discover Financial Services | | 16,150 | | 312 | |
eBay, Inc. ‡ | | 13,000 | | 469 | |
EMC Corp. ‡ | | 13,900 | | 353 | |
Ensco International, Inc. ^ | | 7,800 | | 433 | |
EOG Resources, Inc. | | 7,100 | | 629 | |
Estee Lauder Cos., Inc. (The) Class A | | 1,900 | | 83 | |
Exelon Corp. | | 33,000 | | 2,732 | |
Express Scripts, Inc. Class A ‡ | | 4,500 | | 284 | |
Exxon Mobil Corp. | | 6,400 | | 589 | |
FedEx Corp. | | 9,100 | | 940 | |
Fifth Third Bancorp | | 32,800 | | 1,026 | |
Fortune Brands, Inc. | | 6,700 | | 561 | |
Freddie Mac | | 10,000 | | 522 | |
Genentech, Inc. ‡ | | 4,800 | | 356 | |
General Dynamics Corp. | | 2,100 | | 191 | |
General Electric Co. | | 72,300 | | 2,976 | |
Genzyme Corp. ‡ | | 15,200 | | 1,155 | |
Goldman Sachs Group, Inc. (The) | | 1,500 | | 372 | |
Google, Inc. Class A ‡^ | | 2,200 | | 1,555 | |
Halliburton Co. ^ | | 19,800 | | 781 | |
Harley-Davidson, Inc. | | 5,800 | | 299 | |
Hartford Financial Services Group, Inc. | | 6,400 | | 621 | |
The notes to the financial statements are an integral part of this report.
119
| | Shares | | Value | |
United States (continued) | | | | | |
Illinois Tool Works, Inc. | | 29,400 | | $ | 1,683 | |
Intel Corp. | | 75,500 | | 2,031 | |
International Game Technology | | 14,000 | | 611 | |
Intuit, Inc. ‡ | | 13,900 | | 447 | |
ITT Educational Services, Inc. ‡ | | 2,400 | | 305 | |
J Crew Group, Inc. ‡ | | 7,300 | | 273 | |
Johnson & Johnson | | 14,700 | | 958 | |
Johnson Controls, Inc. ^ | | 31,400 | | 1,373 | |
JPMorgan Chase & Co. | | 18,800 | | 884 | |
Laboratory Corp. of America Holdings ‡ | | 7,000 | | 481 | |
Las Vegas Sands Corp. ‡ | | 2,800 | | 372 | |
Lexmark International, Inc. Class A ‡^ | | 5,600 | | 235 | |
Linear Technology Corp. ^ | | 13,000 | | 429 | |
LSI Corp. ‡ | | 23,200 | | 153 | |
Manitowoc Co., Inc. (The) | | 3,800 | | 187 | |
Masco Corp. | | 51,000 | | 1,228 | |
Mastercard, Inc. Class A ^ | | 4,100 | | 777 | |
McGraw-Hill Cos., Inc. (The) | | 12,900 | | 645 | |
Medco Health Solutions, Inc. ‡ | | 9,700 | | 915 | |
Medtronic, Inc. | | 16,200 | | 769 | |
Merck & Co., Inc. | | 20,900 | | 1,218 | |
Microchip Technology, Inc. | | 8,600 | | 285 | |
Microsoft Corp. | | 80,700 | | 2,971 | |
Millennium Pharmaceuticals, Inc. ‡ | | 29,000 | | 343 | |
Millipore Corp. ‡ | | 2,300 | | 179 | |
Morgan Stanley | | 32,500 | | 2,186 | |
Network Appliance, Inc. ‡ | | 18,800 | | 592 | |
News Corp. Class A | | 34,500 | | 748 | |
NiSource, Inc. | | 20,200 | | 413 | |
Northeast Utilities | | 1,400 | | 43 | |
Omnicom Group, Inc. | | 13,400 | | 683 | |
PACCAR, Inc. | | 11,700 | | 650 | |
Peabody Energy Corp. | | 8,100 | | 452 | |
Pepco Holdings, Inc. | | 9,200 | | 262 | |
PepsiCo, Inc. | | 2,600 | | 192 | |
Pharmaceutical Product Development, | | 5,700 | | 241 | |
PNC Financial Services Group, Inc. | | 6,600 | | 476 | |
Praxair, Inc. | | 8,800 | | 752 | |
Precision Castparts Corp. | | 600 | | 90 | |
Procter & Gamble Co. ^ | | 3,300 | | 229 | |
Qualcomm, Inc. | | 13,600 | | 581 | |
Quest Diagnostics, Inc. | | 7,700 | | 409 | |
Range Resources Corp. | | 4,500 | | 202 | |
Red Hat, Inc. ‡ | | 8,500 | | 183 | |
RH Donnelley Corp. ‡ | | 8,700 | | 477 | |
Rockwell Automation, Inc. | | 4,600 | | 317 | |
Ryder System, Inc. | | 5,100 | | 244 | |
Schering-Plough Corp. | | 11,700 | | 357 | |
Sempra Energy | | 12,300 | | 757 | |
Southwestern Energy Co. ‡ | | 4,300 | | 222 | |
Sprint Nextel Corp. ^ | | 114,900 | | 1,965 | |
Starbucks Corp. ‡ | | 10,800 | | 288 | |
Symantec Corp. ‡ | | 61,700 | | 1,159 | |
Synthes, Inc. | | 571 | | $ | 71 | |
SYSCO Corp. | | 43,300 | | 1,485 | |
Target Corp. ^ | | 7,600 | | 466 | |
United Technologies Corp. | | 7,400 | | 567 | |
UnitedHealth Group, Inc. | | 11,300 | | 555 | |
Viacom, Inc. Class B ‡ | | 13,800 | | 570 | |
Vmware, Inc. Class A ‡^ | | 1,600 | | 200 | |
Wells Fargo & Co. ^ | | 64,200 | | 2,183 | |
Wyeth | | 29,600 | | 1,439 | |
Wynn Resorts, Ltd. ^ | | 3,100 | | 500 | |
Xilinx, Inc. | | 22,700 | | 554 | |
XTO Energy, Inc. | | 6,100 | | 405 | |
Yahoo!, Inc. ‡^ | | 4,000 | | 124 | |
Virgin Islands, British (0.0%) | | | | | |
Dolphin Capital Investors, Ltd. ‡ | | 20,275 | | 55 | |
Total Common Stocks (cost $176,522) | | | | 190,617 | |
| | Shares | | Value | |
INVESTMENT COMPANIES (3.5%) | | | | | |
United States (3.5%) | | | | | |
iShares MSCI Emerging Markets Index | | 21,580 | | 3,604 | |
Vanguard Emerging Markets ETF | | 31,260 | | 3,652 | |
Total Investment Companies (cost $4,816) | | | | 7,256 | |
| | | | | |
Total Security Lending Collateral (cost $13,530) | | | | 13,530 | |
Total Investment Securities (cost $196,854) # | | | | $ | 213,335 | |
| | | | | | |
The notes to the financial statements are an integral part of this report.
120
SWAP AGREEMENTS
| | | | | | Net Unrealized | |
| | Expiration | | Notional | | Appreciation | |
| | Date | | Amount | | (Depreciation) | |
Receive a fixed rate equal to 3.07% and the Fund will pay a floating rate based on U.K. Retail Price Index.
Counterparty: Deutsche Bank AG | | 01/29/37 | | GBP | | $4,000 | | $ | (654 | ) |
| | | | | | | | | |
Receive a fixed rate equal to 3.10% and the Fund will pay a floating rate based on U.K. Retail Price Index.
Counterparty: Goldman Sachs International | | 01/22/37 | | GBP | | 4,000 | | (611 | ) |
| | | | | | | | | |
Receive a fixed rate equal to 3.10% and the Fund will pay a floating rate based on U.K. Retail Price Index.
Counterparty: Deutsche Bank AG | | 06/29/37 | | GBP | | 4,000 | | (235 | ) |
| | | | | | | | | |
Receive a fixed rate equal to 5.21% and the Fund will pay a floating rate based on 6-month Great British Pound-LIBOR.
Counterparty: Deutsche Bank AG | | 06/29/37 | | GBP | | 3,000 | | (330 | ) |
| | | | | | | | | |
Receive a floating rate based on 6-month CHF LIBOR and the Fund will pay a fixed rate equal to 3.29%.
Counterparty: Deutsche Bank AG | | 08/23/17 | | CHF | | 5,000 | | 17 | |
| | | | | | | | | |
Receive a floating rate based on 6-month Great British Pound-LIBOR and the Fund will pay a fixed rate equal to 5.12%.
Counterparty: Deutsche Bank AG | | 07/27/37 | | GBP | | 1,000 | | (81 | ) |
| | | | | | | | | |
Receive a floating rate based on the 3-month LIBOR and the Fund will pay a fixed rate equal to 2.50%.
Counterparty: Deutsche Bank AG | | 01/26/37 | | JPY | | 200,000 | | 17 | |
| | | | | | | | | |
Receive a floating rate based on the 3-month LIBOR and the Fund will pay a fixed rate equal to 2.57%.
Counterparty: Goldman Sachs International | | 02/02/37 | | JPY | | 450,000 | | (23 | ) |
| | | | | | | | | | |
The notes to the financial statements are an integral part of this report.
121
| | | | | | | | Net Unrealized | |
| | Expiration | | Notional | | Appreciation | |
| | Date | | Amount | | (Depreciation) | |
Receive a floating rate based on the 3-month LIBOR and the Fund will pay a fixed rate equal to 2.87%.
Counterparty: Deutsche Bank AG | | 01/24/17 | | CHF | | $1,000 | | $ | 29 | |
| | | | | | | | | |
Receive a floating rate based on the 3-month LIBOR and the Fund will pay a fixed rate equal to 4.59%.
Counterparty: Deutsche Bank AG | | 01/22/37 | | GBP | | 3,000 | | 267 | |
| | | | | | | | | |
Receive a floating rate based on the 3-month LIBOR and the Fund will pay a fixed rate equal to 4.72%.
Counterparty: Goldman Sachs International | | 01/29/37 | | GBP | | 3,000 | | 144 | |
| | | | | | | | | |
Receive from the Counterparty, in the event of default on any of the securities in the Dow Jones CDX.EM. 6 Year Index, the remaining interest payments on those defaulted securities and the Fund will pay a fixed rate equal to 1.40%.
Counterparty: Goldman Sachs International | | 12/20/11 | | | | 16,000 | | 101 | |
| | | | | | | | | |
Receive from the Counterparty, in the event of default on any of the securities in the Dow Jones CDX.HY-8 Index, the remaining interest payments on those defaulted securities and the Fund will pay a fixed rate equal to 2.75%.
Counterparty: Goldman Sachs International | | 06/20/12 | | | | 15,000 | | 729 | |
| | | | | | | | | |
Receive a floating rate based on the 3-month LIBOR minus 5bp and the Fund will pay a floating based on the monthly performance of the EURO STOXX50 Price Index (SX5E).
Counterparty: Goldman Sachs International | | 1/25/2012 | | EUR | | 10,120 | | (443 | ) |
Total Swap Agreements
(Premium $1,445) | | | | $ | | | 719,120 | | (1,073 | ) |
| | | | | | | | | | | |
The notes to the financial statements are an integral part of this report.
122
FUTURES CONTRACTS:
| | | | | | | | Net Unrealized | |
| | | | Settlement | | | | Appreciation | |
| | Contracts (·) | | Date | | Amount | | (Depreciation) | |
10 Year Australia Long Bond | | 85 | | 12/15/2007 | | $ | 7,770 | | $ | (184 | ) |
10 Year Canadian Bond | | 10 | | 12/17/2007 | | 1,187 | | 6 | |
10 Year Japan Bond | | (15 | ) | 12/20/2007 | | (17,694 | ) | (86 | ) |
10-Year U.S. Treasury Note | | (239 | ) | 12/31/2007 | | (26,294 | ) | (241 | ) |
Amsterdam Index | | 12 | | 11/17/2007 | | 1,903 | | q | |
CAC-40 Index | | (183 | ) | 11/16/2007 | | (15,470 | ) | (101 | ) |
DAX Index | | (82 | ) | 12/19/2007 | | (23,903 | ) | (663 | ) |
DJ Euro STOXX 50 Index | | (13 | ) | 12/15/2007 | | (847 | ) | (13 | ) |
Euro-Bund | | (7 | ) | 12/10/2007 | | (1,148 | ) | (1 | ) |
FTSE 100 Index | | (62 | ) | 12/16/2007 | | (8,692 | ) | (295 | ) |
FTSE/ JSE Index | | (121 | ) | 12/20/2007 | | (5,343 | ) | (465 | ) |
Hang Seng Index | | (16 | ) | 11/29/2007 | | (3,227 | ) | (102 | ) |
H-Shares Index | | (85 | ) | 11/29/2007 | | (10,964 | ) | (96 | ) |
IBEX 35 Index | | (21 | ) | 11/21/2007 | | (4,819 | ) | (188 | ) |
Long Gilt | | (33 | ) | 12/30/2007 | | (7,356 | ) | (40 | ) |
MSCI SING IX ETS | | (34 | ) | 11/29/2007 | | (2,170 | ) | (15 | ) |
MSCI Taiwan Index | | (20 | ) | 11/29/2007 | | (766 | ) | (12 | ) |
NIKKEI 225 OSE | | (105 | ) | 12/07/2007 | | (15,219 | ) | (679 | ) |
OMXS30 Index | | (222 | ) | 11/24/2007 | | (4,137 | ) | (29 | ) |
S&P 500 Index | | (123 | ) | 12/14/2007 | | (47,813 | ) | (1,304 | ) |
S&P MIB Index | | (14 | ) | 12/21/2007 | | (4,120 | ) | (41 | ) |
S&P TSE 60 Index | | (79 | ) | 12/20/2007 | | (14,182 | ) | (701 | ) |
SPI 200 Index | | (77 | ) | 12/20/2007 | | (12,121 | ) | (887 | ) |
| | | | | | $ | (215,425 | ) | $ | (6,137 | ) |
FORWARD FOREIGN CURRENCY CONTRACTS:
| | | | | | Amount in | | Net Unrealized | |
| | Bought | | Settlement | | U.S. Dollars | | Appreciation | |
Currency | | (Sold) | | Date | | Bought(Sold) | | (Depreciation) | |
Australian Dollar | | 2,270 | | 01/23/2008 | | $ | 2,000 | | $ | 94 | |
Australian Dollar | | (16,080 | ) | 01/23/2008 | | (13,960 | ) | (873 | ) |
Brazil Real | | (7,430 | ) | 01/24/2008 | | (4,012 | ) | (215 | ) |
Canadian Dollar | | (19,150 | ) | 01/23/2008 | | (18,407 | ) | (1,763 | ) |
Euro Dollar | | 4,090 | | 01/23/2008 | | 5,679 | | 243 | |
Euro Dollar | | (60,475 | ) | 01/23/2008 | | (83,682 | ) | (3,894 | ) |
Japanese Yen | | 1,683,000 | | 01/23/2008 | | 14,201 | | 533 | |
Malaysian Ringgit | | 12,909 | | 01/24/2008 | | 3,831 | | 50 | |
Mexican Peso | | 22,980 | | 01/23/2008 | | 2,088 | | 46 | |
New Zealand Dollar | | (6,045 | ) | 01/23/2008 | | (4,712 | ) | 101 | |
Norwegian Krone | | (6,850 | ) | 01/23/2008 | | (1,198 | ) | (70 | ) |
Republic of Korea Won | | (2,431,000 | ) | 01/24/2008 | | (2,658 | ) | (49 | ) |
Saudi Arabian Riyal | | 15,560 | | 01/23/2008 | | 4,166 | | (2 | ) |
Singapore Dollar | | 6,155 | | 01/23/2008 | | 4,116 | | 155 | |
South African Rand | | (8,750 | ) | 01/23/2008 | | (1,226 | ) | (95 | ) |
Swedish Krona | | 109,300 | | 01/23/2008 | | 16,583 | | 621 | |
Swiss Franc | | 23,420 | | 01/23/2008 | | 19,720 | | 588 | |
Taiwan Dollar | | 479,800 | | 01/24/2008 | | 14,793 | | 135 | |
United Kingdom Pound | | 1,215 | | 01/23/2008 | | 2,457 | | 60 | |
United Kingdom Pound | | (32,655 | ) | 01/23/2008 | | (66,248 | ) | (1,405 | ) |
| | | | | | $ | (106,469 | ) | $ | (5,740 | ) |
The notes to the financial statements are an integral part of this report.
123
FORWARD FOREIGN CROSS CURRENCY CONTRACTS:
| | | | | | | | | | Net Unrealized | |
| | | | | | | | Settlement | | Appreciation | |
Currency Bought | | Currency Sold | | Date | | (Depreciation) | |
Japanese Yen | | 492,523 | | Euro Dollar | | 3,075 | | 01/23/2008 | | $ | (141 | ) |
Japanese Yen | | 538,750 | | New Zealand Dollar | | 6,250 | | 01/23/2008 | | (51 | ) |
New Zealand Dollar | | 6,045 | | Japanese Yen | | 528,786 | | 01/23/2008 | | (19 | ) |
| | | | | | | | | | $ | (211 | ) |
| | Percentage of | | | |
(unaudited) | | Total Investments | | Value | |
INVESTMENTS BY INDUSTRY: | | | | | |
Commercial Banks | | 10.8 | % | $ | 23,026 | |
Pharmaceuticals | | 7.0 | % | 14,982 | |
Oil, Gas & Consumable Fuels | | 6.8 | % | 14,548 | |
Capital Markets | | 6.3 | % | 13,407 | |
Insurance | | 4.6 | % | 9,899 | |
Wireless Telecommunication Services | | 3.1 | % | 6,662 | |
Diversified Telecommunication Services | | 3.1 | % | 6,590 | |
Software | | 3.0 | % | 6,483 | |
Electric Utilities | | 3.0 | % | 6,392 | |
Semiconductors & Semiconductor Equipment | | 3.0 | % | 6,349 | |
Media | | 2.7 | % | 5,837 | |
Diversified Financial Services | | 2.4 | % | 5,054 | |
Energy Equipment & Services | | 2.3 | % | 4,888 | |
Food & Staples Retailing | | 2.3 | % | 4,877 | |
Industrial Conglomerates | | 2.2 | % | 4,704 | |
Machinery | | 2.0 | % | 4,197 | |
Hotels, Restaurants & Leisure | | 1.8 | % | 3,910 | |
Communications Equipment | | 1.7 | % | 3,580 | |
Beverages | | 1.6 | % | 3,427 | |
Health Care Providers & Services | | 1.5 | % | 3,263 | |
Automobiles | | 1.5 | % | 3,227 | |
Auto Components | | 1.4 | % | 3,046 | |
Computers & Peripherals | | 1.4 | % | 2,934 | |
Health Care Equipment & Supplies | | 1.2 | % | 2,602 | |
Road & Rail | | 1.2 | % | 2,525 | |
Biotechnology | | 1.2 | % | 2,445 | |
Specialty Retail | | 1.1 | % | 2,384 | |
Internet Software & Services | | 1.0 | % | 2,149 | |
Air Freight & Logistics | | 1.0 | % | 2,092 | |
IT Services | | 0.8 | % | 1,701 | |
Food Products | | 0.7 | % | 1,566 | |
Trading Companies & Distributors | | 0.7 | % | 1,561 | |
Chemicals | | 0.7 | % | 1,529 | |
Paper & Forest Products | | 0.7 | % | 1,453 | |
Construction Materials | | 0.7 | % | 1,437 | |
Aerospace & Defense | | 0.6 | % | 1,325 | |
Household Products | | 0.6 | % | 1,235 | |
Building Products | | 0.6 | % | 1,228 | |
Household Durables | | 0.5 | % | 969 | |
Tobacco | | 0.4 | % | 914 | |
Metals & Mining | | 0.4 | % | 775 | |
Real Estate Management & Development | | 0.3 | % | 724 | |
Commercial Services & Supplies | | 0.3 | % | 672 | |
Consumer Finance | | 0.3 | % | 670 | |
Life Sciences Tools & Services | | 0.3 | % | 646 | |
Airlines | | 0.3 | % | 635 | |
| | | | | | |
The notes to the financial statements are an integral part of this report.
124
| | Percentage of | | | |
(unaudited) | | Total Investments | | Value | |
Thrifts & Mortgage Finance | | 0.3 | % | $ | 522 | |
Real Estate Investment Trusts | | 0.2 | % | 494 | |
Textiles, Apparel & Luxury Goods | | 0.2 | % | 485 | |
Marine | | 0.2 | % | 478 | |
Electronic Equipment & Instruments | | 0.2 | % | 477 | |
Multiline Retail | | 0.2 | % | 466 | |
Diversified Consumer Services | | 0.2 | % | 462 | |
Office Electronics | | 0.2 | % | 394 | |
Electrical Equipment | | 0.2 | % | 317 | |
Multi-Utilities | | 0.2 | % | 303 | |
Internet & Catalog Retail | | 0.1 | % | 287 | |
Containers & Packaging | | 0.1 | % | 282 | |
Gas Utilities | | 0.1 | % | 146 | |
Construction & Engineering | | 0.1 | % | 89 | |
Personal Products | | 0.0 | % | 84 | |
Investment Securities, at value | | 93.6 | % | 199,805 | |
Short-Term Investments | | 6.4 | % | 13,530 | |
Total Investments | | 100.0 | % | $ | 213,335 | |
| | | | | | | |
NOTES TO SCHEDULE OF INVESTMENTS
^ At October 31, 2007, all or a portion of this security is on loan (see Note 1). The value at October 31, 2007, of all securities on loan is $13,116.
‡ Non Income Producing
· Contract Amounts are not in thousands
2 At October 31, 2007, $22,213 was on deposit with broker to cover margin requirements for open futures contracts.
# Aggregate cost for federal income tax purposes is $197,689. Aggregate gross unrealized appreciation for all securities in which there is an excess of value over tax cost and aggregate gross unrealized depreciation for all securities in which there is an excess of tax cost over value were $22,207 and $6,562, respectively. Net unrealized appreciation for tax purposes is $15,645.
q Value is less than $1
DEFINITONS
REIT Real Estate Investment Trust
The notes to the financial statements are an integral part of this report.
125
TA IDEX UBS Large Cap Value
MARKET ENVIRONMENT
Despite periods of market volatility, the fiscal year ended October 31, 2007 was a rewarding one for large-cap value investors. During that period, the Russell 1000 Value Index (“Russell 1000 Value”) gained 10.83%. Strong stock selection helped the portfolio outperform the Russell 1000 Value during the fiscal year.
After a slow start, the US economy appeared to strengthen during the twelve-month reporting period. First quarter 2007 US gross domestic product (“GDP”) came in at only 0.6%—the slowest growth rate in the US since the fourth quarter of 2002. The stumble was attributed to a variety of factors, including ongoing troubles in the housing market and tepid business spending. The economy then picked up steam in the second quarter—GDP posted a solid 3.8% growth rate—boosted by improving manufacturing activity. To date, the Commerce Department is reporting an advance estimate for third quarter GDP growth of 6.9%. Despite the weak housing market, issues related to sub-prime mortgages and tighter credit conditions, strong consumer spending and an increase in exports is continuing to support the economy.
US equities generally posted positive returns during the first half of the fiscal year. Over this time, the market was helped by strong corporate profits, an active merger and acquisition (“M&A”) environment and hopes that the Federal Reserve Board (“Fed”) would lower short-term interest rates. The market then weakened significantly in June and July 2007. Ongoing weakness in the housing market, rising sub-prime mortgage defaults and a severe credit crunch caused the Standard and Poor’s 500 Composite Stock Index (“S&P 500”) to fall nearly 5%. Stock prices rebounded in late August 2007, as expectations shifted that the Fed would lower interest rates. The Fed, in fact, did so in September and October, and the market continued to climb upward. (The federal funds rate, or “fed funds” rate, is the rate that banks charge one another for funds they borrow on an overnight basis.).
PERFORMANCE
For the year ended October 31, 2007, TA IDEX UBS Large Cap Value, Class I returned 12.48%. By comparison its benchmark, the Russell 1000 Value, returned 10.83%. For the year ended October 31, 2007, the net expense ratio of the Fund was 0.81%.
STRATEGY REVIEW
The portfolio seeks to maximize total return, consisting of capital appreciation and current income. To pursue this objective, the portfolio invests in the stocks of US large capitalization companies, which we define as those with a market capitalization of at least $3 billion. As the portfolio’s advisor, we generally focus on identifying what we believe are discrepancies between a security’s fundamental value and its market price when selecting securities for the portfolio. We base our estimates of a security’s fundamental value on economic, industry and company analysis, as well as on a company’s management team, competitive advantage and core competencies. Through this process, we aim to construct a portfolio with attractive relative price/value characteristics.
Strong stock selection drove the portfolio’s outperformance during the fiscal year. In terms of individual stocks, Medco Health Solutions, Inc., Costco Wholesale Corporation, Mellon Financial Corporation, Johnson Controls, Inc. and Merck & Co., Inc. were the greatest contributors to portfolio performance. On the downside, Sprint Nextel Corporation, Symantec Corporation, Omnicom Group Inc. and Burlington Northern Santa Fe Corporation were the largest detractor’s from performance.
In terms of industry exposures, the portfolio’s leading contributors to performance were its overweight positions in the motor vehicle and parts, oil services and the electric utility industries. In contrast, its underweight in energy reserves and oil refining stocks, as well as an overweight in banks, detracted from results.
John Leonard
Thomas M. Cole
Thomas Digenan
Scott Hazen
Co-Portfolio Managers
UBS Global Asset Management (Americas) Inc.
126
(unaudited)
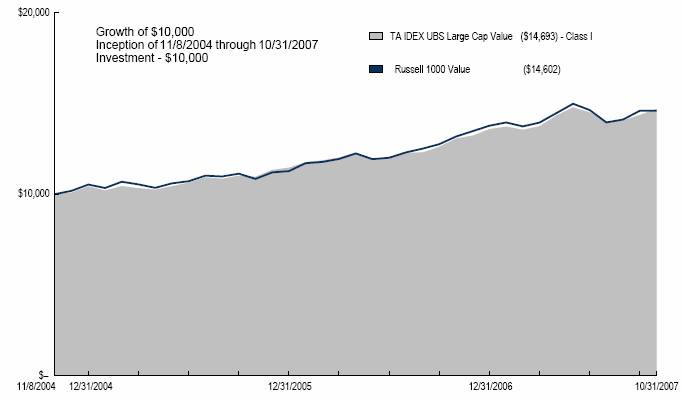
Average Annual Total Return for Periods Ended 10/31/2007
| | 1 Year | | From Inception | | Inception Date | |
| | | | | | | |
Class I (NAV) | | 12.48 | % | 13.78 | % | 11/8/04 | |
Russell 1000 Value (1) | | 10.83 | % | 13.50 | % | 11/8/04 | |
NOTES
(1) The Russell 1000 Value (Russell 1000 Value) Index is an unmanaged index used as a general measure of market performance. Calculations assume dividends and capital gains are reinvested and do not include any managerial expenses. From inception calculation is based on life of the Fund.
The performance data presented represents past performance, future results may vary. Performance data does not reflect the deduction of taxes that would be paid on fund distributions or the redemption of fund shares. Investment return and principal value will fluctuate so that an investor’s shares, when redeemed, may be worth more or less than their original cost. Current performance may be lower or higher than performance quoted. Please see www.transamericaidex.com for performance data current to the most recent month-end.
Net Asset Value (NAV) returns include the reinvestment of dividends and capital gains. Fund shares are sold without a sales load.
This material must be preceded or accompanied by a current prospectus, which includes specific contents regarding the investment objectives and policies of this fund.
This fund is only available in Class I shares, which are not available for direct investment by the public.
127
UNDERSTANDING YOUR FUND’S EXPENSES
(unaudited)
SHAREHOLDER EXPENSES
Fund shareholders may incur two types of costs: (1) transaction costs, including sales charges (loads) on purchases, contingent deferred sales charges on redemptions and redemption fees; and (2) ongoing costs, including management fees, dividend expense on short-sales, and other fund expenses.
The following Example is intended to help you understand your ongoing costs (in dollars and cents) of investing in the Fund and to compare these costs with the ongoing costs of investing in other funds.
The Example is based on an investment of $1,000 invested at May 1, 2007 and held for the entire period until October 31, 2007.
ACTUAL EXPENSES
The first line in the table below provides information about actual account values and actual expenses. You may use the information in this line, together with the amount you invested, to estimate the expenses that you paid over the period. Simply divide your account value by $1,000 (for example, an $8,600 account value divided by $1,000 = 8.6), then multiply the result by the number in the first line of your Fund under the heading entitled “Expenses Paid During Period” to estimate the expenses you paid on your account during this period.
HYPOTHETICAL EXAMPLE FOR COMPARISON PURPOSES
The second line in the table below provides information about hypothetical account values and hypothetical expenses based on the Fund’s actual expense ratio and an assumed rate of return of 5% per year before expenses, which is not the Fund’s actual return. The hypothetical account values and expenses may not be used to estimate the actual ending account balance or expenses you paid for the period. You may use this information to compare the ongoing costs of investing in your Fund and other funds. To do so, compare this 5% hypothetical example with the 5% hypothetical examples that appear in the shareholder reports of the other funds.
Please note that the expenses shown in the table are meant to highlight your ongoing costs only and do not reflect any transactional costs, such as sales charges, redemption fees, brokerage commissions paid on purchases and sales of fund shares. Therefore, the second line under the Fund in the table is useful in comparing ongoing costs only, and will not help you determine the relative total costs of owning different funds. If any of these transaction costs were included, your costs would be higher. The expenses shown in the table do not reflect any fees that may be charged to you by brokers, financial intermediaries or other financial institutions.
| | Beginning | | Ending | | Annualized | | Expenses | |
| | Account | | Account | | Expense | | Paid During | |
| | Value | | Value | | Ratio | | Period (a) | |
Class I | | | | | | | | | |
Actual | | $ | 1,000.00 | | $ | 1,025.27 | | 0.81 | % | $ | 4.12 | |
Hypothetical (b) | | 1,000.00 | | 1,021.06 | | 0.81 | | 4.12 | |
| | | | | | | | | | | | |
(a) Expenses are calculated using the Fund’s annualized expense ratio (as disclosed in the table), multiplied by the average account value for the period, multiplied by the number of days in the period (184 days), and divided by the number of days in the year (365 days).
(b) 5% return per year before expenses.
GRAPHICAL PRESENTATION OF SCHEDULE OF INVESTMENTS
By Sector
At October 31, 2007
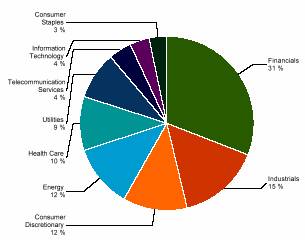
This chart shows the percentage breakdown by sector of the Fund’s total investment securities.
128
SCHEDULE OF INVESTMENTS
At October 31, 2007
(all amounts except share amounts in thousands)
| | Shares | | Value | |
CONVERTIBLE PREFERRED STOCKS (1.7%) | | | | | |
Panama (1.7%) | | | | | |
Carnival Corp. ^ | | 318,500 | | $ | 15,282 | |
Total Preferred Stocks (cost $15,156) | | | | 15,282 | |
| | | | | |
COMMON STOCKS (94.6%) | | | | | |
Cayman Islands (1.2%) | | | | | |
GlobalSantaFe Corp. | | 125,500 | | 10,169 | |
United States (93.4%) | | | | | |
Aflac, Inc. | | 172,000 | | 10,798 | |
Allstate Corp. (The) | | 94,600 | | 4,957 | |
American Electric Power Co., Inc. | | 347,400 | | 16,748 | |
Anheuser-Busch Cos., Inc. | | 187,200 | | 9,600 | |
AT&T, Inc. | | 507,500 | | 21,208 | |
Bank of America Corp. | | 256,700 | | 12,394 | |
Bank of New York Mellon Corp. | | 446,155 | | 21,795 | |
BorgWarner, Inc. | | 147,500 | | 15,592 | |
Bristol-Myers Squibb Co. | | 380,700 | | 11,417 | |
Burlington Northern Santa Fe Corp. | | 201,000 | | 17,517 | |
Cephalon, Inc. ‡^ | | 60,300 | | 4,447 | |
Chevron Corp. | | 341,100 | | 31,214 | |
Citigroup, Inc. | | 830,000 | | 34,777 | |
City National Corp. | | 65,200 | | 4,408 | |
Comcast Corp. Class A ‡ | | 417,300 | | 8,784 | |
Constellation Brands, Inc. Class A ‡ | | 256,400 | | 6,441 | |
Costco Wholesale Corp. | | 184,300 | | 12,396 | |
Discover Financial Services | | 284,200 | | 5,485 | |
Ensco International, Inc. | | 134,700 | | 7,475 | |
Exelon Corp. | | 315,700 | | 26,134 | |
Exxon Mobil Corp. | | 358,400 | | 32,969 | |
FedEx Corp. | | 130,400 | | 13,476 | |
Fifth Third Bancorp | | 521,400 | | 16,309 | |
Fortune Brands, Inc. | | 95,600 | | 8,008 | |
Freddie Mac | | 139,200 | | 7,270 | |
General Electric Co. | | 1,089,100 | | 44,827 | |
Halliburton Co. | | 339,500 | | 13,383 | |
Harley-Davidson, Inc. | | 104,300 | | 5,371 | |
Hartford Financial Services Group, Inc. | | 144,500 | | 14,021 | |
Illinois Tool Works, Inc. | | 332,200 | | 19,022 | |
Johnson & Johnson | | 198,500 | | 12,936 | |
Johnson Controls, Inc. | | 533,400 | | $ | 23,320 | |
JPMorgan Chase & Co. | | 526,600 | | 24,750 | |
Lockheed Martin Corp. | | 59,200 | | 6,514 | |
Masco Corp. | | 480,900 | | 11,580 | |
Medco Health Solutions, Inc. ‡ | | 154,900 | | 14,620 | |
Merck & Co., Inc. | | 373,300 | | 21,748 | |
Microsoft Corp. | | 510,600 | | 18,795 | |
Morgan Stanley | | 508,600 | | 34,208 | |
News Corp. Class A | | 418,800 | | 9,075 | |
NiSource, Inc. | | 264,300 | | 5,405 | |
Northeast Utilities | | 354,700 | | 10,935 | |
Northern Trust Corp. | | 166,900 | | 12,553 | |
Northrop Grumman Corp. | | 120,600 | | 10,085 | |
Omnicom Group, Inc. | | 229,200 | | 11,685 | |
PACCAR, Inc. | | 178,000 | | 9,890 | |
Peabody Energy Corp. | | 116,800 | | 6,512 | |
Pepco Holdings, Inc. | | 276,500 | | 7,878 | |
PNC Financial Services Group, Inc. | | 176,400 | | 12,729 | |
RH Donnelley Corp. ‡^ | | 111,700 | | 6,127 | |
Sempra Energy | | 148,900 | | 9,159 | |
Sprint Nextel Corp. | | 921,763 | | 15,762 | |
Symantec Corp. ‡ | | 667,700 | | 12,539 | |
UnitedHealth Group, Inc. | | 66,900 | | 3,288 | |
Wells Fargo & Co. | | 1,014,900 | | 34,517 | |
Wyeth | | 370,700 | | 18,027 | |
Total Common Stocks (cost $752,004) | | | | 833,049 | |
| | Shares | | Value | |
INVESTMENT COMPANIES (1.8%) | | | | | |
United States (1.8%) | | | | | |
SPDR Trust Series 1 Series T, Class T ^ | | 102,500 | | 15,852 | |
Total Investment Companies (cost $15,436) | | | | 15,852 | |
| | | | | |
Total Security Lending Collateral (cost $33,291) ± | | | | 33,291 | |
Total Investment Securities (cost $815,887) # | | | | $ | 897,474 | |
| | | | | | |
NOTES TO SCHEDULE OF INVESTMENTS
^ At October 31, 2007, all or a portion of this security is on loan (see Note 1). The value at October 31, 2007, of all securities on loan is $32,455.
± Cash collateral for the Repurchase Agreements, valued at $6,076, that serve as collateral for securities lending, are invested in corporate and government bonds with interest rates and maturity dates ranging from 0.00% - 8.125% and 11/14/2007 - 9/15/2037.
‡ Non Income Producing
# Aggregate cost for federal income tax purposes is $816,294. Aggregate gross unrealized appreciation for all securities in which there is an excess of value over tax cost and aggregate gross unrealized depreciation for all securities in which there is an excess of tax cost over value were $106,804 and $25,624, respectively. Net unrealized appreciation for tax purposes is $81,180.
The notes to the financial statements are an integral part of this report.
129
| | Percentage of | | | |
(unaudited) | | Total Investments | | Value | |
INVESTMENTS BY INDUSTRY: | | | | | |
Commercial Banks | | 10.0 | % | $ | 89,757 | |
Electric Utilities | | 8.5 | % | 76,259 | |
Diversified Financial Services | | 8.0 | % | 71,921 | |
Oil, Gas & Consumable Fuels | | 7.9 | % | 70,695 | |
Pharmaceuticals | | 7.1 | % | 64,129 | |
Capital Markets | | 7.0 | % | 62,613 | |
Industrial Conglomerates | | 5.0 | % | 44,827 | |
Auto Components | | 4.3 | % | 38,913 | |
Media | | 4.0 | % | 35,671 | |
Software | | 3.5 | % | 31,335 | |
Energy Equipment & Services | | 3.5 | % | 31,027 | |
Insurance | | 3.3 | % | 29,776 | |
Machinery | | 3.2 | % | 28,911 | |
Diversified Telecommunication Services | | 2.4 | % | 21,208 | |
Health Care Providers & Services | | 2.0 | % | 17,908 | |
Road & Rail | | 1.9 | % | 17,517 | |
Aerospace & Defense | | 1.8 | % | 16,599 | |
Beverages | | 1.8 | % | 16,040 | |
Wireless Telecommunication Services | | 1.8 | % | 15,762 | |
Hotels, Restaurants & Leisure | | 1.7 | % | 15,282 | |
Air Freight & Logistics | | 1.5 | % | 13,476 | |
Food & Staples Retailing | | 1.4 | % | 12,396 | |
Building Products | | 1.3 | % | 11,580 | |
Household Durables | | 0.9 | % | 8,008 | |
Thrifts & Mortgage Finance | | 0.8 | % | 7,270 | |
Consumer Finance | | 0.6 | % | 5,485 | |
Automobiles | | 0.6 | % | 5,371 | |
Biotechnology | | 0.5 | % | 4,447 | |
Investment Securities, at value | | 96.3 | % | 864,183 | |
Short-Term Investments | | 3.7 | % | 33,291 | |
Total Investments | | 100.0 | % | $ | 897,474 | |
The notes to the financial statements are an integral part of this report.
130
TA IDEX Van Kampen Emerging Markets Debt
MARKET ENVIRONMENT
During the twelve-month period ending October 31, 2007, emerging markets debt as measured by the J.P. Morgan Emerging Markets Bond Index (“EMBI Global”) returned 8.05%. Spreads on U.S. dollar-denominated external debt ended the twelve-month period in very close proximity to their starting point. The average spread of emerging markets bonds ended the period at +201 basis points above U.S. Treasury bonds. Interest rates on short-dated U.S. Treasury bonds declined substantially during the year ended October 31, 2007, as the Federal Reserve Board cut interest rates in the wake of a deceleration in U.S. economic activity and mortgage credit concerns during the summer of 2007.
PERFORMANCE
For the year ended October 31, 2007, TA IDEX Van Kampen Emerging Markets Debt, Class I returned 9.94%. By comparison its benchmark, the EMBI Global, returned 8.05%. For the year ended October 31, 2007, the net expense ratio of the Fund was 1.03%.
STRATEGY REVIEW
Most emerging market local currency assets outperformed external debt handily during the period. The portfolio benefited specifically from domestic debt and currency exposure to Turkey, Brazil, and Mexico, which added significantly to performance relative to the EMBI Global during the one-year period ending October 31, 2007. In Turkey, disinflation, robust foreign direct investment flows, orderly democratic elections, and prudent fiscal and monetary management were key themes during the period. The Turkish lira gained 20% versus the U.S. dollar. In Brazil, continued reserve accumulation, a strong trade balance, and attractive real interest rates helped spur the currency by 19%. During the period, Moody’s and Standard & Poor’s (“S&P”) upgraded the country’s long-term external debt credit rating to Ba1 and BB+, respectively. In Mexico, local and external debt assets were buoyed by the passing of tax and pension reform, continued retirement of external debt, and the market’s increasing confidence in the central bank’s ability and conviction to combat inflation. S&P upgraded the country’s long-term external debt rating to BBB+ during the one-year period.
Within the portfolio’s external debt exposure, a consistent overweight in the Philippines aided relative returns on the back of ongoing fiscal improvements and a declining trade deficit. In Venezuela, an aggregate underweight and security selection – particularly an overweight in the midsection of the yield curve – aided relative returns amid a sell-off in external debt. Supply concerns, nationalization of oil assets, and President Chavez’s continued anti-West rhetoric overwhelmed the positive impact of higher oil prices. In Indonesia, the portfolio’s exposure to corporate debt, which underperformed sovereign assets, detracted from relative returns. Indonesia’s external debt credit rating was upgraded to Ba3 by Moody’s during the period.
Abigail L. McKenna
Eric J. Baurmeister
Federico L. Kaune
Co-Portfolio Managers
Morgan Stanley Investment Management Inc.
131
(unaudited)
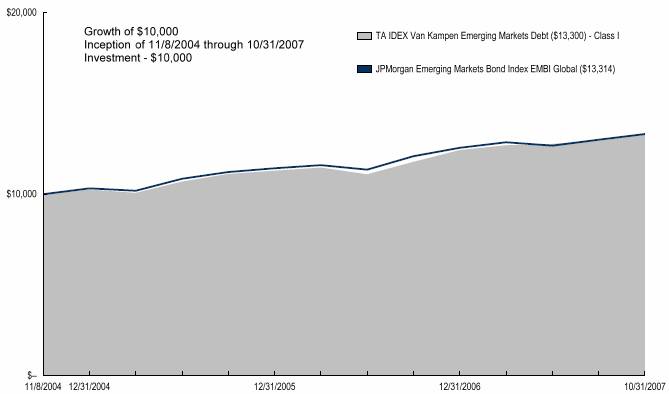
Average Annual Total Return for Periods Ended 10/31/2007
| | 1 Year | | From Inception | | Inception Date | |
Class I (NAV) | | 9.94 | % | 10.04 | % | 11/8/04 | |
JPMorgan Emerging Markets Bond Index EMBI Global(1) | | 8.05 | % | 10.01 | % | 11/8/04 | |
NOTES
(1) The J.P.Morgan Emerging Markets Bond (EMBI Global) Index is an unmanaged index used as a general measure of market performance. Calculations assume dividends and capital gains are reinvested and do not include any managerial expenses. From inception calculation is based on life of the Fund.
The performance data presented represents past performance, future results may vary. Performance data does not reflect the deduction of taxes that would be paid on fund distributions or the redemption of fund shares. Investment return and principal value will fluctuate so that an investor’s shares, when redeemed, may be worth more or less than their original cost. Current performance may be lower or higher than performance quoted. Please see www.transamericaidex.com for performance data current to the most recent month-end.
Net Asset Value (NAV) returns include the reinvestment of dividends and capital gains. Fund shares are sold without a sales load.
Investing in emerging markets involves special considerations. These may include risks related to market and currency volatility, adverse social and political developments, and the relatively small size and lesser liquidity of these markets.
This material must be preceded or accompanied by a current prospectus, which includes specific contents regarding the investment objectives and policies of this fund.
This fund is only available in Class I shares, which are not available for direct investment by the public.
132
UNDERSTANDING YOUR FUND’S EXPENSES
(unaudited)
SHAREHOLDER EXPENSES
Fund shareholders may incur two types of costs: (1) transaction costs, including sales charges (loads) on purchases, contingent deferred sales charges on redemptions and redemption fees; and (2) ongoing costs, including management fees, dividend expense on short-sales, and other fund expenses.
The following Example is intended to help you understand your ongoing costs (in dollars and cents) of investing in the Fund and to compare these costs with the ongoing costs of investing in other funds.
The Example is based on an investment of $1,000 invested at May 1, 2007 and held for the entire period until October 31, 2007.
ACTUAL EXPENSES
The first line in the table below provides information about actual account values and actual expenses. You may use the information in this line, together with the amount you invested, to estimate the expenses that you paid over the period. Simply divide your account value by $1,000 (for example, an $8,600 account value divided by $1,000 = 8.6), then multiply the result by the number in the first line of your Fund under the heading entitled “Expenses Paid During Period” to estimate the expenses you paid on your account during this period.
HYPOTHETICAL EXAMPLE FOR COMPARISON PURPOSES
The second line in the table below provides information about hypothetical account values and hypothetical expenses based on the Fund’s actual expense ratio and an assumed rate of return of 5% per year before expenses, which is not the Fund’s actual return. The hypothetical account values and expenses may not be used to estimate the actual ending account balance or expenses you paid for the period. You may use this information to compare the ongoing costs of investing in your Fund and other funds. To do so, compare this 5% hypothetical example with the 5% hypothetical examples that appear in the shareholder reports of the other funds.
Please note that the expenses shown in the table are meant to highlight your ongoing costs only and do not reflect any transactional costs, such as sales charges, redemption fees, brokerage commissions paid on purchases and sales of fund shares. Therefore, the second line under the Fund in the table is useful in comparing ongoing costs only, and will not help you determine the relative total costs of owning different funds. If any of these transaction costs were included, your costs would be higher. The expenses shown in the table do not reflect any fees that may be charged to you by brokers, financial intermediaries or other financial institutions.
| | Beginning | | Ending | | Annualized | | Expenses | |
| | Account | | Account | | Expense | | Paid During | |
| | Value | | Value | | Ratio | | Period (a) | |
Class I | | | | | | | | | |
Actual | | $ | 1,000.00 | | $ | 1,033.71 | | 1.01 | % | $ | 5.16 | |
Hypothetical (b) | | 1,000.00 | | 1,020.06 | | 1.01 | | 5.13 | |
| | | | | | | | | |
| | | | | | | | | | | | |
(a) Expenses are calculated using the Fund’s annualized expense ratio (as disclosed in the table), multiplied by the average account value for the period, multiplied by the number of days in the period (184 days), and divided by the number of days in the year (365 days).
(b) 5% return per year before expenses.
GRAPHICAL PRESENTATION OF SCHEDULE OF INVESTMENTS
By Region
At October 31, 2007

This chart shows the percentage breakdown by region of the Fund’s total investment securities.
133
SCHEDULE OF INVESTMENTS
At October 31, 2007
(all amounts except share amounts in thousands)
| | Principal | | Value | |
FOREIGN GOVERNMENT OBLIGATIONS (63.8%) | | | | | | | |
Arab Republic of Egypt -144A | | | | | | | |
8.75%, due 07/18/2012 | | EGP | | 13,120 | | $ | 2,439 | |
Argentina Government International | | | | | | | |
8.28%, due 12/31/2033 | | $ | | 4,291 | | 4,345 | |
Argentine Republic | | | | | | | |
Zero Coupon, due 04/10/2049 *,(2) | | | | 2,310 | | 1,094 | |
Zero Coupon, due 12/15/2035 * | | | | 64,362 | | 2,254 | |
5.83%, due 12/31/2033 | | | | 10,839 | | 4,313 | |
8.28%, due 12/31/2033 | | | | 120 | | 105 | |
Argentine Republic | | | | | | | |
Zero Coupon, due 12/15/2035 * | | | | 306 | | 38 | |
Mexican Bonos | | | | | | | |
8.00%, due 12/17/2015 | | MXN | | 56,480 | | 5,314 | |
Mexico Government International Bond | | | | | | | |
6.75%, due 09/27/2034 | | | | 4,387 | | 4,907 | |
Republic of Brazil | | | | | | | |
8.00%, due 01/15/2018 | | | | 8,461 | | 9,476 | |
8.88%, due 10/14/2019 – 04/15/2024 | | | | 4,833 | | 6,168 | |
10.00%, due 08/07/2011 | | | | 9,250 | | 11,068 | |
10.50%, due 07/14/2014 | | | | 2,580 | | 3,299 | |
11.00%, due 08/17/2040 | | | | 5,260 | | 7,067 | |
Republic of Bulgaria , Reg S | | | | | | | |
8.25%, due 01/15/2015 | | | | 3,750 | | 4,421 | |
Republic of Colombia | | | | | | | |
7.38%, due 09/18/2037 | | | | 3,110 | | 3,552 | |
8.25%, due 12/22/2014 | | | | 2,200 | | 2,512 | |
Republic of Colombia | | | | | | | |
11.75%, due 02/25/2020 | | | | 2,100 | | 3,134 | |
Republic of Ecuador , Reg S | | | | | | | |
9.38%, due 12/15/2015 | | | | 1,590 | | 1,590 | |
10.00%, due 08/15/2030 | | | | 1,760 | | 1,681 | |
Republic of Ivory Coast, (2) | | | | | | | |
3.00%, due 03/30/2018 * | | | | 3,495 | | 1,258 | |
Republic of Panama | | | | | | | |
7.13%, due 01/29/2026 | | | | 2,720 | | 2,999 | |
7.25%, due 03/15/2015 | | | | 1,220 | | 1,336 | |
9.38%, due 04/01/2029 | | | | 300 | | 408 | |
9.63%, due 02/08/2011 | | | | 1,476 | | 1,660 | |
Republic of Peru | | | | | | | |
8.38%, due 05/03/2016 | | | | 2,200 | | 2,590 | |
8.75%, due 11/21/2033 | | | | 3,190 | | 4,259 | |
9.88%, due 02/06/2015 | | | | 1,180 | | 1,475 | |
Republic of the Philippines | | | | | | | |
8.88%, due 03/17/2015 | | | | 8,020 | | 9,424 | |
9.00%, due 02/15/2013 | | | | 3,930 | | 4,519 | |
9.50%, due 02/02/2030 | | | | 12,772 | | 17,162 | |
Republic of Turkey | | | | | | | |
6.75%, due 04/03/2018 | | | | 6,048 | | 6,139 | |
7.00%, due 09/26/2016 | | | | 4,120 | | 4,311 | |
11.88%, due 01/15/2030 | | | | 2,500 | | 3,971 | |
Republic of Venezuela | | | | | | | |
5.75%, due 02/26/2016 | | | | 1,640 | | 1,410 | |
8.50%, due 10/08/2014 | | $ | | 2,100 | | $ | 2,158 | |
9.25%, due 09/15/2027 | | | | 5,270 | | 5,776 | |
10.75%, due 09/19/2013 | | | | 4,930 | | 5,514 | |
Russian Federation , Reg S | | | | | | | |
7.50%, due 03/31/2030 | | | | 6,782 | | 7,640 | |
11.00%, due 07/24/2018 | | | | 2,820 | | 3,995 | |
12.75%, due 06/24/2028 | | | | 3,470 | | 6,244 | |
State of Qatar , Reg S | | | | | | | |
9.75%, due 06/15/2030 | | | | 1,220 | | 1,827 | |
Ukraine Government -144A | | | | | | | |
6.58%, due 11/21/2016 | | | | 3,010 | | 3,059 | |
United Mexican States | | | | | | | |
8.38%, due 01/14/2011 | | | | 3,367 | | 3,737 | |
9.50%, due 12/18/2014 | | MXN | | 159,990 | | 16,268 | |
United Mexican States | | | | | | | |
5.63%, due 01/15/2017 | | | | 4,500 | | 4,565 | |
Total Foreign Government Obligations (cost $189,810) | | | | | | 202,481 | |
| | | | | | | |
ASSET-BACKED SECURITIES (0.5%) | | | | | | | |
Netherlands (0.5%) | | | | | | | |
Tjiwi Kimia Finance BV , Reg S 144A | | | | | | | |
6.00%, due 04/28/2015 | | | | 1,885 | | 1,612 | |
Total Asset-Backed Securities (cost $1,628) | | | | | | 1,612 | |
| | | | | | | |
CORPORATE DEBT SECURITIES (19.6%) | | | | | | | |
Cayman Islands (0.7%) | | | | | | | |
Banco ABN AMRO Real SA/Cayman | | | | | | | |
Island -144A | | | | | | | |
15.86%, due 12/13/2007 | | BRL | | 4,000 | | 2,299 | |
Chile (1.4%) | | | | | | | |
Empresa Nacional de Petroleo Enap , Reg S 144A | | | | | | | |
6.75%, due 11/15/2012 | | | | 4,300 | | 4,525 | |
Luxembourg (7.0%) | | | | | | | |
GAZ Capital for Gazprom -144A | | | | | | | |
6.21%, due 11/22/2016 | | | | 5,743 | | 5,663 | |
8.63%, due 04/28/2034 | | | | 4,480 | | 5,682 | |
RSHB Capital SA for OJSC Russian | | | | | | | |
Agricultural Bank -144A | | | | | | | |
6.30%, due 05/15/2017 | | | | 1,527 | | 1,447 | |
7.18%, due 05/16/2013 | | | | 4,580 | | 4,723 | |
Tnk-BP Finance SA -144A | | | | | | | |
7.88%, due 03/13/2018 | | | | 4,769 | | 4,715 | |
Mexico (0.7%) | | | | | | | |
Pemex Project Funding Master Trust -144A | | | | | | | |
8.63%, due 12/01/2023 | | | | 1,750 | | 2,256 | |
The notes to the financial statements are an integral part of this report.
134
| | Principal | | Value | |
CORPORATE DEBT SECURITIES (19.6%) | | | | | | | |
Netherlands (2.4%) | | | | | | | |
Pindo Deli Finance BV , Reg S 144A | | | | | | | |
Zero Coupon, due 04/28/2025 | | $ | | 10,915 | | $ | 1,201 | |
5.97%, due 04/28/2018 * | | | | 1,500 | | 742 | |
6.00%, due 04/28/2015 – 04/28/2018 * | | | | 2,658 | | 1,625 | |
Tjiwi Kimia Finance BV , Reg S 144A | | | | | | | |
Zero Coupon, due 04/28/2027 * | | | | 2,545 | | 280 | |
6.00%, due 04/28/2015 – 04/28/2018 * | | | | 7,133 | | 3,832 | |
Trinidad and Tobago (1.1%) | | | | | | | |
National Gas Co. of Trinidad & Tobago, Ltd. , Reg S 144A | | | | | | | |
6.05%, due 01/15/2036 | | | | 3,406 | | 3,297 | |
United States (6.3%) | | | | | | | |
JPMorgan Chase & Co. -144A | | | | | | | |
7.00%, due 06/28/2017 | | RUB | | 78,000 | | 3,020 | |
Pemex Proj FDG Master TR-Regs 144A | | | | | | | |
5.75%, due 03/01/2018 | | | | 6,220 | | 6,273 | |
Pemex Project Funding Master Trust , Reg S 144A | | | | | | | |
6.99%, due 06/15/2010 * | | | | 5,450 | | 5,537 | |
9.13%, due 10/13/2010 | | | | 4,500 | | 5,008 | |
Total Corporate Debt Securities (cost $64,607) | | | | | | 62,125 | |
STRUCTURED NOTES (5.0%) | | | | | | | |
Republic of Brazil Credit Linked Note | | | | | | | |
6.00%, due 05/18/2009 | | $ | | 4,448 | | $ | 6,153 | |
Brazil (2.1%) | | | | | | | |
JPMorgan Chase & Co. | | | | | | | |
Zero Coupon, due 01/03/2012 | | BRL | | 11,610 | | 6,533 | |
Cayman Islands (1.0%) | | | | | | | |
Republic of Brazil Credit Linked Note (Banco ABN Amro Real SA, Grand Cayman Branch) , Reg S 16.20%, due 02/22/2010 | | BRL | | 5,060 | | 3,156 | |
Total Structured Notes (cost $12,128) | | | | | | 15,842 | |
| | Shares | | Value | |
WARRANTS (0.0%) | | | | | |
Mexico (0.0%) | | | | | |
United Mexican States | | | | | |
Expiration: 11/07/2007, Exercise Price $0.00 | | 4,588 | | 2 | |
Total Warrants (cost $175) | | | | 2 | |
Total Investment Securities (cost $268,348) # | | | | $ | 282,062 | |
| | | | | | |
NOTES TO SCHEDULE OF INVESTMENTS
* Floating or variable rate note. Rate is listed as of October 31, 2007.
2 In Default
Ž The security has a perpetual maturity. The date shown is the next call date.
# Aggregate cost for federal income tax purposes is $269,369. Aggregate gross unrealized appreciation for all securities in which there is an excess of value over tax cost and aggregate gross unrealized depreciation for all securities in which there is an excess of tax cost over value were $16,857 and $4,165, respectively. Net unrealized appreciation for tax purposes is $12,692.
DEFINITIONS:
144A | | 144A Securities are registered pursuant to Rule 144A of the Securities Act of 1933. These securities are deemed to be liquid for purposes of compliance limitations on holdings of illiquid securities and may be resold as transactions exempt from registration, normally to qualified institutional buyers. At October 31, 2007, these securities aggregated $36,873 or 11.62% of net assets of the Fund. |
BRL | | Brazil Real |
EGP | | Egypt Pound |
MXN | | Mexico nuevo peso |
RUB | | Russia Ruble |
The notes to the financial statements are an integral part of this report.
135
| | Percentage of | | | |
(unaudited) | | Total Investments | | Value | |
INVESTMENTS BY INDUSTRY: | | | | | |
Sovereign Government Obligation | | 76.3 | % | $ | 215,169 | |
Oil, Gas & Consumable Fuels | | 12.4 | % | 34,944 | |
Commercial Banks | | 5.8 | % | 16,340 | |
Paper & Forest Products | | 2.7 | % | 7,680 | |
Diversified Financial Services | | 2.2 | % | 6,317 | |
Asset-Backed Securities | | 0.6 | % | 1,612 | |
Investment Securities, at value | | 100.0 | % | 282,062 | |
Total Investments | | 100.0 | % | $ | 282,062 | |
The notes to the financial statements are an integral part of this report.
136
TA IDEX Van Kampen Mid-Cap Growth
MARKET ENVIRONMENT
The twelve-month period ended October 31, 2007 began on a high note. Overall, stocks rallied strongly though year end 2006, as the Federal Reserve Board (“Fed”) continued to leave the target federal funds rate (“fed funds rate”) unchanged, inflation remained under control, consumer spending was decent, and the pace of merger and acquisition and private equity activities fueled optimistic investor sentiment. However, within the first few months of 2007, the burgeoning crisis in the sub-prime mortgage market (i.e., loans made to riskier, less credit worthy consumers) disrupted stocks’ climb. By summer, the still rising levels of loan defaults and home foreclosures led to a full collapse of the sub-prime mortgage market, causing the bankruptcies of a number mortgage lenders and several hedge funds invested in sub-prime mortgage-backed securities. Credit began tightening across the board, removing much of the low-cost liquidity that had helped support the leveraged buyout boom and stocks’ robust gains for the past several years. In addition, consumers became more cautious on spending, as gasoline prices increased and the housing market continued to languish. The market in July and August was highly volatile, as investors began to reassess risk and rotated into areas of the market they believed to be “safe havens.” Beginning in mid-August, the Fed lowered both the discount rate (the rate at which member banks borrow from the central bank) and the fed funds rate in a series of adjustments that helped stabilize the markets and injected much-needed liquidity into the financial system. Although stocks did turn upward in September and October, investors found little solace in September’s weak economic data reports, the multi-billion dollar losses expected at the largest financial companies, and anticipated further market volatility in the weeks ahead.
PERFORMANCE
For the year ended October 31, 2007, TA IDEX Van Kampen Mid-Cap Growth, Class I returned 37.32%. By comparison its benchmark, the Russell Midcap Growth Index (“Russell Midcap Growth”), returned 19.72%. For the year ended October 31, 2007, the net expense ratio of the Fund was 0.90%.
STRATEGY REVIEW
Throughout the reporting period, we used our intensive fundamental research process to seek high-quality growth companies. Our investment discipline favors companies that have high barriers to entry, business visibility, rising return on invested capital, free cash flow and a favorable risk/reward profile. Our emphasis is on secular growth, and as a result, short-term market events are not as meaningful in the stock selection process.
As of the end of the reporting period, consumer discretionary represented the largest weight and sector overweight relative to the Russell Midcap Growth. Financial services and health care were the next largest absolute weights in the portfolio, although both sectors were underweight relative to the Russell Midcap Growth.
The portfolio outperformed the Russell Midcap Growth for the twelve-month period ended October 31, 2007. The most significant contributor to performance came from security selection in the consumer discretionary sector. In particular, investment in hotel/motel, retail, commercial services, education services, consumer electronics and communications and media companies greatly benefited relative returns. An underweight allocation and stock selection within the technology sector (mainly in computer software services firms) were also advantageous to performance. The health care sector also added to relative returns through an underweight allocation coupled with security selection in the medical and dental instruments and supplies and health care services segments.
The most significant detractors to performance included the materials and processing sector, where an underweight allocation and stock selection in real estate companies, an avoidance of metal fabricating firms and a single holding in an engineering and contracting services company hurt relative returns. Additionally, stock selection and an underweight allocation in the other energy sector negatively impacted returns. Here, our avoidance of oil well equipment companies as well as gas pipeline and coal companies greatly dampened overall performance.
Dennis P. Lynch
David S. Cohen
Sam G. Chainani
Alexander T. Norton
Co-Portfolio Managers
Morgan Stanley Investment Management, Inc.
137
(unaudited)
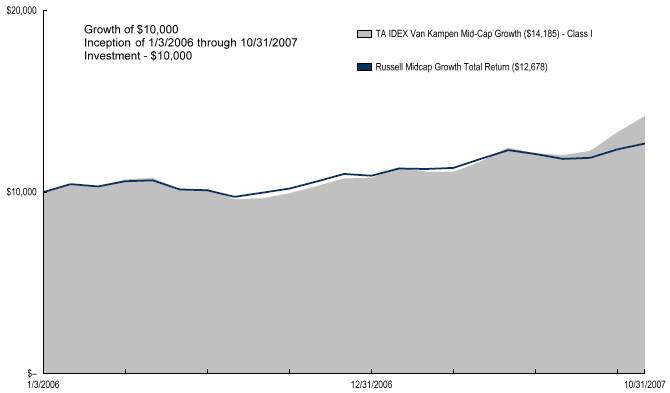
Average Annual Total Return for Periods Ended 10/31/2007
| | 1 Year | | From Inception | | Inception Date | |
Class I (NAV) | | 37.32 | % | 21.08 | % | 1/3/06 | |
Russell Midcap Growth (1) | | 19.72 | % | 14.77 | % | 1/3/06 | |
NOTES
(1) The Russell Midcap Growth (Russell Midcap Growth) Index is an unmanaged index used as a general measure of market performance. Calculations assume dividends and capital gains are reinvested and do not include any managerial expenses. From inception calculation is based on life of the Fund.
The performance data presented represents past performance, future results may vary. Performance data does not reflect the deduction of taxes that would be paid on fund distributions or the redemption of fund shares. Investment return and principal value will fluctuate so that an investor’s shares,when redeemed, may be worth more or less than their original cost. Current performance may be lower or higher than performance quoted. Please see www.transamericaidex.com for performance data current to the most recent month-end.
Net Asset Value (NAV) returns include the reinvestment of dividends and capital gains. Fund shares are sold without a sales load.
This material must be preceded or accompanied by a current prospectus, which includes specific contents regarding the investment objectives and policies of this fund.
This fund is only available in Class I shares, which are not available for direct investment by the public.
138
UNDERSTANDING YOUR FUND’S EXPENSES
(unaudited)
SHAREHOLDER EXPENSES
Fund shareholders may incur two types of costs: (1) transaction costs, including sales charges (loads) on purchases, contingent deferred sales charges on redemptions and redemption fees; and (2) ongoing costs, including management fees, dividend expense on short-sales, and other fund expenses.
The following Example is intended to help you understand your ongoing costs (in dollars and cents) of investing in the Fund and to compare these costs with the ongoing costs of investing in other funds.
The Example is based on an investment of $1,000 invested at May 1, 2007 and held for the entire period until October 31, 2007.
ACTUAL EXPENSES
The first line in the table below provides information about actual account values and actual expenses. You may use the information in this line, together with the amount you invested, to estimate the expenses that you paid over the period. Simply divide your account value by $1,000 (for example, an $8,600 account value divided by $1,000 = 8.6), then multiply the result by the number in the first line of your Fund under the heading entitled “Expenses Paid During Period” to estimate the expenses you paid on your account during this period.
HYPOTHETICAL EXAMPLE FOR COMPARISON PURPOSES
The second line in the table below provides information about hypothetical account values and hypothetical expenses based on the Fund’s actual expense ratio and an assumed rate of return of 5% per year before expenses, which is not the Fund’s actual return. The hypothetical account values and expenses may not be used to estimate the actual ending account balance or expenses you paid for the period. You may use this information to compare the ongoing costs of investing in your Fund and other funds. To do so, compare this 5% hypothetical example with the 5% hypothetical examples that appear in the shareholder reports of the other funds.
Please note that the expenses shown in the table are meant to highlight your ongoing costs only and do not reflect any transactional costs, such as sales charges, redemption fees, brokerage commissions paid on purchases and sales of fund shares. Therefore, the second line under the Fund in the table is useful in comparing ongoing costs only, and will not help you determine the relative total costs of owning different funds. If any of these transaction costs were included, your costs would be higher. The expenses shown in the table do not reflect any fees that may be charged to you by brokers, financial intermediaries or other financial institutions.
| | Beginning | | Ending | | Annualized | | Expenses | |
| | Account | | Account | | Expense | | Paid During | |
| | Value | | Value | | Ratio | | Period (a) | |
| | | | | | | | | |
Class I | | | | | | | | | |
Actual | | $ | 1,000.00 | | $ | 1,213.37 | | 0.89 | % | $ | 4.95 | |
Hypothetical (b) | | 1,000.00 | | 1,020.66 | | 0.89 | | 4.52 | |
| | | | | | | | | | | | |
(a) Expenses are calculated using the Fund’s annualized expense ratio (as disclosed in the table), multiplied by the average account value for the period, multiplied by the number of days in the period (184 days), and divided by the number of days in the year (365 days).
(b) 5% return per year before expenses.
GRAPHICAL PRESENTATION OF SCHEDULE OF INVESTMENTS
By Sector
At October 31, 2007
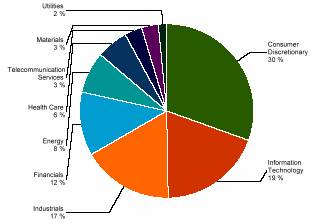
This chart shows the percentage breakdown by sector of the Fund’s total investment securities.
139
SCHEDULE OF INVESTMENTS
At October 31, 2007
(all amounts except share amounts in thousands)
| | Shares | | Value | |
CONVERTIBLE PREFERRED STOCKS (2.9%) | | | | | |
Media (2.9%) | | | | | |
Aeroplan Income Fund | | 151,497 | | $ | 3,573 | |
Total Preferred Stock (cost $2,444) | | | | 3,573 | |
| | | | | |
COMMON STOCKS (93.1%) | | | | | |
Air Freight & Logistics (4.2%) | | | | | |
CH Robinson Worldwide, Inc. | | 54,878 | | 2,739 | |
Expeditors International Washington, | | 50,732 | | 2,570 | |
Airlines (1.3%) | | | | | |
UAL Corp. ‡^ | | 34,117 | | 1,634 | |
Capital Markets (1.6%) | | | | | |
Calamos Asset Management, Inc. Class A | | 57,485 | | 1,956 | |
Chemicals (2.0%) | | | | | |
Nalco Holding Co. | | 101,792 | | 2,531 | |
Commercial Services & Supplies (7.4%) | | | | | |
ChoicePoint, Inc. ‡ | | 41,460 | | 1,630 | |
Corporate Executive Board Co. ^ | | 41,115 | | 2,929 | |
Monster Worldwide, Inc. ‡ | | 53,307 | | 2,163 | |
Stericycle, Inc. ‡ | | 44,910 | | 2,620 | |
Construction & Engineering (0.9%) | | | | | |
Aecom Technology Corp. ‡ | | 31,608 | | 1,067 | |
Construction Materials (1.0%) | | | | | |
Texas Industries, Inc. | | 16,690 | | 1,219 | |
Diversified Consumer Services (3.2%) | | | | | |
Apollo Group, Inc. Class A ‡ | | 38,757 | | 3,072 | |
Weight Watchers International, Inc. | | 18,083 | | 927 | |
Diversified Financial Services (5.8%) | | | | | |
Glg Partners, Inc. ‡^ | | 73,587 | | 974 | |
IntercontinentalExchange, Inc. ‡^ | | 14,555 | | 2,594 | |
Leucadia National Corp. ^ | | 44,737 | | 2,267 | |
Moody’s Corp. ^ | | 33,949 | | 1,484 | |
Electrical Equipment (1.1%) | | | | | |
First Solar, Inc. ‡^ | | 8,549 | | 1,358 | |
Electronic Equipment & Instruments (1.0%) | | | | | |
Itron, Inc. ‡^ | | 12,227 | | 1,314 | |
Gas Utilities (1.5%) | | | | | |
Questar Corp. | | 32,484 | | 1,854 | |
Health Care Equipment & Supplies (1.8%) | | | | | |
GEN-Probe, Inc. ‡ | | 32,270 | | 2,260 | |
Hotels, Restaurants & Leisure (9.2%) | | | | | |
Chipotle Mexican Grill, Inc. Class B ‡ | | 15,929 | | 1,964 | |
Choice Hotels International, Inc. ^ | | 24,614 | | 954 | |
Ctrip.Com International, Ltd. | | 32,279 | | 1,819 | |
Wendy’s International, Inc. | | 38,648 | | 1,344 | |
Wynn Resorts, Ltd. | | 33,432 | | 5,397 | |
Household Durables (0.7%) | | | | | |
NVR, Inc. ‡^ | | 1,801 | | 857 | |
Insurance (1.1%) | | | | | |
Alleghany Corp. ‡^ | | 3,556 | | 1,398 | |
Internet & Catalog Retail (0.1%) | | | | | |
Alibaba.Com, Ltd. ‡ @ | | 68,500 | | 119 | |
Internet Software & Services (10.5%) | | | | | |
Baidu.Com ‡^ | | 9,907 | | 3,789 | |
Equinix, Inc. ‡^ | | 22,596 | | 2,636 | |
NHN Corp. ‡ | | 8,020 | | $ | 2,547 | |
Savvis, Inc. ‡^ | | 24,877 | | 940 | |
Tencent Holdings, Ltd. | | 390,000 | | 3,306 | |
IT Services (4.6%) | | | | | |
Global Payments, Inc. | | 36,714 | | 1,746 | |
Iron Mountain, Inc. ‡ | | 51,760 | | 1,798 | |
Mastercard, Inc. Class A | | 11,586 | | 2,196 | |
Life Sciences Tools & Services (3.8%) | | | | | |
Illumina, Inc. ‡^ | | 44,443 | | 2,495 | |
Techne Corp. ‡ | | 35,479 | | 2,315 | |
Media (4.5%) | | | | | |
Discovery Holding Co. Class A ‡ | | 61,975 | | 1,767 | |
Focus Media Holding, Ltd. ‡^ | | 25,566 | | 1,585 | |
Grupo Televisa SA | | 91,798 | | 2,281 | |
Oil, Gas & Consumable Fuels (7.4%) | | | | | |
Southwestern Energy Co. ‡ | | 56,840 | | 2,940 | |
Ultra Petroleum Corp. ‡ | | 89,413 | | 6,336 | |
Real Estate Management & Development (2.9%) | | | | | |
Brookfield Asset Management, Inc. Class A | | 45,186 | | 1,843 | |
Forest City Enterprises, Inc. Class A | | 30,557 | | 1,739 | |
Software (2.3%) | | | | | |
Autodesk, Inc. ‡ | | 22,456 | | 1,098 | |
Salesforce.Com, Inc. ‡^ | | 31,728 | | 1,789 | |
Specialty Retail (3.8%) | | | | | |
Abercrombie & Fitch Co. Class A ^ | | 42,246 | | 3,346 | |
AutoZone, Inc. ‡ | | 11,840 | | 1,473 | |
Textiles, Apparel & Luxury Goods (2.4%) | | | | | |
Lululemon Athletica, Inc. ‡^ | | 33,342 | | 1,774 | |
Under Armour, Inc. Class A ‡^ | | 19,034 | | 1,185 | |
Trading Companies & Distributors (2.6%) | | | | | |
LI & Fung, Ltd. | | 690,000 | | 3,240 | |
Transportation Infrastructure (1.3%) | | | | | |
Grupo Aeroportuario del Pacifico SA de | | 31,919 | | 1,674 | |
Wireless Telecommunication Services (3.1%) | | | | | |
Crown Castle International Corp. ‡ | | 39,918 | | 1,639 | |
NII Holdings, Inc. ‡ | | 39,241 | | 2,276 | |
Total Common Stocks (cost $95,286) | | | | 116,767 | |
| | | | | |
Total Security Lending Collateral (cost $22,950) ± | | | | 22,950 | |
Total Investment Securities (cost $120,680) # | | | | $ | 143,290 | |
The notes to the financial statements are an integral part of this report.
140
NOTES TO SCHEDULE OF INVESTMENTS
^ At October 31, 2007, all or a portion of this security is on loan (see Note 1). The value at October 31, 2007, of all securities on loan is $22,268
± Cash collateral for the Repurchase Agreements, valued at $4,189, that serve as collateral for securities lending, are invested in corporate and government bonds with interest rates and maturity dates ranging from 0.00% - 8.125% and 11/14/2007 - 9/15/2037.
‡ Non Income Producing
@ Securities valued as determined in good faith in accordance with procedures established by the Fund’s Board of Trustees.
# Aggregate cost for federal income tax purposes is $120,798. Aggregate gross unrealized appreciation for all securities in which there is an excess of value over tax cost and aggregate gross unrealized depreciation for all securities in which there is an excess of tax cost over value were $25,078 and $2,586, respectively. Net unrealized appreciation for tax purposes is $22,492.
The notes to the financial statements are an integral part of this report.
141
TA IDEX Van Kampen Small Company Growth
MARKET ENVIRONMENT
The twelve-month period ended October 31, 2007 began on a high note. Overall, stocks rallied strongly though year end 2006, as the Federal Reserve Board (“Fed”) continued to leave the target federal funds rate (“fed funds rate”) unchanged, inflation remained under control, consumer spending was decent, and the pace of merger and acquisition and private equity activities fueled optimistic investor sentiment. However, within the first few months of 2007, the burgeoning crisis in the sub-prime mortgage market (i.e., loans made to riskier, less credit worthy consumers) disrupted stocks’ climb. By summer, the still rising levels of loan defaults and home foreclosures led to a full collapse of the sub-prime mortgage market, causing the bankruptcies of a number mortgage lenders and several hedge funds invested in sub-prime mortgage-backed securities. Credit began tightening across the board, removing much of the low-cost liquidity that had helped support the leveraged buyout boom and stocks’ robust gains for the past several years. In addition, consumers became more cautious on spending, as gasoline prices increased and the housing market continued to languish. The market in July and August was highly volatile, as investors began to reassess risk and rotated into areas of the market they believe to be “safe havens.” Beginning in mid-August, the Fed lowered both the discount rate (the rate at which member banks borrow from the central bank) and the fed funds rate in a series of adjustments that helped stabilize the markets and injected much-needed liquidity into the financial system. Although stocks did turn upward in September and October, investors found little solace in September’s weak economic data reports, the multi-billion dollar losses expected at the largest financial companies, and anticipated further market volatility in the weeks ahead.
PERFORMANCE
For the year ended October 31, 2007, TA IDEX Van Kampen Small Company Growth, Class I returned 14.96%. By comparison its benchmark, the Russell 2000 Growth Index (“Russell 2000 Growth”), returned 16.73%. For the year ended October 31, 2007, the net expense ratio of the Fund was 1.01%.
STRATEGY REVIEW
Throughout the period, we used our intensive fundamental research process to seek high-quality growth companies. Our investment discipline favors companies that have high barriers to entry, business visibility, rising return on invested capital, free cash flow and a favorable risk/reward profile. Our emphasis is on secular growth, and as a result, short-term market events are not as meaningful in the stock selection process.
At the end of the reporting period, consumer discretionary represented both the largest sector weight and overweight in the portfolio versus the Russell 2000 Growth. The technology and financial services sectors were the next largest absolute weights in the portfolio, although both sectors were underweight relative to the Russell 2000 Growth.
The portfolio underperformed the Russell 2000 Growth over the twelve-month period, and the sectors that contributed most significantly to performance were technology, financial services and producer durables. Within the technology sector, superior stock selection in computer software services and miscellaneous technology companies had the largest positive impact on relative returns. The financial services sector further added to the portfolio’s performance through security selection in the financial information services, real estate investment trusts (“REIT”s) and diversified financial services segments. Stock selection in homebuilding companies and telecommunication equipment firms in the producer durables sector was also advantageous to relative returns.
Still there were several areas of weakness for the portfolio. For instance, an overweight allocation in the integrated oils sector turned out to be the largest detractor to relative returns, offsetting gains made through positive stock selection. Poor stock selection in the utilities sector, particularly in wireless companies, coupled with an underweight allocation also dampened performance. The materials and processing sector further detracted from the portfolio due to investment in construction companies and an avoidance of metal fabricating companies.
Dennis P. Lynch
David S. Cohen
Sam G. Chainani
Alexander T. Norton
Co-Portfolio Managers
Morgan Stanley Investment Management Inc.
142
(unaudited)
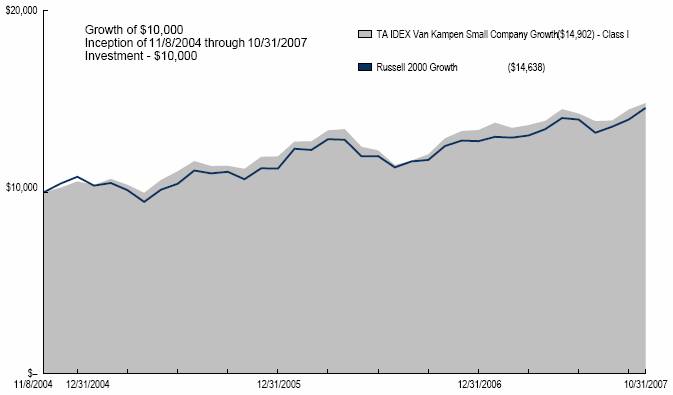
Average Annual Total Return for Periods Ended 10/31/2007
| | 1 Year | | From Inception | | Inception Date | |
Class I (NAV) | | 14.96 | % | 14.32 | % | 11/8/04 | |
Russell 2000 Growth (1) | | 16.73 | % | 13.54 | % | 11/8/04 | |
NOTES
(1) The Russell 2000 Growth (Russell 2000 Growth) Index is an unmanaged index used as a general measure of market performance. Calculations assume dividends and capital gains are reinvested and do not include any managerial expenses. From inception calculation is based on life of the Fund.
The performance data presented represents past performance, future results may vary. Performance data does not reflect the deduction of taxes that would be paid on fund distributions or the redemption of fund shares. Investment return and principal value will fluctuate so that an investor’s shares, when redeemed, may be worth more or less than their original cost. Current performance may be lower or higher than performance quoted. Please see www.transamericaidex.com for performance data current to the most recent month-end.
Net Asset Value (NAV) returns include the reinvestment of dividends and capital gains. Fund shares are sold without a sales load. Investing in small cap stocks generally involves greater risks so an investment in the Fund may not be appropriate for everyone.
This material must be preceded or accompanied by a current prospectus, which includes specific contents regarding the investment objectives and policies of this fund.
This fund is only available in Class I shares, which are not available for direct investment by the public.
143
UNDERSTANDING YOUR FUND’S EXPENSES
(unaudited)
SHAREHOLDER EXPENSES
Fund shareholders may incur two types of costs: (1) transaction costs, including sales charges (loads) on purchases, contingent deferred sales charges on redemptions and redemption fees; and (2) ongoing costs, including management fees, dividend expense on short-sales, and other fund expenses.
The following Example is intended to help you understand your ongoing costs (in dollars and cents) of investing in the Fund and to compare these costs with the ongoing costs of investing in other funds.
The Example is based on an investment of $1,000 invested at May 1, 2007 and held for the entire period until October 31, 2007.
ACTUAL EXPENSES
The first line in the table below provides information about actual account values and actual expenses. You may use the information in this line, together with the amount you invested, to estimate the expenses that you paid over the period. Simply divide your account value by $1,000 (for example, an $8,600 account value divided by $1,000 = 8.6), then multiply the result by the number in the first line of your Fund under the heading entitled “Expenses Paid During Period” to estimate the expenses you paid on your account during this period.
HYPOTHETICAL EXAMPLE FOR COMPARISON PURPOSES
The second line in the table below provides information about hypothetical account values and hypothetical expenses based on the Fund’s actual expense ratio and an assumed rate of return of 5% per year before expenses, which is not the Fund’s actual return. The hypothetical account values and expenses may not be used to estimate the actual ending account balance or expenses you paid for the period. You may use this information to compare the ongoing costs of investing in your Fund and other funds. To do so, compare this 5% hypothetical example with the 5% hypothetical examples that appear in the shareholder reports of the other funds.
Please note that the expenses shown in the table are meant to highlight your ongoing costs only and do not reflect any transactional costs, such as sales charges, redemption fees, brokerage commissions paid on purchases and sales of fund shares. Therefore, the second line under the Fund in the table is useful in comparing ongoing costs only, and will not help you determine the relative total costs of owning different funds. If any of these transaction costs were included, your costs would be higher. The expenses shown in the table do not reflect any fees that may be charged to you by brokers, financial intermediaries or other financial institutions.
| | Beginning
Account
Value | | Ending
Account
Value | | Annualized
Expense
Ratio | | Expenses
Paid During
Period (a) | |
| | | | | | | | | |
Class I | | | | | | | | | |
Actual | | $ | 1,000.00 | | $ | 1,069.89 | | 1.01 | % | $ | 5.26 | |
Hypothetical (b) | | 1,000.00 | | 1,020.06 | | 1.01 | | 5.13 | |
| | | | | | | | | | | | |
(a) Expenses are calculated using the Fund’s annualized expense ratio (as disclosed in the table), multiplied by the average account value for the period, multiplied by the number of days in the period (184 days), and divided by the number of days in the year (365 days).
(b) 5% return per year before expenses.
GRAPHICAL PRESENTATION OF SCHEDULE OF INVESTMENTS
By Sector
At October 31, 2007
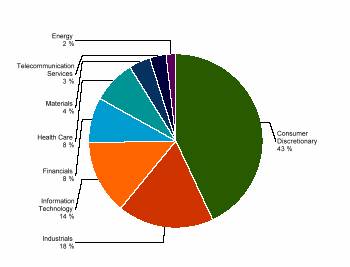
This chart shows the percentage breakdown by sector of the Fund’s total investment securities.
144
SCHEDULE OF INVESTMENTS
At October 31, 2007
(all amounts except share amounts in thousands)
| | Shares | | Value | |
COMMON STOCKS (94.9%) | | | | | |
Biotechnology (1.5%) | | | | | |
Alnylam Pharmaceuticals, Inc. ‡^ | | 89,189 | | $ | 2,817 | |
Capital Markets (4.9%) | | | | | |
Greenhill & Co., Inc. ^ | | 90,975 | | 6,730 | |
Pzena Investment Managm Class A ‡^ | | 125,215 | | 2,427 | |
Commercial Services & Supplies (11.9%) | | | | | |
Advisory Board Co. (The) ‡ | | 107,004 | | 6,871 | |
Corporate Executive Board Co. | | 40,215 | | 2,865 | |
Costar Group, Inc. ‡ | | 95,531 | | 5,493 | |
IHS, Inc. Class A ‡ | | 72,457 | | 4,568 | |
Viad Corp. | | 75,761 | | 2,685 | |
Construction Materials (1.7%) | | | | | |
Texas Industries, Inc. | | 44,530 | | 3,253 | |
Diversified Consumer Services (4.2%) | | | | | |
Strayer Education, Inc. | | 42,405 | | 7,907 | |
Diversified Financial Services (1.9%) | | | | | |
Endeavor Acquisition Corp. ‡^ | | 140,625 | | 1,730 | |
Information Services Group ‡ | | 236,388 | | 1,782 | |
Diversified Telecommunication Services (2.9%) | | | | | |
Cogent Communications Group, Inc. ‡ | | 196,008 | | 5,425 | |
Electronic Equipment & Instruments (0.7%) | | | | | |
Echelon Corp. ‡^ | | 62,904 | | 1,387 | |
Health Care Equipment & Supplies (0.3%) | | | | | |
Microbia Inc. ‡ § @ | | 96,357 | | 602 | |
Hotels, Restaurants & Leisure (15.7%) | | | | | |
AFC Enterprises ‡ | | 141,486 | | 1,889 | |
Ambassadors Group, Inc. | | 99,531 | | 1,809 | |
Ambassadors International, Inc. ^ | | 57,890 | | 1,184 | |
BJ’s Restaurants, Inc. ‡ | | 101,577 | | 2,010 | |
Ctrip.Com International, Ltd. | | 68,791 | | 3,877 | |
Gaylord Entertainment Co. ‡ | | 114,751 | | 6,252 | |
Peet’s Coffee & Tea, Inc. ‡ | | 61,837 | | 1,686 | |
PF Chang’s China Bistro, Inc. ‡^ | | 111,523 | | 3,246 | |
Premier Exhibitions, Inc. ‡^ | | 99,152 | | 1,100 | |
Vail Resorts, Inc. ‡^ | | 105,813 | | 6,422 | |
Household Durables (1.8%) | | | | | |
Gafisa SA ‡^ | | 95,857 | | 3,418 | |
Insurance (0.6%) | | | | | |
Greenlight Capital RE, Ltd. Class A ‡^ | | 54,818 | | 1,137 | |
Internet & Catalog Retail (6.5%) | | | | | |
Blue Nile, Inc. ‡^ | | 104,711 | | 8,276 | |
Gmarket, Inc. ‡ | | 67,779 | | 1,834 | |
GSI Commerce, Inc. ‡ | | 73,364 | | 2,090 | |
Internet Software & Services (7.6%) | | | | | |
Bankrate, Inc. ‡^ | | 32,065 | | 1,473 | |
CNET Networks, Inc. ‡^ | | 176,761 | | 1,428 | |
Comscore, Inc. ‡^ | | 41,329 | | 1,515 | |
Equinix, Inc. ‡ | | 49,400 | | 5,763 | |
Rediff.Com India, Ltd. ‡^ | | 51,513 | | 832 | |
Vistaprint, Ltd. ‡ | | 52,133 | | 2,480 | |
Websense, Inc. ‡ | | 45,883 | | 844 | |
IT Services (0.8%) | | | | | |
Forrester Research, Inc. ‡ | | 63,293 | | 1,501 | |
Leisure Equipment & Products (2.0%) | | | | | |
Aruze Corp. | | 85,700 | | $ | 3,680 | |
Life Sciences Tools & Services (5.8%) | | | | | |
Illumina, Inc. ‡ | | 72,140 | | 4,051 | |
Techne Corp. ‡ | | 105,907 | | 6,909 | |
Machinery (0.9%) | | | | | |
Middleby Corp. ‡ | | 26,424 | | 1,722 | |
Media (7.0%) | | | | | |
Arbitron, Inc. ^ | | 34,548 | | 1,749 | |
CKX, Inc. ‡ | | 101,828 | | 1,238 | |
Dena Co., Ltd. | | 278 | | 1,722 | |
Interactive Data Corp. | | 183,510 | | 5,898 | |
Lakes Entertainment, Inc. ‡ | | 55,865 | | 464 | |
Marvel Entertainment, Inc. ‡ | | 85,513 | | 2,115 | |
Metals & Mining (1.4%) | | | | | |
Kaiser Aluminum Corp. | | 35,076 | | 2,658 | |
Oil, Gas & Consumable Fuels (1.7%) | | | | | |
Delta Petroleum Corp. ‡^ | | 100,349 | | 1,877 | |
GMX Resources, Inc. ‡^ | | 35,584 | | 1,370 | |
Paper & Forest Products (0.7%) | | | | | |
Deltic Timber Corp. | | 22,457 | | 1,256 | |
Real Estate Management & Development (0.7%) | | | | | |
Consolidated-Tomoka Land Co. | | 12,556 | | 860 | |
HouseValues, Inc. ‡^ | | 97,837 | | 382 | |
Semiconductors & Semiconductor Equipment (1.1%) | | | | | |
Tessera Technologies, Inc. ‡ | | 52,305 | | 1,998 | |
Software (2.8%) | | | | | |
Blackboard, Inc. ‡ | | 68,690 | | 3,428 | |
Longtop Financial Techno-ADR ‡^ | | 68,099 | | 1,934 | |
Specialty Retail (0.9%) | | | | | |
Citi Trends, Inc. ‡^ | | 83,836 | | 1,640 | |
Select Comfort Corp. ‡ | | 12,291 | | 140 | |
Textiles, Apparel & Luxury Goods (2.1%) | | | | | |
Iconix Brand Group, Inc. ‡ | | 82,250 | | 1,879 | |
Lululemon Athletica, Inc. ‡^ | | 38,288 | | 2,038 | |
Trading Companies & Distributors (0.7%) | | | | | |
Integrated Distribution Services Group, | | 351,000 | | 1,372 | |
Transportation Infrastructure (4.1%) | | | | | |
Grupo Aeroportuario del Pacifico SA de | | 91,458 | | 4,797 | |
Macquarie Infrastructure Co. LLC | | 72,120 | | 3,012 | |
Total Common Stocks (cost $144,448) | | | | 178,797 | |
| | | | | |
Total Security Lending Collateral (cost $47,638) ± | | | | 47,638 | |
Total Investment Securities (cost $192,085) # | | | | $ | 226,435 | |
The notes to the financial statements are an integral part of this report.
145
NOTES TO SCHEDULE OF INVESTMENTS
^ At October 31, 2007, all or a portion of this security is on loan (see Note 1). The value at October 31, 2007, of all securities on loan is $46,021.
@ Securities valued as determined in good faith in accordance with procedures established by the Fund’s Board of Trustees.
± Cash collateral for the Repurchase Agreements, valued at $8,694, that serve as collateral for securities lending, are invested in corporate and government bonds with interest rates and maturity dates ranging from 0.00% - 8.125% and 11/14/2007 - 9/15/2037.
‡ Non Income Producing.
§ Illiquid.
# Aggregate cost for federal income tax purposes is $192,224. Aggregate gross unrealized appreciation for all securities in which there is an excess of value over tax cost and aggregate gross unrealized depreciation for all securities in which there is an excess of tax cost over value were $42,706 and $8,495, respectively. Net unrealized appreciation for tax purposes is $34,211.
DEFINITIONS
ADR American Depositary Receipt
The notes to the financial statements are an integral part of this report.
146
STATEMENTS OF ASSETS & LIABILITIES
At October 31, 2007
(all amounts except per share amounts in thousands)
| | TA IDEX
AllianceBernstein
International
Value | | TA IDEX
Bjurman, Barry
Micro Emerging
Growth | | TA IDEX
BlackRock
Global
Allocation | | TA IDEX
BlackRock
Large Cap
Value | | TA IDEX
BlackRock
Natural
Resources | | TA IDEX
Evergreen
International
Small Cap | |
Assets: | | | | | | | | | | | | | |
Investment, at cost | | $ | 430,736 | | $ | 85,374 | | $ | 436,241 | | $ | 534,088 | | $ | 125,550 | | $ | 482,598 | |
Foreign currency, at cost | | 1,501 | | — | | 3,402 | | — | | — | | 3,909 | |
Securities loaned, at value | | 8,344 | | 13,702 | | — | | 14,369 | | 20,710 | | 11,216 | |
Investment securities, at value | | 515,106 | | 105,947 | | 521,250 | | 626,852 | | 167,455 | | 636,464 | |
Cash | | 13,411 | | 3,373 | | 2,184 | | — | | 10,633 | | 13,388 | |
Foreign currency, at value | | 1,535 | | — | | 3,845 | | — | | — | | 3,910 | |
Receivable from brokers for proceeds on securities sold short | | — | | — | | — | | — | | — | | — | |
Receivables: | | | | | | | | | | | | | |
Investment securities sold | | 2,340 | | 83 | | 4,231 | | 3,239 | | — | | 413 | |
Shares of beneficial interest sold | | 681 | | 64 | | 210 | | 104 | | 59 | | — | |
Interest | | 29 | | 6 | | 1,127 | | 10 | | 27 | | 13 | |
Income from loaned securities | | 4 | | 22 | | — | | 9 | | 16 | | 21 | |
Dividends | | 1,519 | | 6 | | 368 | | 392 | | 88 | | 667 | |
Dividend reclaims | | 270 | | — | | 53 | | — | | 11 | | 141 | |
Unrealized appreciation on forward foreign currency contracts | | — | | — | | 852 | | — | | — | | — | |
| | $ | 534,895 | | $ | 109,501 | | $ | 534,120 | | $ | 630,606 | | $ | 178,289 | | $ | 655,017 | |
Liabilities: | | | | | | | | | | | | | |
Premium on written option & swaption | | $ | — | | $ | — | | $ | (2,496 | ) | $ | — | | $ | — | | $ | — | |
Investment securities purchased | | 6,293 | | 2,826 | | 4,627 | | 4,666 | | — | | 2,642 | |
Accounts payable and accrued liabilities: | | | | | | | | | | | | | |
Shares of beneficial interest redeemed | | 7 | | — | | 5 | | 3 | | 3 | | — | |
Management and advisory fees | | 378 | | 97 | | 337 | | 430 | | 110 | | 577 | |
Deferred foreign taxes | | — | | — | | 244 | | — | | — | | — | |
Transfer agent fees | | — | | — | | — | | — | | — | | — | |
Administration fees | | 9 | | 2 | | 9 | | 11 | | 3 | | 11 | |
Due to custodian | | — | | — | | — | | 3 | | — | | — | |
Payable for collateral for securities on loan | | 8,918 | | 14,430 | | — | | 15,304 | | 21,371 | | 11,795 | |
Unrealized depreciation on forward foreign currency contracts | | — | | — | | 132 | | — | | — | | — | |
Written options | | — | | — | | 4,605 | | — | | — | | — | |
Variation margin | | — | | — | | 3,586 | | — | | — | | — | |
Securities sold short, at value | | — | | — | | — | | — | | — | | — | |
Other | | 73 | | 20 | | 91 | | 54 | | 23 | | 100 | |
| | 15,678 | | 17,375 | | 13,636 | | 20,471 | | 21,510 | | 15,125 | |
Net Assets | | $ | 519,217 | | $ | 92,126 | | $ | 520,484 | | $ | 610,135 | | $ | 156,779 | | $ | 639,892 | |
| | | | | | | | | | | | | |
Net Assets Consist of: | | | | | | | | | | | | | |
Shares of beneficial interest, unlimited shares authorized, no par value | | $ | 393,797 | | $ | 75,221 | | $ | 403,335 | | $ | 479,774 | | $ | 112,898 | | $ | 413,364 | |
Undistributed (accumulated) net investment income | | 7,564 | | — | | 11,560 | | 3,919 | | 301 | | 4,384 | |
Undistributed (accumulated) net realized gain (loss) from investments | | 33,428 | | (3,669 | ) | 22,011 | | 33,679 | | 1,676 | | 68,262 | |
Net unrealized appreciation (depreciation) on: | | | | | | | | | | | | | |
Investment securities | | 84,370 | | 20,574 | | 84,764 | | 92,763 | | 41,904 | | 153,866 | |
Futures contracts | | — | | — | | (294 | ) | — | | — | | — | |
Written options | | — | | — | | (2,109 | ) | — | | — | | — | |
Translation of assets and liabilities denominated in foreign currencies | | 58 | | — | | 1,217 | | — | | — | | 16 | |
Net Assets | | $ | 519,217 | | $ | 92,126 | | $ | 520,484 | | $ | 610,135 | | $ | 156,779 | | $ | 639,892 | |
| | | | | | | | | | | | | |
Shares Outstanding | | 34,902 | | 7,365 | | 39,342 | | 46,644 | | 11,114 | | 34,005 | |
| | | | | | | | | | | | | |
Net Asset Value and Offering Price Per Share | | $ | 14.88 | | $ | 12.51 | | $ | 13.23 | | $ | 13.08 | | $ | 14.11 | | $ | 18.82 | |
The notes to the financial statements are an integral part of this report.
147
| | TA IDEX
Federated
Market
Opportunity | | TA IDEX
JPMorgan
International
Bond | | TA IDEX
JPMorgan Mid
Cap Value | | TA IDEX Loomis
Sayles Bond | | TA IDEX
Marsico
International
Growth | | TA IDEX Mellon
Market Neutral
Strategy | |
Assets: | | | | | | | | | | | | | |
Investment, at cost | | $ | 27,708 | | $ | 693,013 | | $ | 256,026 | | $ | 543,865 | | $ | 471,052 | | $ | 104,924 | |
Foreign currency, at cost | | — | | 3,799 | | — | | — | | 3 | | — | |
Securities loaned, at value | | 610 | | — | | 30,037 | | 52,156 | | 14,046 | | — | |
Investment securities, at value | | 27,681 | | 737,232 | | 292,854 | | 549,181 | | 616,211 | | 106,944 | |
Cash | | 26,081 | | 5,341 | | 8,960 | | 15,203 | | 23,194 | | 14,520 | |
Foreign currency, at value | | — | | 3,922 | | — | | — | | — | | — | |
Receivable from brokers for proceeds on securities sold short | | — | | — | | — | | — | | — | | 98,233 | |
Receivables: | | | | | | | | | | | | | |
Investment securities sold | | 376 | | 25,225 | | 1,376 | | — | | 8,086 | | 14,761 | |
Shares of beneficial interest sold | | 79 | | 176 | | — | | 1,308 | | 692 | | 79 | |
Interest | | 158 | | 10,120 | | 29 | | 8,028 | | 63 | | 33 | |
Income from loaned securities | | 2 | | — | | 14 | | 26 | | 21 | | — | |
Dividends | | 32 | | — | | 103 | | 11 | | 800 | | 28 | |
Dividend reclaims | | 16 | | — | | — | | — | | 582 | | — | |
Variation margin | | — | | 686 | | — | | — | | — | | 450 | |
Receivable from premiums on written options | | — | | — | | — | | — | | — | | — | |
Unrealized appreciation on forward foreign currency contracts | | 17 | | 5,032 | | — | | — | | 11 | | — | |
| | $ | 54,442 | | $ | 787,734 | | $ | 303,336 | | $ | 573,757 | | $ | 649,660 | | $ | 235,048 | |
Liabilities: | | | | | | | | | | | | | |
Investment securities purchased | | — | | 19,679 | | 1,533 | | 6,424 | | 6,602 | | 15,989 | |
Accounts payable and accrued liabilities: | | | | | | | | | | | | | |
Shares of beneficial interest redeemed | | 1 | | 279 | | 3 | | 257 | | 44 | | 2 | |
Management and advisory fees | | 39 | | 348 | | 199 | | 281 | | 543 | | 142 | |
Transfer agent fees | | — | | — | | — | | — | | — | | — | |
Administration fees | | 1 | | 13 | | 5 | | 9 | | 11 | | 2 | |
Payable for collateral for securities on loan | | 630 | | — | | 30,899 | | 53,498 | | 14,624 | | — | |
Unrealized depreciation on forward foreign currency contracts | | — | | 5,476 | | — | | — | | 4 | | — | |
Securities sold short, at value | | — | | — | | — | | — | | — | | 106,434 | |
Other | | 24 | | 112 | | 36 | | 39 | | 94 | | 85 | |
| | 695 | | 25,907 | | 32,675 | | 60,508 | | 21,922 | | 122,654 | |
Net Assets | | $ | 53,747 | | $ | 761,827 | | $ | 270,661 | | $ | 513,249 | | $ | 627,738 | | $ | 112,394 | |
| | | | | | | | | | | | | |
Net Assets Consist of: | | | | | | | | | | | | | |
Shares of beneficial interest, unlimited shares authorized, no par value | | $ | 58,885 | | $ | 712,889 | | $ | 218,997 | | $ | 504,284 | | $ | 416,892 | | $ | 114,845 | |
Undistributed (accumulated) net investment income | | 68 | | 11,652 | | 2,209 | | 3,662 | | 4,343 | | 2,634 | |
Undistributed (accumulated) net realized gain (loss) from investments | | (5,197 | ) | (8,084 | ) | 12,670 | | (113 | ) | 61,318 | | (3,109 | ) |
Net unrealized appreciation (depreciation) on: | | | | | | | | | | | | | |
Investment securities | | (27 | ) | 44,219 | | 36,785 | | 5,316 | | 145,159 | | 2,020 | |
Futures contracts | | — | | 640 | | — | | — | | — | | — | |
Translation of assets and liabilities denominated in foreign currencies | | 18 | | 511 | | — | | 100 | | 26 | | — | |
Securities sold short | | — | | — | | — | | — | | — | | (3,996 | ) |
Net Assets | | $ | 53,747 | | $ | 761,827 | | $ | 270,661 | | $ | 513,249 | | $ | 627,738 | | $ | 112,394 | |
| | | | | | | | | | | | | |
Shares Outstanding | | 5,761 | | 69,250 | | 21,979 | | 50,376 | | 38,653 | | 11,487 | |
| | | | | | | | | | | | | |
Net Asset Value and Offering Price Per Share | | $ | 9.33 | | $ | 11.00 | | $ | 12.32 | | $ | 10.19 | | $ | 16.24 | | $ | 9.78 | |
148
| | TA IDEX
Neuberger
Berman
International | | TA IDEX
Oppenheimer
Developing
Markets | | TA IDEX
Oppenheimer
Small- & Mid-
Cap Value | | TA IDEX Third
Avenue Value | | TA IDEX
Transamerica
Short-Term
Bond | | TA IDEX UBS
Dynamic Alpha | |
Assets: | | | | | | | | | | | | | |
Investment, at cost | | $ | 522,312 | | $ | 450,872 | | $ | 189,266 | | $ | 688,758 | | $ | 557,063 | | $ | 196,854 | |
Foreign currency, at cost | | 7 | | 8,516 | | — | | — | | — | | 455 | |
Securities loaned, at value | | 36,101 | | 19,109 | | 30,374 | | 97,709 | | — | | 13,116 | |
Investment securities, at value | | 607,046 | | 646,295 | | 206,250 | | 697,786 | | 556,022 | | 213,335 | |
Cash | | 25,854 | | 44,091 | | 7,498 | | 82,222 | | 5,679 | | 6,005 | |
Cash on deposit with broker | | — | | — | | — | | — | | — | | 22,213 | |
Foreign currency, at value | | 7 | | 8,482 | | — | | — | | — | | — | |
Receivable from brokers for proceeds on securities sold short | | — | | — | | — | | — | | — | | — | |
Receivables: | | | | | | | | | | | | | |
Investment securities sold | | 2,786 | | 4,794 | | 4,256 | | — | | — | | 5,343 | |
Shares of beneficial interest sold | | 881 | | 598 | | 311 | | 156 | | 48 | | 72 | |
Interest | | 71 | | 103 | | 27 | | 230 | | 7,236 | | 27 | |
Income from loaned securities | | 48 | | 17 | | 17 | | 148 | | 6 | | 26 | |
Dividends | | 1,186 | | 518 | | 79 | | 730 | | — | | 217 | |
Dividend reclaims | | 261 | | 5 | | — | | — | | — | | 87 | |
Unrealized appreciation on forward foreign currency contracts | | — | | — | | — | | — | | — | | 2,626 | |
Other | | — | | 19 | | — | | — | | — | | — | |
| | $ | 638,140 | | $ | 704,922 | | $ | 218,438 | | $ | 781,272 | | $ | 568,991 | | $ | 249,950 | |
Liabilities: | | | | | | | | | | | | | |
Premium on swap agreements, at value | | $ | — | | $ | — | | $ | — | | $ | — | | $ | — | | $ | 1,445 | |
Investment securities purchased | | 3,038 | | 8,547 | | 3,427 | | 446 | | 4,496 | | 8,305 | |
Accounts payable and accrued liabilities: | | | | | | | | | | | | | |
Shares of beneficial interest redeemed | | 10 | | 8 | | — | | 199 | | 231 | | 2 | |
Management and advisory fees | | 495 | | 642 | | 163 | | 485 | | 314 | | 260 | |
Deferred foreign taxes | | — | | 1,179 | | — | | — | | — | | — | |
Transfer agent fees | | — | | — | | — | | — | | — | | — | |
Administration fees | | 10 | | 12 | | 3 | | 12 | | 10 | | 4 | |
Due to custodian | | 258 | | — | | — | | — | | — | | 1,356 | |
Payable for collateral for securities on loan | | 37,742 | | 19,776 | | 31,688 | | 101,498 | | — | | 13,530 | |
Unrealized depreciation on forward foreign currency contracts | | — | | — | | — | | — | | — | | 8,577 | |
Payable on swap agreements | | — | | — | | — | | — | | — | | 2,518 | |
Variation margin | | — | | — | | — | | — | | — | | 6,047 | |
Securities sold short, at value | | — | | — | | — | | — | | — | | — | |
Other | | 99 | | 197 | | 31 | | 54 | | 51 | | 51 | |
| | 41,652 | | 30,361 | | 35,312 | | 102,694 | | 5,102 | | 40,650 | |
Net Assets | | $ | 596,488 | | $ | 674,561 | | $ | 183,126 | | $ | 678,578 | | $ | 563,889 | | $ | 209,301 | |
| | | | | | | | | | | | | |
Net Assets Consist of: | | | | | | | | | | | | | |
Shares of beneficial interest, unlimited shares authorized, no par value | | $ | 460,309 | | $ | 424,785 | | $ | 153,400 | | $ | 657,385 | | $ | 567,258 | | $ | 212,774 | |
Undistributed (accumulated) net investment income | | 5,390 | | 3,521 | | — | | 3,567 | | 1,571 | | 1,994 | |
Undistributed (accumulated) net realized gain (loss) from investments | | 46,045 | | 52,047 | | 12,742 | | 8,600 | | (3,899 | ) | (8,338 | ) |
Net unrealized appreciation (depreciation) on: | | | | | | | | | | | | | |
Investment securities | | 84,734 | | 194,244 | | 16,984 | | 9,028 | | (1,041 | ) | 16,481 | |
Futures contracts | | — | | — | | — | | — | | — | | (6,137 | ) |
Swap agreements | | — | | — | | — | | — | | — | | (1,073 | ) |
Translation of assets and liabilities denominated in foreign currencies | | 10 | | (36 | ) | — | | (2 | ) | — | | (6,400 | ) |
Net Assets | | $ | 596,488 | | $ | 674,561 | | $ | 183,126 | | $ | 678,578 | | $ | 563,889 | | $ | 209,301 | |
| | | | | | | | | | | | | |
Shares Outstanding | | 44,015 | | 39,521 | | 13,898 | | 23,455 | | 57,447 | | 21,300 | |
| | | | | | | | | | | | | |
Net Asset Value and Offering Price Per Share | | $ | 13.55 | | $ | 17.07 | | $ | 13.18 | | $ | 28.93 | | $ | 9.82 | | $ | 9.83 | |
149
| | TA IDEX UBS
Large Cap
Value | | TA IDEX Van
Kampen
Emerging
Markets Debt | | TA IDEX Van
Kampen Mid-
Cap Growth | | TA IDEX Van
Kampen Small
Company
Growth | |
Assets: | | | | | | | | | |
Investment, at cost | | $ | 815,887 | | $ | 268,348 | | $ | 120,680 | | $ | 192,085 | |
Foreign currency, at cost | | — | | 489 | | — | | 2 | |
Securities loaned, at value | | 32,455 | | — | | 22,268 | | 46,021 | |
Investment securities, at value | | 897,474 | | 282,062 | | 143,290 | | 226,435 | |
Cash | | 12,939 | | 7,202 | | 5,240 | | 9,676 | |
Foreign currency, at value | | — | | 479 | | — | | — | |
Receivable from brokers for proceeds on securities sold short | | — | | — | | — | | — | |
Receivables: | | | | | | | | | |
Investment securities sold | | 8,429 | | 23,091 | | — | | 446 | |
Shares of beneficial interest sold | | 791 | | 10 | | 97 | | 22 | |
Interest | | 50 | | 4,928 | | 14 | | 36 | |
Income from loaned securities | | 8 | | — | | 14 | | 181 | |
Dividends | | 1,016 | | — | | 34 | | 59 | |
| | $ | 920,707 | | $ | 317,772 | | $ | 148,689 | | $ | 236,855 | |
Liabilities: | | | | | | | | | |
Investment securities purchased | | 5,639 | | — | | 248 | | 670 | |
Accounts payable and accrued liabilities: | | | | | | | | | |
Shares of beneficial interest redeemed | | 194 | | 119 | | — | | — | |
Management and advisory fees | | 590 | | 262 | | 86 | | 161 | |
Transfer agent fees | | — | | — | | — | | — | |
Administration fees | | 16 | | 6 | | 2 | | 3 | |
Payable for collateral for securities on loan | | 33,291 | | — | | 22,950 | | 47,638 | |
Securities sold short, at value | | — | | — | | — | | — | |
Other | | 55 | | 57 | | 23 | | 36 | |
| | 39,785 | | 444 | | 23,309 | | 48,508 | |
Net Assets | | $ | 880,922 | | $ | 317,328 | | $ | 125,380 | | $ | 188,347 | |
| | | | | | | | | |
Net Assets Consist of: | | | | | | | | | |
Shares of beneficial interest, unlimited shares authorized, no par value | | $ | 780,631 | | $ | 287,953 | | $ | 95,190 | | $ | 136,177 | |
Undistributed (accumulated) net investment income | | 8,682 | | 6,495 | | 52 | | 314 | |
Undistributed (accumulated) net realized gain from investments | | 10,022 | | 9,035 | | 7,528 | | 17,506 | |
Net unrealized appreciation (depreciation) on: | | | | | | | | | |
Investment securities | | 81,587 | | 13,710 | | 22,610 | | 34,350 | |
Translation of assets and liabilities denominated in foreign currencies | | — | | 135 | | — | | — | |
Net Assets | | $ | 880,922 | | $ | 317,328 | | $ | 125,380 | | $ | 188,347 | |
| | | | | | | | | |
Shares Outstanding | | 63,882 | | 28,267 | | 8,856 | | 13,318 | |
| | | | | | | | | |
Net Asset Value and Offering Price Per Share | | $ | 13.79 | | $ | 11.23 | | $ | 14.16 | | $ | 14.14 | |
150
STATEMENTS OF OPERATIONS
For the year ended October 31, 2007
(all amounts in thousands)
| | TA IDEX
AllianceBernstein
International
Value* | | TA IDEX
Bjurman, Barry
Micro Emerging
Growth* | | TA IDEX
BlackRock
Global
Allocation* | | TA IDEX
BlackRock Large
Cap Value* | | TA IDEX
BlackRock
Natural
Resources* | | TA IDEX
Evergreen
International
Small Cap* | |
Investment Income: | | | | | | | | | | | | | |
Dividends | | $ | 12,587 | | $ | 259 | | $ | 5,547 | | $ | 10,054 | | $ | 907 | | $ | 10,963 | |
Less withholding taxes on foreign dividends | | (1,105 | ) | (1 | ) | (308 | ) | — | | (38 | ) | (642 | ) |
Interest | | 319 | | 45 | | 8,318 | | 117 | | 298 | | 394 | |
Income from loaned securities-net | | 24 | | 62 | | — | | 39 | | 31 | | 104 | |
| | 11,825 | | 365 | | 13,557 | | 10,210 | | 1,198 | | 10,819 | |
Expenses: | | | | | | | | | | | | | |
Management and advisory fees | | 3,610 | | 725 | | 3,458 | | 4,456 | | 749 | | 5,555 | |
Printing and shareholder reports | | 3 | | 8 | | 4 | | 4 | | — | (d) | 4 | |
Custody fees | | 238 | | 15 | | 328 | | 111 | | 24 | | 373 | |
Administration fees | | 86 | | 14 | | 94 | | 113 | | 19 | | 108 | |
Legal fees | | 10 | | 2 | | 12 | | 14 | | 15 | | 12 | |
Audit fees | | 20 | | 20 | | 39 | | 20 | | 19 | | 20 | |
Trustees fees | | 16 | | 2 | | 18 | | 21 | | 3 | | 19 | |
Registration fees | | 17 | | 3 | | 21 | | 5 | | 3 | | 4 | |
Dividend expense on securities sold short | | — | | — | | — | | — | | — | | — | |
Other | | 6 | | 1 | | 8 | | 8 | | — | | 7 | |
Total expenses | | 4,006 | | 790 | | 3,982 | | 4,752 | | 832 | | 6,102 | |
Net of Reimbursement/Recapture of class expense: | | — | | 11 | | — | | — | | — | | — | |
Net expenses | | 4,006 | | 801 | | 3,982 | | 4,752 | | 832 | | 6,102 | |
| | | | | | | | | | | | | |
Net Investment Income (Loss) | | 7,819 | | (436 | ) | 9,575 | | 5,458 | | 366 | | 4,717 | |
| | | | | | | | | | | | | |
Net Realized Gain (Loss) from: | | | | | | | | | | | | | |
Investment securities | | 34,122 | | (2,867 | ) | 21,905 | (a) | 33,761 | | 1,671 | | 67,791 | |
Futures contracts | | — | | — | | 1,762 | | — | | — | | — | |
Written option and swaption contracts | | — | | — | | 386 | | — | | — | | — | |
Foreign currency transactions | | 237 | | — | | 2,182 | (a) | — | | (60 | ) | 471 | |
| | 34,359 | | (2,867 | ) | 26,235 | | 33,761 | | 1,611 | | 68,262 | |
| | | | | | | | | | | | | |
Net Increase (Decrease) in Unrealized Appreciation (Depreciation) on: | | | | | | | | | | | | | |
Investment securities | | 48,297 | | 16,767 | | 61,574 | | 22,176 | | 41,904 | | 85,317 | |
Futures contracts | | — | | — | | 1,379 | | — | | — | | — | |
Written option and swaption contracts | | — | | — | | 2,008 | | — | | — | | — | |
Translation of assets and liabilities denominated in foreign currencies | | 44 | | — | | 940 | | — | | — | | (7 | ) |
| | 48,341 | | 16,767 | | 59,127 | | 22,176 | | 41,904 | | 85,310 | |
Net Realized and Unrealized Gain:(c) | | 82,700 | | 13,900 | | 85,362 | | 55,937 | | 43,515 | | 153,572 | |
Net Increase In Net Assets Resulting from Operations | | $ | 90,519 | | $ | 13,464 | | $ | 94,937 | | $ | 61,395 | | $ | 43,881 | | $ | 158,289 | |
The notes to the financial statements are an integral part of this report.
151
| | TA IDEX
Federated Market
Opportunity* | | TA IDEX
JPMorgan
International
Bond* | | TA IDEX
JPMorgan Mid
Cap Value* | | TA IDEX Loomis
Sayles Bond* | | TA IDEX Marsico
International
Growth* | | TA IDEX Mellon
Market Neutral
Strategy* | |
Investment Income: | | | | | | | | | | | | | |
Dividends | | $ | 440 | | $ | — | | $ | 4,845 | | $ | 65 | | $ | 9,713 | | $ | 863 | |
Less withholding taxes on foreign dividends | | (45 | ) | (136 | ) | (10 | ) | — | | (813 | ) | — | |
Interest | | 1,426 | | 23,432 | | (8 | ) | 12,375 | | 895 | | 4,141 | |
Income from loaned securities-net | | 8 | | — | | 47 | | 60 | | 83 | | — | |
| | 1,829 | | 23,296 | | 4,874 | | 12,500 | | 9,878 | | 5,004 | |
| | | | | | | | | | | | | |
Expenses: | | | | | | | | | | | | | |
Management and advisory fees | | 435 | | 3,644 | | 2,160 | | 1,336 | | 4,818 | | 1,201 | |
Printing and shareholder reports | | 3 | | 4 | | 3 | | 1 | | 3 | | 1 | |
Custody fees | | 22 | | 409 | | 40 | | 50 | | 311 | | 21 | |
Administration fees | | 11 | | 142 | | 53 | | 41 | | 93 | | 17 | |
Legal fees | | 1 | | 18 | | 7 | | 17 | | 11 | | 15 | |
Audit fees | | 20 | | 20 | | 20 | | 19 | | 21 | | 19 | |
Trustees fees | | 2 | | 27 | | 10 | | 6 | | 17 | | 3 | |
Registration fees | | 4 | | 32 | | 1 | | 11 | | 2 | | 3 | |
Dividend expense on securities sold short | | — | | — | | — | | — | | — | | 1,344 | |
Other | | 1 | | 9 | | 3 | | — | | 7 | | — | |
Total expenses | | 499 | | 4,305 | | 2,297 | | 1,481 | | 5,283 | | 2,624 | |
Net expenses | | 499 | | 4,305 | | 2,297 | | 1,481 | | 5,283 | | 2,624 | |
| | | | | | | | | | | | | |
Net Investment Income | | 1,330 | | 18,991 | | 2,577 | | 11,019 | | 4,595 | | 2,380 | |
| | | | | | | | | | | | | |
Net Realized Gain (Loss) from: | | | | | | | | | | | | | |
Investment securities | | (1,763 | ) | 7,575 | | 13,309 | | (11 | ) | 63,302 | | 4,184 | |
Futures contracts | | — | | (1,424 | ) | — | | — | | — | | — | |
Foreign currency transactions | | 80 | | (1,299 | ) | — | | 49 | | (462 | ) | — | |
Securities sold short | | — | | — | | — | | — | | — | | (7,039 | ) |
| | (1,683 | ) | 4,852 | | 13,309 | | 38 | | 62,840 | | (2,855 | ) |
| | | | | | | | | | | | | |
Net Increase (Decrease) in Unrealized Appreciation (Depreciation) on: | | | | | | | | | | | | | |
Investment securities | | (559 | ) | 34,321 | | 11,119 | | 5,316 | | 94,474 | | 2,020 | |
Futures contracts | | — | | 576 | | — | | — | | — | | — | |
Translation of assets and liabilities denominated in foreign currencies | | 18 | | 671 | | — | | 100 | | 20 | | — | |
Securities sold short | | — | | — | | — | | — | | — | | (3,996 | ) |
| | (541 | ) | 35,568 | | 11,119 | | 5,416 | | 94,494 | | (1,976 | ) |
Net Realized and Unrealized Gain (Loss):(c) | | (2,224 | ) | 40,420 | | 24,427 | | 5,454 | | 157,334 | | (4,831 | ) |
Net Increase (Decrease) In Net Assets Resulting from Operations | | $ | (894 | ) | $ | 59,411 | | $ | 27,005 | | $ | 16,473 | | $ | 161,929 | | $ | (2,451 | ) |
152
| | TA IDEX
Neuberger
Berman
International* | | TA IDEX
Oppenheimer
Developing
Markets* | | TA IDEX
Oppenheimer
Small- & Mid-Cap
Value* | | TA IDEX Third
Avenue Value* | | TA IDEX
Transamerica
Short-Term
Bond* | | TA IDEX UBS
Dynamic Alpha* | |
Investment Income: | | | | | | | | | | | | | |
Dividends | | $ | 11,498 | | $ | 10,895 | | $ | 1,114 | | $ | 4,398 | | $ | — | | $ | 3,689 | |
Less withholding taxes on foreign dividends | | (1,011 | ) | (1,072 | ) | (1 | ) | (182 | ) | — | | (244 | ) |
Interest | | 855 | | 821 | | 237 | | 1,595 | | 27,463 | | 586 | |
Income from loaned securities-net | | 115 | | 50 | | 52 | | 279 | | 17 | | 58 | |
| | 11,457 | | 10,694 | | 1,402 | | 6,090 | | 27,480 | | 4,089 | |
| | | | | | | | | | | | | |
Expenses: | | | | | | | | | | | | | |
Management and advisory fees | | 4,833 | | 5,451 | | 1,273 | | 2,647 | | 3,126 | | 2,192 | |
Printing and shareholder reports | | 4 | | 4 | | 8 | | 3 | | 3 | | — | |
Custody fees | | 327 | | 799 | | 47 | | 70 | | 61 | | 150 | |
Administration fees | | 101 | | 97 | | 27 | | 66 | | 100 | | 32 | |
Legal fees | | 12 | | 11 | | 3 | | 6 | | 13 | | 17 | |
Audit fees | | 22 | | 98 | | 20 | | 19 | | 20 | | 20 | |
Trustees fees | | 19 | | 17 | | 5 | | 9 | | 19 | | 6 | |
Registration fees | | 19 | | 17 | | 6 | | 16 | | 10 | | 5 | |
Dividend expense on securities sold short | | — | | — | | — | | — | | — | | — | |
Other | | 7 | | 6 | | 1 | | 1 | | 6 | | 1 | |
Total expenses | | 5,344 | | 6,500 | | 1,390 | | 2,837 | | 3,358 | | 2,423 | |
Net of Reimbursement/Recapture of class expense: | | — | | — | | 13 | | — | | — | | — | |
Net expenses | | 5,344 | | 6,500 | | 1,403 | | 2,837 | | 3,358 | | 2,423 | |
Net Investment Income (Loss) | | 6,113 | | 4,194 | | (1 | ) | 3,253 | | 24,122 | | 1,666 | |
| | | | | | | | | | | | | |
Net Realized Gain (Loss) from: | | | | | | | | | | | | | |
Investment securities | | 47,254 | | 53,266 | (b) | 12,939 | | 9,053 | | (1,455 | ) | 7,814 | |
Futures contracts | | — | | — | | — | | — | | — | | (8,223 | ) |
Swap agreements | | — | | — | | — | | — | | — | | 801 | |
Foreign currency transactions | | (1,119 | ) | (470 | )(b) | (7 | ) | (139 | ) | — | | (8,402 | ) |
| | 46,135 | | 52,796 | | 12,932 | | 8,914 | | (1,455 | ) | (8,010 | ) |
| | | | | | | | | | | | | |
Net Increase (Decrease) in Unrealized Appreciation (Depreciation) on: | | | | | | | | | | | | | |
| | | | | | | | | | | | | |
Investment securities | | 47,684 | | 167,268 | | 10,851 | | 9,028 | | (1,233 | ) | 16,481 | |
Futures contracts | | — | | — | | — | | — | | — | | (6,137 | ) |
Swap agreements | | — | | — | | — | | — | | — | | (1,073 | ) |
Translation of assets and liabilities denominated in foreign currencies | | 13 | | (434 | ) | — | | (2 | ) | — | | (6,400 | ) |
| | 47,697 | | 166,834 | | 10,851 | | 9,026 | | (1,233 | ) | 2,871 | |
Net Realized and Unrealized Gain
(Loss):(c) | | 93,832 | | 219,630 | | 23,783 | | 17,940 | | (2,688 | ) | (5,139 | ) |
Net Increase (Decrease) In Net Assets Resulting from Operations | | $ | 99,945 | | $ | 223,824 | | $ | 23,782 | | $ | 21,193 | | $ | 21,434 | | $ | (3,473 | ) |
153
| | TA IDEX UBS
Large Cap Value* | | TA IDEX Van
Kampen
Emerging
Markets Debt* | | TA IDEX Van
Kampen Mid-Cap
Growth* | | TA IDEX Van
Kampen Small
Company
Growth* | |
Investment Income: | | | | | | | | | |
Dividends | | $ | 13,660 | | $ | — | | $ | 906 | | $ | 919 | |
Less withholding taxes on foreign dividends | | — | | — | | (14 | ) | (3 | ) |
Interest | | 1,131 | | 21,250 | | 109 | | 254 | |
Income from loaned securities-net | | 38 | | — | | 55 | | 1,139 | |
| | 14,829 | | 21,250 | | 1,056 | | 2,309 | |
| | | | | | | | | |
Expenses: | | | | | | | | | |
Management and advisory fees | | 5,136 | | 3,077 | | 697 | | 1,915 | |
Printing and shareholder reports | | 3 | | 3 | | 3 | | 3 | |
Custody fees | | 70 | | 209 | | 33 | | 43 | |
Administration fees | | 134 | | 66 | | 18 | | 40 | |
Legal fees | | 15 | | 9 | | 2 | | 5 | |
Audit fees | | 20 | | 20 | | 20 | | 20 | |
Trustees fees | | 23 | | 13 | | 3 | | 8 | |
Registration fees | | 15 | | 7 | | 4 | | 5 | |
Dividend expense on securities sold short | | — | | — | | — | | — | |
Other | | 5 | | 6 | | 1 | | 4 | |
Total expenses | | 5,421 | | 3,410 | | 781 | | 2,043 | |
Net expenses | | 5,421 | | 3,410 | | 781 | | 2,043 | |
| | | | | | | | | |
Net Investment Income | | 9,408 | | 17,840 | | 275 | | 266 | |
| | | | | | | | | |
Net Realized Gain (Loss) from: | | | | | | | | | |
Investment securities | | 10,038 | | 13,195 | | 8,485 | | 17,930 | |
Futures contracts | | — | | (66 | ) | — | | — | |
Written option and swaption contracts | | — | | 1,826 | | — | | — | |
Foreign currency transactions | | — | | 101 | | (2 | ) | (6 | ) |
| | 10,038 | | 15,056 | | 8,483 | | 17,924 | |
| | | | | | | | | |
Net Increase (Decrease) in Unrealized Appreciation(Depreciation) on: | | | | | | | | | |
Investment securities | | 50,757 | | (1,432 | ) | 21,206 | | 11,276 | |
Translation of assets and liabilities denominated in foreign currencies | | — | | 83 | | — | | — | |
| | 50,757 | | (1,349 | ) | 21,206 | | 11,276 | |
Net Realized and Unrealized Gain:(c) | | 60,795 | | 13,707 | | 29,689 | | 29,200 | |
Net Increase In Net Assets Resulting from Operations | | $ | 70,203 | | $ | 31,547 | | $ | 29,964 | | $ | 29,466 | |
(a) Net of foreign capital gains tax of $36.
(b) Net of foreign capital gains tax of $71.
(c) Net realized and unrealized gain (loss) includes Investment Securities, Futures Contracts, Written Options and Swaptions, Swaps and Foreign Currency Transactions.
(d) Rounds to less than $1.
* For a listing of commencement dates for the above Fund’s, please reference Note1 in the “Notes to the Financial Statements”.
154
STATEMENTS OF CHANGES IN NET ASSETS
For the years ended:
(all amounts in thousands)
| | TA IDEX AllianceBernstein
International Value* | | TA IDEX Bjurman, Barry Micro
Emerging Growth* | | TA IDEX BlackRock Global
Allocation* | |
| | Year Ended | | Year Ended | | Year Ended | | Year Ended | | Year Ended | | Year Ended | |
| | October 31, 2007 | | October 31, 2006 | | October 31, 2007 | | October 31, 2006 | | October 31, 2007 | | October 31, 2006 | |
Increase (Decrease) in Net Assets From: | | | | | | | | | | | | | |
Operations: | | | | | | | | | | | | | |
Net investment income (loss) | | $ | 7,819 | | $ | 4,120 | | $ | (436 | ) | $ | (60 | ) | $ | 9,575 | | $ | 6,063 | |
Net realized gain (loss)(a) | | 34,359 | | 6,391 | | (2,867 | ) | (815 | ) | 26,235 | | 9,269 | |
Change in unrealized appreciation(b) | | 48,341 | | 36,087 | | 16,767 | | 3,807 | | 59,127 | | 24,451 | |
Net increase (decrease) in net assets resulting from operations | | 90,519 | | 46,598 | | 13,464 | | 2,932 | | 94,937 | | 39,783 | |
| | | | | | | | | | | | | |
Distributions to Shareholders: | | | | | | | | | | | | | |
From net investment income | | (4,552 | ) | (144 | ) | — | | — | | (8,774 | ) | (372 | ) |
From net realized gains | | (7,001 | ) | — | | — | | — | | (8,425 | ) | — | |
| | | | | | | | | | | | | |
Capital Share Transactions: | | | | | | | | | | | | | |
Proceeds from shares sold | | | | | | | | | | | | | |
Class I | | 116,948 | | 330,067 | | 23,555 | | 52,449 | | 83,746 | | 451,161 | |
| | 116,948 | | 330,067 | | 23,555 | | 52,449 | | 83,746 | | 451,161 | |
| | | | | | | | | | | | | |
Issued from fund acquisition | | — | | — | | — | | — | | — | | — | |
Dividends and distributions reinvested | | | | | | | | | | | | | |
Class I | | 11,553 | | 144 | | — | | — | | 17,198 | | 372 | |
| | 11,553 | | 144 | | — | | — | | 17,198 | | 372 | |
Cost of shares redeemed | | | | | | | | | | | | | |
Class I | | (64,781 | ) | (134 | ) | (274 | ) | — | | (149,139 | ) | (3 | ) |
| | (64,781 | ) | (134 | ) | (274 | ) | — | | (149,139 | ) | (3 | ) |
| | | | | | | | | | | | | |
Redemption fee | | — | | — | | — | | — | | — | | — | |
| | | | | | | | | | | | | |
Automatic conversions | | — | | — | | — | | — | | — | | — | |
| | 63,720 | | 330,077 | | 23,281 | | 52,449 | | (48,195 | ) | 451,530 | |
Net increase (decrease) in net assets | | 142,686 | | 376,531 | | 36,745 | | 55,381 | | 29,543 | | 490,941 | |
| | | | | | | | | | | | | |
Net Assets: | | | | | | | | | | | | | |
Beginning of year | | 376,531 | | — | | 55,381 | | — | | 490,941 | | — | |
End of year | | $ | 519,217 | | $ | 376,531 | | $ | 92,126 | | $ | 55,381 | | $ | 520,484 | | $ | 490,941 | |
Undistributed (Accumulated) Net Investment Income (Loss) | | $ | 7,564 | | $ | 3,429 | | $ | — | | $ | — | | $ | 11,560 | | $ | 7,159 | |
| | | | | | | | | | | | | |
Share Activity: | | | | | | | | | | | | | |
Shares issued | | | | | | | | | | | | | |
Class I | | 8,495 | | 30,476 | | 2,101 | | 5,290 | | 7,063 | | 43,698 | |
| | 8,495 | | 30,476 | | 2,101 | | — | | 7,063 | | 43,698 | |
Shares issued-reinvested from distributions | | | | | | | | | | | | | |
Class I | | 912 | | 14 | | — | | — | | 1,536 | | 37 | |
| | 912 | | 14 | | — | | — | | 1,536 | | 37 | |
| | | | | | | | | | | | | |
Shares issued on fund acquisition | | — | | — | | — | | — | | — | | — | |
Shares redeemed | | | | | | | | | | | | | |
Class I | | (4,982 | ) | (13 | ) | (26 | ) | — | | (12,992 | ) | — | |
| | (4,982 | ) | (13 | ) | (26 | ) | — | | (12,992 | ) | — | |
| | | | | | | | | | | | | |
Automatic conversions | | — | | — | | — | | — | | — | | — | |
Net increase (decrease) in shares outstanding | | | | | | | | | | | | | |
Class I | | 4,425 | | 30,477 | | 2,075 | | 5,290 | | (4,393 | ) | 43,735 | |
| | 4,425 | | 30,477 | | 2,075 | | 5,290 | | (4,393 | ) | 43,735 | |
* For a listing of commencement dates for the above Fund’s, please reference Note 1 in the “Notes to the Financial Statements”.
(a) Net realized and unrealized gain (loss) includes Investment Securities, Futures Contracts, Written Options and Swaptions, Swaps and Foreign Currency Transactions.
(b) Change in unrealized appreciation (depreciation) includes investment securities, futures contracts, written options and swaptions, swaps and foreign currency translation.
The notes to the financial statements are an integral part of this report.
155
| | TA IDEX BlackRock Large Cap
Value* | | TA IDEX
BlackRock
Natural
Resources* | | TA IDEX Evergreen International
Small Cap* | | TA IDEX
Federated Market
Opportunity* | |
| | Year Ended | | Year Ended | | Period Ended | | Year Ended | | Year Ended | | Year Ended | |
| | October 31, 2007 | | October 31, 2006 | | October 31, 2007 | | October 31, 2007 | | October 31, 2006 | | October 31, 2007 | |
Increase (Decrease) in Net Assets From: | | | | | | | | | | | | | |
Operations: | | | | | | | | | | | | | |
Net investment income | | $ | 5,458 | | $ | 3,254 | | $ | 366 | | $ | 4,717 | | $ | 3,809 | | $ | 1,330 | |
Net realized gain (loss)(a) | | 33,761 | | 17,655 | | 1,611 | | 68,262 | | 65,140 | | (1,683 | ) |
Change in unrealized appreciation (depreciation)(b) | | 22,176 | | 50,775 | | 41,904 | | 85,310 | | 34,645 | | (541 | ) |
| | | | | | | | | | | | | |
Net increase (decrease) in net assets resulting from operations | | 61,395 | | 71,684 | | 43,881 | | 158,289 | | 103,594 | | (894 | ) |
| | | | | | | | | | | | | |
Distributions to Shareholders: | | | | | | | | | | | | | |
From net investment income | | (3,990 | ) | (1,026 | ) | — | | (3,583 | ) | (823 | ) | (1,771 | ) |
From net realized gains | | (15,598 | ) | — | | — | | (65,360 | ) | (10,837 | ) | — | |
| | | | | | | | | | | | | |
Capital Share Transactions: | | | | | | | | | | | | | |
Proceeds from shares sold | | | | | | | | | | | | | |
Class A | | — | | 2,001 | | — | | — | | — | | — | |
Class I | | 142,245 | | 445,738 | | 114,565 | | 85,683 | | 186,053 | | 36,953 | |
| | 142,245 | | 447,739 | | 114,565 | | 85,683 | | 186,053 | | 36,953 | |
| | | | | | | | | | | | | |
Issued from fund acquisition | | — | | — | | — | | — | | — | | — | |
Dividends and distributions reinvested | | | | | | | | | | | | | |
Class I | | 19,589 | | 1,026 | | — | | 68,942 | | 11,660 | | 1,771 | |
| | 19,589 | | 1,026 | | — | | 68,942 | | 11,660 | | 1,771 | |
Cost of shares redeemed | | | | | | | | | | | | | |
Class A | | — | | (356,774 | ) | — | | — | | (127,067 | ) | — | |
Class I | | (100,035 | ) | (4,702 | ) | (1,667 | ) | (75,714 | ) | (21,500 | ) | (65,500 | ) |
| | (100,035 | ) | (361,476 | ) | (1,667 | ) | (75,714 | ) | (148,567 | ) | (65,500 | ) |
| | | | | | | | | | | | | |
Redemption fee | | — | | — | | — | | — | | — | | — | |
| | | | | | | | | | | | | |
Automatic conversions | | — | | — | | — | | — | | — | | — | |
| | 61,799 | | 87,289 | | 112,898 | | 78,911 | | 49,146 | | (26,776 | ) |
Net increase (decrease) in net assets | | 103,606 | | 157,947 | | 156,779 | | 168,257 | | 141,080 | | (29,441 | ) |
| | | | | | | | | | | | | |
Net Assets: | | | | | | | | | | | | | |
Beginning of year | | 506,529 | | 348,582 | | — | | 471,635 | | 330,555 | | 83,188 | |
End of year | | $ | 610,135 | | $ | 506,529 | | $ | 156,779 | | $ | 639,892 | | $ | 471,635 | | $ | 53,747 | |
| | | | | | | | | | | | | |
Undistributed (Accumulated) Net Investment Income (Loss) | | $ | 918 | | $ | 2,451 | | $ | 301 | | $ | 4,384 | | $ | 3,579 | | $ | 68 | |
| | | | | | | | | | | | | |
Share Activity: | | | | | | | | | | | | | |
Shares issued | | | | | | | | | | | | | |
Class A | | — | | 191 | | — | | — | | — | | — | |
Class I | | 11,483 | | 42,006 | | 11,251 | | 5,108 | | 13,754 | | 3,897 | |
| | 11,483 | | 42,197 | | 11,251 | | 5,108 | | 13,754 | | 3,897 | |
Shares issued-reinvested from distributions | | | | | | | | | | | | | |
Class I | | 1,619 | | 94 | | — | | 4,640 | | 864 | | 184 | |
| | 1,619 | | 94 | | — | | 4,640 | | 864 | | 184 | |
| | | | | | | | | | | | | |
Shares issued on fund acquisition | | — | | — | | — | | — | | — | | — | |
Shares redeemed | | | | | | | | | | | | | |
Class A | | — | | (34,089 | ) | — | | — | | (9,945 | ) | — | |
Class I | | (8,132 | ) | (426 | ) | (137 | ) | (4,885 | ) | (1,556 | ) | (6,888 | ) |
| | (8,132 | ) | (34,515 | ) | (137 | ) | (4,885 | ) | (11,501 | ) | (6,888 | ) |
| | | | | | | | | | | | | |
Automatic conversions | | — | | — | | — | | — | | — | | — | |
Net increase (decrease) in shares outstanding | | | | | | | | | | | | | |
Class A | | — | | (33,898 | ) | — | | — | | (9,945 | ) | — | |
Class I | | 4,970 | | 41,674 | | 11,114 | | 4,863 | | 13,062 | | (2,807 | ) |
| | 4,970 | | 7,776 | | 11,114 | | 4,863 | | 3,117 | | (2,807 | ) |
156
| | TA IDEX | | | | | | | | | | | |
| | Federated Market | | TA IDEX JPMorgan International | | | | | | TA IDEX Loomis | |
| | Opportunity* | | Bond* | | TA IDEX JPMorgan Mid Cap Value* | | Sayles Bond* | |
| | Year Ended | | Year Ended | | Year Ended | | Year Ended | | Year Ended | | Period Ended | |
| | October 31, 2006 | | October 31, 2007 | | October 31, 2006 | | October 31, 2007 | | October 31, 2006 | | October 31, 2007 | |
Increase (Decrease) in Net Assets From: | | | | | | | | | | | | | |
Operations: | | | | | | | | | | | | | |
Net investment income | | $ | 2,077 | | $ | 18,991 | | $ | 8,866 | | $ | 2,577 | | $ | 2,471 | | $ | 11,019 | |
Net realized gain (loss)(a) | | (3,105 | ) | 4,852 | | 4,491 | | 13,309 | | 10,521 | | 38 | |
Change in unrealized appreciation(b) | | 532 | | 35,568 | | 9,802 | | 11,119 | | 25,135 | | 5,416 | |
Net increase (decrease) in net assets resulting from operations | | (496 | ) | 59,411 | | 23,159 | | 27,005 | | 38,127 | | 16,473 | |
| | | | | | | | | | | | | |
Distributions to Shareholders: | | | | | | | | | | | | | |
From net investment income | | (1,977 | ) | (25,641 | ) | (7,991 | ) | (2,282 | ) | (961 | ) | (7,508 | ) |
From net realized gains | | — | | — | | — | | (10,392 | ) | (1,029 | ) | — | |
| | | | | | | | | | | | | |
Capital Share Transactions: | | | | | | | | | | | | | |
Proceeds from shares sold | | | | | | | | | | | | | |
Class A | | — | | — | | — | | — | | 4,598 | | — | |
Class I | | 89,534 | | 53,956 | | 659,095 | | — | | 215,612 | | 516,616 | |
| | 89,534 | | 53,956 | | 659,095 | | — | | 220,210 | | 516,616 | |
| | | | | | | | | | | | | |
Issued from fund acquisition | | — | | — | | — | | — | | — | | — | |
| | | | | | | | | | | | | |
| | | | | | | | | | | | | |
Dividends and distributions reinvested Class I | | 1,977 | | 25,641 | | 7,991 | | 12,674 | | 1,990 | | 7,508 | |
| | 1,977 | | 25,641 | | 7,991 | | 12,674 | | 1,990 | | 7,508 | |
| | | | | | | | | | | | | |
Cost of shares redeemed | | | | | | | | | | | | | |
Class A | | — | | — | | — | | — | | (205,876 | ) | — | |
Class I | | (5,850 | ) | (33,794 | ) | — | | (1,532 | ) | (5,529 | ) | (19,840 | ) |
| | (5,850 | ) | (33,794 | ) | — | | (1,532 | ) | (211,405 | ) | (19,840 | ) |
| | | | | | | | | | | | | |
Redemption fee | | — | | — | | — | | — | | — | | — | |
| | | | | | | | | | | | | |
Automatic conversions | | — | | — | | — | | — | | — | | — | |
| | | | | | | | | | | | | |
| | 85,661 | | 45,803 | | 667,086 | | 11,142 | | 10,795 | | 504,284 | |
Net increase (decrease) in net assets | | 83,188 | | 79,573 | | 682,254 | | 25,473 | | 46,932 | | 513,249 | |
| | | | | | | | | | | | | |
Net Assets: | | | | | | | | | | | | | |
Beginning of year | | — | | 682,254 | | — | | 245,188 | | 198,256 | | — | |
End of year | | $ | 83,188 | | $ | 761,827 | | $ | 682,254 | | $ | 270,661 | | $ | 245,188 | | $ | 513,249 | |
Undistributed (Accumulated) Net Investment Income (Loss) | | $ | 555 | | $ | 11,652 | | $ | 7,849 | | $ | 2,209 | | $ | 1,908 | | $ | 3,662 | |
| | | | | | | | | | | | | |
Share Activity: | | | | | | | | | | | | | |
Shares issued | | | | | | | | | | | | | |
Class A | | — | | — | | — | | — | | 456 | | — | |
Class I | | 8,953 | | 5,131 | | 64,116 | | — | | 21,339 | | 51,618 | |
| | 8,953 | | 5,131 | | 64,116 | | — | | 21,795 | | 51,618 | |
Shares issued-reinvested from distributions | | | | | | | | | | | | | |
Class I | | 198 | | 2,444 | | 774 | | 1,104 | | 191 | | 755 | |
| | 198 | | 2,444 | | 774 | | 1,104 | | 191 | | 755 | |
| | | | | | | | | | | | | |
Shares issued on fund acquisition | | — | | — | | — | | — | | — | | — | |
| | | | | | | | | | | | | |
Shares redeemed | | | | | | | | | | | | | |
Class A | | — | | — | | — | | — | | (20,396 | ) | — | |
Class I | | (583 | ) | (3,215 | ) | — | | (127 | ) | (528 | ) | (1,997 | ) |
| | (583 | ) | (3,215 | ) | — | | (127 | ) | (20,924 | ) | (1,997 | ) |
| | | | | | | | | | | | | |
Automatic conversions | | — | | — | | — | | — | | — | | — | |
| | | | | | | | | | | | | |
Net increase (decrease) in shares outstanding | | | | | | | | | | | | | |
Class A | | — | | — | | — | | — | | (19,940 | ) | — | |
Class I | | 8,568 | | 4,360 | | 64,890 | | 977 | | 21,002 | | 50,376 | |
| | 8,568 | | 4,360 | | 64,890 | | 977 | | 1,062 | | 50,376 | |
157
| | | | | | | | | | | | TA IDEX | |
| | | | | | TA IDEX Mellon | | | | | | Oppenheimer | |
| | TA IDEX Marsico International | | Market Neutral | | TA IDEX Neuberger Berman | | Developing | |
| | Growth* | | Strategy* | | International* | | Markets* | |
| | Year Ended | | Year Ended | | Period Ended | | Year Ended | | Year Ended | | Year Ended | |
| | October 31, 2007 | | October 31, 2006 | | October 31, 2007 | | October 31, 2007 | | October 31, 2006 | | October 31, 2007 | |
Increase (Decrease) in Net Assets From: | | | | | | | | | | | | | |
Operations: | | | | | | | | | | | | | |
Net investment income | | $ | 4,595 | | $ | 1,407 | | $ | 2,380 | | $ | 6,113 | | $ | 4,587 | | $ | 4,194 | |
Net realized gain (loss)(a) | | 62,840 | | 74,903 | | (2,855 | ) | 46,135 | | 23,519 | | 52,796 | |
Change in unrealized appreciation (depreciation)(b) | | 94,494 | | 23,418 | | (1,976 | ) | 47,697 | | 37,047 | | 166,834 | |
Net increase (decrease) in net assets resulting from operations | | 161,929 | | 99,728 | | (2,451 | ) | 99,945 | | 65,153 | | 223,824 | |
| | | | | | | | | | | | | |
Distributions to Shareholders: | | | | | | | | | | | | | |
From net investment income | | (1,069 | ) | (3,283 | ) | — | | (5,043 | ) | (515 | ) | (1,858 | ) |
From net realized gains | | (75,189 | ) | (2,500 | ) | — | | (23,361 | ) | — | | (12,445 | ) |
| | | | | | | | | | | | | |
Capital Share Transactions: | | | | | | | | | | | | | |
Proceeds from shares sold | | | | | | | | | | | | | |
Class I | | 143,816 | | 184,042 | | 129,375 | | 137,066 | | 406,908 | | 101,549 | |
| | 143,816 | | 184,042 | | 129,375 | | 137,066 | | 406,908 | | 101,549 | |
| | | | | | | | | | | | | |
Issued from fund acquisition | | — | | — | | — | | — | | — | | — | |
Dividends and distributions reinvested | | | | | | | | | | | | | |
Class I | | 76,258 | | 5,783 | | — | | 28,404 | | 515 | | 14,303 | |
| | 76,258 | | 5,783 | | — | | 28,404 | | 515 | | 14,303 | |
Cost of shares redeemed | | | | | | | | | | | | | |
Class A | | — | | (115,115 | ) | — | | — | | — | | — | |
Class I | | (106,633 | ) | (134,523 | ) | (14,530 | ) | (100,519 | ) | (12,065 | ) | (12,893 | ) |
| | (106,633 | ) | (249,638 | ) | (14,530 | ) | (100,519 | ) | (12,065 | ) | (12,893 | ) |
| | | | | | | | | | | | | |
Redemption fee | | — | | — | | — | | — | | — | | — | |
| | | | | | | | | | | | | |
Automatic conversions | | — | | — | | — | | — | | — | | — | |
| | 113,441 | | (59,813 | ) | 114,845 | | 64,951 | | 395,358 | | 102,959 | |
Net increase (decrease) in net assets | | 199,112 | | 34,132 | | 112,394 | | 136,492 | | 459,996 | | 312,479 | |
| | | | | | | | | | | | | |
Net Assets: | | | | | | | | | | | | | |
Beginning of year | | 428,626 | | 394,494 | | — | | 459,996 | | — | | 362,080 | |
End of year | | $ | 627,738 | | $ | 428,626 | | $ | 112,394 | | $ | 596,488 | | $ | 459,996 | | $ | 674,560 | |
Undistributed (Accumulated) Net Investment Income (Loss) | | $ | 4,343 | | $ | 1,019 | | $ | 2,634 | | $ | 5,390 | | $ | 4,263 | | $ | 3,521 | |
| | | | | | | | | | | | | |
Share Activity: | | | | | | | | | | | | | |
Shares issued | | | | | | | | | | | | | |
Class I | | 10,611 | | 15,462 | | 12,975 | | 10,926 | | 40,191 | | 7,548 | |
| | 10,611 | | 15,462 | | 12,975 | | 10,926 | | 40,191 | | 7,548 | |
Shares issued-reinvested from distributions | | | | | | | | | | | | | |
Class I | | 6,189 | | 479 | | — | | 2,409 | | 51 | | 1,219 | |
| | 6,189 | | 479 | | — | | 2,409 | | 51 | | 1,219 | |
| | | | | | | | | | | | | |
Shares issued on fund acquisition | | — | | — | | — | | — | | — | | — | |
| | | | | | | | | | | | | |
Shares redeemed | | | | | | | | | | | | | |
Class A | | — | | (10,171 | ) | — | | — | | — | | — | |
Class I | | (8,494 | ) | (10,955 | ) | (1,488 | ) | (8,500 | ) | (1,063 | ) | (972 | ) |
| | (8,494 | ) | (21,126 | ) | (1,488 | ) | (8,500 | ) | (1,063 | ) | (972 | ) |
| | | | | | | | | | | | | |
Automatic conversions | | — | | — | | — | | — | | — | | — | |
| | | | | | | | | | | | | |
Net increase (decrease) in shares outstanding | | | | | | | | | | | | | |
Class A | | — | | (10,171 | ) | — | | — | | — | | — | |
Class I | | 8,306 | | 4,986 | | 11,487 | | 4,835 | | 39,179 | | 7,795 | |
| | 8,306 | | (5,185 | ) | 11,487 | | 4,835 | | 39,179 | | 7,795 | |
| | | | | | | | | | | | | | | | | | | | |
158
| | TA IDEX | | | | | | | | | | | |
| | Oppenheimer | | | | | | | | | | | |
| | Developing | | TA IDEX Oppenheimer Small- & | | TA IDEX Third | | TA IDEX Transamerica Short-Term | |
| | Markets* | | Mid-Cap Value* | | Avenue Value* | | Bond* | |
| | Year Ended | | Year Ended | | Year Ended | | Period Ended | | Year Ended | | Year Ended | |
| | October 31, 2006 | | October 31, 2007 | | October 31, 2006 | | October 31, 2007 | | October 31, 2007 | | October 31, 2006 | |
Increase (Decrease) in Net Assets From: | | | | | | | | | | | | | |
Operations: | | | | | | | | | | | | | |
Net investment income (loss) | | $ | 2,472 | | $ | (1 | ) | $ | 136 | | $ | 3,253 | | $ | 24,122 | | $ | 12,210 | |
Net realized gain (loss)(a) | | 11,305 | | 12,932 | | 1,356 | | 8,914 | | (1,455 | ) | (1,787 | ) |
Change in unrealized appreciation
(depreciation)(b) | | 27,373 | | 10,851 | | 6,133 | | 9,026 | | (1,233 | ) | 2,995 | |
Net increase (decrease) in net assets resulting from operations | | 41,150 | | 23,782 | | 7,625 | | 21,193 | | 21,434 | | 13,418 | |
| | | | | | | | | | | | | |
Distributions to Shareholders: | | | | | | | | | | | | | |
From net investment income | | (896 | ) | (154 | ) | — | | — | | (22,977 | ) | (11,784 | ) |
From net realized gains | | — | | (1,527 | ) | — | | — | | — | | — | |
| | | | | | | | | | | | | |
Capital Share Transactions: | | | | | | | | | | | | | |
Proceeds from shares sold | | | | | | | | | | | | | |
Class A | | — | | — | | — | | — | | — | | 682 | |
Class I | | 332,453 | | 68,085 | | 84,274 | | 674,117 | | 193,918 | | 198,147 | |
| | 332,453 | | 68,085 | | 84,274 | | 674,117 | | 193,918 | | 198,829 | |
| | | | | | | | | | | | | |
Issued from fund acquisition | | — | | — | | — | | — | | — | | — | |
| | | | | | | | | | | | | |
Dividends and distributions reinvested | | | | | | | | | | | | | |
Class A | | — | | — | | — | | — | | — | | 256 | |
Class I | | 896 | | 1,681 | | — | | — | | 22,977 | | 11,861 | |
| | 896 | | 1,681 | | — | | — | | 22,977 | | 12,117 | |
Cost of shares redeemed | | | | | | | | | | | | | |
Class A | | — | | — | | — | | — | | — | | (109,421 | ) |
Class I | | (11,523 | ) | (640 | ) | — | | (16,732 | ) | (30,905 | ) | (6,620 | ) |
| | (11,523 | ) | (640 | ) | — | | (16,732 | ) | (30,905 | ) | (116,041 | ) |
| | | | | | | | | | | | | |
Redemption fee | | — | | — | | — | | — | | — | | — | |
| | | | | | | | | | | | | |
Automatic conversions | | — | | — | | — | | — | | — | | — | |
| | 321,826 | | 69,126 | | 84,274 | | 657,385 | | 185,990 | | 94,905 | |
Net increase (decrease) in net assets | | 362,080 | | 91,227 | | 91,899 | | 678,578 | | 184,447 | | 96,539 | |
| | | | | | | | | | | | | |
Net Assets: | | | | | | | | | | | | | |
Beginning of year | | — | | 91,899 | | — | | — | | 379,442 | | 282,903 | |
End of year | | $ | 362,080 | | $ | 183,126 | | $ | 91,899 | | $ | 678,578 | | $ | 563,889 | | $ | 379,442 | |
Undistributed (Accumulated) Net Investment Income (Loss) | | $ | 1,548 | | $ | — | | $ | 129 | | $ | 3,567 | | $ | 1,571 | | $ | 426 | |
| | | | | | | | | | | | | |
Share Activity: | | | | | | | | | | | | | |
Shares issued | | | | | | | | | | | | | |
Class A | | — | | — | | — | | — | | — | | 70 | |
Class I | | 32,752 | | 5,401 | | 8,401 | | 24,059 | | 19,678 | | 20,229 | |
| | 32,752 | | 5,401 | | 8,401 | | 24,059 | | 19,678 | | 20,299 | |
Shares issued-reinvested from distributions | | | | | | | | | | | | | |
Class A | | — | | — | | — | | — | | — | | 26 | |
Class I | | 89 | | 147 | | — | | — | | 2,340 | | 1,215 | |
| | 89 | | 147 | | — | | — | | 2,340 | | 1,241 | |
| | | | | | | | | | | | | |
Shares issued on fund acquisition | | — | | — | | — | | — | | — | | — | |
| | | | | | | | | | | | | |
Shares redeemed | | | | | | | | | | | | | |
Class A | | — | | — | | — | | — | | — | | (11,185 | ) |
Class I | | (1,115 | ) | (51 | ) | — | | (604 | ) | (3,135 | ) | (677 | ) |
| | (1,115 | ) | (51 | ) | — | | (604 | ) | (3,135 | ) | (11,862 | ) |
| | | | | | | | | | | | | |
Automatic conversions | | — | | — | | — | | — | | — | | — | |
| | | | | | | | | | | | | |
Net increase (decrease) in shares outstanding | | | | | | | | | | | | | |
Class A | | — | | — | | — | | — | | — | | (11,089 | ) |
Class I | | 31,726 | | 5,497 | | 8,401 | | 23,455 | | 18,883 | | 20,767 | |
| | 31,726 | | 5,497 | | 8,401 | | 23,455 | | 18,883 | | 9,678 | |
159
| | | | | | | | | | TA IDEX Van | |
| | TA IDEX UBS | | | | | | TA IDEX Van Kampen Emerging | | Kampen Mid-Cap | |
| | Dynamic Alpha* | | TA IDEX UBS Large Cap Value* | | Markets Debt* | | Growth* | |
| | Period Ended | | Year Ended | | Year Ended | | Year Ended | | Year Ended | | Year Ended | |
| | October 31, 2007 | | October 31, 2007 | | October 31, 2006 | | October 31, 2007 | | October 31, 2006 | | October 31, 2007 | |
Increase (Decrease) in Net Assets From: | | | | | | | | | | | | | |
Operations: | | | | | | | | | | | | | |
Net investment income | | $ | 1,666 | | $ | 9,408 | | $ | 2,422 | | $ | 17,840 | | $ | 18,790 | | $ | 275 | |
Net realized gain (loss)(a) | | (8,010 | ) | 10,038 | | 7,811 | | 15,056 | | 4,883 | | 8,483 | |
Change in unrealized appreciation
(depreciation)(b) | | 2,871 | | 50,757 | | 23,989 | | (1,349 | ) | 9,918 | | 21,206 | |
Net increase (decrease) in net assets resulting fromoperations | | (3,473 | ) | 70,203 | | 34,222 | | 31,547 | | 33,591 | | 29,964 | |
| | | | | | | | | | | | | |
Distributions to Shareholders: | | | | | | | | | | | | | |
From net investment income | | — | | (2,770 | ) | (1,596 | ) | (19,139 | ) | (17,469 | ) | (138 | ) |
From net realized gains | | — | | (7,826 | ) | (2,899 | ) | (3,843 | ) | (1,668 | ) | — | |
| | | | | | | | | | | | | |
Capital Share Transactions: | | | | | | | | | | | | | |
Proceeds from shares sold | | | | | | | | | | | | | |
Class A | | — | | — | | — | | — | | 4,012 | | — | |
Class I | | 242,143 | | 633,004 | | 119,573 | | 18,120 | | 407,643 | | 36,521 | |
| | 242,143 | | 633,004 | | 119,573 | | 18,120 | | 411,655 | | 36,521 | |
| | | | | | | | | | | | | |
Issued from fund acquisition | | — | | — | | — | | — | | — | | — | |
| | | | | | | | | | | | | |
Dividends and distributions reinvested | | | | | | | | | | | | | |
Class A | | — | | — | | — | | — | | 460 | | — | |
Class I | | — | | 10,596 | | 4,495 | | 22,983 | | 18,975 | | 138 | |
| | — | | 10,596 | | 4,495 | | 22,983 | | 19,435 | | 138 | |
Cost of shares redeemed | | | | | | | | | | | | | |
Class A | | — | | — | | (72,383 | ) | — | | (130,675 | ) | — | |
Class I | | (29,369 | ) | (49,067 | ) | (20,129 | ) | (158,066 | ) | (150,747 | ) | (16,197 | ) |
| | (29,369 | ) | (49,067 | ) | (92,512 | ) | (158,066 | ) | (281,422 | ) | (16,197 | ) |
| | | | | | | | | | | | | |
Redemption fee | | — | | — | | — | | — | | — | | — | |
| | | | | | | | | | | | | |
Automatic conversions | | — | | — | | — | | — | | — | | — | |
| | 212,774 | | 594,533 | | 31,556 | | (116,963 | ) | 149,668 | | 20,462 | |
Net increase (decrease) in net assets | | 209,301 | | 654,140 | | 61,283 | | (108,399 | ) | 164,122 | | 50,288 | |
| | | | | | | | | | | | | |
Net Assets: | | | | | | | | | | | | | |
Beginning of year | | — | | 226,782 | | 165,499 | | 425,726 | | 261,604 | | 75,092 | |
End of year | | $ | 209,301 | | $ | 880,922 | | $ | 226,782 | | $ | 317,328 | | $ | 425,726 | | $ | 125,380 | |
Undistributed (Accumulated) Net Investment Income(Loss) | | $ | 1,994 | | $ | 8,682 | | $ | 2,044 | | $ | 6,495 | | $ | 2,194 | | $ | 52 | |
| | | | | | | | | | | | | |
Share Activity: | | | | | | | | | | | | | |
Shares issued | | | | | | | | | | | | | |
Class A | | — | | — | | — | | — | | 384 | | — | |
Class I | | 24,211 | | 49,000 | | 10,601 | | 1,632 | | 38,444 | | 3,047 | |
| | 24,211 | | 49,000 | | 10,601 | | 1,632 | | 38,828 | | 3,047 | |
Shares issued-reinvested from distributions | | | | | | | | | | | | | |
Class A | | — | | — | | — | | — | | 44 | | — | |
Class I | | — | | 839 | | 399 | | 2,100 | | 1,801 | | 13 | |
| | — | | 839 | | 399 | | 2,100 | | 1,845 | | 13 | |
| | | | | | | | | | | | | |
Shares issued on fund acquisition | | — | | — | | — | | — | | — | | — | |
| | | | | | | | | | | | | |
Shares redeemed | | | | | | | | | | | | | |
Class A | | — | | — | | (6,529 | ) | — | | (12,448 | ) | — | |
Class I | | (2,911 | ) | (3,778 | ) | (1,772 | ) | (14,481 | ) | (14,239 | ) | (1,471 | ) |
| | (2,911 | ) | (3,778 | ) | (8,301 | ) | (14,481 | ) | (26,687 | ) | (1,471 | ) |
| | | | | | | | | | | | | |
Automatic conversions | | — | | — | | — | | — | | — | | — | |
| | | | | | | | | | | | | |
Net increase (decrease) in shares outstanding | | | | | | | | | | | | | |
Class A | | — | | — | | (6,529 | ) | — | | (12,020 | ) | — | |
Class I | | 21,300 | | 46,061 | | 9,228 | | (10,749 | ) | 26,006 | | 1,589 | |
| | 21,300 | | 46,061 | | 2,699 | | (10,749 | ) | 13,986 | | 1,589 | |
160
| | TA IDEX Van | | | | | |
| | Kampen Mid-Cap | | TA IDEX Van Kampen Small | |
| | Growth* | | Company Growth* | |
| | Year Ended | | Year Ended | | Year Ended | |
| | October 31, 2006 | | October 31, 2007 | | October 31, 2006 | |
Increase (Decrease) in Net Assets From: | | | | | | | |
Operations: | | | | | | | |
Net investment income (loss) | | $ | 51 | | $ | 266 | | $ | (526 | ) |
Net realized gain (loss)(a) | | (1,091 | ) | 17,924 | | 11,395 | |
Change in unrealized appreciation(b) | | 1,404 | | 11,276 | | 19,464 | |
Net increase (decrease) in net assets resulting from operations | | 364 | | 29,466 | | 30,333 | |
| | | | | | | |
Distributions to Shareholders: | | | | | | | |
From net investment income | | — | | — | | (136 | ) |
From net realized gains | | — | | (11,508 | ) | (3,166 | ) |
| | | | | | | |
Capital Share Transactions: | | | | | | | |
Proceeds from shares sold | | | | | | | |
Class A | | — | | — | | 2,856 | |
Class I | | 74,728 | | 24,254 | | 193,993 | |
| | 74,728 | | 24,254 | | 196,849 | |
| | | | | | | |
Issued from fund acquisition | | — | | — | | — | |
| | | | | | | |
Dividends and distributions reinvested | | | | | | | |
Class I | | — | | 11,508 | | 3,302 | |
| | — | | 11,508 | | 3,302 | |
Cost of shares redeemed | | | | | | | |
Class A | | — | | — | | (79,117 | ) |
Class I | | — | | (167,022 | ) | (7,523 | ) |
| | — | | (167,022 | ) | (86,640 | ) |
| | | | | | | |
Redemption fee | | — | | — | | — | |
| | | | | | | |
Automatic conversions | | — | | — | | — | |
| | 74,728 | | (131,260 | ) | 113,511 | |
Net increase (decrease) in net assets | | 75,092 | | (113,302 | ) | 140,542 | |
| | | | | | | |
Net Assets: | | | | | | | |
Beginning of year | | — | | 301,649 | | 161,107 | |
End of year | | $ | 75,092 | | $ | 188,347 | | $ | 301,649 | |
Undistributed (Accumulated) Net Investment Income (Loss) | | $ | 52 | | $ | 314 | | $ | 43 | |
| | | | | | | |
Share Activity: | | | | | | | |
Shares issued | | | | | | | |
Class A | | — | | — | | 248 | |
Class I | | 7,267 | | 1,816 | | 16,324 | |
| | 7,267 | | 1,816 | | 16,572 | |
Shares issued-reinvested from distributions | | | | | | | |
Class I | | — | | 898 | | 274 | |
| | — | | 898 | | 274 | |
| | | | | | | |
Shares issued on fund acquisition | | — | | — | | — | |
| | | | | | | |
Shares redeemed | | | | | | | |
Class A | | — | | — | | (6,881 | ) |
Class I | | — | | (12,992 | ) | (660 | ) |
| | — | | (12,992 | ) | (7,541 | ) |
| | | | | | | |
Automatic conversions | | — | | — | | — | |
| | | | | | | |
Net increase (decrease) in shares outstanding | | | | | | | |
Class A | | — | | — | | (6,633 | ) |
Class I | | 7,267 | | (10,278 | ) | 15,938 | |
| | 7,267 | | (10,278 | ) | 9,305 | |
161
FINANCIAL HIGHLIGHTS
For the years ended:
FINANCIAL HIGHLIGHTS
| | TA IDEX AllianceBernstein | | TA IDEX Bjurman, Barry Micro | | TA IDEX BlackRock Global | |
| | International Value(a) | | Emerging Growth(a) | | Allocation(a) | |
| | October 31, 2007 | | October 31, 2006 | | October 31, 2007 | | October 31, 2006 | | October 31, 2007 | | October 31, 2006 | |
Net Asset Value | | | | | | | | | | | | | |
Beginning of year | | $ | 12.35 | | $ | 10.00 | | $ | 10.47 | | $ | 10.00 | | $ | 11.23 | | $ | 10.00 | |
| | | | | | | | | | | | | |
Investment Operations | | | | | | | | | | | | | |
Net Investment income (loss) | | 0.25 | | 0.20 | | (0.07 | ) | (0.02 | ) | 0.24 | | 0.19 | |
Net realized and unrealized gain (loss) on investments | | 2.65 | | 2.16 | | 2.11 | | 0.49 | | 2.15 | | 1.06 | |
Total from investment operations | | 2.90 | | 2.36 | | 2.04 | | 0.47 | | 2.39 | | 1.25 | |
| | | | | | | | | | | | | |
Distributions | | | | | | | | | | | | | |
Net investment income | | (0.15 | ) | (0.01 | ) | — | | — | | (0.20 | ) | (0.02 | ) |
Net realized gains on investments | | (0.22 | ) | — | | — | | — | | (0.19 | ) | — | |
Total distributions | | (0.37 | ) | (0.01 | ) | — | | — | | (0.39 | ) | (0.02 | ) |
| | | | | | | | | | | | | |
Net Asset Value | | | | | | | | | | | | | |
End of year | | $ | 14.88 | | $ | 12.35 | | $ | 12.51 | | $ | 10.47 | | $ | 13.23 | | $ | 11.23 | |
| | | | | | | | | | | | | |
Total Return(b) | | 23.99 | % | 23.67 | % | 19.48 | % | 4.70 | % | 21.95 | % | 12.45 | % |
| | | | | | | | | | | | | |
Net Assets End of Period | | $ | 519,217 | | $ | 376,531 | | $ | 92,126 | | $ | 55,381 | | $ | 520,484 | | $ | 490,941 | |
| | | | | | | | | | | | | |
Ratio and Supplemental Data | | | | | | | | | | | | | |
Ratio of Expenses to Average Net Assets:
Net(c) | | 0.93 | % | 0.99 | % | 1.16 | %(e) | 1.25 | %(e) | 0.85 | % | 0.90 | % |
Ratio of Expenses to Average Net Assets:
Total(c) | | 0.93 | % | 0.99 | % | 1.14 | %(f) | 1.38 | %(f) | 0.85 | % | 0.90 | % |
Net investment income (loss), to average net assets(c) | | 1.82 | % | 1.91 | % | (0.63 | )% | (0.69 | )% | 2.04 | % | 2.02 | % |
Portfolio turnover rate(d) | | 36 | % | 22 | % | 116 | % | 14 | % | 30 | % | 31 | % |
The notes to the financial statements are an integral part of this report.
162
| | | | | | TA IDEX | | | | | | | |
| | | | | | BlackRock | | | | | | | |
| | TA IDEX BlackRock Large Cap | | Natural | | | | | | | |
| | Value(a) | | Resources(a),* | | TA IDEX Evergreen International Small Cap(a) | |
| | October 31, 2007 | | October 31, 2006 | | October 31, 2007 | | October 31, 2007 | | October 31, 2006 | | October 31, 2005 | |
Net Asset Value | | | | | | | | | | | | | |
Beginning of year | | $ | 12.15 | | $ | 10.47 | | $ | 10.00 | | $ | 16.18 | | $ | 12.71 | | $ | 10.00 | |
| | | | | | | | | | | | | |
Investment Operations | | | | | | | | | | | | | |
Net Investment income (loss) | | 0.12 | | 0.07 | | 0.04 | | 0.15 | | 0.14 | | 0.06 | |
Net realized and unrealized gain (loss) on investments | | 1.27 | | 1.64 | | 4.07 | | 4.84 | | 3.79 | | 2.65 | |
Total from investment operations | | 1.39 | | 1.71 | | 4.11 | | 4.99 | | 3.93 | | 2.71 | |
| | | | | | | | | | | | | |
Distributions | | | | | | | | | | | | | |
Net investment income | | (0.09 | ) | (0.03 | ) | — | | (0.12 | ) | (0.03 | ) | — | |
Net realized gains on
investments | | (0.37 | ) | — | | — | | (2.23 | ) | (0.43 | ) | — | |
Total distributions | | (0.46 | ) | (0.03 | ) | — | | (2.35 | ) | (0.46 | ) | — | |
| | | | | | | | | | | | | |
Net Asset Value | | | | | | | | | | | | | |
End of year | | $ | 13.08 | | $ | 12.15 | | $ | 14.11 | | $ | 18.82 | | $ | 16.18 | | $ | 12.71 | |
| | | | | | | | | | | | | |
Total Return(b) | | 11.80 | % | 16.36 | % | 41.10 | % | 34.72 | % | 31.68 | % | 27.10 | % |
| | | | | | | | | | | | | |
Net Assets End of
Period | | $ | 610,135 | | $ | 506,529 | | $ | 156,779 | | $ | 639,892 | | $ | 471,635 | | $ | 204,413 | |
| | | | | | | | | | | | | |
Ratio and Supplemental Data | | | | | | | | | | | | | |
Ratio of Expenses to Average Net Assets: Net(c) | | 0.84 | % | 0.84 | % | 0.89 | % | 1.13 | % | 1.15 | % | 1.22 | % |
Ratio of Expenses to Average Net Assets: Total(c) | | 0.84 | % | 0.84 | % | 0.89 | % | 1.13 | % | 1.15 | % | 1.22 | % |
Net investment income (loss), to average net assets(c) | | 0.96 | % | 0.62 | % | 0.39 | % | 0.88 | % | 0.94 | % | 0.56 | % |
Portfolio turnover rate(d) | | 69 | % | 56 | % | 7 | % | 78 | % | 89 | % | 65 | % |
| | TA IDEX Federated Market | | TA IDEX JPMorgan International | | TA IDEX JPMorgan Mid Cap | |
| | Opportunity(a) | | Bond(a) | | Value(a) | |
| | October 31, 2007 | | October 31, 2006 | | October 31, 2007 | | October 31, 2006 | | October 31, 2007 | | October 31, 2006 | |
Net Asset Value | | | | | | | | | | | | | |
Beginning of year | | $ | 9.71 | | $ | 10.00 | | $ | 10.51 | | $ | 10.00 | | $ | 11.67 | | $ | 10.09 | |
| | | | | | | | | | | | | |
Investment Operations | | | | | | | | | | | | | |
Net Investment income (loss) | | 0.24 | | 0.27 | | 0.28 | | 0.22 | | 0.13 | | 0.11 | |
Net realized and unrealized gain (loss) on investments | | (0.34 | ) | (0.30 | ) | 0.59 | | 0.49 | | 1.13 | | 1.57 | |
Total from investment operations | | (0.10 | ) | (0.03 | ) | 0.87 | | 0.71 | | 1.26 | | 1.68 | |
| | | | | | | | | | | | | |
Distributions | | | | | | | | | | | | | |
Net investment income | | (0.28 | ) | (0.26 | ) | (0.38 | ) | (0.20 | ) | (0.11 | ) | (0.05 | ) |
Net realized gains on investments | | — | | — | | — | | — | | (0.50 | ) | (0.05 | ) |
Total distributions | | (0.28 | ) | (0.26 | ) | (0.38 | ) | (0.20 | ) | (0.61 | ) | (0.10 | ) |
| | | | | | | | | | | | | |
Net Asset Value | | | | | | | | | | | | | |
End of year | | $ | 9.33 | | $ | 9.71 | | $ | 11.00 | | $ | 10.51 | | $ | 12.32 | | $ | 11.67 | |
| | | | | | | | | | | | | |
Total Return(b) | | (1.03 | )% | (0.35 | )% | 8.55 | % | 7.12 | % | 11.07 | % | 16.71 | % |
| | | | | | | | | | | | | |
Net Assets End of Period | | $ | 53,747 | | $ | 83,188 | | $ | 761,827 | | $ | 682,254 | | $ | 270,661 | | $ | 245,188 | |
| | | | | | | | | | | | | |
Ratio and Supplemental Data | | | | | | | | | | | | | |
Ratio of Expenses to Average Net Assets: Net(c) | | 0.93 | % | 0.88 | % | 0.61 | % | 0.64 | % | 0.87 | % | 0.88 | % |
Ratio of Expenses to Average Net Assets: Total(c) | | 0.93 | % | 0.88 | % | 0.61 | % | 0.64 | % | 0.87 | % | 0.88 | % |
Net investment income (loss), to average net
assets(c) | | 2.49 | % | 2.97 | % | 2.68 | % | 2.34 | % | 0.98 | % | 1.10 | % |
Portfolio turnover
rate(d) | | 97 | % | 72 | % | 86 | % | 145 | % | 50 | % | 46 | % |
163
FINANCIAL HIGHLIGHTS (continued)
For the years ended:
| | | | | | TA IDEX Mellon | |
| | TA IDEX Loomis | | | | Market Neutral | |
| | Sayles Bond(a),* | | TA IDEX Marsico International Growth(a) | | Strategy(a),* | |
| | October 31, 2007 | | October 31, 2007 | | October 31, 2006 | | October 31, 2005 | | October 31, 2005 | |
| | | | | | | | | | | |
Net Asset Value | | | | | | | | | | | |
Beginning of year | | $ | 10.00 | | $ | 14.12 | | $ | 11.11 | | $ | 10.00 | | $ | 10.00 | |
| | | | | | | | | | | |
Investment Operations | | | | | | | | | | | |
Net Investment income (loss) | | 0.45 | | 0.13 | | 0.05 | | 0.16 | | 0.23 | |
Net realized and unrealized gain (loss) on investments | | (0.01 | ) | 4.46 | | 3.17 | | 0.99 | | (0.45 | ) |
Total from investment operations | | 0.44 | | 4.59 | | 3.22 | | 1.15 | | (0.22 | ) |
| | | | | | | | | | | |
Distributions | | | | | | | | | | | |
Net investment income | | (0.25 | ) | (0.03 | ) | (0.12 | ) | (0.04 | ) | — | |
Net realized gains on investments | | — | | (2.44 | ) | (0.09 | ) | — | | — | |
Total distributions | | (0.25 | ) | (2.47 | ) | (0.21 | ) | (0.04 | ) | — | |
| | | | | | | | | | | |
Net Asset Value | | | | | | | | | | | |
End of year | | $ | 10.19 | | $ | 16.24 | | $ | 14.12 | | $ | 11.11 | | $ | 9.78 | |
| | | | | | | | | | | |
Total Return(b) | | 4.50 | % | 38.11 | % | 29.35 | % | 11.49 | % | (2.20 | )% |
| | | | | | | | | | | |
Net Assets End of Period | | $ | 513,249 | | $ | 627,738 | | $ | 428,626 | | $ | 281,692 | | $ | 112,394 | |
| | | | | | | | | | | |
Ratio and Supplemental Data | | | | | | | | | | | |
Ratio of Expenses to Average Net Assets: Net,(c) | | 0.73 | % | 1.13 | % | 1.16 | % | 1.18 | % | 1.49 | %(g)(i) |
Ratio of Expenses to Average Net Assets: Total(c) | | 0.73 | % | 1.13 | % | 1.16 | % | 1.18 | % | 3.05 | %(h)(i) |
Net investment income (loss), to average net assets(c) | | 5.42 | % | 0.99 | % | 0.38 | % | 1.52 | % | 2.77 | % |
Portfolio turnover rate(d) | | 18 | % | 133 | % | 129 | % | 145 | % | 119 | % |
| | TA IDEX Neuberger Berman | | TA IDEX Oppenheimer Developing | | TA IDEX Oppenheimer Small & | |
| | International(a),* | | Markets(a),* | | Mid-Cap Value(a),* | |
| | October 31, 2007 | | October 31, 2006 | | October 31, 2007 | | October 31, 2006 | | October 31, 2007 | | October 31, 2006 | |
| | | | | | | | | | | | | |
Net Asset Value | | | | | | | | | | | | | |
Beginning of year | | $ | 11.74 | | $ | 10.00 | | $ | 11.41 | | $ | 10.00 | | $ | 10.94 | | $ | 10.00 | |
| | | | | | | | | | | | | |
Investment Operations | | | | | | | | | | | | | |
Net Investment income (loss) | | 0.15 | | 0.12 | | 0.12 | | 0.09 | | — | | 0.02 | |
Net realized and unrealized gain (loss) on investments | | 2.37 | | 1.64 | | 5.99 | | 1.37 | | 2.44 | | 0.92 | |
Total from investment operations | | 2.52 | | 1.76 | | 6.11 | | 1.46 | | 2.44 | | 0.94 | |
| | | | | | | | | | | | | |
Distributions | | | | | | | | | | | | | |
Net investment income | | (0.13 | ) | (0.02 | ) | (0.06 | ) | (0.05 | ) | (0.02 | ) | — | |
Net realized gains on investments | | (0.58 | ) | — | | (0.39 | ) | — | | (0.18 | ) | ��� | |
Total distributions | | (0.71 | ) | (0.02 | ) | (0.45 | ) | (0.05 | ) | (0.20 | ) | — | |
| | | | | | | | | | | | | |
Net Asset Value | | | | | | | | | | | | | |
End of year | | $ | 13.55 | | $ | 11.74 | | $ | 17.07 | | $ | 11.41 | | $ | 13.18 | | $ | 10.94 | |
| | | | | | | | | | | | | |
Total Return(b) | | 22.37 | % | 17.61 | % | 55.27 | % | 14.64 | % | 22.57 | % | 9.40 | % |
| | | | | | | | | | | | | |
Net Assets End of Period | | $ | 596,488 | | $ | 459,996 | | $ | 674,560 | | $ | 362,080 | | $ | 183,126 | | $ | 91,899 | |
| | | | | | | | | | | | | |
Ratio and Supplemental Data | | | | | | | | | | | | | |
Ratio of Expenses to Average Net Assets: Net(c) | | 1.06 | % | 1.07 | % | 1.34 | % | 1.45 | %(e) | 1.03 | %(e) | 1.15 | %(e) |
Ratio of Expenses to Average Net Assets: Total(c) | | 1.06 | % | 1.07 | % | 1.34 | % | 1.45 | % | 1.03 | % (f) | 1.22 | %(f) |
Net investment income (loss), to average net assets(c) | | 1.21 | % | 1.21 | % | 0.87 | % | 0.89 | % | — | % | 0.74 | % |
Portfolio turnover rate(d) | | 57 | % | 52 | % | 59 | % | 77 | % | 118 | % | 33 | % |
164
FINANCIAL HIGHLIGHTS (continued)
For the years ended:
| | | | | | | | | | TA IDEX UBS | |
| | TA IDEX Third | | | | | | | | Dynamic | |
| | Avenue Value(a),* | | TA IDEX Transamerica Short-Term Bond(a),* | | Alpha(a),* | |
| | October 31, 2007 | | October 31, 2007 | | October 31, 2006 | | October 31, 2005 | | October 31, 2007 | |
Net Asset Value | | | | | | | | | | | |
Beginning of year | | $ | 28.01 | | $ | 9.84 | | $ | 9.79 | | $ | 10.00 | | $ | 10.00 | |
| | | | | | | | | | | |
Investment Operations | | | | | | | | | | | |
Net Investment income (loss) | | 0.14 | | 0.47 | | 0.40 | | 0.28 | | 0.09 | |
Net realized and unrealized gain (loss) on investments | | 0.78 | | (0.04 | ) | 0.05 | | (0.22 | ) | (0.26 | ) |
Total from investment operations | | 0.92 | | 0.43 | | 0.45 | | 0.06 | | (0.17 | ) |
| | | | | | | | | | | |
Distributions | | | | | | | | | | | |
Net investment income | | — | | (0.45 | ) | (0.40 | ) | (0.27 | ) | — | |
Net realized gains on investments | | — | | — | | — | | — | | — | |
Total distributions | | — | | (0.45 | ) | (0.40 | ) | (0.27 | ) | — | |
| | | | | | | | | | | |
Net Asset Value | | | | | | | | | | | |
End of year | | $ | 28.93 | | $ | 9.82 | | $ | 9.84 | | $ | 9.79 | | $ | 9.83 | |
| | | | | | | | | | | |
Total Return(b) | | 3.28 | % | 4.45 | % | 4.72 | % | 0.49 | % | (1.70 | )% |
| | | | | | | | | | | |
Net Assets End of Period | | $ | 678,578 | | $ | 563,889 | | $ | 379,442 | | $ | 174,302 | | $ | 209,382 | |
| | | | | | | | | | | |
Ratio and Supplemental Data | | | | | | | | | | | |
Ratio of Expenses to Average Net Assets: Net(c) | | 0.86 | % | 0.67 | % | 0.70 | % | 0.71 | % | 1.51 | %(i) |
Ratio of Expenses to Average Net Assets: Total(c) | | 0.86 | % | 0.67 | % | 0.70 | % | 0.71 | % | 1.51 | %(i) |
Net investment income (loss), to average net assets(c) | | 0.98 | % | 4.81 | % | 4.10 | % | 2.92 | % | 1.16 | % |
Portfolio turnover rate(d) | | 11 | % | 117 | % | 100 | % | 153 | % | 45 | % |
| | TA IDEX UBS Large Cap Value(a),* | | TA IDEX Van Kampen Emerging Markets Debt(a),* | |
| | October 31, 2007 | | October 31, 2006 | | October 31, 2005 | | October 31, 2007 | | October 31, 2006 | | October 31, 2005 | |
Net Asset Value | | | | | | | | | | | | | |
Beginning of year | | $ | 12.73 | | $ | 10.95 | | $ | 10.00 | | $ | 10.91 | | $ | 10.45 | | $ | 10.00 | |
| | | | | | | | | | | | | |
Investment Operations | | | | | | | | | | | | | |
Net Investment income (loss) | | 0.19 | | 0.14 | | 0.12 | | 0.59 | | 0.55 | | 0.49 | |
Net realized and unrealized gain (loss) on investments | | 1.36 | | 1.92 | | 0.84 | | 0.46 | | 0.52 | | 0.45 | |
Total from investment operations | | 1.55 | | 2.06 | | 0.96 | | 1.05 | | 1.07 | | 0.94 | |
| | | | | | | | | | | | | |
Distributions | | | | | | | | | | | | | |
Net investment income | | (0.13 | ) | (0.10 | ) | (0.01 | ) | (0.63 | ) | (0.54 | ) | (0.49 | ) |
Net realized gains on investments | | (0.36 | ) | (0.18 | ) | — | | (0.10 | ) | (0.07 | ) | — | |
Total distributions | | (0.49 | ) | (0.28 | ) | (0.01 | ) | (0.73 | ) | (0.61 | ) | (0.49 | ) |
| | | | | | | | | | | | | |
Net Asset Value | | | | | | | | | | | | | |
End of year | | $ | 13.79 | | $ | 12.73 | | $ | 10.95 | | $ | 11.23 | | $ | 10.91 | | $ | 10.45 | |
| | | | | | | | | | | | | |
Total Return(b) | | 12.48 | % | 19.19 | % | 9.60 | % | 9.94 | % | 10.61 | % | 9.36 | % |
| | | | | | | | | | | | | |
Net Assets End of Period | | $ | 880,922 | | $ | 226,782 | | $ | 94,135 | | $ | 317,328 | | $ | 425,726 | | $ | 136,022 | |
| | | | | | | | | | | | | |
Ratio and Supplemental Data | | | | | | | | | | | | | |
Ratio of Expenses to Average Net Assets: Net(c) | | 0.81 | % | 0.88 | % | 0.92 | % | 1.03 | % | 1.03 | % | 1.07 | % |
Ratio of Expenses to Average Net Assets: Total(c) | | 0.81 | % | 0.88 | % | 0.92 | % | 1.03 | % | 1.03 | % | 1.07 | % |
Net investment income (loss), to average net assets(c) | | 1.41 | % | 1.21 | % | 1.14 | % | 5.36 | % | 5.24 | % | 4.91 | % |
Portfolio turnover rate(d) | | 27 | % | 32 | % | 43 | % | 79 | % | 79 | % | 67 | % |
165
FINANCIAL HIGHLIGHTS (continued)
For the years ended:
| | TA IDEX Van Kampen Mid-Cap | | | |
| | Growth(a),* | | TA IDEX Van Kampen Small Company Growth(a),* | |
| | October 31, 2007 | | October 31, 2006 | | October 31, 2007 | | October 31, 2006 | | October 31, 2005 | |
Net Asset Value | | | | | | | | | | | |
Beginning of year | | $ | 10.33 | | $ | 10.00 | | $ | 12.78 | | $ | 11.29 | | $ | 10.00 | |
| | | | | | | | | | | |
Investment Operations | | | | | | | | | | | |
Net Investment income (loss) | | 0.04 | | 0.01 | | 0.02 | | (0.02 | ) | 0.01 | |
Net realized and unrealized gain (loss) on investments | | 3.81 | | 0.32 | | 1.81 | | 1.69 | | 1.28 | |
Total from investment operations | | 3.85 | | 0.33 | | 1.83 | | 1.67 | | 1.29 | |
| | | | | | | | | | | |
Distributions | | | | | | | | | | | |
Net investment income | | (0.02 | ) | — | | — | | (0.01 | ) | — | |
Net realized gains on investments | | — | | — | | (0.47 | ) | (0.17 | ) | — | |
Total distributions | | (0.02 | ) | – | | (0.47 | ) | (0.18 | ) | — | |
| | | | | | | | | | | |
Net Asset Value | | | | | | | | | | | |
End of year | | $ | 14.16 | | $ | 10.33 | | $ | 14.14 | | $ | 12.78 | | $ | 11.29 | |
| | | | | | | | | | | |
Total Return(b) | | 37.32 | % | 3.30 | % | 14.75 | % | 14.92 | % | 12.80 | % |
| | | | | | | | | | | |
Net Assets End of Period | | $ | 125,380 | | $ | 75,092 | | $ | 188,347 | | $ | 301,649 | | $ | 86,432 | |
| | | | | | | | | | | |
Ratio and Supplemental Data | | | | | | | | | | | |
Ratio of Expenses to Average Net Assets: Net(c) | | 0.90 | % | 0.92 | % | 1.01 | % | 1.01 | % | 1.07 | % |
Ratio of Expenses to Average Net Assets: Total(c) | | 0.90 | % | 0.92 | % | 1.01 | % | 1.01 | % | 1.07 | % |
Net investment income (loss), to average net assets(c) | | 0.32 | % | 0.11 | % | 0.13 | % | (0.19 | )% | 0.06 | % |
Portfolio turnover rate(d) | | 74 | % | 50 | % | 71 | % | 67 | % | 75 | % |
(a) | | Per share information is calculated based on average number of shares outstanding. |
(b) | | Total return has been calculated for the applicable period without deduction of a sales load, if any, on an initial purchase. Not annualized. |
(c) | | Annualized |
(d) | | Not annualized |
(e) | | Ratio of Net Expenses to Average Net Assets is net of fee and reimbursements by the investment adviser, if any. |
(f) | | Ratio of Net Expenses to Average Net Assets includes all expenses before fee waivers and reimbursements by the investment adviser. |
(g) | | Ratio of Net Expenses to Average Net Assets is exclusive of dividends on securities sold short (representing 1.56% of Average Net Assets) (see note 1) |
(h) | | Ratio of Total Expenses to Average Net Assets is inclusive of dividends on securities sold short (representing 1.56% of Average Net Assets) |
(i) | | The Fund has restated its ratio and supplemental data within the financial highlights (see note 8) |
| | |
* | | Commenced operations on January 3, 2007. |
166
NOTES TO FINANCIAL STATEMENTS
At October 31, 2007
(all amounts in thousands)
NOTE 1. ORGANIZATION AND SIGNIFICANT ACCOUNTING POLICIES
Transamerica IDEX Mutual Funds (“TA IDEX Class I Funds”) is an open-end management investment company registered under the Investment Company Act of 1940, as amended (the “1940 Act”). TA IDEX AllianceBernstein International Value, TA IDEX Bjurman, Barry Micro Emerging Growth, TA IDEX BlackRock Global Allocation, TA IDEX BlackRock Large Cap Value, TA IDEX BlackRock Natural Resources, TA IDEX Evergreen International Small Cap, TA IDEX Federated Market Opportunity, TA IDEX JPMorgan International Bond, TA IDEX JPMorgan Mid Cap Value, TA IDEX Loomis Sayles Bond, TA IDEX Marsico International Growth, TA IDEX Mellon Market Neutral Strategy, TA IDEX Neuberger Berman International, TA IDEX Oppenheimer Developing Markets, TA IDEX Oppenheimer Small- & Mid-Cap Value, TA IDEX Transamerica Short-Term Bond, TA IDEX Third Avenue Value, TA IDEX UBS Dynamic Alpha, TA IDEX UBS Large Cap Value, TA IDEX Van Kampen Emerging Markets Debt, TA IDEX Van Kampen Mid-Cap Growth, and TA IDEX Van Kampen Small Company Growth, (each a “Fund” and collectively “the Funds”), are part of Transamerica IDEX Mutual Funds.
| | Commencement of | |
Fund | | Operations | |
TA IDEX AllianceBernstein International Value | | December 6, 2005 | |
TA IDEX Bjurman, Barry Micro Emerging Growth | | August 1, 2006 | |
TA IDEX BlackRock Global Allocation | | December 6, 2005 | |
TA IDEX BlackRock Large Cap Value * | | November 15, 2005 | |
TA IDEX BlackRock Natural Resources | | January 3, 2007 | |
TA IDEX Evergreen International Small Cap | | November 8, 2004 | |
TA IDEX Federated Market Opportunity | | December 6, 2005 | |
TA IDEX JPMorgan International Bond | | December 6, 2005 | |
TA IDEX JPMorgan Mid Cap Value * | | November 15, 2005 | |
TA IDEX Loomis Sayles Bond | | January 3, 2007 | |
TA IDEX Marsico International Growth | | November 8, 2004 | |
TA IDEX Mellon Market Neutral Strategy | | January 3, 2007 | |
TA IDEX Neuberger Berman International | | December 6, 2005 | |
TA IDEX Oppenheimer Developing Markets | | December 6, 2005 | |
TA IDEX Oppenheimer Small- & Mid-Cap Value | | August 1, 2006 | |
TA IDEX Third Avenue Value | | May 1, 2007 | |
TA IDEX Transamerica Short-Term Bond | | November 8, 2004 | |
TA IDEX UBS Dynamic Alpha | | January 3, 2007 | |
TA IDEX UBS Large Cap Value | | November 8, 2004 | |
TA IDEX Van Kampen Emerging Markets Debt | | November 8, 2004 | |
TA IDEX Van Kampen Mid-Cap Growth | | January 3, 2006 | |
TA IDEX Van Kampen Small Company Growth | | November 8, 2004 | |
* Fund commenced Class I share operations and converted Class A share assets to an equivalent value of Class I share assets on November 15, 2005.
In the normal course of business, the Funds enter into contracts that contain a variety of representations that provide general indemnifications. The Funds’ maximum exposure under these arrangements is unknown, as this would involve future claims that may be made against the Funds and/or their affiliates that have not yet occurred. However, based on experience, the Funds expect the risk of loss to be remote.
This report should be read in conjunction with the Funds’ current prospectuses, which contain more complete information about the Funds.
In preparing the Funds’ financial statements in accordance with accounting principles generally accepted in the United States of America (“GAAP”), estimates or assumptions (which could differ from actual results) may be used that affect reported amounts and disclosures. The following is a summary of significant accounting policies followed by the Funds.
Class operations, income and expenses: The Funds currently offer one class of shares, Class I shares, which are currently being offered for sale only to certain affiliated asset allocation funds. Income, non-class specific expenses and realized and unrealized gains and losses, are allocated daily, based upon the value of shares outstanding method as permitted under Rule 18f-3 of the 1940 Act. Class I bore its own specific expenses as well as a portion of general, common expenses.
Security valuations: The Funds value their investments at the close of the New York Stock Exchange (“NYSE”), normally 4 p.m. ET, each day the NYSE is open for business. Fund investments are valued at the last sale price or closing price on the day of valuation taken from the primary exchange where the security is principally traded.
Securities traded in the over-the-counter market and listed securities for which no sale was reported on that date are valued at the last quoted bid price.
Debt securities are valued based on a price quotation or other equivalent indication of value supplied by an exchange, a pricing service or a major market maker; however, those that mature in sixty days or less are valued at amortized cost, which approximates market.
Investment company securities are valued at the net asset value of the underlying portfolio.
Foreign securities generally are valued based on quotations from the primary market in which they are traded. Because many foreign securities markets and exchanges close prior to the close of the NYSE, closing prices for foreign securities in those markets or on those exchanges do not reflect the events that occur after that close. If a significant market event impacting the value of a portfolio security (e.g., natural disaster, company announcement, market volatility) occurs subsequent to the close of trading in the security, but prior to the calculation of the Funds’ net asset value per share, market quotations for that security may be determined to be unreliable and, accordingly, not “readily available.” As a result, foreign equity securities held by the Funds may be valued at fair market value as determined in good faith by the Funds’ Administrative Valuation Committee, under the supervision of the Board’s Valuation Committee, using guidelines adopted by the Board of Trustees.
Other securities for which quotations are not readily available or whose values have been determined to be unreliable are valued at fair market value as determined in good faith by the Funds’ Administrative Valuation Committee, under the supervision of the Board’s Valuation Committee, using guidelines adopted by the Board of Trustees.
167
Cash: Each Fund may leave cash overnight in its cash account with the custodian, State Street Bank & Trust Company (“State Street”). On July 2, 2007, State Street acquired the parent company of Investors Bank & Trust Company (“IBT”). State Street has been contracted on behalf of the Funds to invest the excess cash into their savings accounts, which at October 31, 2007 were paying an interest rate of 3.00%.
Throughout the year, the Funds may have cash overdraft balances. A fee is incurred on these overdrafts, calculated by multiplying the overdrafts by a rate based on the federal funds rate.
Short sales: TA IDEX Mellon Market Neutral Strategy and TA IDEX UBS Dynamic Alpha may from time to time sell securities short. In the event that the sub-advisers anticipate that the price of securities will decline, they may sell the securities short and borrow the same securities from a broker or other institution to complete the sale. The Funds will incur a profit or a loss, depending upon whether the market price of the securities decreases or increases between the date of the short sale and the date on which the Funds must replace the borrowed securities. All short sales will be fully collateralized. Short sales represent an aggressive trading practice with a high risk/return potential, and short sales involve special considerations. Risks of short sales include that possible losses from short sales may be unlimited (e.g., if the price of stocks sold short rises), whereas losses from direct purchases of securities are limited to the total amount invested, and the Funds may be unable to replace borrowed securities sold short. Dividends paid by the issuers of the securities sold short are paid by the Funds to the lenders, recorded on the ex-date of the dividends and recorded as expenses on the Statements of Operations.
Repurchase agreements: The Funds are authorized to enter into repurchase agreements. The Funds, through their custodian, State Street, receive delivery of the underlying securities, the value of which at the time of purchase is required to be an amount equal to at least 100% of the resale price. The Funds will bear the risk of value fluctuations until the securities can be sold and may encounter delays and incur costs in liquidating the securities. In the event of bankruptcy or insolvency of the seller, delays and costs may be incurred.
Commission recapture: The sub-advisers of certain Funds, to the extent consistent with the best execution and usual commission rate policies and practices, have elected to place security transactions of the Funds with broker/dealers with which Transamerica IDEX Mutual Funds has established a Commission Recapture Program. A Commission Recapture Program is any arrangement under which a broker/dealer applies a portion of the commissions received by such broker/dealer on the security transactions to the Funds. In no event will commissions paid by the Funds be used to pay expenses that would otherwise be borne by any other funds within Transamerica IDEX Mutual Funds, or by any other party.
Recaptured commissions for the year ended October 31, 2007, are included in net realized gains in the Statements of Operations and are summarized as follows:
Fund | | Commissions | |
TA IDEX AllianceBernstein International Value | | $ | 9 | |
TA IDEX Bjurman, Barry Micro Emerging Growth | | 24 | |
TA IDEX BlackRock Global Allocation | | — | |
TA IDEX BlackRock Large Cap Value | | — | |
TA IDEX BlackRock Natural Resources | | — | |
TA IDEX Evergreen International Small Cap | | — | |
TA IDEX Federated Market Opportunity | | 8 | |
TA IDEX JPMorgan International Bond | | — | |
TA IDEX JPMorgan Mid Cap Value | | 4 | |
TA IDEX Loomis Sayles Bond | | — | |
TA IDEX Marsico International Growth | | 5 | |
TA IDEX Mellon Market Neutral Strategy | | — | |
TA IDEX Neuberger Berman International | | 9 | |
TA IDEX Oppenheimer Developing Markets | | — | |
TA IDEX Oppenheimer Small- & Mid-Cap Value | | — | |
TA IDEX Third Avenue Value | | 2 | |
TA IDEX Transamerica Short-Term Bond | | — | |
TA IDEX UBS Dynamic Alpha | | 8 | |
TA IDEX UBS Large Cap Value | | 52 | |
TA IDEX Van Kampen Emerging Markets Debt | | — | |
TA IDEX Van Kampen Mid-Cap Growth | | — | |
TA IDEX Van Kampen Small Company Growth | | 38 | |
| | | | |
Securities lending: The Funds may lend securities to qualified borrowers, with State Street acting as the Funds’ lending agent. The Funds earn negotiated lenders’ fees. The Funds receive cash and/or securities as collateral against the loaned securities. Cash collateral received is invested in short term, interest bearing securities. The Funds monitor the market value of securities loaned on a daily basis and requires collateral in an amount at least equal to the value of the securities loaned. The value of loaned securities and related collateral outstanding at October 31, 2007, were as follows:
| | | | Cash Collateral | |
Fund | | Market Value | | Received | |
TA IDEX AllianceBernstein International Value | | $ | 8,344 | | $ | 8,918 | |
TA IDEX Bjurman, Barry Micro Emerging Growth | | 13,702 | | 14,430 | |
TA IDEX BlackRock Global Allocation | | — | | — | |
TA IDEX BlackRock Large Cap Value | | 14,369 | | 15,304 | |
TA IDEX BlackRock Natural Resources | | 20,710 | | 21,371 | |
TA IDEX Evergreen International Small Cap | | 11,216 | | 11,795 | |
TA IDEX Federated Market Opportunity | | 610 | | 630 | |
TA IDEX JPMorgan International Bond | | — | | — | |
TA IDEX JPMorgan Mid Cap Value | | 30,037 | | 30,899 | |
TA IDEX Loomis Sayles Bond | | 52,156 | | 53,498 | |
TA IDEX Marsico International Growth | | 14,046 | | 14,624 | |
TA IDEX Mellon Market Neutral Strategy | | — | | — | |
TA IDEX Neuberger Berman International | | 36,101 | | 37,741 | |
TA IDEX Oppenheimer Developing Markets | | 19,109 | | 19,776 | |
TA IDEX Oppenheimer Small- & Mid-Cap Value | | 30,374 | | 31,688 | |
TA IDEX Third Avenue Value | | 97,709 | | 101,498 | |
TA IDEX Transamerica Short-Term Bond | | — | | — | |
TA IDEX UBS Dynamic Alpha | | 13,116 | | 13,530 | |
TA IDEX UBS Large Cap Value | | 32,455 | | 33,291 | |
TA IDEX Van Kampen Emerging Markets Debt | | — | | — | |
TA IDEX Van Kampen Mid-Cap Growth | | 22,268 | | 22,950 | |
TA IDEX Van Kampen Small Company Growth | | 46,021 | | 47,638 | |
| | | | | | | |
168
The Funds have invested the cash collateral received from securities loaned in the following short term, interest bearing securities:
| | TA IDEX | | TA IDEX Bjurman, | | | | | |
| | AllianceBernstein | | Barry Micro | | TA IDEX BlackRock | | TA IDEX BlackRock | |
| | International Value | | Emerging Growth | | Large Cap Value | | Natural Resources | |
| | | | | | | | | |
Abbey National PLC, Eurodollar Term, 4.85%, 11/8/2007 | | $ | 164 | | $ | 265 | | $ | 281 | | $ | 392 | |
ABN AMRO Bank NV, Eurodollar Term, 4.95%, 11/21/2007 | | 614 | | 993 | | 1,053 | | 1,471 | |
Bank of Nova Scotia, Eurodollar Term, 5.00%, 11/26/2007 | | 614 | | 993 | | 1,053 | | 1,471 | |
Barclays, Eurodollar Term, 5.00%, 1/22/2008 | | 82 | | 132 | | 141 | | 196 | |
BNP Paribas, Eurodollar Term, 4.72%, 11/23/2007 | | 982 | | 1,588 | | 1,685 | | 2,353 | |
Calyon, Eurodollar Term, 4.88%, 11/7/2007 | | 245 | | 397 | | 421 | | 588 | |
Canadian Imperial Bank of Commerce, Eurodollar Term, 5.34%, 11/9/2007 | | 123 | | 199 | | 211 | | 294 | |
Credit Suisse First Boston Corp., Repurchase Agreement, 5.04%,11/1/2007 | | 205 | | 331 | | 351 | | 490 | |
Dexia Group, Eurodollar Term, 5.10%, 11/14/2007 | | 614 | | 993 | | 1,053 | | 1,471 | |
Fifth Third Bancorp, Eurodollar Overnight, 4.62%, 11/1/2007 | | 123 | | 199 | | 211 | | 294 | |
Lloyds TSB Bank, Eurodollar Term, 4.90%, 11/9/2007 | | 818 | | 1,324 | | 1,404 | | 1,961 | |
Merrill Lynch & Co. (RPG), Repurchase Agreement, 4.82%, 11/1/2007 | | 696 | | 1,126 | | 1,194 | | 1,667 | |
Morgan Stanley & Co. (Gvt Repo), Repurchase Agreement, 4.82%, 11/1/2007 | | 695 | | 1,126 | | 1,194 | | 1,667 | |
Rabobank Nederland, Eurodollar Term, 4.82%, 11/15/2007 | | 614 | | 993 | | 1,053 | | 1,471 | |
Reserve Primary Money Market Fund, Money Market Fund, 5.09%,11/1/2007 | | 245 | | 397 | | 421 | | 588 | |
Royal Bank of Canada, Eurodollar Term, 4.95%, 11/16/2007 | | 82 | | 132 | | 141 | | 196 | |
Royal Bank of Scotland, Eurodollar Term, 5.33%, 1/22/2008 | | 736 | | 1,192 | | 1,264 | | 1,765 | |
Societe Generale, Eurodollar Term, 5.05%, 11/1/2007 | | 450 | | 728 | | 772 | | 1,079 | |
Svenska Handlesbanken, Eurodollar Overnight, 4.84%, 11/1/2007 | | 530 | | 859 | | 910 | | 1,271 | |
Toronto Dominion Bank, Eurodollar Term, 4.88%, 11/6/2007 | | 245 | | 397 | | 421 | | 588 | |
UBS AG, Eurodollar Term, 5.36%, 11/8/2007 | | 41 | | 66 | | 70 | | 98 | |
| | | | | | | | | |
| | $ | 8,918 | | $ | 14,430 | | $ | 15,304 | | $ | 21,371 | |
| | TA IDEX Evergreen | | | | | | | |
| | International Small | | TA IDEX Federated | | TA IDEX JPMorgan | | TA IDEX Loomis | |
| | Cap | | Market Opportunity | | Mid Cap Value | | Sayles Bond | |
| | | | | | | | | |
Abbey National PLC, Eurodollar Term, 4.85%, 11/8/2007 | | $ | 216 | | $ | 12 | | $ | 567 | | $ | 982 | |
ABN AMRO Bank NV, Eurodollar Term, 4.95%, 11/21/2007 | | 812 | | 43 | | 2,126 | | 3,682 | |
Bank of Nova Scotia, Eurodollar Term, 5.00%, 11/26/2007 | | 812 | | 43 | | 2,126 | | 3,682 | |
Barclays, Eurodollar Term, 5.00%, 1/22/2008 | | 108 | | 6 | | 284 | | 491 | |
BNP Paribas, Eurodollar Term, 4.72%, 11/23/2007 | | 1,299 | | 69 | | 3,402 | | 5,890 | |
Calyon, Eurodollar Term, 4.88%, 11/7/2007 | | 325 | | 17 | | 851 | | 1,473 | |
Canadian Imperial Bank of Commerce, Eurodollar Term, 5.34%, 11/9/2007 | | 162 | | 9 | | 425 | | 736 | |
Credit Suisse First Boston Corp., Repurchase Agreement, 5.04%, 11/1/2007 | | 270 | | 15 | | 709 | | 1,227 | |
Dexia Group, Eurodollar Term, 5.10%, 11/14/2007 | | 812 | | 43 | | 2,126 | | 3,682 | |
Fifth Third Bancorp, Eurodollar Overnight, 4.62%, 11/1/2007 | | 162 | | 9 | | 425 | | 736 | |
Lloyds TSB Bank, Eurodollar Term, 4.90%, 11/9/2007 | | 1,082 | | 58 | | 2,835 | | 4,909 | |
Merrill Lynch & Co. (RPG), Repurchase Agreement, 4.82%, 11/1/2007 | | 920 | | 49 | | 2,410 | | 4,172 | |
Morgan Stanley & Co. (Gvt Repo), Repurchase Agreement, 4.82%, 11/1/2007 | | 920 | | 49 | | 2,410 | | 4,172 | |
Rabobank Nederland, Eurodollar Term, 4.82%, 11/15/2007 | | 812 | | 43 | | 2,126 | | 3,682 | |
Reserve Primary Money Market Fund, Money Market Fund, 5.09%,11/1/2007 | | 325 | | 17 | | 851 | | 1,473 | |
Royal Bank of Canada, Eurodollar Term, 4.95%, 11/16/2007 | | 108 | | 6 | | 284 | | 491 | |
Royal Bank of Scotland, Eurodollar Term, 5.33%, 1/22/2008 | | 974 | | 52 | | 2,552 | | 4,418 | |
Societe Generale, Eurodollar Term, 5.05%, 11/1/2007 | | 595 | | 32 | | 1,559 | | 2,700 | |
Svenska Handlesbanken, Eurodollar Overnight, 4.84%, 11/1/2007 | | 702 | | 38 | | 1,838 | | 3,182 | |
Toronto Dominion Bank, Eurodollar Term, 4.88%, 11/6/2007 | | 325 | | 17 | | 851 | | 1,473 | |
UBS AG, Eurodollar Term, 5.36%, 11/8/2007 | | 54 | | 3 | | 142 | | 245 | |
| | | | | | | | | |
| | $ | 11,795 | | $ | 630 | | $ | 30,899 | | $ | 53,498 | |
169
| | | | | | TA IDEX | | TA IDEX | |
| | TA IDEX Marsico | | TA IDEX Neuberger | | Oppenheimer | | Oppenheimer Small- | |
| | International Growth | | Berman International | | Developing Markets | | & Mid-Cap Value | |
| | | | | | | | | |
Abbey National PLC, Eurodollar Term, 4.85%, 11/8/2007 | | $ | 268 | | $ | 693 | | $ | 363 | | $ | 582 | |
ABN AMRO Bank NV, Eurodollar Term, 4.95%, 11/21/2007 | | 1,006 | | 2,597 | | 1,361 | | 2,181 | |
Bank of Nova Scotia, Eurodollar Term, 5.00%, 11/26/2007 | | 1,006 | | 2,597 | | 1,361 | | 2,181 | |
Barclays, Eurodollar Term, 5.00%, 1/22/2008 | | 134 | | 346 | | 182 | | 291 | |
BNP Paribas, Eurodollar Term, 4.72%, 11/23/2007 | | 1,610 | | 4,156 | | 2,178 | | 3,489 | |
Calyon, Eurodollar Term, 4.88%, 11/7/2007 | | 403 | | 1,039 | | 544 | | 872 | |
Canadian Imperial Bank of Commerce, Eurodollar Term, 5.34%, 11/9/2007 | | 201 | | 519 | | 272 | | 436 | |
Credit Suisse First Boston Corp., Repurchase Agreement, 5.04%, 11/1/2007 | | 336 | | 866 | | 454 | | 727 | |
Dexia Group, Eurodollar Term, 5.10%, 11/14/2007 | | 1,006 | | 2,597 | | 1,361 | | 2,181 | |
Fifth Third Bancorp, Eurodollar Overnight, 4.62%, 11/1/2007 | | 201 | | 519 | | 272 | | 436 | |
Lloyds TSB Bank, Eurodollar Term, 4.90%, 11/9/2007 | | 1,342 | | 3,463 | | 1,815 | | 2,908 | |
Merrill Lynch & Co. (RPG), Repurchase Agreement, 4.82%, 11/1/2007 | | 1,141 | | 2,944 | | 1,542 | | 2,471 | |
Morgan Stanley & Co. (Gvt Repo), Repurchase Agreement, 4.82%, 11/1/2007 | | 1,141 | | 2,944 | | 1,542 | | 2,471 | |
Rabobank Nederland, Eurodollar Term, 4.82%, 11/15/2007 | | 1,006 | | 2,597 | | 1,361 | | 2,181 | |
Reserve Primary Money Market Fund, Money Market Fund, 5.09%,11/1/2007 | | 403 | | 1,039 | | 544 | | 872 | |
Royal Bank of Canada, Eurodollar Term, 4.95%, 11/16/2007 | | 134 | | 346 | | 182 | | 291 | |
Royal Bank of Scotland, Eurodollar Term, 5.33%, 1/22/2008 | | 1,208 | | 3,117 | | 1,633 | | 2,617 | |
Societe Generale, Eurodollar Term, 5.05%, 11/1/2007 | | 738 | | 1,905 | | 998 | | 1,599 | |
Svenska Handlesbanken, Eurodollar Overnight, 4.84%, 11/1/2007 | | 870 | | 2,245 | | 1,176 | | 1,885 | |
Toronto Dominion Bank, Eurodollar Term, 4.88%, 11/6/2007 | | 403 | | 1,039 | | 544 | | 872 | |
UBS AG, Eurodollar Term, 5.36%, 11/8/2007 | | 67 | | 173 | | 91 | | 145 | |
| | | | | | | | | |
| | $ | 14,624 | | $ | 37,741 | | $ | 19,776 | | $ | 31,688 | |
| | | | | | | | TA IDEX Van | |
| | TA IDEX Third | | TA IDEX UBS | | TA IDEX UBS Large | | Kampen Mid-Cap | |
| | Avenue Value | | Dynamic Alpha | | Cap Value | | Growth | |
| | | | | | | | | |
Abbey National PLC, Eurodollar Term, 4.85%, 11/8/2007 | | $ | 1,863 | | $ | 248 | | $ | 611 | | $ | 421 | |
ABN AMRO Bank NV, Eurodollar Term, 4.95%, 11/21/2007 | | 6,985 | | 931 | | 2,291 | | 1,579 | |
Bank of Nova Scotia, Eurodollar Term, 5.00%, 11/26/2007 | | 6,985 | | 931 | | 2,291 | | 1,579 | |
Barclays, Eurodollar Term, 5.00%, 1/22/2008 | | 931 | | 124 | | 305 | | 211 | |
BNP Paribas, Eurodollar Term, 4.72%, 11/23/2007 | | 11,176 | | 1,490 | | 3,666 | | 2,527 | |
Calyon, Eurodollar Term, 4.88%, 11/7/2007 | | 2,794 | | 373 | | 916 | | 632 | |
Canadian Imperial Bank of Commerce, Eurodollar Term, 5.34%, 11/9/2007 | | 1,397 | | 186 | | 458 | | 316 | |
Credit Suisse First Boston Corp., Repurchase Agreement, 5.04%, 11/1/2007 | | 2,328 | | 310 | | 764 | | 527 | |
Dexia Group, Eurodollar Term, 5.10%, 11/14/2007 | | 6,985 | | 931 | | 2,291 | | 1,579 | |
Fifth Third Bancorp, Eurodollar Overnight, 4.62%, 11/1/2007 | | 1,397 | | 186 | | 458 | | 316 | |
Lloyds TSB Bank, Eurodollar Term, 4.90%, 11/9/2007 | | 9,313 | | 1,242 | | 3,055 | | 2,106 | |
Merrill Lynch & Co. (RPG), Repurchase Agreement, 4.82%, 11/1/2007 | | 7,916 | | 1,055 | | 2,597 | | 1,790 | |
Morgan Stanley & Co. (Gvt Repo), Repurchase Agreement, 4.82%, 11/1/2007 | | 7,916 | | 1,055 | | 2,597 | | 1,790 | |
Rabobank Nederland, Eurodollar Term, 4.82%, 11/15/2007 | | 6,985 | | 931 | | 2,291 | | 1,579 | |
Reserve Primary Money Market Fund, Money Market Fund, 5.09%,11/1/2007 | | 2,794 | | 373 | | 916 | | 632 | |
Royal Bank of Canada, Eurodollar Term, 4.95%, 11/16/2007 | | 931 | | 124 | | 305 | | 211 | |
Royal Bank of Scotland, Eurodollar Term, 5.33%, 1/22/2008 | | 8,382 | | 1,117 | | 2,749 | | 1,895 | |
Societe Generale, Eurodollar Term, 5.05%, 11/1/2007 | | 5,122 | | 683 | | 1,680 | | 1,158 | |
Svenska Handlesbanken, Eurodollar Overnight, 4.84%, 11/1/2007 | | 6,038 | | 805 | | 1,981 | | 1,365 | |
Toronto Dominion Bank, Eurodollar Term, 4.88%, 11/6/2007 | | 2,794 | | 373 | | 916 | | 632 | |
UBS AG, Eurodollar Term, 5.36%, 11/8/2007 | | 466 | | 62 | | 153 | | 105 | |
| | | | | | | | | |
| | $ | 101,498 | | $ | 13,530 | | $ | 33,291 | | $ | 22,950 | |
170
| | TA IDEX Van | |
| | Kampen Small | |
| | Company Growth | |
| | | |
Abbey National PLC, Eurodollar Term, 4.85%, 11/8/2007 | | $ | 874 | |
ABN AMRO Bank NV, Eurodollar Term, 4.95%, 11/21/2007 | | 3,278 | |
Bank of Nova Scotia, Eurodollar Term, 5.00%, 11/26/2007 | | 3,278 | |
Barclays, Eurodollar Term, 5.00%, 1/22/2008 | | 437 | |
BNP Paribas, Eurodollar Term, 4.72%, 11/23/2007 | | 5,245 | |
Calyon, Eurodollar Term, 4.88%, 11/7/2007 | | 1,311 | |
Canadian Imperial Bank of Commerce, Eurodollar Term, 5.34%, 11/9/2007 | | 656 | |
Credit Suisse First Boston Corp., Repurchase Agreement, 5.04%, 11/1/2007 | | 1,093 | |
Dexia Group, Eurodollar Term, 5.10%, 11/14/2007 | | 3,278 | |
Fifth Third Bancorp, Eurodollar Overnight, 4.62%, 11/1/2007 | | 656 | |
Lloyds TSB Bank, Eurodollar Term, 4.90%, 11/9/2007 | | 4,371 | |
Merrill Lynch & Co. (RPG), Repurchase Agreement, 4.82%, 11/1/2007 | | 3,716 | |
Morgan Stanley & Co. (Gvt Repo), Repurchase Agreement, 4.82%, 11/1/2007 | | 3,716 | |
Rabobank Nederland, Eurodollar Term, 4.82%, 11/15/2007 | | 3,278 | |
Reserve Primary Money Market Fund, Money Market Fund, 5.09%,11/1/2007 | | 1,312 | |
Royal Bank of Canada, Eurodollar Term, 4.95%, 11/16/2007 | | 437 | |
Royal Bank of Scotland, Eurodollar Term, 5.33%, 1/22/2008 | | 3,934 | |
Societe Generale, Eurodollar Term, 5.05%, 11/1/2007 | | 2,404 | |
Svenska Handlesbanken, Eurodollar Overnight, 4.84%, 11/1/2007 | | 2,834 | |
Toronto Dominion Bank, Eurodollar Term, 4.88%, 11/6/2007 | | 1,311 | |
UBS AG, Eurodollar Term, 5.36%, 11/8/2007 | | 219 | |
| | | |
| | $ | 47,638 | |
Income from loaned securities on the Statements of Operations is net of fees, earned by State Street for its services, in the following amounts:
Fund | | Fees | |
TA IDEX AllianceBernstein International Value | | $ | 10 | |
TA IDEX Bjurman, Barry Micro Emerging Growth | | 27 | |
TA IDEX BlackRock Global Allocation | | — | |
TA IDEX BlackRock Large Cap Value | | 16 | |
TA IDEX BlackRock Natural Resources | | 13 | |
TA IDEX Evergreen International Small Cap | | 44 | |
TA IDEX Federated Market Opportunity | | 3 | |
TA IDEX JPMorgan International Bond | | — | |
TA IDEX JPMorgan Mid Cap Value | | 20 | |
TA IDEX Loomis Sayles Bond | | 25 | |
TA IDEX Marsico International Growth | | 36 | |
TA IDEX Mellon Market Neutral Strategy | | — | |
TA IDEX Neuberger Berman International | | 49 | |
TA IDEX Oppenheimer Developing Markets | | 21 | |
TA IDEX Oppenheimer Small- & Mid-Cap Value | | 22 | |
TA IDEX Third Avenue Value | | 120 | |
TA IDEX Transamerica Short-Term Bond | | 7 | |
TA IDEX UBS Dynamic Alpha | | 25 | |
TA IDEX UBS Large Cap Value | | 16 | |
TA IDEX Van Kampen Emerging Markets Debt | | — | |
TA IDEX Van Kampen Mid-Cap Growth | | 24 | |
TA IDEX Van Kampen Small Company Growth | | 488 | |
| | | | |
Real Estate Investment Trusts (“REITs”): There are certain additional risks involved in investing in REITs. These include, but are not limited to, economic conditions, changes in zoning laws, real estate values, property taxes and interest rates.
Dividend income is recorded at management’s estimate of the income included in distributions from the REIT investments.
Distributions received in excess of the estimated amount are recorded as a reduction of the cost of investments. The actual amounts of income, return of capital and capital gains are only determined by each REIT after the fiscal year end and may differ from the estimated amounts.
Loan participations/ assignments: The Funds may purchase participations/ assignments in commercial loans. Such indebtedness may be secured or unsecured. These investments may include standby financing commitments, including revolving credit facilities that obligate the Funds to supply additional cash to the borrowers on demand. Loan participations/ assignments involve risks of insolvency of the lending banks or other financial intermediaries. As such, the Funds assume the credit risks associated with the corporate borrowers and may assume the credit risks associated with the interposed banks or other financial intermediaries. The Funds may be contractually obligated to receive approval from the agent banks and/or borrowers prior to the sale of these investments. Loan participations typically represent direct participation in loans to corporate borrowers, and generally are offered by banks or other financial institutions or lending syndicates. The Funds may participate in such syndications, or can buy a portion of the loans, becoming part lenders. Loans are often administered by agent banks acting as agents for all holders. The agent banks administer the terms of the loans, as specified in the loan agreements. In addition, the agent banks are normally responsible for the collection of principal and interest payments from the corporate borrowers and the apportionment of these payments to the credit of all institutions that are parties to the loan agreements. Unless, under the terms of the loans or other indebtedness, the portfolios have direct recourse against the corporate borrowers, the Funds may have
171
to rely on the agent banks or other financial intermediaries to apply appropriate credit remedies against corporate borrowers.
Security transactions and investment income: Security transactions are recorded on the trade date. Security gains and losses are calculated on the specific identification basis. Dividend income, if any, is recorded on the ex-dividend dates or, in the case of foreign securities, as soon as the Funds are informed of the ex-dividend dates. Interest income, including accretion of discounts and amortization of premiums, is recorded on the accrual basis commencing on the settlement date.
Foreign currency denominated investments: The accounting records of the Funds are maintained in U.S. dollars. Securities and other assets and liabilities denominated in foreign currencies are translated into U.S. dollars at the closing exchange rate each day. The cost of foreign securities is translated at the exchange rate in effect when the investments were acquired. Each Fund combines fluctuations from currency exchange rates and fluctuations in value when computing net realized and unrealized gains or losses from investments.
Net foreign currency gains and losses resulting from changes in exchange rates include: 1) foreign currency fluctuations between trade date and settlement date of investment security transactions; 2) gains and losses on forward foreign currency contracts; and 3) the difference between the receivable amounts of interest and dividends recorded in the accounting records in U.S. dollars and the amounts actually received.
Foreign currency denominated assets may involve risks not typically associated with domestic transactions. These risks include revaluation of currencies, adverse fluctuations in foreign currency values and possible adverse political, social and economic developments, including those particular to a specific industry, country or region.
Foreign capital gains taxes: The Funds may be subject to taxes imposed by countries in which they invest, with respect to their investments in issuers existing or operating in such countries. Such taxes are generally based on income earned or repatriated and capital gains realized on the sale of such investments. The Funds accrue such taxes when the related income or capital gains are earned. Some countries require governmental approval for the repatriation of investment income, capital or the proceeds of sales earned by foreign investors. In addition, if there is deterioration in a country’s balance of payments or for other reasons, a country may impose temporary restrictions on foreign capital remittances abroad.
Forward foreign currency contracts: The Funds may enter into forward foreign currency contracts to hedge against exchange rate risk arising from investments in securities denominated in foreign currencies. Contracts are valued at the contractual forward rate and are marked to market daily, with the change in value recorded as an unrealized gain or loss. When the contracts are settled a realized gain or loss is incurred. Risks may arise from changes in market value of the underlying currencies and from the possible inability of counterparties to meet the terms of their contracts.
Open forward currency contracts at October 31, 2007 are listed in the Schedules of Investments.
Futures contracts: The Funds may enter into futures contracts to manage exposure to market, interest rate or currency fluctuations. Futures contracts are valued at the settlement price established each day by the board of trade or exchange on which they are traded. The primary risks associated with futures contracts are imperfect correlation between the change in market value of the securities held and the prices of futures contracts; the possibility of an illiquid market and inability of the counterparty to meet the contract terms.
Open futures contracts at October 31, 2007 are listed in the Schedules of Investments.
Option contracts: The Funds may enter into option contracts to manage exposure to market fluctuations. Options are valued at the average of the bid and ask (“Mean Quote”) established each day at the close of the board of trade or exchange on which they are traded. The primary risks associated with options are an imperfect correlation between the change in value of the securities held and the prices of the option contracts; the possibility of an illiquid market and an inability of the counterparty to meet the contract terms. When a Fund writes a covered call or put option, an amount equal to the premium received by a Fund is included in the Fund’s Statement of Assets and Liabilities as an asset and as an equivalent liability. Options are marked-to-market daily to reflect the current value of the option written.
The underlying face amounts of open option contracts at October 31, 2007 are listed in the Schedules of Investments.
Transactions in written call and put options were as follows:
TA IDEX BlackRock Global Allocation | | Premium | | Contracts * | |
| | | | | |
Balance at October 31, 2006 | | $ | 1,080 | | 4,261 | |
Sales | | 3,386 | | 6,891 | |
Closing Buys | | (1,528 | ) | (2,783 | ) |
Expirations | | (166 | ) | (1,435 | ) |
Exercised | | (277 | ) | (805 | ) |
Balance at October 31, 2007 | | $ | 2,496 | | 6,129 | |
TA IDEX Van Kampen Emerging
Markets Debt | | Premium | | Contracts * | |
Balance at October 31, 2006 | | $ | — | | — | |
Sales | | 3,314 | | 135,434,015 | |
Closing Buys | | (3,314 | ) | (135,434,015 | ) |
Expirations | | — | | — | |
Exercised | | — | | — | |
Balance at October 31, 2007 | | $ | — | | — | |
* Contracts not in thousands.
172
Dividend distributions: Distributions to shareholders are recorded on the ex-dividend dates and are determined in accordance with federal income tax regulations which may differ from GAAP.
NOTE 2. RELATED PARTY TRANSACTIONS
Transamerica Fund Advisors, Inc. (“TFAI”) is the Funds’ investment adviser. Transamerica Fund Services, Inc. (“TFS”) is the Funds’ administrator and transfer agent. AFSG Securities Corp. (“AFSG”) was the Funds’ distributor/principal underwriter. Effective May 1, 2007, Transamerica Capital Inc. (“TCI”) is the Funds’ distributor/principal underwriter.
TFAI, TFS, and TCI are affiliates of AEGON, NV, a Netherlands corporation. 100% of the Funds’ assets are owned by affiliated investment companies.
Investment advisory fees: The Funds pay management fees to TFAI based on average daily net assets (“ANA”) at the following breakpoints:
Fund | | Breakpoints |
TA IDEX AllianceBernstein | | 0.88% of the first $200 million of ANA |
International Value | | 0.81% of the next $300 million of ANA |
| | 0.77% of ANA over $500 million |
| | |
TA IDEX Bjurman, Barry Micro Emerging Growth | | 1.05% of the first $250 million of ANA |
| | 1.00% of the next $250 million of ANA |
| | 0.975% of ANA over $500 million |
| | |
TA IDEX BlackRock Global | | 0.80% of the first $100 million of ANA |
Allocation | | 0.72% of ANA over $100 million |
| | |
TA IDEX BlackRock Large Cap | | 0.80% of the first $250 million of ANA |
Value | | 0.775% of the next $500 million of ANA |
| | 0.75% of ANA over $750 million |
| | |
TA IDEX BlackRock Natural | | 0.80% of the first $250 million of ANA |
Resources | | 0.775% of the next $250 million of ANA |
| | 0.75% of ANA over $500 million |
| | |
TA IDEX Evergreen International | | 1.07% of the first $250 million of ANA |
Small Cap | | 1.00% of ANA over $250 million |
| | |
TA IDEX Federated Market | | 0.85% of the first $30 million of ANA |
Opportunity | | 0.80% of the next $20 million of ANA |
| | 0.70% of ANA over $50 million |
| | |
TA IDEX JPMorgan International | | 0.55% of the first $100 million of ANA |
Bond | | 0.52% of the next $150 million of ANA |
| | 0.51% of the next $250 million of ANA |
| | 0.50% of the next $500 million of ANA |
| | 0.47% of ANA over $1 billion |
Fund | | Breakpoints |
TA IDEX JPMorgan Mid Cap Value | | 0.85% of the first $100 million of ANA |
| | 0.80% of ANA over $100 million |
| | |
TA IDEX Loomis Sayles Bond | | 0.675% of the first $200 million of ANA |
| | 0.625% of the next $550 million of ANA |
| | 0.60% of ANA over $750 million |
| | |
TA IDEX Marsico International | | 1.06% of the first $300 million of ANA |
Growth | | 1.01% of the next $100 million of ANA |
| | 0.96% of the next $600 million of ANA |
| | 0.91% of ANA over $1 billion |
| | |
TA IDEX Mellon Market Neutral | | 1.40% of ANA |
Strategy | | |
| | |
TA IDEX Neuberger Berman | | 1.00% of the first $100 million of ANA |
International | | 0.95% of ANA over $100 million |
| | |
TA IDEX Oppenheimer Developing | | 1.20% of the first $50 million of ANA |
Markets | | 1.15% of the next $150 million of ANA |
| | 1.10% of ANA over $200 million |
| | |
TA IDEX Oppenheimer Small- & | | 0.95% of the first $100 million of ANA |
Mid-Cap Value | | 0.90% of the next $150 million of ANA |
| | 0.85% of the next $250 million of ANA |
| | 0.825% of ANA over $500 million |
| | |
TA IDEX Third Avenue Value | | 0.80% of ANA |
| | |
TA IDEX Transamerica Short-Term | | 0.65% of the first $250 million of ANA |
Bond | | 0.60% of the next $250 million of ANA |
| | 0.575% of the next $500 million of ANA |
| | 0.55% of ANA over $1 billion |
| | |
TA IDEX UBS Dynamic Alpha | | 1.40% of the first $150 million of ANA |
| | 1.30% of the next $150 million of ANA |
| | 1.20% of ANA over $300 million |
| | |
TA IDEX UBS Large Cap Value | | 0.82% of the first $200 million of ANA |
| | 0.76% of the next $200 million of ANA |
| | 0.74% of the next $350 million of ANA |
| | 0.71% of the next $250 million of ANA |
| | 0.67% of the next $500 million of ANA |
| | 0.62% of ANA over $1.5 billion |
| | |
TA IDEX Van Kampen Emerging | | From November 1, 2006 to December 31, 2006: |
Markets Debt | | 0.95% of the first $250 million of ANA |
| | 0.90% of the next $250 million of ANA |
| | 0.80% of ANA over $500 million |
| | From January 1, 2007 on: |
| | 0.95% of the first $250 million of ANA |
| | 0.85% of the next $250 million of ANA |
| | 0.80% of ANA over $500 million |
| | |
TA IDEX Van Kampen Mid-Cap | | From November 1, 2006 to December 31, 2006: |
Growth | | 0.80% of ANA |
| | From January 1, 2007 on: |
| | 0.80% of the first $1 billion of ANA |
| | 0.775% of ANA over $1 billion |
| | |
TA IDEX Van Kampen Small Company Growth | | 0.95% of the first $500 million of ANA |
| | 0.85% of ANA over $500 million |
173
TFAI has contractually agreed to waive its advisory fee and will reimburse each Fund to the extent that operating expenses, excluding dividend expense on short sales, exceed the following stated annual limit:
Fund | | Expense Limit | |
TA IDEX AllianceBernstein International Value | | 1.13 | % |
TA IDEX Bjurman, Barry Micro Emerging Growth* | | 1.25 | |
TA IDEX BlackRock Global Allocation | | 1.00 | |
TA IDEX BlackRock Large Cap Value* | | 1.00 | |
TA IDEX BlackRock Natural Resources* | | 1.00 | |
TA IDEX Evergreen International Small Cap* | | 1.32 | |
TA IDEX Federated Market Opportunity | | 1.05 | |
TA IDEX JPMorgan International Bond | | 0.75 | |
TA IDEX JPMorgan Mid Cap Value* | | 1.05 | |
TA IDEX Loomis Sayles Bond* | | 0.88 | |
TA IDEX Marsico International Growth* | | 1.31 | |
TA IDEX Mellon Market Neutral Strategy* | | 1.65 | |
TA IDEX Neuberger Berman International | | 1.25 | |
TA IDEX Oppenheimer Developing Markets | | 1.45 | |
TA IDEX Oppenheimer Small- & Mid-Cap Value* | | 1.15 | |
TA IDEX Third Avenue Value* | | 1.00 | |
TA IDEX Transamerica Short -Term Bond* | | 0.85 | |
TA IDEX UBS Dynamic Alpha* | | 1.65 | |
TA IDEX UBS Large Cap Value* | | 1.02 | |
TA IDEX Van Kampen Emerging Markets Debt* | | 1.15 | |
TA IDEX Van Kampen Mid-Cap Growth | | 1.00 | |
TA IDEX Van Kampen Small Company Growth* | | 1.15 | |
*If total Fund expenses fall below the annual expense limitation agreement agreed to by the adviser within the succeeding three years, the Funds may be required to pay the adviser a portion or all of the reimbursed class expenses.
For the year ended October 31, 2007, the following Funds recaptured previously waived expenses:
TA IDEX Bjurman, Barry Micro Emerging Growth | | $ | 11 | |
TA IDEX Oppenheimer Small & Mid-Cap Value | | $ | 13 | |
There are no amounts available for recapture at October 31, 2007.
Administrative services: The Funds have entered into agreements with TFS for financial and legal fund administration services. Each Fund pays TFS an annual fee of 0.02% of ANA. The Legal fees on the Statements of Operations are fees paid to external legal counsel.
Transfer agent fees: Each Fund pays TFS an annual per-account charge for each open and closed account. For the period from inception through October 31, 2007 and the year ended October 31, 2007, as applicable, TFS retained the following amounts of the Funds’ transfer agent fees.
Fund | | Fees |
TA IDEX Evergreen International Small Cap | | Less than $1 |
TA IDEX Marsico International Growth | | Less than $1 |
TA IDEX Transamerica Short-Term Bond | | Less than $1 |
TA IDEX UBS Large Cap Value | | Less than $1 |
TA IDEX Van Kampen Emerging Markets Debt | | Less than $1 |
TA IDEX Van Kampen Mid-Cap Growth | | Less than $1 |
TA IDEX Van Kampen Small Company Growth | | Less than $1 |
Funds not listed in the above table did not incur transfer agency fees.
Retirement plan: Under a retirement plan (the “Emeritus Plan”) available to the Independent Trustees, each Independent Trustee is deemed to have elected to serve as Trustee Emeritus of Transamerica IDEX upon his or her termination of service, other than removal for cause, for a maximum period of five years determined by his or her years of service as a Trustee.
The amounts shall be accrued by Transamerica IDEX on a pro rata basis allocable to each Transamerica IDEX fund based on the relative assets of the Funds. If retainers increase in the future, past accruals (and credits) will be adjusted upwards so that 50% of the Trustee’s current retainer is accrued and credited at all times. Upon death, disability or termination of service, other than removal for cause, amounts deferred become payable to an Emeritus Trustee (or his/her beneficiary). Upon the commencement of service as Trustee Emeritus, compensation will be paid on a quarterly basis during the time period that the Trustee Emeritus is allowed to serve as such.
For the year ended October 31, 2007, the amounts related to the Emeritus Plan were as follows:
Fund | | Emeritus Fee
Due | |
TA IDEX AllianceBernstein International Value | | $ | 13 | |
TA IDEX Bjurman, Barry Micro Emerging Growth | | 1 | |
TA IDEX BlackRock Global Allocation | | 18 | |
TA IDEX BlackRock Large Cap Value | | 25 | |
TA IDEX BlackRock Natural Resources | | — | |
TA IDEX Evergreen International Small Cap | | 23 | |
TA IDEX Federated Market Opportunity | | 4 | |
TA IDEX JPMorgan International Bond | | 22 | |
TA IDEX JPMorgan Mid Cap Value | | 13 | |
TA IDEX Loomis Sayles Bond | | — | |
TA IDEX Marsico International Growth | | 21 | |
TA IDEX Mellon Market Neutral Strategy | | — | |
TA IDEX Neuberger Berman International | | 23 | |
TA IDEX Oppenheimer Developing Markets | | 17 | |
TA IDEX Oppenheimer Small- & Mid-Cap Value | | 4 | |
TA IDEX Third Avenue Value | | — | |
TA IDEX Transamerica Short-Term Bond | | 16 | |
TA IDEX UBS Dynamic Alpha | | — | |
TA IDEX UBS Large Cap Value | | 11 | |
TA IDEX Van Kampen Emerging Markets Debt | | 19 | |
TA IDEX Van Kampen Mid-Cap Growth | | 3 | |
TA IDEX Van Kampen Small Company Growth | | 15 | |
| | | | |
As of October 31, 2007, the Funds had not made any payments related to the Emeritus Plan. Amounts deferred and accrued under the Deferred Compensation and Emeritus Plans are unfunded and unsecured claims against the general assets of Transamerica IDEX.
The Emeritus Plan was terminated effective October 30, 2007. Upon the termination, the Fund shall continue to pay any remaining benefits in accordance with the Plan, but no further compensation shall accrue under the Plan.
174
Brokerage commissions: Brokerage commissions incurred on security transactions placed with affiliates of the advisers for the year ended October 31, 2007 were the following:
Fund | | Brokerage
Commissions | |
TA IDEX BlackRock Global Allocation | | $ | 20 | |
TA IDEX BlackRock Natural Resources | | 1 | |
TA IDEX Neuberger Berman International | | 45 | |
TA IDEX Third Avenue Value | | 103 | |
TA IDEX UBS Dynamic Alpha | | 1 | |
TA IDEX UBS Large Cap Value | | 5 | |
TA IDEX Van Kampen Mid-Cap Growth | | 2 | |
TA IDEX Van Kampen Small Company Growth | | — | (a) |
| | | | |
(a) Rounds to less than $1.
NOTE 3. INVESTMENT TRANSACTIONS
The cost of securities purchased and proceeds from securities sold (excluding short-term securities) for the period from inception to October 31, 2007 and the year ended October 31, 2007, as applicable, were as follows:
| | Purchases of securities: | | Proceeds from
maturities and sales of
securities: | |
Fund | | Long-term | | U.S.
Government | | Long-term | | U.S.
Government | |
TA IDEX AllianceBernstein International Value | | $ | 215,209 | | $ | — | | $ | 151,168 | | $ | — | |
TA IDEX Bjurman, Barry Micro Emerging Growth | | 103,201 | | — | | 79,055 | | — | |
TA IDEX BlackRock Global Allocation | | 99,685 | | 25,664 | | 277,124 | | 29,485 | |
TA IDEX BlackRock Large Cap Value | | 433,463 | | — | | 387,691 | | — | |
TA IDEX BlackRock Natural Resources | | 110,165 | | — | | 7,656 | | — | |
TA IDEX Evergreen International Small Cap | | 431,639 | | — | | 406,733 | | — | |
TA IDEX Federated Market Opportunity | | 20,818 | | — | | 35,885 | | 23,715 | |
TA IDEX JPMorgan International Bond | | 571,399 | | — | | 584,771 | | — | |
TA IDEX JPMorgan Mid Cap Value | | 128,759 | | — | | 126,674 | | — | |
TA IDEX Loomis Sayles Bond | | 465,522 | | 57,322 | | 37,304 | | 6,555 | |
TA IDEX Marsico International Growth | | 617,600 | | — | | 597,954 | | — | |
TA IDEX Mellon Market Neutral Strategy | | 235,991 | | — | | 135,251 | | — | |
TA IDEX Neuberger Berman International | | 310,270 | | — | | 273,641 | | — | |
TA IDEX Oppenheimer Developing Markets | | 327,110 | | — | | 272,397 | | — | |
TA IDEX Oppenheimer Small- & Mid-Cap Value | | 215,252 | | — | | 152,697 | | — | |
TA IDEX Third Avenue Value | | 641,908 | | — | | 63,700 | | — | |
TA IDEX Transamerica Short-Term Bond | | 203,136 | | 577,427 | | 635,505 | | — | |
TA IDEX UBS Dynamic Alpha | | 254,145 | | — | | 85,447 | | — | |
TA IDEX UBS Large Cap Value | | 757,863 | | — | | 173,366 | | — | |
TA IDEX Van Kampen Emerging Markets Debt | | 244,274 | | — | | 341,207 | | — | |
TA IDEX Van Kampen Mid- Cap Growth | | 81,405 | | — | | 63,289 | | — | |
TA IDEX Van Kampen Small Company Growth | | 139,367 | | — | | 286,001 | | — | |
| | | | | | | | | | | | | |
NOTE 4. FEDERAL INCOME TAX MATTERS
The Funds have not made any provision for federal income or excise taxes due to their policy to distribute all of their taxable income and capital gains to their shareholders and otherwise qualify as regulated investment companies under Subchapter M of the Internal Revenue Code. Income and capital gain distributions are determined in accordance with income tax regulations, which may differ from GAAP. These differences are primarily due to differing treatment for items including, but not limited to, wash sales, REITS, PFICS and foreign currency transactions.
Therefore, distributions determined in accordance with tax regulations may differ significantly in amount or character from net investment income and realized gains for financial reporting purposes. Financial reporting records are adjusted for permanent book/tax differences to reflect tax character. Financial records are not adjusted for temporary differences. These reclassifications are as follows:
Fund | | Shares of
beneficial
interest,
unlimited
shares
authorized | | Undistributed
(accumulated) net
investment
income (loss) | | Undistributed
(accumulated)
net realized
gain (loss)
from
investment
securities | |
TA IDEX AllianceBernstein International Value | | $ | — | | $ | 868 | | $ | (868 | ) |
TA IDEX Bjurman, Barry Micro Emerging Growth | | (445 | ) | 436 | | 9 | |
TA IDEX BlackRock Global Allocation | | — | | 3,600 | | (3,600 | ) |
TA IDEX BlackRock Large Cap Value | | — | | — | | — | |
TA IDEX BlackRock Natural Resources | | — | | (65 | ) | 65 | |
TA IDEX Evergreen International Small Cap | | — | | (329 | ) | 329 | |
TA IDEX Federated Market Opportunity | | — | | (46 | ) | 46 | |
TA IDEX JPMorgan International Bond | | — | | 10,453 | | (10,453 | ) |
TA IDEX JPMorgan Mid Cap Value | | 5 | | 5 | | (10 | ) |
TA IDEX Loomis Sayles Bond | | — | | 151 | | (151 | ) |
TA IDEX Marsico International Growth | | — | | (202 | ) | 202 | |
TA IDEX Mellon Market Neutral Strategy | | — | | 254 | | (254 | ) |
TA IDEX Neuberger Berman International | | — | | 57 | | (57 | ) |
TA IDEX Oppenheimer Developing Markets | | — | | (363 | ) | 363 | |
TA IDEX Oppenheimer Small- & Mid-Cap Value | | — | | 26 | | (26 | ) |
TA IDEX Third Avenue Value | | — | | 313 | | (313 | ) |
TA IDEX UBS Dynamic Alpha | | — | | 328 | | (328 | ) |
TA IDEX Van Kampen Emerging Markets Debt | | — | | 5,600 | | (5,600 | ) |
TA IDEX Van Kampen Mid-Cap Growth | | — | | (136 | ) | 136 | |
TA IDEX Van Kampen Small Company Growth | | (353 | ) | 5 | | 348 | |
| | | | | | | | | | |
175
The capital loss carryfowards are available to offset future realized capital gains through the periods listed:
Fund | | Capital Loss
Carryforwards | | Available Through | |
TA IDEX Bjurman, Barry Micro Emerging Growth | | $ | 804 | | October 31, 2014 | |
TA IDEX Bjurman, Barry Micro Emerging Growth | | 2,866 | | October 31, 2015 | |
TA IDEX Federated Market Opportunity | | 3,741 | | October 31, 2014 | |
TA IDEX Federated Market Opportunity | | 2,503 | | October 31, 2015 | |
TA IDEX JPMorgan International Bond | | 2,471 | | October 31, 2014 | |
TA IDEX JPMorgan International Bond | | 5,154 | | October 31, 2015 | |
TA IDEX Loomis Sayles Bond | | 98 | | October 31, 2015 | |
TA IDEX Mellon Market Neutral Strategy | | 2,914 | | October 31, 2015 | |
TA IDEX Transamerica Short-Term Bond | | 658 | | October 31, 2013 | |
TA IDEX Transamerica Short-Term Bond | | 1,787 | | October 31, 2014 | |
TA IDEX Transamerica Short-Term Bond | | 1,304 | | October 31, 2015 | |
TA IDEX UBS Dynamic Alpha | | 15,823 | | October 31, 2015 | |
| | | | | | |
Funds not listed in the above table do not have capital loss carryforwards. The capital loss carryforwards utilized during the year ended October 31, 2007, were as follows:
Fund | | Capital Loss Carryforwards
Utilized During the Year Ended
October 31, 2007 | |
TA IDEX Van Kampen Mid-Cap Growth | | $ | 1,031 | |
| | | | |
The tax character of distributions paid may differ from the character of distributions shown in the Statements of Changes in Net Assets due to the short-term gains being treated as ordinary income for tax purposes. The tax character of distributions paid during 2006 and 2007 was as follows:
| | Distributions Paid
From: 2006 | | Distributions Paid
From: 2007 | |
| | Ordinary
Income | | Long-
term
Capital
Gain | | Ordinary
Income | | Long-
term
Capital
Gain | |
TA IDEX AllianceBernstein International Value | | $ | 144 | | $ | — | | $ | 11,180 | | $ | 373 | |
TA IDEX BlackRock Global Allocation | | 372 | | — | | 16,525 | | 674 | |
TA IDEX BlackRock Large Cap Value | | 1,026 | | — | | 5,144 | | 14,444 | |
TA IDEX Evergreen International Small Cap | | 11,435 | | 225 | | 27,958 | | 40,985 | |
TA IDEX Federated Market Opportunity | | 1,977 | | — | | 1,771 | | — | |
TA IDEX JPMorgan International Bond | | 7,991 | | — | | 25,641 | | — | |
TA IDEX JPMorgan Mid Cap Value | | 1965 | | 25 | | 8,551 | | 4,123 | |
TA IDEX Loomis Sayles Bond | | — | | — | | 7,508 | | — | |
| | | | | | | | | |
TA IDEX Marsico International Growth | | 5,663 | | 120 | | 54,846 | | 21,412 | |
TA IDEX Neuberger Berman International | | 515 | | — | | 28,404 | | — | |
TA IDEX Oppenheimer Developing Markets | | 896 | | — | | 14,303 | | — | |
TA IDEX Oppenheimer Small- & Mid-Cap Value | | — | | — | | 1,681 | | — | |
TA IDEX Transamerica Short- Term Bond | | 11,784 | | — | | 22,977 | | — | |
TA IDEX UBS Large Cap Value | | 4,495 | | — | | 2,850 | | 7,746 | |
| | | | | | | | | |
TA IDEX Van Kampen Emerging Markets Debt | | 18,922 | | 215 | | 21,767 | | 1,215 | |
TA IDEX Van Kampen Mid- Cap Growth | | — | | — | | 138 | | — | |
TA IDEX Van Kampen Small Company Growth | | 3,302 | | — | | 6,744 | | 4,764 | |
| | | | | | | | | | | | | |
The tax basis components of distributable earnings as of October 31, 2007 were as follows:
Fund | | Undistributed
Ordinary
Income | | Undistributed
Long-term
Capital Gain | | Total Capital
Loss
Carryforward | | Other
Temporary
Differences | | Net*
Unrealized
Appreciation
(Depreciation) | |
TA IDEX AllianceBernstein International Value | | $ | 15,049 | | $ | 25,977 | | $ | — | | $ | — | | $ | 84,394 | |
TA IDEX Bjurman, Barry Micro Emerging Growth | | — | | — | | (3,670 | ) | — | | 20,575 | |
TA IDEX BlackRock Global Allocation | | 18,354 | | 17,141 | | — | | (35 | ) | 81,653 | |
TA IDEX BlackRock Large Cap Value | | 3,918 | | 34,018 | | — | | — | | 92,425 | |
TA IDEX BlackRock Natural Resources | | 1,978 | | 3 | | — | | — | | 41,900 | |
TA IDEX Evergreen International Small Cap | | 24,067 | | 48,654 | | — | | — | | 153,807 | |
TA IDEX Federated Market Opportunity | | 68 | | — | | (6,244 | ) | — | | 1038 | |
TA IDEX JPMorgan International Bond | | 11,652 | | — | | (7,625 | ) | — | | 44,911 | |
TA IDEX JPMorgan Mid Cap Value | | 2,210 | | 13,316 | | — | | — | | 36,138 | |
TA IDEX Loomis Sayles Bond | | 3,758 | | — | | (98 | ) | — | | 5,305 | |
TA IDEX Marsico International Growth | | 21,110 | | 45,615 | | — | | — | | 144,121 | |
TA IDEX Mellon Market Neutral Strategy | | 2,634 | | — | | (2,919 | ) | — | | (2,171 | ) |
| | | | | | | | | | | | | | | | |
176
TA IDEX Neuberger Berman International | | 10,663 | | 41,934 | | — | | — | | 83,582 | |
TA IDEX Oppenheimer Developing Markets | | 15,286 | | 41,191 | | — | | — | | 193,298 | |
TA IDEX Oppenheimer Small- & Mid- Cap Value | | 8,719 | | 4,554 | | — | | — | | 16,453 | |
| | | | | | | | | | | |
TA IDEX Third Avenue Value | | 18,213 | | — | | — | | — | | 2,980 | |
TA IDEX Transamerica Short-Term Bond | | 1,571 | | — | | (3,749 | ) | — | | (1,191 | ) |
TA IDEX UBS Dynamic Alpha | | 2,026 | | — | | (15,823 | ) | — | | 10,324 | |
TA IDEX UBS Large Cap Value | | 9,905 | | 9,206 | | — | | — | | 81,180 | |
TA IDEX Van Kampen Emerging Markets Debt | | 9,728 | | 6,945 | | — | | (14 | ) | 12,716 | |
TA IDEX Van Kampen Mid- Cap Growth | | 3,239 | | 4,460 | | — | | — | | 22,491 | |
TA IDEX Van Kampen Small Company Growth | | 2,157 | | 15,799 | | — | | — | | 34,214 | |
*Amounts include unrealized gain/loss from foreign currency and derivative instruments, if applicable.
NOTE 5. REGULATORY PROCEEDINGS
There continues to be significant federal and state regulatory activity relating to financial services companies, particularly mutual fund companies and their investment advisers. As part of an ongoing investigation regarding potential market timing, recordkeeping and trading compliance issues and matters affecting the Funds’ investment adviser, TFAI, and certain affiliates and former employees of TFAI, the SEC staff has indicated that it is likely to take some action against TFAI and certain of its affiliates at the conclusion of the investigation. The potential timing and the scope of any such action is difficult to predict. Although the impact of any action brought against TFAI and/or its affiliates is difficult to assess at the present time, the Funds currently believe that the likelihood that any such action will have a material adverse impact is remote. It is important to note that the Funds are not aware of any allegation of wrongdoing against them and their Board at the time this annual report is printed. Although it is not anticipated that these developments will have an adverse impact on the Funds, there can be no assurance at this time. TFAI and its affiliates are actively working with the SEC in regard to this matter; however, the exact resolution cannot be determined at this time. TFAI will take such actions that it deems necessary or appropriate to continue providing management services to the Funds and to bring all matters to an appropriate conclusion.
TFAI and/or its affiliates, and not the Funds, will bear the costs regarding these regulatory matters.
NOTE 6. RECENTLY ISSUED ACCOUNTING PRONOUCEMENTS
In July 2006, the Financial Accounting Standards Board (“FASB”) released FASB Interpretation No. 48, “Accounting for Uncertainty in Income Taxes (“FIN 48”), an interpretation of FASB Statement No. 109”. FIN 48 provides guidance for how uncertain tax positions should be recognized, measured, presented and disclosed in the financial statements. FIN 48 requires the accounting and disclosure of tax positions taken or expected to be taken in the course of preparing the Funds’ tax returns to determine where the tax positions are “more-likely- than-not” of being sustained by the applicable tax authority. Tax positions not deemed to meet the more-likely-than-not threshold would be recorded as a tax benefit or expense in the current year. Adoption of FIN 48 is effective during the first required financial reporting period for fiscal years beginning after December 15, 2006.
Implementation of FIN 48 requires Management of the Funds to analyze all open tax years, as defined by the Statute of Limitations, for all major jurisdictions, which includes federal and certain states. Open tax years are those that are open for exam by taxing authorities (i.e., the last 4 tax year ends and the interim tax period since then). The Funds have no examinations in progress and none are expected at this time.
As of September 28, 2007, Management of the Funds have reviewed all open tax years and major jurisdictions and concluded the adoption of FIN 48 resulted in no impact the Funds’ net assets or results of operations. There is no tax liability resulting from unrecognized tax benefits relating to uncertain income tax positions taken or expected to be taken in future tax returns. The Funds are also not aware of any tax positions for which it is reasonably possible that the total amounts of unrecognized tax benefits will significantly change in the next 12 months.
In September 2006, FASB issued its new Standard No. 157, “Fair Value Measurements” (“FAS 157”). FAS 157 is designed to unify guidance for the measurement of fair value of all types of assets, including financial instruments, and certain liabilities, throughout a number of accounting standards. FAS 157 also establishes a hierarchy for measuring fair value in generally accepted accounting principles and expands financial statement disclosures about fair value measurements that are relevant to mutual funds. FAS 157 is effective for financial statements issued for fiscal years beginning after November 15, 2007, and earlier application is permitted.
As of October 31, 2007, Management does not expect the adoption of FAS 157 to impact the amounts reported in the financial statements, however, additional disclosures will be required about the inputs used to develop the measurements of fair value and the effect of certain of the measurements reported in the statement of operations for a fiscal period.
NOTE 7. SUBSEQUENT EVENT
Effective January 1, 2008, Transamerica Fund Advisors, Inc. will change its name to Transamerica Asset Management, Inc.
177
NOTES TO FINANCIAL STATEMENTS (continued)
At October 31, 2007
(all amounts in thousands)
NOTE 8. RESTATEMENT
The TA IDEX Mellon Market Neutral Strategy and TA IDEX UBS Dynamic Alpha Fund’s previously issued financial statements presented ratios of expenses to average net assets: total and ratios of expenses to average net assets: net incorrectly for the year ended October 31, 2007. The impact of correcting the expense ratios on the TA IDEX Mellon Market Neutral Strategy Fund was to increase the ratio of expenses to average net assets. The impact of correcting the expense ratios on the TA IDEX UBS Dynamic Alpha Fund was to decrease the ratios of expenses to average net assets. This restatement had no effect on the two fund’s net assets or net asset value per share during the period.
This restatement changed the financial highlights as follows:
Financial Highlights
For the year ended October 31, 2007
TA IDEX Mellon Market Neutral Strategy
(As previously reported)
Ratio of Expenses to Average Net Assets: Net | | 1.49 | % |
Ratio of Expenses to Average Net Assets: Total | | 1.49 | % |
(As restated)
Ratio of Expenses to Average Net Assets: Net | | 1.49 | %(g) |
Ratio of Expenses to Average Net Assets: Total | | 3.05 | %(h) |
(g) Ratio of Net Expenses to Average Net Assets is exclusive of dividends on securities sold short (representing 1.56% of Average Net Assets) (see note 1).
(h) Ratio of Total Expenses to Average Net Assets is inclusive of dividends on securities sold short (representing 1.56%. of Average Net Assets)
TA IDEX UBS Dynamic Alpha
(As previously reported)
Ratio of Expenses to Average Net Assets: Net | | 2.09 | % |
Ratio of Expenses to Average Net Assets: Total | | 2.09 | % |
(As restated)
Ratio of Expenses to Average Net Assets: Net | | 1.51 | % |
Ratio of Expenses to Average Net Assets: Total | | 1.51 | % |
178
Report of Independent Registered Certified Public Accounting Firm
To the Board of Trustees and Shareholders of TA IDEX AllianceBernstein International Value, TA IDEX Bjurman, Barry Micro Emerging Growth, TA IDEX BlackRock Global Allocation, TA IDEX BlackRock Large Cap Value, TA IDEX BlackRock Natural Resources, TA IDEX Evergreen International Small Cap, TA IDEX Federated Market Opportunity, TA IDEX JPMorgan International Bond, TA IDEX JPMorgan Mid Cap Value, TA IDEX Loomis Sayles Bond, TA IDEX Marsico International Growth, TA IDEX Mellon Market Neutral Strategy, TA IDEX Neuberger Berman International, TA IDEX Oppenheimer Developing Markets, TA IDEX Oppenheimer Small- & Mid-Cap Value, TA IDEX Third Avenue Value, TA IDEX Transamerica Short-Term Bond, TA IDEX UBS Dynamic Alpha, TA IDEX UBS Large Cap Value, TA IDEX Van Kampen Emerging Markets Debt, TA IDEX Van Kampen Mid Cap Growth and TA IDEX Van Kampen Small Company Growth:
In our opinion, the accompanying statements of assets and liabilities, including the schedules of investments, and the related statements of operations and of changes in net assets and the financial highlights present fairly, in all material respects, the financial position of TA IDEX AllianceBernstein International Value, TA IDEX Bjurman, Barry Micro Emerging Growth, TA IDEX BlackRock Global Allocation, TA IDEX BlackRock Large Cap Value, TA IDEX BlackRock Natural Resources, TA IDEX Evergreen International Small Cap, TA IDEX Federated Market Opportunity, TA IDEX JPMorgan International Bond, TA IDEX JPMorgan Mid Cap Value, TA IDEX Loomis Sayles Bond, TA IDEX Marsico International Growth, TA IDEX Mellon Market Neutral Strategy, TA IDEX Neuberger Berman International, TA IDEX Oppenheimer Developing Markets, TA IDEX Oppenheimer Small- & Mid-Cap Value, TA IDEX Third Avenue Value, TA IDEX Transamerica Short-Term Bond, TA IDEX UBS Dynamic Alpha, TA IDEX UBS Large Cap Value, TA IDEX Van Kampen Emerging Markets Debt, TA IDEX Van Kampen Mid Cap Growth and TA IDEX Van Kampen Small Company Growth (individually a “Fund”, collectively the “Funds”) at October 31, 2007, and the results of each of their operations, the changes in each of their net assets and the financial highlights for each of the periods indicated, in conformity with accounting principles generally accepted in the United States of America. These financial statements and financial highlights (hereafter referred to as “financial statements”) are the responsibility of the Funds’ management; our responsibility is to express an opinion on these financial statements based on our audits. We conducted our audits of these financial statements in accordance with the standards of the Public Company Accounting Oversight Board (United States). Those standards require that we plan and perform the audit to obtain reasonable assurance about whether the financial statements are free of material misstatement. An audit includes examining, on a test basis, evidence supporting the amounts and disclosures in the financial statements, assessing the accounting principles used and significant estimates made by management, and evaluating the overall financial statement presentation. We believe that our audits, which included confirmation of securities at October 31, 2007 by correspondence with the custodian and brokers, provide a reasonable basis for our opinion.
As discussed in Note 8, the financial highlights for TA IDEX Mellon Market Neutral Strategy and TA IDEX UBS Dynamic Alpha have been restated.

Tampa, Florida
December 21, 2007 (January 25, 2008 as to the effects of the restatement discussed in Note 8)
179
INVESTMENT ADVISORY AND SUB-ADVISORY AGREEMENTS - REVIEW AND APPROVAL (unaudited)
At a meeting of the Board of Trustees of Transamerica IDEX Mutual Funds (“TA IDEX”) held on October 3rd and 4th, 2006, in approving a mandate to establish TA IDEX Third Avenue Value as a new series of TA IDEX, the Board reviewed and considered the proposed investment advisory agreement (the “Investment Advisory Agreement”) between TA IDEX Third Avenue Value (the “Fund”) and Transamerica Fund Advisors, Inc. (“TFAI”), as well as the proposed investment sub-advisory agreement (the “Sub-Advisory Agreement”) of the Fund between TFAI and Third Avenue Management LLC (the “Sub-Adviser”), to determine whether the agreements should be approved for an initial two-year period. Following their review and consideration, the Trustees determined that the proposed Investment Advisory Agreement and the proposed Sub-Advisory Agreement would enable shareholders of the Fund to obtain high quality services at a cost that is appropriate, fair, and in the best interests of its shareholders. The Board, including the independent members of the Board, unanimously approved the proposed Investment Advisory Agreement and Sub-Advisory Agreement. In reaching their decision, the Trustees requested and obtained from TFAI and the Sub-Adviser such information as they deemed reasonably necessary to evaluate the proposed agreements, including information about fees and performance of comparable funds managed by the Sub-Adviser. In considering the proposed approval of the Investment Advisory and Sub-Advisory Agreements, the Trustees evaluated a number of considerations that they believed, in light of the legal advice furnished to them by independent legal counsel and their own business judgment, to be relevant. They based their decisions on the following considerations, among others, although they did not identify any consideration or particular information that was controlling of their decisions:
The nature, extent and quality of the advisory services to be provided. The Board considered the nature and quality of the services expected to be provided by TFAI and the Sub-Adviser. They concluded that TFAI and the Sub-Adviser are capable of providing high quality services to the Fund, as indicated by the nature and quality of services provided in the past by TFAI for other series within the fund complex and the Sub-Adviser’s management capabilities demonstrated with respect to other funds it manages and the experience, capability and integrity of TFAI’s senior management, the financial resources of TFAI and the Sub-Adviser, TFAI’s management oversight process and the professional qualifications and experience of the Sub-Adviser’s portfolio management team (the Board reviewed carefully the qualifications of the prospective managers for the Fund). The Trustees determined that TFAI and the Sub-Adviser can provide investment and related services that are appropriate in scope and extent in light of the proposed Fund’s operations, the competitive landscape of the investment company business and investor needs.
The investment performance of the Fund. The Fund was not yet in existence and therefore had no historical performance for the Board to review. However, the Board examined the performance of a fund managed by the Sub-Adviser with investment objectives and strategies comparable to those of the Fund. The Board noted that the comparable fund and other funds managed by the Sub-Adviser have generally performed well and have generated investor interest. On the basis of the Board’s assessment of the nature, extent and quality of advisory services to be provided or procured by TFAI and the Sub-Adviser, the Board concluded that TFAI and the Sub-Adviser are capable of generating a level of investment performance that is appropriate in light of the Fund’s proposed investment objectives, policies and strategies and competitive with other investment companies, and also determined that TFAI’s and the Sub-Adviser’s performance records for other funds indicate that their management of the Fund is likely to benefit the Fund and its shareholders.
The cost of advisory services provided and the level of profitability. The Fund was not yet in existence and therefore no revenue, cost or profitability data was available for the Board to review. However, the Board reviewed projected profitability information regarding TFAI’s costs of procuring portfolio management services, as well as the costs of its provision of administration, transfer agency, fund accounting and other services, to the proposed Fund and other funds within the fund complex. Based on such information and the proposed management and sub-advisory fees for the Fund, the Trustees determined that the proposed management fees of the Fund generally are consistent with industry averages and are appropriate in light of the services expected to be provided or procured, the management fees and the anticipated profitability of the relationship between the Fund, TFAI and its affiliates, and the Sub-Adviser. The Board also took note of the costs involved in establishing a new fund and acknowledged that the Fund is being added as an investment option for the asset allocation funds only and that these funds’ assets will flow into the proposed Fund. In making these observations and determinations, the Board reviewed comparative information provided by Lipper, Inc. and Strategic Insight Simfund.
Whether fee levels reflect economies of scale and the extent to which economies of scale would be realized as the Fund grows. In evaluating the extent to which the management fees payable under the new Investment Advisory and Sub-Advisory Agreements reflect economies of scale or will permit economies of scale to be realized in the future, the Board took note of TFAI’s pricing strategy and the absence of advisory and sub-advisory fee breakpoints as detailed in the materials provided to the Board. The Board concluded that the management fees appropriately reflect the Fund’s anticipated size, the current economic environment for TFAI, the competitive nature of the investment company market, and TFAI’s pricing strategy. The Board also noted that, in the future, it would have the opportunity to periodically re-examine whether the Fund has achieved economies of scale and the appropriateness of management fees payable to TFAI and fees payable by TFAI to the Sub-Adviser, and whether advisory and sub-advisory fee breakpoints would be appropriate going forward.
Benefits (such as soft dollars) to TFAI, its affiliates, or the Sub-Adviser from their relationship with the Fund. The Board concluded that other benefits anticipated to be derived by TFAI, its affiliates, and the Sub-Adviser from their relationships with the Fund, including “soft dollar” benefits (if any) in connection with brokerage transactions are expected to be reasonable and fair, and consistent with industry practice and the best interests of the Fund and its shareholders. The Trustees noted that TFAI would not realize soft dollar benefits from its relationship with the Fund, and that the Sub-Adviser would engage in soft-dollar arrangements consistent with applicable law and “best execution” requirements. In addition, the Trustees noted that the Sub-Adviser will be asked to participate in a brokerage program pursuant to which a certain portion of brokerage commissions paid by the Fund is recaptured for the benefit of the Fund and its shareholders, which could limit the amount of “soft-dollar” arrangements the Sub-Adviser may engage in with respect to the Fund’s portfolio brokerage transactions.
Other considerations. The Board considered the investment objective of the Fund and its investment strategies and determined that the Fund would enhance the investment options for the asset allocation funds. The Board determined that TFAI has made a substantial commitment to the recruitment and retention of high quality personnel, and maintains the financial, compliance and operational resources reasonably necessary to manage the Fund in a professional manner that is consistent with the best interests of the Fund and its
180
shareholders. In this regard, the Trustees favorably considered the procedures and policies in place by TFAI to enforce compliance with applicable laws and regulations and oversee the portfolio management activities of the Sub-Adviser. The Trustees also determined that TFAI has made a significant entrepreneurial commitment to the management and success of the Fund, reflected by TFAI’s expense limitation and fee waiver arrangements with the Fund which may result in TFAI waiving a substantial amount of management fees for the benefit of shareholders. In approving the Fund, the Board also considered the high quality of the Sub-Adviser’s portfolio management personnel who will manage the Fund under the Sub-Advisory Agreement, and their overall portfolio management capabilities. The Board determined that they, too, have made substantial commitments to the recruitment and retention of high quality personnel, and maintain the financial and operational resources reasonably necessary to manage the Fund.
SUPPLEMENTAL INFORMATION (unaudited)
TAX INFORMATION
For dividends paid during the year ended October 31, 2007, the Funds designated the following as qualified dividend income:
Fund | | Qualified Dividend
Income | |
| | | |
TA IDEX AllianceBernstein International Value | | $ | 11,180 | |
TA IDEX Bjurman, Barry Micro Emerging Growth | | — | |
TA IDEX BlackRock Global Allocation | | 5,526 | |
TA IDEX BlackRock Large Cap Value | | 3,749 | |
TA IDEX BlackRock Natural Resources | | — | |
TA IDEX Evergreen International Small Cap | | 10,794 | |
TA IDEX Federated Market Opportunity | | 353 | |
TA IDEX JPMorgan International Bond | | — | |
TA IDEX JPMorgan Mid Cap Value | | 2,599 | |
TA IDEX Loomis Sayles Bond | | 65 | |
TA IDEX Marsico International Growth | | 9,287 | |
TA IDEX Mellon Market Neutral Strategy | | — | |
TA IDEX Neuberger Berman International | | 11,174 | |
TA IDEX Oppenheimer Developing Markets | | 10,595 | |
TA IDEX Oppenheimer Small- & Mid-Cap Value | | 1,059 | |
TA IDEX Third Avenue Value | | — | |
TA IDEX Transamerica Short-Term Bond | | — | |
TA IDEX UBS Dynamic Alpha | | — | |
TA IDEX UBS Large Cap Value | | 2,850 | |
TA IDEX Van Kampen Emerging Markets Debt | | — | |
TA IDEX Van Kampen Mid-Cap Growth | | 138 | |
TA IDEX Van Kampen Small Company Growth | | 885 | |
| | | | |
For corporate shareholders, investment income (dividend income plus short-term gains, if any) qualifies for the dividends received deductions as follows:
Fund | | Dividend Received
Deduction Percentage | |
| | | |
TA IDEX AllianceBernstein International Value | | — | |
TA IDEX Bjurman, Barry Micro Emerging Growth | | — | |
TA IDEX BlackRock Global Allocation | | 10.18 | % |
TA IDEX BlackRock Large Cap Value | | 72.89 | % |
TA IDEX BlackRock Natural Resources | | — | |
TA IDEX Evergreen International Small Cap | | — | |
TA IDEX Federated Market Opportunity | | 5.05 | % |
TA IDEX JPMorgan International Bond | | — | |
TA IDEX JPMorgan Mid Cap Value | | 30.38 | % |
TA IDEX Loomis Sayles Bond | | 0.55 | % |
TA IDEX Marsico International Growth | | — | |
TA IDEX Mellon Market Neutral Strategy | | — | |
TA IDEX Neuberger Berman International | | — | |
TA IDEX Oppenheimer Developing Markets | | — | |
TA IDEX Oppenheimer Small- & Mid-Cap Value | | 45.53 | % |
TA IDEX Third Avenue Value | | — | |
TA IDEX Transamerica Short-Term Bond | | — | |
TA IDEX UBS Dynamic Alpha | | — | |
TA IDEX UBS Large Cap Value | | 100.00 | % |
TA IDEX Van Kampen Emerging Markets Debt | | — | |
TA IDEX Van Kampen Mid-Cap Growth | | 100.00 | % |
TA IDEX Van Kampen Small Company Growth | | 10.29 | % |
181
For tax purposes, the Long-Term Capital Gain Designations for the year ended October 31, 2007 were as follows:
Fund | | Long-Term Capital Designation | |
TA IDEX AllianceBernstein International Value | | $ | 373 | |
TA IDEX Bjurman, Barry Micro Emerging Growth | | — | |
TA IDEX BlackRock Global Allocation | | 674 | |
TA IDEX BlackRock Large Cap Value | | 14,445 | |
TA IDEX BlackRock Natural Resources | | — | |
TA IDEX Evergreen International Small Cap | | 40,985 | |
TA IDEX Federated Market Opportunity | | — | |
TA IDEX JPMorgan International Bond | | — | |
TA IDEX JPMorgan Mid Cap Value | | 4,123 | |
TA IDEX Loomis Sayles Bond | | — | |
TA IDEX Marsico International Growth | | 21,412 | |
TA IDEX Mellon Market Neutral Strategy | | — | |
TA IDEX Neuberger Berman International | | — | |
TA IDEX Oppenheimer Developing Markets | | — | |
TA IDEX Oppenheimer Small- & Mid-Cap Value | | — | |
TA IDEX Third Avenue Value | | — | |
TA IDEX Transamerica Short-Term Bond | | — | |
TA IDEX UBS Dynamic Alpha | | — | |
TA IDEX UBS Large Cap Value | | 7,747 | |
TA IDEX Van Kampen Emerging Markets Debt | | 1,215 | |
TA IDEX Van Kampen Mid-Cap Growth | | — | |
TA IDEX Van Kampen Small Company Growth | | 4,764 | |
| | | | |
The information and distributions reported herein may differ from the information and distributions taxable to the shareholders for the calendar year ending December 31, 2007. Complete information will be computed and reported in conjunction with your 2007 Form 1099-DIV.
RESULTS OF SHAREHOLDER PROXY (unaudited)
Section 270.30e-1 under the Investment Company Act of 1940, as amended, titled “Reports to Stockholders of Management Companies,” requires regulated investment companies to report on all subject matters put to the vote of shareholders and provide final results. Accordingly, the Board of Trustees of the Funds solicited a vote by the shareholders for the following items:
At a special meeting of shareholders held on October 30, 2007, the results of the Proposals were as follows:
Proposal 1: To elect a new Board of Directors
| | For | | Withheld |
John K. Carter | | 1,869,801,381.126 | | 75,092,910.077 |
Leo J. Hill | | 1,870,292,020.404 | | 74,602,270.799 |
Joyce Galpern Norden | | 1,870,010,162.690 | | 74,884,128.513 |
Neal M. Jewell | | 1,869,085,986.703 | | 75,808,304.500 |
Russell A. Kimball, Jr. | | 1,869,975,193.416 | | 74,919,097.787 |
Eugene M. Mannella | | 1,869,732,073.896 | | 75,162,217.307 |
Norm R. Nielsen | | 1,870,076,377.259 | | 74,817,913.944 |
Patricia L. Sawyer | | 1,870,218,037.071 | | 74,676,254.132 |
John W. Waechter | | 1,869,642,547.953 | | 75,251,743.250 |
Proposal 2: To approve an amendment to the Agreement and Declaration of Trust
For | | Withheld | | Abstain |
1,216,704,908.632 | | 76,054,434.614 | | 186,736,131.957 |
182
TRANSAMERICA IDEX MUTUAL FUNDS
Management of the Funds
Name, Address*** and Age | | Position(s)
Held | | Length
of Time
Served* | | Principal Occupation(s)
During Past Five Years | | Number of
Funds
in Fund
Complex
Overseen
by Trustee | | Other Board
Memberships |
| | | | | | | | | | |
Independent Trustees :** | | | | | | | | | | |
| | | | | | | | | | |
Leo J. Hill
(DOB: 3/27/56) | | Trustee | | Since 2001 | | Principal, Advisor Network Solutions, LLC (business consulting) (2006 to present); Trustee, Diversified Investors Portfolios (“DIP”), The Diversified Investors Funds Group (“DIFG”), The Diversified Investors Funds Group II (“DIFG II”), and Diversified Investors Strategic Variable Funds (“DISVF”) (2007 to present); Trustee, Transamerica IDEX Mutual Funds (“TA IDEX”) (2002 to present); Director, Transamerica Income Shares, Inc. (“TIS”) (2002 to present); Trustee, AEGON/Transamerica Series Trust (“ATST”) (2001 to present); Owner and President, Prestige Automotive Group (2001 to 2005); President, L. J. Hill & Company (1999 to present); Market President, Nations Bank of Sun Coast Florida (1998 to 1999); President and Chief Executive Officer, Barnett Banks of Treasure Coast Florida (1994 to 1998); Executive Vice President and Senior Credit Officer, Barnett Banks of Jacksonville, Florida (1991 to 1994); Senior Vice President and Senior Loan Administration Officer, Wachovia Bank of Georgia (1976 to 1991). | | 160 | | None |
| | | | | | | | | | |
Russell A. Kimball, Jr.
(DOB: 8/17/44) | | Trustee | | Since 1986 | | Trustee, DIP, DIFG, DIFG II, and DISVF (2007 to present); Trustee, TA IDEX (2002 to present); Director, TIS (2002 to present); Trustee, ATST (1986 to present); General Manager, Sheraton Sand Key Resort (1975 to present). | | 160 | | None |
| | | | | | | | | | |
Norm R. Nielsen
(DOB: 5/11/39) | | Trustee | | Since 2006 | | Retired (2005 to present); Trustee, DIP, DIFG, DIFG II, and DISVF (2007 to present); Trustee, TA IDEX (2006 to present); Director, TIS (2006 to present); Trustee, ATST (2006 to present); Director, Iowa City Area Development (1996 to 2004); Director, Iowa Health Systems (1994 to 2003); Director, U.S. Bank (1987 to 2006); President, Kirkwood Community College (1979 to 2005). | | 160 | | Buena Vista University Board of Trustees (2004 to present) |
183
Name, Address*** and Age | | Position(s)
Held | | Length
of Time
Served* | | Principal Occupation(s)
During Past Five Years | | Number of
Funds
in Fund
Complex
Overseen
by Trustee | | Other Board
Memberships |
| | | | | | | | | | |
John W. Waechter
(DOB: 2/25/52) | | Trustee | | Since 2004 | | Trustee, DIP, DIFG, DIFG II, and DISVF (2007 to present); Trustee, TA IDEX (2005 to present); Director, TIS (2004 to present); Trustee, ATST (2004 to present); employee, RBC Dain Rauscher (securities dealer) (March 2004 to May 2004); Executive Vice President, Chief Financial Officer and Chief Compliance Officer, William R. Hough & Co. (securities dealer) (1979 to 2004); Treasurer, The Hough Group of Funds (1993 to 2004). | | 160 | | None |
| | | | | | | | | | |
Neal M. Jewell
(DOB: 2/12/35) | | Trustee | | Since 1993 | | Retired (2004 to present); Trustee, TA IDEX and ATST (2007 to present); Director, TIS (2007 to present); Trustee, DIP, DIFG, DIFG II, and DISVF (1993 to present); Independent Trustee, EAI Select Managers Equity Fund (a mutual fund) (1996 to 2004). | | 160 | | None |
| | | | | | | | | | |
Eugene M. Mannella
(DOB: 2/1/54) | | Trustee | | Since 1993 | | Self-employed consultant (2006 to present); President, Arapain Partners LLC (limited purpose broker-dealer) (1998 to present); Trustee, TA IDEX and ATST (2007 to present); Director, TIS (2007 to present); Trustee, DIP, DIFG, DIFG II, and DISVF (1994 to present); President, International Fund Services (alternative asset administration) (1993 to 2005). | | 160 | | None |
| | | | | | | | | | |
Joyce Galpern Norden
(DOB: 6/1/39) | | Trustee | | Since 1993 | | Retired (2004 to present); Trustee, TA IDEX and ATST (2007 to present); Director, TIS (2007 to present); Trustee, DIP (2002 to present); Trustee, DIFG, DIFG II, and DISVF (1993 to present); Vice President, Institutional Advancement, Reconstructionist Rabbinical College (1996 to 2004). | | 160 | | Board of Governors, Reconstructionist Rabbinical College (2007 to present) |
| | | | | | | | | | |
Patricia L. Sawyer
(DOB: 7/1/50) | | Trustee | | Since 1993 | | Trustee, TA IDEX and ATST (2007 to present); Director, TIS (2007 to present); Trustee, DIP, DIFG, DIFG II, and DISVF (1993 to present); President and Executive Search Consultant, Smith & Sawyer LLC (consulting) (1989 to present). | | 160 | | None |
184
Name, Address*** and Age | | Position(s)
Held | | Length
of Time
Served* | | Principal Occupation(s)
During Past Five Years | | Number of
Funds
in Fund
Complex
Overseen
by Trustee | | Other Board
Memberships |
| | | | | | | | | | |
Interested Trustee :**** | | | | | | | | | | |
| | | | | | | | | | |
John K. Carter
(DOB: 4/24/61) | | Trustee | | Since 2006 | | Chief Executive Officer (July 2006 to present), Vice President, Secretary and Chief Compliance Officer, the Trust (2003 to August 2006); President and Chief Executive Officer, DIP, DIFG, DIFG II and DISVF (August 2007 to present); Trustee, DIP, DIFG, DIFG II, and DISVF (2007 to present); Trustee (September 2006 to present), President and Chief Executive Officer (July 2006 to present), Senior Vice President (1999 to June 2006), Chief Compliance Officer, General Counsel and Secretary (1999 to August 2006), TA IDEX; Trustee (September 2006 to present), President and Chief Executive Officer (July 2006 to present), Senior Vice President (1999 to June 2006), Chief Compliance Officer, General Counsel and Secretary (1999 to August 2006), ATST; Director (September 2006 to present), President and Chief Executive Officer (July 2006 to present), Senior Vice President (2002 to June 2006), General Counsel, Secretary and Chief Compliance Officer (2002 to August 2006), TIS; President and Chief Executive Officer (July 2006 to present), Senior Vice President (1999 to June 2006), Director (2000 to present), General Counsel and Secretary (2000 to August 2006), Chief Compliance Officer (2004 to August 2006), TFAI; President and Chief Executive Officer (July 2006 to present), Senior Vice President (1999 to June 2006), Director (2001 to present), General Counsel and Secretary (2001 to August 2006), Transamerica Fund Services, Inc. (“TFS”); Vice President, AFSG Securities Corporation (2001 to present); Senior Vice President, General Counsel and Secretary, Transamerica Index Funds, Inc. (“TIFI”) (2002 to 2004); Vice President, Transamerica Investment Services, Inc. (“TISI”) (2003 to 2005) and TIM (2001 to 2005). | | 160 | | None |
185
Officers
Name, Address*** and Age | | Position(s) Held | | Length of
Time
Served† | | Principal Occupation(s)
During the Past Five Years |
| | | | | | |
John K. Carter
(DOB: 4/24/61) | | Chief Executive Officer and President | | Since 2006 | | See the table above. |
| | | | | | |
Dennis P. Gallagher
(DOB: 12/19/70) | | Vice President, General Counsel and Secretary | | Since 2006 | | Vice President, General Counsel and Secretary, the Trust, TA IDEX, ATST and TIS (September 2006 to present); Vice President, General Counsel and Secretary, DIP, DIFG, DIFG II and DISVF (August 2007 to present); Vice President and Secretary, the Trust (September 2006 to present); Director, Senior Vice President, General Counsel and Secretary, TFAI and TFS (September 2006 to present); Director, Deutsche Asset Management (1998 to 2006). |
| | | | | | |
Elizabeth L. Belanger
(DOB: 1/7/72) | | Deputy General Counsel, Assistant Secretary and Conflicts of Interest Officer | | Since 2007 | | Deputy General Counsel, Assistant Secretary and Conflicts of Interest Officer, the Trust (November 2007 to present); Deputy General Counsel, Assistant Secretary and Conflicts of Interest Officer, TA IDEX, ATST and TIS (July 2007 to present); Deputy General Counsel and Conflicts of Interest Officer (August 2007 to present), Assistant Secretary (August 2005 to present), DIP, DIFG, DIFG II and DISVF; Vice President and Senior Counsel, Diversified (with Diversified since 2005); Director, TFLIC (April 2006 to present); Director of Compliance, Domini Social Investments LLC (November 2003 to May 2005); Associate, Bingham McCutchen LLP (September 1997 to October 2003). |
| | | | | | |
Joseph P. Carusone
(DOB: 9/8/65) | | Vice President, Treasurer and Principal Financial Officer | | Since 2007 | | Vice President, Treasurer and Principal Financial Officer, the Trust (November 2007 to present); Vice President, Treasurer and Principal Financial Officer, TA IDEX, ATST and TIS (July 2007 to present); Vice President (August 2007 to present), Treasurer and Principal Financial Officer (2001 to present), DIP, DIFG, DIFG II and DISVF; Vice President, Diversified (with Diversified since 1999); President, Diversified Investors Securities Corp. (“DISC”) (February 2007 to present); Director, TFLIC (2004 to present). |
| | | | | | |
Christopher A. Staples
(DOB: 8/14/70) | | Vice President and Chief Investment Officer | | Since 2007 | | Vice President and Chief Investment Officer, the Trust (November 2007 to present); Vice President (July 2007 to present), Chief Investment Officer (June 2007 to present), Senior Vice President (June 2007 to July 2007), Senior Vice President - Investment Management (July 2006 to June 2007), Vice President - Investment Management (2004 to July 2006), TA IDEX, ATST and TIS; Vice President and Chief Investment Officer, DIP, DIFG, DIFG II and DISVF (August 2007 to present); Vice President, Investment Administration, TII (2004 to present); Director, TFAI and TFS (2005 to present); Assistant Vice President, Raymond James & Associates (1999 to 2004). |
186
Name, Address*** and Age | | Position(s) Held | | Length of
Time
Served† | | Principal Occupation(s)
During the Past Five Years |
| | | | | | |
T. Gregory Reymann, II
(DOB: 5/13/58) | | Chief Compliance Officer | | Since 2006 | | Chief Compliance Officer (September 2006 to present) and Vice President (2005 to present), the Trust; Chief Compliance Officer TA IDEX, ATST, TIS and TFAI (September 2006 to present); Senior Vice President, TFAI (September 2006 to present); Senior Vice President, TA IDEX, ATST and TIS (September 2006 to July 2007); Vice President and Senior Counsel, TFS (2005 to 2006); Vice President and Counsel, TA IDEX, ATST, TFAI and TIS (2004 to 2006), TFS (2004 to 2005) and TIF (2004); Attorney, Gould, Cooksey, et al. (2002 to 2004). |
| | | | | | |
Michael A. Masson
(DOB: 1/21/71) | | Assistant Treasurer | | Since 2007 | | Assistant Treasurer, the Trust (November 2007 to present); Assistant Treasurer, TA IDEX, ATST and TIS (July 2007 to present); Assistant Treasurer, DIP, DIFG, DIFG II and DISVF (August 2007 to present); Assistant Vice President, ATST and TIS (2005 to present); Assistant Vice President, TII (2005 to present); Assistant Vice President, TFS and TFAI (2005 to present); Assistant Vice President, JPMorgan Chase & Co. (1999 to 2005). |
| | | | | | |
Suzanne Valerio-Montemurro
(DOB: 8/13/64) | | Assistant Treasurer | | Since 2007 | | Assistant Treasurer, the Trust (November 2007 to present); Assistant Treasurer, TA IDEX, ATST and TIS (July 2007 to present); Assistant Treasurer, DIP, DIFG, DIFG II and DISVF (August 2007 to present); Vice President, Diversified (with Diversified since 1998). |
* Each Trustee shall hold office until: 1) his or her successor is elected and qualified or 2) he or she resigns or his or her term as a Trustee is terminated in accordance with the Transamerica IDEX by-laws.
** Independent trustee (“Independent Trustee”) means a trustee who is not an “interested person” (as defined under the 1940 Act) of the Trust (the “Independent Trustees”).
*** The mailing address of each Trustee and Officer is c/o Secretary of the Funds, 570 Carillon Parkway, St. Petersburg, Florida 33716.
**** May be deemed an “interested person” (as that term is defined in Section 2(a)(19) of the 1940 Act) of the Trust because of his employment with the Advisor or an affiliate of the Advisor.
† If an officer has held offices for different Funds for different periods of time, the earliest applicable date is shown.
Additional information about the Fund trustees can be found in the Statement of Additional Information available, without charge, upon request, by calling toll free 1-888-233-4339.
187
PROXY VOTING POLICIES AND PROCEDURES AND QUARTERLY PORTFOLIO HOLDINGS
A description of the Transamerica IDEX Mutual Funds’ proxy voting policies and procedures is available in the Statements of Additional Information of the Funds, available without charge upon request by calling 1-888-233-4339 (toll free) or on the Securities and Exchange Commission website (http://www.sec.gov).
In addition, the Funds are required to file Form N-PX, with their complete proxy voting records for the 12 months ended June 30th, no later than August 31st of each year. The Form is available without charge: (1) from the Funds, upon request by calling 1-888-233-4339; and (2) on the SEC’s website at (http://www.sec.gov).
The Funds file their complete schedule of portfolios holdings with the SEC for the first and third quarter of each fiscal year on Form N-Q which is available on the Commission’s website at http://www.sec.gov. The Funds’ Form N-Q may be reviewed and copied at the Commission’s Public Reference Room in Washington, D.C. Information on the operation of the Public Reference Room may be obtained by calling 1-800-SEC-0330.
Important Notice Regarding Delivery of Shareholder Documents
Every year we send shareholders informative materials such as the Transamerica IDEX Annual Report, the Transamerica IDEX Prospectus, and other required documents that keep you informed regarding your funds. Transamerica IDEX will only send one piece per mailing address, a method that saves your funds money by reducing mailing and printing costs. We will continue to do this unless you tell us not to. To elect to receive individual mailings, simply call a Transamerica IDEX Customer Service Representative toll free at 1-888-233-4339, 8 a.m. to 7 p.m. Eastern Time, Monday–Friday. Your request will take effect within 30 days.
188
P.O. Box 9012
Clearwater, FL 33758-9012

Customer Service 1-888-233-IDEX (4339)
P.O. Box 9012 · Clearwater, FL 33758-9012
Distributor: Transamerica Capital, Inc.
Item 2: Code of Ethics.
(a) Registrant has adopted a code of ethics that applies to its principal executive officer, principal financial officer, and any other officers who serve a similar function.
(b) Registrant’s code of ethics is reasonably designed as described in this Form N-CSR.
(c) During the period covered by the report, no amendments were made to the provisions of this code of ethics.
(d) During the period covered by the report, Registrant did not grant any waivers, including implicit waivers, from the provisions of this code of ethics.
(e) Not Applicable
(f) Registrant has filed this code of ethics as an exhibit pursuant to Item 12(a)(1) of Form N-CSR.
Item 3: Audit Committee Financial Experts.
Registrant’s Board of Trustees has determined that John W. Waechter and Eugene M. Mannella are “audit committee financial experts,” as such term is defined in Item 3 of Form N-CSR. Mr. Waechter and Mr. Mannella are “independent” under the standards set forth in Item 3 of Form N-CSR. The designation of Mr. Waechter and Mr. Mannella as “audit committee financial experts” pursuant to Item 3 of Form N-CSR does not (i) impose upon them any duties, obligations, or liabilities that are greater than the duties, obligations and liabilities imposed upon them as a member of the Registrant’s audit committee or Board of Trustees in the absence of such designation; or (ii) affect the duties, obligations or liabilities of any other member of the Registrant’s audit committee or Board of Trustees.
Item 4: Principal Accountant Fees and Services.
| | | | Fiscal Year Ended 10/31 | |
(in thousands) | | 2006 | | 2007 | |
| | | | | | | |
(a) | | Audit Fees | | 691 | | 785 | |
(b) | | Audit-related Fees | | 43 | | 25 | |
(c) | | Tax Fees | | 151 | | 418 | |
(d) | | All Other Fees | | N/A | | N/A | |
(e) | (1) | Pre-approval policy* (see below) | | | | | |
(e) | (2) | % of above that were pre-approved | | 0% | | 0% | |
(f) | | If greater than 50%, disclose hours | | N/A | | N/A | |
(g) | | Non-audit fees rendered to Adviser (or affiliate that provided services to Registrant) | | N/A | | N/A | |
(h) | | Disclose whether the Audit Committee has considered whether the provisions of non-audit services rendered to the Adviser that were NOT pre-approved is compatible with maintaining the auditor’s independence. | | Yes | | Yes | |
3
* (e) (1) The Audit Committee may delegate any portion of its authority, including the authority to grant pre-approvals of audit and permitted non-audit services, to one or more members or a subcommittee. Any decision of the subcommittee to grant pre-approvals shall be presented to the full Audit Committee at its next regularly scheduled meeting.
Item 5: Audit Committee of Listed Registrants.
The following individuals comprise the standing Audit Committee: Leo J. Hill, Neal M. Jewell, Russell A. Kimball, Jr., Eugene M. Mannella, Norm R. Nielsen, Joyce Galpern Norden, Patricia L. Sawyer and John W. Waechter.
Item 6: Schedule of Investments.
The schedules of investments are included in the annual report to shareholders filed under Item 1 of this Form N-CSR.
Item 7: Disclosure of Proxy Voting Policies and Procedures for Closed-End Management Investment Companies. Not applicable.
Item 8: Portfolio Managers of Closed-End Management Investment Companies. Not applicable.
Item 9. Purchases of Equity Securities by Closed-End Management Investment Company and Affiliated Purchasers. Not applicable.
Item 10: Submission of Matters to a Vote of Security Holders
The Registrant’s Nominating Committee’s provisions with respect to nominations of Trustees to its Board are as follows:
A candidate for nomination as Trustee submitted by a shareholder will not be deemed to be properly submitted to the Committee for the Committee’s consideration unless the following requirements have been met and procedures followed:
1. Each eligible shareholder or shareholder group may submit no more than one nominee each calendar year.
2. The nominee must satisfy all qualifications provided herein and in the Fund’s organizational documents, including qualification as a possible Independent Trustee if the nominee is to serve in that capacity.
· The nominee may not be the nominating shareholder, a member of the nominating shareholder group or a member of the immediate family of the nominating shareholder or any member of the nominating shareholder group.(1)
(1) Terms such as “immediate family member” and “control” shall be interpreted in accordance with the federal securities laws.
4
· Neither the nominee nor any member of the nominee’s immediate family may be currently employed or employed within the year prior to the nomination by any nominating shareholder entity or entity in a nominating shareholder group.
· Neither the nominee nor any immediate family member of the nominee is permitted to have accepted directly or indirectly, during the year of the election for which the nominee’s name was submitted, during the immediately preceding calendar year, or during the year when the nominee’s name was submitted, any consulting, advisory, or other compensatory fee from the nominating shareholder or any member of a nominating shareholder group.
· The nominee may not be an executive officer, director or person fulfilling similar functions of the nominating shareholder or any member of the nominating shareholder group, or of an affiliate of the nominating shareholder or any such member of the nominating shareholder group.
· The nominee may not control the nominating shareholder or any member of the nominating shareholder group (or, in the case of a holder or member that is a fund, an interested person of such holder or member as defined by Section 2(a)(19) of the 1940 Act).
· A shareholder or shareholder group may not submit for consideration a nominee which has previously been considered by the Committee.
3. In order for the Committee to consider shareholder submissions, the following requirements must be satisfied regarding the shareholder or shareholder group submitting the proposed nominee:
· Any shareholder or shareholder group submitting a proposed nominee must beneficially own, either individually or in the aggregate, more than 5% of a Fund’s (or a series thereof) securities that are eligible to vote both at the time of submission of the nominee and at the time of the Board member election. Each of the securities used for purposes of calculating this ownership must have been held continuously for at least two years as of the date of the nomination. In addition, such securities must continue to be held through the date of the meeting. The nominating shareholder or shareholder group must also bear the economic risk of the investment.
· The nominating shareholder or shareholder group must also submit a certification which provides the number of shares which the person or group has (a) sole power to vote or direct the vote; (b) shared power to vote or direct the vote; (c) sole power to dispose or direct the disposition of such shares; and (d) shared power to dispose or direct the disposition of such shares. In addition the certification shall provide that the shares have been held continuously for at least two years.
4. Shareholders or shareholder groups submitting proposed nominees must substantiate compliance with the above requirements at the time of submitting their proposed nominee as part of their written submission to the attention of the Fund’s Secretary, who will provide all submissions to the Committee. This submission to the Fund must include:
· the shareholder’s contact information;
· the nominee’s contact information and the number of applicable Fund shares owned by the proposed nominee;
· all information regarding the nominee that would be required to be disclosed in solicitations of proxies for elections of directors required by Regulation 14A under the Securities Exchange Act of 1934; and
5
· a notarized letter executed by the nominee, stating his or her intention to serve as a nominee and be named in a Fund’s proxy statement, if so designated by the Committee and the Fund’s Board.
5. The Committee will consider all submissions meeting the applicable requirements stated herein that are received by December 31 of the most recently completed calendar year.
Item 11: Controls and Procedures.
(a) The Registrant’s principal executive officer and principal financial officer evaluated the Registrant’s disclosure controls and procedures within 90 days of this filing and have concluded that the Registrant’s disclosure controls and procedures (as defined in Rule 30a-3(c) under the Investment Company Act of 1940) are appropriately designed to ensure that information required to be disclosed by Registrant in the reports that it files on Form N-CSR (a) is accumulated and communicated to Registrant’s management, including its principal executive officer and principal financial officer, to allow timely decisions regarding required disclosure, and (b) is recorded, processed, summarized and reported, within the time periods specified in the rules and forms adopted by the U.S. Securities and Exchange Commission.
(b) The Registrant’s principal executive officer and principal financial officer are aware of no change in the Registrant’s internal control over financial reporting that occurred during the Registrant’s most recent fiscal quarter that has materially affected, or is reasonably likely to materially affect, the Registrant’s internal control over financial reporting.
Item 12: Exhibits.
(a) (1) Registrant’s code of ethics (that is the subject of the disclosure required by Item 2(a)) is attached.
(2) Separate certifications for Registrant’s principal executive officer and principal financial officer, as required by Rule 30a-2(a) under the 1940 Act, are attached.
(3) Not applicable.
(b) A certification for Registrant’s principal executive officer and principal financial officer, as required by Rule 30a-2(b) under the 1940 Act, is attached. The certification furnished pursuant to this paragraph is not deemed to be “filed” for purposes of Section 18 of the Securities Act of 1934, or otherwise subject to liability of that section. Such certification is not deemed to be incorporated by reference into any filing under the Securities Act of 1933 or the Securities Exchange Act of 1934, except to the extent that the Registrant specifically incorporates it by reference
6
SIGNATURES
Pursuant to the requirements of the Securities Exchange Act of 1934 and the Investment Company Act of 1940, the Registrant has duly caused this report to be signed on its behalf by the undersigned, thereunto duly authorized.
| Transamerica IDEX Mutual Funds | |
| (Registrant) |
| |
| By: | /s/ John K. Carter | |
| | John K. Carter |
| | Chief Executive Officer |
| | Date: February 4, 2008 |
| | | | |
Pursuant to the requirements of the Securities Exchange Act of 1934 and the Investment Company Act of 1940, this report has been signed below by the following persons on behalf of the Registrant and in the capacities and on the dates indicated.
| By: | /s/ John K. Carter | |
| | John K. Carter |
| | Chief Executive Officer |
| | Date: February 4, 2008 |
| | |
| | |
| By: | /s/ Joseph P. Carusone | |
| | Joseph P. Carusone |
| | Principal Financial Officer |
| | Date: February 4, 2008 |
| | | | |
7
EXHIBIT INDEX
Exhibit No. | | Description of Exhibit |
| | |
12(a)(1) | | Code of Ethics for Principal Executive and Senior Financial Officers |
12(a)(2)(i) | | Section 302 N-CSR Certification of Principal Executive Officer |
12(a)(2)(ii) | | Section 302 N-CSR Certification of Principal Financial Officer |
12(b) | | Section 906 N-CSR Certification of Principal Executive Officer and Principal Financial Officer |
8