As filed with the SEC on December 30, 2009.
UNITED STATES
SECURITIES AND EXCHANGE COMMISSION
Washington, D.C. 20549
FORM N-CSR
CERTIFIED SHAREHOLDER REPORT OF REGISTERED
MANAGEMENT INVESTMENT COMPANIES
Investment Company Act file number | 811-04556 |
|
TRANSAMERICA FUNDS |
(Exact name of registrant as specified in charter) |
|
570 Carillon Parkway, St. Petersburg, Florida | | 33716 |
(Address of principal executive offices) | | (Zip code) |
|
Dennis P. Gallagher, Esq. P.O. Box 9012, Clearwater, Florida 33758-9771 |
(Name and address of agent for service) |
|
Registrant’s telephone number, including area code: | (727) 299-1800 | |
|
Date of fiscal year end: | October 31 | |
|
Date of reporting period: | November 1, 2008 - October 31, 2009 | |
| | | | | | | | |
Item 1: Report(s) to Shareholders. The Annual Report is attached.

Fund of Funds
Annual Report
October 31, 2009
www.transamericafunds.com
Customer Service 1-888-233-4339
P.O. Box 9012 · Clearwater, FL 33758-9012
Distributor: Transamerica Capital, Inc.
Dear Fellow Shareholder:
On behalf of Transamerica Funds, we would like to thank you for your continued support and confidence in our products as we look forward to continuing to serve you and your financial adviser in the future. We value the trust you have placed in us.
This annual report is provided to you with the intent of presenting a comprehensive review of the investments of each of your portfolios. The Securities and Exchange Commission requires that annual and semi-annual reports be sent to all shareholders, and we believe this report to be an important part of the investment process. In addition to providing a comprehensive review, this report also provides a discussion of accounting policies as well as matters presented to shareholders that may have required their vote.
We believe it is important to recognize and understand current market conditions in order to provide a context for reading this report. During the past twelve months, markets have oscillated from significant weakness in conjunction with investors’ concerns over the health of the economy and the labor market to strength in conjunction with investor optimism of recovery and bargain hunting. The equity markets touched new lows in March 2009, and then subsequently rallied sharply. The period ended in October with positive twelve month returns for both the broad equity and bond markets. As economic recovery prospects have improved, the U.S. dollar has weakened versus the Euro, Pound Sterling, and Japanese Yen. Oil prices have been quite volatile over the past year, hitting their lows in January 2009 and recovering to end higher at the end of the period. From a rate of 1.00% at the beginning of the period, the Federal Reserve lowered the federal funds rate in December 2008 to a range of 0%-0.25% in an effort to stimulate the economy. The unemployment rate has continued to climb and reached 10.2% in October. Bargain hunting and an increased appetite for risk following market lows in March 2009 has led to strong gains for particular equity and fixed-income sectors, including emerging market stocks, technology stocks and high-yield bonds. Treasuries and money market securities have lagged on a relative basis. For the twelve months ending October 31, 2009, the Dow Jones Industrial Average returned 7.71%; the Standard & Poor’s 500 Index returned 9.80%; and the Barclays Capital U.S. Aggregate Bond Index returned 13.79%. Please keep in mind, it is important to maintain a diversified portfolio as investment returns have historically been difficult to predict.
In addition to your active involvement in the investment process, we firmly believe that a financial adviser is a key resource to help you build a complete picture of your current and future financial needs. Financial advisers are familiar with the market’s history, including long-term returns and volatility of various asset classes. With your financial adviser, you can develop an investment program that incorporates factors such as your goals, your investment timeline, and your risk tolerance.
Please contact your financial adviser if you have any questions about the contents of this report, and thanks again for the confidence you have placed in us.
Sincerely, | |
| |
| |
John K. Carter | Christopher A. Staples |
Chairman of the Board, | Senior Vice President & Chief Investment Officer |
President & Chief Executive Officer | Transamerica Funds |
Transamerica Funds | |
The views expressed in this report reflect those of the portfolio managers only and may not necessarily represent the views of Transamerica Funds. These views are subject to change based upon market conditions. These views should not be relied upon as investment advice and are not indicative of trading intent on behalf of Transamerica Funds.
Transamerica Asset Allocation — Conservative Portfolio
(unaudited)
MARKET ENVIRONMENT
The 12-month period ending October 31, 2009 was an eventful one in the financial markets. Although the period does not include September and October 2008—when we witnessed the demise of Lehman Brothers, the Merrill Lynch and Wachovia rescues, and the government seizures of Fannie Mae, Freddie Mac, Washington Mutual, and AIG—the market fallout from the financial sector’s near-collapse persisted well into the winter. With the housing market sinking further, banks taking massive write-offs, and even credit-worthy companies struggling to secure routine daily financing, the stock and bond markets remained in their panicked state well into 2009. The Standard and Poor’s 500 Composite Stock Index (“S&P 500”) continued to plunge until finally bottoming on March 9, 2009, by which point it was off 55% from its 2007 peak.
Measured from November 1, 2008 (the start of the fiscal year covered by this report), the S&P 500 lost about 29% through March 9. The losses in international markets were in the same neighborhood, although emerging markets fell less, thanks partly to improving oil prices in 2009’s first quarter. Aside from U.S. Treasuries—whose prices had been driven up by safety-seeking investors—most bonds had faltered along with the stock market through October 2008. But starting in November, the broader bond market gradually reclaimed its traditional status as a relatively safe harbor. Treasuries still reigned, but eventually high-quality corporate bonds also performed well as investors fled equities. The Barclays Capital Corporate Investment Grade Index (“BC Corporate Investment Grade”), which had lost almost 14% in September and October, recouped about 8% from November 1 through March 9, 2009. Junk-rated corporates still lagged, however.
The turning point arrived in early March as fears of a total financial meltdown eased, myriad stimulus initiatives progressed, and several economic indicators showed initial hints of stabilizing. The market rebound steamrolled unabated straight through the spring, summer, and early fall, before easing off in October. The rally, which saw the S&P 500 rise more than 55% from March 10 through October 31, favored the most economically sensitive sectors as investors grew more confident that the economy’s nadir had come and gone. Cyclical sectors, including industrials, technology, and especially the ravaged financials arena, recorded the most dramatic gains. The S&P 500’s financials sector shot up almost 128% over that stretch, while industrials and information technology both rebounded nearly 69%. Basic materials were close behind with a 65% return. Traditionally, defensive sectors, such as health care, consumer staples, and utilities, rebounded only about half as much. Other risky asset classes were also rewarded. Small-cap stocks jumped more than 65% as measured by the Russell 2000® Index, and the Morgan Stanley Capital International Emerging Markets Index (“MSCI Emerging Markets”) soared nearly 92% in U.S. dollar terms. Even the Morgan Stanley Capital International-Europe, Australasia, and Far East Index (“MSCI-EAFE”) of developed foreign markets gained 72% on a dollar basis. Both international indices were significantly helped by the greenback’s fall as investors who had flocked to the dollar’s perceived safety began exiting after March.
Meanwhile, the credit markets continued to improve as lending activity gradually resumed. Treasuries were no longer in such demand, but bonds with credit risk basked in investors’ returning confidence. Investment-grade corporate bonds gained 21% according to the BC Corporate Investment Grade. The corresponding high-yield index rallied almost 54%.
For the 12-month period as a whole, the S&P 500 gained 9.80%. Within the U.S., mid-cap companies out-performed both large and small companies. In the large-cap realm, value stocks—which include the big banks, brokers, and insurers—dramatically underperformed growth stocks, although that relationship didn’t hold in the smaller-cap ranges. The MSCI-EAFE Index returned an impressive 27.71% in dollar terms (less than half that without factoring in the dollar’s depreciation). The MSCI Emerging Markets soared nearly 65% over the period. The Barclays Capital U.S. Aggregate Bond Index (“BCAB”) rose 13.79%, with junk bonds leading the rebound.
PERFORMANCE
For the year ended October 31, 2009, Transamerica Asset Allocation—Conservative Portfolio Class A returned 21.76%. By comparison, its primary and secondary benchmarks, the BCAB and the Wilshire 5000 Total Market Index, returned 13.79% and 11.33%, respectively.
STRATEGY REVIEW
This portfolio is structured to provide a mix of approximately 35% equity and 65% fixed-income securities (including cash) under normal conditions. The equity side provides broad coverage of both domestic and international markets, across a range of investment styles. The larger fixed-income portion covers investment-grade and lower-credit holdings, including government, investment-grade corporate, investment-grade foreign, high-yield corporate, convertible, and emerging-markets bonds. The portfolio also includes emerging-market stocks, global real estate, and alternative strategies. The goal is to provide investors one-stop coverage of the financial markets with a fixed-income emphasis, and the portfolio is more broadly diversified than most traditional balanced funds. No one can predict with consistency which asset classes and investment styles will out-perform in any given quarter or year. But by diversifying across all of them, one can capture the long-term performance of each.
Diversification can also smooth out risk, although it can not prevent losses in short-term periods when many asset classes drop simultaneously, as happened in the recent downturn. Nevertheless, the portfolio out-performed both its bond benchmark and its equity benchmark over the 12-month period, and ranked in the top quartile of its Morningstar category. Three main factors explain the out-performance. First, our bond portfolio, which had suffered through much of 2008, benefited from the strong rebound in the credit markets in 2009. The credit-sensitive holdings performed especially well. Transamerica High Yield Bond surged significantly and Transamerica Loomis Sayles Bond, a multi-sector bond fund that has exposure to high-yield and foreign bonds, was also up significantly.
Transamerica Funds | | Annual Report 2009 |
1
Transamerica Van Kampen Emerging Markets Debt also gained. The portfolio’s largest position, Transamerica PIMCO Total Return, rose an impressive amount and Transamerica PIMCO Real Return TIPS was up as well. Second, as part of our standard diversification, we hold about 30% of the equity stake in international stocks; and as mentioned, international markets gained more than the domestic stock market over the period. Also, we directed about a fourth of the international sleeve toward emerging markets, which soared. Indeed, our two emerging-markets funds, Transamerica Oppenheimer Developing Markets and Transamerica WMC Emerging Markets, were the portfolio’s two biggest gainers, and most of the other international funds were among the top performers. Finally, although our asset-allocation targets are strategic in nature rather than tactical, we did hold our equity weight between three and seven percentage points below the normal 35% target throughout the worst months of the stock market’s downturn. Given that fewer than half of our underlying funds beat their Morningstar category medians over the one-year period, we primarily credit the above factors for the portfolio’s out-performance.
During the period, we added three new underlying funds. Transamerica JPMorgan Core Bond, a historically successful bond strategy targeting high-quality bonds, was added to the Transamerica fund menu, enabling us to introduce it to the portfolio in July 2009. We invested in it both for its talented management and also to absorb some of the assets in Transamerica PIMCO Total Return, previously the only core bond fund available to us and thus a particularly large position. Transamerica Thornburg International Value has an outstanding record in the foreign large blend style. We added the fund in November 2008, primarily on the basis of the manager’s skill, but the fund also fleshes out our large-cap style coverage. Transamerica MFS International Equity was also added in late 2008 after an I share was created. Its parent fund has a strong history of investing with a growth-leaning style, and it complemented other foreign funds we already had in place.
We also eliminated several funds during the period. In late 2008, we decided to sell our position in Transamerica Small/Mid Cap Value after its sole manager resigned and was replaced by a team with more of a growth than value-style background. In the spring, we liquidated our position in Transamerica Bjurman, Barry Micro Emerging Growth after its management decided to close their firm. Then in September, we discontinued using five funds because of a change in the Transamerica fund-lineup rationalization. The funds were Transamerica American Century Large Company Value, Transamerica Marsico Growth, Transamerica Marsico International Growth, Transamerica Evergreen International Small Cap, and Transamerica Evergreen Health Care. Assets in those funds were distributed to various other portfolio holdings in a way that preserved the careful diversification and balance of the portfolio.
The question on many investors’ minds now is whether both stocks and credit-sensitive bonds have soared too fast and too high given economic conditions. When global security markets do settle down, we believe the stock- and bond-picking skills of our underlying managers will take on more importance.
Michael Stout, CFA
Jon Hale, Ph.D., CFA
Jeff McConnell, CFA
Maciej Kowara, Ph.D., CFA
Co-Portfolio Managers
Morningstar Associates, LLC
2
Average Annual Total Return for Periods Ended 10/31/2009
| | 1 Year | | 5 Years | | 10 Years or
Life of Portfolio | | Inception Date | |
Class A (NAV) | | 21.76 | % | 3.95 | % | 4.88 | % | 03/01/2002 | |
Class A (POP) | | 15.10 | % | 2.79 | % | 4.11 | % | 03/01/2002 | |
Barclays Capital U.S. Aggregate Bond Index* | | 13.79 | % | 5.05 | % | 5.46 | % | 03/01/2002 | |
Wilshire 5000* | | 11.33 | % | 1.05 | % | 2.17 | % | 03/01/2002 | |
Class B (NAV) | | 21.01 | % | 3.30 | % | 4.20 | % | 03/01/2002 | |
Class B (POP) | | 16.01 | % | 3.13 | % | 4.20 | % | 03/01/2002 | |
Class C (NAV) | | 21.09 | % | 3.32 | % | 5.93 | % | 11/11/2002 | |
Class C (POP) | | 20.09 | % | 3.32 | % | 5.93 | % | 11/11/2002 | |
Class R (NAV) | | 21.59 | % | N/A | | 2.57 | % | 06/15/2006 | |
NOTES
* The Barclays Capital U.S. Aggregate Bond Index and the Wilshire 5000 Total Market ("Wilshire 5000") Index are unmanaged indices used as a general measure of market performance. Calculations assume dividends and capital gains are reinvested and do not include any managerial expenses. The 10 Years or Life of Portfolio calculation is based on life of Class A shares. You cannot invest directly in an index.
The performance data presented represents past performance; future results may vary. Performance data does not reflect the deduction of taxes that would be paid on portfolio distributions or the redemption of portfolio shares. Investment return and principal value will fluctuate so that an investor’s shares, when redeemed, may be worth more or less than their original cost. Current performance may be lower or higher than performance quoted. Please see www.transamericafunds.com for performance data current to the most recent month-end. Net Asset Value (“NAV”) returns include the reinvestment of dividends and capital gains but do not reflect any sales charges. Public Offering Price (“POP”) returns include the reinvestment of dividends and capital gains and reflects the maximum sales charge of 5.5% for A shares or the maximum applicable contingent deferred sales charge (5% in the 1st year, decreasing to 0% after 6 years) for Class B shares and 1% (during the first 12 months) for Class C shares. Shares purchased prior to March 1, 2004 are subject to a maximum applicable contingent deferred sales charge (5% in the 1st year, decreasing to 0% after 7 years) for Class B shares and (2% in the 1st year, decreasing to 0% after 2 years) for Class C shares.
Performance figures may reflect fee waivers and/or expense reimbursements by the Investment Adviser. Without such waivers and/or reimbursements, the performance would be lower. Future waivers and/or reimbursements are at the discretion of the Investment Adviser.
This material must be preceded or accompanied by a current prospectus, which includes specific contents regarding the investment objectives and policies of this portfolio.
3
Transamerica Asset Allocation – Growth Portfolio
(unaudited)
MARKET ENVIRONMENT
The 12-month period ending October 31, 2009 was an eventful one in the financial markets. Although the period does not include September and October 2008—when we witnessed the demise of Lehman Brothers, the Merrill Lynch and Wachovia rescues, and the government seizures of Fannie Mae, Freddie Mac, Washington Mutual, and AIG—the market fallout from the financial sector’s near-collapse persisted well into the winter. With the housing market sinking further, banks taking massive write-offs, and even credit-worthy companies struggling to secure routine daily financing, the stock and bond markets remained in their panicked state well into 2009. The Standard and Poor’s 500 Composite Stock Index (“S&P 500”) continued to plunge until finally bottoming on March 9, 2009, by which point it was off 55% from its 2007 peak.
Measured from November 1, 2008 (the start of the fiscal year covered by this report), the S&P 500 lost about 29% through March 9. The losses in international markets were in the same neighborhood, although emerging markets fell less, thanks partly to improving oil prices in 2009’s first quarter.
The turning point arrived in early March as fears of a total financial meltdown eased, myriad stimulus initiatives progressed, and several economic indicators showed initial hints of stabilizing. The market rebound steamrolled unabated straight through the spring, summer, and early fall, before easing off in October. The rally, which saw the S&P 500 rise more than 55% from March 10 through October 31, favored the most economically sensitive sectors as investors grew more confident that the economy’s nadir had come and gone. Cyclical sectors, including industrials, technology, and especially the ravaged financials arena, recorded the most dramatic gains. The S&P 500’s financials sector shot up almost 128% over that stretch, while industrials and information technology both rebounded nearly 69%. Basic materials were close behind with a 65% return. Traditionally, defensive sectors, such as health care, consumer staples, and utilities, rebounded only about half as much. Other risky asset classes were also rewarded. Small-cap stocks jumped more than 65% as measured by the Russell 2000® Index, and the Morgan Stanley Capital International Emerging Markets Index (“MSCI Emerging Markets”) soared nearly 92% in U.S. dollar terms. Even the Morgan Stanley Capital International-Europe, Australasia, and Far East Index (“MSCI-EAFE”) of developed foreign markets gained 72% on a dollar basis. Both international indices were significantly helped by the greenback’s fall as investors who had flocked to the dollar’s perceived safety began exiting after March.
For the 12-month period as a whole, the S&P 500 gained 9.80%. Within the U.S., mid-cap companies out-performed both large and small companies. In the large-cap realm, value stocks—which include the big banks, brokers, and insurers—dramatically underperformed growth stocks, although that relationship didn’t hold in the smaller-cap ranges. The MSCI-EAFE Index returned an impressive 27.71% in dollar terms (less than half that without factoring in the dollar’s depreciation). The MSCI Emerging Markets Index soared nearly 65% over the period.
PERFORMANCE
For the year ended October 31, 2009, Transamerica Asset Allocation—Growth Portfolio Class A returned 14.46%. By comparison, its benchmark, the Wilshire 5000 Total Market Index, returned 11.33%.
STRATEGY REVIEW
This portfolio is structured to provide broadly diversified coverage of the domestic and international equity markets, across a range of market capitalizations and investment styles. The portfolio also includes emerging markets, global real estate, and alternative strategies. The goal is to provide investors one-stop coverage of the equity markets, and the portfolio is more broadly diversified across investment styles than most market indices. No one can predict with consistency which investment styles will out-perform in any given quarter or year. But by diversifying across all of them, one can capture the long-term performance of each.
Diversification can also smooth out risk, although it can not prevent losses in short-term periods when many asset classes drop simultaneously, as happened in the recent downturn. Nevertheless, the portfolio out-performed its benchmark and ranked in the top third of its Morningstar category. Two main factors explain the out-performance. First, as part of our standard diversification we hold about 30% of the diversified-equity stake in international stocks, and as mentioned, international markets gained more than the domestic stock market over the period. Also, we directed about a fourth of the international sleeve toward emerging markets, which soared. Indeed, our two emerging-markets funds, Transamerica Oppenheimer Developing Markets and Transamerica WMC Emerging Markets, were the portfolio’s two biggest gainers by far, and most of the other international funds were among the top performers. Second, our small- and mid-cap exposure helped, as Transamerica Van Kampen Mid-Cap Growth, Transamerica Van Kampen Small Company Growth, and Transamerica Oppenheimer Small- & Mid-Cap Value all rode the rebound to impressive gains for the one-year period. Finally, our alternative-strategy allocation helped soften losses during the market downturn—to a greater degree than they hindered the portfolio in the rebound. Given that fewer than half of our underlying funds beat their Morningstar category medians over the one-year period, we primarily credit the above factors for the portfolio’s out-performance.
During the period, we introduced one new underlying fund, Transamerica MFS International Equity, which was added in late 2008 after an I share was created. Its parent fund has a strong history of investing with a growth-leaning style, and it complemented other foreign funds we already had in place.
4
We also eliminated several funds during the period. In late 2008, we decided to sell our position in Transamerica Small/Mid Cap Value after its sole manager resigned and was replaced by a team with more of a growth than value-style background. In the spring, we liquidated our position in Transamerica Bjurman, Barry Micro Emerging Growth after its management decided to close their firm. Then in September, we discontinued using five funds because of a change in the Transamerica fund-lineup. The funds were Transamerica American Century Large Company Value, Transamerica Marsico Growth, Transamerica Marsico International Growth, Transamerica Evergreen International Small Cap, and Transamerica Evergreen Health Care. Assets in those funds were distributed to various other portfolio holdings in a way that preserved the careful diversification and balance of the portfolio.
The question on many investors’ minds now is whether stocks have soared too fast and too high given economic conditions. When global security markets do settle down, we believe the stock- and bond-picking skills of our underlying managers will take on more importance.
Michael Stout, CFA
Jon Hale, Ph.D., CFA
Jeff McConnell, CFA
Maciej Kowara, Ph.D., CFA
Co-Portfolio Managers
Morningstar Associates, LLC
5
Average Annual Total Return for Periods Ended 10/31/2009
| | 1 Year | | 5 Years | | 10 Years or
Life of Portfolio | | Inception Date | |
Class A (NAV) | | 14.46 | % | 1.67 | % | 2.04 | % | 03/01/2002 | |
Class A (POP) | | 8.12 | % | 0.52 | % | 1.30 | % | 03/01/2002 | |
Wilshire 5000* | | 11.33 | % | 1.05 | % | 2.17 | % | 03/01/2002 | |
Class B (NAV) | | 13.78 | % | 0.98 | % | 1.38 | % | 03/01/2002 | |
Class B (POP) | | 8.78 | % | 0.80 | % | 1.38 | % | 03/01/2002 | |
Class C (NAV) | | 13.72 | % | 1.06 | % | 5.13 | % | 11/11/2002 | |
Class C (POP) | | 12.72 | % | 1.06 | % | 5.13 | % | 11/11/2002 | |
Class R (NAV) | | 14.35 | % | N/A | | (3.34 | )% | 06/15/2006 | |
NOTES
* The Wilshire 5000 Total Market (“Wilshire 5000”) Index is an unmanaged index used as a general measure of market performance. Calculations assume dividends and capital gains are reinvested and do not include any managerial expenses. The 10 Years or Life of Portfolio calculation is based on life of Class A shares. You cannot invest directly in an index.
The performance data presented represents past performance; future results may vary. Performance data does not reflect the deduction of taxes that would be paid on portfolio distributions or the redemption of portfolio shares. Investment return and principal value will fluctuate so that an investor’s shares, when redeemed, may be worth more or less than their original cost. Current performance may be lower or higher than performance quoted. Please see www.transamericafunds.com for performance data current to the most recent month-end. Net Asset Value (“NAV”) returns include the reinvestment of dividends and capital gains but do not reflect any sales charges. Public Offering Price (“POP”) returns include the reinvestment of dividends and capital gains and reflects the maximum sales charge of 5.5% for A shares or the maximum applicable contingent deferred sales charge (5% in the 1st year, decreasing to 0% after 6 years) for Class B shares and 1% (during the first 12 months) for Class C shares. Shares purchased prior to March 1, 2004 are subject to a maximum applicable contingent deferred sales charge (5% in the 1st year, decreasing to 0% after 7 years) for Class B shares and (2% in the 1st year, decreasing to 0% after 2 years) for Class C shares.
Performance figures may reflect fee waivers and/or expense reimbursements by the Investment Adviser. Without such waivers and/or reimbursements, the performance would be lower. Future waivers and/or reimbursements are at the discretion of the Investment Adviser.
This material must be preceded or accompanied by a current prospectus, which includes specific contents regarding the investment objectives and policies of this portfolio.
6
Transamerica Asset Allocation — Moderate Growth Portfolio
(unaudited)
MARKET ENVIRONMENT
The 12-month period ending October 31, 2009 was an eventful one in the financial markets. Although the period does not include September and October 2008—when we witnessed the demise of Lehman Brothers, the Merrill Lynch and Wachovia rescues, and the government seizures of Fannie Mae, Freddie Mac, Washington Mutual, and AIG—the market fallout from the financial sector’s near-collapse persisted well into the winter. With the housing market sinking further, banks taking massive write-offs, and even credit-worthy companies struggling to secure routine daily financing, the stock and bond markets remained in their panicked state well into 2009. The Standard and Poor’s 500 Composite Stock Index (“S&P 500”) continued to plunge until finally bottoming on March 9, 2009, by which point it was off 55% from its 2007 peak.
Measured from November 1, 2008 (the start of the fiscal year covered by this report), the S&P 500 lost about 29% through March 9. The losses in international markets were in the same neighborhood, although emerging markets fell less, thanks partly to improving oil prices in 2009’s first quarter. Aside from U.S. Treasuries—whose prices had been driven up by safety-seeking investors—most bonds had faltered along with the stock market through October 2008. But starting in November, the broader bond market gradually reclaimed its traditional status as a relatively safe harbor. Treasuries still reigned, but eventually high-quality corporate bonds also performed well as investors fled equities. The Barclays Capital Corporate Investment Grade Index (“BC Corporate Investment Grade”), which had lost almost 14% in September and October, recouped about 8% from November 1 through March 9, 2009. Junk-rated corporates still lagged, however.
The turning point arrived in early March as fears of a total financial meltdown eased, myriad stimulus initiatives progressed, and several economic indicators showed initial hints of stabilizing. The market rebound steamrolled unabated straight through the spring, summer, and early fall, before easing off in October. The rally, which saw the S&P 500 rise more than 55% from March 10 through October 31, favored the most economically sensitive sectors as investors grew more confident that the economy’s nadir had come and gone. Cyclical sectors, including industrials, technology, and especially the ravaged financials arena, recorded the most dramatic gains. The S&P 500’s financials sector shot up almost 128% over that stretch, while industrials and information technology both rebounded nearly 69%. Basic materials were close behind with a 65% return. Traditionally, defensive sectors, such as health care, consumer staples, and utilities, rebounded only about half as much. Other risky asset classes were also rewarded. Small-cap stocks jumped more than 65% as measured by the Russell 2000® Index, and the Morgan Stanley Capital International Emerging Markets Index (“MSCI Emerging Markets”) soared nearly 92% in U.S. dollar terms. Even the Morgan Stanley Capital International-Europe, Australasia, and Far East Index (“MSCI-EAFE”) of developed foreign markets gained 72% on a dollar basis. Both international indices were significantly helped by the greenback’s fall as investors who had flocked to the dollar’s perceived safety began exiting after March.
Meanwhile, the credit markets continued to improve as lending activity gradually resumed. Treasuries were no longer in such demand, but bonds with credit risk basked in investors’ returning confidence. Investment-grade corporate bonds gained 21% according to the BC Corporate Investment Grade. The corresponding high-yield index rallied almost 54%.
For the 12-month period as a whole, the S&P 500 gained 9.80%. Within the U.S., mid-cap companies out-performed both large and small companies. In the large-cap realm, value stocks—which include the big banks, brokers, and insurers—dramatically underperformed growth stocks, although that relationship didn’t hold in the smaller-cap ranges. The MSCI-EAFE Index returned an impressive 27.71% in dollar terms (less than half that without factoring in the dollar’s depreciation). The MSCI Emerging Markets soared nearly 65% over the period. The Barclays Capital U.S. Aggregate Bond Index (“BCAB”) rose 13.79%, with junk bonds leading the rebound.
PERFORMANCE
For the year ended October 31, 2009, Transamerica Asset Allocation—Moderate Growth Portfolio Class A returned 17.47%. By comparison, its primary and secondary benchmarks, the Wilshire 5000 Total Market Index and the BCAB, returned 11.33% and 13.79%, respectively.
STRATEGY REVIEW
This portfolio is structured to provide a mix of approximately 70% equity and 30% fixed-income securities (including cash) under normal conditions. The equity side provides broad coverage of both domestic and international markets, across a range of investment styles. The fixed-income portion covers investment-grade and credit-sensitive holdings, as well as international bonds. The portfolio also includes emerging markets, global real estate, and alternative strategies. The goal is to provide investors one-stop coverage of the financial markets, and the portfolio is more broadly diversified than most traditional balanced funds. No one can predict with consistency which asset classes and investment styles will out-perform in any given quarter or year. But by diversifying across all of them, one can capture the long-term performance of each.
Diversification can also smooth out risk, although it can not prevent losses in short-term periods when many asset classes drop simultaneously, as happened in the recent downturn. Nevertheless, the portfolio out-performed both its equity benchmark and its bond benchmark over the 12-month period, and ranked in the top half of its Morningstar category. Three main factors explain the out-performance. First, as part of our standard diversification we hold about 30% of the equity stake in international stocks, and as mentioned, international markets gained more than the domestic stock market over the period. Also, we directed about a fourth of the international sleeve toward emerging markets, which soared.
7
Indeed, our two emerging-markets funds, Transamerica Oppenheimer Developing Markets and Transamerica WMC Emerging Markets, were the portfolio’s two biggest gainers, and most of the other international funds were among the top performers. Second, our bond portfolio, which had suffered through much of 2008, benefited from the strong rebound in the credit markets in 2009. Transamerica High Yield Bond surged significantly and Transamerica Loomis Sayles Bond, a multi-sector bond fund that has exposure to high-yield and foreign bonds, was up. Transamerica Van Kampen Emerging Markets Debt also gained significantly. Finally, although our asset-allocation targets are strategic in nature rather than tactical, we did hold our equity weight between six and 12 percentage points below the normal 70% target throughout the worst months of the stock market’s downturn. Given that fewer than half of our underlying funds beat their Morningstar category medians over the one-year period, we primarily credit the above factors for the portfolio’s out-performance.
During the period, we added two new underlying funds. Transamerica JPMorgan Core Bond, a historically successful bond strategy targeting high-quality bonds, was added to the Transamerica fund menu, enabling us to introduce it to the portfolio in July 2009. We invested in it both for its talented management and also to absorb some of the assets in Transamerica PIMCO Total Return, previously the only core bond fund available to us and thus a particularly large position. Transamerica MFS International Equity was also added in late 2008 after an I share was created. Its parent fund has a strong history of investing with a growth-leaning style, and it complemented other foreign funds we already had in place.
We also eliminated several funds during the period. In late 2008, we decided to sell our position in Transamerica Small/Mid Cap Value after its sole manager resigned and was replaced by a team with more of a growth than value-style background. In the spring, we liquidated our position in Transamerica Bjurman, Barry Micro Emerging Growth after its management decided to close their firm. Then in September, we discontinued using five funds because of a change in the Transamerica fund-lineup. The funds were Transamerica American Century Large Company Value, Transamerica Marsico Growth, Transamerica Marsico International Growth, Transamerica Evergreen International Small Cap, and Transamerica Evergreen Health Care. Assets in those funds were distributed to various other portfolio holdings in a way that preserved the careful diversification and balance of the portfolio.
The question on many investors’ minds now is whether stocks have soared too fast and too high given economic conditions. When global security markets do settle down, we believe the stock- and bond-picking skills of our underlying managers will take on more importance.
Michael Stout, CFA
Jon Hale, Ph.D., CFA
Jeff McConnell, CFA
Maciej Kowara, Ph.D., CFA
Co-Portfolio Managers
Morningstar Associates, LLC
8
Average Annual Total Return for Periods Ended 10/31/2009
| | 1 Year | | 5 Years | | 10 Years or
Life of Portfolio | | Inception Date | |
Class A (NAV) | | 17.47 | % | 2.93 | % | 3.32 | % | 03/01/2002 | |
Class A (POP) | | 10.96 | % | 1.77 | % | 2.56 | % | 03/01/2002 | |
Wilshire 5000* | | 11.33 | % | 1.05 | % | 2.17 | % | 03/01/2002 | |
Barclays Capital U.S. Aggregate Bond Index* | | 13.79 | % | 5.05 | % | 5.46 | % | 03/01/2002 | |
Class B (NAV) | | 16.69 | % | 2.24 | % | 2.63 | % | 03/01/2002 | |
Class B (POP) | | 11.69 | % | 2.07 | % | 2.63 | % | 03/01/2002 | |
Class C (NAV) | | 16.77 | % | 2.29 | % | 5.71 | % | 11/11/2002 | |
Class C (POP) | | 15.77 | % | 2.29 | % | 5.71 | % | 11/11/2002 | |
Class R (NAV) | | 17.29 | % | N/A | | (0.72 | )% | 06/15/2006 | |
NOTES
* The Wilshire 5000 Total Market (“Wilshire 5000”) Index and the Barclays Capital U.S. Aggregate Bond Index are unmanaged indices used as a general measure of market performance. Calculations assume dividends and capital gains are reinvested and do not include any managerial expenses. The 10 Years or Life of Portfolio calculation is based on life of Class A shares. You cannot invest directly in an index.
The performance data presented represents past performance; future results may vary. Performance data does not reflect the deduction of taxes that would be paid on portfolio distributions or the redemption of portfolio shares. Investment return and principal value will fluctuate so that an investor’s shares, when redeemed, may be worth more or less than their original cost. Current performance may be lower or higher than performance quoted. Please see www.transamericafunds.com for performance data current to the most recent month-end. Net Asset Value (“NAV”) returns include the reinvestment of dividends and capital gains but do not reflect any sales charges. Public Offering Price (“POP”) returns include the reinvestment of dividends and capital gains and reflects the maximum sales charge of 5.5% for A shares or the maximum applicable contingent deferred sales charge (5% in the 1st year, decreasing to 0% after 6 years) for Class B shares and 1% (during the first 12 months) for Class C shares. Shares purchased prior to March 1, 2004 are subject to a maximum applicable contingent deferred sales charge (5% in the 1st year, decreasing to 0% after 7 years) for Class B shares and (2% in the 1st year, decreasing to 0% after 2 years) for Class C shares.
Performance figures may reflect fee waivers and/or expense reimbursements by the Investment Adviser. Without such waivers and/or reimbursements, the performance would be lower. Future waivers and/or reimbursements are at the discretion of the Investment Adviser.
This material must be preceded or accompanied by a current prospectus, which includes specific contents regarding the investment objectives and policies of this portfolio.
9
Transamerica Asset Allocation — Moderate Portfolio
(unaudited)
MARKET ENVIRONMENT
The 12-month period ending October 31, 2009 was an eventful one in the financial markets. Although the period does not include September and October 2008—when we witnessed the demise of Lehman Brothers, the Merrill Lynch and Wachovia rescues, and the government seizures of Fannie Mae, Freddie Mac, Washington Mutual, and AIG—the market fallout from the financial sector’s near-collapse persisted well into the winter. With the housing market sinking further, banks taking massive write-offs, and even credit-worthy companies struggling to secure routine daily financing, the stock and bond markets remained in their panicked state well into 2009. The Standard and Poor’s 500 Composite Stock Index (“S&P 500”) continued to plunge until finally bottoming on March 9, 2009, by which point it was off 55% from its 2007 peak.
Measured from November 1, 2008 (the start of the fiscal year covered by this report), the S&P 500 lost about 29% through March 9. The losses in international markets were in the same neighborhood, although emerging markets fell less, thanks partly to improving oil prices in 2009’s first quarter. Aside from U.S. Treasuries—whose prices had been driven up by safety-seeking investors—most bonds had faltered along with the stock market through October 2008. But starting in November, the broader bond market gradually reclaimed its traditional status as a relatively safe harbor. Treasuries still reigned, but eventually high-quality corporate bonds also performed well as investors fled equities. The Barclays Capital Corporate Investment Grade Index (“BC Corporate Investment Grade”), which had lost almost 14% in September and October, recouped about 8% from November 1 through March 9, 2009. Junk-rated corporates still lagged, however.
The turning point arrived in early March as fears of a total financial meltdown eased, myriad stimulus initiatives progressed, and several economic indicators showed initial hints of stabilizing. The market rebound steamrolled unabated straight through the spring, summer, and early fall, before easing off in October. The rally, which saw the S&P 500 rise more than 55% from March 10 through October 31, favored the most economically sensitive sectors as investors grew more confident that the economy’s nadir had come and gone. Cyclical sectors, including industrials, technology, and especially the ravaged financials arena, recorded the most dramatic gains. The S&P 500’s financials sector shot up almost 128% over that stretch, while industrials and information technology both rebounded nearly 69%. Basic materials were close behind with a 65% return. Traditionally, defensive sectors, such as health care, consumer staples, and utilities, rebounded only about half as much. Other risky asset classes were also rewarded. Small-cap stocks jumped more than 65% as measured by the Russell 2000® Index, and the Morgan Stanley Capital International Emerging Markets Index (“MSCI Emerging Markets”) soared nearly 92% in U.S. dollar terms. Even the Morgan Stanley Capital International-Europe, Australasia, and Far East Index (“MSCI-EAFE”) of developed foreign markets gained 72% on a dollar basis. Both international indices were significantly helped by the greenback’s fall as investors who had flocked to the dollar’s perceived safety began exiting after March.
Meanwhile, the credit markets continued to improve as lending activity gradually resumed. Treasuries were no longer in such demand, but bonds with credit risk basked in investors’ returning confidence. Investment-grade corporate bonds gained 21% according to the BC Corporate Investment Grade. The corresponding high-yield index rallied almost 54%.
For the 12-month period as a whole, the S&P 500 gained 9.80%. Within the U.S., mid-cap companies out-performed both large and small companies. In the large-cap realm, value stocks—which include the big banks, brokers, and insurers—dramatically underperformed growth stocks, although that relationship didn’t hold in the smaller-cap ranges. The MSCI-EAFE Index returned an impressive 27.71% in dollar terms (less than half that without factoring in the dollar’s depreciation). The MSCI Emerging Markets soared nearly 65% over the period. The Barclays Capital U.S. Aggregate Bond Index (“BCAB”) rose 13.79%, with junk bonds leading the rebound.
PERFORMANCE
For the year ended October 31, 2009, Transamerica Asset Allocation—Moderate Portfolio Class A returned 19.99%. By comparison, its primary and secondary benchmarks, the Wilshire 5000 Total Market Index and the BCAB, returned 11.33% and 13.79%, respectively.
STRATEGY REVIEW
This portfolio is structured to provide a mix of approximately 50% equity and 50% fixed-income securities (including cash) under normal conditions. The equity side provides broad coverage of both domestic and international markets, across a range of investment styles. The fixed-income portion covers investment-grade and credit-sensitive holdings, as well as international bonds. The portfolio also includes emerging markets, global real estate, and alternative strategies. The goal is to provide investors one-stop coverage of the financial markets, and the portfolio is more broadly diversified than most traditional balanced funds. No one can predict with consistency which asset classes and investment styles will out-perform in any given quarter or year. But by diversifying across all of them, one can capture the long-term performance of each.
Diversification can also smooth out risk, although it can not prevent losses in short-term periods when many asset classes drop simultaneously, as happened in the recent downturn. Nevertheless, the portfolio out-performed both its equity benchmark and its bond benchmark over the 12-month period, and ranked in the top quartile of its Morningstar category. Three main factors explain the out-performance. First, as part of our standard diversification we hold about 30% of the equity stake in international stocks, and as mentioned, international markets gained more than the domestic stock market over the period. Also, we directed about a fourth of the international sleeve toward emerging markets, which soared.
10
Indeed, our two emerging-markets funds, Transamerica Oppenheimer Developing Markets and Transamerica WMC Emerging Markets, were the portfolio’s two biggest gainers, and most of the other international funds were among the top performers. Second, our bond portfolio, which had suffered through much of 2008, benefited from the strong rebound in the credit markets in 2009. Transamerica High Yield Bond surged significantly and Transamerica Loomis Sayles Bond, a multi-sector bond fund that has exposure to high-yield and foreign bonds, was up. Transamerica Van Kampen Emerging Markets Debt also gained significantly. Finally, although our asset-allocation targets are strategic in nature rather than tactical, we did hold our equity weight between six and 11 percentage points below the normal 50% target throughout the worst months of the stock market’s downturn. Given that fewer than half of our underlying funds beat their Morningstar category medians over the one-year period, we primarily credit the above factors for the portfolio’s out-performance.
During the period, we added three new underlying funds. Transamerica JPMorgan Core Bond, a historically successful bond strategy targeting high-quality bonds, was added to the Transamerica fund menu, enabling us to introduce it to the portfolio in July 2009. We invested in it both for its talented management and also to absorb some of the assets in Transamerica PIMCO Total Return, previously the only core bond fund available to us and thus a particularly large position. Transamerica Thornburg International Value has an outstanding record in the large-cap core style. We added the fund in November 2008, primarily on the basis of the manager’s skill, but the fund also fleshes out our large-cap style coverage. Transamerica MFS International Equity was also added in late 2008 after an I share was created. Its parent fund has a strong history of investing with a growth-leaning style, and it complemented other foreign funds we already had in place.
We also eliminated several funds during the period. In late 2008, we decided to sell our position in Transamerica Small/Mid Cap Value after its sole manager resigned and was replaced by a team with more of a growth than value-style background. In the spring, we liquidated our position in Transamerica Bjurman, Barry Micro Emerging Growth after its management decided to close their firm. Then in September, we discontinued using five funds because of a change in the Transamerica fund-lineup. The funds were Transamerica American Century Large Company Value, Transamerica Marsico Growth, Transamerica Marsico International Growth, Transamerica Evergreen International Small Cap, and Transamerica Evergreen Health Care. Assets in those funds were distributed to various other portfolio holdings in a way that preserved the careful diversification and balance of the portfolio.
The question on many investors’ minds now is whether stocks have soared too fast and too high given economic conditions. When global security markets do settle down, we believe the stock- and bond-picking skills of our underlying managers will take on more importance.
Michael Stout, CFA
Jon Hale, Ph.D., CFA
Jeff McConnell, CFA
Maciej Kowara, Ph.D., CFA
Co-Portfolio Managers
Morningstar Associates, LLC
11
Average Annual Total Return for Periods Ended 10/31/2009
| | 1 Year | | 5 Years | | 10 Years or
Life of Portfolio | | Inception Date | |
Class A (NAV) | | 19.99 | % | 3.68 | % | 4.25 | % | 03/01/2002 | |
Class A (POP) | | 13.40 | % | 2.52 | % | 3.49 | % | 03/01/2002 | |
Wilshire 5000* | | 11.33 | % | 1.05 | % | 2.17 | % | 03/01/2002 | |
Barclays Capital U.S. Aggregate Bond Index* | | 13.79 | % | 5.05 | % | 5.46 | % | 03/01/2002 | |
Class B (NAV) | | 19.16 | % | 3.00 | % | 3.57 | % | 03/01/2002 | |
Class B (POP) | | 14.16 | % | 2.83 | % | 3.57 | % | 03/01/2002 | |
Class C (NAV) | | 19.24 | % | 3.03 | % | 6.05 | % | 11/11/2002 | |
Class C (POP) | | 18.24 | % | 3.03 | % | 6.05 | % | 11/11/2002 | |
Class R (NAV) | | 19.81 | % | N/A | | 1.24 | % | 06/15/2006 | |
NOTES
* The Wilshire 5000 Total Market (“Wilshire 5000”) Index and the Barclays Capital U.S. Aggregate Bond Index are unmanaged indices used as a general measure of market performance. Calculations assume dividends and capital gains are reinvested and do not include any managerial expenses. The 10 Years or Life of Portfolio calculation is based on life of Class A shares. You cannot invest directly in an index.
The performance data presented represents past performance; future results may vary. Performance data does not reflect the deduction of taxes that would be paid on portfolio distributions or the redemption of portfolio shares. Investment return and principal value will fluctuate so that an investor’s shares, when redeemed, may be worth more or less than their original cost. Current performance may be lower or higher than performance quoted. Please see www.transamericafunds.com for performance data current to the most recent month-end. Net Asset Value (“NAV”) returns include the reinvestment of dividends and capital gains but do not reflect any sales charges. Public Offering Price (“POP”) returns include the reinvestment of dividends and capital gains and reflects the maximum sales charge of 5.5% for A shares or the maximum applicable contingent deferred sales charge (5% in the 1st year, decreasing to 0% after 6 years) for Class B shares and 1% (during the first 12 months) for Class C shares. Shares purchased prior to March 1, 2004 are subject to a maximum applicable contingent deferred sales charge (5% in the 1st year, decreasing to 0% after 7 years) for Class B shares and (2% in the 1st year, decreasing to 0% after 2 years) for Class C shares.
Performance figures may reflect fee waivers and/or expense reimbursements by the Investment Adviser. Without such waivers and/or reimbursements, the performance would be lower. Future waivers and/or reimbursements are at the discretion of the Investment Adviser.
This material must be preceded or accompanied by a current prospectus, which includes specific contents regarding the investment objectives and policies of this portfolio.
12
Transamerica Multi-Manager Alternative Strategies Portfolio
(unaudited)
MARKET ENVIRONMENT
The 12-month period ending October 31, 2009 was an eventful one in the financial markets. Although the period does not include September and October 2008—when we witnessed the demise of Lehman Brothers, the Merrill Lynch and Wachovia rescues, and the government seizures of Fannie Mae, Freddie Mac, Washington Mutual, and AIG—the market fallout from the financial sector’s near-collapse persisted well into the winter. With the housing market sinking further, banks taking massive write-offs, and even credit-worthy companies struggling to secure routine daily financing, the stock and bond markets remained in their panicked state well into 2009. The Standard and Poor’s 500 Composite Stock Index (“S&P 500”) continued to plunge until finally bottoming on March 9, 2009, by which point it was off 55% from its 2007 peak.
Measured from November 1, 2008 (the start of the fiscal year covered by this report), the S&P 500 lost about 29% through March 9. The losses in international markets were in the same neighborhood, although emerging markets fell less, thanks partly to improving oil prices in 2009’s first quarter. Aside from U.S. Treasuries—whose prices had been driven up by safety-seeking investors—most bonds had faltered along with the stock market through October 2008. But starting in November, the broader bond market gradually reclaimed its traditional status as a relatively safe harbor. Treasuries still reigned, but eventually high-quality corporate bonds also performed well as investors fled equities. The Barclays Capital Corporate Investment Grade Index (“BC Corporate Investment Grade”), which had lost almost 14% in September and October, recouped about 8% from November 1 through March 9, 2009. Junk-rated corporates still lagged, however.
The turning point arrived in early March as fears of a total financial meltdown eased, myriad stimulus initiatives progressed, and several economic indicators showed initial hints of stabilizing. The market rebound steamrolled unabated straight through the spring, summer, and early fall, before easing off in October. The rally, which saw the S&P 500 recover more than 55% from March 10 through October 31, favored the most economically sensitive sectors as investors grew more confident that the economy’s nadir had come and gone. Cyclical sectors, including industrials, technology, and especially the ravaged financials arena, recorded the most dramatic gains. The S&P 500’s financials sector shot up almost 128% over that stretch, while industrials and information technology both rebounded nearly 69%. Basic materials were close behind with a 65% return. Traditionally, defensive sectors, such as health care, consumer staples, and utilities, rebounded only about half as much. Other risky asset classes were also rewarded. Small-cap stocks jumped more than 65% as measured by the Russell 2000® Index, and the Morgan Stanley Capital International Emerging Markets Index (“MSCI Emerging Markets”) soared nearly 92% in U.S. dollar terms. Even the Morgan Stanley Capital International-Europe, Australasia, and Far East Index (“MSCI-EAFE”) of developed international markets gained 72% on a dollar basis; that result was significantly influenced by the greenback’s fall against most currencies as investors who had flocked to the dollar’s perceived safety began exiting after March.
Meanwhile, the credit markets continued to improve as lending activity gradually resumed. Treasuries were no longer in such demand, but bonds with credit risk basked in investors’ returning confidence. Investment-grade corporate bonds gained 21% according to the BC Corporate Investment Grade. The corresponding high-yield index rallied almost 54%.
For the 12-month period as a whole, the S&P 500 gained 9.80%. Within the U.S., mid-cap companies out-performed both large and small companies. In the large-cap realm, value stocks—which include the big banks, brokers, and insurers—dramatically underperformed growth stocks, although that relationship didn’t hold in the smaller-cap ranges. The MSCI-EAFE Index returned an impressive 27.71% in dollar terms (less than half that without factoring in the dollar’s depreciation). The MSCI Emerging Markets soared nearly 65% over the period. The Barclays Capital U.S. Aggregate Bond Index rose 13.79%, with junk bonds leading the rebound.
PERFORMANCE
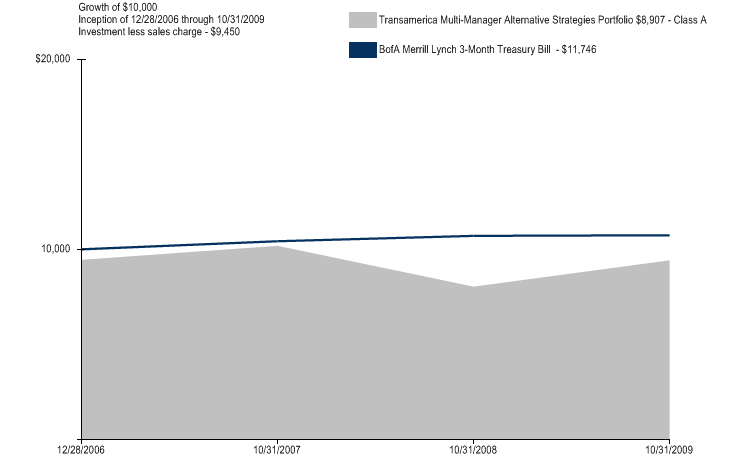
For the year ended October 31, 2009, Transamerica Multi-Manager Alternative Strategies Portfolio Class A returned 17.21%. By comparison, its benchmark, the Bank of America Merrill Lynch 3-Month Treasury Bill + 3% Wrap (“BofA Merrill Lynch 3-Month Treasury Bill”), returned 3.35%.
STRATEGY REVIEW
This portfolio is meant to provide diversification away from the mainstream stock and bond asset classes by combining absolute-return, unconventional equity, and lower-correlated fixed-income sleeves. Even though replicating hedge-fund performance is not the portfolio’s objective, we aim to provide a hedge-like performance profile in a mutual-fund format.
Viewed in this light, the portfolio by and large achieved its objectives over the 12-month reporting period. From November 1, 2008 to the stock market’s low point on March 9, 2009, the S&P 500 lost about 29% and the portfolio lost less than 11%. In the subsequent rebound between March 10 and October 31, 2009, the S&P 500 rose slightly more than 55% while the portfolio gained more than 31%. It was essentially impossible to avoid high correlation with the equity market amid one of the sharpest global market moves in history, but the portfolio was less correlated with the stock market on the downside than it was on the upside. Its loss during the downturn amounted to about 37% of the S&P 500’s loss, while during the rebound the portfolio captured more than half of the index’s gain. Although the portfolio exhibited increased stock-market correlation over the 12-month period, it handily out-performed both the stock and bond markets, as well as its BofA Merrill Lynch 3 Month Treasury Bill benchmark.
13
This performance came despite disappointing showings from some of the underlying funds. In particular, three of the absolute-return managers lagged. Transamerica BNY Mellon Market Neutral Strategy posted a loss for the period, while Transamerica Federated Market Opportunity and Transamerica UBS Dynamic Alpha (the latter under new management as of this writing and renamed Transamerica First Quadrant Global Macro) underperformed both stocks and bonds. These funds did, however, live up to our expectation that they would be the least market-correlated among the underlying funds; and as a group, they were among the best performers in the downturn. Meanwhile other underlying funds delivered powerful returns. Transamerica Oppenheimer Developing Markets, Transamerica Loomis Sayles Bond, and Transamerica Schroders International Small Cap each returned in excess of 40% for the period. Solid gains from Transamerica BlackRock Natural Resources, Transamerica BlackRock Global Allocation, and Transamerica JPMorgan International Bond filled in the middle.
The portfolio is not tactical in nature, so we did not actively change the allocations during the period. Indeed, our most important decision of the year was to stick with our carefully designed strategic asset mix as the markets were plummeting. Over the year as a whole, our weightings of the underlying strategies resulted in a decent overall performance pattern under extreme circumstances.
The portfolio did undergo some small changes, however. In the spring, we liquidated our position in Transamerica Bjurman, Barry Micro Emerging Growth because its management decided to close their firm. We moved those assets to Transamerica Third Avenue Value. One of the more idiosyncratic equity managers around, Transamerica Third Avenue Value is a good fit for this portfolio. In late September, Transamerica Evergreen International Small Cap was no longer a part of the fund-lineup due to changes effected by Transamerica Asset Management, Inc., the fund’s adviser. The portfolio received shares of Transamerica Neuberger Berman International as part of that change. Those shares make up less than half a percent of the portfolio’s assets.
This past year’s extreme market volatility served as a fairly intense stress test for this portfolio’s approach, and we take some encouragement from the portfolio’s performance over the period despite certain disappointments. We cannot say whether the stock and credit markets’ heady gains of the last eight months are warranted by economic conditions, or poised to reverse to one degree or another. But the past year does afford greater confidence that the portfolio could reasonably withstand any residual aftershocks that might reverberate in the months ahead.
Michael Stout, CFA
Jon Hale, Ph.D., CFA
Jeff McConnell, CFA
Maciej Kowara, Ph.D.,CFA
Co-Portfolio Managers
Morningstar Associates, LLC
14
Average Annual Total Return for Periods Ended 10/31/2009
| | 1 Year | | 10 Years or
Life of Portfolio | | Inception Date | |
Class A (NAV) | | 17.21 | % | (0.10 | )% | 12/28/2006 | |
Class A (POP) | | 10.80 | % | (2.06 | )% | 12/28/2006 | |
BofA Merrill Lynch 3-Month Treasury Bill * | | 3.35 | % | 5.67 | % | 12/28/2006 | |
Class C (NAV) | | 16.37 | % | (0.74 | )% | 12/28/2006 | |
Class C (POP) | | 15.37 | % | (0.74 | )% | 12/28/2006 | |
NOTES
* The Bank of America Merrill Lynch 3-Month Treasury Bill + 3% Wrap (“BofA Merrill Lynch 3-Month Treasury Bill”) Index is an unmanaged index used as a general measure of market performance. Calculations assume dividends and capital gains are reinvested and do not include any managerial expenses. The 10 Years or Life of Portfolio calculation is based on life of Class A shares. You cannot invest directly in an index.
The performance data presented represents past performance; future results may vary. Performance data does not reflect the deduction of taxes that would be paid on portfolio distributions or the redemption of portfolio shares. Investment return and principal value will fluctuate so that an investor’s shares, when redeemed, may be worth more or less than their original cost. Current performance may be lower or higher than performance quoted. Please see www.transamericafunds.com for performance data current to the most recent month-end. Net Asset Value (“NAV”) returns include the reinvestment of dividends and capital gains but do not reflect any sales charges. Public Offering Price (“POP”) returns include the reinvestment of dividends and capital gains and reflects the maximum sales charge of 5.5% for A shares or the maximum applicable contingent deferred sales charge of 1% (during the first 12 months) for Class C shares.
Performance figures may reflect fee waivers and/or expense reimbursements by the Investment Adviser. Without such waivers and/or reimbursements, the performance would be lower. Future waivers and/or reimbursements are at the discretion of the Investment Adviser.
The portfolio may utilize strategies and hedging techniques in matched combinations that are designed to neutralize or offset the risks of each strategy employing these techniques separately. Some strategies include long/short and market neutral strategies; bear markets strategies; tactical investment strategies (debt and/or equity); foreign currency trading strategies; global real estate securities; commodities and/or natural resources and/or precious metals; and non-traditional investments (such as micro-cap stocks and emerging market stocks). There is no assurance that these strategies will protect against losses. Certain hedging techniques and leverage employed in the management of the portfolio may accelerate the velocity of possible losses. This material must be preceded or accompanied by a current prospectus, which includes specific contents regarding the investment objectives and policies of this portfolio.
15
Transamerica Multi-Manager International Portfolio
(unaudited)
MARKET ENVIRONMENT
The 12-month period ending October 31, 2009 was an eventful one in the global financial markets. Although the period does not include September and October 2008, when a number of major financial institutions were seized, rescued, or simply allowed to fail, the market fallout from the financial sector’s near-collapse persisted well into the winter. With the U.S. housing market sinking further, banks taking massive write-offs, and even credit-worthy companies struggling to secure routine daily financing, the stock and bond markets remained in their panicked state well into 2009.
From November 1, 2008 (the start of the fiscal year covered by this report), the Morgan Stanley Capital International World ex-US Index (“MSCI WORLD ex-US (USD)”) lost close to 26% through its bottom on March 9. The Morgan Stanley Capital International Emerging Markets Index (“MSCI Emerging Markets”) was down almost 23% from November 1, 2008 to its low point on March 2, 2009.
The turning point arrived in early March as fears of a total financial meltdown eased, myriad stimulus initiatives progressed, and several economic indicators showed initial hints of stabilizing. The market rebound steamrolled unabated straight through the spring, summer, and early fall, before easing off in October. The MSCI World ex-US (USD) rose more than 72% from March 10 through October 31 in U.S. dollar terms, helped significantly by the greenback’s fall as investors who had flocked to the dollar’s perceived safety began exiting after March. The rally favored cyclical sectors, and riskier stocks in general, as investors grew more confident that the economy’s nadir had come and gone. International small-cap stocks jumped more than 83% over that stretch in dollar terms, as measured by the Morgan Stanley Capital International EAFE Small Cap Index (“MSCI-EAFE Small Cap”). But emerging markets were the strongest. The MSCI Emerging Markets soared nearly 92%.
Over the 12-month period as a whole, the MSCI World ex-US (USD) gained 27.83%, the MSCI EAFE Small Cap rose 48.74%, and the MSCI Emerging Markets trumped both with a 64.13% return.
PERFORMANCE
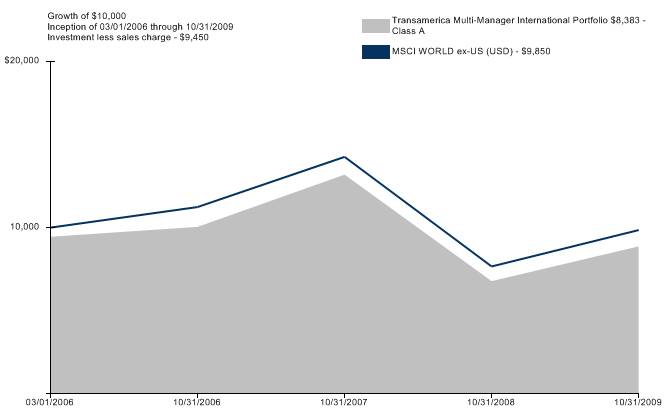
For the year ended October 31, 2009, Transamerica Multi-Manager International Portfolio Class A returned 30.86%. By comparison, its benchmark, the MSCI World ex-US (USD), returned 28.55%.
STRATEGY REVIEW
The portfolio is structured to provide broad coverage of international equity markets. Its nine underlying portfolio holdings cover a range of international investing styles, including large value, large growth, mid cap, small cap, emerging markets, global real estate, and global tactical asset allocation. The portfolio typically has approximately 75% of assets in developed-markets stocks and 25% in emerging markets. Large-cap stocks are targeted at 65% to 70% of the portfolio, with mid- and small-cap stocks comprising 30% to 35%. The portfolio typically contains smaller positions of about 5% each in the underlying global real estate and global tactical asset-allocation funds. Our objective is to provide investors with comprehensive coverage of international markets in a single investment vehicle. As such, the portfolio is more broadly diversified than most international portfolios or indices. No one can predict with consistency which investment styles will out-perform in any given quarter or year, but by diversifying across several of them, one can capture the long-term performance of each.
The portfolio outpaced its MSCI World ex-US (USD) benchmark over the 12-month reporting period. During the market’s downturn the portfolio lost less than the index as, interestingly, its small-cap and emerging-markets funds held up better than the broad benchmark, which is dominated by larger-cap stocks from developed markets. The hardest-hit stocks in most developed markets were the giant banks and other large financial institutions at the center of the global credit crisis and related government bailouts. Smaller-cap stocks were less affected, while emerging markets still boasted their strong long-term growth prospects and thus continued to attract investors. Transamerica BlackRock Global Allocation also held up better than the all-stock benchmark, as one would expect from a hybrid stock/bond fund, and Transamerica Neuberger Berman International performed relatively well on the downside. The portfolio trailed in the rebound phase, however. Its three major large-cap holdings—Transamerica Thornburg International Value, Transamerica MFS International Equity, and Transamerica Marsico International Growth (which was in the portfolio until late September)—didn’t quite keep pace with the index’s torrid rally from March to October. The rebound favored riskier fare that these portfolios don’t typically hold. And Transamerica BlackRock Global Allocation, while admirably capturing more of the market’s movement on the upside than it did on the downside, nevertheless diluted the portfolio’s gains owing to its bond exposure.
For the 12-month period as a whole, the majority of the underlying funds performed well, and the overall portfolio surpassed the MSCI World ex-US (USD) index by slightly more than two percentage points.
16
In September, we discontinued using Transamerica Marsico International Growth and Transamerica Evergreen International Small Cap because of a change in the Transamerica fund-lineup rationalization. Assets in those funds were distributed to other portfolio holdings in a way that preserved the diversification and balance of the portfolio.
The question on many investors’ minds now is whether stocks have soared too fast and too high given global economic conditions. If the security markets do settle down, as they surely must eventually, we believe the stock-picking skills of our underlying managers will take on more importance.
Michael Stout, CFA
Jon Hale, Ph.D., CFA
Jeff McConnell, CFA
Maciej Kowara, Ph.D., CFA
Co-Portfolio Managers
Morningstar Associates, LLC
17
Average Annual Total Return for Periods Ended 10/31/2009
| | 1 Year | | 10 Years or
Life of Portfolio | | Inception Date | |
Class A (NAV) | | 30.86 | % | (1.71 | )% | 03/01/2006 | |
Class A (POP) | | 23.71 | % | (3.21 | )% | 03/01/2006 | |
MSCI WORLD ex-US (USD)* | | 28.55 | % | 0.03 | % | 03/01/2006 | |
Class B (NAV) | | 30.00 | % | (2.41 | )% | 03/01/2006 | |
Class B (POP) | | 25.00 | % | (2.91 | )% | 03/01/2006 | |
Class C (NAV) | | 30.00 | % | (2.38 | )% | 03/01/2006 | |
Class C (POP) | | 29.00 | % | (2.38 | )% | 03/01/2006 | |
NOTES
* The Morgan Stanley Capital International World ex-US ("MSCI World ex-US (USD)") Index is an unmanaged index used as a general measure of market performance. Calculations assume dividends and capital gains are reinvested and do not include any managerial expenses. The 10 Years or Life of Portfolio calculation is based on life of Class A shares. You cannot invest directly in an index.
The performance data presented represents past performance; future results may vary. Performance data does not reflect the deduction of taxes that would be paid on portfolio distributions or the redemption of portfolio shares. Investment return and principal value will fluctuate so that an investor’s shares, when redeemed, may be worth more or less than their original cost. Current performance may be lower or higher than performance quoted. Please see www.transamericafunds.com for performance data current to the most recent month-end. Net Asset Value (“NAV”) returns include the reinvestment of dividends and capital gains but do not reflect any sales charges. Public Offering Price (“POP”) returns include the reinvestment of dividends and capital gains and reflects the maximum sales charge of 5.5% for A shares or the maximum applicable contingent deferred sales charge (5% in the 1st year, decreasing to 0% after 6 years) for Class B shares and 1% (during the first 12 months) for Class C shares.
Performance figures may reflect fee waivers and/or expense reimbursements by the Investment Adviser. Without such waivers and/or reimbursements, the performance would be lower. Future waivers and/or reimbursements are at the discretion of the Investment Adviser.
Investments in global/international markets involve risks not associated with U.S. markets, such as currency fluctuations, adverse social and political developments, and the relatively small size and lesser liquidity of the markets. This material must be preceded or accompanied by a current prospectus, which includes specific contents regarding the investment objectives and policies of this portfolio.
18
Understanding Your Portfolios’ Expenses
(unaudited)
SHAREHOLDER EXPENSES
Portfolio shareholders may incur two types of costs: (1) transaction costs, including sales charges (loads) on purchases, contingent deferred sales charges on redemptions and redemption fees; and (2) ongoing costs, including management fees, and other portfolio expenses.
The following examples are intended to help you understand your ongoing costs (in dollars and cents) of investing in the portfolios and to compare these costs with the ongoing costs of investing in other portfolios.
The examples are based on an investment of $1,000 invested at May 1, 2009 and held for the entire period until October 31, 2009.
ACTUAL EXPENSES
The information in the table under the heading “Actual Expenses” provides information about actual account values and actual expenses. You may use the information in these columns, together with the amount you invested, to estimate the expenses that you paid over the period. Simply divide your account value by $1,000 (for example, an $8,600 account value divided by $1,000 = $8.6), then multiply the result by the number in the appropriate column for your share class titled “Expenses Paid During Period” to estimate the expenses you paid on your account during this period. If your account is an IRA, your expenses could have included a $15 annual fee. The amount of any fee paid through your account would increase the estimate of expenses you paid during the period and decrease your ending account value.
HYPOTHETICAL EXAMPLES FOR COMPARISON PURPOSES
The information in the table under the heading “Hypothetical Expenses” provides information about hypothetical account values and hypothetical expenses based on the portfolios’ actual expense ratios and an assumed rate of return of 5% per year before expenses, which is not the portfolios’ actual returns. The hypothetical account values and expenses may not be used to estimate the actual ending account balance or expenses you paid for the period. You may use this information to compare the ongoing costs of investing in your portfolios and other portfolios. To do so, compare this 5% hypothetical example with the 5% hypothetical examples that appear in the shareholder reports of the other portfolios. As in the case of the actual expense example, if your account is subject to an IRA fee, the amount of the fee paid through your account would increase the hypothetical expenses you would have paid during the period and decrease the hypothetical ending account value.
Please note that the expenses shown in the table are meant to highlight your ongoing costs only and do not reflect any transactional costs, such as sales charges, redemption fees, brokerage commissions paid on purchases and sales of portfolio shares. Therefore, the information under the heading “Hypothetical Expenses” is useful in comparing ongoing costs only, and will not help you determine the relative total costs of owning different portfolios. If any of these transaction costs were included, your costs would be higher. The expenses shown in the table do not reflect any fees that may be charged to you by brokers, financial intermediaries or other financial institutions.
| | | | Actual Expenses | | Hypothetical Expenses (b) | | | |
Portfolio Name | | Beginning
Account Value | | Ending Account
Value | | Expenses Paid
During Period (a) | | Ending Account
Value | | Expenses Paid
During Period (a) | | Annualized
Expense Ratio (c) | |
Transamerica Asset Allocation - Conservative Portfolio | | | | | | | | | | | | | |
Class A | | $ | 1,000.00 | | $ | 1,171.50 | | $ | 3.56 | | $ | 1,021.93 | | $ | 3.31 | | 0.65 | % |
Class B | | 1,000.00 | | 1,167.90 | | 6.94 | | 1,018.80 | | 6.46 | | 1.27 | |
Class C | | 1,000.00 | | 1,168.30 | | 6.72 | | 1,019.00 | | 6.26 | | 1.23 | |
Class R | | 1,000.00 | | 1,170.50 | | 5.09 | | 1,020.52 | | 4.74 | | 0.93 | |
Transamerica Asset Allocation - Growth Portfolio | | | | | | | | | | | | | |
Class A | | 1,000.00 | | 1,209.80 | | 3.95 | | 1,021.63 | | 3.62 | | 0.71 | |
Class B | | 1,000.00 | | 1,206.50 | | 7.67 | | 1,018.25 | | 7.02 | | 1.38 | |
Class C | | 1,000.00 | | 1,205.20 | | 7.23 | | 1,018.65 | | 6.61 | | 1.30 | |
Class R | | 1,000.00 | | 1,208.60 | | 5.01 | | 1,020.67 | | 4.58 | | 0.90 | |
Transamerica Asset Allocation - Moderate Growth Portfolio | | | | | | | | | | | | | |
Class A | | 1,000.00 | | 1,190.20 | | 3.59 | | 1,021.93 | | 3.31 | | 0.65 | |
Class B | | 1,000.00 | | 1,185.80 | | 7.22 | | 1,018.60 | | 6.67 | | 1.31 | |
Class C | | 1,000.00 | | 1,186.20 | | 6.94 | | 1,018.85 | | 6.41 | | 1.26 | |
Class R | | 1,000.00 | | 1,189.40 | | 4.69 | | 1,020.92 | | 4.33 | | 0.85 | |
Transamerica Asset Allocation - Moderate Portfolio | | | | | | | | | | | | | |
Class A | | 1,000.00 | | 1,178.70 | | 3.40 | | 1,022.08 | | 3.16 | | 0.62 | |
Class B | | 1,000.00 | | 1,175.40 | | 7.02 | | 1,018.75 | | 6.51 | | 1.28 | |
Class C | | 1,000.00 | | 1,176.10 | | 6.75 | | 1,019.00 | | 6.26 | | 1.23 | |
Class R | | 1,000.00 | | 1,178.20 | | 4.94 | | 1,020.67 | | 4.58 | | 0.90 | |
Transamerica Multi-Manager Alternative Strategies Portfolio | | | | | | | | | | | | | |
Class A | | 1,000.00 | | 1,164.40 | | 4.31 | | 1,021.22 | | 4.02 | | 0.79 | |
Class C | | 1,000.00 | | 1,160.20 | | 7.73 | | 1,018.05 | | 7.22 | | 1.42 | |
Transamerica Multi-Manager International Portfolio | | | | | | | | | | | | | |
Class A | | 1,000.00 | | 1,304.30 | | 4.07 | | 1,021.68 | | 3.57 | | 0.70 | |
Class B | | 1,000.00 | | 1,300.00 | | 8.41 | | 1,017.90 | | 7.37 | | 1.45 | |
Class C | | 1,000.00 | | 1,300.00 | | 8.12 | | 1,018.15 | | 7.12 | | 1.40 | |
| | | | | | | | | | | | | | | | | | |
(a) Expenses are calculated using the portfolios’ annualized expense ratios (as disclosed in the table), multiplied by the average account values for the period, multiplied by the number of days in the period (184 days), and divided by the number of days in the year (365 days).
(b) 5% return per year before expenses.
(c) Expense ratios do not include expenses of the investment companies in which the portfolios invest.
19
Schedules of Investments Composition
At October 31, 2009
(the following charts summarize the Schedules of Investments of the portfolios by asset type)
(unaudited)
Transamerica Asset Allocation - Conservative Portfolio
Bonds | | 43.4 | % |
U.S. Stocks | | 24.1 | |
Tactical and Specialty | | 15.8 | |
Global/International Stocks | | 8.3 | |
Inflation-Protected Securities | | 7.7 | |
Capital Preservation | | 0.6 | |
Other Assets and Liabilities - Net | | 0.1 | |
Total | | 100.0 | % |
Transamerica Asset Allocation - Growth Portfolio
U.S. Stocks | | 66.5 | % |
Global/International Stocks | | 20.9 | |
Tactical and Specialty | | 12.6 | |
Capital Preservation | | 0.2 | |
Other Assets and Liabilities - Net | | (0.2 | ) |
Total | | 100.0 | % |
Transamerica Asset Allocation - Moderate Growth Portfolio
U.S. Stocks | | 47.0 | % |
Bonds | | 20.5 | |
Tactical and Specialty | | 14.4 | |
Global/International Stocks | | 14.0 | |
Inflation-Protected Securities | | 3.9 | |
Capital Preservation | | 0.2 | |
Other Assets and Liabilities - Net | | 0.0 | * |
Total | | 100.0 | % |
Transamerica Asset Allocation - Moderate Portfolio
Bonds | | 34.6 | % |
U.S. Stocks | | 33.0 | |
Tactical and Specialty | | 15.7 | |
Global/International Stocks | | 10.5 | |
Inflation-Protected Securities | | 5.9 | |
Capital Preservation | | 0.3 | |
Other Assets and Liabilities - Net | | 0.0 | * |
Total | | 100.0 | % |
Transamerica Multi-Manager Alternative Strategies Portfolio
Tactical and Specialty | | 72.6 | % |
Bond | | 11.0 | |
Global/International Stocks | | 8.7 | |
Capital Preservation | | 4.5 | |
U.S. Stock | | 3.1 | |
Other Assets and Liabilities - Net | | 0.1 | |
Total | | 100.0 | % |
Transamerica Multi-Manager International Portfolio
Global/International Stocks | | 88.3 | % |
Tactical and Specialty | | 11.5 | |
Other Assets and Liabilities - Net | | 0.2 | |
Total | | 100.0 | % |
* Amount rounds to less than 0.05%.
20
Transamerica Asset Allocation – Conservative Portfolio
SCHEDULE OF INVESTMENTS
At October 31, 2009
(all amounts except share amounts in thousands)
| | Shares | | Value | |
INVESTMENT COMPANIES - 99.9% € | | | | | |
Bonds - 43.4% | | | | | |
Transamerica Convertible Securities | | 21,957 | | $ | 185 | |
Transamerica Flexible Income | | 1,925,184 | | 16,114 | |
Transamerica High Yield Bond | | 7,361,377 | | 62,572 | |
Transamerica JPMorgan Core Bond | | 1,997,577 | | 20,136 | |
Transamerica JPMorgan International Bond | | 5,950,515 | | 69,264 | |
Transamerica PIMCO Total Return | | 11,886,249 | | 128,965 | |
Transamerica Short-Term Bond | | 8,064,792 | | 81,292 | |
Transamerica Van Kampen Emerging Markets Debt | | 3,751,014 | | 38,373 | |
Capital Preservation - 0.6% | | | | | |
Transamerica Money Market | | 5,943,850 | | 5,944 | |
Global/International Stocks - 8.3% | | | | | |
Transamerica AllianceBernstein International Value | | 810,065 | | 6,319 | |
Transamerica MFS International Equity ‡ | | 1,779,527 | | 14,521 | |
Transamerica Neuberger Berman International | | 1,126,277 | | 8,526 | |
Transamerica Oppenheimer Developing Markets | | 1,098,117 | | 11,113 | |
Transamerica Schroders International Small Cap | | 1,865,666 | | 15,336 | |
Transamerica Thornburg International Value | | 1,995,452 | | 19,335 | |
Transamerica WMC Emerging Markets ‡ | | 426,474 | | 5,143 | |
Inflation-Protected Securities - 7.7% | | | | | |
Transamerica PIMCO Real Return TIPS | | 6,942,815 | | 74,427 | |
Tactical and Specialty - 15.8% | | | | | |
Transamerica BlackRock Global Allocation | | 1,834,101 | | 18,323 | |
Transamerica BlackRock Natural Resources | | 950,243 | | 9,531 | |
Transamerica BNY Mellon Market Neutral Strategy | | 864,920 | | 7,291 | |
Transamerica Clarion Global Real Estate Securities | | 1,299,182 | | 13,992 | |
Transamerica Federated Market Opportunity | | 1,085,367 | | 9,757 | |
Transamerica Loomis Sayles Bond | | 8,099,100 | | 80,506 | |
Transamerica Science & Technology ‡ | | 991,175 | | 3,628 | |
Transamerica UBS Dynamic Alpha | | 1,553,847 | | 9,447 | |
U.S. Stocks - 24.1% | | | | | |
Transamerica BlackRock Large Cap Value | | 5,784,019 | | 45,173 | |
Transamerica Equity | | 4,804,949 | | 36,950 | |
Transamerica Growth Opportunities ‡ | | 1,152,647 | | 8,968 | |
Transamerica Jennison Growth | | 5,142,159 | | 52,296 | |
Transamerica JPMorgan Mid Cap Value | | 1,124,327 | | 9,309 | |
Transamerica Oppenheimer Small- & Mid-Cap Value | | 1,036,296 | | 8,000 | |
Transamerica Third Avenue Value ‡ | | 987,505 | | 18,210 | |
Transamerica UBS Large Cap Value | | 4,552,615 | | 38,424 | |
Transamerica Van Kampen Mid-Cap Growth | | 841,163 | | 8,058 | |
Transamerica Van Kampen Small Company Growth | | 636,576 | | 5,615 | |
Total Investment Companies (cost $951,241) # | | | | 961,043 | |
Other Assets and Liabilities - Net | | | | 1,045 | |
Net Assets | | | | $ | 962,088 | |
NOTES TO SCHEDULE OF INVESTMENTS:
€ The portfolio invests its assets in the Class I shares of the affiliated fund of Transamerica Funds.
‡ Non-income producing security.
# Aggregate cost for federal income tax purposes is $956,175. Aggregate gross unrealized appreciation/depreciation for all securities in which there is an excess of value over tax cost were $38,681 and $33,813, respectively. Net unrealized appreciation for tax purposes is $4,868.
VALUATION SUMMARY:
| | Level 1 | | Level 2 | | Level 3 | | Total | |
Investment Companies | | $ | 961,043 | | $ | — | | $ | — | | $ | 961,043 | |
| | | | | | | | | | | | | |
The notes to the financial statements are an integral part of this report.
21
Transamerica Asset Allocation – Growth Portfolio
SCHEDULE OF INVESTMENTS
At October 31, 2009
(all amounts except share amounts in thousands)
| | Shares | | Value | |
INVESTMENT COMPANIES - 100.2% € | | | | | |
Capital Preservation - 0.2% | | | | | |
Transamerica Money Market | | 2,949,858 | | $ | 2,950 | |
Global/International Stocks - 20.9% | | | | | |
Transamerica AllianceBernstein International Value | | 4,707,666 | | 36,720 | |
Transamerica MFS International Equity ‡ | | 3,130,374 | | 25,544 | |
Transamerica Neuberger Berman International | | 9,434,385 | | 71,418 | |
Transamerica Oppenheimer Developing Markets | | 7,409,013 | | 74,980 | |
Transamerica Schroders International Small Cap | | 7,348,869 | | 60,408 | |
Transamerica Thornburg International Value | | 4,800,754 | | 46,519 | |
Transamerica WMC Emerging Markets ‡ | | 387,510 | | 4,673 | |
Tactical and Specialty - 12.6% | | | | | |
Transamerica BlackRock Global Allocation | | 4,852,624 | | 48,478 | |
Transamerica BlackRock Natural Resources | | 1,603,983 | | 16,088 | |
Transamerica BNY Mellon Market Neutral Strategy | | 1,123,989 | | 9,475 | |
Transamerica Clarion Global Real Estate Securities | | 7,191,645 | | 77,454 | |
Transamerica Federated Market Opportunity | | 1,347,724 | | 12,116 | |
Transamerica Science & Technology ‡ | | 4,272,282 | | 15,637 | |
Transamerica UBS Dynamic Alpha | | 2,371,907 | | 14,421 | |
U.S. Stocks - 66.5% | | | | | |
Transamerica BlackRock Large Cap Value | | 25,838,486 | | 201,798 | |
Transamerica Equity | | 24,597,338 | | 189,154 | |
Transamerica Growth Opportunities ‡ | | 4,297,784 | | 33,437 | |
Transamerica Jennison Growth | | 20,563,098 | | 209,126 | |
Transamerica JPMorgan Mid Cap Value | | 5,472,542 | | 45,313 | |
Transamerica Oppenheimer Small- & Mid-Cap Value | | 4,145,316 | | 32,002 | |
Transamerica Third Avenue Value ‡ | | 3,016,840 | | 55,631 | |
Transamerica UBS Large Cap Value | | 23,079,598 | | 194,791 | |
Transamerica Van Kampen Mid-Cap Growth | | 3,861,366 | | 36,992 | |
Transamerica Van Kampen Small Company Growth | | 2,235,079 | | 19,713 | |
Total Investment Companies (cost $1,674,853) # | | | | 1,534,838 | |
Other Assets and Liabilities - Net | | | | (2,494 | ) |
Net Assets | | | | $ | 1,532,344 | |
NOTES TO SCHEDULE OF INVESTMENTS:
€ The portfolio invests its assets in the Class I shares of the affiliated fund of Transamerica Funds.
‡ Non-income producing security.
# Aggregate cost for federal income tax purposes is $1,692,449. Aggregate gross unrealized appreciation/depreciation for all securities in which there is an excess of value over tax cost were $30,129 and $187,740, respectively. Net unrealized depreciation for tax purposes is $157,611.
VALUATION SUMMARY:
| | Level 1 | | Level 2 | | Level 3 | | Total | |
Investment Companies | | $ | 1,534,838 | | $ | — | | $ | — | | $ | 1,534,838 | |
| | | | | | | | | | | | | |
The notes to the financial statements are an integral part of this report.
22
Transamerica Asset Allocation – Moderate Growth Portfolio
SCHEDULE OF INVESTMENTS
At October 31, 2009
(all amounts except share amounts in thousands)
| | Shares | | Value | |
INVESTMENT COMPANIES - 100.0% € | | | | | |
Bonds - 20.5% | | | | | |
Transamerica Convertible Securities | | 2,938,060 | | $ | 24,709 | |
Transamerica Flexible Income | | 2,614,926 | | 21,887 | |
Transamerica High Yield Bond | | 12,107,248 | | 102,912 | |
Transamerica JPMorgan Core Bond | | 3,195,156 | | 32,207 | |
Transamerica JPMorgan International Bond | | 9,032,947 | | 105,144 | |
Transamerica PIMCO Total Return | | 15,709,470 | | 170,447 | |
Transamerica Short-Term Bond | | 8,943,960 | | 90,155 | |
Transamerica Van Kampen Emerging Markets Debt | | 5,804,911 | | 59,384 | |
Capital Preservation - 0.2% | | | | | |
Transamerica Money Market | | 6,792,949 | | 6,793 | |
Global/International Stocks - 14.0% | | | | | |
Transamerica AllianceBernstein International Value | | 6,490,652 | | 50,627 | |
Transamerica MFS International Equity ‡ | | 3,277,857 | | 26,747 | |
Transamerica Neuberger Berman International | | 13,103,484 | | 99,194 | |
Transamerica Oppenheimer Developing Markets | | 8,551,912 | | 86,545 | |
Transamerica Schroders International Small Cap | | 8,459,525 | | 69,537 | |
Transamerica Thornburg International Value | | 6,352,891 | | 61,560 | |
Transamerica WMC Emerging Markets ‡ | | 1,526,530 | | 18,410 | |
Inflation-Protected Securities - 3.9% | | | | | |
Transamerica PIMCO Real Return TIPS | | 10,805,394 | | 115,834 | |
Tactical and Specialty - 14.4% | | | | | |
Transamerica BlackRock Global Allocation | | 8,170,447 | | 81,623 | |
Transamerica BlackRock Natural Resources | | 3,801,281 | | 38,127 | |
Transamerica BNY Mellon Market Neutral Strategy | | 3,239,506 | | 27,309 | |
Transamerica Clarion Global Real Estate Securities | | 9,920,199 | | 106,841 | |
Transamerica Federated Market Opportunity | | 2,560,003 | | 23,014 | |
Transamerica Loomis Sayles Bond | | 8,860,590 | | 88,074 | |
Transamerica Science & Technology ‡ | | 7,359,308 | | 26,935 | |
Transamerica UBS Dynamic Alpha | | 5,592,573 | | 34,003 | |
U.S. Stocks - 47.0% | | | | | |
Transamerica BlackRock Large Cap Value | | 32,992,801 | | 257,674 | |
Transamerica Equity | | 37,399,285 | | 287,600 | |
Transamerica Growth Opportunities ‡ | | 6,327,388 | | 49,227 | |
Transamerica Jennison Growth | | 22,883,504 | | 232,725 | |
Transamerica JPMorgan Mid Cap Value | | 9,103,792 | | 75,379 | |
Transamerica Oppenheimer Small- & Mid-Cap Value | | 6,513,211 | | 50,282 | |
Transamerica Third Avenue Value ‡ | | 4,466,190 | | 82,357 | |
Transamerica UBS Large Cap Value | | 33,466,814 | | 282,460 | |
Transamerica Van Kampen Mid-Cap Growth | | 5,291,139 | | 50,689 | |
Transamerica Van Kampen Small Company Growth | | 2,115,280 | | 18,657 | |
Total Investment Companies (cost $3,126,375) # | | | | 2,955,068 | |
Other Assets and Liabilities - Net | | | | 844 | |
Net Assets | | | | $ | 2,955,912 | |
NOTES TO THE SCHEDULE OF INVESTMENTS:
€ The portfolio invests its assets in the Class I shares of the affiliated fund of Transamerica Funds.
‡ Non-income producing security.
# Aggregate cost for federal income tax purposes is $3,152,792. Aggregate gross unrealized appreciation/depreciation for all securities in which there is an excess of value over tax cost were $58,631 and $256,355, respectively. Net unrealized depreciation for tax purposes is $197,724.
VALUATION SUMMARY:
| | Level 1 | | Level 2 | | Level 3 | | Total | |
Investment Companies | | $ | 2,955,068 | | $ | — | | $ | — | | $ | 2,955,068 | |
| | | | | | | | | | | | | |
The notes to the financial statements are an integral part of this report.
23
Transamerica Asset Allocation – Moderate Portfolio
SCHEDULE OF INVESTMENTS
At October 31, 2009
(all amounts except share amounts in thousands)
| | Shares | | Value | |
INVESTMENT COMPANIES - 100.0% € | | | | | |
Bonds - 34.6% | | | | | |
Transamerica Convertible Securities | | 3,061,428 | | $ | 25,747 | |
Transamerica Flexible Income | | 2,225,594 | | 18,628 | |
Transamerica High Yield Bond | | 11,648,726 | | 99,014 | |
Transamerica JPMorgan Core Bond | | 2,705,653 | | 27,273 | |
Transamerica JPMorgan International Bond | | 11,327,053 | | 131,847 | |
Transamerica PIMCO Total Return | | 18,315,318 | | 198,720 | |
Transamerica Short-Term Bond | | 10,431,605 | | 105,151 | |
Transamerica Van Kampen Emerging Markets Debt | | 5,577,643 | | 57,059 | |
Capital Preservation - 0.3% | | | | | |
Transamerica Money Market | | 5,125,702 | | 5,126 | |
Global/International Stocks - 10.5% | | | | | |
Transamerica AllianceBernstein International Value | | 2,793,899 | | 21,792 | |
Transamerica MFS International Equity ‡ | | 2,718,050 | | 22,179 | |
Transamerica Neuberger Berman International | | 3,811,935 | | 28,856 | |
Transamerica Oppenheimer Developing Markets | | 2,948,603 | | 29,840 | |
Transamerica Schroders International Small Cap | | 5,126,942 | | 42,144 | |
Transamerica Thornburg International Value | | 3,223,798 | | 31,239 | |
Transamerica WMC Emerging Markets ‡ | | 2,128,163 | | 25,666 | |
Inflation-Protected Securities - 5.9% | | | | | |
Transamerica PIMCO Real Return TIPS | | 10,663,141 | | 114,309 | |
Tactical and Specialty - 15.7% | | | | | |
Transamerica BlackRock Global Allocation | | 3,962,722 | | 39,588 | |
Transamerica BlackRock Natural Resources | | 2,423,112 | | 24,304 | |
Transamerica BNY Mellon Market Neutral Strategy | | 1,790,957 | | 15,098 | |
Transamerica Clarion Global Real Estate Securities | | 4,397,959 | | 47,366 | |
Transamerica Federated Market Opportunity | | 2,000,580 | | 17,985 | |
Transamerica Loomis Sayles Bond | | 13,253,351 | | 131,738 | |
Transamerica Science & Technology ‡ | | 2,692,814 | | 9,856 | |
Transamerica UBS Dynamic Alpha | | 2,685,926 | | 16,330 | |
U.S. Stocks - 33.0% | | | | | |
Transamerica BlackRock Large Cap Value | | 15,838,491 | | 123,699 | |
Transamerica Equity | | 15,491,872 | | 119,132 | |
Transamerica Growth Opportunities ‡ | | 2,406,104 | | 18,719 | |
Transamerica Jennison Growth | | 12,975,922 | | 131,965 | |
Transamerica JPMorgan Mid Cap Value | | 4,319,934 | | 35,769 | |
Transamerica Oppenheimer Small- & Mid-Cap Value | | 3,314,200 | | 25,586 | |
Transamerica Third Avenue Value ‡ | | 2,055,515 | | 37,904 | |
Transamerica UBS Large Cap Value | | 13,635,295 | | 115,082 | |
Transamerica Van Kampen Mid-Cap Growth | | 2,090,585 | | 20,028 | |
Transamerica Van Kampen Small Company Growth | | 839,213 | | 7,402 | |
Total Investment Companies (cost $1,965,474) # | | | | 1,922,141 | |
Other Assets and Liabilities - Net | | | | 519 | |
Net Assets | | | | $ | 1,922,660 | |
NOTES TO THE SCHEDULE OF INVESTMENTS:
€ The portfolio invests its assets in the Class I shares of the affiliated fund of Transamerica Funds.
‡ Non-income producing security.
# Aggregate cost for federal income tax purposes is $1,975,091. Aggregate gross unrealized appreciation/depreciation for all securities in which there is an excess of value over tax cost were $58,786 and $111,736, respectively. Net unrealized depreciation for tax purposes is $52,950.
VALUATION SUMMARY:
| | Level 1 | | Level 2 | | Level 3 | | Total | |
Investment Companies | | $ | 1,922,141 | | $ | — | | $ | — | | $ | 1,922,141 | |
| | | | | | | | | | | | | |
The notes to the financial statements are an integral part of this report.
24
Transamerica Multi-Manager Alternative Strategies Portfolio
SCHEDULE OF INVESTMENTS
At October 31, 2009
(all amounts except share amounts in thousands)
| | Shares | | Value | |
INVESTMENT COMPANIES - 99.9% € | | | | | |
Bond - 11.0% | | | | | |
Transamerica JPMorgan International Bond | | 2,038,830 | | $ | 23,732 | |
Capital Preservation - 4.5% | | | | | |
Transamerica Money Market | | 9,783,502 | | 9,784 | |
Global/International Stocks - 8.7% | | | | | |
Transamerica Neuberger Berman International | | 76,767 | | 581 | |
Transamerica Oppenheimer Developing Markets | | 838,054 | | 8,481 | |
Transamerica Schroders International Small Cap | | 1,192,714 | | 9,804 | |
Tactical and Specialty - 72.6% | | | | | |
Transamerica BlackRock Global Allocation | | 1,251,581 | | 12,503 | |
Transamerica BlackRock Natural Resources | | 2,141,752 | | 21,482 | |
Transamerica BNY Mellon Market Neutral Strategy | | 2,258,666 | | 19,041 | |
Transamerica Clarion Global Real Estate Securities | | 2,085,979 | | 22,466 | |
Transamerica Federated Market Opportunity | | 2,430,219 | | 21,848 | |
Transamerica Loomis Sayles Bond | | 3,705,506 | | 36,833 | |
Transamerica UBS Dynamic Alpha | | 3,718,022 | | 22,605 | |
U.S. Stock - 3.1% | | | | | |
Transamerica Third Avenue Value ‡ | | 362,586 | | 6,686 | |
Total Investment Companies (cost $234,064) # | | | | 215,846 | |
Other Assets and Liabilities - Net | | | | 223 | |
Net Assets | | | | $ | 216,069 | |
NOTES TO SCHEDULE OF INVESTMENTS:
€ The portfolio invests its assets in the Class I shares of the affiliated fund of Transamerica Funds.
‡ Non-income producing security.
# Aggregate cost for federal income tax purposes is $236,141. Aggregate gross unrealized appreciation/depreciation for all securities in which there is an excess of value over tax cost were $2,124 and $22,419, respectively. Net unrealized depreciation for tax purposes is $20,295.
VALUATION SUMMARY:
| | Level 1 | | Level 2 | | Level 3 | | Total | |
Investment Companies | | $ | 215,846 | | $ | — | | $ | — | | $ | 215,846 | |
| | | | | | | | | | | | | |
The notes to the financial statements are an integral part of this report.
25
Transamerica Multi-Manager International Portfolio
SCHEDULE OF INVESTMENTS
At October 31, 2009
(all amounts except share amounts in thousands)
| | Shares | | Value | |
INVESTMENT COMPANIES - 99.8% € | | | | | |
Global/International Stocks - 88.3% | | | | | |
Transamerica AllianceBernstein International Value | | 4,027,512 | | $ | 31,415 | |
Transamerica MFS International Equity ‡ | | 4,120,228 | | 33,621 | |
Transamerica Neuberger Berman International | | 3,918,500 | | 29,663 | |
Transamerica Oppenheimer Developing Markets | | 3,289,966 | | 33,294 | |
Transamerica Schroders International Small Cap | | 4,624,337 | | 38,012 | |
Transamerica Thornburg International Value | | 6,265,263 | | 60,710 | |
Transamerica WMC Emerging Markets ‡ | | 2,100,152 | | 25,328 | |
Tactical and Specialty - 11.5% | | | | | |
Transamerica BlackRock Global Allocation | | 1,764,822 | | 17,631 | |
Transamerica Clarion Global Real Estate Securities | | 1,412,070 | | 15,208 | |
Total Investment Companies (cost $322,063) # | | | | 284,882 | |
Other Assets and Liabilities - Net | | | | 656 | |
Net Assets | | | | $ | 285,538 | |
NOTES TO THE SCHEDULE OF INVESTMENTS:
€ The portfolio invests its assets in the Class I shares of the affiliated fund of Transamerica Funds.
‡ Non-income producing security.
# Aggregate cost for federal income tax purposes is $322,910. Aggregate gross unrealized appreciation/depreciation for all securities in which there is an excess of value over tax cost were $4,191 and $42,219, respectively. Net unrealized depreciation for tax purposes is $38,028.
VALUATION SUMMARY:
| | Level 1 | | Level 2 | | Level 3 | | Total | |
Investment Companies | | $ | 284,882 | | $ | — | | $ | — | | $ | 284,882 | |
| | | | | | | | | | | | | |
The notes to the financial statements are an integral part of this report.
26
STATEMENTS OF ASSETS AND LIABILITIES
At October 31, 2009
(all amounts except per share amounts in thousands)
| | Transamerica
Asset
Allocation -
Conservative
Portfolio | | Transamerica
Asset
Allocation -
Growth
Portfolio | | Transamerica
Asset
Allocation -
Moderate
Growth
Portfolio | | Transamerica
Asset
Allocation -
Moderate
Portfolio | | Transamerica
Multi-Manager
Alternative
Strategies
Portfolio | | Transamerica
Multi-Manager
International
Portfolio | |
Assets: | | | | | | | | | | | | | |
Investments in affiliated investment companies, at value | | $ | 961,043 | | $ | 1,534,838 | | $ | 2,955,068 | | $ | 1,922,141 | | $ | 215,846 | | $ | 284,882 | |
Cash | | 20 | | 7 | | — | | — | | — | | — | |
Receivables: | | | | | | | | | | | | | |
Investment securities sold | | — | | — | | — | | — | | 25 | | — | |
Shares of beneficial interest sold | | 3,821 | | 3,255 | | 9,425 | | 7,229 | | 1,135 | | 1,680 | |
Dividends | | 201 | | — | | 223 | | 259 | | — | | — | |
| | $ | 965,085 | | $ | 1,538,100 | | $ | 2,964,716 | | $ | 1,929,629 | | $ | 217,006 | | $ | 286,562 | |
Liabilities: | | | | | | | | | | | | | |
Accounts payable and accrued liabilities: | | | | | | | | | | | | | |
Investment securities purchased | | $ | 253 | | $ | 140 | | $ | 760 | | $ | 1,596 | | $ | — | | $ | 137 | |
Shares of beneficial interest redeemed | | 1,906 | | 4,146 | | 5,327 | | 3,681 | | 722 | | 618 | |
Management and advisory fees | | 82 | | 135 | | 257 | | 165 | | 37 | | 26 | |
Distribution and service fees | | 618 | | 1,020 | | 1,980 | | 1,263 | | 117 | | 173 | |
Transfer agent fees | | 77 | | 227 | | 321 | | 160 | | 27 | | 44 | |
Administration fees | | 10 | | 17 | | 32 | | 21 | | 2 | | 3 | |
Due to custodian | | — | | — | | 6 | | — | | 12 | | — | |
Other | | 51 | | 71 | | 121 | | 83 | | 20 | | 23 | |
| | $ | 2,997 | | $ | 5,756 | | $ | 8,804 | | $ | 6,969 | | $ | 937 | | $ | 1,024 | |
Net assets | | $ | 962,088 | | $ | 1,532,344 | | $ | 2,955,912 | | $ | 1,922,660 | | $ | 216,069 | | $ | 285,538 | |
| | | | | | | | | | | | | |
Net assets consist of: | | | | | | | | | | | | | |
Shares of beneficial interest, unlimited shares authorized, no par value | | 990,801 | | 1,857,522 | | 3,361,927 | | 2,027,958 | | 240,977 | | 409,306 | |
Undistributed net investment income | | 1,684 | | 8,842 | | 11,621 | | 17,604 | | 41 | | 2,279 | |
Accumulated net realized loss from investments in affiliated investment companies | | (40,199 | ) | (194,005 | ) | (246,329 | ) | (79,569 | ) | (6,731 | ) | (88,866 | ) |
Net unrealized appreciation (depreciation) on investments in affiliated investment companies | | 9,802 | | (140,015 | ) | (171,307 | ) | (43,333 | ) | (18,218 | ) | (37,181 | ) |
Net assets | | $ | 962,088 | | $ | 1,532,344 | | $ | 2,955,912 | | $ | 1,922,660 | | $ | 216,069 | | $ | 285,538 | |
Net assets by class: | | | | | | | | | | | | | |
Class A | | $ | 360,558 | | $ | 574,500 | | $ | 1,044,810 | | $ | 694,532 | | $ | 119,693 | | $ | 134,751 | |
Class B | | 111,706 | | 192,054 | | 394,275 | | 228,151 | | | | 18,010 | |
Class C | | 488,315 | | 763,086 | | 1,513,954 | | 997,766 | | 96,376 | | 132,777 | |
Class R | | 1,509 | | 2,704 | | 2,873 | | 2,211 | | | | | |
Shares outstanding: | | | | | | | | | | | | | |
Class A | | 34,589 | | 57,900 | | 100,539 | | 65,382 | | 12,800 | | 15,801 | |
Class B | | 10,762 | | 19,805 | | 38,117 | | 21,545 | | | | 2,131 | |
Class C | | 47,093 | | 78,711 | | 146,674 | | 94,546 | | 10,391 | | 15,707 | |
Class R | | 144 | | 274 | | 277 | | 209 | | | | | |
Net asset value per share: | | | | | | | | | | | | | |
Class A | | $ | 10.42 | | $ | 9.92 | | $ | 10.39 | | $ | 10.62 | | $ | 9.35 | | $ | 8.53 | |
Class B | | 10.38 | | 9.70 | | 10.34 | | 10.59 | | | | 8.45 | |
Class C | | 10.37 | | 9.69 | | 10.32 | | 10.55 | | 9.27 | | 8.45 | |
Class R | | 10.49 | | 9.85 | | 10.36 | | 10.58 | | | | | |
| | | | | | | | | | | | | |
Maximum offering price per share: (a) | | | | | | | | | | | | | |
Class A | | $ | 11.03 | | $ | 10.50 | | $ | 10.99 | | $ | 11.24 | | $ | 9.89 | | $ | 9.03 | |
| | | | | | | | | | | | | |
Investments in affiliated investment companies, at cost | | $ | 951,241 | | $ | 1,674,853 | | $ | 3,126,375 | | $ | 1,965,474 | | $ | 234,064 | | $ | 322,063 | |
(a) Includes the maximum selling commission (represented as a percentage of offering price) which is reduced on certain levels of sales as set forth in the Prospectus. Net asset value per share for Classes B, C, and R shares represents offering price. The redemption price for Classes B and C shares equals net asset value less any applicable contingent deferred sales charge.
The notes to the financial statements are an integral part of this report.
27
STATEMENTS OF OPERATIONS
For the year ended October 31, 2009
(all amounts in thousands)
| | Transamerica
Asset Allocation
- Conservative
Portfolio | | Transamerica
Asset Allocation
- Growth
Portfolio | | Transamerica
Asset Allocation
- Moderate
Growth Portfolio | | Transamerica
Asset Allocation
- Moderate
Portfolio | | Transamerica
Multi-Manager
Alternative
Strategies
Portfolio | | Transamerica
Multi-Manager
International
Portfolio | |
Investment income: | | | | | | | | | | | | | |
Dividend income from affiliated investment companies | | $ | 39,071 | | $ | 29,993 | | $ | 97,101 | | $ | 73,852 | | $ | 7,878 | | $ | 5,702 | |
Expenses: | | | | | | | | | | | | | |
Management and advisory | | 793 | | 1,364 | | 2,631 | | 1,657 | | 366 | | 236 | |
Distribution and service: | | | | | | | | | | | | | |
Class A | | 1,034 | | 1,716 | | 3,138 | | 2,015 | | 338 | | 366 | |
Class B | | 970 | | 1,770 | | 3,630 | | 2,110 | | | | 152 | |
Class C | | 3,993 | | 6,943 | | 13,691 | | 8,687 | | 868 | | 1,161 | |
Class R | | 7 | | 10 | | 11 | | 8 | | | | | |
Transfer agent: | | | | | | | | | | | | | |
Class A | | 443 | | 1,115 | | 1,436 | | 777 | | 173 | | 220 | |
Class B | | 127 | | 449 | | 688 | | 326 | | | | 59 | |
Class C | | 327 | | 1,248 | | 1,810 | | 828 | | 147 | | 282 | |
Class R | | 3 | | 4 | | 4 | | 3 | | | | | |
Printing and shareholder reports | | 112 | | 291 | | 479 | | 257 | | 48 | | 75 | |
Custody | | 26 | | 38 | | 73 | | 49 | | 9 | | 9 | |
Administration | | 99 | | 170 | | 329 | | 207 | | 23 | | 30 | |
Legal | | 25 | | 43 | | 83 | | 52 | | 6 | | 8 | |
Audit and tax | | 19 | | 20 | | 21 | | 20 | | 16 | | 16 | |
Trustees | | 17 | | 29 | | 57 | | 36 | | 4 | | 5 | |
Registration | | 91 | | 92 | | 119 | | 106 | | 40 | | 51 | |
Other | | 8 | | 13 | | 24 | | 17 | | — | (a) | 1 | |
Total expenses | | 8,094 | | 15,315 | | 28,224 | | 17,155 | | 2,038 | | 2,671 | |
Net of reimbursement of class expenses | | | | | | | | | | | | | |
Class B | | — | | — | | — | | — | | — | | (18 | ) |
Total reimbursed expenses | | — | | — | | — | | — | | — | | (18 | ) |
Net expenses | | 8,094 | | 15,315 | | 28,224 | | 17,155 | | 2,038 | | 2,653 | |
Net investment income | | 30,977 | | 14,678 | | 68,877 | | 56,697 | | 5,840 | | 3,049 | |
| | | | | | | | | | | | | |
Net realized and unrealized gain (loss) on investments in affiliated investment companies: | | | | | | | | | | | | | |
Realized loss from investments in affiliated investment companies | | (42,824 | ) | (203,025 | ) | (262,506 | ) | (84,458 | ) | (12,932 | ) | (56,278 | ) |
Realized gain distributions from investments in affiliated investment companies | | 5,106 | | 16,058 | | 28,595 | | 13,011 | | 6,658 | | 5,248 | |
| | (37,718 | ) | (186,967 | ) | (233,911 | ) | (71,447 | ) | (6,274 | ) | (51,030 | ) |
Increase in unrealized appreciation (depreciation) on investments in affiliated investment companies | | 167,509 | | 351,453 | | 575,877 | | 312,983 | | 28,291 | | 108,676 | |
Net realized and unrealized gain (loss) on investments in affiliated investment companies | | 129,791 | | 164,486 | | 341,966 | | 241,536 | | 22,017 | | 57,646 | |
Net increase In net assets resulting from operations | | $ | 160,768 | | $ | 179,164 | | $ | 410,843 | | $ | 298,233 | | $ | 27,857 | | $ | 60,695 | |
(a) Amount rounds to less than $1.
The notes to the financial statements are an integral part of this report.
28
STATEMENTS OF CHANGES IN NET ASSETS
For the years ended:
(all amounts in thousands)
| | Transamerica Asset Allocation -
Conservative Portfolio | | Transamerica Asset Allocation -
Growth Portfolio | | Transamerica Asset Allocation -
Moderate Growth Portfolio | |
| | October 31, 2009 | | October 31, 2008 | | October 31, 2009 | | October 31, 2008 | | October 31, 2009 | | October 31, 2008 | |
From operations: | | | | | | | | | | | | | |
Net investment income | | $ | 30,977 | | $ | 22,258 | | $ | 14,678 | | $ | 17,181 | | $ | 68,877 | | $ | 63,059 | |
Net realized gain (loss) on investments in affiliated investment companies | | (37,718 | ) | 127 | | (186,967 | ) | (1,971 | ) | (233,911 | ) | 6,369 | |
Change in unrealized appreciation (depreciation) on investments in affiliated investment companies | | 167,509 | | (241,499 | ) | 351,453 | | (1,035,052 | ) | 575,877 | | (1,522,341 | ) |
Net increase (decrease) in net assets resulting from operations | | 160,768 | | (219,114 | ) | 179,164 | | (1,019,842 | ) | 410,843 | | (1,452,913 | ) |
| | | | | | | | | | | | | |
Distributions to shareholders: | | | | | | | | | | | | | |
From net investment income: | | | | | | | | | | | | | |
Class A | | (13,153 | ) | (7,660 | ) | (10,375 | ) | (1,116 | ) | (32,722 | ) | (17,275 | ) |
Class B | | (4,011 | ) | (2,383 | ) | (2,123 | ) | — | | (10,197 | ) | (4,380 | ) |
Class C | | (16,263 | ) | (8,298 | ) | (9,364 | ) | — | | (40,056 | ) | (16,655 | ) |
Class R | | (57 | ) | (19 | ) | (40 | ) | — | | (73 | ) | (25 | ) |
| | (33,484 | ) | (18,360 | ) | (21,902 | ) | (1,116 | ) | (83,048 | ) | (38,335 | ) |
From net realized gains: | | | | | | | | | | | | | |
Class A | | — | | (4,897 | ) | — | | (22,064 | ) | — | | (36,711 | ) |
Class B | | — | | (2,233 | ) | — | | (10,387 | ) | — | | (18,289 | ) |
Class C | | — | | (6,652 | ) | — | | (36,318 | ) | — | | (60,086 | ) |
Class R | | — | | (13 | ) | — | | (26 | ) | — | | (58 | ) |
| | — | | (13,795 | ) | — | | (68,795 | ) | — | | (115,144 | ) |
Total distributions to shareholders | | (33,484 | ) | (32,155 | ) | (21,902 | ) | (69,911 | ) | (83,048 | ) | (153,479 | ) |
| | | | | | | | | | | | | |
Capital share transactions: | | | | | | | | | | | | | |
Proceeds from shares sold: | | | | | | | | | | | | | |
Class A | | 139,081 | | 191,670 | | 143,445 | | 212,070 | | 230,540 | | 358,051 | |
Class B | | 31,792 | | 44,384 | | 18,975 | | 40,565 | | 38,265 | | 74,823 | |
Class C | | 198,027 | | 274,416 | | 115,363 | | 263,723 | | 244,779 | | 556,048 | |
Class R | | 713 | | 1,070 | | 1,940 | | 1,918 | | 1,114 | | 1,706 | |
| | 369,613 | | 511,540 | | 279,723 | | 518,276 | | 514,698 | | 990,628 | |
Dividends and distributions reinvested: | | | | | | | | | | | | | |
Class A | | 11,691 | | 9,506 | | 9,389 | | 20,861 | | 30,081 | | 49,557 | |
Class B | | 3,265 | | 3,420 | | 1,861 | | 9,005 | | 9,051 | | 20,024 | |
Class C | | 11,336 | | 8,944 | | 7,303 | | 27,196 | | 29,851 | | 55,992 | |
Class R | | 46 | | 21 | | 19 | | 18 | | 45 | | 37 | |
| | 26,338 | | 21,891 | | 18,572 | | 57,080 | | 69,028 | | 125,610 | |
Cost of shares redeemed: | | | | | | | | | | | | | |
Class A | | (108,752 | ) | (88,378 | ) | (136,887 | ) | (168,000 | ) | (240,883 | ) | (294,086 | ) |
Class B | | (29,438 | ) | (32,684 | ) | (41,291 | ) | (56,102 | ) | (79,769 | ) | (105,134 | ) |
Class C | | (149,422 | ) | (130,261 | ) | (189,430 | ) | (236,973 | ) | (382,557 | ) | (408,704 | ) |
Class R | | (569 | ) | (377 | ) | (1,136 | ) | (593 | ) | (579 | ) | (759 | ) |
| | (288,181 | ) | (251,700 | ) | (368,744 | ) | (461,668 | ) | (703,788 | ) | (808,683 | ) |
Redemption fees: | | | | | | | | | | | | | |
Class A | | 6 | | 6 | | 3 | | 4 | | 1 | | 4 | |
Class B | | 1 | | 3 | | — | | 2 | | — | | 3 | |
Class C | | 1 | | 18 | | 3 | | 7 | | 2 | | 9 | |
| | 8 | | 27 | | 6 | | 13 | | 3 | | 16 | |
Automatic conversions: | | | | | | | | | | | | | |
Class A | | 2,399 | | 4,081 | | 3,697 | | 9,315 | | 7,442 | | 13,458 | |
Class B | | (2,399 | ) | (4,081 | ) | (3,697 | ) | (9,315 | ) | (7,442 | ) | (13,458 | ) |
| | — | | — | | — | | — | | — | | — | |
Net increase (decrease) in net assets resulting from capital shares transactions | | 107,778 | | 281,758 | | (70,443 | ) | 113,701 | | (120,059 | ) | 307,571 | |
| | | | | | | | | | | | | |
Net increase (decrease) in net assets | | 235,062 | | 30,489 | | 86,819 | | (976,052 | ) | 207,736 | | (1,298,821 | ) |
| | | | | | | | | | | | | |
Net assets: | | | | | | | | | | | | | |
Beginning of year | | $ | 727,026 | | $ | 696,537 | | $ | 1,445,525 | | $ | 2,421,577 | | $ | 2,748,176 | | $ | 4,046,997 | |
End of year | | $ | 962,088 | | $ | 727,026 | | $ | 1,532,344 | | $ | 1,445,525 | | $ | 2,955,912 | | $ | 2,748,176 | |
Undistributed net investment income | | $ | 1,684 | | $ | 4,191 | | $ | 8,842 | | $ | 16,066 | | $ | 11,621 | | $ | 25,792 | |
The notes to the financial statements are an integral part of this report.
29
| | Transamerica Asset Allocation -
Conservative Portfolio | | Transamerica Asset Allocation -
Growth Portfolio | | Transamerica Asset Allocation -
Moderate Growth Portfolio | |
| | October 31, 2009 | | October 31, 2008 | | October 31, 2009 | | October 31, 2008 | | October 31, 2009 | | October 31, 2008 | |
Share activity: | | | | | | | | | | | | | |
Shares issued: | | | | | | | | | | | | | |
Class A | | 15,113 | | 17,099 | | 17,028 | | 16,662 | | 25,412 | | 28,856 | |
Class B | | 3,491 | | 3,992 | | 2,296 | | 3,216 | | 4,250 | | 6,036 | |
Class C | | 21,793 | | 24,710 | | 13,991 | | 21,061 | | 27,170 | | 44,820 | |
Class R | | 80 | | 101 | | 231 | | 166 | | 121 | | 139 | |
| | 40,477 | | 45,902 | | 33,546 | | 41,105 | | 56,953 | | 79,851 | |
Shares issued-reinvested from distributions: | | | | | | | | | | | | | |
Class A | | 1,344 | | 977 | | 1,182 | | 1,519 | | 3,594 | | 3,790 | |
Class B | | 379 | | 333 | | 239 | | 670 | | 1,080 | | 1,536 | |
Class C | | 1,315 | | 903 | | 938 | | 2,022 | | 3,571 | | 4,300 | |
Class R | | 5 | | 2 | | 2 | | 1 | | 5 | | 3 | |
| | 3,043 | | 2,215 | | 2,361 | | 4,212 | | 8,250 | | 9,629 | |
Shares redeemed: | | | | | | | | | | | | | |
Class A | | (11,999 | ) | (8,115 | ) | (16,568 | ) | (13,653 | ) | (27,351 | ) | (24,553 | ) |
Class B | | (3,248 | ) | (2,996 | ) | (5,088 | ) | (4,682 | ) | (9,088 | ) | (8,856 | ) |
Class C | | (16,669 | ) | (12,235 | ) | (23,261 | ) | (20,022 | ) | (43,805 | ) | (34,617 | ) |
Class R | | (61 | ) | (35 | ) | (137 | ) | (46 | ) | (63 | ) | (64 | ) |
| | (31,977 | ) | (23,381 | ) | (45,054 | ) | (38,403 | ) | (80,307 | ) | (68,090 | ) |
Automatic conversions: | | | | | | | | | | | | | |
Class A | | 260 | | 358 | | 431 | | 720 | | 828 | | 1,079 | |
Class B | | (261 | ) | (359 | ) | (441 | ) | (737 | ) | (830 | ) | (1,085 | ) |
| | (1 | ) | (1 | ) | (10 | ) | (17 | ) | (2 | ) | (6 | ) |
Net increase (decrease) in shares outstanding: | | | | | | | | | | | | | |
Class A | | 4,718 | | 10,319 | | 2,073 | | 5,248 | | 2,483 | | 9,172 | |
Class B | | 361 | | 970 | | (2,994 | ) | (1,533 | ) | (4,588 | ) | (2,369 | ) |
Class C | | 6,439 | | 13,378 | | (8,332 | ) | 3,061 | | (13,064 | ) | 14,503 | |
Class R | | 24 | | 68 | | 96 | | 121 | | 63 | | 78 | |
| | 11,542 | | 24,735 | | (9,157 | ) | 6,897 | | (15,106 | ) | 21,384 | |
The notes to the financial statements are an integral part of this report.
30
| | Transamerica Asset Allocation -
Moderate Portfolio | | Transamerica Multi-Manager
Alternative Strategies Portfolio | | Transamerica Multi-Manager
International Portfolio | |
| | October 31, 2009 | | October 31, 2008 | | October 31, 2009 | | October 31, 2008 | | October 31, 2009 | | October 31, 2008 | |
From operations: | | | | | | | | | | | | | |
Net investment income | | $ | 56,697 | | $ | 50,142 | | $ | 5,840 | | $ | 2,882 | | $ | 3,049 | | $ | 9,540 | |
Net realized loss on investments in affiliated investment companies | | (71,447 | ) | (3,803 | ) | (6,274 | ) | (455 | ) | (51,030 | ) | (37,550 | ) |
Change in unrealized appreciation (depreciation) on investments in affiliated investment companies | | 312,983 | | (715,860 | ) | 28,291 | | (50,142 | ) | 108,676 | | (221,869 | ) |
Net increase (decrease) in net assets resulting from operations | | 298,233 | | (669,521 | ) | 27,857 | | (47,715 | ) | 60,695 | | (249,879 | ) |
| | | | | | | | | | | | | |
Distributions to shareholders: | | | | | | | | | | | | | |
From net investment income: | | | | | | | | | | | | | |
Class A | | (25,025 | ) | (13,866 | ) | (3,552 | ) | (1,164 | ) | (770 | ) | (4,695 | ) |
Class B | | (7,739 | ) | (4,791 | ) | | | | | — | | (595 | ) |
Class C | | (32,988 | ) | (17,309 | ) | (2,751 | ) | (1,288 | ) | — | | (5,384 | ) |
Class R | | (61 | ) | (11 | ) | | | | | | | | |
| | (65,813 | ) | (35,977 | ) | (6,303 | ) | (2,452 | ) | (770 | ) | (10,674 | ) |
From net realized gains: | | | | | | | | | | | | | |
Class A | | — | | (20,000 | ) | — | | — | | — | | (1,300 | ) |
Class B | | — | | (10,456 | ) | | | | | — | | (213 | ) |
Class C | | — | | (34,616 | ) | — | | — | | — | | (1,818 | ) |
Class R | | — | | (19 | ) | | | | | | | | |
| | — | | (65,091 | ) | — | | — | | — | | (3,331 | ) |
Total distributions to shareholders | | (65,813 | ) | (101,068 | ) | (6,303 | ) | (2,452 | ) | (770 | ) | (14,005 | ) |
| | | | | | | | | | | | | |
Capital share transactions: | | | | | | | | | | | | | |
Proceeds from shares sold: | | | | | | | | | | | | | |
Class A | | 205,360 | | 257,189 | | 55,943 | | 116,850 | | 52,130 | | 93,298 | |
Class B | | 32,093 | | 46,815 | | | | | | 2,161 | | 8,076 | |
Class C | | 237,636 | | 356,768 | | 26,516 | | 79,747 | | 18,980 | | 74,383 | |
Class R | | 2,053 | | 904 | | | | | | | | | |
| | 477,142 | | 661,676 | | 82,459 | | 196,597 | | 73,271 | | 175,757 | |
Dividends and distributions reinvested: | | | | | | | | | | | | | |
Class A | | 22,442 | | 30,571 | | 2,810 | | 893 | | 603 | | 4,441 | |
Class B | | 6,569 | | 12,884 | | | | | | — | | 648 | |
Class C | | 23,369 | | 36,220 | | 2,055 | | 1,003 | | — | | 4,866 | |
Class R | | 46 | | 15 | | | | | | | | | |
| | 52,426 | | 79,690 | | 4,865 | | 1,896 | | 603 | | 9,955 | |
Cost of shares redeemed: | | | | | | | | | | | | | |
Class A | | (167,320 | ) | (169,998 | ) | (47,972 | ) | (33,651 | ) | (48,414 | ) | (67,324 | ) |
Class B | | (57,609 | ) | (71,809 | ) | | | | | (3,438 | ) | (5,230 | ) |
Class C | | (260,060 | ) | (263,959 | ) | (32,021 | ) | (15,669 | ) | (44,010 | ) | (60,577 | ) |
Class R | | (1,135 | ) | (253 | ) | | | | | | | | |
| | (486,124 | ) | (506,019 | ) | (79,993 | ) | (49,320 | ) | (95,862 | ) | (133,131 | ) |
Redemption fees: | | | | | | | | | | | | | |
Class A | | — | | 7 | | 1 | | — | | 1 | | — | |
Class B | | — | | 1 | | | | | | — | | — | |
Class C | | 5 | | 7 | | — | | 1 | | — | | 2 | |
| | 5 | | 15 | | 1 | | 1 | | 1 | | 2 | |
Automatic conversions: | | | | | | | | | | | | | |
Class A | | 4,828 | | 9,884 | | — | | — | | 435 | | 1,195 | |
Class B | | (4,828 | ) | (9,884 | ) | | | | | (435 | ) | (1,195 | ) |
| | — | | — | | — | | — | | — | | — | |
Net increase (decrease) in net assets resulting from capital shares transactions | | 43,449 | | 235,362 | | 7,332 | | 149,174 | | (21,987 | ) | 52,583 | |
| | | | | | | | | | | | | |
Net increase (decrease) in net assets | | 275,869 | | (535,227 | ) | 28,886 | | 99,007 | | 37,938 | | (211,301 | ) |
| | | | | | | | | | | | | |
Net assets: | | | | | | | | | | | | | |
Beginning of year | | $ | 1,646,791 | | $ | 2,182,018 | | $ | 187,183 | | $ | 88,176 | | $ | 247,600 | | $ | 458,901 | |
End of year | | $ | 1,922,660 | | $ | 1,646,791 | | $ | 216,069 | | $ | 187,183 | | $ | 285,538 | | $ | 247,600 | |
Undistributed net investment income | | $ | 17,604 | | $ | 26,720 | | $ | 41 | | $ | 504 | | $ | 2,279 | | $ | — | |
The notes to the financial statements are an integral part of this report.
31
| | Transamerica Asset Allocation -
Moderate Portfolio | | Transamerica Multi-Manager
Alternative Strategies Portfolio | | Transamerica Multi-Manager
International Portfolio | |
| | October 31, 2009 | | October 31, 2008 | | October 31, 2009 | | October 31, 2008 | | October 31, 2009 | | October 31, 2008 | |
Share activity: | | | | | | | | | | | | | |
Shares issued: | | | | | | | | | | | | | |
Class A | | 21,960 | | 21,575 | | 6,565 | | 11,512 | | 7,357 | | 8,606 | |
Class B | | 3,459 | | 3,930 | | | | | | 296 | | 726 | |
Class C | | 25,589 | | 30,129 | | 3,168 | | 7,837 | | 2,664 | | 6,632 | |
Class R | | 224 | | 78 | | | | | | | | | |
| | 51,232 | | 55,712 | | 9,733 | | 19,349 | | 10,317 | | 15,964 | |
Shares issued-reinvested from distributions: | | | | | | | | | | | | | |
Class A | | 2,606 | | 2,475 | | 359 | | 88 | | 96 | | 387 | |
Class B | | 761 | | 1,043 | | | | | | — | | 56 | |
Class C | | 2,717 | | 2,940 | | 264 | | 99 | | — | | 425 | |
Class R | | 6 | | 1 | | | | | | | | | |
| | 6,090 | | 6,459 | | 623 | | 187 | | 96 | | 868 | |
Shares redeemed: | | | | | | | | | | | | | |
Class A | | (18,420 | ) | (14,728 | ) | (5,868 | ) | (3,463 | ) | (7,408 | ) | (6,889 | ) |
Class B | | (6,339 | ) | (6,249 | ) | | | | | (526 | ) | (534 | ) |
Class C | | (28,973 | ) | (23,247 | ) | (3,944 | ) | (1,632 | ) | (6,754 | ) | (6,328 | ) |
Class R | | (124 | ) | (21 | ) | | | | | | | | |
| | (53,856 | ) | (44,245 | ) | (9,812 | ) | (5,095 | ) | (14,688 | ) | (13,751 | ) |
Automatic conversions: | | | | | | | | | | | | | |
Class A | | 524 | | 819 | | | | | | 65 | | 110 | |
Class B | | (525 | ) | (822 | ) | | | | | (65 | ) | (111 | ) |
| | (1 | ) | (3 | ) | — | | — | | — | | (1 | ) |
Net increase (decrease) in shares outstanding: | | | | | | | | | | | | | |
Class A | | 6,670 | | 10,141 | | 1,056 | | 8,137 | | 110 | | 2,214 | |
Class B | | (2,644 | ) | (2,098 | ) | | | | | (295 | ) | 137 | |
Class C | | (667 | ) | 9,822 | | (512 | ) | 6,304 | | (4,090 | ) | 729 | |
Class R | | 106 | | 58 | | | | | | | | | |
| | 3,465 | | 17,923 | | 544 | | 14,441 | | (4,275 | ) | 3,080 | |
The notes to the financial statements are an integral part of this report.
32
FINANCIAL HIGHLIGHTS
For the years ended:
For a share outstanding throughout each period
| | Transamerica Asset Allocation - Conservative Portfolio | |
| | Class A | |
| | October 31,
2009 | | October 31,
2008 | | October 31,
2007 | | October 31,
2006 | | October 31,
2005 | |
Net asset value | | | | | | | | | | | |
Beginning of year | | $ | 8.99 | | $ | 12.40 | | $ | 11.76 | | $ | 11.35 | | $ | 11.07 | |
| | | | | | | | | | | |
Investment operations | | | | | | | | | | | |
From net investment income(a),(b) | | 0.40 | | 0.36 | | 0.38 | | 0.28 | | 0.32 | |
From net realized and unrealized gain (loss) on affiliated investments | | 1.46 | | (3.21 | ) | 0.82 | | 0.80 | | 0.37 | |
Total from investment operations | | 1.86 | | (2.85 | ) | 1.20 | | 1.08 | | 0.69 | |
| | | | | | | | | | | |
Distributions | | | | | | | | | | | |
Net investment income | | (0.43 | ) | (0.32 | ) | (0.24 | ) | (0.35 | ) | (0.22 | ) |
Net realized gains on affiliated investments | | — | | (0.24 | ) | (0.32 | ) | (0.32 | ) | (0.19 | ) |
Total distributions | | (0.43 | ) | (0.56 | ) | (0.56 | ) | (0.67 | ) | (0.41 | ) |
| | | | | | | | | | | |
Net asset value | | | | | | | | | | | |
End of year | | $ | 10.42 | | $ | 8.99 | | $ | 12.40 | | $ | 11.76 | | $ | 11.35 | |
| | | | | | | | | | | |
Total return(c) | | 21.76 | % | (23.86 | )% | 12.06 | % | 9.90 | % | 6.30 | % |
| | | | | | | | | | | |
Net assets end of year | | $ | 360,558 | | $ | 268,516 | | $ | 242,342 | | $ | 165,071 | | $ | 129,724 | |
| | | | | | | | | | | |
Ratio and supplemental data | | | | | | | | | | | |
| | | | | | | | | | | |
Expenses to average net assets:(d) | | | | | | | | | | | |
After reimbursement/recapture | | 0.65 | % | 0.62 | % | 0.62 | % | 0.60 | % | 0.28 | % |
Before reimbursement/recapture | | 0.65 | % | 0.62 | % | 0.62 | % | 0.60 | % | 0.28 | % |
Net investment income, to average net assets(e),(f) | | 4.27 | % | 3.22 | % | 3.18 | % | 2.44 | % | 2.85 | % |
Portfolio turnover rate(g) | | 27 | % | 10 | % | 32 | % | 29 | % | 32 | % |
For a share outstanding throughout each period
| | Transamerica Asset Allocation - Conservative Portfolio | |
| | Class B | |
| | October 31,
2009 | | October 31,
2008 | | October 31,
2007 | | October 31,
2006 | | October 31,
2005 | |
Net asset value | | | | | | | | | | | |
Beginning of year | | $ | 8.97 | | $ | 12.36 | | $ | 11.73 | | $ | 11.32 | | $ | 11.05 | |
| | | | | | | | | | | |
Investment operations | | | | | | | | | | | |
From net investment income(a),(b) | | 0.35 | | 0.31 | | 0.30 | | 0.20 | | 0.24 | |
From net realized and unrealized gain (loss) on affiliated investments | | 1.45 | | (3.22 | ) | 0.86 | | 0.81 | | 0.38 | |
Total from investment operations | | 1.80 | | (2.91 | ) | 1.16 | | 1.01 | | 0.62 | |
| | | | | | | | | | | |
Distributions | | | | | | | | | | | |
Net investment income | | (0.39 | ) | (0.24 | ) | (0.21 | ) | (0.28 | ) | (0.16 | ) |
Net realized gains on affiliated investments | | — | | (0.24 | ) | (0.32 | ) | (0.32 | ) | (0.19 | ) |
Total distributions | | (0.39 | ) | (0.48 | ) | (0.53 | ) | (0.60 | ) | (0.35 | ) |
| | | | | | | | | | | |
Net asset value | | | | | | | | | | | |
End of year | | $ | 10.38 | | $ | 8.97 | | $ | 12.36 | | $ | 11.73 | | $ | 11.32 | |
| | | | | | | | | | | |
Total return(c) | | 21.01 | % | (24.36 | )% | 11.34 | % | 9.19 | % | 5.65 | % |
| | | | | | | | | | | |
Net assets end of year | | $ | 111,706 | | $ | 93,268 | | $ | 116,569 | | $ | 110,701 | | $ | 106,449 | |
| | | | | | | | | | | |
Ratio and supplemental data | | | | | | | | | | | |
| | | | | | | | | | | |
Expenses to average net assets:(d) | | | | | | | | | | | |
After reimbursement/recapture | | 1.28 | % | 1.24 | % | 1.25 | % | 1.26 | % | 0.93 | % |
Before reimbursement/recapture | | 1.28 | % | 1.24 | % | 1.25 | % | 1.26 | % | 0.93 | % |
Net investment income, to average net assets(e),(f) | | 3.71 | % | 2.72 | % | 2.59 | % | 1.78 | % | 2.15 | % |
Portfolio turnover rate(g) | | 27 | % | 10 | % | 32 | % | 29 | % | 32 | % |
The notes to the financial statements are an integral part of this report.
33
For a share outstanding throughout each period
| | Transamerica Asset Allocation - Conservative Portfolio | |
| | Class C | |
| | October 31,
2009 | | October 31,
2008 | | October 31,
2007 | | October 31,
2006 | | October 31,
2005 | |
Net asset value | | | | | | | | | | | |
Beginning of year | | $ | 8.96 | | $ | 12.35 | | $ | 11.73 | | $ | 11.32 | | $ | 11.05 | |
| | | | | | | | | | | |
Investment operations | | | | | | | | | | | |
From net investment income(a),(b) | | 0.34 | | 0.29 | | 0.30 | | 0.21 | | 0.25 | |
From net realized and unrealized gain (loss) on affiliated investments | | 1.46 | | (3.19 | ) | 0.86 | | 0.80 | | 0.37 | |
Total from investment operations | | 1.80 | | (2.90 | ) | 1.16 | | 1.01 | | 0.62 | |
| | | | | | | | | | | |
Distributions | | | | | | | | | | | |
Net investment income | | (0.39 | ) | (0.25 | ) | (0.22 | ) | (0.28 | ) | (0.16 | ) |
Net realized gains on affiliated investments | | — | | (0.24 | ) | (0.32 | ) | (0.32 | ) | (0.19 | ) |
Total distributions | | (0.39 | ) | (0.49 | ) | (0.54 | ) | (0.60 | ) | (0.35 | ) |
| | | | | | | | | | | |
Net asset value | | | | | | | | | | | |
End of year | | $ | 10.37 | | $ | 8.96 | | $ | 12.35 | | $ | 11.73 | | $ | 11.32 | |
| | | | | | | | | | | |
Total return(c) | | 21.09 | % | (24.30 | )% | 11.31 | % | 9.25 | % | 5.61 | % |
| | | | | | | | | | | |
Net assets end of year | | $ | 488,315 | | $ | 364,153 | | $ | 336,981 | | $ | 257,675 | | $ | 208,959 | |
| | | | | | | | | | | |
Ratio and supplemental data | | | | | | | | | | | |
| | | | | | | | | | | |
Expenses to average net assets:(d) | | | | | | | | | | | |
After reimbursement/recapture | | 1.23 | % | 1.22 | % | 1.22 | % | 1.23 | % | 0.90 | % |
Before reimbursement/recapture | | 1.23 | % | 1.22 | % | 1.22 | % | 1.23 | % | 0.90 | % |
Net investment income, to average net assets(e),(f) | | 3.69 | % | 2.61 | % | 2.60 | % | 1.82 | % | 2.21 | % |
Portfolio turnover rate(g) | | 27 | % | 10 | % | 32 | % | 29 | % | 32 | % |
For a share outstanding throughout each period
| | Transamerica Asset Allocation - Conservative Portfolio | | | |
| | Class R | | | |
| | October 31,
2009 | | October 31,
2008 | | October 31,
2007 | | October 31,
2006(h) | | | |
Net asset value | | | | | | | | | | | |
Beginning of year | | $ | 9.05 | | $ | 12.47 | | $ | 11.84 | | $ | 11.30 | | | |
| | | | | | | | | | | |
Investment operations | | | | | | | | | | | |
From net investment income(a) | | 0.37 | | 0.35 | | 0.33 | | 0.13 | | | |
From net realized and unrealized gain (loss) on affiliated investments | | 1.49 | | (3.23 | ) | 0.85 | | 0.47 | | | |
Total from investment operations | | 1.86 | | (2.88 | ) | 1.18 | | 0.60 | | | |
| | | | | | | | | | | |
Distributions | | | | | | | | | | | |
Net investment income | | (0.42 | ) | (0.30 | ) | (0.23 | ) | (0.06 | ) | | |
Net realized gains on affiliated investments | | — | | (0.24 | ) | (0.32 | ) | — | | | |
Total distributions | | (0.42 | ) | (0.54 | ) | (0.55 | ) | (0.06 | ) | | |
| | | | | | | | | | | |
Net asset value | | | | | | | | | | | |
End of year | | $ | 10.49 | | $ | 9.05 | | $ | 12.47 | | $ | 11.84 | | | |
| | | | | | | | | | | |
Total return(c) | | 21.59 | % | (23.98 | )% | 11.89 | % | 5.35 | %(i) | | |
| | | | | | | | | | | |
Net assets end of year | | $ | 1,509 | | $ | 1,089 | | $ | 645 | | $ | 53 | | | |
| | | | | | | | | | | |
Ratio and supplemental data | | | | | | | | | | | |
| | | | | | | | | | | |
Expenses to average net assets:(d) | | | | | | | | | | | |
After reimbursement/recapture | | 0.89 | % | 0.82 | % | 0.86 | % | 0.66 | %(j) | | |
Before reimbursement/recapture | | 0.89 | % | 0.82 | % | 0.86 | % | 0.66 | %(j) | | |
Net investment income, to average net assets(e),(f) | | 3.97 | % | 3.14 | % | 2.71 | % | 3.03 | %(j) | | |
Portfolio turnover rate(g) | | 27 | % | 10 | % | 32 | % | 29 | %(i) | | |
The notes to the financial statements are an integral part of this report.
34
For a share outstanding throughout each period
| | Transamerica Asset Allocation - Growth Portfolio | |
| | Class A | |
| | October 31,
2009 | | October 31,
2008 | | October 31,
2007 | | October 31,
2006 | | October 31,
2005 | |
Net asset value | | | | | | | | | | | |
Beginning of year | | $ | 8.87 | | $ | 15.46 | | $ | 13.44 | | $ | 11.99 | | $ | 10.75 | |
| | | | | | | | | | | |
Investment operations | | | | | | | | | | | |
From net investment income(a),(b) | | 0.12 | | 0.15 | | 0.23 | | 0.03 | | 0.05 | |
From net realized and unrealized gain (loss) on affiliated investments | | 1.12 | | (6.29 | ) | 2.53 | | 1.89 | | 1.38 | |
Total from investment operations | | 1.24 | | (6.14 | ) | 2.76 | | 1.92 | | 1.43 | |
| | | | | | | | | | | |
Distributions | | | | | | | | | | | |
Net investment income | | (0.19 | ) | (0.02 | ) | (0.29 | ) | (0.11 | ) | (0.12 | ) |
Net realized gains on affiliated investments | | — | | (0.43 | ) | (0.45 | ) | (0.36 | ) | (0.07 | ) |
Total distributions | | (0.19 | ) | (0.45 | ) | (0.74 | ) | (0.47 | ) | (0.19 | ) |
| | | | | | | | | | | |
Net asset value | | | | | | | | | | | |
End of year | | $ | 9.92 | | $ | 8.87 | | $ | 15.46 | | $ | 13.44 | | $ | 11.99 | |
| | | | | | | | | | | |
Total return(c) | | 14.46 | % | (40.75 | )% | 21.35 | % | 16.38 | % | 13.42 | % |
| | | | | | | | | | | |
Net assets end of year | | $ | 574,500 | | $ | 495,257 | | $ | 781,872 | | $ | 502,488 | | $ | 286,412 | |
| | | | | | | | | | | |
Ratio and supplemental data | | | | | | | | | | | |
| | | | | | | | | | | |
Expenses to average net assets:(d) | | | | | | | | | | | |
After reimbursement/recapture | | 0.73 | % | 0.65 | % | 0.64 | % | 0.65 | % | 0.34 | % |
Before reimbursement/recapture | | 0.73 | % | 0.65 | % | 0.64 | % | 0.65 | % | 0.34 | % |
Net investment income, to average net assets(e),(f) | | 1.41 | % | 1.20 | % | 1.62 | % | 0.22 | % | 0.42 | % |
Portfolio turnover rate(g) | | 47 | % | 12 | % | 18 | % | 22 | % | 35 | % |
| | | | | | | | | | | |
For a share outstanding throughout each period |
| | | | | | | | | | | |
| | Transamerica Asset Allocation - Growth Portfolio | |
| | Class B | |
| | October 31,
2009 | | October 31,
2008 | | October 31,
2007 | | October 31,
2006 | | October 31,
2005 | |
Net asset value | | | | | | | | | | | |
Beginning of year | | $ | 8.63 | | $ | 15.13 | | $ | 13.17 | | $ | 11.77 | | $ | 10.57 | |
| | | | | | | | | | | |
Investment operations | | | | | | | | | | | |
From net investment income (loss)(a),(b) | | 0.07 | | 0.08 | | 0.14 | | (0.05 | ) | (0.03 | ) |
From net realized and unrealized gain (loss) on affiliated investments | | 1.10 | | (6.15 | ) | 2.47 | | 1.85 | | 1.36 | |
Total from investment operations | | 1.17 | | (6.07 | ) | 2.61 | | 1.80 | | 1.33 | |
| | | | | | | | | | | |
Distributions | | | | | | | | | | | |
Net investment income | | (0.10 | ) | — | | (0.20 | ) | (0.04 | ) | (0.06 | ) |
Net realized gains on affiliated investments | | — | | (0.43 | ) | (0.45 | ) | (0.36 | ) | (0.07 | ) |
Total distributions | | (0.10 | ) | (0.43 | ) | (0.65 | ) | (0.40 | ) | (0.13 | ) |
| | | | | | | | | | | |
Net asset value | | | | | | | | | | | |
End of year | | $ | 9.70 | | $ | 8.63 | | $ | 15.13 | | $ | 13.17 | | $ | 11.77 | |
| | | | | | | | | | | |
Total return(c) | | 13.78 | % | (41.15 | )% | 20.54 | % | 15.57 | % | 12.55 | % |
| | | | | | | | | | | |
Net assets end of year | | $ | 192,054 | | $ | 196,817 | | $ | 368,186 | | $ | 288,719 | | $ | 211,904 | |
| | | | | | | | | | | |
Ratio and supplemental data | | | | | | | | | | | |
| | | | | | | | | | | |
Expenses to average net assets:(d) | | | | | | | | | | | |
After reimbursement/recapture | | 1.40 | % | 1.30 | % | 1.29 | % | 1.31 | % | 0.99 | % |
Before reimbursement/recapture | | 1.40 | % | 1.30 | % | 1.29 | % | 1.31 | % | 0.99 | % |
Net investment income (loss), to average net assets(e),(f) | | 0.84 | % | 0.67 | % | 1.02 | % | (0.42 | )% | (0.24 | )% |
Portfolio turnover rate(g) | | 47 | % | 12 | % | 18 | % | 22 | % | 35 | % |
The notes to the financial statements are an integral part of this report.
35
For a share outstanding throughout each period
| | Transamerica Asset Allocation - Growth Portfolio | |
| | Class C | |
| | October 31,
2009 | | October 31,
2008 | | October 31,
2007 | | October 31,
2006 | | October 31,
2005 | |
Net asset value | | | | | | | | | | | |
Beginning of year | | $ | 8.64 | | $ | 15.13 | | $ | 13.18 | | $ | 11.78 | | $ | 10.57 | |
| | | | | | | | | | | |
Investment operations | | | | | | | | | | | |
From net investment income (loss)(a),(b) | | 0.08 | | 0.08 | | 0.14 | | (0.05 | ) | (0.02 | ) |
From net realized and unrealized gain (loss) on affiliated investments | | 1.08 | | (6.14 | ) | 2.48 | | 1.85 | | 1.37 | |
Total from investment operations | | 1.16 | | (6.06 | ) | 2.62 | | 1.80 | | 1.35 | |
| | | | | | | | | | | |
Distributions | | | | | | | | | | | |
Net investment income | | (0.11 | ) | — | | (0.22 | ) | (0.04 | ) | (0.07 | ) |
Net realized gains on affiliated investments | | — | | (0.43 | ) | (0.45 | ) | (0.36 | ) | (0.07 | ) |
Total distributions | | (0.11 | ) | (0.43 | ) | (0.67 | ) | (0.40 | ) | (0.14 | ) |
| | | | | | | | | | | |
Net asset value | | | | | | | | | | | |
End of year | | $ | 9.69 | | $ | 8.64 | | $ | 15.13 | | $ | 13.18 | | $ | 11.78 | |
| | | | | | | | | | | |
Total return(c) | | 13.72 | % | (41.08 | )% | 20.60 | % | 15.61 | % | 12.82 | % |
| | | | | | | | | | | |
Net assets end of year | | $ | 763,086 | | $ | 751,881 | | $ | 1,270,635 | | $ | 876,768 | | $ | 528,211 | |
| | | | | | | | | | | |
Ratio and supplemental data | | | | | | | | | | | |
| | | | | | | | | | | |
Expenses to average net assets:(d) | | | | | | | | | | | |
After reimbursement/recapture | | 1.33 | % | 1.26 | % | 1.25 | % | 1.26 | % | 0.93 | % |
Before reimbursement/recapture | | 1.33 | % | 1.26 | % | 1.25 | % | 1.26 | % | 0.93 | % |
Net investment income (loss), to average net assets(e),(f) | | 0.90 | % | 0.62 | % | 1.03 | % | (0.38 | )% | (0.17 | )% |
Portfolio turnover rate(g) | | 47 | % | 12 | % | 18 | % | 22 | % | 35 | % |
For a share outstanding throughout each period
| | Transamerica Asset Allocation - Growth Portfolio | | | |
| | Class R | | | |
| | October 31,
2009 | | October 31,
2008 | | October 31,
2007 | | October 31,
2006(h) | | | |
Net asset value | | | | | | | | | | | |
Beginning of year | | $ | 8.84 | | $ | 15.40 | | $ | 13.43 | | $ | 12.36 | | | |
| | | | | | | | | | | |
Investment operations | | | | | | | | | | | |
From net investment income(a) | | 0.10 | | 0.07 | | 0.13 | | 0.05 | | | |
From net realized and unrealized gain (loss) on affiliated investments | | 1.12 | | (6.20 | ) | 2.60 | | 1.02 | | | |
Total from investment operations | | 1.22 | | (6.13 | ) | 2.73 | | 1.07 | | | |
| | | | | | | | | | | |
Distributions | | | | | | | | | | | |
Net investment income | | (0.21 | ) | — | | (0.31 | ) | — | | | |
Net realized gains on affiliated investments | | — | | (0.43 | ) | (0.45 | ) | — | | | |
Total distributions | | (0.21 | ) | (0.43 | ) | (0.76 | ) | — | | | |
| | | | | | | | | | | |
Net asset value | | | | | | | | | | | |
End of year | | $ | 9.85 | | $ | 8.84 | | $ | 15.40 | | $ | 13.43 | | | |
| | | | | | | | | | | |
Total return(c) | | 14.35 | % | (40.81 | )% | 21.20 | % | 8.66 | %(i) | | |
| | | | | | | | | | | |
Net assets end of year | | $ | 2,704 | | $ | 1,570 | | $ | 884 | | $ | 85 | | | |
| | | | | | | | | | | |
Ratio and supplemental data | | | | | | | | | | | |
| | | | | | | | | | | |
Expenses to average net assets:(d) | | | | | | | | | | | |
After reimbursement/recapture | | 0.85 | % | 0.83 | % | 0.68 | % | 0.67 | %(j) | | |
Before reimbursement/recapture | | 0.85 | % | 0.83 | % | 0.68 | % | 0.67 | %(j) | | |
Net investment income, to average net assets(e),(f) | | 1.09 | % | 0.57 | % | 0.94 | % | 1.08 | %(j) | | |
Portfolio turnover rate(g) | | 47 | % | 12 | % | 18 | % | 22 | %(i) | | |
The notes to the financial statements are an integral part of this report.
36
For a share outstanding throughout each period
| | Transamerica Asset Allocation - Moderate Growth Portfolio | |
| | Class A | |
| | October 31,
2009 | | October 31,
2008 | | October 31,
2007 | | October 31,
2006 | | October 31,
2005 | |
Net asset value | | | | | | | | | | | |
Beginning of year | | $ | 9.20 | | $ | 14.58 | | $ | 13.05 | | $ | 11.88 | | $ | 10.97 | |
| | | | | | | | | | | |
Investment operations | | | | | | | | | | | |
From net investment income(a),(b) | | 0.28 | | 0.26 | | 0.33 | | 0.15 | | 0.16 | |
From net realized and unrealized gain (loss) on affiliated investments | | 1.25 | | (5.04 | ) | 1.86 | | 1.53 | | 1.00 | |
Total from investment operations | | 1.53 | | (4.78 | ) | 2.19 | | 1.68 | | 1.16 | |
| | | | | | | | | | | |
Distributions | | | | | | | | | | | |
Net investment income | | (0.34 | ) | (0.19 | ) | (0.34 | ) | (0.20 | ) | (0.20 | ) |
Net realized gains on affiliated investments | | — | | (0.41 | ) | (0.32 | ) | (0.31 | ) | (0.05 | ) |
Total distributions | | (0.34 | ) | (0.60 | ) | (0.66 | ) | (0.51 | ) | (0.25 | ) |
| | | | | | | | | | | |
Net asset value | | | | | | | | | | | |
End of year | | $ | 10.39 | | $ | 9.20 | | $ | 14.58 | | $ | 13.05 | | $ | 11.88 | |
| | | | | | | | | | | |
Total return(c) | | 17.47 | % | (34.01 | )% | 17.48 | % | 14.59 | % | 10.69 | % |
| | | | | | | | | | | |
Net assets end of year | | $ | 1,044,810 | | $ | 901,766 | | $ | 1,295,568 | | $ | 914,835 | | $ | 560,231 | |
| | | | | | | | | | | |
Ratio and supplemental data | | | | | | | | | | | |
| | | | | | | | | | | |
Expenses to average net assets:(d) | | | | | | | | | | | |
After reimbursement/recapture | | 0.66 | % | 0.60 | % | 0.60 | % | 0.61 | % | 0.28 | % |
Before reimbursement/recapture | | 0.66 | % | 0.60 | % | 0.60 | % | 0.61 | % | 0.28 | % |
Net investment income, to average net assets(e),(f) | | 2.99 | % | 2.12 | % | 2.42 | % | 1.17 | % | 1.37 | % |
Portfolio turnover rate(g) | | 37 | % | 13 | % | 19 | % | 21 | % | 26 | % |
For a share outstanding throughout each period
| | Transamerica Asset Allocation - Moderate Growth Portfolio | |
| | Class B | |
| | October 31,
2009 | | October 31,
2008 | | October 31,
2007 | | October 31,
2006 | | October 31,
2005 | |
Net asset value | | | | | | | | | | | |
Beginning of year | | $ | 9.12 | | $ | 14.45 | | $ | 12.94 | | $ | 11.80 | | $ | 10.90 | |
| | | | | | | | | | | |
Investment operations | | | | | | | | | | | |
From net investment income(a),(b) | | 0.22 | | 0.19 | | 0.24 | | 0.06 | | 0.08 | |
From net realized and unrealized gain (loss) on affiliated investments | | 1.24 | | (5.01 | ) | 1.85 | | 1.52 | | 1.01 | |
Total from investment operations | | 1.46 | | (4.82 | ) | 2.09 | | 1.58 | | 1.09 | |
| | | | | | | | | | | |
Distributions | | | | | | | | | | | |
Net investment income | | (0.24 | ) | (0.10 | ) | (0.26 | ) | (0.13 | ) | (0.14 | ) |
Net realized gains on affiliated investments | | — | | (0.41 | ) | (0.32 | ) | (0.31 | ) | (0.05 | ) |
Total distributions | | (0.24 | ) | (0.51 | ) | (0.58 | ) | (0.44 | ) | (0.19 | ) |
| | | | | | | | | | | |
Net asset value | | | | | | | | | | | |
End of year | | $ | 10.34 | | $ | 9.12 | | $ | 14.45 | | $ | 12.94 | | $ | 11.80 | |
| | | | | | | | | | | |
Total return(c) | | 16.69 | % | (34.44 | )% | 16.69 | % | 13.74 | % | 10.05 | % |
| | | | | | | | | | | |
Net assets end of year | | $ | 394,275 | | $ | 389,429 | | $ | 651,359 | | $ | 549,040 | | $ | 428,677 | |
| | | | | | | | | | | |
Ratio and supplemental data | | | | | | | | | | | |
| | | | | | | | | | | |
Expenses to average net assets:(d) | | | | | | | | | | | |
After reimbursement/recapture | | 1.33 | % | 1.27 | % | 1.27 | % | 1.28 | % | 0.95 | % |
Before reimbursement/recapture | | 1.33 | % | 1.27 | % | 1.27 | % | 1.28 | % | 0.95 | % |
Net investment income, to average net assets(e),(f) | | 2.39 | % | 1.54 | % | 1.78 | % | 0.51 | % | 0.68 | % |
Portfolio turnover rate(g) | | 37 | % | 13 | % | 19 | % | 21 | % | 26 | % |
The notes to the financial statements are an integral part of this report.
37
For a share outstanding throughout each period
| | Transamerica Asset Allocation - Moderate Growth Portfolio | |
| | Class C | |
| | October 31,
2009 | | October 31,
2008 | | October 31,
2007 | | October 31,
2006 | | October 31,
2005 | |
Net asset value | | | | | | | | | | | |
Beginning of year | | $ | 9.11 | | $ | 14.45 | | $ | 12.95 | | $ | 11.80 | | $ | 10.91 | |
| | | | | | | | | | | |
Investment operations | | | | | | | | | | | |
From net investment income(a),(b) | | 0.22 | | 0.18 | | 0.24 | | 0.07 | | 0.08 | |
From net realized and unrealized gain (loss) on affiliated investments | | 1.25 | | (5.00 | ) | 1.85 | | 1.52 | | 1.01 | |
Total from investment operations | | 1.47 | | (4.82 | ) | 2.09 | | 1.59 | | 1.09 | |
| | | | | | | | | | | |
Distributions | | | | | | | | | | | |
Net investment income | | (0.26 | ) | (0.11 | ) | (0.27 | ) | (0.13 | ) | (0.15 | ) |
Net realized gains on affiliated investments | | — | | (0.41 | ) | (0.32 | ) | (0.31 | ) | (0.05 | ) |
Total distributions | | (0.26 | ) | (0.52 | ) | (0.59 | ) | (0.44 | ) | (0.20 | ) |
| | | | | | | | | | | |
Net asset value | | | | | | | | | | | |
End of year | | $ | 10.32 | | $ | 9.11 | | $ | 14.45 | | $ | 12.95 | | $ | 11.80 | |
| | | | | | | | | | | |
Total return(c) | | 16.77 | % | (34.44 | )% | 16.74 | % | 13.87 | % | 10.02 | % |
| | | | | | | | | | | |
Net assets end of year | | $ | 1,513,954 | | $ | 1,455,012 | | $ | 2,098,087 | | $ | 1,520,489 | | $ | 981,156 | |
| | | | | | | | | | | |
Ratio and supplemental data | | | | | | | | | | | |
| | | | | | | | | | | |
Expenses to average net assets:(d) | | | | | | | | | | | |
After reimbursement/recapture | | 1.28 | % | 1.23 | % | 1.23 | % | 1.24 | % | 0.90 | % |
Before reimbursement/recapture | | 1.28 | % | 1.23 | % | 1.23 | % | 1.24 | % | 0.90 | % |
Net investment income, to average net assets(e),(f) | | 2.43 | % | 1.49 | % | 1.79 | % | 0.55 | % | 0.74 | % |
Portfolio turnover rate(g) | | 37 | % | 13 | % | 19 | % | 21 | % | 26 | % |
For a share outstanding throughout each period
| | Transamerica Asset Allocation - Moderate Growth Portfolio | | | |
| | Class R | | | |
| | October 31,
2009 | | October 31,
2008 | | October 31,
2007 | | October 31,
2006(h) | | | |
Net asset value | | | | | | | | | | | |
Beginning of year | | $ | 9.18 | | $ | 14.54 | | $ | 13.05 | | $ | 12.13 | | | |
| | | | | | | | | | | |
Investment operations | | | | | | | | | | | |
From net investment income(a) | | 0.25 | | 0.22 | | 0.24 | | 0.10 | | | |
From net realized and unrealized gain (loss) on affiliated investments | | 1.26 | | (5.00 | ) | 1.93 | | 0.82 | | | |
Total from investment operations | | 1.51 | | (4.78 | ) | 2.17 | | 0.92 | | | |
| | | | | | | | | | | |
Distributions | | | | | | | | | | | |
Net investment income | | (0.33 | ) | (0.17 | ) | (0.36 | ) | — | | | |
Net realized gains on affiliated investments | | — | | (0.41 | ) | (0.32 | ) | — | | | |
Total distributions | | (0.33 | ) | (0.58 | ) | (0.68 | ) | — | | | |
| | | | | | | | | | | |
Net asset value | | | | | | | | | | | |
End of year | | $ | 10.36 | | $ | 9.18 | | $ | 14.54 | | $ | 13.05 | | | |
| | | | | | | | | | | |
Total return(c) | | 17.29 | % | (34.08 | )% | 17.31 | % | 7.58 | %(i) | | |
| | | | | | | | | | | |
Net assets end of year | | $ | 2,873 | | $ | 1,969 | | $ | 1,983 | | $ | 54 | | | |
| | | | | | | | | | | |
Ratio and supplemental data | | | | | | | | | | | |
| | | | | | | | | | | |
Expenses to average net assets:(d) | | | | | | | | | | | |
After reimbursement/recapture | | 0.82 | % | 0.76 | % | 0.67 | % | 0.66 | %(j) | | |
Before reimbursement/recapture | | 0.82 | % | 0.76 | % | 0.67 | % | 0.66 | %(j) | | |
Net investment income, to average net assets(e),(f) | | 2.68 | % | 1.74 | % | 1.80 | % | 2.08 | %(j) | | |
Portfolio turnover rate(g) | | 37 | % | 13 | % | 19 | % | 21 | %(i) | | |
The notes to the financial statements are an integral part of this report.
38
For a share outstanding throughout each period
| | Transamerica Asset Allocation - Moderate Portfolio | |
| | Class A | |
| | October 31,
2009 | | October 31,
2008 | | October 31,
2007 | | October 31,
2006 | | October 31,
2005 | |
Net asset value | | | | | | | | | | | |
Beginning of year | | $ | 9.29 | | $ | 13.69 | | $ | 12.64 | | $ | 11.78 | | $ | 11.23 | |
| | | | | | | | | | | |
Investment operations | | | | | | | | | | | |
From net investment income(a),(b) | | 0.36 | | 0.33 | | 0.36 | | 0.24 | | 0.27 | |
From net realized and unrealized gain (loss) on affiliated investments | | 1.40 | | (4.05 | ) | 1.40 | | 1.15 | | 0.67 | |
Total from investment operations | | 1.76 | | (3.72 | ) | 1.76 | | 1.39 | | 0.94 | |
| | | | | | | | | | | |
Distributions | | | | | | | | | | | |
Net investment income | | (0.43 | ) | (0.28 | ) | (0.37 | ) | (0.28 | ) | (0.33 | ) |
Net realized gains on affiliated investments | | — | | (0.40 | ) | (0.34 | ) | (0.25 | ) | (0.06 | ) |
Total distributions | | (0.43 | ) | (0.68 | ) | (0.71 | ) | (0.53 | ) | (0.39 | ) |
| | | | | | | | | | | |
Net asset value | | | | | | | | | | | |
End of year | | $ | 10.62 | | $ | 9.29 | | $ | 13.69 | | $ | 12.64 | | $ | 11.78 | |
| | | | | | | | | | | |
Total return(c) | | 19.99 | % | (28.41 | )% | 14.51 | % | 12.22 | % | 8.54 | % |
| | | | | | | | | | | |
Net assets end of year | | $ | 694,532 | | $ | 545,646 | | $ | 665,013 | | $ | 471,902 | | $ | 329,797 | |
| | | | | | | | | | | |
Ratio and supplemental data | | | | | | | | | | | |
| | | | | | | | | | | |
Expenses to average net assets:(d) | | | | | | | | | | | |
After reimbursement/recapture | | 0.63 | % | 0.59 | % | 0.59 | % | 0.58 | % | 0.26 | % |
Before reimbursement/recapture | | 0.63 | % | 0.59 | % | 0.59 | % | 0.58 | % | 0.26 | % |
Net investment income, to average net assets(e),(f) | | 3.76 | % | 2.79 | % | 2.83 | % | 1.98 | % | 2.31 | % |
Portfolio turnover rate(g) | | 30 | % | 12 | % | 23 | % | 22 | % | 19 | % |
For a share outstanding throughout each period
| | Transamerica Asset Allocation - Moderate Portfolio | |
| | Class B | |
| | October 31,
2009 | | October 31,
2008 | | October 31,
2007 | | October 31,
2006 | | October 31,
2005 | |
Net asset value | | | | | | | | | | | |
Beginning of year | | $ | 9.23 | | $ | 13.59 | | $ | 12.55 | | $ | 11.70 | | $ | 11.16 | |
| | | | | | | | | | | |
Investment operations | | | | | | | | | | | |
From net investment income(a),(b) | | 0.30 | | 0.27 | | 0.28 | | 0.16 | | 0.18 | |
From net realized and unrealized gain (loss) on affiliated investments | | 1.39 | | (4.05 | ) | 1.39 | | 1.15 | | 0.68 | |
Total from investment operations | | 1.69 | | (3.78 | ) | 1.67 | | 1.31 | | 0.86 | |
| | | | | | | | | | | |
Distributions | | | | | | | | | | | |
Net investment income | | (0.33 | ) | (0.18 | ) | (0.28 | ) | (0.21 | ) | (0.26 | ) |
Net realized gains on affiliated investments | | — | | (0.40 | ) | (0.34 | ) | (0.25 | ) | (0.06 | ) |
Total distributions | | (0.33 | ) | (0.58 | ) | (0.62 | ) | (0.46 | ) | (0.32 | ) |
| | | | | | | | | | | |
Net asset value | | | | | | | | | | | |
End of year | | $ | 10.59 | | $ | 9.23 | | $ | 13.59 | | $ | 12.55 | | $ | 11.70 | |
| | | | | | | | | | | |
Total return(c) | | 19.16 | % | (28.87 | )% | 13.73 | % | 11.50 | % | 7.81 | % |
| | | | | | | | | | | |
Net assets end of year | | $ | 228,151 | | $ | 223,209 | | $ | 357,175 | | $ | 336,385 | | $ | 295,649 | |
| | | | | | | | | | | |
Ratio and supplemental data | | | | | | | | | | | |
| | | | | | | | | | | |
Expenses to average net assets:(d) | | | | | | | | | | | |
After reimbursement/recapture | | 1.30 | % | 1.25 | % | 1.25 | % | 1.25 | % | 0.92 | % |
Before reimbursement/recapture | | 1.30 | % | 1.25 | % | 1.25 | % | 1.25 | % | 0.92 | % |
Net investment income, to average net assets(e),(f) | | 3.23 | % | 2.26 | % | 2.21 | % | 1.31 | % | 1.61 | % |
Portfolio turnover rate(g) | | 30 | % | 12 | % | 23 | % | 22 | % | 19 | % |
The notes to the financial statements are an integral part of this report.
39
For a share outstanding throughout each period
| | Transamerica Asset Allocation - Moderate Portfolio | |
| | Class C | |
| | October 31,
2009 | | October 31,
2008 | | October 31,
2007 | | October 31,
2006 | | October 31,
2005 | |
Net asset value | | | | | | | | | | | |
Beginning of year | | $ | 9.21 | | $ | 13.58 | | $ | 12.55 | | $ | 11.70 | | $ | 11.17 | |
| | | | | | | | | | | |
Investment operations | | | | | | | | | | | |
From net investment income(a),(b) | | 0.30 | | 0.26 | | 0.28 | | 0.16 | | 0.19 | |
From net realized and unrealized gain (loss) on affiliated investments | | 1.39 | | (4.03 | ) | 1.39 | | 1.14 | | 0.67 | |
Total from investment operations | | 1.69 | | (3.77 | ) | 1.67 | | 1.30 | | 0.86 | |
| | | | | | | | | | | |
Distributions | | | | | | | | | | | |
Net investment income | | (0.35 | ) | (0.20 | ) | (0.30 | ) | (0.21 | ) | (0.27 | ) |
Net realized gains on affiliated investments | | — | | (0.40 | ) | (0.34 | ) | (0.25 | ) | (0.06 | ) |
Total distributions | | (0.35 | ) | (0.60 | ) | (0.64 | ) | (0.46 | ) | (0.33 | ) |
| | | | | | | | | | | |
Net asset value | | | | | | | | | | | |
End of year | | $ | 10.55 | | $ | 9.21 | | $ | 13.58 | | $ | 12.55 | | $ | 11.70 | |
| | | | | | | | | | | |
Total return(c) | | 19.24 | % | (28.87 | )% | 13.86 | % | 11.46 | % | 7.85 | % |
| | | | | | | | | | | |
Net assets end of year | | $ | 997,766 | | $ | 876,977 | | $ | 1,159,220 | | $ | 905,061 | | $ | 678,783 | |
| | | | | | | | | | | |
Ratio and supplemental data | | | | | | | | | | | |
| | | | | | | | | | | |
Expenses to average net assets:(d) | | | | | | | | | | | |
After reimbursement/recapture | | 1.24 | % | 1.21 | % | 1.21 | % | 1.22 | % | 0.89 | % |
Before reimbursement/recapture | | 1.24 | % | 1.21 | % | 1.21 | % | 1.22 | % | 0.89 | % |
Net investment income, to average net assets(e),(f) | | 3.25 | % | 2.21 | % | 2.22 | % | 1.35 | % | 1.67 | % |
Portfolio turnover rate(g) | | 30 | % | 12 | % | 23 | % | 22 | % | 19 | % |
For a share outstanding throughout each period
| | Transamerica Asset Allocation - Moderate Portfolio | | | |
| | Class R | | | |
| | October 31,
2009 | | October 31,
2008 | | October 31,
2007 | | October 31,
2006(h) | | | |
Net asset value | | | | | | | | | | | |
Beginning of year | | $ | 9.28 | | $ | 13.65 | | $ | 12.64 | | $ | 11.86 | | | |
| | | | | | | | | | | |
Investment operations | | | | | | | | | | | |
From net investment income(a) | | 0.32 | | 0.28 | | 0.31 | | 0.13 | | | |
From net realized and unrealized gain (loss) on affiliated investments | | 1.42 | | (4.02 | ) | 1.42 | | 0.65 | | | |
Total from investment operations | | 1.74 | | (3.74 | ) | 1.73 | | 0.78 | | | |
| | | | | | | | | | | |
Distributions | | | | | | | | | | | |
Net investment income | | (0.44 | ) | (0.23 | ) | (0.38 | ) | — | | | |
Net realized gains on affiliated investments | | — | | (0.40 | ) | (0.34 | ) | — | | | |
Total distributions | | (0.44 | ) | (0.63 | ) | (0.72 | ) | — | | | |
| | | | | | | | | | | |
Net asset value | | | | | | | | | | | |
End of year | | $ | 10.58 | | $ | 9.28 | | $ | 13.65 | | $ | 12.64 | | | |
| | | | | | | | | | | |
Total return(c) | | 19.81 | % | (28.57 | )% | 14.31 | % | 6.58 | %(i) | | |
| | | | | | | | | | | |
Net assets end of year | | $ | 2,211 | | $ | 959 | | $ | 610 | | $ | 53 | | | |
| | | | | | | | | | | |
Ratio and supplemental data | | | | | | | | | | | |
| | | | | | | | | | | |
Expenses to average net assets:(d) | | | | | | | | | | | |
After reimbursement/recapture | | 0.86 | % | 0.87 | % | 0.72 | % | 0.66 | %(j) | | |
Before reimbursement/recapture | | 0.86 | % | 0.87 | % | 0.72 | % | 0.66 | %(j) | | |
Net investment income, to average net assets(e),(f) | | 3.38 | % | 2.37 | % | 2.44 | % | 2.73 | %(j) | | |
Portfolio turnover rate(g) | | 30 | % | 12 | % | 23 | % | 22 | %(i) | | |
The notes to the financial statements are an integral part of this report.
40
For a share outstanding throughout each period
| | Transamerica Multi-Manager Alternative
Strategies Portfolio | | | | | |
| | Class A | | | | | |
| | October 31,
2009 | | October 31,
2008 | | October 31,
2007(k) | | | | | |
Net asset value | | | | | | | | | | | |
Beginning of year | | $ | 8.30 | | $ | 10.78 | | $ | 10.00 | | | | | |
| | | | | | | | | | | |
Investment operations | | | | | | | | | | | |
From net investment income(a) | | 0.29 | | 0.20 | | 0.05 | | | | | |
From net realized and unrealized gain (loss) on affiliated investments | | 1.08 | | (2.43 | ) | 0.73 | | | | | |
Total from investment operations | | 1.37 | | (2.23 | ) | 0.78 | | | | | |
| | | | | | | | | | | |
Distributions | | | | | | | | | | | |
Net investment income | | (0.32 | ) | (0.25 | ) | — | | | | | |
Net realized gains on affiliated investments | | — | | — | | — | | | | | |
Total distributions | | (0.32 | ) | (0.25 | ) | — | | | | | |
| | | | | | | | | | | |
Net asset value | | | | | | | | | | | |
End of year | | $ | 9.35 | | $ | 8.30 | | $ | 10.78 | | | | | |
| | | | | | | | | | | |
Total return(c) | | 17.21 | % | (21.08 | )% | 7.80 | %(i) | | | | |
| | | | | | | | | | | |
Net assets end of year | | $ | 119,693 | | $ | 97,482 | | $ | 38,870 | | | | | |
| | | | | | | | | | | |
Ratio and supplemental data | | | | | | | | | | | |
| | | | | | | | | | | |
Expenses to average net assets:(d) | | | | | | | | | | | |
After reimbursement/recapture | | 0.81 | % | 0.84 | %(#) | 0.90 | %(j) | | | | |
Before reimbursement/recapture | | 0.81 | % | 0.84 | %(#) | 1.29 | %(j) | | | | |
Net investment income, to average net assets(e),(f) | | 3.43 | % | 1.98 | % | 0.58 | %(j) | | | | |
Portfolio turnover rate(g) | | 18 | % | 5 | % | — | %(i),(l) | | | | |
For a share outstanding throughout each period
| | Transamerica Multi-Manager Alternative
Strategies Portfolio | | | | | |
| | Class C | | | | | |
| | October 31,
2009 | | October 31,
2008 | | October 31,
2007(k) | | | | | |
Net asset value | | | | | | | | | | | |
Beginning of year | | $ | 8.23 | | $ | 10.72 | | $ | 10.00 | | | | | |
| | | | | | | | | | | |
Investment operations | | | | | | | | | | | |
From net investment income (loss)(a) | | 0.24 | | 0.15 | | (0.01 | ) | | | | |
From net realized and unrealized gain (loss) on affiliated investments | | 1.06 | | (2.42 | ) | 0.73 | | | | | |
Total from investment operations | | 1.30 | | (2.27 | ) | 0.72 | | | | | |
| | | | | | | | | | | |
Distributions | | | | | | | | | | | |
Net investment income | | (0.26 | ) | (0.22 | ) | — | | | | | |
Net realized gains on affiliated investments | | — | | — | | — | | | | | |
Total distributions | | (0.26 | ) | (0.22 | ) | — | | | | | |
| | | | | | | | | | | |
Net asset value | | | | | | | | | | | |
End of year | | $ | 9.27 | | $ | 8.23 | | $ | 10.72 | | | | | |
| | | | | | | | | | | |
Total return(c) | | 16.37 | % | (21.52 | )% | 7.20 | %(i) | | | | |
| | | | | | | | | | | |
Net assets end of year | | $ | 96,376 | | $ | 89,701 | | $ | 49,306 | | | | | |
| | | | | | | | | | | |
Ratio and supplemental data | | | | | | | | | | | |
| | | | | | | | | | | |
Expenses to average net assets:(d) | | | | | | | | | | | |
After reimbursement/recapture | | 1.45 | % | 1.52 | %(#) | 1.55 | %(j) | | | | |
Before reimbursement/recapture | | 1.45 | % | 1.52 | %(#) | 1.99 | %(j) | | | | |
Net investment income (loss), to average net assets(e),(f) | | 2.92 | % | 1.53 | % | (0.07 | )%(j) | | | | |
Portfolio turnover rate(g) | | 18 | % | 5 | % | — | %(i),(l) | | | | |
The notes to the financial statements are an integral part of this report.
41
For a share outstanding throughout each period
| | Transamerica Multi-Manager International Portfolio | | | |
| | Class A | | | |
| | October 31,
2009 | | October 31,
2008 | | October 31,
2007 | | October 31,
2006(m) | | | |
Net asset value | | | | | | | | | | | |
Beginning of year | | $ | 6.57 | | $ | 13.24 | | $ | 10.63 | | $ | 10.00 | | | |
| | | | | | | | | | | |
Investment operations | | | | | | | | | | | |
From net investment income (loss)(a) | | 0.17 | | 0.27 | | 0.32 | | (0.04 | ) | | |
From net realized and unrealized gain (loss) on affiliated investments | | 1.84 | | (6.53 | ) | 2.87 | | 0.67 | | | |
Total from investment operations | | 2.01 | | (6.26 | ) | 3.19 | | 0.63 | | | |
| | | | | | | | | | | |
Distributions | | | | | | | | | | | |
Net investment income | | (0.05 | ) | (0.32 | ) | (0.58 | ) | — | | | |
Net realized gains on affiliated investments | | — | | (0.09 | ) | — | | — | | | |
Total distributions | | (0.05 | ) | (0.41 | ) | (0.58 | ) | — | | | |
| | | | | | | | | | | |
Net asset value | | | | | | | | | | | |
End of year | | $ | 8.53 | | $ | 6.57 | | $ | 13.24 | | $ | 10.63 | | | |
| | | | | | | | | | | |
Total return(c) | | 30.86 | % | (48.61 | )% | 31.30 | % | 6.30 | %(i) | | |
| | | | | | | | | | | |
Net assets end of year | | $ | 134,751 | | $ | 103,077 | | $ | 178,422 | | $ | 58,142 | | | |
| | | | | | | | | | | |
Ratio and supplemental data | | | | | | | | | | | |
| | | | | | | | | | | |
Expenses to average net assets:(d) | | | | | | | | | | | |
After reimbursement/recapture | | 0.74 | % | 0.65 | % | 0.65 | % | 0.80 | %(j) | | |
Before reimbursement/recapture | | 0.74 | % | 0.65 | % | 0.65 | % | 0.88 | %(j) | | |
Net investment income (loss), to average net assets(e),(f) | | 2.35 | % | 2.59 | % | 2.78 | % | (0.67 | )%(j) | | |
Portfolio turnover rate(g) | | 32 | % | 38 | % | 1 | % | 1 | %(i) | | |
For a share outstanding throughout each period
| | Transamerica Multi-Manager International Portfolio | | | |
| | Class B | | | |
| | October 31,
2009 | | October 31,
2008 | | October 31,
2007 | | October 31,
2006(m) | | | |
Net asset value | | | | | | | | | | | |
Beginning of year | | $ | 6.50 | | $ | 13.13 | | $ | 10.59 | | $ | 10.00 | | | |
| | | | | | | | | | | |
Investment operations | | | | | | | | | | | |
| | | | | | | | | | | |
From net investment income (loss)(a) | | 0.01 | | 0.21 | | 0.23 | | (0.09 | ) | | |
From net realized and unrealized gain (loss) on affiliated investments | | 1.94 | | (6.50 | ) | 2.86 | | 0.68 | | | |
Total from investment operations | | 1.95 | | (6.29 | ) | 3.09 | | 0.59 | | | |
| | | | | | | | | | | |
Distributions | | | | | | | | | | | |
Net investment income | | — | | (0.25 | ) | (0.55 | ) | — | | | |
Net realized gains on affiliated investments | | — | | (0.09 | ) | — | | — | | | |
Total distributions | | — | | (0.34 | ) | (0.55 | ) | — | | | |
| | | | | | | | | | | |
Net asset value | | | | | | | | | | | |
End of year | | $ | 8.45 | | $ | 6.50 | | $ | 13.13 | | $ | 10.59 | | | |
| | | | | | | | | | | |
Total return(c) | | 30.00 | % | (49.04 | )% | 30.32 | % | 5.90 | %(i) | | |
| | | | | | | | | | | |
Net assets end of year | | $ | 18,010 | | $ | 15,781 | | $ | 30,060 | | $ | 9,849 | | | |
| | | | | | | | | | | |
Ratio and supplemental data | | | | | | | | | | | |
| | | | | | | | | | | |
Expenses to average net assets:(d) | | | | | | | | | | | |
After reimbursement/recapture | | 1.45 | % | 1.42 | % | 1.43 | % | 1.45 | %(j) | | |
Before reimbursement/recapture | | 1.57 | % | 1.42 | % | 1.43 | % | 1.69 | %(j) | | |
Net investment income (loss), to average net assets(e),(f) | | 0.08 | % | 1.95 | % | 1.98 | % | (1.32 | )%(j) | | |
Portfolio turnover rate(g) | | 32 | % | 38 | % | 1 | % | 1 | %(i) | | |
The notes to the financial statements are an integral part of this report.
42
For a share outstanding throughout each period
| | Transamerica Multi-Manager International Portfolio | | | |
| | Class C | | | |
| | October 31,
2009 | | October 31,
2008 | | October 31,
2007 | | October 31,
2006(m) | | | |
Net asset value | | | | | | | | | | | |
Beginning of year | | $ | 6.50 | | $ | 13.13 | | $ | 10.58 | | $ | 10.00 | | | |
| | | | | | | | | | | |
Investment operations | | | | | | | | | | | |
From net investment income (loss)(a) | | 0.03 | | 0.21 | | 0.24 | | (0.09 | ) | | |
From net realized and unrealized gain (loss) on affiliated investments | | 1.92 | | (6.49 | ) | 2.86 | | 0.67 | | | |
Total from investment operations | | 1.95 | | (6.28 | ) | 3.10 | | 0.58 | | | |
| | | | | | | | | | | |
Distributions | | | | | | | | | | | |
Net investment income | | — | | (0.26 | ) | (0.55 | ) | — | | | |
Net realized gains on affiliated investments | | — | | (0.09 | ) | — | | — | | | |
Total distributions | | — | | (0.35 | ) | (0.55 | ) | — | | | |
| | | | | | | | | | | |
Net asset value | | | | | | | | | | | |
End of year | | $ | 8.45 | | $ | 6.50 | | $ | 13.13 | | $ | 10.58 | | | |
| | | | | | | | | | | |
Total return(c) | | 30.00 | % | (48.98 | )% | 30.45 | % | 5.80 | %(i) | | |
| | | | | | | | | | | |
Net assets end of year | | $ | 132,777 | | $ | 128,742 | | $ | 250,419 | | $ | 76,650 | | | |
| | | | | | | | | | | |
Ratio and supplemental data | | | | | | | | | | | |
| | | | | | | | | | | |
Expenses to average net assets:(d) | | | | | | | | | | | |
After reimbursement/recapture | | 1.43 | % | 1.31 | % | 1.31 | % | 1.45 | %(j) | | |
Before reimbursement/recapture | | 1.43 | % | 1.31 | % | 1.31 | % | 1.53 | %(j) | | |
Net investment income (loss), to average net assets(e),(f) | | 0.50 | % | 2.01 | % | 2.08 | % | (1.32 | )%(j) | | |
Portfolio turnover rate(g) | | 32 | % | 38 | % | 1 | % | 1 | %(i) | | |
(a) | Calculated based on average number of shares outstanding. |
(b) | On November 15, 2005, the portfolio was authorized under its 12b-1 plan to pay fees on each class up to the following limits: Class A 0.35%, Class B 1.00%, Class C 1.00%, Class R 0.50%. |
(c) | Total return has been calculated for the applicable period without deduction of a sales load, if any, on an initial purchase. |
(d) | Do not include expenses of the investment companies in which the portfolio invests. |
(e) | Recognition of net investment income by the portfolio is affected by the timing of the declaration of dividends by the underlying affiliated investment companies in which the portfolio invests. |
(f) | Includes redemption fees, if any. The impact of redemption fees is less than 0.01% for Class A, Class B, Class C, and Class R, respectively. |
(g) | Do not include the portfolio activity of the underlying affiliated funds. |
(h) | Commenced operations on June 15, 2006. |
(i) | Not annualized. |
(j) | Annualized. |
(k) | Commenced operations on December 28, 2006. |
(l) | Amount rounds to less than 1% or (1%). |
(m) | Commenced operations on March 1, 2006. |
(#) | Includes recaptured expenses by the investment adviser. The impact of recaptured expenses was 0.07% and 0.09% for Class A and Class C, respectively (See Note 3). |
The notes to the financial statements are an integral part of this report.
43
NOTES TO FINANCIAL STATEMENTS
At October 31, 2009
(all amounts in thousands)
NOTE 1. ORGANIZATION AND SIGNIFICANT ACCOUNTING POLICIES
Transamerica Funds (the “Trust”) is an open-end management investment company registered under the Investment Company Act of 1940, as amended (the “1940 Act”). Transamerica Asset Allocation—Conservative Portfolio, Transamerica Asset Allocation—Growth Portfolio, Transamerica Asset Allocation—Moderate Growth Portfolio, Transamerica Asset Allocation—Moderate Portfolio, Transamerica Multi—Manager Alternative Strategies Portfolio, and Transamerica Multi—Manager International Portfolio (each, a “Portfolio”; and collectively, the “Portfolios”) are part of Transamerica Funds.
The Portfolios, with the exception of Transamerica Multi—Manager International Portfolio and Transamerica Multi-Manager Alternative Strategies Portfolio, currently offer four classes of shares, Class A, Class B, Class C, and Class R. Transamerica Multi—Manager International Portfolio currently offers three classes of shares, Class A, Class B, and Class C. Transamerica Multi—Manager Alternative Strategies Portfolio currently offers two classes of shares, Class A and Class C. Each class has a public offering price that reflects different sales charges, if any, and expense levels. Class B shares will convert to Class A shares eight years after purchase.
This report should be read in conjunction with the Portfolios’ current prospectus, which contains more complete information about the Portfolios, including investment objectives and strategies.
In the normal course of business, the Portfolios enter into contracts that contain a variety of representations that provide general indemnifications. The Portfolios’ maximum exposure under these arrangements is unknown, as this would involve future claims that may be made against the Portfolios and/or their affiliates that have not yet occurred. However, based on experience, the Portfolios expect the risk of loss to be remote.
In preparing the Portfolios’ financial statements in accordance with accounting principles generally accepted in the United States of America (“GAAP”), estimates or assumptions (which could differ from actual results) may be used that affect reported amounts and disclosures. The following is a summary of significant accounting policies followed by the Portfolios.
Security transactions and investment income: Security transactions are recorded on the trade date. Security gains and losses are calculated on the specific identification basis. Interest income is accrued as earned. Dividend income and capital gain distributions from affiliated investment companies, if any, are recorded on the ex-dividend date. Dividends and net realized gain (loss) from investment securities for the Portfolios are from investments in shares of affiliated investment companies.
Multiple class operations, income, and expenses: Income, non-class specific expenses and realized and unrealized gains and losses are allocated daily to each class, based upon the value of shares outstanding method as permitted under Rule 18f-3 of the 1940 Act. Each class bears its own specific expenses as well as a portion of general, common expenses.
Dividend distributions: Distributions to shareholders are recorded on the ex-dividend date and are determined in accordance with federal income tax regulations.
Redemption fees: A short-term trading redemption fee may be assessed on any sales of Portfolio shares in a fund account during the first five (5) NYSE trading days following their purchase date. This redemption fee will equal 2% of the amount redeemed and shares held the longest will be treated as being redeemed first and shares held the shortest as being redeemed last. For the year ended October 31, 2009, the Portfolios received redemption fees, which are disclosed in the Portfolios’ Statements of Changes in Net Assets. Effective March 1, 2009, the Portfolios no longer charge redemption fees.
Cash overdraft: Throughout the year, the Portfolios may have cash overdraft balances. A fee is incurred on these overdrafts, calculated by multiplying the overdrafts by a rate based on the federal funds rate.
NOTE 2. SECURITY VALUATIONS
All investments in securities are recorded at their estimated fair value. The Portfolios value their investments at the close of the New York Stock Exchange (“NYSE”), normally 4 p.m. ET, each day the NYSE is open for business. The Portfolios utilize various methods to measure the fair value of their investments on a recurring basis. GAAP establishes a hierarchy that prioritizes inputs to valuation methods. The three Levels of inputs are:
Level 1—Unadjusted quoted prices in active markets for identical securities.
Level 2—Inputs, other than quoted prices included in Level 1, that are observable, either directly or indirectly. These inputs may include quoted prices for the identical instrument on an inactive market, prices for similar instruments, interest rates, prepayment speeds, credit risk, yield curves, default rates and similar data.
Level 3—Unobservable inputs, to the extent that relevant observable inputs are not available, representing the Portfolios’ own assumptions about the assumptions a market participant would use in valuing the investment, based on the best information available.
44
NOTES TO FINANCIAL STATEMENTS (continued)
At October 31, 2009
(all amounts in thousands)
NOTE 2. (continued)
The availability of observable inputs can vary from security to security and is affected by a wide variety of factors, including, but not limited to, the type of security, whether the security is new and not yet established in the marketplace, the liquidity of markets, and other characteristics particular to the security. To the extent that valuation is based on models or inputs that are less observable or unobservable in the market, the determination of fair value requires more judgment. Accordingly, the degree of judgment exercised in determining fair value is generally greatest for instruments categorized in Level 3.
The inputs used to measure fair value may fall into different Levels of the fair value hierarchy. In such cases, for disclosure purposes, the Level in the fair value hierarchy that is assigned to the fair value measurement of a security is determined based on the lowest Level input that is significant to the fair value measurement in its entirety.
Fair value measurements: Investment company securities are valued at the net asset value of the underlying portfolio. These securities are actively traded and no valuation adjustments are applied. They are categorized in Level I of the fair value hierarchy.
The hierarchy classification of inputs used to value the Portfolios’ investments at October 31, 2009, are included at the end of the Portfolios’ Schedules of Investments.
NOTE 3. RELATED PARTY TRANSACTIONS
Transamerica Asset Management, Inc. (“TAM”) is the Portfolios’ investment adviser. Transamerica Fund Services, Inc. (“TFS”) is the Portfolios’ administrator and transfer agent. Transamerica Capital, Inc. (“TCI”) is the Portfolios’ distributor/principal underwriter. TAM, TFS, and TCI are affiliates of AEGON, NV.
Certain officers and trustees of the Portfolios are also officers and/or directors of TAM, TFS and TCI.
Because the underlying funds have varied expense and fee levels and the Portfolios may own different proportions of underlying funds at different times, the amount of fees and expenses incurred indirectly by the Portfolios will vary. The Portfolios have material ownership interests in the underlying funds.
At the commencement of operations of each of these Portfolios and classes, TAM invested in each Portfolio. As of October 31, 2009, TAM had investments in the Portfolios as follows:
Portfolio Name | | Market
Value | | % of Portfolio’s
Net Assets | |
Transamerica Asset Allocation-Conservative Portfolio | | | | | |
Class R | | $ | 54 | | 0.01 | % |
Transamerica Asset Allocation-Growth Portfolio | | | | | |
Class R | | 45 | | — | (a) |
Transamerica Asset Allocation-Moderate Growth Portfolio | | | | | |
Class R | | 49 | | — | (a) |
Transamerica Asset Allocation-Moderate Portfolio | | | | | |
Class R | | 52 | | — | (a) |
Transamerica Multi-Manager Alternative Strategies Portfolio | | | | | |
Class A | | 249 | | 0.12 | |
Transamerica Multi-Manager Alternative Strategies Portfolio | | | | | |
Class C | | 245 | | 0.11 | |
| | | | | | |
(a) Amount rounds to less than 0.01%.
Investment advisory fees: The Portfolios pay management fees to TAM based on average daily net assets (“ANA”) at the following rates or breakpoints:
Transamerica Asset Allocation — Conservative Portfolio | | | |
Average Daily Net Assets | | 0.10 | % |
Transamerica Asset Allocation — Growth Portfolio | | | |
Average Daily Net Assets | | 0.10 | % |
Transamerica Asset Allocation — Moderate Growth Portfolio | | | |
Average Daily Net Assets | | 0.10 | % |
Transamerica Asset Allocation — Moderate Portfolio | | | |
Average Daily Net Assets | | 0.10 | % |
Transamerica Multi-Manager Alternative Strategies Portfolio | | | |
First $500 million | | 0.20 | % |
Over $500 million up to $1 billion | | 0.19 | % |
Over $1 billion | | 0.18 | % |
Transamerica Multi - Manager International Portfolio | | | |
Average Daily Net Assets | | 0.10 | % |
45
NOTES TO FINANCIAL STATEMENTS (continued)
At October 31, 2009
(all amounts in thousands)
NOTE 3. (continued)
TAM has contractually agreed to waive its advisory fees and will reimburse the Portfolios to the extent that operating expenses, excluding 12b-1 fees, extraordinary expenses, and acquired (i.e. underlying) portfolios’ fees and expenses, exceed the following stated annual limit:
Portfolio Name | | Expense Limit | |
Transamerica Asset Allocation - Conservative Portfolio | | 0.45 | % |
Transamerica Asset Allocation - Growth Portfolio | | 0.45 | |
Transamerica Asset Allocation - Moderate Growth Portfolio | | 0.45 | |
Transamerica Asset Allocation - Moderate Portfolio | | 0.45 | |
Transamerica Multi-Manager Alternative Strategies Portfolio | | 0.55 | |
Transamerica Multi-Manager International Portfolio* | | 0.45 | |
*This Portfolio may not recapture any fees waived and/or reimbursed prior to March 1, 2008.
If total Portfolio expenses fall below the annual expense limitation agreement agreed to by the adviser within the succeeding three years, the Portfolios may be required to pay the adviser a portion or all of the reimbursed class expenses.
The following amounts were available for recapture as of October 31, 2009:
Transamerica Multi-Manager International Portfolio | | Reimbursement of Class Expenses | | Available for Recapture Through | |
Fiscal Year 2009: | | | | | |
Class B | | $ | 18 | | 10/31/2012 | |
| | | | | | |
Distribution and service fees: The Portfolios have 12b-1 distribution plans under the 1940 Act pursuant to which an annual fee, based on ANA, is paid to the distributor for various disbursements such as broker-dealer account servicing fees and other promotional expenses of the Portfolios. The Portfolios are authorized under the 12b-1 plans to pay fees on each available class up to the following limits: 0.35% for Class A; 1.00% for Class B; 1.00% for Class C; and 0.50% for Class R.
Underwriter commissions relate to front-end sales charges imposed for Class A shares and contingent deferred sales charges from Classes B, C, and certain A share redemptions. For the year ended October 31, 2009, the underwriter commissions were as follows:
Transamerica Asset Allocation - Conservative Portfolio | | | |
Received by Underwriter | | $ | 2,423 | |
Retained by Underwriter | | 394 | |
Contingent Deferred Sales Charge | | 426 | |
| | | |
Transamerica Asset Allocation - Growth Portfolio | | | |
Received by Underwriter | | $ | 2,688 | |
Retained by Underwriter | | 409 | |
Contingent Deferred Sales Charge | | 586 | |
| | | |
Transamerica Asset Allocation - Moderate Growth Portfolio | | | |
Received by Underwriter | | $ | 5,239 | |
Retained by Underwriter | | 807 | |
Contingent Deferred Sales Charge | | 1,088 | |
| | | |
Transamerica Asset Allocation - Moderate Portfolio | | | |
Received by Underwriter | | $ | 4,041 | |
Retained by Underwriter | | 641 | |
Contingent Deferred Sales Charge | | 683 | |
| | | |
Transamerica Multi-Manager Alternative Strategies Portfolio | | | |
Received by Underwriter | | $ | 548 | |
Retained by Underwriter | | 83 | |
Contingent Deferred Sales Charge | | 59 | |
| | | |
Transamerica Multi-Manager International Portfolio | | | |
Received by Underwriter | | $ | 245 | |
Retained by Underwriter | | 37 | |
Contingent Deferred Sales Charge | | 91 | |
Administrative services: The Portfolios have entered into agreements with TFS for financial and legal fund administration services. The Portfolios pay TFS an annual fee of 0.0125% of ANA. The Legal fees on the Statements of Operations are fees paid to external legal counsel.
Transfer agent fees: The Portfolios pay TFS an annual per-account charge for each open and closed account. The Portfolios paid TFS the following amounts for the year ended October 31, 2009:
Portfolio Name | | Fees | |
Transamerica Asset Allocation - Conservative Portfolio | | $ | 864 | |
Transamerica Asset Allocation - Growth Portfolio | | 2,716 | |
Transamerica Asset Allocation - Moderate Growth Portfolio | | 3,808 | |
Transamerica Asset Allocation - Moderate Portfolio | | 1,871 | |
Transamerica Multi-Manager Alternative Strategies Portfolio | | 312 | |
Transamerica Multi-Manager International Portfolio | | 560 | |
| | | | |
Deferred compensation plan: Each eligible Independent Portfolio Trustee may elect to participate in a non-qualified deferred compensation plan (the “Plan”). Under the Plan, such Trustees may defer payment of all or a portion of their total fees earned as a Portfolio Trustee. Each Trustee who is a participant in the Plan may elect that the earnings, losses or gains credited to his or her deferred fee amounts be determined based on a deemed investment in Class A shares of any series of Transamerica Funds, including the Portfolios, or investment options under Transamerica Partners Institutional Funds Group and Transamerica Institutional Asset Allocation Funds. The right of a participant to receive a distribution from the Plan of the deferred fees is a claim against the general assets of all series of Transamerica Funds.
46
NOTES TO FINANCIAL STATEMENTS (continued)
At October 31, 2009
(all amounts in thousands)
NOTE 3. (continued)
Retirement plan: Under a prior retirement plan (the “Emeritus Plan”) available to the Independent Trustees, each Independent Trustee was deemed to have been elected to serve as Trustee Emeritus of Transamerica Funds upon his or her termination of service, other than removal for cause, for a maximum period of five years determined by his or her years of service as a Trustee.
Such amounts were to be accrued by Transamerica Funds on a pro rata basis allocable to each Transamerica Fund based on the relative assets of the Portfolio. If retainers increased in the future, past accruals (and credits) would be adjusted upward so that 50% of the Trustee’s current retainer was accrued and credited at all times. Upon death, disability or termination of service, other than removal for cause, amounts deferred became payable to a Trustee Emeritus (or his/her beneficiary). Upon the commencement of service as Trustee Emeritus, compensation would be paid on a quarterly basis during the time period that the Trustee Emeritus was allowed to serve as such.
At October 31, 2009, the Portfolios’ liabilities related to the Emeritus Plan were as follows:
Portfolio Name | | Emeritus Fees | |
Transamerica Asset Allocation - Conservative Portfolio | | $ | 1 | |
Transamerica Asset Allocation - Growth Portfolio | | 2 | |
Transamerica Asset Allocation - Moderate Growth Portfolio | | 5 | |
Transamerica Asset Allocation - Moderate Portfolio | | 3 | |
Transamerica Multi-Manager International Portfolio | | — | (a) |
| | | | |
(a) Rounds to less than $1.
Amounts deferred and accrued under the Emeritus Plan are claims against the general assets of Transamerica Funds.
The Emeritus Plan was terminated effective October 30, 2007. Upon the termination, the Portfolios continue to pay any remaining benefits in accordance with the Plan, but no further compensation has been accrued.
NOTE 4. INVESTMENT TRANSACTIONS
The cost of securities purchased and proceeds from securities sold (excluding short-term securities) for the year ended October 31, 2009 were as follows:
| | Purchases of securities: | | Proceeds from maturities and sales of
securities: | |
Portfolio Name | | Long-term | | U.S. Government | | Long-term | | U.S. Government | |
Transamerica Asset Allocation - Conservative Portfolio | | $ | 326,116 | | $ | — | | $ | 217,057 | | $ | — | |
Transamerica Asset Allocation - Growth Portfolio | | 643,128 | | — | | 702,956 | | — | |
Transamerica Asset Allocation - Moderate Growth Portfolio | | 992,617 | | — | | 1,100,083 | | — | |
Transamerica Asset Allocation - Moderate Portfolio | | 553,943 | | — | | 507,543 | | — | |
Transamerica Multi-Manager Alternative Strategies Portfolio | | 46,612 | | — | | 33,159 | | — | |
Transamerica Multi-Manager International Portfolio | | 77,349 | | — | | 92,413 | | — | |
| | | | | | | | | | | | | |
NOTE 5. FEDERAL INCOME TAX MATTERS
The Portfolios have not made any provision for federal income or excise taxes due to their policy to distribute all of their taxable income and capital gains to their shareholders and otherwise qualify as regulated investment companies under Subchapter M of the Internal Revenue Code. Management has evaluated the Portfolios tax provisions taken for all open tax years and has concluded that no provision for income tax is required in the Portfolios’ financial statements. Income and capital gain distributions are determined in accordance with income tax regulations, which may differ from GAAP. These differences are primarily due to differing treatment for items including, but not limited to, wash sales, net operating losses and distribution reclasses.
47
NOTES TO FINANCIAL STATEMENTS (continued)
At October 31, 2009
(all amounts in thousands)
NOTE 5. (continued)
Therefore, distributions determined in accordance with tax regulations may differ significantly in amount or character from net investment income and realized gains for financial reporting purposes. Financial reporting records are adjusted for permanent book/tax differences to reflect tax character. Financial records are not adjusted for temporary differences. These reclassifications are listed in the table below. The Portfolios not listed in the table below did not have reclassifications.
Portfolio Name | | Shares of beneficial
interest, unlimited shares
authorized | | Undistributed
(accumulated) net
investment income (loss) | | Undistributed
(accumulated) net realized
gain (loss) from
investment securities | |
Transamerica Asset Allocation - Conservative Portfolio | | $ | 69 | | $ | — | | $ | (69 | ) |
Transamerica Asset Allocation - Growth Portfolio | | (1,582 | ) | — | | 1,582 | |
Transamerica Asset Allocation - Moderate Growth Portfolio | | (2,242 | ) | — | | 2,242 | |
Transamerica Asset Allocation - Moderate Portfolio | | (779 | ) | — | | 779 | |
| | | | | | | | | | |
The capital loss carryforwards are available to offset future realized capital gains through the periods listed below.
Portfolio Name | | Capital Loss Carryforwards | | Available Through | |
Transamerica Asset Allocation - Conservative Portfolio | | $ | 35,265 | | October 31, 2017 | |
Transamerica Asset Allocation - Growth Portfolio | | 176,408 | | October 31, 2017 | |
Transamerica Asset Allocation - Moderate Growth Portfolio | | 219,913 | | October 31, 2017 | |
Transamerica Asset Allocation - Moderate Portfolio | | 69,952 | | October 31, 2017 | |
Transamerica Multi-Manager Alternative Strategies Portfolio | | 151 | | October 31, 2016 | |
Transamerica Multi-Manager Alternative Strategies Portfolio | | 4,502 | | October 31, 2017 | |
Transamerica Multi-Manager International Portfolio | | 36,280 | | October 31, 2016 | |
Transamerica Multi-Manager International Portfolio | | 51,740 | | October 31, 2017 | |
| | | | | | |
There were no capital loss carryforwards utilized or expired during the year ended October 31, 2009.
The tax character of distributions paid may differ from the character of distributions shown in the Statements of Changes in Net Assets due to short-term gains being treated as ordinary income for tax purposes. The tax character of distributions paid during 2008 and 2009 was as follows:
| | Distributions Paid From: 2008 | | Distributions Paid From: 2009 | |
Portfolio Name | | Ordinary
income | | Long-term
Capital Gain | | Ordinary income | | Long-term
Capital Gain | |
Transamerica Asset Allocation - Conservative Portfolio | | $ | 18,360 | | $ | 13,795 | | $ | 33,484 | | $ | — | |
Transamerica Asset Allocation - Growth Portfolio | | 1,116 | | 68,795 | | 21,902 | | — | |
Transamerica Asset Allocation - Moderate Growth Portfolio | | 38,335 | | 115,144 | | 83,048 | | — | |
Transamerica Asset Allocation - Moderate Portfolio | | 35,977 | | 65,091 | | 65,813 | | — | |
Transamerica Multi-Manager Alternative Strategies Portfolio | | 2,452 | | — | | 6,303 | | — | |
Transamerica Multi-Manager International Portfolio | | 10,674 | | 3,331 | | 770 | | — | |
| | | | | | | | | | | | | |
The tax basis components of distributable earnings as of October 31, 2009 are as follows:
Portfolio Name | | Undistributed
Ordinary income | | Undistributed
Long-term
Capital Gain | | Capital Loss
Carryforwards | | Other
Temporary
Differences | | Net Unrealized
Appreciation
(Depreciation) | |
Transamerica Asset Allocation - Conservative Portfolio | | $ | 1,685 | | $ | — | | $ | (35,265 | ) | $ | — | | $ | 4,867 | |
Transamerica Asset Allocation - Growth Portfolio | | 8,842 | | — | | (176,408 | ) | — | | (157,612 | ) |
Transamerica Asset Allocation - Moderate Growth Portfolio | | 11,619 | | — | | (219,913 | ) | — | | (197,721 | ) |
Transamerica Asset Allocation - Moderate Portfolio | | 17,604 | | — | | (69,952 | ) | — | | (52,950 | ) |
Transamerica Multi-Manager Alternative Strategies Portfolio | | 41 | | — | | (4,653 | ) | — | | (20,296 | ) |
Transamerica Multi-Manager International Portfolio | | 2,280 | | — | | (88,020 | ) | — | | (38,028 | ) |
| | | | | | | | | | | | | | | | |
48
NOTES TO FINANCIAL STATEMENTS (continued)
At October 31, 2009
(all amounts in thousands)
NOTE 6. ACCOUNTING PRONOUNCEMENT
In March 2008, the Financial Accounting Standards Board issued amendments to authoritative guidance on disclosures about derivative instruments and hedging activities which require that the Portfolio disclose: a) how and why an entity uses derivative instruments, b) how derivative instruments and related hedged items are accounted for and c) how derivative instruments and related hedged items affect an entity’s financial position, financial performance and cash flows. The adoption of the additional disclosure requirements is effective for financial statements issued for fiscal years beginning after November 15, 2008. Management is currently evaluating the application of the adoption of the additional disclosure requirements and its impact on the Portfolios’ financial statements.
NOTE 7. SUBSEQUENT EVENTS
Effective November 30, 2009, the Portfolios offered a new class of shares, Class I shares.
Effective November 30, 2009, all existing Class I shares were re-designated as Class I2 shares. Accordingly, the Portfolios will be investing their assets in Class I2 shares of affiliated funds of Transamerica Funds.
Management has evaluated subsequent events through December 21, 2009, the date of issuance of the financial statements, and determined that no other material events or transactions would require recognition or disclosure in the Portfolios’ financial statements.
49
Report of Independent Registered Certified Public Accounting Firm
To the Board of Trustees and Shareholders of Transamerica Asset Allocation - Conservative Portfolio, Transamerica Asset Allocation - Growth Portfolio, Transamerica Asset Allocation - Moderate Growth Portfolio, Transamerica Asset Allocation - Moderate Portfolio, Transamerica Multi-Manager Alternative Strategies Portfolio, and Transamerica Multi-Manager International Portfolio:
In our opinion, the accompanying statements of assets and liabilities, including the schedules of investments, and the related statements of operations and of changes in net assets and the financial highlights present fairly, in all material respects, the financial position of Transamerica Asset Allocation - Conservative Portfolio, Transamerica Asset Allocation - Growth Portfolio, Transamerica Asset Allocation - Moderate Growth Portfolio, Transamerica Asset Allocation - Moderate Portfolio, Transamerica Multi-Manager Alternative Strategies Portfolio, and Transamerica Multi-Manager International Portfolio (individually a “Portfolio”, collectively the “Portfolios”) at October 31, 2009, and the results of each of their operations, the changes in each of their net assets and the financial highlights for each of the periods indicated, in conformity with accounting principles generally accepted in the United States of America. These financial statements and financial highlights (hereafter referred to as “financial statements”) are the responsibility of the Portfolios’ management; our responsibility is to express an opinion on these financial statements based on our audits. We conducted our audits of these financial statements in accordance with the standards of the Public Company Accounting Oversight Board (United States). Those standards require that we plan and perform the audit to obtain reasonable assurance about whether the financial statements are free of material misstatement. An audit includes examining, on a test basis, evidence supporting the amounts and disclosures in the financial statements, assessing the accounting principles used and significant estimates made by management, and evaluating the overall financial statement presentation. We believe that our audits, which included confirmation of securities at October 31, 2009 by correspondence with the custodian and brokers, provide a reasonable basis for our opinion.

Tampa, Florida
December 21, 2009
50
TRANSAMERICA ASSET ALLOCATION - CONSERVATIVE PORTFOLIO (unaudited)
INVESTMENT ADVISORY AND ASSET ALLOCATION MANAGEMENT AGREEMENTS - CONTRACT RENEWAL
At a meeting of the Board of Trustees of Transamerica Funds (the “Board”) held on June 4, 2009, the Board reviewed and considered the renewal of the investment advisory agreement (the “Investment Advisory Agreement”) between Transamerica Asset Allocation - Conservative Portfolio (the “Portfolio”) and Transamerica Asset Management, Inc. (“TAM”), as well as the renewal of the Asset Allocation Management Agreement of the Portfolio between TAM and Morningstar Associates, LLC (the “Portfolio Construction Manager”), to determine whether the agreements should be renewed.
Following their review and consideration, the Trustees determined that the renewal of the Investment Advisory Agreement and the Asset Allocation Management Agreement would enable shareholders of the Portfolio to obtain high quality services at a cost that is appropriate, fair, and in the best interests of Portfolio shareholders. The Board, including the independent members of the Board, unanimously approved the renewal of the Investment Advisory Agreement and Asset Allocation Management Agreement through June 30, 2010. In reaching their decision, the Trustees requested and obtained from TAM and the Portfolio Construction Manager such information as they deemed reasonably necessary to evaluate the agreements, including information about fees and performance of comparable portfolios managed by the Portfolio Construction Manager. The Trustees also carefully considered information they had previously received from TAM and the Portfolio Construction Manager as part of their regular oversight of the Portfolio, as well as comparative fee, expense, and performance information prepared by Lipper Inc. (“Lipper”), an independent provider of mutual fund performance, and fee and expense information and profitability data prepared by management. In considering the proposed continuation of the Investment Advisory and Asset Allocation Management Agreements, the Trustees evaluated a number of considerations that they believed, in light of the legal advice furnished to them by independent legal counsel and their own business judgment, to be relevant. They based their decisions on the following considerations, among others, although they did not identify any consideration or particular information that was controlling of their decisions:
The nature, extent and quality of the advisory services to be provided. The Board considered the nature and quality of the services provided by TAM and the Portfolio Construction Manager to the Portfolio in the past, as well as the services anticipated to be provided in the future. The Trustees also reviewed the Portfolio Construction Manager’s investment approach for the Portfolio. The Board concluded that TAM and the Portfolio Construction Manager are capable of providing high quality services to the Portfolio, as indicated by the nature and quality of services provided in the past by TAM and the Portfolio Construction Manager for this Portfolio and the experience, capability and integrity of TAM’s senior management, the financial resources of TAM and the Portfolio Construction Manager, TAM’s management oversight process and the professional qualifications of the portfolio management team of the Portfolio Construction Manager. The Trustees determined that TAM and the Portfolio Construction Manager can provide investment and related services that are appropriate in scope and extent in light of the Portfolio’s operations, the competitive landscape of the investment company business and investor needs.
The investment performance of the Portfolio. The Board examined the short and longer-term performance of the Portfolio, including relative performance against a peer universe of comparable mutual funds as prepared by Lipper for various trailing periods ended December 31, 2008. The Board noted that the Portfolio’s performance was below the median for its peer universe for the past 1- and 3-year periods and above the median for the past 5-year period. The Trustees agreed that they would continue to monitor the performance of the Portfolio. On the basis of the Board’s assessment of the nature, extent and quality of advisory services to be provided or procured by TAM and the Portfolio Construction Manager, the Board concluded that TAM and the Portfolio Construction Manager are capable of generating a level of investment performance that is appropriate in light of the Portfolio’s investment objectives, policies and strategies and competitive with other investment companies.
The cost of advisory services provided and the level of profitability. The Board reviewed profitability information of TAM’s cost of procuring fund management services, as well as the costs of provision of administration, fund accounting and other services, to the Portfolio and to Transamerica Funds as a whole by TAM and its affiliates. The Board reviewed the management and portfolio construction management fees for the Portfolio. The Trustees noted that the Portfolio’s contractual management fee was below the medians for its peer group and peer universe and that the total expenses of the Portfolio were above the medians for its peer group and peer universe. Based on their review, the Trustees determined that the management and portfolio construction management fees of the Portfolio generally are appropriate in light of the services expected to be provided or procured, and the anticipated profitability of the relationship between the Portfolio, TAM and its affiliates, and the Portfolio Construction Manager. In making these observations and determinations, the Board reviewed comparative information provided by Lipper.
Whether fee levels reflect economies of scale and the extent to which economies of scale would be realized as the Portfolio grows. The Trustees considered the economies of scale with respect to the management of the Portfolio, whether the Portfolio had appropriately benefited from any economies of scale, and whether there was potential for realization of any further economies of scale. The Trustees considered the absence of breakpoints in the management fee schedule, and concluded the absence of breakpoints was acceptable under the circumstances. The Trustees also concluded that they will have the opportunity to periodically reexamine whether the Portfolio has achieved economies of scale, and the appropriateness of management fees payable to TAM and fees paid to the Portfolio Construction Manager, in the future.
Benefits to TAM, its affiliates, or the Portfolio Construction Manager from their relationship with the Portfolio. The Board concluded that other benefits anticipated to be derived by TAM, its affiliates, and the Portfolio Construction Manager from their relationships with the Portfolio are expected to be consistent with industry practice and the best interests of the Portfolio and its shareholders. The Trustees noted that TAM would not realize soft dollar benefits from its relationship with the Fund.
Other considerations. The Board determined that TAM has made a substantial commitment to the recruitment and retention of high quality personnel, and maintains the financial, compliance and operational resources reasonably necessary to manage the Portfolio in a professional manner that is consistent with the best interests of the Portfolio and its shareholders. In this regard, the Trustees favorably considered the procedures and policies in place by TAM to enforce compliance with applicable laws and regulations and oversee the portfolio management activities of the Portfolio Construction Manager. The Trustees also determined that TAM has made a significant entrepreneurial commitment to the management and success of the Portfolio, reflected by TAM’s expense limitation and fee waiver arrangements with the Portfolio, which may result in TAM waiving fees for the benefit of shareholders.
Conclusion. After consideration of the factors described above as well as other factors, the Trustees, including all of the independent members of the Board, concluded that the Investment Advisory Agreement and the Asset Allocation Management Agreement, including the fees payable thereunder, were fair and reasonable and voted to approve the renewal of the Investment Advisory Agreement and the Asset Allocation Management Agreement for the Portfolio.
51
TRANSAMERICA ASSET ALLOCATION - GROWTH PORTFOLIO (unaudited)
INVESTMENT ADVISORY AND ASSET ALLOCATION MANAGEMENT AGREEMENTS - CONTRACT RENEWAL
At a meeting of the Board of Trustees of Transamerica Funds (the “Board”) held on June 4, 2009, the Board reviewed and considered the renewal of the investment advisory agreement (the “Investment Advisory Agreement”) between Transamerica Asset Allocation - Growth Portfolio (the “Portfolio”) and Transamerica Asset Management, Inc. (“TAM”), as well as the renewal of the Asset Allocation Management Agreement of the Portfolio between TAM and Morningstar Associates, LLC (the “Portfolio Construction Manager”), to determine whether the agreements should be renewed.
Following their review and consideration, the Trustees determined that the renewal of the Investment Advisory Agreement and the Asset Allocation Management Agreement would enable shareholders of the Portfolio to obtain high quality services at a cost that is appropriate, fair, and in the best interests of Portfolio shareholders. The Board, including the independent members of the Board, unanimously approved the renewal of the Investment Advisory Agreement and Asset Allocation Management Agreement through June 30, 2010. In reaching their decision, the Trustees requested and obtained from TAM and the Portfolio Construction Manager such information as they deemed reasonably necessary to evaluate the agreements, including information about fees and performance of comparable portfolios managed by the Portfolio Construction Manager. The Trustees also carefully considered information they had previously received from TAM and the Portfolio Construction Manager as part of their regular oversight of the Portfolio, as well as comparative fee, expense, and performance information prepared by Lipper Inc. (“Lipper”), an independent provider of mutual fund performance, and fee and expense information and profitability data prepared by management. In considering the proposed continuation of the Investment Advisory and Asset Allocation Management Agreements, the Trustees evaluated a number of considerations that they believed, in light of the legal advice furnished to them by independent legal counsel and their own business judgment, to be relevant. They based their decisions on the following considerations, among others, although they did not identify any consideration or particular information that was controlling of their decisions:
The nature, extent and quality of the advisory services to be provided. The Board considered the nature and quality of the services provided by TAM and the Portfolio Construction Manager to the Portfolio in the past, as well as the services anticipated to be provided in the future. The Trustees also reviewed the Portfolio Construction Manager’s investment approach for the Portfolio. The Board concluded that TAM and the Portfolio Construction Manager are capable of providing high quality services to the Portfolio, as indicated by the nature and quality of services provided in the past by TAM and the Portfolio Construction Manager for this Portfolio and the experience, capability and integrity of TAM’s senior management, the financial resources of TAM and the Portfolio Construction Manager, TAM’s management oversight process and the professional qualifications of the portfolio management team of the Portfolio Construction Manager. The Trustees determined that TAM and the Portfolio Construction Manager can provide investment and related services that are appropriate in scope and extent in light of the Portfolio’s operations, the competitive landscape of the investment company business and investor needs.
The investment performance of the Portfolio. The Board examined the short and longer-term performance of the Portfolio, including relative performance against a peer universe of comparable mutual funds as prepared by Lipper for various trailing periods ended December 31, 2008. The Board noted that the Portfolio’s performance was below the median for its peer universe for the past 1-year period and above the median for the past 3- and 5-year periods. On the basis of the Board’s assessment of the nature, extent and quality of advisory services to be provided or procured by TAM and the Portfolio Construction Manager, the Board concluded that TAM and the Portfolio Construction Manager are capable of generating a level of investment performance that is appropriate in light of the Portfolio’s investment objectives, policies and strategies and competitive with other investment companies.
The cost of advisory services provided and the level of profitability. The Board reviewed profitability information of TAM’s cost of procuring fund management services, as well as the costs of provision of administration, fund accounting and other services, to the Portfolio and to Transamerica Funds as a whole by TAM and its affiliates. The Board reviewed the management and portfolio construction management fees for the Portfolio. The Trustees noted that the Portfolio’s contractual management fee was below the medians for its peer group and peer universe and that the total expenses of the Portfolio were above the medians for its peer group and peer universe. Based on their review, the Trustees determined that the management and portfolio construction management fees of the Portfolio generally are appropriate in light of the services expected to be provided or procured, and the anticipated profitability of the relationship between the Portfolio, TAM and its affiliates, and the Portfolio Construction Manager. In making these observations and determinations, the Board reviewed comparative information provided by Lipper.
Whether fee levels reflect economies of scale and the extent to which economies of scale would be realized as the Portfolio grows. The Trustees considered the economies of scale with respect to the management of the Portfolio, whether the Portfolio had appropriately benefited from any economies of scale, and whether there was potential for realization of any further economies of scale. The Trustees considered the absence of breakpoints in the management fee schedule, and concluded the absence of breakpoints was acceptable under the circumstances. The Trustees also concluded that they will have the opportunity to periodically reexamine whether the Portfolio has achieved economies of scale, and the appropriateness of management fees payable to TAM and fees paid to the Portfolio Construction Manager, in the future.
Benefits to TAM, its affiliates, or the Portfolio Construction Manager from their relationship with the Portfolio. The Board concluded that other benefits anticipated to be derived by TAM, its affiliates, and the Portfolio Construction Manager from their relationships with the Portfolio are expected to be consistent with industry practice and the best interests of the Portfolio and its shareholders. The Trustees noted that TAM would not realize soft dollar benefits from its relationship with the Fund.
Other considerations. The Board determined that TAM has made a substantial commitment to the recruitment and retention of high quality personnel, and maintains the financial, compliance and operational resources reasonably necessary to manage the Portfolio in a professional manner that is consistent with the best interests of the Portfolio and its shareholders. In this regard, the Trustees favorably considered the procedures and policies in place by TAM to enforce compliance with applicable laws and regulations and oversee the portfolio management activities of the Portfolio Construction Manager. The Trustees also determined that TAM has made a significant entrepreneurial commitment to the management and success of the Portfolio, reflected by TAM’s expense limitation and fee waiver arrangements with the Portfolio, which may result in TAM waiving fees for the benefit of shareholders.
Conclusion. After consideration of the factors described above as well as other factors, the Trustees, including all of the independent members of the Board, concluded that the Investment Advisory Agreement and the Asset Allocation Management Agreement, including the fees payable thereunder, were fair and reasonable and voted to approve the renewal of the Investment Advisory Agreement and the Asset Allocation Management Agreement for the Portfolio.
52
TRANSAMERICA ASSET ALLOCATION - MODERATE PORTFOLIO (unaudited)
INVESTMENT ADVISORY AND ASSET ALLOCATION MANAGEMENT AGREEMENTS - CONTRACT RENEWAL
At a meeting of the Board of Trustees of Transamerica Funds (the “Board”) held on June 4, 2009, the Board reviewed and considered the renewal of the investment advisory agreement (the “Investment Advisory Agreement”) between Transamerica Asset Allocation - Moderate Portfolio (the “Portfolio”) and Transamerica Asset Management, Inc. (“TAM”), as well as the renewal of the Asset Allocation Management Agreement of the Portfolio between TAM and Morningstar Associates, LLC (the “Portfolio Construction Manager”), to determine whether the agreements should be renewed.
Following their review and consideration, the Trustees determined that the renewal of the Investment Advisory Agreement and the Asset Allocation Management Agreement would enable shareholders of the Portfolio to obtain high quality services at a cost that is appropriate, fair, and in the best interests of Portfolio shareholders. The Board, including the independent members of the Board, unanimously approved the renewal of the Investment Advisory Agreement and Asset Allocation Management Agreement through June 30, 2010. In reaching their decision, the Trustees requested and obtained from TAM and the Portfolio Construction Manager such information as they deemed reasonably necessary to evaluate the agreements, including information about fees and performance of comparable portfolios managed by the Portfolio Construction Manager. The Trustees also carefully considered information they had previously received from TAM and the Portfolio Construction Manager as part of their regular oversight of the Portfolio, as well as comparative fee, expense, and performance information prepared by Lipper Inc. (“Lipper”), an independent provider of mutual fund performance, and fee and expense information and profitability data prepared by management. In considering the proposed continuation of the Investment Advisory and Asset Allocation Management Agreements, the Trustees evaluated a number of considerations that they believed, in light of the legal advice furnished to them by independent legal counsel and their own business judgment, to be relevant. They based their decisions on the following considerations, among others, although they did not identify any consideration or particular information that was controlling of their decisions:
The nature, extent and quality of the advisory services to be provided. The Board considered the nature and quality of the services provided by TAM and the Portfolio Construction Manager to the Portfolio in the past, as well as the services anticipated to be provided in the future. The Trustees also reviewed the Portfolio Construction Manager’s investment approach for the Portfolio. The Board concluded that TAM and the Portfolio Construction Manager are capable of providing high quality services to the Portfolio, as indicated by the nature and quality of services provided in the past by TAM and the Portfolio Construction Manager for this Portfolio and the experience, capability and integrity of TAM’s senior management, the financial resources of TAM and the Portfolio Construction Manager, TAM’s management oversight process and the professional qualifications of the portfolio management team of the Portfolio Construction Manager. The Trustees determined that TAM and the Portfolio Construction Manager can provide investment and related services that are appropriate in scope and extent in light of the Portfolio’s operations, the competitive landscape of the investment company business and investor needs.
The investment performance of the Portfolio. The Board examined the short and longer-term performance of the Portfolio, including relative performance against a peer universe of comparable mutual funds as prepared by Lipper for various trailing periods ended December 31, 2008. The Board noted that the Portfolio’s performance was in line the median for its peer universe for the past 1- and 3- year periods and above the median for the past 5-year period. On the basis of the Board’s assessment of the nature, extent and quality of advisory services to be provided or procured by TAM and the Portfolio Construction Manager, the Board concluded that TAM and the Portfolio Construction Manager are capable of generating a level of investment performance that is appropriate in light of the Portfolio’s investment objectives, policies and strategies and competitive with other investment companies.
The cost of advisory services provided and the level of profitability. The Board reviewed profitability information of TAM’s cost of procuring fund management services, as well as the costs of provision of administration, fund accounting and other services, to the Portfolio and to Transamerica Funds as a whole by TAM and its affiliates. The Board reviewed the management and portfolio construction management fees for the Portfolio. The Trustees noted that the Portfolio’s contractual management fee was below the medians for its peer group and peer universe and that the total expenses of the Portfolio were above the medians for its peer group and peer universe. Based on their review, the Trustees determined that the management and portfolio construction management fees of the Portfolio generally are appropriate in light of the services expected to be provided or procured, and the anticipated profitability of the relationship between the Portfolio, TAM and its affiliates, and the Portfolio Construction Manager. In making these observations and determinations, the Board reviewed comparative information provided by Lipper.
Whether fee levels reflect economies of scale and the extent to which economies of scale would be realized as the Portfolio grows. The Trustees considered the economies of scale with respect to the management of the Portfolio, whether the Portfolio had appropriately benefited from any economies of scale, and whether there was potential for realization of any further economies of scale. The Trustees considered the absence of breakpoints in the management fee schedule, and concluded the absence of breakpoints was acceptable under the circumstances. The Trustees also concluded that they will have the opportunity to periodically reexamine whether the Portfolio has achieved economies of scale, and the appropriateness of management fees payable to TAM and fees paid to the Portfolio Construction Manager, in the future.
Benefits to TAM, its affiliates, or the Portfolio Construction Manager from their relationship with the Portfolio. The Board concluded that other benefits anticipated to be derived by TAM, its affiliates, and the Portfolio Construction Manager from their relationships with the Portfolio are expected to be consistent with industry practice and the best interests of the Portfolio and its shareholders. The Trustees noted that TAM would not realize soft dollar benefits from its relationship with the Fund.
Other considerations. The Board determined that TAM has made a substantial commitment to the recruitment and retention of high quality personnel, and maintains the financial, compliance and operational resources reasonably necessary to manage the Portfolio in a professional manner that is consistent with the best interests of the Portfolio and its shareholders. In this regard, the Trustees favorably considered the procedures and policies in place by TAM to enforce compliance with applicable laws and regulations and oversee the portfolio management activities of the Portfolio Construction Manager. The Trustees also determined that TAM has made a significant entrepreneurial commitment to the management and success of the Portfolio, reflected by TAM’s expense limitation and fee waiver arrangements with the Portfolio, which may result in TAM waiving fees for the benefit of shareholders.
Conclusion. After consideration of the factors described above as well as other factors, the Trustees, including all of the independent members of the Board, concluded that the Investment Advisory Agreement and the Asset Allocation Management Agreement, including the fees payable thereunder, were fair and reasonable and voted to approve the renewal of the Investment Advisory Agreement and the Asset Allocation Management Agreement for the Portfolio.
53
TRANSAMERICA ASSET ALLOCATION - MODERATE GROWTH PORTFOLIO (unaudited)
INVESTMENT ADVISORY AND ASSET ALLOCATION MANAGEMENT AGREEMENTS - CONTRACT RENEWAL
At a meeting of the Board of Trustees of Transamerica Funds (the “Board”) held on June 4, 2009, the Board reviewed and considered the renewal of the investment advisory agreement (the “Investment Advisory Agreement”) between Transamerica Asset Allocation - Moderate Growth Portfolio (the “Portfolio”) and Transamerica Asset Management, Inc. (“TAM”), as well as the renewal of the Asset Allocation Management Agreement of the Portfolio between TAM and Morningstar Associates, LLC (the “Portfolio Construction Manager”), to determine whether the agreements should be renewed.
Following their review and consideration, the Trustees determined that the renewal of the Investment Advisory Agreement and the Asset Allocation Management Agreement would enable shareholders of the Portfolio to obtain high quality services at a cost that is appropriate, fair, and in the best interests of Portfolio shareholders. The Board, including the independent members of the Board, unanimously approved the renewal of the Investment Advisory Agreement and Asset Allocation Management Agreement through June 30, 2010. In reaching their decision, the Trustees requested and obtained from TAM and the Portfolio Construction Manager such information as they deemed reasonably necessary to evaluate the agreements, including information about fees and performance of comparable portfolios managed by the Portfolio Construction Manager. The Trustees also carefully considered information they had previously received from TAM and the Portfolio Construction Manager as part of their regular oversight of the Portfolio, as well as comparative fee, expense, and performance information prepared by Lipper Inc. (“Lipper”), an independent provider of mutual fund performance, and fee and expense information and profitability data prepared by management. In considering the proposed continuation of the Investment Advisory and Asset Allocation Management Agreements, the Trustees evaluated a number of considerations that they believed, in light of the legal advice furnished to them by independent legal counsel and their own business judgment, to be relevant. They based their decisions on the following considerations, among others, although they did not identify any consideration or particular information that was controlling of their decisions:
The nature, extent and quality of the advisory services to be provided. The Board considered the nature and quality of the services provided by TAM and the Portfolio Construction Manager to the Portfolio in the past, as well as the services anticipated to be provided in the future. The Trustees also reviewed the Portfolio Construction Manager’s investment approach for the Portfolio. The Board concluded that TAM and the Portfolio Construction Manager are capable of providing high quality services to the Portfolio, as indicated by the nature and quality of services provided in the past by TAM and the Portfolio Construction Manager for this Portfolio and the experience, capability and integrity of TAM’s senior management, the financial resources of TAM and the Portfolio Construction Manager, TAM’s management oversight process and the professional qualifications of the portfolio management team of the Portfolio Construction Manager. The Trustees determined that TAM and the Portfolio Construction Manager can provide investment and related services that are appropriate in scope and extent in light of the Portfolio’s operations, the competitive landscape of the investment company business and investor needs.
The investment performance of the Portfolio. The Board examined the short and longer-term performance of the Portfolio, including relative performance against a peer universe of comparable mutual funds as prepared by Lipper for various trailing periods ended December 31, 2008. The Board noted that the Portfolio’s performance was below the median for its peer universe for past 1-year period, in line with the median for the past 3-year period and above the median for the past 5-year period. On the basis of the Board’s assessment of the nature, extent and quality of advisory services to be provided or procured by TAM and the Portfolio Construction Manager, the Board concluded that TAM and the Sub-Adviser are capable of generating a level of investment performance that is appropriate in light of the Portfolio’s investment objectives, policies and strategies and competitive with other investment companies.
The cost of advisory services provided and the level of profitability. The Board reviewed profitability information of TAM’s cost of procuring fund management services, as well as the costs of provision of administration, fund accounting and other services, to the Portfolio and to Transamerica Funds as a whole by TAM and its affiliates. The Board reviewed the management and portfolio construction management fees for the Portfolio. The Trustees noted that the Portfolio’s contractual management fee was below the medians for its peer group and peer universe and that the total expenses of the Portfolio were above the medians for its peer group and peer universe. Based on their review, the Trustees determined that the management and portfolio construction management fees of the Portfolio generally are appropriate in light of the services expected to be provided or procured, and the anticipated profitability of the relationship between the Portfolio, TAM and its affiliates, and the Portfolio Construction Manager. In making these observations and determinations, the Board reviewed comparative information provided by Lipper.
Whether fee levels reflect economies of scale and the extent to which economies of scale would be realized as the Portfolio grows. The Trustees considered the economies of scale with respect to the management of the Portfolio, whether the Portfolio had appropriately benefited from any economies of scale, and whether there was potential for realization of any further economies of scale. The Trustees considered the absence of breakpoints in the management fee schedule, and concluded the absence of breakpoints was acceptable under the circumstances. The Trustees also concluded that they will have the opportunity to periodically reexamine whether the Portfolio has achieved economies of scale, and the appropriateness of management fees payable to TAM and fees paid to the Portfolio Construction Manager, in the future.
Benefits to TAM, its affiliates, or the Portfolio Construction Manager from their relationship with the Portfolio. The Board concluded that other benefits anticipated to be derived by TAM, its affiliates, and the Portfolio Construction Manager from their relationships with the Portfolio are expected to be consistent with industry practice and the best interests of the Portfolio and its shareholders. The Trustees noted that TAM would not realize soft dollar benefits from its relationship with the Fund.
Other considerations. The Board determined that TAM has made a substantial commitment to the recruitment and retention of high quality personnel, and maintains the financial, compliance and operational resources reasonably necessary to manage the Portfolio in a professional manner that is consistent with the best interests of the Portfolio and its shareholders. In this regard, the Trustees favorably considered the procedures and policies in place by TAM to enforce compliance with applicable laws and regulations and oversee the portfolio management activities of the Portfolio Construction Manager. The Trustees also determined that TAM has made a significant entrepreneurial commitment to the management and success of the Portfolio, reflected by TAM’s expense limitation and fee waiver arrangements with the Portfolio, which may result in TAM waiving fees for the benefit of shareholders.
Conclusion. After consideration of the factors described above as well as other factors, the Trustees, including all of the independent members of the Board, concluded that the Investment Advisory Agreement and the Asset Allocation Management Agreement, including the fees payable thereunder, were fair and reasonable and voted to approve the renewal of the Investment Advisory Agreement and the Asset Allocation Management Agreement for the Portfolio.
54
TRANSAMERICA MULTI-MANAGER ALTERNATIVE STRATEGIES PORTFOLIO (unaudited)
INVESTMENT ADVISORY AND ASSET ALLOCATION MANAGEMENT AGREEMENTS - CONTRACT RENEWAL
At a meeting of the Board of Trustees of Transamerica Funds (the “Board”) held on June 4, 2009, the Board reviewed and considered the renewal of the investment advisory agreement (the “Investment Advisory Agreement”) between Transamerica Multi-Manager Alternative Strategies Portfolio (the “Portfolio”) and Transamerica Asset Management, Inc. (“TAM”), as well as the renewal of the Asset Allocation Management Agreement of the Portfolio between TAM and Morningstar Associates, LLC (the “Portfolio Construction Manager”), to determine whether the agreements should be renewed.
Following their review and consideration, the Trustees determined that the renewal of the Investment Advisory Agreement and the Asset Allocation Management Agreement would enable shareholders of the Portfolio to obtain high quality services at a cost that is appropriate, fair, and in the best interests of Portfolio shareholders. The Board, including the independent members of the Board, unanimously approved the renewal of the Investment Advisory Agreement and Asset Allocation Management Agreement through June 30, 2010. In reaching their decision, the Trustees requested and obtained from TAM and the Portfolio Construction Manager such information as they deemed reasonably necessary to evaluate the agreements, including information about fees and performance of comparable portfolios managed by the Portfolio Construction Manager. The Trustees also carefully considered information they had previously received from TAM and the Portfolio Construction Manager as part of their regular oversight of the Portfolio, as well as comparative fee, expense, and performance information prepared by Lipper Inc. (“Lipper”), an independent provider of mutual fund performance, and fee and expense information and profitability data prepared by management. In considering the proposed continuation of the Investment Advisory and Asset Allocation Management Agreements, the Trustees evaluated a number of considerations that they believed, in light of the legal advice furnished to them by independent legal counsel and their own business judgment, to be relevant. They based their decisions on the following considerations, among others, although they did not identify any consideration or particular information that was controlling of their decisions:
The nature, extent and quality of the advisory services to be provided. The Board considered the nature and quality of the services provided by TAM and the Portfolio Construction Manager to the Portfolio in the past, as well as the services anticipated to be provided in the future. The Trustees also reviewed the Portfolio Construction Manager’s investment approach for the Portfolio. The Trustees noted that they receive, on a quarterly basis, an execution analysis from Capital Institutional Services, Inc. (CAPIS), an independent provider of trade analyses, for the Portfolio Construction Manager and a comparison of trading results against a peer universe of managers. The Board concluded that TAM and the Portfolio Construction Manager are capable of providing high quality services to the Portfolio, as indicated by the nature and quality of services provided in the past by TAM and the Portfolio Construction Manager for this Portfolio and the experience, capability and integrity of TAM’s senior management, the financial resources of TAM and the Portfolio Construction Manager, TAM’s management oversight process and the professional qualifications of the portfolio management team of the Portfolio Construction Manager. The Trustees determined that TAM and the Portfolio Construction Manager can provide investment and related services that are appropriate in scope and extent in light of the Portfolio’s operations, the competitive landscape of the investment company business and investor needs.
The investment performance of the Portfolio. The Board examined the short and longer-term performance of the Portfolio, including relative performance against a peer universe of comparable mutual funds as prepared by Lipper for various trailing periods ended December 31, 2008, noting that the Portfolio’s inception date was December 28, 2006. The Board noted that the Portfolio’s performance was above the median for its peer universe for the past 1-year period. On the basis of the Board’s assessment of the nature, extent and quality of advisory services to be provided or procured by TAM and the Portfolio Construction Manager, the Board concluded that TAM and the Portfolio Construction Manager are capable of generating a level of investment performance that is appropriate in light of the Portfolio’s investment objectives, policies and strategies and competitive with other investment companies.
The cost of advisory services provided and the level of profitability. The Board reviewed profitability information of TAM’s cost of procuring fund management services, as well as the costs of provision of administration, fund accounting and other services, to the Portfolio and to Transamerica Funds as a whole by TAM and its affiliates. The Board reviewed the management and portfolio construction management fees for the Portfolio. The Trustees noted that the Portfolio’s contractual management fee was 1 basis point above the Lipper median for its peer group and that the total expenses of the Portfolio were above the median for its peer group. The challenges of finding a truly comparable peer group were noted. Based on their review, the Trustees determined that the management and portfolio construction management fees of the Portfolio generally are appropriate in light of the services expected to be provided or procured, and the anticipated profitability of the relationship between the Portfolio, TAM and its affiliates, and the Portfolio Construction Manager. In making these observations and determinations, the Board reviewed comparative information provided by Lipper.
Whether fee levels reflect economies of scale and the extent to which economies of scale would be realized as the Portfolio grows. The Trustees considered the economies of scale with respect to the management of the Portfolio, whether the Portfolio had appropriately benefited from any economies of scale, and whether there was potential for realization of any further economies of scale. In evaluating the extent to which the management fees payable under the Investment Advisory and Asset Allocation Management Agreements reflect economies of scale or will permit economies of scale to be realized in the future, the Board noted that TAM and the Portfolio Construction Manager offer breakpoints which appropriately benefit investors by passing on economies of scale in the form of lower management fees as the level of assets grows. The Trustees also concluded that they will have the opportunity to periodically reexamine whether the Portfolio has achieved economies of scale, and the appropriateness of management fees payable to TAM and fees paid to the Portfolio Construction Manager, in the future.
Benefits to TAM, its affiliates, or the Portfolio Construction Manager from their relationship with the Portfolio. The Board concluded that other benefits anticipated to be derived by TAM, its affiliates, and the Portfolio Construction Manager from their relationships with the Portfolio are expected to be consistent with industry practice and the best interests of the Portfolio and its shareholders. The Trustees noted that TAM would not realize soft dollar benefits from its relationship with the Fund.
Other considerations. The Board determined that TAM has made a substantial commitment to the recruitment and retention of high quality personnel, and maintains the financial, compliance and operational resources reasonably necessary to manage the Portfolio in a professional manner that is consistent with the best interests of the Portfolio and its shareholders. In this regard, the Trustees favorably considered the procedures and policies in place by TAM to enforce compliance with applicable laws and regulations and oversee the portfolio management activities of the Portfolio Construction Manager. The Trustees also determined that TAM has made a significant entrepreneurial commitment to the management and success of the Portfolio, reflected by TAM’s expense limitation and fee waiver arrangements with the Portfolio, which may result in TAM waiving fees for the benefit of shareholders.
Conclusion. After consideration of the factors described above as well as other factors, the Trustees, including all of the independent members of the Board, concluded that the Investment Advisory Agreement and the Asset Allocation Management Agreement, including the fees payable thereunder, were fair and reasonable and voted to approve the renewal of the Investment Advisory Agreement and the Asset Allocation Management Agreement for the Portfolio.
55
TRANSAMERICA MULTI-MANAGER INTERNATIONAL PORTFOLIO (unaudited)
INVESTMENT ADVISORY AND ASSET ALLOCATION MANAGEMENT AGREEMENTS - CONTRACT RENEWAL
At a meeting of the Board of Trustees of Transamerica Funds (the “Board”) held on June 4, 2009, the Board reviewed and considered the renewal of the investment advisory agreement (the “Investment Advisory Agreement”) between Transamerica Multi-Manager International Portfolio (the “Portfolio”) and Transamerica Asset Management, Inc. (“TAM”), as well as the renewal of the Asset Allocation Management Agreement of the Portfolio between TAM and Morningstar Associates, LLC (the “Portfolio Construction Manager”), to determine whether the agreements should be renewed.
Following their review and consideration, the Trustees determined that the renewal of the Investment Advisory Agreement and the Asset Allocation Management Agreement would enable shareholders of the Portfolio to obtain high quality services at a cost that is appropriate, fair, and in the best interests of Portfolio shareholders. The Board, including the independent members of the Board, unanimously approved the renewal of the Investment Advisory Agreement and Asset Allocation Management Agreement through June 30, 2010. In reaching their decision, the Trustees requested and obtained from TAM and the Portfolio Construction Manager such information as they deemed reasonably necessary to evaluate the agreements, including information about fees and performance of comparable portfolios managed by the Portfolio Construction Manager. The Trustees also carefully considered information they had previously received from TAM and the Portfolio Construction Manager as part of their regular oversight of the Portfolio, as well as comparative fee, expense, and performance information prepared by Lipper Inc. (“Lipper”), an independent provider of mutual fund performance, and fee and expense information and profitability data prepared by management. In considering the proposed continuation of the Investment Advisory and Asset Allocation Management Agreements, the Trustees evaluated a number of considerations that they believed, in light of the legal advice furnished to them by independent legal counsel and their own business judgment, to be relevant. They based their decisions on the following considerations, among others, although they did not identify any consideration or particular information that was controlling of their decisions:
The nature, extent and quality of the advisory services to be provided. The Board considered the nature and quality of the services provided by TAM and the Portfolio Construction Manager to the Portfolio in the past, as well as the services anticipated to be provided in the future. The Trustees also reviewed the Portfolio Construction Manager’s investment approach for the Portfolio. The Trustees noted that they receive, on a quarterly basis, an execution analysis from Capital Institutional Services, Inc. (CAPIS), an independent provider of trade analyses, for the Portfolio Construction Manager and a comparison of trading results against a peer universe of managers. The Board concluded that TAM and the Portfolio Construction Manager are capable of providing high quality services to the Portfolio, as indicated by the nature and quality of services provided in the past by TAM and the Portfolio Construction Manager for this Portfolio and the experience, capability and integrity of TAM’s senior management, the financial resources of TAM and the Portfolio Construction Management, TAM’s management oversight process and the professional qualifications of the portfolio management team of the Portfolio Construction Management. The Trustees determined that TAM and the Portfolio Construction Manager can provide investment and related services that are appropriate in scope and extent in light of the Portfolio’s operations, the competitive landscape of the investment company business and investor needs.
The investment performance of the Portfolio. The Board examined the short and longer-term performance of the Portfolio, including relative performance against a peer universe of comparable mutual funds as prepared by Lipper for various trailing periods ended December 31, 2008, noting that the Portfolio’s inception date was March 1, 2006. The Board noted that the Portfolio’s performance was below the median for its peer universe for the past 1-year period. On the basis of the Board’s assessment of the nature, extent and quality of advisory services to be provided or procured by TAM and the Portfolio Construction Manager, the Board concluded that TAM and the Portfolio Construction Manager are capable of generating a level of investment performance that is appropriate in light of the Portfolio’s investment objectives, policies and strategies and competitive with other investment companies.
The cost of advisory services provided and the level of profitability. The Board reviewed profitability information of TAM’s cost of procuring fund management services, as well as the costs of provision of administration, fund accounting and other services, to the Portfolio and to Transamerica Funds as a whole by TAM and its affiliates. The Board reviewed the management and portfolio construction management fees for the Portfolio. The Trustees noted that the Portfolio’s contractual management fee was in line with the Lipper median and that the total expenses of the Portfolio were above the medians for its peer group and peer universe. Based on their review, the Trustees determined that the management and portfolio construction management fees of the Portfolio generally are appropriate in light of the services expected to be provided or procured, and the anticipated profitability of the relationship between the Portfolio, TAM and its affiliates, and the Portfolio Construction Manager. In making these observations and determinations, the Board reviewed comparative information provided by Lipper.
Whether fee levels reflect economies of scale and the extent to which economies of scale would be realized as the Portfolio grows. The Trustees considered the economies of scale with respect to the management of the Portfolio, whether the Portfolio had appropriately benefited from any economies of scale, and whether there was potential for realization of any further economies of scale. The Board considered the specific reasons for the absence of breakpoints in the management fee schedule, and concluded that the absence of breakpoints was acceptable under the circumstances. The Trustees also concluded that they will have the opportunity to periodically reexamine whether the Portfolio has achieved economies of scale, and the appropriateness of management fees payable to TAM and fees paid to the Portfolio Construction Manager, in the future.
Benefits to TAM, its affiliates, or the Portfolio Construction Manager from their relationship with the Portfolio. The Board concluded that other benefits anticipated to be derived by TAM, its affiliates, and the Portfolio Construction Manager from their relationships with the Portfolio are expected to be consistent with industry practice and the best interests of the Portfolio and its shareholders. The Trustees noted that TAM would not realize soft dollar benefits from its relationship with the Fund.
Other considerations. The Board determined that TAM has made a substantial commitment to the recruitment and retention of high quality personnel, and maintains the financial, compliance and operational resources reasonably necessary to manage the Portfolio in a professional manner that is consistent with the best interests of the Portfolio and its shareholders. In this regard, the Trustees favorably considered the procedures and policies in place by TAM to enforce compliance with applicable laws and regulations and oversee the portfolio management activities of the Portfolio Construction Manager. The Trustees also determined that TAM has made a significant entrepreneurial commitment to the management and success of the Portfolio, reflected by TAM’s expense limitation and fee waiver arrangements with the Portfolio, which may result in TAM waiving fees for the benefit of shareholders.
Conclusion. After consideration of the factors described above as well as other factors, the Trustees, including all of the independent members of the Board, concluded that the Investment Advisory Agreement and the Asset Allocation Management Agreement, including the fees payable thereunder, were fair and reasonable and voted to approve the renewal of the Investment Advisory Agreement and the Asset Allocation Management Agreement for the Portfolio.
56
SUPPLEMENTAL INFORMATION (unaudited)
TAX INFORMATION
For dividends paid during the year ended October 31, 2009, the Portfolios designated the following as qualified dividend income:
Portfolio | | Qualified Dividend
Income | |
Transamerica Asset Allocation — Conservative Portfolio | | $ | 6,262 | |
Transamerica Asset Allocation — Growth Portfolio | | 19,250 | |
Transamerica Asset Allocation — Moderate Growth Portfolio | | 39,515 | |
Transamerica Asset Allocation — Moderate Portfolio | | 18,454 | |
Transamerica Multi-Manager Alternative Strategies Portfolio | | 3,254 | |
Transamerica Multi-Manager International Portfolio | | 634 | |
| | | | |
For corporate shareholders, investment income (dividend income plus short-term gains, if any) qualifies for the dividends received deductions as follows:
Portfolio | | Dividend Received
Deduction Percentage | |
Transamerica Asset Allocation — Conservative Portfolio | | 12.26 | % |
Transamerica Asset Allocation — Growth Portfolio | | 47.19 | % |
Transamerica Asset Allocation — Moderate Growth Portfolio | | 32.51 | % |
Transamerica Asset Allocation — Moderate Portfolio | | 21.24 | % |
Transamerica Multi-Manager Alternative Strategies Portfolio | | 2.85 | % |
Transamerica Multi-Manager International Portfolio | | 2.90 | % |
For tax purposes, there were no Long-Term Capital Gain Designations for the year ended October 31, 2009.
The information and distributions reported herein may differ from the information and distributions taxable to the shareholders for the calendar year ending December 31, 2009. Complete information will be computed and reported in conjunction with your 2009
Form 1099-DIV.
57
TRANSAMERICA FUNDS
Management of the Funds
The Board Members and executive officers of the Trust are listed below. The Board governs each fund and is responsible for protecting the interests of the shareholders. The Board Members are experienced executives who meet periodically throughout the year to oversee the business affairs of each fund and the operation of the Trust by its officers. The Board also reviews the management of each fund’s assets by the investment adviser and its respective sub-adviser. The funds are among the funds advised and sponsored by TAM (collectively, “Transamerica Asset Management Group”). Transamerica Asset Management Group (“TAMG”) consists of Transamerica Funds, Transamerica Series Trust (“TST”), Transamerica Income Shares, Inc. (“TIS”), Transamerica Partners Funds Group (“TPFG”), Transamerica Partners Funds Group II (“TPFG II”), Transamerica Partners Portfolios (“TPP”), and Transamerica Asset Allocation Variable Funds (“TAAVF”) and consists of 163 funds as of the date of this SAI.
The mailing address of each Board Member is c/o Secretary, 570 Carillon Parkway, St. Petersburg, Florida 33716. The Board Members, their ages, their positions with the Trust, and their principal occupations for the past five years (their titles may have varied during that period), the number of funds in TAMG the Board oversees, and other board memberships they hold are set forth in the table below.
Name and Age | | Position(s) Held
with Trust | | Term of
Office and
Length of
Time
Served* | | Principal Occupation(s) During
Past 5 Years | | Number of
Funds in
Complex
Overseen
by Board
Member | | Other
Directorships |
| | | | | | | | | | |
INTERESTED BOARD MEMBER** | | | | | | | | |
| | | | | | | | | | |
John K. Carter
(1961) | | Chairman, Board Member, President, and Chief Executive Officer | | Since 1999 | | Chairman and Board Member (2008 — present), President (2007 — present), Chief Executive Officer (2006 — present), Vice President, Secretary and Chief Compliance Officer (2003 — 2006), Transamerica Investors, Inc. (“TII”); Chairman, Board Member, President and Chief Executive Officer, TPP, TPFG, TPFG II and TAAVF (2007 — present); Chairman (2007 — present), Board Member (2006 — present), President and Chief Executive Officer (2006 — present), Senior Vice President (1999 — 2006), Chief Compliance Officer, General Counsel and Secretary (1999 — 2006), Transamerica Funds and TST; Chairman (2007 — present), Board Member (2006 — present), President and Chief Executive Officer (2006 — present), Senior Vice President (2002 — 2006), General Counsel, Secretary and Chief Compliance Officer (2002 — 2006), TIS; Chairman, President and Chief Executive Officer (2006 — present), Director (2002 — present), Senior Vice President (1999 — 2006), General Counsel and Secretary (2000 — 2006), Chief Compliance Officer (2004 — 2006), TAM; Chairman, President and Chief Executive Officer (2006 — present), Senior Vice President (1999 — 2006), Director (2002 — present), General Counsel and Secretary (2001 — 2006), Transamerica Fund Services, Inc. (“TFS”); Vice President, AFSG Securities Corporation (2001 —present); Senior Vice President, General Counsel and Secretary, Transamerica Index Funds, Inc. (“TIF”) (2002 — 2004); and Director, (2008 — present), Vice President, Transamerica Investment Services, Inc. (“TISI”) (2003 — 2005) and Transamerica Investment Management, LLC (“TIM”) (2001 — 2005). | | 163 | | N/A |
58
Name and Age | | Position(s) Held
with Trust | | Term of
Office and
Length of
Time
Served* | | Principal Occupation(s) During
Past 5 Years | | Number of
Funds in
Complex
Overseen
by Board
Member | | Other
Directorships |
| | | | | | | | | | |
INDEPENDENT BOARD MEMBERS*** | | | | | | | |
| | | | | | | | | | |
Sandra N. Bane
(1952) | | Board Member | | Since 2008 | | Retired, KPMG (1999 — present); Board Member, TII (2003 — present); and Board Member, Transamerica Funds, TST, TIS, TPP, TPFG, TPFG II and TAAVF (2008 — present). | | 163 | | Big 5 Sporting Goods (2002 — present); AGL Resources, Inc. (energy services holding company) (2008 — present) |
| | | | | | | | | | |
Leo J. Hill
(1956) | | Lead Independent Board Member | | Since 2002 | | Principal, Advisor Network Solutions, LLC (business consulting) (2006 — present); Board Member, TST (2001 — present); Board Member, Transamerica Funds and TIS (2002 — present); Board Member, TPP, TPFG, TPFG II and TAAVF (2007 — present); Board Member, TII (2008 — present); Owner and President, Prestige Automotive Group (2001 — 2005); President, L. J. Hill & Company (1999 — present); Market President, Nations Bank of Sun Coast Florida (1998 — 1999); President and Chief Executive Officer, Barnett Banks of Treasure Coast Florida (1994 — 1998); Executive Vice President and Senior Credit Officer, Barnett Banks of Jacksonville, Florida (1991 — 1994); and Senior Vice President and Senior Loan Administration Officer, Wachovia Bank of Georgia (1976 — 1991). | | 163 | | N/A |
| | | | | | | | | | |
David W. Jennings
(1946) | | Board Member | | Since 2009 | | Board Member, Transamerica Funds, TST, TIS, TPP, TPFG, TPFG II and TAAVF (July 2009 — present); Board Member, TII (July 2009 — present); Principal, Maxam Capital Management, LLC (2006 — 2008); and Principal, Cobble Creek Management LP (2004 — 2006). | | 163 | | N/A |
| | | | | | | | | | |
Neal M. Jewell
(1935) | | Board Member | | Since 2007 | | Retired (2004 — present); Board Member, TPP, TPFG, TPFG II and TAAVF (1993 — present); Board Member, Transamerica Funds, TST and TIS (2007 — present); Board Member, TII (2008 - present); and Independent Trustee, EAI Select Managers Equity Fund (a mutual fund) (1996 — 2004). | | 163 | | N/A |
| | | | | | | | | | |
Russell A. Kimball, Jr.
(1944) | | Board Member | | 1986 — 1990 and 2002 - Present | | General Manager, Sheraton Sand Key Resort (1975 — present); Board Member, TST (1986 — present); Board Member, Transamerica Funds, (1986 — 1990), (2002 — present); Board Member, TIS (2002 — present); Board Member, TPP, TPFG, TPFG II and TAAVF (2007 — present); and Board Member, TII (2008 — present). | | 163 | | N/A |
59
Name and Age | | Position(s) Held
with Trust | | Term of
Office and
Length of
Time
Served* | | Principal Occupation(s) During
Past 5 Years | | Number of
Funds in
Complex
Overseen
by Board
Member | | Other
Directorships |
Eugene M. Mannella
(1954) | | Board Member | | Since 2007 | | Chief Executive Officer, HedgeServ Corporation (hedge fund administration) (2008 — present); Self-employed consultant (2006 — present); President, ARAPAHO Partners LLC (limited purpose broker-dealer) (1998 — 2008); Board Member, TPP, TPFG, TPFG II and TAAVF (1994 — present); Board Member, Transamerica Funds, TST and TIS (2007 — present); Board Member, TII (2008 — present); and President, International Fund Services (alternative asset administration) (1993 — 2005). | | 163 | | N/A |
| | | | | | | | | | |
Norman R. Nielsen
(1939) | | Board Member | | Since 2006 | | Retired (2005 — present); Board Member, Transamerica Funds, TST and TIS (2006 — present); Board Member, TPP, TPFG, TPFG II and TAAVF (2007 — present); Board Member, TII (2008 — present); Director, Iowa Student Loan Service Corporation (2006 — present); Director, League for Innovation in the Community Colleges (1985 — 2005); Director, Iowa Health Systems (1994 — 2003); Director, U.S. Bank (1987 — 2006); and President, Kirkwood Community College (1985 — 2005). | | 163 | | Buena Vista University Board of Trustees (2004 - present) |
| | | | | | | | | | |
Joyce G. Norden
(1939) | | Board Member | | Since 2007 | | Retired (2004 — present); Board Member, TPFG, TPFG II and TAAVF (1993 —present); Board Member, TPP (2002 — present); Board Member, Transamerica Funds, TST and TIS (2007 — present); Board Member, TII (2008 — present); and Vice President, Institutional Advancement, Reconstructionist Rabbinical College (1996 — 2004). | | 163 | | Board of Governors, Reconstruction-ist Rabbinical College (2007 - present) |
| | | | | | | | | | |
Patricia L. Sawyer
(1950) | | Board Member | | Since 2007 | | Retired (2007 — present); President/Founder, Smith & Sawyer LLC (management consulting) (1989 — 2007); Board Member, Transamerica Funds, TST and TIS (2007 — present); Board Member, TII (2008 — present); Board Member, TPP, TPFG, TPFG II and TAAVF (1993 — present); Vice President, American Express (1987 — 1989); Vice President, The Equitable (1986 — 1987); and Strategy Consultant, Booz, Allen & Hamilton (1982 — 1986). | | 163 | | N/A |
60
Name and Age | | Position(s) Held
with Trust | | Term of
Office and
Length of
Time
Served* | | Principal Occupation(s) During
Past 5 Years | | Number of
Funds in
Complex
Overseen
by Board
Member | | Other
Directorships |
| | | | | | | | | | |
John W. Waechter
(1952) | | Board Member | | Since 2005 | | Attorney, Englander & Fischer, P.A. (2008 — present); Retired (2004 — 2008); Board Member, TST and TIS (2004 — present); Board Member, Transamerica Funds (2005 — present); Board Member, TPP, TPFG, TPFG II and TAAVF (2007 — present); Board Member, TII (2008 — present); Employee, RBC Dain Rauscher (securities dealer) (2004); Executive Vice President, Chief Financial Officer and Chief Compliance Officer, William R. Hough & Co. (securities dealer) (1979 — 2004); and Treasurer, The Hough Group of Funds (1993 — 2004). | | 163 | | Operation Par, Inc. (2008 — present); West Central Florida Council — Boy Scouts of America (2008 — present) |
* Each Board Member shall hold office until: 1) his or her successor is elected and qualified or 2) he or she resigns, retires or his or her term as a Board Member is terminated in accordance with the Trust’s Declaration of Trust.
** May be deemed an “interested person” (as that term is defined in the 1940 Act) of the Trust because of his employment with TAM or an affiliate of TAM.
*** Independent Board Member means a Board Member who is not an “interested person” (as defined under the 1940 Act) of the Trust.
OFFICERS
The mailing address of each officer is c/o Secretary, 570 Carillon Parkway, St. Petersburg, Florida 33716. The following table shows information about the officers, including their ages, their positions held with the Trust and their principal occupations during the past five years (their titles may have varied during that period). Each officer will hold office until his or her successor has been duly elected or appointed or until his or her earlier death, resignation or removal.
Name and Age | | Position | | Term of Office
and Length of
Time Served* | | Principal Occupation(s) or
Employment During Past 5 Years |
| | | | | | |
John K. Carter
(1961) | | Chairman, Board Member, President, and Chief Executive Officer | | Since 1999 | | See the table above. |
| | | | | | |
Dennis P. Gallagher
(1970) | | Vice President, General Counsel and Secretary | | Since 2006 | | Vice President, General Counsel and Secretary, Transamerica Funds, TST and TIS (2006 — present); Vice President, General Counsel and Secretary, TII, (2006 — present); Vice President, General Counsel and Secretary, TPP, TPFG, TPFG II and TAAVF (2007 — present); Director, Senior Vice President, General Counsel, Operations, and Secretary, TAM and TFS (2006 — present); Assistant Vice President, TCI (2007 — present); and Director, Deutsche Asset Management (1998 — 2006). |
| | | | | | |
Joseph P. Carusone
(1965) | | Vice President, Treasurer and Principal Financial Officer | | Since 2007 | | Vice President, Treasurer and Principal Financial Officer, Transamerica Funds, TST and TIS (2007 — present); Vice President, Treasurer and Principal Financial Officer, TII (2007 — present); Vice President (2007 — present), Treasurer and Principal Financial Officer (2001 — present), TPP, TPFG, TPFG II and TAAVF; Senior Vice President, TAM and TFS (2007 — present); Senior Vice President (2008 — present), Vice President (2001 — 2008); Diversified Investment Advisors, Inc. (“DIA”); Director and President, Diversified Investors Securities Corp. (“DISC”) (2007 — present); Director, Transamerica Financial Life Insurance Company (“TFLIC”) (2004 — present); and Treasurer, Diversified Actuarial Services, Inc. (2002 — present). |
61
Name and Age | | Position | | Term of Office
and Length of
Time Served* | | Principal Occupation(s) or
Employment During Past 5 Years |
| | | | | | |
Christopher A. Staples
(1970) | | Vice President and Chief Investment Officer | | Since 2005 | | Vice President and Chief Investment Officer (2007 — present); Vice President - Investment Administration (2005 — 2007), TII; Vice President and Chief Investment Officer (2007 — present), Senior Vice President - Investment Management (2006 — 2007), Vice President - Investment Management (2005 — 2006), Transamerica Funds, TST and TIS; Vice President and Chief Investment Officer, TPP, TPFG, TPFG II and TAAVF (2007 — present); Director (2005 — present), Senior Vice President — Investment Management (2006 — present) and Chief Investment Officer (2007 — present), TAM; Director, TFS (2005 — present); and Assistant Vice President, Raymond James & Associates (1999 — 2004). |
| | | | | | |
Rick B. Resnik
(1967) | | Vice President, Chief Compliance Officer and Conflicts of Interest Officer | | Since 2008 | | Chief Compliance Officer, TPP, TPFG, TPFG II and TAAVF (2004 — present); Chief Compliance Officer, Transamerica Funds, TST and TIS (2008 — present); Vice President and Conflicts of Interest Officer, TPP, TPFG, TPFG II, TAAVF, Transamerica Funds, TST and TIS (2008 — present); Chief Compliance Officer, Vice President and Conflicts of Interest Officer, TII (2008 — present); Senior Vice President and Chief Compliance Officer, TAM (2008 — present); Senior Vice President, TFS (2008 — present); Vice President and Chief Compliance Officer, DIA (2004 - present); with DIA since 1988; Director (1999 — present), Vice President and Chief Compliance Officer (1996 — present), DISC; Assistant Vice President, TFLIC (1999 — present); and Chief Compliance Officer, Transamerica Partners Variable Funds (2004 - present). |
| | | | | | |
Robert A. DeVault, Jr.
(1965) | | Assistant Treasurer | | Since 2009 | | Assistant Treasurer, Transamerica Funds, TST, TIS, TPP, TPFG, TPFG II and TAAVF (January 2009 — present); Assistant Treasurer, TII (January 2009 — present); and Assistant Vice President (2007 — present) and Manager, Fund Administration, (2002 — 2007), TFS. |
| | | | | | |
Suzanne Valerio-Montemurro
(1964) | | Assistant Treasurer | | Since 2007 | | Assistant Treasurer, Transamerica Funds, TST, TIS, TPP, TPFG, TPFG II and TAAVF (2007 — present); Assistant Treasurer, TII (2007 — present); and Vice President, DIA (1998 — present). |
| | | | | | |
Sarah L. Bertrand
(1967) | | Assistant Secretary | | Since 2009 | | Assistant Secretary, Transamerica Funds, TST, TIS, TPP, TPFG, TPFG II and TAAVF (January 2009 — present); Assistant Secretary, TII (January 2009 — present); Assistant Vice President and Manager, Legal Administration, TAM and TFS (2007 — present); Assistant Secretary and Chief Compliance Officer, 40|86 Series Trust and 40|86 Strategic Income Fund (2000 - 2007); and Second Vice President and Assistant Secretary, Legal and Compliance, 40|86 Capital Management, Inc. (1994 — 2007). |
| | | | | | |
Timothy J. Bresnahan
(1968) | | Assistant Secretary | | Since 2009 | | Assistant Secretary, Transamerica Funds, TST, TIS, TPP, TPFG, TPFG II and TAAVF (January 2009 — present); Assistant Secretary, TII (January 2009 — present); Counsel, TAM (2008 — present); Counsel (contract), Massachusetts Financial Services, Inc. (2007); Assistant Counsel, BISYS Fund Services Ohio, Inc. (2005 — 2007); and Associate, Greenberg Traurig, P.A. (2004 — 2005). |
62
Name and Age | | Position | | Term of Office
and Length of
Time Served* | | Principal Occupation(s) or
Employment During Past 5 Years |
| | | | | | |
Richard E. Shield, Jr.
(1974) | | Tax Officer | | Since 2008 | | Tax Officer, Transamerica Funds, TST, TIS, TPP, TPFG, TPFG II and TAAVF (2008 — present); Tax Officer, TII (2008 — present); Tax Manager, Jeffrey P. McClanathan, CPA (2006 — 2007) and Gregory, Sharer & Stuart (2005 — 2006); Tax Senior, Kirkland, Russ, Murphy & Tapp, P.A. (2003 — 2005); and Certified Public Accountant, Schultz, Chaipel & Co., LLP (1998 — 2003). |
*Elected and serves at the pleasure of the Board of the Trust.
If an officer has held offices for different funds for different periods of time, the earliest applicable date is shown. No officer of the Trust, except for the Chief Compliance Officer, receives any compensation from the Trust.
Additional information about the Funds’ Board Members can be found in the Statement of Additional Information, available, without charge, upon request, by calling toll free 1-888-233-4339 or on the Trust’s website at www.transamericafunds.com.
63
PROXY VOTING POLICIES AND PROCEDURES AND QUARTERLY PORTFOLIO HOLDINGS
(unaudited)
A description of the Transamerica Funds’ proxy voting policies and procedures is available in the Statement of Additional Information of the Portfolios, available without charge upon request by calling 1-888-233-4339 (toll free) or on the Securities and Exchange Commission’s (“SEC”) website at http://www.sec.gov.
In addition, the Portfolios are required to file Form N-PX, with their complete proxy voting records for the 12 months ended June 30th, no later than August 31st of each year. The Form is available without charge: (1) from the Portfolios, upon request by calling 1-888-233-4339; and (2) on the SEC’s website at http://www.sec.gov.
The Portfolios file their complete schedule of portfolio holdings with the SEC for the first and third quarter of each fiscal year on Form N-Q, which is available on the SEC’s website at http://www.sec.gov. The Portfolios’ Form N-Q may be reviewed and copied at the SEC’s Public Reference Room in Washington, D.C. Information on the operation of the Public Reference Room may be obtained
by calling 1-800-SEC-0330.
You may also visit the Trust’s website at www.transamericafunds.com for this and other information about the Portfolios and the Trust.
Important Notice Regarding Delivery of Shareholder Documents
Every year we send shareholders informative materials such as the Transamerica Funds Annual Report, the Transamerica Funds Prospectus, and other required documents that keep you informed regarding your Portfolios. Transamerica Funds will only send one piece per mailing address, a method that saves your Portfolios money by reducing mailing and printing costs. We will continue to do this unless you tell us not to. To elect to receive individual mailings, simply call a Transamerica Customer Service Representative toll free at 1-888-233-4339, 8 a.m. to 7 p.m. Eastern Time, Monday–Friday. Your request will take effect within 30 days.
64
TRANSAMERICA FUNDS – PRIVACY POLICY
Notice of privacy policy
Your privacy is very important to us. We want you to understand what information we collect and how we use it. We collect and use “nonpublic personal information” in connection with providing our customers with a broad range of financial products and services as effectively and conveniently as possible. We treat nonpublic personal information in accordance with our Privacy Policy.
What Information We Collect and From Whom We Collect It
We may collect nonpublic personal information about you from the following sources:
· Information we receive from you on applications or other forms, such as your name, address, and account number;
· Information about your transactions with us, our affiliates, or others, such as your account balance and purchase/redemption history; and
· Information we receive from non-affiliated third parties, including consumer reporting agencies.
What Information We Disclose and To Whom We Disclose It
We do not disclose any nonpublic personal information about current or former customers to anyone without their express consent, except as permitted by law. We may disclose the nonpublic personal information we collect, as described above, to persons or companies that perform services on our behalf and to other financial institutions with which we have joint marketing agreements. We will require these companies to protect the confidentiality of your nonpublic personal information and to use it only to perform the services for which we have hired them.
Our Security Procedures
We restrict access to your nonpublic personal information and only allow disclosures to persons and companies as permitted by law to assist in providing products or services to you. We maintain physical, electronic, and procedural safeguards to protect your nonpublic personal information and to safeguard the disposal of certain consumer information.
If you have any questions about our privacy policy, please call 1-888-233-4339 on any business day between 8 a.m. and 7 p.m. Eastern Time.
Note: This privacy policy applies only to customers that have a direct relationship with us or our affiliates. If you own shares of our funds in the name of a third party such as a bank or broker-dealer, its privacy policy may apply to you instead of ours.
65
P.O. Box 9012
Clearwater, FL 33758-9012

Customer Service 1-888-233-4339
P.O. Box 9012 · Clearwater, FL 33758-9012
Distributor: Transamerica Capital, Inc.

Open Funds
Annual Report
October 31, 2009
www.transamericafunds.com
Customer Service 1-888-233-4339
P.O. Box 9012 · Clearwater, FL 33758-9012
Distributor: Transamerica Capital, Inc.
Dear Fellow Shareholder:
On behalf of Transamerica Funds, we would like to thank you for your continued support and confidence in our products as we look forward to continuing to serve you and your financial adviser in the future. We value the trust you have placed in us.
This annual report is provided to you with the intent of presenting a comprehensive review of the investments of each of your funds. The Securities and Exchange Commission requires that annual and semi-annual reports be sent to all shareholders, and we believe this report to be an important part of the investment process. In addition to providing a comprehensive review, this report also provides a discussion of accounting policies as well as matters presented to shareholders that may have required their vote.
We believe it is important to recognize and understand current market conditions in order to provide a context for reading this report. During the past twelve months, markets have oscillated from significant weakness in conjunction with investors’ concerns over the health of the economy and the labor market to strength in conjunction with investor optimism of recovery and bargain hunting. The equity markets touched new lows in March 2009, and then subsequently rallied sharply. The period ended in October with positive twelve - month returns for both the broad equity and bond markets. As economic recovery prospects have improved, the U.S. dollar has weakened versus the Euro, Pound Sterling, and Japanese Yen. Oil prices have been quite volatile over the past year, hitting their lows in January 2009 and recovering to end higher at the end of the period. From a rate of 1.00% at the beginning of the period, the Federal Reserve lowered the federal funds rate in December 2008 to a range of 0%-0.25% in an effort to stimulate the economy. The unemployment rate has continued to climb and reached 10.2% in October. Bargain hunting and an increased appetite for risk following market lows in March 2009 has led to strong gains for particular equity and fixed-income sectors, including emerging market stocks, technology stocks and high - yield bonds. Treasuries and money market securities have lagged on a relative basis. For the twelve months ending October 31, 2009, the Dow Jones Industrial Average returned 7.71%; the Standard & Poor’s 500 Index returned 9.80%; and the Barclays Capital Aggregate U.S. Bond Index returned 13.79%. Please keep in mind it is important to maintain a diversified portfolio as investment returns have historically been difficult to predict.
In addition to your active involvement in the investment process, we firmly believe that a financial adviser is a key resource to help you build a complete picture of your current and future financial needs. Financial advisers are familiar with the market’s history, including long-term returns and volatility of various asset classes. With your financial adviser, you can develop an investment program that incorporates factors such as your goals, your investment timeline, and your risk tolerance.
Please contact your financial advisor if you have any questions about the contents of this report, and thanks again for the confidence you have placed in us.
Sincerely,
John K. Carter | Christopher A. Staples |
Chairman of the Board, | Senior Vice President & Chief Investment Officer |
President & Chief Executive Officer | Transamerica Funds |
Transamerica Funds | |
The views expressed in this report reflect those of the portfolio managers only and may not necessarily represent the views of Transamerica Funds. These views are subject to change based upon market conditions. These views should not be relied upon as investment advice and are not indicative of trading intent on behalf of Transamerica Funds.
Transamerica Balanced
(unaudited)
MARKET ENVIRONMENT
During the 12 months ended October 31, 2009, securities markets grappled with a global economic slowdown and the repercussions from the collapse of the credit markets before staging powerful rallies.
U.S. equity markets began the period with a freefall precipitated by concerns that corporate earnings would be eroded by tight lending standards, sharply reduced global liquidity, a deepening U.S. recession and slower economic growth elsewhere. Investors retreated from U.S. stock markets, despite extraordinary efforts by the U.S. government and Treasury to restore order in the financial system and reinvigorate the economy. The arsenal deployed in this effort included near-zero interest rates and more than a dozen programs meant to stabilize the housing market, infuse liquidity into the credit markets, jump-start consumer spending, or provide financing to the largest financial institutions.
The government’s massive efforts yielded modest success by March, when bellwether banks showed first signs of stabilization, and gained traction thereafter. Amid signs that the immediate danger to the banking system had passed, U.S. equity markets began a vigorous rebound from the March lows.
In fixed income, greatly reduced liquidity and the ongoing recession caused a dislocation of near-historic proportions. Demand for the relative safety of U.S. Treasuries escalated sharply, pushing yields down to near zero. Meanwhile, yields in riskier asset classes rose dramatically.
As the period progressed and the government’s initiatives took effect in earnest, U.S. fixed income markets rallied impressively. An early beneficiary of the government’s programs was agency mortgage-backed securities (“MBS”). The government effectively took over the issuing agencies and manipulated mortgage rates lower through large-scale purchases of agency MBS. Corporates also did well, outperforming Treasuries.
By third quarter 2009, U.S. economic growth turned positive. The decline in housing prices moderated after April, and existing home sales rose during the summer, aided by a federal first-time homebuyer tax credit. Other federal stimulus programs helped loosen credit markets, affording businesses better access to funding for new projects and rebuilding inventories. Although unemployment remains elevated, consumer sentiment, business activity and corporate earnings showed improvements by period-end.
PERFORMANCE
For the year ended October 31, 2009, Transamerica Balanced Class A returned 18.43%. By comparison, its primary and secondary benchmarks, the Standard and Poor’s 500 Composite Stock Index and the Barclays Capital U.S Aggregate Bond Index, returned 9.80% and 13.79%, respectively.
STRATEGY REVIEW
During the period, Transamerica Balanced outperformed its blended benchmark. For the equity segment, positive relative performance is attributable to overweighting the strong-performing information technology sector and stock selection in the consumer discretionary and industrials sectors.
Amazon.com, Inc. was a top-performing consumer discretionary holding. The company achieved healthy returns by engaging the global consumer. Another key performance contributor was BlackRock, Inc., a global investment management, risk management and advisory services firm. It is considered a fixed income industry leader and benefited during a period of favor for fixed income strategies.
Performance detractors included overweighting the weaker-performing industrials sector and stock selection in the healthcare and financial services sectors. The Charles Schwab Corp., a key performance detractor, benefitted early in the period from a trend among financial advisors to form their own firms and was on the leading edge of providing service and distribution channels for those advisors. More recently, the company experienced a slowdown in its business as consumers shifted from investing to saving. Business outsourcing company Automatic Data Processing, Inc., (“ADP”) was also a performance detractor. During the period, it experienced a decline in its stock price due to rising unemployment.
On the fixed income side, strong performance was primarily the result of overweighting mortgage-related and corporate securities. Also contributing to performance was a small but strategic investment in commercial MBS — most notably, cell-phone towers. Unlike commercial buildings, demand for cell-phone towers was not impacted greatly by the recession. During the period, our shorter-than-index duration modestly detracted from performance, but the impact was more than offset by the fund’s sector exposures.
Gary U. Rollé, CFA
Greg D. Haendel, CFA
Derek S. Brown, CFA
Edward S. Han
John J. Huber, CFA
Peter O. Lopez
Erik U. Rollé
Brian W. Westhoff, CFA
Co-Portfolio Managers
Transamerica Investment Management, LLC
1

Average Annual Total Return for Periods Ended 10/31/2009
| | 1 Year | | 5 Years | | 10 Years or
Life of Fund | | Inception Date | |
Class A (NAV) | | 18.43 | % | 2.17 | % | 1.84 | % | 12/02/1994 | |
Class A (POP) | | 11.90 | % | 1.02 | % | 1.27 | % | 12/02/1994 | |
S&P 500* | | 9.80 | % | 0.33 | % | (0.95 | )% | 12/02/1994 | |
Barclays Capital U.S. Aggregate Bond* | | 13.79 | % | 5.05 | % | 6.31 | % | 12/02/1994 | |
Class B (NAV) | | 17.50 | % | 1.55 | % | 1.33 | % | 10/01/1995 | |
Class B (POP) | | 12.57 | % | 1.37 | % | 1.33 | % | 10/01/1995 | |
Class C (NAV) | | 17.80 | % | 1.61 | % | 3.15 | % | 11/11/2002 | |
Class C (POP) | | 16.80 | % | 1.61 | % | 3.15 | % | 11/11/2002 | |
NOTES
* The Standard and Poor’s 500 Composite Stock (“S&P 500”) Index and the Barclays Capital U.S. Aggregate Bond (“Barclays Capital U.S. Aggregate Bond”) Index are unmanaged indices used as a general measure of market performance. Calculations assume dividends and capital gains are reinvested and do not include any managerial expenses. The 10 Years or Life of Fund calculation is based on life of Class A shares. You cannot invest directly in an index.
The performance data presented represents past performance; future results may vary. Performance data does not reflect the deduction of taxes that would be paid on fund distributions or the redemption of fund shares. Investment return and principal value will fluctuate so that an investor’s shares, when redeemed, may be worth more or less than their original cost. Current performance may be lower or higher than performance quoted. Please see www.transamericafunds.com for performance data current to the most recent month-end. Net Asset Value (NAV) returns include the reinvestment of dividends and capital gains but do not reflect any sales charges. Public Offering Price (POP) returns include the reinvestment of dividends and capital gains and reflect the maximum sales charge of 5.5% for A shares or the maximum applicable contingent deferred sales charge (5% in the 1st year, decreasing to 0% after 6 years) for Class B shares and 1% (during the first 12 months) for Class C shares. Shares purchased prior to March 1, 2004 are subject to a maximum applicable contingent deferred sales charge (5% in the 1st year, decreasing to 0% after 7 years) for Class B shares and (2% in the 1st year, decreasing to 0% after 2 years) for Class C shares. Net Asset Value (NAV) returns include the reinvestment of dividends and capital gains but do not reflect any sales charges.
Performance figures may reflect fee waivers and/or expense reimbursements by the Investment Adviser. Without such waivers and/or reimbursements, the performance would be lower. Future waivers and/or reimbursements are at the discretion of the Investment Adviser.
This material must be preceded or accompanied by a current prospectus, which includes specific contents regarding the investment objectives and policies of this Fund.
2
Transamerica Convertible Securities
(unaudited)
MARKET ENVIRONMENT
During the 12 months ended October 31, 2009, convertible securities — which are sensitive to both equity and fixed income market trends — experienced tremendous volatility.
U.S. equity markets began the period with a freefall precipitated by concerns that corporate earnings would be eroded by tight lending standards, sharply reduced global liquidity, a deepening U.S. recession and slower economic growth elsewhere. Investors retreated from U.S. stock markets, despite extraordinary efforts by the U.S. government and Treasury to restore order in the financial system and reinvigorate the economy. The arsenal deployed in this effort included near-zero interest rates and more than a dozen programs meant to infuse liquidity into the credit markets; jump-start consumer spending; or provide financing to the largest financial institutions.
In fixed income markets, greatly reduced liquidity and the ongoing recession caused a dislocation of near-historic proportions. Demand for the relative safety of U.S. Treasuries escalated sharply, pushing yields down to near zero. Meanwhile, yields in riskier asset classes rose dramatically.
During equity bear markets, convertible securities typically fare better than equities, as their debt components tend to offset some or all of the negative impact on the equity component. However, as spreads widened, the debt component of many convertibles sharply declined. Additionally, convertible market liquidity was an issue early in the period as hedge funds — a major block of market participants — reduced their exposures.
By mid-March the government’s various efforts began to gain traction. Bellwether banks showed first signs of stabilization, sparking improvements in both equity and fixed income markets. By summer, the federal stimulus programs helped to bring the recession to an end and loosen credit markets, affording businesses better access to funding for new projects and rebuilding inventories. Towards the end of the period, credit spreads had narrowed and equity markets continued to rebound — both positive developments for convertible securities.
PERFORMANCE
For the year ended October 31, 2009, Transamerica Convertible Securities Class A returned 20.42%. By comparison, its benchmark, the Bank of America Merrill Lynch All U.S. Convertible Securities Index, returned 37.26%.
STRATEGY REVIEW
Throughout the period, we adhered to the core tenets of our investment philosophy — seeking quality companies with proven management, strong cash-flow characteristics and sustainable competitive advantages. In addition, early in the period, we shifted the portfolio to low-risk investments (i.e., short-term fixed income instruments), a defensive move to preserve capital in a volatile market. Further, we lowered the fund’s delta — a measure of sensitivity to equity price changes — slightly below the benchmark. Thus, the fund was conservatively positioned when the markets rallied, led by higher-risk segments of the market. As a result, the fund lagged the benchmark during the rally, but nonetheless posted a double-digit return for the full period.
By early summer, we shifted the portfolio’s stance to reflect a more positive outlook on the equity markets, anticipating low to moderate domestic growth. We increased our position in biotechnology, convinced pending healthcare reform would place pressure on large pharmaceutical companies to seek other avenues of growth. We felt many of these companies would be discouraged from doing their own research and development and seek to pursue mergers and acquisitions with smaller biotechnology companies. We think this is an opportunistic area of the market and selectively added quality biotechnology names such as Human Genome Sciences, Inc. and Onyx Pharmaceuticals, Inc.
Additionally, in the belief that dollar-based weakness would cause a rally in commodity prices (i.e., gold and steel), we increased our exposure to commodity-related securities, adding investments in companies like worldwide gold miner Newmont Mining Corporation and steel producer U.S. Steel Corp.
Kirk J. Kim
Peter O. Lopez
Co-Portfolio Managers
Transamerica Investment Management, LLC
3
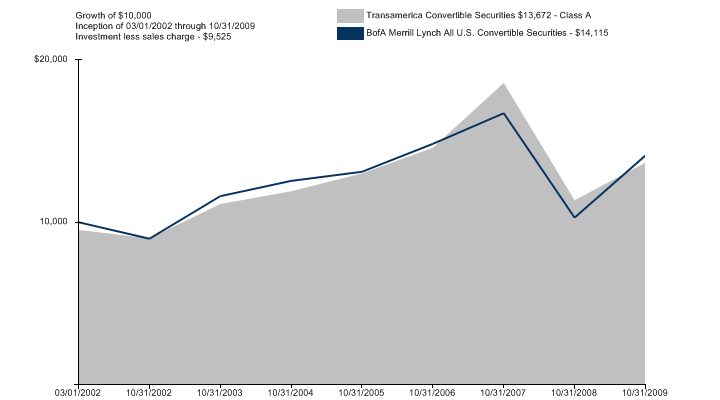
Average Annual Total Return for Periods Ended 10/31/2009
| | 1 Year | | 5 Years | | 10 Years or
Life of Fund | | Inception Date | |
Class A (NAV) | | 20.42 | % | 2.80 | % | 4.83 | % | 03/01/2002 | |
Class A (POP) | | 14.67 | % | 1.80 | % | 4.16 | % | 03/01/2002 | |
BofA Merrill Lynch All U.S. Convertible Securities* | | 37.26 | % | 2.38 | % | 4.60 | % | 03/01/2002 | |
Class B (NAV) | | 19.45 | % | 2.02 | % | 4.10 | % | 03/01/2002 | |
Class B (POP) | | 14.45 | % | 1.88 | % | 4.10 | % | 03/01/2002 | |
Class C (NAV) | | 19.57 | % | 2.09 | % | 5.45 | % | 11/11/2002 | |
Class C (POP) | | 18.57 | % | 2.09 | % | 5.45 | % | 11/11/2002 | |
Class I (NAV) | | 21.09 | % | N/A | | 1.48 | % | 11/15/2005 | |
NOTES
* The Bank of America Merrill Lynch All U.S. Convertibles Securities (“BofA Merrill Lynch All U.S. Convertibles Securities”) Index is an unmanaged index used as a general measure of market performance. Calculations assume dividends and capital gains are reinvested and do not include any managerial expenses. 10 Years or Life of fund calculation is based on life of Class A shares. You cannot invest directly in an index.
The performance data presented represents past performance; future results may vary. Performance data does not reflect the deduction of taxes that would be paid on fund distributions or the redemption of fund shares. Investment return and principal value will fluctuate so that an investor’s shares, when redeemed, may be worth more or less than their original cost. Current performance may be lower or higher than performance quoted. Please see www.transamericafunds.com for performance data current to the most recent month-end. Net Asset Value (NAV) returns include the reinvestment of dividends and capital gains but do not reflect any sales charges. Public Offering Price (POP) returns include the reinvestment of dividends and capital gains and reflect the maximum sales charge of 4.75% for A shares or the maximum applicable contingent deferred sales charge (5% in the 1st year, decreasing to 0% after 6 years) for Class B shares and 1% (during the first 12 months) for Class C shares. Shares purchased prior to March 1, 2004 are subject to a maximum applicable contingent deferred sales charge (5% in the 1st year, decreasing to 0% after 7 years) for Class B shares and (2% in the 1st year, decreasing to 0% after 2 years) for Class C shares. Net Asset Value (NAV) returns include the reinvestment of dividends and capital gains but do not reflect any sales charges.
Performance figures may reflect fee waivers and/or expense reimbursements by the Investment Adviser. Without such waivers and/or reimbursements, the performance would be lower. Future waivers and/or reimbursements are at the discretion of the Investment Adviser.
This material must be preceded or accompanied by a current prospectus, which includes specific contents regarding the investment objectives and policies of this fund.
4
Transamerica Equity
(unaudited)
MARKET ENVIRONMENT
During the 12 months ended October 31, 2009, equity markets experienced tremendous volatility as they grappled with, and then overcame, a global economic slowdown and the repercussions from the collapse of the credit markets.
U.S. equity markets began the period with a freefall precipitated by concerns that corporate earnings would be eroded by tight lending standards, sharply reduced global liquidity, a deepening U.S. recession and slower economic growth elsewhere. Investors retreated from U.S. stock markets, despite extraordinary efforts by the U.S. government and Treasury to restore order in the financial system and reinvigorate the economy. The arsenal deployed in this effort included near-zero interest rates and more than a dozen programs meant to stabilize the housing market; infuse liquidity into the credit markets; jump-start consumer spending; or provide financing to the largest financial institutions.
The government’s massive efforts yielded modest success by March, when bellwether banks showed first signs of stabilization, and gained traction thereafter. Amid signs that the immediate danger to the banking system had passed, U.S. equity markets began a vigorous — albeit volatile — rebound, ending the period modestly higher.
We believe the U.S. recession ended in mid-2009. The decline in housing prices moderated after April, and existing home sales rose during the summer, aided by a federal first-time homebuyer tax credit. Other federal stimulus programs helped loosen credit markets, affording businesses better access to funding for new projects and rebuilding inventories. Additionally, U.S. economic growth for third quarter 2009 was positive. Although unemployment remains elevated, consumer sentiment, business activity and corporate earnings showed improvements by period-end.
PERFORMANCE
For the year ended October 31, 2009, Transamerica Equity Class A returned 10.07%. By comparison, its benchmark, the Russell 1000® Growth Index, returned 17.51%.
STRATEGY REVIEW
Throughout the period, we adhered to the core tenets of our investment philosophy — seeking companies with proven management, strong cash-flow characteristics and sustainable competitive advantages. Thus, when the market rebound began, Transamerica Equity was positioned in high-quality stocks with strong growth characteristics. In the initial phase of the rebound, still-cautious investors favored quality, and the fund rebounded vigorously. It did not, however, own the smallest constituents of the benchmark, which had fallen out of the fund’s market-cap range as stock prices contracted early on. As investors’ appetite for risk grew, smaller and lower-quality stocks fared best. The fund, while continuing to generate gains and, ultimately, double-digit returns, underperformed the benchmark index.
We believe the international consumer will be an increasingly important factor in the global economy, and companies moving rapidly into international markets will benefit. Among the fund’s strongest contributors to performance was Amazon.com, which achieved healthy returns by engaging the global consumer.
Other key contributors were Johnson Controls Inc., a manufacturer of automotive interior products and battery-powered systems, and Apple Inc., the maker of consumer-friendly personal electronics. During the period, Johnson Controls was awarded government contracts and successfully cut costs amidst the downturn in auto manufacturing and sales. Apple’s products continued to benefit from worldwide consumers’ desire for technology that provides improved mobile communications and access to information.
Partially offsetting the gains for these and other stocks was our security selection in the financial services (i.e., Wells Fargo & Co.) and healthcare (i.e., Varian Medical Systems, Inc.) sectors. Consumer bank Wells Fargo was caught in the downdraft of financial stocks early in the period. However, its acquisition of Wachovia is proving beneficial, and its deposit levels are rising. Varian, a successful developer of technology used to treat cancer through precise radiation procedures, lost ground on fears that cost-conscious hospitals would postpone purchases. Also detracting from performance was General Electric Co. (“GE”) Concerned about GE’s strained balance sheet, we sold the stock in favor of better opportunities.
Gary U. Rollé, CFA
Edward S. Han
John J. Huber, CFA
Peter O. Lopez
Eric U. Rollé
Co-Portfolio Managers
Transamerica Investment Management, LLC
5

Average Annual Total Return for Periods Ended 10/31/2009
| | 1 Year | | 5 Years | | 10 Years or
Life of Fund | | Inception Date | |
Class A (NAV) | | 10.07 | % | 0.75 | % | (2.63 | )% | 03/01/2000 | |
Class A (POP) | | 4.00 | % | (0.37 | )% | (3.20 | )% | 03/01/2000 | |
Russell 1000® Growth* | | 17.51 | % | 1.27 | % | (5.00 | )% | 03/01/2000 | |
Class B (NAV) | | 9.19 | % | 0.00 | % | (3.23 | )% | 03/01/2000 | |
Class B (POP) | | 4.19 | % | (0.20 | )% | (3.23 | )% | 03/01/2000 | |
Class C (NAV) | | 9.32 | % | 0.05 | % | 4.53 | % | 11/11/2002 | |
Class C (POP) | | 8.32 | % | 0.05 | % | 4.53 | % | 11/11/2002 | |
Class I (NAV) | | 10.73 | % | N/A | | (4.00 | )% | 11/15/2005 | |
Class T (NAV) | | 10.46 | % | N/A | | (7.91 | )% | 10/27/2006 | |
Class T (POP) | | 1.06 | % | N/A | | (10.58 | )% | 10/27/2006 | |
NOTES
* The Russell 1000® Growth (“Russell 1000® Growth”) Index is an unmanaged index used as a general measure of market performance. Calculations assume dividends and capital gains are reinvested and do not include any managerial expenses. 10 Years or Life of fund calculation is based on life of Class A shares. You cannot invest directly in an index.
The performance data presented represents past performance; future results may vary. Performance data does not reflect the deduction of taxes that would be paid on fund distributions or the redemption of fund shares. Investment return and principal value will fluctuate so that an investor’s shares, when redeemed, may be worth more or less than their original cost. Current performance may be lower or higher than performance quoted. Please see www.transamericafunds.com for performance data current to the most recent month-end. Public Offering Price (POP) returns include the reinvestment of dividends and capital gains and reflect the maximum sales charge of 5.5% for A shares (8.5% for Class T) or the maximum applicable contingent deferred sales charge (5% in the 1st year, decreasing to 0% after 6 years) for Class B shares and 1% (during the first 12 months) for Class C shares. Shares purchased prior to March 1, 2004 are subject to a maximum applicable contingent deferred sales charge (5% in the 1st year, decreasing to 0% after 7 years) for Class B shares and (2% in the 1st year, decreasing to 0% after 2 years) for Class C shares. Net Asset Value (NAV) returns include the reinvestment of dividends and capital gains but do not reflect any sales charges. Net Asset Value (NAV) returns include the reinvestment of dividends and capital gains but do not reflect any sales charges.
Performance figures may reflect fee waivers and/or expense reimbursements by he Investment Adviser. Without such waivers and/or reimbursements, the performance would be lower. Future waivers and/or reimbursements are at the discretion of the Investment Adviser.
This material must be preceded or accompanied by a current prospectus, which includes specific contents regarding the investment objectives and policies of this fund.
6
Transamerica Flexible Income
(unaudited)
MARKET ENVIRONMENT
During most of the 12 months ended October 31, 2009, U.S. fixed income markets experienced the strongest rally in many decades.
Early in the reporting period, fixed income markets grappled with the repercussions of the financial crisis that began with the collapse of the subprime mortgage market in 2007. By September 2008, the crisis had shuttered a preeminent investment bank (Lehman Brothers). Other banks responded by further tightening already stringent lending standards.
With liquidity greatly reduced and the U.S. economy mired in recession, a dislocation of near-historic proportions occurred in the fixed income markets. Demand for the relative safety of U.S. Treasuries escalated sharply, pushing yields down. Meanwhile, prices for non-Treasury securities fell, and yields, which move in opposition to prices, rose. The gap between the yields of Treasuries and other securities (i.e., yield spreads) widened, in some cases to levels not seen since the Great Depression.
Market conditions began to stabilize early in 2009 after aggressive and unprecedented efforts by the U.S. government to restore order and confidence to the financial system and reinvigorate the economy gained traction. The arsenal deployed in this effort included reduction of the federal funds rate (from 1.0% to near 0%) and more than a dozen programs meant to stabilize the housing market; provide a liquidity backstop to high-quality corporations; jump-start consumer spending; and provide financing and capital to financial institutions. An early beneficiary of these programs was agency mortgage-backed securities (“MBS”). The government effectively took over the issuing agencies and manipulated mortgage rates lower through large-scale purchases of agency MBS.
As the period progressed, the massive government initiatives loosened up credit markets, affording businesses better access to funding for new projects, continuing operations and debt refinancing. Consumer spending modestly rebounded, the U.S. housing market showed initial signs of stabilization, and the U.S. recession ended. Although unemployment remained elevated, consumer sentiment, business activity and corporate earnings showed improvements. By October, credit spreads had narrowed, and credit yield curves were migrating toward a more normal (i.e., upward-sloping) configuration. For the full 12 months, investment-grade corporate bonds, high-yield bonds and mortgage securities outperformed Treasuries.
PERFORMANCE
For the year ended October 31, 2009, Transamerica Flexible Income Class A returned 22.30%. By comparison, its primary and former benchmarks, the Barclays Capital Aggregate U.S. Bond Index and the Barclays Capital U.S. Government/Credit Bond Index, returned 13.79% and 14.60%, respectively.
STRATEGY REVIEW
During the fiscal year, Transamerica Flexible Income achieved its objective of providing high total return through a combination of current income and capital appreciation by increasing its exposure to high-yield corporate bonds and agency MBS.
Early in the period, we increased our exposure to agency MBS. Both the government’s implied guarantee and the federal programs designed to manipulate mortgage rates lower helped to make these securities attractive. Additionally, we purchased many short-dated bonds, which benefited from the government’s liquidity programs, a reopening of the fixed income markets and inverted yield curves.
During the reopening of credit markets in early 2009, we bought many new issues with high coupons and benefited from drastic credit-market improvements. After strong performance, we moved to lock in gains in high-yield and agency MBS. We repositioned the assets in attractive new high-grade corporate bonds. Also contributing modestly to performance was the fund’s limited exposure to convertibles, common equity and preferred stock.
A slight detractor from overall performance was our shorter-than-index duration as credit conditions improved and yield spreads declined. However, the impact of our duration positioning was eclipsed by the fund’s selections in high-yield bonds, investment-grade corporate bonds and mortgage securities.
Brian W. Westhoff, CFA
Derek S. Brown, CFA
Kirk J. Kim
Greg D. Haendel, CFA
Peter O. Lopez
Co-Portfolio Managers
Transamerica Investment Management, LLC
7
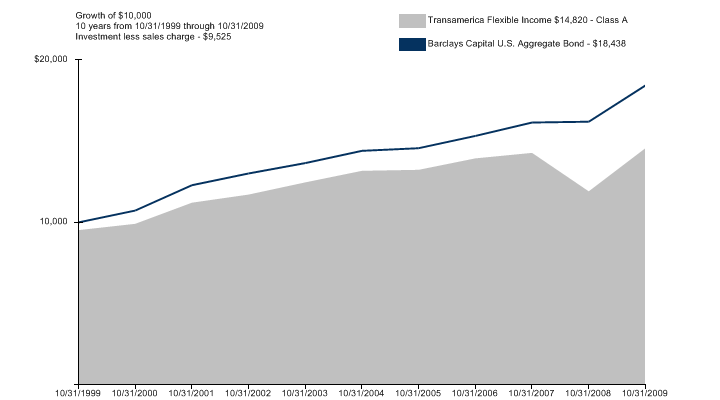
Average Annual Total Return for Periods Ended 10/31/2009
| | 1 Year | | 5 Years | | 10 Years or
Life of Fund | | Inception Date | |
Class A (NAV) | | 22.30 | % | 2.03 | % | 4.35 | % | 06/29/1987 | |
Class A (POP) | | 16.49 | % | 1.05 | % | 3.84 | % | 06/29/1987 | |
Barclays Capital U.S. Aggregate Bond* | | 13.79 | % | 5.05 | % | 6.31 | % | 06/29/1987 | |
Barclays Capital U.S. Government/Credit Bond* | | 14.60 | % | 4.79 | % | 6.32 | % | 06/29/1987 | |
Class B (NAV) | | 21.39 | % | 1.35 | % | 3.79 | % | 10/01/1995 | |
Class B (POP) | | 16.39 | % | 1.19 | % | 3.79 | % | 10/01/1995 | |
Class C (NAV) | | 21.50 | % | 1.39 | % | 2.44 | % | 11/11/2002 | |
Class C (POP) | | 20.50 | % | 1.39 | % | 2.44 | % | 11/11/2002 | |
Class I (NAV) | | 23.16 | % | N/A | | 2.64 | % | 11/08/2004 | |
NOTES
* The Barclays Capital U.S. Aggregate Bond (“Barclays Capital U.S. Aggregate Bond”) Index and Barclays Capital U.S. Government/Credit Bond (“Barclays Capital U.S. Government/Credit Bond”) Index are unmanaged indices used as a general measure of market performance. Calculations assume dividends and capital gains are reinvested and do not include any managerial expenses. 10 Years or Life of fund calculation is based on life of Class A shares. You cannot invest directly in an index.
The performance data presented represents past performance; future results may vary. Performance data does not reflect the deduction of taxes that would be paid on fund distributions or the redemption of fund shares. Investment return and principal value will fluctuate so that an investor’s shares, when redeemed, may be worth more or less than their original cost. Current performance may be lower or higher than performance quoted. Please see www.transamericafunds.com for performance data current to the most recent month-end. Net Asset Value (NAV) returns include the reinvestment of dividends and capital gains but do not reflect any sales charges. Public Offering Price (POP) returns include the reinvestment of dividends and capital gains and reflect the maximum sales charge of 4.75% for A shares or the maximum applicable contingent deferred sales charge (5% in the 1st year, decreasing to 0% after 6 years) for Class B shares and 1% (during the first 12 months) for Class C shares. Shares purchased prior to March 1, 2004 are subject to a maximum applicable contingent deferred sales charge (5% in the 1st year, decreasing to 0% after 7 years) for Class B shares and (2% in the 1st year, decreasing to 0% after 2 years) for Class C shares. Net Asset Value (NAV) returns include the reinvestment of dividends and capital gains but do not reflect any sales charges.
Performance figures may reflect fee waivers and/or expense reimbursements by the Investment Adviser. Without such waivers and/or reimbursements, the performance would be lower. Future waivers and/or reimbursements are at the discretion of the Investment Adviser.
This material must be preceded or accompanied by a current prospectus, which includes specific contents regarding the investment objectives and policies of this fund.
8
Transamerica Growth Opportunities
(unaudited)
MARKET ENVIRONMENT
During the 12 months ended October 31, 2009, equity markets experienced tremendous volatility as they grappled with a global economic slowdown and the repercussions from the collapse of the credit markets.
U.S. equity markets began the period with a freefall precipitated by concerns that corporate earnings would be eroded by tight lending standards, sharply reduced global liquidity, a deepening U.S. recession and slower economic growth elsewhere. Investors retreated from U.S. stock markets, despite extraordinary efforts by the U.S. government and Treasury to restore order in the financial system and reinvigorate the economy. The arsenal deployed in this effort included near-zero interest rates and more than a dozen programs meant to stabilize the housing market; infuse liquidity into the credit markets; jump-start consumer spending; or provide financing to the largest financial institutions.
The government’s massive efforts yielded modest success by March, when bellwether banks showed first signs of stabilization, and gained traction thereafter. Amid signs that the immediate danger to the banking system had passed, U.S. equity markets began a vigorous rebound from the March lows.
We believe the U.S. recession ended in mid-2009. The decline in housing prices moderated after April, and existing home sales rose during the summer, aided by a federal first-time homebuyer tax credit. Other federal stimulus programs helped loosen credit markets, affording businesses better access to funding for new projects and rebuilding inventories. Additionally, U.S. economic growth for third quarter 2009 was positive. Although unemployment remains elevated, consumer sentiment, business activity and corporate earnings showed improvements by period-end.
PERFORMANCE
For the year ended October 31, 2009, Transamerica Growth Opportunities Class A returned 14.76%. By comparison, its benchmark, the Russell Midcap® Growth Index, returned 22.48%.
STRATEGY REVIEW
Throughout the period, we adhered to the core tenets of our investment philosophy — seeking companies with proven management, strong cash-flow characteristics and sustainable competitive advantages. Thus, when the market rebound began, Transamerica Growth Opportunities was positioned in high-quality stocks with strong growth characteristics. In the initial phase of the rebound, still-cautious investors favored quality, and the portfolio outperformed. It did not, however, own the smallest constituents of the benchmark, which had fallen out of the fund’s market-cap range as stock prices contracted early on. As investors’ appetite for risk grew, smaller and lower-quality stocks fared best. The fund, while continuing to generate gains and, recently, double-digit returns, underperformed the benchmark.
We believe the international consumer will be an increasingly important factor in the global economy, and companies moving rapidly into international markets will benefit. Two of the fund’s stronger contributors — Guess?, Inc. and Priceline.com Inc. — gained from the increasing influence of the global consumer. Guess? is growing its international business at an aggressive pace, and Priceline.com is benefiting from growth in Europe, where its value-price offering has been adopted by many small hotels for the first time.
Stock selection in the auto & transportation sector also contributed to relative performance, as did our lack of exposure in the weaker-performing utilities, integrated oils and consumer staples sectors.
Automotive product leader BorgWarner Inc. — which supplies the newest technologies to the auto market — was a top contributor despite a difficult third quarter in which it experienced stock price declines amidst investor skepticism about the ability of the government’s “cash for clunkers” program to jump-start auto sales.
Stock selection in the technology and financial services sectors detracted from performance, as did our cash position, which was a byproduct of normal trading activity.
Technology holding FLIR Systems, Inc. came under pressure earlier in the period as some investors rotated out of profitable positions. We sold the stock in the third quarter. Game publisher Activision Blizzard had flat third-quarter returns following a strong first half of the year. We expect video-game sales to increase in the fourth quarter following significant price declines for video-game consoles and the release of new games ahead of the holiday season.
Edward S. Han
John J. Huber, CFA
Co-Portfolio Managers
Transamerica Investment Management, LLC
9
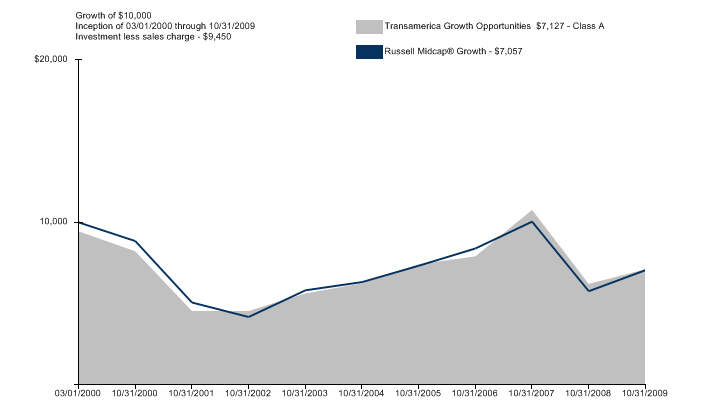
Average Annual Total Return for Periods Ended 10/31/2009
| | 1 Year | | 5 Years | | 10 Years or
Life of Fund | | Inception Date | |
Class A (NAV) | | 14.76 | % | 2.64 | % | (2.89 | )% | 03/01/2000 | |
Class A (POP) | | 8.35 | % | 1.50 | % | (3.46 | )% | 03/01/2000 | |
Russell Midcap® Growth* | | 22.48 | % | 2.22 | % | (3.54 | )% | 03/01/2000 | |
Class B (NAV) | | 14.03 | % | 1.87 | % | (3.52 | )% | 03/01/2000 | |
Class B (POP) | | 9.03 | % | 1.69 | % | (3.52 | )% | 03/01/2000 | |
Class C (NAV) | | 13.80 | % | 1.90 | % | 6.16 | % | 11/11/2002 | |
Class C (POP) | | 12.80 | % | 1.90 | % | 6.16 | % | 11/11/2002 | |
Class I (NAV) | | 15.43 | % | N/A | | (0.67 | )% | 11/15/2005 | |
NOTES
* The Russell Midcap® Growth (“Russell Midcap® Growth”) Index is an unmanaged index used as a general measure of market performance. Calculations assume dividends and capital gains are reinvested and do not include any managerial expenses. The 10 Years or Life of Fund calculation is based on life of Class A shares. You cannot invest directly in an index.
The performance data presented represents past performance; future results may vary. Performance data does not reflect the deduction of taxes that would be paid on fund distributions or the redemption of fund shares. Investment return and principal value will fluctuate so that an investor’s shares, when redeemed, may be worth more or less than their original cost. Current performance may be lower or higher than performance quoted. Please see www.transamericafunds.com for performance data current to the most recent month-end. Net Asset Value (NAV) returns include the reinvestment of dividends and capital gains but do not reflect any sales charges. Public Offering Price (POP) returns include the reinvestment of dividends and capital gains and reflect the maximum sales charge of 5.5% for A shares or the maximum applicable contingent deferred sales charge (5% in the 1st year, decreasing to 0% after 6 years) for Class B shares and 1% (during the first 12 months) for Class C shares. Shares purchased prior to March 1, 2004 are subject to a maximum applicable contingent deferred sales charge (5% in the 1st year, decreasing to 0% after 7 years) for Class B shares and (2% in the 1st year, decreasing to 0% after 2 years) for Class C shares. Net Asset Value (NAV) returns include the reinvestment of dividends and capital gains but do not reflect any sales charges.
Performance figures may reflect fee waivers and/or expense reimbursements by the Investment Adviser. Without such waivers and/or reimbursements, the performance would be lower. Future waivers and/or reimbursements are at the discretion of the Investment Adviser.
Investing in small cap stocks generally involves greater risk and volatility, therefore an investment in the fund may not be appropriate for everyone. This material must be preceded or accompanied by a current prospectus, which includes specific contents regarding the investment objectives and policies of this Fund.
10
Transamerica High Yield Bond
(unaudited)
MARKET ENVIRONMENT
October 2009 marked the eighth consecutive month of positive returns for the high yield market and brought the prior twelve month gain for the Bank of America Merrill Lynch High Yield Cash Pay Index (“Merrill Lynch High Yield”) to 48.05%. The index has now fully recouped the -26.43% loss experienced in the fiscal year ended October 2008. The twelve month performance exceeds the record calendar year return of 34.58% posted by the Merrill Lynch High Yield in 1991.
High yield returns for the majority of 2009 benefited from positive technical factors. The heavy flow of money to risky asset classes spurred rallies in high yield, investment-grade and emerging-markets credit, leveraged loans, and equities. Operating results have not yet demonstrated a sharp rebound. However, investors rarely receive validation that a rally is fundamentally supported until well after the initial gains occur.
Investor sentiment for high yield assets has changed significantly in recent months and has led to a dramatic improvement in capital markets access. The result is a flurry of refinancing activity that removed or deferred the risk of default for a large portion of the high yield market. Consequently, default rates are currently consistent with levels seen in prior recessionary periods rather than the Depression-like conditions implied by the record spread levels witnessed in Q4 2008 and Q1 2009.
PERFORMANCE
For the year ended October 31, 2009, Transamerica High Yield Bond Class A returned 47.58%. By comparison its benchmark, the Bank of America Merrill Lynch U.S. High Yield, Cash Pay returned 48.05%.
STRATEGY REVIEW
The portfolio benefited from an overweight position in cyclical industries such as technology and building materials as economically sensitive industries generally outperformed defensive industries. The recovery in cyclicals is a reversal from 2008 when defensive industries outperformed and indicates a market looking forward to economic improvement.
Anticipating the strength in cyclicals, we maintained an underweight position in defensive industries including a reduced industry weighting to telecommunication and energy which resulted in a positive contribution to Fund performance. While the Fund’s exposure to the financial sector increased during the year, the portfolio position remained underweight relative to the benchmark. As a result, financials were a negative contributor to Fund performance during the 2009 recovery as the sector outperformed the overall market.
We anticipate fundamentals will stabilize in the coming months but challenges to the economy remain. Job losses have slowed but unemployment levels are at 25 year highs and may climb further before any long term improvement takes hold. As a result, we do not expect consumers to be a significant economic driver in the short-term but instead anticipate that inventory re-stocking and capital availability should foster growth through 2009 and into 2010.
Against this backdrop, we anticipate maintaining an overweight to cyclical industries with an underweight bias toward defensive industries. We are also selectively reducing exposure to issuers that rallied beyond what we believe to be fair value relative to the risk. We continue to find opportunities in financials where spreads (+1,200 bps) remain wide relative to the overall high yield market (+775 bps). We also believe opportunities still exist in the longer dated maturities of high quality names.
The Fund is currently positioned towards a view that we are in the early stages of a recovery and we believe the Fund will outperform in that environment. We also continue to believe the high yield market offers attractive spreads and absolute yields and anticipate improving fundamentals to validate this as the economy improves.
David R. Halfpap, CFA
Bradley J. Beman, CFA, CPA
Benjamin D. Miller, CFA
Co-Portfolio Managers
AEGON USA Investment Management, LLC
11
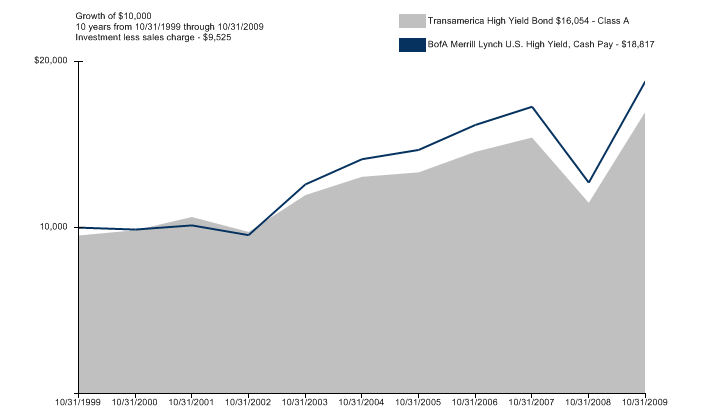
Average Annual Total Return for Periods Ended 10/31/2009
| | 1 Year | | 5 Years | | 10 Years or
Life of Fund | | Inception Date | |
Class A (NAV) | | 47.58 | % | 5.40 | % | 5.95 | % | 06/14/1985 | |
Class A (POP) | | 40.83 | % | 4.37 | % | 5.44 | % | 06/14/1985 | |
BofA Merrill Lynch U.S. High Yield, Cash Pay* | | 48.05 | % | 5.92 | % | 6.53 | % | 06/14/1985 | |
Class B (NAV) | | 46.69 | % | 4.62 | % | 5.39 | % | 10/01/1995 | |
Class B (POP) | | 41.69 | % | 4.47 | % | 5.39 | % | 10/01/1995 | |
Class C (NAV) | | 46.63 | % | 4.66 | % | 7.23 | % | 11/11/2002 | |
Class C (POP) | | 45.63 | % | 4.66 | % | 7.23 | % | 11/11/2002 | |
Class I (NAV) | | 48.39 | % | N/A | | 5.89 | % | 11/08/2004 | |
NOTES
* The Bank of America Merrill Lynch U.S. High Yield, Cash Pay (“BofA Merrill Lynch U.S. High Yield, Cash Pay”) Index is an unmanaged index used as a general measure of market performance. Calculations assume dividends and capital gains are reinvested and do not include any managerial expenses. 10 Years or Life of fund calculation is based on life of Class A shares. You cannot invest directly in an index.
The performance data presented represents past performance; future results may vary. Performance data does not reflect the deduction of taxes that would be paid on fund distributions or the redemption of fund shares. Investment return and principal value will fluctuate so that an investor’s shares, when redeemed, may be worth more or less than their original cost. Current performance may be lower or higher than performance quoted. Please see www.transamericafunds.com for performance data current to the most recent month-end. Net Asset Value (NAV) returns include the reinvestment of dividends and capital gains but do not reflect any sales charges. Public Offering Price (POP) returns include the reinvestment of dividends and capital gains and reflect the maximum sales charge of 4.75% for A shares or the maximum applicable contingent deferred sales charge (5% in the 1st year, decreasing to 0% after 6 years) for Class B shares and 1% (during the first 12 months) for Class C shares. Shares purchased prior to March 1, 2004 are subject to a maximum applicable contingent deferred sales charge (5% in the 1st year, decreasing to 0% after 7 years) for Class B shares and (2% in the 1st year, decreasing to 0% after 2 years) for Class C shares. Net Asset Value (NAV) returns include the reinvestment of dividends and capital gains but do not reflect any sales charges.
Performance figures may reflect fee waivers and/or expense reimbursements by the Investment Adviser. Without such waivers and/or reimbursements, the performance would be lower. Future waivers and/or reimbursements are at the discretion of the Investment Adviser.
Investments in high-yield bonds (“junk bonds”) may be subject to greater volatility and risks as the income derived from these securities is not guaranteed and may be unpredictable. This material must be preceded or accompanied by a current prospectus, which includes specific contents regarding the investment objectives and policies of this fund.
12
Transamerica Legg Mason Partners All Cap
(unaudited)
MARKET ENVIRONMENT
The market conditions during the fiscal year ending October 31, 2009 are best described as a rollercoaster ride. The financial and credit crises struck early in the fiscal year which required hundreds of billions of dollars from the government to be injected into the banking and financial system to prevent large, destabilizing bankruptcies. As a result, the stock markets, both in the U.S. and abroad, went into tailspins. The U.S. stock market traced out lows in October and late November of 2008 and a final one in early March of this year.
In addition to massive injections of money into the financial systems, the new Administration in Washington passed legislation that also added $787 billion of stimulus to the overall economy. However, much of this stimulus will hit in 2010-2011 and so it is unclear what the effects have been this year.
It is fair to say that many stock prices in early 2009 reached levels that can only be described as mouth-watering. At the same time, the combination of cash (money market funds) and near cash (CD’s, savings accounts) totaled more than 100% of the value of all U.S. stocks, a historically high figure. This happened even though the return on short term funds was essentially zero, a measure of the fear in place earlier this year.
First quarter 2009 U.S. gross domestic product (“GDP”) declined at an approximate 6% annual rate and improved to approximately -1% in the June quarter. The combination of less bad economic news and ample liquidity caused stocks to rise dramatically. From the March ninth low through the end of the third calendar quarter, stocks, as measured by the S&P 500 Index, rallied approximately 57%.
With the dramatic market sell off in the first calendar quarter of 2009, we began to take a more offensive position with the portfolio, increasing our exposure to early cycle sectors trading at deep discounts to fair value. Historically, early cycle sectors such as consumer discretionary, industrials, financials, technology, energy and materials have been the first to anticipate a recovery.
PERFORMANCE
For the year ended October 31, 2009, Transamerica Legg Mason Partners All Cap Class A returned 13.19%. By comparison, its benchmark, the Russell 3000® Index, returned 10.83%.
STRATEGY REVIEW
For the fiscal year ending October 31, 2009, the Transamerica Legg Mason Partners All Cap (Class A) portfolio returned +13.19%, excluding the effects of sales charges, outperforming the Russell 3000® Index, which returned +10.83%.
For the fiscal year, the Information Technology (+8.05%) and Consumer Discretionary (+2.80%) sectors were the largest contributors to absolute performance while Industrials (+0.03%) and Materials (+0.06%) sectors contributed the least to absolute performance.
The top stock contributors to Portfolio performance during the fiscal year were Samsung Electronics Co. Ltd — GDR (+1.95%), Franklin Resources Inc. (+1.37%), McDermott International Inc. (+1.23%), Wyeth (+1.20%), and Anadarko Petroleum Corp. (+1.01%). The largest detractors from performance were Raytheon Co. (-1.38%), Bank of America Corp. (-0.95%), Abbott Laboratories (-0.84%), General Electric Co. (-0.69%), and Synovus Financial Corp. (-0.56%).
The top 10 holdings for the Portfolio as of October 31, 2009 were: Samsung Electronics Co. Ltd. — GDR (3.81%), JPMorgan Chase & Co. (3.50%), Safeway Inc. (3.30%), Franklin Resources Inc. (2.95%), Bank of America Corp. (2.86%), Cisco Systems Inc. (2.73%), Microsoft Corp. (2.62%), Texas Instruments Inc. (2.60%), Novartis AG — ADS (2.56%), and Applied Materials Inc. (2.51%).
The largest five sectors for the Portfolio as of October 31, 2009 were: Information Technology (21.18%), Financials (17.67%), Energy (15.85%), Industrials (13.50%), and Consumer Discretionary (8.89%).
John J. Goode
Peter J. Hable
Co-Portfolio Managers
ClearBridge Advisors, LLC
13
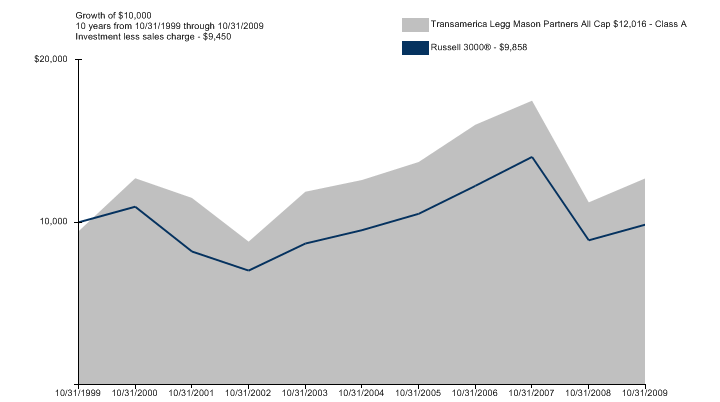
Average Annual Total Return for Periods Ended 10/31/2009
| | 1 Year | | 5 Years | | 10 Years or
Life of Fund | | Inception Date | |
Class A (NAV) | | 13.19 | % | 0.16 | % | 3.01 | % | 03/01/1999 | |
Class A (POP) | | 6.97 | % | (0.96 | )% | 2.43 | % | 03/01/1999 | |
Russell 3000®* | | 10.83 | % | 0.71 | % | (0.14 | )% | 03/01/1999 | |
Class B (NAV) | | 12.38 | % | (0.53 | )% | 2.45 | % | 03/01/1999 | |
Class B (POP) | | 7.38 | % | (0.67 | )% | 2.45 | % | 03/01/1999 | |
Class C (NAV) | | 12.35 | % | (0.48 | )% | 4.48 | % | 11/11/2002 | |
Class C (POP) | | 11.35 | % | (0.48 | )% | 4.48 | % | 11/11/2002 | |
NOTES
* The Russell 3000® (“Russell 3000®”) Index is an unmanaged index used as a general measure of market performance. Calculations assume dividends and capital gains are reinvested and do not include any managerial expenses. 10 Years or Life of fund calculation is based on life of Class A shares. You cannot invest directly in an index.
The performance data presented represents past performance; future results may vary. Performance data does not reflect the deduction of taxes that would be paid on fund distributions or the redemption of fund shares. Investment return and principal value will fluctuate so that an investor’s shares, when redeemed, may be worth more or less than their original cost. Current performance may be lower or higher than performance quoted. Please see www.transamericafunds.com for performance data current to the most recent month-end. Net Asset Value (NAV) returns include the reinvestment of dividends and capital gains but do not reflect any sales charges. Public Offering Price (POP) returns include the reinvestment of dividends and capital gains and reflect the maximum sales charge of 5.5% for A shares or the maximum applicable contingent deferred sales charge (5% in the 1st year, decreasing to 0% after 6 years) for Class B shares and 1% (during the first 12 months) for Class C shares. Shares purchased prior to March 1, 2004 are subject to a maximum applicable contingent deferred sales charge (5% in the 1st year, decreasing to 0% after 7 years) for Class B shares and (2% in the 1st year, decreasing to 0% after 2 years) for Class C shares. Net Asset Value (NAV) returns include the reinvestment of dividends and capital gains but do not reflect any sales charges.
Performance figures may reflect fee waivers and/or expense reimbursements by the Investment Adviser. Without such waivers and/or reimbursements, the performance would be lower. Future waivers and/or reimbursements are at the discretion of the Investment Adviser.
The Fund is non-diversified. Investments in a “non-diversified” fund may be subject to specific risks such as susceptibility to single economic, political or regulatory events and may be subject to greater loss than investments in a diversified fund. This material must be preceded or accompanied by a current prospectus, which includes specific contents regarding the investment objectives and policies of this fund.
14
Transamerica Science & Technology
(unaudited)
MARKET ENVIRONMENT
During the 12 months ended October 31, 2009, equity markets experienced tremendous volatility as they grappled with a global economic slowdown and the repercussions from the collapse of the credit markets.
U.S. equity markets began the period with a freefall precipitated by concerns that corporate earnings would be eroded by tight lending standards, sharply reduced global liquidity, a deepening U.S. recession and slower economic growth elsewhere. Investors retreated from U.S. stock markets, despite extraordinary efforts by the U.S. government and Treasury to restore order in the financial system and reinvigorate the economy. The arsenal deployed in this effort included near-zero interest rates and more than a dozen programs meant to stabilize the housing market; infuse liquidity into the credit markets; jump-start consumer spending; or provide financing to the largest financial institutions.
The government’s massive efforts yielded modest success by March, when bellwether banks showed first signs of stabilization, and gained traction thereafter. Amid signs that the immediate danger to the banking system had passed, U.S. equity markets began a vigorous — albeit volatile — rebound, ending the period modestly higher.
We believe the U.S. recession ended in mid-2009. The decline in housing prices moderated after April, and existing home sales rose during the summer, aided by a federal first-time homebuyer tax credit. Other federal stimulus programs helped loosen credit markets, affording businesses better access to funding for new projects and rebuilding inventories. Additionally, U.S. economic growth was positive for third quarter 2009. Although unemployment remains elevated, consumer sentiment, business activity and corporate earnings showed improvements by period-end.
PERFORMANCE
For the year ended October 31, 2009, Transamerica Science & Technology Class A returned 25.70%. By comparison, its benchmark, the Dow Jones U.S. Technology Index, returned 32.53%.
STRATEGY REVIEW
Transamerica Science & Technology generally invests in companies that rely extensively on technology in their product development or operations and have benefited from technological progress or have enabled such progress in others, with a particular focus on companies in developing segments of the sector.
During the fiscal year, the fund — while posting double-digit returns — underperformed its benchmark. Positive relative performance was attributable primarily to overweighting the consumer discretionary sector and top-performing healthcare sector. Also contributing to performance was our security selection in the information technology sector, specifically, Data Domain and Salesforce.com.
Data storage deduplication provider Data Domain benefited earlier in the year as a bidding war for the company erupted between rival suitors. EMC Corp. bought Data Domain in July, and we sold our position to realize the price gain from the acquisition.
Salesforce.com, a leader in customer relationship management (“CRM”) and cloud computing, has a unique business model that incorporates easy-to-use, productivity-enhancing software along with service. The company offers variability with user costs, and the return on investment is typically less than 12 months. Therefore, numerous companies moved forward with CRM purchases despite a pullback in many areas of capital spending.
Key performance detractors included overweighting and security selection in the telecommunications service sector. Individual healthcare holdings NuVasive, Inc. and Gilead Sciences, Inc. also detracted from performance. NuVasive is a medical device company focused on the design and development of products for the surgical treatment of spine disorders. It suffered during the period from uncertainty surrounding healthcare reform and its impact on hospital budgets and capital expenditures. Gilead Sciences, a biopharmaceutical company whose primary drugs are Truvada and Atripla (for the treatment of HIV-1 in adults), saw substantial growth during the period. However, it suffered from investors’ interest in more cyclical growth stocks that hold greater appeal during post-recession recoveries. We continue to hold this position and believe in Gilead’s long-term growth potential.
Kirk J. Kim
Joshua D. Shaskan, CFA
Jeffrey J. Hoo, CFA
Erik U. Rollé
Co-Portfolio Managers
Transamerica Investment Management, LLC
15
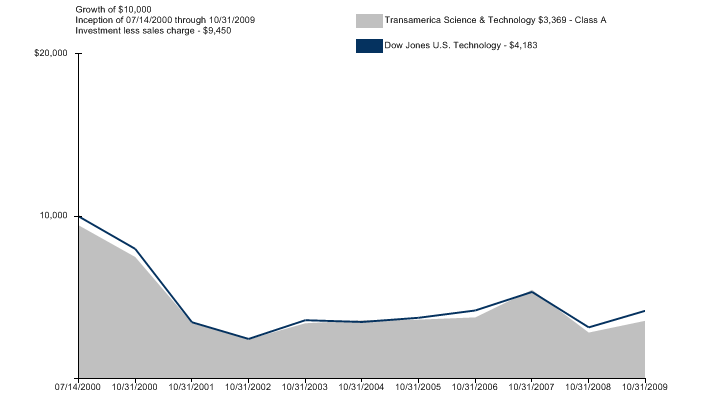
Average Annual Total Return for Periods Ended 10/31/2009
| | 1 Year | | 5 Years | | 10 Years or
Life of Fund | | Inception Date | |
Class A (NAV) | | 25.70 | % | (0.15 | )% | (9.95 | )% | 07/14/2000 | |
Class A (POP) | | 18.60 | % | (1.27 | )% | (10.50 | )% | 07/14/2000 | |
Dow Jones U.S. Technology* | | 32.53 | % | 3.69 | % | (8.95 | )% | 07/14/2000 | |
Class B (NAV) | | 25.00 | % | (0.87 | )% | (10.52 | )% | 07/14/2000 | |
Class B (POP) | | 20.00 | % | (1.06 | )% | (10.52 | )% | 07/14/2000 | |
Class C (NAV) | | 25.00 | % | (0.81 | )% | 5.35 | % | 11/11/2002 | |
Class C (POP) | | 24.00 | % | (0.81 | )% | 5.35 | % | 11/11/2002 | |
Class I (NAV) | | 26.64 | % | N/A | | (0.91 | )% | 11/15/2005 | |
NOTES
* The Dow Jones U.S. Technology (“Dow Jones U.S. Technology”) Index is an unmanaged index used as a general measure of market performance. Calculations assume dividends and capital gains are reinvested and do not include any managerial expenses. 10 Years or Life of fund calculation is based on life of Class A shares. You cannot invest directly in an index.
The performance data presented represents past performance; future results may vary. Performance data does not reflect the deduction of taxes that would be paid on fund distributions or the redemption of fund shares. Investment return and principal value will fluctuate so that an investor’s shares, when redeemed, may be worth more or less than their original cost. Current performance may be lower or higher than performance quoted. Please see www.transamericafunds.com for performance data current to the most recent month-end. Net Asset Value (NAV) returns include the reinvestment of dividends and capital gains but do not reflect any sales charges. Public Offering Price (POP) returns include the reinvestment of dividends and capital gains and reflect the maximum sales charge of 5.5% for A shares or the maximum applicable contingent deferred sales charge (5% in the 1st year, decreasing to 0% after 6 years) for Class B shares and 1% (during the first 12 months) for Class C shares. Shares purchased prior to March 1, 2004 are subject to a maximum applicable contingent deferred sales charge (5% in the 1st year, decreasing to 0% after 7 years) for Class B shares and (2% in the 1st year, decreasing to 0% after 2 years) for Class C shares. Net Asset Value (NAV) returns include the reinvestment of dividends and capital gains but do not reflect any sales charges.
Performance figures may reflect fee waivers and/or expense reimbursements by the Investment Adviser. Without such waivers and/or reimbursements, the performance would be lower. Future waivers and/or reimbursements are at the discretion of the Investment Adviser.
Investing in technology stocks generally involves greater volatility and risks, so an investment in the Fund may not be appropriate for everyone. The Fund is non-diversified. Investments in a “non-diversified” fund may be subject to specific risks such as susceptibility to single economic, political or regulatory events, and may be subject to greater loss than investments in a diversified fund. This material must be preceded or accompanied by a current prospectus, which includes specific contents regarding the investment objectives and policies of this fund.
16
Transamerica Short-Term Bond
(unaudited)
MARKET ENVIRONMENT
During most of the 12 months ended October 31, 2009, U.S. fixed income markets experienced the strongest rally in many decades.
Early in the reporting period, fixed income markets grappled with the repercussions of the financial crisis that began with the collapse of the subprime mortgage market in 2007. By September 2008, the crisis had shuttered a preeminent investment bank (Lehman Brothers). Other banks responded by further tightening already stringent lending standards.
With liquidity greatly reduced and the U.S. economy mired in recession, a dislocation of near-historic proportions occurred in the fixed income markets. Demand for the relative safety of U.S. Treasuries escalated sharply, pushing yields down to near zero. Meanwhile, prices for non-Treasury securities fell, and yields, which move in opposition to prices, rose. The gap between the yields of Treasuries and other securities (i.e., yield spreads) widened, in some cases to levels not seen since the Great Depression. This was especially true in corporate bonds; concerns about businesses’ ability to obtain financing and maintain profitability drove yields for both investment-grade and non-investment grade bonds to double-digit levels. Yields on short-term corporate bonds were particularly attractive — in some instances, close or equal to that of a company’s long-term debt.
Market conditions began to stabilize early in 2009 after aggressive and unprecedented efforts by the U.S. government to restore order and confidence to the financial system and reinvigorate the economy began to take hold. The arsenal deployed in this effort included reduction of the federal funds rate (from 1.0% to near 0%) and more than a dozen programs meant to stabilize the housing market; provide a liquidity backstop to high-quality corporations; jump-start consumer spending; and provide financing and capital to financial institutions. An early beneficiary of these programs was agency mortgage-backed securities (“MBS”). The government effectively took over the issuing agencies and manipulated mortgage rates lower through large-scale purchases of agency MBS.
As the period progressed, the massive government initiatives loosened up credit markets, affording businesses better access to funding for new projects, continuing operations and debt refinancing. Consumer spending modestly rebounded, the U.S. housing market showed initial signs of stabilization, and the U.S. recession ended. Although unemployment remained elevated, consumer sentiment, business activity and corporate earnings showed improvements. By October, credit spreads had narrowed, and credit yield curves were migrating toward a more normal (i.e., upward-sloping) configuration. For the full 12 months, the corporate and mortgage sectors outperformed Treasuries.
PERFORMANCE
For the year ended October 31, 2009, Transamerica Short-Term Bond Class I returned 14.44%. By comparison, its benchmark, the Bank of America Merrill Lynch U.S. Corporate & Government 1-3 Yrs Index, returned 6.36%.
STRATEGY REVIEW
Transamerica Short-Term Bond maintained a higher yield, and achieved a higher total return, than the benchmark index due to our overweighting of mortgage-related and corporate securities throughout much of the period.
Early in the period, we invested approximately 30% of net assets in agency MBS. Both the government’s implied guarantee and the federal programs designed to manipulate mortgage rates lower helped to make these securities attractive. Later, as agency MBS became fully valued and the outlook for the economy, housing and corporate profits brightened, we shifted our focus to highly enhanced MBS issued by private lenders (rather than the federal agencies) and short-term corporate securities.
Within the corporate sector, we consistently underweighted industries most sensitive to the credit crisis and weak economy — such as homebuilders, consumer cyclicals and autos — while overweighting defensive industries such as consumer staples and utilities.
Also contributing to the fund’s outperformance was a small but strategic investment in commercial MBS — most notably, cell phone towers. Unlike commercial buildings, demand for cell phone towers was not impacted greatly by the recession.
Throughout the period, we maintained a shorter-than-index duration (i.e., sensitivity to interest-rate movements) for the portfolio. This modestly detracted from performance, but the impact was more than offset by the fund’s sector exposures.
Greg D. Haendel, CFA
Derek S. Brown, CFA
Co-Portfolio Managers
Transamerica Investment Management, LLC
17

Average Annual Total Return for Periods Ended 10/31/2009
| | 1 Year | | 10 Years or
Life of Fund | | Inception Date | |
Class I (NAV) | | 14.44 | % | 4.45 | % | 11/08/2004 | |
BofA Merrill Lynch U.S. Corporate & Government, 1-3 Yrs* | | 6.36 | % | 4.30 | % | 11/08/2004 | |
Class A (NAV) | | 14.07 | % | 5.89 | % | 11/01/2007 | |
Class A (POP) | | 11.24 | % | 4.54 | % | 11/01/2007 | |
Class C (NAV) | | 13.31 | % | 5.15 | % | 11/01/2007 | |
Class C (POP) | | 12.31 | % | 5.15 | % | 11/01/2007 | |
NOTES
* The Bank of America Merrill Lynch U.S. Corporate & Government, 1-3 Yrs (“BofA Merrill Lynch U.S. Corporate & Government, 1-3 Yrs “) Index is an unmanaged index used as a general measure of market performance. Calculations assume dividends and capital gains are reinvested and do not include any managerial expenses. 10 Years or Life of Fund calculation is based on life of Class I shares. You cannot invest directly in an index.
The performance data presented represents past performance; future results may vary. Performance data does not reflect the deduction of taxes that would be paid on fund distributions or the redemption of fund shares. Investment return and principal value will fluctuate so that an investor’s shares, when redeemed, may be worth more or less than their original cost. Current performance may be lower or higher than performance quoted. Please see www.transamericafunds.com for performance data current to the most recent month-end. Net Asset Value (NAV) returns include the reinvestment of dividends and capital gains but do not reflect any sales charges. Public Offering Price (POP) returns include the reinvestment of dividends and capital gains and reflect the maximum sales charge of 2.5% for A shares or the maximum applicable contingent deferred sales charge and 1% (during the first 12 months) for Class C shares. Net Asset Value (NAV) returns include the reinvestment of dividends and capital gains but do not reflect any sales charges. Net Asset Value (NAV) returns include the reinvestment of dividends and capital gains but do not reflect any sales charges.
Performance figures may reflect fee waivers and/or expense reimbursements by the Investment Adviser. Without such waivers and/or reimbursements, the performance would be lower. Future waivers and/or reimbursements are at the discretion of the Investment Adviser.
This material must be preceded or accompanied by a current prospectus, which includes specific contents regarding the investment objectives and policies of this fund.
18
Transamerica Small/Mid Cap Value
(unaudited)
MARKET ENVIRONMENT
During the 12 months ended October 31, 2009, equity markets experienced tremendous volatility as they grappled with, and then overcame, a global economic slowdown and the repercussions from the collapse of the credit markets.
U.S. equity markets began the period with a freefall precipitated by concerns that corporate earnings would be eroded by tight lending standards, sharply reduced global liquidity, a deepening U.S. recession and slower economic growth elsewhere. Investors retreated from U.S. stock markets, despite extraordinary efforts by the U.S. government and Treasury to restore order in the financial system and reinvigorate the economy. The arsenal deployed in this effort included near-zero interest rates and more than a dozen programs meant to stabilize the housing market; infuse liquidity into the credit markets; jump-start consumer spending; or provide financing to the largest financial institutions.
The government’s massive efforts yielded modest success by March, when bellwether banks showed first signs of stabilization, and gained traction thereafter. Amid signs that the immediate danger to the banking system had passed, U.S. equity markets began a vigorous — albeit volatile — rebound, ending the period with double-digit gains.
We believe the U.S. recession ended in mid-2009. The decline in housing prices moderated after April, and existing home sales rose during the summer, aided by a federal first-time homebuyer tax credit. Other federal stimulus programs helped loosen credit markets, affording businesses better access to funding for new projects and rebuilding inventories. Additionally, U.S. economic growth for third quarter 2009 was positive. Although unemployment remains elevated, consumer sentiment, business activity and corporate earnings showed improvements by period-end.
PERFORMANCE
For the year ended October 31, 2009, Transamerica Small/Mid Cap Value Class A returned 19.12%. By comparison, its benchmark, the Russell 2500® Value Index, returned 8.55%.
STRATEGY REVIEW
Entering 2009, management had positioned the fund in expectation of a rebound among certain segments of the economy and market in the latter half of the year. The rebound occurred more quickly than anticipated, effectively “fast-forwarding” the fund’s gains and contributing to outperformance vs. its benchmark for the fiscal year.
During the summer, while the fund continued to benefit from the market’s rebound, management took profits to reinvest in new or newer holdings it expects to show strength through late 2010 and in to 2011.
Stock selection in the auto & transportation and financial services sectors was the primary contributor to positive relative performance during the period. Top contributors included Tenneco Inc., a producer of emission control products for the auto industry. Despite a virtual shutdown in auto production earlier in the year, Tenneco’s stock price increased as management successfully steered the company through the downturn and subsequent resurgence in U.S. auto manufacturing. Following strong outperformance through late summer, we sold the position to leverage other opportunities.
Another top contributor was individual holding Allscripts-Misys Healthcare Solutions, Inc., which provides software, services, information and connectivity solutions to physicians and other healthcare providers. Allscripts benefitted during the period from the government’s support of health information technology, such as electronic medical records.
Detracting from relative performance was stock selection in the materials & processing and consumer staples sectors. Also, individual holdings FTI Consulting, Inc. and Harmonic Inc. were performance detractors. FTI Consulting, a business advisory company, performed well early in the period as many businesses required consulting services for financial restructuring. In the mid to latter part of the fiscal year, FTI’s stock price declined as economic and credit conditions improved and its other, more cyclical businesses detracted from its restructuring/bankruptcy business. Video delivery solutions company Harmonic Inc. experienced lower relative performance resulting from investor speculation that cable companies will decrease capital expenditures in 2010. However, we continue to hold this position, which aligns with our belief in the cable infrastructure business.
Joshua D. Shaskan, CFA
Jeffrey J. Hoo, CFA
Thomas E. Larkin, III
Co-Portfolio Managers
Transamerica Investment Management, LLC
19
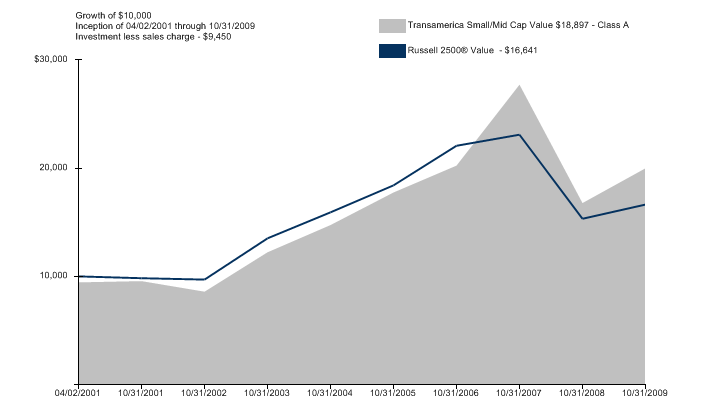
Average Annual Total Return for Periods Ended 10/31/2009
| | 1 Year | | 5 Years | | 10 Years or
Life of Fund | | Inception Date | |
Class A (NAV) | | 19.12 | % | 6.27 | % | 9.12 | % | 04/02/2001 | |
Class A (POP) | | 12.56 | % | 5.08 | % | 8.41 | % | 04/02/2001 | |
Russell 2500® Value* | | 8.55 | % | 0.88 | % | 6.11 | % | 04/02/2001 | |
Class B (NAV) | | 18.37 | % | 5.53 | % | 8.44 | % | 04/02/2001 | |
Class B (POP) | | 13.37 | % | 5.37 | % | 8.44 | % | 04/02/2001 | |
Class C (NAV) | | 18.42 | % | 5.55 | % | 12.09 | % | 11/11/2002 | |
Class C (POP) | | 17.42 | % | 5.55 | % | 12.09 | % | 11/11/2002 | |
Class I (NAV) | | 19.85 | % | N/A | | 3.36 | % | 11/15/2005 | |
NOTES
* The Russell 2500® Value (“Russell 2500® Value”) Index is an unmanaged index used as a general measure of market performance. Calculations assume dividends and capital gains are reinvested and do not include any managerial expenses. The 10 Years or Life of Fund calculation is based on life of Class A shares. You cannot invest directly in an index.
The performance data presented represents past performance; future results may vary. Performance data does not reflect the deduction of taxes that would be paid on fund distributions or the redemption of fund shares. Investment return and principal value will fluctuate so that an investor’s shares, when redeemed, may be worth more or less than their original cost. Current performance may be lower or higher than performance quoted. Please see www.transamericafunds.com for performance data current to the most recent month-end. Net Asset Value (NAV) returns include the reinvestment of dividends and capital gains but do not reflect any sales charges. Public Offering Price (POP) returns include the reinvestment of dividends and capital gains and reflect the maximum sales charge of 5.5% for A shares or the maximum applicable contingent deferred sales charge (5% in the 1st year, decreasing to 0% after 6 years) for Class B shares and 1% (during the first 12 months) for Class C shares. Shares purchased prior to March 1, 2004 are subject to a maximum applicable contingent deferred sales charge (5% in the 1st year, decreasing to 0% after 7 years) for Class B shares and (2% in the 1st year, decreasing to 0% after 2 years) for Class C shares. Net Asset Value (NAV) returns include the reinvestment of dividends and capital gains but do not reflect any sales charges.
Performance figures may reflect fee waivers and/or expense reimbursements by the Investment Adviser. Without such waivers and/or reimbursements, the performance would be lower. Future waivers and/or reimbursements are at the discretion of the Investment Adviser.
Investing in small cap stocks generally involves greater risk and volatility, therefore an investment in the fund may not be appropriate for everyone. This material must be preceded or accompanied by a current prospectus, which includes specific contents regarding the investment objectives and policies of this Fund.
20
Transamerica Templeton Global
(unaudited)
MARKET ENVIRONMENT
Domestic
During the 12 months ended October 31, 2009, global equity markets experienced tremendous volatility as they grappled with a global economic slowdown and the repercussions from the collapse of the credit markets.
U.S. equity markets began the period with a freefall precipitated by tight lending standards, sharply reduced global liquidity, a deepening U.S. recession and slower economic growth elsewhere. Investors retreated from U.S. stock markets, despite efforts by the U.S. government and Treasury to restore order in the financial system and reinvigorate the economy. The arsenal deployed in this effort included near-zero interest rates and more than a dozen programs meant to stabilize the housing market; infuse liquidity into the credit markets; jump-start consumer spending; or provide financing to the largest financial institutions.
The government’s massive efforts yielded modest success by March, when bellwether banks showed first signs of stabilization, and gained traction thereafter. Amid signs that the immediate danger to the banking system had passed, U.S. equity markets began a vigorous — albeit volatile — rebound, ending the period modestly higher.
International
The global economy and equity markets experienced two distinct periods during the 12 months under review. The first period, from November 2008 through mid-March 2009, was marked by a deepening global financial crisis and economic recession, and significant asset value declines amid extreme market volatility. In the second period, the global economy and financial markets began to rebound. Global equities surged from their lowest valuation levels in a quarter century due to massive government monetary and fiscal interventions and some positive economic data.
The review period began in the aftermath of Lehman Brothers’ demise and AIG’s liquidity crisis, when lending ground to a halt. As financial institutions, corporations and consumers rushed to reduce debt, asset prices slumped, deflationary pressures emerged, and the global financial system’s problems spilled over into the real economy. Policymakers around the world responded by slashing interest rates, recapitalizing faltering banks, and otherwise guaranteeing significant portions of the private sector’s collective liabilities.
The aggressive intervention succeeded in rescuing some of the largest banks. Equity valuations were revised upward, and stocks rallied. The U.S. dollar slumped as the flight to safety subsided, underpinning a rebound in commodity prices. Some of the world’s largest economies, including those of the U.S., Japan, France and Germany, returned to growth near the end of the period, largely due to generous incentives and inventory adjustments. Skepticism surrounding the sustainability of some positive economic data and improved corporate earnings appeared partially responsible for increased equity market volatility near period end.
PERFORMANCE
For the year ended October 31, 2009, Transamerica Templeton Global Class A returned 19.24%. By comparison, its benchmark, the Morgan Stanley Capital International World Index, returned 19.21%.
STRATEGY REVIEW
Transamerica Investment Management, LLC
Throughout the period, we adhered to the core tenets of our investment philosophy — seeking companies with proven management, strong cash-flow characteristics and sustainable competitive advantages. Thus, when the market rebound began, the domestic equity portion of Transamerica Templeton Global was positioned in high-quality stocks with strong growth characteristics. In the initial phase of the rebound, still-cautious investors favored quality, and the fund rebounded vigorously. It did not, however, own the smallest constituents of the benchmark, which had fallen out of the fund’s market-cap range as stock prices contracted early on. As investors’ appetite for risk grew, smaller and lower-quality stocks fared best. Regardless, the fund continued to generate gains and, ultimately, outperformed its benchmark with a double-digit return for the period.
We believe the international consumer will be an increasingly important factor in the global economy, and companies moving rapidly into international markets will benefit. Among the fund’s strongest contributors to performance was Amazon.com, which achieved healthy returns by engaging the global consumer.
Another key contributor in the information technology sector was Apple Inc., the maker of consumer-friendly personal electronics. During the period, Apple’s products continued to benefit from worldwide consumers’ desire for technology that provides improved mobile communications and access to information.
Partially offsetting the gains for these and other stocks was our security selection in the healthcare (i.e., Varian Medical Systems, Inc.) and financial services (i.e., The Charles Schwab Corp.) sectors. Varian, a successful developer of technology used to treat cancer through precise radiation procedures, lost ground on fears that cost-conscious hospitals would postpone purchases. Early in the period, Schwab benefitted from a trend among financial advisors to form their own firms and was on the leading edge of providing service and distribution channels for those advisors. More recently, the company experienced a slowdown in its business as consumers shifted from investing to saving. However, we believe this trend will reverse as the market improves, and Schwab stands to gain considerable market share.
Gary U. Rollé, CFA
Portfolio Manager
Transamerica Investment Management, LLC
21
Templeton Investment Counsel, LLC
Stock selection in the consumer discretionary and telecommunication services sectors boosted the portfolio’s relative performance during the reporting period. Stock selection among automobile manufacturers in consumer discretionary contributed significantly to the portfolio largely due to holding BMW and not holding Volkswagen, both based in Germany. Within telecommunications services, Norway’s Telenor performed well. An underweighted allocation to and stock selection in utilities also benefited the portfolio. Conversely, underweightings and stock selection in the materials and financials sectors detracted from relative returns. Within financials, Japanese consumer finance company Promise and Switzerland-based insurance provider ACE hurt relative results. An overweighted allocation and stock selection in health care, particularly a position in Swiss pharmaceutical manufacturer Novartis, also hindered the portfolio’s relative performance.
Geographically, the portfolio’s underweighted allocation to Japan benefited relative performance during the period. Stock selection in the U.K. and our overweighted exposure to Norway also contributed to relative returns. However, the portfolio’s underweighted position in Australia hindered relative performance. Stock selection in France and exposure to the U.S. (not an index component) also detracted from relative results.
The U.S. dollar depreciated versus most foreign currencies for the period, which positively affected the portfolio’s performance because investments in securities with non-U.S. currency exposure increased in value as the dollar weakened. However, one cannot expect the same result in future periods.
Tina Sadler, CFA
Antonio T. Docal, CFA
Gary Motyl, CFA
Co-Portfolio Managers
Templeton Investment Counsel, LLC
22
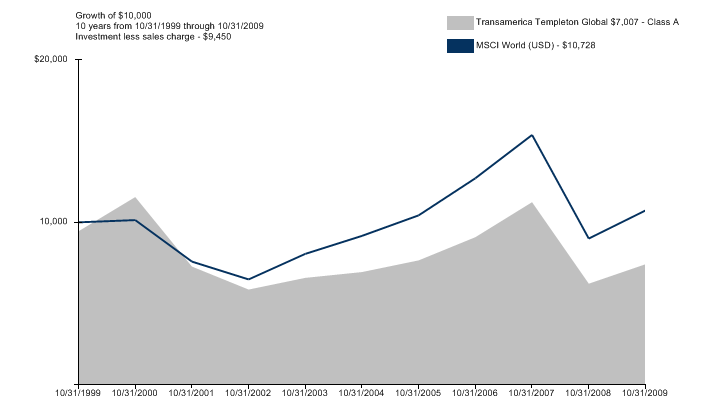
Average Annual Total Return for Periods Ended 10/31/2009
| | 1 Year | | 5 Years | | 10 Years or
Life of Fund | | Inception Date | |
Class A (NAV) | | 19.24 | % | 1.35 | % | (2.39 | )% | 10/01/1992 | |
Class A (POP) | | 12.70 | % | 0.21 | % | (2.95 | )% | 10/01/1992 | |
MSCI World (USD)* | | 19.21 | % | 3.20 | % | 0.71 | % | 10/01/1992 | |
Class B (NAV) | | 18.63 | % | 0.70 | % | (2.93 | )% | 10/01/1995 | |
Class B (POP) | | 13.63 | % | 0.51 | % | (2.93 | )% | 10/01/1995 | |
Class C (NAV) | | 18.34 | % | 0.63 | % | 2.84 | % | 11/11/2002 | |
Class C (POP) | | 17.34 | % | 0.63 | % | 2.84 | % | 11/11/2002 | |
NOTES
* The Morgan Stanley Capital International World (“MSCI World (USD)”) Index is an unmanaged index used as a general measure of market performance. Calculations assume dividends and capital gains are reinvested and do not include any managerial expenses. The 10 Years or Life of Fund calculation is based on life of Class A shares. You cannot invest directly in an index.
The performance data presented represents past performance; future results may vary. Performance data does not reflect the deduction of taxes that would be paid on fund distributions or the redemption of fund shares. Investment return and principal value will fluctuate so that an investor’s shares, when redeemed, may be worth more or less than their original cost. Current performance may be lower or higher than performance quoted. Please see www.transamericafunds.com for performance data current to the most recent month-end. Net Asset Value (NAV) returns include the reinvestment of dividends and capital gains but do not reflect any sales charges. Public Offering Price (POP) returns include the reinvestment of dividends and capital gains and reflect the maximum sales charge of 5.5% for A shares or the maximum applicable contingent deferred sales charge (5% in the 1st year, decreasing to 0% after 6 years) for Class B shares and 1% (during the first 12 months) for Class C shares. Shares purchased prior to March 1, 2004 are subject to a maximum applicable contingent deferred sales charge (5% in the 1st year, decreasing to 0% after 7 years) for Class B shares and (2% in the 1st year, decreasing to 0% after 2 years) for Class C shares. Net Asset Value (NAV) returns include the reinvestment of dividends and capital gains but do not reflect any sales charges.
Performance figures may reflect fee waivers and/or expense reimbursements by the Investment Adviser. Without such waivers and/or reimbursements, the performance would be lower. Future waivers and/or reimbursements are at the discretion of the Investment Adviser.
International investing involves special risks including currency fluctuations, political instability, and different financial accounting standards. This material must be preceded or accompanied by a current prospectus, which includes specific contents regarding the investment objectives and policies of this fund.
23
Transamerica Value Balanced
(unaudited)
MARKET ENVIRONMENT
During the 12 months ended October 31, 2009, securities markets grappled with a global economic slowdown and the repercussions from the collapse of the credit markets before staging powerful rallies.
U.S. equity markets began the period with a freefall precipitated by concerns that corporate earnings would be eroded by tight lending standards, sharply reduced global liquidity, a deepening U.S. recession and slower economic growth elsewhere. Investors retreated from U.S. stock markets, despite extraordinary efforts by the U.S. government and Treasury to restore order in the financial system and reinvigorate the economy. The arsenal deployed in this effort included near-zero interest rates and more than a dozen programs meant to stabilize the housing market, infuse liquidity into the credit markets, jump-start consumer spending, or provide financing to the largest financial institutions.
The government’s massive efforts yielded modest success by March, when bellwether banks showed first signs of stabilization, and gained traction thereafter. Amid signs that the immediate danger to the banking system had passed, U.S. equity markets began a vigorous rebound from the March lows.
In fixed income, greatly reduced liquidity and the ongoing recession caused a dislocation of near-historic proportions. Demand for the relative safety of U.S. Treasuries escalated sharply, pushing yields down to near zero. Meanwhile, yields in riskier asset classes rose dramatically.
As the period progressed and the government’s initiatives took effect in earnest, U.S. fixed income markets rallied impressively. An early beneficiary of the government’s programs was agency mortgage-backed securities (“MBS”). The government effectively took over the issuing agencies and manipulated mortgage rates lower through large-scale purchases of agency MBS. Corporates also did well, outperforming Treasuries.
By third quarter 2009, U.S. economic growth turned positive. The decline in housing prices moderated after April, and existing home sales rose during the summer, aided by a federal first-time homebuyer tax credit. Other federal stimulus programs helped loosen credit markets, affording businesses better access to funding for new projects and rebuilding inventories. Although unemployment remains elevated, consumer sentiment, business activity and corporate earnings showed improvements by period-end.
PERFORMANCE
For the year ended October 31, 2009, Transamerica Value Balanced Class A returned 12.10%. By comparison, its primary and secondary benchmarks, the Russell 1000® Value Index and the Barclays Capital Aggregate U.S. Bond Index, returned 4.78% and 13.79%, respectively.
STRATEGY REVIEW
During the period, relative outperformance for the equity segment of Transamerica Value Balanced was attributable to underweighting the weaker-performing financial services sector; and overweighting and stock selection in the materials & processing and other energy sectors.
BlackRock, Inc. — a global investment management, risk management and advisory services firm — was as top contributor. It is considered a fixed income industry leader and benefited during a period of favor for fixed income strategies. Our position in Brazil’s largest iron ore miner — Vale SA — also contributed to performance. Vale saw tremendous demand for iron ore, which is used to manufacture steel, in emerging markets such as China and India.
Stock selection in the technology, consumer discretionary and integrated oils sectors detracted from performance. Transocean Ltd., the world’s largest offshore drilling contractor, was the biggest portfolio detractor. It suffered from a significant drop in oil prices early in the fiscal year. Because Transocean’s revenues are highly correlated to oil prices, the company’s stock underperformed as oil prices declined. We sold the position. Bank of America continued to struggle through the aftermath of the credit meltdown and the challenging integration of Merrill Lynch, which it acquired in 2008 in the midst of a deep recession. We sold this position in favor of other financial services holdings.
On the fixed income side, strong performance was primarily the result of overweighting mortgage-related and corporate securities. Also contributing to performance was a small but strategic investment in commercial MBS — most notably, cell-phone towers. Unlike commercial buildings, demand for cell-phone towers was not impacted greatly by the recession. During the period, our shorter-than-index duration modestly detracted from performance, but the impact was more than offset by the fund’s sector exposures.
John J. Huber, CFA
Greg D. Haendel, CFA
Derek S. Brown, CFA
Scott L. Dinsdale, CFA
Kirk R. Feldhus
Brian W. Westhoff, CFA
Co-Portfolio Managers
Transamerica Investment Management, LLC
24
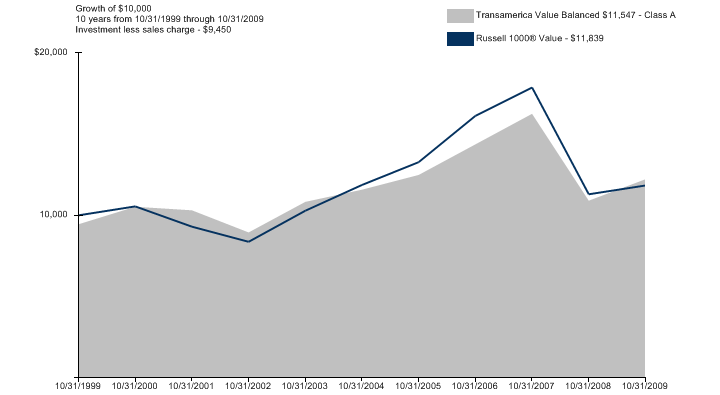
Average Annual Total Return for Periods Ended 10/31/2009
| | 1 Year | | 5 Years | | 10 Years or
Life of Fund | | Inception Date | |
Class A (NAV) | | 12.10 | % | 1.08 | % | 2.61 | % | 10/01/1995 | |
Class A (POP) | | 5.92 | % | (0.05 | )% | 2.02 | % | 10/01/1995 | |
Russell 1000® Value* | | 4.78 | % | (0.05 | )% | 1.70 | % | 10/01/1995 | |
Barclays Capital U.S. Aggregate Bond* | | 13.79 | % | 5.05 | % | 6.31 | % | 10/01/1995 | |
Class B (NAV) | | 11.38 | % | 0.42 | % | 2.06 | % | 10/01/1995 | |
Class B (POP) | | 6.38 | % | 0.26 | % | 2.06 | % | 10/01/1995 | |
Class C (NAV) | | 11.43 | % | 0.47 | % | 3.86 | % | 11/11/2002 | |
Class C (POP) | | 10.43 | % | 0.47 | % | 3.86 | % | 11/11/2002 | |
NOTES
* The Russell 1000® Value (“Russell 1000® Value”) Index and the Barclays Capital U.S. Aggregate Bond (“Barclays Capital U.S. Aggregate Bond”) Index are unmanaged indices used as a general measure of market performance. Calculations assume dividends and capital gains are reinvested and do not include any managerial expenses. 10 Years or Life of Fund calculation is based on life of Class A shares. You cannot invest directly in an index.
The performance data presented represents past performance; future results may vary. Performance data does not reflect the deduction of taxes that would be paid on fund distributions or the redemption of fund shares. Investment return and principal value will fluctuate so that an investor’s shares, when redeemed, may be worth more or less than their original cost. Current performance may be lower or higher than performance quoted. Please see www.transamericafunds.com for performance data current to the most recent month-end. Net Asset Value (NAV) returns include the reinvestment of dividends and capital gains but do not reflect any sales charges. Public Offering Price (POP) returns include the reinvestment of dividends and capital gains and reflect the maximum sales charge of 5.5% for A shares or the maximum applicable contingent deferred sales charge (5% in the 1st year, decreasing to 0% after 6 years) for Class B shares and 1% (during the first 12 months) for Class C shares. Shares purchased prior to March 1, 2004 are subject to a maximum applicable contingent deferred sales charge (5% in the 1st year, decreasing to 0% after 7 years) for Class B shares and (2% in the 1st year, decreasing to 0% after 2 years) for Class C shares. Net Asset Value (NAV) returns include the reinvestment of dividends and capital gains but do not reflect any sales charges.
Performance figures may reflect fee waivers and/or expense reimbursements by the Investment Adviser. Without such waivers and/or reimbursements, the performance would be lower. Future waivers and/or reimbursements are at the discretion of the Investment Adviser.
This material must be preceded or accompanied by a current prospectus, which includes specific contents regarding the investment objectives and policies of this fund.
25
Understanding Your Funds’ Expenses
(unaudited)
SHAREHOLDER EXPENSES
Fund shareholders may incur two types of costs: (1) transaction costs, including sales charges (loads) on purchases, contingent deferred sales charges on redemptions and redemption fees; and (2) ongoing costs, including management fees, dividend expense on short-sales, and other fund expenses.
The following examples are intended to help you understand your ongoing costs (in dollars and cents) of investing in the funds and to compare these costs with the ongoing costs of investing in other funds.
The examples are based on an investment of $1,000 invested at May 1, 2009 and held for the entire period until October 31, 2009.
ACTUAL EXPENSES
The information in the table under the heading “Actual Expenses” provides information about actual account values and actual expenses. You may use the information in these columns, together with the amount you invested, to estimate the expenses that you paid over the period. Simply divide your account value by $1,000 (for example, an $8,600 account value divided by $1,000 = $8.60), then multiply the result by the number in the appropriate column for your share class titled “Expenses Paid During Period” to estimate the expenses you paid on your account during this period. If your account is an IRA, your expenses could have included a $15 annual fee. The amount of any fee paid through your account would increase the estimate of expenses you paid during the period and decrease your ending account value.
HYPOTHETICAL EXAMPLES FOR COMPARISON PURPOSES
The information in the table under the heading “Hypothetical Expenses” provides information about hypothetical account values and hypothetical expenses based on the funds’ actual expense ratios and an assumed rate of return of 5% per year before expenses, which are not the funds’ actual returns. The hypothetical account values and expenses may not be used to estimate the actual ending account balance or expenses you paid for the period. You may use this information to compare the ongoing costs of investing in your funds and other funds. To do so, compare this 5% hypothetical example with the 5% hypothetical examples that appear in the shareholder reports of the other funds. As in the case of the actual expense example, if your account is subject to an IRA fee, the amount of the fee paid through your account would increase the hypothetical expenses you would have paid during the period and decrease the hypothetical ending account value.
Please note that the expenses shown in the table are meant to highlight your ongoing costs only and do not reflect any transactional costs. Therefore, the information under the heading “Hypothetical Expenses” is useful in comparing ongoing costs only, and will not help you determine the relative total costs of owning different funds. In addition, if these transactional costs were included, your costs would have been higher. The expenses shown in the table do not reflect any fees that may be charged to you by brokers, financial intermediaries or other financial institutions.
Expense ratios may vary period to period because of various factors, such as an increase in expenses that are not covered by the advisory and administrative fees such as fees and expenses of the trustees and their counsel, extraordinary expenses and interest expense.
| | | | Actual Expenses | | Hypothetical Expenses (b) | | | |
Fund Name | | Beginning
Account Value | | Ending Account
Value | | Expenses Paid
During Period (a) | | Ending Account
Value | | Expenses Paid
During Period (a) | | Annualized
Expense Ratio | |
Transamerica Balanced | | | | | | | | | | | | | |
Class A | | $ | 1,000.00 | | $ | 1,145.70 | | $ | 9.41 | | $ | 1,016.43 | | $ | 8.84 | | 1.74 | % |
Class B | | 1,000.00 | | 1,142.30 | | 13.34 | | 1,012.75 | | 12.53 | | 2.47 | |
Class C | | 1,000.00 | | 1,142.60 | | 12.21 | | 1,013.81 | | 11.47 | | 2.26 | |
| | | | | | | | | | | | | |
Transamerica Convertible Securities | | | | | | | | | | | | | |
Class A | | 1,000.00 | | 1,180.00 | | 8.30 | | 1,017.59 | | 7.68 | | 1.51 | |
Class B | | 1,000.00 | | 1,176.00 | | 12.40 | | 1,013.81 | | 11.47 | | 2.26 | |
Class C | | 1,000.00 | | 1,176.10 | | 11.68 | | 1,014.47 | | 10.82 | | 2.13 | |
Class I | | 1,000.00 | | 1,183.20 | | 5.56 | | 1,020.11 | | 5.14 | | 1.01 | |
| | | | | | | | | | | | | |
Transamerica Equity | | | | | | | | | | | | | |
Class A | | 1,000.00 | | 1,152.90 | | 8.25 | | 1,017.54 | | 7.73 | | 1.52 | |
Class B | | 1,000.00 | | 1,149.20 | | 11.76 | | 1,014.27 | | 11.02 | | 2.17 | |
Class C | | 1,000.00 | | 1,148.40 | | 11.75 | | 1,014.27 | | 11.02 | | 2.17 | |
Class I | | 1,000.00 | | 1,156.40 | | 4.57 | | 1,020.97 | | 4.28 | | 0.84 | |
Class T | | 1,000.00 | | 1,155.20 | | 5.70 | | 1,019.91 | | 5.35 | | 1.05 | |
| | | | | | | | | | | | | |
Transamerica Flexible Income | | | | | | | | | | | | | |
Class A | | 1,000.00 | | 1,181.30 | | 7.97 | | 1,017.90 | | 7.37 | | 1.45 | |
Class B | | 1,000.00 | | 1,176.80 | | 11.58 | | 1,014.57 | | 10.71 | | 2.11 | |
Class C | | 1,000.00 | | 1,178.50 | | 11.15 | | 1,014.97 | | 10.31 | | 2.03 | |
Class I | | 1,000.00 | | 1,185.50 | | 4.63 | | 1,020.97 | | 4.28 | | 0.84 | |
| | | | | | | | | | | | | |
Transamerica Growth Opportunities | | | | | | | | | | | | | |
Class A | | 1,000.00 | | 1,142.60 | | 9.45 | | 1,016.38 | | 8.89 | | 1.75 | |
Class B | | 1,000.00 | | 1,140.30 | | 12.95 | | 1,013.11 | | 12.18 | | 2.40 | |
Class C | | 1,000.00 | | 1,138.00 | | 12.93 | | 1,013.11 | | 12.18 | | 2.40 | |
Class I | | 1,000.00 | | 1,147.50 | | 4.93 | | 1,020.62 | | 4.63 | | 0.91 | |
| | | | | | | | | | | | | |
Transamerica High Yield Bond | | | | | | | | | | | | | |
Class A | | 1,000.00 | | 1,275.60 | | 6.71 | | 1,019.31 | | 5.96 | | 1.17 | |
Class B | | 1,000.00 | | 1,269.40 | | 10.70 | | 1,015.78 | | 9.50 | | 1.87 | |
Class C | | 1,000.00 | | 1,269.20 | | 10.30 | | 1,016.13 | | 9.15 | | 1.80 | |
Class I | | 1,000.00 | | 1,276.50 | | 3.84 | | 1,021.83 | | 3.41 | | 0.67 | |
| | | | | | | | | | | | | |
Transamerica Legg Mason Partners All Cap | | | | | | | | | | | | | |
Class A | | 1,000.00 | | 1,224.70 | | 8.75 | | 1,017.34 | | 7.93 | | 1.56 | |
Class B | | 1,000.00 | | 1,220.50 | | 12.37 | | 1,014.06 | | 11.22 | | 2.21 | |
Class C | | 1,000.00 | | 1,220.80 | | 12.37 | | 1,014.06 | | 11.22 | | 2.21 | |
| | | | | | | | | | | | | | | | | | |
26
| | | | Actual Expenses | | Hypothetical Expenses (b) | | | |
Fund Name | | Beginning
Account Value | | Ending Account
Value | | Expenses Paid
During Period (a) | | Ending
Account Value | | Expenses Paid
During Period (a) | | Annualized
Expense Ratio | |
Transamerica Money Market | | | | | | | | | | | | | |
Class A | | $ | 1,000.00 | | $ | 1,000.00 | | $ | 2.07 | | $ | 1,023.14 | | $ | 2.09 | | 0.41 | % |
Class B | | 1,000.00 | | 1,000.00 | | 2.07 | | 1,023.14 | | 2.09 | | 0.41 | |
Class C | | 1,000.00 | | 1,000.00 | | 2.12 | | 1,023.09 | | 2.14 | | 0.42 | |
Class I | | 1,000.00 | | 1,000.10 | | 1.92 | | 1,023.29 | | 1.94 | | 0.38 | |
| | | | | | | | | | | | | |
Transamerica Science & Technology | | | | | | | | | | | | | |
Class A | | 1,000.00 | | 1,235.30 | | 8.62 | | 1,017.49 | | 7.78 | | 1.53 | |
Class B | | 1,000.00 | | 1,231.60 | | 12.26 | | 1,014.22 | | 11.07 | | 2.18 | |
Class C | | 1,000.00 | | 1,231.60 | | 12.26 | | 1,014.22 | | 11.07 | | 2.18 | |
Class I | | 1,000.00 | | 1,240.70 | | 5.03 | | 1,020.72 | | 4.53 | | 0.89 | |
| | | | | | | | | | | | | |
Transamerica Short-Term Bond | | | | | | | | | | | | | |
Class A | | 1,000.00 | | 1,079.70 | | 4.72 | | 1,020.67 | | 4.58 | | 0.90 | |
Class C | | 1,000.00 | | 1,074.60 | | 8.63 | | 1,016.89 | | 8.39 | | 1.65 | |
Class I | | 1,000.00 | | 1,080.00 | | 3.04 | | 1,022.28 | | 2.96 | | 0.58 | |
| | | | | | | | | | | | | |
Transamerica Small/Mid Cap Value | | | | | | | | | | | | | |
Class A | | 1,000.00 | | 1,156.30 | | 7.99 | | 1,017.80 | | 7.48 | | 1.47 | |
Class B | | 1,000.00 | | 1,152.20 | | 11.72 | | 1,014.32 | | 10.97 | | 2.16 | |
Class C | | 1,000.00 | | 1,152.30 | | 11.56 | | 1,014.47 | | 10.82 | | 2.13 | |
Class I | | 1,000.00 | | 1,159.50 | | 5.39 | | 1,020.21 | | 5.04 | | 0.99 | |
| | | | | | | | | | | | | |
Transamerica Templeton Global | | | | | | | | | | | | | |
Class A | | 1,000.00 | | 1,232.20 | | 8.72 | | 1,017.39 | | 7.88 | | 1.55 | |
Class B | | 1,000.00 | | 1,230.40 | | 12.37 | | 1,014.12 | | 11.17 | | 2.20 | |
Class C | | 1,000.00 | | 1,227.00 | | 12.35 | | 1,014.12 | | 11.17 | | 2.20 | |
| | | | | | | | | | | | | |
Transamerica Value Balanced | | | | | | | | | | | | | |
Class A | | 1,000.00 | | 1,166.20 | | 9.77 | | 1,016.18 | | 9.10 | | 1.79 | |
Class B | | 1,000.00 | | 1,162.60 | | 13.46 | | 1,012.75 | | 12.53 | | 2.47 | |
Class C | | 1,000.00 | | 1,162.00 | | 13.30 | | 1,012.91 | | 12.38 | | 2.44 | |
| | | | | | | | | | | | | | | | | | |
(a) | Expenses are calculated using the funds’ annualized expense ratios (as disclosed in the table), multiplied by the average account values for the period, multiplied by the number of days in the period (184 days), and divided by the number of days in the year (365 days). |
| |
(b) | 5% return per year before expenses. |
27
Schedules of Investments Composition
At October 31, 2009
(The following charts summarize the Schedule of Investments of each fund by asset type)
(unaudited)
Transamerica Balanced
Common Stocks | | 61.9 | % |
Corporate Debt Securities | | 24.0 | |
U.S. Government Agency Obligations | | 7.5 | |
Mortgage-Backed Securities | | 5.0 | |
Securities Lending Collateral | | 0.7 | |
U.S. Government Obligation | | 0.5 | |
Asset-Backed Securities | | 0.5 | |
Repurchase Agreement | | 0.3 | |
Other Assets and Liabilities - Net Ω | | (0.4 | ) |
Total | | 100.0 | % |
Transamerica Convertible Securities | | | |
| | | |
Convertible Bonds | | 54.0 | % |
Repurchase Agreement | | 9.6 | |
Convertible Preferred Stocks | | 8.8 | |
Corporate Debt Securities | | 6.8 | |
Reverse Convertible Bond | | 4.3 | |
Preferred Stock | | 2.5 | |
Common Stock | | 1.7 | |
Other Assets and Liabilities - Net Ω | | 12.3 | |
Total | | 100.0 | % |
Transamerica Equity | | | |
| | | |
Common Stocks | | 97.6 | % |
Repurchase Agreement | | 2.4 | |
Securities Lending Collateral | | 0.5 | |
Other Assets and Liabilities - Net Ω | | (0.5 | ) |
Total | | 100.0 | % |
Transamerica Flexible Income | | | |
| | | |
Corporate Debt Securities | | 68.3 | % |
Mortgage-Backed Securities | | 13.5 | |
Common Stock | | 4.2 | |
Foreign Government Obligations | | 4.1 | |
Repurchase Agreement | | 2.3 | |
Securities Lending Collateral | | 2.3 | |
Convertible Bonds | | 2.2 | |
U.S. Government Obligations | | 2.0 | |
Preferred Stocks | | 1.4 | |
Convertible Preferred Stocks | | 1.4 | |
Asset-Backed Security | | 0.6 | |
Other Assets and Liabilities - Net Ω | | (2.3 | ) |
Total | | 100.0 | % |
Transamerica Growth Opportunities | | | |
| | | |
Common Stocks | | 96.3 | % |
Securities Lending Collateral | | 6.1 | |
Repurchase Agreement | | 4.2 | |
Other Assets and Liabilities - Net Ω | | (6.6 | ) |
Total | | 100.0 | % |
Transamerica High Yield Bond | | | |
| | | |
Corporate Debt Securities | | 92.3 | % |
Securities Lending Collateral | | 5.5 | |
Repurchase Agreement | | 4.7 | |
Common Stock | | 0.3 | |
Preferred Stock | | 0.2 | |
Other Assets and Liabilities - Net Ω | | (3.0 | ) |
Total | | 100.0 | % |
Transamerica Legg Mason Partners All Cap | | | |
| | | |
Common Stocks | | 97.1 | % |
Repurchase Agreement | | 3.0 | |
Other Assets and Liabilities - Net Ω | | (0.1 | ) |
Total | | 100.0 | % |
Transamerica Money Market | | | |
| | | |
Commercial Paper | | 79.5 | % |
Short-Term Foreign Government Obligations | | 10.1 | |
Corporate Debt Securities | | 6.9 | |
Certificate of Deposit | | 3.2 | |
Repurchase Agreement | | 0.4 | |
Other Assets and Liabilities - Net Ω | | (0.1 | ) |
Total | | 100.0 | % |
Transamerica Science & Technology | | | |
| | | |
Common Stocks | | 97.9 | % |
Repurchase Agreement | | 0.7 | |
Other Assets and Liabilities - Net Ω | | 1.4 | |
Total | | 100.0 | % |
Transamerica Short-Term Bond | | | |
| | | |
Corporate Debt Securities | | 76.0 | % |
Mortgage-Backed Securities | | 11.5 | |
U.S. Government Agency Obligations | | 6.8 | |
Asset-Backed Securities | | 2.1 | |
Repurchase Agreement | | 1.4 | |
Foreign Government Obligation | | 0.9 | |
Securities Lending Collateral | | 0.1 | |
Other Assets and Liabilities - Net Ω | | 1.2 | |
Total | | 100.0 | % |
Transamerica Small/Mid Cap Value | | | |
| | | |
Common Stocks | | 93.9 | % |
Repurchase Agreement | | 6.0 | |
Securities Lending Collateral | | 5.7 | |
Other Assets and Liabilities - Net Ω | | (5.6 | ) |
Total | | 100.0 | % |
Transamerica Templeton Global | | | |
| | | |
Common Stocks | | 97.6 | % |
Repurchase Agreement | | 1.7 | |
Other Assets and Liabilities - Net Ω | | 0.7 | |
Total | | 100.0 | % |
Transamerica Value Balanced | | | |
| | | |
Common Stocks | | 61.6 | % |
Corporate Debt Securities | | 25.8 | |
U.S. Government Agency Obligations | | 6.6 | |
Mortgage-Backed Securities | | 4.6 | |
U.S. Government Obligations | | 0.6 | |
Asset-Backed Securities | | 0.5 | |
Municipal Government Obligation | | 0.2 | |
Repurchase Agreement | | 0.2 | |
Other Assets and Liabilities - Net Ω | | (0.1 | ) |
Total | | 100.0 | % |
Ω The Other Assets and Liabilities - Net category may include, but is not limited to, Forward Currency Contracts, Futures Contracts, Swap Agreements, Written Options and Swaptions, and Securities Sold Short.
28
Transamerica Balanced
SCHEDULE OF INVESTMENTS
At October 31, 2009
(all amounts in thousands)
| | Principal | | Value | |
U.S. GOVERNMENT OBLIGATION - 0.5% | | | | | |
U.S. Treasury Inflation Indexed Bond 2.50%, 01/15/2029 | | $ | 462 | | $ | 498 | |
Total U.S. Government Obligation (cost $467) | | | | | |
| | | | | |
U.S. GOVERNMENT AGENCY OBLIGATIONS - 7.5% | | | | | |
Fannie Mae | | | | | |
5.00%, 04/25/2034 | | 700 | | 747 | |
5.50%, 04/01/2037- 11/01/2038 | | 2,308 | | 2,432 | |
Freddie Mac | | | | | |
5.00%, 02/01/2024- 07/01/2035 | | 2,421 | | 2,539 | |
6.00%, 12/01/2037 | | 1,263 | | 1,369 | |
Total U.S. Government Agency Obligations (cost $6,830) | | | | 7,087 | |
| | | | | |
MORTGAGE-BACKED SECURITIES - 5.0% | | | | | |
American Tower Trust | | | | | |
Series 2007-1A, Class AFX | | | | | |
5.42%, 04/15/2037 -144A | | 450 | | 455 | |
BCAP LLC Trust | | | | | |
Series 2009-RR10, Class 2A1 | | | | | |
4.92%, 08/26/2035 -144A Ə* | | 260 | | 248 | |
Series 2009-RR3, Class 2A1 | | | | | |
5.65%, 05/26/2037 -144A Ə | | 157 | | 151 | |
Series 2009-RR6, Class 2A1 | | | | | |
5.36%, 08/26/2035 -144A Ə | | 174 | | 167 | |
Crown Castle Towers LLC | | | | | |
Series 2006-1A, Class AFX | | | | | |
5.24%, 11/15/2036 -144A | | 739 | | 748 | |
Jefferies & Co., Inc. | | | | | |
Series 2009-R2, Class 2A | | | | | |
6.55%, 12/26/2037 -144A | | 183 | | 171 | |
Series 2009-R7, Class 10A3 | | | | | |
6.00%, 12/26/2036 -144A | | 161 | | 153 | |
Series 2009-R7, Class 12A1 | | | | | |
5.50%, 08/26/2036 -144A | | 183 | | 176 | |
Series 2009-R7, Class 1A1 | | | | | |
5.59%, 02/26/2036 -144A | | 268 | | 256 | |
Series 2009-R7, Class 4A1 | | | | | |
3.74%, 09/26/2034 -144A * | | 258 | | 245 | |
Series 2009-R9, Class 1A1 | | | | | |
5.84%, 08/26/2046 -144A | | 183 | | 177 | |
JP Morgan Re-REMIC | | | | | |
Series 2009-7, Class 8A1 | | | | | |
5.82%, 01/27/2047 -144A | | 183 | | 178 | |
Small Business Adminstration Trust | | | | | |
Series 2006-1A, Class A | | | | | |
5.31%, 11/15/2036 -144A | | 680 | | 683 | |
WaMu Mortgage Pass Through Certificates | | | | | |
Series 2003-S9, Class A6 | | | | | |
5.25%, 10/25/2033 | | 370 | | 371 | |
Wells Fargo Mortgage Backed Securities Trust | | | | | |
Series 2003-G, Class A1 | | | | | |
4.10%, 06/25/2033 * | | 280 | | 273 | |
Series 2003-L, Class 1A2 | | | | | |
4.56%, 11/25/2033 * | | 262 | | 258 | |
Total Mortgage-Backed Securities (cost $4,578) | | | | 4,710 | |
| | | | | |
ASSET-BACKED SECURITIES - 0.5% | | | | | |
American Airlines Pass-Through Trust | | | | | |
Series 2001-2, Class A-2 | | | | | |
7.86%, 10/01/2011 | | 185 | | 184 | |
Delta Air Lines, Inc. | | | | | |
Series 2000-1, Class A-2 | | | | | |
7.57%, 05/18/2012 | | 270 | | 270 | |
Total Asset-Backed Securities (cost $458) | | | | 454 | |
| | | | | |
CORPORATE DEBT SECURITIES - 24.0% | | | | | |
Airlines - 0.1% | | | | | |
Continental Airlines, Inc. | | | | | |
9.00%, 07/08/2016 | | 120 | | 128 | |
Beverages - 0.2% | | | | | |
Anheuser-Busch InBev Worldwide, Inc. | | | | | |
8.20%, 01/15/2039 -144A | | 133 | | 168 | |
Building Products - 0.4% | | | | | |
Holcim Capital Corp., Ltd. | | | | | |
6.88%, 09/29/2039 -144A | | 171 | | 177 | |
Voto-Votorantim Overseas Trading Operations NV | | | | | |
6.63%, 09/25/2019 -144A | | 185 | | 178 | |
Capital Markets - 1.2% | | | | | |
Goldman Sachs Group, Inc. | | | | | |
0.74%, 03/22/2016 * | | 405 | | 372 | |
Macquarie Group, Ltd. | | | | | |
7.63%, 08/13/2019 -144A | | 380 | | 420 | |
Raymond James Financial, Inc. | | | | | |
8.60%, 08/15/2019 | | 360 | | 392 | |
Chemicals - 1.3% | | | | | |
Chevron Phillips Chemical Co. LLC | | | | | |
8.25%, 06/15/2019 -144A | | 165 | | 196 | |
Cytec Industries, Inc. | | | | | |
8.95%, 07/01/2017 | | 170 | | 199 | |
Dow Chemical Co. | | | | | |
8.55%, 05/15/2019 | | 390 | | 445 | |
Nalco Co. | | | | | |
8.25%, 05/15/2017 -144A | | 180 | | 189 | |
Yara International ASA | | | | | |
7.88%, 06/11/2019 -144A | | 185 | | 211 | |
Commercial Banks - 2.0% | | | | | |
Barclays Bank PLC | | | | | |
10.18%, 06/12/2021 -144A | | 316 | | 417 | |
National City Bank/Cleveland OH | | | | | |
0.65%, 12/15/2016 * | | 460 | | 384 | |
State Street Capital Trust IV | | | | | |
1.30%, 06/15/2037 * | | 583 | | 391 | |
Wells Fargo Capital XIII | | | | | |
7.70%, 03/26/2013 Ž | | 390 | | 363 | |
ZFS Finance USA Trust II | | | | | |
6.45%, 06/15/2016 -144A ■ | | 429 | | 386 | |
Commercial Services & Supplies - 0.2% | | | | | |
Hertz Corp. | | | | | |
8.88%, 01/01/2014 | | 200 | | 203 | |
Construction Materials - 0.2% | | | | | |
CRH America, Inc. | | | | | |
5.30%, 10/15/2013 | | 200 | | 208 | |
Containers & Packaging - 0.6% | | | | | |
Graphic Packaging International, Inc. | | | | | |
9.50%, 06/15/2017 -144A | | 200 | | 210 | |
Rexam PLC | | | | | |
6.75%, 06/01/2013 -144A | | 326 | | 345 | |
Diversified Financial Services - 3.3% | | | | | |
Bank of America Corp. | | | | | |
0.58%, 06/15/2016 * | | 740 | | 652 | |
Citigroup, Inc. | | | | | |
6.13%, 05/15/2018 | | 360 | | 364 | |
| | | | | | | |
The notes to the financial statements are an integral part of this report.
29
| | Principal | | Value | |
Diversified Financial Services (continued) | | | | | |
Glencore Funding LLC | | | | | |
6.00%, 04/15/2014 -144A | | $ | 209 | | $ | 205 | |
Harley-Davidson Funding Corp. | | | | | |
5.25%, 12/15/2012 -144A | | 380 | | 381 | |
Hyundai Capital Services, Inc. | | | | | |
6.00%, 05/05/2015 -144A | | 333 | | 333 | |
JPMorgan Chase Capital XXVII | | | | | |
7.00%, 11/01/2039 | | 220 | | 221 | |
Lukoil International Finance BV | | | | | |
6.38%, 11/05/2014 -144A | | 350 | | 351 | |
Pemex Finance, Ltd. | | | | | |
9.03%, 02/15/2011 | | 166 | | 171 | |
Rabobank Nederland NV | | | | | |
11.00%, 06/30/2019 144A ■Ž | | 315 | | 395 | |
Electric Utilities - 0.4% | | | | | |
KCP&L Greater Missouri Operations Co. | | | | | |
11.88%, 07/01/2012 Ђ | | 295 | | 342 | |
Energy Equipment & Services - 0.6% | | | | | |
Enterprise Products Operating LLC | | | | | |
7.00%, 06/01/2067 ■ | | 300 | | 263 | |
Weatherford International, Ltd. | | | | | |
7.00%, 03/15/2038 | | 285 | | 291 | |
Food & Staples Retailing - 0.4% | | | | | |
Ingles Markets, Inc. | | | | | |
8.88%, 05/15/2017 | | 185 | | 190 | |
Stater Brothers Holdings, Inc. | | | | | |
8.13%, 06/15/2012 | | 225 | | 226 | |
Food Products - 0.7% | | | | | |
Lorillard Tobacco Co. | | | | | |
8.13%, 06/23/2019 | | 160 | | 178 | |
M-Foods Holdings, Inc. | | | | | |
9.75%, 10/01/2013 -144A | | 227 | | 234 | |
Michael Foods, Inc. | | | | | |
8.00%, 11/15/2013 | | 320 | | 325 | |
Gas Utilities - 0.6% | | | | | |
DCP Midstream LLC | | | | | |
9.75%, 03/15/2019 -144A | | 215 | | 257 | |
EQT Corp. | | | | | |
8.13%, 06/01/2019 | | 260 | | 298 | |
Hotels, Restaurants & Leisure - 1.0% | | | | | |
International Game Technology | | | | | |
7.50%, 06/15/2019 | | 335 | | 371 | |
Marriott International, Inc. | | | | | |
5.63%, 02/15/2013 | | 350 | | 362 | |
Royal Caribbean Cruises, Ltd. | | | | | |
8.75%, 02/02/2011 | | 172 | | 174 | |
Household Durables - 0.4% | | | | | |
Whirlpool Corp. | | | | | |
8.00%, 05/01/2012 | | 343 | | 373 | |
Industrial Conglomerates - 0.2% | | | | | |
QHP Pharma | | | | | |
10.25%, 03/15/2015 | | 180 | | 183 | |
Insurance - 0.5% | | | | | |
American Financial Group, Inc. | | | | | |
9.88%, 06/15/2019 | | 175 | | 198 | |
Oil Insurance, Ltd. | | | | | |
7.56%, 06/30/2011 -144A Ž■ | | 400 | | 283 | |
Leisure Equipment & Products - 0.4% | | | | | |
Hasbro, Inc. | | | | | |
6.30%, 09/15/2017 | | 380 | | 408 | |
Media - 0.2% | | | | | |
Discovery Communications LLC | | | | | |
5.63%, 08/15/2019 | | 165 | | 169 | |
Metals & Mining - 1.0% | | | | | |
ArcelorMittal | | | | | |
5.38%, 06/01/2013 | | 340 | | 350 | |
Rio Tinto Finance USA, Ltd. | | | | | |
9.00%, 05/01/2019 | | 330 | | 411 | |
Xstrata Canada Corp. | | | | | |
7.35%, 06/05/2012 | | 183 | | 197 | |
Multiline Retail - 0.4% | | | | | |
Best Buy Co., Inc. | | | | | |
6.75%, 07/15/2013 | | 330 | | 355 | |
Multi-Utilities - 0.7% | | | | | |
Black Hills Corp. | | | | | |
9.00%, 05/15/2014 | | 185 | | 213 | |
Sempra Energy | | | | | |
9.80%, 02/15/2019 | | 380 | | 485 | |
Oil, Gas & Consumable Fuels - 2.6% | | | | | |
Enbridge Energy Partners, LP | | | | | |
9.88%, 03/01/2019 | | 270 | | 341 | |
GAZ Capital SA | | | | | |
8.13%, 07/31/2014 -144A Λ | | 340 | | 359 | |
Nustar Logistics, LP | | | | | |
6.88%, 07/15/2012 | | 450 | | 478 | |
Petrobras International Finance Co. | | | | | |
5.75%, 01/20/2020 | | 360 | | 359 | |
Petrohawk Energy Corp. | | | | | |
9.13%, 07/15/2013 | | 360 | | 373 | |
Petroleum Co. of Trinidad & Tobago, Ltd. | | | | | |
9.75%, 08/14/2019 -144A | | 178 | | 202 | |
Ras Laffan Liquefied Natural Gas Co., Ltd. III | | | | | |
6.75%, 09/30/2019 -144A | | 390 | | 430 | |
Paper & Forest Products - 0.4% | | | | | |
Weyerhaeuser Co. | | | | | |
6.75%, 03/15/2012 | | 380 | | 398 | |
Real Estate Investment Trusts - 3.0% | | | | | |
Boston Properties, LP | | | | | |
5.88%, 10/15/2019 | | 375 | | 378 | |
Dexus Property Group | | | | | |
7.13%, 10/15/2014 -144A | | 250 | | 252 | |
Duke Realty, LP | | | | | |
7.38%, 02/15/2015 | | 310 | | 327 | |
Healthcare Realty Trust, Inc. | | | | | |
8.13%, 05/01/2011 | | 345 | | 362 | |
Host Hotels & Resorts, LP | | | | | |
7.00%, 08/15/2012 | | 180 | | 181 | |
PPF Funding, Inc. | | | | | |
5.35%, 04/15/2012 -144A | | 381 | | 334 | |
Simon Property Group, LP | | | | | |
10.35%, 04/01/2019 | | 320 | | 402 | |
Tanger Properties, LP | | | | | |
6.15%, 11/15/2015 | | 205 | | 194 | |
WEA Finance LLC/WT Finance Aust Pty, Ltd. | | | | | |
6.75%, 09/02/2019 -144A | | 365 | | 372 | |
Real Estate Management & Development - 0.4% | | | | | |
Post Apartment Homes, LP | | | | | |
6.30%, 06/01/2013 | | 349 | | 350 | |
Transportation Infrastructure - 0.4% | | | | | |
Erac USA Finance Co. | | | | | |
8.00%, 01/15/2011 -144A | | 355 | | 374 | |
Wireless Telecommunication Services - 0.2% | | | | | |
Centennial Communications Corp. | | | | | |
6.04%, 01/01/2013 * | | 170 | | 169 | |
Total Corporate Debt Securities (cost $21,318) | | | | 22,826 | |
| | | | | | | |
The notes to the financial statements are an integral part of this report.
30
(all amounts except share amounts in thousands)
| | Shares | | Value | |
COMMON STOCKS - 61.9% | | | | | |
Air Freight & Logistics - 2.5% | | | | | |
CH Robinson Worldwide, Inc. | | 27,000 | | $ | 1,488 | |
Expeditors International of Washington, Inc. | | 27,000 | | 870 | |
Auto Components - 3.4% | | | | | |
BorgWarner, Inc. | | 50,000 | | 1,516 | |
Johnson Controls, Inc. | | 72,000 | | 1,722 | |
Biotechnology - 0.9% | | | | | |
Gilead Sciences, Inc. ‡ | | 20,500 | | 872 | |
Capital Markets - 3.9% | | | | | |
Charles Schwab Corp. | | 101,000 | | 1,751 | |
T. Rowe Price Group, Inc. | | 39,843 | | 1,942 | |
Chemicals - 2.5% | | | | | |
Praxair, Inc. | | 12,000 | | 953 | |
Sigma-Aldrich Corp. | | 27,000 | | 1,403 | |
Commercial Banks - 1.0% | | | | | |
BB&T Corp. | | 26,200 | | 626 | |
Marshall & Ilsley Corp. | | 59,000 | | 314 | |
Communications Equipment - 1.4% | | | | | |
QUALCOMM, Inc. | | 31,300 | | 1,296 | |
Computers & Peripherals - 5.8% | | | | | |
Apple, Inc. ‡ | | 19,455 | | 3,667 | |
International Business Machines Corp. | | 16,000 | | 1,930 | |
Construction & Engineering - 1.3% | | | | | |
Jacobs Engineering Group, Inc. ‡ | | 30,000 | | 1,269 | |
Diversified Financial Services - 2.1% | | | | | |
JPMorgan Chase & Co. | | 48,000 | | 2,005 | |
Electrical Equipment - 1.0% | | | | | |
Emerson Electric Co. | | 25,000 | | 944 | |
Electronic Equipment & Instruments - 0.9% | | | | | |
Tyco Electronics, Ltd. | | 41,800 | | 888 | |
Energy Equipment & Services - 2.2% | | | | | |
Core Laboratories NV | | 10,000 | | 1,043 | |
Schlumberger, Ltd. | | 16,000 | | 995 | |
Food & Staples Retailing - 1.3% | | | | | |
Wal-Mart Stores, Inc. | | 24,000 | | 1,192 | |
Health Care Equipment & Supplies - 2.9% | | | | | |
Becton Dickinson and Co. | | 17,000 | | 1,162 | |
Covidien PLC | | 25,000 | | 1,053 | |
Varian Medical Systems, Inc. ‡Λ | | 13,000 | | 533 | |
Internet & Catalog Retail - 4.4% | | | | | |
Amazon.com, Inc. ‡ | | 35,000 | | 4,159 | |
Internet Software & Services - 3.3% | | | | | |
Google, Inc. -Class A ‡ | | 5,850 | | 3,136 | |
IT Services - 1.8% | | | | | |
Automatic Data Processing, Inc. | | 44,000 | | 1,751 | |
Machinery - 6.1% | | | | | |
Caterpillar, Inc. | | 32,000 | | 1,762 | |
Kennametal, Inc. | | 79,300 | | 1,868 | |
PACCAR, Inc. | | 59,000 | | 2,206 | |
Oil, Gas & Consumable Fuels - 1.5% | | | | | |
Anadarko Petroleum Corp. | | 7,500 | | 457 | |
EOG Resources, Inc. | | 12,000 | | 980 | |
Paper & Forest Products - 2.3% | | | | | |
Weyerhaeuser Co. | | 60,000 | | 2,180 | |
Road & Rail - 1.2% | | | | | |
Burlington Northern Santa Fe Corp. | | 15,000 | | 1,130 | |
Semiconductors & Semiconductor Equipment - 2.0% | | | | | |
Intel Corp. | | 98,000 | | 1,873 | |
Software - 4.2% | | | | | |
Adobe Systems, Inc. ‡ | | 29,000 | | 955 | |
Microsoft Corp. | | 40,000 | | 1,109 | |
Oracle Corp. | | 90,800 | | 1,917 | |
Trading Companies & Distributors - 2.0% | | | | | |
WW Grainger, Inc. | | 20,000 | | 1,875 | |
Total Common Stocks (cost $55,055) | | | | 58,792 | |
| | | | | |
| | Principal | | | |
REPURCHASE AGREEMENT - 0.3% | | | | | |
State Street Repurchase Agreement 0.01%, dated 10/30/2009, to be repurchased at $295 on 11/02/2009. Collateralized by a U.S. Government Agency Obligation, 4.00%, due 12/15/2017, and with a value of $303. | | $ | 295 | | 295 | |
Total Repurchase Agreement (cost $295) | | | | | |
| | | | | |
| | Shares | | | |
SECURITIES LENDING COLLATERAL - 0.7% | | | | | |
State Street Navigator Securities Lending Trust - Prime Portfolio, 0.35% p | | 674,400 | | 674 | |
Total Securities Lending Collateral (cost $674) | | | | | |
Total Investment Securities (cost $89,675) # | | | | 95,336 | |
Other Assets and Liabilities - Net | | | | (337 | ) |
Net Assets | | | | $ | 94,999 | |
| | | | | | | |
NOTES TO SCHEDULE OF INVESTMENTS:
‡ | Non-income producing security. |
Λ | All or a portion of this security is on loan. The value of all securities on loan is $659. |
Ž | The security has a perpetual maturity. The date shown is the next call date. |
Ə | Security fair valued as determined in good faith in accordance with procedures established by the Board of Trustees. This security had a Market Value of $566, or 0.6% of the fund’s net assets. |
■ | Coupon rate is fixed for a predetermined period of time and then converts to a floating rate until maturity/call date. Rate is listed as of 10/31/2009. |
* | Floating or variable rate note. Rate is listed as of 10/31/2009. |
p | Rate shown reflects the yield at 10/31/2009. |
# | Aggregate cost for federal income tax purposes is $89,837. Aggregate gross unrealized appreciation/depreciation for all securities in which there is an excess of value over tax cost were $10,941 and $5,442, respectively. Net unrealized appreciation for tax purposes is $5,499. |
The notes to the financial statements are an integral part of this report.
31
(all amounts in thousands)
DEFINITIONS:
144A | | 144A Securities are registered pursuant to Rule 144A of the Securities Act of 1933. These securities are deemed to be liquid for purposes of compliance limitations on holdings of illiquid securities and may be resold as transactions exempt from registration, normally to qualified institutional buyers. At 10/31/2009, these securities aggregated $11,466, or 12.07%, of the fund’s net assets. |
REMIC | | Real Estate Mortgage Investment Conduits (consist of a fixed pool of mortgages broken apart and marketed to investors as individual securities). |
VALUATION SUMMARY:
Investment Securities | | Level 1 | | Level 2 | | Level 3 | | Total | |
Equities - Consumer Discretionary | | $ | 7,397 | | $ | — | | $ | — | | $ | 7,397 | |
Equities - Consumer Staples | | 1,192 | | — | | — | | 1,192 | |
Equities - Energy | | 3,475 | | — | | — | | 3,475 | |
Equities - Financials | | 6,638 | | — | | — | | 6,638 | |
Equities - Health Care | | 3,620 | | — | | — | | 3,620 | |
Equities - Industrials | | 13,412 | | — | | — | | 13,412 | |
Equities - Information Technology | | 17,226 | | — | | — | | 17,226 | |
Equities - Materials | | 4,536 | | — | | — | | 4,536 | |
Equities - Telecommunication Services | | 1,296 | | — | | — | | 1,296 | |
Fixed Income - Asset-Backed Security | | — | | 454 | | — | | 454 | |
Fixed Income - Consumer Discretionary | | — | | 2,125 | | — | | 2,125 | |
Fixed Income - Consumer Staples | | — | | 1,815 | | — | | 1,815 | |
Fixed Income - Energy | | — | | 3,353 | | — | | 3,353 | |
Fixed Income - Financials | | — | | 9,832 | | — | | 9,832 | |
Fixed Income - Industrials | | — | | 1,084 | | — | | 1,084 | |
Fixed Income - Materials | | — | | 2,941 | | — | | 2,941 | |
Fixed Income - Mortgage-Backed Security | | — | | 4,710 | | — | | 4,710 | |
Fixed Income - Telecommunication Services | | — | | 338 | | — | | 338 | |
Fixed Income - U.S. Government Agency Obligation | | — | | 7,087 | | — | | 7,087 | |
Fixed Income - U.S. Government Obligation | | — | | 498 | | — | | 498 | |
Fixed Income - Utilities | | — | | 1,338 | | — | | 1,338 | |
Cash & Cash Equivalent - Repurchase Agreement | | — | | 295 | | — | | 295 | |
Cash & Cash Equivalent - Securities Lending Collateral | | 674 | | — | | — | | 674 | |
Total | | $ | 59,466 | | $ | 35,870 | | $ | — | | $ | 95,336 | |
The notes to the financial statements are an integral part of this report.
32
Transamerica Convertible Securities
SCHEDULE OF INVESTMENTS
At October 31, 2009
(all amounts except share amounts in thousands)
| | Principal | | Value | |
CORPORATE DEBT SECURITIES - 6.8% | | | | | |
Commercial Banks - 3.2% | | | | | |
Wells Fargo Capital XIII | | | | | |
7.70%, 03/26/2013 ■Ž | | $ | 2,500 | | $ | 2,325 | |
Diversified Financial Services - 3.6% | | | | | |
Credit Suisse Securities USA LLC | | | | | |
0.25%, 04/09/2010 | | 22,266 | | 2,607 | |
Total Corporate Debt Securities (cost $6,016) | | | | 4,932 | |
| | | | | |
| | Shares | | | |
CONVERTIBLE PREFERRED STOCKS - 8.8% | | | | | |
Chemicals - 1.7% | | | | | |
Celanese Corp. 4.25% p | | 35,000 | | 1,230 | |
Diversified Financial Services - 4.2% | | | | | |
Vale Capital, Ltd. 5.50% p | | 60,900 | | 2,987 | |
Pharmaceuticals - 2.9% | | | | | |
Mylan, Inc. 6.50% p | | 2,055 | | 2,117 | |
Total Convertible Preferred Stocks (cost $4,736) | | | | 6,334 | |
| | | | | |
PREFERRED STOCK - 2.5% | | | | | |
Hotels, Restaurants & Leisure - 2.5% | | | | | |
Las Vegas Sands Corp. 10.00% p | | 7,000 | | 1,817 | |
Total Preferred Stock (cost $1,375) | | | | | |
| | | | | |
COMMON STOCK - 1.7% | | | | | |
Auto Components - 1.7% | | | | | |
Johnson Controls, Inc. | | 51,493 | | 1,232 | |
Total Common Stock (cost $1,351) | | | | | |
| | | | | |
| | Principal | | | |
REVERSE CONVERTIBLE BOND - 4.3% ұ | | | | | |
Capital Markets - 4.3% | | | | | |
Goldman Sachs Group, Inc. | | | | | |
0.25%, 06/30/2010 -144A § | | $ | 29,500 | | 3,145 | |
Total Reverse Convertible Bond (cost $3,713) | | | | | |
| | | | | |
CONVERTIBLE BONDS - 54.0% | | | | | |
Auto Components - 1.8% | | | | | |
BorgWarner, Inc. | | | | | |
3.50%, 04/15/2012 | | 1,060 | | 1,277 | |
Biotechnology - 6.5% | | | | | |
Human Genome Sciences, Inc. | | | | | |
2.25%, 08/15/2012 | | 2,270 | | 2,957 | |
Onyx Pharmaceuticals, Inc. | | | | | |
4.00%, 08/15/2016 | | 1,760 | | 1,784 | |
Capital Markets - 3.9% | | | | | |
Jefferies Group, Inc. | | | | | |
3.88%, 11/01/2029 | | 2,970 | | 2,825 | |
Construction & Engineering - 1.6% | | | | | |
Quanta Services, Inc. | | | | | |
3.75%, 04/30/2026 | | 1,075 | | 1,192 | |
Diversified Consumer Services - 2.0% | | | | | |
Coinstar, Inc. | | | | | |
4.00%, 09/01/2014 | | 1,350 | | 1,426 | |
Diversified Financial Services - 2.2% | | | | | |
AngloGold Ashanti Holdings Finance PLC | | | | | |
3.50%, 05/22/2014 -144A | | 1,445 | | 1,575 | |
Diversified Telecommunication Services - 3.6% | | | | | |
Mastec, Inc. | | | | | |
4.00%, 06/15/2014 | | 2,495 | | 2,595 | |
Energy Equipment & Services - 2.0% | | | | | |
Covanta Holding Corp. | | | | | |
3.25%, 06/01/2014 -144A | | 1,270 | | 1,422 | |
Health Care Equipment & Supplies - 2.3% | | | | | |
NuVasive, Inc. | | | | | |
2.25%, 03/15/2013 -144A | | 1,578 | | 1,647 | |
Hotels, Restaurants & Leisure - 2.9% | | | | | |
Wyndham Worldwide Corp. | | | | | |
3.50%, 05/01/2012 | | 1,440 | | 2,124 | |
Machinery - 1.9% | | | | | |
Navistar International Corp. | | | | | |
3.00%, 10/15/2014 | | 1,395 | | 1,313 | |
Media - 4.0% | | | | | |
Macrovision Corp. | | | | | |
2.63%, 08/15/2011 | | 2,575 | | 2,936 | |
Metals & Mining - 6.4% | | | | | |
Newmont Mining Corp. | | | | | |
1.25%, 07/15/2014 | | 1,375 | | 1,635 | |
Steel Dynamics, Inc. | | | | | |
5.13%, 06/15/2014 | | 1,435 | | 1,552 | |
U.S. Steel Corp. | | | | | |
4.00%, 05/15/2014 | | 1,100 | | 1,458 | |
Multiline Retail - 2.2% | | | | | |
Saks, Inc. | | | | | |
7.50%, 12/01/2013 -144A | | 1,200 | | 1,577 | |
Oil, Gas & Consumable Fuels - 3.5% | | | | | |
Quicksilver Resources, Inc. | | | | | |
1.88%, 11/01/2024 | | 940 | | 1,002 | |
Western Refining, Inc. | | | | | |
5.75%, 06/15/2014 | | 1,770 | | 1,547 | |
Semiconductors & Semiconductor Equipment - 3.0% | | | | | |
Intel Corp. | | | | | |
3.25%, 08/01/2039 -144A | | 2,000 | | 2,155 | |
Software - 4.2% | | | | | |
Nuance Communications, Inc. | | | | | |
2.75%, 08/15/2027 | | 1,710 | | 1,728 | |
Take-Two Interactive Software, Inc. | | | | | |
4.38%, 06/01/2014 | | 1,080 | | 1,355 | |
Total Convertible Bonds (cost $37,372) | | | | 39,082 | |
| | | | | |
REPURCHASE AGREEMENT - 9.6% | | | | | |
State Street Repurchase Agreement 0.01%, dated 10/30/2009, to be repurchased at $6,926 on 11/02/2009. Collateralized by a U.S. Government Agency Obligation, 4.00%, due 12/15/2017, and with a value of $7,067. | | 6,926 | | 6,926 | |
Total Repurchase Agreement (cost $6,926) | | | | | |
| | | | | |
Total Investment Securities (cost $61,489) # | | | | 63,468 | |
Other Assets and Liabilities - Net | | | | 8,880 | |
| | | | | |
Net Assets | | | | $ | 72,348 | |
The notes to the financial statements are an integral part of this report.
33
(all amounts in thousands)
NOTES TO SCHEDULE OF INVESTMENTS:
p | Rate shown reflects the yield at 10/31/2009. |
■ | Coupon rate is fixed for a predetermined period of time and then converts to a floating rate until maturity/call date. Rate is listed as of 10/31/2009. |
§ | Illiquid. This security aggregated $3,145, or 4.35%, of the Fund’s net assets. |
Ž | The security has a perpetual maturity. The date shown is the next call date. |
ұ | A bond that can be converted to cash, debt, or equity at the discretion of the issuer at a set date. The bond contains an embedded derivative that allows the issuer to put the bond to bondholders at a set date prior to the bond’s maturity for existing debt or shares of an underlying company. The underlying company need not be related in any way to the issuer’s business. |
# | Aggregate cost for federal income tax purposes is $61,489. Aggregate gross unrealized appreciation/depreciation for all securities in which there is an excess of value over tax cost were $5,245 and $3,266, respectively. Net unrealized appreciation for tax purposes is $1,979. |
DEFINITIONS:
144A | | 144A Securities are registered pursuant to Rule 144A of the Securities Act of 1933. These securities are deemed to be liquid for purposes of compliance limitations on holdings of illiquid securities and may be resold as transactions exempt from registration, normally to qualified institutional buyers. At 10/31/2009, these securities aggregated $11,521, or 15.92%, of the fund’s net assets. |
VALUATION SUMMARY:
Investment Securities | | Level 1 | | Level 2 | | Level 3 | | Total | |
Equities - Consumer Discretionary | | $ | 3,049 | | $ | — | | $ | — | | $ | 3,049 | |
Equities - Financials | | 2,987 | | — | | — | | 2,987 | |
Equities - Health Care | | 2,117 | | — | | — | | 2,117 | |
Equities - Materials | | 1,230 | | — | | — | | 1,230 | |
Fixed Income - Consumer Discretionary | | — | | 9,339 | | — | | 9,339 | |
Fixed Income - Energy | | — | | 3,971 | | — | | 3,971 | |
Fixed Income - Financials | | — | | 12,478 | | — | | 12,478 | |
Fixed Income - Health Care | | — | | 6,388 | | — | | 6,388 | |
Fixed Income - Industrials | | — | | 2,505 | | — | | 2,505 | |
Fixed Income - Information Technology | | — | | 5,238 | | — | | 5,238 | |
Fixed Income - Materials | | — | | 4,645 | | — | | 4,645 | |
Fixed Income - Telecommunication Services | | — | | 2,595 | | — | | 2,595 | |
Cash & Cash Equivalent - Repurchase Agreement | | — | | 6,926 | | — | | 6,926 | |
Total | | $ | 9,383 | | $ | 54,085 | | $ | — | | $ | 63,468 | |
The notes to the financial statements are an integral part of this report.
34
Transamerica Equity
SCHEDULE OF INVESTMENTS
At October 31, 2009
(all amounts except share amounts in thousands)
| | Shares | | Value | |
COMMON STOCKS - 97.6% | | | | | |
Air Freight & Logistics - 1.7% | | | | | |
Expeditors International of Washington, Inc. | | 567,796 | | $ | 18,294 | |
Auto Components - 6.4% | | | | | |
BorgWarner, Inc. | | 922,000 | | 27,955 | |
Johnson Controls, Inc. | | 1,771,600 | | 42,377 | |
Biotechnology - 1.9% | | | | | |
Gilead Sciences, Inc. ‡ | | 486,263 | | 20,690 | |
Capital Markets - 6.3% | | | | | |
Charles Schwab Corp. | | 1,895,785 | | 32,873 | |
T. Rowe Price Group, Inc. | | 740,900 | | 36,104 | |
Chemicals - 12.3% | | | | | |
Ecolab, Inc. | | 754,200 | | 33,155 | |
Monsanto Co. | | 272,875 | | 18,332 | |
Praxair, Inc. | | 649,455 | | 51,592 | |
Sigma-Aldrich Corp. | | 607,975 | | 31,572 | |
Commercial Banks - 4.9% | | | | | |
SunTrust Banks, Inc. | | 392,730 | | 7,505 | |
Wells Fargo & Co. | | 1,675,835 | | 46,119 | |
Communications Equipment - 5.7% | | | | | |
Cisco Systems, Inc. ‡ | | 1,269,655 | | 29,012 | |
Palm, Inc. ‡Λ | | 770,555 | | 8,946 | |
QUALCOMM, Inc. | | 588,401 | | 24,366 | |
Computers & Peripherals - 8.3% | | | | | |
Apple, Inc. ‡ | | 320,320 | | 60,381 | |
International Business Machines Corp. | | 251,300 | | 30,309 | |
Construction & Engineering - 2.0% | | | | | |
Jacobs Engineering Group, Inc. ‡ | | 527,845 | | 22,323 | |
Electrical Equipment - 2.6% | | | | | |
Emerson Electric Co. | | 758,020 | | 28,615 | |
Energy Equipment & Services - 1.2% | | | | | |
Schlumberger, Ltd. | | 204,030 | | 12,691 | |
Food & Staples Retailing - 1.9% | | | | | |
Wal-Mart Stores, Inc. | | 422,855 | | 21,007 | |
Health Care Equipment & Supplies - 1.3% | | | | | |
Intuitive Surgical, Inc. ‡ | | 59,695 | | 14,706 | |
Hotels, Restaurants & Leisure - 1.1% | | | | | |
Yum! Brands, Inc. | | 377,445 | | 12,437 | |
Internet & Catalog Retail - 8.9% | | | | | |
Amazon.com, Inc. ‡ | | 683,990 | | 81,265 | |
priceline.com, Inc. ‡ | | 103,355 | | 16,308 | |
Internet Software & Services - 5.8% | | | | | |
Google, Inc. -Class A ‡ | | 118,200 | | 63,369 | |
IT Services - 2.3% | | | | | |
Automatic Data Processing, Inc. | | 620,775 | | 24,707 | |
Machinery - 5.2% | | | | | |
Caterpillar, Inc. | | 436,500 | | 24,034 | |
PACCAR, Inc. | | 867,270 | | 32,444 | |
Media - 2.4% | | | | | |
Walt Disney Co. | | 943,600 | | 25,826 | |
Oil, Gas & Consumable Fuels - 4.9% | | | | | |
Anadarko Petroleum Corp. | | 462,700 | | 28,192 | |
EOG Resources, Inc. | | 315,685 | | 25,779 | |
Pharmaceuticals - 4.4% | | | | | |
Roche Holding AG ADR | | 590,305 | | 23,553 | |
Teva Pharmaceutical Industries, Ltd. | | ADR | 480,745 | | 24,269 | |
Road & Rail - 2.2% | | | | | |
Union Pacific Corp. | | 445,320 | | 24,555 | |
Semiconductors & Semiconductor Equipment - 1.0% | | | | | |
Intel Corp. | | 576,595 | | 11,019 | |
Software - 2.9% | | | | | |
Activision Blizzard, Inc. ‡ | | 450,350 | | 4,877 | |
Microsoft Corp. | | 982,650 | | 27,249 | |
Total Common Stocks (cost $975,570) | | | | 1,068,807 | |
| | | | | |
| | Principal | | | |
REPURCHASE AGREEMENT - 2.4% | | | | | |
State Street Repurchase Agreement 0.01%, dated 10/30/2009, to be repurchased at $26,250 on 11/02/2009. Collateralized by a U.S. Government Agency Obligation, 4.00%, due 12/15/2017, and with a value of $26,777. | | $ | 26,250 | | 26,250 | |
Total Repurchase Agreement (cost $26,250) | | | | | |
| | | | | |
| | Shares | | | |
SECURITIES LENDING COLLATERAL - 0.5% | | | | | |
State Street Navigator Securities Lending Trust - Prime Portfolio, 0.35% ▲ | | 4,941,984 | | 4,942 | |
Total Securities Lending Collateral (cost $4,942) | | | | | |
| | | | | |
Total Investment Securities (cost $1,006,762) # | | | | 1,099,999 | |
Other Assets and Liabilities - Net | | | | (5,665 | ) |
Net Assets | | | | $ | 1,094,334 | |
| | | | | | | | |
NOTES TO SCHEDULE OF INVESTMENTS:
‡ | | Non-income producing security. |
Λ | | All or a portion of this security is on loan. The value of all securities on loan is $4,781. |
p | | Rate shown reflects the yield at 10/31/2009. |
# | | Aggregate cost for federal income tax purposes is $1,021,340. Aggregate gross unrealized appreciation/depreciation for all securities in which there is an excess of value over tax cost were $139,071 and $60,412, respectively. Net unrealized appreciation for tax purposes is $78,659. |
DEFINITIONS:
ADR | American Depository Receipt |
The notes to the financial statements are an integral part of this report.
35
(all amounts in thousands)
VALUATION SUMMARY:
Investment Securities | | Level 1 | | Level 2 | | Level 3 | | Total | |
Equities - Consumer Discretionary | | $ | 206,168 | | $ | — | | $ | — | | $ | 206,168 | |
Equities - Consumer Staples | | 21,007 | | | — | | | — | | | 21,007 | |
Equities - Energy | | 66,662 | | | — | | | — | | | 66,662 | |
Equities - Financials | | 122,601 | | | — | | | — | | | 122,601 | |
Equities - Health Care | | 83,218 | | | — | | | — | | | 83,218 | |
Equities - Industrials | | 150,265 | | | — | | | — | | | 150,265 | |
Equities - Information Technology | | 259,869 | | | — | | | — | | | 259,869 | |
Equities - Materials | | 134,651 | | | — | | | — | | | 134,651 | |
Equities - Telecommunication Services | | 24,366 | | | — | | | — | | | 24,366 | |
Cash & Cash Equivalent - Repurchase Agreement | | — | | | 26,250 | | | — | | | 26,250 | |
Cash & Cash Equivalent - Securities Lending Collateral | | 4,942 | | | — | | | — | | | 4,942 | |
Total | | $ | 1,073,749 | | $ | 26,250 | | $ | — | | $ | 1,099,999 | |
The notes to the financial statements are an integral part of this report.
36
Transamerica Flexible Income
SCHEDULE OF INVESTMENTS
At October 31, 2009
(all amounts in thousands)
| | Principal | | Value | |
U.S. GOVERNMENT OBLIGATIONS - 2.0% | | | | | |
U.S. Treasury Inflation Indexed Bond | | | | | |
1.75%, 01/15/2028 | | $ | 1,442 | | $ | 1,388 | |
U.S. Treasury Inflation Indexed Note | | | | | |
2.00%, 04/15/2012 | | 2,127 | | 2,221 | |
Total U.S. Government Obligations (cost $3,561) | | | | 3,609 | |
| | | | | |
FOREIGN GOVERNMENT OBLIGATIONS - 4.1% | | | | | |
Australian Government Bond | | | | | |
5.25%, 08/15/2010 | | | AUD | 2,000 | | 1,813 | |
French Government Bond | | | | | | | |
4.00%, 04/25/2018 | | | EUR | 3,500 | | 5,413 | |
Total Foreign Government Obligations (cost $6,327) | | | | 7,226 | |
| | | | | |
MORTGAGE-BACKED SECURITIES - 13.5% | | | | | |
American Tower Trust | | | | | |
Series 2007-1A, Class C | | | | | |
5.62%, 04/15/2037 -144A | | $ | 2,090 | | 2,090 | |
BCAP LLC Trust | | | | | |
Series 2009-RR10, Class 2A1 | | | | | |
4.92%, 08/26/2035 -144A Ə * | | 1,126 | | 1,076 | |
Series 2009-RR3, Class 2A1 | | | | | |
5.65%, 05/26/2037 -144A Ə | | 655 | | 629 | |
Series 2009-RR6, Class 2A1 | | | | | |
5.36%, 08/26/2035 -144A Ə | | 1,532 | | 1,471 | |
Bear Stearns Adjustable Rate Mortgage Trust | | | | | |
Series 2003-4, Class 3A1 | | | | | |
4.98%, 07/25/2033 | | 1,171 | | 1,120 | |
Crown Castle Towers LLC | | | | | |
Series 2006-1A, Class C | | | | | |
5.47%, 11/15/2036 -144A | | 2,000 | | 2,043 | |
Series 2006-1A, Class D | | | | | |
5.77%, 11/15/2036 -144A | | 500 | | 510 | |
Jefferies & Co., Inc. | | | | | |
Series 2009-R2, Class 2A | | | | | |
6.55%, 12/26/2037 -144A | | 703 | | 654 | |
Series 2009-R7, Class 10A3 | | | | | |
6.00%, 12/26/2036 -144A | | 631 | | 601 | |
Series 2009-R7, Class 12A1 | | | | | |
5.50%, 08/26/2036 -144A | | 732 | | 703 | |
Series 2009-R7, Class 16A1 | | | | | |
5.68%, 12/26/2036 -144A * | | 604 | | 605 | |
Series 2009-R7, Class 1A1 | | | | | |
5.59%, 02/26/2036 -144A | | 1,159 | | 1,107 | |
Series 2009-R7, Class 4A1 | | | | | |
3.74%, 09/26/2034 -144A * | | 1,127 | | 1,071 | |
Series 2009-R9, Class 1A1 | | | | | |
5.84%, 08/26/2046 -144A | | 1,198 | | 1,162 | |
JP Morgan Re-REMIC | | | | | |
Series 2009-7, Class 8A1 | | | | | |
5.82%, 01/27/2047 -144A | | 1,272 | | 1,236 | |
Small Business Administration Trust | | | | | |
Series 2006-1A, Class D | | | | | |
5.85%, 11/15/2036 -144A | | 2,379 | | 2,366 | |
Series 2006-1A, Class E | | | | | |
6.17%, 11/15/2036 -144A | | 1,460 | | 1,449 | |
WaMu Mortgage Pass Through Certificates | | | | | |
Series 2003-S9, Class A6 | | | | | |
5.25%, 10/25/2033 | | 1,615 | | 1,617 | |
Wells Fargo Mortgage Backed Securities Trust | | | | | |
Series 2003-G, Class A1 | | | | | |
4.10%, 06/25/2033 * | | 1,226 | | 1,196 | |
Series 2003-L, Class 1A2 | | | | | |
4.56%, 11/25/2033 * | | 1,149 | | 1,132 | |
Total Mortgage-Backed Securities (cost $23,541) | | | | 23,838 | |
| | | | | |
ASSET-BACKED SECURITY - 0.6% | | | | | |
American Airlines Pass-Through Trust | | | | | |
Series 2001-2, Class A-2 | | | | | |
7.86%, 10/01/2011 | | 1,000 | | 995 | |
Total Asset-Backed Security (cost $1,000) | | | | | |
| | | | | |
CORPORATE DEBT SECURITIES - 68.3% | | | | | |
Building Products - 0.5% | | | | | |
Voto-Votorantim Overseas Trading Operations NV | | | | | |
6.63%, 09/25/2019 -144A | | 840 | | 806 | |
Capital Markets - 1.9% | | | | | |
Macquarie Group, Ltd. | | | | | |
7.30%, 08/01/2014 -144A | | 1,480 | | 1,606 | |
Raymond James Financial, Inc. | | | | | |
8.60%, 08/15/2019 | | 1,570 | | 1,712 | |
Chemicals - 2.3% | | | | | |
Cytec Industries, Inc. | | | | | |
8.95%, 07/01/2017 | | 660 | | 773 | |
Dow Chemical Co. | | | | | |
8.55%, 05/15/2019 | | 1,400 | | 1,598 | |
Momentive Performance Materials, Inc. | | | | | |
9.75%, 12/01/2014 ΛЂ | | 1,005 | | 839 | |
Yara International ASA | | | | | |
7.88%, 06/11/2019 -144A | | 720 | | 821 | |
Commercial Banks - 4.0% | | | | | |
Barclays Bank PLC | | | | | |
10.18%, 06/12/2021 -144A | | 1,480 | | 1,953 | |
Scotland International Finance | | | | | |
6.50%, 02/15/2011 -144A | | 1,440 | | 1,387 | |
State Street Capital Trust IV | | | | | |
1.30%, 06/01/2037 * | | 2,500 | | 1,677 | |
ZFS Finance USA Trust II | | | | | |
6.45%, 06/15/2016 -144A ■ | | 2,300 | | 2,070 | |
Commercial Services & Supplies - 0.8% | | | | | |
Protection One Alarm Monitoring, Inc. | | | | | |
12.00%, 11/15/2011 | | 1,400 | | 1,418 | |
Construction Materials - 2.9% | | | | | |
CRH America, Inc. | | | | | |
5.30%, 10/15/2013 | | 1,790 | | 1,858 | |
Lafarge SA | | | | | |
6.15%, 07/15/2011 | | 1,880 | | 1,967 | |
Martin Marietta Materials, Inc. | | | | | |
6.88%, 04/01/2011 | | 1,290 | | 1,339 | |
Consumer Finance - 1.7% | | | | | |
Cardtronics, Inc. | | | | | |
9.25%, 08/15/2013 Ђ | | 835 | | 848 | |
Discover Financial Services | | | | | |
0.83%, 06/11/2010 * | | 1,130 | | 1,116 | |
Ford Motor Credit Co. LLC | | | | | |
7.88%, 06/15/2010 | | 985 | | 995 | |
| | | | | | | | | | |
The notes to the financial statements are an integral part of this report.
37
| | Principal | | Value | |
Containers & Packaging - 3.0% | | | | | |
Graphic Packaging International, Inc. | | | | | |
9.50%, 06/15/2017 -144A | | $ | 2,625 | | $ | 2,756 | |
Rexam PLC | | | | | |
6.75%, 06/01/2013 -144A | | 2,365 | | 2,503 | |
Diversified Financial Services - 10.6% | | | | | |
Bank of America Corp. | | | | | |
0.58%, 06/15/2016 * | | 2,110 | | 1,855 | |
Glencore Funding LLC | | | | | |
6.00%, 04/15/2014 -144A | | 2,000 | | 1,962 | |
GMAC, Inc. | | | | | |
6.88%, 09/15/2011 -144A | | 750 | | 720 | |
Harley-Davidson Funding Corp. | | | | | |
5.25%, 12/15/2012 -144A | | 1,400 | | 1,404 | |
Hyundai Capital Services, Inc. | | | | | |
6.00%, 05/05/2015 -144A | | 1,615 | | 1,616 | |
JPMorgan Chase Capital XXVII | | | | | |
7.00%, 11/01/2039 | | 1,755 | | 1,767 | |
Lukoil International Finance BV | | | | | |
6.38%, 11/05/2014 -144A | | 2,580 | | 2,585 | |
Nissan Motor Acceptance Corp. | | | | | |
5.63%, 03/14/2011 -144A | | 2,095 | | 2,149 | |
Pemex Finance, Ltd. | | | | | |
9.03%, 02/15/2011 | | 1,905 | | 1,969 | |
Rabobank Nederland NV | | | | | |
11.00%, 06/30/2019 ■ | | 1,200 | | 1,506 | |
Selkirk Cogen Funding Corp. | | | | | |
8.98%, 06/26/2012 | | 760 | | 799 | |
Sensus USA, Inc. | | | | | |
8.63%, 12/15/2013 | | 500 | | 500 | |
Diversified Telecommunication Services - 0.7% | | | | | |
Sprint Capital Corp. | | | | | |
7.63%, 01/30/2011 | | 1,300 | | 1,314 | |
Electric Utilities - 0.9% | | | | | |
KCP&L Greater Missouri Operations Co. | | | | | |
11.88%, 07/01/2012 Ђ | | 1,405 | | 1,631 | |
Electronic Equipment & Instruments - 1.1% | | | | | |
Tyco Electronics Group SA | | | | | |
6.00%, 10/01/2012 | | 1,800 | | 1,917 | |
Food & Staples Retailing - 1.2% | | | | | |
Ingles Markets, Inc. | | | | | |
8.88%, 05/15/2017 | | 1,140 | | 1,169 | |
Stater Brothers Holdings, Inc. | | | | | |
8.13%, 06/15/2012 | | 1,000 | | 1,005 | |
Food Products - 2.1% | | | | | |
Lorillard Tobacco Co. | | | | | |
8.13%, 06/23/2019 | | 635 | | 706 | |
M-Foods Holdings, Inc. | | | | | |
9.75%, 10/01/2013 -144A | | 1,300 | | 1,342 | |
Michael Foods, Inc. | | | | | |
8.00%, 11/15/2013 | | 1,575 | | 1,602 | |
Gas Utilities - 1.1% | | | | | |
DCP Midstream LLC | | | | | |
9.75%, 03/15/2019 -144A | | 725 | | 866 | |
EQT Corp. | | | | | |
8.13%, 06/01/2019 | | 960 | | 1,100 | |
Hotels, Restaurants & Leisure - 2.9% | | | | | |
Carrols Corp. | | | | | |
9.00%, 01/15/2013 | | 500 | | 500 | |
Hyatt Hotels Corp. | | | | | |
6.88%, 08/15/2019 -144A | | 1,370 | | 1,398 | |
Lions Gate Entertainment, Inc. | | | | | |
10.25%, 11/01/2016 -144A | | 1,010 | | 990 | |
MGM Mirage, Inc. | | | | | |
8.38%, 02/01/2011 Λ | | 1,805 | | 1,647 | |
Pokagon Gaming Authority | | | | | |
10.38%, 06/15/2014 -144A | | 650 | | 673 | |
Station Casinos, Inc. | | | | | |
6.88%, 03/01/2016 Џ | | 700 | | 28 | |
Household Durables - 1.3% | | | | | |
Lennar Corp. | | | | | |
12.25%, 06/01/2017 | | 550 | | 660 | |
Sealy Mattress Co. | | | | | |
8.25%, 06/15/2014 | | 250 | | 243 | |
Whirlpool Corp. | | | | | |
8.00%, 05/01/2012 | | 1,265 | | 1,375 | |
Industrial Conglomerates - 1.3% | | | | | |
QHP Pharma | | | | | |
10.25%, 03/15/2015 | | 2,195 | | 2,228 | |
Insurance - 1.6% | | | | | |
American Financial Group, Inc. | | | | | |
9.88%, 06/15/2019 | | 1,100 | | 1,245 | |
Oil Insurance, Ltd. | | | | | |
7.56%, 06/30/2011 -144A Ž■ | | 2,245 | | 1,586 | |
Machinery - 0.9% | | | | | |
Polypore, Inc. | | | | | |
8.75%, 05/15/2012 | | 550 | | 546 | |
Titan International, Inc. | | | | | |
8.00%, 01/15/2012 | | 1,200 | | 1,140 | |
Metals & Mining - 3.9% | | | | | |
Anglo American Capital PLC | | | | | |
9.38%, 04/08/2019 -144A | | 1,240 | | 1,504 | |
ArcelorMittal | | | | | |
5.38%, 06/01/2013 | | 750 | | 773 | |
Freeport-McMoRan Copper & Gold, Inc. | | | | | |
8.38%, 04/01/2017 | | 1,500 | | 1,614 | |
Rio Tinto Finance USA, Ltd. | | | | | |
9.00%, 05/01/2019 | | 1,165 | | 1,449 | |
Xstrata Canada Corp. | | | | | |
7.35%, 06/05/2012 | | 1,320 | | 1,420 | |
Multiline Retail - 0.8% | | | | | |
Macy’s Retail Holdings, Inc. | | | | | |
5.35%, 03/15/2012 | | 1,480 | | 1,452 | |
Multi-Utilities - 1.5% | | | | | |
Black Hills Corp. | | | | | |
9.00%, 05/15/2014 | | 690 | | 795 | |
Sempra Energy | | | | | |
9.80%, 02/15/2019 | | 1,455 | | 1,856 | |
Oil, Gas & Consumable Fuels - 7.4% | | | | | |
Enbridge Energy Partners, LP | | | | | |
9.88%, 03/01/2019 | | 890 | | 1,123 | |
Enterprise Products Operating LLC | | | | | |
8.38%, 08/01/2066 ■ | | 1,150 | | 1,127 | |
GAZ Capital SA | | | | | |
8.13%, 07/31/2014 -144A Λ | | 1,105 | | 1,167 | |
Nustar Logistics, LP | | | | | |
6.88%, 07/15/2012 | | 1,500 | | 1,594 | |
Opti Canada, Inc. | | | | | |
8.25%, 12/15/2014 | | 1,800 | | 1,413 | |
Petrohawk Energy Corp. | | | | | |
9.13%, 07/15/2013 | | 1,255 | | 1,299 | |
Petroleum Co. of Trinidad & Tobago, Ltd. | | | | | |
9.75%, 08/14/2019 -144A | | 776 | | 881 | |
| | | | | | | |
The notes to the financial statements are an integral part of this report.
38
(all amounts except share amounts in thousands)
| | Principal | | Value | |
Oil, Gas & Consumable Fuels (continued) | | | | | |
Petroleum Development Corp. | | | | | |
12.00%, 02/15/2018 | | $ | 1,000 | | $ | 998 | |
Ras Laffan Liquefied Natural Gas Co., Ltd. III | | | | | |
6.75%, 09/30/2019 -144A | | 1,615 | | 1,781 | |
Weatherford International, Ltd. | | | | | |
9.63%, 03/01/2019 | | 1,500 | | 1,857 | |
Paper & Forest Products - 2.4% | | | | | |
Ainsworth Lumber Co., Ltd. | | | | | |
11.00%, 07/29/2015 -144A | | 1,435 | | 890 | |
Exopack Holding, Inc. | | | | | |
11.25%, 02/01/2014 | | 2,000 | | 2,030 | |
Weyerhaeuser Co. | | | | | |
6.75%, 03/15/2012 | | 1,300 | | 1,362 | |
Pipelines - 0.5% | | | | | |
Regency Energy Partners | | | | | |
9.38%, 06/01/2016 -144A | | 850 | | 897 | |
Real Estate Investment Trusts - 5.3% | | | | | |
Dexus Property Group | | | | | |
7.13%, 10/15/2014 -144A | | 1,655 | | 1,671 | |
Duke Realty, LP | | | | | |
7.38%, 02/15/2015 | | 1,350 | | 1,423 | |
Healthcare Realty Trust, Inc. | | | | | |
8.13%, 05/01/2011 | | 1,480 | | 1,553 | |
PPF Funding, Inc. | | | | | |
5.35%, 04/15/2012 -144A | | 1,720 | | 1,509 | |
Simon Property Group, LP | | | | | |
10.35%, 04/01/2019 | | 1,350 | | 1,698 | |
WEA Finance LLC/WT Finance Aust Pty, Ltd. | | | | | |
6.75%, 09/02/2019 -144A | | 1,610 | | 1,640 | |
Real Estate Management & Development - 0.9% | | | | | |
Post Apartment Homes, LP | | | | | |
5.45%, 06/01/2012 | | 1,600 | | 1,591 | |
Road & Rail - 0.6% | | | | | |
Kansas City Southern de Mexico SA de CV | | | | | |
12.50%, 04/01/2016 -144A | | 1,000 | | 1,123 | |
Specialty Retail - 0.7% | | | | | |
Michaels Stores, Inc. | | | | | |
11.38%, 11/01/2016 Λ | | 1,200 | | 1,161 | |
Transportation Infrastructure - 0.9% | | | | | |
Erac USA Finance Co. | | | | | |
8.00%, 01/15/2011 -144A | | 1,400 | | 1,472 | |
Kansas City Southern de Mexico SA de CV | | | | | |
7.63%, 12/01/2013 | | 360 | | 346 | |
Wireless Telecommunication Services - 0.6% | | | | | |
Centennial Communications Corp. | | | | | |
6.04%, 01/01/2013 * | | 1,000 | | 993 | |
Total Corporate Debt Securities (cost $114,258) | | | | 121,247 | |
| | | | | |
| | Shares | | | |
CONVERTIBLE PREFERRED STOCKS - 1.4% | | | | | |
Diversified Financial Services - 0.9% | | | | | |
Vale Capital II 6.75% pΛ | | 22,000 | | 1,736 | |
Road & Rail - 0.5% | | | | | |
Kansas City Southern 5.13% p | | 880 | | 833 | |
Total Convertible Preferred Stocks (cost $2,407) | | | | 2,569 | |
| | | | | |
PREFERRED STOCKS - 1.4% | | | | | |
Commercial Banks - 0.5% | | | | | |
BB&T Capital Trust VI 9.60% p | | 34,000 | | 901 | |
Diversified Telecommunication Services - 0.9% | | | | | |
Centaur Funding Corp. 9.08% -144A p | | 1,661 | | 1,667 | |
Total Preferred Stocks (cost $3,003) | | | | 2,568 | |
| | | | | |
COMMON STOCKS - 4.2% | | | | | |
Auto Components - 0.9% | | | | | |
BorgWarner, Inc. | | 52,000 | | 1,577 | |
Hotels, Restaurants & Leisure - 0.8% | | | | | |
Yum! Brands, Inc. | | 42,000 | | 1,384 | |
Internet & Catalog Retail - 1.0% | | | | | |
Amazon.com, Inc. ‡ | | 15,000 | | 1,781 | |
Oil, Gas & Consumable Fuels - 0.7% | | | | | |
Petroleo Brasileiro SA -Class A | | 32,000 | | 1,284 | |
Software - 0.8% | | | | | |
Activision Blizzard, Inc. ‡ | | 130,000 | | 1,408 | |
Total Common Stocks (cost $7,522) | | | | 7,434 | |
| | | | | |
| | Principal | | | |
CONVERTIBLE BONDS - 2.2% | | | | | |
Diversified Telecommunication Services - 0.7% | | | | | |
Lucent Technologies, Inc. | | | | | |
2.88%, 06/15/2023 Ђ | | $ | 1,350 | | 1,330 | |
Pharmaceuticals - 1.0% | | | | | |
Allergan, Inc. | | | | | |
1.50%, 04/01/2026 | | 1,500 | | 1,676 | |
Semiconductors & Semiconductor Equipment - 0.5% | | | | | |
Intel Corp. | | | | | |
2.95%, 12/15/2035 * | | 900 | | 824 | |
Total Convertible Bonds (cost $3,667) | | | | 3,830 | |
| | | | | |
REPURCHASE AGREEMENT - 2.3% | | | | | |
State Street Repurchase Agreement 0.01%, dated 10/30/2009, to be repurchased at $4,169 on 11/02/2009. Collateralized by a U.S. Government Agency Obligation, 4.00%, due 12/15/2017, and with a value of $4,257. | | 4,169 | | 4,169 | |
Total Repurchase Agreement (cost $4,169) | | | | | |
| | | | | |
| | Shares | | | |
SECURITIES LENDING COLLATERAL - 2.3% | | | | | |
State Street Navigator Securities Lending Trust - Prime Portfolio, 0.35% p | | 4,074,953 | | 4,075 | |
Total Securities Lending Collateral (cost $4,075) | | | | | |
| | | | | |
Total Investment Securities (cost $173,530) # | | | | 181,560 | |
Other Assets and Liabilities - Net | | | | (4,071 | ) |
Net Assets | | | | $ | 177,489 | |
| | | | | | | | |
The notes to the financial statements are an integral part of this report.
39
(all amounts in thousands)
FORWARD FOREIGN CURRENCY CONTRACTS:
Currency | | (Sold) | | Settlement
Date | | Amount in U.S.
Dollars (Sold) | | Net Unrealized
Appreciation | |
Euro | | (1,450 | ) | 01/29/2010 | | $ | (2,144 | ) | | $ | 11 | |
| | | | | | | | | | | | |
NOTES TO SCHEDULE OF INVESTMENTS:
Λ All or a portion of this security is on loan. The value of all securities on loan is $3,993.
Ž The security has a perpetual maturity. The date shown is the next call date.
p Rate shown reflects yield at 10/31/2009.
Ђ Step bond. Interest rate may increase or decrease as the credit rating changes.
Ə Security fair valued as determined in good faith in accordance with procedures established by the Board of Trustees. This security had a Market Value of $3,176, or 1.79% of the fund’s net assets.
‡ Non-income producing security.
■ Coupon rate is fixed for a predetermined period of time and then converts to a floating rate until maturity/call date. Rate is listed as of 10/31/2009.
* Floating or variable rate note. Rate is listed as of 10/31/2009.
Џ In default.
# Aggregate cost for federal income tax purposes is $173,581. Aggregate gross unrealized appreciation/depreciation for all securities in which there is an excess of value over tax cost were $11,229 and $3,250, respectively. Net unrealized appreciation for tax purposes is $7,979.
DEFINITIONS:
144A 144A Securities are registered pursuant to Rule 144A of the Securities Act of 1933. These securities are deemed to be liquid for purposes of compliance limitations on holdings of illiquid securities and may be resold as transactions exempt from registration, normally to qualified institutional buyers. At 10/31/2009, these securities aggregated $66,168, or 37.28%, of the fund’s net assets.
AUD Australian Dollar
EUR Euro
REMIC Real Estate Mortgage Investment Conduits (consist of a fixed pool of mortgages broken apart and marketed to investors as individual securities)
VALUATION SUMMARY:
Investment Securities | | Level 1 | | Level 2 | | Level 3 | | Total | |
Equities - Consumer Discretionary | | $ | 4,743 | | $ | — | | $ | — | | $ | 4,743 | |
Equities - Energy | | 1,284 | | — | | — | | 1,284 | |
Equities - Financials | | 2,637 | | — | | — | | 2,637 | |
Equities - Industrials | | — | | 833 | | — | | 833 | |
Equities - Information Technology | | 1,408 | | — | | — | | 1,408 | |
Equities - Telecommunication Services | | 1,667 | | — | | — | | 1,667 | |
Fixed Income - Asset-Backed Security | | — | | 995 | | — | | 995 | |
Fixed Income - Consumer Discretionary | | — | | 12,741 | | — | | 12,741 | |
Fixed Income - Consumer Staples | | — | | 6,100 | | — | | 6,100 | |
Fixed Income - Energy | | — | | 13,146 | | — | | 13,146 | |
Fixed Income - Financials | | — | | 46,111 | | — | | 46,111 | |
Fixed Income - Foreign Government Obligation | | — | | 7,226 | | — | | 7,226 | |
Fixed Income - Health Care | | — | | 1,676 | | — | | 1,676 | |
Fixed Income - Industrials | | — | | 14,889 | | — | | 14,889 | |
Fixed Income - Information Technology | | — | | 2,741 | | — | | 2,741 | |
Fixed Income - Materials | | — | | 18,653 | | — | | 18,653 | |
Fixed Income - Mortgage-Backed Security | | — | | 23,838 | | — | | 23,838 | |
Fixed Income - Telecommunication Services | | — | | 3,637 | | — | | 3,637 | |
Fixed Income - U.S. Government Obligation | | — | | 3,609 | | — | | 3,609 | |
Fixed Income - Utilities | | — | | 5,382 | | — | | 5,382 | |
Cash & Cash Equivalent - Repurchase Agreement | | — | | 4,169 | | — | | 4,169 | |
Cash & Cash Equivalent - Securities Lending Collateral | | 4,075 | | — | | — | | 4,075 | |
Total | | $ | 15,814 | | $ | 165,746 | | $ | — | | $ | 181,560 | |
Other Financial Instruments* | | Level 1 | | Level 2 | | Level 3 | | Total | |
Forward Foreign Currency Contracts | | $ | — | | $ | 11 | | $ | — | | $ | 11 | |
| | | | | | | | | | | | | |
* Other financial instruments are derivative instruments. Future Contracts, Forward Foreign Currency Contracts and Swap Contracts are valued at unrealized appreciation (depreciation) on the instrument.
The notes to the financial statements are an integral part of this report.
40
Transamerica Growth Opportunities
SCHEDULE OF INVESTMENTS
At October 31, 2009
(all amounts except share amounts in thousands)
| | Shares | | Value | |
COMMON STOCKS - 96.3% | | | | | |
Aerospace & Defense - 4.1% | | | | | |
Precision Castparts Corp. | | 78,869 | | $ | 7,534 | |
Air Freight & Logistics - 2.0% | | | | | |
CH Robinson Worldwide, Inc. | | 67,440 | | 3,717 | |
Auto Components - 3.5% | | | | | |
BorgWarner, Inc. | | 215,400 | | 6,531 | |
Biotechnology - 0.7% | | | | | |
Onyx Pharmaceuticals, Inc. ‡ | | 47,900 | | 1,274 | |
Capital Markets - 6.7% | | | | | |
Cohen & Steers, Inc. Λ | | 114,685 | | 2,217 | |
Greenhill & Co., Inc. | | 71,655 | | 6,179 | |
T. Rowe Price Group, Inc. | | 80,005 | | 3,899 | |
Chemicals - 1.5% | | | | | |
Ecolab, Inc. | | 63,825 | | 2,806 | |
Commercial Banks - 3.1% | | | | | |
City National Corp. Λ | | 111,630 | | 4,205 | |
Marshall & Ilsley Corp. | | 299,840 | | 1,595 | |
Communications Equipment - 4.8% | | | | | |
Juniper Networks, Inc. ‡ | | 86,200 | | 2,199 | |
Palm, Inc. ‡Λ | | 417,245 | | 4,844 | |
Polycom, Inc. ‡ | | 88,500 | | 1,900 | |
Construction & Engineering - 1.0% | | | | | |
Jacobs Engineering Group, Inc. ‡ | | 44,995 | | 1,903 | |
Construction Materials - 2.0% | | | | | |
Martin Marietta Materials, Inc. | | 44,400 | | 3,699 | |
Diversified Consumer Services - 1.8% | | | | | |
Strayer Education, Inc. | | 16,195 | | 3,287 | |
Diversified Financial Services - 3.5% | | | | | |
MSCI, Inc. -Class A ‡ | | 210,760 | | 6,407 | |
Electrical Equipment - 4.2% | | | | | |
Cooper Industries PLC -Class A | | 119,100 | | 4,608 | |
Hubbell, Inc. -Class B | | 75,500 | | 3,211 | |
Energy Equipment & Services - 2.3% | | | | | |
Core Laboratories NV Λ | | 40,545 | | 4,229 | |
Health Care Equipment & Supplies - 5.6% | | | | | |
Idexx Laboratories, Inc. ‡Λ | | 61,600 | | 3,149 | |
Intuitive Surgical, Inc. ‡ | | 18,830 | | 4,640 | |
Masimo Corp. ‡ | | 97,265 | | 2,584 | |
Health Care Technology - 1.0% | | | | | |
Cerner Corp. ‡ | | 24,375 | | 1,853 | |
Internet & Catalog Retail - 3.9% | | | | | |
priceline.com, Inc. ‡ | | 45,400 | | 7,164 | |
Life Sciences Tools & Services - 1.5% | | | | | |
Covance, Inc. ‡ | | 35,005 | | 1,809 | |
Techne Corp. | | 14,915 | | 932 | |
Machinery - 8.2% | | | | | |
Donaldson Co., Inc. | | 30,100 | | 1,074 | |
Kennametal, Inc. | | 317,345 | | 7,476 | |
PACCAR, Inc. | | 174,900 | | 6,542 | |
Media - 1.6% | | | | | |
Dreamworks Animation SKG, Inc. -Class A ‡ | | 89,700 | | 2,870 | |
Oil, Gas & Consumable Fuels - 3.0% | | | | | |
Range Resources Corp. | | 112,170 | | 5,614 | |
Pharmaceuticals - 1.0% | | | | | |
Allergan, Inc. | | 33,900 | | 1,907 | |
Professional Services - 2.5% | | | | | |
Robert Half International, Inc. | | 200,970 | | 4,663 | |
Real Estate Management & Development - 1.5% | | | | | |
St. Joe Co. ‡ | | 117,600 | | 2,815 | |
Road & Rail - 2.1% | | | | | |
Kansas City Southern ‡ | | 159,500 | | 3,865 | |
Semiconductors & Semiconductor Equipment - 2.5% | | | | | |
Broadcom Corp. -Class A ‡ | | 89,290 | | 2,376 | |
Rovi Corp. ‡ | | 84,900 | | 2,339 | |
Software - 10.8% | | | | | |
Activision Blizzard, Inc. ‡ | | 535,837 | | 5,803 | |
Adobe Systems, Inc. ‡ | | 56,100 | | 1,848 | |
Informatica Corp. ‡ | | 169,300 | | 3,594 | |
Intuit, Inc. ‡ | | 87,000 | | 2,529 | |
Quality Systems, Inc. Λ | | 33,150 | | 2,023 | |
Salesforce.com, Inc. ‡ | | 71,500 | | 4,058 | |
Specialty Retail - 7.5% | | | | | |
Gap, Inc. | | 241,595 | | 5,156 | |
Guess?, Inc. | | 245,810 | | 8,984 | |
Textiles, Apparel & Luxury Goods - 0.7% | | | | | |
Under Armour, Inc. -Class A ‡Λ | | 46,700 | | 1,254 | |
Trading Companies & Distributors - 1.7% | | | | | |
WW Grainger, Inc. | | 32,800 | | 3,074 | |
Total Common Stocks (cost $169,942) | | | | 178,239 | |
| | | | | |
| | Principal | | | |
REPURCHASE AGREEMENT - 4.2% | | | | | |
State Street Repurchase Agreement 0.01%, dated 10/30/2009, to be repurchased at $7,807 on 11/02/2009. Collateralized by U.S. Government Agency Obligations, 4.00%, due 12/15/2017, and with a total value of $7,967. | | $ | 7,807 | | 7,807 | |
Total Repurchase Agreement (cost $7,807) | | | | | |
| | | | | |
| | Shares | | | |
SECURITIES LENDING COLLATERAL - 6.1% | | | | | |
State Street Navigator Securities Lending Trust - Prime Portfolio, 0.35% p | | 11,262,545 | | 11,263 | |
Total Securities Lending Collateral (cost $11,263) | | | | | |
| | | | | |
Total Investment Securities (cost $189,012) # | | | | 197,309 | |
Other Assets and Liabilities - Net | | | | (12,278 | ) |
| | | | | |
Net Assets | | | | $ | 185,031 | |
| | | | | | | |
The notes to the financial statements are an integral part of this report.
41
(all amounts in thousands)
NOTES TO SCHEDULE OF INVESTMENTS:
Λ | All or a portion of this security is on loan. The value of all securities on loan is $10,983. |
‡ | Non-income producing security. |
p | Rate shown reflects the yield at 10/31/2009. |
# | Aggregate cost for federal income tax purposes is $189,395. Aggregate gross unrealized appreciation/depreciation for all securities in which there is an excess of value over tax cost were $18,290 and $10,376, respectively. Net unrealized appreciation for tax purposes is $7,914. |
VALUATION SUMMARY:
Investment Securities | | Level 1 | | Level 2 | | Level 3 | | Total | |
Equities - Consumer Discretionary | | $ | 35,245 | | $ | — | | $ | — | | $ | 35,245 | |
Equities - Energy | | 9,843 | | — | | — | | 9,843 | |
Equities - Financials | | 27,317 | | — | | — | | 27,317 | |
Equities - Health Care | | 18,148 | | — | | — | | 18,148 | |
Equities - Industrials | | 51,367 | | — | | — | | 51,367 | |
Equities - Information Technology | | 33,513 | | — | | — | | 33,513 | |
Equities - Materials | | 2,806 | | — | | — | | 2,806 | |
Cash & Cash Equivalent - Repurchase Agreement | | — | | 7,807 | | — | | 7,807 | |
Cash & Cash Equivalent - Securities Lending Collateral | | 11,263 | | — | | — | | 11,263 | |
Total | | $ | 189,502 | | $ | 7,807 | | $ | — | | $ | 197,309 | |
The notes to the financial statements are an integral part of this report.
42
Transamerica High Yield Bond
SCHEDULE OF INVESTMENTS
At October 31, 2009
(all amounts in thousands)
| | Principal | | Value | |
CORPORATE DEBT SECURITIES - 92.3% | | | | | |
Aerospace & Defense - 2.1% | | | | | |
Alliant Techsystems, Inc. | | | | | |
6.75%, 04/01/2016 | | $ | 4,000 | | $ | 3,930 | |
BE Aerospace, Inc. | | | | | |
8.50%, 07/01/2018 | | 1,800 | | 1,872 | |
Hawker Beechcraft Acquisition Co. LLC | | | | | |
8.50%, 04/01/2015 Λ | | 3,740 | | 2,908 | |
L-3 Communications Corp. | | | | | |
6.13%, 01/15/2014 | | 1,000 | | 990 | |
Spirit Aerosystems, Inc. | | | | | |
7.50%, 10/01/2017 -144A | | 2,095 | | 2,079 | |
Auto Components - 0.3% | | | | | |
TRW Automotive, Inc. | | | | | |
7.00%, 03/15/2014 -144A | | 2,000 | | 1,860 | |
Beverages - 0.9% | | | | | |
Constellation Brands, Inc. | | | | | |
7.25%, 09/01/2016 | | 4,900 | | 4,912 | |
Building Products - 3.1% | | | | | |
Masco Corp. | | | | | |
7.75%, 08/01/2029 | | 2,000 | | 1,902 | |
Owens Corning, Inc. | | | | | |
7.00%, 12/01/2036 Ђ | | 7,940 | | 6,656 | |
9.00%, 06/15/2019 | | 1,500 | | 1,627 | |
Ply Gem Industries, Inc. | | | | | |
11.75%, 06/15/2013 Λ | | 8,520 | | 7,988 | |
Chemicals - 2.7% | | | | | |
Huntsman International LLC | | | | | |
7.38%, 01/01/2015 Ђ | | 6,400 | | 5,888 | |
Ineos Group Holdings PLC | | | | | |
8.50%, 02/15/2016 -144A | | 2,570 | | 1,439 | |
Nova Chemicals Corp. | | | | | |
4.54%, 11/15/2013 * | | 5,400 | | 4,860 | |
6.50%, 01/15/2012 | | 1,450 | | 1,421 | |
8.38%, 11/01/2016 -144A | | 2,000 | | 2,010 | |
Commercial Banks - 0.5% | | | | | |
Wells Fargo Capital XV | | | | | |
9.75%, 09/26/2013 ■Ž | | 2,625 | | 2,822 | |
Commercial Services & Supplies - 2.0% | | | | | |
Aramark Corp. | | | | | |
8.50%, 02/01/2015 | | 1,450 | | 1,465 | |
Ceridian Corp. | | | | | |
11.25%, 11/15/2015 Ђ | | 2,930 | | 2,820 | |
12.25%, 11/15/2015 ΏΛ | | 325 | | 293 | |
Hertz Corp. | | | | | |
8.88%, 01/01/2014 | | 4,150 | | 4,201 | |
Iron Mountain, Inc. | | | | | |
8.38%, 08/15/2021 | | 2,500 | | 2,588 | |
Computers & Peripherals - 0.3% | | | | | |
Seagate Technology HDD Holdings, Inc. | | | | | |
6.80%, 10/01/2016 | | 950 | | 931 | |
Seagate Technology International | | | | | |
10.00%, 05/01/2014 -144A | | 450 | | 500 | |
Consumer Finance - 3.4% | | | | | |
American General Finance Corp. | | | | | |
4.00%, 03/15/2011 | | 2,000 | | 1,717 | |
5.20%, 12/15/2011 | | 2,000 | | 1,614 | |
5.38%, 10/01/2012 | | 6,447 | | 4,970 | |
5.63%, 08/17/2011 | | 3,000 | | 2,530 | |
Ford Motor Credit Co. LLC | | | | | |
9.88%, 08/10/2011 | | 8,575 | | 8,771 | |
Containers & Packaging - 2.8% | | | | | |
Ball Corp. | | | | | |
7.13%, 09/01/2016 | | 2,865 | | 2,929 | |
7.38%, 09/01/2019 | | 1,760 | | 1,800 | |
Jefferson Smurfit Corp. | | | | | |
8.25%, 10/01/2012 ЏΛ | | 7,745 | | 5,964 | |
Owens-Brockway Glass Container, Inc. | | | | | |
6.75%, 12/01/2014 | | 3,235 | | 3,227 | |
Sealed Air Corp. | | | | | |
6.88%, 07/15/2033 -144A | | 2,100 | | 1,807 | |
Diversified Consumer Services - 0.8% | | | | | |
Service Corp. International | | | | | |
6.75%, 04/01/2015 | | 350 | | 340 | |
6.75%, 04/01/2016 * | | 4,300 | | 4,203 | |
7.00%, 06/15/2017 | | 175 | | 171 | |
Diversified Financial Services - 5.4% | | | | | |
AES Red Oak LLC - Series B | | | | | |
9.20%, 11/30/2029 | | 2,125 | | 1,891 | |
CIT Group, Inc. | | | | | |
0.56%, 07/28/2011 Џ | | 1,500 | | 975 | |
5.13%, 09/30/2014 Џ | | 2,500 | | 1,639 | |
5.40%, 03/07/2013 Џ | | 7,250 | | 4,713 | |
Firekeepers Development Authority | | | | | |
13.88%, 05/01/2015 -144A | | 2,800 | | 3,024 | |
GMAC, Inc. | | | | | |
6.75%, 12/01/2014 -144A | | 6,240 | | 5,664 | |
7.25%, 03/02/2011 -144A | | 3,150 | | 3,095 | |
Janus Capital Group, Inc. | | | | | |
6.70%, 06/15/2017 Ђ | | 1,400 | | 1,331 | |
JPMorgan Chase & Co. | | | | | |
7.90%, 04/30/2018 ■Ž | | 2,250 | | 2,262 | |
Nuveen Investments, Inc. | | | | | |
10.50%, 11/15/2015 -144A | | 7,310 | | 6,470 | |
Diversified Telecommunication Services - 6.9% | | | | | |
Frontier Communications Corp. | | | | | |
9.00%, 08/15/2031 | | 5,915 | | 5,840 | |
Intelsat Corp. | | | | | |
9.25%, 06/15/2016 | | 3,265 | | 3,321 | |
Qwest Communications International, Inc. | | | | | |
7.50%, 02/15/2014 Ђ | | 2,900 | | 2,842 | |
8.00%, 10/01/2015 -144A | | 3,500 | | 3,474 | |
Qwest Communications International, Inc. - Series B | | | | | |
7.50%, 02/15/2014 | | 2,615 | | 2,563 | |
Sprint Capital Corp. | | | | | |
6.90%, 05/01/2019 | | 4,920 | | 4,280 | |
8.75%, 03/15/2032 | | 2,650 | | 2,292 | |
Sprint Nextel Corp. | | | | | |
8.38%, 08/15/2017 | | 3,500 | | 3,378 | |
Telcordia Technologies, Inc. | | | | | |
4.03%, 07/15/2012 -144A * | | 6,035 | | 5,220 | |
Windstream Corp. | | | | | |
7.88%, 11/01/2017 -144A Λ | | 2,375 | | 2,399 | |
8.63%, 08/01/2016 | | 3,500 | | 3,596 | |
Electric Utilities - 2.9% | | | | | |
Elwood Energy LLC | | | | | |
8.16%, 07/05/2026 | | 5,411 | | 4,816 | |
Intergen NV | | | | | |
9.00%, 06/30/2017 -144A | | 5,100 | | 5,304 | |
Texas Competitive Electric Holdings Co. LLC | | | | | |
10.25%, 11/01/2015 ΛЂ | | 9,045 | | 6,422 | |
Electronic Equipment & Instruments - 0.4% | | | | | |
NXP BV | | | | | |
3.03%, 10/15/2013 * | | 2,940 | | 2,220 | |
| | | | | | | |
The notes to the financial statements are an integral part of this report.
43
| | Principal | | Value | |
Food & Staples Retailing - 1.7% | | | | | |
Rite Aid Corp. | | | | | |
7.50%, 03/01/2017 | | $ | 2,000 | | $ | 1,790 | |
10.38%, 07/15/2016 | | 1,700 | | 1,709 | |
SUPERVALU, Inc. | | | | | |
7.50%, 11/15/2014 | | 4,000 | | 4,002 | |
8.00%, 05/01/2016 | | 2,430 | | 2,473 | |
Food Products - 2.2% | | | | | |
Del Monte Corp. | | | | | |
6.75%, 02/15/2015 | | 1,075 | | 1,072 | |
7.50%, 10/15/2019 -144A | | 1,100 | | 1,117 | |
Dole Foods Co., Inc. | | | | | |
8.00%, 10/01/2016 -144A | | 3,450 | | 3,492 | |
Smithfield Foods, Inc. | | | | | |
7.75%, 07/01/2017 | | 4,375 | | 3,646 | |
Tyson Foods, Inc. | | | | | |
7.00%, 05/01/2018 | | 2,400 | | 2,294 | |
8.25%, 10/01/2011 | | 700 | | 739 | |
Gas Utilities - 1.6% | | | | | |
Dynegy Holdings, Inc. | | | | | |
7.75%, 06/01/2019 | | 10,540 | | 8,880 | |
Health Care Equipment & Supplies - 1.2% | | | | | |
Boston Scientific Corp. | | | | | |
6.25%, 11/15/2015 Ђ | | 1,100 | | 1,128 | |
6.40%, 06/15/2016 | | 1,125 | | 1,148 | |
Cooper Cos., Inc. | | | | | |
7.13%, 02/15/2015 | | 4,995 | | 4,844 | |
Health Care Providers & Services - 4.8% | | | | | |
Community Health Systems, Inc. | | | | | |
8.88%, 07/15/2015 | | 6,250 | | 6,437 | |
HCA, Inc. | | | | | |
8.50%, 04/15/2019 -144A | | 1,100 | | 1,166 | |
9.25%, 11/15/2016 | | 8,875 | | 9,274 | |
Omnicare, Inc. | | | | | |
6.13%, 06/01/2013 | | 3,900 | | 3,744 | |
6.88%, 12/15/2015 | | 600 | | 569 | |
U.S. Oncology, Inc. | | | | | |
9.13%, 08/15/2017 -144A | | 5,550 | | 5,855 | |
Hotels, Restaurants & Leisure - 7.1% | | | | | |
Harrah’s Operating Co., Inc. | | | | | |
10.00%, 12/15/2018 -144A | | 6,825 | | 5,187 | |
Mashantucket Western Pequot Tribe | | | | | |
8.50%, 11/15/2015 -144A | | 6,600 | | 2,112 | |
MGM Mirage, Inc. | | | | | |
5.88%, 02/27/2014 | | 2,500 | | 1,825 | |
6.75%, 04/01/2013 | | 3,000 | | 2,475 | |
7.50%, 06/01/2016 Λ | | 1,625 | | 1,243 | |
10.38%, 05/15/2014 -144A | | 500 | | 533 | |
Mohegan Tribal Gaming Authority | | | | | |
7.13%, 08/15/2014 | | 3,275 | | 2,293 | |
Royal Caribbean Cruises, Ltd. | | | | | |
7.00%, 06/15/2013 | | 4,950 | | 4,777 | |
7.25%, 06/15/2016 | | 500 | | 465 | |
Seminole Hard Rock Entertainment, Inc. | | | | | |
2.80%, 03/15/2014 -144A * | | 5,955 | | 4,794 | |
Seneca Gaming Corp. | | | | | |
7.25%, 05/01/2012 | | 5,400 | | 5,210 | |
Starwood Hotels & Resorts Worldwide, Inc. | | | | | |
6.75%, 05/15/2018 | | 1,600 | | 1,540 | |
7.88%, 10/15/2014 | | 2,000 | | 2,070 | |
Station Casinos, Inc. | | | | | |
6.00%, 04/01/2012 Џ | | 5,485 | | 1,241 | |
6.50%, 02/01/2014 Џ | | 2,620 | | 105 | |
WMG Acquisition Corp. | | | | | |
9.50%, 06/15/2016 -144A | | 2,150 | | 2,295 | |
Wynn Las Vegas Capital Corp. | | | | | |
6.63%, 12/01/2014 | | 2,200 | | 2,082 | |
Household Durables - 3.1% | | | | | |
Beazer Homes USA, Inc. | | | | | |
12.00%, 10/15/2017 -144A | | 450 | | 473 | |
D.R. Horton, Inc. | | | | | |
5.25%, 02/15/2015 | | 2,008 | | 1,855 | |
Jarden Corp. | | | | | |
7.50%, 05/01/2017 Λ | | 3,390 | | 3,339 | |
K Hovnanian Enterprises, Inc. | | | | | |
10.63%, 10/15/2016 -144A | | 3,000 | | 2,985 | |
Meritage Homes Corp. | | | | | |
6.25%, 03/15/2015 | | 5,795 | | 5,345 | |
Mohawk Industries, Inc. | | | | | |
6.88%, 01/15/2016 Ђ | | 3,475 | | 3,406 | |
Independent Power Producers & Energy Traders - 3.1% | | | | | |
Edison Mission Energy | | | | | |
7.00%, 05/15/2017 | | 4,800 | | 3,876 | |
7.20%, 05/15/2019 | | 5,000 | | 3,987 | |
7.75%, 06/15/2016 | | 2,000 | | 1,720 | |
LSP Energy, LP | | | | | |
7.16%, 01/15/2014 | | 3,024 | | 2,698 | |
NRG Energy, Inc. | | | | | |
7.25%, 02/01/2014 | | 3,520 | | 3,494 | |
7.38%, 01/15/2017 | | 2,000 | | 1,980 | |
Insurance - 1.8% | | | | | |
Genworth Financial, Inc. | | | | | |
6.15%, 11/15/2066 ■ | | 2,000 | | 1,340 | |
Liberty Mutual Group, Inc. | | | | | |
10.75%, 06/15/2058 -144A | | 4,400 | | 4,620 | |
Lincoln National Corp. | | | | | |
7.00%, 05/17/2066 ■ | | 5,250 | | 4,305 | |
IT Services - 3.0% | | | | | |
DI Finance | | | | | |
9.50%, 02/15/2013 | | 2,005 | | 2,045 | |
SunGard Data Systems, Inc. | | | | | |
9.13%, 08/15/2013 | | 4,010 | | 4,080 | |
10.25%, 08/15/2015 | | 4,200 | | 4,331 | |
Unisys Corp. | | | | | |
12.50%, 01/15/2016 | | 1,250 | | 1,150 | |
12.75%, 10/15/2014 -144A | | 2,372 | | 2,591 | |
14.25%, 09/15/2015 -144A | | 3,503 | | 3,766 | |
Machinery - 0.5% | | | | | |
Navistar International Corp. | | | | | |
8.25%, 11/01/2021 | | 2,690 | | 2,626 | |
Media - 3.8% | | | | | |
CSC Holdings, Inc. | | | | | |
7.63%, 07/15/2018 | | 4,650 | | 4,767 | |
8.50%, 06/15/2015 -144A | | 925 | | 977 | |
Dish DBS Corp. | | | | | |
6.63%, 10/01/2014 | | 1,990 | | 1,940 | |
7.75%, 05/31/2015 | | 3,080 | | 3,149 | |
| | | | | | | |
The notes to the financial statements are an integral part of this report.
44
| | Principal | | Value | |
Media (continued) | | | | | |
Lamar Media Corp. | | | | | |
6.63%, 08/15/2015 | | $ | 2,025 | | $ | 1,914 | |
9.75%, 04/01/2014 | | 750 | | 825 | |
Liberty Media LLC | | | | | |
5.70%, 05/15/2013 | | 2,500 | | 2,350 | |
RH Donnelley, Inc. | | | | | |
11.75%, 05/15/2015 -144A Џ | | 4,007 | | 2,284 | |
Umbrella Acquisition, Inc. | | | | | |
9.75%, 03/15/2015 -144A | | 2,447 | | 1,896 | |
Videotron Ltee | | | | | |
6.88%, 01/15/2014 | | 1,825 | | 1,825 | |
Metals & Mining - 1.5% | | | | | |
Steel Dynamics, Inc. | | | | | |
7.38%, 11/01/2012 | | 2,950 | | 2,961 | |
Teck Resources, Ltd. | | | | | |
9.75%, 05/15/2014 | | 900 | | 1,010 | |
10.25%, 05/15/2016 | | 2,250 | | 2,593 | |
U.S. Steel Corp. | | | | | |
7.00%, 02/01/2018 | | 1,950 | | 1,878 | |
Multiline Retail - 2.2% | | | | | |
Bon-Ton Department Stores, Inc. | | | | | |
10.25%, 03/15/2014 | | 5,125 | | 4,228 | |
JC Penney Corp., Inc. | | | | | |
7.40%, 04/01/2037 | | 2,000 | | 1,860 | |
7.65%, 08/15/2016 | | 2,000 | | 2,090 | |
Macy’s Retail Holdings, Inc. | | | | | |
7.45%, 07/15/2017 Λ | | 4,100 | | 3,977 | |
Multi-Utilities - 0.4% | | | | | |
CMS Energy Corp. | | | | | |
6.55%, 07/17/2017 | | 840 | | 818 | |
6.88%, 12/15/2015 | | 1,340 | | 1,376 | |
Oil, Gas & Consumable Fuels - 7.4% | | | | | |
Chesapeake Energy Corp. | | | | | |
6.88%, 01/15/2016 | | 2,000 | | 1,930 | |
7.00%, 08/15/2014 | | 3,400 | | 3,425 | |
7.25%, 12/15/2018 | | 830 | | 803 | |
7.63%, 07/15/2013 | | 100 | | 103 | |
Connacher Oil and Gas, Ltd. | | | | | |
10.25%, 12/15/2015 -144A | | 2,480 | | 2,133 | |
Continental Resources, Inc. | | | | | |
8.25%, 10/01/2019 -144A | | 1,140 | | 1,171 | |
El Paso Corp. | | | | | |
7.25%, 06/01/2018 | | 3,100 | | 3,095 | |
Forest Oil Corp. | | | | | |
7.25%, 06/15/2019 | | 2,000 | | 1,865 | |
7.75%, 05/01/2014 | | 275 | | 272 | |
Kinder Morgan Finance Co. | | | | | |
5.70%, 01/05/2016 | | 5,810 | | 5,526 | |
Mariner Energy, Inc. | | | | | |
8.00%, 05/15/2017 | | 1,555 | | 1,462 | |
Newfield Exploration Co. | | | | | |
6.63%, 09/01/2014 | | 2,175 | | 2,148 | |
7.13%, 05/15/2018 | | 295 | | 296 | |
Opti Canada, Inc. | | | | | |
7.88%, 12/15/2014 | | 2,500 | | 1,950 | |
8.25%, 12/15/2014 | | 2,100 | | 1,649 | |
Pioneer Natural Resources Co. | | | | | |
6.65%, 03/15/2017 | | 3,225 | | 3,084 | |
Plains Exploration & Production Co. | | | | | |
7.00%, 03/15/2017 | | 1,700 | | 1,615 | |
7.75%, 06/15/2015 | | 3,000 | | 2,963 | |
Tesoro Corp. | | | | | |
6.25%, 11/01/2012 | | 3,275 | | 3,218 | |
6.63%, 11/01/2015 | | 675 | | 621 | |
Whiting Petroleum Corp. | | | | | |
7.00%, 02/01/2014 | | 3,380 | | 3,367 | |
Paper & Forest Products - 5.3% | | | | | |
Abitibi-Consolidated, Inc. | | | | | |
13.75%, 04/01/2011 -144A Џ | | 3,200 | | 3,296 | |
Domtar Corp. | | | | | |
7.88%, 10/15/2011 | | 268 | | 279 | |
10.75%, 06/01/2017 | | 5,250 | | 6,024 | |
Georgia-Pacific LLC | | | | | |
7.00%, 01/15/2015 -144A | | 3,825 | | 3,863 | |
7.13%, 01/15/2017 -144A | | 1,153 | | 1,165 | |
International Paper Co. | | | | | |
9.38%, 05/15/2019 | | 2,000 | | 2,421 | |
Newpage Corp. | | | | | |
11.38%, 12/31/2014 -144A | | 800 | | 798 | |
Verso Paper Holdings LLC | | | | | |
11.38%, 08/01/2016 | | 3,000 | | 1,950 | |
11.50%, 07/01/2014 -144A | | 1,800 | | 1,917 | |
Westvaco Corp. | | | | | |
8.20%, 01/15/2030 | | 2,300 | | 2,303 | |
Weyerhaeuser Co. | | | | | |
7.38%, 03/15/2032 | | 7,150 | | 6,560 | |
Real Estate Investment Trusts - 2.2% | | | | | |
Host Hotels & Resorts, LP | | | | | |
7.13%, 11/01/2013 | | 3,155 | | 3,139 | |
9.00%, 05/15/2017 -144A Λ | | 2,250 | | 2,408 | |
iStar Financial, Inc. | | | | | |
5.88%, 03/15/2016 | | 5,000 | | 2,525 | |
8.63%, 06/01/2013 | | 5,000 | | 3,100 | |
10.00%, 06/15/2014 -144A Λ | | 1,500 | | 1,260 | |
Real Estate Management & Development - 0.9% | | | | | |
First Industrial, LP | | | | | |
5.75%, 01/15/2016 | | 2,000 | | 1,429 | |
Realogy Corp. | | | | | |
10.50%, 04/15/2014 Λ | | 5,305 | | 3,793 | |
Semiconductors & Semiconductor Equipment - 0.9% | | | | | |
Freescale Semiconductor, Inc. | | | | | |
10.13%, 12/15/2016 Λ | | 7,345 | | 5,215 | |
Software - 0.7% | | | | | |
First Data Corp. | | | | | |
9.88%, 09/24/2015 Λ | | 4,136 | | 3,815 | |
Specialty Retail - 0.7% | | | | | |
Blockbuster, Inc. | | | | | |
11.75%, 10/01/2014 -144A | | 3,800 | | 3,601 | |
Claire’s Stores, Inc. | | | | | |
9.63%, 06/01/2015 | | 500 | | 345 | |
Textiles, Apparel & Luxury Goods - 1.2% | | | | | |
Levi Strauss & Co. | | | | | |
8.88%, 04/01/2016 | | 1,200 | | 1,224 | |
9.75%, 01/15/2015 | | 5,480 | | 5,727 | |
Wireless Telecommunication Services - 0.5% | | | | | |
Nextel Communications, Inc. | | | | | |
6.88%, 10/31/2013 | | 3,125 | | 2,891 | |
Total Corporate Debt Securities (cost $522,619) | | | | 527,136 | |
| | | | | | | |
The notes to the financial statements are an integral part of this report.
45
(all amounts except share amounts in thousands)
| | Shares | | Value | |
PREFERRED STOCK - 0.2% | | | | | |
Diversified Financial Services - 0.2% | | | | | |
Preferred Blocker, Inc. 7.00% -144A p | | 2,228 | | $ | 1,361 | |
Total Preferred Stock (cost $701) | | | | | |
| | | | | |
COMMON STOCK - 0.3% | | | | | |
IT Services - 0.3% | | | | | |
Unisys Corp. ‡ | | 61,972 | | 1,806 | |
Total Common Stock (cost $1,487) | | | | | |
| | | | | |
| | Principal | | | |
REPURCHASE AGREEMENT - 4.7% | | | | | |
State Street Repurchase Agreement 0.01%, dated 10/30/2009, to be repurchased at $26,956 on 11/02/2009. Collateralized by U.S. Government Agency Obligations, 4.00%, due 12/15/2017, and with a total value of $27,496. | | $ | 26,956 | | 26,956 | |
Total Repurchase Agreement (cost $26,956) | | | | | |
| | | | | |
| | Shares | | | |
SECURITIES LENDING COLLATERAL - 5.5% | | | | | |
State Street Navigator Securities Lending Trust - Prime Portfolio, 0.35% p | | 31,426,978 | | $ | 31,427 | |
Total Securities Lending Collateral (cost $31,427) | | | | | |
| | | | | |
Total Investment Securities (cost $583,190) # | | | | 588,686 | |
Other Assets and Liabilities - Net | | | | (17,014 | ) |
| | | | | |
Net Assets | | | | $ | 571,672 | |
| | | | | | | |
NOTES TO SCHEDULE OF INVESTMENTS:
Ž | The security has a perpetual maturity. The date shown is the next call date. |
‡ | Non-income producing security. |
Џ | In default. |
Ђ | Step bond. Interest rate may increase or decrease as the credit rating changes. |
* | Floating or variable rate note. Rate is listed as of 10/31/2009. |
Λ | All or a portion of this security is on loan. The value of all securities on loan is $30,783. |
■ | Coupon rate is fixed for a predetermined period of time and then converts to a floating rate until maturity/call date. Rate is listed as of 10/31/2009. |
Ώ | Payment in-kind. Securities pay interest or dividends in the form of additional bonds or preferred stock. |
p | Rate shown reflects the yield at 10/31/2009. |
# | Aggregate cost for federal income tax purposes is $584,095. Aggregate gross unrealized appreciation/depreciation for all securities in which there is an excess of value over tax cost were $34,213 and $29,622, respectively. Net unrealized appreciation for tax purposes is $4,591. |
DEFINITIONS:
144A | 144A Securities are registered pursuant to Rule 144A of the Securities Act of 1933. These securities are deemed to be liquid for purposes of compliance limitations on holdings of illiquid securities and may be resold as transactions exempt from registration, normally to qualified institutional buyers. At 10/31/2009, these securities aggregated $113,463, or 19.85%, of the fund’s net assets. |
VALUATION SUMMARY:
Investment Securities | | Level 1 | | Level 2 | | Level 3 | | Total | |
Equities - Financials | | $ | 1,361 | | $ | — | | $ | — | | $ | 1,361 | |
Equities - Information Technology | | 1,806 | | — | | — | | 1,806 | |
Fixed Income - Consumer Discretionary | | — | | 108,320 | | — | | 108,320 | |
Fixed Income - Consumer Staples | | — | | 27,246 | | — | | 27,246 | |
Fixed Income - Energy | | — | | 51,576 | | — | | 51,576 | |
Fixed Income - Financials | | — | | 81,407 | | — | | 81,407 | |
Fixed Income - Health Care | | — | | 23,725 | | — | | 23,725 | |
Fixed Income - Industrials | | — | | 35,166 | | — | | 35,166 | |
Fixed Income - Information Technology | | — | | 33,965 | | — | | 33,965 | |
Fixed Income - Materials | | — | | 70,363 | | — | | 70,363 | |
Fixed Income - Telecommunication Services | | — | | 58,877 | | — | | 58,877 | |
Fixed Income - Utilities | | — | | 36,491 | | — | | 36,491 | |
Cash & Cash Equivalent - Repurchase Agreement | | — | | 26,956 | | — | | 26,956 | |
Cash & Cash Equivalent - Securities Lending Collateral | | 31,427 | | — | | — | | 31,427 | |
Total | | $ | 34,594 | | $ | 554,092 | | $ | — | | $ | 588,686 | |
The notes to the financial statements are an integral part of this report.
46
Transamerica Legg Mason Partners All Cap
SCHEDULE OF INVESTMENTS
At October 31, 2009
(all amounts except share amounts in thousands)
| | Shares | | Value | |
COMMON STOCKS - 97.1% | | | | | |
Aerospace & Defense - 4.6% | | | | | |
Boeing Co. | | 16,790 | | $ | 803 | |
Honeywell International, Inc. | | 29,270 | | 1,051 | |
Northrop Grumman Corp. | | 25,280 | | 1,267 | |
Air Freight & Logistics - 1.8% | | | | | |
United Parcel Service, Inc. -Class B | | 23,700 | | 1,272 | |
Capital Markets - 5.4% | | | | | |
Franklin Resources, Inc. | | 19,440 | | 2,034 | |
Morgan Stanley | | 6,500 | | 209 | |
State Street Corp. | | 34,286 | | 1,439 | |
Teton Advisors, Inc. -Class B ‡§Ə | | 89 | | ♦ | |
Commercial Banks - 1.1% | | | | | |
Comerica, Inc. | | 7,660 | | 213 | |
KeyCorp | | 102,060 | | 550 | |
Communications Equipment - 3.3% | | | | | |
Cisco Systems, Inc. ‡ | | 82,680 | | 1,889 | |
Telefonaktiebolaget LM Ericsson ADR | | 37,260 | | 388 | |
Construction & Engineering - 1.6% | | | | | |
Fluor Corp. | | 12,710 | | 564 | |
Jacobs Engineering Group, Inc. ‡ | | 6,080 | | 257 | |
Tutor Perini Corp. ‡ | | 16,970 | | 300 | |
Diversified Financial Services - 6.3% | | | | | |
Bank of America Corp. | | 135,080 | | 1,969 | |
JPMorgan Chase & Co. | | 57,860 | | 2,417 | |
Diversified Telecommunication Services - 1.4% | | | | | |
AT&T, Inc. | | 37,800 | | 970 | |
Energy Equipment & Services - 6.4% | | | | | |
Baker Hughes, Inc. | | 24,190 | | 1,018 | |
Halliburton Co. | | 44,680 | | 1,305 | |
Schlumberger, Ltd. | | 21,730 | | 1,352 | |
Weatherford International, Ltd. ‡ | | 41,310 | | 724 | |
Food & Staples Retailing - 3.3% | | | | | |
Safeway, Inc. | | 102,040 | | 2,278 | |
Food Products - 3.2% | | | | | |
Unilever PLC ADR | | 31,399 | | 937 | |
Unilever PLC | | 41,575 | | 1,242 | |
Hotels, Restaurants & Leisure - 1.2% | | | | | |
Carnival Corp. | | 21,820 | | 635 | |
Marriott International, Inc. -Class A | | 8,463 | | 212 | |
Household Durables - 0.8% | | | | | |
Toll Brothers, Inc. ‡ | | 29,820 | | 516 | |
Industrial Conglomerates - 2.3% | | | | | |
McDermott International, Inc. ‡ | | 72,220 | | 1,605 | |
Insurance - 3.2% | | | | | |
Allied World Assurance Co. Holdings, Ltd. | | 14,550 | | 651 | |
Chubb Corp. | | 32,100 | | 1,558 | |
Internet Software & Services - 1.7% | | | | | |
eBay, Inc. ‡ | | 52,930 | | 1,179 | |
Leisure Equipment & Products - 0.3% | | | | | |
Mattel, Inc. | | 9,600 | | 182 | |
Life Sciences Tools & Services - 1.1% | | | | | |
Enzo Biochem, Inc. ‡ | | 133,057 | | 733 | |
Machinery - 2.9% | | | | | |
Dover Corp. | | 19,130 | | 721 | |
PACCAR, Inc. | | 15,270 | | 571 | |
Parker Hannifin Corp. | | 13,760 | | 729 | |
Media - 2.5% | | | | | |
Walt Disney Co. | | 61,700 | | 1,689 | |
Metals & Mining - 0.7% | | | | | |
BHP Billiton, Ltd. ADR | | 2,830 | | 186 | |
Nucor Corp. | | 6,600 | | 263 | |
Oil, Gas & Consumable Fuels - 9.5% | | | | | |
Anadarko Petroleum Corp. | | 20,890 | | 1,273 | |
ConocoPhillips | | 16,010 | | 803 | |
Devon Energy Corp. | | 22,340 | | 1,446 | |
Hess Corp. | | 24,900 | | 1,363 | |
Murphy Oil Corp. | | 3,050 | | 186 | |
XTO Energy, Inc. | | 35,260 | | 1,465 | |
Paper & Forest Products - 0.9% | | | | | |
Weyerhaeuser Co. | | 17,050 | | 619 | |
Pharmaceuticals - 7.1% | | | | | |
Johnson & Johnson | | 24,660 | | 1,456 | |
Merck & Co., Inc. | | 55,268 | | 1,709 | |
Novartis AG ADR | | 33,960 | | 1,765 | |
Professional Services - 0.3% | | | | | |
Robert Half International, Inc. | | 7,480 | | 174 | |
Real Estate Investment Trusts - 0.4% | | | | | |
Lasalle Hotel Properties | | 16,280 | | 279 | |
Real Estate Management & Development - 1.3% | | | | | |
Jones Lang Lasalle, Inc. | | 18,480 | | 866 | |
Semiconductors & Semiconductor Equipment - 12.3% | | | | | |
Applied Materials, Inc. | | 141,980 | | 1,732 | |
Novellus Systems, Inc. ‡ | | 46,990 | | 967 | |
Samsung Electronics Co., Ltd. -144A GDR | | 8,600 | | 2,619 | |
Taiwan Semiconductor Manufacturing Co., Ltd. ADR | | 109,098 | | 1,041 | |
Texas Instruments, Inc. | | 76,340 | | 1,790 | |
Varian Semiconductor Equipment Associates, Inc. ‡ | | 5,700 | | 162 | |
Verigy, Ltd. ‡ | | 8,671 | | 85 | |
Software - 4.0% | | | | | |
Citrix Systems, Inc. ‡ | | 13,840 | | 509 | |
Lawson Software, Inc. ‡ | | 68,430 | | 432 | |
Microsoft Corp. | | 65,160 | | 1,806 | |
Specialty Retail - 4.1% | | | | | |
Gap, Inc. | | 43,550 | | 929 | |
Home Depot, Inc. | | 63,360 | | 1,590 | |
Williams-Sonoma, Inc. | | 20,270 | | 381 | |
Wireless Telecommunication Services - 2.1% | | | | | |
Vodafone Group PLC ADR | | 63,917 | | 1,419 | |
Total Common Stocks (cost $65,202) | | | | 66,744 | |
| | | | | |
| | Principal | | | |
REPURCHASE AGREEMENT - 3.0% | | | | | |
State Street Repurchase Agreement 0.01%, dated 10/30/2009, to be repurchased at $2,073 on 11/02/2009. Collateralized by a U.S. Government Agency Obligation, 4.00%, due 12/15/2017, and with a value of $2,118. | | $ | 2,073 | | 2,073 | |
Total Repurchase Agreement (cost $2,073) | | | | | |
| | | | | |
Total Investment Securities (cost $67,275) # | | | | 68,817 | |
Other Assets and Liabilities - Net | | | | (48 | ) |
| | | | | |
Net Assets | | | | $ | 68,769 | |
| | | | | | | |
The notes to the financial statements are an integral part of this report.
47
(all amounts in thousands)
NOTES TO SCHEDULE OF INVESTMENTS:
‡ | Non-income producing security. |
§ | Illiquid. This security aggregated to less than $1, or less than 0.00%, of the Fund’s net assets. |
Ə | Security fair valued as determined in good faith in accordance with procedures established by the Board of Trustees. This security aggregated to less than $1, or less than 0.00% of the fund’s net assets. |
♦ | Value is less than $1. |
# | Aggregate cost for federal income tax purposes is $67,526. Aggregate gross unrealized appreciation/depreciation for all securities in which there is an excess of value over tax cost were $10,905 and $9,614, respectively. Net unrealized appreciation for tax purposes is $1,291. |
DEFINITIONS:
144A | 144A Securities are registered pursuant to Rule 144A of the Securities Act of 1933. These securities are deemed to be liquid for purposes of compliance limitations on holdings of illiquid securities and may be resold as transactions exempt from registration, normally to qualified institutional buyers. At 10/31/2009, these securities aggregated $2,619, or 3.81%, of the fund’s net assets. |
ADR | American Depositary Receipt |
GDR | Global Depositary Receipt |
VALUATION SUMMARY:
Investment Securities | | Level 1 | | Level 2 | | Level 3 | | Total | |
Equities - Consumer Discretionary | | $ | 6,134 | | $ | — | | $ | — | | $ | 6,134 | |
Equities - Consumer Staples | | 4,457 | | — | | — | | 4,457 | |
Equities - Energy | | 10,935 | | — | | — | | 10,935 | |
Equities - Financials | | 12,185 | | — | | ♦ | | 12,185 | |
Equities - Health Care | | 5,663 | | — | | — | | 5,663 | |
Equities - Industrials | | 9,314 | | — | | — | | 9,314 | |
Equities - Information Technology | | 14,599 | | — | | — | | 14,599 | |
Equities - Materials | | 1,068 | | — | | — | | 1,068 | |
Equities - Telecommunication Services | | 2,389 | | — | | — | | 2,389 | |
Cash & Cash Equivalent - Repurchase Agreement | | — | | 2,073 | | — | | 2,073 | |
Total | | $ | 66,744 | | $ | 2,073 | | $ | — | | $ | 68,817 | |
Level 3 Rollforward
Securities | | Beginning
Balance at
10/31/2008 | | Net
Purchases/(Sales) | | Accrued
Discounts/(Premiums) | | Total Realized
Gain/(Loss) | | Total Change In Unrealized
Appreciation/(Depreciation) | | Net Transfers
In/(Out) of
Level 3 | | Ending
Balance at
10/31/2009 | |
Equities - Financials | | $ | — | | $ | ♦ | | $ | — | | $ | — | | $ | — | | $ | — | | $ | ♦ | |
| | | | | | | | | | | | | | | | | | | | | | |
The notes to the financial statements are an integral part of this report.
48
Transamerica Money Market
SCHEDULE OF INVESTMENTS
At October 31, 2009
(all amounts in thousands)
| | Principal | | Value | |
COMMERCIAL PAPER - 79.5% | | | | | |
Aerospace & Defense - 2.1% | | | | | |
Honeywell International, Inc. | | | | | |
0.13%, 12/21/2009 - 144A | | $ | 1,750 | | $ | 1,750 | |
0.16%, 12/31/2009 - 144A | | 1,150 | | 1,150 | |
0.22%, 12/28/2009 - 144A | | 2,500 | | 2,500 | |
Beverages - 3.6% | | | | | |
Coca-Cola Co. | | | | | |
0.13%, 11/12/2009 - 144A | | 3,100 | | 3,100 | |
0.14%, 12/18/2009 - 144A | | 2,950 | | 2,949 | |
0.16%, 12/17/2009 - 144A | | 1,100 | | 1,100 | |
0.20%, 12/14/2009 - 144A | | 2,300 | | 2,299 | |
Capital Markets - 0.4% | | | | | |
State Street Corp. | | | | | |
0.23%, 12/21/2009 | | 1,100 | | 1,100 | |
Chemicals - 3.4% | | | | | |
EI Du Pont de Nemours & Co. | | | | | |
0.13%, 11/03/2009 - 144A | | 9,000 | | 9,000 | |
Commercial Banks - 10.7% | | | | | |
Barclays Bank PLC | | | | | |
0.26%, 11/17/2009 | | 4,000 | | 4,000 | |
Toronto-Dominion Holdings USA, Inc. | | | | | |
0.15%, 11/03/2009 - 11/04/2009 -144A | | 11,300 | | 11,300 | |
UBS Finance Delaware LLC | | | | | |
0.14%, 12/14/2009 | | 5,400 | | 5,399 | |
0.21%, 12/17/2009 | | 7,300 | | 7,298 | |
Consumer Finance - 5.0% | | | | | |
Toyota Motor Credit Corp. | | | | | |
0.14%, 11/13/2009 | | 1,600 | | 1,600 | |
0.16%, 11/23/2009 - 12/04/2009 | | 11,450 | | 11,448 | |
Diversified Financial Services - 45.7% | | | | | |
Alpine Securitization | | | | | |
0.15%, 11/13/2009 - 144A | | 2,700 | | 2,700 | |
0.19%, 11/10/2009 - 11/24/2009 -144A | | 10,300 | | 10,298 | |
American Honda Finance Corp. | | | | | |
0.25%, 11/19/2009 - 12/02/2009 | | 8,000 | | 7,999 | |
0.33%, 11/18/2009 | | 4,400 | | 4,399 | |
Bank of America Corp. | | | | | |
0.40%, 12/07/2009 | | 2,600 | | 2,600 | |
CAFCO LLC | | | | | |
0.26%, 12/02/2009 - 144A | | 3,100 | | 3,099 | |
Caterpillar Financial Services Corp. | | | | | |
0.20%, 11/09/2009 | | 5,650 | | 5,650 | |
CIESCO LLC | | | | | |
0.25%, 01/21/2010 - 144A | | 5,800 | | 5,797 | |
0.26%, 01/06/2010 - 144A | | 4,200 | | 4,198 | |
General Electric Capital Corp. | | | | | |
0.17%, 12/15/2009 | | 3,130 | | 3,129 | |
0.18%, 12/29/2009 | | 3,100 | | 3,099 | |
0.23%, 12/03/2009 | | 1,650 | | 1,650 | |
General Electric Co. | | | | | |
0.17%, 12/28/2009 - 12/31/2009 | | 5,150 | | 5,149 | |
Metlife Funding, Inc. | | | | | |
0.17%, 11/02/2009 | | 1,500 | | 1,500 | |
0.26%, 11/20/2009 | | 7,300 | | 7,298 | |
Old Line Funding LLC | | | | | |
0.18%, 11/17/2009 - 144A | | 5,369 | | 5,369 | |
0.23%, 12/07/2009 - 144A | | 1,500 | | 1,500 | |
PACCAR Financial Corp. | | | | | |
0.15%, 11/25/2009 | | 2,118 | | 2,118 | |
0.18%, 01/27/2010 | | 3,000 | | 2,999 | |
0.20%, 01/12/2010 | | 4,200 | | 4,198 | |
0.21%, 12/14/2009 | | 2,900 | | 2,899 | |
Rabobank USA Financial Corp. | | | | | |
0.14%, 12/08/2009 | | 4,700 | | 4,700 | |
0.23%, 12/01/2009 - 12/10/2009 | | 7,400 | | 7,399 | |
Ranger Funding Co. LLC | | | | | |
0.22%, 12/07/2009 - 144A | | 2,600 | | 2,599 | |
Sheffield Receivables Corp. | | | | | |
0.20%, 11/05/2009 - 144A | | 1,200 | | 1,200 | |
0.28%, 11/06/2009 - 144A | | 3,000 | | 3,000 | |
Wal-Mart Funding Corp. | | | | | |
0.20%, 11/09/2009 - 144A | | 13,400 | | 13,398 | |
Food & Staples Retailing - 2.9% | | | | | |
Nestle Capital Corp. | | | | | |
0.16%, 12/17/2009 - 144A | | 7,700 | | 7,698 | |
Health Care Equipment & Supplies - 0.7% | | | | | |
Medtronic, Inc. | | | | | |
0.19%, 12/02/2009 - 144A | | 1,900 | | 1,900 | |
Oil, Gas & Consumable Fuels - 5.0% | | | | | |
Total Capital SA | | | | | |
0.14%, 12/30/2009 - 144A | | 8,200 | | 8,198 | |
Total Fina Elf Capital | | | | | |
0.14%, 11/06/2009 - 144A | | 4,800 | | 4,800 | |
Total Commercial Paper (cost $208,533) | | | | 208,533 | |
| | | | | |
CERTIFICATE OF DEPOSIT - 3.2% | | | | | |
Diversified Financial Services - 3.2% | | | | | |
Bank of America Corp. | | | | | |
0.50%, 12/14/2009 | | 8,400 | | 8,400 | |
Total Certificate of Deposit (cost $8,400) | | | | | |
| | | | | |
CORPORATE DEBT SECURITIES - 6.9% | | | | | |
Capital Markets - 4.6% | | | | | |
Goldman Sachs Group, Inc. * | | | | | |
0.33%, 11/16/2009 | | 1,000 | | 1,000 | |
0.52%, 11/16/2009 | | 11,037 | | 11,038 | |
Commercial Banks - 1.9% | | | | | |
Wachovia Corp. * | | | | | |
0.86%, 11/24/2009 | | 5,000 | | 5,001 | |
Diversified Financial Services - 0.4% | | | | | |
Caterpillar Financial Services Corp. * | | | | | |
0.73%, 02/08/2010 | | 1,145 | | 1,146 | |
Total Corporate Debt Securities (cost $18,185) | | | | 18,185 | |
| | | | | |
SHORT-TERM FOREIGN GOVERNMENT OBLIGATIONS - 10.1% | | | | | |
Province of Ontario Canada | | | | | |
0.18%, 01/08/2010 - 01/11/2010 | | 10,400 | | 10,396 | |
0.21%, 11/30/2009 | | 3,000 | | 2,999 | |
Province of Quebec Canada | | | | | |
0.15%, 11/23/2009 - 12/07/2009 -144A | | 4,050 | | 4,050 | |
0.18%, 12/15/2009 - 144A | | 2,000 | | 2,000 | |
0.25%, 12/02/2009 - 144A | | 7,000 | | 6,999 | |
Total Short-Term Foreign Government Obligations (cost $26,444) | | | | 26,444 | |
| | | | | | | |
The notes to the financial statements are an integral part of this report.
49
| | Principal | | Value | |
REPURCHASE AGREEMENT - 0.4% | | | | | |
State Street Repurchase Agreement 0.01%, dated 10/30/2009, to be repurchased at $1,143 on 11/02/2009. Collateralized by a U.S. Government Agency Obligation, 4.00%, due 12/25/2024, and with a value of $1,168. | | $ | 1,143 | | $ | 1,143 | |
Total Repurchase Agreement (cost $1,143) | | | | | |
| | | | | |
Total Investment Securities (cost $262,705) # | | | | 262,705 | |
Other Assets and Liabilities - Net | | | | (199 | ) |
| | | | | |
Net Assets | | | | $ | 262,506 | |
| | | | | | | |
NOTES TO SCHEDULE OF INVESTMENTS:
* | Floating or variable rate note. Rate is listed as of 10/31/2009. |
# | Aggregate cost for federal income tax purposes is $262,705. |
DEFINITIONS:
144A | 144A Securities are registered pursuant to Rule 144A of the Securities Act of 1933. These securities are deemed to be liquid for purposes of compliance limitations on holdings of illiquid securities and may be resold as transactions exempt from registration, normally to qualified institutional buyers. At 10/31/2009, these securities aggregated $123,951, or 47.22%, of the fund’s net assets. |
VALUATION SUMMARY:
Investment Securities | | Level 1 | | Level 2 | | Level 3 | | Total | |
Fixed Income - Consumer Staples | | $ | — | | $ | 17,147 | | $ | — | | $ | 17,147 | |
Fixed Income - Energy | | — | | 12,998 | | — | | 12,998 | |
Fixed Income - Financials | | — | | 188,675 | | — | | 188,675 | |
Fixed Income - Health Care | | — | | 1,900 | | — | | 1,900 | |
Fixed Income - Industrials | | — | | 5,398 | | — | | 5,398 | |
Fixed Income - Materials | | — | | 9,000 | | — | | 9,000 | |
Fixed Income - Short-Term Foreign Government Obligation | | — | | 26,444 | | — | | 26,444 | |
Cash & Cash Equivalent - Repurchase Agreement | | — | | 1,143 | | — | | 1,143 | |
Total | | $ | — | | $ | 262,705 | | $ | — | | $ | 262,705 | |
The notes to the financial statements are an integral part of this report.
50
Transamerica Science & Technology
SCHEDULE OF INVESTMENTS
At October 31, 2009
(all amounts except share amounts in thousands)
| | Shares | | Value | |
COMMON STOCKS - 97.9% | | | | | |
Aerospace & Defense - 2.1% | | | | | |
Hexcel Corp. ‡ | | 124,165 | | $ | 1,366 | |
Biotechnology - 8.0% | | | | | |
Alexion Pharmaceuticals, Inc. ‡ | | 42,800 | | 1,901 | |
Gilead Sciences, Inc. ‡ | | 19,490 | | 829 | |
Human Genome Sciences, Inc. ‡ | | 132,200 | | 2,471 | |
Communications Equipment - 17.3% | | | | | |
Brocade Communications Systems, Inc. ‡ | | 130,355 | | 1,118 | |
Cisco Systems, Inc. ‡ | | 28,950 | | 662 | |
F5 Networks, Inc. ‡ | | 52,430 | | 2,354 | |
Juniper Networks, Inc. ‡ | | 43,100 | | 1,099 | |
Palm, Inc. ‡ | | 210,885 | | 2,449 | |
Polycom, Inc. ‡ | | 107,000 | | 2,297 | |
QUALCOMM, Inc. | | 32,490 | | 1,345 | |
Computers & Peripherals - 6.4% | | | | | |
Apple, Inc. ‡ | | 15,055 | | 2,838 | |
EMC Corp./Massachusetts ‡ | | 81,705 | | 1,346 | |
Diversified Consumer Services - 1.1% | | | | | |
Capella Education Co. ‡ | | 10,615 | | 731 | |
Diversified Telecommunication Services - 4.0% | | | | | |
AT&T, Inc. | | 53,205 | | 1,366 | |
Verizon Communications, Inc. | | 42,460 | | 1,256 | |
Electronic Equipment & Instruments - 3.0% | | | | | |
DTS, Inc. ‡ | | 68,300 | | 1,929 | |
Health Care Equipment & Supplies - 4.3% | | | | | |
Intuitive Surgical, Inc. ‡ | | 6,000 | | 1,478 | |
NuVasive, Inc. ‡ | | 37,375 | | 1,356 | |
Internet & Catalog Retail - 7.7% | | | | | |
Amazon.com, Inc. ‡ | | 27,855 | | 3,310 | |
priceline.com, Inc. ‡ | | 10,805 | | 1,705 | |
Internet Software & Services - 8.8% | | | | | |
Equinix, Inc. ‡ | | 28,755 | | 2,453 | |
Google, Inc. -Class A ‡ | | 3,730 | | 2,000 | |
Vocus, Inc. ‡ | | 71,283 | | 1,290 | |
Semiconductors & Semiconductor Equipment - 7.4% | | | | | |
Broadcom Corp. -Class A ‡ | | 45,000 | | | 1,197 | |
Intel Corp. | | 96,000 | | 1,835 | |
Rovi Corp. ‡ | | 65,000 | | 1,791 | |
Software - 20.0% | | | | | |
Activision Blizzard, Inc. ‡ | | 219,000 | | 2,371 | |
Citrix Systems, Inc. ‡ | | 35,000 | | 1,287 | |
Concur Technologies, Inc. ‡ | | 44,775 | | 1,596 | |
Informatica Corp. ‡ | | 60,410 | | 1,283 | |
Microsoft Corp. | | 66,000 | | 1,830 | |
Nuance Communications, Inc. ‡ | | 137,735 | | 1,806 | |
Salesforce.com, Inc. ‡ | | 51,660 | | 2,931 | |
Wireless Telecommunication Services - 7.8% | | | | | |
American Tower Corp. -Class A ‡ | | 30,560 | | 1,125 | |
NII Holdings, Inc. ‡ | | 57,450 | | 1,548 | |
SBA Communications Corp. -Class A ‡ | | 36,800 | | 1,038 | |
Sprint Nextel Corp. ‡ | | 470,000 | | 1,391 | |
Total Common Stocks (cost $53,352) | | | | 63,978 | |
| | | | | |
| | Principal | | | |
REPURCHASE AGREEMENT - 0.7% | | | | | |
State Street Repurchase Agreement 0.01%, dated 10/30/2009, to be repurchased at $444 on 11/02/2009. Collateralized by a U.S. Government Agency Obligation, 4.00%, due 12/15/2017, and with a value of $454. | | $ | 444 | | 444 | |
Total Repurchase Agreement (cost $444) | | | | | |
| | | | | |
Total Investment Securities (cost $53,796) # | | | | 64,422 | |
Other Assets and Liabilities - Net | | | | 906 | |
| | | | | |
Net Assets | | | | $ | 65,328 | |
| | | | | | | |
NOTES TO SCHEDULE OF INVESTMENTS:
‡ | Non-income producing security. |
# | Aggregate cost for federal income tax purposes is $53,813. Aggregate gross unrealized appreciation/depreciation for all securities in which there is an excess of value over tax cost were $13,725 and $3,116, respectively. Net unrealized appreciation for tax purposes is $10,609. |
VALUATION SUMMARY:
Investment Securities | | Level 1 | | Level 2 | | Level 3 | | Total | |
Equities - Consumer Discretionary | | $ | 5,746 | | $ | — | | $ | — | | $ | 5,746 | |
Equities - Health Care | | 8,035 | | — | | — | | 8,035 | |
Equities - Industrials | | 1,366 | | — | | — | | 1,366 | |
Equities - Information Technology | | 39,762 | | — | | — | | 39,762 | |
Equities - Telecommunication Services | | 9,069 | | — | | — | | 9,069 | |
Cash & Cash Equivalent - Repurchase Agreement | | — | | 444 | | — | | 444 | |
Total | | $ | 63,978 | | $ | 444 | | $ | — | | $ | 64,422 | |
The notes to the financial statements are an integral part of this report.
51
Transamerica Short-Term Bond
SCHEDULE OF INVESTMENTS
At October 31, 2009
(all amounts in thousands)
| | Principal | | Value | |
U.S. GOVERNMENT AGENCY OBLIGATIONS - 6.8% | | | | | |
Fannie Mae | | | | | |
4.50%, 03/25/2017 - 04/25/2030 | | $ | 14,590 | | $ | 15,023 | |
5.00%, 10/25/2032 - 06/25/2034 | | 14,699 | | 15,228 | |
5.50%, 03/25/2026 | | 7,149 | | 7,540 | |
Freddie Mac | | | | | |
3.75%, 12/15/2011 | | 2,640 | | 2,666 | |
4.00%, 10/15/2029 | | 3,762 | | 3,833 | |
4.50%, 02/15/2027 | | 3,412 | | 3,504 | |
4.84%, 06/01/2035 * | | 7,153 | | 7,289 | |
5.00%, 06/15/2027 - 11/15/2032 | | 8,683 | | 8,964 | |
5.50%, 01/15/2029 | | 12,754 | | 12,956 | |
5.52%, 02/01/2038 * | | 5,853 | | 6,158 | |
5.56%, 08/01/2037 * | | 1,680 | | 1,772 | |
Ginnie Mae | | | | | |
4.50%, 01/17/2033 | | 4,063 | | 4,154 | |
Total U.S. Government Agency Obligations
(cost $85,621) | | | | 89,087 | |
| | | | | |
FOREIGN GOVERNMENT OBLIGATION - 0.9% | | | | | |
Australia Government Bond | | | | | |
5.25%, 08/15/2010 | | AUD | 13,600 | | 12,328 | |
Total Foreign Government Obligation
(cost $12,687) | | | | | |
| | | | | |
MORTGAGE-BACKED SECURITIES - 11.5% | | | | | |
American Tower Trust | | | | | |
Series 2007-1A, Class AFX | | | | | |
5.42%, 04/15/2037 -144A | | $ | 6,000 | | 6,060 | |
Series 2007-1A, Class B | | | | | |
5.54%, 04/15/2037 -144A | | 4,750 | | 4,750 | |
Series 2007-1A, Class D | | | | | |
5.96%, 04/15/2037 -144A | | 500 | | 500 | |
BCAP LLC Trust | | | | | |
Series 2009-RR10, Class 2A1 | | | | | |
4.92%, 08/26/2035 -144A Ə * | | 5,876 | | 5,612 | |
Series 2009-RR3, Class 1A2 | | | | | |
6.00%, 11/26/2036 -144A | | 3,925 | | 3,768 | |
Series 2009-RR3, Class 2A1 | | | | | |
5.65%, 05/26/2037 -144A | | 5,675 | | 5,448 | |
Series 2009-RR6, Class 2A1 | | | | | |
5.36%, 08/26/2035 -144A | | 6,646 | | 6,380 | |
Crown Castle Towers LLC | | | | | |
Series 2005-1A, Class AFX | | | | | |
4.64%, 06/15/2035 -144A | | 7,715 | | 7,773 | |
Series 2005-1A, Class B | | | | | |
4.88%, 06/15/2035 -144A | | 1,250 | | 1,256 | |
Series 2005-1A, Class C | | | | | |
5.07%, 06/15/2035 -144A | | 10,404 | | 10,456 | |
Series 2006-1A, Class B | | | | | |
5.36%, 11/15/2036 -144A | | 13,855 | | 14,131 | |
Series 2006-1A, Class C | | | | | |
5.47%, 11/15/2036 -144A | | 9,000 | | 9,191 | |
Global Tower Partners Acquisition Partners LLC | | | | | |
Series 2007-1A, Class AFL | | | | | |
0.45%, 05/15/2037 -144A * | | 8,000 | | 7,480 | |
Series 2007-1A, Class B | | | | | |
5.52%, 05/15/2037 -144A | | 8,880 | | 8,525 | |
Jefferies & Co., Inc. | | | | | |
Series 2009-R2, Class 2A | | | | | |
6.55%, 12/26/2037 -144A | | 4,080 | | 3,794 | |
Series 2009-R2, Class 3A | | | | | |
5.85%, 01/26/2047 -144A | | 5,066 | | 4,661 | |
Series 2009-R7, Class 10A3 | | | | | |
6.00%, 12/26/2036 -144A | | 3,691 | | 3,518 | |
Series 2009-R7, Class 11A1 | | | | | |
5.32%, 03/26/2037 -144A | | 6,353 | | 6,099 | |
Series 2009-R7, Class 12A1 | | | | | |
5.50%, 08/26/2036 -144A | | 4,430 | | 4,252 | |
Series 2009-R7, Class 16A1 | | | | | |
5.68%, 12/26/2036 -144A * | | 3,785 | | 3,795 | |
Series 2009-R7, Class 4A1 | | | | | |
3.74%, 09/26/2034 -144A * | | 4,733 | | 4,495 | |
Series 2009-R9, Class 1A1 | | | | | |
5.84%, 08/26/2046 -144A | | 10,796 | | 10,472 | |
JP Morgan Re-REMIC | | | | | |
Series 2009-7, Class 8A1 | | | | | |
5.82%, 01/27/2047 -144A | | 5,782 | | 5,619 | |
Small Business Administration Trust | | | | | |
Series 2006-1A, Class E | | | | | |
6.17%, 11/15/2036 -144A | | 5,533 | | 5,492 | |
Series 2006-1A, Class A | | | | | |
5.31%, 11/15/2036 -144A | | 3,700 | | 3,719 | |
Wells Fargo Mortgage Backed Securities Trust | | | | | |
Series 2003-G, Class A1 | | | | | |
4.10%, 06/25/2033 * | | 4,333 | | 4,226 | |
Total Mortgage-Backed Securities (cost $145,633) | | | | 151,472 | |
| | | | | |
ASSET-BACKED SECURITIES - 2.1% | | | | | |
American Airlines Pass-Through Trust | | | | | |
Series 2001-2, Class A2 | | | | | |
7.86%, 10/01/2011 | | 7,000 | | 6,965 | |
Delta Air Lines, Inc. | | | | | |
Series 2000-1, Class A-2 | | | | | |
7.57%, 05/18/2012 | | 11,350 | | 11,350 | |
PF Export Receivables Master Trust | | | | | |
6.44%, 06/01/2015 -144A | | 9,187 | | 9,412 | |
Total Asset-Backed Securities (cost $27,740) | | | | 27,727 | |
| | | | | |
CORPORATE DEBT SECURITIES - 76.0% | | | | | |
Airlines - 0.4% | | | | | |
Continental Airlines, Inc. | | | | | |
6.50%, 12/15/2012 | | 2,230 | | 2,208 | |
7.49%, 10/02/2010 | | 3,061 | | 3,015 | |
Auto Components - 0.6% | | | | | |
Johnson Controls, Inc. | | | | | |
5.25%, 01/15/2011 | | 7,600 | | 7,867 | |
Automobiles - 0.2% | | | | | |
Daimler Finance North America LLC | | | | | |
5.88%, 03/15/2011 | | 3,100 | | 3,234 | |
Beverages - 2.9% | | | | | |
Anheuser-Busch InBev Worldwide, Inc. | | | | | |
3.00%, 10/15/2012 -144A | | 9,930 | | 10,016 | |
Bacardi, Ltd. | | | | | |
7.45%, 04/01/2014 -144A | | 3,480 | | 3,977 | |
Diageo Capital PLC | | | | | |
4.38%, 05/03/2010 | | 4,870 | | 4,966 | |
Foster’s Finance Corp. | | | | | |
6.88%, 06/15/2011 -144A | | 6,225 | | 6,645 | |
| | | | | | | | |
The notes to the financial statements are an integral part of this report.
52
| | Principal | | Value | |
Beverages (continued) | | | | | |
Molson Coors Capital Finance ULC | | | | | |
4.85%, 09/22/2010 | | $ | 5,000 | | $ | 5,170 | |
SABMiller PLC | | | | | |
6.20%, 07/01/2011 -144A | | 6,301 | | 6,708 | |
Capital Markets - 1.8% | | | | | |
Goldman Sachs Group, Inc. | | | | | |
0.52%, 11/16/2009 * | | 6,100 | | 6,100 | |
Macquarie Group, Ltd. | | | | | |
7.30%, 08/01/2014 -144A | | 5,493 | | 5,962 | |
Morgan Stanley | | | | | |
0.53%, 01/18/2011 * | | 8,700 | | 8,626 | |
4.75%, 04/01/2014 | | 2,500 | | 2,508 | |
Chemicals - 3.0% | | | | | |
Chevron Phillips Chemical Co. LLC | | | | | |
7.00%, 03/15/2011 | | 6,800 | | 7,195 | |
Cytec Industries, Inc. | | | | | |
5.50%, 10/01/2010 | | 5,880 | | 5,965 | |
Dow Chemical Co. | | | | | |
4.85%, 08/15/2012 | | 5,000 | | 5,206 | |
6.13%, 02/01/2011 | | 7,240 | | 7,555 | |
Methanex Corp. | | | | | |
8.75%, 08/15/2012 | | 3,877 | | 3,974 | |
Mosaic Co. | | | | | |
7.38%, 12/01/2014 -144A Ђ | | 4,225 | | 4,498 | |
Nalco Co. | | | | | |
7.75%, 11/15/2011 | | 5,187 | | 5,193 | |
Commercial Banks - 3.1% | | | | | |
Bank of Scotland PLC | | | | | |
5.00%, 11/21/2011 -144A | | 930 | | 969 | |
BB&T Corp. | | | | | |
3.85%, 07/27/2012 | | 5,000 | | 5,169 | |
PNC Funding Corp. | | | | | |
0.42%, 01/31/2012 * | | 12,000 | | 11,583 | |
Scotland International Finance | | | | | |
7.70%, 08/15/2010 -144A | | 6,900 | | 6,972 | |
Silicon Valley Bank | | | | | |
5.70%, 06/01/2012 | | 2,000 | | 2,015 | |
SunTrust Banks, Inc. | | | | | |
5.25%, 11/05/2012 | | 1,420 | | 1,486 | |
6.38%, 04/01/2011 | | 5,621 | | 5,892 | |
Wachovia Corp. | | | | | |
0.41%, 04/23/2012 * | | 7,400 | | 7,237 | |
Commercial Services & Supplies - 1.0% | | | | | |
Avery Dennison Corp. | | | | | |
4.88%, 01/15/2013 | | 6,000 | | 6,142 | |
Protection One Alarm Monitoring, Inc. | | | | | |
12.00%, 11/15/2011 | | 6,000 | | 6,075 | |
Construction Materials - 2.0% | | | | | |
CRH America, Inc. | | | | | |
5.30%, 10/15/2013 | | 2,660 | | 2,763 | |
5.63%, 09/30/2011 | | 4,300 | | 4,541 | |
6.95%, 03/15/2012 | | 2,590 | | 2,808 | |
Lafarge SA | | | | | |
6.15%, 07/15/2011 | | 9,000 | | 9,416 | |
Martin Marietta Materials, Inc. | | | | | |
6.88%, 04/01/2011 | | 8,000 | | 8,304 | |
Consumer Finance - 2.3% | | | | | |
American Express Credit Corp. | | | | | |
1.64%, 05/27/2010 * | | 7,500 | | 7,527 | |
5.13%, 08/25/2014 | | 3,500 | | 3,687 | |
Discover Financial Services | | | | | |
0.83%, 06/11/2010 * | | 7,850 | | 7,756 | |
John Deere Capital Corp. | | | | | |
1.05%, 06/10/2011 * | | 6,125 | | 6,171 | |
Toyota Motor Credit Corp. | | | | | |
3.78%, 01/09/2012 * | | 5,000 | | 5,339 | |
Containers & Packaging - 0.8% | | | | | |
Rexam PLC | | | | | |
6.75%, 06/01/2013 -144A | | 9,950 | | 10,530 | |
Diversified Financial Services - 9.2% | | | | | |
American Honda Finance Corp. | | | | | |
0.63%, 01/29/2010 -144A * | | 4,500 | | 4,498 | |
5.13%, 12/15/2010 -144A | | 3,920 | | 4,063 | |
BAE Systems Holdings, Inc. | | | | | |
6.40%, 12/15/2011 -144A | | 7,000 | | 7,494 | |
Bear Stearns Cos. LLC | | | | | |
5.50%, 08/15/2011 | | 2,000 | | 2,097 | |
6.95%, 08/10/2012 | | 5,000 | | 5,611 | |
Caterpillar Financial Services Corp. | | | | | |
1.03%, 06/24/2011 * | | 7,390 | | 7,444 | |
Citigroup, Inc. | | | | | |
0.52%, 05/18/2011 * | | 11,100 | | 10,882 | |
FIA Card Services NA | | | | | |
7.13%, 11/15/2012 | | 8,781 | | 9,551 | |
General Electric Capital Corp. | | | | | |
0.45%, 07/27/2012 *Λ | | 1,400 | | 1,349 | |
0.61%, 11/01/2012 * | | 3,015 | | 2,885 | |
5.88%, 02/15/2012 | | 4,890 | | 5,273 | |
Harley-Davidson Funding Corp. | | | | | |
5.00%, 12/15/2010 -144A | | 12,230 | | 12,151 | |
Lukoil International Finance BV | | | | | |
6.38%, 11/05/2014 -144A | | 7,000 | | 7,014 | |
Merrill Lynch & Co., Inc. | | | | | |
2.52%, 05/12/2010 * | | 7,735 | | 7,819 | |
Nissan Motor Acceptance Corp. | | | | | |
5.63%, 03/14/2011 -144A | | 12,225 | | 12,538 | |
PACCAR Financial Corp. | | | | | |
3.78%, 01/12/2011 * | | 5,000 | | 5,198 | |
Pemex Finance, Ltd. | | | | | |
9.03%, 02/15/2011 | | 5,904 | | 6,102 | |
Selkirk Cogen Funding Corp. | | | | | |
8.98%, 06/26/2012 | | 6,615 | | 6,955 | |
Williams Cos., Inc. Credit Linked Certificate Trust V | | | | | |
6.38%, 10/01/2010 -144A | | 2,450 | | 2,521 | |
Diversified Telecommunication Services - 1.8% | | | | | |
Qwest Corp. | | | | | |
7.88%, 09/01/2011 | | 10,320 | | 10,656 | |
Sprint Capital Corp. | | | | | |
7.63%, 01/30/2011 | | 5,009 | | 5,065 | |
8.38%, 03/15/2012 | | 2,000 | | 2,025 | |
Telefonica Europe BV | | | | | |
7.75%, 09/15/2010 | | 6,250 | | 6,601 | |
Electric Utilities - 2.0% | | | | | |
KCP&L Greater Missouri Operations Co. | | | | | |
11.88%, 07/01/2012 Ђ | | 10,325 | | 11,984 | |
NiSource Finance Corp. | | | | | |
7.88%, 11/15/2010 | | 6,545 | | 6,895 | |
PSEG Power LLC | | | | | |
7.75%, 04/15/2011 | | 6,780 | | 7,318 | |
| | | | | | | |
The notes to the financial statements are an integral part of this report.
53
| | Principal | | Value | |
Electronic Equipment & Instruments - 1.3% | | | | | |
Agilent Technologies, Inc. | | | | | |
4.45%, 09/14/2012 | | $ | 5,000 | | $ | 5,115 | |
Tyco Electronics Group SA | | | | | |
6.00%, 10/01/2012 | | 11,206 | | 11,936 | |
Energy Equipment & Services - 1.0% | | | | | |
NGPL Pipeco LLC | | | | | |
6.51%, 12/15/2012 -144A | | 7,470 | | 8,160 | |
Plains All American Pipeline, LP / PAA Finance Corp. | | | | | |
4.25%, 09/01/2012 | | 4,890 | | 5,025 | |
Food & Staples Retailing - 1.4% | | | | | |
Kroger Co. | | | | | |
8.05%, 02/01/2010 | | 7,012 | | 7,129 | |
Stater Brothers Holdings, Inc. | | | | | |
8.13%, 06/15/2012 | | 4,400 | | 4,422 | |
Woolworths, Ltd. | | | | | |
5.25%, 11/15/2011 -144A | | 7,000 | | 7,371 | |
Food Products - 2.1% | | | | | |
M-Foods Holdings, Inc. | | | | | |
9.75%, 10/01/2013 -144A | | 3,750 | | 3,872 | |
Michael Foods, Inc. | | | | | |
8.00%, 11/15/2013 | | 5,480 | | 5,576 | |
Reynolds American, Inc. | | | | | |
7.25%, 06/01/2012 | | 10,700 | | 11,669 | |
UST, Inc. | | | | | |
6.63%, 07/15/2012 | | 6,460 | | 7,009 | |
Gas Utilities - 0.9% | | | | | |
DCP Midstream LLC | | | | | |
7.88%, 08/16/2010 | | 6,900 | | 7,237 | |
9.70%, 12/01/2013 -144A | | 4,500 | | 5,219 | |
Health Care Equipment & Supplies - 0.2% | | | | | |
Carefusion Corp. | | | | | |
4.13%, 08/01/2012 -144A | | 2,000 | | 2,055 | |
Hotels, Restaurants & Leisure - 2.4% | | | | | |
Carrols Corp. | | | | | |
9.00%, 01/15/2013 | | 7,000 | | 7,000 | |
Marriott International, Inc. | | | | | |
5.63%, 02/15/2013 | | 10,725 | | 11,101 | |
Royal Caribbean Cruises, Ltd. | | | | | |
8.00%, 05/15/2010 Λ | | 2,900 | | 2,929 | |
8.75%, 02/02/2011 | | 3,000 | | 3,030 | |
Yum! Brands, Inc. | | | | | |
8.88%, 04/15/2011 | | 6,200 | | 6,756 | |
Household Durables - 0.9% | | | | | |
Whirlpool Corp. | | | | | |
8.00%, 05/01/2012 | | 11,000 | | 11,963 | |
Industrial Conglomerates - 1.0% | | | | | |
QHP Pharma | | | | | |
10.25%, 03/15/2015 | | 12,770 | | 12,962 | |
Insurance - 1.2% | | | | | |
MetLife, Inc. | | | | | |
5.38%, 12/15/2012 | | 7,850 | | 8,448 | |
Oil Insurance, Ltd. | | | | | |
7.56%, 06/30/2011 -144A ■Ž | | 3,250 | | 2,295 | |
Prudential Financial, Inc. | | | | | |
3.63%, 09/17/2012 | | 5,000 | | 5,081 | |
IT Services - 0.4% | | | | | |
Western Union Co. | | | | | |
5.40%, 11/17/2011 | | 5,500 | | 5,870 | |
Machinery - 1.2% | | | | | |
Case New Holland, Inc. | | | | | |
7.75%, 09/01/2013 -144A | | 6,000 | | 5,955 | |
Kennametal, Inc. | | | | | |
7.20%, 06/15/2012 | | 9,950 | | 10,487 | |
Media - 0.9% | | | | | |
Comcast Cable Holdings LLC | | | | | |
9.80%, 02/01/2012 | | 5,000 | | 5,727 | |
Time Warner, Inc. | | | | | |
0.68%, 11/13/2009 * | | 6,406 | | 6,407 | |
Metals & Mining - 3.8% | | | | | |
Anglo American Capital PLC | | | | | |
9.38%, 04/08/2014 -144A | | 9,500 | | 11,095 | |
ArcelorMittal | | | | | |
5.38%, 06/01/2013 | | 11,500 | | 11,853 | |
Freeport-McMoRan Corp. | | | | | |
8.75%, 06/01/2011 Λ | | 9,183 | | 9,769 | |
Rio Tinto Finance USA, Ltd. | | | | | |
8.95%, 05/01/2014 | | 4,795 | | 5,667 | |
Xstrata Canada Corp. | | | | | |
7.35%, 06/05/2012 | | 11,000 | | 11,837 | |
Multiline Retail - 1.7% | | | | | |
Best Buy Co., Inc. | | | | | |
6.75%, 07/15/2013 | | 6,400 | | 6,876 | |
JC Penney Corp., Inc. | | | | | |
8.00%, 03/01/2010 | | 6,175 | | 6,252 | |
Limited, Inc. | | | | | |
5.25%, 11/01/2014 | | 5,000 | | 4,650 | |
Macy’s Retail Holdings, Inc. | | | | | |
5.35%, 03/15/2012 | | 4,170 | | 4,092 | |
Multi-Utilities - 0.8% | | | | | |
Black Hills Corp. | | | | | |
9.00%, 05/15/2014 | | 4,100 | | 4,724 | |
Sempra Energy | | | | | |
7.95%, 03/01/2010 | | 5,500 | | 5,625 | |
Office Electronics - 0.6% | | | | | |
Xerox Corp. | | | | | |
7.13%, 06/15/2010 | | 6,250 | | 6,437 | |
8.25%, 05/15/2014 | | 1,000 | | 1,152 | |
Oil, Gas & Consumable Fuels - 8.2% | | | | | |
Anadarko Finance Co. | | | | | |
6.75%, 05/01/2011 | | 6,460 | | 6,888 | |
Anadarko Petroleum Corp. | | | | | |
7.63%, 03/15/2014 | | 1,435 | | 1,642 | |
Consol Energy, Inc. | | | | | |
7.88%, 03/01/2012 | | 7,100 | | 7,544 | |
El Paso Corp. | | | | | |
7.00%, 05/15/2011 | | 3,250 | | 3,276 | |
7.38%, 12/15/2012 | | 2,000 | | 2,028 | |
EnCana Corp. | | | | | |
6.30%, 11/01/2011 | | 5,100 | | 5,526 | |
Enterprise Products Operating LLC | | | | | |
7.50%, 02/01/2011 | | 7,595 | | 8,071 | |
7.63%, 02/15/2012 | | 7,855 | | 8,686 | |
EQT Corp. | | | | | |
5.15%, 11/15/2012 | | 4,520 | | 4,711 | |
GAZ Capital SA | | | | | |
8.13%, 07/31/2014 -144A Λ | | 6,920 | | 7,310 | |
Hess Corp. | | | | | |
6.65%, 08/15/2011 | | 4,215 | | 4,538 | |
| | | | | | | |
The notes to the financial statements are an integral part of this report.
54
(all amounts except for share amounts in thousands)
| | Principal | | Value | |
Oil, Gas & Consumable Fuels (continued) | | | | | |
Kinder Morgan, Inc. | | | | | |
6.50%, 09/01/2012 | | $ | 5,316 | | $ | 5,462 | |
Marathon Oil Corp. | | | | | |
8.38%, 05/01/2012 | | 6,000 | | 6,779 | |
Ras Laffan Liquefied Natural Gas Co., Ltd. III | | | | | |
4.50%, 09/30/2012 -144A | | 6,915 | | 7,151 | |
Weatherford International, Inc. | | | | | |
5.95%, 06/15/2012 | | 7,305 | | 7,857 | |
Williams Cos., Inc. | | | | | |
2.29%, 10/01/2010 -144A * | | 1,450 | | 1,449 | |
7.13%, 09/01/2011 | | 4,682 | | 4,983 | |
Woodside Finance, Ltd. | | | | | |
5.00%, 11/15/2013 -144A | | 4,450 | | 4,484 | |
8.13%, 03/01/2014 -144A | | 2,450 | | 2,776 | |
XTO Energy, Inc. | | | | | |
5.00%, 08/01/2010 | | 5,770 | | 5,937 | |
Paper & Forest Products - 0.8% | | | | | |
Weyerhaeuser Co. | | | | | |
6.75%, 03/15/2012 | | 9,840 | | 10,312 | |
Real Estate Investment Trusts - 9.6% | | | | | |
Boston Properties, LP | | | | | |
6.25%, 01/15/2013 | | 10,000 | | 10,631 | |
BRE Properties, Inc. | | | | | |
7.45%, 01/15/2011 | | 8,500 | | 8,711 | |
Dexus Property Group | | | | | |
7.13%, 10/15/2014 -144A | | 7,125 | | 7,194 | |
Duke Realty, LP | | | | | |
4.63%, 05/15/2013 | | 5,000 | | 4,836 | |
5.63%, 08/15/2011 | | 2,000 | | 2,035 | |
5.88%, 08/15/2012 | | 6,053 | | 6,213 | |
Federal Realty Investment Trust | | | | | |
8.75%, 12/01/2009 | | 2,680 | | 2,691 | |
Healthcare Realty Trust, Inc. | | | | | |
8.13%, 05/01/2011 | | 10,895 | | 11,434 | |
Host Hotels & Resorts, LP | | | | | |
7.00%, 08/15/2012 | | 7,095 | | 7,122 | |
Kimco Realty Corp. | | | | | |
4.62%, 05/06/2010 | | 5,000 | | 5,013 | |
Liberty Property, LP | | | | | |
6.38%, 08/15/2012 | | 11,870 | | 12,289 | |
PPF Funding, Inc. | | | | | |
5.35%, 04/15/2012 -144A | | 9,975 | | 8,750 | |
Shurgard Storage Centers LLC | | | | | |
5.88%, 03/15/2013 | | 2,910 | | 2,971 | |
Simon Property Group, LP | | | | | |
4.88%, 03/18/2010 | | 6,265 | | 6,315 | |
5.30%, 05/30/2013 | | 1,600 | | 1,658 | |
7.75%, 01/20/2011 | | 2,000 | | 2,105 | |
Tanger Properties, LP | | | | | |
6.15%, 11/15/2015 | | 6,265 | | 5,938 | |
United Dominion Realty Trust | | | | | |
5.00%, 01/15/2012 | | 8,847 | | 8,990 | |
WEA Finance LLC / WCI Finance LLC | | | | | |
5.40%, 10/01/2012 -144A | | 11,500 | | 11,886 | |
Real Estate Management & Development - 1.0% | | | | | |
Post Apartment Homes, LP | | | | | |
5.45%, 06/01/2012 | | 7,450 | | 7,409 | |
7.70%, 12/20/2010 | | 5,000 | | 5,152 | |
Road & Rail - 1.1% | | | | | |
CSX Corp. | | | | | |
6.75%, 03/15/2011 | | 6,580 | | 7,000 | |
Union Pacific Corp. | | | | | |
3.63%, 06/01/2010 | | 5,030 | | 5,108 | |
6.13%, 01/15/2012 | | 2,000 | | 2,153 | |
Specialty Retail - 0.1% | | | | | |
Staples, Inc. | | | | | |
7.75%, 04/01/2011 | | 1,500 | | 1,612 | |
Trading Companies & Distributors - 1.0% | | | | | |
GATX Corp. | | | | | |
4.75%, 10/01/2012 | | 12,390 | | 12,620 | |
Transportation Infrastructure - 0.9% | | | | | |
Erac USA Finance Co. | | | | | |
5.80%, 10/15/2012 -144A | | 3,000 | | 3,169 | |
7.95%, 12/15/2009 -144A | | 6,875 | | 6,916 | |
8.00%, 01/15/2011 -144A | | 1,722 | | 1,811 | |
Wireless Telecommunication Services - 0.4% | | | | | |
Vodafone Group PLC | | | | | |
7.75%, 02/15/2010 | | 5,000 | | 5,099 | |
Total Corporate Debt Securities (cost $964,640) | | | | 1,001,035 | |
| | | | | |
REPURCHASE AGREEMENT - 1.4% | | | | | |
State Street Repurchase Agreement 0.01%, dated 10/30/2009, to be repurchased at $18,897 on 11/02/2009. Collateralized by a U.S. Government Agency Obligation, 4.00%, due 12/25/2024, and with a total value of $19,277. | | 18,897 | | 18,897 | |
Total Repurchase Agreement (cost $18,897) | | | | | |
| | | | | |
| | Shares | | | |
SECURITIES LENDING COLLATERAL - 0.1% | | | | | |
State Street Navigator Securities Lending Trust - Prime Portfolio, 0.35% p | | 1,553,930 | | 1,554 | |
Total Securities Lending Collateral (cost $1,554) | | | | | |
| | | | | |
Total Investment Securities (cost $1,256,772) # | | | | 1,302,100 | |
Other Assets and Liabilities - Net | | | | 15,569 | |
| | | | | |
Net Assets | | | | $ | 1,317,669 | |
| | | | | | | |
FUTURES CONTRACTS: (a)
Description | | Contracts Г | | Expiration Date | | Net Unrealized
(Depreciation) | |
5-Year U.S. Treasury Note | | (450 | ) | 12/31/2009 | | $ | (801 | ) |
| | | | | | | | |
The notes to the financial statements are an integral part of this report.
55
(all amounts in thousands)
NOTES TO SCHEDULE OF INVESTMENTS:
Ž The security has a perpetual maturity. The date shown is the next call date.
■ Coupon rate is fixed for a predetermined period of time and then converts to a floating rate until maturity/call date. Rate is listed as of 10/31/2009.
Λ All or a portion of this security is on loan. The value of all securities on loan is $1,522.
Ə Security fair valued as determined in good faith in accordance with procedures established by the Board of Trustees. This security had a Market Value of $5,612, or 0.4% of the fund’s net assets.
Ђ Step bond. Interest rate may increase or decrease as the credit rating changes.
* Floating or variable rate note. Rate is listed as of 10/31/2009.
p Rate shown reflects the yield at 10/31/2009.
Г Contract amounts are not in thousands.
(a) Cash in the amount of $1,237 has been segregated with the broker to cover margin requirements for the open future contract.
# Aggregate cost for federal income tax purposes is $1,256,772. Aggregate gross unrealized appreciation/depreciation for all securities in which there is an excess of value over tax cost were $47,740 and $2,412, respectively. Net unrealized appreciation for tax purposes is $45,328.
DEFINITIONS:
144A 144A Securities are registered pursuant to Rule 144A of the Securities Act of 1933. These securities are deemed to be liquid for purposes of compliance limitations on holdings of illiquid securities and may be resold as transactions exempt from registration, normally to qualified institutional buyers. At 10/31/2009, these securities aggregated $372,132, or 28.24%, of the fund’s net assets.
AUD Australian Dollar
REMIC Real Estate Mortgage Investment Conduits (consist of a fixed pool of mortgages broken apart and marketed to investors as individual securities)
VALUATION SUMMARY:
Investment Securities | | Level 1 | | Level 2 | | Level 3 | | Total | |
Fixed Income - Asset-Backed Security | | $ | — | | $ | 27,727 | | $ | — | | $ | 27,727 | |
Fixed Income - Consumer Discretionary | | — | | 112,953 | | — | | 112,953 | |
Fixed Income - Consumer Staples | | — | | 76,448 | | — | | 76,448 | |
Fixed Income - Energy | | — | | 132,739 | | — | | 132,739 | |
Fixed Income - Financials | | — | | 371,611 | | — | | 371,611 | |
Fixed Income - Foreign Government Obligation | | — | | 12,328 | | — | | 12,328 | |
Fixed Income - Industrials | | — | | 90,716 | | — | | 90,716 | |
Fixed Income - Information Technology | | — | | 30,510 | | — | | 30,510 | |
Fixed Income - Materials | | — | | 120,065 | | — | | 120,065 | |
Fixed Income - Mortgage-Backed Security | | — | | 151,472 | | — | | 151,472 | |
Fixed Income - Telecommunication Services | | — | | 29,447 | | — | | 29,447 | |
Fixed Income - U.S. Government Agency Obligation | | — | | 89,087 | | — | | 89,087 | |
Fixed Income - Utilities | | — | | 36,546 | | — | | 36,546 | |
Cash & Cash Equivalent - Repurchase Agreement | | — | | 18,897 | | — | | 18,897 | |
Cash & Cash Equivalent - Securities Lending Collateral | | 1,554 | | — | | — | | 1,554 | |
Total | | $ | 1,554 | | $ | 1,300,546 | | $ | — | | $ | 1,302,100 | |
| | | | | | | | | |
Other Financial Instruments* | | Level 1 | | Level 2 | | Level 3 | | Total | |
Futures Contracts | | $ | — | | $ | (801) | | $ | — | | $ | (801 | ) |
* Other Financial Instruments are derivative instruments. Futures Contracts, Forward Foreign Currency Contracts and Swap Contracts are valued at unrealized appreciation (depreciation) on the instrument.
The notes to the financial statements are an integral part of this report.
56
Transamerica Small/Mid Cap Value
SCHEDULE OF INVESTMENTS
At October 31, 2009
(all amounts except share amounts in thousands)
| | Shares | | Value | |
COMMON STOCKS - 93.9% | | | | | |
Airlines - 1.4% | | | | | |
Continental Airlines, Inc. -Class B ‡ | | 435,400 | | $ | 5,007 | |
Capital Markets - 3.5% | | | | | |
Cohen & Steers, Inc. Λ | | 264,625 | | 5,115 | |
Raymond James Financial, Inc. Λ | | 320,800 | | 7,574 | |
Chemicals - 5.8% | | | | | |
FMC Corp. | | 104,495 | | 5,340 | |
Intrepid Potash, Inc. ‡Λ | | 312,400 | | 8,048 | |
Terra Industries, Inc. | | 233,031 | | 7,403 | |
Commercial Banks - 6.5% | | | | | |
Bank of Hawaii Corp. | | 206,300 | | 9,160 | |
City National Corp. Λ | | 224,050 | | 8,440 | |
SVB Financial Group ‡ | | 143,300 | | 5,911 | |
Communications Equipment - 5.4% | | | | | |
Arris Group, Inc. ‡ | | 729,580 | | 7,485 | |
Brocade Communications Systems, Inc. ‡ | | 797,355 | | 6,841 | |
Harmonic Lightwaves, Inc. ‡ | | 987,152 | | 5,183 | |
Diversified Consumer Services - 1.8% | | | | | |
Sotheby’s | | 420,950 | | 6,676 | |
Electric Utilities - 3.5% | | | | | |
ITC Holdings Corp. | | 96,475 | | 4,285 | |
NV Energy, Inc. | | 400,700 | | 4,593 | |
Portland General Electric Co. | | 211,410 | | 3,930 | |
Electrical Equipment - 4.6% | | | | | |
General Cable Corp. ‡ | | 280,525 | | 8,736 | |
Woodward Governor Co. | | 333,945 | | 7,851 | |
Energy Equipment & Services - 2.8% | | | | | |
Oil States International, Inc. ‡ | | 144,815 | | 4,987 | |
Superior Energy Services, Inc. ‡ | | 246,585 | | 5,329 | |
Health Care Equipment & Supplies - 5.6% | | | | | |
Cooper Cos., Inc. | | 240,200 | | 6,728 | |
Hologic, Inc. ‡ | | 432,000 | | 6,385 | |
West Pharmaceutical Services, Inc. | | 177,995 | | 7,026 | |
Health Care Providers & Services - 2.0% | | | | | |
Mednax, Inc. ‡ | | 137,000 | | 7,113 | |
Health Care Technology - 2.2% | | | | | |
Allscripts-Misys Healthcare Solutions, Inc. ‡ | | 417,860 | | 8,148 | |
Hotels, Restaurants & Leisure - 1.4% | | | | | |
Cheesecake Factory, Inc. ‡ | | 283,415 | | 5,152 | |
Household Durables - 2.3% | | | | | |
Tupperware Brands Corp. | | 181,575 | | 8,174 | |
Insurance - 4.4% | | | | | |
HCC Insurance Holdings, Inc. | | 306,210 | | 8,081 | |
PartnerRe, Ltd. | | 104,870 | | 8,020 | |
Leisure Equipment & Products - 1.8% | | | | | |
Pool Corp. Λ | | 339,000 | | 6,638 | |
Life Sciences Tools & Services - 2.5% | | | | | |
Charles River Laboratories International, Inc. ‡ | | 248,580 | | 9,078 | |
Machinery - 4.8% | | | | | |
Harsco Corp. | | 212,410 | | 6,688 | |
Manitowoc Co., Inc. | | 575,250 | | 5,258 | |
Watts Water Technologies, Inc. -Class A | | 201,435 | | 5,691 | |
Media - 1.6% | | | | | |
Lamar Advertising Co. -Class A ‡Λ | | 231,715 | | | 5,631 | |
Metals & Mining - 3.2% | | | | | |
AK Steel Holding Corp. | | 318,900 | | 5,061 | |
Reliance Steel & Aluminum Co. | | 183,425 | | 6,691 | |
Multiline Retail - 1.7% | | | | | |
Saks, Inc. ‡ Λ | | 1,103,325 | | | | 6,190 | |
Oil, Gas & Consumable Fuels - 2.7% | | | | | |
Comstock Resources, Inc. ‡ | | 238,700 | | 9,808 | |
Professional Services - 2.1% | | | | | |
Manpower, Inc. | | 157,500 | | 7,467 | |
Real Estate Investment Trusts - 7.2% | | | | | |
BioMed Realty Trust, Inc. | | 390,000 | | 5,292 | |
Douglas Emmett, Inc. | | 410,000 | | 4,838 | |
Kilroy Realty Corp. | | 279,955 | | 7,732 | |
Omega Healthcare Investors, Inc. | | 534,600 | | 8,106 | |
Real Estate Management & Development - 4.0% | | | | | |
Jones Lang Lasalle, Inc. Λ | | 181,410 | | 8,499 | |
St. Joe Co. ‡ | | 250,255 | | 5,991 | |
Road & Rail - 3.1% | | | | | |
Kansas City Southern ‡ | | 469,785 | | 11,383 | |
Software - 1.1% | | | | | |
THQ, Inc. ‡ | | 781,000 | | 4,085 | |
Specialty Retail - 1.8% | | | | | |
Childrens Place Retail Stores, Inc. ‡ | | 208,050 | | 6,543 | |
Trading Companies & Distributors - 3.1% | | | | | |
Beacon Roofing Supply, Inc. ‡ | | 366,920 | | 5,269 | |
WESCO International, Inc. ‡ | | 238,740 | | 6,102 | |
Total Common Stocks (cost $298,271) | | | | 340,762 | |
| | | | | | | |
| | Principal | | | |
REPURCHASE AGREEMENT - 6.0% | | | | | |
State Street Repurchase Agreement 0.01%, dated 10/30/2009, to be repurchased at $21,689 on 11/02/2009. Collateralized by a U.S. Government Obligation, zero coupon due 04/08/2010, and with a value of $22,125. | | $ | 21,689 | | 21,689 | |
Total Repurchase Agreement (cost $21,689) | | | | | |
| | | | | | |
| | Shares | | | |
SECURITIES LENDING COLLATERAL - 5.7% | | | | | |
State Street Navigator Securities Lending Trust - Prime Portfolio, 0.35% p | | 20,574,293 | | 20,574 | |
Total Securities Lending Collateral (cost $20,574) | | | | | |
| | | | | |
Total Investment Securities (cost $340,534) # | | | | 383,025 | |
Other Assets and Liabilities - Net | | | | (20,177 | ) |
| | | | | |
Net Assets | | | | $ | 362,848 | |
| | | | | | |
The notes to the financial statements are an integral part of this report.
57
(all amounts in thousands)
NOTES TO SCHEDULE OF INVESTMENTS:
‡ | Non-income producing security. |
Λ | All or a portion of this security is on loan. The value of all securities on loan is $20,085. |
p | Rate shown reflects the yield at 10/31/2009. |
# | Aggregate cost for federal income tax purposes is $340,654. Aggregate gross unrealized appreciation/depreciation for all securities in which there is an excess of value over tax cost were $58,925 and $16,554, respectively. Net unrealized appreciation for tax purposes is $42,371. |
VALUATION SUMMARY:
Investment Securities | | Level 1 | | Level 2 | | Level 3 | | Total | |
Equities - Consumer Discretionary | | $ | 45,004 | | $ | — | | $ | — | | $ | 45,004 | |
Equities - Energy | | 20,124 | | — | | — | | 20,124 | |
Equities - Financials | | 92,759 | | — | | — | | 92,759 | |
Equities - Health Care | | 44,478 | | — | | — | | 44,478 | |
Equities - Industrials | | 69,452 | | — | | — | | 69,452 | |
Equities - Information Technology | | 23,594 | | — | | — | | 23,594 | |
Equities - Materials | | 32,543 | | — | | — | | 32,543 | |
Equities - Utilities | | 12,808 | | — | | — | | 12,808 | |
Cash & Cash Equivalent - Repurchase Agreement | | — | | 21,689 | | — | | 21,689 | |
Cash & Cash Equivalent - Securities Lending Collateral | | 20,574 | | — | | — | | 20,574 | |
Total | | $ | 361,336 | | $ | 21,689 | | $ | — | | $ | 383,025 | |
The notes to the financial statements are an integral part of this report.
58
Transamerica Templeton Global
SCHEDULE OF INVESTMENTS
At October 31, 2009
(all amounts except share amounts in thousands)
| | Shares | | Value | |
COMMON STOCKS - 97.6% | | | | | |
Australia - 1.2% | | | | | |
Alumina, Ltd. ‡ | | 96,049 | | $ | 141 | |
Brambles, Ltd. | | 55,748 | | 351 | |
National Australia Bank, Ltd. | | 28,826 | | 762 | |
Austria - 0.7% | | | | | |
Telekom Austria AG | | 41,880 | | 686 | |
Brazil - 1.4% | | | | | |
Empresa Brasileira de Aeronautica SA ADR ‡ | | 25,360 | | 514 | |
Petroleo Brasileiro SA -Class A ADR | | 13,480 | | 541 | |
Vale SA -Class B ADR | | 15,230 | | 388 | |
China - 0.3% | | | | | |
China Telecom Corp., Ltd. | | 670,000 | | 296 | |
Denmark - 0.3% | | | | | |
Vestas Wind Systems A/S ‡ | | 3,900 | | 274 | |
France - 6.9% | | | | | |
Accor SA | | 7,040 | | 337 | |
AXA SA | | 36,800 | | 915 | |
France Telecom SA | | 47,180 | | 1,169 | |
GDF Suez | | 14,448 | | 604 | |
Michelin -Class B | | 10,407 | | 771 | |
Sanofi-Aventis SA | | 16,139 | | 1,183 | |
Total SA | | 21,742 | | 1,301 | |
Vivendi | | 26,410 | | 733 | |
Germany - 6.6% | | | | | |
Bayerische Motoren Werke AG | | 15,120 | | 740 | |
Celesio AG | | 19,660 | | 487 | |
Deutsche Post AG | | 42,130 | | 713 | |
E.ON AG ADR | | 24,540 | | 942 | |
Merck KGaA | | 7,380 | | 694 | |
Muenchener Rueckversicherungs AG | | 5,590 | | 884 | |
Rhoen Klinikum AG | | 14,942 | | 363 | |
SAP AG | | 17,410 | | 789 | |
Siemens AG | | 11,760 | | 1,062 | |
Hong Kong - 1.0% | | | | | |
Cheung Kong Holdings, Ltd. | | 47,000 | | 600 | |
Hutchison Whampoa, Ltd. | | 59,000 | | 414 | |
Ireland - 0.5% | | | | | |
CRH PLC | | 22,201 | | 543 | |
Israel - 1.6% | | | | | |
Check Point Software Technologies ‡ | | 20,690 | | 643 | |
Teva Pharmaceutical Industries, Ltd. ADR | | 19,490 | | 984 | |
Italy - 1.3% | | | | | |
Autogrill SpA ‡ | | 32,781 | | 369 | |
ENI SpA ADR | | 12,195 | | 604 | |
UniCredit SpA ‡ | | 101,510 | | 340 | |
Japan - 3.4% | | | | | |
Fujifilm Holdings Corp. | | 16,700 | | 476 | |
Konica Minolta Holdings, Inc. | | 54,500 | | 512 | |
Mabuchi Motor Co., Ltd. | | 6,300 | | 301 | |
Nintendo Co., Ltd. | | 2,200 | | 552 | |
Sony Corp. ADR | | 10,560 | | 310 | |
Takeda Pharmaceutical Co., Ltd. | | 8,300 | | 332 | |
Toyota Motor Corp. | | 13,100 | | 517 | |
USS Co., Ltd. | | 7,410 | | 448 | |
Korea, Republic of - 1.6% | | | | | |
KB Financial Group, Inc. ADR ‡ | | 11,523 | | 547 | |
Samsung Electronics Co., Ltd. -144A GDR | | 3,430 | | 1,044 | |
Netherlands - 2.4% | | | | | |
Akzo Nobel NV | | 8,450 | | 499 | |
ING Groep NV ADR ‡ | | 9,330 | | 120 | |
ING Groep NV ‡ | | 32,710 | | 426 | |
Koninklijke Philips Electronics NV | | 33,360 | | 839 | |
Randstad Holding NV ‡ | | 7,050 | | 267 | |
Reed Elsevier NV | | 26,984 | | 314 | |
Norway - 1.8% | | | | | |
Aker Solutions ASA | | 17,210 | | | 207 | |
Statoil ASA | | 19,400 | | 457 | |
Telenor ASA ‡ | | 88,850 | | 1,146 | |
Singapore - 2.1% | | | | | |
DBS Group Holdings, Ltd. | | 97,400 | | 891 | |
Flextronics International, Ltd. ‡ | | 61,830 | | 401 | |
Singapore Telecommunications, Ltd. | | 378,000 | | 784 | |
South Africa - 0.6% | | | | | |
Sasol, Ltd. ADR | | 16,850 | | 630 | |
Spain - 2.6% | | | | | |
Banco Santander SA | | 25,719 | | 414 | |
Iberdrola SA | | 62,199 | | 563 | |
Telefonica SA | | 57,454 | | 1,605 | |
Sweden - 1.0% | | | | | |
Nordea Bank AB | | 67,010 | | 716 | |
Telefonaktiebolaget LM Ericsson -Class B | | 29,030 | | 303 | |
Switzerland - 6.4% | | | | | |
ACE, Ltd. ‡ | | 18,590 | | 955 | |
Adecco SA | | 12,770 | | 571 | |
Lonza Group AG | | 7,370 | | 573 | |
Nestle SA ADR | | 24,375 | | 1,134 | |
Novartis AG ADR | | 16,740 | | 869 | |
Roche Holding AG ADR | | 26,260 | | 1,585 | |
Swiss Reinsurance Co., Ltd. | | 11,470 | | 467 | |
UBS AG ‡ | | 15,765 | | 263 | |
Taiwan - 0.8% | | | | | |
Lite-On Technology Corp. GDR | | 22,526 | | 302 | |
Taiwan Semiconductor Manufacturing Co., Ltd. ADR | | 51,164 | | 488 | |
Turkey - 0.8% | | | | | |
Turkcell Iletisim Hizmet AS ADR | | 47,270 | | 777 | |
United Kingdom - 12.0% | | | | | |
Aviva PLC | | 92,990 | | 581 | |
BAE Systems PLC | | 112,160 | | 576 | |
BP PLC ADR | | 18,170 | | 1,029 | |
British Sky Broadcasting Group PLC | | 79,790 | | 695 | |
Cadbury PLC | | 27,958 | | 353 | |
Compass Group PLC | | 67,220 | | 426 | |
GlaxoSmithKline PLC | | 44,309 | | 909 | |
Group 4 Securicor PLC | | 161,830 | | 669 | |
HSBC Holdings PLC | | 39,039 | | 445 | |
Kingfisher PLC ADR | | 147,110 | | 624 | |
Pearson PLC | | 31,090 | | 423 | |
Rexam PLC | | 136,330 | | 617 | |
Rolls-Royce Group PLC -Class C §‡Ə | | 4,657,860 | | 8 | |
Rolls-Royce Group PLC ‡ | | 77,631 | | 573 | |
Royal Dutch Shell PLC -Class B | | 29,130 | | 839 | |
Tesco PLC | | 103,780 | | 692 | |
Unilever PLC | | 34,487 | | 1,031 | |
Vodafone Group PLC | | 618,342 | | 1,363 | |
Wolseley PLC ‡ | | 14,163 | | 286 | |
United States - 40.3% | | | | | |
Amazon.com, Inc. ‡ | | 28,490 | | 3,385 | |
Anadarko Petroleum Corp. | | 16,865 | | 1,027 | |
Apple, Inc. ‡ | | 15,575 | | 2,936 | |
Automatic Data Processing, Inc. | | 23,330 | | 929 | |
BorgWarner, Inc. | | 37,300 | | 1,131 | |
Caterpillar, Inc. | | 17,695 | | 974 | |
Charles Schwab Corp. | | 77,280 | | 1,340 | |
Cisco Systems, Inc. ‡ | | 50,000 | | 1,142 | |
Ecolab, Inc. | | 31,500 | | 1,385 | |
Emerson Electric Co. | | 34,285 | | 1,294 | |
EOG Resources, Inc. | | 10,490 | | 857 | |
Expeditors International of Washington, Inc. | | 23,076 | | 744 | |
Gilead Sciences, Inc. ‡ | | 19,555 | | 832 | |
Google, Inc. -Class A ‡ | | 5,000 | | 2,681 | |
Intel Corp. | | 22,515 | | 430 | |
The notes to the financial statements are an integral part of this report.
59
| | Shares | | Value | |
United States (continued) | | | | | |
International Business Machines Corp. | | 10,480 | | $ | 1,264 | |
Intuitive Surgical, Inc. ‡ | | 1,690 | | 416 | |
Jacobs Engineering Group, Inc. ‡ | | 21,335 | | 902 | |
Johnson Controls, Inc. | | 75,000 | | 1,794 | |
Microsoft Corp. | | 39,690 | | 1,101 | |
Monsanto Co. | | 10,660 | | 716 | |
PACCAR, Inc. | | 36,000 | | 1,347 | |
Palm, Inc. ‡ | | 14,730 | | 171 | |
Praxair, Inc. | | 24,700 | | 1,962 | |
priceline.com, Inc. ‡ | | 3,855 | | 608 | |
QUALCOMM, Inc. | | 20,885 | | 865 | |
Sigma-Aldrich Corp. | | 36,000 | | 1,869 | |
T. Rowe Price Group, Inc. | | 30,000 | | 1,462 | |
Union Pacific Corp. | | 15,090 | | 832 | |
Wal-Mart Stores, Inc. | | 15,985 | | 794 | |
Walt Disney Co. | | 38,000 | | 1,040 | |
Wells Fargo & Co. | | 69,780 | | 1,920 | |
Yum! Brands, Inc. | | 18,595 | | 613 | |
Total Common Stocks (cost $101,870) | | | | 98,644 | |
| | | | | | |
| | Principal | | | |
REPURCHASE AGREEMENTS - 1.7% | | | | | |
State Street Repurchase Agreement 0.01%, dated 10/30/2009, to be repurchased at $1,669 on 11/02/2009. Collateralized by U.S. Government Agency Obligations, 4.00%, due 12/15/2017, and with a total value of $1,707. | | $ | 1,669 | | 1,669 | |
Total Repurchase Agreements (cost $1,669) | | | | | |
| | | | | |
Total Investment Securities (cost $103,539) # | | | | 100,313 | |
Other Assets and Liabilities - Net | | | | 725 | |
| | | | | |
Net Assets | | | | $ | 101,038 | |
| | | | | | | |
| | Percentage of
Total Investments | | Value | |
INVESTMENTS BY INDUSTRY (unaudited): | | | | | |
Oil, Gas & Consumable Fuels | | 7.3 | % | $ | 7,285 | |
Pharmaceuticals | | 6.5 | | 6,556 | |
Chemicals | | 6.4 | | 6,431 | |
Commercial Banks | | 6.0 | | 6,035 | |
Diversified Telecommunication Services | | 5.7 | | 5,686 | |
Computers & Peripherals | | 4.5 | | 4,502 | |
Internet & Catalog Retail | | 4.0 | | 3,993 | |
Insurance | | 3.8 | | 3,802 | |
Auto Components | | 3.7 | | 3,696 | |
Media | | 3.2 | | 3,205 | |
Software | | 3.1 | | 3,085 | |
Capital Markets | | 3.1 | | 3,065 | |
Internet Software & Services | | 2.7 | | 2,681 | |
Food Products | | 2.5 | | 2,518 | |
Communications Equipment | | 2.5 | | 2,481 | |
Machinery | | 2.3 | | 2,321 | |
Industrial Conglomerates | | 2.3 | | 2,315 | |
Wireless Telecommunication Services | | 2.2 | | 2,140 | |
Semiconductors & Semiconductor Equipment | | 2.0 | | 1,962 | |
Hotels, Restaurants & Leisure | | 1.7 | | 1,745 | |
Aerospace & Defense | | 1.7 | | 1,671 | |
Electrical Equipment | | 1.6 | | 1,568 | |
Electric Utilities | | 1.5 | | 1,505 | |
Food & Staples Retailing | | 1.5 | | 1,486 | |
Air Freight & Logistics | | 1.4 | | 1,457 | |
Automobiles | | 1.2 | | 1,257 | |
| | | | | | |
The notes to the financial statements are an integral part of this report.
60
(all amounts in thousands)
| | Percentage of
Total Investments | | Value | |
INVESTMENTS BY INDUSTRY (unaudited) (continued): | | | | | |
Electronic Equipment & Instruments | | 1.2 | % | $ | 1,178 | |
Specialty Retail | | 1.0 | | 1,072 | |
Commercial Services & Supplies | | 1.0 | | 1,020 | |
IT Services | | 0.9 | | 929 | |
Construction & Engineering | | 0.9 | | 902 | |
Health Care Providers & Services | | 0.9 | | 850 | |
Professional Services | | 0.8 | | 838 | |
Biotechnology | | 0.8 | | 832 | |
Road & Rail | | 0.8 | | 832 | |
Containers & Packaging | | 0.6 | | 617 | |
Multi-Utilities | | 0.6 | | 604 | |
Real Estate Management & Development | | 0.6 | | 600 | |
Life Sciences Tools & Services | | 0.6 | | 573 | |
Diversified Financial Services | | 0.5 | | 546 | |
Construction Materials | | 0.5 | | 543 | |
Metals & Mining | | 0.5 | | 529 | |
Office Electronics | | 0.5 | | 512 | |
Health Care Equipment & Supplies | | 0.4 | | 416 | |
Household Durables | | 0.3 | | 310 | |
Trading Companies & Distributors | | 0.3 | | 286 | |
Energy Equipment & Services | | 0.2 | | 207 | |
Investment Securities, at Value | | 98.3 | | 98,644 | |
Short-Term Investments | | 1.7 | | 1,669 | |
Total Investments | | 100.0 | % | $ | 100,313 | |
NOTES TO SCHEDULE OF INVESTMENTS:
‡ | Non-income producing security. |
§ | Illiquid. This security aggregated $8, or 0.01%, of the Fund’s net assets. |
♦ | Value is less than $1. |
Ə | Security fair valued as determined in good faith in accordance with procedures established by the Board of Trustees. This security aggregated to $8, or 0.01% of the fund’s net assets. |
# | Aggregate cost for federal income tax purposes is $104,612. Aggregate gross unrealized appreciation/depreciation for all securities in which there is an excess of value over tax cost were $8,751 and $13,050, respectively. Net unrealized depreciation for tax purposes is $4,299. |
DEFINITIONS:
144A | 144A Securities are registered pursuant to Rule 144A of the Securities Act of 1933. These securities are deemed to be liquid for purposes of compliance limitations on holdings of illiquid securities and may be resold as transactions exempt from registration, normally to qualified institutional buyers. At 10/31/2009, these securities aggregated $1,044, or 1.03%, of the fund’s net assets. |
ADR | American Depositary Receipt |
GDR | Global Depositary Receipt |
VALUATION SUMMARY:
Investment Securities | | Level 1 | | Level 2 | | Level 3 | | Total | |
Equities - Consumer Discretionary | | $ | 9,056 | | $ | 6,223 | | $ | — | | $ | 15,279 | |
Equities - Consumer Staples | | 1,928 | | 2,076 | | — | | 4,004 | |
Equities - Energy | | 5,527 | | 1,965 | | — | | 7,492 | |
Equities - Financials | | 6,361 | | 7,687 | | — | | 14,048 | |
Equities - Health Care | | 3,102 | | 6,126 | | — | | 9,228 | |
Equities - Industrials | | 7,445 | | 5,757 | | 8 | | 13,210 | |
Equities - Information Technology | | 12,487 | | 3,976 | | — | | 16,463 | |
Equities - Materials | | 6,321 | | 1,800 | | — | | 8,121 | |
Equities - Telecommunication Services | | 1,641 | | 7,048 | | — | | 8,689 | |
Equities - Utilities | | 942 | | 1,168 | | — | | 2,110 | |
Cash & Cash Equivalent - Repurchase Agreement | | — | | 1,669 | | — | | 1,669 | |
Total | | $ | 54,810 | | $ | 45,495 | | $ | 8 | | $ | 100,313 | |
Level 3 Rollforward
Securities | | Beginning
Balance at
10/31/2008 | | Net
Purchases/(Sales) | | Accrued
Discounts/(Premiums) | | Total Realized
Gain/(Loss) | | Total Change In Unrealized
Appreciation/(Depreciation) | | Net Transfers
In/(Out) of
Level 3 | | Ending
Balance at
10/31/2009 | |
Foreign Equity - Industrials | | $ | — | | $ | — | | $ | — | | $ | — | | $ | ♦ | | $ | 8 | | $ | 8 | |
| | | | | | | | | | | | | | | | | | | | | | |
The notes to the financial statements are an integral part of this report.
61
Transamerica Value Balanced
SCHEDULE OF INVESTMENTS
At October 31, 2009
(all amounts in thousands)
| | Principal | | Value | |
U.S. GOVERNMENT OBLIGATIONS - 0.6% | | | | | |
U.S. Treasury Bond | | | | | |
4.25%, 05/15/2039 | | $ | 35 | | $ | 35 | |
U.S. Treasury Inflation Indexed Bond | | | | | |
2.50%, 01/15/2029 | | 121 | | 130 | |
Total U.S. Government Obligations (cost $158) | | | | 165 | |
| | | | | |
U.S. GOVERNMENT AGENCY OBLIGATIONS - 6.6% | | | | | |
Fannie Mae | | | | | |
5.00%, 05/01/2018- 03/01/2036 | | 480 | | 500 | |
5.50%, 07/01/2019- 01/01/2038 | | 164 | | 174 | |
6.00%, 08/01/2036- 12/01/2037 | | 571 | | 609 | |
Freddie Mac | | | | | |
5.00%, 04/01/2018- 10/15/2030 | | 184 | | 195 | |
5.49%, 09/01/2037 * | | 197 | | 208 | |
5.50%, 09/01/2018- 11/01/2018 | | 116 | | 126 | |
Total U.S. Government Agency Obligations (cost $1,733) | | | | 1,812 | |
| | | | | |
MORTGAGE-BACKED SECURITIES - 4.6% | | | | | |
American Tower Trust | | | | | |
Series 2007-1A, Class C | | | | | |
5.62%, 04/15/2037 -144A | | 155 | | 155 | |
BCAP LLC Trust | | | | | |
Series 2009-RR10, Class 2A1 | | | | | |
4.92%, 08/26/2035 -144A Ə * | | 78 | | 75 | |
Series 2009-RR3, Class 2A1 | | | | | |
5.65%, 05/26/2037 -144A | | 46 | | 44 | |
Series 2009-RR6, Class 2A1 | | | | | |
5.36%, 08/26/2035 -144A | | 51 | | 49 | |
Crown Castle Towers LLC | | | | | |
Series 2006-1A, Class AFX | | | | | |
5.24%, 11/15/2036 -144A | | 115 | | 116 | |
Jefferies & Co., Inc. | | | | | |
Series 2009-R2, Class 2A | | | | | |
6.55%, 12/26/2037 -144A | | 52 | | 49 | |
Series 2009-R7, Class 10A3 | | | | | |
6.00%, 12/26/2036 -144A | | 48 | | 46 | |
Series 2009-R7, Class 12A1 | | | | | |
5.50%, 08/26/2036 -144A | | 54 | | 51 | |
Series 2009-R7, Class 1A1 | | | | | |
5.59%, 02/26/2036 -144A | | 81 | | 77 | |
Series 2009-R7, Class 4A1 | | | | | |
3.74%, 09/26/2034 -144A * | | 74 | | 70 | |
Series 2009-R9, Class 1A1 | | | | | |
5.84%, 08/26/2046 -144A | | 55 | | 53 | |
JP Morgan Re-REMIC | | | | | |
Series 2009-7, Class 8A1 | | | | | |
5.82%, 01/27/2047 -144A | | 53 | | 52 | |
Small Business Adminstration Trust | | | | | |
Series 2006-1A, Class A | | | | | |
5.31%, 11/15/2036 -144A | | 150 | | 150 | |
WaMu Mortgage Pass Through Certificates | | | | | |
Series 2003-S9, Class A6 | | | | | |
5.25%, 10/25/2033 | | 110 | | 110 | |
Wells Fargo Mortgage Backed Securities Trust | | | | | |
Series 2003-G, Class A1 | | | | | |
4.10%, 06/25/2033 * | | 83 | | 81 | |
Series 2003-L, Class 1A2 | | | | | |
4.56%, 11/25/2033 * | | 78 | | 77 | |
Total Mortgage-Backed Securities (cost $1,226) | | | | 1,255 | |
| | | | | |
ASSET-BACKED SECURITIES - 0.5% | | | | | |
American Airlines Pass-Through Trust | | | | | |
Series 2001-2, Class A-2 | | | | | |
7.86%, 10/01/2011 | | | 55 | | | 55 | |
Delta Air Lines, Inc. | | | | | |
Series 2000-1, Class A-2 | | | | | |
7.57%, 05/18/2012 | | 85 | | 85 | |
Total Asset-Backed Securities (cost $141) | | | | 140 | |
| | | | | |
MUNICIPAL GOVERNMENT OBLIGATION - 0.2% | | | | | |
Metropolitan Transportation Authority | | | | | |
7.34%, 11/15/2039 | | 51 | | 61 | |
Total Municipal Government Obligation (cost $51) | | | | | |
| | | | | |
CORPORATE DEBT SECURITIES - 25.8% | | | | | |
Airlines - 0.4% | | | | | |
Continental Airlines, Inc. | | | | | |
7.49%, 10/02/2010 | | 75 | | 74 | |
9.00%, 07/08/2016 | | 35 | | 37 | |
Beverages - 0.4% | | | | | |
Anheuser-Busch InBev Worldwide, Inc. | | | | | |
8.20%, 01/15/2039 -144A | | 80 | | 101 | |
Building Products - 0.4% | | | | | |
Holcim Capital Corp., Ltd. | | | | | |
6.88%, 09/29/2039 -144A | | 51 | | 53 | |
Voto-Votorantim Overseas Trading Operations NV | | | | | |
6.63%, 09/25/2019 -144A | | 55 | | 53 | |
Capital Markets - 1.3% | | | | | |
Goldman Sachs Group, Inc. | | | | | |
0.74%, 03/22/2016 * | | 120 | | 110 | |
Macquarie Group, Ltd. | | | | | |
7.63%, 08/13/2019 -144A | | 115 | | 128 | |
Raymond James Financial, Inc. | | | | | |
8.60%, 08/15/2019 | | 105 | | 114 | |
Chemicals - 1.3% | | | | | |
Chevron Phillips Chemical Co. LLC | | | | | |
8.25%, 06/15/2019 -144A | | 50 | | 59 | |
Cytec Industries, Inc. | | | | | |
8.95%, 07/01/2017 | | 50 | | 59 | |
Dow Chemical Co. | | | | | |
8.55%, 05/15/2019 | | 115 | | 130 | |
Nalco Co. | | | | | |
8.25%, 05/15/2017 -144A | | 52 | | 55 | |
Yara International ASA | | | | | |
7.88%, 06/11/2019 -144A | | 55 | | 63 | |
Commercial Banks - 2.1% | | | | | |
Barclays Bank PLC | | | | | |
10.18%, 06/12/2021 -144A | | 96 | | 126 | |
National City Bank/Cleveland OH | | | | | |
0.65%, 12/15/2016 * | | 135 | | 113 | |
State Street Capital Trust IV | | | | | |
1.30%, 06/15/2037 * | | 173 | | 116 | |
Wells Fargo Capital XIII | | | | | |
7.70%, 03/26/2013 ■Ž | | 115 | | 107 | |
ZFS Finance USA Trust II | | | | | |
6.45%, 06/15/2016 -144A ■ | | 130 | | 117 | |
Commercial Services & Supplies - 0.3% | | | | | |
Hertz Corp. | | | | | |
8.88%, 01/01/2014 | | 75 | | 76 | |
The notes to the financial statements are an integral part of this report.
62
| | Principal | | Value | |
Construction Materials - 0.4% | | | | | |
CRH America, Inc. | | | | | |
5.30%, 10/15/2013 | | $ | 100 | | $ | 104 | |
Consumer Finance - 0.3% | | | | | |
Discover Financial Services | | | | | |
0.83%, 06/11/2010 * | | 95 | | 94 | |
Containers & Packaging - 0.6% | | | | | |
Graphic Packaging International, Inc. | | | | | |
9.50%, 06/15/2017 -144A | | 58 | | 61 | |
Rexam PLC | | | | | |
6.75%, 06/01/2013 -144A | | 95 | | 101 | |
Diversified Financial Services - 3.7% | | | | | |
Bank of America Corp. | | | | | |
0.58%, 06/15/2016 * | | 205 | | 181 | |
Citigroup, Inc. | | | | | |
6.13%, 05/15/2018 | | 107 | | 108 | |
General Electric Capital Corp. | | | | | |
6.00%, 08/07/2019 | | 70 | | 74 | |
Glencore Funding LLC | | | | | |
6.00%, 04/15/2014 -144A | | 80 | | 78 | |
Harley-Davidson Funding Corp. | | | | | |
5.25%, 12/15/2012 -144A | | 110 | | 111 | |
Hyundai Capital Services, Inc. | | | | | |
6.00%, 05/05/2015 -144A | | 98 | | 98 | |
JPMorgan Chase Capital XXVII | | | | | |
7.00%, 11/01/2039 | | 65 | | 65 | |
Lukoil International Finance BV | | | | | |
6.38%, 11/05/2014 -144A | | 105 | | 105 | |
Pemex Finance, Ltd. | | | | | |
9.03%, 02/15/2011 | | 49 | | 50 | |
Rabobank Nederland NV | | | | | |
11.00%, 06/30/2019 144A ■Ž | | 95 | | 120 | |
Electric Utilities - 0.4% | | | | | |
KCP&L Greater Missouri Operations Co. | | | | | |
11.88%, 07/01/2012 Ђ | | 87 | | 101 | |
Electronic Equipment & Instruments - 0.4% | | | | | |
Tyco Electronics Group SA | | | | | |
6.00%, 10/01/2012 | | 110 | | 117 | |
Energy Equipment & Services - 0.3% | | | | | |
Weatherford International, Ltd. | | | | | |
7.00%, 03/15/2038 | | 80 | | 82 | |
Food & Staples Retailing - 0.6% | | | | | |
Ingles Markets, Inc. | | | | | |
8.88%, 05/15/2017 | | 55 | | 56 | |
Stater Brothers Holdings, Inc. | | | | | |
8.13%, 06/15/2012 | | 100 | | 101 | |
Food Products - 0.8% | | | | | |
Lorillard Tobacco Co. | | | | | |
8.13%, 06/23/2019 | | 47 | | 52 | |
M-Foods Holdings, Inc. | | | | | |
9.75%, 10/01/2013 -144A | | 67 | | 69 | |
Michael Foods, Inc. | | | | | |
8.00%, 11/15/2013 | | 90 | | 92 | |
Gas Utilities - 0.6% | | | | | |
DCP Midstream LLC | | | | | |
9.75%, 03/15/2019 -144A | | 60 | | 72 | |
EQT Corp. | | | | | |
8.13%, 06/01/2019 | | 75 | | 86 | |
Hotels, Restaurants & Leisure - 0.6% | | | | | |
International Game Technology | | | | | |
7.50%, 06/15/2019 | | 100 | | 110 | |
Royal Caribbean Cruises, Ltd. | | | | | |
8.75%, 02/02/2011 | | 70 | | 71 | |
Household Durables - 0.4% | | | | | |
Whirlpool Corp. | | | | | |
8.00%, 05/01/2012 | | | | 102 | | | | 111 | |
Insurance - 0.5% | | | | | |
American Financial Group, Inc. | | | | | |
9.88%, 06/15/2019 | | 52 | | 59 | |
Oil Insurance, Ltd. | | | | | |
7.56%, 06/30/2011 -144A ■Ž | | 120 | | 85 | |
Leisure Equipment & Products - 0.4% | | | | | |
Hasbro, Inc. | | | | | |
6.30%, 09/15/2017 | | 115 | | 124 | |
Metals & Mining - 1.7% | | | | | |
Anglo American Capital PLC | | | | | |
9.38%, 04/08/2019 -144A | | 106 | | 129 | |
ArcelorMittal | | | | | |
5.38%, 06/01/2013 | | 130 | | 134 | |
Rio Tinto Finance USA, Ltd. | | | | | |
9.00%, 05/01/2019 | | 100 | | 124 | |
Xstrata Canada Corp. | | | | | |
7.35%, 06/05/2012 | | 55 | | 59 | |
Multiline Retail - 0.4% | | | | | |
Best Buy Co., Inc. | | | | | |
6.75%, 07/15/2013 | | 100 | | 107 | |
Multi-Utilities - 0.7% | | | | | |
Black Hills Corp. | | | | | |
9.00%, 05/15/2014 | | 55 | | 63 | |
Sempra Energy | | | | | |
9.80%, 02/15/2019 | | 105 | | 134 | |
Oil, Gas & Consumable Fuels - 2.1% | | | | | |
Enbridge Energy Partners, LP | | | | | |
9.88%, 03/01/2019 | | 75 | | 95 | |
GAZ Capital SA | | | | | |
8.13%, 07/31/2014 -144A | | 100 | | 105 | |
Petrobras International Finance Co. | | | | | |
5.75%, 01/20/2020 | | 105 | | 105 | |
Petrohawk Energy Corp. | | | | | |
9.13%, 07/15/2013 | | 100 | | 104 | |
Petroleum Co. of Trinidad & Tobago, Ltd. | | | | | |
9.75%, 08/14/2019 -144A | | 53 | | 60 | |
Ras Laffan Liquefied Natural Gas Co., Ltd. III | | | | | |
6.75%, 09/30/2019 -144A | | 115 | | 126 | |
Paper & Forest Products - 1.0% | | | | | |
Celulosa Arauco y Constitucion SA | | | | | |
8.63%, 08/15/2010 | | 171 | | 179 | |
Weyerhaeuser Co. | | | | | |
6.75%, 03/15/2012 | | 100 | | 105 | |
Real Estate Investment Trusts - 2.9% | | | | | |
Boston Properties, LP | | | | | |
5.88%, 10/15/2019 | | 110 | | 111 | |
Dexus Property Group | | | | | |
7.13%, 10/15/2014 -144A | | 72 | | 73 | |
Duke Realty, LP | | | | | |
7.38%, 02/15/2015 | | 90 | | 95 | |
Healthcare Realty Trust, Inc. | | | | | |
8.13%, 05/01/2011 | | 100 | | 105 | |
Host Hotels & Resorts, LP | | | | | |
7.00%, 08/15/2012 | | 55 | | 55 | |
PPF Funding, Inc. | | | | | |
5.35%, 04/15/2012 -144A | | 130 | | 114 | |
Simon Property Group, LP | | | | | |
10.35%, 04/01/2019 | | 95 | | 119 | |
WEA Finance LLC/WT Finance Aust Pty, Ltd. | | | | | |
6.75%, 09/02/2019 -144A | | 107 | | 109 | |
| | | | | | | | | |
The notes to the financial statements are an integral part of this report.
63
(all amounts except share amounts in thousands)
| | Principal | | Value | |
Real Estate Management & Development - 0.4% | | | | | |
Post Apartment Homes, LP | | | | | |
5.45%, 06/01/2012 | | $ | 20 | | $ | 20 | |
6.30%, 06/01/2013 | | 91 | | 91 | |
Transportation Infrastructure - 0.4% | | | | | |
Erac USA Finance Co. | | | | | |
8.00%, 01/15/2011 -144A | | 105 | | 110 | |
Total Corporate Debt Securities (cost $6,546) | | | | 7,060 | |
| | | | | | | |
| | Shares | | | |
COMMON STOCKS - 61.6% | | | | | |
Aerospace & Defense - 1.6% | | | | | |
Precision Castparts Corp. | | 4,520 | | 432 | |
Air Freight & Logistics - 0.6% | | | | | |
United Parcel Service, Inc. -Class B | | 3,200 | | 172 | |
Auto Components - 2.0% | | | | | |
BorgWarner, Inc. | | 18,153 | | 550 | |
Automobiles - 1.6% | | | | | |
Harley-Davidson, Inc. | | 17,940 | | 447 | |
Capital Markets - 5.7% | | | | | |
BlackRock, Inc. -Class A | | 2,910 | | 630 | |
Blackstone Group, LP | | 30,505 | | 409 | |
Credit Suisse Group AG ADR | | 10,060 | | 536 | |
Chemicals - 2.1% | | | | | |
Praxair, Inc. | | 7,200 | | 572 | |
Commercial Banks - 1.7% | | | | | |
SunTrust Banks, Inc. | | 23,910 | | 457 | |
Communications Equipment - 1.6% | | | | | |
QUALCOMM, Inc. | | 10,780 | | 446 | |
Computers & Peripherals - 3.9% | | | | | |
Apple, Inc. ‡ | | 2,975 | | 561 | |
International Business Machines Corp. | | 4,270 | | 515 | |
Construction & Engineering - 1.4% | | | | | |
Jacobs Engineering Group, Inc. ‡ | | 9,358 | | 396 | |
Diversified Financial Services - 2.1% | | | | | |
JPMorgan Chase & Co. | | 13,573 | | 567 | |
Electrical Equipment - 1.4% | | | | | |
Cooper Industries PLC -Class A | | 9,995 | | 387 | |
Electronic Equipment & Instruments - 1.1% | | | | | |
Tyco Electronics, Ltd. | | 13,700 | | 291 | |
Health Care Equipment & Supplies - 0.9% | | | | | |
Becton Dickinson and Co. | | 3,593 | | 246 | |
Health Care Providers & Services - 2.2% | | | | | |
Community Health Systems, Inc. ‡ | | 19,205 | | 601 | |
IT Services - 0.6% | | | | | |
Automatic Data Processing, Inc. | | 4,000 | | 159 | |
Machinery - 1.8% | | | | | |
Caterpillar, Inc. | | 9,060 | | | 499 | |
Media - 2.0% | | | | | |
Walt Disney Co. | | 19,600 | | 536 | |
Metals & Mining - 1.7% | | | | | |
Vale SA -Class B ADR | | 18,500 | | 472 | |
Multiline Retail - 1.3% | | | | | |
Target Corp. | | 7,385 | | 358 | |
Oil, Gas & Consumable Fuels - 6.8% | | | | | |
Anadarko Petroleum Corp. | | 11,000 | | 671 | |
Exxon Mobil Corp. | | 7,900 | | 566 | |
XTO Energy, Inc. | | 15,000 | | 623 | |
Paper & Forest Products - 2.1% | | | | | |
Weyerhaeuser Co. | | 15,615 | | 567 | |
Pharmaceuticals - 3.3% | | | | | |
Roche Holding AG ADR | | 8,420 | | 336 | |
Teva Pharmaceutical Industries, Ltd. ADR | | 11,115 | | 560 | |
Professional Services - 1.7% | | | | | |
Robert Half International, Inc. | | 20,530 | | 476 | |
Road & Rail - 2.4% | | | | | |
Union Pacific Corp. | | 11,400 | | 628 | |
Software - 3.8% | | | | | |
Microsoft Corp. | | 20,300 | | 563 | |
Oracle Corp. | | 22,880 | | 483 | |
Specialty Retail - 3.5% | | | | | |
Gap, Inc. | | 24,790 | | 529 | |
Home Depot, Inc. | | 15,500 | | 389 | |
Textiles, Apparel & Luxury Goods - 0.7% | | | | | |
Nike, Inc. -Class B | | 3,100 | | 193 | |
Total Common Stocks (cost $14,534) | | | | 16,823 | |
| | | | | | |
| | Principal | | | |
REPURCHASE AGREEMENT - 0.2% | | | | | |
State Street Repurchase Agreement 0.01%, dated 10/30/2009, to be repurchased at $59 on 11/02/2009. Collateralized by a U.S. Government Agency Obligation, 4.00%, due 12/15/2017, and with a value of $64. | | $ | 59 | | 59 | |
Total Repurchase Agreement (cost $59) | | | | | |
| | | | | |
Total Investment Securities (cost $24,448) # | | | | 27,375 | |
Other Assets and Liabilities - Net | | | | (30 | ) |
| | | | | |
Net Assets | | | | $ | 27,345 | |
| | | | | | | |
NOTES TO SCHEDULE OF INVESTMENTS:
‡ | Non-income producing security. |
Ž | The security has a perpetual maturity. The date shown is the next call date. |
■ | Coupon rate is fixed for a predetermined period of time and then converts to a floating rate until maturity/call date. Rate is listed as of 10/31/2009. |
Ə | Security fair valued as determined in good faith in accordance with procedures established by the Board of Trustees. This security had a Market Value of $75, or 0.3% of the Fund’s net assets. |
Ђ | Step bond. Interest rate may increase or decrease as the credit rating changes. |
* | Floating or variable rate note. Rate is listed as of 10/31/2009. |
# | Aggregate cost for federal income tax purposes is $24,113. Aggregate gross unrealized appreciation/depreciation for all securities in which there is an excess of value over tax cost were $3,864 and $602, respectively. Net unrealized appreciation for tax purposes is $3,262. |
The notes to the financial statements are an integral part of this report.
64
(all amounts in thousands)
DEFINITIONS:
144A | 144A Securities are registered pursuant to Rule 144A of the Securities Act of 1933. These securities are deemed to be liquid for purposes of compliance limitations on holdings of illiquid securities and may be resold as transactions exempt from registration, normally to qualified institutional buyers. At 10/31/2009, these securities aggregated $3,468, or 12.68%, of the Fund’s net assets. |
ADR | American Depositary Receipt |
REMIC | Real Estate Mortgage Investment Conduits (consist of a fixed pool of mortgages broken apart and marketed to investors as individual securities). |
VALUATION SUMMARY:
Investment Securities | | Level 1 | | Level 2 | | Level 3 | | Total | |
Equities - Consumer Discretionary | | $ | 3,002 | | $ | — | | $ | — | | $ | 3,002 | |
Equities - Energy | | 1,860 | | — | | — | | 1,860 | |
Equities - Financials | | 2,599 | | — | | — | | 2,599 | |
Equities - Health Care | | 1,743 | | — | | — | | 1,743 | |
Equities - Industrials | | 2,990 | | — | | — | | 2,990 | |
Equities - Information Technology | | 2,572 | | — | | — | | 2,572 | |
Equities - Materials | | 1,611 | | — | | — | | 1,611 | |
Equities - Telecommunication Services | | 446 | | — | | — | | 446 | |
Fixed Income - Asset-Backed Security | | — | | 140 | | — | | 140 | |
Fixed Income - Consumer Discretionary | | — | | 560 | | — | | 560 | |
Fixed Income - Consumer Staples | | — | | 620 | | — | | 620 | |
Fixed Income - Energy | | — | | 749 | | — | | 749 | |
Fixed Income - Financials | | — | | 3,050 | | — | | 3,050 | |
Fixed Income - Industrials | | — | | 382 | | — | | 382 | |
Fixed Income - Information Technology | | — | | 117 | | — | | 117 | |
Fixed Income - Materials | | — | | 1,198 | | — | | 1,198 | |
Fixed Income - Mortgage-Backed Security | | — | | 1,255 | | — | | 1,255 | |
Fixed Income - Municipal Government Obligation | | — | | 61 | | — | | 61 | |
Fixed Income - U.S. Government Agency Obligation | | — | | 1,812 | | — | | 1,812 | |
Fixed Income - U.S. Government Obligation | | — | | 165 | | — | | 165 | |
Fixed Income - Utilities | | — | | 384 | | — | | 384 | |
Cash & Cash Equivalent - Repurchase Agreement | | — | | 59 | | — | | 59 | |
Total | | $ | 16,823 | | $ | 10,552 | | $ | — | | $ | 27,375 | |
The notes to the financial statements are an integral part of this report.
65
STATEMENTS OF ASSETS AND LIABILITIES
At October 31, 2009
(all amounts except per share amounts in thousands)
| | Transamerica
Balanced | | Transamerica
Convertible
Securities | | Transamerica
Equity | | Transamerica Flexible Income | | Transamerica
Growth
Opportunities | |
Assets: | | | | | | | | | | | |
Investment securities, at value | | $ | 95,041 | | $ | 56,542 | | $ | 1,073,749 | | $ | 177,391 | | $ | 189,502 | |
Repurchase agreement, at value | | 295 | | 6,926 | | 26,250 | | 4,169 | | 7,807 | |
Foreign currency, at value | | 19 | | — | | — | | — | | — | |
Receivables: | | | | | | | | | | | |
Investment securities sold | | 1,100 | | 10,967 | | 1,721 | | 3,774 | | 3,127 | |
Shares of beneficial interest sold | | 30 | | 15 | | 261 | | 1,274 | | 100 | |
Interest | | 480 | | 424 | | — | | 2,656 | | — | |
Securities lending income (net) | | — | | — | | 1 | | 2 | | 10 | |
Dividends | | 30 | | 73 | | 259 | | 51 | | 3 | |
Dividend reclaims | | 29 | | — | | 404 | | — | | — | |
Other | | — | | — | | 2,000 | | — | | — | |
Unrealized appreciation on forward foreign currency contracts | | — | | — | | — | | 11 | | — | |
| | $ | 97,024 | | $ | 74,947 | | $ | 1,104,645 | | $ | 189,328 | | $ | 200,549 | |
Liabilities: | | | | | | | | | | | |
Accounts payable and accrued liabilities: | | | | | | | | | | | |
Investment securities purchased | | 1,095 | | 2,357 | | 3,415 | | 6,794 | | 3,950 | |
Shares of beneficial interest redeemed | | 60 | | 125 | | 828 | | 794 | | 36 | |
Management and advisory fees | | 74 | | 48 | | 674 | | 107 | | 147 | |
Distribution and service fees | | 48 | | 11 | | 157 | | 25 | | 38 | |
Transfer agent fees | | 28 | | 3 | | 162 | | 7 | | 48 | |
Administration fees | | 2 | | 1 | | 19 | | 3 | | 3 | |
Other | | 44 | | 54 | | 114 | | 34 | | 33 | |
Collateral for securities on loan | | 674 | | — | | 4,942 | | 4,075 | | 11,263 | |
| | 2,025 | | 2,599 | | 10,311 | | 11,839 | | 15,518 | |
Net assets | | $ | 94,999 | | $ | 72,348 | | $ | 1,094,334 | | $ | 177,489 | | $ | 185,031 | |
| | | | | | | | | | | |
Net assets consist of: | | | | | | | | | | | |
Shares of beneficial interest, unlimited shares authorized, no par value | | $ | 99,968 | | $ | 104,460 | | $ | 1,382,771 | | $ | 236,240 | | $ | 225,509 | |
Undistributed (accumulated) net investment income (loss) | | 69 | | 82 | | 2,928 | | 1,228 | | (16 | ) |
Accumulated net realized gain (loss) from investments | | (10,704 | ) | (34,173 | ) | (384,678 | ) | (68,023 | ) | (48,759 | ) |
Net unrealized appreciation (depreciation) on: | | | | | | | | | | | |
Investment securities | | 5,661 | | 1,979 | | 93,237 | | 8,030 | | 8,297 | |
Translation of assets and liabilities denominated in foreign currencies | | 5 | | — | | 76 | | 14 | | — | |
Net assets | | $ | 94,999 | | $ | 72,348 | | $ | 1,094,334 | | $ | 177,489 | | $ | 185,031 | |
Net assets by class: | | | | | | | | | | | |
Class A | | $ | 60,279 | | $ | 13,012 | | $ | 292,838 | | $ | 24,173 | | $ | 48,788 | |
Class B | | 17,787 | | 2,370 | | 39,699 | | 8,161 | | 14,067 | |
Class C | | 16,933 | | 5,780 | | 37,225 | | 12,978 | | 10,774 | |
Class I | | | | 51,186 | | 637,103 | | 132,177 | | 111,402 | |
Class T | | | | | | 87,469 | | | | | |
Shares outstanding: | | | | | | | | | | | |
Class A | | 3,377 | | 1,548 | | 38,860 | | 2,901 | | 6,474 | |
Class B | | 1,000 | | 284 | | 5,665 | | 978 | | 2,013 | |
Class C | | 957 | | 696 | | 5,289 | | 1,561 | | 1,536 | |
Class I | | | | 6,082 | | 82,878 | | 15,797 | | 14,311 | |
Class T | | | | | | 4,137 | | | | | |
Net asset value per share: | | | | | | | | | | | |
Class A | | $ | 17.85 | | $ | 8.41 | | $ | 7.54 | | $ | 8.33 | | $ | 7.54 | |
Class B | | 17.79 | | 8.35 | | 7.01 | | 8.34 | | 6.99 | |
Class C | | 17.69 | | 8.30 | | 7.04 | | 8.31 | | 7.01 | |
Class I | | | | 8.42 | | 7.69 | | 8.37 | | 7.78 | |
Class T | | | | | | 21.14 | | | | | |
Maximum offering price per share (a) | | | | | | | | | | | |
Class A | | $ | 18.89 | | $ | 8.83 | | $ | 7.98 | | $ | 8.75 | | $ | 7.97 | |
| | | | | | | | | | | |
Investment securities, at cost | | $ | 89,380 | | $ | 54,563 | | $ | 980,512 | | $ | 169,361 | | $ | 181,205 | |
Repurchase agreement, at cost | | $ | 295 | | $ | 6,926 | | $ | 26,250 | | $ | 4,169 | | $ | 7,807 | |
Foreign currency, at cost | | $ | 18 | | $ | — | | $ | — | | $ | — | | $ | — | |
Securities loaned, at value | | $ | 659 | | $ | — | | $ | 4,781 | | $ | 3,993 | | $ | 10,983 | |
The notes to the financial statements are an integral part of this report.
66
| | Transamerica
High Yield Bond | | Transamerica
Legg Mason
Partners All Cap | | Transamerica
Money Market | | Transamerica
Science &
Technology | | Transamerica
Short-Term
Bond | |
Assets: | | | | | | | | | | | |
Investment securities, at value | | $ | 561,730 | | $ | 66,744 | | $ | 261,562 | | $ | 63,978 | | $ | 1,283,203 | |
Repurchase agreement, at value | | 26,956 | | 2,073 | | 1,143 | | 444 | | 18,897 | |
Cash on deposit with broker | | — | | — | | — | | — | | 1,237 | |
Receivables: | | | | | | | | | | | |
Investment securities sold | | 3,336 | | 141 | | — | | 936 | | 5,085 | |
Shares of beneficial interest sold | | 986 | | 14 | | 568 | | 9 | | 21,547 | |
Interest | | 12,954 | | — | | 37 | | — | | 17,287 | |
Securities lending income (net) | | 23 | | — | | — | | 2 | | 2 | |
Dividends | | 39 | | 44 | | — | | 42 | | — | |
Dividend reclaims | | — | | 15 | | — | | — | | — | |
Due from advisor | | — | | — | | 168 | | — | | — | |
| | $ | 606,024 | | $ | 69,031 | | $ | 263,478 | | $ | 65,411 | | $ | 1,347,258 | |
Liabilities: | | | | | | | | | | | |
Accounts payable and accrued liabilities: | | | | | | | | | | | |
Investment securities purchased | | 2,134 | | — | | — | | — | | 21,948 | |
Shares of beneficial interest redeemed | | 380 | | 141 | | 744 | | 3 | | 1,287 | |
Management and advisory fees | | 279 | | 24 | | — | | 45 | | 497 | |
Distribution and service fees | | 45 | | 40 | | 116 | | 5 | | 319 | |
Transfer agent fees | | 10 | | 29 | | 45 | | 4 | | 18 | |
Administration fees | | 10 | | 1 | | 5 | | 1 | | 21 | |
Distribution payable | | — | | — | | 22 | | — | | 3,002 | |
Variation margin | | — | | — | | — | | — | | 798 | |
Other | | 67 | | 27 | | 40 | | 25 | | 145 | |
Collateral for securities on loan | | 31,427 | | — | | — | | — | | 1,554 | |
| | 34,352 | | 262 | | 972 | | 83 | | 29,589 | |
Net assets | | $ | 571,672 | | $ | 68,769 | | $ | 262,506 | | $ | 65,328 | | $ | 1,317,669 | |
| | | | | | | | | | | |
Net assets consist of: | | | | | | | | | | | |
Shares of beneficial interest, unlimited shares authorized, no par value | | $ | 630,476 | | $ | 75,087 | | $ | 262,423 | | $ | 67,374 | | $ | 1,286,345 | |
Undistributed (accumulated) net investment income (loss) | | 2,454 | | 171 | | 83 | | (2 | ) | 518 | |
Accumulated net realized gain (loss) from investments | | (66,754 | ) | (8,031 | ) | — | | (12,670 | ) | (13,718 | ) |
Net unrealized appreciation (depreciation) on: | | | | | | | | | | | |
Investment securities | | 5,496 | | 1,542 | | — | | 10,626 | | 45,328 | |
Futures contracts | | — | | — | | — | | — | | (801 | ) |
Translation of assets and liabilities denominated in foreign currencies | | — | | — | | — | | — | | (3 | ) |
Net assets | | $ | 571,672 | | $ | 68,769 | | $ | 262,506 | | $ | 65,328 | | $ | 1,317,669 | |
Net assets by class: | | | | | | | | | | | |
Class A | | $ | 67,290 | | $ | 36,940 | | $ | 146,598 | | $ | 5,774 | | $ | 289,879 | |
Class B | | 11,898 | | 18,510 | | 35,612 | | 1,588 | | | |
Class C | | 19,548 | | 13,319 | | 46,177 | | 1,500 | | 317,130 | |
Class I | | 472,936 | | | | 34,119 | | 56,466 | | 710,660 | |
Shares outstanding: | | | | | | | | | | | |
Class A | | 7,968 | | 3,321 | | 146,598 | | 1,617 | | 28,258 | |
Class B | | 1,410 | | 1,788 | | 35,612 | | 474 | | | |
Class C | | 2,321 | | 1,287 | | 46,177 | | 448 | | 30,967 | |
Class I | | 55,634 | | | | 34,119 | | 15,424 | | 70,480 | |
Net asset value per share: | | | | | | | | | | | |
Class A | | $ | 8.45 | | $ | 11.12 | | $ | 1.00 | | $ | 3.57 | | $ | 10.26 | |
Class B | | 8.44 | | 10.35 | | 1.00 | | 3.35 | | | |
Class C | | 8.42 | | 10.35 | | 1.00 | | 3.35 | | 10.24 | |
Class I | | 8.50 | | | | 1.00 | | 3.66 | | 10.08 | |
Maximum offering price per share (a) | | | | | | | | | | | |
Class A | | $ | 8.87 | | $ | 11.77 | | $ | 1.00 | | $ | 3.78 | | $ | 10.52 | |
| | | | | | | | | | | |
Investment securities, at cost | | $ | 556,234 | | $ | 65,202 | | $ | 261,562 | | $ | 53,352 | | $ | 1,237,875 | |
Repurchase agreement, at cost | | $ | 26,956 | | $ | 2,073 | | $ | 1,143 | | $ | 444 | | $ | 18,897 | |
Securities loaned, at value | | $ | 30,783 | | $ | — | | $ | — | | $ | — | | $ | 1,522 | |
The notes to the financial statements are an integral part of this report.
67
| | Transamerica
Small/Mid Cap
Value | | Transamerica
Templeton
Global | | Transamerica
Value Balanced | |
Assets: | | | | | | | |
Investment securities, at value | | $ | 361,336 | | $ | 98,644 | | $ | 27,316 | |
Repurchase agreement, at value | | 21,689 | | 1,669 | | 59 | |
Foreign currency, at value | | — | | 342 | | — | |
Receivables: | | | | | | | |
Investment securities sold | | — | | 361 | | 191 | |
Shares of beneficial interest sold | | 2,116 | | 5 | | — | |
Interest | | — | | — | | 145 | |
Securities lending income (net) | | 10 | | — | | — | |
Dividends | | 189 | | 122 | | 11 | |
Dividend reclaims | | — | | 205 | | — | |
| | $ | 385,340 | | $ | 101,348 | | $ | 27,722 | |
Liabilities: | | | | | | | |
Accounts payable and accrued liabilities: | | | | | | | |
Investment securities purchased | | — | | 8 | | 269 | |
Shares of beneficial interest redeemed | | 1,332 | | 142 | | 3 | |
Management and advisory fees | | 261 | | 33 | | 22 | |
Distribution and service fees | | 199 | | 44 | | 14 | |
Transfer agent fees | | 69 | | 48 | | 9 | |
Administration fees | | 6 | | 2 | | 1 | |
Other | | 51 | | 33 | | 59 | |
Collateral for securities on loan | | 20,574 | | — | | — | |
| | 22,492 | | 310 | | 377 | |
Net assets | | $ | 362,848 | | $ | 101,038 | | $ | 27,345 | |
| | | | | | | |
Net assets consist of: | | | | | | | |
Shares of beneficial interest, unlimited shares authorized, no par value | | $ | 520,761 | | $ | 384,590 | | $ | 29,975 | |
Undistributed (accumulated) net investment income (loss) | | (1 | ) | 574 | | 325 | |
Accumulated net realized gain (loss) from investments | | (200,403 | ) | (280,922 | ) | (5,882 | ) |
Net unrealized appreciation (depreciation) on: | | | | | | | |
Investment securities | | 42,491 | | (3,226 | ) | 2,927 | |
Translation of assets and liabilities denominated in foreign currencies | | — | | 22 | | — | |
Net assets | | $ | 362,848 | | $ | 101,038 | | $ | 27,345 | |
Net assets by class: | | | | | | | |
Class A | | $ | 201,569 | | $ | 78,387 | | $ | 18,280 | |
Class B | | 34,573 | | 8,388 | | 3,817 | |
Class C | | 115,960 | | 14,263 | | 5,248 | |
Class I | | 10,746 | | | | | |
Shares outstanding: | | | | | | | |
Class A | | 13,689 | | 3,380 | | 1,880 | |
Class B | | 2,442 | | 384 | | 393 | |
Class C | | 8,282 | | 660 | | 542 | |
Class I | | 725 | | | | | |
Net asset value per share: | | | | | | | |
Class A | | $ | 14.72 | | $ | 23.19 | | $ | 9.73 | |
Class B | | 14.16 | | 21.84 | | 9.70 | |
Class C | | 14.00 | | 21.62 | | 9.69 | |
Class I | | 14.82 | | | | | |
Maximum offering price per share (a) | | | | | | | |
Class A | | $ | 15.58 | | $ | 24.54 | | $ | 10.30 | |
| | | | | | | |
Investment securities, at cost | | $ | 318,845 | | $ | 101,870 | | $ | 24,389 | |
Repurchase agreement, at cost | | $ | 21,689 | | $ | 1,669 | | $ | 59 | |
Foreign currency, at cost | | $ | — | | $ | 340 | | $ | — | |
Securities loaned, at value | | $ | 20,085 | | $ | — | | $ | — | |
(a) Includes the maximum selling commission (represented as a percentage of offering price) which is reduced on certain levels of sales as set forth in the Prospectus. Net asset value per share for Classes B, C, I, and T shares represents offering price. The redemption price for Classes B and C shares equals net asset value less any applicable contingent deferred sales charge.
The notes to the financial statements are an integral part of this report.
68
STATEMENTS OF OPERATIONS
For the year ended October 31, 2009
(all amounts in thousands)
| | Transamerica
Balanced | | Transamerica
Convertible
Securities | | Transamerica
Equity | | Transamerica
Flexible Income | | Transamerica
Growth
Opportunities | |
Investment income: | | | | | | | | | | | |
Dividend income | | $ | 873 | | $ | 881 | | $ | 13,846 | | $ | 287 | | $ | 1,456 | |
Withholding taxes on foreign dividends | | — | | — | | (24 | ) | (30 | ) | (4 | ) |
Interest income | | 2,200 | | 2,210 | | 6 | | 10,450 | | 1 | |
Securities lending income (net) | | 68 | | 41 | | 286 | | 33 | | 247 | |
| | 3,141 | | 3,132 | | 14,114 | | 10,740 | | 1,700 | |
Expenses: | | | | | | | | | | | |
Management and advisory | | 728 | | 622 | | 6,576 | | 1,039 | | 1,269 | |
Distribution and service: | | | | | | | | | | | |
Class A | | 182 | | 40 | | 948 | | 57 | | 149 | |
Class B | | 227 | | 24 | | 439 | | 81 | | 155 | |
Class C | | 162 | | 60 | | 378 | | 75 | | 99 | |
Transfer agent: | | | | | | | | | | | |
Class A | | 203 | | 24 | | 1,361 | | 44 | | 412 | |
Class B | | 106 | | 8 | | 299 | | 25 | | 124 | |
Class C | | 46 | | 9 | | 190 | | 16 | | 70 | |
Class I | | | | — | (a) | — | (a) | — | (a) | — | (a) |
Class T | | | | | | 171 | | | | | |
Printing and shareholder reports | | 29 | | 18 | | 207 | | 32 | | 42 | |
Custody | | 24 | | 16 | | 82 | | 31 | | 21 | |
Administration | | 18 | | 16 | | 181 | | 29 | | 32 | |
Legal | | 3 | | 3 | | 29 | | 5 | | 5 | |
Audit and tax | | 23 | | 24 | | 61 | | 24 | | 20 | |
Trustees | | 2 | | 2 | | 20 | | 3 | | 3 | |
Registration | | 35 | | 34 | | 57 | | 37 | | 36 | |
Other | | 39 | | 36 | | 222 | | 14 | | 14 | |
Total expenses | | 1,827 | | 936 | | 11,221 | | 1,512 | | 2,451 | |
Class expense reimbursed: | | | | | | | | | | | |
Class A | | — | | — | | (418 | ) | — | | (203 | ) |
Class B | | — | | — | | (145 | ) | — | | (48 | ) |
Class C | | — | | — | | (58 | ) | — | | (22 | ) |
Total expense reimbursed | | — | | — | | (621 | ) | — | | (273 | ) |
Net expenses | | 1,827 | | 936 | | 10,600 | | 1,512 | | 2,178 | |
Net investment income (loss) | | 1,314 | | 2,196 | | 3,514 | | 9,228 | | (478 | ) |
Net realized gain (loss) on transactions from: | | | | | | | | | | | |
Investment securities | | (10,551 | ) | (16,800 | ) | (229,461 | ) | (20,030 | ) | (15,832 | ) |
Foreign currency transactions | | 4 | | — | | — | | (163 | ) | — | |
| | (10,547 | ) | (16,800 | ) | (229,461 | ) | (20,193 | ) | (15,832 | ) |
| | | | | | | | | | | |
Net increase (decrease) in unrealized appreciation (depreciation) on: | | | | | | | | | | | |
Investment securities | | 23,660 | | 25,198 | | 309,343 | | 39,616 | | 39,944 | |
Translation of assets and liabilities denominated in foreign currencies | | — | | — | | 47 | | (33 | ) | — | |
Change in unrealized appreciation (depreciation) | | 23,660 | | 25,198 | | 309,390 | | 39,583 | | 39,944 | |
Net realized and unrealized gain: | | 13,113 | | 8,398 | | 79,929 | | 19,390 | | 24,112 | |
Net increase In net assets resulting from operations | | $ | 14,427 | | $ | 10,594 | | $ | 83,443 | | $ | 28,618 | | $ | 23,634 | |
The notes to the financial statements are an integral part of this report.
69
| | Transamerica
High Yield Bond | | Transamerica Legg
Mason Partners All
Cap | | Transamerica
Money Market | | Transamerica
Science &
Technology | | Transamerica
Short-Term Bond | |
Investment income: | | | | | | | | | | | |
Dividend income | | $ | 139 | | $ | 1,542 | | $ | — | | $ | 273 | | $ | — | |
Withholding taxes on foreign dividends | | (3 | ) | (68 | ) | — | | — | | (14 | ) |
Interest income | | 48,314 | | — | | 2,363 | | — | | 43,830 | |
Securities lending income (net) | | 210 | | 24 | | — | | 36 | | 33 | |
| | 48,660 | | 1,498 | | 2,363 | | 309 | | 43,849 | |
Expenses: | | | | | | | | | | | |
Management and advisory | | 2,703 | | 527 | | 1,163 | | 424 | | 4,565 | |
Distribution and service: | | | | | | | | | | | |
Class A | | 137 | | 103 | | 524 | | 15 | | 271 | |
Class B | | 100 | | 234 | | 416 | | 16 | | — | |
Class C | | 115 | | 129 | | 620 | | 13 | | 901 | |
Transfer agent: | | | | | | | | | | | |
Class A | | 64 | | 169 | | 348 | | 32 | | 48 | |
Class B | | 24 | | 142 | | 93 | | 15 | | | |
Class C | | 16 | | 51 | | 76 | | 8 | | 55 | |
Class I | | — | (a) | | | — | (a) | — | (a) | — | (a) |
Money market guarantee insurance | | | | | | | | | | | |
Class A | | — | | — | | 46 | | — | | — | |
Class B | | — | | — | | 10 | | — | | | |
Class C | | — | | — | | 15 | | — | | — | |
Class I | | — | | | | 10 | | — | | — | |
Printing and shareholder reports | | 85 | | 24 | | 67 | | 16 | | 161 | |
Custody | | 71 | | 22 | | 40 | | 10 | | 88 | |
Administration | | 92 | | 13 | | 58 | | 11 | | 150 | |
Legal | | 15 | | 2 | | 9 | | 2 | | 23 | |
Audit and tax | | 24 | | 20 | | 21 | | 21 | | 24 | |
Trustees | | 10 | | 1 | | 5 | | 1 | | 17 | |
Registration | | 45 | | 41 | | 77 | | 30 | | 115 | |
Other | | 25 | | 20 | | 15 | | 6 | | 10 | |
Total expenses | | 3,526 | | 1,498 | | 3,613 | | 620 | | 6,428 | |
Fund expense reimbursed: | | — | | — | | — | | — | | (490 | ) |
Class expense reimbursed: | | | | | | | | | | | |
Class A | | — | | (114 | ) | (763 | ) | (22 | ) | (72 | ) |
Class B | | — | | (98 | ) | (422 | ) | (11 | ) | — | |
Class C | | — | | (27 | ) | (552 | ) | (5 | ) | — | |
Class I | | — | | | | (30 | ) | — | | — | |
Total expense reimbursed | | — | | (239 | ) | (1,767 | ) | (38 | ) | (562 | ) |
Net expenses | | 3,526 | | 1,259 | | 1,846 | | 582 | | 5,866 | |
Net investment income (loss) | | 45,134 | | 239 | | 517 | | (273 | ) | 37,983 | |
Net realized gain (loss) on transactions from: | | | | | | | | | | | |
Investment securities | | (55,912 | ) | (5,541 | ) | — | | (12,107 | ) | 2,129 | |
Futures contracts | | — | | — | | — | | — | | (1,588 | ) |
Foreign currency transactions | | — | | — | | — | | — | | (14 | ) |
| | (55,912 | ) | (5,541 | ) | — | | (12,107 | ) | 527 | |
| | | | | | | | | | | |
Net increase (decrease) in unrealized appreciation (depreciation) on: | | | | | | | | | | | |
Investment securities | | 183,047 | | 12,095 | | — | | 25,657 | | 66,035 | |
Futures contracts | | — | | — | | — | | — | | (640 | ) |
Translation of assets and liabilities denominated in foreign currencies | | — | | — | | — | | — | | (5 | ) |
Change in unrealized appreciation (depreciation) | | 183,047 | | 12,095 | | — | | 25,657 | | 65,390 | |
Net realized and unrealized gain | | 127,135 | | 6,554 | | — | | 13,550 | | 65,917 | |
Net increase In net assets resulting from operations | | $ | 172,269 | | $ | 6,793 | | $ | 517 | | $ | 13,277 | | $ | 103,900 | |
The notes to the financial statements are an integral part of this report.
70
| | Transamerica
Small/Mid Cap
Value | | Transamerica
Templeton Global | | Transamerica Value
Balanced | |
Investment income: | | | | | | | |
Dividend income | | $ | 4,576 | | $ | 2,515 | | $ | 434 | |
Withholding taxes on foreign dividends | | — | | (204 | ) | (3 | ) |
Interest income | | 4 | | — | | 676 | |
Securities lending income (net) | | 288 | | 53 | | 11 | |
| | 4,868 | | 2,364 | | 1,118 | |
Expenses: | | | | | | | |
Management and advisory | | 2,442 | | 730 | | 202 | |
Distribution and service: | | | | | | | |
Class A | | 555 | | 244 | | 60 | |
Class B | | 302 | | 85 | | 47 | |
Class C | | 926 | | 131 | | 51 | |
Transfer agent: | | | | | | | |
Class A | | 506 | | 460 | | 74 | |
Class B | | 97 | | 76 | | 29 | |
Class C | | 254 | | 79 | | 15 | |
Class I | | — | (a) | | | | |
Printing and shareholder reports | | 141 | | 28 | | 12 | |
Custody | | 41 | | 25 | | 20 | |
Administration | | 61 | | 18 | | 5 | |
Legal | | 11 | | 62 | | 1 | |
Audit and tax | | 23 | | 35 | | 28 | |
Trustees | | 6 | | 2 | | 1 | |
Registration | | 59 | | 34 | | 35 | |
Reorganization | | — | | — | | 33 | |
Other | | 26 | | 63 | | 9 | |
Total expenses | | 5,450 | | 2,072 | | 622 | |
Class expense reimbursed: | | | | | | | |
Class A | | — | | (385 | ) | (67 | ) |
Class B | | — | | (67 | ) | (27 | ) |
Class C | | — | | (65 | ) | (13 | ) |
Total expense reimbursed | | — | | (517 | ) | (107 | ) |
Net expenses | | 5,450 | | 1,555 | | 515 | |
Net investment income (loss) | | (582 | ) | 809 | | 603 | |
| | | | | | | |
Net realized gain (loss) on transactions from: | | | | | | | |
Investment securities | | (101,349 | ) | (16,965 | ) | (2,247 | ) |
Foreign currency transactions | | — | | 9 | | — | |
| | (101,349 | ) | (16,956 | ) | (2,247 | ) |
| | | | | | | |
Net increase (decrease) in unrealized appreciation (depreciation) on: | | | | | | | |
Investment securities | | 110,124 | | 31,886 | | 4,301 | |
Translation of assets and liabilities denominated in foreign currencies | | — | | 31 | | — | |
Change in unrealized appreciation (depreciation) | | 110,124 | | 31,917 | | 4,301 | |
Net realized and unrealized gain | | 8,775 | | 14,961 | | 2,054 | |
Net increase In net assets resulting from operations | | $ | 8,193 | | $ | 15,770 | | $ | 2,657 | |
(a) Rounds to less than $1.
The notes to the financial statements are an integral part of this report.
71
STATEMENTS OF CHANGES IN NET ASSETS
For the years ended:
(all amounts in thousands)
| | Transamerica Balanced | | Transamerica Convertible
Securities | | Transamerica Equity | |
| | October 31, 2009 | | October 31, 2008 | | October 31, 2009 | | October 31, 2008 | | October 31, 2009 | | October 31, 2008 | |
From operations: | | | | | | | | | | | | | |
Net investment income | | $ | 1,314 | | $ | 1,331 | | $ | 2,196 | | $ | 2,392 | | $ | 3,514 | | $ | 2,780 | |
Net realized gain (loss)(a) | | (10,547 | ) | 6,222 | | (16,800 | ) | (17,308 | ) | (229,461 | ) | (58,064 | ) |
Change in unrealized appreciation (depreciation)(b) | | 23,660 | | (63,988 | ) | 25,198 | | (55,761 | ) | 309,390 | | (731,286 | ) |
Net increase (decrease) in net assets resulting from operations | | 14,427 | | (56,435 | ) | 10,594 | | (70,677 | ) | 83,443 | | (786,570 | ) |
| | | | | | | | | | | | | |
Distributions to shareholders: | | | | | | | | | | | | | |
From net investment income: | | | | | | | | | | | | | |
Class A | | (1,014 | ) | (699 | ) | (304 | ) | (133 | ) | — | | — | |
Class B | | (251 | ) | (286 | ) | (51 | ) | (15 | ) | — | | — | |
Class C | | (226 | ) | (161 | ) | (137 | ) | (38 | ) | — | | — | |
Class I | | — | | — | | (2,142 | ) | (1,811 | ) | (2,946 | ) | — | |
Class T | | — | | — | | | | | | (9 | ) | — | |
| | (1,491 | ) | (1,146 | ) | (2,634 | ) | (1,997 | ) | (2,955 | ) | — | |
From net realized gains: | | | | | | | | | | �� | | | |
Class A | | (3,148 | ) | (1,615 | ) | — | | (2,349 | ) | — | | — | |
Class B | | (1,819 | ) | (2,368 | ) | — | | (1,381 | ) | — | | — | |
Class C | | (1,091 | ) | (828 | ) | — | | (861 | ) | — | | — | |
Class I | | — | | — | | — | | (31,579 | ) | — | | — | |
| | (6,058 | ) | (4,811 | ) | — | | (36,170 | ) | — | | — | |
Total distributions to shareholders | | (7,549 | ) | (5,957 | ) | (2,634 | ) | (38,167 | ) | (2,955 | ) | — | |
| | | | | | | | | | | | | |
Capital share transactions: | | | | | | | | | | | | | |
Proceeds from shares sold: | | | | | | | | | | | | | |
Class A | | 2,689 | | 3,878 | | 7,615 | | 13,963 | | 18,934 | | 42,081 | |
Class B | | 1,256 | | 2,063 | | 399 | | 1,164 | | 2,981 | | 4,848 | |
Class C | | 912 | | 1,325 | | 2,203 | | 9,648 | | 2,444 | | 5,391 | |
Class I | | — | | — | | 103 | | 6,078 | | 157,215 | | 51,057 | |
Class T | | — | | — | | — | | — | | 920 | | 1,798 | |
| | 4,857 | | 7,266 | | 10,320 | | 30,853 | | 182,494 | | 105,175 | |
Dividends and distributions reinvested: | | | | | | | | | | | | | |
Class A | | 3,940 | | 2,018 | | 227 | | 1,721 | | — | | — | |
Class B | | 1,971 | | 2,440 | | 40 | | 1,103 | | — | | — | |
Class C | | 1,182 | | 879 | | 51 | | 599 | | — | | — | |
Class I | | — | | — | | 2,142 | | 32,781 | | 2,946 | | — | |
Class T | | — | | — | | — | | — | | 9 | | — | |
| | 7,093 | | 5,337 | | 2,460 | | 36,204 | | 2,955 | | — | |
Cost of shares redeemed: | | | | | | | | | | | | | |
Class A | | (12,325 | ) | (15,261 | ) | (7,658 | ) | (7,685 | ) | (65,179 | ) | (89,748 | ) |
Class B | | (7,498 | ) | (19,396 | ) | (1,156 | ) | (1,659 | ) | (10,613 | ) | (28,453 | ) |
Class C | | (4,111 | ) | (6,156 | ) | (4,402 | ) | (2,109 | ) | (14,174 | ) | (19,902 | ) |
Class I | | — | | — | | (47,593 | ) | (4,311 | ) | (67,722 | ) | (56,853 | ) |
Class T | | — | | — | | — | | — | | (11,813 | ) | (21,752 | ) |
| | (23,934 | ) | (40,813 | ) | (60,809 | ) | (15,764 | ) | (169,501 | ) | (216,708 | ) |
Redemption fee: | | | | | | | | | | | | | |
Class A | | — | | — | | — | | — | | — | | 3 | |
| | — | | — | | — | | — | | — | | 3 | |
Automatic conversions: | | | | | | | | | | | | | |
Class A | | 11,140 | | 24,175 | | 185 | | 645 | | 14,302 | | 48,320 | |
Class B | | (11,140 | ) | (24,175 | ) | (185 | ) | (645 | ) | (14,302 | ) | (48,320 | ) |
| | — | | — | | — | | — | | — | | — | |
Net increase (decrease) in net assets resulting from capital shares transactions | | (11,984 | ) | (28,210 | ) | (48,029 | ) | 51,293 | | 15,948 | | (111,530 | ) |
| | | | | | | | | | | | | |
Net increase (decrease) in net assets | | (5,106 | ) | (90,602 | ) | (40,069 | ) | (57,551 | ) | 96,436 | | (898,100 | ) |
| | | | | | | | | | | | | |
Net assets: | | | | | | | | | | | | | |
Beginning of year | | $ | 100,105 | | $ | 190,707 | | $ | 112,417 | | $ | 169,968 | | $ | 997,898 | | $ | 1,895,998 | |
End of year | | $ | 94,999 | | $ | 100,105 | | $ | 72,348 | | $ | 112,417 | | $ | 1,094,334 | | $ | 997,898 | |
Undistributed net investment income (loss) | | $ | 69 | | $ | 189 | | $ | 82 | | $ | 520 | | $ | 2,928 | | $ | 2,369 | |
The notes to the financial statements are an integral part of this report.
72
| | Transamerica Balanced | | Transamerica Convertible
Securities | | Transamerica Equity | |
| | October 31, 2009 | | October 31, 2008 | | October 31, 2009 | | October 31, 2008 | | October 31, 2009 | | October 31, 2008 | |
| | | | | | | | | | | | | |
Share activity: | | | | | | | | | | | | | |
Shares issued: | | | | | | | | | | | | | |
Class A | | 168 | | 168 | | 1,041 | | 1,322 | | 2,948 | | 4,098 | |
Class B | | 80 | | 93 | | 53 | | 111 | | 506 | | 511 | |
Class C | | 59 | | 60 | | 300 | | 939 | | 414 | | 552 | |
Class I | | — | | — | | 14 | | 509 | | 21,289 | | 6,453 | |
Class T | | — | | — | | — | | — | | 51 | | 64 | |
| | 307 | | 321 | | 1,408 | | 2,881 | | 25,208 | | 11,678 | |
Shares issued-reinvested from distributions: | | | | | | | | | | | | | |
Class A | | 264 | | 95 | | 32 | | 159 | | — | | 6 | |
Class B | | 133 | | 104 | | 6 | | 100 | | — | | — | |
Class C | | 80 | | 39 | | 7 | | 55 | | — | | — | |
Class I | | — | | — | | 306 | | 3,008 | | 458 | | — | |
Class T | | — | | — | | — | | — | | 1 | | — | |
| | 477 | | 238 | | 351 | | 3,322 | | 459 | | 6 | |
Shares redeemed: | | | | | | | | | | | | | |
Class A | | (794 | ) | (712 | ) | (1,046 | ) | (784 | ) | (10,073 | ) | (9,119 | ) |
Class B | | (490 | ) | (893 | ) | (160 | ) | (168 | ) | (1,764 | ) | (3,011 | ) |
Class C | | (269 | ) | (289 | ) | (607 | ) | (235 | ) | (2,369 | ) | (2,172 | ) |
Class I | | — | | — | | (6,994 | ) | (465 | ) | (10,523 | ) | (7,429 | ) |
Class T | | — | | — | | — | | — | | (664 | ) | (787 | ) |
| | (1,553 | ) | (1,894 | ) | (8,807 | ) | (1,652 | ) | (25,393 | ) | (22,518 | ) |
Automatic conversions: | | | | | | | | | | | | | |
Class A | | 704 | | 1,089 | | 25 | | 62 | | 2,192 | | 4,704 | |
Class B | | (707 | ) | (1,096 | ) | (25 | ) | (62 | ) | (2,349 | ) | (5,003 | ) |
| | (3 | ) | (7 | ) | — | | — | | (157 | ) | (299 | ) |
Net increase (decrease) in shares outstanding: | | | | | | | | | | | | | |
Class A | | 342 | | 640 | | 52 | | 759 | | (4,933 | ) | (311 | ) |
Class B | | (984 | ) | (1,792 | ) | (126 | ) | (19 | ) | (3,607 | ) | (7,503 | ) |
Class C | | (130 | ) | (190 | ) | (300 | ) | 759 | | (1,955 | ) | (1,620 | ) |
Class I | | | | | | (6,674 | ) | 3,052 | | 11,224 | | (976 | ) |
Class T | | | | | | | | | | (612 | ) | (723 | ) |
| | (772 | ) | (1,342 | ) | (7,048 | ) | 4,551 | | 117 | | (11,133 | ) |
The notes to the financial statements are an integral part of this report.
73
| | Transamerica Flexible Income | | Transamerica Growth
Opportunities | | Transamerica High Yield Bond | |
| | October 31, 2009 | | October 31, 2008 | | October 31, 2009 | | October 31, 2008 | | October 31, 2009 | | October 31, 2008 | |
From operations: | | | | | | | | | | | | | |
Net investment income (loss) | | $ | 9,228 | | $ | 19,949 | | $ | (478 | ) | $ | (933 | ) | $ | 45,134 | | $ | 37,005 | |
Net realized gain (loss)(a) | | (20,193 | ) | (34,533 | ) | (15,832 | ) | (20,795 | ) | (55,912 | ) | (9,296 | ) |
Change in unrealized appreciation (depreciation)(b) | | 39,583 | | (26,098 | ) | 39,944 | | (114,155 | ) | 183,047 | | (173,227 | ) |
Net increase (decrease) in net assets resulting from operations | | 28,618 | | (40,682 | ) | 23,634 | | (135,883 | ) | 172,269 | | (145,518 | ) |
| | | | | | | | | | | | | |
Distributions to shareholders: | | | | | | | | | | | | | |
From net investment income: | | | | | | | | | | | | | |
Class A | | (941 | ) | (849 | ) | — | | — | | (3,588 | ) | (2,500 | ) |
Class B | | (410 | ) | (600 | ) | — | | — | | (873 | ) | (1,008 | ) |
Class C | | (384 | ) | (386 | ) | — | | — | | (961 | ) | (574 | ) |
Class I | | (7,215 | ) | (18,830 | ) | — | | — | | (40,325 | ) | (31,427 | ) |
| | (8,950 | ) | (20,665 | ) | — | | — | | (45,747 | ) | (35,509 | ) |
Total distributions to shareholders | | (8,950 | ) | (20,665 | ) | — | | — | | (45,747 | ) | (35,509 | ) |
| | | | | | | | | | | | | |
Capital share transactions: | | | | | | | | | | | | | |
Proceeds from shares sold: | | | | | | | | | | | | | |
Class A | | 10,176 | | 3,320 | | 4,051 | | 3,902 | | 47,357 | | 10,846 | |
Class B | | 2,774 | | 1,949 | | 1,387 | | 2,025 | | 4,221 | | 1,083 | |
Class C | | 16,525 | | 2,580 | | 1,126 | | 1,293 | | 18,109 | | 736 | |
Class I | | 28,190 | | 28,018 | | 10,374 | | 1,984 | | 33,691 | | 241,102 | |
| | 57,665 | | 35,867 | | 16,938 | | 9,204 | | 103,378 | | 253,767 | |
Dividends and distributions reinvested: | | | | | | | | | | | | | |
Class A | | 781 | | 509 | | — | | — | | 2,491 | | 1,345 | |
Class B | | 317 | | 369 | | — | | — | | 546 | | 502 | |
Class C | | 298 | | 239 | | — | | — | | 576 | | 267 | |
Class I | | 7,215 | | 15,299 | | — | | — | | 40,325 | | 20,457 | |
| | 8,611 | | 16,416 | | — | | — | | 43,938 | | 22,571 | |
Cost of shares redeemed: | | | | | | | | | | | | | |
Class A | | (4,781 | ) | (5,383 | ) | (9,176 | ) | (14,166 | ) | (21,773 | ) | (14,351 | ) |
Class B | | (2,734 | ) | (5,085 | ) | (3,018 | ) | (9,511 | ) | (3,022 | ) | (6,552 | ) |
Class C | | (11,057 | ) | (4,119 | ) | (2,206 | ) | (4,474 | ) | (8,685 | ) | (3,074 | ) |
Class I | | (45,960 | ) | (232,281 | ) | (14 | ) | (45,766 | ) | (126,635 | ) | (11,363 | ) |
| | (64,532 | ) | (246,868 | ) | (14,414 | ) | (73,917 | ) | (160,115 | ) | (35,340 | ) |
Redemption fee: | | | | | | | | | | | | | |
Class A | | — | | — | | 1 | | 1 | | — | | 1 | |
| | — | | — | | 1 | | 1 | | — | | 1 | |
Automatic conversions: | | | | | | | | | | | | | |
Class A | | 2,016 | | 3,069 | | 6,621 | | 15,592 | | 1,995 | | 2,666 | |
Class B | | (2,016 | ) | (3,069 | ) | (6,621 | ) | (15,592 | ) | (1,995 | ) | (2,666 | ) |
| | — | | — | | — | | — | | — | | — | |
Net increase (decrease) in net assets resulting from capital shares transactions | | 1,744 | | (194,585 | ) | 2,525 | | (64,712 | ) | (12,799 | ) | 240,999 | |
| | | | | | | | | | | | | |
Net increase (decrease) in net assets | | 21,412 | | (255,932 | ) | 26,159 | | (200,595 | ) | 113,723 | | 59,972 | |
| | | | | | | | | | | | | |
Net assets: | | | | | | | | | | | | | |
Beginning of year | | $ | 156,077 | | $ | 412,009 | | $ | 158,872 | | $ | 359,467 | | $ | 457,949 | | $ | 397,977 | |
End of year | | $ | 177,489 | | $ | 156,077 | | $ | 185,031 | | $ | 158,872 | | $ | 571,672 | | $ | 457,949 | |
Undistributed (accumulated) net investment income (loss) | | $ | 1,083 | | $ | 805 | | $ | (16 | ) | $ | (17 | ) | $ | 2,454 | | $ | 3,067 | |
The notes to the financial statements are an integral part of this report.
74
| | Transamerica Flexible Income | | Transamerica Growth
Opportunities | | Transamerica High Yield Bond | |
| | October 31, 2009 | | October 31, 2008 | | October 31, 2009 | | October 31, 2008 | | October 31, 2009 | | October 31, 2008 | |
Share activity: | | | | | | | | | | | | | |
Shares issued: | | | | | | | | | | | | | |
Class A | | 1,330 | | 359 | | 608 | | 427 | | 6,660 | | 1,223 | |
Class B | | 382 | | 214 | | 240 | | 235 | | 593 | | 112 | |
Class C | | 2,105 | | 290 | | 186 | | 144 | | 2,534 | | 82 | |
Class I | | 3,765 | | 2,984 | | 1,484 | | 224 | | 4,433 | | 27,503 | |
| | 7,582 | | 3,847 | | 2,518 | | 1,030 | | 14,220 | | 28,920 | |
Shares issued-reinvested from distributions: | | | | | | | | | | | | | |
Class A | | 105 | | 83 | | — | | — | | 359 | | 223 | |
Class B | | 43 | | 56 | | — | | — | | 82 | | 78 | |
Class C | | 40 | | 38 | | — | | — | | 81 | | 41 | |
Class I | | 976 | | 2,167 | | — | | — | | 6,035 | | 3,829 | |
| | 1,164 | | 2,344 | | — | | — | | 6,557 | | 4,171 | |
Shares redeemed: | | | | | | | | | | | | | |
Class A | | (654 | ) | (630 | ) | (1,404 | ) | (1,569 | ) | (3,199 | ) | (1,734 | ) |
Class B | | (370 | ) | (585 | ) | (517 | ) | (1,105 | ) | (432 | ) | (787 | ) |
Class C | | (1,414 | ) | (483 | ) | (374 | ) | (529 | ) | (1,154 | ) | (380 | ) |
Class I | | (6,606 | ) | (27,886 | ) | (2 | ) | (5,248 | ) | (20,679 | ) | (1,605 | ) |
| | (9,044 | ) | (29,584 | ) | (2,297 | ) | (8,451 | ) | (25,464 | ) | (4,506 | ) |
Automatic conversions: | | | | | | | | | | | | | |
Class A | | 271 | | 351 | | 1,029 | | 1,695 | | 271 | | 310 | |
Class B | | (271 | ) | (351 | ) | (1,105 | ) | (1,809 | ) | (271 | ) | (310 | ) |
| | — | | — | | (76 | ) | (114 | ) | — | | — | |
Net increase (decrease) in shares outstanding: | | | | | | | | | | | | | |
Class A | | 1,052 | | 163 | | 233 | | 553 | | 4,091 | | 22 | |
Class B | | (216 | ) | (666 | ) | (1,382 | ) | (2,679 | ) | (28 | ) | (907 | ) |
Class C | | 731 | | (155 | ) | (188 | ) | (385 | ) | 1,461 | | (257 | ) |
Class I | | (1,865 | ) | (22,735 | ) | 1,482 | | (5,024 | ) | (10,211 | ) | 29,727 | |
| | (298 | ) | (23,393 | ) | 145 | | (7,535 | ) | (4,687 | ) | 28,585 | |
The notes to the financial statements are an integral part of this report.
75
| | Transamerica Legg Mason
Partners All Cap | | Transamerica Money Market | | Transamerica Science &
Technology | |
| | October 31, 2009 | | October 31, 2008 | | October 31, 2009 | | October 31, 2008 | | October 31, 2009 | | October 31, 2008 | |
From operations: | | | | | | | | | | | | | |
Net investment income (loss) | | $ | 239 | | $ | 532 | | $ | 517 | | $ | 4,673 | | $ | (273 | ) | $ | (434 | ) |
Net realized gain (loss)(a) | | (5,541 | ) | (1,842 | ) | — | | — | | (12,107 | ) | (563 | ) |
Change in unrealized appreciation (depreciation)(b) | | 12,095 | | (48,557 | ) | — | | — | | 25,657 | | (48,013 | ) |
Net increase (decrease) in net assets resulting from operations | | 6,793 | | (49,867 | ) | 517 | | 4,673 | | 13,277 | | (49,010 | ) |
| | | | | | | | | | | | | |
Distributions to shareholders: | | | | | | | | | | | | | |
From net investment income: | | | | | | | | | | | | | |
Class A | | (415 | ) | — | | (307 | ) | (2,745 | ) | — | | — | |
Class B | | (96 | ) | — | | (32 | ) | (473 | ) | — | | — | |
Class C | | (84 | ) | — | | (44 | ) | (539 | ) | — | | — | |
Class I | | | | | | (134 | ) | (927 | ) | — | | — | |
| | (595 | ) | — | | (517 | ) | (4,684 | ) | — | | — | |
From net realized gains: | | | | | | | | | | | | | |
Class A | | — | | (4,246 | ) | — | | — | | — | | (282 | ) |
Class B | | — | | (7,861 | ) | — | | — | | — | | (157 | ) |
Class C | | — | | (3,130 | ) | — | | — | | — | | (96 | ) |
Class I | | | | | | — | | — | | — | | (2,576 | ) |
| | — | | (15,237 | ) | — | | — | | — | | (3,111 | ) |
Total distributions to shareholders | | (595 | ) | (15,237 | ) | (517 | ) | (4,684 | ) | — | | (3,111 | ) |
| | | | | | | | | | | | | |
Capital share transactions: | | | | | | | | | | | | | |
Proceeds from shares sold: | | | | | | | | | | | | | |
Class A | | 2,244 | | 2,542 | | 143,852 | | 156,262 | | 1,498 | | 2,918 | |
Class B | | 947 | | 1,618 | | 27,049 | | 36,830 | | 210 | | 381 | |
Class C | | 954 | | 909 | | 52,405 | | 72,304 | | 344 | | 660 | |
Class I | | | | | | 17,852 | | 25,560 | | 364 | | 4,896 | |
| | 4,145 | | 5,069 | | 241,158 | | 290,956 | | 2,416 | | 8,855 | |
Dividends and distributions reinvested: | | | | | | | | | | | | | |
Class A | | 401 | | 4,108 | | 415 | | 2,215 | | — | | 268 | |
Class B | | 87 | | 7,238 | | 50 | | 376 | | — | | 149 | |
Class C | | 75 | | 2,816 | | 62 | | 404 | | — | | 78 | |
Class I | | | | | | 159 | | 811 | | — | | 2,576 | |
| | 563 | | 14,162 | | 686 | | 3,806 | | — | | 3,071 | |
Cost of shares redeemed: | | | | | | | | | | | | | |
Class A | | (8,291 | ) | (15,837 | ) | (144,951 | ) | (115,331 | ) | (1,185 | ) | (3,212 | ) |
Class B | | (6,850 | ) | (23,998 | ) | (26,771 | ) | (16,870 | ) | (352 | ) | (821 | ) |
Class C | | (4,219 | ) | (10,843 | ) | (66,281 | ) | (32,353 | ) | (538 | ) | (625 | ) |
Class I | | | | | | (13,219 | ) | (31,716 | ) | (1,801 | ) | (1,428 | ) |
| | (19,360 | ) | (50,678 | ) | (251,222 | ) | (196,270 | ) | (3,876 | ) | (6,086 | ) |
Redemption fee: | | | | | | | | | | | | | |
| | — | | — | | — | | — | | — | | — | |
Automatic conversions: | | | | | | | | | | | | | |
Class A | | 10,525 | | 8,181 | | 4,826 | | 3,549 | | 678 | | 186 | |
Class B | | (10,525 | ) | (8,181 | ) | (4,826 | ) | (3,549 | ) | (678 | ) | (186 | ) |
| | — | | — | | — | | — | | — | | — | |
Net increase (decrease) in net assets resulting from capital shares transactions | | (14,652 | ) | (31,447 | ) | (9,378 | ) | 98,492 | | (1,460 | ) | 5,840 | |
| | | | | | | | | | | | | |
Net increase (decrease) in net assets | | (8,454 | ) | (96,551 | ) | (9,378 | ) | 98,481 | | 11,817 | | (46,281 | ) |
| | | | | | | | | | | | | |
Net assets: | | | | | | | | | | | | | |
Beginning of year | | $ | 77,223 | | $ | 173,774 | | $ | 271,884 | | $ | 173,403 | | $ | 53,511 | | $ | 99,792 | |
End of year | | $ | 68,769 | | $ | 77,223 | | $ | 262,506 | | $ | 271,884 | | $ | 65,328 | | $ | 53,511 | |
Undistributed (accumulated) net investment income (loss) | | $ | 171 | | $ | 525 | | $ | 83 | | $ | 83 | | $ | (2 | ) | $ | (2 | ) |
The notes to the financial statements are an integral part of this report.
76
| | Transamerica Legg Mason
Partners All Cap | | Transamerica Money Market | | Transamerica Science &
Technology | |
| | October 31, 2009 | | October 31, 2008 | | October 31, 2009 | | October 31, 2008 | | October 31, 2009 | | October 31, 2008 | |
Share activity: | | | | | | | | | | | | | |
Shares issued: | | | | | | | | | | | | | |
Class A | | 231 | | 183 | | 143,852 | | 156,265 | | 477 | | 616 | |
Class B | | 110 | | 128 | | 27,049 | | 36,830 | | 70 | | 92 | |
Class C | | 112 | | 73 | | 52,405 | | 72,304 | | 117 | | 154 | |
Class I | | | | | | 17,852 | | 25,560 | | 99 | | 1,201 | |
| | 453 | | 384 | | 241,158 | | 290,959 | | 763 | | 2,063 | |
Shares issued-reinvested from distributions: | | | | | | | | | | | | | |
Class A | | 44 | | 271 | | 415 | | 2,215 | | — | | 53 | |
Class B | | 10 | | 513 | | 50 | | 376 | | — | | 31 | |
Class C | | 9 | | 199 | | 62 | | 404 | | — | | 16 | |
Class I | | | | | | 159 | | 811 | | — | | 501 | |
| | 63 | | 983 | | 686 | | 3,806 | | — | | 601 | |
Shares redeemed: | | | | | | | | | | | | | |
Class A | | (883 | ) | (1,145 | ) | (144,951 | ) | (115,331 | ) | (419 | ) | (774 | ) |
Class B | | (798 | ) | (1,867 | ) | (26,771 | ) | (16,870 | ) | (134 | ) | (202 | ) |
Class C | | (488 | ) | (835 | ) | (66,281 | ) | (32,353 | ) | (198 | ) | (161 | ) |
Class I | | | | | | (13,219 | ) | (31,716 | ) | (647 | ) | (394 | ) |
| | (2,169 | ) | (3,847 | ) | (251,222 | ) | (196,270 | ) | (1,398 | ) | (1,531 | ) |
Automatic conversions: | | | | | | | | | | | | | |
Class A | | 1,100 | | 595 | | 4,826 | | 3,549 | | 229 | | 47 | |
Class B | | (1,180 | ) | (641 | ) | (4,826 | ) | (3,549 | ) | (243 | ) | (50 | ) |
| | (80 | ) | (46 | ) | — | | — | | (14 | ) | (3 | ) |
Net increase (decrease) in shares outstanding: | | | | | | | | | | | | | |
Class A | | 493 | | (96 | ) | 4,142 | | 46,698 | | 287 | | (58 | ) |
Class B | | (1,858 | ) | (1,867 | ) | (4,498 | ) | 16,787 | | (307 | ) | (129 | ) |
Class C | | (368 | ) | (563 | ) | (13,814 | ) | 40,355 | | (81 | ) | 9 | |
Class I | | | | | | 4,792 | | (5,345 | ) | (548 | ) | 1,308 | |
| | (1,733 | ) | (2,526 | ) | (9,378 | ) | 98,495 | | (649 | ) | 1,130 | |
The notes to the financial statements are an integral part of this report.
77
| | Transamerica Short-Term Bond | | Transamerica Small/Mid Cap Value | | Transamerica Templeton Global | |
| | October 31, 2009 | | October 31, 2008 | | October 31, 2009 | | October 31, 2008 | | October 31, 2009 | | October 31, 2008 | |
From operations: | | | | | | | | | | | | | |
Net investment income (loss) | | $ | 37,983 | | $ | 24,879 | | $ | (582 | ) | $ | 9,308 | | $ | 809 | | $ | 1,486 | |
Net realized gain (loss)(a) | | 526 | | (10,141 | ) | (101,349 | ) | (98,519 | ) | (16,956 | ) | 11,223 | |
Change in unrealized appreciation (depreciation)(b) | | 65,391 | | (19,826 | ) | 110,124 | | (296,332 | ) | 31,917 | | (105,619 | ) |
Net increase (decrease) in net assets resulting from operations | | 103,900 | | (5,088 | ) | 8,193 | | (385,543 | ) | 15,770 | | (92,910 | ) |
| | | | | | | | | | | | | |
Distributions to shareholders: | | | | | | | | | | | | | |
From net investment income: | | | | | | | | | | | | | |
Class A | | (4,009 | ) | (73 | ) | (4,092 | ) | (815 | ) | (662 | ) | (1,124 | ) |
Class B | | | | | | (531 | ) | — | | — | | (99 | ) |
Class C | | (3,980 | ) | (74 | ) | (1,959 | ) | (207 | ) | — | | (199 | ) |
Class I | | (31,013 | ) | (24,970 | ) | (1,434 | ) | (4,881 | ) | — | | (700 | ) |
| | (39,002 | ) | (25,117 | ) | (8,016 | ) | (5,903 | ) | (662 | ) | (2,122 | ) |
From net realized gains: | | | | | | | | | | | | | |
Class A | | — | | — | | — | | (12,319 | ) | — | | — | |
Class B | | | | | | — | | (5,719 | ) | — | | — | |
Class C | | — | | — | | — | | (7,564 | ) | — | | — | |
Class I | | — | | — | | — | | (50,781 | ) | | | — | |
| | — | | — | | — | | (76,383 | ) | — | | — | |
Total distributions to shareholders | | (39,002 | ) | (25,117 | ) | (8,016 | ) | (82,286 | ) | (662 | ) | (2,122 | ) |
| | | | | | | | | | | | | |
Capital share transactions: | | | | | | | | | | | | | |
Proceeds from shares sold: | | | | | | | | | | | | | |
Class A | | 307,854 | | 6,797 | | 90,888 | | 376,986 | | 2,261 | | 4,616 | |
Class B | | | | | | 7,452 | | 18,229 | | 750 | | 1,618 | |
Class C | | 316,772 | | 8,910 | | 34,707 | | 111,684 | | 591 | | 900 | |
Class I | | 225,676 | | 34,605 | | 25,014 | | 40,971 | | — | | — | |
| | 850,302 | | 50,312 | | 158,061 | | 547,870 | | 3,602 | | 7,134 | |
Dividends and distributions reinvested: | | | | | | | | | | | | | |
Class A | | 2,350 | | 27 | | 3,256 | | 10,992 | | 644 | | 1,085 | |
Class B | | | | | | 458 | | 5,175 | | — | | 94 | |
Class C | | 2,129 | | 29 | | 1,538 | | 6,054 | | — | | 189 | |
Class I | | 29,359 | | 19,101 | | 1,434 | | 55,662 | | | | 700 | |
| | 33,838 | | 19,157 | | 6,686 | | 77,883 | | 644 | | 2,068 | |
Cost of shares redeemed: | | | | | | | | | | | | | |
Class A | | (32,632 | ) | (923 | ) | (107,219 | ) | (137,493 | ) | (12,531 | ) | (21,738 | ) |
Class B | | | | | | (6,668 | ) | (10,337 | ) | (1,794 | ) | (8,972 | ) |
Class C | | (16,819 | ) | (1,386 | ) | (27,816 | ) | (21,818 | ) | (2,744 | ) | (5,417 | ) |
Class I | | (87,178 | ) | (95,587 | ) | (201,385 | ) | (148,685 | ) | | | (38,070 | ) |
| | (136,629 | ) | (97,896 | ) | (343,088 | ) | (318,333 | ) | (17,069 | ) | (74,197 | ) |
Redemption fee: | | | | | | | | | | | | | |
Class A | | 1 | | 2 | | 6 | | 2 | | — | | — | |
| | 1 | | 2 | | 6 | | 2 | | — | | — | |
Automatic conversions: | | | | | | | | | | | | | |
Class A | | | | | | 2,712 | | 7,300 | | 2,563 | | 30,467 | |
Class B | | | | | | (2,712 | ) | (7,300 | ) | (2,563 | ) | (30,467 | ) |
| | | | | | — | | — | | — | | — | |
Net increase (decrease) in net assets resulting from capital shares transactions | | 747,512 | | (28,425 | ) | (178,335 | ) | 307,422 | | (12,823 | ) | (64,995 | ) |
| | | | | | | | | | | | | |
Net increase (decrease) in net assets | | 812,410 | | (58,630 | ) | (178,158 | ) | (160,407 | ) | 2,285 | | (160,027 | ) |
| | | | | | | | | | | | | |
Net assets: | | | | | | | | | | | | | |
Beginning of year | | $ | 505,259 | | $ | 563,889 | | $ | 541,006 | | $ | 701,413 | | $ | 98,753 | | $ | 258,780 | |
End of year | | $ | 1,317,669 | | $ | 505,259 | | $ | 362,848 | | $ | 541,006 | | $ | 101,038 | | $ | 98,753 | |
Undistributed (accumulated) net investment income (loss) | | $ | 314 | | $ | 1,333 | | $ | (1 | ) | $ | 7,851 | | $ | 574 | | $ | 421 | |
The notes to the financial statements are an integral part of this report.
78
| | Transamerica Short-Term Bond | | Transamerica Small/Mid Cap Value | | Transamerica Templeton Global | |
| | October 31, 2009 | | October 31, 2008 | | October 31, 2009 | | October 31, 2008 | | October 31, 2009 | | October 31, 2008 | |
Share activity: | | | | | | | | | | | | | |
Shares issued: | | | | | | | | | | | | | |
Class A | | 30,676 | | 689 | | 6,850 | | 20,500 | | 110 | | 148 | |
Class B | | | | | | 585 | | 1,013 | | 41 | | 61 | |
Class C | | 31,668 | | 908 | | 2,683 | | 6,200 | | 32 | | 32 | |
Class I | | 23,703 | | 2,942 | | 2,158 | | 3,081 | | | | — | |
| | 86,047 | | 4,539 | | 12,276 | | 30,794 | | 183 | | 241 | |
Shares issued-reinvested from distributions: | | | | | | | | | | | | | |
Class A | | 233 | | 6 | | 287 | | 553 | | 34 | | 35 | |
Class B | | | | | | 42 | | 270 | | — | | 3 | |
Class C | | 212 | | 6 | | 142 | | 318 | | — | | 6 | |
Class I | | 3,042 | | 2,571 | | 126 | | 2,787 | | | | 20 | |
| | 3,487 | | 2,583 | | 597 | | 3,928 | | 34 | | 64 | |
Shares redeemed: | | | | | | | | | | | | | |
Class A | | (3,251 | ) | (95 | ) | (9,340 | ) | (9,819 | ) | (650 | ) | (749 | ) |
Class B | | | | | | (572 | ) | (609 | ) | (101 | ) | (315 | ) |
Class C | | (1,683 | ) | (143 | ) | (2,456 | ) | (1,406 | ) | (154 | ) | (198 | ) |
Class I | | (9,311 | ) | (9,914 | ) | (18,296 | ) | (9,530 | ) | | | (1,260 | ) |
| | (14,245 | ) | (10,152 | ) | (30,664 | ) | (21,364 | ) | (905 | ) | (2,522 | ) |
Automatic conversions: | | | | | | | | | | | | | |
Class A | | | | | | 207 | | 385 | | 132 | | 1,006 | |
Class B | | | | | | (215 | ) | (400 | ) | (140 | ) | (1,071 | ) |
| | | | | | (8 | ) | (15 | ) | (8 | ) | (65 | ) |
Net increase (decrease) in shares outstanding: | | | | | | | | | | | | | |
Class A | | 27,658 | | 600 | | (1,996 | ) | 11,619 | | (374 | ) | 440 | |
Class B | | | | | | (161 | ) | 274 | | (200 | ) | (1,322 | ) |
Class C | | 30,196 | | 771 | | 369 | | 5,112 | | (122 | ) | (160 | ) |
Class I | | 17,434 | | (4,401 | ) | (16,011 | ) | (3,662 | ) | | | (1,240 | ) |
| | 75,289 | | (3,030 | ) | (17,799 | ) | 13,343 | | (696 | ) | (2,282 | ) |
The notes to the financial statements are an integral part of this report.
79
| | Transamerica Value Balanced | |
| | October 31, 2009 | | October 31, 2008 | |
From operations: | | | | | |
Net investment income | | $ | 603 | | $ | 1,068 | |
Net realized gain (loss)(a) | | (2,247 | ) | (3,730 | ) |
Change in unrealized appreciation (depreciation)(b) | | 4,301 | | (14,696 | ) |
Net increase (decrease) in net assets resulting from operations | | 2,657 | | (17,358 | ) |
| | | | | |
Distributions to shareholders: | | | | | |
From net investment income: | | | | | |
Class A | | (431 | ) | (692 | ) |
Class B | | (85 | ) | (196 | ) |
Class C | | (95 | ) | (172 | ) |
| | (611 | ) | (1,060 | ) |
From net realized gains: | | | | | |
Class A | | — | | (1,609 | ) |
Class B | | — | | (830 | ) |
Class C | | — | | (566 | ) |
| | — | | (3,005 | ) |
Total distributions to shareholders | | (611 | ) | (4,065 | ) |
| | | | | |
Capital share transactions: | | | | | |
Proceeds from shares sold: | | | | | |
Class A | | 1,178 | | 1,496 | |
Class B | | 318 | | 511 | |
Class C | | 569 | | 374 | |
| | 2,065 | | 2,381 | |
Dividends and distributions reinvested: | | | | | |
Class A | | 406 | | 2,069 | |
Class B | | 79 | | 909 | |
Class C | | 89 | | 669 | |
| | 574 | | 3,647 | |
Cost of shares redeemed: | | | | | |
Class A | | (5,082 | ) | (8,353 | ) |
Class B | | (1,531 | ) | (4,161 | ) |
Class C | | (1,640 | ) | (2,846 | ) |
| | (8,253 | ) | (15,360 | ) |
Redemption fee: | | | | | |
Class B | | — | | 1 | |
| | — | | 1 | |
Automatic conversions: | | | | | |
Class A | | 1,707 | | 3,193 | |
Class B | | (1,707 | ) | (3,193 | ) |
| | — | | — | |
Net decrease in net assets resulting from capital shares transactions | | (5,614 | ) | (9,331 | ) |
| | | | | |
Net decrease in net assets | | (3,568 | ) | (30,754 | ) |
| | | | | |
Net assets: | | | | | |
Beginning of year | | $ | 30,913 | | $ | 61,667 | |
End of year | | $ | 27,345 | | $ | 30,913 | |
Undistributed net investment income (loss) | | $ | 325 | | $ | 349 | |
The notes to the financial statements are an integral part of this report.
80
| | Transamerica Value Balanced | |
| | October 31, 2009 | | October 31, 2008 | |
Share activity: | | | | | |
Shares issued: | | | | | |
Class A | | 135 | | 112 | |
Class B | | 37 | | 39 | |
Class C | | 67 | | 29 | |
| | 239 | | 180 | |
Shares issued-reinvested from distributions: | | | | | |
Class A | | 48 | | 176 | |
Class B | | 10 | | 74 | |
Class C | | 10 | | 56 | |
| | 68 | | 306 | |
Shares redeemed: | | | | | |
Class A | | (594 | ) | (713 | ) |
Class B | | (180 | ) | (351 | ) |
Class C | | (193 | ) | (243 | ) |
| | (967 | ) | (1,307 | ) |
Automatic conversions: | | | | | |
Class A | | 195 | | 261 | |
Class B | | (196 | ) | (262 | ) |
| | (1 | ) | (1 | ) |
Net increase (decrease) in shares outstanding: | | | | | |
Class A | | (216 | ) | (164 | ) |
Class B | | (329 | ) | (500 | ) |
Class C | | (116 | ) | (158 | ) |
| | (661 | ) | (822 | ) |
(a) | Net realized gain (loss) includes investment securities, futures contracts, written options and swaptions, securities sold short, swaps, and foreign currency transactions. |
(b) | Change in unrealized appreciation (depreciation) includes investment securities, futures contracts, written options and swaptions, securities sold short, swaps, and foreign currency translation. |
The notes to the financial statements are an integral part of this report.
81
FINANCIAL HIGHLIGHTS
For the periods and years ended:
For a share outstanding throughout each period
| | Transamerica Balanced | |
| | Class A | |
| | October 31,
2009 | | October 31,
2008 | | October 31,
2007 | | October 31,
2006 | | October 31,
2005 | |
Net asset value | | | | | | | | | | | |
Beginning of year | | $ | 16.44 | | $ | 25.70 | | $ | 22.05 | | $ | 19.90 | | $ | 18.53 | |
| | | | | | | | | | | |
Investment operations | | | | | | | | | | | |
Net investment income(a) | | 0.28 | | 0.28 | | 0.17 | | 0.12 | | 0.15 | |
Net realized and unrealized gain (loss) on investments | | 2.47 | | (8.64 | ) | 3.62 | | 2.12 | | 1.41 | |
Total from investment operations | | 2.75 | | (8.36 | ) | 3.79 | | 2.24 | | 1.56 | |
| | | | | | | | | | | |
Distributions | | | | | | | | | | | |
Net investment income | | (0.31 | ) | (0.24 | ) | (0.14 | ) | (0.09 | ) | (0.19 | ) |
Net realized gains on investments | | (1.03 | ) | (0.66 | ) | — | | — | | — | |
Total distributions | | (1.34 | ) | (0.90 | ) | (0.14 | ) | (0.09 | ) | (0.19 | ) |
| | | | | | | | | | | |
Net asset value | | | | | | | | | | | |
End of year | | $ | 17.85 | | $ | 16.44 | | $ | 25.70 | | $ | 22.05 | | $ | 19.90 | |
| | | | | | | | | | | |
Total return(b) | | 18.43 | % | (33.55 | )% | 17.28 | % | 11.27 | % | 8.41 | % |
| | | | | | | | | | | |
Net assets end of year | | $ | 60,279 | | $ | 49,917 | | $ | 61,565 | | $ | 55,547 | | $ | 62,440 | |
| | | | | | | | | | | |
Ratios and supplemental data | | | | | | | | | | | |
Expenses to average net assets | | | | | | | | | | | |
After reimbursement/fee waiver | | 1.73 | %(m) | 1.52 | % | 1.56 | % | 1.58 | % | 1.59 | % |
Before reimbursement/fee waiver | | 1.73 | %(m) | 1.52 | % | 1.56 | % | 1.58 | % | 1.59 | % |
Net investment income, to average net assets(c) | | 1.72 | % | 1.27 | % | 0.73 | % | 0.57 | % | 0.75 | % |
Portfolio turnover rate | | 100 | % | 52 | % | 52 | % | 51 | % | 27 | % |
For a share outstanding throughout each period
| | Transamerica Balanced | |
| | Class B | |
| | October 31,
2009 | | October 31,
2008 | | October 31,
2007 | | October 31,
2006 | | October 31,
2005 | |
Net asset value | | | | | | | | | | | |
Beginning of year | | $ | 16.37 | | $ | 25.58 | | $ | 21.98 | | $ | 19.88 | | $ | 18.47 | |
| | | | | | | | | | | |
Investment operations | | | | | | | | | | | |
Net investment income(a) | | 0.16 | | 0.13 | | 0.04 | | — | (d) | 0.04 | |
Net realized and unrealized gain (loss) on investments | | 2.45 | | (8.58 | ) | 3.60 | | 2.12 | | 1.40 | |
Total from investment operations | | 2.61 | | (8.45 | ) | 3.64 | | 2.12 | | 1.44 | |
| | | | | | | | | | | |
Distributions | | | | | | | | | | | |
Net investment income | | (0.17 | ) | (0.10 | ) | (0.04 | ) | (0.02 | ) | (0.03 | ) |
Net realized gains on investments | | (1.03 | ) | (0.66 | ) | — | | — | | — | |
Total distributions | | (1.20 | ) | (0.76 | ) | (0.04 | ) | (0.02 | ) | (0.03 | ) |
| | | | | | | | | | | |
Net asset value | | | | | | | | | | | |
End of year | | $ | 17.79 | | $ | 16.37 | | $ | 25.58 | | $ | 21.98 | | $ | 19.88 | |
| | | | | | | | | | | |
Total return(b) | | 17.50 | % | (33.95 | )% | 16.57 | % | 10.65 | % | 7.80 | % |
| | | | | | | | | | | |
Net assets end of year | | $ | 17,787 | | $ | 32,469 | | $ | 96,573 | | $ | 118,286 | | $ | 142,479 | |
| | | | | | | | | | | |
Ratios and supplemental data | | | | | | | | | | | |
Expenses to average net assets | | | | | | | | | | | |
After reimbursement/fee waiver | | 2.46 | %(m) | 2.15 | % | 2.14 | % | 2.15 | % | 2.14 | % |
Before reimbursement/fee waiver | | 2.46 | %(m) | 2.15 | % | 2.14 | % | 2.15 | % | 2.14 | % |
Net investment income, to average net assets(c) | | 1.02 | % | 0.59 | % | 0.15 | % | 0.01 | % | 0.20 | % |
Portfolio turnover rate | | 100 | % | 52 | % | 52 | % | 51 | % | 27 | % |
The notes to the financial statements are an integral part of this report.
82
For a share outstanding throughout each period
| | Transamerica Balanced | |
| | Class C | |
| | October 31,
2009 | | October 31,
2008 | | October 31,
2007 | | October 31,
2006 | | October 31,
2005 | |
Net asset value | | | | | | | | | | | |
Beginning of year | | $ | 16.30 | | $ | 25.50 | | $ | 21.91 | | $ | 19.82 | | $ | 18.45 | |
| | | | | | | | | | | |
Investment operations | | | | | | | | | | | |
Net investment income(a) | | 0.18 | | 0.15 | | 0.04 | | 0.01 | | 0.04 | |
Net realized and unrealized gain (loss) on investments | | 2.46 | | (8.56 | ) | 3.59 | | 2.10 | | 1.41 | |
Total from investment operations | | 2.64 | | (8.41 | ) | 3.63 | | 2.11 | | 1.45 | |
| | | | | | | | | | | |
Distributions | | | | | | | | | | | |
Net investment income | | (0.22 | ) | (0.13 | ) | (0.04 | ) | (0.02 | ) | (0.08 | ) |
Net realized gains on investments | | (1.03 | ) | (0.66 | ) | — | | — | | — | |
Total distributions | | (1.25 | ) | (0.79 | ) | (0.04 | ) | (0.02 | ) | (0.08 | ) |
| | | | | | | | | | | |
Net asset value | | | | | | | | | | | |
End of year | | $ | 17.69 | | $ | 16.30 | | $ | 25.50 | | $ | 21.91 | | $ | 19.82 | |
| | | | | | | | | | | |
Total return(b) | | 17.80 | % | (33.92 | )% | 16.61 | % | 10.64 | % | 7.85 | % |
| | | | | | | | | | | |
Net assets end of year | | $ | 16,933 | | $ | 17,719 | | $ | 32,569 | | $ | 36,750 | | $ | 43,276 | |
| | | | | | | | | | | |
Ratios and supplemental data | | | | | | | | | | | |
Expenses to average net assets | | | | | | | | | | | |
After reimbursement/fee waiver | | 2.27 | %(m) | 2.08 | % | 2.11 | % | 2.12 | % | 2.13 | % |
Before reimbursement/fee waiver | | 2.27 | %(m) | 2.08 | % | 2.11 | % | 2.12 | % | 2.13 | % |
Net investment income, to average net assets(c) | | 1.15 | % | 0.69 | % | 0.18 | % | 0.03 | % | 0.21 | % |
Portfolio turnover rate | | 100 | % | 52 | % | 52 | % | 51 | % | 27 | % |
For a share outstanding throughout each period
| | Transamerica Convertible Securities | |
| | Class A | |
| | October 31,
2009 | | October 31,
2008 | | October 31,
2007 | | October 31,
2006 | | October 31,
2005 | |
Net asset value | | | | | | | | | | | |
Beginning of year | | $ | 7.18 | | $ | 15.30 | | $ | 12.76 | | $ | 11.56 | | $ | 11.00 | |
| | | | | | | | | | | |
Investment operations | | | | | | | | | | | |
Net investment income(a) | | 0.17 | | 0.13 | | 0.10 | | 0.07 | | 0.20 | |
Net realized and unrealized gain (loss) on investments | | 1.26 | | (4.92 | ) | 3.22 | | 1.33 | | 0.81 | |
Total from investment operations | | 1.43 | | (4.79 | ) | 3.32 | | 1.40 | | 1.01 | |
| | | | | | | | | | | |
Distributions | | | | | | | | | | | |
Net investment income | | (0.20 | ) | (0.10 | ) | (0.11 | ) | (0.07 | ) | (0.20 | ) |
Net realized gains on investments | | — | | (3.23 | ) | (0.67 | ) | (0.13 | ) | (0.25 | ) |
Total distributions | | (0.20 | ) | (3.33 | ) | (0.78 | ) | (0.20 | ) | (0.45 | ) |
| | | | | | | | | | | |
Net asset value | | | | | | | | | | | |
End of year | | $ | 8.41 | | $ | 7.18 | | $ | 15.30 | | $ | 12.76 | | $ | 11.56 | |
| | | | | | | | | | | |
Total return(b) | | 20.42 | % | (38.92 | )% | 27.41 | % | 12.15 | % | 9.24 | % |
| | | | | | | | | | | |
Net assets end of year | | $ | 13,012 | | $ | 10,748 | | $ | 11,276 | | $ | 6,350 | | $ | 209,374 | |
| | | | | | | | | | | |
Ratios and supplemental data | | | | | | | | | | | |
Expenses to average net assets | | | | | | | | | | | |
After reimbursement/fee waiver | | 1.50 | %(n) | 1.33 | % | 1.33 | % | 1.25 | % | 1.17 | % |
Before reimbursement/fee waiver | | 1.50 | %(n) | 1.33 | % | 1.33 | % | 1.25 | % | 1.17 | % |
Net investment income, to average net assets(c) | | 2.22 | % | 1.23 | % | 0.75 | % | 0.59 | % | 1.74 | % |
Portfolio turnover rate | | 181 | % | 91 | % | 92 | % | 69 | % | 87 | % |
The notes to the financial statements are an integral part of this report.
83
For a share outstanding throughout each period
| | Transamerica Convertible Securities | |
| | Class B | |
| | October 31,
2009 | | October 31,
2008 | | October 31,
2007 | | October 31,
2006 | | October 31,
2005 | |
Net asset value | | | | | | | | | | | |
Beginning of year | | $ | 7.13 | | $ | 15.22 | | $ | 12.71 | | $ | 11.54 | | $ | 11.00 | |
| | | | | | | | | | | |
Investment operations | | | | | | | | | | | |
Net investment income(a) | | 0.11 | | 0.04 | | 0.01 | | — | (d) | 0.09 | |
Net realized and unrealized gain (loss) on investments | | 1.25 | | (4.87 | ) | 3.21 | | 1.32 | | 0.80 | |
Total from investment operations | | 1.36 | | (4.83 | ) | 3.22 | | 1.32 | | 0.89 | |
| | | | | | | | | | | |
Distributions | | | | | | | | | | | |
Net investment income | | (0.15 | ) | (0.03 | ) | (0.04 | ) | (0.02 | ) | (0.10 | ) |
Net realized gains on investments | | — | | (3.23 | ) | (0.67 | ) | (0.13 | ) | (0.25 | ) |
Total distributions | | (0.15 | ) | (3.26 | ) | (0.71 | ) | (0.15 | ) | (0.35 | ) |
| | | | | | | | | | | |
Net asset value | | | | | | | | | | | |
End of year | | $ | 8.35 | | $ | 7.13 | | $ | 15.22 | | $ | 12.71 | | $ | 11.54 | |
| | | | | | | | | | | |
Total return(b) | | 19.45 | % | (39.32 | )% | 26.54 | % | 11.47 | % | 8.09 | % |
| | | | | | | | | | | |
Net assets end of year | | $ | 2,370 | | $ | 2,920 | | $ | 6,533 | | $ | 6,651 | | $ | 6,656 | |
| | | | | | | | | | | |
Ratios and supplemental data | | | | | | | | | | | |
Expenses to average net assets | | | | | | | | | | | |
After reimbursement/fee waiver | | 2.24 | %(n) | 2.02 | % | 1.99 | % | 1.99 | % | 2.15 | % |
Before reimbursement/fee waiver | | 2.24 | %(n) | 2.02 | % | 1.99 | % | 1.99 | % | 2.15 | % |
Net investment income, to average net assets(c) | | 1.48 | % | 0.40 | % | 0.10 | % | — | %(e) | 0.76 | % |
Portfolio turnover rate | | 181 | % | 91 | % | 92 | % | 69 | % | 87 | % |
For a share outstanding throughout each period
| | Transamerica Convertible Securities | |
| | Class C | |
| | October 31,
2009 | | October 31,
2008 | | October 31,
2007 | | October 31,
2006 | | October 31,
2005 | |
Net asset value | | | | | | | | | | | |
Beginning of year | | $ | 7.10 | | $ | 15.17 | | $ | 12.66 | | $ | 11.50 | | $ | 10.97 | |
| | | | | | | | | | | |
Investment operations | | | | | | | | | | | |
Net investment income(a) | | 0.13 | | 0.07 | | 0.02 | | — | (d) | 0.08 | |
Net realized and unrealized gain (loss) on investments | | 1.23 | | (4.87 | ) | 3.20 | | 1.31 | | 0.82 | |
Total from investment operations | | 1.36 | | (4.80 | ) | 3.22 | | 1.31 | | 0.90 | |
| | | | | | | | | | | |
Distributions | | | | | | | | | | | |
Net investment income | | (0.16 | ) | (0.04 | ) | (0.04 | ) | (0.02 | ) | (0.12 | ) |
Net realized gains on investments | | — | | (3.23 | ) | (0.67 | ) | (0.13 | ) | (0.25 | ) |
Total distributions | | (0.16 | ) | (3.27 | ) | (0.71 | ) | (0.15 | ) | (0.37 | ) |
| | | | | | | | | | | |
Net asset value | | | | | | | | | | | |
End of year | | $ | 8.30 | | $ | 7.10 | | $ | 15.17 | | $ | 12.66 | | $ | 11.50 | |
| | | | | | | | | | | |
Total return(b) | | 19.57 | % | (39.24 | )% | 26.69 | % | 11.44 | % | 8.17 | % |
| | | | | | | | | | | |
Net assets end of year | | $ | 5,780 | | $ | 7,070 | | $ | 3,598 | | $ | 3,551 | | $ | 4,465 | |
| | | | | | | | | | | |
Ratios and supplemental data | | | | | | | | | | | |
Expenses to average net assets | | | | | | | | | | | |
After reimbursement/fee waiver | | 2.08 | %(n) | 1.94 | % | 1.94 | % | 1.94 | % | 2.16 | % |
Before reimbursement/fee waiver | | 2.08 | %(n) | 1.94 | % | 1.94 | % | 1.94 | % | 2.16 | % |
Net investment income, to average net assets(c) | | 1.70 | % | 0.72 | % | 0.15 | % | 0.02 | % | 0.73 | % |
Portfolio turnover rate | | 181 | % | 91 | % | 92 | % | 69 | % | 87 | % |
The notes to the financial statements are an integral part of this report.
84
For a share outstanding throughout each period
| | Transamerica Convertible Securities | | | |
| | Class I | | | |
| | October 31,
2009 | | October 31,
2008 | | October 31,
2007 | | October 31,
2006(f) | | | |
Net asset value | | | | | | | | | | | |
Beginning of year | | $ | 7.19 | | $ | 15.31 | | $ | 12.76 | | $ | 11.71 | | | |
| | | | | | | | | | | |
Investment operations | | | | | | | | | | | |
Net investment income(a) | | 0.21 | | 0.18 | | 0.16 | | 0.14 | | | |
Net realized and unrealized gain (loss) on investments | | 1.26 | | (4.92 | ) | 3.23 | | 1.17 | | | |
Total from investment operations | | 1.47 | | (4.74 | ) | 3.39 | | 1.31 | | | |
| | | | | | | | | | | |
Distributions | | | | | | | | | | | |
Net investment income | | (0.24 | ) | (0.15 | ) | (0.17 | ) | (0.13 | ) | | |
Net realized gains on investments | | — | | (3.23 | ) | (0.67 | ) | (0.13 | ) | | |
Total distributions | | (0.24 | ) | (3.38 | ) | (0.84 | ) | (0.26 | ) | | |
| | | | | | | | | | | |
Net asset value | | | | | | | | | | | |
End of year | | $ | 8.42 | | $ | 7.19 | | $ | 15.31 | | $ | 12.76 | | | |
| | | | | | | | | | | |
Total return(b) | | 21.09 | % | (38.58 | )% | 28.10 | % | 11.26 | %(g) | | |
| | | | | | | | | | | |
Net assets end of year | | $ | 51,186 | | $ | 91,679 | | $ | 148,562 | | $ | 256,474 | | | |
| | | | | | | | | | | |
Ratios and supplemental data | | | | | | | | | | | |
Expenses to average net assets | | | | | | | | | | | |
After reimbursement/fee waiver | | 0.93 | %(n) | 0.84 | % | 0.82 | % | 0.82 | %(h) | | |
Before reimbursement/fee waiver | | 0.93 | %(n) | 0.84 | % | 0.82 | % | 0.82 | %(h) | | |
Net investment income, to average net assets(c) | | 2.86 | % | 1.65 | % | 1.24 | % | 1.20 | %(h) | | |
Portfolio turnover rate | | 181 | % | 91 | % | 92 | % | 69 | %(g) | | |
For a share outstanding throughout each period
| | Transamerica Equity | |
| | Class A | |
| | October 31,
2009 | | October 31,
2008 | | October 31,
2007 | | October 31,
2006 | | October 31,
2005 | |
Net asset value | | | | | | | | | | | |
Beginning of year | | $ | 6.85 | | $ | 12.07 | | $ | 9.83 | | $ | 8.87 | | $ | 7.44 | |
| | | | | | | | | | | |
Investment operations | | | | | | | | | | | |
Net investment loss(a) | | — | (d) | (0.01 | ) | (0.05 | ) | (0.07 | ) | (0.02 | ) |
Net realized and unrealized gain (loss) on investments | | 0.69 | | (5.21 | ) | 2.29 | | 1.11 | | 1.58 | |
Total from investment operations | | 0.69 | | (5.22 | ) | 2.24 | | 1.04 | | 1.56 | |
| | | | | | | | | | | |
Distributions | | | | | | | | | | | |
Net realized gains on investments | | — | | — | | — | | (0.08 | ) | (0.13 | ) |
Total distributions | | — | | — | | — | | (0.08 | ) | (0.13 | ) |
| | | | | | | | | | | |
Net asset value | | | | | | | | | | | |
End of year | | $ | 7.54 | | $ | 6.85 | | $ | 12.07 | | $ | 9.83 | | $ | 8.87 | |
| | | | | | | | | | | |
Total return(b) | | 10.07 | % | (43.25 | )% | 22.79 | % | 11.71 | % | 21.16 | % |
| | | | | | | | | | | |
Net assets end of year | | $ | 292,838 | | $ | 300,140 | | $ | 532,251 | | $ | 500,483 | | $ | 301,635 | |
| | | | | | | | | | | |
Ratios and supplemental data | | | | | | | | | | | |
Expenses to average net assets | | | | | | | | | | | |
After reimbursement/fee waiver | | 1.52 | %(l) | 1.39 | % | 1.40 | % | 1.51 | % | 1.36 | % |
Before reimbursement/fee waiver | | 1.67 | %(l) | 1.39 | % | 1.40 | % | 1.51 | % | 1.36 | % |
Net investment income (loss), to average net assets(c) | | 0.06 | % | (0.07 | )% | (0.48 | )% | (0.70 | )% | (0.27 | )% |
Portfolio turnover rate | | 53 | % | 33 | % | 62 | % | 19 | % | 39 | % |
The notes to the financial statements are an integral part of this report.
85
For a share outstanding throughout each period
| | Transamerica Equity | |
| | Class B | |
| | October 31,
2009 | | October 31,
2008 | | October 31,
2007 | | October 31,
2006 | | October 31,
2005 | |
Net asset value | | | | | | | | | | | |
Beginning of year | | $ | 6.42 | | $ | 11.39 | | $ | 9.35 | | $ | 8.49 | | $ | 7.19 | |
| | | | | | | | | | | |
Investment operations | | | | | | | | | | | |
Net investment loss(a) | | (0.03 | ) | (0.08 | ) | (0.12 | ) | (0.12 | ) | (0.08 | ) |
Net realized and unrealized gain (loss) on investments | | 0.62 | | (4.89 | ) | 2.16 | | 1.06 | | 1.51 | |
Total from investment operations | | 0.59 | | (4.97 | ) | 2.04 | | 0.94 | | 1.43 | |
| | | | | | | | | | | |
Distributions | | | | | | | | | | | |
Net realized gains on investments | | — | | — | | — | | (0.08 | ) | (0.13 | ) |
Total distributions | | — | | — | | — | | (0.08 | ) | (0.13 | ) |
| | | | | | | | | | | |
Net asset value | | | | | | | | | | | |
End of year | | $ | 7.01 | | $ | 6.42 | | $ | 11.39 | | $ | 9.35 | | $ | 8.49 | |
| | | | | | | | | | | |
Total return(b) | | 9.19 | % | (43.63 | )% | 21.82 | % | 11.06 | % | 20.03 | % |
| | | | | | | | | | | |
Net assets end of year | | $ | 39,699 | | $ | 59,479 | | $ | 191,007 | | $ | 222,144 | | $ | 49,865 | |
| | | | | | | | | | | |
Ratios and supplemental data | | | | | | | | | | | |
Expenses to average net assets | | | | | | | | | | | |
After reimbursement/fee waiver | | 2.17 | %(l) | 2.17 | % | 2.17 | % | 2.17 | % | 2.18 | % |
Before reimbursement/fee waiver | | 2.50 | %(l) | 2.21 | % | 2.21 | % | 2.34 | % | 2.61 | % |
Net investment loss, to average net assets(c) | | (0.53 | )% | (0.87 | )% | (1.25 | )% | (1.34 | )% | (0.99 | )% |
Portfolio turnover rate | | 53 | % | 33 | % | 62 | % | 19 | % | 39 | % |
For a share outstanding throughout each period
| | Transamerica Equity | |
| | Class C | |
| | October 31,
2009 | | October 31,
2008 | | October 31,
2007 | | October 31,
2006 | | October 31,
2005 | |
Net asset value | | | | | | | | | | | |
Beginning of year | | $ | 6.44 | | $ | 11.42 | | $ | 9.37 | | $ | 8.50 | | $ | 7.20 | |
| | | | | | | | | | | |
Investment operations | | | | | | | | | | | |
Net investment loss(a) | | (0.03 | ) | (0.07 | ) | (0.11 | ) | (0.12 | ) | (0.08 | ) |
Net realized and unrealized gain (loss) on investments | | 0.63 | | (4.91 | ) | 2.16 | | 1.07 | | 1.51 | |
Total from investment operations | | 0.60 | | (4.98 | ) | 2.05 | | 0.95 | | 1.43 | |
| | | | | | | | | | | |
Distributions | | | | | | | | | | | |
Net realized gains on investments | | — | | — | | — | | (0.08 | ) | (0.13 | ) |
Total distributions | | — | | — | | — | | (0.08 | ) | (0.13 | ) |
| | | | | | | | | | | |
Net asset value | | | | | | | | | | | |
End of year | | $ | 7.04 | | $ | 6.44 | | $ | 11.42 | | $ | 9.37 | | $ | 8.50 | |
| | | | | | | | | | | |
Total return(b) | | 9.32 | % | (43.61 | )% | 21.88 | % | 11.16 | % | 20.05 | % |
| | | | | | | | | | | |
Net assets end of year | | $ | 37,225 | | $ | 46,676 | | $ | 101,226 | | $ | 97,047 | | $ | 23,656 | |
| | | | | | | | | | | |
Ratios and supplemental data | | | | | | | | | | | |
Expenses to average net assets | | | | | | | | | | | |
After reimbursement/fee waiver | | 2.17 | %(l) | 2.04 | % | 2.07 | % | 2.10 | % | 2.18 | % |
Before reimbursement/fee waiver | | 2.32 | %(l) | 2.04 | % | 2.07 | % | 2.10 | % | 2.31 | % |
Net investment loss, to average net assets(c) | | (0.56 | )% | (0.72 | )% | (1.15 | )% | (1.27 | )% | (1.00 | )% |
Portfolio turnover rate | | 53 | % | 33 | % | 62 | % | 19 | % | 39 | % |
The notes to the financial statements are an integral part of this report.
86
For a share outstanding throughout each period
| | Transamerica Equity | |
| | Class I | |
| | October 31,
2009 | | October 31,
2008 | | October 31,
2007 | | October 31,
2006(f) | |
Net asset value | | | | | | | | | |
Beginning of year | | $ | 6.99 | | $ | 12.23 | | $ | 9.90 | | $ | 9.17 | |
| | | | | | | | | |
Investment operations | | | | | | | | | |
Net investment income(a) | | 0.05 | | 0.06 | | 0.01 | | — | (d) |
Net realized and unrealized gain (loss) on investments | | 0.69 | | (5.30 | ) | 2.32 | | 0.81 | |
Total from investment operations | | 0.74 | | (5.24 | ) | 2.33 | | 0.81 | |
| | | | | | | | | |
Distributions | | | | | | | | | |
Net investment income | | (0.04 | ) | — | | — | | — | |
Net realized gains on investments | | — | | — | | — | | (0.08 | ) |
Total distributions | | (0.04 | ) | — | | — | | (0.08 | ) |
| | | | | | | | | |
Net asset value | | | | | | | | | |
End of year | | $ | 7.69 | | $ | 6.99 | | $ | 12.23 | | $ | 9.90 | |
| | | | | | | | | |
Total return(b) | | 10.73 | % | (42.85 | )% | 23.54 | % | 8.83 | %(g) |
| | | | | | | | | |
Net assets end of year | | $ | 637,103 | | $ | 500,722 | | $ | 888,019 | | $ | 714,803 | |
| | | | | | | | | |
Ratios and supplemental data | | | | | | | | | |
Expenses to average net assets | | | | | | | | | |
After reimbursement/fee waiver | | 0.82 | %(l) | 0.75 | % | 0.78 | % | 0.81 | %(h) |
Before reimbursement/fee waiver | | 0.82 | %(l) | 0.75 | % | 0.78 | % | 0.81 | %(h) |
Net investment income, to average net assets(c) | | 0.72 | % | 0.55 | % | 0.13 | % | 0.02 | %(h) |
Portfolio turnover rate | | 53 | % | 33 | % | 62 | % | 19 | %(g) |
For a share outstanding throughout each period
| | Transamerica Equity | |
| | Class T | |
| | October 31,
2009 | | October 31,
2008 | | October 31,
2007 | | October 31,
2006(i) | |
Net asset value | | | | | | | | | |
Beginning of year | | $ | 19.14 | | $ | 33.53 | | $ | 27.18 | | $ | 27.10 | |
| | | | | | | | | |
Investment operations | | | | | | | | | |
Net investment income(a) | | 0.10 | | 0.12 | | — | | — | (d) |
Net realized and unrealized gain (loss) on investments | | 1.90 | | (14.51 | ) | 6.35 | | 0.08 | |
Total from investment operations | | 2.00 | | (14.39 | ) | 6.35 | | 0.08 | |
| | | | | | | | | |
Distributions | | | | | | | | | |
Net investment income | | — | (d) | — | | — | | — | |
Total distributions | | — | (d) | — | | — | | — | |
| | | | | | | | | |
Net asset value | | | | | | | | | |
End of year | | $ | 21.14 | | $ | 19.14 | | $ | 33.53 | | $ | 27.18 | |
| | | | | | | | | |
Total return(b) | | 10.46 | % | (42.92 | )% | 23.36 | % | 0.30 | %(g) |
| | | | | | | | | |
Net assets end of year | | $ | 87,469 | | $ | 90,881 | | $ | 183,495 | | $ | 195,420 | |
| | | | | | | | | |
Ratios and supplemental data | | | | | | | | | |
Expenses to average net assets | | | | | | | | | |
After reimbursement/fee waiver | | 1.03 | %(l) | 0.89 | % | 0.91 | % | 0.84 | %(h) |
Before reimbursement/fee waiver | | 1.03 | %(l) | 0.89 | % | 0.91 | % | 0.84 | %(h) |
Net investment income (loss), to average net assets(c) | | 0.54 | % | 0.42 | % | 0.01 | % | (0.21 | )%(h) |
Portfolio turnover rate | | 53 | % | 33 | % | 62 | % | 19 | %(g) |
The notes to the financial statements are an integral part of this report.
87
For a share outstanding throughout each period
| | Transamerica Flexible Income | |
| | Class A | |
| | October 31,
2009 | | October 31,
2008 | | October 31,
2007 | | October 31,
2006 | | October 31,
2005 | |
Net asset value | | | | | | | | | | | |
Beginning of year | | $ | 7.22 | | $ | 9.14 | | $ | 9.38 | | $ | 9.31 | | $ | 9.68 | |
| | | | | | | | | | | |
Investment operations | | | | | | | | | | | |
Net investment income(a) | | 0.46 | | 0.44 | | 0.48 | | 0.43 | | 0.37 | |
Net realized and unrealized gain (loss) on investments | | 1.08 | | (1.89 | ) | (0.25 | ) | 0.05 | | (0.32 | ) |
Total from investment operations | | 1.54 | | (1.45 | ) | 0.23 | | 0.48 | | 0.05 | |
| | | | | | | | | | | |
Distributions | | | | | | | | | | | |
Net investment income | | (0.43 | ) | (0.47 | ) | (0.47 | ) | (0.41 | ) | (0.38 | ) |
Return of capital | | — | | — | | — | | — | | (0.04 | ) |
Total distributions | | (0.43 | ) | (0.47 | ) | (0.47 | ) | (0.41 | ) | (0.42 | ) |
| | | | | | | | | | | |
Net asset value | | | | | | | | | | | |
End of year | | $ | 8.33 | | $ | 7.22 | | $ | 9.14 | | $ | 9.38 | | $ | 9.31 | |
| | | | | | | | | | | |
Total return(b) | | 22.30 | % | (16.57 | )% | 2.42 | % | 5.34 | % | 0.47 | % |
| | | | | | | | | | | |
Net assets end of year | | $ | 24,173 | | $ | 13,360 | | $ | 15,409 | | $ | 17,005 | | $ | 140,203 | |
| | | | | | | | | | | |
Ratios and supplemental data | | | | | | | | | | | |
Expenses to average net assets | | | | | | | | | | | |
After reimbursement/fee waiver | | 1.47 | % | 1.39 | % | 1.40 | % | 1.47 | % | 1.25 | % |
Before reimbursement/fee waiver | | 1.47 | % | 1.39 | % | 1.40 | % | 1.47 | % | 1.25 | % |
Net investment income, to average net assets(c) | | 6.03 | % | 5.12 | % | 5.12 | % | 4.64 | % | 3.85 | % |
Portfolio turnover rate | | 169 | % | 98 | % | 108 | % | 110 | % | 58 | % |
For a share outstanding throughout each period
| | Transamerica Flexible Income | |
| | Class B | |
| | October 31, 2009 | | October 31, 2008 | | October 31, 2007 | | October 31, 2006 | | October 31, 2005 | |
Net asset value | | | | | | | | | | | |
Beginning of year | | $ | 7.23 | | $ | 9.14 | | $ | 9.39 | | $ | 9.32 | | $ | 9.68 | |
| | | | | | | | | | | |
Investment operations | | | | | | | | | | | |
Net investment income(a) | | 0.40 | | 0.38 | | 0.42 | | 0.38 | | 0.29 | |
Net realized and unrealized gain (loss) on investments | | 1.09 | | (1.88 | ) | (0.26 | ) | 0.06 | | (0.32 | ) |
Total from investment operations | | 1.49 | | (1.50 | ) | 0.16 | | 0.44 | | (0.03 | ) |
| | | | | | | | | | | |
Distributions | | | | | | | | | | | |
Net investment income | | (0.38 | ) | (0.41 | ) | (0.41 | ) | (0.37 | ) | (0.29 | ) |
Return of capital | | — | | — | | — | | — | | (0.04 | ) |
Total distributions | | (0.38 | ) | (0.41 | ) | (0.41 | ) | (0.37 | ) | (0.33 | ) |
| | | | | | | | | | | |
Net asset value | | | | | | | | | | | |
End of year | | $ | 8.34 | | $ | 7.23 | | $ | 9.14 | | $ | 9.39 | | $ | 9.32 | |
| | | | | | | | | | | |
Total return(b) | | 21.39 | % | (17.03 | )% | 1.66 | % | 4.81 | % | (0.36 | )% |
| | | | | | | | | | | |
Net assets end of year | | $ | 8,161 | | $ | 8,628 | | $ | 17,007 | | $ | 23,501 | | $ | 32,560 | |
| | | | | | | | | | | |
Ratios and supplemental data | | | | | | | | | | | |
Expenses to average net assets | | | | | | | | | | | |
After reimbursement/fee waiver | | 2.16 | % | 2.05 | % | 2.04 | % | 2.08 | % | 2.08 | % |
Before reimbursement/fee waiver | | 2.16 | % | 2.05 | % | 2.04 | % | 2.08 | % | 2.08 | % |
Net investment income, to average net assets(c) | | 5.36 | % | 4.42 | % | 4.48 | % | 4.08 | % | 3.02 | % |
Portfolio turnover rate | | 169 | % | 98 | % | 108 | % | 110 | % | 58 | % |
The notes to the financial statements are an integral part of this report.
88
For a share outstanding throughout each period
| | Transamerica Flexible Income | |
| | Class C | |
| | October 31, 2009 | | October 31, 2008 | | October 31, 2007 | | October 31, 2006 | | October 31, 2005 | |
Net asset value | | | | | | | | | | | |
Beginning of year | | $ | 7.21 | | $ | 9.12 | | $ | 9.36 | | $ | 9.30 | | $ | 9.67 | |
| | | | | | | | | | | |
Investment operations | | | | | | | | | | | |
Net investment income(a) | | 0.41 | | 0.39 | | 0.42 | | 0.39 | | 0.29 | |
Net realized and unrealized gain (loss) on investments | | 1.08 | | (1.88 | ) | (0.25 | ) | 0.04 | | (0.33 | ) |
Total from investment operations | | 1.49 | | (1.49 | ) | 0.17 | | 0.43 | | (0.04 | ) |
| | | | | | | | | | | |
Distributions | | | | | | | | | | | |
Net investment income | | (0.39 | ) | (0.42 | ) | (0.41 | ) | (0.37 | ) | (0.29 | ) |
Return of capital | | — | | — | | — | | — | | (0.04 | ) |
Total distributions | | (0.39 | ) | (0.42 | ) | (0.41 | ) | (0.37 | ) | (0.33 | ) |
| | | | | | | | | | | |
Net asset value | | | | | | | | | | | |
End of year | | $ | 8.31 | | $ | 7.21 | | $ | 9.12 | | $ | 9.36 | | $ | 9.30 | |
| | | | | | | | | | | |
Total return(b) | | 21.50 | % | (16.98 | )% | 1.81 | % | 4.74 | % | (0.40 | )% |
| | | | | | | | | | | |
Net assets end of year | | $ | 12,978 | | $ | 5,981 | | $ | 8,982 | | $ | 12,519 | | $ | 13,439 | |
| | | | | | | | | | | |
Ratios and supplemental data | | | | | | | | | | | |
Expenses to average net assets | | | | | | | | | | | |
After reimbursement/fee waiver | | 2.06 | % | 1.97 | % | 2.00 | % | 2.07 | % | 2.11 | % |
Before reimbursement/fee waiver | | 2.06 | % | 1.97 | % | 2.00 | % | 2.07 | % | 2.11 | % |
Net investment income, to average net assets(c) | | 5.43 | % | 4.52 | % | 4.51 | % | 4.15 | % | 2.99 | % |
Portfolio turnover rate | | 169 | % | 98 | % | 108 | % | 110 | % | 58 | % |
For a share outstanding throughout each period
| | Transamerica Flexible Income | |
| | Class I | |
| | October 31, 2009 | | October 31, 2008 | | October 31, 2007 | | October 31, 2006 | | October 31, 2005(j) | |
Net asset value | | | | | | | | | | | |
Beginning of year | | $ | 7.25 | | $ | 9.17 | | $ | 9.42 | | $ | 9.35 | | $ | 9.68 | |
| | | | | | | | | | | |
Investment operations | | | | | | | | | | | |
Net investment income(a) | | 0.50 | | 0.50 | | 0.53 | | 0.50 | | 0.40 | |
Net realized and unrealized gain (loss) on investments | | 1.10 | | (1.90 | ) | (0.26 | ) | 0.05 | | (0.32 | ) |
Total from investment operations | | 1.60 | | (1.40 | ) | 0.27 | | 0.55 | | 0.08 | |
| | | | | | | | | | | |
Distributions | | | | | | | | | | | |
Net investment income | | (0.48 | ) | (0.52 | ) | (0.52 | ) | (0.48 | ) | (0.37 | ) |
Net realized gains on investments | | — | | — | | — | | — | | (0.04 | ) |
Total distributions | | (0.48 | ) | (0.52 | ) | (0.52 | ) | (0.48 | ) | (0.41 | ) |
| | | | | | | | | | | |
Net asset value | | | | | | | | | | | |
End of year | | $ | 8.37 | | $ | 7.25 | | $ | 9.17 | | $ | 9.42 | | $ | 9.35 | |
| | | | | | | | | | | |
Total return(b) | | 23.16 | % | (16.02 | )% | 2.93 | % | 6.04 | % | 0.85 | %(g) |
| | | | | | | | | | | |
Net assets end of year | | $ | 132,177 | | $ | 128,108 | | $ | 370,611 | | $ | 221,116 | | $ | 110,709 | |
| | | | | | | | | | | |
Ratios and supplemental data | | | | | | | | | | | |
Expenses to average net assets | | | | | | | | | | | |
After reimbursement/fee waiver | | 0.85 | % | 0.77 | % | 0.80 | % | 0.86 | % | 0.85 | %(h) |
Before reimbursement/fee waiver | | 0.85 | % | 0.77 | % | 0.80 | % | 0.86 | % | 0.85 | %(h) |
Net investment income, to average net assets(c) | | 6.64 | % | 5.67 | % | 5.71 | % | 5.35 | % | 4.25 | %(h) |
Portfolio turnover rate | | 169 | % | 98 | % | 108 | % | 110 | % | 58 | %(g) |
The notes to the financial statements are an integral part of this report.
89
For a share outstanding throughout each period
| | Transamerica Growth Opportunities | |
| | Class A | |
| | October 31, 2009 | | October 31, 2008 | | October 31, 2007 | | October 31, 2006 | | October 31, 2005 | |
Net asset value | | | | | | | | | | | |
Beginning of year | | $ | 6.57 | | $ | 11.40 | | $ | 8.36 | | $ | 7.85 | | $ | 6.61 | |
| | | | | | | | | | | |
Investment operations | | | | | | | | | | | |
Net investment loss(a) | | (0.05 | ) | (0.06 | ) | (0.09 | ) | (0.07 | ) | (0.02 | ) |
Net realized and unrealized gain (loss) on investments | | 1.02 | | (4.77 | ) | 3.13 | | 0.58 | | 1.26 | |
Total from investment operations | | 0.97 | | (4.83 | ) | 3.04 | | 0.51 | | 1.24 | |
| | | | | | | | | | | |
Net asset value | | | | | | | | | | | |
End of year | | $ | 7.54 | | $ | 6.57 | | $ | 11.40 | | $ | 8.36 | | $ | 7.85 | |
| | | | | | | | | | | |
Total return(b) | | 14.76 | % | (42.37 | )% | 36.20 | % | 6.62 | % | 18.76 | % |
| | | | | | | �� | | | | |
Net assets end of year | | $ | 48,788 | | $ | 41,005 | | $ | 64,825 | | $ | 56,588 | | $ | 256,559 | |
| | | | | | | | | | | |
Ratios and supplemental data | | | | | | | | | | | |
Expenses to average net assets | | | | | | | | | | | |
After reimbursement/fee waiver | | 1.75 | % | 1.75 | % | 1.75 | % | 1.72 | % | 1.41 | % |
Before reimbursement/fee waiver | | 2.23 | % | 1.81 | % | 1.77 | % | 1.72 | % | 1.41 | % |
Net investment loss, to average net assets(c) | | (0.68 | )% | (0.69 | )% | (1.00 | )% | (0.89 | )% | (0.30 | )% |
Portfolio turnover rate | | 71 | % | 45 | % | 85 | % | 59 | % | 34 | % |
For a share outstanding throughout each period
| | Transamerica Growth Opportunities | |
| | Class B | |
| | October 31, 2009 | | October 31, 2008 | | October 31, 2007 | | October 31, 2006 | | October 31, 2005 | |
Net asset value | | | | | | | | | | | |
Beginning of year | | $ | 6.13 | | $ | 10.72 | | $ | 7.92 | | $ | 7.48 | | $ | 6.37 | |
| | | | | | | | | | | |
Investment operations | | | | | | | | | | | |
Net investment loss(a) | | (0.08 | ) | (0.12 | ) | (0.14 | ) | (0.13 | ) | (0.09 | ) |
Net realized and unrealized gain (loss) on investments | | 0.94 | | (4.47 | ) | 2.94 | | 0.57 | | 1.20 | |
Total from investment operations | | 0.86 | | (4.59 | ) | 2.80 | | 0.44 | | 1.11 | |
| | | | | | | | | | | |
Net asset value | | | | | | | | | | | |
End of year | | $ | 6.99 | | $ | 6.13 | | $ | 10.72 | | $ | 7.92 | | $ | 7.48 | |
| | | | | | | | | | | |
Total return(b) | | 14.03 | % | (42.82 | )% | 35.35 | % | 5.88 | % | 17.43 | % |
| | | | | | | | | | | |
Net assets end of year | | $ | 14,067 | | $ | 20,823 | | $ | 65,123 | | $ | 66,098 | | $ | 74,589 | |
| | | | | | | | | | | |
Ratios and supplemental data | | | | | | | | | | | |
Expenses to average net assets | | | | | | | | | | | |
After reimbursement/fee waiver | | 2.40 | % | 2.40 | % | 2.40 | % | 2.40 | % | 2.40 | % |
Before reimbursement/fee waiver | | 2.71 | % | 2.46 | % | 2.45 | % | 2.46 | % | 2.61 | % |
Net investment loss, to average net assets(c) | | (1.25 | )% | (1.39 | )% | (1.66 | )% | (1.57 | )% | (1.29 | )% |
Portfolio turnover rate | | 71 | % | 45 | % | 85 | % | 59 | % | 34 | % |
The notes to the financial statements are an integral part of this report.
90
For a share outstanding throughout each period
| | Transamerica Growth Opportunities | |
| | Class C | |
| | October 31, 2009 | | October 31, 2008 | | October 31, 2007 | | October 31, 2006 | | October 31, 2005 | |
Net asset value | | | | | | | | | | | |
Beginning of year | | $ | 6.16 | | $ | 10.74 | | $ | 7.94 | | $ | 7.49 | | $ | 6.38 | |
| | | | | | | | | | | |
Investment operations | | | | | | | | | | | |
Net investment loss(a) | | (0.08 | ) | (0.11 | ) | (0.14 | ) | (0.12 | ) | (0.09 | ) |
Net realized and unrealized gain (loss) on investments | | 0.93 | | (4.47 | ) | 2.94 | | 0.57 | | 1.20 | |
Total from investment operations | | 0.85 | | (4.58 | ) | 2.80 | | 0.45 | | 1.11 | |
| | | | | | | | | | | |
Net asset value | | | | | | | | | | | |
End of year | | $ | 7.01 | | $ | 6.16 | | $ | 10.74 | | $ | 7.94 | | $ | 7.49 | |
| | | | | | | | | | | |
Total return(b) | | 13.80 | % | (42.64 | )% | 35.26 | % | 6.01 | % | 17.40 | % |
| | | | | | | | | | | |
Net assets end of year | | $ | 10,774 | | $ | 10,619 | | $ | 22,656 | | $ | 21,688 | | $ | 25,432 | |
| | | | | | | | | | | |
Ratios and supplemental data | | | | | | | | | | | |
Expenses to average net assets | | | | | | | | | | | |
After reimbursement/fee waiver | | 2.40 | % | 2.34 | % | 2.36 | % | 2.38 | % | 2.40 | % |
Before reimbursement/fee waiver | | 2.62 | % | 2.34 | % | 2.36 | % | 2.38 | % | 2.54 | % |
Net investment loss, to average net assets(c) | | (1.31 | )% | (1.29 | )% | (1.61 | )% | (1.54 | )% | (1.29 | )% |
Portfolio turnover rate | | 71 | % | 45 | % | 85 | % | 59 | % | 34 | % |
For a share outstanding throughout each period
| | Transamerica Growth Opportunities | | | |
| | Class I | | | |
| | October 31, 2009 | | October 31, 2008 | | October 31, 2007 | | October 31, 2006(f) | | | |
Net asset value | | | | | | | | | | | |
Beginning of year | | $ | 6.74 | | $ | 11.59 | | $ | 8.43 | | $ | 7.99 | | | |
| | | | | | | | | | | |
Investment operations | | | | | | | | | | | |
Net investment income (loss)(a) | | 0.01 | | 0.01 | | (0.01 | ) | — | (d) | | |
Net realized and unrealized gain (loss) on investments | | 1.03 | | (4.86 | ) | 3.17 | | 0.44 | | | |
Total from investment operations | | 1.04 | | (4.85 | ) | 3.16 | | 0.44 | | | |
| | | | | | | | | | | |
Net asset value | | | | | | | | | | | |
End of year | | $ | 7.78 | | $ | 6.74 | | $ | 11.59 | | $ | 8.43 | | | |
| | | | | | | | | | | |
Total return(b) | | 15.43 | % | (41.85 | )% | 37.49 | % | 5.51 | %(g) | | |
| | | | | | | | | | | |
Net assets end of year | | $ | 111,402 | | $ | 86,425 | | $ | 206,863 | | $ | 214,775 | | | |
| | | | | | | | | | | |
Ratios and supplemental data | | | | | | | | | | | |
Expenses to average net assets | | | | | | | | | | | |
After reimbursement/fee waiver | | 0.91 | % | 0.86 | % | 0.88 | % | 0.88 | %(h) | | |
Before reimbursement/fee waiver | | 0.91 | % | 0.86 | % | 0.88 | % | 0.88 | %(h) | | |
Net investment income (loss), to average net assets(c) | | 0.15 | % | 0.15 | % | (0.15 | )% | (0.06 | )%(h) | | |
Portfolio turnover rate | | 71 | % | 45 | % | 85 | % | 59 | %(g) | | |
The notes to the financial statements are an integral part of this report.
91
For a share outstanding throughout each period
| | Transamerica High Yield Bond | |
| | Class A | |
| | October 31, 2009 | | October 31, 2008 | | October 31, 2007 | | October 31, 2006 | | October 31, 2005 | |
Net asset value | | | | | | | | | | | |
Beginning of year | | $ | 6.31 | | $ | 9.12 | | $ | 9.19 | | $ | 8.97 | | $ | 9.37 | |
| | | | | | | | | | | |
Investment operations | | | | | | | | | | | |
Net investment income(a) | | 0.65 | | 0.64 | | 0.60 | | 0.61 | | 0.56 | |
Net realized and unrealized gain (loss) on investments | | 2.14 | | (2.83 | ) | (0.07 | ) | 0.19 | | (0.37 | ) |
Total from investment operations | | 2.79 | | (2.19 | ) | 0.53 | | 0.80 | | 0.19 | |
| | | | | | | | | | | |
Distributions | | | | | | | | | | | |
Net investment income | | (0.66 | ) | (0.62 | ) | (0.60 | ) | (0.58 | ) | (0.59 | ) |
Total distributions | | (0.66 | ) | (0.62 | ) | (0.60 | ) | (0.58 | ) | (0.59 | ) |
| | | | | | | | | | | |
Net asset value | | | | | | | | | | | |
End of year | | $ | 8.45 | | $ | 6.31 | | $ | 9.12 | | $ | 9.19 | | $ | 8.97 | |
| | | | | | | | | | | |
Total return(b) | | 47.58 | % | (25.46 | )% | 5.90 | % | 9.27 | % | 2.06 | % |
| | | | | | | | | | | |
Net assets end of year | | $ | 67,290 | | $ | 24,506 | | $ | 35,147 | | $ | 43,514 | | $ | 336,340 | |
| | | | | | | | | | | |
Ratios and supplemental data | | | | | | | | | | | |
Expenses to average net assets | | | | | | | | | | | |
After reimbursement/fee waiver | | 1.19 | % | 1.16 | % | 1.15 | % | 1.16 | % | 1.05 | % |
Before reimbursement/fee waiver | | 1.19 | % | 1.16 | % | 1.15 | % | 1.16 | % | 1.05 | % |
Net investment income, to average net assets(c) | | 9.08 | % | 7.65 | % | 6.45 | % | 6.77 | % | 6.04 | % |
Portfolio turnover rate | | 58 | % | 38 | % | 80 | % | 73 | % | 71 | % |
For a share outstanding throughout each period
| | Transamerica High Yield Bond | |
| | Class B | |
| | October 31, 2009 | | October 31, 2008 | | October 31, 2007 | | October 31, 2006 | | October 31, 2005 | |
Net asset value | | | | | | | | | | | |
Beginning of year | | $ | 6.30 | | $ | 9.11 | | $ | 9.18 | | $ | 8.97 | | $ | 9.37 | |
| | | | | | | | | | | |
Investment operations | | | | | | | | | | | |
Net investment income(a) | | 0.60 | | 0.58 | | 0.53 | | 0.55 | | 0.48 | |
Net realized and unrealized gain (loss) on investments | | 2.15 | | (2.83 | ) | (0.06 | ) | 0.19 | | (0.37 | ) |
Total from investment operations | | 2.75 | | (2.25 | ) | 0.47 | | 0.74 | | 0.11 | |
| | | | | | | | | | | |
Distributions | | | | | | | | | | | |
Net investment income | | (0.61 | ) | (0.56 | ) | (0.54 | ) | (0.53 | ) | (0.51 | ) |
Total distributions | | (0.61 | ) | (0.56 | ) | (0.54 | ) | (0.53 | ) | (0.51 | ) |
| | | | | | | | | | | |
Net asset value | | | | | | | | | | | |
End of year | | $ | 8.44 | | $ | 6.30 | | $ | 9.11 | | $ | 9.18 | | $ | 8.97 | |
| | | | | | | | | | | |
Total return(b) | | 46.69 | % | (26.04 | )% | 5.19 | % | 8.53 | % | 1.21 | % |
| | | | | | | | | | | |
Net assets end of year | | $ | 11,898 | | $ | 9,091 | | $ | 21,370 | | $ | 27,753 | | $ | 37,006 | |
| | | | | | | | | | | |
Ratios and supplemental data | | | | | | | | | | | |
Expenses to average net assets | | | | | | | | | | | |
After reimbursement/fee waiver | | 1.91 | % | 1.85 | % | 1.83 | % | 1.83 | % | 1.85 | % |
Before reimbursement/fee waiver | | 1.91 | % | 1.85 | % | 1.83 | % | 1.83 | % | 1.85 | % |
Net investment income, to average net assets(c) | | 8.56 | % | 6.83 | % | 5.77 | % | 6.12 | % | 5.18 | % |
Portfolio turnover rate | | 58 | % | 38 | % | 80 | % | 73 | % | 71 | % |
The notes to the financial statements are an integral part of this report.
92
For a share outstanding throughout each period
| | Transamerica High Yield Bond | |
| | Class C | |
| | October 31, 2009 | | October 31, 2008 | | October 31, 2007 | | October 31, 2006 | | October 31, 2005 | |
Net asset value | | | | | | | | | | | |
Beginning of year | | $ | 6.30 | | $ | 9.10 | | $ | 9.17 | | $ | 8.96 | | $ | 9.36 | |
| | | | | | | | | | | |
Investment operations | | | | | | | | | | | |
Net investment income(a) | | 0.60 | | 0.58 | | 0.53 | | 0.55 | | 0.47 | |
Net realized and unrealized gain (loss) on investments | | 2.14 | | (2.82 | ) | (0.06 | ) | 0.19 | | (0.36 | ) |
Total from investment operations | | 2.74 | | (2.24 | ) | 0.47 | | 0.74 | | 0.11 | |
| | | | | | | | | | | |
Distributions | | | | | | | | | | | |
Net investment income | | (0.62 | ) | (0.56 | ) | (0.54 | ) | (0.53 | ) | (0.51 | ) |
Total distributions | | (0.62 | ) | (0.56 | ) | (0.54 | ) | (0.53 | ) | (0.51 | ) |
| | | | | | | | | | | |
Net asset value | | | | | | | | | | | |
End of year | | $ | 8.42 | | $ | 6.30 | | $ | 9.10 | | $ | 9.17 | | $ | 8.96 | |
| | | | | | | | | | | |
Total return(b) | | 46.63 | % | (25.89 | )% | 5.21 | % | 8.54 | % | 1.21 | % |
| | | | | | | | | | | |
Net assets end of year | | $ | 19,548 | | $ | 5,429 | | $ | 10,160 | | $ | 11,317 | | $ | 15,880 | |
| | | | | | | | | | | |
Ratios and supplemental data | | | | | | | | | | | |
Expenses to average net assets | | | | | | | | | | | |
After reimbursement/fee waiver | | 1.81 | % | 1.80 | % | 1.83 | % | 1.83 | % | 1.88 | % |
Before reimbursement/fee waiver | | 1.81 | % | 1.80 | % | 1.83 | % | 1.83 | % | 1.88 | % |
Net investment income, to average net assets(c) | | 8.23 | % | 6.93 | % | 5.77 | % | 6.12 | % | 5.11 | % |
Portfolio turnover rate | | 58 | % | 38 | % | 80 | % | 73 | % | 71 | % |
For a share outstanding throughout each period
| | Transamerica High Yield Bond | |
| | Class I | |
| | October 31, 2009 | | October 31, 2008 | | October 31, 2007 | | October 31, 2006 | | October 31, 2005(j) | |
Net asset value | | | | | | | | | | | |
Beginning of year | | $ | 6.35 | | $ | 9.17 | | $ | 9.24 | | $ | 9.02 | | $ | 9.39 | |
| | | | | | | | | | | |
Investment operations | | | | | | | | | | | |
Net investment income(a) | | 0.69 | | 0.69 | | 0.65 | | 0.67 | | 0.59 | |
Net realized and unrealized gain (loss) on investments | | 2.16 | | (2.85 | ) | (0.07 | ) | 0.18 | | (0.37 | ) |
Total from investment operations | | 2.85 | | (2.16 | ) | 0.58 | | 0.85 | | 0.22 | |
| | | | | | | | | | | |
Distributions | | | | | | | | | | | |
Net investment income | | (0.70 | ) | (0.66 | ) | (0.65 | ) | (0.63 | ) | (0.59 | ) |
Total distributions | | (0.70 | ) | (0.66 | ) | (0.65 | ) | (0.63 | ) | (0.59 | ) |
| | | | | | | | | | | |
Net asset value | | | | | | | | | | | |
End of year | | $ | 8.50 | | $ | 6.35 | | $ | 9.17 | | $ | 9.24 | | $ | 9.02 | |
| | | | | | | | | | | |
Total return(b) | | 48.39 | % | (25.05 | )% | 6.39 | % | 9.81 | % | 2.33 | %(g) |
| | | | | | | | | | | |
Net assets end of year | | $ | 472,936 | | $ | 418,923 | | $ | 331,300 | | $ | 315,252 | | $ | 40,860 | |
| | | | | | | | | | | |
Ratios and supplemental data | | | | | | | | | | | |
Expenses to average net assets | | | | | | | | | | | |
After reimbursement/fee waiver | | 0.67 | % | 0.65 | % | 0.65 | % | 0.66 | % | 0.66 | %(h) |
Before reimbursement/fee waiver | | 0.67 | % | 0.65 | % | 0.65 | % | 0.66 | % | 0.66 | %(h) |
Net investment income, to average net assets(c) | | 9.96 | % | 8.34 | % | 6.96 | % | 7.29 | % | 6.60 | %(h) |
Portfolio turnover rate | | 58 | % | 38 | % | 80 | % | 73 | % | 71 | %(g) |
The notes to the financial statements are an integral part of this report.
93
For a share outstanding throughout each period
| | Transamerica Legg Mason Partners All Cap | |
| | Class A | |
| | October 31, 2009 | | October 31, 2008 | | October 31, 2007 | | October 31, 2006 | | October 31, 2005 | |
Net asset value | | | | | | | | | | | |
Beginning of year | | $ | 9.98 | | $ | 17.08 | | $ | 18.18 | | $ | 16.10 | | $ | 14.80 | |
| | | | | | | | | | | |
Investment operations | | | | | | | | | | | |
Net investment income(a) | | 0.06 | | 0.12 | | 0.07 | | 0.09 | | 0.06 | |
Net realized and unrealized gain (loss) on investments | | 1.23 | | (5.73 | ) | 1.49 | | 2.55 | | 1.24 | |
Total from investment operations | | 1.29 | | (5.61 | ) | 1.56 | | 2.64 | | 1.30 | |
| | | | | | | | | | | |
Distributions | | | | | | | | | | | |
Net investment income | | (0.15 | ) | — | | (0.06 | ) | (0.01 | ) | — | (d) |
Net realized gains on investments | | — | | (1.49 | ) | (2.60 | ) | (0.55 | ) | — | |
Total distributions | | (0.15 | ) | (1.49 | ) | (2.66 | ) | (0.56 | ) | — | (d) |
| | | | | | | | | | | |
Net asset value | | | | | | | | | | | |
End of year | | $ | 11.12 | | $ | 9.98 | | $ | 17.08 | | $ | 18.18 | | $ | 16.10 | |
| | | | | | | | | | | |
Total return(b) | | 13.19 | % | (35.81 | )% | 9.27 | % | 16.74 | % | 8.79 | % |
| | | | | | | | | | | |
Net assets end of year | | $ | 36,940 | | $ | 28,237 | | $ | 49,938 | | $ | 55,622 | | $ | 173,929 | |
| | | | | | | | | | | |
Ratios and supplemental data | | | | | | | | | | | |
Expenses to average net assets | | | | | | | | | | | |
After reimbursement/fee waiver | | 1.55 | %(l) | 1.55 | % | 1.55 | % | 1.55 | % | 1.32 | % |
Before reimbursement/fee waiver | | 1.94 | %(l) | 1.59 | % | 1.56 | % | 1.57 | % | 1.32 | % |
Net investment income, to average net assets(c) | | 0.63 | % | 0.85 | % | 0.42 | % | 0.52 | % | 0.36 | % |
Portfolio turnover rate | | 34 | % | 27 | % | 17 | % | 25 | % | 27 | % |
For a share outstanding throughout each period
| | Transamerica Legg Mason Partners All Cap | |
| | Class B | |
| | October 31, 2009 | | October 31, 2008 | | October 31, 2007 | | October 31, 2006 | | October 31, 2005 | |
Net asset value | | | | | | | | | | | |
Beginning of year | | $ | 9.24 | | $ | 16.01 | | $ | 17.24 | | $ | 15.39 | | $ | 14.27 | |
| | | | | | | | | | | |
Investment operations | | | | | | | | | | | |
Net investment income (loss)(a) | | 0.02 | | 0.02 | | (0.03 | ) | (0.03 | ) | (0.09 | ) |
Net realized and unrealized gain (loss) on investments | | 1.12 | | (5.30 | ) | 1.40 | | 2.43 | | 1.21 | |
Total from investment operations | | 1.14 | | (5.28 | ) | 1.37 | | 2.40 | | 1.12 | |
| | | | | | | | | | | |
Distributions | | | | | | | | | | | |
Net investment income | | (0.03 | ) | — | | — | | — | (d) | — | |
Net realized gains on investments | | — | | (1.49 | ) | (2.60 | ) | (0.55 | ) | — | |
Total distributions | | (0.03 | ) | (1.49 | ) | (2.60 | ) | (0.55 | ) | — | |
| | | | | | | | | | | |
Net asset value | | | | | | | | | | | |
End of year | | $ | 10.35 | | $ | 9.24 | | $ | 16.01 | | $ | 17.24 | | $ | 15.39 | |
| | | | | | | | | | | |
Total return(b) | | 12.38 | % | (36.18 | )% | 8.57 | % | 15.97 | % | 7.84 | % |
| | | | | | | | | | | |
Net assets end of year | | $ | 18,510 | | $ | 33,670 | | $ | 88,268 | | $ | 109,567 | | $ | 123,494 | |
| | | | | | | | | | | |
Ratios and supplemental data | | | | | | | | | | | |
Expenses to average net assets | | | | | | | | | | | |
After reimbursement/fee waiver | | 2.20 | %(l) | 2.20 | % | 2.19 | % | 2.20 | % | 2.19 | % |
Before reimbursement/fee waiver | | 2.62 | %(l) | 2.24 | % | 2.19 | % | 2.21 | % | 2.19 | % |
Net investment income (loss), to average net assets(c) | | 0.18 | % | 0.20 | % | (0.22 | )% | (0.17 | )% | (0.58 | )% |
Portfolio turnover rate | | 34 | % | 27 | % | 17 | % | 25 | % | 27 | % |
The notes to the financial statements are an integral part of this report.
94
For a share outstanding throughout each period
| | Transamerica Legg Mason Partners All Cap | |
| | Class C | |
| | October 31, 2009 | | October 31, 2008 | | October 31, 2007 | | October 31, 2006 | | October 31, 2005 | |
Net asset value | | | | | | | | | | | |
Beginning of year | | $ | 9.26 | | $ | 16.04 | | $ | 17.25 | | $ | 15.39 | | $ | 14.26 | |
| | | | | | | | | | | |
Investment operations | | | | | | | | | | | |
Net investment income (loss)(a) | | 0.01 | | 0.03 | | (0.02 | ) | (0.02 | ) | (0.08 | ) |
Net realized and unrealized gain (loss) on investments | | 1.12 | | (5.32 | ) | 1.41 | | 2.43 | | 1.21 | |
Total from investment operations | | 1.13 | | (5.29 | ) | 1.39 | | 2.41 | | 1.13 | |
| | | | | | | | | | | |
Distributions | | | | | | | | | | | |
Net investment income | | (0.05 | ) | — | | — | | — | (d) | — | |
Net realized gains on investments | | — | | (1.49 | ) | (2.60 | ) | (0.55 | ) | — | |
Total distributions | | (0.05 | ) | (1.49 | ) | (2.60 | ) | (0.55 | ) | — | |
| | | | | | | | | | | |
Net asset value | | | | | | | | | | | |
End of year | | $ | 10.35 | | $ | 9.26 | | $ | 16.04 | | $ | 17.25 | | $ | 15.39 | |
| | | | | | | | | | | |
Total return(b) | | 12.35 | % | (36.17 | )% | 8.70 | % | 16.04 | % | 7.89 | % |
| | | | | | | | | | | |
Net assets end of year | | $ | 13,319 | | $ | 15,316 | | $ | 35,568 | | $ | 41,340 | | $ | 49,909 | |
| | | | | | | | | | | |
Ratios and supplemental data | | | | | | | | | | | |
Expenses to average net assets | | | | | | | | | | | |
After reimbursement/fee waiver | | 2.20 | %(l) | 2.15 | % | 2.13 | % | 2.15 | % | 2.15 | % |
Before reimbursement/fee waiver | | 2.41 | %(l) | 2.15 | % | 2.13 | % | 2.15 | % | 2.15 | % |
Net investment income (loss), to average net assets(c) | | 0.08 | % | 0.26 | % | (0.15 | )% | (0.12 | )% | (0.53 | )% |
Portfolio turnover rate | | 34 | % | 27 | % | 17 | % | 25 | % | 27 | % |
For a share outstanding throughout each period
| | Transamerica Money Market | |
| | Class A | |
| | October 31, 2009 | | October 31, 2008 | | October 31, 2007 | | October 31, 2006 | | October 31, 2005 | |
Net asset value | | | | | | | | | | | |
Beginning of year | | $ | 1.00 | | $ | 1.00 | | $ | 1.00 | | $ | 1.00 | | $ | 1.00 | |
| | | | | | | | | | | |
Investment operations | | | | | | | | | | | |
Net investment income(a) | | — | (d) | 0.02 | | 0.05 | | 0.04 | | 0.02 | |
Net realized and unrealized gain on investments | | — | (d) | — | (d) | — | | — | | — | |
Total from investment operations | | — | (d) | 0.02 | | 0.05 | | 0.04 | | 0.02 | |
| | | | | | | | | | | |
Distributions | | | | | | | | | | | |
Net investment income | | — | (d) | (0.02 | ) | (0.05 | ) | (0.04 | ) | (0.02 | ) |
Net realized gains on investments | | — | | — | | — | (d) | — | | — | |
Total distributions | | — | (d) | (0.02 | ) | (0.05 | ) | (0.04 | ) | (0.02 | ) |
| | | | | | | | | | | |
Net asset value | | | | | | | | | | | |
End of year | | $ | 1.00 | | $ | 1.00 | | $ | 1.00 | | $ | 1.00 | | $ | 1.00 | |
| | | | | | | | | | | |
Total return(b) | | 0.21 | % | 2.52 | % | 4.61 | % | 4.09 | % | 2.10 | % |
| | | | | | | | | | | |
Net assets end of year | | $ | 146,598 | | $ | 142,456 | | $ | 95,766 | | $ | 78,716 | | $ | 150,804 | |
| | | | | | | | | | | |
Ratios and supplemental data | | | | | | | | | | | |
Expenses to average net assets | | | | | | | | | | | |
After reimbursement/fee waiver | | 0.60 | % | 0.83 | % | 0.83 | % | 0.83 | % | 0.83 | % |
Before reimbursement/fee waiver | | 1.11 | % | 1.08 | % | 1.20 | % | 1.23 | % | 1.05 | % |
Net investment income, to average net assets(c) | | 0.20 | % | 2.40 | % | 4.54 | % | 3.98 | % | 2.08 | % |
The notes to the financial statements are an integral part of this report.
95
For a share outstanding throughout each period
| | Transamerica Money Market | |
| | Class B | |
| | October 31, 2009 | | October 31, 2008 | | October 31, 2007 | | October 31, 2006 | | October 31, 2005 | |
Net asset value | | | | | | | | | | | |
Beginning of year | | $ | 1.00 | | $ | 1.00 | | $ | 1.00 | | $ | 1.00 | | $ | 1.00 | |
| | | | | | | | | | | |
Investment operations | | | | | | | | | | | |
Net investment income(a) | | — | (d) | 0.02 | | 0.04 | | 0.03 | | 0.02 | |
Net realized and unrealized gain on investments | | — | (d) | — | (d) | — | | — | | — | |
Total from investment operations | | — | (d) | 0.02 | | 0.04 | | 0.03 | | 0.02 | |
| | | | | | | | | | | |
Distributions | | | | | | | | | | | |
Net investment income | | — | (d) | (0.02 | ) | (0.04 | ) | (0.03 | ) | (0.02 | ) |
Net realized gains on investments | | — | | — | | — | (d) | — | | — | |
Total distributions | | — | (d) | (0.02 | ) | (0.04 | ) | (0.03 | ) | (0.02 | ) |
| | | | | | | | | | | |
Net asset value | | | | | | | | | | | |
End of year | | $ | 1.00 | | $ | 1.00 | | $ | 1.00 | | $ | 1.00 | | $ | 1.00 | |
| | | | | | | | | | | |
Total return(b) | | 0.08 | % | 1.83 | % | 3.92 | % | 3.41 | % | 1.60 | % |
| | | | | | | | | | | |
Net assets end of year | | $ | 35,612 | | $ | 40,110 | | $ | 23,324 | | $ | 25,727 | | $ | 31,647 | |
| | | | | | | | | | | |
Ratios and supplemental data | | | | | | | | | | | |
Expenses to average net assets | | | | | | | | | | | |
After reimbursement/fee waiver | | 0.73 | % | 1.48 | % | 1.48 | % | 1.48 | % | 1.32 | % |
Before reimbursement/fee waiver | | 1.75 | % | 1.75 | % | 1.83 | % | 1.80 | % | 1.79 | % |
Net investment income, to average net assets(c) | | 0.08 | % | 1.75 | % | 3.87 | % | 3.50 | % | 1.57 | % |
For a share outstanding throughout each period
| | Transamerica Money Market | |
| | Class C | |
| | October 31, 2009 | | October 31, 2008 | | October 31, 2007 | | October 31, 2006 | | October 31, 2005 | |
Net asset value | | | | | | | | | | | |
Beginning of year | | $ | 1.00 | | $ | 1.00 | | $ | 1.00 | | $ | 1.00 | | $ | 1.00 | |
| | | | | | | | | | | |
Investment operations | | | | | | | | | | | |
Net investment income(a) | | — | (d) | 0.02 | | 0.04 | | 0.03 | | 0.02 | |
Net realized and unrealized gain on investments | | — | (d) | — | (d) | — | | — | | — | |
Total from investment operations | | — | (d) | 0.02 | | 0.04 | | 0.03 | | 0.02 | |
| | | | | | | | | | | |
Distributions | | | | | | | | | | | |
Net investment income | | — | (d) | (0.02 | ) | (0.04 | ) | (0.03 | ) | (0.02 | ) |
Net realized gains on investments | | — | | — | | — | (d) | — | | — | |
Total distributions | | — | (d) | (0.02 | ) | (0.04 | ) | (0.03 | ) | (0.02 | ) |
| | | | | | | | | | | |
Net asset value | | | | | | | | | | | |
End of year | | $ | 1.00 | | $ | 1.00 | | $ | 1.00 | | $ | 1.00 | | $ | 1.00 | |
| | | | | | | | | | | |
Total return(b) | | 0.07 | % | 1.86 | % | 3.92 | % | 3.16 | % | 1.87 | % |
| | | | | | | | | | | |
Net assets end of year | | $ | 46,177 | | $ | 59,991 | | $ | 19,638 | | $ | 17,286 | | $ | 15,997 | |
| | | | | | | | | | | |
Ratios and supplemental data | | | | | | | | | | | |
Expenses to average net assets | | | | | | | | | | | |
After reimbursement/fee waiver | | 0.76 | % | 1.48 | % | 1.48 | % | 1.48 | % | 1.26 | % |
Before reimbursement/fee waiver | | 1.64 | % | 1.67 | % | 1.73 | % | 1.82 | % | 1.89 | % |
Net investment income, to average net assets(c) | | 0.07 | % | 1.65 | % | 3.88 | % | 3.40 | % | 1.61 | % |
The notes to the financial statements are an integral part of this report.
96
For a share outstanding throughout each period
| | Transamerica Money Market | | | |
| | Class I | | | |
| | October 31,
2009 | | October 31,
2008 | | October 31,
2007 | | October 31,
2006(f) | | | |
Net asset value | | | | | | | | | | | |
Beginning of year | | $ | 1.00 | | $ | 1.00 | | $ | 1.00 | | $ | 1.00 | | | |
| | | | | | | | | | | |
Investment operations | | | | | | | | | | | |
Net investment income(a) | | — | (d) | 0.03 | | 0.05 | | 0.04 | | | |
Net realized and unrealized gain on investments | | — | (d) | — | (d) | — | | — | | | |
Total from investment operations | | — | (d) | 0.03 | | 0.05 | | 0.04 | | | |
| | | | | | | | | | | |
Distributions | | | | | | | | | | | |
Net investment income | | — | (d) | (0.03 | ) | (0.05 | ) | (0.04 | ) | | |
Net realized gains on investments | | — | | — | | — | (d) | — | | | |
Total distributions | | — | (d) | (0.03 | ) | (0.05 | ) | (0.04 | ) | | |
| | | | | | | | | | | |
Net asset value | | | | | | | | | | | |
End of year | | $ | 1.00 | | $ | 1.00 | | $ | 1.00 | | $ | 1.00 | | | |
| | | | | | | | | | | |
Total return(b) | | 0.35 | % | 2.84 | % | 4.98 | % | 4.30 | %(g) | | |
| | | | | | | | | | | |
Net assets end of year | | $ | 34,119 | | $ | 29,327 | | $ | 34,673 | | $ | 26,466 | | | |
| | | | | | | | | | | |
Ratios and supplemental data | | | | | | | | | | | |
Expenses to average net assets | | | | | | | | | | | |
After reimbursement/fee waiver | | 0.45 | % | 0.48 | % | 0.48 | % | 0.48 | %(h) | | |
Before reimbursement/fee waiver | | 0.53 | % | 0.49 | % | 0.52 | % | 0.51 | %(h) | | |
Net investment income, to average net assets(c) | | 0.36 | % | 2.89 | % | 4.88 | % | 4.39 | %(h) | | |
For a share outstanding throughout each period
| | Transamerica Science & Technology | |
| | Class A | |
| | October 31,
2009 | | October 31,
2008 | | October 31,
2007 | | October 31,
2006 | | October 31,
2005 | |
Net asset value | | | | | | | | | | | |
Beginning of year | | $ | 2.84 | | $ | 5.67 | | $ | 3.91 | | $ | 3.82 | | $ | 3.80 | |
| | | | | | | | | | | |
Investment operations | | | | | | | | | | | |
Net investment income (loss)(a) | | (0.03 | ) | (0.04 | ) | (0.05 | ) | (0.03 | ) | 0.03 | |
Net realized and unrealized gain (loss) on investments | | 0.76 | | (2.61 | ) | 1.81 | | 0.18 | | 0.02 | |
Total from investment operations | | 0.73 | | (2.65 | ) | 1.76 | | 0.15 | | 0.05 | |
| | | | | | | | | | | |
Distributions | | | | | | | | | | | |
Net investment income | | — | | — | | — | | — | | (0.03 | ) |
Net realized gains on investments | | — | | (0.18 | ) | — | | (0.06 | ) | — | |
Total distributions | | — | | (0.18 | ) | — | | (0.06 | ) | (0.03 | ) |
| | | | | | | | | | | |
Net asset value | | | | | | | | | | | |
End of year | | $ | 3.57 | | $ | 2.84 | | $ | 5.67 | | $ | 3.91 | | $ | 3.82 | |
| | | | | | | | | | | |
Total return(b) | | 25.70 | % | (48.18 | )% | 45.01 | % | 3.78 | % | 1.23 | % |
| | | | | | | | | | | |
Net assets end of year | | $ | 5,774 | | $ | 3,778 | | $ | 7,874 | | $ | 5,616 | | $ | 65,423 | |
| | | | | | | | | | | |
Ratios and supplemental data | | | | | | | | | | | |
Expenses to average net assets | | | | | | | | | | | |
After reimbursement/fee waiver | | 1.53 | %(l) | 1.53 | % | 1.53 | % | 1.53 | % | 1.32 | % |
Before reimbursement/fee waiver | | 2.06 | %(l) | 1.70 | % | 1.77 | % | 1.67 | % | 1.32 | % |
Net investment income (loss), to average net assets(c) | | (0.97 | )% | (1.02 | )% | (1.03 | )% | (0.72 | )% | 0.63 | % |
Portfolio turnover rate | | 57 | % | 47 | % | 66 | % | 94 | % | 73 | % |
The notes to the financial statements are an integral part of this report.
97
For a share outstanding throughout each period
| | Transamerica Science & Technology | |
| | Class B | |
| | October 31,
2009 | | October 31,
2008 | | October 31,
2007 | | October 31,
2006 | | October 31,
2005 | |
Net asset value | | | | | | | | | | | |
Beginning of year | | $ | 2.68 | | $ | 5.40 | | $ | 3.74 | | $ | 3.68 | | $ | 3.68 | |
| | | | | | | | | | | |
Investment operations | | | | | | | | | | | |
Net investment loss(a) | | (0.04 | ) | (0.07 | ) | (0.07 | ) | (0.06 | ) | (0.02 | ) |
Net realized and unrealized gain (loss) on investments | | 0.71 | | (2.47 | ) | 1.73 | | 0.18 | | 0.02 | |
Total from investment operations | | 0.67 | | (2.54 | ) | 1.66 | | 0.12 | | — | |
| | | | | | | | | | | |
Distributions | | | | | | | | | | | |
Net realized gains on investments | | — | | (0.18 | ) | — | | (0.06 | ) | — | |
Total distributions | | — | | (0.18 | ) | — | | (0.06 | ) | — | |
| | | | | | | | | | | |
Net asset value | | | | | | | | | | | |
End of year | | $ | 3.35 | | $ | 2.68 | | $ | 5.40 | | $ | 3.74 | | $ | 3.68 | |
| | | | | | | | | | | |
Total return(b) | | 25.00 | % | (48.56 | )% | 44.39 | % | 3.10 | % | — | %(e) |
| | | | | | | | | | | |
Net assets end of year | | $ | 1,588 | | $ | 2,094 | | $ | 4,913 | | $ | 4,208 | | $ | 5,316 | |
| | | | | | | | | | | |
Ratios and supplemental data | | | | | | | | | | | |
Expenses to average net assets | | | | | | | | | | | |
After reimbursement/fee waiver | | 2.18 | %(l) | 2.18 | % | 2.18 | % | 2.18 | % | 2.20 | % |
Before reimbursement/fee waiver | | 2.90 | %(l) | 2.53 | % | 2.53 | % | 2.57 | % | 2.68 | % |
Net investment loss, to average net assets (c) | | (1.60 | )% | (1.67 | )% | (1.67 | )% | (1.58 | )% | (0.58 | )% |
Portfolio turnover rate | | 57 | % | 47 | % | 66 | % | 94 | % | 73 | % |
For a share outstanding throughout each period
| | Transamerica Science & Technology | |
| | Class C | |
| | October 31,
2009 | | October 31,
2008 | | October 31,
2007 | | October 31,
2006 | | October 31,
2005 | |
Net asset value | | | | | | | | | | | |
Beginning of year | | $ | 2.68 | | $ | 5.39 | | $ | 3.73 | | $ | 3.67 | | $ | 3.67 | |
| | | | | | | | | | | |
Investment operations | | | | | | | | | | | |
Net investment loss(a) | | (0.05 | ) | (0.07 | ) | (0.07 | ) | (0.06 | ) | (0.02 | ) |
Net realized and unrealized gain (loss) on investments | | 0.72 | | (2.46 | ) | 1.73 | | 0.18 | | 0.02 | |
Total from investment operations | | 0.67 | | (2.53 | ) | 1.66 | | 0.12 | | — | |
| | | | | | | | | | | |
Distributions | | | | | | | | | | | |
Net realized gains on investments | | — | | (0.18 | ) | — | | (0.06 | ) | — | |
Total distributions | | — | | (0.18 | ) | — | | (0.06 | ) | — | |
| | | | | | | | | | | |
Net asset value | | | | | | | | | | | |
End of year | | $ | 3.35 | | $ | 2.68 | | $ | 5.39 | | $ | 3.73 | | $ | 3.67 | |
| | | | | | | | | | | |
Total return(b) | | 25.00 | % | (48.46 | )% | 44.50 | % | 3.11 | % | — | %(e) |
| | | | | | | | | | | |
Net assets end of year | | $ | 1,500 | | $ | 1,417 | | $ | 2,799 | | $ | 2,045 | | $ | 2,779 | |
| | | | | | | | | | | |
Ratios and supplemental data | | | | | | | | | | | |
Expenses to average net assets | | | | | | | | | | | |
After reimbursement/fee waiver | | 2.18 | %(l) | 2.18 | % | 2.18 | % | 2.18 | % | 2.20 | % |
Before reimbursement/fee waiver | | 2.55 | %(l) | 2.31 | % | 2.36 | % | 2.35 | % | 2.65 | % |
Net investment loss, to average net assets (c) | | (1.61 | )% | (1.67 | )% | (1.63 | )% | (1.57 | )% | (0.51 | )% |
Portfolio turnover rate | | 57 | % | 47 | % | 66 | % | 94 | % | 73 | % |
The notes to the financial statements are an integral part of this report.
98
For a share outstanding throughout each period
| | Transamerica Science & Technology | |
| | Class I | |
| | October 31,
2009 | | October 31,
2008 | | October 31,
2007 | | October 31,
2006(f) | |
Net asset value | | | | | | | | | |
Beginning of year | | $ | 2.89 | | $ | 5.74 | | $ | 3.93 | | $ | 3.98 | |
| | | | | | | | | |
Investment operations | | | | | | | | | |
Net investment income (loss)(a) | | (0.01 | ) | (0.02 | ) | (0.02 | ) | (0.01 | ) |
Net realized and unrealized gain (loss) on investments | | 0.78 | | (2.65 | ) | 1.83 | | 0.02 | |
Total from investment operations | | 0.77 | | (2.67 | ) | 1.81 | | 0.01 | |
| | | | | | | | | |
Distributions | | | | | | | | | |
Net investment income | | — | | — | | — | | — | |
Net realized gains on investments | | — | | (0.18 | ) | — | | (0.06 | ) |
Total distributions | | — | | (0.18 | ) | — | | (0.06 | ) |
| | | | | | | | | |
Net asset value | | | | | | | | | |
End of year | | $ | 3.66 | | $ | 2.89 | | $ | 5.74 | | $ | 3.93 | |
| | | | | | | | | |
Total return(b) | | 26.64 | % | (47.93 | )% | 46.06 | % | 0.12 | %(g) |
| | | | | | | | | |
Net assets end of year | | $ | 56,466 | | $ | 46,222 | | $ | 84,206 | | $ | 57,642 | |
| | | | | | | | | |
Ratios and supplemental data | | | | | | | | | |
Expenses to average net assets | | | | | | | | | |
After reimbursement/fee waiver | | 0.96 | %(l) | 0.91 | % | 0.92 | % | 0.92 | %(h) |
Before reimbursement/fee waiver | | 0.96 | %(l) | 0.91 | % | 0.92 | % | 0.92 | %(h) |
Net investment income (loss), to average net assets(c) | | (0.39 | )% | (0.41 | )% | (0.41 | )% | (0.35 | )%(h) |
Portfolio turnover rate | | 57 | % | 47 | % | 66 | % | 94 | %(g) |
For a share outstanding throughout each period
| | Transamerica Short-Term
Bond | | Transamerica Short-Term
Bond | |
| | Class A | | Class C | |
| | October 31,
2009 | | October 31,
2008(k) | | October 31,
2009 | | October 31,
2008(k) | |
Net asset value | | | | | | | | | |
Beginning of year | | $ | 9.44 | | $ | 10.00 | | $ | 9.42 | | $ | 10.00 | |
| | | | | | | | | |
Investment operations | | | | | | | | | |
Net investment income (loss)(a) | | 0.51 | | 0.38 | | 0.43 | | 0.32 | |
Net realized and unrealized gain (loss) on investments | | 0.78 | | (0.54 | ) | 0.80 | | (0.55 | ) |
Total from investment operations | | 1.29 | | (0.16 | ) | 1.23 | | (0.23 | ) |
| | | | | | | | | |
Distributions | | | | | | | | | |
Net investment income | | (0.47 | ) | (0.40 | ) | (0.41 | ) | (0.35 | ) |
Total distributions | | (0.47 | ) | (0.40 | ) | (0.41 | ) | (0.35 | ) |
| | | | | | | | | |
Net asset value | | | | | | | | | |
End of year | | $ | 10.26 | | $ | 9.44 | | $ | 10.24 | | $ | 9.42 | |
| | | | | | | | | |
Total return(b) | | 13.40 | % | (1.70 | )%(g) | 12.74 | % | (2.43 | )%(g) |
| | | | | | | | | |
Net assets end of year | | $ | 289,879 | | $ | 5,663 | | $ | 317,130 | | $ | 7,263 | |
| | | | | | | | | |
Ratios and supplemental data | | | | | | | | | |
Expenses to average net assets | | | | | | | | | |
After reimbursement/fee waiver | | 0.91 | % | 1.11 | %(h) | 1.65 | % | 1.76 | %(h) |
Before reimbursement/fee waiver | | 1.09 | % | 1.11 | %(h) | 1.74 | % | 1.76 | %(h) |
Net investment income (loss), to average net assets(c) | | 5.14 | % | 3.92 | %(h) | 4.38 | % | 3.28 | %(h) |
Portfolio turnover rate | | 77 | % | 67 | %(g) | 77 | % | 67 | %(g) |
The notes to the financial statements are an integral part of this report.
99
For a share outstanding throughout each period
| | Transamerica Short-Term Bond | |
| | Class I | |
| | October 31,
2009 | | October 31,
2008 | | October 31,
2007 | | October 31,
2006 | | October 31,
2005(j) | |
Net asset value | | | | | | | | | | | |
Beginning of year | | $ | 9.28 | | $ | 9.82 | | $ | 9.84 | | $ | 9.79 | | $ | 10.00 | |
| | | | | | | | | | | |
Investment operations | | | | | | | | | | | |
Net investment income(a) | | 0.50 | | 0.43 | | 0.47 | | 0.40 | | 0.28 | |
Net realized and unrealized gain (loss) on investments | | 0.80 | | (0.54 | ) | (0.04 | ) | 0.05 | | (0.22 | ) |
Total from investment operations | | 1.30 | | (0.11 | ) | 0.43 | | 0.45 | | 0.06 | |
| | | | | | | | | | | |
Distributions | | | | | | | | | | | |
Net investment income | | (0.50 | ) | (0.43 | ) | (0.45 | ) | (0.40 | ) | (0.27 | ) |
Total distributions | | (0.50 | ) | (0.43 | ) | (0.45 | ) | (0.40 | ) | (0.27 | ) |
| | | | | | | | | | | |
Net asset value | | | | | | | | | | | |
End of year | | $ | 10.08 | | $ | 9.28 | | $ | 9.82 | | $ | 9.84 | | $ | 9.79 | |
| | | | | | | | | | | |
Total return(b) | | 14.44 | % | (1.22 | )% | 4.45 | % | 4.72 | % | 0.49 | %(g) |
| | | | | | | | | | | |
Net assets end of year | | $ | 710,660 | | $ | 492,333 | | $ | 563,889 | | $ | 379,442 | | $ | 174,302 | |
| | | | | | | | | | | |
Ratios and supplemental data | | | | | | | | | | | |
Expenses to average net assets | | | | | | | | | | | |
After reimbursement/fee waiver | | 0.63 | % | 0.68 | % | 0.67 | % | 0.70 | % | 0.71 | %(h) |
Before reimbursement/fee waiver | | 0.69 | % | 0.68 | % | 0.67 | % | 0.70 | % | 0.71 | %(h) |
Net investment income, to average net assets(c) | | 5.14 | % | 4.38 | % | 4.81 | % | 4.10 | % | 2.92 | %(h) |
Portfolio turnover rate | | 77 | % | 67 | % | 117 | % | 100 | % | 153 | %(g) |
For a share outstanding throughout each period
| | Transamerica Small/Mid Cap Value | |
| | Class A | |
| | October 31,
2009 | | October 31,
2008 | | October 31,
2007 | | October 31,
2006 | | October 31,
2005 | |
Net asset value | | | | | | | | | | | |
Beginning of year | | $ | 12.70 | | $ | 23.78 | | $ | 17.78 | | $ | 16.69 | | $ | 14.32 | |
| | | | | | | | | | | |
Investment operations | | | | | | | | | | | |
Net investment income(a) | | — | (d) | 0.21 | | 0.14 | | 0.28 | | 0.03 | |
Net realized and unrealized gain (loss) on investments | | 2.33 | | (8.64 | ) | 6.30 | | 1.96 | | 2.85 | |
Total from investment operations | | 2.33 | | (8.43 | ) | 6.44 | | 2.24 | | 2.88 | |
| | | | | | | | | | | |
Distributions | | | | | | | | | | | |
Net investment income | | (0.31 | ) | (0.16 | ) | (0.13 | ) | (0.03 | ) | (0.09 | ) |
Net realized gains on investments | | — | | (2.49 | ) | (0.31 | ) | (1.12 | ) | (0.42 | ) |
Total distributions | | (0.31 | ) | (2.65 | ) | (0.44 | ) | (1.15 | ) | (0.51 | ) |
| | | | | | | | | | | |
Net asset value | | | | | | | | | | | |
End of year | | $ | 14.72 | | $ | 12.70 | | $ | 23.78 | | $ | 17.78 | | $ | 16.69 | |
| | | | | | | | | | | |
Total return(b) | | 19.12 | % | (39.47 | )% | 36.99 | % | 13.97 | % | 20.41 | % |
| | | | | | | | | | | |
Net assets end of year | | $ | 201,569 | | $ | 199,210 | | $ | 96,667 | | $ | 47,014 | | $ | 386,346 | |
| | | | | | | | | | | |
Ratios and supplemental data | | | | | | | | | | | |
Expenses to average net assets | | | | | | | | | | | |
After reimbursement/fee waiver | | 1.59 | % | 1.41 | % | 1.41 | % | 1.39 | % | 1.24 | % |
Before reimbursement/fee waiver | | 1.59 | % | 1.41 | % | 1.41 | % | 1.39 | % | 1.24 | % |
Net investment income, to average net assets (c) | | — | %(e) | 1.18 | % | 0.71 | % | 1.61 | % | 0.20 | % |
Portfolio turnover rate | | 101 | % | 48 | % | 22 | % | 21 | % | 42 | % |
The notes to the financial statements are an integral part of this report.
100
For a share outstanding throughout each period
| | Transamerica Small/Mid Cap Value | |
| | Class B | |
| | October 31,
2009 | | October 31,
2008 | | October 31,
2007 | | October 31,
2006 | | October 31,
2005 | |
Net asset value | | | | | | | | | | | |
Beginning of year | | $ | 12.19 | | $ | 22.89 | | $ | 17.12 | | $ | 16.21 | | $ | 13.97 | |
| | | | | | | | | | | |
Investment operations | | | | | | | | | | | |
Net investment income (loss)(a) | | (0.08 | ) | 0.06 | | 0.02 | | (0.01 | ) | (0.11 | ) |
Net realized and unrealized gain (loss) on investments | | 2.26 | | (8.27 | ) | 6.06 | | 2.07 | | 2.77 | |
Total from investment operations | | 2.18 | | (8.21 | ) | 6.08 | | 2.06 | | 2.66 | |
| | | | | | | | | | | |
Distributions | | | | | | | | | | | |
Net investment income | | (0.21 | ) | — | | — | | (0.03 | ) | — | |
Net realized gains on investments | | — | | (2.49 | ) | (0.31 | ) | (1.12 | ) | (0.42 | ) |
Total distributions | | (0.21 | ) | (2.49 | ) | (0.31 | ) | (1.15 | ) | (0.42 | ) |
| | | | | | | | | | | |
Net asset value | | | | | | | | | | | |
End of year | | $ | 14.16 | | $ | 12.19 | | $ | 22.89 | | $ | 17.12 | | $ | 16.21 | |
| | | | | | | | | | | |
Total return(b) | | 18.37 | % | (39.85 | )% | 36.09 | % | 13.21 | % | 19.30 | % |
| | | | | | | | | | | |
Net assets end of year | | $ | 34,573 | | $ | 31,716 | | $ | 53,285 | | $ | 47,007 | | $ | 46,410 | |
| | | | | | | | | | | |
Ratios and supplemental data | | | | | | | | | | | |
Expenses to average net assets | | | | | | | | | | | |
After reimbursement/fee waiver | | 2.24 | % | 2.07 | % | 2.07 | % | 2.10 | % | 2.14 | % |
Before reimbursement/fee waiver | | 2.24 | % | 2.07 | % | 2.07 | % | 2.10 | % | 2.14 | % |
Net investment income (loss), to average net assets(c) | | (0.66 | )% | 0.34 | % | 0.12 | % | (0.06 | )% | (0.70 | )% |
Portfolio turnover rate | | 101 | % | 48 | % | 22 | % | 21 | % | 42 | % |
For a share outstanding throughout each period
| | Transamerica Small/Mid Cap Value | |
| | Class C | |
| | October 31,
2009 | | October 31,
2008 | | October 31,
2007 | | October 31,
2006 | | October 31,
2005 | |
Net asset value | | | | | | | | | | | |
Beginning of year | | $ | 12.10 | | $ | 22.81 | | $ | 17.09 | | $ | 16.18 | | $ | 13.96 | |
| | | | | | | | | | | |
Investment operations | | | | | | | | | | | |
Net investment income (loss)(a) | | (0.08 | ) | 0.09 | | 0.02 | | — | (d) | (0.12 | ) |
Net realized and unrealized gain (loss) on investments | | 2.23 | | (8.24 | ) | 6.05 | | 2.06 | | 2.77 | |
Total from investment operations | | 2.15 | | (8.15 | ) | 6.07 | | 2.06 | | 2.65 | |
| | | | | | | | | | | |
Distributions | | | | | | | | | | | |
Net investment income | | (0.25 | ) | (0.07 | ) | (0.04 | ) | (0.03 | ) | (0.01 | ) |
Net realized gains on investments | | — | | (2.49 | ) | (0.31 | ) | (1.12 | ) | (0.42 | ) |
Total distributions | | (0.25 | ) | (2.56 | ) | (0.35 | ) | (1.15 | ) | (0.43 | ) |
| | | | | | | | | | | |
Net asset value | | | | | | | | | | | |
End of year | | $ | 14.00 | | $ | 12.10 | | $ | 22.81 | | $ | 17.09 | | $ | 16.18 | |
| | | | | | | | | | | |
Total return(b) | | 18.42 | % | (39.84 | )% | 36.16 | % | 13.23 | % | 19.22 | % |
| | | | | | | | | | | |
Net assets end of year | | $ | 115,960 | | $ | 95,729 | | $ | 63,856 | | $ | 29,105 | | $ | 21,532 | |
| | | | | | | | | | | |
Ratios and supplemental data | | | | | | | | | | | |
Expenses to average net assets | | | | | | | | | | | |
After reimbursement/fee waiver | | 2.20 | % | 2.04 | % | 2.04 | % | 2.08 | % | 2.20 | % |
Before reimbursement/fee waiver | | 2.20 | % | 2.04 | % | 2.04 | % | 2.08 | % | 2.20 | % |
Net investment income (loss), to average net assets (c) | | (0.63 | )% | 0.52 | % | 0.10 | % | (0.03 | )% | (0.76 | )% |
Portfolio turnover rate | | 101 | % | 48 | % | 22 | % | 21 | % | 42 | % |
The notes to the financial statements are an integral part of this report.
101
For a share outstanding throughout each period
| | Transamerica Small/Mid Cap Value | | | |
| | Class I | | | |
| | October 31,
2009 | | October 31,
2008 | | October 31,
2007 | | October 31,
2006(f) | | | |
Net asset value | | | | | | | | | | | |
Beginning of year | | $ | 12.81 | | $ | 23.91 | | $ | 17.87 | | $ | 16.84 | | | |
| | | | | | | | | | | |
Investment operations | | | | | | | | | | | |
Net investment income(a) | | 0.11 | | 0.30 | | 0.26 | | 0.18 | | | |
Net realized and unrealized gain (loss) on investments | | 2.31 | | (8.67 | ) | 6.32 | | 1.97 | | | |
Total from investment operations | | 2.42 | | (8.37 | ) | 6.58 | | 2.15 | | | |
| | | | | | | | | | | |
Distributions | | | | | | | | | | | |
Net investment income | | (0.41 | ) | (0.24 | ) | (0.23 | ) | — | | | |
Net realized gains on investments | | — | | (2.49 | ) | (0.31 | ) | (1.12 | ) | | |
Total distributions | | (0.41 | ) | (2.73 | ) | (0.54 | ) | (1.12 | ) | | |
| | | | | | | | | | | |
Net asset value | | | | | | | | | | | |
End of year | | $ | 14.82 | | $ | 12.81 | | $ | 23.91 | | $ | 17.87 | | | |
| | | | | | | | | | | |
Total return(b) | | 19.85 | % | (39.11 | )% | 37.78 | % | 13.30 | %(g) | | |
| | | | | | | | | | | |
Net assets end of year | | $ | 10,746 | | $ | 214,351 | | $ | 487,605 | | $ | 478,728 | | | |
| | | | | | | | | | | |
Ratios and supplemental data | | | | | | | | | | | |
Expenses to average net assets | | | | | | | | | | | |
After reimbursement/fee waiver | | 0.91 | % | 0.85 | % | 0.85 | % | 0.86 | %(h) | | |
Before reimbursement/fee waiver | | 0.91 | % | 0.85 | % | 0.85 | % | 0.86 | %(h) | | |
Net investment income, to average net assets(c) | | 0.89 | % | 1.58 | % | 1.30 | % | 1.05 | %(h) | | |
Portfolio turnover rate | | 101 | % | 48 | % | 22 | % | 21 | %(g) | | |
For a share outstanding throughout each period
| | Transamerica Templeton Global | |
| | Class A | |
| | October 31,
2009 | | October 31,
2008 | | October 31,
2007 | | October 31,
2006 | | October 31,
2005 | |
Net asset value | | | | | | | | | | | |
Beginning of year | | $ | 19.63 | | $ | 35.83 | | $ | 29.28 | | $ | 24.68 | | $ | 22.57 | |
| | | | | | | | | | | |
Investment operations | | | | | | | | | | | |
Net investment income(a) | | 0.21 | | 0.33 | | 0.19 | | 0.15 | | 0.21 | |
Net realized and unrealized gain (loss) on investments | | 3.53 | | (16.19 | ) | 6.70 | | 4.45 | | 2.14 | |
Total from investment operations | | 3.74 | | (15.86 | ) | 6.89 | | 4.60 | | 2.35 | |
| | | | | | | | | | | |
Distributions | | | | | | | | | | | |
Net investment income | | (0.18 | ) | (0.34 | ) | (0.34 | ) | — | (d) | (0.24 | ) |
Total distributions | | (0.18 | ) | (0.34 | ) | (0.34 | ) | — | (d) | (0.24 | ) |
| | | | | | | | | | | |
Net asset value | | | | | | | | | | | |
End of year | | $ | 23.19 | | $ | 19.63 | | $ | 35.83 | | $ | 29.28 | | $ | 24.68 | |
| | | | | | | | | | | |
Total return(b) | | 19.24 | % | (44.68 | )% | 23.74 | % | 18.65 | % | 10.41 | % |
| | | | | | | | | | | |
Net assets end of year | | $ | 78,387 | | $ | 73,721 | | $ | 118,738 | | $ | 117,367 | | $ | 385,504 | |
| | | | | | | | | | | |
Ratios and supplemental data | | | | | | | | | | | |
Expenses to average net assets | | | | | | | | | | | |
After reimbursement/fee waiver | | 1.55 | %(l) | 1.55 | % | 1.55 | % | 1.55 | % | 1.42 | % |
Before reimbursement/fee waiver | | 2.10 | %(l) | 1.61 | % | 1.63 | % | 1.62 | % | 1.42 | % |
Net investment income, to average net assets(c) | | 1.04 | % | 1.13 | % | 0.59 | % | 0.55 | % | 0.85 | % |
Portfolio turnover rate | | 25 | % | 28 | % | 30 | % | 55 | % | 79 | % |
The notes to the financial statements are an integral part of this report.
102
For a share outstanding throughout each period
| | Transamerica Templeton Global | |
| | Class B | |
| | October 31, 2009 | | October 31, 2008 | | October 31, 2007 | | October 31, 2006 | | October 31, 2005 | |
| | | | | | | | | | | |
Net asset value | | | | | | | | | | | |
Beginning of year | | $ | 18.41 | | $ | 33.52 | | $ | 27.40 | | $ | 23.24 | | $ | 21.23 | |
| | | | | | | | | | | |
Investment operations | | | | | | | | | | | |
Net investment income (loss)(a) | | 0.08 | | 0.08 | | (0.02 | ) | (0.01 | ) | 0.02 | |
Net realized and unrealized gain (loss) on investments | | 3.35 | | (15.14 | ) | 6.28 | | 4.17 | | 1.99 | |
Total from investment operations | | 3.43 | | (15.06 | ) | 6.26 | | 4.16 | | 2.01 | |
| | | | | | | | | | | |
Distributions | | | | | | | | | | | |
Net investment income | | — | | (0.05 | ) | (0.14 | ) | — | | — | (d) |
Total distributions | | — | | (0.05 | ) | (0.14 | ) | — | | — | (d) |
| | | | | | | | | | | |
Net asset value | | | | | | | | | | | |
End of year | | $ | 21.84 | | $ | 18.41 | | $ | 33.52 | | $ | 27.40 | | $ | 23.24 | |
| | | | | | | | | | | |
Total return(b) | | 18.63 | % | (44.99 | )% | 22.94 | % | 17.90 | % | 9.48 | % |
| | | | | | | | | | | |
Net assets end of year | | $ | 8,388 | | $ | 10,746 | | $ | 63,876 | | $ | 75,711 | | $ | 90,877 | |
| | | | | | | | | | | |
Ratios and supplemental data | | | | | | | | | | | |
Expenses to average net assets | | | | | | | | | | | |
After reimbursement/fee waiver | | 2.20 | %(l) | 2.20 | % | 2.20 | % | 2.20 | % | 2.20 | % |
Before reimbursement/fee waiver | | 2.99 | %(l) | 2.44 | % | 2.39 | % | 2.42 | % | 2.41 | % |
Net investment income (loss), to average net assets(c) | | 0.43 | % | 0.29 | % | (0.07 | )% | (0.05 | )% | 0.07 | % |
Portfolio turnover rate | | 25 | % | 28 | % | 30 | % | 55 | % | 79 | % |
| | | | | | | | | | | |
For a share outstanding throughout each period | |
| | | |
| | Transamerica Templeton Global | |
| | Class C | |
| | October 31, 2009 | | October 31, 2008 | | October 31, 2007 | | October 31, 2006 | | October 31, 2005 | |
| | | | | | | | | | | |
Net asset value | | | | | | | | | | | |
Beginning of year | | $ | 18.27 | | $ | 33.47 | | $ | 27.37 | | $ | 23.21 | | $ | 21.21 | |
| | | | | | | | | | | |
Investment operations | | | | | | | | | | | |
Net investment income (loss)(a) | | 0.07 | | 0.12 | | (0.02 | ) | (0.01 | ) | 0.02 | |
Net realized and unrealized gain (loss) on investments | | 3.28 | | (15.10 | ) | 6.27 | | 4.17 | | 1.99 | |
Total from investment operations | | 3.35 | | (14.98 | ) | 6.25 | | 4.16 | | 2.01 | |
| | | | | | | | | | | |
Distributions | | | | | | | | | | | |
Net investment income | | — | | (0.22 | ) | (0.15 | ) | — | | (0.01 | ) |
Total distributions | | — | | (0.22 | ) | (0.15 | ) | — | | (0.01 | ) |
| | | | | | | | | | | |
Net asset value | | | | | | | | | | | |
End of year | | $ | 21.62 | | $ | 18.27 | | $ | 33.47 | | $ | 27.37 | | $ | 23.21 | |
| | | | | | | | | | | |
Total return(b) | | 18.34 | % | (45.05 | )% | 22.95 | % | 17.87 | % | 9.52 | % |
| | | | | | | | | | | |
Net assets end of year | | $ | 14,263 | | $ | 14,286 | | $ | 31,506 | | $ | 32,341 | | $ | 36,938 | |
| | | | | | | | | | | |
Ratios and supplemental data | | | | | | | | | | | |
Expenses to average net assets | | | | | | | | | | | |
After reimbursement/fee waiver | | 2.20 | %(l) | 2.20 | % | 2.20 | % | 2.20 | % | 2.20 | % |
Before reimbursement/fee waiver | | 2.70 | %(l) | 2.26 | % | 2.31 | % | 2.35 | % | 2.38 | % |
Net investment income (loss), to average net assets(c) | | 0.39 | % | 0.43 | % | (0.07 | )% | (0.05 | )% | 0.07 | % |
Portfolio turnover rate | | 25 | % | 28 | % | 30 | % | 55 | % | 79 | % |
The notes to the financial statements are an integral part of this report.
103
For a share outstanding throughout each period
| | Transamerica Value Balanced | |
| | Class A | |
| | October 31, 2009 | | October 31, 2008 | | October 31, 2007 | | October 31, 2006 | | October 31, 2005 | |
| | | | | | | | | | | |
Net asset value | | | | | | | | | | | |
Beginning of year | | $ | 8.91 | | $ | 14.38 | | $ | 13.30 | | $ | 11.95 | | $ | 12.11 | |
| | | | | | | | | | | |
Investment operations | | | | | | | | | | | |
Net investment income(a) | | 0.22 | | 0.30 | | 0.28 | | 0.23 | | 0.24 | |
Net realized and unrealized gain (loss) on investments | | 0.82 | | (4.74 | ) | 1.41 | | 1.54 | | 0.69 | |
Total from investment operations | | 1.04 | | (4.44 | ) | 1.69 | | 1.77 | | 0.93 | |
| | | | | | | | | | | |
Distributions | | | | | | | | | | | |
Net investment income | | (0.22 | ) | (0.31 | ) | (0.23 | ) | (0.24 | ) | (0.25 | ) |
Net realized gains on investments | | — | | (0.72 | ) | (0.38 | ) | (0.18 | ) | (0.84 | ) |
Total distributions | | (0.22 | ) | (1.03 | ) | (0.61 | ) | (0.42 | ) | (1.09 | ) |
| | | | | | | | | | | |
Net asset value | | | | | | | | | | | |
End of year | | $ | 9.73 | | $ | 8.91 | | $ | 14.38 | | $ | 13.30 | | $ | 11.95 | |
| | | | | | | | | | | |
Total return(b) | | 12.10 | % | (32.94 | )% | 13.11 | % | 15.09 | % | 7.79 | % |
| | | | | | | | | | | |
Net assets end of year | | $ | 18,280 | | $ | 18,666 | | $ | 32,485 | | $ | 32,666 | | $ | 32,934 | |
| | | | | | | | | | | |
Ratios and supplemental data | | | | | | | | | | | |
Expenses to average net assets | | | | | | | | | | | |
After reimbursement/fee waiver | | 1.67 | %(o) | 1.55 | % | 1.55 | % | 1.55 | % | 1.55 | % |
Before reimbursement/fee waiver | | 2.07 | %(o) | 1.56 | % | 1.58 | % | 1.63 | % | 1.59 | % |
Net investment income, to average net assets(c) | | 2.46 | % | 2.51 | % | 2.06 | % | 1.84 | % | 2.03 | % |
Portfolio turnover rate | | 107 | % | 50 | % | 42 | % | 42 | % | 57 | % |
| | | | | | | | | | | |
For a share outstanding throughout each period |
| | | |
| | Transamerica Value Balanced | |
| | Class B | |
| | October 31, 2009 | | October 31, 2008 | | October 31, 2007 | | October 31, 2006 | | October 31, 2005 | |
| | | | | | | | | | | |
Net asset value | | | | | | | | | | | |
Beginning of year | | $ | 8.88 | | $ | 14.32 | | $ | 13.25 | | $ | 11.91 | | $ | 12.07 | |
| | | | | | | | | | | |
Investment operations | | | | | | | | | | | |
Net investment income(a) | | 0.16 | | 0.22 | | 0.19 | | 0.15 | | 0.17 | |
Net realized and unrealized gain (loss) on investments | | 0.82 | | (4.72 | ) | 1.41 | | 1.53 | | 0.68 | |
Total from investment operations | | 0.98 | | (4.50 | ) | 1.60 | | 1.68 | | 0.85 | |
| | | | | | | | | | | |
Distributions | | | | | | | | | | | |
Net investment income | | (0.16 | ) | (0.22 | ) | (0.15 | ) | (0.16 | ) | (0.17 | ) |
Net realized gains on investments | | — | | (0.72 | ) | (0.38 | ) | (0.18 | ) | (0.84 | ) |
Total distributions | | (0.16 | ) | (0.94 | ) | (0.53 | ) | (0.34 | ) | (1.01 | ) |
| | | | | | | | | | | |
Net asset value | | | | | | | | | | | |
End of year | | $ | 9.70 | | $ | 8.88 | | $ | 14.32 | | $ | 13.25 | | $ | 11.91 | |
| | | | | | | | | | | |
Total return(b) | | 11.38 | % | (33.37 | )% | 12.40 | % | 14.28 | % | 7.13 | % |
| | | | | | | | | | | |
Net assets end of year | | $ | 3,817 | | $ | 6,414 | | $ | 17,508 | | $ | 20,405 | | $ | 24,072 | |
| | | | | | | | | | | |
Ratios and supplemental data | | | | | | | | | | | |
Expenses to average net assets | | | | | | | | | | | |
After reimbursement/fee waiver | | 2.32 | %(o) | 2.20 | % | 2.20 | % | 2.20 | % | 2.20 | % |
Before reimbursement/fee waiver | | 2.89 | %(o) | 2.30 | % | 2.27 | % | 2.28 | % | 2.27 | % |
Net investment income, to average net assets(c) | | 1.89 | % | 1.83 | % | 1.43 | % | 1.20 | % | 1.39 | % |
Portfolio turnover rate | | 107 | % | 50 | % | 42 | % | 42 | % | 57 | % |
The notes to the financial statements are an integral part of this report.
104
For a share outstanding throughout each period
| | Transamerica Value Balanced | |
| | Class C | |
| | October 31, 2009 | | October 31, 2008 | | October 31, 2007 | | October 31, 2006 | | October 31, 2005 | |
| | | | | | | | | | | |
Net asset value | | | | | | | | | | | |
Beginning of year | | $ | 8.87 | | $ | 14.31 | | $ | 13.25 | | $ | 11.91 | | $ | 12.07 | |
| | | | | | | | | | | |
Investment operations | | | | | | | | | | | |
Net investment income(a) | | 0.16 | | 0.22 | | 0.19 | | 0.15 | | 0.17 | |
Net realized and unrealized gain (loss) on investments | | 0.83 | | (4.72 | ) | 1.41 | | 1.53 | | 0.69 | |
Total from investment operations | | 0.99 | | (4.50 | ) | 1.60 | | 1.68 | | 0.86 | |
| | | | | | | | | | | |
Distributions | | | | | | | | | | | |
Net investment income | | (0.17 | ) | (0.22 | ) | (0.16 | ) | (0.16 | ) | (0.18 | ) |
Net realized gains on investments | | — | | (0.72 | ) | (0.38 | ) | (0.18 | ) | (0.84 | ) |
Total distributions | | (0.17 | ) | (0.94 | ) | (0.54 | ) | (0.34 | ) | (1.02 | ) |
| | | | | | | | | | | |
Net asset value | | | | | | | | | | | |
End of year | | $ | 9.69 | | $ | 8.87 | | $ | 14.31 | | $ | 13.25 | | $ | 11.91 | |
| | | | | | | | | | | |
Total return(b) | | 11.43 | % | (33.33 | )% | 12.40 | % | 14.33 | % | 7.18 | % |
| | | | | | | | | | | |
Net assets end of year | | $ | 5,248 | | $ | 5,833 | | $ | 11,674 | | $ | 11,316 | | $ | 11,926 | |
| | | | | | | | | | | |
Ratios and supplemental data | | | | | | | | | | | |
Expenses to average net assets | | | | | | | | | | | |
After reimbursement/fee waiver | | 2.32 | %(o) | 2.13 | % | 2.17 | % | 2.20 | % | 2.16 | % |
Before reimbursement/fee waiver | | 2.58 | %(o) | 2.13 | % | 2.17 | % | 2.20 | % | 2.16 | % |
Net investment income, to average net assets(c) | | 1.83 | % | 1.92 | % | 1.44 | % | 1.19 | % | 1.43 | % |
Portfolio turnover rate | | 107 | % | 50 | % | 42 | % | 42 | % | 57 | % |
(a) | Calculated based on average number of shares outstanding. |
(b) | Total return has been calculated for the applicable period without deduction of a sales load, if any, on an initial purchase. |
(c) | Includes redemption fees, if any. The impact of redemption fees is less than 0.01% for Class A, Class B, Class C, and Class I, respectively. |
(d) | Rounds to less than $(0.01) or $0.01. |
(e) | Rounds to less than (0.01%) or 0.01%. |
(f) | Commenced operations November 15, 2005. |
(g) | Not annualized. |
(h) | Annualized. |
(i) | Commenced operations October 27, 2006. |
(j) | Commenced operations November 8, 2004. |
(k) | Commenced operations November 1, 2007. |
(l) | Includes non recurring reorganization expenses. The impact of the expenses are less than 0.01% for each class. |
(m) | Includes non recurring reorganization expenses. The impact of the expenses are 0.02% for each class. |
(n) | Includes non recurring reorganization expenses. The impact of the expenses are 0.03% for each class. |
(o) | Includes non recurring reorganization expenses. The impact of the expenses are 0.12% for each class. |
105
NOTES TO FINANCIAL STATEMENTS
At October 31, 2009
(all amounts in thousands)
NOTE 1. ORGANIZATION AND SIGNIFICANT ACCOUNTING POLICIES
Transamerica Funds (the “Trust”) is an open-end management investment company registered under the Investment Company Act of 1940, as amended (the “1940 Act”). Transamerica Balanced, Transamerica Convertible Securities, Transamerica Equity, Transamerica Flexible Income, Transamerica Growth Opportunities, Transamerica High Yield Bond, Transamerica Legg Mason Partners All Cap, Transamerica Money Market, Transamerica Science & Technology, Transamerica Short-Term Bond, Transamerica Small/Mid Cap Value, Transamerica Templeton Global and Transamerica Value Balanced (each, a “Fund”; collectively, the “Funds”) are part of Transamerica Funds.
The Funds, except Transamerica Balanced, Transamerica Equity, Transamerica Legg Mason Partners All Cap, Transamerica Short-Term Bond, Transamerica Templeton Global and Transamerica Value Balanced, currently have four classes of shares; Class A, Class B, Class C, and Class I. Transamerica Balanced, Transamerica Legg Mason Partners All Cap, Transamerica Templeton Global, and Transamerica Value Balanced currently have three classes of shares; Class A, Class B, and Class C. Transamerica Equity currently has five classes of shares; Class A, Class B, Class C, Class I, and Class T. Transamerica Short-Term Bond currently has three classes of shares: Class A, Class C, and Class I. Class T shares are not available to new investors. Each of the above classes has a public offering price that reflects different sales charges, if any, and expense levels. Class I shares are currently available for investment primarily to certain affiliated asset allocation funds.
Class I shares may also be made available to other investors, including institutional investors and eligible retirement plans whose record keepers or financial service firm intermediaries have entered into agreements with Transamerica Funds or its agents. Class B shares will convert to Class A shares eight years after purchase.
Transamerica Legg Mason Partners All Cap and Transamerica Science & Technology are “non-diversified” under the 1940 Act.
This report should be read in conjunction with the Funds’ current prospectus, which contains more complete information about the Funds, including investment objectives and strategies.
In the normal course of business, the Funds enter into contracts that contain a variety of representations that provide general indemnifications. The Funds’ maximum exposure under these arrangements is unknown, as this would involve future claims that may be made against the Funds and/or their affiliates that have not yet occurred. However, based on experience, the Funds expect the risk of loss to be remote.
In preparing the Funds’ financial statements in accordance with accounting principles generally accepted in the United States of America (“GAAP”), estimates or assumptions (which could differ from actual results) may be used that affect reported amounts and disclosures. The following is a summary of significant accounting policies followed by the Funds.
Repurchase agreements: Securities purchased subject to repurchase agreements are held at the Funds’ custodian and, pursuant to the terms of the repurchase agreements, must have an aggregate market value greater than or equal to 100% of the resale price. The Funds will bear the risk of value fluctuations until the securities can be sold and may encounter delays and incur costs in liquidating the securities. In the event of bankruptcy or insolvency of the seller, delays and costs may be incurred.
Foreign currency denominated investments: The accounting records of the Funds are maintained in U.S. dollars. Securities and other assets and liabilities denominated in foreign currencies are translated into U.S. dollars at the closing exchange rate each day. Income, expenses, purchases and sales of investment securities denominated in foreign currencies are translated at prevailing exchange rates on the respective dates of such transactions. Each Fund combines fluctuations from currency exchange rates and fluctuations in value when computing net realized and unrealized gains or losses from investments.
Net foreign currency gains and losses resulting from changes in exchange rates include: 1) foreign currency fluctuations between trade date and settlement date of investment security transactions; 2) gains and losses on forward foreign currency contracts; and 3) the difference between the receivable amounts of interest and dividends recorded in the accounting records in U.S. dollars and the amounts actually received.
Foreign currency denominated assets may involve risks not typically associated with domestic transactions. These risks include revaluation of currencies, adverse fluctuations in foreign currency values and possible adverse political, social and economic developments, including those particular to a specific industry, country or region.
Forward foreign currency contracts: The Funds are subject to foreign currency exchange rate risk exposure in the normal course of pursuing their investment objectives. The Funds that enter into forward foreign currency contracts are using the contracts to hedge against exchange rate risk arising from investments in securities denominated in foreign currencies. Forward foreign currency contracts are marked to market daily, with the change in value recorded as an unrealized gain or loss. When the contracts are settled, a realized gain or loss is incurred. Risks arise from changes in market value of the underlying currencies and from the possible inability of counterparties to meet the terms of their contracts.
Open forward foreign currency contracts at October 31, 2009 are listed in the Schedules of Investments.
106
NOTES TO FINANCIAL STATEMENTS (continued)
At October 31, 2009
(all amounts in thousands)
NOTE 1. (continued)
Option contracts: The Funds are subject to equity price risk, interest rate risk, and foreign currency exchange rate risk in the normal course of pursuing their investment objectives. The Funds enter into option contracts to manage exposure to various market fluctuations. The primary risks associated with options are an imperfect correlation between the change in value of the securities held and the prices of the option contracts; the possibility of an illiquid market and an inability of the counterparty to meet the contract terms. The Funds may write call and put options on futures, swaps (“swaptions”), securities or currencies they own or in which they may invest. When a Fund writes a covered call or put option/swaption, an amount equal to the premium received by a Fund is included in the Fund’s Statement of Assets and Liabilities as an asset and as an equivalent liability. Premiums received from writing options/swaptions which expire are treated as realized gains. Premiums received from writing options/swaptions which are exercised or closed are added to the proceeds or offset against amounts paid on the underlying future, swap, security or currency transaction to determine the realized gain or loss. Options are marked-to-market daily to reflect the current value of the option/swaption written.
At October 31, 2009, the Funds did not hold any open option or swaption contracts.
Futures contracts: The Funds are subject to equity price risk, interest rate risk, and foreign currency exchange rate risk in the normal course of pursuing their investment objectives. Certain Funds use futures contracts to gain exposure to, or hedge against changes in the value of equities, interest rates or foreign currencies. A futures contract represents a commitment for the future purchase or sale of an asset at a specified price on a specified date. Upon entering into such contracts, the Funds are required to deposit with the broker either in cash or securities an initial margin in an amount equal to a certain percentage of the contract amount.
Subsequent payments (variation margin) are paid or received by the Funds each day, depending on the daily fluctuations in the value of the contracts, and are recorded for financial statement purposes as unrealized gains or losses by the Funds. Upon entering into such contracts, the Funds bear the risk of interest or exchange rates or securities prices moving unexpectedly, in which case, the Funds may not achieve the anticipated benefits of the futures contracts and may realize losses. With futures, there is minimal counterparty credit risk to the Funds since futures are exchange traded and the exchange’s clearinghouse, as counterparty to all exchange - traded futures, guarantees the futures against default.
The underlying face amounts of open futures contracts at October 31, 2009 are listed in the Schedules of Investments. The variation margin receivable or payable, as applicable, is included in the Statements of Assets and Liabilities.
Restricted and illiquid securities: Restricted and illiquid securities are subject to legal or contractual restrictions on resale or are illiquid. Restricted securities generally may be resold in transactions exempt from registration. A security may be considered illiquid if it lacks a readily available market or if its valuation has not changed for a certain period of time. Disposal of these securities may involve time-consuming negotiations and expense, and prompt sale at the current valuation may be difficult.
The restricted and illiquid securities at October 31, 2009 are listed in the Schedules of Investments.
Multiple class operations, income and expenses: Income, non-class specific expenses and realized and unrealized gains and losses are allocated daily to each class, based upon the value of shares outstanding method as permitted under Rule 18f-3 of the 1940 Act. Each class bears its own specific expenses as well as a portion of general, common expenses.
Securities lending: Securities are lent to qualified financial institutions and brokers. The lending of Funds’ securities exposes the Funds to risks such as the following: (i) the borrowers may fail to return the loaned securities; (ii) the borrowers may not be able to provide additional collateral; (iii) the Funds may experience delays in recovery of the loaned securities or delays in access to collateral; or (iv) the Funds may experience losses related to the investment collateral. To minimize certain risks, loan counterparties pledge cash collateral equal to at least the market value of the securities loaned. Cash collateral received is invested in the State Street Navigator Securities Lending Trust-Prime Portfolio, a money market mutual fund registered under the 1940 Act. By lending such securities, the Funds attempt to increase their net investment income through the receipt of interest (after rebates and fees).
Such income is reflected separately on the Statements of Operations. The value of loaned securities and related collateral outstanding at October 31, 2009 are shown in the Schedules of Investments and Statements of Assets and Liabilities.
Income from loaned securities on the Statements of Operations is net of fees earned by the lending agent for its services.
Cash overdraft: Throughout the year, the Funds may have cash overdraft balances. A fee is incurred on these overdrafts at a rate based on the federal funds rate.
107
NOTES TO FINANCIAL STATEMENTS (continued)
At October 31, 2009
(all amounts in thousands)
NOTE 1. (continued)
Commission recapture: The sub-advisers of certain Funds, to the extent consistent with the best execution and usual commission rate policies and practices, have elected to place security transactions of the Funds with broker/dealers with which Transamerica Funds has established a Commission Recapture Program. A Commission Recapture Program is any arrangement under which a broker/dealer applies a portion of the commissions received by such broker/dealer on the security transactions to the Funds. In no event will commissions paid by the Funds be used to pay expenses that would otherwise be borne by any other funds within Transamerica Funds, or by any other party.
Recaptured commissions for the year ended October 31, 2009, are included in net realized gain (loss) in the Statements of Operations and are summarized as follows:
Fund | | Commissions | |
Transamerica Balanced | | $ | 5 | |
Transamerica Equity | | 114 | |
Transamerica Growth Opportunities | | 27 | |
Transamerica Legg Mason Partners All Cap | | 9 | |
Transamerica Science & Technology | | 5 | |
Transamerica Small/Mid Cap Value | | 77 | |
Transamerica Templeton Global | | 5 | |
Transamerica Value Balanced | | 1 | |
| | | | |
Security transactions and investment income: Security transactions are recorded on the trade date. Security gains and losses are calculated on the specific identification basis. Dividend income, if any, is recorded on the ex-dividend date or, in the case of foreign securities, as soon as the Funds are informed of the ex-dividend date. Interest income, including accretion of discounts and amortization of premiums, is recorded on the accrual basis commencing on the settlement date.
Dividend income related to Real Estate Investment Trusts (“REIT”), is recorded at management’s estimate of the income included in distributions from the REIT investments. Distributions received in excess of the estimated amount are recorded as a reduction of the cost of investments. The actual amounts of income, return of capital and capital gains are only determined by each REIT after the fiscal year-end and may differ from the estimated amounts.
Dividend distributions: Distributions to shareholders are recorded on the ex-dividend date and are determined in accordance with federal income tax regulations which may differ from GAAP.
Foreign taxes: The Funds may be subject to foreign taxes on income, gains on investments or currency repatriation, a portion of which may be recoverable. The Funds will accrue such taxes and recoveries as applicable, based upon the current interpretation of tax rules and regulations that exist in the markets in which the Funds invest.
Redemption fees: A short-term trading redemption fee may be assessed on any sales of Fund shares in a fund account during the first five (5) NYSE trading days following their purchase date. This redemption fee will equal 2% of the amount redeemed and shares held the longest will be treated as being redeemed first and shares held the shortest as being redeemed last. For the year ended October 31, 2009, the Funds received redemption fees which are disclosed in the Funds’ Statements of Changes in Net Assets. Effective March 1, 2009, the Funds no longer charge redemption fees.
Temporary guarantee program: Transamerica Money Market was enrolled in the U.S. Department of the Treasury’s “Treasury” Temporary Guarantee Program for Money Market Funds (the “Program”) through September 18, 2009. Under the Program, the Treasury guaranteed the $1.00 dollar per share value of fund shares as of September 19, 2008.
These Program expenses were borne by Transamerica Money Market without regard to any expense limitation agreement in effect.
NOTE 2. SECURITY VALUATIONS
All investments in securities are recorded at their estimated fair value. The Funds value their investments at the close of the New York Stock Exchange (“NYSE”), normally 4 p.m. ET, each day the NYSE is open for business. The Funds utilize various methods to measure the fair value of their investments on a recurring basis. GAAP establishes a hierarchy that prioritizes inputs to valuation methods. The three Levels of inputs are:
Level 1—Unadjusted quoted prices in active markets for identical securities.
Level 2—Inputs, other than quoted prices included in Level 1, that are observable, either directly or indirectly. These inputs may include quoted prices for the identical instrument on an inactive market, prices for similar instruments, interest rates, prepayment speeds, credit risk, yield curves, default rates and similar data.
Level 3—Unobservable inputs, to the extent that relevant observable inputs are not available, representing the Funds’ own assumptions about the assumptions a market participant would use in valuing the investment, based on the best information available.
108
NOTES TO FINANCIAL STATEMENTS (continued)
At October 31, 2009
(all amounts in thousands)
NOTE 2. (continued)
The availability of observable inputs can vary from security to security and is affected by a wide variety of factors, including, but not limited to, the type of security, whether the security is new and not yet established in the marketplace, the liquidity of markets, and other characteristics particular to the security. To the extent that valuation is based on models or inputs that are less observable or unobservable in the market, the determination of fair value requires more judgment. Accordingly, the degree of judgment exercised in determining fair value is generally greatest for instruments categorized in Level 3.
The inputs used to measure fair value may fall into different Levels of the fair value hierarchy. In such cases, for disclosure purposes, the Level in the fair value hierarchy that is assigned to the fair value measurement of a security is determined based on the lowest Level input that is significant to the fair value measurement in its entirety.
Fair value measurements: A description of the valuation techniques applied to the Funds’ major categories of assets and liabilities measured at fair value on a recurring basis is as follows:
Equity securities (common and preferred stock): Securities are stated at the last reported sales price or closing price on the day of valuation taken from the primary exchange where the security is principally traded. To the extent these securities are actively traded and valuation adjustments are not applied, they are categorized in Level 1 of the fair value hierarchy.
Foreign securities generally are valued based on quotations from the primary market in which they are traded and are categorized in Level 1. Because many foreign securities markets and exchanges close prior to the close of the NYSE, closing prices for foreign securities in those markets or on those exchanges do not reflect the events that occur after that close. Certain foreign securities may be fair valued using a pricing service that considers the correlation of the trading patterns of the foreign security to the intraday trading in the U.S. markets for investments such as American Depositary Receipts (“ADR”), financial futures, Exchange Traded Funds (“ETF”), and the movement of the certain indices of securities based on a statistical analysis of their historical relationship. Such valuations generally are categorized in Level 2.
Preferred stock and other equities traded on inactive markets or valued by reference to similar instruments are also generally categorized in Level 2.
Corporate bonds: The fair value of corporate bonds is estimated using various techniques, which may consider recently executed transactions in securities of the issuer or comparable issuers, market price quotations (where observable), bond spreads, fundamental data relating to the issuer, and credit default swap spreads adjusted for any basis difference between cash and derivative instruments. While most corporate bonds are categorized in Level 2 of the fair value hierarchy, in instances where lower relative weight is placed on transaction prices, quotations, or similar observable inputs, they are categorized in Level 3.
Asset backed securities: The fair value of asset backed securities is estimated based on models that consider the estimated cash flows of each tranche of the entity, establish a benchmark yield, and develop an estimated tranche specific spread to the benchmark yield based on the unique attributes of the tranche. To the extent the inputs are observable and timely, the values would generally be categorized in Level 2 of the fair value hierarchy; otherwise they would be categorized as Level 3.
Short-term notes: Short-term notes are valued using amortized cost, which approximates fair value. To the extent the inputs are observable and timely, the values would be generally categorized in Level 2 of the fair value hierarchy.
U.S. government securities: U.S. government securities are normally valued using a model that incorporates market observable data such as reported sales of similar securities, broker quotes, yields, bids, offers, and reference data. Certain securities are valued by principally using dealer quotations. U.S. government securities generally are categorized in Level 2 of the fair value hierarchy.
U.S. .government agency securities: U.S. government agency securities are comprised of two main categories consisting of agency issued debt and mortgage pass-throughs. Generally, agency issued debt securities are valued in a manner similar to U. S. government securities. Mortgage pass-throughs include to-be-announced (“TBA”) securities and mortgage pass-through certificates. Generally, TBA securities and mortgage pass-throughs are valued using dealer quotations. Depending on market activity levels and whether quotations or other observable data are used, these securities are typically categorized in Level 2 of the fair value hierarchy.
Restricted securities (equity and debt): Restricted securities for which quotations are not readily available are valued at fair value as determined in good faith by Transamerica Asset Management, Inc.’s (“TAM”) Valuation Committee under the supervision of the Board of Trustees. Restricted securities issued by publicly traded companies are generally valued at a discount to similar publicly traded securities. Restricted securities issued by nonpublic entities may be valued by reference to comparable public entities and/or fundamental data relating to the issuer. Depending on the relative significance of valuation inputs, these instruments may be classified in either Level 2 or Level 3 of the fair value hierarchy.
109
NOTES TO FINANCIAL STATEMENTS (continued)
At October 31, 2009
(all amounts in thousands)
NOTE 2. (continued)
Derivative instruments: Listed derivatives that are actively traded are valued based on quoted prices from the exchange and generally are categorized in Level 1 of the fair value hierarchy. Over the counter (“OTC”) derivative contracts include forward, swap, and option contracts related to interest rates, foreign currencies, credit standing of reference entities, equity prices, or commodity prices. Depending on the product and the terms of the transaction, the fair value of the OTC derivative products can be modeled by taking into account the counterparties’ creditworthiness and using a series of techniques, including simulation models. Many pricing models do not entail material subjectivity because the methodologies employed do not necessitate significant judgments and the pricing inputs are observed from actively quoted markets, as is the case for interest rate swap and option contracts. A substantial majority of OTC derivative products valued by the Funds using pricing models fall into this category and generally are categorized in Level 2 of the fair value hierarchy.
Other: Securities for which quotations are not readily available or whose values have been determined to be unreliable are valued at fair market value as determined in good faith by TAM’s Valuation Committee under the supervision of the Board of Trustees.
The hierarchy classification of inputs used to value the Funds’ investments at October 31, 2009, as well as a reconciliation of assets for which significant unobservable inputs (Level 3) were used in determining value, is included at the end of each Fund’s Schedule of Investments.
NOTE 3. RELATED PARTY TRANSACTIONS
TAM is the Funds’ investment adviser and is directly owned by Western Reserve Life Assurance Co. of Ohio (77%) and AUSA Holding Company (23%) (“AUSA”), both of which are indirect, wholly owned subsidiaries of AEGON NV. AUSA is wholly owned by AEGON USA, LLC (“AEGON USA”), a financial services holding company whose primary emphasis is on life and health insurance, and annuity and investment products. AEGON USA is owned by AEGON US Holding Corporation, which is owned by Transamerica Corporation (DE). Transamerica Corporation (DE) is owned by The AEGON Trust, which is owned by AEGON International B.V., which is owned by AEGON NV, a Netherlands corporation, and a publicly traded international insurance group.
Transamerica Fund Services, Inc. (“TFS”) is the Funds’ administrator and transfer agent. Transamerica Capital, Inc. (“TCI”) is the Funds’ distributor/principal underwriter. TAM, TFS, and TCI are affiliates of AEGON NV.
Certain officers and trustees of the Funds are also officers and/or directors of TAM, TFS, and TCI.
At the commencement of the operations, TAM, an affiliate of the Funds, invested in the Funds. As of October 31, 2009, TAM had remaining investments in the Funds as follows:
Fund Name | | Market
Value | | % of Fund’s
Net Assets | |
Transamerica Convertible Securities | | | | | |
Class C | | $ | 341 | | 0.47 | % |
| | | | | | |
110
NOTES TO FINANCIAL STATEMENTS (continued)
At October 31, 2009
(all amounts in thousands)
NOTE 3. (continued)
The following schedule reflects the percentage of each Fund’s assets owned by affiliated investment companies at October 31, 2009:
Transamerica Convertible Securities | | Market
Values | | % of Net
Assets | |
Transamerica Asset Allocation-Conservative Portfolio | | $ | 185 | | 0.26 | % |
Transamerica Asset Allocation-Moderate Portfolio | | 25,746 | | 35.59 | |
Transamerica Asset Allocation-Moderate Growth Portfolio | | 24,709 | | 34.15 | |
Total | | $ | 50,640 | | 70.00 | % |
| | | | | |
Transamerica Equity | | Market
Values | | % of Net
Assets | |
Transamerica Asset Allocation-Conservative Portfolio | | $ | 36,950 | | 3.38 | % |
Transamerica Asset Allocation-Growth Portfolio | | 189,154 | | 17.28 | |
Transamerica Asset Allocation-Moderate Portfolio | | 119,132 | | 10.89 | |
Transamerica Asset Allocation-Moderate Growth Portfolio | | 287,601 | | 26.28 | |
Total | | $ | 632,837 | | 57.83 | % |
| | | | | |
Transamerica Flexible Income | | Market
Values | | % of Net
Assets | |
Transamerica Asset Allocation-Conservative Portfolio | | $ | 16,114 | | 9.08 | % |
Transamerica Asset Allocation-Moderate Portfolio | | 18,628 | | 10.50 | |
Transamerica Asset Allocation-Moderate Growth Portfolio | | 21,887 | | 12.33 | |
Transamerica Asset Allocation-Conservative VP | | 18,058 | | 10.17 | |
Transamerica Asset Allocation-Moderate Growth VP | | 26,546 | | 14.96 | |
Transamerica Asset Allocation-Moderate VP | | 30,331 | | 17.09 | |
Total | | $ | 131,564 | | 74.13 | % |
| | | | | |
Transamerica Growth Opportunities | | Market
Values | | % of Net
Assets | |
Transamerica Asset Allocation-Conservative Portfolio | | $ | 8,968 | | 4.85 | % |
Transamerica Asset Allocation-Growth Portfolio | | 33,437 | | 18.07 | |
Transamerica Asset Allocation-Moderate Portfolio | | 18,719 | | 10.12 | |
Transamerica Asset Allocation-Moderate Growth Portfolio | | 49,227 | | 26.60 | |
Total | | $ | 110,351 | | 59.64 | % |
| | | | | |
Transamerica High Yield Bond | | Market
Values | | % of Net
Assets | |
Transamerica Asset Allocation-Conservative Portfolio | | $ | 62,572 | | 10.95 | % |
Transamerica Asset Allocation-Moderate Portfolio | | 99,014 | | 17.32 | |
Transamerica Asset Allocation-Moderate Growth Portfolio | | 102,912 | | 18.00 | |
Transamerica Asset Allocation-Conservative VP | | 50,745 | | 8.88 | |
Transamerica Asset Allocation-Moderate Growth VP | | 73,887 | | 12.92 | |
Transamerica Asset Allocation-Moderate VP | | 80,188 | | 14.03 | |
Total | | $ | 469,318 | | 82.10 | % |
| | | | | |
Transamerica Money Market | | Market
Values | | % of Net
Assets | |
Transamerica Asset Allocation-Conservative Portfolio | | $ | 5,944 | | 2.27 | % |
Transamerica Asset Allocation-Growth Portfolio | | 2,950 | | 1.12 | |
Transamerica Asset Allocation-Moderate Portfolio | | 5,126 | | 1.95 | |
Transamerica Asset Allocation-Moderate Growth Portfolio | | 6,793 | | 2.59 | |
Transamerica Multi-Manager Alternative Strategies Portfolio | | 9,783 | | 3.73 | |
Total | | $ | 30,596 | | 11.66 | % |
| | | | | |
Transamerica Science & Technology | | Market
Values | | % of Net
Assets | |
Transamerica Asset Allocation-Conservative Portfolio | | $ | 3,628 | | 5.55 | % |
Transamerica Asset Allocation-Growth Portfolio | | 15,636 | | 23.94 | |
Transamerica Asset Allocation-Moderate Portfolio | | 9,856 | | 15.09 | |
Transamerica Asset Allocation-Moderate Growth Portfolio | | 26,935 | | 41.23 | |
Total | | $ | 56,055 | | 85.81 | % |
| | | | | |
Transamerica Short-Term Bond | | Market
Values | | % of Net
Assets | |
Transamerica Asset Allocation-Conservative Portfolio | | $ | 81,293 | | 6.17 | % |
Transamerica Asset Allocation-Moderate Portfolio | | 105,151 | | 7.98 | |
Transamerica Asset Allocation-Moderate Growth Portfolio | | 90,155 | | 6.84 | |
Transamerica Asset Allocation-Conservative VP | | 111,645 | | 8.48 | |
Transamerica Asset Allocation-Moderate Growth VP | | 150,604 | | 11.43 | |
Transamerica Asset Allocation-Moderate VP | | 152,867 | | 11.60 | |
Transamerica International Moderate Growth VP | | 15,298 | | 1.16 | |
Total | | $ | 707,013 | | 53.66 | % |
111
NOTES TO FINANCIAL STATEMENTS (continued)
At October 31, 2009
(all amounts in thousands)
NOTE 3. (continued)
Investment advisory fees: The Funds pay management fees to TAM based on average daily net assets (“ANA”) at the following breakpoints:
Transamerica Balanced | | | |
First $250 million | | 0.80 | % |
Over $250 million up to $500 million | | 0.75 | % |
Over $500 million up to $1.5 billion | | 0.70 | % |
Over $1.5 billion | | 0.625 | % |
Transamerica Convertible Securities | | | |
First $250 million | | 0.75 | % |
Over $250 million | | 0.70 | % |
Transamerica Equity | | | |
First $500 million | | 0.75 | % |
Over $500 million up to $2.5 billion | | 0.70 | % |
Over $2.5 billion | | 0.65 | % |
Transamerica Flexible Income | | | |
First $250 million | | 0.725 | % |
Over $250 million up to $350 million | | 0.675 | % |
Over $350 million | | 0.625 | % |
Transamerica Growth Opportunities | | | |
First $250 million | | 0.80 | % |
Over $250 million up to $500 million | | 0.75 | % |
Over $500 million | | 0.70 | % |
Transamerica High Yield Bond | | | |
First $400 million | | 0.59 | % |
Over $400 million up to $750 million | | 0.575 | % |
Over $750 million | | 0.55 | % |
Transamerica Legg Mason Partners All Cap | | | |
First $500 million | | 0.80 | % |
Over $500 million | | 0.675 | % |
Transamerica Money Market | | | |
Average daily net assets | | 0.40 | % |
Transamerica Science & Technology | | | |
First $500 million | | 0.78 | % |
Over $500 million | | 0.70 | % |
Transamerica Short-Term Bond * | | | |
First $250 million | | 0.65 | % |
Over $250 million up to $500 million | | 0.60 | % |
Over $500 million up to $1 billion | | 0.575 | % |
Over $1 billion | | 0.55 | % |
Transamerica Small/Mid Cap Value | | | |
First $500 million | | 0.80 | % |
Over $500 million | | 0.75 | % |
Transamerica Templeton Global | | | |
First $500 million | | 0.80 | % |
Over $500 million | | 0.70 | % |
Transamerica Value Balanced | | | |
First $500 million | | 0.75 | % |
Over $500 million up to $1 billion | | 0.65 | % |
Over $1 billion | | 0.60 | % |
* Effective May 1, 2009, TAM has contractually agreed to waive 0.10% of the investment advisory fee.
TAM has contractually agreed to waive its advisory fee and will reimburse the Funds to the extent that operating expenses, excluding 12b-1 fees and other extraordinary expenses, exceed the following stated annual limit:
Fund | | Expense
Limit | |
Transamerica Balanced | | 1.45 | % |
Transamerica Convertible Securities | | 1.35 | |
Transamerica Equity* | | 1.17 | |
Transamerica Flexible Income | | 1.50 | |
Transamerica Growth Opportunities* | | 1.40 | |
Transamerica High Yield Bond* | | 1.24 | |
Transamerica Legg Mason Partners All Cap* | | 1.20 | |
Transamerica Money Market | | 0.48 | |
Transamerica Science & Technology | | 1.18 | |
Transamerica Short-Term Bond | | 0.85 | |
Transamerica Small/Mid Cap Value | | 1.40 | |
Transamerica Templeton Global | | 1.20 | |
Transamerica Value Balanced* | | 1.20 | |
*The Fund may not recapture any fees waived and/or reimbursed prior to March 1, 2008. |
If total Fund expenses fall below the annual expense limitation agreement agreed to by the adviser within the succeeding three years, the Funds may be required to pay the adviser a portion or all of the reimbursed class expenses.
There were no amounts recaptured at October 31, 2009.
112
NOTES TO FINANCIAL STATEMENTS (continued)
At October 31, 2009
(all amounts in thousands)
NOTE 3. (continued)
The following amounts were available for recapture as of October 31, 2009:
Fund | | Reimbursement of
Class Expenses | | Available for
Recapture Through | |
Transamerica Equity | | | | | |
Fiscal Year 2008: | | | | 10/31/2011 | |
Class B | | $ | 54 | | | |
Fiscal Year 2009: | | | | 10/31/2012 | |
Class A | | 418 | | | |
Class B | | 145 | | | |
Class C | | 58 | | | |
Transamerica Growth Opportunities | | | | | |
Fiscal Year 2008: | | | | 10/31/2011 | |
Class A | | $ | 31 | | | |
Class B | | 27 | | | |
Fiscal Year 2009: | | | | 10/31/2012 | |
Class A | | 203 | | | |
Class B | | 48 | | | |
Class C | | 22 | | | |
Transamerica Legg Mason Partners All Cap | | | | | |
Fiscal Year 2008: | | | | 10/31/2011 | |
Class A | | $ | 17 | | | |
Class B | | 24 | | | |
Fiscal Year 2009: | | | | 10/31/2012 | |
Class A | | 114 | | | |
Class B | | 98 | | | |
Class C | | 27 | | | |
Transamerica Money Market | | | | | |
Fiscal Year 2007: | | | | 10/31/2010 | |
Class A | | $ | 321 | | | |
Class B | | 88 | | | |
Class C | | 45 | | | |
Class I | | 18 | | | |
Fiscal Year 2008: | | | | 10/31/2011 | |
Class A | | 276 | | | |
Class B | | 71 | | | |
Class C | | 62 | | | |
Class I | | 2 | | | |
Fiscal Year 2009: | | | | 10/31/2012 | |
Class A | | 763 | | | |
Class B | | 422 | | | |
Class C | | 552 | | | |
Class I | | 30 | | | |
Transamerica Science & Technology | | | | | |
Fiscal Year 2007: | | | | 10/31/2010 | |
Class A | | $ | 13 | | | |
Class B | | 14 | | | |
Class C | | 4 | | | |
Fiscal Year 2008: | | | | 10/31/2011 | |
Class A | | 11 | | | |
Class B | | 12 | | | |
Class C | | 3 | | | |
Fiscal Year 2009: | | | | 10/31/2012 | |
Class A | | 22 | | | |
Class B | | 11 | | | |
Class C | | 5 | | | |
Transamerica Templeton Global | | | | | |
Fiscal Year 2007: | | | | 10/31/2010 | |
Class A | | $ | 94 | | | |
Class B | | 131 | | | |
Class C | | 35 | | | |
Fiscal Year 2008: | | | | 10/31/2011 | |
Class A | | 66 | | | |
Class B | | 82 | | | |
Class C | | 14 | | | |
Fiscal Year 2009: | | | | 10/31/2012 | |
Class A | | 385 | | | |
Class B | | 67 | | | |
Class C | | 65 | | | |
Transamerica Value Balanced | | | | | |
Fiscal Year 2008: | | | | 10/31/2011 | |
Class A | | $ | 3 | | | |
Class B | | 11 | | | |
Fiscal Year 2009: | | | | 10/31/2012 | |
Class A | | 67 | | | |
Class B | | 27 | | | |
Class C | | 13 | | | |
In addition to the advisory fee waiver for Transamerica Money Market, TAM or any of its affiliates may waive fees or reimburse expenses of one or more classes of Transamerica Money Market in order to avoid a negative yield. At any point in which the Transamerica Money Market, or any classes thereof, achieves a positive yield, the expenses previously waived or reimbursed within the succeeding three years pursuant to this paragraph may be reimbursed to TAM, to the extent that such reimbursement does not cause classes of Transamerica Money Market to experience a negative yield. Waived expenses related to the maintenance of the yield are included in the Statement of Operations, within the class expense (reimbursed). Amounts waived for Class A, B, C, and I as of October 31, 2009 were $384, $321, $465, and $22 respectively.
Distribution and service fees: The Funds have 12b-1 distribution plans under the 1940 Act pursuant to which an annual fee, based on ANA, is paid to the distributor for various disbursements such as broker-dealer account servicing fees and other promotional expenses of the Funds. The Funds are authorized under the 12b-1 plans to pay fees on each class up to the following limits: 0.35% for Class A, 1.00% for Class B, and 1.00% for Class C. 12b-1 fees are not applicable for Class I and Class T. Effective May 1, 2009, TAM has contractually agreed to waive 0.10% of 12b-1 fees on Class A shares of Transamerica Short-Term Bond.
113
NOTES TO FINANCIAL STATEMENTS (continued)
At October 31, 2009
(all amounts in thousands)
NOTE 3. (continued)
Underwriter commissions relate to front-end sales charges imposed for Class A shares and contingent deferred sales charges from Class B, Class C, and certain Class A share redemptions. For the year ended October 31, 2009, the underwriter commissions were as follows:
Transamerica Balanced | | | |
Received by Underwriter | | $ | 46 | |
Retained by Underwriter | | 7 | |
Contingent Deferred Sales Charge | | 18 | |
Transamerica Convertible Securities | | | |
Received by Underwriter | | $ | 34 | |
Retained by Underwriter | | 6 | |
Contingent Deferred Sales Charge | | 10 | |
Transamerica Equity | | | |
Received by Underwriter | | $ | 260 | |
Retained by Underwriter | | 39 | |
Contingent Deferred Sales Charge | | 65 | |
Transamerica Flexible Income | | | |
Received by Underwriter | | $ | 100 | |
Retained by Underwriter | | 19 | |
Contingent Deferred Sales Charge | | 9 | |
Transamerica Growth Opportunities | | | |
Received by Underwriter | | $ | 46 | |
Retained by Underwriter | | 7 | |
Contingent Deferred Sales Charge | | 17 | |
Transamerica High Yield Bond | | | |
Received by Underwriter | | $ | 355 | |
Retained by Underwriter | | 64 | |
Contingent Deferred Sales Charge | | 15 | |
Transamerica Legg Mason Partners All Cap | | | |
Received by Underwriter | | $ | 28 | |
Retained by Underwriter | | 4 | |
Contingent Deferred Sales Charge | | 20 | |
Transamerica Money Market | | | |
Received by Underwriter | | $ | — | |
Retained by Underwriter | | — | |
Contingent Deferred Sales Charge | | 239 | |
Transamerica Science & Technology | | | |
Received by Underwriter | | $ | 9 | |
Retained by Underwriter | | 1 | |
Contingent Deferred Sales Charge | | 2 | |
Transamerica Short-Term Bond | | | |
Received by Underwriter | | $ | 1,452 | |
Retained by Underwriter | | 289 | |
Contingent Deferred Sales Charge | | 41 | |
Transamerica Small/Mid Cap Value | | | |
Received by Underwriter | | $ | 347 | |
Retained by Underwriter | | 52 | |
Contingent Deferred Sales Charge | | 128 | |
Transamerica Templeton Global | | | |
Received by Underwriter | | $ | 38 | |
Retained by Underwriter | | 6 | |
Contingent Deferred Sales Charge | | 10 | |
Transamerica Value Balanced | | | |
Received by Underwriter | | $ | 12 | |
Retained by Underwriter | | 2 | |
Contingent Deferred Sales Charge | | 6 | |
Administrative services: The Funds have entered into agreements with TFS for financial and legal fund administration services. The Funds pay TFS an annual fee of 0.02% of ANA. The Legal fees on the Statements of Operations are fees paid to external legal counsel.
Transfer agent fees: The Funds pay TFS an annual per-account charge for each open and closed account. For the year ended October 31, 2009, the Funds paid TFS the following:
Fund | | Fees | |
Transamerica Balanced | | $ | 348 | |
Transamerica Convertible Securities | | 40 | |
Transamerica Equity | | 1,891 | |
Transamerica Flexible Income | | 83 | |
Transamerica Growth Opportunities | | 591 | |
Transamerica High Yield Bond | | 99 | |
Transamerica Legg Mason Partners All Cap | | 343 | |
Transamerica Money Market | | 480 | |
Transamerica Science & Technology | | 53 | |
Transamerica Short-Term Bond | | 85 | |
Transamerica Small/Mid Cap Value | | 852 | |
Transamerica Templeton Global | | 607 | |
Transamerica Value Balanced | | 116 | |
| | | | |
Deferred compensation plan: Each eligible Independent Fund Trustee may elect to participate in a non-qualified deferred compensation plan (the “Plan”) maintained by Transamerica Funds. Under the Plan, such Trustees may defer payment of all or a portion of their total fees earned as a Fund Trustee. Each Trustee who is a participant in the Plan may elect that the earnings, losses or gains credited to his or her deferred fee amounts be determined based on a deemed investment in Class A shares of any series of Transamerica Funds or investment options under Transamerica Partners Institutional Funds Group, Transamerica Institutional Asset Allocation Funds. The right of a participant to receive a distribution from the Plan of the deferred fees is a claim against the general assets of all series of Transamerica Funds.
Retirement plan: Under a prior retirement plan (the “Emeritus Plan”) available to the Independent Trustees, each Independent Trustee was deemed to have been elected to serve as Trustee Emeritus of Transamerica Funds upon his or her termination of service, other than removal for cause, for a maximum period of five years determined by his or her years of service as a Trustee.
114
NOTES TO FINANCIAL STATEMENTS (continued)
At October 31, 2009
(all amounts in thousands)
NOTE 3. (continued)
Such amounts were to be accrued by Transamerica Funds on a pro rata basis allocable to each Transamerica Fund based on the relative assets of the Fund. If retainers increased in the future, past accruals (and credits) would be adjusted upward so that 50% of the Trustee’s current retainer was accrued and credited at all times. Upon death, disability or termination of service, other than removal for cause, amounts deferred became payable to a Trustee Emeritus (or his/her beneficiary). Upon the commencement of service as Trustee Emeritus, compensation would be paid on a quarterly basis during the time period that the Trustee Emeritus was allowed to serve as such.
At October 31, 2009, the Funds’ liabilities related to the Emeritus Plan were as follows:
Fund | | Emeritus Fees | |
Transamerica Balanced | | $ | — | (a) |
Transamerica Convertible Securities | | — | (a) |
Transamerica Equity | | 3 | |
Transamerica Flexible Income | | 1 | |
Transamerica Growth Opportunities | | 1 | |
Transamerica High Yield Bond | | 1 | |
Transamerica Legg Mason Partners All Cap | | — | (a) |
Transamerica Money Market | | — | (a) |
Transamerica Science & Technology | | — | (a) |
Transamerica Short-Term Bond | | 1 | |
Transamerica Small/Mid Cap Value | | 1 | |
Transamerica Templeton Global | | 1 | |
Transamerica Value Balanced | | — | (a) |
| | | | |
Amounts deferred and accrued under the Emeritus Plan are claims against the general assets of Transamerica Funds.
The Emeritus Plan was terminated effective October 30, 2007. Upon the termination, the Funds continue to pay any remaining benefits in accordance with the Plan, but no further compensation has been accrued.
Brokerage commissions: There were no brokerage commissions incurred on security transactions placed with affiliates of the advisers for the year ended October 31, 2009.
NOTE 4. INVESTMENT TRANSACTIONS
The cost of securities purchased and proceeds from securities sold (excluding short-term securities) for the year ended October 31, 2009 were as follows:
| | Purchases of securities: | | Proceeds from maturities and sales of
securities: | |
Fund | | Long-term | | U.S. Government | | Long-term | | U.S. Government | |
Transamerica Balanced | | $ | 77,028 | | $ | 13,322 | | $ | 87,948 | | $ | 19,027 | |
Transamerica Convertible Securities | | 133,514 | | — | | 199,129 | | — | |
Transamerica Equity | | 537,777 | | — | | 471,344 | | — | |
Transamerica Flexible Income | | 197,960 | | 45,519 | | 190,941 | | 55,826 | |
Transamerica Growth Opportunities | | 109,727 | | — | | 108,967 | | — | |
Transamerica High Yield Bond | | 247,301 | | — | | 273,372 | | — | |
Transamerica Legg Mason Partners All Cap | | 22,262 | | — | | 38,913 | | — | |
Transamerica Money Market | | — | | — | | — | | — | |
Transamerica Science & Technology | | 31,205 | | — | | 29,961 | | — | |
Transamerica Short-Term Bond | | 1,200,893 | | 8,780 | | 581,179 | | 8,792 | |
Transamerica Small/Mid Cap Value | | 304,914 | | — | | 438,355 | | — | |
Transamerica Templeton Global | | 22,340 | | — | | 30,842 | | — | |
Transamerica Value Balanced | | 24,538 | | 4,170 | | 28,091 | | 5,004 | |
| | | | | | | | | | | | | |
NOTE 5. FEDERAL INCOME TAX MATTERS
The Funds have not made any provisions for federal income or excise taxes due to their policy to distribute all of their taxable income and capital gains to their shareholders and otherwise qualify as regulated investment companies under Subchapter M of the Internal Revenue Code. Management has evaluated the Funds’ tax provisions taken for all open tax years and has concluded that no provision for income tax is required in the Funds’ financial statements. Income and capital gain distributions are determined in accordance with income tax regulations, which may differ from GAAP. These differences are primarily due to differing treatment for items including, but not limited to, wash sales, structured notes, foreign bonds, swaps, passive foreign investment companies, net operating losses and distribution reclasses.
(a) Rounds to less than $1.
115
NOTES TO FINANCIAL STATEMENTS (continued)
At October 31, 2009
(all amounts in thousands)
NOTE 5. (continued)
Therefore, distributions determined in accordance with tax regulations may differ significantly in amount or character from net investment income and realized gains for financial reporting purposes. Financial reporting records are adjusted for permanent book/tax differences to reflect tax character. Financial records are not adjusted for temporary differences. These reclassifications are as follows:
Fund | | Shares of beneficial
interest, unlimited shares
authorized | | Undistributed
(accumulated) net
investment income (loss) | | Undistributed
(accumulated) net realized
gain (loss) from
investment securities | |
Transamerica Balanced | | $ | — | | $ | 57 | | $ | (57 | ) |
Transamerica Equity | | (308,384 | ) | — | | 308,384 | |
Transamerica Flexible Income | | — | | 145 | | (145 | ) |
Transamerica Growth Opportunities | | (99,573 | ) | 479 | | 99,094 | |
Transamerica Science & Technology | | (273 | ) | 273 | | — | |
Transamerica Short-Term Bond | | — | | 204 | | (204 | ) |
Transamerica Small/Mid Cap Value | | (746 | ) | 746 | | — | |
Transamerica Templeton Global | | (33,613 | ) | 6 | | 33,607 | |
Transamerica Value Balanced | | (111 | ) | (16 | ) | 127 | |
| | | | | | | | | | |
The capital loss carryforwards are available to offset future realized capital gains through the periods listed below. Funds not listed in the table below do not have any capital loss carryforwards.
Fund | | Capital Loss
Carryforwards | | Available Through | |
Transamerica Balanced | | $ | 10,542 | | October 31, 2017 | |
Transamerica Convertible Securities | | 17,338 | | October 31, 2016 | |
Transamerica Convertible Securities | | 16,835 | | October 31, 2017 | |
Transamerica Equity | | 94,612 | | October 31, 2010 | |
Transamerica Equity | | 52,413 | | October 31, 2016 | |
Transamerica Equity | | 223,075 | | October 31, 2017 | |
Transamerica Flexible Income | | 890 | | October 31, 2013 | |
Transamerica Flexible Income | | 5,058 | | October 31, 2014 | |
Transamerica Flexible Income | | 6,946 | | October 31, 2015 | |
Transamerica Flexible Income | | 34,692 | | October 31, 2016 | |
Transamerica Flexible Income | | 20,375 | | October 31, 2017 | |
Transamerica Growth Opportunities | | 4,619 | | October 31, 2010 | |
Transamerica Growth Opportunities | | 7,437 | | October 31, 2011 | |
Transamerica Growth Opportunities | | 20,295 | | October 31, 2016 | |
Transamerica Growth Opportunities | | 16,025 | | October 31, 2017 | |
Transamerica High Yield Bond | | 1,546 | | October 31, 2011 | |
Transamerica High Yield Bond | | 9,181 | | October 31, 2016 | |
Transamerica High Yield Bond | | 55,908 | | October 31, 2017 | |
Transamerica Legg Mason Partners All Cap | | 2,254 | | October 31, 2016 | |
Transamerica Legg Mason Partners All Cap | | 5,526 | | October 31, 2017 | |
Transamerica Money Market | | 1 | | October 31, 2013 | |
Transamerica Money Market | | 1 | | October 31, 2014 | |
Transamerica Money Market | | 1 | | October 31, 2017 | |
Transamerica Science & Technology | | 504 | | October 31, 2016 | |
Transamerica Science & Technology | | 12,149 | | October 31, 2017 | |
Transamerica Short-Term Bond | | 658 | | October 31, 2013 | |
Transamerica Short-Term Bond | | 1,787 | | October 31, 2014 | |
Transamerica Short-Term Bond | | 1,304 | | October 31, 2015 | |
Transamerica Short-Term Bond | | 10,368 | | October 31, 2016 | |
Transamerica Short-Term Bond | | 404 | | October 31, 2017 | |
Transamerica Small/Mid Cap Value | | 98,911 | | October 31, 2016 | |
Transamerica Small/Mid Cap Value | | 101,374 | | October 31, 2017 | |
Transamerica Templeton Global | | 205,203 | | October 31, 2010 | |
Transamerica Templeton Global | | 57,944 | | October 31, 2011 | |
Transamerica Templeton Global | | 16,825 | | October 31, 2017 | |
Transamerica Value Balanced | | 3,594 | | October 31, 2016 | |
Transamerica Value Balanced | | 2,286 | | October 31, 2017 | |
| | | | | | |
116
NOTES TO FINANCIAL STATEMENTS (continued)
At October 31, 2009
(all amounts in thousands)
NOTE 5. (continued)
The capital loss carryforwards utilized or expired during the year ended October 31, 2009 were as follows:
Fund | | Capital Loss Carryforwards
Expired During the Year Ended
October 31, 2009 | |
Transamerica Equity | | $ | 308,384 | |
Transamerica Growth Opportunities | | 99,198 | |
Transamerica Templeton Global | | 33,614 | |
| | | | |
The tax character of distributions paid may differ from the character of distributions shown in the Statements of Changes in Net Assets due to short-term gains being treated as ordinary income for tax purposes. The tax character of distributions paid during 2008 and 2009 were as follows:
| | Distributions Paid From: 2008 | | Distributions Paid From: 2009 | |
Fund | | Ordinary
Income | | Long-Term
Capital Gain | | Ordinary
Income | | Long-Term
Capital Gain | |
Transamerica Balanced | | $ | 1,146 | | $ | 4,811 | | $ | 1,491 | | $ | 6,058 | |
Transamerica Convertible Securities | | 10,032 | | 28,135 | | 2,634 | | — | |
Transamerica Equity | | — | | — | | 2,955 | | — | |
Transamerica Flexible Income | | 20,665 | | — | | 8,950 | | — | |
Transamerica Growth Opportunities | | — | | — | | — | | — | |
Transamerica High Yield Bond | | 35,509 | | — | | 45,747 | | — | |
Transamerica Legg Mason Partners All Cap | | 440 | | 14,797 | | 595 | | — | |
Transamerica Money Market | | 4,684 | | — | | 517 | | — | |
Transamerica Science & Technology | | — | | 3,111 | | — | | — | |
Transamerica Short-Term Bond | | 25,117 | | — | | 39,002 | | — | |
Transamerica Small/Mid Cap Value | | 6,446 | | 75,840 | | 8,016 | | — | |
Transamerica Templeton Global | | 2,122 | | — | | 662 | | — | |
Transamerica Value Balanced | | 1,133 | | 2,932 | | 611 | | — | |
| | | | | | | | | | | | | |
The tax basis components of distributable earnings as of October 31, 2009 are as follows:
Fund | | Undistributed
Ordinary Income | | Undistributed
Long-Term
Capital Gain | | Capital Loss
Carryforward | | Other
Temporary
Differences | | Net Unrealized
Appreciation
(Depreciation) | |
Transamerica Balanced | | $ | 118 | | $ | — | | $ | (10,542 | ) | $ | — | | $ | 5,455 | |
Transamerica Convertible Securities | | 82 | | — | | (34,173 | ) | — | | 1,979 | |
Transamerica Equity | | 3,339 | | — | | (370,100 | ) | — | | 78,324 | |
Transamerica Flexible Income | | 1,236 | | — | | (67,961 | ) | — | | 7,974 | |
Transamerica Growth Opportunities | | — | | — | | (48,376 | ) | — | | 7,898 | |
Transamerica High Yield Bond | | 3,255 | | — | | (66,635 | ) | — | | 4,576 | |
Transamerica Legg Mason Partners All Cap | | 179 | | — | | (7,780 | ) | — | | 1,283 | |
Transamerica Money Market | | 112 | | — | | (3 | ) | — | | (26 | ) |
Transamerica Science & Technology | | — | | — | | (12,653 | ) | — | | 10,607 | |
Transamerica Short Term Bond | | 519 | | — | | (14,521 | ) | (3,001 | ) | 48,327 | |
Transamerica Small/Mid Cap Value | | — | | — | | (200,285 | ) | — | | 42,372 | |
Transamerica Templeton Global | | 811 | | — | | (279,972 | ) | — | | (4,391 | ) |
Transamerica Value Balanced | | — | | — | | (5,880 | ) | — | | 3,250 | |
| | | | | | | | | | | | | | | | |
117
NOTES TO FINANCIAL STATEMENTS (continued)
At October 31, 2009
(all amounts in thousands)
NOTE 6. ACCOUNTING PRONOUNCEMENT
In March 2008, the Financial Accounting Standards Board issued amendments to authoritative guidance on disclosures about derivative instruments and hedging activities which require that the Fund disclose: a) how and why an entity uses derivative instruments, b) how derivative instruments and related hedged items are accounted for and c) how derivative instruments and related hedged items affect an entity’s financial position, financial performance and cash flows. The adoption of the additional disclosure requirements is effective for financial statements issued for fiscal years beginning after November 15, 2008. Management is currently evaluating the application of the adoption of the additional disclosure requirements and its impact on the Funds’ financial statements.
NOTE 7. SUBSEQUENT EVENTS
The Board of Trustees has approved a name change for Transamerica Legg Mason Partners All Cap to Transamerica Focus effective November 6, 2009. The Board has also approved a new investment sub-advisory agreement with Transamerica Investment Management, LLC (“TIM”), effective on the same date.
Effective November 13, 2009, Transamerica Diversified Equity was added to the Trust.
Effective November 13, 2009, Transamerica High Yield Bond changed its name to Transamerica AEGON High Yield Bond.
Effective November 13, 2009, the following funds offered a Class P share:
Transamerica Balanced
Transamerica Diversified Equity
Transamerica Equity
Transamerica Focus (formerly Transamerica Legg Mason Partners All Cap)
Transamerica Growth Opportunities
Transamerica AEGON High Yield Bond (formerly Transamerica High Yield Bond)
Transamerica Money Market
The Board of Trustees approved an Agreement and Plan of Reorganization for funds within the Trust. The following paragraphs describe each effective reorganization.
On November 13, 2009, Transamerica Balanced acquired all of the net assets of Transamerica Value Balanced and Transamerica Premier Balanced Fund pursuant to a Plan of Reorganization. Transamerica Balanced is the accounting survivor. The acquisition was accomplished by a tax - free exchange of 16,603 shares of Transamerica Balanced for 2,784 shares of Transamerica Value Balanced and 13,545 shares of Transamerica Premier Balanced Fund outstanding on November 13, 2009. Transamerica Value Balanced’s net assets at that date, $28,129, including $4,036 unrealized appreciation, were combined with those of Transamerica Balanced. Transamerica Premier Balanced Fund’s net assets at that date, $281,788, including $32,655 unrealized appreciation, were combined with those of Transamerica Balanced. The aggregate net assets of Transamerica Balanced immediately before the acquisition were $98,823; the combined net assets of Transamerica Balanced immediately after the acquisition were $408,740. Shares issued with the acquisition were as follows:
Transamerica Value Balanced
Classes | | Shares | | Amount | |
A | | 1,014 | | $ | 18,932 | |
B | | 207 | | 3,855 | |
C | | 289 | | 5,342 | |
| | | | | | |
Transamerica Premier Balanced Fund
Class | | Shares | | Amount | |
P | | 15,093 | | $ | 281,788 | |
| | | | | | |
118
NOTES TO FINANCIAL STATEMENTS (continued)
At October 31, 2009
(all amounts in thousands)
NOTE 7. (continued)
On November 13, 2009, Transamerica Diversified Equity acquired all of the net assets of Transamerica Science & Technology, Transamerica Templeton Global, Transamerica Premier Diversified Equity Fund and Transamerica Premier Institutional Diversified Equity Fund pursuant to a Plan of Reorganization. Transamerica Premier Diversified Equity Fund is the accounting survivor. The acquisition was accomplished by a tax - free exchange of 35,311 shares of Transamerica Diversified Equity for 17,970 shares of Transamerica Science & Technology, 4,437 shares of Transamerica Templeton Global, 21,531 shares of Transamerica Premier Diversified Equity Fund and 216 shares of Transamerica Premier Institutional Diversified Equity Fund outstanding on November 13, 2009. Transamerica Science & Technology’s net assets at that date, $71,411, including $16,692 unrealized appreciation, were combined with those of Transamerica Diversified Equity.
Transamerica Templeton Global’s net assets at that date, $103,595, including $5,276 unrealized appreciation, were combined with those of Transamerica Diversified Equity. Transamerica Premier Diversified Equity Fund’s net assets at that date, $276,775, including $29,067 unrealized appreciation, were combined with those of Transamerica Diversified Equity. Transamerica Premier Institutional Diversified Equity Fund’s net assets at that date, $2,115, including $346 unrealized appreciation, were combined with those of Transamerica Diversified Equity was newly organized on November 13, 2009; therefore it had no assets before the acquisition. The combined net assets of Transamerica Diversified Equity immediately after the acquisition were $453,896. Shares issued with the acquisition were as follows:
Transamerica Science & Technology
Classes | | Shares | | Amount | |
A | | 500 | | $ | 6,423 | |
B | | 131 | | 1,678 | |
C | | 128 | | 1,647 | |
I | | 4,797 | | 61,663 | |
| | | | | | |
Transamerica Templeton Global
Classes | | Shares | | Amount | |
A | | 6,267 | | $ | 80,558 | |
B | | 654 | | 8,412 | |
C | | 1,138 | | 14,625 | |
| | | | | | |
Transamerica Premier Diversified Equity Fund
Class | | Shares | | Amount | |
P | | 21,531 | | $ | 276,775 | |
| | | | | | |
Transamerica Premier Institutional Diversified Equity Fund
Class | | Shares | | Amount | |
I | | 165 | | $ | 2,115 | |
| | | | | | |
119
NOTES TO FINANCIAL STATEMENTS (continued)
At October 31, 2009
(all amounts in thousands)
NOTE 7. (continued)
On November 13, 2009, Transamerica Equity acquired all of the net assets of Transamerica Premier Equity Fund and Transamerica Premier Institutional Equity Fund pursuant to a Plan of Reorganization. Transamerica Equity is the accounting survivor. The acquisition was accomplished by a tax - free exchange of 66,720 shares of Transamerica Equity for 25,932 shares of Transamerica Premier Equity Fund and 8,477 shares of Transamerica Premier Institutional Equity Fund outstanding on November 13, 2009. Transamerica Premier Equity Fund’s net assets at that date, $459,628, including $49,578 unrealized appreciation, were combined with those of Transamerica Equity. Transamerica Premier Institutional Equity Fund’s net assets at that date, $80,465, including $7,579 unrealized appreciation, were combined with those of Transamerica Equity. The aggregate net assets of Transamerica Equity immediately before the acquisition were $1,167,181; the combined net assets of Transamerica Equity immediately after the acquisition were $1,707,274. Shares issued with the acquisition were as follows:
Transamerica Premier Equity Fund
Class | | Shares | | Amount | |
P | | 56,955 | | $ | 459,628 | |
| | | | | | |
Transamerica Premier Institutional Equity Fund
Class | | Shares | | Amount | |
I | | 9,765 | | $ | 80,465 | |
| | | | | | |
On November 13, 2009, Transamerica Focus (formerly Transamerica Legg Mason Partners All Cap) acquired all of the net assets of Transamerica Premier Focus Fund pursuant to a Plan of Reorganization. Transamerica Premier Focus Fund is the accounting survivor. The acquisition was accomplished by a tax - free exchange of 5,802 shares of Transamerica Focus for 3,672 shares of Transamerica Premier Focus Fund outstanding on November 13, 2009. Transamerica Focus’s net assets at that date, $72,239, including $4,752 unrealized appreciation, were combined with those of Transamerica Premier Focus Fund. The aggregate net assets of Transamerica Premier Focus Fund immediately before the acquisition was $68,302; the combined net assets of Transamerica Focus immediately after the acquisition was $140,541. Shares issued with the acquisition were as follows:
Transamerica Premier Focus Fund
Class | | Shares | | Amount | |
P | | 5,802 | | $ | 68,302 | |
| | | | | | |
On November 13, 2009, Transamerica Growth Opportunities acquired all of the net assets of Transamerica Premier Growth Opportunities Fund pursuant to a Plan of Reorganization. Transamerica Growth Opportunities is the accounting survivor. The acquisition was accomplished by a tax - free exchange of 12,010 shares of Transamerica Growth Opportunities for 4,478 shares of Transamerica Premier Growth Opportunities Fund outstanding on November 13, 2009. Transamerica Premier Growth Opportunities Fund’s net assets at that date, $96,199, including $12,641 unrealized appreciation, were combined with those of Transamerica Growth Opportunities. The aggregate net assets of Transamerica Growth Opportunities immediately before the acquisition were $197,060; the combined net assets of Transamerica Growth Opportunities immediately after the acquisition were $293,259. Shares issued with the acquisition were as follows:
Transamerica Premier Growth Opportunities Fund
Class | | Shares | | Amount | |
P | | 12,010 | | $ | 96,199 | |
| | | | | | |
120
NOTES TO FINANCIAL STATEMENTS (continued)
At October 31, 2009
(all amounts in thousands)
NOTE 7. (continued)
On November 13, 2009, Transamerica Flexible Income acquired all of the net assets of Transamerica Convertible Securities pursuant to a Plan of Reorganization. Transamerica Flexible Income is the accounting survivor. The acquisition was accomplished by a tax free exchange of 8,937 shares of Transamerica Flexible Income for 8,540 shares of Transamerica Convertible Securities outstanding on November 13, 2009. Transamerica Convertible Securities’s net assets at that date, $75,162, including $5,629 unrealized appreciation, were combined with those of Transamerica Flexible Income. The aggregate net assets of Transamerica Flexible Income immediately before the acquisition were $186,259; the combined net assets of Transamerica Flexible Income immediately after the acquisition were $261,421. Shares issued with the acquisition were as follows:
Transamerica Convertible Securities
Class | | Shares | | Amount | |
A | | 1,554 | | $ | 13,041 | |
B | | 294 | | 2,469 | |
C | | 717 | | 5,997 | |
I | | 6,372 | | 53,655 | |
| | | | | | |
On November 20, 2009, Transamerica Money Market acquired all of the net assets of Transamerica Premier Cash Reserve Fund pursuant to a Plan of Reorganization. Transamerica Money Market is the accounting survivor. The acquisition was accomplished by a tax - free exchange of 43,668 shares of Transamerica Money Market for 43,668 shares of Transamerica Premier Cash Reserve Fund outstanding on November 20, 2009. Transamerica Premier Cash Reserve Fund’s net assets at that date, $43,668, were combined with those of Transamerica Money Market. The aggregate net assets of Transamerica Money Market immediately before the acquisition were $254,159; the combined net assets of Transamerica Money Market immediately after the acquisition were $297,827. Shares issued with the acquisition were as follows:
Transamerica Premier Cash Reserve Fund
Class | | Shares | | Amount | |
P | | 43,668 | | $ | 43,668 | |
| | | | | | |
On November 20, 2009, Transamerica AEGON High Yield Bond acquired all of the net assets of Transamerica Premier High Yield Bond Fund pursuant to a Plan of Reorganization. Transamerica AEGON High Yield Bond is the accounting survivor. The acquisition was accomplished by a tax - free exchange of 10,999 shares of Transamerica AEGON High Yield Bond for 14,218 shares of Transamerica Premier High Yield Bond Fund outstanding on November 20, 2009. Transamerica Premier High Yield Bond Fund’s net assets at that date, $93,513, including $7,785 unrealized appreciation, were combined with those of Transamerica AEGON High Yield Bond. The aggregate net assets of Transamerica AEGON High Yield Bond immediately before the acquisition were $582,106; the combined net assets of Transamerica AEGON High Yield Bond immediately after the acquisition were $675,619. Shares issued with the acquisition were as follows:
Transamerica Premier High Yield Bond Fund
Class | | Shares | | Amount | |
I | | 4,929 | | $ | 42,041 | |
P | | 6,070 | | 51,472 | |
| | | | | | |
121
NOTES TO FINANCIAL STATEMENTS (continued)
At October 31, 2009
(all amounts in thousands)
NOTE 7. (continued)
Effective November 30, 2009, the following funds offered a new class of shares, Class I shares:
Transamerica Balanced
Transamerica Diversified Equity
Transamerica Equity
Transamerica Flexible Income
Transamerica Growth Opportunities
Transamerica AEGON High Yield Bond
Transamerica Focus
Transamerica Money Market
Transamerica Short-Term Bond
Transamerica Small/Mid Cap Value
Effective November 30, 2009, all previously existing Class I shares were re-designated as Class I2 shares.
Management has evaluated subsequent events through December 21, 2009, the date of issuance of the financial statements, and determined that no other material events or transactions would require recognition or disclosure in the Funds’ Financial Statements.
122
Report of Independent Registered Certified Public Accounting Firm
To the Board of Trustees and Shareholders of Transamerica Balanced, Transamerica Convertible Securities, Transamerica Equity, Transamerica Flexible Income, Transamerica Growth Opportunities, Transamerica High Yield Bond, Transamerica Legg Mason Partners All Cap, Transamerica Money Market, Transamerica Science & Technology, Transamerica Short-Term Bond, Transamerica Small/Mid Cap Value, Transamerica Templeton Global, and Transamerica Value Balanced:
In our opinion, the accompanying statements of assets and liabilities, including the schedules of investments, and the related statements of operations and of changes in net assets and the financial highlights present fairly, in all material respects, the financial position of Transamerica Balanced, Transamerica Convertible Securities, Transamerica Equity, Transamerica Flexible Income, Transamerica Growth Opportunities, Transamerica High Yield Bond, Transamerica Legg Mason Partners All Cap, Transamerica Money Market, Transamerica Science & Technology, Transamerica Short-Term Bond, Transamerica Small/Mid Cap Value, Transamerica Templeton Global, and Transamerica Value Balanced (individually a “Fund”, collectively the “Funds”) at October 31, 2009, and the results of each of their operations, the changes in each of their net assets and the financial highlights for each of the periods indicated, in conformity with accounting principles generally accepted in the United States of America. These financial statements and financial highlights (hereafter referred to as “financial statements”) are the responsibility of the Funds’ management; our responsibility is to express an opinion on these financial statements based on our audits. We conducted our audits of these financial statements in accordance with the standards of the Public Company Accounting Oversight Board (United States). Those standards require that we plan and perform the audit to obtain reasonable assurance about whether the financial statements are free of material misstatement. An audit includes examining, on a test basis, evidence supporting the amounts and disclosures in the financial statements, assessing the accounting principles used and significant estimates made by management, and evaluating the overall financial statement presentation. We believe that our audits, which included confirmation of securities at October 31, 2009 by correspondence with the custodian and brokers, provide a reasonable basis for our opinion.

Tampa, Florida
December 21, 2009
123
TRANSAMERICA BALANCED
INVESTMENT ADVISORY AND SUB-ADVISORY AGREEMENTS - CONTRACT RENEWAL
(unaudited)
At a meeting of the Board of Trustees of Transamerica Funds (the “Board”) held on June 4, 2009, the Board reviewed and considered the renewal of the investment advisory agreement (the “Investment Advisory Agreement”) between Transamerica Balanced (the “Fund”) and Transamerica Asset Management, Inc. (“TAM”), as well as the renewal of the investment sub-advisory agreement (the “Sub-Advisory Agreement”) of the Fund between TAM and Transamerica Investment Management, LLC (the “Sub-Adviser”), to determine whether the agreements should be renewed.
Following their review and consideration, the Trustees determined that the renewal of the Investment Advisory Agreement and the Sub-Advisory Agreement would enable shareholders of the Fund to obtain high quality services at a cost that is appropriate, fair, and in the best interests of Fund shareholders. The Board, including the independent members of the Board, unanimously approved the renewal of the Investment Advisory Agreement and Sub-Advisory Agreement through June 30, 2010. In reaching their decision, the Trustees requested and obtained from TAM and the Sub-Adviser such information as they deemed reasonably necessary to evaluate the agreements, including information about fees and performance of comparable funds managed by the Sub-Adviser. The Trustees noted that TAM and the Sub-Adviser do not manage any comparable separate accounts. The Trustees also carefully considered information they had previously received from TAM and the Sub-Adviser as part of their regular oversight of the Fund, as well as comparative fee, expense, and performance information prepared by Lipper Inc. (“Lipper”), an independent provider of mutual fund performance, and fee and expense information and profitability data prepared by management. In considering the proposed continuation of the Investment Advisory and Sub-Advisory Agreements, the Trustees evaluated a number of considerations that they believed, in light of the legal advice furnished to them by independent legal counsel and their own business judgment, to be relevant. They based their decisions on the following considerations, among others, although they did not identify any consideration or particular information that was controlling of their decisions:
The nature, extent and quality of the advisory services to be provided. The Board considered the nature and quality of the services provided by TAM and the Sub-Adviser to the Fund in the past, as well as the services anticipated to be provided in the future. The Trustees also reviewed the Sub-Adviser’s investment approach for the Fund. The Trustees noted that they receive, on a quarterly basis, an execution analysis from Capital Institutional Services, Inc. (CAPIS), an independent provider of trade analyses, for the Sub-Adviser and a comparison of trading results against a peer universe of managers. The Board concluded that TAM and the Sub-Adviser are capable of providing high quality services to the Fund, as indicated by the nature and quality of services provided in the past by TAM a nd the Sub-Adviser for this Fund and the experience, capability and integrity of TAM’s senior management, the financial resources of TAM and the Sub-Adviser, TAM’s management oversight process and the professional qualifications of the portfolio management team of the Sub-Adviser. The Trustees determined that TAM and the Sub-Adviser can provide investment and related services that are appropriate in scope and extent in light of the Fund’s operations, the competitive landscape of the investment company business and investor needs.
The investment performance of the Fund. The Board examined the short and longer-term performance of the Fund, including relative performance against a peer universe of comparable mutual funds as prepared by Lipper for various trailing periods ended December 31, 2008. The Board noted that the Fund’s performance was below the median for its peer universe for the past 1- and 3-year periods and in line with the median for its peer universe for the past 5-year period. On the basis of the Board’s assessment of the nature, extent and quality of advisory services to be provided or procured by TAM and the Sub-Adviser, the Board concluded that TAM and the Sub-Adviser are capable of generating a level of investment performance that is appropriate in light of the Fund’s investment objectives, policies and strategies and competitive with other investment companies.
The cost of advisory services provided and the level of profitability. The Board reviewed profitability information of TAM’s cost of procuring fund management services, as well as the costs of provision of administration, fund accounting and other services, to the Fund and to Transamerica Funds as a whole by TAM and its affiliates. The Board reviewed the management and sub-advisory fees for the Fund. The Trustees noted that the Fund’s contractual management fee and total expenses were above the medians for its expense group and universe. It was noted that the peer group was challenging due to varying asset allocations. Based on their review, the Trustees determined that the management and sub-advisory fees of the Fund generally are appropriate in light of the services expected to be provided or procured, and the anticipated profitability of the relationship between the Fund, TAM and its affiliates, and the Sub-Adviser. In making these observations and determinations, the Board reviewed comparative information provided by Lipper.
Whether fee levels reflect economies of scale and the extent to which economies of scale would be realized as the Fund grows. The Trustees considered the economies of scale with respect to the management of the Fund, whether the Fund had appropriately benefited from any economies of scale, and whether there was potential for realization of any further economies of scale. In evaluating the extent to which the management fees payable under the Investment Advisory and Sub-Advisory Agreements reflect economies of scale or will permit economies of scale to be realized in the future, the Board noted that TAM and the Sub-Adviser offer breakpoints which appropriately benefit investors by passing on economies of scale in the form of lower management fees as the level of assets grows. The Trustees also concluded that they will have the opportunity to periodically reexamine whether the Fund has achieved economies of scale, and the appropriateness of management fees payable to TAM and fees paid to the Sub-Adviser, in the future.
Benefits to TAM, its affiliates, or the Sub-Adviser from their relationship with the Fund. The Board concluded that other benefits anticipated to be derived by TAM, its affiliates, and the Sub-Adviser from their relationships with the Fund are expected to be consistent with industry practice and the best interests of the Fund and its shareholders. The Trustees noted that TAM would not realize soft dollar benefits from its relationship with the Fund. The Board also noted that the Sub-Adviser is participating in a brokerage program pursuant to which a portion of brokerage commissions paid by the Fund is recaptured for the benefit of the Fund and its shareholders, thus limiting the amount of soft dollar arrangements the Sub-Adviser may engage in with respect to the Fund’s brokerage transactions.
124
Other considerations. The Board determined that TAM has made a substantial commitment to the recruitment and retention of high quality personnel, and maintains the financial, compliance and operational resources reasonably necessary to manage the Fund in a professional manner that is consistent with the best interests of the Fund and its shareholders. In this regard, the Trustees favorably considered the procedures and policies in place by TAM to enforce compliance with applicable laws and regulations and oversee the portfolio management activities of the Sub-Adviser. The Trustees also determined that TAM has made a significant entrepreneurial commitment to the management and success of the Fund, reflected by TAM’s expense limitation and fee waiver arrangements with the Fund, which may result in TAM waiving fees for the benefit of shareholders.
Conclusion. After consideration of the factors described above as well as other factors, the Trustees, including all of the independent members of the Board, concluded that the Investment Advisory Agreement and the Sub-Advisory Agreement, including the fees payable thereunder, were fair and reasonable and voted to approve the renewal of the Investment Advisory Agreement and the Sub-Advisory Agreement for the Fund.
125
TRANSAMERICA CONVERTIBLE SECURITIES
INVESTMENT ADVISORY AND SUB-ADVISORY AGREEMENTS - CONTRACT RENEWAL
(unaudited)
At a meeting of the Board of Trustees of Transamerica Funds (the “Board”) held on June 4, 2009, the Board reviewed and considered the renewal of the investment advisory agreement (the “Investment Advisory Agreement”) between Transamerica Convertible Securities (the “Fund”) and Transamerica Asset Management, Inc. (“TAM”), as well as the renewal of the investment sub-advisory agreement (the “Sub-Advisory Agreement”) of the Fund between TAM and Transamerica Investment Management, LLC (the “Sub-Adviser”), to determine whether the agreements should be renewed.
Following their review and consideration, the Trustees determined that the renewal of the Investment Advisory Agreement and the Sub-Advisory Agreement would enable shareholders of the Fund to obtain high quality services at a cost that is appropriate, fair, and in the best interests of Fund shareholders. The Board, including the independent members of the Board, unanimously approved the renewal of the Investment Advisory Agreement and Sub-Advisory Agreement through June 30, 2010. In reaching their decision, the Trustees requested and obtained from TAM and the Sub-Adviser such information as they deemed reasonably necessary to evaluate the agreements, including information about fees and performance of comparable funds managed by the Sub-Adviser. The Trustees noted that TAM and the Sub-Adviser do not manage any comparable separate accounts. The Trustees also carefully considered information they had previously received from TAM and the Sub-Adviser as part of their regular oversight of the Fund, as well as comparative fee, expense, and performance information prepared by Lipper Inc. (“Lipper”), an independent provider of mutual fund performance, and fee and expense information and profitability data prepared by management. In considering the proposed continuation of the Investment Advisory and Sub-Advisory Agreements, the Trustees evaluated a number of considerations that they believed, in light of the legal advice furnished to them by independent legal counsel and their own business judgment, to be relevant. They based their decisions on the following considerations, among others, although they did not identify any consideration or particular information that was controlling of their decisions:
The nature, extent and quality of the advisory services to be provided. The Board considered the nature and quality of the services provided by TAM and the Sub-Adviser to the Fund in the past, as well as the services anticipated to be provided in the future. The Trustees also reviewed the Sub-Adviser’s investment approach for the Fund. The Trustees noted that they receive, on a quarterly basis, an execution analysis from Capital Institutional Services, Inc. (CAPIS), an independent provider of trade analyses, for the Sub-Adviser and a comparison of trading results against a peer universe of managers. The Board concluded that TAM and the Sub-Adviser are capable of providing high quality services to the Fund, as indicated by the nature and quality of services provided in the past by TAM a nd the Sub-Adviser for this Fund and the experience, capability and integrity of TAM’s senior management, the financial resources of TAM and the Sub-Adviser, TAM’s management oversight process and the professional qualifications of the portfolio management team of the Sub-Adviser. The Trustees determined that TAM and the Sub-Adviser can provide investment and related services that are appropriate in scope and extent in light of the Fund’s operations, the competitive landscape of the investment company business and investor needs.
The investment performance of the Fund. The Board examined the short and longer-term performance of the Fund, including relative performance against a peer universe of comparable mutual funds as prepared by Lipper for various trailing periods ended December 31, 2008. The Board noted that the Fund’s performance was below the median for its peer universe for the past 1-year period and above the median for its peer universe for the past 3- and 5-year periods. On the basis of the Board’s assessment of the nature, extent and quality of advisory services to be provided or procured by TAM and the Sub-Adviser, the Board concluded that TAM and the Sub-Adviser are capable of generating a level of investment performance that is appropriate in light of the Fund’s investment objectives, policies and strategies and competitive with other investment companies.
The cost of advisory services provided and the level of profitability. The Board reviewed profitability information of TAM’s cost of procuring fund management services, as well as the costs of provision of administration, fund accounting and other services, to the Fund and to Transamerica Funds as a whole by TAM and its affiliates. The Board reviewed the management and sub-advisory fees for the Fund. The Trustees noted that the Fund’s contractual management fee and total expenses were above the medians for its expense group and universe. It was noted that the Fund’s contractual management fee was within 7 basis points of the expense group median. Based on their review, the Trustees determined that the management and sub-advisory fees of the Fund generally are appropriate in light of the services expected to be provided or procured, and the anticipated profitability of the relationship between the Fund, TAM and its affiliates, and the Sub-Adviser. In making these observations and determinations, the Board reviewed comparative information provided by Lipper.
Whether fee levels reflect economies of scale and the extent to which economies of scale would be realized as the Fund grows. The Trustees considered the economies of scale with respect to the management of the Fund, whether the Fund had appropriately benefited from any economies of scale, and whether there was potential for realization of any further economies of scale. In evaluating the extent to which the management fees payable under the Investment Advisory and Sub-Advisory Agreements reflect economies of scale or will permit economies of scale to be realized in the future, the Board noted that TAM offers breakpoints which appropriately benefit investors by passing on economies of scale in the form of lower management fees as the level of assets grows. The Trustees also concluded that they will have the opportunity to periodically reexamine whether the Fund has achieved economies of scale, and the appropriateness of management fees payable to TAM and fees paid to the Sub-Adviser, in the future.
Benefits to TAM, its affiliates, or the Sub-Adviser from their relationship with the Fund. The Board concluded that other benefits anticipated to be derived by TAM, its affiliates, and the Sub-Adviser from their relationships with the Fund are expected to be consistent with industry practice and the best interests of the Fund and its shareholders. The Trustees noted that TAM would not realize soft dollar benefits from its relationship with the Fund.
126
Other considerations. The Board determined that TAM has made a substantial commitment to the recruitment and retention of high quality personnel, and maintains the financial, compliance and operational resources reasonably necessary to manage the Fund in a professional manner that is consistent with the best interests of the Fund and its shareholders. In this regard, the Trustees favorably considered the procedures and policies in place by TAM to enforce compliance with applicable laws and regulations and oversee the portfolio management activities of the Sub-Adviser. The Trustees also determined that TAM has made a significant entrepreneurial commitment to the management and success of the Fund, reflected by TAM’s expense limitation and fee waiver arrangements with the Fund, which may result in TAM waiving fees for the benefit of shareholders.
Conclusion. After consideration of the factors described above as well as other factors, the Trustees, including all of the independent members of the Board, concluded that the Investment Advisory Agreement and the Sub-Advisory Agreement, including the fees payable thereunder, were fair and reasonable and voted to approve the renewal of the Investment Advisory Agreement and the Sub-Advisory Agreement for the Fund.
127
TRANSAMERICA EQUITY
INVESTMENT ADVISORY AND SUB-ADVISORY AGREEMENTS - CONTRACT RENEWAL
(unaudited)
At a meeting of the Board of Trustees of Transamerica Funds (the “Board”) held on June 4, 2009, the Board reviewed and considered the renewal of the investment advisory agreement (the “Investment Advisory Agreement”) between Transamerica Equity (the “Fund”) and Transamerica Asset Management, Inc. (“TAM”), as well as the renewal of the investment sub-advisory agreement (the “Sub-Advisory Agreement”) of the Fund between TAM and Transamerica Investment Management, LLC (the “Sub-Adviser”), to determine whether the agreements should be renewed.
Following their review and consideration, the Trustees determined that the renewal of the Investment Advisory Agreement and the Sub-Advisory Agreement would enable shareholders of the Fund to obtain high quality services at a cost that is appropriate, fair, and in the best interests of Fund shareholders. The Board, including the independent members of the Board, unanimously approved the renewal of the Investment Advisory Agreement and Sub-Advisory Agreement through June 30, 2010. In reaching their decision, the Trustees requested and obtained from TAM and the Sub-Adviser such information as they deemed reasonably necessary to evaluate the agreements, including information about fees and performance of comparable funds managed by the Sub-Adviser. The Trustees noted that TAM and the Sub-Adviser do not manage any comparable separate accounts. The Trustees also carefully considered information they had previously received from TAM and the Sub-Adviser as part of their regular oversight of the Fund, as well as comparative fee, expense, and performance information prepared by Lipper Inc. (“Lipper”), an independent provider of mutual fund performance, and fee and expense information and profitability data prepared by management. In considering the proposed continuation of the Investment Advisory and Sub-Advisory Agreements, the Trustees evaluated a number of considerations that they believed, in light of the legal advice furnished to them by independent legal counsel and their own business judgment, to be relevant. They based their decisions on the following considerations, among others, although they did not identify any consideration or particular information that was controlling of their decisions:
The nature, extent and quality of the advisory services to be provided. The Board considered the nature and quality of the services provided by TAM and the Sub-Adviser to the Fund in the past, as well as the services anticipated to be provided in the future. The Trustees also reviewed the Sub-Adviser’s investment approach for the Fund. The Trustees noted that they receive, on a quarterly basis, an execution analysis from Capital Institutional Services, Inc. (CAPIS), an independent provider of trade analyses, for the Sub-Adviser and a comparison of trading results against a peer universe of managers. The Board concluded that TAM and the Sub-Adviser are capable of providing high quality services to the Fund, as indicated by the nature and quality of services provided in the past by TAM a nd the Sub-Adviser for this Fund and the experience, capability and integrity of TAM’s senior management, the financial resources of TAM and the Sub-Adviser, TAM’s management oversight process and the professional qualifications of the portfolio management team of the Sub-Adviser. The Trustees determined that TAM and the Sub-Adviser can provide investment and related services that are appropriate in scope and extent in light of the Fund’s operations, the competitive landscape of the investment company business and investor needs.
The investment performance of the Fund. The Board examined the short and longer-term performance of the Fund, including relative performance against a peer universe of comparable mutual funds as prepared by Lipper for various trailing periods ended December 31, 2008. The Board noted that the Fund’s performance was below the median for its peer universe for the past 1- and 3-year periods and in line with the median for its peer universe for the past 5-year period. The Board discussed the concentrated approach taken by the Fund’s management team. The Trustees agreed that they would continue to monitor the performance of the Fund closely. On the basis of the Board’s assessment of the nature, extent and quality of advisory services to be provided or procured by TAM and the Sub-Adviser, the Board concluded that TAM and the Sub-Adviser are capable of generating a level of investment performance that is appropriate in light of the Fund’s investment objectives, policies and strategies and competitive with other investment companies.
The cost of advisory services provided and the level of profitability. The Board reviewed profitability information of TAM’s cost of procuring fund management services, as well as the costs of provision of administration, fund accounting and other services, to the Fund and to Transamerica Funds as a whole by TAM and its affiliates. The Board reviewed the management and sub-advisory fees for the Fund. The Trustees noted that the Fund’s contractual management fee was in line with the medians for its expense group and universe and that the total expenses of the Fund were above the medians for its expense group and universe. Based on their review, the Trustees determined that the management and sub-advisory fees of the Fund generally are appropriate in light of the services expected to be provided or procured, and the anticipated profitability of the relationship between the Fund, TAM and its affiliates, and the Sub-Adviser. In making these observations and determinations, the Board reviewed comparative information provided by Lipper.
Whether fee levels reflect economies of scale and the extent to which economies of scale would be realized as the Fund grows. The Trustees considered the economies of scale with respect to the management of the Fund, whether the Fund had appropriately benefited from any economies of scale, and whether there was potential for realization of any further economies of scale. In evaluating the extent to which the management fees payable under the Investment Advisory and Sub-Advisory Agreements reflect economies of scale or will permit economies of scale to be realized in the future, the Board noted that TAM and the Sub-Adviser offer breakpoints which appropriately benefit investors by passing on economies of scale in the form of lower management fees as the level of assets grows. The Trustees also concluded that they will have the opportunity to periodically reexamine whether the Fund has achieved economies of scale, and the appropriateness of management fees payable to TAM and fees paid to the Sub-Adviser, in the future.
Benefits to TAM, its affiliates, or the Sub-Adviser from their relationship with the Fund. The Board concluded that other benefits anticipated to be derived by TAM, its affiliates, and the Sub-Adviser from their relationships with the Fund are expected to be consistent with industry practice and the best interests of the Fund and its shareholders. The Trustees noted that TAM would not realize soft dollar benefits from its relationship with the Fund. The Board also noted that the Sub-Adviser is participating in a brokerage program pursuant to which a portion of brokerage commissions paid by the Fund is recaptured for the benefit of the Fund and its shareholders, thus limiting the amount of soft dollar arrangements the Sub-Adviser may engage in with respect to the Fund’s brokerage transactions.
128
Other considerations. The Board determined that TAM has made a substantial commitment to the recruitment and retention of high quality personnel, and maintains the financial, compliance and operational resources reasonably necessary to manage the Fund in a professional manner that is consistent with the best interests of the Fund and its shareholders. In this regard, the Trustees favorably considered the procedures and policies in place by TAM to enforce compliance with applicable laws and regulations and oversee the portfolio management activities of the Sub-Adviser. The Trustees also determined that TAM has made a significant entrepreneurial commitment to the management and success of the Fund, reflected by TAM’s expense limitation and fee waiver arrangements with the Fund, which may result in TAM waiving fees for the benefit of shareholders.
Conclusion. After consideration of the factors described above as well as other factors, the Trustees, including all of the independent members of the Board, concluded that the Investment Advisory Agreement and the Sub-Advisory Agreement, including the fees payable thereunder, were fair and reasonable and voted to approve the renewal of the Investment Advisory Agreement and the Sub-Advisory Agreement for the Fund.
129
TRANSAMERICA FLEXIBLE INCOME
INVESTMENT ADVISORY AND SUB-ADVISORY AGREEMENTS - CONTRACT RENEWAL
(unaudited)
At a meeting of the Board of Trustees of Transamerica Funds (the “Board”) held on June 4, 2009, the Board reviewed and considered the renewal of the investment advisory agreement (the “Investment Advisory Agreement”) between Transamerica Flexible Income (the “Fund”) and Transamerica Asset Management, Inc. (“TAM”), as well as the renewal of the investment sub-advisory agreement (the “Sub-Advisory Agreement”) of the Fund between TAM and Transamerica Investment Management, LLC (the “Sub-Adviser”), to determine whether the agreements should be renewed.
Following their review and consideration, the Trustees determined that the renewal of the Investment Advisory Agreement and the Sub-Advisory Agreement would enable shareholders of the Fund to obtain high quality services at a cost that is appropriate, fair, and in the best interests of Fund shareholders. The Board, including the independent members of the Board, unanimously approved the renewal of the Investment Advisory Agreement and Sub-Advisory Agreement through June 30, 2010. In reaching their decision, the Trustees requested and obtained from TAM and the Sub-Adviser such information as they deemed reasonably necessary to evaluate the agreements, including information about fees and performance of comparable funds managed by the Sub-Adviser. The Trustees noted that TAM and the Sub-Adviser do not manage any comparable separate accounts. The Trustees also carefully considered information they had previously received from TAM and the Sub-Adviser as part of their regular oversight of the Fund, as well as comparative fee, expense, and performance information prepared by Lipper Inc. (“Lipper”), an independent provider of mutual fund performance, and fee and expense information and profitability data prepared by management. In considering the proposed continuation of the Investment Advisory and Sub-Advisory Agreements, the Trustees evaluated a number of considerations that they believed, in light of the legal advice furnished to them by independent legal counsel and their own business judgment, to be relevant. They based their decisions on the following considerations, among others, although they did not identify any consideration or particular information that was controlling of their decisions:
The nature, extent and quality of the advisory services to be provided. The Board considered the nature and quality of the services provided by TAM and the Sub-Adviser to the Fund in the past, as well as the services anticipated to be provided in the future. The Trustees also reviewed the Sub-Adviser’s investment approach for the Fund. The Trustees noted that they receive, on a quarterly basis, an execution analysis from Capital Institutional Services, Inc. (CAPIS), an independent provider of trade analyses, for the Sub-Adviser and a comparison of trading results against a peer universe of managers. The Board concluded that TAM and the Sub-Adviser are capable of providing high quality services to the Fund, as indicated by the nature and quality of services provided in the past by TAM a nd the Sub-Adviser for this Fund and the experience, capability and integrity of TAM’s senior management, the financial resources of TAM and the Sub-Adviser, TAM’s management oversight process and the professional qualifications of the portfolio management team of the Sub-Adviser. The Trustees determined that TAM and the Sub-Adviser can provide investment and related services that are appropriate in scope and extent in light of the Fund’s operations, the competitive landscape of the investment company business and investor needs.
The investment performance of the Fund. The Board examined the short and longer-term performance of the Fund, including relative performance against a peer universe of comparable mutual funds as prepared by Lipper for various trailing periods ended December 31, 2008. The Board noted that the Fund’s performance was below the median for its peer universe for the past 1-, 3- and 5- year periods. The Board discussed the reasons for the Fund’s underperformance with TAM. It was noted that the Fund’s new portfolio management team, which began managing the Fund in October 2008, has repositioned and diversified the Fund in an attempt to improve performance and consistency. The Trustees agreed that they would continue to monitor the performance of the Fund closely. On the basis of the Board’s assessment of the nature, extent and quality of advisory services to be provided or procured by TAM and the Sub-Adviser, the Board concluded that TAM and the Sub-Adviser are capable of generating a level of investment performance that is appropriate in light of the Fund’s investment objectives, policies and strategies and competitive with other investment companies.
The cost of advisory services provided and the level of profitability. The Board reviewed profitability information of TAM’s cost of procuring fund management services, as well as the costs of provision of administration, fund accounting and other services, to the Fund and to Transamerica Funds as a whole by TAM and its affiliates. The Board reviewed the management and sub-advisory fees for the Fund. The Trustees noted that the Fund’s contractual management fee and total expenses were above the medians for its expense group and universe. It was noted that TAM voluntarily lowered its management fee in 2007, and again in 2008. Management also noted that it was exploring alternatives to improve fees, including through a potential reorganization. Based on their review, the Trustees determined that the management and sub-advisory fees of the Fund generally are appropriate in light of the services expected to be provided or procured, and the anticipated profitability of the relationship between the Fund, TAM and its affiliates, and the Sub-Adviser. In making these observations and determinations, the Board reviewed comparative information provided by Lipper.
Whether fee levels reflect economies of scale and the extent to which economies of scale would be realized as the Fund grows. The Trustees considered the economies of scale with respect to the management of the Fund, whether the Fund had appropriately benefited from any economies of scale, and whether there was potential for realization of any further economies of scale. In evaluating the extent to which the management fees payable under the Investment Advisory and Sub-Advisory Agreements reflect economies of scale or will permit economies of scale to be realized in the future, the Board noted that TAM and the Sub-Adviser offer breakpoints which appropriately benefit investors by passing on economies of scale in the form of lower management fees as the level of assets grows. The Trustees also concluded that they will have the opportunity to periodically reexamine whether the Fund has achieved economies of scale, and the appropriateness of management fees payable to TAM and fees paid to the Sub-Adviser, in the future.
Benefits to TAM, its affiliates, or the Sub-Adviser from their relationship with the Fund. The Board concluded that other benefits anticipated to be derived by TAM, its affiliates, and the Sub-Adviser from their relationships with the Fund are expected to be consistent with industry practice and the best interests of the Fund and its shareholders. The Trustees noted that TAM would not realize soft dollar benefits from its relationship with the Fund.
130
Other considerations. The Board determined that TAM has made a substantial commitment to the recruitment and retention of high quality personnel, and maintains the financial, compliance and operational resources reasonably necessary to manage the Fund in a professional manner that is consistent with the best interests of the Fund and its shareholders. In this regard, the Trustees favorably considered the procedures and policies in place by TAM to enforce compliance with applicable laws and regulations and oversee the portfolio management activities of the Sub-Adviser. The Trustees also determined that TAM has made a significant entrepreneurial commitment to the management and success of the Fund, reflected by TAM’s expense limitation and fee waiver arrangements with the Fund, which may result in TAM waiving fees for the benefit of shareholders.
Conclusion. After consideration of the factors described above as well as other factors, the Trustees, including all of the independent members of the Board, concluded that the Investment Advisory Agreement and the Sub-Advisory Agreement, including the fees payable thereunder, were fair and reasonable and voted to approve the renewal of the Investment Advisory Agreement and the Sub-Advisory Agreement for the Fund.
131
TRANSAMERICA GROWTH OPPORTUNITIES
INVESTMENT ADVISORY AND SUB-ADVISORY AGREEMENTS - CONTRACT RENEWAL
(unaudited)
At a meeting of the Board of Trustees of Transamerica Funds (the “Board”) held on June 4, 2009, the Board reviewed and considered the renewal of the investment advisory agreement (the “Investment Advisory Agreement”) between Transamerica Growth Opportunities (the “Fund”) and Transamerica Asset Management, Inc. (“TAM”), as well as the renewal of the investment sub-advisory agreement (the “Sub-Advisory Agreement”) of the Fund between TAM and Transamerica Investment Management, LLC (the “Sub-Adviser”), to determine whether the agreements should be renewed.
Following their review and consideration, the Trustees determined that the renewal of the Investment Advisory Agreement and the Sub-Advisory Agreement would enable shareholders of the Fund to obtain high quality services at a cost that is appropriate, fair, and in the best interests of Fund shareholders. The Board, including the independent members of the Board, unanimously approved the renewal of the Investment Advisory Agreement and Sub-Advisory Agreement through June 30, 2010. In reaching their decision, the Trustees requested and obtained from TAM and the Sub-Adviser such information as they deemed reasonably necessary to evaluate the agreements, including information about fees and performance of comparable funds managed by the Sub-Adviser. The Trustees noted that TAM and the Sub-Adviser do not manage any comparable separate accounts. The Trustees also carefully considered information they had previously received from TAM and the Sub-Adviser as part of their regular oversight of the Fund, as well as comparative fee, expense, and performance information prepared by Lipper Inc. (“Lipper”), an independent provider of mutual fund performance, and fee and expense information and profitability data prepared by management. In considering the proposed continuation of the Investment Advisory and Sub-Advisory Agreements, the Trustees evaluated a number of considerations that they believed, in light of the legal advice furnished to them by independent legal counsel and their own business judgment, to be relevant. They based their decisions on the following considerations, among others, although they did not identify any consideration or particular information that was controlling of their decisions:
The nature, extent and quality of the advisory services to be provided. The Board considered the nature and quality of the services provided by TAM and the Sub-Adviser to the Fund in the past, as well as the services anticipated to be provided in the future. The Trustees also reviewed the Sub-Adviser’s investment approach for the Fund. The Trustees noted that they receive, on a quarterly basis, an execution analysis from Capital Institutional Services, Inc. (CAPIS), an independent provider of trade analyses, for the Sub-Adviser and a comparison of trading results against a peer universe of managers. The Board concluded that TAM and the Sub-Adviser are capable of providing high quality services to the Fund, as indicated by the nature and quality of services provided in the past by TAM a nd the Sub-Adviser for this Fund and the experience, capability and integrity of TAM’s senior management, the financial resources of TAM and the Sub-Adviser, TAM’s management oversight process and the professional qualifications of the portfolio management team of the Sub-Adviser. The Trustees determined that TAM and the Sub-Adviser can provide investment and related services that are appropriate in scope and extent in light of the Fund’s operations, the competitive landscape of the investment company business and investor needs.
The investment performance of the Fund. The Board examined the short and longer-term performance of the Fund, including relative performance against a peer universe of comparable mutual funds as prepared by Lipper for various trailing periods ended December 31, 2008. The Board noted that the Fund’s performance was above the median for its peer universe for the past 1-, 3- and 5- year periods. On the basis of the Board’s assessment of the nature, extent and quality of advisory services to be provided or procured by TAM and the Sub-Adviser, the Board concluded that TAM and the Sub-Adviser are capable of generating a level of investment performance that is appropriate in light of the Fund’s investment objectives, policies and strategies and competitive with other investment companies.
The cost of advisory services provided and the level of profitability. The Board reviewed profitability information of TAM’s cost of procuring fund management services, as well as the costs of provision of administration, fund accounting and other services, to the Fund and to Transamerica Funds as a whole by TAM and its affiliates. The Board reviewed the management and sub-advisory fees for the Fund. The Trustees noted that the Fund’s contractual management fee was in line with the medians for its expense group and universe and that the total expenses of the Fund were above the medians for its expense group and universe. Based on their review, the Trustees determined that the management and sub-advisory fees of the Fund generally are appropriate in light of the services expected to be provided or procured, and the anticipated profitability of the relationship between the Fund, TAM and its affiliates, and the Sub-Adviser. In making these observations and determinations, the Board reviewed comparative information provided by Lipper.
Whether fee levels reflect economies of scale and the extent to which economies of scale would be realized as the Fund grows. The Trustees considered the economies of scale with respect to the management of the Fund, whether the Fund had appropriately benefited from any economies of scale, and whether there was potential for realization of any further economies of scale. In evaluating the extent to which the management fees payable under the Investment Advisory and Sub-Advisory Agreements reflect economies of scale or will permit economies of scale to be realized in the future, the Board noted that TAM and the Sub-Adviser offer breakpoints which appropriately benefit investors by passing on economies of scale in the form of lower management fees as the level of assets grows. The Trustees also concluded that they will have the opportunity to periodically reexamine whether the Fund has achieved economies of scale, and the appropriateness of management fees payable to TAM and fees paid to the Sub-Adviser, in the future.
Benefits to TAM, its affiliates, or the Sub-Adviser from their relationship with the Fund. The Board concluded that other benefits anticipated to be derived by TAM, its affiliates, and the Sub-Adviser from their relationships with the Fund are expected to be consistent with industry practice and the best interests of the Fund and its shareholders. The Trustees noted that TAM would not realize soft dollar benefits from its relationship with the Fund. The Board also noted that the Sub-Adviser is participating in a brokerage program pursuant to which a portion of brokerage commissions paid by the Fund is recaptured for the benefit of the Fund and its shareholders, thus limiting the amount of soft dollar arrangements the Sub-Adviser may engage in with respect to the Fund’s brokerage transactions.
132
Other considerations. The Board determined that TAM has made a substantial commitment to the recruitment and retention of high quality personnel, and maintains the financial, compliance and operational resources reasonably necessary to manage the Fund in a professional manner that is consistent with the best interests of the Fund and its shareholders. In this regard, the Trustees favorably considered the procedures and policies in place by TAM to enforce compliance with applicable laws and regulations and oversee the portfolio management activities of the Sub-Adviser. The Trustees also determined that TAM has made a significant entrepreneurial commitment to the management and success of the Fund, reflected by TAM’s expense limitation and fee waiver arrangements with the Fund, which may result in TAM waiving fees for the benefit of shareholders.
Conclusion. After consideration of the factors described above as well as other factors, the Trustees, including all of the independent members of the Board, concluded that the Investment Advisory Agreement and the Sub-Advisory Agreement, including the fees payable thereunder, were fair and reasonable and voted to approve the renewal of the Investment Advisory Agreement and the Sub-Advisory Agreement for the Fund.
133
TRANSAMERICA HIGH YIELD BOND
INVESTMENT ADVISORY AND SUB-ADVISORY AGREEMENTS - CONTRACT RENEWAL
(unaudited)
At a meeting of the Board of Trustees of Transamerica Funds (the “Board”) held on June 4, 2009, the Board reviewed and considered the renewal of the investment advisory agreement (the “Investment Advisory Agreement”) between Transamerica High Yield Bond (the “Fund”) and Transamerica Asset Management, Inc. (“TAM”), as well as the renewal of the investment sub-advisory agreement (the “Sub-Advisory Agreement”) of the Fund between TAM and AEGON USA Investment Management, LLC (the “Sub-Adviser”), to determine whether the agreements should be renewed.
Following their review and consideration, the Trustees determined that the renewal of the Investment Advisory Agreement and the Sub-Advisory Agreement would enable shareholders of the Fund to obtain high quality services at a cost that is appropriate, fair, and in the best interests of Fund shareholders. The Board, including the independent members of the Board, unanimously approved the renewal of the Investment Advisory Agreement and Sub-Advisory Agreement through June 30, 2010. In reaching their decision, the Trustees requested and obtained from TAM and the Sub-Adviser such information as they deemed reasonably necessary to evaluate the agreements, including information about fees and performance of comparable funds managed by the Sub-Adviser. The Trustees also carefully considered information they had previously received from TAM and the Sub-Adviser as part of their regular oversight of the Fund, as well as comparative fee, expense, and performance information prepared by Lipper Inc. (“Lipper”), an independent provider of mutual fund performance, and fee and expense information and profitability data prepared by management. In considering the proposed continuation of the Investment Advisory and Sub-Advisory Agreements, the Trustees evaluated a number of considerations that they believed, in light of the legal advice furnished to them by independent legal counsel and their own business judgment, to be relevant. They based their decisions on the following considerations, among others, although they did not identify any consideration or particular information that was controlling of their decisions:
The nature, extent and quality of the advisory services to be provided. The Board considered the nature and quality of the services provided by TAM and the Sub-Adviser to the Fund in the past, as well as the services anticipated to be provided in the future. The Trustees also reviewed the Sub-Adviser’s investment approach for the Fund. The Trustees noted that they receive, on a quarterly basis, an execution analysis from Capital Institutional Services, Inc. (CAPIS), an independent provider of trade analyses, for the Sub-Adviser and a comparison of trading results against a peer universe of managers. The Board concluded that TAM and the Sub-Adviser are capable of providing high quality services to the Fund, as indicated by the nature and quality of services provided in the past by TAM a nd the Sub-Adviser for this Fund and the experience, capability and integrity of TAM’s senior management, the financial resources of TAM and the Sub-Adviser, TAM’s management oversight process and the professional qualifications of the portfolio management team of the Sub-Adviser. The Trustees determined that TAM and the Sub-Adviser can provide investment and related services that are appropriate in scope and extent in light of the Fund’s operations, the competitive landscape of the investment company business and investor needs.
The investment performance of the Fund. The Board examined the short and longer-term performance of the Fund, including rela tive performance against a peer universe of comparable mutual funds as prepared by Lipper for various trailing periods ended December 31, 2008. The Board noted that the Fund’s performance was in line with the median for its peer universe for the past 1- and 3-year periods and below the median for the past 5-year period. On the basis of the Board’s assessment of the nature, extent and quality of advisory services to be provided or procured by TAM and the Sub-Adviser, the Board concluded that TAM and the Sub-Adviser are capable of generating a level of investment performance that is appropriate in light of the Fund’s investment objectives, policies and strategies and competitive with other investment companies.
The cost of advisory services provided and the level of profitability. The Board reviewed profitability information of TAM’s cost of procuring fund management services, as well as the costs of provision of administration, fund accounting and other services, to the Fund and to Transamerica Funds as a whole by TAM and its affiliates. The Board reviewed the management and sub-advisory fees for the Fund. The Trustees noted that the Fund’s contractual management fee was in line with the medians for its peer group and peer universe and that the total expenses of the Fund were above the medians for its peer group and peer universe. Based on their review, the Trustees determined that the management and sub-advisory fees of the Fund generally are appropriate in light of the services expected to be provided or procured, and the anticipated profitability of the relationship between the Fund, TAM and its affiliates, and the Sub-Adviser. In making these observations and determinations, the Board reviewed comparative information provided by Lipper.
Whether fee levels reflect economies of scale and the extent to which economies of scale would be realized as the Fund grows. The Trustees considered the economies of scale with respect to the management of the Fund, whether the Fund had appropriately benefited from any economies of scale, and whether there was potential for realization of any further economies of scale. In evaluating the extent to which the management fees payable under the Investment Advisory and Sub-Advisory Agreements reflect economies of scale or will permit economies of scale to be realized in the future, the Board noted that TAM and the Sub-Adviser offer breakpoints which appropriately benefit investors by passing on economies of scale in the form of lower management fees as the level of assets grows. The Trustees also concluded that they will have the opportunity to periodically reexamine whether the Fund has achieved economies of scale, and the appropriateness of management fees payable to TAM and fees paid to the Sub-Adviser, in the future.
Benefits to TAM, its affiliates, or the Sub-Adviser from their relationship with the Fund. The Board concluded that other benefits anticipated to be derived by TAM, its affiliates, and the Sub-Adviser from their relationships with the Fund are expected to be consistent with industry practice and the best interests of the Fund and its shareholders. The Trustees noted that TAM would not realize soft dollar benefits from its relationship with the Fund.
134
Other considerations. The Board determined that TAM has made a substantial commitment to the recruitment and retention of high quality personnel, and maintains the financial, compliance and operational resources reasonably necessary to manage the Fund in a professional manner that is consistent with the best interests of the Fund and its shareholders. In this regard, the Trustees favorably considered the procedures and policies in place by TAM to enforce compliance with applicable laws and regulations and oversee the portfolio management activities of the Sub-Adviser. The Trustees also determined that TAM has made a significant entrepreneurial commitment to the management and success of the Fund, reflected by TAM’s expense limitation and fee waiver arrangements with the Fund, which may result in TAM waiving fees for the benefit of shareholders.
Conclusion. After consideration of the factors described above as well as other factors, the Trustees, including all of the independent members of the Board, concluded that the Investment Advisory Agreement and the Sub-Advisory Agreement, including the fees payable thereunder, were fair and reasonable and voted to approve the renewal of the Investment Advisory Agreement and the Sub-Advisory Agreement for the Fund.
135
TRANSAMERICA LEGG MASON PARTNERS ALL CAP
INVESTMENT ADVISORY AND SUB-ADVISORY AGREEMENTS - CONTRACT RENEWAL
(unaudited)
At a meeting of the Board of Trustees of Transamerica Funds (the “Board”) held on June 4, 2009, the Board reviewed and considered the renewal of the investment advisory agreement (the “Investment Advisory Agreement”) between Transamerica Legg Mason Partners All Cap (the “Fund”) and Transamerica Asset Management, Inc. (“TAM”), as well as the renewal of the investment sub-advisory agreement (the “Sub-Advisory Agreement”) of the Fund between TAM and ClearBridge Advisors, LLC (the “Sub-Adviser”), to determine whether the agreements should be renewed.
Following their review and consideration, the Trustees determined that the renewal of the Investment Advisory Agreement and the Sub-Advisory Agreement would enable shareholders of the Fund to obtain high quality services at a cost that is appropriate, fair, and in the best interests of Fund shareholders. The Board, including the independent members of the Board, unanimously approved the renewal of the Investment Advisory Agreement and Sub-Advisory Agreement through June 30, 2010. In reaching their decision, the Trustees requested and obtained from TAM and the Sub-Adviser such information as they deemed reasonably necessary to evaluate the agreements, including information about fees and performance of comparable funds managed by the Sub-Adviser. The Trustees also carefully considered information they had previously received from TAM and the Sub-Adviser as part of their regular oversight of the Fund, as well as comparative fee, expense, and performance information prepared by Lipper Inc. (“Lipper”), an independent provider of mutual fund performance, and fee and expense information and profitability data prepared by management. In considering the proposed continuation of the Investment Advisory and Sub-Advisory Agreements, the Trustees evaluated a number of considerations that they believed, in light of the legal advice furnished to them by independent legal counsel and their own business judgment, to be relevant. They based their decisions on the following considerations, among others, although they did not identify any consideration or particular information that was controlling of their decisions:
The nature, extent and quality of the advisory services to be provided. The Board considered the nature and quality of the services provided by TAM and the Sub-Adviser to the Fund in the past, as well as the services anticipated to be provided in the future. The Trustees also reviewed the Sub-Adviser’s investment approach for the Fund. The Trustees noted that they receive, on a quarterly basis, an execution analysis from Capital Institutional Services, Inc. (CAPIS), an independent provider of trade analyses, for the Sub-Adviser and a comparison of trading results against a peer universe of managers. The Board concluded that TAM and the Sub-Adviser are capable of providing high quality services to the Fund, as indicated by the nature and quality of services provided in the past by TAM a nd the Sub-Adviser for this Fund and the experience, capability and integrity of TAM’s senior management, the financial resources of TAM and the Sub-Adviser, TAM’s management oversight process and the professional qualifications of the portfolio management team of the Sub-Adviser. The Trustees determined that TAM and the Sub-Adviser can provide investment and related services that are appropriate in scope and extent in light of the Fund’s operations, the competitive landscape of the investment company business and investor needs.
The investment performance of the Fund. The Board examined the short and longer-term performance of the Fund, including rela tive performance against a peer universe of comparable mutual funds as prepared by Lipper for various trailing periods ended December 31, 2008. The Board noted that the Fund’s performance was above the median for its peer universe for the past 1-year period, in line with the median for the past 3-year period and below the median for the past 5-year period. On the basis of the Board’s assessment of the nature, extent and quality of advisory services to be provided or procured by TAM and the Sub-Adviser, the Board concluded that TAM and the Sub-Adviser are capable of generating a level of investment performance that is appropriate in light of the Fund’s investment objectives, policies and strategies and competitive with other investment companies.
The cost of advisory services provided and the level of profitability. The Board reviewed profitability information of TAM’s cost of procuring fund management services, as well as the costs of provision of administration, fund accounting and other services, to the Fund and to Transamerica Funds as a whole by TAM and its affiliates. The Board reviewed the management and sub-advisory fees for the Fund. The Trustees noted that the Fund’s contractual management fee was in line with the median for its peer group and above the median for its peer universe and that the total expenses of the Fund were above the medians for its peer group and peer universe. Based on their review, the Trustees determined that the management and sub-advisory fees of the Fund generally are appropriate in light of the services expected to be provided or procured, and the anticipated profitability of the relationship between the Fund, TAM and its affiliates, and the Sub-Adviser. In making these observations and determinations, the Board reviewed comparative information provided by Lipper.
Whether fee levels reflect economies of scale and the extent to which economies of scale would be realized as the Fund grows. The Trustees considered the economies of scale with respect to the management of the Fund, whether the Fund had appropriately benefited from any economies of scale, and whether there was potential for realization of any further economies of scale. In evaluating the extent to which the management fees payable under the Investment Advisory and Sub-Advisory Agreements reflect economies of scale or will permit economies of scale to be realized in the future, the Board noted that TAM and the Sub-Adviser offer breakpoints which appropriately benefit investors by passing on economies of scale in the form of lower management fees as the level of assets grows. The Trustees also concluded that they will have the opportunity to periodically reexamine whether the Fund has achieved economies of scale, and the appropriateness of management fees payable to TAM and fees paid to the Sub-Adviser, in the future.
Benefits to TAM, its affiliates, or the Sub-Adviser from their relationship with the Fund. The Board concluded that other benefits anticipated to be derived by TAM, its affiliates, and the Sub-Adviser from their relationships with the Fund are expected to be consistent with industry practice and the best interests of the Fund and its shareholders. The Trustees noted that TAM would not realize soft dollar benefits from its relationship with the Fund. The Board also noted that the Sub-Adviser is participating in a brokerage program pursuant to which a portion of brokerage commissions paid by the Fund is recaptured for the benefit of the Fund and its shareholders, thus limiting the amount of soft dollar arrangements the Sub-Adviser may engage in with respect to the Fund’s brokerage transactions.
136
Other considerations. The Board determined that TAM has made a substantial commitment to the recruitment and retention of high quality personnel, and maintains the financial, compliance and operational resources reasonably necessary to manage the Fund in a professional manner that is consistent with the best interests of the Fund and its shareholders. In this regard, the Trustees favorably considered the procedures and policies in place by TAM to enforce compliance with applicable laws and regulations and oversee the portfolio management activities of the Sub-Adviser. The Trustees also determined that TAM has made a significant entrepreneurial commitment to the management and success of the Fund, reflected by TAM’s expense limitation and fee waiver arrangements with the Fund, which may result in TAM waiving fees for the benefit of shareholders.
Conclusion. After consideration of the factors described above as well as other factors, the Trustees, including all of the independent members of the Board, concluded that the Investment Advisory Agreement and the Sub-Advisory Agreement, including the fees payable thereunder, were fair and reasonable and voted to approve the renewal of the Investment Advisory Agreement and the Sub-Advisory Agreement for the Fund.
137
TRANSAMERICA MONEY MARKET
INVESTMENT ADVISORY AND SUB-ADVISORY AGREEMENTS - CONTRACT RENEWAL
(unaudited)
At a meeting of the Board of Trustees of Transamerica Funds (the “Board”) held on June 4, 2009, the Board reviewed and considered the renewal of the investment advisory agreement (the “Investment Advisory Agreement”) between Transamerica Money Market (the “Fund”) and Transamerica Asset Management, Inc. (“TAM”), as well as the renewal of the investment sub-advisory agreement (the “Sub-Advisory Agreement”) of the Fund between TAM and Transamerica Investment Management, LLC (the “Sub-Adviser”), to determine whether the agreements should be renewed.
Following their review and consideration, the Trustees determined that the renewal of the Investment Advisory Agreement and the Sub-Advisory Agreement would enable shareholders of the Fund to obtain high quality services at a cost that is appropriate, fair, and in the best interests of Fund shareholders. The Board, including the independent members of the Board, unanimously approved the renewal of the Investment Advisory Agreement and Sub-Advisory Agreement through June 30, 2010. In reaching their decision, the Trustees requested and obtained from TAM and the Sub-Adviser such information as they deemed reasonably necessary to evaluate the agreements, including information about fees and performance of comparable funds managed by the Sub-Adviser. The Trustees noted that TAM and the Sub-Adviser do not manage any comparable separate accounts. The Trustees also carefully considered information they had previously received from TAM and the Sub-Adviser as part of their regular oversight of the Fund, as well as comparative fee, expense, and performance information prepared by Lipper Inc. (“Lipper”), an independent provider of mutual fund performance, and fee and expense information and profitability data prepared by management. In considering the proposed continuation of the Investment Advisory and Sub-Advisory Agreements, the Trustees evaluated a number of considerations that they believed, in light of the legal advice furnished to them by independent legal counsel and their own business judgment, to be relevant. They based their decisions on the following considerations, among others, although they did not identify any consideration or particular information that was controlling of their decisions:
The nature, extent and quality of the advisory services to be provided. The Board considered the nature and quality of the services provided by TAM and the Sub-Adviser to the Fund in the past, as well as the services anticipated to be provided in the future. The Trustees also reviewed the Sub-Adviser’s investment approach for the Fund. The Board concluded that TAM and the Sub-Adviser are capable of providing high quality services to the Fund, as indicated by the nature and quality of services provided in the past by TAM and the Sub-Adviser for this Fund and the experience, capability and integrity of TAM’s senior management, the financial resources of TAM and the Sub-Adviser, TAM’s management oversight process and the professional qualifications of the portfolio management team of the S ub-Adviser. The Trustees determined that TAM and the Sub-Adviser can provide investment and related services that are appropriate in scope and extent in light of the Fund’s operations, the competitive landscape of the investment company business and investor needs.
The investment performance of the Fund. The Board examined the short and longer-term performance of the Fund, including relative performance against a peer universe of comparable mutual funds as prepared by Lipper for various trailing periods ended December 31, 2008. The Board noted that the Fund’s performance was in line with the median for its peer universe for the past 1-, 3- and 5- year periods. On the basis of the Board’s assessment of the nature, extent and quality of advisory services to be provided or procured by TAM and the Sub-Adviser, the Board concluded that TAM and the Sub-Adviser are capable of generating a level of investment performance that is appropriate in light of the Fund’s investment objectives, policies and strategies and competitive with other investment companies.
The cost of advisory services provided and the level of profitability. The Board reviewed profitability information of TAM’s cost of procuring fund management services, as well as the costs of provision of administration, fund accounting and other services, to the Fund and to Transamerica Funds as a whole by TAM and its affiliates. The Board reviewed the management and sub-advisory fees for the Fund. The Trustees noted that the Fund’s contractual management fee was in line with the median for its expense group and above the median for its expense universe and that the total expenses of the Fund were below the median for its expense group and universe. Based on their review, the Trustees determined that the management and sub-advisory fees of the Fund generally are appropriate in light of the services expected to be provided or procured, and the anticipated profitability of the relationship between the Fund, TAM and its affiliates, and the Sub-Adviser. In making these observations and determinations, the Board reviewed comparative information provided by Lipper.
Whether fee levels reflect economies of scale and the extent to which economies of scale would be realized as the Fund grows. The Trustees considered the economies of scale with respect to the management of the Fund, whether the Fund had appropriately benefited from any economies of scale, and whether there was potential for realization of any further economies of scale. Although TAM and the Sub-Adviser do not offer breakpoints, the Board noted TAM and the Sub-Adviser have competitive advisory fees at all asset levels, thereby mitigating the need for breakpoints. The Trustees also concluded that they will have the opportunity to periodically reexamine whether the Fund has achieved economies of scale, and the appropriateness of management fees payable to TAM and fees paid to the Sub-Adviser, in the future.
Benefits to TAM, its affiliates, or the Sub-Adviser from their relationship with the Fund. The Board concluded that other benefits anticipated to be derived by TAM, its affiliates, and the Sub-Adviser from their relationships with the Fund are expected to be consistent with industry practice and the best interests of the Fund and its shareholders. The Trustees noted that TAM would not realize soft dollar benefits from its relationship with the Fund.
138
Other considerations. The Board determined that TAM has made a substantial commitment to the recruitment and retention of high quality personnel, and maintains the financial, compliance and operational resources reasonably necessary to manage the Fund in a professional manner that is consistent with the best interests of the Fund and its shareholders. In this regard, the Trustees favorably considered the procedures and policies in place by TAM to enforce compliance with applicable laws and regulations and oversee the portfolio management activities of the Sub-Adviser. The Trustees also determined that TAM has made a significant entrepreneurial commitment to the management and success of the Fund, reflected by TAM’s expense limitation and fee waiver arrangements with the Fund, which may result in TAM waiving fees for the benefit of shareholders.
Conclusion. After consideration of the factors described above as well as other factors, the Trustees, including all of the independent members of the Board, concluded that the Investment Advisory Agreement and the Sub-Advisory Agreement, including the fees payable thereunder, were fair and reasonable and voted to approve the renewal of the Investment Advisory Agreement and the Sub-Advisory Agreement for the Fund.
139
TRANSAMERICA SCIENCE & TECHNOLOGY
INVESTMENT ADVISORY AND SUB-ADVISORY AGREEMENTS - CONTRACT RENEWAL
(unaudited)
At a meeting of the Board of Trustees of Transamerica Funds (the “Board”) held on June 4, 2009, the Board reviewed and considered the renewal of the investment advisory agreement (the “Investment Advisory Agreement”) between Transamerica Science & Technology (the “Fund”) and Transamerica Asset Management, Inc. (“TAM”), as well as the renewal of the investment sub-advisory agreement (the “Sub-Advisory Agreement”) of the Fund between TAM and Transamerica Investment Management, LLC (the “Sub-Adviser”), to determine whether the agreements should be renewed.
Following their review and consideration, the Trustees determined that the renewal of the Investment Advisory Agreement and the Sub-Advisory Agreement would enable shareholders of the Fund to obtain high quality services at a cost that is appropriate, fair, and in the best interests of Fund shareholders. The Board, including the independent members of the Board, unanimously approved the renewal of the Investment Advisory Agreement and Sub-Advisory Agreement through June 30, 2010. In reaching their decision, the Trustees requested and obtained from TAM and the Sub-Adviser such information as they deemed reasonably necessary to evaluate the agreements, including information about fees and performance of comparable funds managed by the Sub-Adviser. The Trustees noted that TAM and the Sub-Adviser do not manage any comparable separate accounts. The Trustees also carefully considered information they had previously received from TAM and the Sub-Adviser as part of their regular oversight of the Fund, as well as comparative fee, expense, and performance information prepared by Lipper Inc. (“Lipper”), an independent provider of mutual fund performance, and fee and expense information and profitability data prepared by management. In considering the proposed continuation of the Investment Advisory and Sub-Advisory Agreements, the Trustees evaluated a number of considerations that they believed, in light of the legal advice furnished to them by independent legal counsel and their own business judgment, to be relevant. They based their decisions on the following considerations, among others, although they did not identify any consideration or particular information that was controlling of their decisions:
The nature, extent and quality of the advisory services to be provided. The Board considered the nature and quality of the services provided by TAM and the Sub-Adviser to the Fund in the past, as well as the services anticipated to be provided in the future. The Trustees also reviewed the Sub-Adviser’s investment approach for the Fund. The Trustees noted that they receive, on a quarterly basis, an execution analysis from Capital Institutional Services, Inc. (CAPIS), an independent provider of trade analyses, for the Sub-Adviser and a comparison of trading results against a peer universe of managers. The Board concluded that TAM and the Sub-Adviser are capable of providing high quality services to the Fund, as indicated by the nature and quality of services provided in the past by TAM a nd the Sub-Adviser for this Fund and the experience, capability and integrity of TAM’s senior management, the financial resources of TAM and the Sub-Adviser, TAM’s management oversight process and the professional qualifications of the portfolio management team of the Sub-Adviser. The Trustees determined that TAM and the Sub-Adviser can provide investment and related services that are appropriate in scope and extent in light of the Fund’s operations, the competitive landscape of the investment company business and investor needs.
The investment performance of the Fund. The Board examined the short and longer-term performance of the Fund, including relative performance against a peer universe of comparable mutual funds as prepared by Lipper for various trailing periods ended December 31, 2008. The Board noted that the Fund’s performance was below the median for its peer universe for the past 1-year period and in line with the median for its peer universe for the past 3- and 5-year periods. The Trustees agreed they would continue to monitor the performance of the Fund closely. On the basis of the Board’s assessment of the nature, extent and quality of advisory services to be provided or procured by TAM and the Sub-Adviser, the Board concluded that TAM and the Sub-Adviser are capable of generating a level of investment performance that is appropriate in light of the Fund’s investment objectives, policies and strategies and competitive with other investment companies.
The cost of advisory services provided and the level of profitability. The Board reviewed profitability information of TAM’s cost of procuring fund management services, as well as the costs of provision of administration, fund accounting and other services, to the Fund and to Transamerica Funds as a whole by TAM and its affiliates. The Board reviewed the management and sub-advisory fees for the Fund. The Trustees noted that the Fund’s contractual management fee was below the medians for its expense group and universe and that the total expenses of the Fund were in line with the medians for its expense group and universe. Based on their review, the Trustees determined that the management and sub-advisory fees of the Fund generally are appropriate in light of the services expected to be provided or procured, and the anticipated profitability of the relationship between the Fund, TAM and its affiliates, and the Sub-Adviser. In making these observations and determinations, the Board reviewed comparative information provided by Lipper.
Whether fee levels reflect economies of scale and the extent to which economies of scale would be realized as the Fund grows. The Trustees considered the economies of scale with respect to the management of the Fund, whether the Fund had appropriately benefited from any economies of scale, and whether there was potential for realization of any further economies of scale. In evaluating the extent to which the management fees payable under the Investment Advisory and Sub-Advisory Agreements reflect economies of scale or will permit economies of scale to be realized in the future, the Board noted that TAM and the Sub-Adviser offer breakpoints which appropriately benefit investors by passing on economies of scale in the form of lower management fees as the level of assets grows. The Trustees also concluded that they will have the opportunity to periodically reexamine whether the Fund has achieved economies of scale, and the appropriateness of management fees payable to TAM and fees paid to the Sub-Adviser, in the future.
Benefits to TAM, its affiliates, or the Sub-Adviser from their relationship with the Fund. The Board concluded that other benefits anticipated to be derived by TAM, its affiliates, and the Sub-Adviser from their relationships with the Fund are expected to be consistent with industry practice and the best interests of the Fund and its shareholders. The Trustees noted that TAM would not realize soft dollar benefits from its relationship with the Fund. The Board also noted that the Sub-Adviser is participating in a brokerage program pursuant to which a portion of brokerage commissions paid by the Fund is recaptured for the benefit of the Fund and its shareholders, thus limiting the amount of soft dollar arrangements the Sub-Adviser may engage in with respect to the Fund’s brokerage transactions.
140
Other considerations. The Board determined that TAM has made a substantial commitment to the recruitment and retention of high quality personnel, and maintains the financial, compliance and operational resources reasonably necessary to manage the Fund in a professional manner that is consistent with the best interests of the Fund and its shareholders. In this regard, the Trustees favorably considered the procedures and policies in place by TAM to enforce compliance with applicable laws and regulations and oversee the portfolio management activities of the Sub-Adviser. The Trustees also determined that TAM has made a significant entrepreneurial commitment to the management and success of the Fund, reflected by TAM’s expense limitation and fee waiver arrangements with the Fund, which may result in TAM waiving fees for the benefit of shareholders.
Conclusion. After consideration of the factors described above as well as other factors, the Trustees, including all of the independent members of the Board, concluded that the Investment Advisory Agreement and the Sub-Advisory Agreement, including the fees payable thereunder, were fair and reasonable and voted to approve the renewal of the Investment Advisory Agreement and the Sub-Advisory Agreement for the Fund.
141
TRANSAMERICA SHORT-TERM BOND
INVESTMENT ADVISORY AND SUB-ADVISORY AGREEMENTS - CONTRACT RENEWAL
(unaudited)
At a meeting of the Board of Trustees of Transamerica Funds (the “Board”) held on June 4, 2009, the Board reviewed and considered the renewal of the investment advisory agreement (the “Investment Advisory Agreement”) between Transamerica Short-Term Bond (the “Fund”) and Transamerica Asset Management, Inc. (“TAM”), as well as the renewal of the investment sub-advisory agreement (the “Sub-Advisory Agreement”) of the Fund between TAM and Transamerica Investment Management, LLC (the “Sub-Adviser”), to determine whether the agreements should be renewed.
Following their review and consideration, the Trustees determined that the renewal of the Investment Advisory Agreement and the Sub-Advisory Agreement would enable shareholders of the Fund to obtain high quality services at a cost that is appropriate, fair, and in the best interests of Fund shareholders. The Board, including the independent members of the Board, unanimously approved the renewal of the Investment Advisory Agreement and Sub-Advisory Agreement through June 30, 2010. In reaching their decision, the Trustees requested and obtained from TAM and the Sub-Adviser such information as they deemed reasonably necessary to evaluate the agreements, including information about fees and performance of comparable funds managed by the Sub-Adviser. The Trustees noted that TAM and the Sub-Adviser do not manage any comparable separate accounts. The Trustees also carefully considered information they had previously received from TAM and the Sub-Adviser as part of their regular oversight of the Fund, as well as comparative fee, expense, and performance information prepared by Lipper Inc. (“Lipper”), an independent provider of mutual fund performance, and fee and expense information and profitability data prepared by management. In considering the proposed continuation of the Investment Advisory and Sub-Advisory Agreements, the Trustees evaluated a number of considerations that they believed, in light of the legal advice furnished to them by independent legal counsel and their own business judgment, to be relevant. They based their decisions on the following considerations, among others, although they did not identify any consideration or particular information that was controlling of their decisions:
The nature, extent and quality of the advisory services to be provided. The Board considered the nature and quality of the services provided by TAM and the Sub-Adviser to the Fund in the past, as well as the services anticipated to be provided in the future. The Trustees also reviewed the Sub-Adviser’s investment approach for the Fund. The Trustees noted that they receive, on a quarterly basis, an execution analysis from Capital Institutional Services, Inc. (CAPIS), an independent provider of trade analyses, for the Sub-Adviser and a comparison of trading results against a peer universe of managers. The Board concluded that TAM and the Sub-Adviser are capable of providing high quality services to the Fund, as indicated by the nature and quality of services provided in the past by TAM a nd the Sub-Adviser for this Fund and the experience, capability and integrity of TAM’s senior management, the financial resources of TAM and the Sub-Adviser, TAM’s management oversight process and the professional qualifications of the portfolio management team of the Sub-Adviser. The Trustees determined that TAM and the Sub-Adviser can provide investment and related services that are appropriate in scope and extent in light of the Fund’s operations, the competitive landscape of the investment company business and investor needs.
The investment performance of the Fund. The Board examined the short and longer-term performance of the Fund, including relative performance against a peer universe of comparable mutual funds as prepared by Lipper for various trailing periods ended December 31, 2008. The Board noted that the Fund’s performance was in line with the median for its peer universe for the past 1- and 3-year periods. On the basis of the Board’s assessment of the nature, extent and quality of advisory services to be provided or procured by TAM and the Sub-Adviser, the Board concluded that TAM and the Sub-Adviser are capable of generating a level of investment performance that is appropriate in light of the Fund’s investment objectives, policies and strategies and competitive with other investment companies.
The cost of advisory services provided and the level of profitability. The Board reviewed profitability information of TAM’s cost of procuring fund management services, as well as the costs of provision of administration, fund accounting and other services, to the Fund and to Transamerica Funds as a whole by TAM and its affiliates. The Board reviewed the management and sub-advisory fees for the Fund. The Trustees noted that the Fund’s contractual management fee was above the medians for its expense group and universe and that the total expenses of the Fund were below the medians for its expense group and universe. Based on their review, the Trustees determined that the management and sub-advisory fees of the Fund generally are appropriate in light of the services expected to be provided or procured, and the anticipated profitability of the relationship between the Fund, TAM and its affiliates, and the Sub-Adviser. In making these observations and determinations, the Board reviewed comparative information provided by Lipper.
Whether fee levels reflect economies of scale and the extent to which economies of scale would be realized as the Fund grows. The Trustees considered the economies of scale with respect to the management of the Fund, whether the Fund had appropriately benefited from any economies of scale, and whether there was potential for realization of any further economies of scale. In evaluating the extent to which the management fees payable under the Investment Advisory and Sub-Advisory Agreements reflect economies of scale or will permit economies of scale to be realized in the future, the Board noted that TAM and the Sub-Adviser offer breakpoints which appropriately benefit investors by passing on economies of scale in the form of lower management fees as the level of assets grows. The Trustees also concluded that they will have the opportunity to periodically reexamine whether the Fund has achieved economies of scale, and the appropriateness of management fees payable to TAM and fees paid to the Sub-Adviser, in the future.
Benefits to TAM, its affiliates, or the Sub-Adviser from their relationship with the Fund. The Board concluded that other benefits anticipated to be derived by TAM, its affiliates, and the Sub-Adviser from their relationships with the Fund are expected to be consistent with industry practice and the best interests of the Fund and its shareholders. The Trustees noted that TAM would not realize soft dollar benefits from its relationship with the Fund.
142
Other considerations. The Board determined that TAM has made a substantial commitment to the recruitment and retention of high quality personnel, and maintains the financial, compliance and operational resources reasonably necessary to manage the Fund in a professional manner that is consistent with the best interests of the Fund and its shareholders. In this regard, the Trustees favorably considered the procedures and policies in place by TAM to enforce compliance with applicable laws and regulations and oversee the portfolio management activities of the Sub-Adviser. The Trustees also determined that TAM has made a significant entrepreneurial commitment to the management and success of the Fund, reflected by TAM’s expense limitation and fee waiver arrangements with the Fund, which may result in TAM waiving fees for the benefit of shareholders.
Conclusion. After consideration of the factors described above as well as other factors, the Trustees, including all of the independent members of the Board, concluded that the Investment Advisory Agreement and the Sub-Advisory Agreement, including the fees payable thereunder, were fair and reasonable and voted to approve the renewal of the Investment Advisory Agreement and the Sub-Advisory Agreement for the Fund.
143
TRANSAMERICA SMALL/MID CAP VALUE
INVESTMENT ADVISORY AND SUB-ADVISORY AGREEMENTS - CONTRACT RENEWAL
(unaudited)
At a meeting of the Board of Trustees of Transamerica Funds (the “Board”) held on June 4, 2009, the Board reviewed and considered the renewal of the investment advisory agreement (the “Investment Advisory Agreement”) between Transamerica Small/Mid Cap Value (the “Fund”) and Transamerica Asset Management, Inc. (“TAM”), as well as the renewal of the investment sub-advisory agreement (the “Sub-Advisory Agreement”) of the Fund between TAM and Transamerica Investment Management, LLC (the “Sub-Adviser”), to determine whether the agreements should be renewed.
Following their review and consideration, the Trustees determined that the renewal of the Investment Advisory Agreement and the Sub-Advisory Agreement would enable shareholders of the Fund to obtain high quality services at a cost that is appropriate, fair, and in the best interests of Fund shareholders. The Board, including the independent members of the Board, unanimously approved the renewal of the Investment Advisory Agreement and Sub-Advisory Agreement through June 30, 2010. In reaching their decision, the Trustees requested and obtained from TAM and the Sub-Adviser such information as they deemed reasonably necessary to evaluate the agreements, including information about fees and performance of comparable funds managed by the Sub-Adviser. The Trustees noted that TAM and the Sub-Adviser do not manage any comparable separate accounts. The Trustees also carefully considered information they had previously received from TAM and the Sub-Adviser as part of their regular oversight of the Fund, as well as comparative fee, expense, and performance information prepared by Lipper Inc. (“Lipper”), an independent provider of mutual fund performance, and fee and expense information and profitability data prepared by management. In considering the proposed continuation of the Investment Advisory and Sub-Advisory Agreements, the Trustees evaluated a number of considerations that they believed, in light of the legal advice furnished to them by independent legal counsel and their own business judgment, to be relevant. They based their decisions on the following considerations, among others, although they did not identify any consideration or particular information that was controlling of their decisions:
The nature, extent and quality of the advisory services to be provided. The Board considered the nature and quality of the services provided by TAM and the Sub-Adviser to the Fund in the past, as well as the services anticipated to be provided in the future. The Trustees also reviewed the Sub-Adviser’s investment approach for the Fund. The Trustees noted that they receive, on a quarterly basis, an execution analysis from Capital Institutional Services, Inc. (CAPIS), an independent provider of trade analyses, for the Sub-Adviser and a comparison of trading results against a peer universe of managers. The Board concluded that TAM and the Sub-Adviser are capable of providing high quality services to the Fund, as indicated by the nature and quality of services provided in the past by TAM a nd the Sub-Adviser for this Fund and the experience, capability and integrity of TAM’s senior management, the financial resources of TAM and the Sub-Adviser, TAM’s management oversight process and the professional qualifications of the portfolio management team of the Sub-Adviser. The Trustees determined that TAM and the Sub-Adviser can provide investment and related services that are appropriate in scope and extent in light of the Fund’s operations, the competitive landscape of the investment company business and investor needs.
The investment performance of the Fund. The Board examined the short and longer-term performance of the Fund, including relative performance against a peer universe of comparable mutual funds as prepared by Lipper for various trailing periods ended December 31, 2008. The Board noted that the Fund’s performance was below the median for its peer universe for the past 1-year period and above the median for its peer universe for the past 3- and 5-year periods. It was noted that the current management team took over the Fund on October 1, 2008. The Trustees agreed that they would continue to monitor the performance of the new management team closely. On the basis of the Board’s assessment of the nature, extent and quality of advisory services to be provided or procured by TAM and the Sub-Adviser, the Board concluded that TAM and the Sub-Adviser are capable of generating a level of investment performance that is appropriate in light of the Fund’s investment objectives, policies and strategies and competitive with other investment companies.
The cost of advisory services provided and the level of profitability. The Board reviewed profitability information of TAM’s cost of procuring fund management services, as well as the costs of provision of administration, fund accounting and other services, to the Fund and to Transamerica Funds as a whole by TAM and its affiliates. The Board reviewed the management and sub-advisory fees for the Fund. The Trustees noted that the Fund’s contractual management fee was below the medians for its expense group and universe and that the total expenses of the Fund were above the median for its expense group and in line with the median for its expense universe. Based on their review, the Trustees determined that the management and sub-advisory fees of the Fund generally are appropriate in light of the services expected to be provided or procured, and the anticipated profitability of the relationship between the Fund, TAM and its affiliates, and the Sub-Adviser. In making these observations and determinations, the Board reviewed comparative information provided by Lipper.
Whether fee levels reflect economies of scale and the extent to which economies of scale would be realized as the Fund grows. The Trustees considered the economies of scale with respect to the management of the Fund, whether the Fund had appropriately benefited from any economies of scale, and whether there was potential for realization of any further economies of scale. In evaluating the extent to which the management fees payable under the Investment Advisory and Sub-Advisory Agreements reflect economies of scale or will permit economies of scale to be realized in the future, the Board noted that TAM and the Sub-Adviser offer breakpoints which appropriately benefit investors by passing on economies of scale in the form of lower management fees as the level of assets grows. The Trustees also concluded that they will have the opportunity to periodically reexamine whether the Fund has achieved economies of scale, and the appropriateness of management fees payable to TAM and fees paid to the Sub-Adviser, in the future.
Benefits to TAM, its affiliates, or the Sub-Adviser from their relationship with the Fund. The Board concluded that other benefits anticipated to be derived by TAM, its affiliates, and the Sub-Adviser from their relationships with the Fund are expected to be consistent with industry practice and the best interests of the Fund and its shareholders. The Trustees noted that TAM would not realize soft dollar benefits from its relationship with the Fund. The Board also noted that the Sub-Adviser is participating in a brokerage program pursuant to which a portion of brokerage commissions paid by the Fund is recaptured for the benefit of the Fund and its shareholders, thus limiting the amount of soft dollar arrangements the Sub-Adviser may engage in with respect to the Fund’s brokerage transactions.
144
Other considerations. The Board determined that TAM has made a substantial commitment to the recruitment and retention of high quality personnel, and maintains the financial, compliance and operational resources reasonably necessary to manage the Fund in a professional manner that is consistent with the best interests of the Fund and its shareholders. In this regard, the Trustees favorably considered the procedures and policies in place by TAM to enforce compliance with applicable laws and regulations and oversee the portfolio management activities of the Sub-Adviser. The Trustees also determined that TAM has made a significant entrepreneurial commitment to the management and success of the Fund, reflected by TAM’s expense limitation and fee waiver arrangements with the Fund, which may result in TAM waiving fees for the benefit of shareholders.
Conclusion. After consideration of the factors described above as well as other factors, the Trustees, including all of the independent members of the Board, concluded that the Investment Advisory Agreement and the Sub-Advisory Agreement, including the fees payable thereunder, were fair and reasonable and voted to approve the renewal of the Investment Advisory Agreement and the Sub-Advisory Agreement for the Fund.
145
TRANSAMERICA TEMPLETON GLOBAL
INVESTMENT ADVISORY AND SUB-ADVISORY AGREEMENTS - CONTRACT RENEWAL
(unaudited)
At a meeting of the Board of Trustees of Transamerica Funds (the “Board”) held on June 4, 2009, the Board reviewed and considered the renewal of the investment advisory agreement (the “Investment Advisory Agreement”) between Transamerica Templeton Global (the “Fund”) and Transamerica Asset Management, Inc. (“TAM”), as well as the renewal of the investment sub-advisory agreement (the “Sub-Advisory Agreements”) of the Fund between TAM and the following sub-advisers: Templeton Investment Counsel, LLC and Transamerica Investment Management, LLC (each the “Sub-Adviser” and collectively the “Sub-Advisers”), to determine whether the agreements should be renewed.
Following their review and consideration, the Trustees determined that the renewal of the Investment Advisory Agreement and the Sub-Advisory Agreements would enable shareholders of the Fund to obtain high quality services at a cost that is appropriate, fair, and in the best interests of Fund shareholders. The Board, including the independent members of the Board, unanimously approved the renewal of the Investment Advisory Agreement and Sub-Advisory Agreements through June 30, 2010. In reaching their decision, the Trustees requested and obtained from TAM and the Sub-Advisers such information as they deemed reasonably necessary to evaluate the agreements, including information about fees and performance of comparable funds managed by the Sub-Advisers. The Trustees also carefully considered information they had previously received from TAM and the Sub-Advisers as part of their regular oversight of the Fund, as well as comparative fee, expense, and performance information prepared by Lipper Inc. (“Lipper”), an independent provider of mutual fund performance, and fee and expense information and profitability data prepared by management. In considering the proposed continuation of the Investment Advisory and Sub-Advisory Agreements, the Trustees evaluated a number of considerations that they believed, in light of the legal advice furnished to them by independent legal counsel and their own business judgment, to be relevant. They based their decisions on the following considerations, among others, although they did not identify any consideration or particular information that was controlling of their decisions:
The nature, extent and quality of the advisory services to be provided. The Board considered the nature and quality of the services provided by TAM and the Sub-Advisers to the Fund in the past, as well as the services anticipated to be provided in the future. The Trustees also reviewed the Sub-Advisers’ investment approaches for the Fund. The Trustees noted that they receive, on a quarterly basis, an execution analysis from Capital Institutional Services, Inc. (CAPIS), an independent provider of trade analyses, for the Sub-Advisers and a comparison of trading results against a peer universe of managers. The Board concluded that TAM and the Sub-Advisers are capable of providing high quality services to the Fund, as indicated by the nature and quality of services provided in the past by TAM and the Sub-Advisers for this Fund and the experience, capability and integrity of TAM’s senior management, the financial resources of TAM and the Sub-Advisers, TAM’s management oversight process and the professional qualifications of the portfolio management teams of the Sub-Advisers. The Trustees determined that TAM and the Sub-Advisers can provide investment and related services that are appropriate in scope and extent in light of the Fund’s operations, the competitive landscape of the investment company business and investor needs.
The investment performance of the Fund. The Board examined the short and longer-term performance of the Fund, including relative performance against a peer universe of comparable mutual funds as prepared by Lipper for various trailing periods ended December 31, 2008. The Board noted that the Fund’s performance was below the median for its peer universe for the past 1-, 3- and 5- year periods. The Trustees discussed the reasons for the underperformance with TAM, and agreed to continue to monitor the Fund closely. On the basis of the Board’s assessment of the nature, extent and quality of advisory services to be provided or procured by TAM and the Sub-Advisers, the Board concluded that TAM and the Sub-Advisers are capable of generating a level of investment performance that is appropriate in light of the Fund’s investment objectives, policies and strategies and competitive with other investment companies.
The cost of advisory services provided and the level of profitability. The Board reviewed profitability information of TAM’s cost of procuring fund management services, as well as the costs of provision of administration, fund accounting and other services, to the Fund and to Transamerica Funds as a whole by TAM and its affiliates. The Board reviewed the management and sub-advisory fees for the Fund. The Trustees noted that the Fund’s contractual management fee was below the median for its expense group and in line with median for its expense universe and that the total expenses of the Fund were in line with the median for its expense group and above the median for its expense universe. Based on their review, the Trustees determined that the management and sub-advisory fees of the Fund generally are appropriate in light of the services expected to be provided or procured, and the anticipated profitability of the relationship between the Fund, TAM and its affiliates, and the Sub-Advisers. In making these observations and determinations, the Board reviewed comparative information provided by Lipper.
Whether fee levels reflect economies of scale and the extent to which economies of scale would be realized as the Fund grows. The Trustees considered the economies of scale with respect to the management of the Fund, whether the Fund had appropriately benefited from any economies of scale, and whether there was potential for realization of any further economies of scale. In evaluating the extent to which the management fees payable under the Investment Advisory and Sub-Advisory Agreements reflect economies of scale or will permit economies of scale to be realized in the future, the Board noted that TAM and the Sub-Advisers offer breakpoints which appropriately benefit investors by passing on economies of scale in the form of lower management fees as the level of assets grows. The Trustees also concluded that they will have the opportunity to periodically reexamine whether the Fund has achieved economies of scale, and the appropriateness of management fees payable to TAM and fees paid to the Sub-Advisers, in the future.
Benefits to TAM, its affiliates, or the Sub-Advisers from their relationship with the Fund. The Board concluded that other benefits anticipated to be derived by TAM, its affiliates, and the Sub-Advisers from their relationships with the Fund are expected to be consistent with industry practice and the best interests of the Fund and its shareholders. The Trustees noted that TAM would not realize soft dollar benefits from its relationship with the Fund. The Board also noted that the Sub-Advisers are participating in a brokerage program pursuant to which a portion of brokerage commissions paid by the Fund is recaptured for the benefit of the Fund and its shareholders, thus limiting the amount of soft dollar arrangements the Sub-Advisers may engage in with respect to the Fund’s brokerage transactions.
146
Other considerations. The Board determined that TAM has made a substantial commitment to the recruitment and retention of high quality personnel, and maintains the financial, compliance and operational resources reasonably necessary to manage the Fund in a professional manner that is consistent with the best interests of the Fund and its shareholders. In this regard, the Trustees favorably considered the procedures and policies in place by TAM to enforce compliance with applicable laws and regulations and oversee the portfolio management activities of the Sub-Advisers. The Trustees also determined that TAM has made a significant entrepreneurial commitment to the management and success of the Fund, reflected by TAM’s expense limitation and fee waiver arrangements with the Fund, which may result in TAM waiving fees for the benefit of shareholders.
Conclusion. After consideration of the factors described above as well as other factors, the Trustees, including all of the independent members of the Board, concluded that the Investment Advisory Agreement and the Sub-Advisory Agreements, including the fees payable thereunder, were fair and reasonable and voted to approve the renewal of the Investment Advisory Agreement and the Sub-Advisory Agreements for the Fund.
147
TRANSAMERICA VALUE BALANCED
INVESTMENT ADVISORY AND SUB-ADVISORY AGREEMENTS - CONTRACT RENEWAL
(unaudited)
At a meeting of the Board of Trustees of Transamerica Funds (the “Board”) held on June 4, 2009, the Board reviewed and considered the renewal of the investment advisory agreement (the “Investment Advisory Agreement”) between Transamerica Value Balanced (the “Fund”) and Transamerica Asset Management, Inc. (“TAM”), as well as the renewal of the investment sub-advisory agreement (the “Sub-Advisory Agreement”) of the Fund between TAM and Transamerica Investment Management, LLC (the “Sub-Adviser”), to determine whether the agreements should be renewed.
Following their review and consideration, the Trustees determined that the renewal of the Investment Advisory Agreement and the Sub-Advisory Agreement would enable shareholders of the Fund to obtain high quality services at a cost that is appropriate, fair, and in the best interests of Fund shareholders. The Board, including the independent members of the Board, unanimously approved the renewal of the Investment Advisory Agreement and Sub-Advisory Agreement through June 30, 2010. In reaching their decision, the Trustees requested and obtained from TAM and the Sub-Adviser such information as they deemed reasonably necessary to evaluate the agreements, including information about fees and performance of comparable funds managed by the Sub-Adviser. The Trustees noted that TAM and the Sub-Adviser do not manage any comparable separate accounts. The Trustees also carefully considered information they had previously received from TAM and the Sub-Adviser as part of their regular oversight of the Fund, as well as comparative fee, expense, and performance information prepared by Lipper Inc. (“Lipper”), an independent provider of mutual fund performance, and fee and expense information and profitability data prepared by management. In considering the proposed continuation of the Investment Advisory and Sub-Advisory Agreements, the Trustees evaluated a number of considerations that they believed, in light of the legal advice furnished to them by independent legal counsel and their own business judgment, to be relevant. They based their decisions on the following considerations, among others, although they did not identify any consideration or particular information that was controlling of their decisions:
The nature, extent and quality of the advisory services to be provided. The Board considered the nature and quality of the services provided by TAM and the Sub-Adviser to the Fund in the past, as well as the services anticipated to be provided in the future. The Trustees also reviewed the Sub-Adviser’s investment approach for the Fund. The Trustees noted that they receive, on a quarterly basis, an execution analysis from Capital Institutional Services, Inc. (CAPIS), an independent provider of trade analyses, for the Sub-Adviser and a comparison of trading results against a peer universe of managers. The Board concluded that TAM and the Sub-Adviser are capable of providing high quality services to the Fund, as indicated by the nature and quality of services provided in the past by TAM a nd the Sub-Adviser for this Fund and the experience, capability and integrity of TAM’s senior management, the financial resources of TAM and the Sub-Adviser, TAM’s management oversight process and the professional qualifications of the portfolio management team of the Sub-Adviser. The Trustees determined that TAM and the Sub-Adviser can provide investment and related services that are appropriate in scope and extent in light of the Fund’s operations, the competitive landscape of the investment company business and investor needs.
The investment performance of the Fund. The Board examined the short and longer-term performance of the Fund, including relative performance against a peer universe of comparable mutual funds as prepared by Lipper for various trailing periods ended December 31, 2008. The Board noted that the Fund’s performance was below the median for its peer universe for the past 1-, 3- and 5- year periods. The Trustees discussed the recent management changes, and agreed that they would continue to monitor the performance of the Fund closely. On the basis of the Board’s assessment of the nature, extent and quality of advisory services to be provided or procured by TAM and the Sub-Adviser, the Board concluded that TAM and the Sub-Adviser are capable of generating a level of investment performance that is appropriate in light of the Fund’s investment objectives, policies and strategies and competitive with other investment companies.
The cost of advisory services provided and the level of profitability. The Board reviewed profitability information of TAM’s cost of procuring fund management services, as well as the costs of provision of administration, fund accounting and other services, to the Fund and to Transamerica Funds as a whole by TAM and its affiliates. The Board reviewed the management and sub-advisory fees for the Fund. The Trustees noted that the Fund’s contractual management fee and total expenses were above the medians for its expense group and universe. Based on their review, the Trustees determined that the management and sub-advisory fees of the Fund generally are appropriate in light of the services expected to be provided or procured, and the anticipated profitability of the relationship between the Fund, TAM and its affiliates, and the Sub-Adviser. In making these observations and determinations, the Board reviewed comparative information provided by Lipper.
Whether fee levels reflect economies of scale and the extent to which economies of scale would be realized as the Fund grows. The Trustees considered the economies of scale with respect to the management of the Fund, whether the Fund had appropriately benefited from any economies of scale, and whether there was potential for realization of any further economies of scale. In evaluating the extent to which the management fees payable under the Investment Advisory and Sub-Advisory Agreements reflect economies of scale or will permit economies of scale to be realized in the future, the Board noted that TAM and the Sub-Adviser offer breakpoints which appropriately benefit investors by passing on economies of scale in the form of lower management fees as the level of assets grows. The Trustees also concluded that they will have the opportunity to periodically reexamine whether the Fund has achieved economies of scale, and the appropriateness of management fees payable to TAM and fees paid to the Sub-Adviser, in the future.
Benefits to TAM, its affiliates, or the Sub-Adviser from their relationship with the Fund. The Board concluded that other benefits anticipated to be derived by TAM, its affiliates, and the Sub-Adviser from their relationships with the Fund are expected to be consistent with industry practice and the best interests of the Fund and its shareholders. The Trustees noted that TAM would not realize soft dollar benefits from its relationship with the Fund. The Board also noted that the Sub-Adviser is participating in a brokerage program pursuant to which a portion of brokerage commissions paid by the Fund is recaptured for the benefit of the Fund and its shareholders, thus limiting the amount of soft dollar arrangements the Sub-Adviser may engage in with respect to the Fund’s brokerage transactions.
148
Other considerations. The Board determined that TAM has made a substantial commitment to the recruitment and retention of high quality personnel, and maintains the financial, compliance and operational resources reasonably necessary to manage the Fund in a professional manner that is consistent with the best interests of the Fund and its shareholders. In this regard, the Trustees favorably considered the procedures and policies in place by TAM to enforce compliance with applicable laws and regulations and oversee the portfolio management activities of the Sub-Adviser. The Trustees also determined that TAM has made a significant entrepreneurial commitment to the management and success of the Fund, reflected by TAM’s expense limitation and fee waiver arrangements with the Fund, which may result in TAM waiving fees for the benefit of shareholders.
Conclusion. After consideration of the factors described above as well as other factors, the Trustees, including all of the independent members of the Board, concluded that the Investment Advisory Agreement and the Sub-Advisory Agreement, including the fees payable thereunder, were fair and reasonable and voted to approve the renewal of the Investment Advisory Agreement and the Sub-Advisory Agreement for the Fund.
149
SUPPLEMENTAL INFORMATION (unaudited)
TAX INFORMATION
For dividends paid during the year ended October 31, 2009, the Funds designated the following as qualified dividend income:
Fund | | Qualified Dividend
Income | |
Transamerica Balanced | | $ | 1,373 | |
Transamerica Convertible Securities | | 1,175 | |
Transamerica Equity | | 2,955 | |
Transamerica Flexible Income | | 145 | |
Transamerica Legg Mason Partners All Cap | | 595 | |
Transamerica Small/Mid Cap Value | | 7,984 | |
Transamerica Templeton Global | | 603 | |
Transamerica Value Balanced | | 511 | |
| | | | |
For corporate shareholders, investment income (dividend income plus short-term gains, if any) qualifies for the dividends received deductions as follows:
Fund | | Dividend Received
Deduction Percentage | |
Transamerica Balanced | | 82.58 | % |
Transamerica Convertible Securities | | 42.49 | |
Transamerica Equity | | 100.00 | |
Transamerica Flexible Income | | 1.62 | |
Transamerica Legg Mason Partners All Cap | | 100.00 | |
Transamerica Science & Technology | | 100.00 | |
Transamerica Small/Mid Cap Value | | 99.61 | |
Transamerica Templeton Global | | 22.05 | |
Transamerica Value Balanced | | 78.18 | |
For tax purposes, the Long-Term Capital Gain Designations for the year ended October 31, 2009 were as follows:
Fund | | Long-Term
Capital Designation | |
Transamerica Balanced | | $ | 6,058 | |
| | | | |
The information and distributions reported herein may differ from the information and distributions taxable to the shareholders for the calendar year ending December 31, 2009. Complete information will be computed and reported in conjunction with your 2009
Form 1099-DIV.
150
TRANSAMERICA FUNDS
Transamerica Legg Mason Partners All Cap
RESULTS OF SHAREHOLDER PROXY (unaudited)
Section 270.30e-1 under the Investment Company Act of 1940, as amended, titled “Reports to Stockholders of Management Companies,” requires registered investment management companies to report on all subject matters put to the vote of shareholders and provide final results. Accordingly, the Board of Trustees of the Fund solicited a vote by the shareholders for the following item.
At a special meeting of shareholders held on October 23, 2009, the results of Proposal 1 were as follows:
Proposal 1: To approve a new Sub-Advisory Agreement with a new sub-adviser:
For | | Against | | Abstentions/Broker Non-
Votes | |
$ | 42,464,747.03 | | $ | 1,851,253.48 | | $ | 3,260,080.07 | |
| | | | | | | | |
151
TRANSAMERICA FUNDS
Transamerica High Yield Bond
Transamerica Money Market
RESULTS OF SHAREHOLDER PROXY (unaudited)
Effective as of November 20, 2009, Transamerica Premier High Yield Bond Fund was reorganized into Transamerica High Yield Bond and Transamerica Premier Cash Reserve Fund was reorganized into Transamerica Money Market.
Section 270.30e-1 under the Investment Company Act of 1940, as amended, titled “Reports to Stockholders of Management Companies,” requires registered investment management companies to report on all subject matters put to the vote of shareholders and provide final results. Accordingly, the Board of Directors of Transamerica Investors, Inc. solicited a vote by the shareholders of Transamerica Premier High Yield Bond Fund and Transamerica Premier Cash Reserve Fund for the following items.
At a special joint meeting of shareholders held on November 16, 2009, the results of the Proposals were as follows:
Proposal 1: To approve an Agreement and Plan of Reorganization, providing for (i) the acquisition of all the assets of Transamerica Premier High Yield Bond Fund, in exchange for shares of Transamerica High Yield Bond to be distributed to the shareholders of Transamerica Premier High Yield Bond Fund and the assumption of all of the liabilities of Transamerica Premier High Yield Bond Fund by Transamerica High Yield Bond, and (ii) the subsequent liquidation of Transamerica Premier High Yield Bond Fund:
For | | Against | | Abstentions/Broker
Non-Votes | |
9,736,318.689 | | 487,877.977 | | 366,384.415 | |
Proposal 2: To approve an Agreement and Plan of Reorganization, providing for (i) the acquisition of all the assets of Transamerica Premier Cash Reserve Fund, in exchange for shares of Transamerica Money Market to be distributed to the shareholders of Transamerica Premier Cash Reserve Fund and the assumption of all of the liabilities of Transamerica Premier Cash Reserve Fund by Transamerica Money Market, and (ii) the subsequent liquidation of Transamerica Premier Cash Reserve Fund:
For | | Against | | Abstentions/Broker
Non-Votes | |
21,148,850.247 | | 3,108,833.699 | | 1,191,774.511 | |
152
TRANSAMERICA FUNDS
Management of the Funds (unaudited)
The Board Members and executive officers of the Trust are listed below. The Board governs each fund and is responsible for protecting the interests of the shareholders. The Board Members are experienced executives who meet periodically throughout the year to oversee the business affairs of each fund and the operation of the Trust by its officers. The Board also reviews the management of each fund’s assets by the investment adviser and its respective sub-adviser. The funds are among the funds advised and sponsored by TAM (collectively, “Transamerica Asset Management Group”). Transamerica Asset Management Group (“TAMG”) consists of Transamerica Funds, Transamerica Series Trust (“TST”), Transamerica Income Shares, Inc. (“TIS”), Transamerica Partners Funds Group (“TPFG”), Transamerica Partners Funds Group II (“TPFG II”), Transamerica Partners Portfolios (“TPP”), and Transamerica Asset Allocation Variable Funds (“TAAVF”) and consists of 163 funds as of the date of this SAI.
The mailing address of each Board Member is c/o Secretary, 570 Carillon Parkway, St. Petersburg, Florida 33716. The Board Members, their ages, their positions with the Trust, and their principal occupations for the past five years (their titles may have varied during that period), the number of funds in TAMG the Board oversees, and other board memberships they hold are set forth in the table below.
Name and Age | | Position(s) Held
with Trust | | Term of
Office and
Length of
Time Served* | | Principal Occupation(s) During
Past 5 Years | | Number of
Funds in
Complex
Overseen
by Board
Member | | Other
Directorships |
| | | | | | | | | | |
INTERESTED BOARD MEMBER** | | | | | | |
| | | | | | | | | | |
John K. Carter
(1961) | | Chairman, Board Member, President, and Chief Executive Officer | | Since 1999 | | Chairman and Board Member (2008 — present), President (2007 — present), Chief Executive Officer (2006 — present), Vice President, Secretary and Chief Compliance Officer (2003 — 2006), Transamerica Investors, Inc. (“TII”);Chairman, Board Member, President and Chief Executive Officer, TPP, TPFG, TPFG II and TAAVF (2007 — present); Chairman (2007 — present), Board Member (2006 — present), President and Chief Executive Officer (2006 — present), Senior Vice President (1999 — 2006), Chief Compliance Officer, General Counsel and Secretary (1999 — 2006), Transamerica Funds and TST; Chairman (2007 — present), Board Member (2006 — present), President and Chief Executive Officer (2006 — present), Senior Vice President (2002 — 2006), General Counsel, Secretary and Chief Compliance Officer (2002 — 2006), TIS; Chairman, President and Chief Executive Officer (2006 — present), Director (2002 — present), Senior Vice President (1999 — 2006), General Counsel and Secretary (2000 — 2006), Chief Compliance Officer (2004 — 2006), TAM; Chairman, President and Chief Executive Officer (2006 — present), Senior Vice President (1999 — 2006), Director (2002 — present), General Counsel and Secretary (2001 — 2006), Transamerica Fund Services, Inc. (“TFS”); Vice President, AFSG Securities Corporation (2001 —present); Senior Vice President, General Counsel and Secretary, Transamerica Index Funds, Inc. (“TIF”) (2002 — 2004); and Director, (2008 — present), Vice President, Transamerica Investment Services, Inc. (“TISI”) (2003 — 2005) and Transamerica Investment Management, LLC (“TIM”) (2001 — 2005). | | 163 | | N/A |
153
Name and Age | | Position(s) Held
with Trust | | Term of
Office and
Length of
Time Served* | | Principal Occupation(s) During
Past 5 Years | | Number of
Funds in
Complex
Overseen
by Board
Member | | Other
Directorships |
| | | | | | | | | | |
INDEPENDENT BOARD MEMBERS*** | | | | | | |
| | | | | | | | | | |
Sandra N. Bane
(1952) | | Board Member | | Since 2008 | | Retired, KPMG (1999 — present); Board Member, TII (2003 — present); and Board Member, Transamerica Funds, TST, TIS, TPP, TPFG, TPFG II and TAAVF (2008 — present). | | 163 | | Big 5 Sporting Goods (2002 — present); AGL Resources, Inc. (energy services holding company) (2008 — present) |
| | | | | | | | | | |
Leo J. Hill
(1956) | | Lead Independent Board Member | | Since 2002 | | Principal, Advisor Network Solutions, LLC (business consulting) (2006 — present); Board Member, TST (2001 — present); Board Member, Transamerica Funds and TIS (2002 — present); Board Member, TPP, TPFG, TPFG II and TAAVF (2007 — present); Board Member, TII (2008 — present);Owner and President, Prestige Automotive Group (2001 — 2005); President, L. J. Hill & Company (1999 — present); Market President, Nations Bank of Sun Coast Florida (1998 — 1999); President and Chief Executive Officer, Barnett Banks of Treasure Coast Florida (1994 — 1998); Executive Vice President and Senior Credit Officer, Barnett Banks of Jacksonville, Florida (1991 — 1994); and Senior Vice President and Senior Loan Administration Officer, Wachovia Bank of Georgia (1976 — 1991). | | 163 | | N/A |
| | | | | | | | | | |
David W. Jennings
(1946) | | Board Member | | Since 2009 | | Board Member, Transamerica Funds, TST, TIS, TPP, TPFG, TPFG II and TAAVF (July 2009 — present); Board Member, TII (July 2009 — present); Principal, Maxam Capital Management, LLC (2006 — 2008); and Principal, Cobble Creek Management LP (2004 — 2006). | | 163 | | N/A |
| | | | | | | | | | |
Neal M. Jewell
(1935) | | Board Member | | Since 2007 | | Retired (2004 — present); Board Member, TPP, TPFG, TPFG II and TAAVF (1993 — present); Board Member, Transamerica Funds, TST and TIS (2007 — present); Board Member, TII (2008 - present); and Independent Trustee, EAI Select Managers Equity Fund (a mutual fund) (1996 — 2004). | | 163 | | N/A |
| | | | | | | | | | |
Russell A. Kimball, Jr.
(1944) | | Board Member | | 1986 — 1990 and 2002 - Present | | General Manager, Sheraton Sand Key Resort (1975 — present); Board Member, TST (1986 — present); Board Member, Transamerica Funds, (1986 — 1990), (2002 — present); Board Member, TIS (2002 — present); Board Member, TPP, TPFG, TPFG II and TAAVF (2007 — present); and Board Member, TII (2008 — present). | | 163 | | N/A |
154
Name and Age | | Position(s) Held
with Trust | | Term of
Office and
Length of
Time Served* | | Principal Occupation(s) During
Past 5 Years | | Number of
Funds in
Complex
Overseen
by Board
Member | | Other
Directorships |
Eugene M. Mannella
(1954) | | Board Member | | Since 2007 | | Chief Executive Officer, HedgeServ Corporation (hedge fund administration) (2008 — present); Self-employed consultant (2006 — present); President, ARAPAHO Partners LLC (limited purpose broker-dealer) (1998 — 2008); Board Member, TPP, TPFG, TPFG II and TAAVF (1994 — present); Board Member, Transamerica Funds, TST and TIS (2007 — present); Board Member, TII (2008 — present); and President, International Fund Services (alternative asset administration) (1993 — 2005). | | 163 | | N/A |
| | | | | | | | | | |
Norman R. Nielsen
(1939) | | Board Member | | Since 2006 | | Retired (2005 — present); Board Member, Transamerica Funds, TST and TIS (2006 — present); Board Member, TPP, TPFG, TPFG II and TAAVF (2007 — present); Board Member, TII (2008 — present); Director, Iowa Student Loan Service Corporation (2006 — present); Director, League for Innovation in the Community Colleges (1985 — 2005); Director, Iowa Health Systems (1994 — 2003); Director, U.S. Bank (1987 — 2006); and President, Kirkwood Community College (1985 — 2005). | | 163 | | Buena Vista University Board of Trustees (2004 - present) |
| | | | | | | | | | |
Joyce G. Norden
(1939) | | Board Member | | Since 2007 | | Retired (2004 — present); Board Member, TPFG, TPFG II and TAAVF (1993 — present); Board Member, TPP (2002 — present); Board Member, Transamerica Funds, TST and TIS (2007 — present); Board Member, TII (2008 — present); and Vice President, Institutional Advancement, Reconstructionist Rabbinical College (1996 — 2004). | | 163 | | Board of Governors, Reconstruction-ist Rabbinical College (2007 - present) |
| | | | | | | | | | |
Patricia L. Sawyer
(1950) | | Board Member | | Since 2007 | | Retired (2007 — present); President/Founder, Smith & Sawyer LLC (management consulting) (1989 — 2007); Board Member, Transamerica Funds, TST and TIS (2007 — present); Board Member, TII (2008 — present); Board Member, TPP, TPFG, TPFG II and TAAVF (1993 — present); Vice President, American Express (1987 — 1989); Vice President, The Equitable (1986 — 1987); and Strategy Consultant, Booz, Allen & Hamilton (1982 — 1986). | | 163 | | N/A |
| | | | | | | | | | |
John W. Waechter
(1952) | | Board Member | | Since 2005 | | Attorney, Englander & Fischer, P.A. (2008 — present); Retired (2004 — 2008); | | 163 | | Operation Par, Inc. (2008 — |
155
Name and Age | | Position(s) Held
with Trust | | Term of
Office and
Length of
Time Served* | | Principal Occupation(s) During
Past 5 Years | | Number of
Funds in
Complex
Overseen
by Board
Member | | Other
Directorships |
| | | | | | Board Member, TST and TIS (2004 — present); Board Member, Transamerica Funds (2005 — present); Board Member, TPP, TPFG, TPFG II and TAAVF (2007 — present); Board Member, TII (2008 — present); Employee, RBC Dain Rauscher (securities dealer) (2004); Executive Vice President, Chief Financial Officer and Chief Compliance Officer, William R. Hough & Co. (securities dealer) (1979 — 2004); and Treasurer, The Hough Group of Funds (1993 — 2004). | | | | present); West Central Florida Council — Boy Scouts of America (2008 — present) |
* Each Board Member shall hold office until: 1) his or her successor is elected and qualified or 2) he or she resigns, retires or his or her term as a Board Member is terminated in accordance with the Trust’s Declaration of Trust.
** May be deemed an “interested person” (as that term is defined in the 1940 Act) of the Trust because of his employment with TAM or an affiliate of TAM.
*** Independent Board Member means a Board Member who is not an “interested person” (as defined under the 1940 Act) of the Trust.
156
OFFICERS
The mailing address of each officer is c/o Secretary, 570 Carillon Parkway, St. Petersburg, Florida 33716. The following table shows information about the officers, including their ages, their positions held with the Trust and their principal occupations during the past five years (their titles may have varied during that period). Each officer will hold office until his or her successor has been duly elected or appointed or until his or her earlier death, resignation or removal.
Name and Age | | Position | | Term of Office and Length of
Time Served* | | Principal Occupation(s) or
Employment During Past 5 Years |
| | | | | | |
John K. Carter
(1961) | | Chairman, Board Member, President, and Chief Executive Officer | | Since 1999 | | See the table above. |
| | | | | | |
Dennis P. Gallagher
(1970) | | Vice President, General Counsel and Secretary | | Since 2006 | | Vice President, General Counsel and Secretary, Transamerica Funds, TST and TIS (2006 — present); Vice President, General Counsel and Secretary, TII, (2006 — present); Vice President, General Counsel and Secretary, TPP, TPFG, TPFG II and TAAVF (2007 — present); Director, Senior Vice President, General Counsel, Operations, and Secretary, TAM and TFS (2006 — present); Assistant Vice President, TCI (2007 — present); and Director, Deutsche Asset Management (1998 — 2006). |
| | | | | | |
Joseph P. Carusone
(1965) | | Vice President, Treasurer and Principal Financial Officer | | Since 2007 | | Vice President, Treasurer and Principal Financial Officer, Transamerica Funds, TST and TIS (2007 — present); Vice President, Treasurer and Principal Financial Officer, TII (2007 — present); Vice President (2007 — present), Treasurer and Principal Financial Officer (2001 — present), TPP, TPFG, TPFG II and TAAVF; Senior Vice President, TAM and TFS (2007 — present); Senior Vice President (2008 — present), Vice President (2001 — 2008); Diversified Investment Advisors, Inc. (“DIA”); Director and President, Diversified Investors Securities Corp. (“DISC”) (2007 — present); Director, Transamerica Financial Life Insurance Company (“TFLIC”) (2004 — present); and Treasurer, Diversified Actuarial Services, Inc. (2002 — present). |
| | | | | | |
Christopher A. Staples
(1970) | | Vice President and Chief Investment Officer | | Since 2005 | | Vice President and Chief Investment Officer (2007 — present); Vice President - Investment Administration (2005 — 2007), TII; Vice President and Chief Investment Officer (2007 — present), Senior Vice President - Investment Management (2006 — 2007), Vice President - Investment Management (2005 — 2006), Transamerica Funds, TST and TIS; Vice President and Chief Investment Officer, TPP, TPFG, TPFG II and TAAVF (2007 — present); Director (2005 — present), Senior Vice President — Investment Management (2006 — present) and Chief Investment Officer (2007 — present), TAM; Director, TFS (2005 — present); and Assistant Vice President, Raymond James & Associates (1999 — 2004). |
157
Name and Age | | Position | | Term of Office and Length of
Time Served* | | Principal Occupation(s) or
Employment During Past 5 Years |
| | | | | | |
Rick B. Resnik
(1967) | | Vice President, Chief Compliance Officer and Conflicts of Interest Officer | | Since 2008 | | Chief Compliance Officer, TPP, TPFG, TPFG II and TAAVF (2004 — present); Chief Compliance Officer, Transamerica Funds, TST and TIS (2008 — present); Vice President and Conflicts of Interest Officer, TPP, TPFG, TPFG II, TAAVF, Transamerica Funds, TST and TIS (2008 — present); Chief Compliance Officer, Vice President and Conflicts of Interest Officer, TII (2008 — present); Senior Vice President and Chief Compliance Officer, TAM (2008 — present); Senior Vice President, TFS (2008 — present); Vice President and Chief Compliance Officer, DIA (2004 - present); with DIA since 1988; Director (1999 — present), Vice President and Chief Compliance Officer (1996 — present), DISC; Assistant Vice President, TFLIC (1999 — present); and Chief Compliance Officer, Transamerica Partners Variable Funds (2004 - present). |
| | | | | | |
Robert A. DeVault, Jr.
(1965) | | Assistant Treasurer | | Since 2009 | | Assistant Treasurer, Transamerica Funds, TST, TIS, TPP, TPFG, TPFG II and TAAVF (January 2009 — present); Assistant Treasurer, TII (January 2009 — present); and Assistant Vice President (2007 — present) and Manager, Fund Administration, (2002 — 2007), TFS. |
| | | | | | |
Suzanne Valerio-Montemurro
(1964) | | Assistant Treasurer | | Since 2007 | | Assistant Treasurer, Transamerica Funds, TST, TIS, TPP, TPFG, TPFG II and TAAVF (2007 — present); Assistant Treasurer, TII (2007 — present); and Vice President, DIA (1998 — present). |
| | | | | | |
Sarah L. Bertrand
(1967) | | Assistant Secretary | | Since 2009 | | Assistant Secretary, Transamerica Funds, TST, TIS, TPP, TPFG, TPFG II and TAAVF (January 2009 — present); Assistant Secretary, TII (January 2009 — present); Assistant Vice President and Manager, Legal Administration, TAM and TFS (2007 — present); Assistant Secretary and Chief Compliance Officer, 40|86 Series Trust and 40|86 Strategic Income Fund (2000 - 2007); and Second Vice President and Assistant Secretary, Legal and Compliance, 40|86 Capital Management, Inc. (1994 — 2007). |
| | | | | | |
Timothy J. Bresnahan
(1968) | | Assistant Secretary | | Since 2009 | | Assistant Secretary, Transamerica Funds, TST, TIS, TPP, TPFG, TPFG II and TAAVF (January 2009 — present); Assistant Secretary, TII (January 2009 — present); Counsel, TAM (2008 — present); Counsel (contract), Massachusetts Financial Services, Inc. (2007); Assistant Counsel, BISYS Fund Services Ohio, Inc. (2005 — 2007); and Associate, Greenberg Traurig, P.A. (2004 — 2005). |
| | | | | | |
Richard E. Shield, Jr.
(1974) | | Tax Officer | | Since 2008 | | Tax Officer, Transamerica Funds, TST, TIS, TPP, TPFG, TPFG II and TAAVF (2008 — present); Tax Officer, TII (2008 — present); Tax Manager, Jeffrey P. McClanathan, CPA (2006 — 2007) and Gregory, Sharer & Stuart (2005 — 2006); Tax Senior, Kirkland, Russ, Murphy & Tapp, P.A. (2003 — 2005); and Certified Public Accountant, Schultz, Chaipel & Co., LLP (1998 — 2003). |
* Elected and serves at the pleasure of the Board of the Trust.
If an officer has held offices for different funds for different periods of time, the earliest applicable date is shown. No officer of the Trust, except for the Chief Compliance Officer, receives any compensation from the Trust.
Additional information about the Funds’ Board Members can be found in the Statement of Additional Information, available, without charge, upon request, by calling toll free 1-888-233-4339 or on the Trust’s website at www.transamericafunds.com.
158
PROXY VOTING POLICIES AND PROCEDURES AND QUARTERLY PORTFOLIO HOLDINGS
(unaudited)
A description of the Transamerica Funds’ proxy voting policies and procedures is available in the Statement of Additional Information of the Portfolios, available without charge upon request by calling 1-888-233-4339 (toll free) or on the Securities and Exchange Commission’s (“SEC”) website at http://www.sec.gov.
In addition, the Portfolios are required to file Form N-PX, with their complete proxy voting records for the 12 months ended June 30th, no later than August 31st of each year. The Form is available without charge: (1) from the Portfolios, upon request by calling 1-888-233-4339 and (2) on the SEC’s website at http://www.sec.gov.
The Portfolios file their complete schedule of portfolio holdings with the SEC for the first and third quarter of each fiscal year on Form N-Q, which is available on the SEC’s website at http://www.sec.gov. The Portfolios’ Form N-Q may be reviewed and copied at the SEC’s Public Reference Room in Washington, D.C. Information on the operation of the Public Reference Room may be obtained by calling 1-800-SEC-0330.
You may also visit the Trust’s website at www.transamericafunds.com for this and other information about the Portfolios and the Trust.
Important Notice Regarding Delivery of Shareholder Documents
Every year we send shareholders informative materials such as the Transamerica Funds Annual Report, the Transamerica Funds Prospectus, and other required documents that keep you informed regarding your Portfolios. Transamerica Funds will only send one piece per mailing address, a method that saves your Portfolios money by reducing mailing and printing costs. We will continue to do this unless you tell us not to. To elect to receive individual mailings, simply call a Transamerica Customer Service Representative toll free at 1-888-233-4339, 8 a.m. to 7 p.m. Eastern Time, Monday—Friday. Your request will take effect within 30 days.
159
Notice of privacy policy
(unaudited)
Protecting your privacy is very important to us. We want you to understand what information we collect and how we use it. We collect and use “nonpublic personal information” in connection with providing our customers with a broad range of financial products and services as effectively and conveniently as possible. We treat nonpublic personal information in accordance with our Privacy Policy.
What Information We Collect and From Whom We Collect It
We may collect nonpublic personal information about you from the following sources:
· Information we receive from you on applications or other forms, such as your name, address, and account number;
· Information about your transactions with us, our affiliates, or others, such as your account balance and purchase/redemption history; and
· Information we receive from non-affiliated third parties, including consumer reporting agencies.
What Information We Disclose and To Whom We Disclose It
We do not disclose any nonpublic personal information about current or former customers to anyone without their express consent, except as permitted by law. We may disclose the nonpublic personal information we collect, as described above, to persons or companies that perform services on our behalf and to other financial institutions with which we have joint marketing agreements. We will require these companies to protect the confidentiality of your nonpublic personal information and to use it only to perform the services for which we have hired them.
Our Security Procedures
We restrict access to your nonpublic personal information and only allow disclosures to persons and companies as permitted by law to assist in providing products or services to you. We maintain physical, electronic, and procedural safeguards to protect your nonpublic personal information and to safeguard the disposal of certain consumer information.
If you have any questions about our privacy policy, please call 1-888-233-4339 on any business day between 8 a.m. and 7 p.m. Eastern Time.
Note: This privacy policy applies only to customers that have a direct relationship with us or our affiliates. If you own shares of our funds in the name of a third party such as a bank or broker-dealer, its privacy policy may apply to you instead of ours.
160
P.O. Box 9012
Clearwater, FL 33758-9012

Customer Service 1-888-233-4339
P.O. Box 9012 · Clearwater, FL 33758-9012
Distributor: Transamerica Capital, Inc.

Class I Funds
Annual Report
October 31, 2009
www.transamericafunds.com
Customer Service 1-888-233-4339
P.O. Box 9012 · Clearwater, FL 33758-9012
Distributor: Transamerica Capital, Inc.
Dear Fellow Shareholder:
On behalf of Transamerica Funds, we would like to thank you for your continued support and confidence in our products as we look forward to continuing to serve you and your financial adviser in the future. We value the trust you have placed in us.
This annual report is provided to you with the intent of presenting a comprehensive review of the investments of each of your funds. The Securities and Exchange Commission requires that annual and semi-annual reports be sent to all shareholders, and we believe this report to be an important part of the investment process. In addition to providing a comprehensive review, this report also provides a discussion of accounting policies as well as matters presented to shareholders that may have required their vote.
We believe it is important to recognize and understand current market conditions in order to provide a context for reading this report. During the past twelve months, markets have oscillated from significant weakness in conjunction with investors’ concerns over the health of the economy and the labor market to strength in conjunction with investor optimism of recovery and bargain hunting. The equity markets touched new lows in March 2009, and then subsequently rallied sharply. The period ended in October with positive twelve-month returns for both the broad equity and bond markets. As economic recovery prospects have improved, the U.S. dollar has weakened versus the Euro, Pound Sterling, and Japanese Yen. Oil prices have been quite volatile over the past year, hitting their lows in January 2009 and recovering to end higher at the end of the period. From a rate of 1.00% at the beginning of the period, the Federal Reserve lowered the federal funds rate in December 2008 to a range of 0%-0.25% in an effort to stimulate the economy. The unemployment rate has continued to climb and reached 10.2% in October. Bargain hunting and an increased appetite for risk following market lows in March 2009 has led to strong gains for particular equity and fixed-income sectors, including emerging market stocks, technology stocks and high-yield bonds. Treasuries and money market securities have lagged on a relative basis. For the twelve months ending October 31, 2009, the Dow Jones Industrial Average returned 7.71%; the Standard & Poor’s 500 Index returned 9.80%; and the Barclays Capital Aggregate U.S. Bond Index returned 13.79%. Please keep in mind it is important to maintain a diversified portfolio as investment returns have historically been difficult to predict.
In addition to your active involvement in the investment process, we firmly believe that a financial adviser is a key resource to help you build a complete picture of your current and future financial needs. Financial advisers are familiar with the market’s history, including long-term returns and volatility of various asset classes. With your financial adviser, you can develop an investment program that incorporates factors such as your goals, your investment timeline, and your risk tolerance.
Please contact your financial adviser if you have any questions about the contents of this report, and thanks again for the confidence you have placed in us.
Sincerely, | |
| |
| |
John K. Carter | Christopher A. Staples |
Chairman of the Board, | Senior Vice President & Chief Investment Officer |
President & Chief Executive Officer | Transamerica Funds |
Transamerica Funds | |
The views expressed in this report reflect those of the portfolio managers only and may not necessarily represent the views of the Transamerica Funds. These views are subject to change based upon market conditions. These views should not be relied upon as investment advice and are not indicative of trading intent on behalf of the Transamerica Funds.
Transamerica AllianceBernstein International Value
(unaudited)
MARKET ENVIRONMENT
International equity markets gained during the 12-month period ended October 31, 2009, as the Morgan Stanley Capital International-Europe, Australasia, and Far East Index (“MSCI-EAFE”) advanced 28.41%. The period started with volatile markets amid uncertainty within the financial sector and growing concerns about the broader global economy. Markets began to recover in March 2009 as investors took heart from renewed US government efforts to stabilize the banking system. We have since experienced a dramatic rally from the lows reached in March 2009 as investors once again returned to risky assets.
PERFORMANCE
For the year ended October 31, 2009, Transamerica AllianceBernstein International Value Class I returned 24.32%. By comparison, its benchmark, the MSCI-EAFE, returned 28.41%.
STRATEGY REVIEW
An overweight to the finance sector, combined with stock selection in the sector, contributed to performance. This included our position in Deutsche Bank, which benefitted from government action to revive bank lending and its own restructuring efforts. Other contributors included Petro Canada in the energy sector and Sumitomo Metal Mining in the industrial commodities sector.
Detracting from relative performance was an overweight to the telecommunications sector and stock selection in that sector. Other notable detractors from performance included Stora Enso, the Finnish paper and packaging products company, which reported disappointing results and a larger than expected reduction in its dividend. With demand deteriorating at unprecedented rates and costs remaining stubbornly high, we trimmed our position in the stock in the first quarter. Japanese financial ORIX Corp. also detracted from relative returns, as did UK-based integrated energy company Centrica PLC.
The portfolio’s country allocations are primarily a result of our bottom-up stock selection process. Security selection within countries was generally positive during the quarter, contributing to returns in Japan, Germany and Australia, while detracting in the United Kingdom, Finland and Belgium. Country selection detracted from overall performance, particularly our underweight to Hong Kong and overweight to Germany. Currency detracted from performance in the portfolio, hurt by an overweight to the US dollar.
Despite the improvement in sentiment, investors remain anxious. While risk aversion and volatility are down materially from their peaks, there is an unusually wide divergence of opinion about the outlook for corporate earnings, indicating that uncertainty remains high. And discounts on the most attractive stocks are still above their long-term averages across most sectors.
Sharon E. Fay, CFA
Kevin F. Simms, CPA
Henry S. D’Auria, CFA
Eric J. Franco, CFA
Co-Portfolio Managers
AllianceBernstein L.P.
1
Transamerica AllianceBernstein International Value
(unaudited)
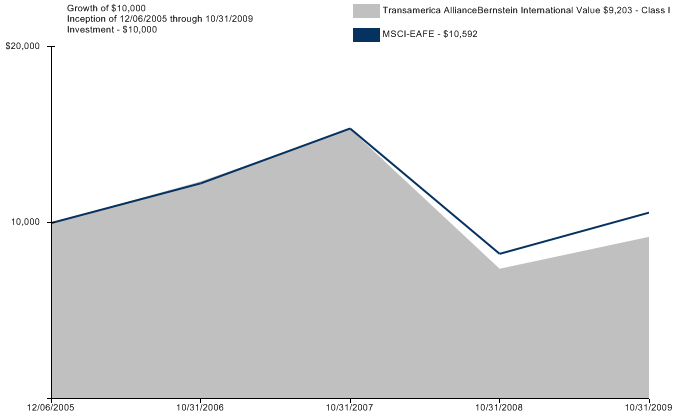
Average Annual Total Return for Periods Ended 10/31/2009
| | 1 Year | | 10 Years or
Life of Fund | | Inception Date | |
Class I (NAV) | | 24.32 | % | (2.07 | )% | 12/06/2005 | |
MSCI-EAFE* | | 28.41 | % | 1.48 | % | 12/06/2005 | |
NOTES
* The Morgan Stanley Capital International-Europe, Australasia, and Far East (“MSCI-EAFE”) Index is an unmanaged index used as a general measure of market performance. Calculations assume dividends and capital gains are reinvested and do not include any managerial expenses. The 10 Years or Life of Fund calculation is based on life of the fund. You cannot invest directly in an Index.
The performance data presented represents past performance; future results may vary. Performance data does not reflect the deduction of taxes that would be paid on fund distributions or the redemption of fund shares. Investment return and principal value will fluctuate so that an investor’s shares, when redeemed, may be worth more or less than their original cost. Current performance may be lower or higher than performance quoted. Please see www.transamericafunds.com for performance data current to the most recent month-end. Net Asset Value (NAV) returns include the reinvestment of dividends and capital gains. Fund shares are sold without a sales load.
Performance figures may reflect fee waivers and/or expense reimbursements by the Investment Adviser. Without such waivers and/or reimbursements, the performance would be lower. Future waivers and/or reimbursements are at the discretion of the Investment Adviser.
International investing involves special risks including currency fluctuations, political instability, and different financial accounting standards. This material must be preceded or accompanied by a current prospectus, which includes specific contents regarding the investment objectives and policies of this fund. This fund is only available in Class I shares, which are not available for direct investment by the public.
2
Transamerica BlackRock Global Allocation
(unaudited)
MARKET ENVIRONMENT
For the period of November 1, 2008 through October 31, 2009, both global equity and global bond markets rebounded sharply and generated attractive returns for investors. Global equities, as measured by the Financial Times Stock Exchange World Index (“FTSE World”), returned 22.55%. Global bonds, as measured by the Barclays Capital Global Aggregate Bond Index, returned 18.41%. We believe the environment offers attractive investment opportunities. However we feel that a diversified approach across asset classes and regions will remain important as investors evaluate Central Bank economic policies and monitor the stability of economic conditions, including tractable gains in GDP and sustainable corporate earnings.
PERFORMANCE
For the year ended October 31, 2009, Transamerica BlackRock Global Allocation Class I returned 20.57%. By comparison, its benchmark, the FTSE World, returned 22.55%.
STRATEGY REVIEW
The Fund invests in a combination of equities and bonds; therefore, the Reference Portfolio provides both a truer representation of the Fund’s composition and a more comparable means for measurement. Returns for each component of the Reference Portfolio for the 12-months ended October 31, 2009, were as follows; the Standard and Poor’s 500 Composite Stock Index (“S&P 500”) returned 9.80%, the FTSE World Index (ex-U.S.) returned 33.56%; the BofA Merrill Lynch current 5-year Treasury Index returned 6.33%; and the Citigroup (non-USD) World Government Bond Index returned 19.26%. Fund results exceeded the 16.58% return of its Reference Portfolio for the 12-month period, but trailed the 22.55% return of its broad-based all-equity benchmark, the FTSE World.
In absolute terms, the Fund’s returns were aided by the recovery in global equity prices which occurred over the past 12 months. Although underweight equities relative to its Reference Portfolio, the Fund benefitted from its underweight and stock selection in the U.S. along with an overweight and stock selection in Canada. The Fund also benefitted from its overweight position in emerging markets including Brazil, Russia, India, and China. From a sector perspective, stock selection in the Energy, Health Care, and Industrial sectors along with an overweight to Materials and an underweight and stock selection in Utilities all contributed positively. Detracting from the Fund’s relative performance was its underweight and stock selection in Australia, in addition to its underweight and stock selection in Spain and France, and an overweight and stock selection in Japan. From a sector perspective, an underweight and stock selection in the Information Technology, Financials, and Consumer Discretionary sectors all detracted from relative performance.
Although underweight bonds, the Fund benefited from the composition of its fixed income component. This included an overweight in U.S. TIPS (Treasury Inflation Protected Securities) and an overweight in both U.S. and non-U.S. convertible bonds. Also contributing to performance was the Fund’s underweight in nominal U.S. Treasuries relative to its Reference Portfolio.
As of October 31, 2009, the Fund is modestly underweight equities relative to its Reference Portfolio. From a regional perspective, the Fund is overweight Asian and Latin American stocks and underweight U.S. and European stocks. The Fund is also underweight fixed income securities relative to its Reference Portfolio. Within fixed income, the Fund is overweight convertible bonds as well as U.S. TIPS (Treasury Inflation Protected Securities) and underweight Japanese and Euro-denominated government bonds. The Fund is overweight cash equivalents relative to its Reference Benchmark. Cash is actively managed and has helped mitigate portfolio volatility, served as a source of funds for new investments and contributed to reducing the overall portfolio interest rate duration.
Dennis W. Stattman
Romualdo Roldan
Dan Chamby
Co-Portfolio Managers
BlackRock Investment Management, LLC
3

Average Annual Total Return for Periods Ended 10/31/2009
| | 1 Year | | 10 Years or
Life of Fund | | Inception Date | |
Class I (NAV) | | 20.57 | % | 5.97 | % | 12/06/2005 | |
FTSE World * | | 22.55 | % | 0.47 | % | 12/06/2005 | |
NOTES
* The Financial Times Stock Exchange World (“FTSE World”) Index is an unmanaged index used as a general measure of market performance. Calculations assume dividends and capital gains are reinvested and do not include any managerial expenses. The 10 Years or Life of Fund calculation is based on life of the fund. You cannot invest directly in an Index.
The performance data presented represents past performance; future results may vary. Performance data does not reflect the deduction of taxes that would be paid on fund distributions or the redemption of fund shares. Investment return and principal value will fluctuate so that an investor’s shares, when redeemed, may be worth more or less than their original cost. Current performance may be lower or higher than performance quoted. Please see www.transamericafunds.com for performance data current to the most recent month-end. Net Asset Value (NAV) returns include the reinvestment of dividends and capital gains. Fund shares are sold without a sales load.
Performance figures may reflect fee waivers and/or expense reimbursements by the Investment Adviser. Without such waivers and/or reimbursements, the performance would be lower. Future waivers and/or reimbursements are at the discretion of the Investment Adviser.
International investing involves special risks including currency fluctuations, political instability, and different financial accounting standards. This material must be preceded or accompanied by a current prospectus, which includes specific contents regarding the investment objectives and policies of this fund. This fund is only available in Class I shares, which are not available for direct investment by the public.
4
Transamerica BlackRock Large Cap Value
(unaudited)
MARKET ENVIRONMENT
In late 2008 and early 2009, investors had to give serious consideration to the unpleasant possibility that the authorities would be unable to prevent a modern day Great Depression. Events were careening out of control, with the credit seizure and declining economic activity creating a vicious, self-feeding downward spiral. Fortunately, extraordinary policy interventions pulled the global economy back from the brink, and the shift in economic perceptions from deep despair to cautious optimism has driven risk asset prices sharply higher during the final six months of the period. The rally that began in March 2009 progressed strongly, resulting in an approximate 59% increase in the Russell 1000® Value Index (“Russell 1000® Value”) price since it hit bottom on March 6. The same financial stocks that were battered by the credit crises soared during the rally on the heels of “less bad” news, rather than discernable earnings prospects. Over the 12-month period, which comprises a significant portion of the credit crisis, the index returned 4.8% and the Standard and Poor’s 500 Composite Stock Index returned 9.8%.
It is no longer necessary to discount an Armageddon scenario, but there is still much uncertainty about the economic and financial outlook. We believe the nascent economic recovery should be sustained, but there are good reasons to expect it to be a hesitant affair, leaving plenty of scope for periodic disappointments. Thus, we believe that while equity prices should move higher in the next few years, the easy part of the advance is over. In our opinion, further gains will depend more on earnings rather than multiple expansion, and that could prove to be a slow grind, not a powerful advance.
PERFORMANCE
For the year ended October 31, 2009, Transamerica BlackRock Large Cap Value Class I returned 4.50%. By comparison, its benchmark, the Russell 1000® Value, returned 4.78%.
STRATEGY REVIEW
The portfolios performance was attributable to allocation, and to a degree, stock selection. Our overweight and stock selection in energy helped performance. Anadarko Petroleum is an example of an energy stock that performed well during the period, as the firm is benefiting from sustainable $60 to $70 per barrel crude oil prices and recovering natural gas prices. Exploration success in the deepwater Liberian Basin validates the potential resource value to be unlocked through Anadarko’s high-impact exploration program including offshore Brazil, West Africa and the Gulf of Mexico.
Further gains were attributable to our overweight in information technology. Western Digital was one of the stronger performers in the sector, and is selectively gaining share in higher-margin areas through technology and manufacturing advantages. The stock’s recent outperformance was driven by positive earnings revisions as the company executed well relative to the demand upturn in the PC supply chain.
An underweight in utilities also contributed. Our lack of exposure was due to the historically high valuations, which do not reflect increasing regulatory scrutiny. Furthermore, input cost pressures left the sector more cyclical than in the past. Within the healthcare sector, stock selection, especially in the healthcare providers and services area, helped returns. We were overweight in this group, as we believe it provides cost-containment services, which are increasingly important in light of escalating healthcare spending trends.
On the negative side, an underweight and stock selection within consumer staples detracted from performance. One of the largest detractors in the sector was our position in Kroger Co., a position that we exited by the end of the period. We were underweight in the sector due to valuation, lack of growth and competitive challenges. Over the period, raw material costs remained a challenge to the sector’s earnings growth.
Additionally stock selection and an underweight to industrials hurt performance. Lack of exposure to machinery stocks and an overweight to aerospace and defense especially detracted. We continue to like some of the names that detracted over the period such as L-3 Communications. While valuations have been challenging for the defense companies, their customer base remains solid with highly visible funding on key defense programs.
Robert C. Doll, Jr., CFA, CPA
Daniel Hanson, CFA
Co-Portfolio Managers
BlackRock Investment Management, LLC
5
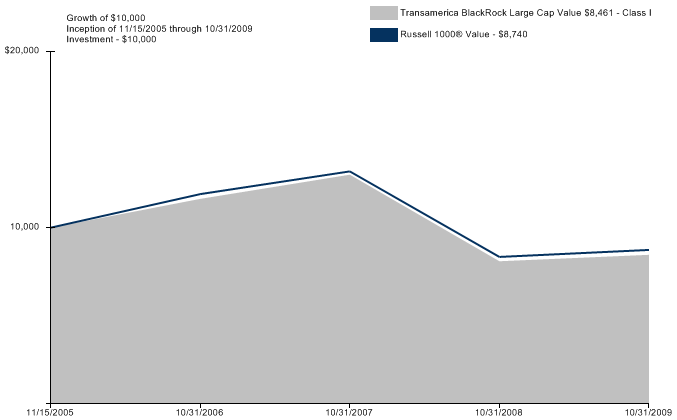
Average Annual Total Return for Periods Ended 10/31/2009
| | 1 Year | | 10 Years or
Life of Fund | | Inception Date | |
Class I (NAV) | | 4.50 | % | (4.13 | )% | 11/15/2005 | |
Russell 1000® Value* | | 4.78 | % | (3.34 | )% | 11/15/2005 | |
NOTES
* The Russell 1000® Value (“Russell 1000® Value”) Index is an unmanaged index used as a general measure of market performance. Calculations assume dividends and capital gains are reinvested and do not include any managerial expenses. The 10 Years or Life of Fund calculation is based on life of the fund. You cannot invest directly in an Index.
The performance data presented represents past performance; future results may vary. Performance data does not reflect the deduction of taxes that would be paid on fund distributions or the redemption of fund shares. Investment return and principal value will fluctuate so that an investor’s shares, when redeemed, may be worth more or less than their original cost. Current performance may be lower or higher than performance quoted. Please see www.transamericafunds.com for performance data current to the most recent month-end. Net Asset Value (NAV) returns include the reinvestment of dividends and capital gains. Fund shares are sold without a sales load.
Performance figures may reflect fee waivers and/or expense reimbursements by the Investment Adviser. Without such waivers and/or reimbursements, the performance would be lower. Future waivers and/or reimbursements are at the discretion of the Investment Adviser.
This material must be preceded or accompanied by a current prospectus, which includes specific contents regarding the investment objectives and policies of this fund. This fund is only available in Class I shares, which are not available for direct investment by the public.
6
Transamerica BlackRock Natural Resources
(unaudited)
MARKET ENVIRONMENT
The annual period was extremely volatile, beginning with a downward move in late 2008 into the first quarter of 2009, and ending with a significant rally.
The second half of 2008 through the first quarter of 2009 marked the most difficult environment for the strategy since its inception. Dramatic weakness in commodities prices continued through the second half of 2008 as reverberations from the failure of Lehman Brothers and the ongoing credit crisis crippled global economies and end-user demand for most hard commodities. While precious metals and soft commodities fared well on a relative basis, tumbling energy and mining prices contributed to the Consumer Research Bureau (“CRB”) Price Index posting a 36% decline in 2008. In this environment, the Fund generated significant losses, but outperformed most of its peers. Fears over the demand ramifications of a prolonged economic recession/depression for natural resources and forced selling by hedge funds contributed to negative psychology surrounding energy/commodity stocks, weighing heavily on the sector. Investors favored large diversified companies with significant cash reserves, shunning many of the higher-beta exploration and service names in our universe. Investors became increasingly short-sighted as economic conditions continued to worsen, and were unwilling to look beyond the news item of the hour. In this environment, cash-heavy mega-cap stocks within the sector outperformed. Our underweight in large-cap integrated oil stocks such as Exxon Mobil Corp. impaired relative return comparisons as these stocks managed to outperform both the sector and the broad market.
Since early March, however, several key areas of commodities markets have posted substantial gains as investor sentiment notably improved. Changing perceptions of global economic activity levels proved to be the key catalyst for many commodities to rally from extremely depressed levels. Improved growth expectations, coupled with supply cuts resulting from the precipitous price declines endured in the second half of 2008, gave investors increased confidence that supply overhangs would be short-lived across a variety of supply-constrained commodities. As the third quarter of 2009 progressed, these changing perceptions started to become substantiated by improving economic data, inventory restocking, and more favorable operating conditions. Copper prices, which have become a proxy for economic activity levels, continued higher. Oil prices, which had fallen below $35/barrel (bbl) in February 2009, finished October near $80/bbl. During this time, higher-beta names significantly outperformed the lower-beta defensive names that fared best late in 2008.
PERFORMANCE
For the year ended October 31, 2009, Transamerica BlackRock Natural Resources Class I returned 24.41%. By comparison, its benchmark, the Morgan Stanley Capital International Natural Resources Index (“MSCI Natural Resources”), returned 21.55%.
STRATEGY REVIEW
In this environment, the Fund outperformed the MSCI Natural Resources over the one-year period ending October 31, 2009. As the U.S. dollar has come under pressure and the global economy has rebounded, our metals allocation, including gold and industrial metals, generated strong absolute and relative returns. Higher-beta segments have rallied sharply since March 2009 and, as such, our emphasis on higher-growth energy service and exploration & production companies benefited the portfolio. While not emphasized in the portfolio, overweight allocations to the lower-beta, larger-cap, and slower-growth integrated and refining segments detracted from relative performance. Cash also detracted from returns during the period as the Fund rallied.
Due to the long-term nature of our investment approach and our belief that the value of the companies we own has still not been fully realized by the market, portfolio positioning is little changed. We continue to prefer oil service companies that have strong international business prospects and solid balance sheets, and oil & gas exploration & production stocks, as we believe these companies offer superior future production and earnings growth prospects. In contrast, we are less bullish on the major integrated oil & gas companies and refiners.
Robert Shearer, CFA
Portfolio Manager
BlackRock Investment Management, LLC
7
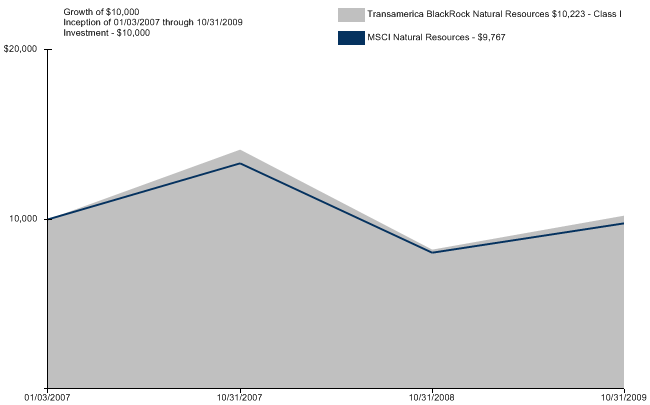
Average Annual Total Return for Periods Ended 10/31/2009
| | 1 Year | | 10 Years or
Life of Fund | | Inception Date | |
Class I (NAV) | | 24.41 | % | 0.78 | % | 01/03/2007 | |
MSCI Natural Resources* | | 21.55 | % | (0.83 | )% | 01/03/2007 | |
NOTES
* The Morgan Stanley Capital International Natural Resources (“MSCI Natural Resources”) Index is an unmanaged index used as a general measure of market performance. Calculations assume dividends and capital gains are reinvested and do not include any managerial expenses. The 10 Years or Life of Fund calculation is based on life of the Fund. You cannot invest directly in an Index.
The performance data presented represents past performance; future results may vary. Performance data does not reflect the deduction of taxes that would be paid on fund distributions or the redemption of fund shares. Investment return and principal value will fluctuate so that an investor’s shares, when redeemed, may be worth more or less than their original cost. Current performance may be lower or higher than performance quoted. Please see www.transamericafunds.com for performance data current to the most recent month-end. Net Asset Value (NAV) returns include the reinvestment of dividends and capital gains. Fund shares are sold without a sales load.
Performance figures may reflect fee waivers and/or expense reimbursements by the Investment Adviser. Without such waivers and/or reimbursements, the performance would be lower. Future waivers and/or reimbursements are at the discretion of the Investment Adviser.
This material must be preceded or accompanied by a current prospectus, which includes specific contents regarding the investment objectives and policies of this Fund. This Fund is only available in Class I shares, which are not available for direct investment by the public.
8
Transamerica BNY Mellon Market Neutral Strategy
(unaudited)
MARKET ENVIRONMENT
During the fourth quarter of 2008 markets fell precipitously as it became increasingly clear that the credit crisis would result in an extended global recession. Although the market briefly rebounded toward the end of 2008 on hopes for a positive effect from massive government intervention, they continued to decline in the first quarter of 2009, hitting bottom in early March. A sharp reversal led by the lowest quality, most highly levered stocks ensued as leading indicators suggested the economy might return to growth sooner than expected. Investor’s relief resulted in the strongest quarterly market gains in the second and third quarters of the year since the fourth quarter of 1998.
PERFORMANCE
For the year ended October 31, 2009, Transamerica BNY Mellon Market Neutral Strategy Class I returned (10.27)%. By comparison, its benchmark, the Bank of America Merrill Lynch 3 Month Treasury Bill + 3% Index, returned 3.35%.
STRATEGY REVIEW
The market neutral strategy is a long/short stock selection strategy based on our quantitative implementation of fundamental and technical valuation concepts. Our daily investment process combines a highly diversified set of factors, or characteristics, including value-based metrics, growth/momentum metrics, and factors based on corporate and management stock buying/selling activity and earnings quality. We blend these measures into a single composite rank for each stock using a dynamic weighting scheme. Then we construct long and short portfolios that are carefully controlled along several dimensions of risk. These include the requirement that the net of the long and short portfolios always be near neutral in terms of beta, sector/industry exposure, and capitalization, among other risk factors. Subject to these risk constraints, the target portfolio consists of long positions in the most attractive stocks and short positions in the least attractive stocks.
The portfolio underperformed its benchmark over the twelve months through October 31, 2009. The market comeback was largely led by the lower-quality, highly leveraged companies which had been the most beaten down during the credit crisis. Also challenging for our process was the high degree of market volatility, which produced frequent shifts in market leadership and in the drivers underlying market direction. The environment proved to be unfavorable for our balanced investment process, as it did for many investors using quantitative investment processes, and the fund posted negative returns for the fiscal year. In particular, despite some positive impacts from the valuation-based components of our process, the part of our model that emphasizes earnings and price momentum significantly detracted value from the portfolio.
While we always seek to minimize the impact of industry, sector, market capitalization, and other top-down exposures, we had narrowed our allowable bands in the recent highly volatile environment, and particularly tightened net sector exposures in the most volatile areas such as Finance, Basic Materials, and Energy. As volatility declines, we expect to return to more normal levels of risk control.
Large vehicle manufacturer Oshkosh Corp. was the strongest portfolio holding, as the manufacturer of armored vehicles soared partly due to increased demand from the defense department. Apple was another strong performer, as analysts continued to recommend the stock, expecting the company to see continued growth due to the success of Apple’s iPhone and sales of Macintosh computers. On the short side, Century Aluminum added value as a steep drop in aluminum prices late last year caused a decline in its stock price.
Utility company Mirant Corp. has lagged its peers during the market rebound and recently suffered downgrades following the announcement of an expected shutdown of a California power plant. A short position in Intuitive Surgical detracted from performance as the maker of surgical robots exceeded revenue and profit estimates. Another short holding, drug maker Inverness Medical Innovations, posted improved revenue, particularly from a jump in North American influenza products sales.
Our investment process seeks to minimize the impact of sector/industry weightings on the performance of the portfolio by maintaining approximately equal weightings of long and short positions in each sector and industry. Nevertheless, slight net long and short sector/industry positions, such as our net short position in the consumer services sector, did have a small negative overall impact on performance.
Michael F. Dunn, CFA
Oliver E. Buckley
Langton C. Garvin, CFA
Co-Portfolio Managers
Mellon Capital Management Corporation
9
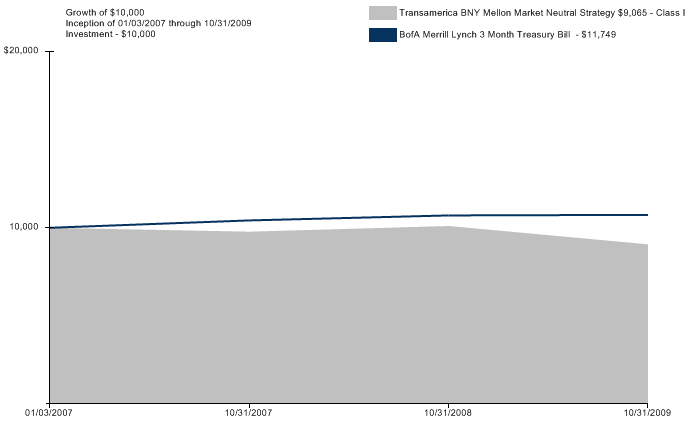
Average Annual Total Return for Periods Ended 10/31/2009
| | 1 Year | | 10 Years or
Life of Fund | | Inception Date | |
Class I (NAV) | | (10.27 | )% | (3.41 | )% | 01/03/2007 | |
BofA Merrill Lynch 3 Month Treasury Bill * | | 3.35 | % | 5.66 | % | 01/03/2007 | |
NOTES
* The Bank of America Merrill Lynch 3 Month Treasury Bill + 3% Wrap Fee (“BofA Merrill Lynch 3 Month Treasury Bill”) Index is an unmanaged index used as a general measure of market performance. Calculations assume dividends and capital gains are reinvested and do not include any managerial expenses. The 10 Years or Life of Fund calculation is based on life of the Fund. You cannot invest directly in an Index.
The performance data presented represents past performance; future results may vary. Performance data does not reflect the deduction of taxes that would be paid on fund distributions or the redemption of fund shares. Investment return and principal value will fluctuate so that an investor’s shares, when redeemed, may be worth more or less than their original cost. Current performance may be lower or higher than performance quoted. Please see www.transamericafunds.com for performance data current to the most recent month-end. Net Asset Value (NAV) returns include the reinvestment of dividends and capital gains. Fund shares are sold without a sales load.
Performance figures may reflect fee waivers and/or expense reimbursements by the Investment Adviser. Without such waivers and/or reimbursements, the performance would be lower. Future waivers and/or reimbursements are at the discretion of the Investment Adviser.
This material must be preceded or accompanied by a current prospectus, which includes specific contents regarding the investment objectives and policies of this Fund. This Fund is only available in Class I shares, which are not available for direct investment by the public.
10
Transamerica Federated Market Opportunity
(unaudited)
MARKET ENVIRONMENT
The fiscal year ending October 31, 2009 was a tale of two markets. The fiscal year started with global economies falling further into recession. Equity markets hit record high levels of volatility and suffered significant losses. In response, governments around the world coordinated efforts on interest rate cuts and implemented a variety of capital and financial guarantee programs aimed at restoring the functioning of credit markets. The U.S. Federal Reserve lowered the Federal Funds rate to a historic low, a range between 0.25% and 0%. This first half of the year was marked with the market bottoming in early March.
The second half of the market can be described as a historic bear market rally. The Standard and Poor’s 500 Composite Stock Index bounced off its lows to rally 64% to its high late in the fiscal year. Economic data showed some improvement with third quarter GDP climbing 3.5%, lead by government stimulus.
PERFORMANCE
For the year ended October 31, 2009, Transamerica Federated Market Opportunity Class I returned 13.01%. By comparison, its primary and secondary benchmarks, the Russell 3000® Value Index and Bank of America Merrill Lynch 3-Month T-Bill Index, returned 4.56% and 0.30%, respectively.
STRATEGY REVIEW
The fund is managed to provide absolute positive returns with low correlation to the U.S. equity market. The fund had a strong positive return for the fiscal year, and it exceeded the return on its market index benchmark.
After the initial equity market crash, valuations on stocks appeared more compelling and the fund’s equity position was increased to take advantage of a rebound in equity prices, which benefited the fund. The fund was more defensively positioned as economic and financial conditions worsened. Once markets rallied substantially off their lows, the fund increased its position in put options to benefit from a significant decline in U.S. equity prices. The fund had substantial cash reserves in addition to put options as a hedge against an anticipated decline in stock prices. The put options on U.S. equity indexes would increase in value if stock prices fell. The rationale for the fund’s strategy was that market bubble history and market valuation history in general, and rapidly deteriorating economic and financial conditions, supported a highly risk-averse strategy during the latter part of the fiscal year. As the market rose over the second half of the year and the portfolio managers increased the fund’s holdings of put options, the fund had net losses on the put options later in the fiscal year. Despite that, the fund’s fiscal-year performance significantly exceeded that of its benchmarks.
Equity sector returns were particularly positive in the gold, energy, and material sectors. On a net basis, securities in other sectors had a modest net gain.
Among the positive contributors to the fund’s performance, the best was Yamana Gold Inc., a Canadian gold mining company. The largest loss came from the put options on the Russell 2000® index. From a country perspective, Canadian stocks were the top contributors to the fund, as the fund held a number of Canadian gold stocks.
Steven J. Lehman, CFA
Dana L. Meissner, CFA
Co-Portfolio Managers
Federated Equity Management Company of Pennsylvania
11
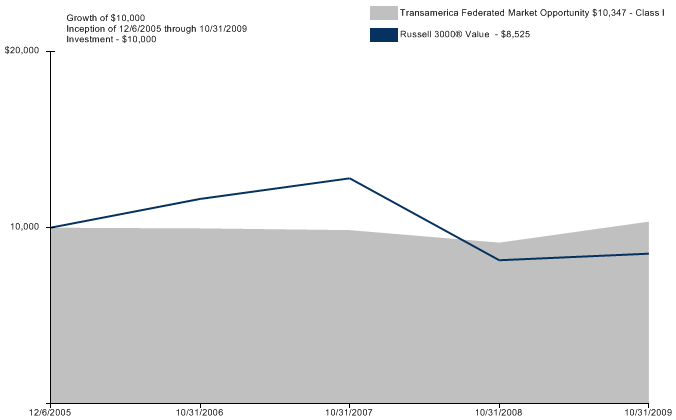
Average Annual Total Return for Periods Ended 10/31/2009
| | 1 Year | | 10 Years or
Life of Fund | | Inception Date | |
Class I (NAV) | | 13.01 | % | 0.88 | % | 12/06/2005 | |
Russell 3000® Value * | | 4.56 | % | (4.01 | )% | 12/06/2005 | |
BofA Merrill Lynch 3 Month Treasury Bill * | | 0.30 | % | 3.16 | % | 12/06/2005 | |
NOTES
* The Russell 3000® Value (“Russell 3000® Value”) Index and the Bank of America Merrill Lynch 3 Month Treasury Bill (“BofA Merrill Lynch 3 Month Treasury Bill”) Index are unmanaged indices used as a general measure of market performance. Calculations assume dividends and capital gains are reinvested and do not include any managerial expenses. The 10 Years or Life of Fund calculation is based on life of the fund. You cannot invest directly in an Index.
The performance data presented represents past performance; future results may vary. Performance data does not reflect the deduction of taxes that would be paid on fund distributions or the redemption of fund shares. Investment return and principal value will fluctuate so that an investor’s shares, when redeemed, may be worth more or less than their original cost. Current performance may be lower or higher than performance quoted. Please see www.transamericafunds.com for performance data current to the most recent month-end. Net Asset Value (NAV) returns include the reinvestment of dividends and capital gains. Fund shares are sold without a sales load.
Performance figures may reflect fee waivers and/or expense reimbursements by the Investment Adviser. Without such waivers and/or reimbursements, the performance would be lower. Future waivers and/or reimbursements are at the discretion of the Investment Adviser.
International investing involves special risks including currency fluctuations, political instability, and different financial accounting standards. This material must be preceded or accompanied by a current prospectus, which includes specific contents regarding the investment objectives and policies of this fund. This fund is only available in Class I shares, which are not available for direct investment by the public.
12
Transamerica JPMorgan Core Bond
(unaudited)
MARKET ENVIRONMENT
The recession of the past year, the deepest in post-World War II history, continued to show signs of improvement during the third quarter. The industrial and housing sectors bounced back strongly after significant and prolonged corrections. These gains were from extremely depressed levels, and the pace will likely ease in the quarters ahead. Nonetheless, strength in these two sectors has helped stem contraction in overall gross domestic product. Consumer spending also came back solidly in the third quarter due primarily to the “cash for clunkers” program; elsewhere spending looked weak.
A rebounding industrial sector is a principal theme of the outlook for the second half of the year. The Institute for Supply Management (ISM) manufacturing survey broke through the expansion threshold of 50 (52.9) in August for the first time since January 2008, before pulling back slightly to 52.6 in September. Importantly, the customer inventory index of the ISM report remained very low, meaning that inventories were viewed as much too lean. Inventories, exports and global capital spending are helping the industrial sector improve as production catches up with sales.
Home sales and housing starts recovered strongly. The data through August show that the annualized three-month moving averages of single-family starts, single-family home sales, and existing home sales have soared 147%, 106% and 34% respectively. Even with these recent surges, single-family starts were still running below sales, with inventories falling as a result. The first-time home buyer tax credit, set to expire in November, also helped.
We are less optimistic about home prices. While price measures, including the S&P/Case-Shiller and the Federal Housing Finance Agency indexes, appear to have stabilized in recent months, inventories of existing homes for sale remained very high, and serious delinquencies and foreclosures continued to increase. In this backdrop, we expect another drop from the second quarter level in the national S&P/Case-Shiller index.
The recovery in the labor market is at best sluggish. Job losses slowed to 768,000 in the third quarter. However, by one estimate, the U.S. economy needs to create approximately 300,000 jobs per quarter to keep the unemployment rate steady. Another troubling aspect for consumer spending is the decided weakness in wages: hourly earnings fell to 2.5% year-over-year by September from a peak of 4.2% in July 2007 and, given the amount of slack in labor markets, will almost certainly weaken further.
Financial conditions eased notably in the third quarter. With rising equity prices, low Treasury and mortgage rates, and the Federal Reserve likely to keep rates low for an “extended period,” the U.S. was in a “sweet spot” of liquidity. However, household credit conditions remained very tight, and banks continue to believe that consumer’s balance sheets will remain stressed and take years to normalize. The demand for consumer loans fell and the number of outstanding U.S. credit cards continued to drop through June as the deleveraging of households continued.
Treasury prices rallied in the third quarter on the back of disappointing economic data and evidence of contained inflation due to subdued growth prospects. The curve flattened as the spread between the two- and five-year yields decreased. London Inter-Bank Offer Rate (“LIBOR”) rates continued their decline.
PERFORMANCE
For the period from inception July 1, 2009 through October 31, 2009, Transamerica JPMorgan Core Bond Class I returned 1.34%. By comparison, its benchmark, the Barclays Capital U.S. Aggregate Bond Index, returned 4.26%.
STRATEGY REVIEW
The Transamerica JPMorgan Core Bond Class I was initiated in early July 2009 and, as such, does not have a full year of performance and portfolio history for the period ended October 31, 2009. Additionally, given that it was funded in early July, the positioning of the Portfolio over the period was not where it will be once fully invested. Given the continued rally in spread products over the past few months, the Fund’s underweight in corporates was a slight detractor from performance. However, the Fund’s overweight in mortgage-backed securities was a positive, as continued government intervention and improving fundamentals in the mortgage market helped the sector post positive excess returns over comparable-duration Treasuries.
Douglas S. Swanson
Portfolio Manager
J.P. Morgan Investment Management, Inc.
13
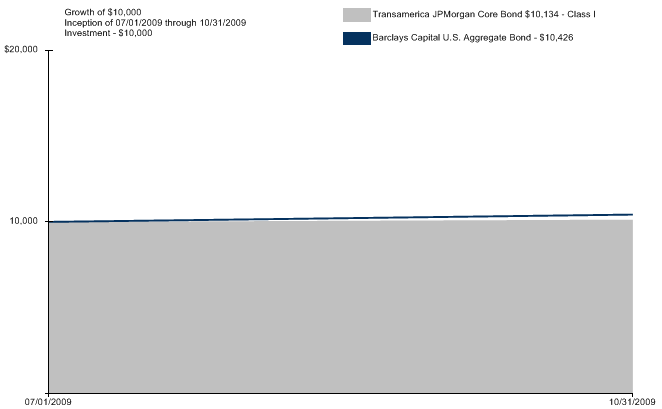
Average Annual Total Return for Period Ended 10/31/2009
| | 10 Years or
Life of Fund | | Inception Date | |
Class I (NAV) | | 1.34 | % | 07/01/2009 | |
Barclays Capital U.S. Aggregate Bond* | | 4.26 | % | 07/01/2009 | |
NOTES
* The Barclays Capital U.S. Aggregate Bond (“Barclays Capital U.S. Aggregate Bond”) Index is an unmanaged index used as a general measure of market performance. Calculations assume dividends and capital gains are reinvested and do not include any managerial expenses. The 10 Years or Life of Fund calculation is based on life of the fund. You cannot invest directly in an Index.
The performance data presented represents past performance; future results may vary. Performance data does not reflect the deduction of taxes that would be paid on fund distributions or the redemption of fund shares. Investment return and principal value will fluctuate so that an investor’s shares, when redeemed, may be worth more or less than their original cost. Current performance may be lower or higher than performance quoted. Please see www.transamericafunds.com for performance data current to the most recent month-end. Net Asset Value (NAV) returns include the reinvestment of dividends and capital gains. Fund shares are sold without a sales load.
Performance figures may reflect fee waivers and/or expense reimbursements by the Investment Adviser. Without such waivers and/or reimbursements, the performance would be lower. Future waivers and/or reimbursements are at the discretion of the Investment Adviser.
This material must be preceded or accompanied by a current prospectus, which includes specific contents regarding the investment objectives and policies of this fund. This fund is only available in Class I shares, which are not available for direct investment by the public.
14
Transamerica JPMorgan International Bond
(unaudited)
MARKET ENVIRONMENT
Following the dramatic events of government bail-outs and the Lehman Brothers bankruptcy in September 2008, the latter part of 2008 saw central banks coordinating globally to reduce rates and inject equity into major financial institutions to prevent the financial system from seizing up. The effects of the financial crisis spread rapidly through the global economy in the first quarter of 2009, with many equity markets outside of Asia plunging to new lows for the cycle and economists significantly revising down growth estimates worldwide. However, March saw government yields and risk asset prices rise due primarily to better-than-expected economic news, concerns about supply and the willingness of investors to take on more risk. Global growth returned during the summer with cyclical countries, such as Japan, Germany, Korea and Brazil, rebounding first and more strongly than countries facing the largest imbalances, such as the U.S., U.K. and Spain. This growth also changed the prospect for global tightening and shifted the near-term focus to exit strategies from ‘unconventional’ monetary policy. Indeed, some central banks, such as the Reserve Bank of Australia, started to tighten monetary policy, with the market pricing in hikes for the major central banks in 2010.
PERFORMANCE
For the year ended October 31, 2009, Transamerica JPMorgan International Bond Class I returned 17.90%. By comparison, its benchmark, the JP Morgan Government Bond ex-U.S. unhedged Index, returned 18.79%.
STRATEGY REVIEW
Global debate forms the foundation of our investment process, with investors across the firm contributing to our regular strategy-setting sessions. In considering rates, opportunities are identified across the global rates universe, focusing on three key decisions — country allocation, yield curve positioning and overall duration. In looking at credit, fundamental research is a key element in the decision-making process, which includes an analysis of investment relationships, identifying opportunities and judging value to build risk-efficient portfolios. The currency decision is weighted in favor of fundamental economic models, incorporating technical analysis and the judgment of our strategy team.
The Transamerica JPMorgan International Bond fund increased allocations in government bonds and reduced agency exposure through the 12 months ended October 31, 2009. The Fund’s allocation in spread sectors benefited performance. While spread widening in the latter part of 2008 and financial market turmoil put pressure on these holdings, the rally in credit during 2009, improvements in the trading environment, and low government yields led to an increased appetite for risky assets.
In terms of rates, the Fund remained longer in duration over the period in line with a view that lower rates would be required for the global economy to emerge from the slump. Investments included long-duration positions in the U.K., Japan and Europe, with a U.K. five-year position benefiting performance. With the Bank of England now owning a significant part of the Gilt market, coupled with the uncertainty about the end of its quantitative easing program, the Gilt market became dislocated and the position was removed over the summer. The long European Union position also benefited performance and is based on our constructive view of the outlook for European bonds. Euro-zone macro data continues to surprise to the upside, and financial market indicators are gradually returning to more normal levels. A short U.K. versus long Canada 10-year duration position was added in the second quarter of 2009. This was based on the strong Canadian fiscal position relative to the U.K. and has benefited performance. A long Japan 10-year duration position detracted from performance and the position was closed in March.
The allocation in currency detracted over the period as the markets remained volatile. Risk was reduced in 2009 as conviction levels fell. The Fund was negatively impacted by a short Euro position in December 2008. The perceived failure of the European Central Bank to ease policy in line with other central banks in December 2008 placed pressure on the short euro positioning, causing significant underperformance.
Jon B. Jonsson
Portfolio Manager
J.P. Morgan Investment Management Inc.
15
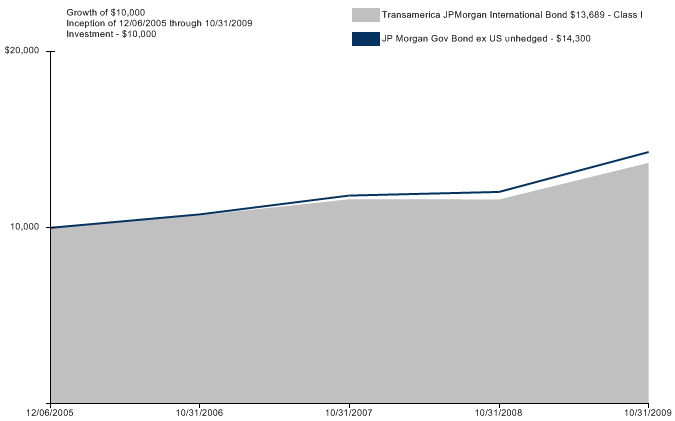
Average Annual Total Return for Periods Ended 10/31/2009
| | 1 Year | | 10 Years or
Life of Fund | | Inception Date | |
Class I (NAV) | | 17.90 | % | 8.38 | % | 12/06/2005 | |
JP Morgan Gov Bond ex US unhedged* | | 18.79 | % | 9.60 | % | 12/06/2005 | |
NOTES
* The JP Morgan Goverment Bond ex U.S. unhedged (“JP Morgan Gov Bond ex US unhedged”) Index is an unmanaged index used as a general measure of market performance. Calculations assume dividends and capital gains are reinvested and do not include any managerial expenses. The 10 Years or Life of Fund calculation is based on life of the fund. You cannot invest directly in an Index.
The performance data presented represents past performance; future results may vary. Performance data does not reflect the deduction of taxes that would be paid on fund distributions or the redemption of fund shares. Investment return and principal value will fluctuate so that an investor’s shares, when redeemed, may be worth more or less than their original cost. Current performance may be lower or higher than performance quoted. Please see www.transamericafunds.com for performance data current to the most recent month-end. Net Asset Value (NAV) returns include the reinvestment of dividends and capital gains. Fund shares are sold without a sales load.
Performance figures may reflect fee waivers and/or expense reimbursements by the Investment Adviser. Without such waivers and/or reimbursements, the performance would be lower. Future waivers and/or reimbursements are at the discretion of the Investment Adviser.
This material must be preceded or accompanied by a current prospectus, which includes specific contents regarding the investment objectives and policies of this fund. This fund is only available in Class I shares, which are not available for direct investment by the public.
16
Transamerica JPMorgan Mid Cap Value
(unaudited)
MARKET ENVIRONMENT
Looking back, the last 12 months will certainly be remembered as one of the most volatile periods in U.S. equity market history. The deterioration in equity markets began to accelerate in October 2008, as the effects of the Lehman Brothers bankruptcy instilled fear and panic in investors. The onslaught of continuously poor economic data continued well into 2009, as the U.S. economy experienced a surge in unemployment claims, wave of announcements on corporate layoffs and extremely low level of consumer confidence. In response, a barrage of governmental policy announcements and Federal Reserve (“Fed”) actions were put in place to restore confidence in the financial system. Equity markets remained volatile and hit fresh lows in early March 2009.
U.S. equity markets rebounded strongly from their March 2009 lows, as investors began to realize that the banking system was not insolvent and economic activity was not in a terminal freefall. The credit markets improved dramatically, while inter-bank lending rates rose to levels seen prior to the bankruptcy of investment bank Lehman Brothers. Also supportive of the markets were comments from the Fed making it quite clear that interest rates will be kept at very low levels for an extended period.
Economic releases throughout the 12 months surprised mostly to the upside. On the housing front, prices appeared to be stabilizing as the Standard and Poor’s/Case-Schiller Home Price Index of 20 Cities posted an increase in August. This was the seventh-consecutive month of improving data. Based on the latest report, average home prices are where they were in the fall of 2003. Non-farm business productivity also increased for the second quarter. The productivity gain was the largest since the third quarter of 2003. Increased productivity is a key ingredient of the sustainability of corporate profits.
One of the main drivers of the market’s advance was that corporate earnings continued to exceed expectations. Through the end of October, 80% of companies reporting had earnings that beat consensus estimates. While it was much publicized that most of the better-than-expected profit results came mostly from aggressive cost-cutting efforts, thus far, 58% of the reporting companies exceeded revenue estimates. Technology companies were the top performers as 80% of such companies have posted better-than-expected revenues, while 80% of utility companies reporting thus far disappointed.
PERFORMANCE
For the year ended October 31, 2009, Transamerica JPMorgan Mid Cap Value Class I returned 13.39%. By comparison, its benchmark, the Russell Midcap® Value Index (“Russell Midcap® Value”), returned 14.52%.
STRATEGY REVIEW
The Transamerica JPMorgan Mid Cap Value portfolio underperformed its benchmark, the Russell Midcap® Value, for the year ended October 31, 2009, due mostly to stock selection and sector allocation to the energy and consumer staple sectors. Stock selection in the utility sector and the portfolio’s underweight in the financial sector contributed to performance.
AutoNation Inc., an auto retailer operating predominantly in the U.S. Sunbelt region was a top contributor. Despite significantly lower vehicle sales, the company was able to maintain profitability through reduced expenses, effective inventory management and increased contributions from its parts and service segment. While the company has significant exposure to the Big 3 U.S. auto manufacturers, such exposure has been drastically reduced over the past few years as the company’s import and luxury segment now accounts for over two-thirds of unit sales. One benefit of the decline in vehicle sales was a decrease in working capital requirements, which allowed the company to reallocate cash to pay down debt. We positively view management’s decision to slow its share repurchases and reallocate free cash flow to pay down debt.
Another top contributor to results was Energen Corporation, an energy holding company engaged in exploration and production of oil, natural gas and natural gas liquids in the United States. The company also distributes natural gas, serving as a utility to over 450,000 customers in northern and central Alabama. The company’s shares were strong throughout the period on the back of increased production and higher commodity prices due to higher demand for natural gas. What we find most attractive is that its gas utility component provides a source of consistent free flow while the exploration and production segment presents opportunities for growth. Additionally, the company hedges a significant amount of its production, isolating earnings from the volatility of energy prices, a trait we have always found favorable.
Synovus Financial Corporation was a top detractor from results. The company provides commercial and retail banking, as well as investment services, to customers in Georgia, Alabama, South Carolina, Florida and Tennessee. Shares were under pressure as the company continued to experience losses in its loan portfolio. Management was very aggressive in setting aside loss provisions, writing down the value of non-performing loans and executing an asset disposition strategy. To bolster its balance sheet, the company announced plans to raise capital thru a $600 million equity offering. While we believe the company has a strong deposit franchise and recognize management’s efforts in addressing problem assets, we are cautious about the name.
Helix Energy Solutions Group Inc., a provider of sub-sea construction, maintenance and salvage services for the offshore oil and natural gas industry, was also a detractor. A combination of lower energy prices, lost production following last year’s hurricane season and continuous project delays resulted in lower revenue and thus profits. After numerous earnings preannouncements, we felt best to sell the position and deploy proceeds to companies where we have more confidence in the fundamentals.
The portfolio’s strategy is based on the premise that stock selection, focused on undervalued mid-cap companies with durable franchises that are led by strong management teams, should generate consistent returns with lower levels of volatility over the long term. Our philosophy emphasizes high-quality, lower-beta stocks that typically have a high return on equity and a price/earnings ratio slightly below or equal to a typical constituent within our benchmark. We set out to accomplish this goal by investing in businesses with relatively lower levels of cyclicality that maximize the probability of consistent earnings and free cash flow generation.
We have maintained our focus throughout the period by continuing to invest in undervalued mid-cap companies with durable franchises and strong management. These characteristics are often sought after as high-quality companies tend to hold their value and attract greater capital flows when markets turn more volatile. Despite different investment styles/themes coming in and going out of favor, we have not wavered in what is important to us and continue to implement the same disciplined investment process.
Jonathan K.L. Simon
Lawrence Playford, CPA, CFA
Gloria Fu, CFA
Co-Portfolio Managers
J.P. Morgan Investment Management Inc.
17
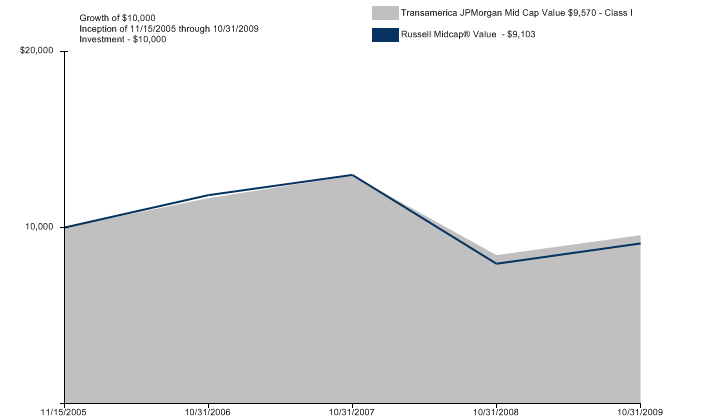
Average Annual Total Return for Periods Ended 10/31/2009
| | 1 Year | | 10 Years or
Life of Fund | | Inception Date | |
Class I (NAV) | | 13.39 | % | (1.10 | )% | 11/15/2005 | |
Russell Midcap® Value * | | 14.52 | % | (2.35 | )% | 11/15/2005 | |
NOTES
* The Russell Midcap® Value (“Russell Midcap® Value”) Index is an unmanaged index used as a general measure of market performance. Calculations assume dividends and capital gains are reinvested and do not include any managerial expenses. The 10 Years or Life of Fund calculation is based on life of the fund. You cannot invest directly in an Index.
The performance data presented represents past performance; future results may vary. Performance data does not reflect the deduction of taxes that would be paid on fund distributions or the redemption of fund shares. Investment return and principal value will fluctuate so that an investor’s shares, when redeemed, may be worth more or less than their original cost. Current performance may be lower or higher than performance quoted. Please see www.transamericafunds.com for performance data current to the most recent month-end. Net Asset Value (NAV) returns include the reinvestment of dividends and capital gains. Fund shares are sold without a sales load.
Performance figures may reflect fee waivers and/or expense reimbursements by the Investment Adviser. Without such waivers and/or reimbursements, the performance would be lower. Future waivers and/or reimbursements are at the discretion of the Investment Adviser.
This material must be preceded or accompanied by a current prospectus, which includes specific contents regarding the investment objectives and policies of this fund. This fund is only available in Class I shares, which are not available for direct investment by the public.
18
Transamerica Loomis Sayles Bond
(unaudited)
MARKET ENVIRONMENT
The period was characterized by extraordinary levels of volatility and unprecedented governmental intervention. Credit spreads widened dramatically during fourth quarter of the year 2008 as a flight-to-quality favored U.S. Treasuries over spread products, including corporate bonds. December provided a measure of relief as effects of government intervention began to trickle into the markets. The crisis of confidence that drained corporate markets of liquidity in third quarter of the year 2008 defined investor behavior for much of the fourth quarter, exacerbating weak fundamentals as the credit crisis accelerated amid consumer and business retrenchment. January saw liquidity begin to flow back into corporate markets and spread sectors benefited from the tentative reappearance of investor risk appetites. The markets took a hairpin turn mid-first quarter as signs that a deepening recession continued to weigh heavily on consumer and business confidence. Investors remained skittish throughout February as speculation surrounding bank stress tests, potential nationalization and a general lack of clarity regarding the Federal government’s economic intentions stoked market instability.
Signs of stability in the economy that emerged at the end of first quarter of the year 2009 continued to materialize in the second quarter and paved the way for resurgence in risk appetite that would continue through third quarter of the year 2009. Prospects for recovery improved as weak but stabilizing manufacturing, housing and unemployment data provided encouraging hints that aggressive policy initiatives may have stabilized business activity. Bank stress tests further reinforced the recovery picture. Corporate new issuance surged, initially led by high-quality credits, but quickly spread to the high yield segment, as the rush of capital into riskier assets improved market liquidity.
Despite promising evidence that the recession is ending, worrisome headwinds remain. Consumers are reluctant to spend while bank lending remains tight. However, technicals remain fairly strong for investment grade and high yield credit. Demand continues to flourish and new issuance is expected to dissipate. Furthermore, despite persistent negative headlines, we are beginning to see a few positive macroeconomic indicators hinting at potential recovery.
PEFORMANCE
For the year ended October 31, 2009, Transamerica Loomis Sayles Bond Class I returned 46.27%. By comparison, its benchmark, the Barclays Capital U.S. Government Credit/Bond Index, returned 14.60%.
STRATEGY REVIEW
The Fund, benefitting from a significant reversal of the flight-to-quality of 2008, has experienced strong performance so far in 2009. Our relative overweights to investment grade and high yield credit contributed strongly to relative performance as credit spreads narrowed substantially. Non-U.S. dollar-denominated investments also boosted performance as an increase in industrial materials’ prices benefited the currency of commodity-rich countries, namely Indonesia, Australia, New Zealand, Brazil and Canada. Our underweights to U.S. Treasuries and Agencies also contributed positively to performance as rates have drifted higher.
The confluence of renewed risk appetite, improved economic outlook and the return of market liquidity fueled a high-velocity rally in credit markets. High yield received a major boost from returning risk appetites. Lower quality, distressed issuers led performance. Improving fundamentals and technicals provided a backdrop for a rebound in consumer-related, communications and automotive credits. Ford Motor Company reaped gains wrought from the “Cash for Clunkers” program while Level 3 Communications buoyed returns as investors dug for yield.
Expanding “green shoots” ignited a broad-base rally in industrial corporates led by cyclical, lower quality BBB-rated credit in the investment grade spectrum. The end of the period saw impressive performance from sectors that had been hard hit in previous quarters, notably retailers and technology. Dillards, Lucent, Macys and Toys R Us all posted healthy gains resulting from this rally.
The inclusion of Commercial Mortgage Backed Securities (“CMBS”) in the Term Asset-Backed Securities Loan Facility (“TALF”) program supported the sector’s performance while Asset-Backed Securities (“ABS”) had a positive run, notably in the credit card space as major banks such as Bank of America and CIT shored up their trusts. Allocation to convertible bonds performed well as convertible securities gained increased attention from issuers as a funding vehicle.
We maintain our overweight to corporate bonds relative to U.S. Treasuries, as the sector may offer some of the best values relative to risk, taking advantage of new issuance and expected volatility to build positions. We expect to maintain our high yield exposure while leaving room for fallen angels from investment grade. We believe structured finance positions will continue to benefit from government efforts to promote lending. Our foreign currency stakes remain focused on commodity-rich countries that may perform well when global growth resumes. As long-term investors, we believe that attractive prices and yields present opportunities for prudent security selection and a well-diversified portfolio.
Kathleen C. Gaffney, CFA
Daniel J. Fuss, CFA, CIC
Elaine M. Stokes
Mathew J. Eagan, CFA
Co-Portfolio Managers
Loomis, Sayles & Company, L.P.
19
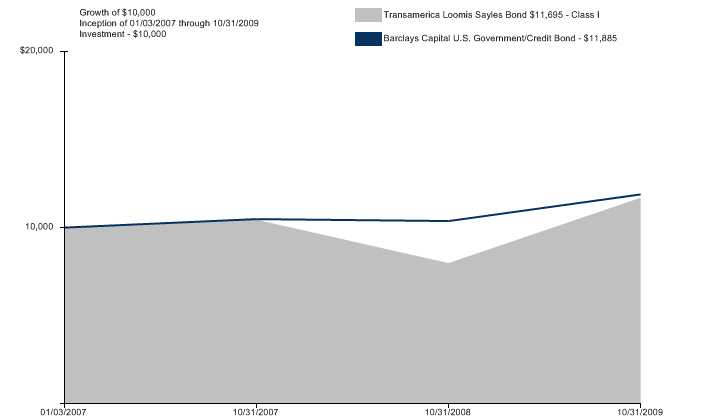
Average Annual Total Return for Periods Ended 10/31/2009
| | 1 Year | | 10 Years or
Life of Fund | | Inception Date | |
Class I (NAV) | | 46.27 | % | 5.70 | % | 01/03/2007 | |
Barclays Capital U.S. Government/Credit Bond* | | 14.60 | % | 6.30 | % | 01/03/2007 | |
NOTES
* The Barclays Capital U.S. Government/Credit Bond (“Barclays Capital U.S. Government/Credit Bond”) Index is an unmanaged index used as a general measure of market performance. Calculations assume dividends and capital gains are reinvested and do not include any managerial expenses. The 10 Years or Life of Fund calculation is based on life of the fund. You cannot invest directly in an Index.
The performance data presented represents past performance; future results may vary. Performance data does not reflect the deduction of taxes that would be paid on fund distributions or the redemption of fund shares. Investment return and principal value will fluctuate so that an investor’s shares, when redeemed, may be worth more or less than their original cost. Current performance may be lower or higher than performance quoted. Please see www.transamericafunds.com for performance data current to the most recent month-end. Net Asset Value (NAV) returns include the reinvestment of dividends and capital gains. Fund shares are sold without a sales load.
Performance figures may reflect fee waivers and/or expense reimbursements by the Investment Adviser. Without such waivers and/or reimbursements, the performance would be lower. Future waivers and/or reimbursements are at the discretion of the Investment Adviser.
International investing involves special risks including currency fluctuations, political instability, and different financial accounting standards. This material must be preceded or accompanied by a current prospectus, which includes specific contents regarding the investment objectives and policies of this fund. This fund is only available in Class I shares, which are not available for direct investment by the public.
20
Transamerica Neuberger Berman International
(unaudited)
MARKET ENVIRONMENT
International markets, as measured by the Morgan Stanley Capital International-Europe, Australasia, and Far East Index (“MSCI-EAFE”), bounced back from a poor start to the period and posted positive returns for the year ended October 31, 2009. Materials, Industrials, and Financials were the best performing sectors. Utilities and Healthcare were the weakest performers, although both sectors still had positive returns. For the year, the MSCI-EAFE outperformed the Standard and Poor’s 500 Composite Stock Index, with the Morgan Stanley Capital International Emerging Markets Index substantially outperforming both developed market indices.
PERFORMANCE
For the year ended October 31, 2009, Transamerica Neuberger Berman International Class I returned 30.83%. By comparison, its benchmark, the MSCI-EAFE, returned 28.41%.
STRATEGY REVIEW
During the year, the Portfolio Managers remained focused on their QUARP (quality at a reasonable price) discipline of investing in high quality, financially strong companies with good organic growth opportunities.
Overall, portfolio holdings in Canada, the United Kingdom, Norway, and China positively impacted relative performance while Australia, Sweden, Hong Kong, and Spain negatively impacted relative performance. From a sector perspective, Energy, Consumer Discretionary, Utilities and Consumer Staples holdings positively impacted relative performance, while Financials, Healthcare and Materials detracted from relative performance.
Among the holdings that had the greatest impact on performance was DNB Nor, a Norwegian bank. The stock underperformed in 2008 as the Norwegian economy is highly leveraged to the shipping and energy industries. We continued to hold the stock as we thought its energy exposure was manageable and its shipping business would prove more defensive. As the Nordic economy proved relatively resilient in 2009, DNB Nor reported strong results. Addax Petroleum, a Canadian listed West African/Middle East exploration and production energy company, also positively impacted performance; the company was acquired by Chinese oil company Sinopec. Ultrapar, a fuel and gas distributor, performed well as the Brazilian economy began to show signs of a recovery. Automotive parts and equipment manufacturer Hyundai Mobis also positively contributed to performance. The company announced strong results following improving sales for Hyundai Motor and Kia (Hyundai Motor and Kia were beneficiaries of “cash for clunkers” program).
Swiss Reinsurance was one of the largest detractors from portfolio performance. The insurance company which manages the excess risk of primary insurers, particularly for natural catastrophes (e.g., storms, earthquakes) and man made catastrophes (e.g., airplane crashes, terrorist attacks), announced losses on its securitized product portfolio; while we had expected losses, the announced loss was more significant than we anticipated, causing us to lose confidence in the outlook for the business; we have eliminated the position from the portfolio. Wacker Chemie, a German chemical company, underperformed; while its solar business remains strong, the more cyclical, chemical side of business detracted from results; we have also eliminated the position from the portfolio. Gerresheimer, a manufacturer of specialty plastic and glass packaging for the pharmaceutical industry, declined on the back of industry destocking concerns, we continue to hold the stock in the portfolio. Laird, manufacturer of EMI (electro magnetic interference) shielding and antennas, negatively impacted performance as the company was facing significant pricing pressure; we have eliminated the stock from the portfolio. Finally, credit insurance company Euler Hermes underperformed; it has been eliminated from the portfolio.
Benjamin Segal, CFA
Portfolio Manager
Neuberger Berman Management, LLC
21
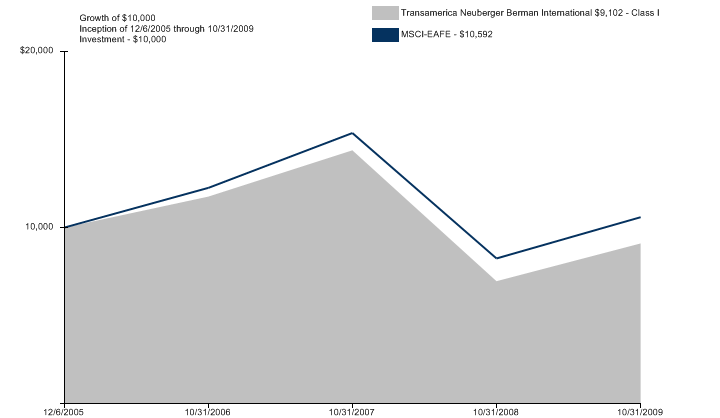
Average Annual Total Return for Periods Ended 10/31/2009
| | 1 Year | | 10 Years or
Life of Fund | | Inception Date | |
Class I (NAV) | | 30.83 | % | (2.38 | )% | 12/06/2005 | |
MSCI-EAFE* | | 28.41 | % | 1.48 | % | 12/06/2005 | |
NOTES
* The Morgan Stanley Capital International-Europe, Australasia, and Far East (“MSCI-EAFE”) Index is an unmanaged index used as a general measure of market performance. Calculations assume dividends and capital gains are reinvested and do not include any managerial expenses. The 10 Years or Life of Fund calculation is based on life of the fund. You cannot invest directly in an Index.
The performance data presented represents past performance; future results may vary. Performance data does not reflect the deduction of taxes that would be paid on fund distributions or the redemption of fund shares. Investment return and principal value will fluctuate so that an investor’s shares, when redeemed, may be worth more or less than their original cost. Current performance may be lower or higher than performance quoted. Please see www.transamericafunds.com for performance data current to the most recent month-end. Net Asset Value (NAV) returns include the reinvestment of dividends and capital gains. Fund shares are sold without a sales load.
Performance figures may reflect fee waivers and/or expense reimbursements by the Investment Adviser. Without such waivers and/or reimbursements, the performance would be lower. Future waivers and/or reimbursements are at the discretion of the Investment Adviser.
International investing involves special risks including currency fluctuations, political instability, and different financial accounting standards. This material must be preceded or accompanied by a current prospectus, which includes specific contents regarding the investment objectives and policies of this fund. This fund is only available in Class I shares, which are not available for direct investment by the public.
22
Transamerica Oppenheimer Developing Markets
(unaudited)
MARKET ENVIRONMENT
The period began in the midst of an unprecedented freefall in world economic activity, which extended through early March 2009. This economic freefall was met with determined and uniform resistance by governments around the world, who deployed massive fiscal and monetary power to prevent the deflation typically associated with synchronous deleveraging. From March through the end of the reporting period, we have witnessed a renewed enthusiasm in worldwide equity markets, though a healthy degree of suspicion continues to lurk. Equity markets — particularly those in the developing world — have bounced back sharply. We attribute the upward move to relatively attractive prices, growing optimism about a recovery in global output and a backdrop of exceptionally low interest rates.
PERFORMANCE
For the year ended October 31, 2009, Transamerica Oppenheimer Developing Markets Class I returned 56.01%. By comparison, its benchmark, the Morgan Stanley Capital International Emerging Markets Index (“MSCI-EMI”), returned 64.63%.
STRATEGY REVIEW
Transamerica Oppenheimer Developing Markets underperformed its benchmark, the MSCI-EMI for the annual reporting period. On an absolute basis, nearly all of the Fund’s geographies and sectors rose over the period. On a country basis, Russia was the strongest relative performer for the Fund. Strong relative stock selection within Brazil contributed positively to performance. Despite benefiting from an overweight position in India, the Fund underperformed within this country sector as a result of weaker relative stock selection. Relative to the benchmark, underweight positions in Israel and Poland, as well as an overweight position within Indonesia, benefited the Fund. In terms of detractors to relative performance, China was the weakest performer for the Fund. Turkey and Mexico also detracted from performance during the reporting period, due to weaker relative stock selection and an overweight position to both country sectors.
The Fund realized absolute gains across sectors, with consumer staples, financials, and information technology leading the pack. On a sector basis, the greatest relative contributor to Fund performance during the reporting period was consumer staples, due to better relative stock selection versus the Index. Positive contributors within this sector included Russian food retailer Magnit and Natura Cosmeticos SA, a Brazil-based company engaged in the manufacturing, distribution and commercialization of cosmetic products.
Our most significant detractor during the reporting period, on a sector basis, was financials, primarily due to weaker relative stock selection. Within the sector, overweight positions to HSBC Holdings plc and Grupo Financiero Banorte S.A.B. de C.V. hurt relative performance. The Fund’s underweight position to the life and health insurance subsector of financials, which performed well for the Index during the reporting period, also detracted from performance.
Despite ever-shifting markets, our approach to investing in developing markets remains consistent. While prices change, our investment philosophy does not. We are long-term investors in structural growth companies with durable competitive advantage and we are only interested in these sorts of companies when prices on offer are attractive. This approach lends itself to exclusion of significant swathes of market capitalization. We strive to be investors in terrific companies, not geographies. We want to be participants in franchises with long-tailed growth options and great economics.
Justin Leverenz, CFA
Portfolio Manager
OppenheimerFunds, Inc.
23
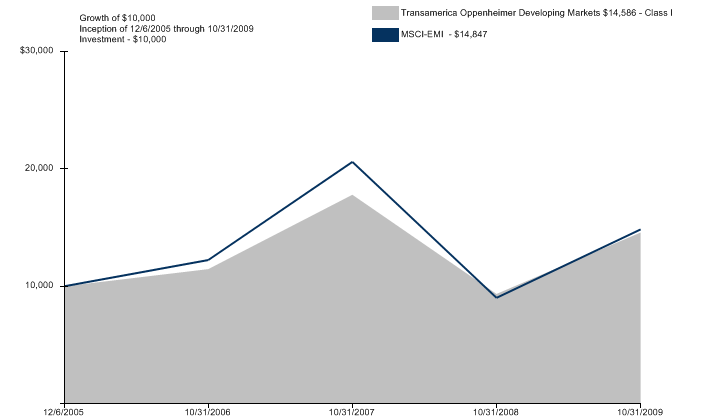
Average Annual Total Return for Periods Ended 10/31/2009
| | 1 Year | | 10 Years or
Life of Fund | | Inception Date | |
Class I (NAV) | | 56.01 | % | 10.15 | % | 12/06/2005 | |
MSCI-EMI * | | 64.63 | % | 10.65 | % | 12/06/2005 | |
NOTES
* The Morgan Stanley Capital International Emerging Markets (“MSCI-EMI”) Index is an unmanaged index used as a general measure of market performance. Calculations assume dividends and capital gains are reinvested and do not include any managerial expenses. The 10 Years or Life of Fund calculation is based on life of the fund. You cannot invest directly in an Index.
The performance data presented represents past performance; future results may vary. Performance data does not reflect the deduction of taxes that would be paid on fund distributions or the redemption of fund shares. Investment return and principal value will fluctuate so that an investor’s shares,when redeemed, may be worth more or less than their original cost. Current performance may be lower or higher than performance quoted. Please see www.transamericafunds.com for performance data current to the most recent month-end. Net Asset Value (NAV) returns include the reinvestment of dividends and capital gains. Fund shares are sold without a sales load.
Performance figures may reflect fee waivers and/or expense reimbursements by the Investment Adviser. Without such waivers and/or reimbursements, the performance would be lower. Future waivers and/or reimbursements are at the discretion of the Investment Adviser.
International investing involves special risks including currency fluctuations, political instability, and different financial accounting standards. This material must be preceded or accompanied by a current prospectus, which includes specific contents regarding the investment objectives and policies of this fund. This fund is only available in Class I shares, which are not available for direct investment by the public.
24
Transamerica Oppenheimer Small- & Mid-Cap Value
(unaudited)
MARKET ENVIRONMENT
The global recession which defined 2008 continued in the first half of 2009, as unemployment rates climbed, housing prices slumped and consumer confidence remained depressed. The economic downturn had been intensified by a global banking crisis that led to the failures of major financial institutions and nearly frozen conditions in some credit markets. Pronounced signs of economic weakness persisted through the first half of 2009. After declining in the fourth quarter of 2008, GDP continued to decline in the first and second quarters of 2009, falling by 6.4% and 0.7% respectively. Yet, investor sentiment soon began to improve when massive remedial efforts by U.S. government and monetary authorities thawed global credit markets. Investors capitalized on historically low valuations among stocks and higher yielding bonds, sparking impressive springtime rallies over the second quarter of the year. Nevertheless, some indicators, such as unemployment figures, housing prices, and consumer confidence continued to be troubling. Despite the strong equity market gains in the second half of the reporting period, wariness persisted about the economic landscape for 2010.
PERFORMANCE
For the year ended October 31, 2009, Transamerica Oppenheimer Small- & Mid-Cap Value Class I returned 22.99%. By comparison, its benchmark, the Russell 2500® Value Index (“Russell 2500® Value”), returned 8.55%.
STRATEGY REVIEW
Transamerica Oppenheimer Small- & Mid-Cap Value outperformed its benchmark, the Russell 2500® Value, for the annual reporting period ended October 31, 2009. We attribute the Fund’s outperformance primarily to strong stock selection within the industrials, financials, consumer discretionary, information technology, utilities and materials sectors. The Fund’s allocation strategy within financials also benefited relative performance.
Within industrials, the Fund outperformed the Index as a result of strong relative stock selection. An underweight to airline securities also contributed to relative performance, as they did not perform well within the Index during the reporting period.
The Fund maintained a significant underweight position in financials, which benefited performance during the reporting period.
Within consumer discretionary, the Fund received strong relative results from clothing and jewelry retailer Chico’s FAS, Inc., and regional gaming and hospitality company, Pinnacle Entertainment, Inc.
The Fund underperformed the Index within the healthcare sector, where weaker relative stock selection hurt relative performance, particularly within the healthcare providers and services subsector. Individual detractors to performance within this subsector included DaVita, Inc. and Health Net, Inc., the latter of which we exited.
The Oppenheimer Value Team builds portfolios using a disciplined, bottom-up stock selection process rooted in analysis of a company’s long-term earnings power, which our analysis has shown is the primary driver of a company’s performance prospects. We believe that focusing on valuations relative to long-term earnings power, rather than large sector or macroeconomic bets is a more sustainable strategy than attempting to predict which sectors are most likely to outperform. Our stock and sector allocations reflect this philosophy.
John Damian
Portfolio Manager
OppenheimerFunds, Inc.
25
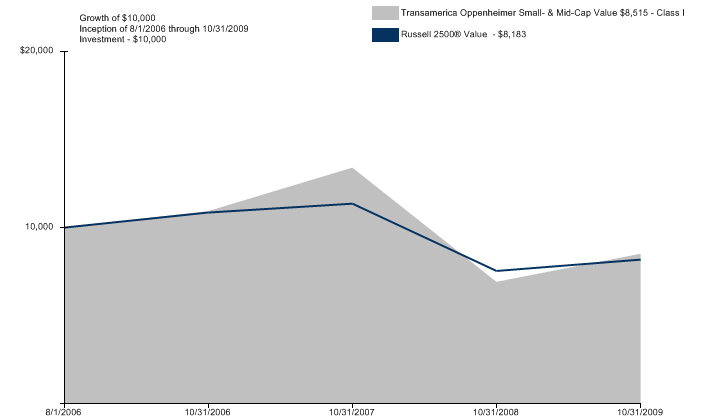
Average Annual Total Return for Periods Ended 10/31/2009
| | 1 Year | | 10 Years or
Life of Fund | | Inception Date | |
Class I (NAV) | | 22.99 | % | (4.82 | )% | 08/01/2006 | |
Russell 2500® Value * | | 8.55 | % | (5.98 | )% | 08/01/2006 | |
NOTES
* The Russell 2500® Value (“Russell 2500® Value”) Index is an unmanaged index used as a general measure of market performance. Calculations assume dividends and capital gains are reinvested and do not include any managerial expenses. The 10 Years or Life of Fund calculation is based on life of the fund. You cannot invest directly in an Index.
The performance data presented represents past performance; future results may vary. Performance data does not reflect the deduction of taxes that would be paid on fund distributions or the redemption of fund shares. Investment return and principal value will fluctuate so that an investor’s shares, when redeemed, may be worth more or less than their original cost. Current performance may be lower or higher than performance quoted. Please see www.transamericafunds.com for performance data current to the most recent month-end. Net Asset Value (NAV) returns include the reinvestment of dividends and capital gains. Fund shares are sold without a sales load.
Performance figures may reflect fee waivers and/or expense reimbursements by the Investment Adviser. Without such waivers and/or reimbursements, the performance would be lower. Future waivers and/or reimbursements are at the discretion of the Investment Adviser.
Investing in small cap stocks generally involves greater risk and volatility, therefore an investment in the fund may not be appropriate for everyone. This material must be preceded or accompanied by a current prospectus, which includes specific contents regarding the investment objectives and policies of this Fund. The Fund is only available in Class I shares, which are not available for direct investment by the public.
26
Transamerica Schroders International Small Cap
(unaudited)
MARKET ENVIRONMENT
The fiscal year ended October 31, 2009 has been one of widely contrasting market conditions. The initial months were dominated by investor nervousness over the ramifications of the global financial crisis as the global economy started to contract and policy makers struggled to provide sufficient monetary and fiscal stimulus. The cutting of interest rates to historically low levels, quantitative easing and a range of fiscal packages has proved very effective in restoring confidence to the markets and in stabilizing economic activity, aided by an end to the inventory reductions seen in the fourth quarter of 2008 and first quarter of 2009 and by a recovery in emerging economies.
For the period as a whole, international smallcap equities have staged a dramatic recovery with a rise of 43.1% in dollar terms. This represents a sharp recovery versus larger cap stocks which, as measured by the Morgan Stanley Capital International-Europe, Australasia, and Far East Index (“MSCI-EAFE”), rose 27.7%. Within smallcap, the outstanding region in terms of performance was Pacific ex-Japan. In sector terms, the key outperformers have been more cyclical areas such as energy, materials and information technology, while consumer staples and utilities have lagged.
PERFORMANCE
For the year ended October 31, 2009, Transamerica Schroders International Small Cap Class I returned 43.56%. By comparison, its benchmark, the Standard & Poor’s Euro Pacific SmallCap (“S&P EPAC SmallCap”) Index, returned 43.10%.
STRATEGY REVIEW
Our focus has remained upon identifying undervalued smaller companies which offer superior growth, are well managed and can sustain above average returns. This philosophy has yielded good relative returns over the period, with stock selection the main contributor to excess returns. The biggest regional contributor to stock selection value-added has been Japan, where many of our more cyclical growth stocks in consumer discretionary and industrial sectors have performed well.
Stock selection has also contributed in the United Kingdom and in continental Europe. In the Pacific ex Japan markets, it has been more of a struggle to keep up with the dramatic rises in the benchmarks particularly in Singapore and Australia, but we have been overweight the region and this has also been a significant factor in the strong relative performance enjoyed by the Fund over the fiscal year.
Over the year, we made some modest adjustments to the regional allocation in the Fund. While retaining an overweight stance in the smaller Asian markets, we took profits in the second half of the year as a number of stocks reached our assessment of fair value. The proceeds from these sales were deployed mainly in Japan where we wished to retain our exposure to cyclical growth stocks while adding exposure to more defensive stocks which had begun to offer long-term value following a period of poor performance. However, we remain modestly underweight Japan as the structural constraints to growth remain formidable.
The Fund has maintained a cautious stance in the United Kingdom reflecting our continued concerns over the headwinds to domestic demand presented by high consumer indebtedness, a growing fiscal deficit and rising unemployment. To a lesser extent, some of these issues also confront areas of continental Europe and we remain underweight in sectors such as financials and consumer cyclicals both in the United Kingdom and in continental Europe. We see better opportunities in the energy, information technology and industrial sectors.
Matthew Dobbs
Portfolio Manager
Schroder Investment Management North America Inc.
27
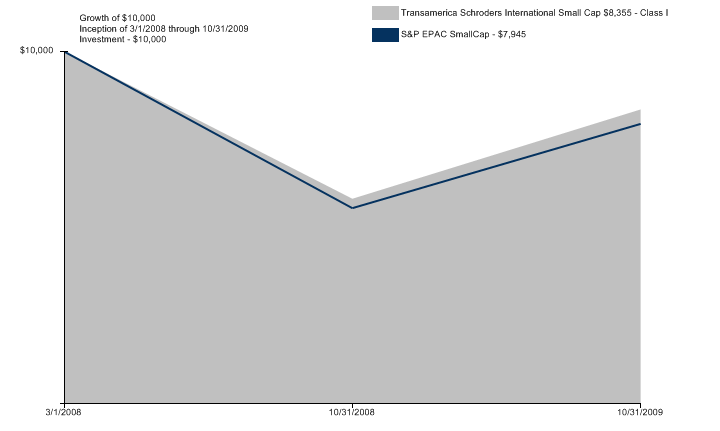
Average Annual Total Return for Periods Ended 10/31/2009
| | 1 Year | | 10 Years or
Life of Fund | | Inception Date | |
Class I (NAV) | | 43.56 | % | (10.20 | )% | 03/01/2008 | |
S&P EPAC SmallCap* | | 43.10 | % | (12.86 | )% | 03/01/2008 | |
NOTES
* The Standard & Poor’s Euro Pacific SmallCap (“S&P EPAC SmallCap”) Index is an unmanaged index used as a general measure of market performance. Calculations assume dividends and capital gains are reinvested and do not include any managerial expenses. The 10 Years or Life of Fund calculation is based on life of the fund. You cannot invest directly in an Index.
The performance data presented represents past performance; future results may vary. Performance data does not reflect the deduction of taxes that would be paid on fund distributions or the redemption of fund shares. Investment return and principal value will fluctuate so that an investor’s shares, when redeemed, may be worth more or less than their original cost. Current performance may be lower or higher than performance quoted. Please see www.transamericafunds.com for performance data current to the most recent month-end. Net Asset Value (NAV) returns include the reinvestment of dividends and capital gains. Fund shares are sold without a sales load.
Performance figures may reflect fee waivers and/or expense reimbursements by the Investment Adviser. Without such waivers and/or reimbursements, the performance would be lower. Future waivers and/or reimbursements are at the discretion of the Investment Adviser.
International investing involves special risks including currency fluctuations, political instability, and different financial accounting standards. This material must be preceded or accompanied by a current prospectus, which includes specific contents regarding the investment objectives and policies of this fund. This fund is only available in Class I shares, which are not available for direct investment by the public.
28
Transamerica Third Avenue Value
(unaudited)
MARKET ENVIRONMENT
After a very challenging 2008, global markets rebounded strongly in 2009 on improved investor sentiment and optimism about a much awaited economic recovery. The Fund posted positive absolute performance during the fiscal year, driven by rebounds in share prices across a wide range of geographies, industries, and companies, as the market slowly began to attribute much deserved credit to those companies with higher earnings and staying power. Our rigorous attention to creditworthiness and balance sheet strength enabled us to largely avoid permanent impairment during the downturn, and enjoy meaningful appreciation as the market rebounded.
PERFORMANCE
For the year ended October 31, 2009, Transamerica Third Avenue Value Class I returned 8.92%. By comparison, its benchmark, the Russell 3000® Value Index, returned 4.56%.
STRATEGY REVIEW
While the market environment in Fiscal 2009 was quite volatile, we continued to manage the portfolio using our “safe and cheap” investment philosophy. At Third Avenue, we invest in well-capitalized companies, with competent management teams and strong long-term growth prospects. We seek to limit potential investment risk by purchasing the securities of such sound companies at a significant discount to our conservative estimate of net asset value. As such, we believe the Fund remains well positioned for the long run regardless of the macro environment.
In terms of absolute performance, the Fund benefited from strong appreciation in its Hong Kong real estate related holdings, including Henderson Land Development, Cheung Kong Holdings and Wharf. These blue chip companies, which have a significant presence in mainland China, are very well capitalized and continue to operate profitably due to high occupancy rates and rising rental income. We believe they are well positioned to reap further benefits from the attractive growth dynamics in the region, which should help their net asset values grow by double digits compounded over the longer term.
Korean steel maker POSCO was also a top contributor during the trailing 12 month period. The company has remained profitable and free cash flow generative, even in an environment where most steel companies, globally, have continued to lose money, and in some cases have been forced to raise equity.
Investment holdings that detracted from performance included MBIA, St. Joe and Legg Mason, which were negatively impacted by the challenging environment for U.S. real estate and financials. Note that MBIA and Legg Mason are no longer held in the Fund.
Sector wise and geographically, Hong Kong-based real estate related holdings and a Korean materials company had the most positive impact on the Fund’s performance while cash and certain U.S.-based financials had the greatest negative impact.
Yang Lie
Curtis R. Jensen
Kathleen K. Crawford
Co-Portfolio Managers
Third Avenue Management LLC
29
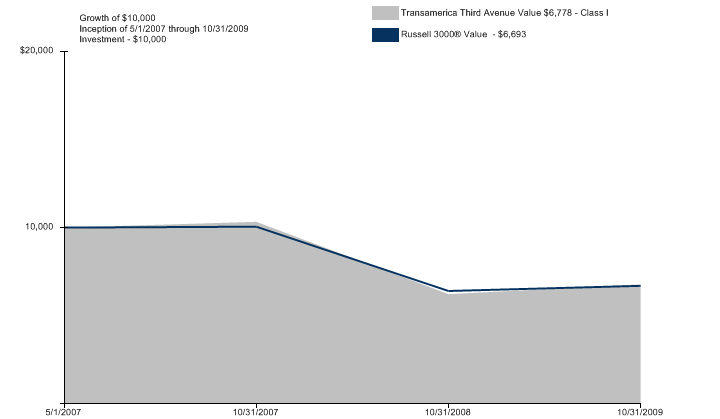
Average Annual Total Return for Periods Ended 10/31/2009
| | 1 Year | | 10 Years or
Life of Fund | | Inception Date | |
Class I (NAV) | | 8.92 | % | (14.39 | )% | 05/01/2007 | |
Russell 3000® Value * | | 4.56 | % | (14.81 | )% | 05/01/2007 | |
NOTES
* The Russell 3000® Value (“Russell 3000® Value”) Index is an unmanaged index used as a general measure of market performance. Calculations assume dividends and capital gains are reinvested and do not include any managerial expenses. The 10 Years or Life of Fund calculation is based on life of the fund. You cannot invest directly in an Index.
The performance data presented represents past performance; future results may vary. Performance data does not reflect the deduction of taxes that would be paid on fund distributions or the redemption of fund shares. Investment return and principal value will fluctuate so that an investor’s shares, when redeemed, may be worth more or less than their original cost. Current performance may be lower or higher than performance quoted. Please see www.transamericafunds.com for performance data current to the most recent month-end. Net Asset Value (NAV) returns include the reinvestment of dividends and capital gains. Fund shares are sold without a sales load.
Performance figures may reflect fee waivers and/or expense reimbursements by the Investment Adviser. Without such waivers and/or reimbursements, the performance would be lower. Future waivers and/or reimbursements are at the discretion of the Investment Adviser.
International investing involves special risks including currency fluctuations, political instability, and different financial accounting standards. This material must be preceded or accompanied by a current prospectus, which includes specific contents regarding the investment objectives and policies of this fund. This fund is only available in Class I shares, which are not available for direct investment by the public.
30
Transamerica Thornburg International Value
(unaudited)
MARKET ENVIRONMENT
What a year it has been. Real fear of an economic and market collapse was pervasive among investors in late 2008 and early 2009. With the failure of many long established financial institutions like AIG as well as once premier industrial enterprises such as GM, those fears were well justified. We will never know with any certainty, but it might be that government and monetary initiatives were executed in the nick of time. Nonetheless, early on equities sold off indiscriminately, led by financials. Cyclical areas such as steels, chemicals, consumer discretionary, and retailers were also particularly hard-hit. Loosely coordinated efforts by a variety of governments, including massive infrastructure spending by the Chinese, provided enough encouragement to investors to set off the biggest stock market rally since 1937. Not surprisingly, many of the strongest rebounds were seen in areas that had been hit the hardest early in the period. Financials led the rebound, but almost all stocks perceived as viable franchises recovered significant lost ground. In a matter of weeks, risk aversion evaporated and equity market performance flip-flopped.
PERFORMANCE
For the year ended October 31, 2009, Transamerica Thornburg International Value Class I returned 22.21%. By comparison, its benchmark, the Morgan Stanley Capital International All Country World ex US Index (“MSCI ACWI ex US”), returned 34.79%.
STRATEGY REVIEW
For the twelve months ended October 31, 2009, Transamerica Thornburg International Value underperformed the MSCI ACWI, returning 22.21%. Relative performance was strong early in the period. Later in the period, despite strong absolute performance, our portfolio didn’t participate as dramatically as the market which had been led by very strong upward momentum, particularly in the financials and cyclicals sectors.
Today, developed markets continue to struggle with the hangovers of a recession. High unemployment and depressed capacity utilization continue to plague these economies. Interestingly, a recent trip to Asia found a more upbeat outlook. Over there, rising consumerism, coupled with healthy household balance sheets, is expected to boost local consumption, thus reducing dependence on the United States. Not surprisingly, developing markets have led the rebound more than established ones. Exposure to these economies provided many of the strongest absolute gains within the portfolio — Asian stocks such as Baidu, Hong Kong Exchanges, Industrial & Commercial Bank of China and China Life Insurance were top contributors to performance. Exposure to other fast-growing markets also benefitted Fund shareholders. BM&F Bovespa is a vertically-integrated exchange platform in Brazil, facilitating transactions in stocks, equity derivatives, currencies and commodities. Two separate visits by our portfolio managers to Brazil cemented our thesis that recent initiatives should result in additional listings on the exchange and that the company has the opportunity to enjoy success in the future.
Relative strength in emerging markets manifested itself in indirect ways as well with Standard Chartered and LVMH Moet Hennessy Louis Vuitton SA (“LVMH”) as notable examples. Despite being domiciled in the United Kingdom, Standard Chartered receives over 70% of its revenues from Asia. By purchasing a bank such as Standard Chartered, we believe that we take advantage of the region’s economic growth with little exposure to the toxic assets plaguing western banks. In a similar fashion, LVMH is achieving much greater growth from its emerging market customers than its developed ones. China has surpassed Japan as purchasers of their luxury goods, from handbags to high-end cognac. Yet France-based LVMH is often valued based on its developed market characteristics.
Throughout this challenging period, we have continued to execute the same investment philosophy and process that has led to a historically strong track record. We believe that our somewhat unique approach to diversification and value provides a framework of portfolio construction that is rational in today’s unsettled times.
William V. Fries, CFA
Wendy Trevisani
Lei Wang, CFA
Co-Portfolio Managers
Thornburg Investment Management, Inc.
31
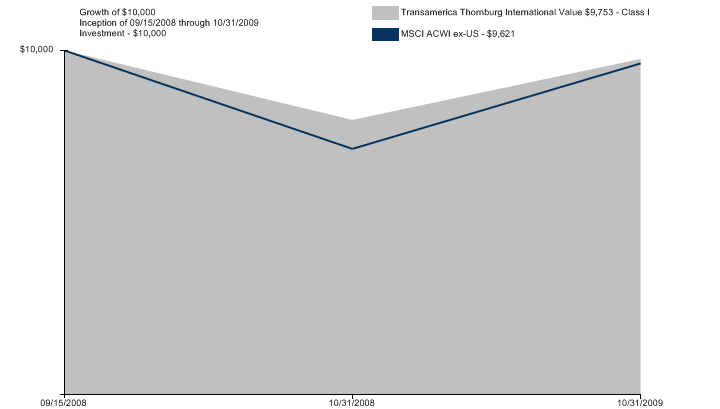
Average Annual Total Return for Periods Ended 10/31/2009
| | 1 Year | | 10 Years or
Life of Fund | | Inception Date | |
Class I (NAV) | | 22.21 | % | (2.19 | )% | 09/15/2008 | |
MSCI ACWI ex-US* | | 34.79 | % | (3.36 | )% | 09/15/2008 | |
NOTES
* The Morgan Stanley Capital International All Country World ex-US (“MSCI ACWI ex-US”) Index is an unmanaged index used as a general measure of market performance. Calculations assume dividends and capital gains are reinvested and do not include any managerial expenses. The 10 Years or Life of Fund calculation is based on life of the fund. You cannot invest directly in an Index.
The performance data presented represents past performance; future results may vary. Performance data does not reflect the deduction of taxes that would be paid on fund distributions or the redemption of fund shares. Investment return and principal value will fluctuate so that an investor’s shares, when redeemed, may be worth more or less than their original cost. Current performance may be lower or higher than performance quoted. Please see www.transamericafunds.com for performance data current to the most recent month-end. Net Asset Value (NAV) returns include the reinvestment of dividends and capital gains. Fund shares are sold without a sales load.
Performance figures may reflect fee waivers and/or expense reimbursements by the Investment Adviser. Without such waivers and/or reimbursements, the performance would be lower. Future waivers and/or reimbursements are at the discretion of the Investment Adviser.
International investing involves special risks including currency fluctuations, political instability, and different financial accounting standards. This material must be preceded or accompanied by a current prospectus, which includes specific contents regarding the investment objectives and policies of this fund. This fund is only available in Class I shares, which are not available for direct investment by the public.
32
Transamerica UBS Dynamic Alpha
(unaudited)
MARKET ENVIRONMENT
While economic growth in the US remained weak during much of the 12-month reporting period, the longest recession since the Great Depression ended during this time. Looking back, gross domestic product (“GDP”) growth declined 5.4% during the fourth quarter of 2008. The economy continued to contract during the first half of 2009, as first quarter GDP growth declined 6.4%. While the economy continued to struggle during the second quarter, it fell at a more modest pace, with GDP growth declining 0.7%. This relatively better reading was largely the result of smaller declines in exports and business spending. After four consecutive quarters of negative GDP growth, the estimate for third quarter 2009 GDP growth was a positive 3.5%.
The twelve-month period began with a difficult month for equities as a dismal outlook for the global economy prompted investors to sell risky (non-Treasury) assets, and flee to safe haven government bonds. Investor concerns deepened into the first quarter of 2009, when the world economy found itself in the most synchronized contraction in some time, due to problems that originated in the U.S. housing market and cascaded into a shutdown of global credit markets and a decline in world trade. New lows were reached in the U.S. equity market in early March as pessimism took hold on weak economic news and falling housing prices.
However, during the month of April, the analogy ‘green shoots’ was used to describe the hopeful beginnings of economic growth, although the global economy was still in a fragile state. For the month, equities posted strong gains on the back of better-than-expected earnings and improving economic data. The Standard and Poor’s 500 Composite Stock Index (“S&P 500”) posted its biggest monthly gain in nine years, and global yield curves steepened during the month of April. As the reporting period continued, investor optimism built momentum. The U.S. equity market rallied strongly in July, with the S&P 500 rising almost 50% from its March lows. Positive macroeconomic news and stronger-than-expected second quarter company earnings gave market participants evidence that a turnaround was near, and risky assets advanced.
With many believing that the worst of the financial crisis and economic downturn is likely over, we have witnessed a rebound in risk appetite. As a result, equity prices advanced sharply and credit spreads narrowed toward the end of the reporting period. We are now witnessing a more normal operating environment in the banking sector, and an increase in new issuance in investment grade bonds and functioning commercial paper markets. Still, credit spreads remain somewhat elevated and lending standards are still tight, indicating that the healing process is not over.
PERFORMANCE
For the year ended October 31, 2009, Transamerica UBS Dynamic Alpha Class I returned 5.34%. By comparison, its benchmark, the Consumer Price Index + 5% Wrap Fee, returned 4.93%.
STRATEGY REVIEW
Market allocation was the main driver of performance, primarily as a result of long equity exposure in the U.S. and the U.K. following the strong equity rally that took place during the 12-month period. To a lesser extent, security selection also contributed to performance, with U.S. Equity, U.S. Large Cap Growth, and U.K. Equity all delivering positive results. This was partially offset by negative contributions from the Global ex-US All Cap Equity Growth and the U.S. Mid-Cap Growth components.
Currency positioning was, on the whole, a slight detractor over the 12-month period, with an underweight to the Euro and the Australian dollar and an overweight to the Latvian lat hurting performance. However, this was mitigated somewhat from a strong showing by the Norwegian Krone, which rallied significantly during the period, as well as a short position to the British pound and a long position in the Korean won.
Curt Custard, CFA
Portfolio Manager
UBS Global Asset Management (Americas) Inc.
33

Average Annual Total Return for Periods Ended 10/31/2009
| | 1 Year | | 10 Years or
Life of Fund | | Inception Date | |
Class I (NAV) | | 5.34 | % | (3.06 | )% | 01/03/2007 | |
Consumer Price Index* | | 4.93 | % | 7.79 | % | 01/03/2007 | |
NOTES
* The Consumer Price Index + 5% wrap fee (“Consumer Price Index”) is an unmanaged index used as a general measure of market performance. Calculations assume dividends and capital gains are reinvested and do not include any managerial expenses. The 10 Years or Life of Fund calculation is based on life of the fund. You cannot invest directly in an Index.
The performance data presented represents past performance; future results may vary. Performance data does not reflect the deduction of taxes that would be paid on fund distributions or the redemption of fund shares. Investment return and principal value will fluctuate so that an investor’s shares, when redeemed, may be worth more or less than their original cost. Current performance may be lower or higher than performance quoted. Please see www.transamericafunds.com for performance data current to the most recent month-end. Net Asset Value (NAV) returns include the reinvestment of dividends and capital gains. Fund shares are sold without a sales load.
Performance figures may reflect fee waivers and/or expense reimbursements by the Investment Adviser. Without such waivers and/or reimbursements, the performance would be lower. Future waivers and/or reimbursements are at the discretion of the Investment Adviser.
International investing involves special risks including currency fluctuations, political instability, and different financial accounting standards. This material must be preceded or accompanied by a current prospectus, which includes specific contents regarding the investment objectives and policies of this fund. This fund is only available in Class I shares, which are not available for direct investment by the public.
34
Transamerica UBS Large Cap Value
(unaudited)
MARKET ENVIRONMENT
The twelve months ended October 31, 2009 began with the outlook for the US equity market dominated by fear and pessimism, as data indicated further declines in economic activity on a global basis. As investors searched for a market bottom, volatility remained elevated. The declines in the equity market continued into the first quarter of 2009, at which time we viewed US equities as being more attractively valued than at any time in our firm’s history, based upon our proprietary valuation process.
The US equity market reached a low on March 9 before staging a very strong rally to close out the month. The Standard and Poor’s 500 Composite Stock Index (“S&P 500”) rose 8.76% in March, representing the largest positive monthly return for the Index in six years. There was also a dramatic shift in sector leadership during the month, as financials, materials and consumer discretionary stocks outperformed, while the more defensive consumer staples and utilities stocks lagged.
The US equity market continued its strong performance through the second quarter and into the third quarter of 2009, with the S&P 500 gaining 15.61% in the third quarter. In addition, we believe that the macroeconomic picture began to point toward a recovery during this time, with pressure on the housing market easing as housing inventory shrank and pricing declines moderated. Weakness in the labor market persisted, however, with unemployment continuing to rise and payrolls continuing to fall. Consumer confidence looks to be past its lows, but caution remains.
Despite the recent moves in equity market prices, we believe that there continues to be a meaningful gap between prices in general and our estimates of fair value. The valuation differential across what we view as the most and least attractive areas of the US equity market has been reduced somewhat, but we believe that it still has a long way to play out. Looking ahead, we expect that this could continue to take some time as investors digest new pieces of information about the direction of economic growth and its impact on company earnings and cash flows.
PERFORMANCE
For the year ended October 31, 2009, Transamerica UBS Large Cap Value Class I returned 7.56%. By comparison, its benchmark, the Russell 1000® Value Index, returned 4.78%.
STRATEGY REVIEW
In late 2008 and the first quarter of 2009, we felt that investors became far too negative on the prospects for the global economy and equities in general, and priced many companies in the US and elsewhere as though there would be no economic recovery. We believe this process created a near-historic buying opportunity.
At the start of 2009, the Fund was tilted heavily toward consumer discretionary stocks and away from consumer staples. This positioning contributed very positively to performance, but we believed that it was no longer supported by valuations. As a result, in recent months we have reduced exposure to consumer discretionary stocks and have increased exposure to what we believe to be select opportunities in the consumer staples sector. Within commodity-oriented sectors, we continue to favor energy stocks over materials stocks. During most of the reporting period, we found the greatest number of interesting opportunities in oil services companies that provide the logistical infrastructure for new projects coming on line, but more recently some of the larger integrated players have become more attractively priced, in our view, as well.
The Fund had a modest underweight to the financial sector, driven largely by underweights to Real Estate Investment Trust (“REIT”)’s and regional banks. As credit deterioration continues, impacting the need for additional capital and future funding issues, we believe that write-downs will likely offset core banking earnings into next year. The Fund’s financial sector positioning is tilted toward diversified players and insurers that have already completed or are in the process of taking the necessary steps to strengthen their balance sheets through asset sales, capital raises and deleveraging.
Healthcare positioning in the Fund is driven by company-specific opportunities. Prices for some holdings have been fairly volatile in recent months as investors grapple with the changing face of the healthcare plan, providing what we believe are opportunities to add to some existing or new positions at very attractive levels.
John C. Leonard
Thomas M. Cole
Thomas J. Digenan
Scott Hazen
Co-Portfolio Managers
UBS Global Asset Management (Americas) Inc.
35
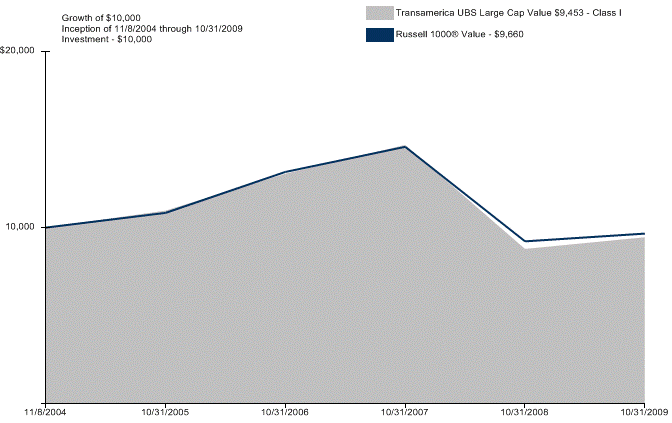
Average Annual Total Return for Periods Ended 10/31/2009
| | 1 Year | | 10 Years or
Life of Fund | | Inception Date | |
Class I (NAV) | | 7.56 | % | (1.12 | )% | 11/08/2004 | |
Russell 1000® Value* | | 4.78 | % | (0.69 | )% | 11/08/2004 | |
NOTES
* The Russell 1000® Value (“Russell 1000® Value”) Index is an unmanaged index used as a general measure of market performance. Calculations assume dividends and capital gains are reinvested and do not include any managerial expenses. The 10 Years or Life of Fund calculation is based on life of the fund. You cannot invest directly in an Index.
The performance data presented represents past performance; future results may vary. Performance data does not reflect the deduction of taxes that would be paid on fund distributions or the redemption of fund shares. Investment return and principal value will fluctuate so that an investor’s shares, when redeemed, may be worth more or less than their original cost. Current performance may be lower or higher than performance quoted. Please see www.transamericafunds.com for performance data current to the most recent month-end. Net Asset Value (NAV) returns include the reinvestment of dividends and capital gains. Fund shares are sold without a sales load.
Performance figures may reflect fee waivers and/or expense reimbursements by the Investment Adviser. Without such waivers and/or reimbursements, the performance would be lower. Future waivers and/or reimbursements are at the discretion of the Investment Adviser.
This material must be preceded or accompanied by a current prospectus, which includes specific contents regarding the investment objectives and policies of this fund. This fund is only available in Class I shares, which are not available for direct investment by the public.
36
Transamerica Van Kampen Emerging Markets Debt
(unaudited)
MARKET ENVIRONMENT
During the 12-month period ending October 31, 2009, emerging markets debt as measured by the JPMorgan Emerging Markets Bond Global Index returned 39.65%. Yield spreads on U.S. dollar-denominated debt (a measure of investors’ risk appetite) ended the 12-month period tighter by 350 basis points at 333 basis points above U.S. Treasuries.
After the Lehman Brothers bankruptcy late in the third quarter of 2008 and the associated freezing of credit markets, investor confidence plummeted, risk appetite collapsed, and the forced selling of many types of risky assets ensued. Against this backdrop, emerging market countries endured a series of shocks including manic deleveraging, an unprecedented drop in commodity prices, and a sharp contraction in developed market growth.
The first months of 2009 were characterized by unprecedented government intervention in financial markets with policy moves ranging from bank nationalization to fiscal and monetary activism. Widespread easing of monetary policy announced by numerous governments around the world complemented this fiscal support, while monetary authorities that had limited scope for further rate cuts moved to quantitative easing. In addition, leaders from the G-20 pledged to support a package of measures which provided funding of more than $1 trillion to contain the global downturn.
In the second quarter of 2009, signs of a rebound in economic activity (so called “green shoots”) and increased risk appetite in the financial markets emerged. Financial conditions improved and markets started to normalize. Emerging markets debt staged a strong rally, benefiting from expectations that downside risks for the global economy had diminished. This “market normalization” was driven by the massive injection of liquidity on the part of the world’s central banks, the sharp easing of monetary policy, and the recent stabilization of supply-side variables such as industrial production. However, the real global economy remained stressed.
Emerging markets debt continued to rally strongly during the third quarter of 2009, as investors sought higher potential returns than those provided by investment grade corporate bonds, whose yields had fallen to near historic lows of five percent. After shutting down in the last months of 2008, emerging markets debt issuance has been strong in 2009, with year-to-date issuance in sovereign and quasi-sovereign debt totaling $82 billion. Market access remained open to those countries with adequate economic fundamentals and good track record of economic policies. Inflows to the emerging markets have accelerated in the third quarter, especially in the month of September. According to EmergingPortfolio (EPDR), a fund flows and allocations data tracking service, total net emerging market-dedicated bond funds’ flows were $4.35 billion year-to-date.
PERFORMANCE
For the year ended October 31, 2009, Transamerica Van Kampen Emerging Markets Debt Class I returned 36.29%. By comparison, its benchmark, the JPMorgan Emerging Markets Bond Global Index, returned 39.65%.
STRATEGY REVIEW
During the 12-month period, the fund benefited from overweights to Venezuela, Ecuador and Kazakhstan, and from security selection in Ivory Coast and Russia. By contrast, above-Index exposure to Brazil and security selection in Indonesia detracted from relative returns.
High-beta countries (or those with greater sensitivity to market movements) such as Ecuador, Venezuela and Kazakhstan have benefited from the rebound in oil prices, as well as in investor risk appetite. Ivory Coast reached a preliminary deal to restructure some US$2.9 billion of defaulted sovereign debt with the London Club of commercial creditors. In Kazakhstan, asset prices were also supported by export duty cuts and other government efforts to bolster the economy.
In the past two months, we tactically added local currency exposure to Brazil, Mexico and Turkey where we believed the potential total returns to be greater than in these countries’ external debt. In Brazil and Turkey, we believe that nominal and real interest rates are very attractive and may be likely to compress. While the scope for compression in Mexico is less, in our view, we believe that the efforts of the Calderon administration to improve the country’s fiscal accounts may be a catalyst for the Mexican peso to potentially appreciate in the medium term.
Abigail L. McKenna
Eric J. Baurmeister
Federico L. Kaune
Co-Portfolio Managers
Morgan Stanley Investment Management Inc.
37
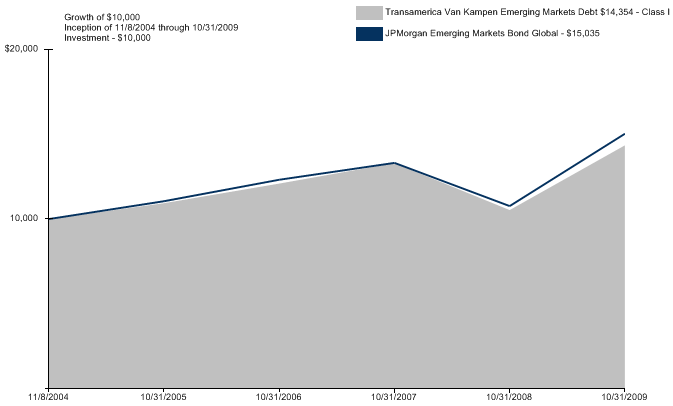
Average Annual Total Return for Periods Ended 10/31/2009
| | 1 Year | | 10 Years or
Life of Fund | | Inception Date | |
Class I (NAV) | | 36.29 | % | 7.53 | % | 11/08/2004 | |
JPMorgan Emerging Markets Bond Global* | | 39.65 | % | 8.53 | % | 11/08/2004 | |
NOTES
* The JPMorgan Emerging Markets Bond Global (“JPMorgan Emerging Markets Bond Global”) Index is an unmanaged index used as a general measure of market performance. Calculations assume dividends and capital gains are reinvested and do not include any managerial expenses. The 10 Years or Life of Fund calculation is based on life of the fund. You cannot invest directly in an Index.
The performance data presented represents past performance; future results may vary. Performance data does not reflect the deduction of taxes that would be paid on fund distributions or the redemption of fund shares. Investment return and principal value will fluctuate so that an investor’s shares, when redeemed, may be worth more or less than their original cost. Current performance may be lower or higher than performance quoted. Please see www.transamericafunds.com for performance data current to the most recent month-end. Net Asset Value (NAV) returns include the reinvestment of dividends and capital gains. Fund shares are sold without a sales load.
Performance figures may reflect fee waivers and/or expense reimbursements by the Investment Adviser. Without such waivers and/or reimbursements, the performance would be lower. Future waivers and/or reimbursements are at the discretion of the Investment Adviser.
International investing involves special risks including currency fluctuations, political instability, and different financial accounting standards. This material must be preceded or accompanied by a current prospectus, which includes specific contents regarding the investment objectives and policies of this fund. This fund is only available in Class I shares, which are not available for direct investment by the public.
38
Transamerica Van Kampen Mid-Cap Growth
(unaudited)
MARKET ENVIRONMENT
In the year following the bankruptcy of Lehman Brothers and government rescues of Fannie Mae and Freddie Mac, the stock market corrected sharply as the financial sector and the economy continued to deteriorate, then rallied in early March as investors grew more confident that the worst may be over. Although unemployment rates continued to climb during the period, other economic indicators appeared to level off, corporate earnings were able to beat analysts’ expectations, and the credit markets showed signs of improvement. Yet, despite the recent surge in investor confidence, many still believe the economy remains vulnerable.
In 2009, we saw a large rebound in performance compared to last year. We believe the market has continued to differentiate on fundamentals, and our higher quality names have benefited.
PERFORMANCE
For the year ended October 31, 2009, Transamerica Van Kampen Mid-Cap Growth Class I returned 29.29%. By comparison, its benchmark, the Russell Midcap® Growth Index, returned 22.48%.
STRATEGY REVIEW
Transamerica Van Kampen Mid-Cap Growth outperformed the Russell Midcap® Growth Index for the 12 months ended October 31, 2009, assuming no deduction of applicable sales charges.
The investment team looks for high quality growth companies that have these attributes: sustainable competitive advantages, business visibility, rising return on invested capital, free cash flow and a favorable risk/reward profile. We find these companies through intense fundamental research. Our emphasis is on secular growth, and as a result short-term market events are not as meaningful in the stock selection process.
The Russell Midcap® Growth re-categorized many of the names we held into new sectors in August 2009. While we made very few changes to the positions we held, this re-categorization caused the Fund’s sector allocations relative to the Index’s to appear quite different from the Fund’s historical relative weightings.
Stock selection in technology outperformed the Index, although an underweight there detracted from relative performance. Within the sector, computer services software and systems was the leading industry contributor to relative performance. Relative performance was further bolstered by stock selection in the producer durables sector, chiefly from the portfolio’s exposure to the commercial services industry. Stock selection in the consumer discretionary sector was also additive to relative performance, driven by exposure to the leisure time industry.
Conversely, stock selection in the financial services sector was the largest drag on relative returns, despite the positive impact of an overweight in the sector. The Fund’s diversified financial services position was particularly detrimental to performance. Stock selection in the energy sector detracted from relative results, especially within the natural gas producers industry. Finally, stock selection in health care detracted from relative performance, although an underweight in the sector was beneficial. Within the sector, medical and dental instruments and supplies dampened performance.
In our view, the financial markets globally have avoided a meltdown and we are returning to a more normal environment, albeit one with significantly more volatility. We do not make investment decisions based on a market outlook. Rather, we remain optimistic and focused on company fundamentals rather than macro forecasting. We will continue to focus on quality, the nature and sustainability of competitive advantage and balance sheet strength.
Dennis P. Lynch
David S. Cohen
Sam G. Chainani
Alexander T. Norton
Jason C. Yeung
Armistead B. Nash
Co-Portfolio Managers
Morgan Stanley Investment Management Inc.
39
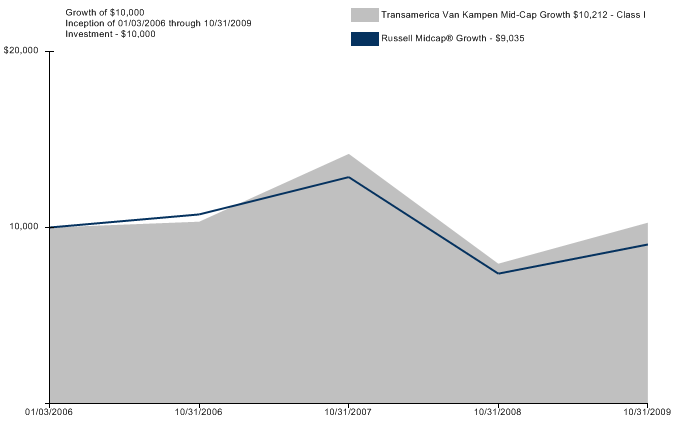
Average Annual Total Return for Periods Ended 10/31/2009
| | 1 Year | | 10 Years or
Life of Fund | | Inception Date | |
Class I (NAV) | | 29.29 | % | 0.71 | % | 01/03/2006 | |
Russell Midcap® Growth* | | 22.48 | % | (2.62 | )% | 01/03/2006 | |
NOTES
* The Russell Midcap® Growth (“Russell Midcap® Growth”) Index is an unmanaged index used as a general measure of market performance. Calculations assume dividends and capital gains are reinvested and do not include any managerial expenses. The 10 Years or Life of Fund calculation is based on life of the fund. You cannot invest directly in an Index.
The performance data presented represents past performance; future results may vary. Performance data does not reflect the deduction of taxes that would be paid on fund distributions or the redemption of fund shares. Investment return and principal value will fluctuate so that an investor’s shares, when redeemed, may be worth more or less than their original cost. Current performance may be lower or higher than performance quoted. Please see www.transamericafunds.com for performance data current to the most recent month-end. Net Asset Value (NAV) returns include the reinvestment of dividends and capital gains. Fund shares are sold without a sales load.
Performance figures may reflect fee waivers and/or expense reimbursements by the Investment Adviser. Without such waivers and/or reimbursements, the performance would be lower. Future waivers and/or reimbursements are at the discretion of the Investment Adviser.
This material must be preceded or accompanied by a current prospectus, which includes specific contents regarding the investment objectives and policies of this fund. This fund is only available in Class I shares, which are not available for direct investment by the public.
40
Transamerica Van Kampen Small Company Growth
(unaudited)
MARKET ENVIRONMENT
In the year following the bankruptcy of Lehman Brothers and government rescues of Fannie Mae and Freddie Mac, the stock market corrected sharply as the financial sector and the economy continued to deteriorate, then rallied in early March as investors grew more confident that the worst may be over. Although unemployment rates continued to climb during the period, other economic indicators appeared to level off, corporate earnings were able to beat analysts’ expectations, and the credit markets showed signs of improvement. Yet, despite the recent surge in investor confidence, many still believe the economy remains vulnerable.
In 2009, we saw a large rebound in performance compared to last year. We believe the market has continued to differentiate on fundamentals, and our higher quality names have benefited.
PERFORMANCE
For the year ended October 31, 2009, Transamerica Van Kampen Small Company Growth Class I returned 22.43%. By comparison, its benchmark, the Russell 2000® Growth Index, returned 11.34%.
STRATEGY REVIEW
Transamerica Van Kampen Small Company Growth outperformed the Russell 2000® Growth for the 12 months ended October 31, 2009, assuming no deduction of applicable sales charges.
The investment team looks for high quality growth companies that have these attributes: sustainable competitive advantages, business visibility, rising return on invested capital, free cash flow and a favorable risk/reward profile. We find these companies through intense fundamental research. Our emphasis is on secular growth, and as a result short-term market events are not as meaningful in the stock selection process.
The Russell 2000® Growth re-categorized many of the names we held into new sectors in August 2009. While we made very few changes to the positions we held, this re-categorization caused the Fund’s sector allocations relative to the Index’s to appear quite different from the Fund’s historical relative weightings.
Both stock selection and an overweight in the consumer discretionary sector contributed the most to relative performance, led by the specialty retail industry. Stock selection and an overweight in materials and processing also bolstered relative gains. Within the sector, the portfolio’s positioning in the cement industry was advantageous. Producer durables was another area of relative strength for the portfolio, as both stock selection and an underweight in the sector were additive, particularly in the commercial services industry.
However, there was one area detrimental to overall performance. Both stock selection and an underweight in energy detracted from relative performance, as natural gas producers underperformed the Index during the period.
In our view, the financial markets globally have avoided a meltdown and we are returning to a more normal environment, albeit one with significantly more volatility. We do not make investment decisions based on a market outlook. Rather, we remain optimistic and focused on company fundamentals rather than macro forecasting. We will continue to focus on quality, the nature and sustainability of competitive advantage and balance sheet strength.
Thank you for your continued support.
David S. Cohen
Dennis P. Lynch
Sam G. Chainani
Alexander T. Norton
Jason C. Yeung
Armistead B. Nash
Co-Portfolio Managers
Morgan Stanley Investment Management Inc.
41

Average Annual Total Return for Periods Ended 10/31/2009
| | 1 Year | | 10 Years or
Life of Fund | | Inception Date | |
Class I (NAV) | | 22.43 | % | 1.24 | % | 11/08/2004 | |
Russell 2000® Growth * | | 11.34 | % | 0.20 | % | 11/08/2004 | |
NOTES
* The Russell 2000® Growth (“Russell 2000® Growth”) Index is an unmanaged index used as a general measure of market performance. Calculations assume dividends and capital gains are reinvested and do not include any managerial expenses. The 10 Years or Life of Fund calculation is based on life of the fund. You cannot invest directly in an Index.
The performance data presented represents past performance; future results may vary. Performance data does not reflect the deduction of taxes that would be paid on fund distributions or the redemption of fund shares. Investment return and principal value will fluctuate so that an investor’s shares, when redeemed, may be worth more or less than their original cost. Current performance may be lower or higher than performance quoted. Please see www.transamericafunds.com for performance data current to the most recent month-end. Net Asset Value (NAV) returns include the reinvestment of dividends and capital gains. Fund shares are sold without a sales load.
Performance figures may reflect fee waivers and/or expense reimbursements by the Investment Adviser. Without such waivers and/or reimbursements, the performance would be lower. Future waivers and/or reimbursements are at the discretion of the Investment Adviser.
Investing in small cap stocks generally involves greater risks so an investment in the Fund may not be appropriate for everyone. This material must be preceded or accompanied by a current prospectus, which includes specific contents regarding the investment objectives and policies of this fund. This fund is only available in Class I shares, which are not available for direct investment by the public.
42
Transamerica WMC Emerging Markets
(unaudited)
MARKET ENVIRONMENT
Emerging markets gained 64.6% during the period, outperforming developed market indices. Latin America was the top relative performer helped by Brazil (+92.3%), which benefited from positive economic data. Results in Asia were mixed, as Indonesia (+128.7%), China (+82.5%), Thailand (+79.4%), and India (+77.1%) were strong, while South Korea (+56.8%) and Taiwan (+49.7%) lagged the broader market. The Morgan Stanley Capital International Emerging Markets Index was led by Turkey (+69.0%) and Eastern European countries such as Hungary (+63.5%), while Poland (+24.0%) underperformed.
PERFORMANCE
For the year ended October 31, 2009, Transamerica WMC Emerging Markets Class I returned 57.44%. By comparison, its benchmark, the Morgan Stanley Capital International Emerging Markets Index (“MSCI-EMI”), returned 64.63%.
STRATEGY REVIEW
For the twelve months ended October 31, 2009, the Transamerica WMC Emerging Markets underperformed the MSCI Emerging Markets on a gross of fee basis by 719 basis points. The Fund also underperformed the Lipper Emerging Markets (peer group) Average by 393 basis points.
The Fund’s underweight position in China, due to relatively fair valuations and policy uncertainty, contributed to relative performance. The Fund’s overweight to India also contributed to performance. Russian natural resource stocks that successfully restructured debt and benefited from rising prices and volumes were also among the largest contributors to relative performance. The Portfolio’s modest allocation to cash detracted from performance.
Stock selection in the Information Technology, Energy, and Telecommunication Services sectors detracted from relative results. Positions in Russian mobile operator Mobile TeleSystems, Korean-based LG Electronics, and Mexican media giant Televisa hurt relative performance. China Resources and Turkey-based industrial and financial conglomerate Haci Omer Sabanci were among other names that detracted from absolute returns. The Fund’s overweight in Health Care, one of the worst relative performing sectors, hurt relative performance.
Strong stock selection in selective Industrials, Metals and Mining and Health Care stocks contributed positively to relative returns during the period. Top performers included Brazilian residential construction and real estate developer Cyrela Brazil Realty, Peruvian precious metals company Compañía de Minas Buenaventura, and one of Russia’s leading mining and metallurgical companies Mechel. Other top contributors to absolute performance included Petrol Brasileiros and China National Offshore Oil Corporation (CNOOC). Our underweight in Information Technology stocks generated positive alpha.
Given the better macroeconomic backdrop, we have been adding to cyclical areas such as media, heavy equipment manufacturers, and transportation companies. We took profits in a number of names that we purchased at stressed levels at the height of the crisis, but have since rebounded strongly. These include cement companies in Turkey and Thailand. We have also reduced exposure to more defensive, high dividend yielding areas such as Telecom Services. We continue to be overweight domestically oriented healthcare and consumer stocks in countries such as India. However, given continued relative weak developed market consumer demand, we remain underweight export dependent economies such as South Korea and Taiwan.
Unprecedented global monetary policy easing and upward pointing leading indicators signal continued economic recovery in both developed and emerging markets. As a result, we expect to continue to add cyclical stocks that will benefit most from accelerating economic activity and growth.
Vera M. Trojan, CFA
Portfolio Manager
Wellington Management Company, LLP
43
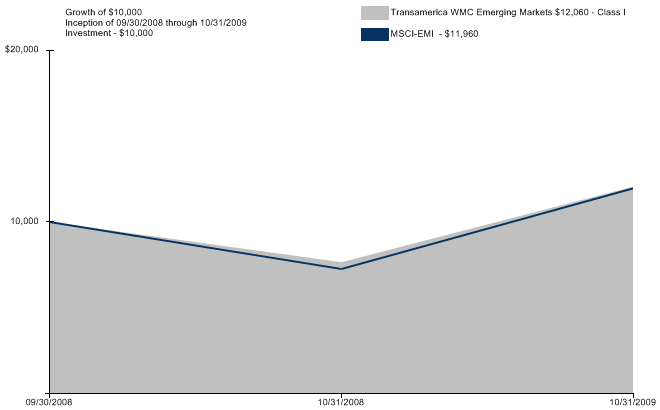
Average Annual Total Return for Periods Ended 10/31/2009
| | 1 Year | | 10 Years or
Life of Fund | | Inception Date | |
Class I (NAV) | | 57.44 | % | 18.79 | % | 09/30/2008 | |
MSCI-EMI * | | 64.63 | % | 19.55 | % | 09/30/2008 | |
NOTES
* The Morgan Stanley Capital International Emerging Markets (“MSCI-EMI”) Index is an unmanaged index used as a general measure of market performance. Calculations assume dividends and capital gains are reinvested and do not include any managerial expenses. The 10 Years or Life of Fund calculation is based on life of the fund. You cannot invest directly in an Index.
The performance data presented represents past performance; future results may vary. Performance data does not reflect the deduction of taxes that would be paid on fund distributions or the redemption of fund shares. Investment return and principal value will fluctuate so that an investor’s shares,when redeemed, may be worth more or less than their original cost. Current performance may be lower or higher than performance quoted. Please see www.transamericafunds.com for performance data current to the most recent month-end. Net Asset Value (NAV) returns include the reinvestment of dividends and capital gains. Fund shares are sold without a sales load.
Performance figures may reflect fee waivers and/or expense reimbursements by the Investment Adviser. Without such waivers and/or reimbursements, the performance would be lower. Future waivers and/or reimbursements are at the discretion of the Investment Adviser.
International investing involves special risks including currency fluctuations, political instability, and different financial accounting standards. This material must be preceded or accompanied by a current prospectus, which includes specific contents regarding the investment objectives and policies of this fund. This fund is only available in Class I shares, which are not available for direct investment by the public.
44
Understanding Your Funds’ Expenses
(unaudited)
SHAREHOLDER EXPENSES
Fund shareholders may incur two types of costs: (1) transaction costs, including sales charges (loads) on purchases, contingent deferred sales charges on redemptions; and (2) ongoing costs, including management fees, dividend expense on short-sales, and other fund expenses.
The following examples are intended to help you understand your ongoing costs (in dollars and cents) of investing in the funds and to compare these costs with the ongoing costs of investing in other funds.
For all funds, excluding Transamerica JPMorgan Core Bond, the examples are based on an investment of $1,000 invested at May 1, 2009 and held for the entire period until October 31, 2009. For Transamerica JPMorgan Core Bond, the example is based on an investment of $1,000 invested at July 1, 2009 (commencement of operations) and held for the entire period until October 31, 2009.
ACTUAL EXPENSES
The information in the table under the heading “Actual Expenses” provides information about actual account values and actual expenses. You may use the information in these columns, together with the amount you invested, to estimate the expenses that you paid over the period. Simply divide your account value by $1,000 (for example, an $8,600 account value divided by $1,000 = $8.60), then multiply the result by the number in the appropriate column for your share class titled “Expenses Paid During Period” to estimate the expenses you paid on your account during this period.
HYPOTHETICAL EXAMPLES FOR COMPARISON PURPOSES
The information in the table under the heading “Hypothetical Expenses” provides information about hypothetical account values and hypothetical expenses based on the funds’ actual expense ratios and an assumed rate of return of five percent per year before expenses, which are not the funds’ actual returns. The hypothetical account values and expenses may not be used to estimate the actual ending account balance or expenses you paid for the period. You may use this information to compare the ongoing costs of investing in the funds versus other funds. To do so, compare this five percent hypothetical example with the 5% hypothetical examples that appear in the shareholder reports of the other funds.
Please note that the expenses shown in the table are meant to highlight your ongoing costs only and do not reflect any transactional costs. Therefore, the information under the heading “Hypothetical Expenses” is useful in comparing ongoing costs only, and will not help you determine the relative total costs of owning different funds. In addition, if these transactional costs were included, your costs would have been higher.
Expense ratios may vary period to period because of various factors, such as an increase in expenses that are not covered by the advisery and administrative fees, such as fees and expenses of the trustees and their counsel, extraordinary expenses and interest expense.
| | | | Actual Expenses | | Hypothetical Expenses (b) | | | |
Fund Name | | Beginning
Account Value | | Ending Account
Value | | Expenses Paid
During Period (a) | | Ending Account
Value | | Expenses Paid
During Period (a) | | Annualized
Expense Ratio | |
Transamerica AllianceBernstein International Value | | $ | 1,000.00 | | $ | 1,287.10 | | $ | 5.25 | | $ | 1,020.62 | | $ | 4.63 | | 0.91 | % |
Transamerica BlackRock Global Allocation | | 1,000.00 | | 1,182.20 | | 4.68 | | 1,020.92 | | 4.33 | | 0.85 | % |
Transamerica BlackRock Large Cap Value | | 1,000.00 | | 1,181.50 | | 4.56 | | 1,021.02 | | 4.23 | | 0.83 | % |
Transamerica BlackRock Natural Resources | | 1,000.00 | | 1,287.60 | | 5.02 | | 1,020.82 | | 4.43 | | 0.87 | % |
Transamerica BNY Mellon Market Neutral Strategy | | 1,000.00 | | 978.00 | | 7.83 | | 1,017.29 | | 7.98 | | 1.57 | % |
Transamerica Federated Market Opportunity | | 1,000.00 | | 1,026.10 | | 4.60 | | 1,020.67 | | 4.58 | | 0.90 | % |
Transamerica JPMorgan Core Bond | | 1,000.00 | | 1,013.40 | | 1.87 | | 1,015.00 | | 1.87 | | 0.55 | % |
Transamerica JPMorgan International Bond | | 1,000.00 | | 1,137.40 | | 3.07 | | 1,022.33 | | 2.91 | | 0.57 | % |
Transamerica JPMorgan Mid Cap Value | | 1,000.00 | | 1,177.80 | | 4.89 | | 1,020.72 | | 4.53 | | 0.89 | % |
Transamerica Loomis Sayles Bond | | 1,000.00 | | 1,270.70 | | 3.95 | | 1,021.73 | | 3.52 | | 0.69 | % |
Transamerica Neuberger Berman International | | 1,000.00 | | 1,294.00 | | 6.07 | | 1,019.91 | | 5.35 | | 1.05 | % |
Transamerica Oppenheimer Developing Markets | | 1,000.00 | | 1,415.40 | | 7.79 | | 1,018.75 | | 6.51 | | 1.28 | % |
Transamerica Oppenheimer Small- & Mid-Cap Value | | 1,000.00 | | 1,185.90 | | 5.40 | | 1,020.27 | | 4.99 | | 0.98 | % |
Transamerica Schroders International Small Cap | | 1,000.00 | | 1,376.90 | | 7.25 | | 1,019.11 | | 6.16 | | 1.21 | % |
Transamerica Third Avenue Value | | 1,000.00 | | 1,185.90 | | 4.68 | | 1,020.92 | | 4.33 | | 0.85 | % |
Transamerica Thornburg International Value | | 1,000.00 | | 1,263.40 | | 6.50 | | 1,019.46 | | 5.80 | | 1.14 | % |
Transamerica UBS Dynamic Alpha | | 1,000.00 | | 1,145.00 | | 8.06 | | 1,017.69 | | 7.58 | | 1.49 | % |
Transamerica UBS Large Cap Value | | 1,000.00 | | 1,185.40 | | 4.41 | | 1,021.17 | | 4.08 | | 0.80 | % |
Transamerica Van Kampen Emerging Markets Debt | | 1,000.00 | | 1,159.10 | | 5.33 | | 1,020.27 | | 4.99 | | 0.98 | % |
Transamerica Van Kampen Mid-Cap Growth | | 1,000.00 | | 1,258.90 | | 4.95 | | 1,020.82 | | 4.43 | | 0.87 | % |
Transamerica Van Kampen Small Company Growth | | 1,000.00 | | 1,193.50 | | 5.64 | | 1,020.06 | | 5.19 | | 1.02 | % |
Transamerica WMC Emerging Markets | | 1,000.00 | | 1,358.10 | | 8.32 | | 1,018.15 | | 7.12 | | 1.40 | % |
| | | | | | | | | | | | | | | | | | |
(a) | For all funds, excluding Transamerica JPMorgan Core Bond, expenses are calculated using the funds’ annualized expense ratios (as disclosed in the table), multiplied by the average account values for the period, multiplied by the number of days in the period (184 days), and divided by the number of days in the year (365 days). For Transamerica JPMorgan Core Bond, expenses are calculated using the funds’ annualized expense ratios (as disclosed in the table), multiplied by the average account values for the period, multiplied by the number of days in the period (123 days), and divided by the number of days in the year (365 days). |
| |
(b) | 5% return per year before expenses. |
45
Schedules of Investments Composition
At October 31, 2009
(The following charts summarize the Schedules of Investments of the funds by asset type)
(unaudited)
Transamerica AllianceBernstein International Value
Common Stocks | | 96.9 | % |
Securities Lending Collateral | | 4.4 | |
Repurchase Agreement | | 1.5 | |
Rights | | 0.0 | * |
Other Assets and Liabilities - Net | | (2.8 | ) |
Total | | 100.0 | % |
Transamerica BlackRock Global Allocation
Common Stocks | | 52.8 | % |
Convertible Bonds | | 11.4 | |
U.S. Government Obligations | | 9.5 | |
Foreign Government Obligations | | 8.8 | |
Short-Term U.S. Government Obligations | | 7.9 | |
Corporate Debt Securities | | 4.3 | |
Investment Companies | | 3.4 | |
Securities Lending Collateral | | 2.7 | |
Preferred Stocks | | 0.5 | |
Convertible Preferred Stocks | | 0.4 | |
Purchased Options | | 0.0 | * |
Warrants | | 0.0 | * |
Structured Notes Debt | | 0.0 | * |
Rights | | 0.0 | * |
Asset-Backed Security | | 0.0 | * |
Written Options | | (0.3 | ) |
Other Assets and Liabilities - Net | | (1.4 | )(a) |
Total | | 100.0 | % |
Transamerica BlackRock Large Cap Value
Common Stocks | | 99.7 | % |
Short-Term Investment Company | | 0.2 | |
Other Assets and Liabilities - Net | | 0.1 | |
Total | | 100.0 | % |
Transamerica BlackRock Natural Resources
Common Stocks | | 89.6 | % |
Repurchase Agreement | | 13.8 | |
Securities Lending Collateral | | 3.7 | |
Other Assets and Liabilities - Net | | (7.1 | ) |
Total | | 100.0 | % |
Transamerica BNY Mellon Market Neutral Strategy
Common Stocks | | 89.7 | % |
Repurchase Agreement | | 25.7 | |
Other Assets and Liabilities - Net | | (15.4 | )(a) |
Total | | 100.0 | % |
Transamerica Federated Market Opportunity
Repurchase Agreement | | 38.7 | % |
Common Stocks | | 34.1 | |
Purchased Options | | 6.8 | |
Foreign Government Obligations | | 6.1 | |
Investment Companies | | 5.7 | |
U.S. Government Obligations | | 5.6 | |
Securities Lending Collateral | | 1.3 | |
Short-Term Government Obligation | | 1.3 | |
Other Assets and Liabilities - Net | | 0.4 | (a) |
Total | | 100.0 | % |
Transamerica JPMorgan Core Bond
U.S. Government Agency Obligations | | 53.3 | % |
U.S. Government Obligations | | 25.3 | |
Corporate Debt Securities | | 8.9 | |
Mortgage-Backed Securities | | 6.9 | |
Repurchase Agreement | | 4.7 | |
Asset-Backed Securities | | 0.4 | |
Municipal Government Obligation | | 0.0 | * |
Other Assets and Liabilities - Net | | 0.5 | |
Total | | 100.0 | % |
Transamerica JPMorgan International Bond
Foreign Government Obligations | | 69.2 | % |
Corporate Debt Securities | | 26.2 | |
Repurchase Agreement | | 1.5 | |
Mortgage-Backed Security | | 0.6 | |
Short-Term U.S. Government Obligation | | 0.2 | |
Asset-Backed Security | | 0.1 | |
Other Assets and Liabilities - Net | | 2.2 | (a) |
Total | | 100.0 | % |
Transamerica JPMorgan Mid Cap Value
Common Stocks | | 99.3 | % |
Securities Lending Collateral | | 2.5 | |
Repurchase Agreement | | 0.8 | |
Other Assets and Liabilities - Net | | (2.6 | ) |
Total | | 100.0 | % |
Transamerica Loomis Sayles Bond
Corporate Debt Securities | | 67.2 | % |
Foreign Government Obligations | | 15.4 | |
Mortgage-Backed Securities | | 5.5 | |
Convertible Bonds | | 3.6 | |
Repurchase Agreement | | 2.3 | |
Asset-Backed Securities | | 0.9 | |
Preferred Stocks | | 0.9 | |
Convertible Preferred Stocks | | 0.7 | |
Structured Note Debts | | 0.6 | |
Loan Assignment | | 0.4 | |
Common Stocks | | 0.1 | |
Securities Lending Collateral | | 0.0 | * |
Other Assets and Liabilities - Net | | 2.4 | |
Total | | 100.0 | % |
Transamerica Neuberger Berman International
Common Stocks | | 97.3 | % |
Repurchase Agreement | | 2.5 | |
Securities Lending Collateral | | 1.7 | |
Warrants | | 0.0 | * |
Rights | | 0.0 | * |
Other Assets and Liabilities - Net | | (1.5 | ) |
Total | | 100.0 | % |
Transamerica Oppenheimer Developing Markets
Common Stocks | | 95.8 | % |
Preferred Stocks | | 2.7 | |
Repurchase Agreement | | 0.8 | |
Securities Lending Collateral | | 0.1 | |
Rights | | 0.0 | * |
Other Assets and Liabilities - Net | | 0.6 | |
Total | | 100.0 | % |
46
Transamerica Oppenheimer Small- & Mid-Cap Value
Common Stocks | | 98.5 | % |
Repurchase Agreement | | 3.5 | |
Other Assets and Liabilities - Net | | (2.0 | ) |
Total | | 100.0 | % |
Transamerica Schroders International Small Cap
Common Stocks | | 95.9 | % |
Repurchase Agreement | | 3.8 | |
Securities Lending Collateral | | 1.6 | |
Rights | | 0.0 | * |
Other Assets and Liabilities - Net | | (1.3 | ) |
Total | | 100.0 | % |
Transamerica Third Avenue Value
Common Stocks | | 86.8 | % |
Short-Term U.S. Government Obligation | | 7.1 | |
Repurchase Agreement | | 5.8 | |
Securities Lending Collateral | | 4.1 | |
Other Assets and Liabilities - Net | | (3.8 | ) |
Total | | 100.0 | % |
Transamerica Thornburg International Value
Common Stocks | | 97.3 | % |
Repurchase Agreement | | 2.6 | |
Other Assets and Liabilities - Net | | 0.1 | (a) |
Total | | 100.0 | % |
Transamerica UBS Dynamic Alpha
Repurchase Agreement | | 99.2 | % |
Common Stocks | | 0.0 | * |
Other Assets and Liabilities - Net | | 0.8 | (a) |
Total | | 100.0 | % |
Transamerica UBS Large Cap Value
Common Stocks | | 97.9 | % |
Repurchase Agreement | | 1.2 | |
Investment Company | | 1.0 | |
Securities Lending Collateral | | 0.2 | |
Other Assets and Liabilities - Net | | (0.3 | ) |
Total | | 100.0 | % |
Transamerica Van Kampen Emerging Markets Debt
Foreign Government Obligations | | 77.9 | % |
Corporate Debt Securities | | 8.5 | |
Repurchase Agreement | | 0.6 | |
Securities Lending Collateral | | 0.0 | * |
Other Assets and Liabilities - Net | | 13.0 | |
Total | | 100.0 | % |
Transamerica Van Kampen Mid-Cap Growth
Common Stocks | | 90.4 | % |
Repurchase Agreement | | 10.6 | |
Securities Lending Collateral | | 6.3 | |
Other Assets and Liabilities - Net | | (7.3 | ) |
Total | | 100.0 | % |
Transamerica Van Kampen Small Company Growth
Common Stocks | | 92.1 | % |
Securities Lending Collateral | | 13.4 | |
Repurchase Agreement | | 6.2 | |
Preferred Stocks | | 2.5 | |
Other Assets and Liabilities - Net | | (14.2 | ) |
Total | | 100.0 | % |
Transamerica WMC Emerging Markets
Common Stocks | | 88.9 | % |
Investment Company | | 4.7 | |
Repurchase Agreement | | 2.8 | |
Preferred Stocks | | 2.3 | |
Convertible Preferred Stock | | 0.7 | |
Warrants | | 0.4 | |
Other Assets and Liabilities - Net | | 0.2 | |
Total | | 100.0 | % |
(a) The Other Assets and Liabilities, Net category may include, but is not limited to, Forward Currencies contracts, Futures contracts, Swap Agreements, Written options and swaptions, and Securities Sold Short.
* Amount rounds to less than 0.05% or (0.05)%.
47
Transamerica AllianceBernstein International Value
SCHEDULE OF INVESTMENTS
At October 31, 2009
(all amounts except share amounts in thousands)
| | Shares | | Value | |
COMMON STOCKS - 96.9% | | | | | |
Australia - 7.7% | | | | | |
Amcor, Ltd. | | 328,200 | | $ | 1,690 | |
Australia & New Zealand Banking Group, Ltd. | | 229,900 | | 4,689 | |
Bendigo and Adelaide Bank, Ltd. | | 155,800 | | 1,263 | |
BHP Billiton, Ltd. | | 23,700 | | 777 | |
Challenger Financial Services Group, Ltd. | | 268,400 | | 883 | |
Insurance Australia Group, Ltd. | | 242,100 | | 814 | |
Lend Lease Corp., Ltd. | | 112,200 | | 930 | |
Macquarie Group, Ltd. | | 68,300 | | 2,991 | |
National Australia Bank, Ltd. | | 144,221 | | 3,811 | |
Qantas Airways, Ltd. | | 991,701 | | 2,466 | |
Tabcorp Holdings, Ltd. | | 283,800 | | 1,810 | |
Telstra Corp., Ltd. | | 712,100 | | 2,116 | |
Belgium - 0.2% | | | | | |
Delhaize Group SA | | 10,200 | | 693 | |
Canada - 4.7% | | | | | |
Biovail Corp. | | 42,600 | | 575 | |
Bombardier, Inc. -Class B | | 483,000 | | 1,960 | |
Brookfield Properties Corp. | | 122,000 | | 1,268 | |
Fairfax Financial Holdings, Ltd. | | 2,800 | | 1,002 | |
Industrial Alliance Insurance & Financial Services, Inc. | | 35,100 | | 901 | |
National Bank of Canada | | 20,700 | | 1,078 | |
Nexen, Inc. | | 135,448 | | 2,913 | |
Suncor Energy, Inc. ‡ | | 86,988 | | 2,888 | |
TELUS Corp. -Class A | | 47,700 | | 1,422 | |
Toronto-Dominion Bank | | 13,500 | | 770 | |
Denmark - 0.8% | | | | | |
Danske Bank A/S -Class R ‡ | | 110,900 | | 2,547 | |
Finland - 1.5% | | | | | |
Nokia OYJ | | 379,000 | | 4,787 | |
France - 14.3% | | | | | |
BNP Paribas | | 65,252 | | 4,916 | |
Casino Guichard Perrachon SA | | 23,800 | | 1,891 | |
Cie de Saint-Gobain | | 15,200 | | 741 | |
Credit Agricole SA | | 220,761 | | 4,229 | |
EDF SA | | 51,700 | | 2,882 | |
France Telecom SA | | 171,900 | | 4,259 | |
Klepierre REIT | | 4,900 | | 203 | |
Lagardere SCA | | 63,300 | | 2,860 | |
Renault SA ‡ | | 58,100 | | 2,600 | |
Sanofi-Aventis SA | | 80,700 | | 5,915 | |
Societe Generale | | 83,844 | | 5,569 | |
Unibail-Rodamco REIT | | 15,000 | | 3,322 | |
Vallourec SA | | 13,045 | | 2,054 | |
Vivendi | | 138,200 | | 3,834 | |
Germany - 13.5% | | | | | |
Allianz SE | | 44,600 | | 5,113 | |
BASF SE | | 84,600 | | 4,529 | |
Bayer AG | | 66,300 | | 4,600 | |
Bayerische Motoren Werke AG | | 15,300 | | 748 | |
Celesio AG | | 25,900 | | 643 | |
Deutsche Bank AG | | 69,100 | | 5,020 | |
Deutsche Post AG | | 172,620 | | 2,920 | |
Deutsche Telekom AG | | 282,500 | | 3,860 | |
E.ON AG | | 141,200 | | 5,411 | |
Metro AG | | 46,000 | | 2,553 | |
Muenchener Rueckversicherungs AG | | 23,600 | | 3,734 | |
RWE AG | | 40,540 | | 3,556 | |
Italy - 6.6% | | | | | |
Banca Popolare di Milano Scarl | | 265,300 | | 1,974 | |
Enel SpA Λ | | 637,500 | | 3,793 | |
ENI SpA | | 175,700 | | 4,352 | |
Intesa Sanpaolo SpA ‡ | | 552,500 | | 2,325 | |
Telecom Italia SpA | | 1,817,100 | | 2,887 | |
Telecom Italia SpA - RSP | | 1,617,800 | | 1,780 | |
UniCredit SpA ‡ | | 1,148,700 | | 3,848 | |
Japan - 13.3% | | | | | |
AEON Co., Ltd. | | 221,500 | | | 1,976 | |
Fujitsu, Ltd. | | 24,000 | | 141 | |
ITOCHU Corp. | | 203,000 | | 1,283 | |
JFE Holdings, Inc. | | 47,500 | | 1,547 | |
KDDI Corp. | | 380 | | 2,017 | |
Kyocera Corp. | | 13,700 | | 1,149 | |
Mitsubishi Chemical Holdings Corp. | | 73,500 | | 273 | |
Mitsubishi Tanabe Pharma Corp. | | 96,000 | | 1,226 | |
Mitsubishi UFJ Financial Group, Inc. | | 226,100 | | 1,204 | |
Mitsui Fudosan Co., Ltd. | | 122,000 | | 1,974 | |
Namco Bandai Holdings, Inc. | | 126,000 | | 1,288 | |
Nippon Mining Holdings, Inc. | | 252,500 | | 1,126 | |
Nippon Telegraph & Telephone Corp. | | 102,300 | | 4,222 | |
Nippon Yusen KK | | 450,000 | | 1,661 | |
Nissan Motor Co., Ltd. ‡ | | 492,800 | | 3,566 | |
ORIX Corp. Λ | | 34,420 | | 2,223 | |
Sharp Corp. | | 181,000 | | 1,931 | |
Sony Corp. | | 56,600 | | 1,671 | |
Sumitomo Mitsui Financial Group, Inc. | | 76,900 | | 2,614 | |
Sumitomo Realty & Development Co., Ltd. | | 98,000 | | 1,858 | |
Tokyo Electric Power Co., Inc. | | 111,800 | | 2,748 | |
Toshiba Corp. ‡ | | 766,000 | | 4,379 | |
Jersey Channel Islands - 1.0% | | | | | |
WPP PLC | | 344,900 | | 3,091 | |
Netherlands - 2.3% | | | | | |
Koninklijke Ahold NV | | 279,060 | | 3,516 | |
Koninklijke DSM NV | | 12,400 | | 543 | |
Randstad Holding NV ‡ | | 82,400 | | 3,126 | |
New Zealand - 0.8% | | | | | |
Fletcher Building, Ltd. | | 234,100 | | 1,384 | |
Telecom Corp. of New Zealand, Ltd. | | 544,898 | | 991 | |
Norway - 1.2% | | | | | |
Statoil ASA | | 158,050 | | 3,724 | |
Spain - 4.0% | | | | | |
Banco Santander SA Reg D ‡ | | 4,041 | | 65 | |
Banco Santander SA | | 437,300 | | 7,037 | |
Telefonica SA | | 203,400 | | 5,680 | |
Sweden - 2.5% | | | | | |
Electrolux AB -Series B ‡ | | 100,400 | | 2,406 | |
Svenska Cellulosa AB - Class B | | 182,400 | | 2,506 | |
Telefonaktiebolaget LM Ericsson - Class B | | 284,000 | | 2,968 | |
Switzerland - 2.7% | | | | | |
Adecco SA | | 57,300 | | 2,560 | |
Novartis AG | | 115,110 | | 5,995 | |
United Kingdom - 19.8% | | | | | |
Associated British Foods PLC | | 226,100 | | 3,062 | |
AstraZeneca PLC | | 108,000 | | 4,848 | |
Aviva PLC | | 461,501 | | 2,886 | |
Barclays PLC ‡ | | 504,900 | | 2,646 | |
BP PLC | | 885,700 | | 8,300 | |
BT Group PLC -Class A | | 711,740 | | 1,525 | |
Centrica PLC | | 401,200 | | 1,630 | |
Drax Group PLC | | 141,300 | | 1,075 | |
GlaxoSmithKline PLC | | 314,600 | | 6,454 | |
Old Mutual PLC | | 448,800 | | 779 | |
Premier Foods PLC ‡ | | 1,225,300 | | 718 | |
Rolls-Royce Group PLC -Class C ‡Ə | | 24,660,000 | | 40 | |
Rolls-Royce Group PLC ‡Λ | | 411,000 | | 3,032 | |
Royal & Sun Alliance Insurance Group PLC | | 671,216 | | 1,330 | |
Royal Dutch Shell PLC -Class A Λ | | 276,130 | | 8,187 | |
Thomas Cook Group PLC | | 322,400 | | 1,080 | |
Travis Perkins PLC ‡ | | 95,300 | | 1,176 | |
TUI Travel PLC | | 406,500 | | 1,548 | |
Vodafone Group PLC | | 3,622,812 | | 7,984 | |
Wolseley PLC ‡ | | 129,700 | | 2,624 | |
Xstrata PLC ‡ | | 107,500 | | 1,548 | |
Total Common Stocks (cost $335,828) | | | | $ | 306,106 | |
The notes to the financial statements are an integral part of this report.
48
| | Shares | | Value | |
RIGHTS - 0.0% | | | | | |
Belgium - 0.0% | | | | | |
Fortis Ə‡ | | 175,832 | | $ | ♦ | |
Total Rights (cost $—) | | | | | |
| | | | | | |
| | Principal | | | |
REPURCHASE AGREEMENT - 1.5% | | | | | |
State Street Repurchase Agreement 0.01%, dated 10/30/2009, to be repurchased at $4,801 on 11/02/2009. Collateralized by a U.S. Government Agency Obligation, 4.00%, due 12/15/2017, and with a value of $4,901. | | $ | 4,801 | | 4,801 | |
Total Repurchase Agreement (cost $4,801) | | | | | |
| | | | | | |
| | Shares | | | |
SECURITIES LENDING COLLATERAL - 4.4% | | | | | |
State Street Navigator Securities Lending Trust - Prime Portfolio, 0.35% ▲ | | 13,966,866 | | | 13,967 | |
Total Securities Lending Collateral (cost $13,967) | | | | | |
Total Investment Securities (cost $354,596) # | | | | 324,874 | |
Other Assets and Liabilities - Net | | | | (8,806 | ) |
| | | | | |
Net Assets | | | | $ | 316,068 | |
INVESTMENTS BY INDUSTRY (unaudited): | | Percentage of
Total Investments | | Value | |
Commercial Banks | | 15.6 | % | $ | 50,585 | |
Oil, Gas & Consumable Fuels | | 9.5 | | 31,490 | |
Pharmaceuticals | | 9.1 | | 29,613 | |
Diversified Telecommunication Services | | 8.8 | | 28,742 | |
Insurance | | 5.1 | | 16,559 | |
Electric Utilities | | 4.6 | | 14,834 | |
Food & Staples Retailing | | 3.2 | | 10,629 | |
Wireless Telecommunication Services | | 3.1 | | 10,001 | |
Media | | 3.1 | | 9,785 | |
Capital Markets | | 2.4 | | 8,011 | |
Communications Equipment | | 2.4 | | 7,755 | |
Automobiles | | 2.1 | | 6,914 | |
Real Estate Management & Development | | 1.9 | | 6,030 | |
Household Durables | | 1.8 | | 6,008 | |
Professional Services | | 1.8 | | 5,686 | |
Chemicals | | 1.7 | | 5,345 | |
Multi-Utilities | | 1.6 | | 5,186 | |
Aerospace & Defense | | 1.5 | | 5,032 | |
Computers & Peripherals | | 1.4 | | 4,520 | |
Hotels, Restaurants & Leisure | | 1.4 | | 4,438 | |
Trading Companies & Distributors | | 1.2 | | 3,907 | |
Metals & Mining | | 1.2 | | 3,872 | |
Food Products | | 1.2 | | 3,780 | |
Real Estate Investment Trusts | | 1.1 | | 3,525 | |
Air Freight & Logistics | | 0.9 | | 2,920 | |
Paper & Forest Products | | 0.8 | | 2,506 | |
Airlines | | 0.8 | | 2,466 | |
Consumer Finance | | 0.7 | | 2,223 | |
Machinery | | 0.6 | | 2,054 | |
Containers & Packaging | | 0.5 | | 1,690 | |
Marine | | 0.5 | | 1,661 | |
Construction Materials | | 0.4 | | 1,384 | |
Leisure Equipment & Products | | 0.4 | | 1,288 | |
Specialty Retail | | 0.4 | | 1,176 | |
Electronic Equipment & Instruments | | 0.4 | | 1,149 | |
Independent Power Producers & Energy Traders | | 0.3 | | 1,075 | |
Diversified Financial Services | | 0.3 | | 883 | |
Building Products | | 0.2 | | 741 | |
Health Care Providers & Services | | 0.2 | | 643 | |
Investment Securities, at Value | | 94.2 | | 306,106 | |
Short-Term Investments | | 5.8 | | 18,768 | |
Total Investments | | 100.0 | % | $ | 324,874 | |
The notes to the financial statements are an integral part of this report.
49
(all amounts in thousands)
NOTES TO SCHEDULE OF INVESTMENTS:
‡ | Non-income producing security. |
Λ | All or a portion of this security is on loan. The value of all securities on loan is $13,262. |
Ə | Securities fair valued as determined in good faith in accordance with procedures established by the Board of Trustees. These securities aggregated to less than $40, or 0.01% of the fund’s net assets. |
♦ | Value and/or principal is less than $1. |
▲ | Rate shown reflects the yield at 10/31/2009. |
# | Aggregate cost for federal income tax purposes is $354,743. Aggregate gross unrealized appreciation/depreciation for all securities in which there is an excess of value over tax cost were $22,361 and $52,230, respectively. Net unrealized depreciation for tax purposes is $29,869. |
DEFINITIONS:
REIT | Real Estate Investment Trust (includes domestic REITs and Foreign Real Estate Investment Companies). |
RSP | Refers to Risparmio shares, which are savings shares on the Italian Stock Exchange. |
VALUATION SUMMARY:
Investment Securities | | Level 1 | | Level 2 | | Level 3 | | Total | |
Equities - Consumer Discretionary | | $ | 1,671 | | $ | 27,940 | | $ | — | | $ | 29,611 | |
Equities - Consumer Staples | | — | | 14,408 | | — | | 14,408 | |
Equities - Energy | | 5,802 | | 25,688 | | — | | 31,490 | |
Equities - Financials | | 5,084 | | 82,733 | | ♦ | | 87,817 | |
Equities - Health Care | | 575 | | 29,679 | | — | | 30,254 | |
Equities - Industrials | | 1,960 | | 22,467 | | 40 | | 24,467 | |
Equities - Information Technology | | — | | 13,423 | | — | | 13,423 | |
Equities - Materials | | — | | 14,798 | | — | | 14,798 | |
Equities - Telecommunication Services | | 1,422 | | 37,321 | | — | | 38,743 | |
Equities - Utilities | | — | | 21,095 | | — | | 21,095 | |
Cash & Cash Equivalent - Repurchase Agreement | | — | | 4,801 | | — | | 4,801 | |
Cash & Cash Equivalent - Securities Lending Collateral | | 13,967 | | — | | — | | 13,967 | |
Total | | $ | 30,481 | | $ | 294,353 | | $ | 40 | | $ | 324,874 | |
Level 3 Rollforward
Securities | | Beginning
Balance at
10/31/2008 | | Net
Purchases/(Sales) | | Accrued
Discounts/(Premiums) | | Total Realized
Gain/(Loss) | | Total Unrealized
Appreciation/(Depreciation) | | Net Transfers
In/(Out) of
Level 3 | | Ending
Balance at
10/31/2009 | |
Equities - Financials | | $ | — | | $ | ♦ | | $ | — | | $ | — | | $ | ♦ | | $ | — | | $ | ♦ | |
Foreign Equity - Industrials | | $ | — | | $ | 40 | | $ | — | | $ | — | | $ | ♦ | | $ | — | | $ | 40 | |
Total | | $ | — | | $ | 40 | | $ | — | | $ | — | | $ | ♦ | | $ | — | | $ | 40 | |
The notes to the financial statements are an integral part of this report.
50
Transamerica BlackRock Global Allocation
SCHEDULE OF INVESTMENTS
At October 31, 2009
(all amounts in thousands)
| | Principal | | Value | |
U.S. GOVERNMENT OBLIGATIONS - 9.5% | | | | | |
United States - 9.5% | | | | | |
U.S. Treasury Inflation Indexed Bond | | | | | |
2.38%, 01/15/2027 | | $ | 1,748 | | $ | 1,848 | |
U.S. Treasury Inflation Indexed Note | | | | | |
0.88%, 04/15/2010 | | 3,970 | | 3,980 | |
1.63%, 01/15/2018 | | 1,526 | | 1,563 | |
2.00%, 04/15/2012 - 01/15/2016 | | 3,654 | | 3,841 | |
2.38%, 04/15/2011 | | 3,963 | | 4,099 | |
2.50%, 07/15/2016 | | 7,129 | | 7,746 | |
U.S. Treasury Note | | | | | |
2.13%, 01/31/2010 | | 1,390 | | 1,397 | |
2.38%, 10/31/2014 Λ | | 5,146 | | 5,159 | |
2.63%, 02/29/2016 | | 1,405 | | 1,391 | |
2.75%, 02/15/2019 | | 2,845 | | 2,704 | |
2.88%, 06/30/2010 | | 2,797 | | 2,845 | |
4.88%, 05/31/2011 | | 5,650 | | 6,027 | |
Total U.S. Government Obligations (cost $41,195) | | | | 42,600 | |
| | | | | |
FOREIGN GOVERNMENT OBLIGATIONS - 8.8% | | | | | |
Australia - 0.2% | | | | | |
Australia Government Bond | | | | | |
5.75%, 06/15/2011 | | AUD | 1,145 | | 1,047 | |
Brazil - 1.4% | | | | | |
Brazil Notas Do Tesouro Nacional | | | | | |
10.00%, 01/01/2017 | | BRL | 12,015 | | 6,097 | |
Canada - 0.3% | | | | | |
Canadian Government Bond | | | | | |
4.00%, 09/01/2010 - 06/01/2016 | | CAD | 1,165 | | 1,124 | |
France - 0.1% | | | | | |
Caisse D’amortissement de La Dette Sociale | | | | | |
3.25%, 04/25/2013 | | EUR | 400 | | 607 | |
Germany - 3.4% | | | | | |
Bundesrepublik Deutschland | | | | | |
3.50%, 07/04/2019 | | EUR | 1,380 | | 2,074 | |
4.25%, 07/04/2017 | | EUR | 2,150 | | 3,433 | |
Bundesschatzanweisungen | | | | | |
4.75%, 06/11/2010 | | EUR | 1,339 | | 2,019 | |
Deutsche Bundesrepublik, TIPS | | | | | |
1.50%, 04/15/2016 | | EUR | 1,711 | | 2,586 | |
Federal Republic of Germany | | | | | |
1.50%, 09/21/2012 -144A | | $ | 1,600 | | 1,597 | |
4.00%, 07/04/2016 | | EUR | 2,250 | | 3,549 | |
Japan - 1.4% | | | | | |
Japanese Government Bond | | | | | |
0.70%, 09/15/2010 | | JPY | 74,450 | | 831 | |
Japanese Government CPI Linked Bond | | | | | |
0.80%, 09/10/2015 - 03/10/2016 | | JPY | 427,563 | | 4,391 | |
1.00%, 06/10/2016 | | JPY | 40,160 | | 413 | |
1.40%, 06/10/2018 | | JPY | 84,405 | | 872 | |
Malaysia - 0.4% | | | | | |
Malaysian Government Bond | | | | | |
3.76%, 04/28/2011 | | MYR | 3,400 | | 1,016 | |
3.87%, 04/13/2010 | | MYR | 2,850 | | 842 | |
Netherlands - 0.4% | | | | | |
Kingdom of the Netherlands | | | | | |
3.75%, 07/15/2014 | | EUR | 1,200 | | 1,860 | |
New Zealand - 0.1% | | | | | |
Republic of New Zealand, CPI Linked Bond | | | | | |
4.50%, 02/15/2016 | | NZD | 400 | | 422 | |
Poland - 0.2% | | | | | |
Republic of Poland, CPI Linked Bond | | | | | |
3.00%, 08/24/2016 | | PLN | 2,896 | | 961 | |
Ukraine - 0.0% | | | | | |
Republic of Ukraine | | | | | |
6.58%, 11/21/2016 Reg S | | $ | 100 | | | 74 | |
United Kingdom - 0.9% | | | | | |
United Kingdom | | | | | |
4.25%, 03/07/2011 | | GBP | 2,235 | | 3,834 | |
Total Foreign Government Obligations (cost $36,881) | | | | 39,649 | |
| | | | | |
ASSET-BACKED SECURITY - 0.0% | | | | | |
Cayman Islands - 0.0% | | | | | |
Latitude CLO, Ltd. | | | | | |
Series 2005-1I, Class SUB | | | | | |
0.01%, 12/15/2017 | | $ | 200 | | 2 | |
Total Asset-Backed Security (cost $177) | | | | | |
| | | | | |
CORPORATE DEBT SECURITIES - 4.3% | | | | | |
Bermuda - 0.1% | | | | | |
Noble Group, Ltd. | | | | | |
8.50%, 05/30/2013 -144A | | 375 | | 410 | |
Canada - 0.1% | | | | | |
Rogers Communications, Inc. | | | | | |
7.63%, 12/15/2011 | | CAD | 500 | | 510 | |
Sino-Forest Corp. | | | | | |
10.25%, 07/28/2014 -144A | | $ | 50 | | 53 | |
Cayman Islands - 0.5% | | | | | |
Chaoda Modern Agriculture Holdings, Ltd. | | | | | |
7.75%, 02/08/2010 Reg S | | 300 | | 294 | |
China Milk Products Group, Ltd. | | | | | |
Zero Coupon, 01/05/2012 | | 554 | | 666 | |
Cosan Finance, Ltd. | | | | | |
7.00%, 02/01/2017 -144A | | 90 | | 86 | |
DBS Capital Funding Corp. | | | | | |
7.66%, 03/31/2049 Reg S | | 42 | | 43 | |
Hutchison Whampoa International, Ltd. | | | | | |
5.45%, 11/24/2010 Reg S | | 300 | | 308 | |
6.25%, 11/24/2014 Reg S | | 200 | | 216 | |
Hutchison Whampoa, Ltd. | | | | | |
7.63%, 04/09/2019 -144A | | 400 | | 451 | |
Ireland - 0.4% | | | | | |
VIP Finance Ireland, Ltd. | | | | | |
8.38%, 04/30/2013 -144A | | 462 | | 474 | |
9.13%, 04/30/2018 -144A | | 1,358 | | 1,416 | |
Korea, Republic of - 0.2% | | | | | |
Korea Electric Power Corp. | | | | | |
5.13%, 04/23/2034 Reg S | | 579 | | 587 | |
7.95%, 04/01/2096 Ђ | | 448 | | 282 | |
Luxembourg - 1.0% | | | | | |
Alrosa Finance SA | | | | | |
8.88%, 11/17/2014 Reg S | | 401 | | 399 | |
Evraz Group SA | | | | | |
8.25%, 11/10/2015 Reg S | | 100 | | 97 | |
8.88%, 04/24/2013 -144A | | 300 | | 294 | |
9.50%, 04/24/2018 -144A | | 425 | | 419 | |
GAZ Capital SA | | | | | |
6.61%, 02/13/2018 | | EUR | 646 | | 964 | |
TNK-BP Finance SA | | | | | |
6.63%, 03/20/2017 -144A | | $ | 852 | | 812 | |
7.50%, 07/18/2016 -144A | | 200 | | 202 | |
7.88%, 03/13/2018 -144A | | 1,122 | | 1,135 | |
UBS Luxembourg SA | | | | | |
8.25%, 05/23/2016 Reg S | | 300 | | 304 | |
Malaysia - 0.2% | | | | | |
Johor Corp. | | | | | |
1.00%, 07/31/2012 § | | MYR | 2,896 | | 832 | |
| | | | | | | | |
The notes to the financial statements are an integral part of this report.
51
(all amounts except share amounts in thousands)
| | Principal | | Value | |
Netherlands - 0.3% | | | | | |
Kazmunaigaz Finance Sub BV | | | | | |
9.13%, 07/02/2018 -144A | | $ | 1,404 | | $ | 1,544 | |
Supranational - 0.1% | | | | | |
European Investment Bank | | | | | |
3.63%, 10/15/2011 | | EUR | 296 | | 453 | |
Trinidad and Tobago - 0.0% | | | | | |
Petroleum Co. of Trinidad & Tobago, Ltd. | | | | | |
9.75%, 08/14/2019 -144A | | $ | 185 | | 210 | |
United Arab Emirates - 0.4% | | | | | |
Abu Dhabi National Energy Co. | | | | | |
6.50%, 10/27/2036 Reg S | | 100 | | 97 | |
Nakheel Development, Ltd. | | | | | |
3.17%, 12/14/2009 | | 1,678 | | 1,800 | |
United States - 0.9% | | | | | |
Advanced Micro Devices, Inc. | | | | | |
7.75%, 11/01/2012 | | 19 | | 17 | |
Bumi Resources Tbk PT | | | | | |
10.59%, 10/08/2012 | | 500 | | 500 | |
General Electric Capital Corp. | | | | | |
0.37%, 01/15/2010 * | | JPY | 204,000 | | 2,263 | |
Pemex Project Funding Master Trust | | | | | |
5.50%, 02/24/2025 Reg S | | EUR | 860 | | 1,098 | |
Virgin Islands, British - 0.1% | | | | | |
Citic Resources Finance, Ltd. | | | | | |
6.75%, 05/15/2014 -144A | | $ | 331 | | 317 | |
Total Corporate Debt Securities (cost $16,749) | | | | 19,553 | |
| | | | | |
STRUCTURED NOTES DEBT - 0.0% | | | | | |
United States - 0.0% | | | | | |
Preferred Term Securities XXIV, Ltd. | | | | | |
03/22/2037 §± | | 350 | | ♦ | |
Preferred Term Securities XXV, Ltd. | | | | | |
03/22/2037 §± | | 175 | | ♦ | |
Preferred Term Securities XXVI, Ltd. | | | | | |
09/22/2037 -144A §± | | 190 | | ♦ | |
Preferred Term Securities XXVII, Ltd. | | | | | |
12/22/2037 Ə§± | | 200 | | ♦ | |
Total Structure Notes Debt (cost $905) | | | | ♦ | |
| | | | | |
CONVERTIBLE PREFERRED STOCKS - 0.4% | | | | | |
Bermuda - 0.0% | | | | | |
Bunge, Ltd. 4.88% ▲ | | 1,390 | | 113 | |
Cayman Islands - 0.0% | | | | | |
XL Capital, Ltd. 10.75% ▲ | | 4,470 | | 115 | |
United States - 0.4% | | | | | |
El Paso Corp. 4.99% ▲ | | 1,153 | | 1,007 | |
Mylan, Inc. 6.50% ▲ | | 272 | | 280 | |
NRG Energy, Inc. 4.00% ▲ | | 147 | | 169 | |
Total Convertible Preferred Stocks (cost $1,342) | | | | 1,684 | |
| | | | | |
PREFERRED STOCKS - 0.5% | | | | | |
Brazil - 0.4% | | | | | |
All America Latina Logistica SA 0.48% ▲ | | BRL | 14,000 | | 103 | |
Cia Brasileira de Distribuicao Grupo Pao de Acucar ‡ | | BRL | 1,547 | | 47 | |
Cia Brasileira de Distribuicao Grupo Pao de Acucar 0.49% ▲ | | BRL | 24,582 | | 744 | |
Itau Unibanco Holding SA 0.48% ▲ | | BRL | 11,100 | | 211 | |
NET Servicos de Comunicacao SA ‡ | | BRL | 12,100 | | 151 | |
Usinas Siderurgicas de Minas Gerais SA 1.02% ▲ | | BRL | 5,500 | | 144 | |
Vale SA 2.49% ▲ | | BRL | 22,600 | | 506 | |
France - 0.1% | | | | | |
Michelin ‡ | | EUR | 1,513 | | | 227 | |
Total Preferred Stocks (cost $1,812) | | | | 2,133 | |
| | | | | | | | |
| | Shares | | | |
COMMON STOCKS - 52.8% | | | | | |
Australia - 0.6% | | | | | |
BHP Billiton, Ltd. | | 36,200 | | 1,187 | |
CSL, Ltd. | | 12,900 | | 362 | |
Newcrest Mining, Ltd. | | 11,170 | | 321 | |
Telstra Corp., Ltd. | | 48,000 | | 143 | |
Transurban Group ‡Λ | | 19,075 | | 77 | |
Woodside Petroleum, Ltd. | | 12,200 | | 512 | |
Austria - 0.0% | | | | | |
Telekom Austria AG | | 10,900 | | 179 | |
Belgium - 0.1% | | | | | |
RHJ International -144A ‡ | | 17,100 | | 125 | |
RHJ International ‡ | | 50,600 | | 369 | |
Bermuda - 0.6% | | | | | |
Arch Capital Group, Ltd. ‡ | | 4,400 | | 296 | |
Axis Capital Holdings, Ltd. | | 300 | | 9 | |
Bunge, Ltd. | | 2,311 | | 132 | |
Cheung Kong Infrastructure Holdings, Ltd. | | 77,900 | | 275 | |
Cosan, Ltd. -Class A ‡ | | 41,200 | | 274 | |
Endurance Specialty Holdings, Ltd. | | 12,600 | | 454 | |
Everest RE Group, Ltd. | | 2,400 | | 210 | |
Katanga Mining, Ltd. ‡ | | 84,672 | | 57 | |
Nabors Industries, Ltd. ‡ | | 4,450 | | 93 | |
Noble Group, Ltd. | | 107,869 | | 197 | |
PartnerRe, Ltd. | | 2,500 | | 191 | |
Platinum Underwriters Holdings, Ltd. | | 5,300 | | 190 | |
RenaissanceRe Holdings, Ltd. | | 5,400 | | 284 | |
Validus Holdings, Ltd. | | 9,727 | | 246 | |
Brazil - 1.9% | | | | | |
Cia Energetica de Minas Gerais ADR Λ | | 7,767 | | 123 | |
Cyrela Brazil Realty SA | | 50,700 | | 648 | |
Global Village Telecom Holding SA ‡ | | 9,500 | | 272 | |
Hypermarcas SA ‡ | | 44,300 | | 907 | |
MRV Engenharia e Participacoes SA | | 16,000 | | 298 | |
Petroleo Brasileiro SA -Class A ADR | | 126,600 | | 5,139 | |
SLC Agricola SA | | 40,700 | | 307 | |
VIVO Participacoes SA ADR | | 31,000 | | 751 | |
Canada - 2.9% | | | | | |
Agrium, Inc. | | 700 | | 33 | |
Alamos Gold, Inc. ‡ | | 40,300 | | 322 | |
Barrick Gold Corp. | | 40,695 | | 1,462 | |
BCE, Inc. | | 1,400 | | 34 | |
Canadian Natural Resources, Ltd. | | 8,200 | | 531 | |
Canadian Pacific Railway, Ltd. | | 16,900 | | 731 | |
Eldorado Gold Corp. ‡Λ | | 63,000 | | 702 | |
EnCana Corp. | | 600 | | 33 | |
Goldcorp, Inc. | | 49,000 | | 1,801 | |
Golden Star Resources, Ltd. ‡ | | 23,800 | | 74 | |
Iamgold Corp. Λ | | 111,000 | | 1,460 | |
Kinross Gold Corp. | | 114,821 | | 2,133 | |
New Gold, Inc. ‡ | | 8,200 | | 30 | |
Nortel Networks Corp. ‡ | | 9,000 | | 1 | |
Rogers Communications, Inc. -Class B | | 28,400 | | 832 | |
Sino-Forest Corp. -Class A ‡ | | 38,300 | | 539 | |
Suncor Energy, Inc. ‡ | | 7,780 | | 258 | |
The notes to the financial statements are an integral part of this report.
52
| | Shares | | Value | |
Canada - (continued) | | | | | |
Talisman Energy, Inc. | | 5,200 | | $ | 88 | |
Teck Resources, Ltd. -Class B ‡ | | 1,500 | | 43 | |
TELUS Corp. ‡ | | 5,300 | | 166 | |
Thomson Reuters Corp. ‡ | | 700 | | 22 | |
Viterra, Inc. ‡ | | 16,000 | | 152 | |
Yamana Gold, Inc. | | 138,970 | | 1,474 | |
Cayman Islands - 0.5% | | | | | |
Bawang International Group Holding, Ltd. ‡ | | 20,300 | | 8 | |
Chaoda Modern Agriculture Holdings, Ltd. | | 960,114 | | 742 | |
Garmin, Ltd. Λ | | 900 | | 27 | |
Tianjin Port Development Holdings, Ltd. ‡ | | 529,600 | | 196 | |
XL Capital, Ltd. -Class A | | 76,800 | | 1,261 | |
Chile - 0.1% | | | | | |
Banco Santander Chile ADR | | 2,500 | | 132 | |
Sociedad Quimica y Minera de Chile SA ADR | | 6,000 | | 220 | |
China - 0.4% | | | | | |
China BlueChemical, Ltd. | | 224,400 | | 119 | |
China Communications Services Corp., Ltd. -Class H | | 5,000 | | 3 | |
China Life Insurance Co., Ltd. ADR | | 4,933 | | 339 | |
China Shenhua Energy Co., Ltd. -Class H | | 182800 | | 819 | |
China South Locomotive and Rolling Stock Corp. | | 129,900 | | 72 | |
Guangshen Railway Co., Ltd. | | 522,700 | | 212 | |
Huaneng Power International, Inc. -Class H | | 40,900 | | 26 | |
Jiangsu Expressway Co., Ltd. -Class H | | 44,700 | | 40 | |
Ping An Insurance Group Co. of China, Ltd. -Class H | | 20,600 | | 180 | |
Xiamen International Port Co., Ltd. -Class H | | 494,200 | | 91 | |
Cyprus - 0.0% | | | | | |
AFI Development PLC GDR | | 47,100 | | 108 | |
Egypt - 0.1% | | | | | |
Telecom Egypt | | 167,430 | | 541 | |
Finland - 0.0% | | | | | |
Fortum OYJ | | 8,978 | | 212 | |
France - 0.7% | | | | | |
AXA SA | | 8,000 | | 199 | |
AXA SA ADR | | 500 | | 12 | |
Cie Generale D’optique Essilor International SA Λ | | 13,500 | | 756 | |
France Telecom SA | | 35,600 | | 883 | |
Sanofi-Aventis SA | | 3,000 | | 220 | |
Sanofi-Aventis SA ADR | | 700 | | 26 | |
Thales SA | | 4,300 | | 208 | |
Total SA | | 13,708 | | 820 | |
Germany - 0.2% | | | | | |
Allianz SE | | 2,216 | | 254 | |
Bayer AG | | 5,171 | | 358 | |
Bayer AG ADR | | 300 | | 21 | |
Bayerische Motoren Werke AG | | 3,100 | | 152 | |
Guernsey, Channel Island - 0.0% | | | | | |
Amdocs, Ltd. ‡ | | 1,000 | | 25 | |
Hong Kong - 1.1% | | | | | |
Beijing Enterprises Holdings, Ltd. | | 288,789 | | 1,722 | |
Cheung Kong Holdings, Ltd. | | 25,500 | | 325 | |
China Mobile, Ltd. | | 47,700 | | 447 | |
Denway Motors, Ltd. | | 248,900 | | 119 | |
Hutchison Whampoa, Ltd. | | 57,600 | | 404 | |
Link REIT | | 305,600 | | 694 | |
Ports Design, Ltd. | | 1,300 | | 3 | |
Shanghai Industrial Holdings, Ltd. | | 18,500 | | 87 | |
Tianjin Development Holdings | | 1,061,900 | | 656 | |
Wharf Holdings, Ltd. | | 76,525 | | 415 | |
India - 0.7% | | | | | |
Adani Power, Ltd. ‡ | | 131,921 | | 273 | |
Bharat Heavy Electricals, Ltd. | | 14,300 | | 668 | |
Container Corp. of India | | 4,400 | | 102 | |
Hindustan Unilever, Ltd. | | 28,200 | | 167 | |
Housing Development Finance Corp. | | 4,900 | | 273 | |
Larsen & Toubro, Ltd. | | 10,000 | | 329 | |
Reliance Industries, Ltd. | | 19,700 | | 795 | |
State Bank of India, Ltd. | | 13,800 | | 634 | |
Indonesia - 0.1% | | | | | |
Bumi Resources Tbk PT | | 983,901 | | 237 | |
Ireland - 0.1% | | | | | |
Accenture PLC -Class A | | 900 | | 33 | |
Covidien PLC | | 8,525 | | 359 | |
Israel - 0.2% | | | | | |
Check Point Software Technologies ‡ | | 1,200 | | 37 | |
Ectel, Ltd. ‡ | | 4,795 | | 6 | |
Teva Pharmaceutical Industries, Ltd. ADR | | 15,240 | | 769 | |
Italy - 0.1% | | | | | |
Assicurazioni Generali SpA | | 3,800 | | 96 | |
Intesa Sanpaolo SpA ‡ | | 51,700 | | 217 | |
Japan - 6.4% | | | | | |
AIOI Insurance Co., Ltd. | | 195,000 | | 858 | |
Astellas Pharma, Inc. | | 10,600 | | 390 | |
Bank of Kyoto, Ltd. | | 31,300 | | 284 | |
Canon, Inc. | | 20,400 | | 769 | |
Coca-Cola Central Japan Co., Ltd. | | 7,925 | | 106 | |
Coca-Cola West Co., Ltd. | | 22,371 | | 416 | |
Daihatsu Motor Co., Ltd. | | 19,900 | | 204 | |
Daikin Industries, Ltd. | | 1,900 | | 64 | |
Daiwa House Industry Co., Ltd. | | 29,300 | | 313 | |
East Japan Railway Co. | | 13,767 | | 882 | |
Fanuc, Ltd. | | 1,500 | | 125 | |
Fuji Heavy Industries, Ltd. ‡ | | 47,000 | | 184 | |
Fujitsu, Ltd. | | 18,300 | | 108 | |
Futaba Industrial Co., Ltd. ‡Λ | | 24,700 | | 129 | |
Hitachi Chemical Co., Ltd. | | 16,200 | | 322 | |
Hokkaido Coca-Cola Bottling Co., Ltd. | | 6,800 | | 37 | |
Honda Motor Co., Ltd. | | 17,500 | | 540 | |
Hoya Corp. | | 30,400 | | 669 | |
JGC Corp. | | 33,000 | | 630 | |
KDDI Corp. | | 216 | | 1,146 | |
Kinden Corp. | | 23,000 | | 187 | |
Kirin Holdings Co., Ltd. | | 43,000 | | 702 | |
Kubota Corp. Λ | | 94,200 | | 732 | |
Kyowa Hakko Kirin Co., Ltd. | | 23,300 | | 269 | |
Mikuni Coca-Cola Bottling Co., Ltd. Λ | | 19,100 | | 161 | |
Mitsubishi Corp. | | 71,100 | | 1,507 | |
Mitsubishi Tanabe Pharma Corp. | | 13,000 | | 166 | |
Mitsui & Co., Ltd. | | 77,900 | | 1,023 | |
Mitsui Sumitomo Insurance Group Holdings, Inc. | | 16,600 | | 386 | |
| | | | | | |
The notes to the financial statements are an integral part of this report.
53
| | Shares | | Value | |
Japan - (continued) | | | | | |
Murata Manufacturing Co., Ltd. | | 9,000 | | $ | 439 | |
NGK Insulators, Ltd. | | 10,900 | | 244 | |
Nintendo Co., Ltd. | | 1,000 | | 251 | |
Nippon Sheet Glass Co., Ltd. | | 2,600 | | 8 | |
Nippon Telegraph & Telephone Corp. | | 11,400 | | 470 | |
Nipponkoa Insurance Co., Ltd. | | 117,100 | | 638 | |
Nomura Holdings, Inc. | | 47,300 | | 333 | |
NTT DoCoMo, Inc. | | 1,008 | | 1,462 | |
NTT Urban Development Corp. | | 155 | | 125 | |
Okumura Corp. | | 82,400 | | 287 | |
Panasonic Corp. Λ | | 2,800 | | 40 | |
Rinnai Corp. | | 3,700 | | 163 | |
ROHM Co., Ltd. | | 3,900 | | 259 | |
Sekisui House, Ltd. | | 74,000 | | 639 | |
Seven & I Holdings Co., Ltd. Λ | | 28,800 | | 630 | |
Shimachu Co., Ltd. | | 4,200 | | 99 | |
Shin-Etsu Chemical Co., Ltd. | | 21,800 | | 1,156 | |
Shionogi & Co., Ltd. | | 17,500 | | 378 | |
Sony Corp. ADR | | 300 | | 9 | |
Sumitomo Chemical Co., Ltd. | | 328,100 | | 1,307 | |
Sumitomo Electric Industries, Ltd. | | 8,800 | | 107 | |
Sumitomo Mitsui Financial Group, Inc. | | 14,100 | | 479 | |
Suzuki Motor Corp. | | 41,600 | | 1,006 | |
Tadano, Ltd. Λ | | 9,000 | | 43 | |
Takeda Pharmaceutical Co., Ltd. | | 6,700 | | 268 | |
TDK Corp. | | 2,300 | | 132 | |
Terumo Corp. | | 2,900 | | 153 | |
Toda Corp. | | 63,500 | | 212 | |
Toho Co., Ltd. | | 19,200 | | 289 | |
Tokio Marine Holdings, Inc. | | 56,200 | | 1,438 | |
Tokyo Gas Co., Ltd. Λ | | 155,000 | | 614 | |
Toyota Industries Corp. | | 23,500 | | 637 | |
Toyota Motor Corp. | | 11,700 | | 462 | |
UBE Industries, Ltd. | | 120,300 | | 310 | |
West Japan Railway Co. | | 90 | | 319 | |
Jersey, Channel Island - 0.0% | | | | | |
Shire PLC ADR | | 500 | | 27 | |
Kazakhstan - 0.3% | | | | | |
Kazmunaigas Exploration Production GDR ‡ | | 49,200 | | 1,162 | |
Korea, Republic of - 0.8% | | | | | |
Cheil Industries, Inc. | | 3,100 | | 116 | |
Korean Reinsurance Co. | | 4,574 | | 41 | |
KT Corp. ADR | | 28,900 | | 464 | |
KT&G Corp. | | 9,500 | | 553 | |
LS Cable, Ltd. | | 4,000 | | 327 | |
Meritz Fire & Marine Insurance Co., Ltd. ‡ | | 4,763 | | 33 | |
Paradise Co., Ltd. | | 26,639 | | 77 | |
POSCO | | 700 | | 290 | |
POSCO ADR | | 3,200 | | 327 | |
Samsung Electronics Co., Ltd. | | 1,250 | | 751 | |
Samsung Fine Chemicals Co., Ltd. | | 6,500 | | 258 | |
SK Telecom Co., Ltd. | | 1,100 | | 168 | |
Luxembourg - 0.0% | | | | | |
ArcelorMittal | | 531 | | 18 | |
Millicom International Cellular SA ‡ | | 500 | | 31 | |
Malaysia - 0.3% | | | | | |
Axiata Group BHD ‡ | | 193,500 | | 165 | |
British American Tobacco Malaysia BHD ‡ | | 18,300 | | 240 | |
Genting Malaysia BHD | | 119,294 | | 95 | |
IOI Corp. BHD | | 298,030 | | 462 | |
Plus Expressways BHD | | 57,000 | | 55 | |
Telekom Malaysia BHD | | 86,000 | | 76 | |
Tenaga Nasional BHD | | 137,657 | | 337 | |
Mexico - 0.1% | | | | | |
America Movil SAB de CV-Series L ADR | | 10,800 | | 477 | |
Fomento Economico Mexicano SAB de CV ADR | | 4,000 | | 173 | |
Netherlands - 0.1% | | | | | |
Koninklijke KPN NV | | 25,555 | | 464 | |
Koninklijke Philips Electronics NV -Class Y | | 1,200 | | 30 | |
Unilever NV | | 5,700 | | 176 | |
Netherlands Antilles - 0.2% | | | | | |
Schlumberger, Ltd. | | 12,600 | | 784 | |
Norway - 0.1% | | | | | |
Statoil ASA | | 20,100 | | 474 | |
Panama - 0.1% | | | | | |
McDermott International, Inc. ‡ | | 27,300 | | 607 | |
Philippines - 0.0% | | | | | |
First Gen Corp. ‡ | | 18,000 | | 6 | |
Russian Federation - 1.2% | | | | | |
Gazprom OAO ADR | | 20,800 | | 499 | |
Kuzbassrazrezugol ‡ | | 820,060 | | 209 | |
MMC Norilsk Nickel ADR ‡ | | 39,234 | | 515 | |
Novorossiysk Commercial Sea Port GDR | | 83,200 | | 950 | |
Polyus Gold Co. ADR | | 21,000 | | 562 | |
Rosneft Oil Co. ‡ | | 27,600 | | 210 | |
Rushydro ‡ | | 1,050,759 | | 36 | |
Rushydro ADR ‡ | | 308,946 | | 1,099 | |
Sberbank of Russian Federation | | 419,500 | | 930 | |
Surgutneftegaz ADR | | 22,700 | | 200 | |
Uralkali GDR ‡ | | 1,400 | | 32 | |
Singapore - 0.7% | | | | | |
Capitaland, Ltd. | | 16,350 | | 47 | |
Fraser and Neave, Ltd. | | 127,800 | | 348 | |
Keppel Corp., Ltd. | | 129,100 | | 742 | |
MobileOne, Ltd. | | 158,030 | | 195 | |
Oversea-Chinese Banking Corp. | | 80,000 | | 431 | |
Parkway Holdings, Ltd. | | 195,620 | | 349 | |
Parkway Life REIT ‡ | | 6,732 | | 6 | |
SembCorp Marine, Ltd. | | 68,100 | | 166 | |
Singapore Press Holdings, Ltd. Λ | | 63,000 | | 173 | |
Singapore Telecommunications, Ltd. | | 340,550 | | 706 | |
South Africa - 0.1% | | | | | |
Anglo Platinum, Ltd. ‡ | | 1,300 | | 112 | |
Gold Fields, Ltd. ADR | | 9,300 | | 119 | |
Impala Platinum Holdings, Ltd. | | 4,900 | | 108 | |
Sasol, Ltd. | | 3,200 | | 120 | |
Spain - 0.3% | | | | | |
Iberdrola Renovables SA | | 29,300 | | 130 | |
Telefonica SA | | 26,698 | | 746 | |
Telefonica SA ADR | | 4,000 | | 336 | |
Switzerland - 1.4% | | | | | |
ACE, Ltd. ‡ | | 29,800 | | 1,531 | |
Credit Suisse Group AG | | 7,180 | | 384 | |
Foster Wheeler AG ‡ | | 12,964 | | 363 | |
Nestle SA | | 32,748 | | 1,523 | |
Noble Corp. | | 700 | | 29 | |
| | | | | | |
The notes to the financial statements are an integral part of this report.
54
| | Shares | | Value | |
Switzerland - (continued) | | | | | |
Novartis AG | | 7,188 | | $ | 374 | |
Roche Holding AG | | 2,801 | | 449 | |
Transocean, Ltd. ‡ | | 4,713 | | 395 | |
Tyco Electronics, Ltd. | | 6,525 | | 139 | |
Tyco International, Ltd. | | 5,525 | | 185 | |
UBS AG ‡ | | 19,400 | | 323 | |
Weatherford International, Ltd. ‡ | | 7,900 | | 138 | |
Zurich Financial Services AG | | 2,519 | | 577 | |
Taiwan - 0.8% | | | | | |
Asustek Computer, Inc. | | 104,116 | | 191 | |
Catcher Technology Co., Ltd. | | 34,100 | | 83 | |
Chunghwa Telecom Co., Ltd. ADR | | 33,537 | | 583 | |
Chunghwa Telecom Co., Ltd. | | 161,036 | | 283 | |
Compal Electronics, Inc. | | 74,000 | | 93 | |
Delta Electronics, Inc. | | 157,541 | | 437 | |
Far EasTone Telecommunications Co., Ltd. | | 122,000 | | 137 | |
High Tech Computer Corp. | | 30,250 | | 300 | |
Hon Hai Precision Industry Co., Ltd. | | 73,252 | | 287 | |
Mediatek, Inc. | | 6,000 | | 84 | |
Taiwan Cement Corp. | | 354,960 | | 364 | |
Taiwan Semiconductor Manufacturing Co., Ltd. | | 298,888 | | 542 | |
Thailand - 0.2% | | | | | |
Hana Microelectronics PCL | | 173,200 | | 96 | |
PTT PCL | | 54,600 | | 392 | |
Siam Commercial Bank PCL | | 186,900 | | 425 | |
United Kingdom - 1.8% | | | | | |
Antofagasta PLC | | 13,000 | | 164 | |
AstraZeneca PLC ADR Λ | | 400 | | 18 | |
BP PLC | | 92,211 | | 864 | |
BP PLC ADR | | 17,900 | | 1,014 | |
British American Tobacco PLC | | 14,125 | | 450 | |
Diageo PLC ADR | | 18,500 | | 1,203 | |
Guinness Peat Group PLC | | 463,094 | | 280 | |
HSBC Holdings PLC | | 163,300 | | 1,803 | |
HSBC Holdings PLC ADR | | 6,100 | | 338 | |
Lloyds TSB Group PLC ‡ | | 72,200 | | 102 | |
Prudential PLC | | 11,000 | | 100 | |
Standard Chartered PLC | | 5,500 | | 135 | |
Unilever PLC ADR | | 6,700 | | 200 | |
Unilever PLC | | 13,386 | | 400 | |
Vodafone Group PLC ADR | | 21,461 | | 476 | |
Vodafone Group PLC | | 326,122 | | 719 | |
United States - 27.5% | | | | | |
3Com Corp. ‡ | | 108,000 | | 555 | |
3M Co. | | 10,900 | | 802 | |
Abbott Laboratories | | 27,700 | | 1,401 | |
Advance Auto Parts, Inc. | | 500 | | 19 | |
AES Corp. ‡ | | 2,300 | | 30 | |
Aetna, Inc. | | 28,450 | | 741 | |
Affiliated Computer Services, Inc. -Class A ‡ | | 1,500 | | 78 | |
Alliance Resource Partners, LP | | 5,700 | | 214 | |
Allstate Corp. | | 7,000 | | 207 | |
Altria Group, Inc. | | 27,000 | | 489 | |
American Commercial Lines, Inc. ‡Λ | | 10,225 | | 219 | |
American Water Works Co., Inc. | | 5,700 | | 108 | |
AmerisourceBergen Corp. -Class A | | 6,400 | | 142 | |
Amgen, Inc. ‡ | | 11,400 | | 613 | |
Amphenol Corp. -Class A | | 1,900 | | 77 | |
Anadarko Petroleum Corp. | | 11,900 | | 725 | |
Analog Devices, Inc. | | 3,200 | | 82 | |
Apache Corp. | | 7,700 | | 725 | |
Apple, Inc. ‡D | | 5,600 | | 1,056 | |
Archer-Daniels-Midland Co. | | 600 | | 18 | |
Ascent Media Corp. ‡ | | 50 | | 1 | |
AT&T, Inc. | | 133,530 | | 3,427 | |
Autoliv, Inc. | | 400 | | 14 | |
Avnet, Inc. ‡ | | 300 | | 7 | |
Avon Products, Inc. D | | 9,000 | | 288 | |
Bank of America Corp. D | | 110,000 | | 1,604 | |
Bank of New York Mellon Corp. | | 62,381 | | 1,662 | |
Baxter International, Inc. | | 4,200 | | 227 | |
Beckman Coulter, Inc. | | 500 | | 32 | |
Biogen Idec, Inc. ‡ | | 700 | | 29 | |
Biosante Pharmaceuticals, Inc. ‡Λ | | 1,774 | | 3 | |
BMC Software, Inc. ‡ | | 2,000 | | 74 | |
Boeing Co. | | 23,600 | | 1,128 | |
Boston Scientific Corp. ‡ | | 14,300 | | 116 | |
Bristol-Myers Squibb Co. | | 178,700 | | 3,895 | |
Broadcom Corp. -Class A ‡ | | 6,200 | | 165 | |
Burlington Northern Santa Fe Corp. D | | 21,300 | | 1,604 | |
CA, Inc. | | 45,400 | | 950 | |
Calpine Corp. ‡ | | 1,800 | | 20 | |
CenturyTel, Inc. | | 2,629 | | 85 | |
CF Industries Holdings, Inc. | | 300 | | 25 | |
Chesapeake Energy Corp. | | 3,500 | | 86 | |
Chevron Corp. | | 37,900 | | 2,901 | |
Chipotle Mexican Grill, Inc. -Class A ‡ | | 700 | | 57 | |
Chubb Corp. | | 11,400 | | 553 | |
Cigna Corp. D | | 17,200 | | 479 | |
Circuit City Stores, Inc. ‡Λ | | 12,400 | | ♦ | |
Cisco Systems, Inc. ‡ | | 76,900 | | 1,758 | |
Citigroup, Inc. | | 75,584 | | 309 | |
CMS Energy Corp. | | 10,100 | | 134 | |
CNA Financial Corp. ‡Λ | | 200 | | 4 | |
CNX Gas Corp. ‡ | | 6,100 | | 170 | |
Coca-Cola Co. | | 8,000 | | 426 | |
Cognizant Technology Solutions Corp. -Class A ‡ | | 3,200 | | 124 | |
Comcast Corp. -Class A | | 88,450 | | 1,284 | |
Comerica, Inc. | | 1,200 | | 33 | |
Complete Production Services, Inc. ‡D | | 25,800 | | 246 | |
Computer Sciences Corp. ‡ | | 2,700 | | 137 | |
Comverse Technology, Inc. ‡ | | 36,600 | | 307 | |
ConAgra Foods, Inc. | | 8,300 | | 174 | |
ConocoPhillips | | 28,800 | | 1,445 | |
Consol Energy, Inc. D | | 38,500 | | 1,648 | |
Constellation Brands, Inc. -Class A ‡ | | 5,800 | | 92 | |
Corning, Inc. D | | 95,900 | | 1,401 | |
Crown Holdings, Inc. ‡ | | 8,700 | | 232 | |
CVS Caremark Corp. | | 15,100 | | 533 | |
DaVita, Inc. ‡ | | 6,100 | | 323 | |
Dell, Inc. ‡ | | 19,000 | | 275 | |
Devon Energy Corp. | | 11,200 | | 725 | |
Discovery Communications, Inc. ‡ | | 1,000 | | 26 | |
Dish Network Corp. -Class A ‡ | | 8,700 | | 151 | |
| | | | | | |
The notes to the financial statements are an integral part of this report.
55
| | Shares | | Value | |
United States - (continued) | | | | | |
Dover Corp. | | 500 | | $ | 19 | |
Dow Chemical Co. | | 30,700 | | 721 | |
Dr. Pepper Snapple Group, Inc. ‡ | | 5,668 | | 155 | |
Eaton Corp. | | 600 | | 36 | |
eBay, Inc. ‡ | | 15,700 | | 350 | |
Edison International | | 600 | | 19 | |
EI du Pont de Nemours & Co. | | 21,300 | | 678 | |
El Paso Corp. | | 74,973 | | 735 | |
Electronic Arts, Inc. ‡ | | 25,200 | | 460 | |
Eli Lilly & Co. | | 9,900 | | 337 | |
EMC Corp./Massachusetts ‡ | | 35,400 | | 583 | |
Endo Pharmaceuticals Holdings, Inc. ‡ | | 2,700 | | 60 | |
Entergy Corp. | | 6,800 | | 522 | |
Exelon Corp. | | 9,100 | | 427 | |
Extreme Networks ‡ | | 989 | | 2 | |
Exxon Mobil Corp. | | 51,500 | | 3,690 | |
Fairpoint Communications, Inc. Λ | | 774 | | ♦ | |
Family Dollar Stores, Inc. | | 600 | | 17 | |
Fidelity National Financial, Inc. -Class A | | 46,700 | | 634 | |
Fidelity National Information Services, Inc. | | 3,300 | | 72 | |
Fluor Corp. | | 400 | | 18 | |
FMC Corp. | | 12,000 | | 613 | |
Forest Laboratories, Inc. ‡ | | 3,900 | | 108 | |
FPL Group, Inc. | | 15,000 | | 737 | |
Freeport-McMoRan Copper & Gold, Inc. ‡ | | 9,430 | | 692 | |
Gap, Inc. | | 1,200 | | 26 | |
General Communication, Inc. -Class A ‡ | | 9,400 | | 58 | |
General Dynamics Corp. | | 1,300 | | 82 | |
General Electric Co. | | 78,020 | | 1,113 | |
General Mills, Inc. | | 5,700 | | 376 | |
Genzyme Corp. ‡ | | 11,500 | | 582 | |
Gilead Sciences, Inc. ‡ | | 8,500 | | 362 | |
Global Industries, Ltd. ‡ | | 70,500 | | 514 | |
Global Payments, Inc. | | 700 | | 34 | |
Goldman Sachs Group, Inc. | | 4,200 | | 715 | |
Goodrich Corp. | | 400 | | 22 | |
Google, Inc. -Class A ‡ | | 3,540 | | 1,898 | |
Halliburton Co. | | 13,180 | | 385 | |
Hanesbrands, Inc. ‡ | | 762 | | 16 | |
Harris Corp. | | 1,400 | | 58 | |
Healthsouth Corp. ‡ | | 8,720 | | 127 | |
Hess Corp. | | 8,600 | | 471 | |
Hewitt Associates, Inc. -Class A ‡ | | 900 | | 32 | |
Hewlett-Packard Co. | | 26,700 | | 1,267 | |
HJ Heinz Co. | | 5,700 | | 229 | |
Hologic, Inc. ‡ | | 58,000 | | 857 | |
Humana, Inc. ‡D | | 22,100 | | 831 | |
Intel Corp. | | 49,100 | | 939 | |
International Business Machines Corp. | | 23,100 | | 2,786 | |
International Game Technology | | 25,400 | | 453 | |
International Paper Co. | | 7,700 | | 172 | |
JDS Uniphase Corp. ‡ | | 4,525 | | 25 | |
Johnson & Johnson | | 52,900 | | 3,124 | |
JPMorgan Chase & Co. D | | 74,800 | | 3,124 | |
KBR, Inc. | | 10,675 | | 218 | |
Key Energy Services, Inc. ‡ | | 8,200 | | 60 | |
King Pharmaceuticals, Inc. ‡ | | 4,000 | | 41 | |
Kraft Foods, Inc. -Class A | | 41,903 | | 1,154 | |
L-3 Communications Holdings, Inc. | | 100 | | 7 | |
Lexmark International, Inc. -Class A ‡ | | 11,700 | | 298 | |
Liberty Media Corp. - Capital ‡ | | 4 | | ♦ | |
Liberty Media Corp. - Entertainment ‡ | | 16 | | ♦ | |
Liberty Media Corp. - Interactive ‡ | | 662 | | 8 | |
Life Technologies Corp. ‡ | | 5,100 | | 241 | |
Lockheed Martin Corp. | | 6,400 | | 440 | |
LSI Corp. ‡ | | 3,168 | | 16 | |
Lubrizol Corp. | | 500 | | 33 | |
Manpower, Inc. | | 100 | | 5 | |
Marathon Oil Corp. | | 28,300 | | 905 | |
Marsh & McLennan Cos., Inc. | | 1,400 | | 33 | |
Mattel, Inc. | | 20,100 | | 380 | |
McDonald’s Corp. | | 9,000 | | 528 | |
McGraw-Hill Cos., Inc. | | 700 | | 20 | |
McKesson Corp. | | 6,500 | | 382 | |
Mead Johnson Nutrition Co. -Class A | | 8,300 | | 349 | |
MeadWestvaco Corp. | | 1,400 | | 32 | |
Medco Health Solutions, Inc. ‡ | | 10,200 | | 572 | |
Medtronic, Inc. | | 34,300 | | 1,225 | |
Memc Electronic Materials, Inc. ‡ | | 2,400 | | 30 | |
Merck & Co., Inc. | | 40,300 | | 1,246 | |
MetLife, Inc. D | | 8,400 | | 286 | |
Mettler-Toledo International, Inc. ‡ | | 1,850 | | 180 | |
Microsoft Corp. D | | 177,600 | | 4,925 | |
Morgan Stanley | | 18,700 | | 601 | |
Motorola, Inc. | | 65,200 | | 559 | |
Murphy Oil Corp. | | 3,700 | | 226 | |
Mylan, Inc. ‡ | | 18,273 | | 297 | |
National Oilwell Varco, Inc. ‡ | | 17,320 | | 710 | |
National Semiconductor Corp. | | 2,700 | | 35 | |
Newmont Mining Corp. | | 33,400 | | 1,451 | |
News Corp. -Class A | | 31,100 | | 358 | |
Noble Energy, Inc. | | 200 | | 13 | |
Northern Trust Corp. | | 20,900 | | 1,050 | |
Northrop Grumman Corp. | | 700 | | 35 | |
Novell, Inc. ‡ | | 7,700 | | 31 | |
NRG Energy, Inc. ‡ | | 600 | | 14 | |
Occidental Petroleum Corp. | | 12,800 | | 971 | |
Oracle Corp. | | 70,000 | | 1,477 | |
Pall Corp. | | 1,500 | | 48 | |
PepsiAmericas, Inc. | | 2,400 | | 70 | |
PerkinElmer, Inc. | | 6,700 | | 125 | |
Perrigo Co. | | 6,100 | | 227 | |
Pfizer, Inc. | | 152,308 | | 2,594 | |
PharMerica Corp. ‡ | | 283 | | 4 | |
Philip Morris International, Inc. | | 16,800 | | 795 | |
Pitney Bowes, Inc. | | 1,400 | | 34 | |
Polycom, Inc. ‡D | | 29,800 | | 640 | |
PPL Corp. | | 8,900 | | 262 | |
Praxair, Inc. | | 2,310 | | 184 | |
Precision Castparts Corp. | | 5,400 | | 516 | |
Pride International, Inc. ‡ | | 800 | | 24 | |
Principal Financial Group, Inc. | | 6,500 | | 163 | |
Procter & Gamble Co. | | 36,600 | | 2,123 | |
Progressive Corp. ‡ | | 15,000 | | 240 | |
QUALCOMM, Inc. | | 21,500 | | 890 | |
| | | | | | |
The notes to the financial statements are an integral part of this report.
56
| | Shares | | Value | |
United States - (continued) | | | | | |
Qwest Communications International, Inc. | | 127,000 | | $ | 456 | |
Ralcorp Holdings, Inc. ‡ | | 1,210 | | 65 | |
Reynolds American, Inc. | | 300 | | 15 | |
Ross Stores, Inc. | | 600 | | 26 | |
RR Donnelley & Sons Co. | | 1,700 | | 34 | |
Ryder System, Inc. | | 700 | | 28 | |
Safeway, Inc. | | 800 | | 18 | |
Sara Lee Corp. | | 62,700 | | 708 | |
Schering-Plough Corp. | | 41,600 | | 1,173 | |
Seahawk Drilling, Inc. ‡ | | 53 | | 1 | |
Smith International, Inc. | | 3,000 | | 83 | |
Southern Co. | | 3,500 | | 109 | |
Spirit Aerosystems Holdings, Inc. -Class A ‡ | | 36,700 | | 584 | |
Sprint Nextel Corp. ‡ | | 49,700 | | 147 | |
St. Joe Co. ‡ | | 17,000 | | 407 | |
State Street Corp. | | 8,400 | | 353 | |
Stone Energy Corp. ‡ | | 2,700 | | 41 | |
Sun Microsystems, Inc. ‡ | | 15,050 | | 123 | |
SUPERVALU, Inc. | | 2,972 | | 47 | |
Synopsys, Inc. ‡ | | 1,500 | | 33 | |
Tellabs, Inc. ‡ | | 3,800 | | 23 | |
Teradata Corp. ‡ | | 2,400 | | 67 | |
Texas Instruments, Inc. | | 22,600 | | 530 | |
Thermo Fisher Scientific, Inc. ‡ | | 9,100 | | 410 | |
Time Warner Cable, Inc. | | 2,058 | | 81 | |
Time Warner, Inc. | | 8,200 | | 247 | |
Total System Services, Inc. | | 3,500 | | 56 | |
Transatlantic Holdings, Inc. | | 3,000 | | 152 | |
Travelers Cos., Inc. | | 21,000 | | 1,045 | |
U.S. Bancorp | | 45,400 | | 1,054 | |
Unifi, Inc. ‡ | | 23,300 | | 65 | |
Union Pacific Corp. | | 27,000 | | 1,489 | |
United Technologies Corp. | | 3,200 | | 197 | |
UnitedHealth Group, Inc. D | | 37,300 | | 968 | |
Unum Group | | 1,000 | | 20 | |
URS Corp. ‡ | | 400 | | 16 | |
VeriSign, Inc. ‡ | | 1,100 | | 25 | |
Verizon Communications, Inc. | | 88,200 | | 2,610 | |
Viacom, Inc. -Class B ‡ | | 32,600 | | 899 | |
WABCO Holdings, Inc. | | 100 | | 2 | |
Wal-Mart Stores, Inc. | | 39,500 | | 1,962 | |
Waters Corp. ‡ | | 7,300 | | 418 | |
WellPoint, Inc. ‡D | | 19,550 | | 914 | |
Wells Fargo & Co. | | 64,900 | | 1,787 | |
Western Digital Corp. ‡ | | 4,000 | | 135 | |
Western Union Co. | | 10,200 | | 185 | |
Windstream Corp. | | 7,322 | | 71 | |
Xerox Corp. D | | 105,400 | | 793 | |
Xilinx, Inc. | | 800 | | 17 | |
XTO Energy, Inc. | | 10,800 | | 449 | |
Total Common Stocks (cost $244,934) | | | | 237,298 | |
| | | | | |
INVESTMENT COMPANIES - 3.4% | | | | | |
Cayman Islands - 0.0% | | | | | |
Dragon Capital - Vietnam Enterprise Investments, Ltd. | | 51,468 | | 174 | |
United States - 3.3% | | | | | |
Consumer Staples Select Sector SPDR Fund Λ | | 20,500 | | 530 | |
Financial Select Sector SPDR Fund Λ | | 152,500 | | 2,138 | |
Health Care Select Sector SPDR Fund Λ | | 20,500 | | 575 | |
iShares Dow Jones US Telecommunications Sector Index Fund | | 11,300 | | 196 | |
iShares Silver Trust Λ | | 82,700 | | 1,329 | |
SPDR Gold Trust | | 73,582 | | 7,543 | |
SPDR KBW Bank Trust Λ | | 3,800 | | 79 | |
Technology Select Sector Λ | | 53,800 | | 1,109 | |
Telecom HOLDRs Trust Λ | | 4,600 | | 106 | |
Utilities Select Sector SPDR Fund | | 40,800 | | 1,158 | |
Vanguard Telecommunication Services ETF | | 400 | | 20 | |
Vietnam - 0.1% | | | | | |
Vinaland, Ltd. | | 436,400 | | 373 | |
Total Investment Companies (cost $13,589) | | | | 15,330 | |
| | | | | |
RIGHTS - 0.0% | | | | | |
Brazil - 0.0% | | | | | |
All America Latina Logistica SA ‡Ə | | 262 | | 1 | |
Total Rights (cost $0) | | | | | |
| | | | | |
| | Notional
Amount | | | |
PURCHASED OPTIONS - 0.0% | | | | | |
Call Options - 0.0% | | | | | |
General Motors Corp. | | $ | 25,800 | | ♦ | |
Call Strike $60.00 | | | | | |
Expires 01/16/2010 | | | | | |
OTC AUD vs USD Currency | | 480,000 | | 3 | |
Call Strike $0.78 | | | | | |
Expires 12/17/2009 | | | | | |
Put Options - 0.0% | | | | | |
S&P 500 Index | | 1,400 | | 13 | |
Put Strike $900.00 | | | | | |
Expires 12/19/2009 | | | | | |
Total Purchased Options (cost $188) | | | | 16 | |
| | | | | |
| | Principal | | | |
CONVERTIBLE BONDS - 11.4% | | | | | |
Bermuda - 0.4% | | | | | |
Gome Electrical Appliances Holdings, Ltd. | | | | | |
Zero Coupon, 05/18/2014 | | CNY | 8,100 | | 1,165 | |
Pine Agritech, Ltd. | | | | | |
Zero Coupon, 07/27/2012 | | CNY | 6,500 | | 835 | |
Canada - 0.3% | | | | | |
Sino-Forest Corp. | | | | | |
5.00%, 08/01/2013-144A § | | $ | 1,125 | | 1,188 | |
Cayman Islands - 1.4% | | | | | |
FU JI Food and Catering Services Holdings, Ltd. | | | | | |
Zero Coupon, 10/18/2010 Џ | | CNY | 2,700 | | 43 | |
Subsea 7, Inc. | | | | | |
Zero Coupon, 06/29/2017 | | $ | 200 | | 197 | |
2.80%, 06/06/2011 | | 500 | | 472 | |
| | | | | | | | | |
The notes to the financial statements are an integral part of this report.
57
(all amounts in thousands)
| | Principal | | Value | |
Cayman Islands - (continued) | | | | | |
Transocean, Inc. | | | | | |
1.50%, 12/15/2037 | | $ | 2,168 | | $ | 2,599 | |
1.63%, 12/15/2037 | | 1,006 | | 985 | |
YTL Power Finance Cayman, Ltd. | | | | | |
Zero Coupon, 05/09/2010 | | 500 | | 612 | |
Zeus Cayman | | | | | |
Zero Coupon, 07/08/2013 | | JPY | 127,000 | | 1,362 | |
China - 0.2% | | | | | |
China Petroleum & Chemical Corp. | | | | | |
Zero Coupon, 04/24/2014 | | HKD | 4,860 | | 682 | |
Germany - 0.6% | | | | | |
Kreditanstalt Fuer Wiederaufbau | | | | | |
0.50%, 02/03/2010 | | EUR | 650 | | 950 | |
3.25%, 06/27/2013 | | EUR | 1,200 | | 1,837 | |
Hong Kong - 0.0% | | | | | |
Hongkong Land CB 2005, Ltd. | | | | | |
2.75%, 12/21/2012 Reg S | | $ | 100 | | 131 | |
India - 1.4% | | | | | |
Gujarat NRE Coke, Ltd. | | | | | |
Zero Coupon, 04/12/2011 | | 200 | | 267 | |
Housing Development Finance Corp. | | | | | |
Zero Coupon, 09/27/2010 | | 300 | | 530 | |
Punj Lloyd, Ltd. | | | | | |
Zero Coupon, 04/08/2011 | | 500 | | 555 | |
Ranbaxy Laboratories, Ltd. | | | | | |
Zero Coupon, 03/18/2011 | | 327 | | 377 | |
Reliance Communications, Ltd. | | | | | |
Zero Coupon, 05/10/2011 | | 550 | | 611 | |
Zero Coupon, 03/06/2012 | | 1,500 | | 1,530 | |
Suzlon Energy, Ltd. | | | | | |
Zero Coupon, 06/12/2012 | | 325 | | 328 | |
Zero Coupon, 07/25/2014 | | 592 | | 524 | |
Zero Coupon, 10/11/2012 | | 500 | | 505 | |
Tata Motors, Ltd. | | | | | |
1.00%, 04/27/2011 | | 450 | | 497 | |
Tata Steel, Ltd. | | | | | |
1.00%, 09/05/2012 | | 400 | | 437 | |
Japan - 0.2% | | | | | |
Bank of Kyoto, Ltd. | | | | | |
Zero Coupon, 03/31/2014 | | JPY | 15,000 | | 167 | |
Nagoya Railroad Co., Ltd. | | | | | |
Zero Coupon, 03/30/2012 | | JPY | 3,000 | | 34 | |
Suzuki Motor Corp. | | | | | |
Zero Coupon, 03/29/2013 | | JPY | 75,000 | | 856 | |
Jersey, Channel Island - 0.9% | | | | | |
Aldar Funding, Ltd. | | | | | |
5.77%, 11/10/2011 | | $ | 225 | | 253 | |
Dana Gas Sukuk, Ltd. | | | | | |
7.50%, 10/31/2012 | | 3,090 | | 2,937 | |
Shire PLC | | | | | |
2.75%, 05/09/2014 | | 1,000 | | 934 | |
Korea, Republic of - 0.1% | | | | | |
Korea Electric Power Corp. | | | | | |
Zero Coupon, 11/23/2011 | | JPY | 50,000 | | 545 | |
Luxembourg - 0.0% | | | | | |
Acergy SA | | | | | |
2.25%, 10/11/2013 | | $ | 100 | | 92 | |
Malaysia - 0.9% | | | | | |
Berjaya Land BHD | | | | | |
8.00%, 08/15/2011 | | MYR | 1,240 | | 368 | |
Cherating Capital, Ltd. * | | | | | |
2.00%, 07/05/2012 | | $ | 500 | | 556 | |
Feringghi Capital, Ltd. | | | | | |
Zero Coupon, 12/22/2009 Reg S | | 300 | | 345 | |
IOI Capital BHD | | | | | |
Zero Coupon, 12/18/2011 | | 575 | | 694 | |
IOI Resources Labuan BHD | | | | | |
Zero Coupon, 01/15/2013 | | 650 | | 633 | |
Paka Capital, Ltd. | | | | | |
Zero Coupon, 03/12/2013 | | 200 | | 199 | |
Rafflesia Capital, Ltd. * | | | | | |
1.25%, 10/04/2011 | | 1,000 | | 1,190 | |
Netherlands - 0.2% | | | | | |
Heidelberg International Finance BV | | | | | |
0.88%, 02/09/2012 | | EUR | 200 | | 321 | |
Pargesa Netherlands NV | | | | | |
1.75%, 06/15/2014 | | CHF | 475 | | 415 | |
Singapore - 1.1% | | | | | |
Capitaland, Ltd. | | | | | |
2.10%, 11/15/2016 | | SGD | 1,000 | | 690 | |
2.95%, 06/20/2022 | | SGD | 2,000 | | 1,155 | |
3.13%, 03/05/2018 | | SGD | 1,500 | | 1,024 | |
Keppel Land, Ltd. | | | | | |
2.50%, 06/23/2013 | | SGD | 400 | | 283 | |
Olam International, Ltd. | | | | | |
6.00%, 10/15/2016 | | $ | 400 | | 446 | |
Wilmar International, Ltd. | | | | | |
Zero Coupon, 12/18/2012 | | 500 | | 640 | |
Yanlord Land Group, Ltd. | | | | | |
5.85%, 07/13/2014 | | SGD | 1,000 | | 775 | |
United Arab Emirates - 0.2% | | | | | |
Nakheel Development 2, Ltd. | | | | | |
2.75%, 01/16/2011 | | $ | 880 | | 761 | |
United States - 3.5% | | | | | |
Advanced Micro Devices, Inc. | | | | | |
6.00%, 05/01/2015 | | 4,965 | | 3,613 | |
Amgen, Inc. | | | | | |
0.38%, 02/01/2013 | | 1,631 | | 1,604 | |
Archer-Daniels-Midland Co. | | | | | |
0.88%, 02/15/2014 | | 319 | | 322 | |
Cell Genesys, Inc. | | | | | |
3.13%, 05/01/2013 Ə | | 21 | | 9 | |
Chesapeake Energy Corp. | | | | | |
2.25%, 12/15/2038 | | 1,177 | | 880 | |
2.50%, 05/15/2037 | | 1,028 | | 905 | |
Forest City Enterprises, Inc. | | | | | |
5.00%, 10/15/2016-144A | | 61 | | 56 | |
Greenbrier Cos., Inc. | | | | | |
2.38%, 05/15/2026 | | 250 | | 173 | |
Helix Energy Solutions Group, Inc. | | | | | |
3.25%, 12/15/2025 | | 68 | | 59 | |
Hologic, Inc. | | | | | |
2.00%, 12/15/2037 Ђ | | 2,291 | | 1,860 | |
| | | | | | | | | |
The notes to the financial statements are an integral part of this report.
58
(all amounts except share amounts in thousands)
| | Principal | | Value | |
United States - (continued) | | | | | |
Intel Corp. | | | | | |
2.95%, 12/15/2035 | | $ | 670 | | $ | 613 | |
3.25%, 08/01/2039-144A | | 632 | | 681 | |
LifePoint Hospitals, Inc. | | | | | |
3.25%, 08/15/2025 | | 52 | | 47 | |
3.50%, 05/15/2014 | | 65 | | 58 | |
McMoRan Exploration Co. | | | | | |
5.25%, 10/06/2011 | | 170 | | 155 | |
Medtronic, Inc. | | | | | |
1.50%, 04/15/2011 | | 133 | | 131 | |
1.63%, 04/15/2013 | | 1,148 | | 1,116 | |
Millipore Corp. | | | | | |
3.75%, 06/01/2026 | | 176 | | 180 | |
Mylan, Inc. | | | | | |
1.25%, 03/15/2012 | | 1,055 | | 1,039 | |
NABI Biopharmaceuticals | | | | | |
2.88%, 04/15/2025 | | 80 | | 76 | |
SanDisk Corp. | | | | | |
1.00%, 05/15/2013 | | 1,660 | | 1,282 | |
SBA Communications Corp. | | | | | |
1.88%, 05/01/2013 | | 251 | | 237 | |
4.00%, 10/01/2014-144A | | 213 | | 246 | |
Sonosite, Inc. | | | | | |
3.75%, 07/15/2014 | | 208 | | 197 | |
Total Convertible Bonds (cost $43,733) | | | | 51,071 | |
| | | | | |
SHORT-TERM U.S. GOVERNMENT OBLIGATIONS - 7.9% | | | | | |
U.S. Treasury Bill | | | | | |
Zero Coupon, 11/05/2009 - 01/21/2010 £ | | 26,644 | | 26,642 | |
0.02%, 12/03/2009 ▲a | | 8,795 | | 8,793 | |
Total Short-Term U.S. Government Obligations
(cost $35,435) | | | | 35,435 | |
| | | | | |
WARRANTS - 0.0% | | | | | |
Canada - 0.0% | | | | | |
Kinross Gold Corp. ‡ | | | | | |
Expiration: 09/03/2013 | | | | | |
Exercise Price: $32.00 | | 9,602 | | 34 | |
Peak Gold, Ltd. ‡ | | | | | |
Expiration: 04/12/2012 | | | | | |
Exercise Price: $15.00 | | 41,000 | | 2 | |
Total Warrants (cost $33) | | | | 36 | |
| | | | | |
| | Shares | | | |
SECURITIES LENDING COLLATERAL - 2.7% | | | | | |
State Street Navigator Securities Lending Trust - Prime Portfolio, 0.35% ▲ | | 11,984,382 | | 11,984 | |
Total Securities Lending Collateral (cost $11,984) | | | | | |
| | | | | |
Total Investment Securities (cost $448,957) # | | | | 456,792 | |
Other Assets and Liabilities - Net | | | | (7,813 | ) |
| | | | | |
Net Assets | | | | $ | 448,979 | |
| | | | | |
| | Notional
Amount | | | |
WRITTEN-OPTIONS - (0.3%) | | | | | |
Put Options - 0.0% | | | | | |
S&P 500 Index | | $ | (1 | ) | (4 | ) |
Put Strike $800.00 | | | | | |
Expires 12/19/2009 | | | | | |
Call Options - (0.3%) | | | | | |
Apple, Inc. | | (6 | ) | (581 | ) |
Call Strike $85.00 | | | | | |
Expires 01/16/2010 | | | | | |
Microsoft Corp. | | (16 | ) | (160 | ) |
Call Strike $17.50 | | | | | |
Expires 01/16/2010 | | | | | |
Polycom, Inc. | | (8 | ) | (19 | ) |
Call Strike $20.00 | | | | | |
Expires 01/16/2010 | | | | | |
Avon Products, Inc. | | (9 | ) | (86 | ) |
Call Strike $22.50 | | | | | |
Expires 01/16/2010 | | | | | |
Consol Energy, Inc. | | (11 | ) | (30 | ) |
Call Strike $46.00 | | | | | |
Expires 01/16/2010 | | | | | |
Burlington Northern Santa Fe Corp. | | (7 | ) | (15 | ) |
Call Strike $80.00 | | | | | |
Expires 01/16/2010 | | | | | |
JPMorgan Chase & Co. | | (18 | ) | (81 | ) |
Call Strike $39.00 | | | | | |
Expires 12/19/2009 | | | | | |
WellPoint, Inc. | | (7 | ) | (4 | ) |
Call Strike $55.00 | | | | | |
Expires 12/19/2009 | | | | | |
UnitedHealth Group, Inc. | | (16 | ) | (21 | ) |
Call Strike $27.00 | | | | | |
Expires 12/19/2009 | | | | | |
Humana, Inc. | | (8 | ) | (47 | ) |
Call Strike $32.00 | | | | | |
Expires 11/21/2009 | | | | | |
Complete Production Services, Inc. | | (6 | ) | (15 | ) |
Call Strike $7.50 | | | | | |
Expires 01/16/2010 | | | | | |
Cigna Corp. | | (6 | ) | (11 | ) |
Call Strike $30.00 | | | | | |
Expires 01/16/2010 | | | | | |
MetLife, Inc. | | (8 | ) | (4 | ) |
Call Strike $40.00 | | | | | |
Expires 12/19/2009 | | | | | |
Xerox Corp | | (31 | ) | (23 | ) |
Call Strike $8.00 | | | | | |
Expires 04/17/2010 | | | | | |
Corning, Inc. | | (12 | ) | (14 | ) |
Call Strike $16.00 | | | | | |
Expires 05/22/2010 | | | | | |
Morgan Stanley | | (5 | ) | (8 | ) |
Call Strike $35.00 | | | | | |
Expires 01/16/2010 | | | | | |
Microsoft Corp. | | (14 | ) | (28 | ) |
Call Strike $28.00 | | | | | |
Expires 04/17/2010 | | | | | |
Total Written Options
(Premiums: $613) | | | | (1,151 | ) |
The notes to the financial statements are an integral part of this report.
59
(all amounts in thousands)
SWAP AGREEMENTS: £
TOTAL RETURN SWAP AGREEMENTS - RECEIVABLE:
Reference Entity | | Floating
Rate | | Maturity
Date | | Counterparty | | Currency
Code | | Notional
Amount | | Market
Value | | Premiums
Paid
(Received) | | Unrealized Appreciation | |
MSCI Daily TR EuropeEx UK USD | | 0.72 | % | 09/01/2010 | | DUB | | USD | | $ | 4,347 | | $ | 231 | | $ | — | | $ | 231 | |
| | | | | | | | | | | | | | | | | | | | | |
FUTURES CONTRACTS:
Description | | Contracts Г | | Expiration Date | | Net Unrealized
Appreciation
(Depreciation) | |
DAX Index | | 3 | | 12/18/2009 | | $ | (30 | ) |
DJ Euro STOXX 50 Index | | 182 | | 12/18/2009 | | (200 | ) |
FTSE 100 Index | | 14 | | 12/18/2009 | | (7 | ) |
Hang Seng Index | | 2 | | 11/27/2009 | | 5 | |
Nikkei 225 Index | | 4 | | 12/10/2009 | | (11 | ) |
S&P 500 Index | | 31 | | 12/17/2009 | | 64 | |
S&P TSE 60 Index | | 2 | | 12/17/2009 | | 16 | |
| | | | | | $ | (163 | ) |
FORWARD FOREIGN CURRENCY CONTRACTS:
Currency | | Bought (Sold) | | Settlement
Date | | Amount in U.S.
Dollars Bought
(Sold) | | Net Unrealized
Appreciation
(Depreciation) | |
Euro | | 340 | | 11/05/2009 | | $ | 509 | | $ | (9 | ) |
Euro | | (860 | ) | 11/06/2009 | | (1,271 | ) | 6 | |
Euro | | 640 | | 11/06/2009 | | 958 | | (15 | ) |
Euro | | 573 | | 11/06/2009 | | 856 | | (13 | ) |
Euro | | (2,099 | ) | 11/06/2009 | | (3,104 | ) | 15 | |
Euro | | 688 | | 11/06/2009 | | 1,029 | | (17 | ) |
Euro | | 340 | | 11/06/2009 | | 508 | | (8 | ) |
Euro | | 1,573 | | 11/06/2009 | | 2,350 | | (35 | ) |
Euro | | 775 | | 11/06/2009 | | 1,158 | | (18 | ) |
Euro | | 1,667 | | 11/12/2009 | | 2,470 | | (16 | ) |
Euro | | 566 | | 11/12/2009 | | 838 | | (5 | ) |
Euro | | (860 | ) | 11/12/2009 | | (1,273 | ) | 8 | |
Euro | | 2,769 | | 11/12/2009 | | 4,101 | | (27 | ) |
Euro | | (860 | ) | 11/12/2009 | | (1,273 | ) | 8 | |
Euro | | (616 | ) | 11/13/2009 | | (912 | ) | 6 | |
Euro | | 433 | | 11/13/2009 | | 650 | | (13 | ) |
Euro | | (860 | ) | 11/13/2009 | | (1,266 | ) | 1 | |
Euro | | 567 | | 11/13/2009 | | 850 | | (15 | ) |
Euro | | 568 | | 11/13/2009 | | 850 | | (15 | ) |
Euro | | 433 | | 11/13/2009 | | 650 | | (13 | ) |
Hong Kong Dollar | | (2,759 | ) | 11/02/2009 | | (356 | ) | (♦) | |
Japanese Yen | | 198,633 | | 11/05/2009 | | 2,198 | | 9 | |
Japanese Yen | | 181,016 | | 11/05/2009 | | 2,003 | | 8 | |
Japanese Yen | | 160,328 | | 11/06/2009 | | 1,758 | | 22 | |
South African Rand | | (3,328 | ) | 11/06/2009 | | (448 | ) | 22 | |
| | | | | | | | $ | (114 | ) |
| | | | | | | | | | | |
FORWARD FOREIGN CROSS CURRENCY CONTRACTS:
Bought/Sold | | Currency | | Amount | | Settlement
Date | | Unrealized Appreciation (Depreciation) | |
Buy | | Euro | | 451 | | 11/06/2009 | | $ | (10 | ) |
Sell | | Swiss Franc | | (681 | ) | 11/06/2009 | | 10 | |
Buy | | Euro | | 2,309 | | 11/05/2009 | | (53 | ) |
Sell | | Pound Sterling | | (2,098 | ) | 11/05/2009 | | 8 | |
| | | | | | | | $ | (45 | ) |
The notes to the financial statements are an integral part of this report.
60
INVESTMENTS BY INDUSTRY (unaudited): | | Percentage of
Total Investments | | Value | |
U.S. Government Obligation | | 9.3 | % | $ | 42,600 | |
Foreign Government Obligation | | 8.7 | | 39,648 | |
Oil, Gas & Consumable Fuels | | 8.6 | | 38,779 | |
Capital Markets | | 4.8 | | 21,297 | |
Diversified Financial Services | | 4.8 | | 21,093 | |
Pharmaceuticals | | 4.8 | | 20,866 | |
Metals & Mining | | 4.1 | | 18,480 | |
Insurance | | 2.9 | | 13,275 | |
Diversified Telecommunication Services | | 2.7 | | 13,088 | |
Commercial Banks | | 2.6 | | 12,445 | |
Wireless Telecommunication Services | | 2.5 | | 12,312 | |
Food Products | | 2.3 | | 11,041 | |
Computers & Peripherals | | 2.0 | | 8,564 | |
Semiconductors & Semiconductor Equipment | | 1.8 | | 8,374 | |
Software | | 1.8 | | 8,269 | |
Industrial Conglomerates | | 1.7 | | 7,895 | |
Energy Equipment & Services | | 1.7 | | 7,865 | |
Health Care Equipment & Supplies | | 1.6 | | 7,030 | |
Real Estate Management & Development | | 1.6 | | 6,853 | |
Communications Equipment | | 1.4 | | 6,219 | |
Health Care Providers & Services | | 1.3 | | 5,937 | |
Chemicals | | 1.3 | | 5,689 | |
Electric Utilities | | 1.3 | | 5,592 | |
Road & Rail | | 1.2 | | 5,505 | |
Food & Staples Retailing | | 1.0 | | 3,981 | |
Biotechnology | | 0.8 | | 3,817 | |
Media | | 0.8 | | 3,702 | |
Beverages | | 0.8 | | 3,541 | |
Automobiles | | 0.7 | | 3,523 | |
Aerospace & Defense | | 0.7 | | 3,219 | |
Electronic Equipment & Instruments | | 0.7 | | 3,212 | |
Trading Companies & Distributors | | 0.7 | | 3,137 | |
Construction & Engineering | | 0.6 | | 2,815 | |
Tobacco | | 0.6 | | 2,542 | |
Household Products | | 0.5 | | 2,290 | |
Internet Software & Services | | 0.5 | | 2,273 | |
Machinery | | 0.4 | �� | 2,155 | |
Paper & Forest Products | | 0.4 | | 1,984 | |
Electrical Equipment | | 0.4 | | 1,935 | |
Hotels, Restaurants & Leisure | | 0.4 | | 1,621 | |
Office Electronics | | 0.3 | | 1,562 | |
Household Durables | | 0.3 | | 1,526 | |
Transportation Infrastructure | | 0.3 | | 1,409 | |
Life Sciences Tools & Services | | 0.2 | | 1,374 | |
Specialty Retail | | 0.2 | | 1,335 | |
Independent Power Producers & Energy Traders | | 0.2 | | 1,260 | |
Auto Components | | 0.2 | | 1,009 | |
Thrifts & Mortgage Finance | | 0.2 | | 803 | |
IT Services | | 0.2 | | 751 | |
Real Estate Investment Trusts | | 0.2 | | 700 | |
Personal Products | | 0.1 | | 645 | |
Gas Utilities | | 0.1 | | 614 | |
Leisure Equipment & Products | | 0.1 | | 380 | |
Construction Materials | | 0.1 | | 364 | |
Containers & Packaging | | 0.1 | | 232 | |
Multi-Utilities | | 0.0 | | 231 | |
Marine | | 0.0 | | 219 | |
Textiles, Apparel & Luxury Goods | | 0.0 | | 200 | |
Water Utilities | | 0.0 | | 108 | |
Building Products | | 0.0 | | 72 | |
| | | | | | |
The notes to the financial statements are an integral part of this report.
61
(all amounts except share amounts in thousands)
INVESTMENTS BY INDUSTRY (unaudited): (continued) | | Percentage of
Total Investments | | Value | |
Commercial Services & Supplies | | 0.0 | % | $ | 68 | |
Multiline Retail | | 0.0 | | 17 | |
Derivative | | 0.0 | | 16 | |
Internet & Catalog Retail | | 0.0 | | 8 | |
Professional Services | | 0.0 | | 5 | |
Asset-Backed Security | | 0.0 | | 2 | |
Investment Securities, at Value | | 89.6 | | 409,373 | |
Short-Term Investments | | 10.4 | | 47,419 | |
Total Investments | | 100.0 | % | $ | 456,792 | |
NOTES TO SCHEDULE OF INVESTMENTS:
Λ | All or a portion of this security is on loan. The value of all securities on loan is $11,627. |
Ђ | Step bond. Interest rate may increase or decrease as the credit rating changes. |
* | Floating or variable rate note. Rate is listed as of 10/31/2009. |
♦ | Value and/or principal is less than $1. |
Ə | Securities fair valued as determined in good faith in accordance with procedures established by the Board of Trustees. These securities aggregated to $10, or 0.00% of the fund’s net assets. |
p | Rate shown reflects the yield at October 31, 2009. |
§ | Illiquid. These securities aggregated to $2,020, or 0.45%, of the fund’s net assets. |
‡ | Non-income producing security. |
Џ | In default. |
D | Cash in the amount of $10 and all or a portion of this security is segregated with the broker to cover margin requirements for open written options. The value of this security segregated at 10/31/2009 is $6,615. |
a | All or a portion of this security is segregated with the broker to cover margin requirements for open futures contracts. The value of this security segregated at 10/31/2009 is $4,399. |
£ | Securities with an aggregate market value of $636 have been pledged as collateral and segregated with the custodian to cover margin requirements for open swap agreements. |
# | Aggregate cost for federal income tax purposes is $450,527. Aggregate gross unrealized appreciation/depreciation for all securities in which there is an excess of value over tax cost were $40,051 and $33,786, respectively. Net unrealized appreciation for tax purposes is $6,265. |
Г | Contract amounts are not in thousands. |
± | Restricted security. At 10/31/2009, the fund owned the following securities (representing 0.19% of Net Assets) which were restricted as to public resale. |
Description | | Date of Acquisition | | Principal | | Cost | | Value | | Price* | |
Preferred Term Secs XXVI, Ltd. 09/22/2037 | | 9/14/2007 | | $ | 190 | | $ | 188 | | $ | ♦ | | $ | 0.00 | |
Preferred Term Secs XXVII, Ltd. 12/22/2037 | | 3/15/2007 | | 200 | | 200 | | ♦ | | 0.01 | |
Preferred Term Securities XXIV Note 03/22/2037 | | 6/20/2007 | | 350 | | 343 | | ♦ | | 0.01 | |
Preferred Term Securities XXV Note 03/22/2037 | | 12/13/2006 | | 175 | | 173 | | ♦ | | 0.01 | |
| | | | | | | | | | | |
Description | | Date of Acquisition | | Shares | | Cost | | Value | | Price* | |
Johor, Corp., 1.00% | | 01/30/2009 | | 2,896,000 | | $ | 2,869 | | $ | 832 | | $ | 0.29 | |
| | | | | | | | | | | | | | | |
* Price not rounded to thousands.
DEFINITIONS:
144A | 144A Securities are registered pursuant to Rule 144A of the Securities Act of 1933. These securities are deemed to be liquid for purposes of compliance limitations on holdings of illiquid securities and may be resold as transactions exempt from registration, normally to qualified institutional buyers. At 10/31/2009, these securities aggregated $11,716, or 2.61%, of the fund’s net assets. |
ADR | American Depository Receipt |
AUD | Australian Dollar |
BRL | Brazilian Real |
CAD | Canadian Dollar |
CHF | Swiss Franc |
CLO | Collateralized Loan Obligation |
CNY | Chinese Yuan |
CPI | Consumer Price Index |
DUB | Deutsche Bank AG |
ETF | Exchange Traded Fund |
EUR | Euro |
GBP | Pound Sterling |
GDR | Global Depository Receipt |
HKD | Hong Kong Dollar |
JPY | Japanese Yen |
MYR | Malaysian Riggit |
The notes to the financial statements are an integral part of this report.
62
(all amounts in thousands)
NZD | New Zealand Dollar |
PLN | Polish Zloty |
REIT | Real Estate Investment Trust (includes domestic REITs and Foreign Real Estate Investment Companies) |
SGD | Singapore Dollar |
SPDR | Standard & Poor’s Depository Receipt |
TIPS | Treasury Inflation Protected Security |
VALUATION SUMMARY:
Investment Securities | | Level 1 | | Level 2 | | Level 3 | | Total | |
Equities - Consumer Discretionary | | $ | 5,740 | | $ | 5,127 | | $ | — | | $ | 10,867 | |
Equities - Consumer Staples | | 15,230 | | 4,976 | | — | | 20,206 | |
Equities - Derivative | | — | | 16 | | — | | 16 | |
Equities - Energy | | 28,465 | | 6,521 | | — | | 34,986 | |
Equities - Financials | | 24,760 | | 12,863 | | — | | 37,623 | |
Equities - Health Care | | 27,058 | | 4,340 | | — | | 31,398 | |
Equities - Industrials | | 13,092 | | 12,108 | | 1 | | 25,201 | |
Equities - Information Technology | | 25,886 | | 5,718 | | — | | 31,604 | |
Equities - Materials | | 16,230 | | 6,372 | | — | | 22,602 | |
Equities - Telecommunication Services | | 12,188 | | 8,792 | | — | | 20,980 | |
Equities - Utilities | | 3,884 | | 1,801 | | — | | 5,685 | |
Fixed Income - Asset-Backed Security | | — | | 2 | | — | | 2 | |
Fixed Income - Consumer Discretionary | | — | | 4,073 | | — | | 4,073 | |
Fixed Income - Consumer Staples | | — | | 2,750 | | — | | 2,750 | |
Fixed Income - Energy | | — | | 11,660 | | — | | 11,660 | |
Fixed Income - Financials | | — | | 23,511 | | — | | 23,511 | |
Fixed Income - Foreign Government Obligation | | — | | 39,649 | | — | | 39,649 | |
Fixed Income - Health Care | | — | | 7,071 | | — | | 7,071 | |
Fixed Income - Industrials | | — | | 3,785 | | — | | 3,785 | |
Fixed Income - Information Technology | | — | | 6,205 | | — | | 6,205 | |
Fixed Income - Materials | | — | | 4,117 | | — | | 4,117 | |
Fixed Income - Short-Term U.S. Government Obligation | | — | | 35,435 | | — | | 35,435 | |
Fixed Income - Telecommunication Services | | — | | 5,329 | | — | | 5,329 | |
Fixed Income - U.S. Government Obligation | | — | | 42,600 | | — | | 42,600 | |
Fixed Income - Utilities | | — | | 2,123 | | — | | 2,123 | |
Investment Company - Financials | | 15,330 | | — | | — | | 15,330 | |
Cash & Cash Equivalent - Securities Lending Collateral | | 11,984 | | — | | — | | 11,984 | |
Total | | $ | 199,847 | | $ | 256,944 | | $ | 1 | | $ | 456,792 | |
| | | | | | | | | |
Other Financial Instruments* | | Level 1 | | Level 2 | | Level 3 | | Total | |
Forward Foreign Currency Contracts | | $ | — | | $ | (159 | ) | $ | — | | $ | (159 | ) |
Written Option | | — | | (538 | ) | — | | (538 | ) |
Total Return - Equity Swap | | — | | 231 | | — | | 231 | |
Futures Contracts | | — | | (163 | ) | — | | (163 | ) |
Total | | $ | — | | $ | (629 | ) | $ | — | | $ | (629 | ) |
Level 3 Rollforward - Investment Securities
Securities | | Beginning Balance
at 10/31/2008 | | Net Purchases/
(Sales) | | Accrued
Discounts/
(Premiums) | | Total Realized Gain/(Loss) | | Change in
Unrealized
Appreciation/
(Depreciation) | | Net Transfers In/(Out) of
Level 3 | | Ending Balance
at 10/31/2009 | |
Equities - Industrials | | $ | — | | $ | 1 | | $ | — | | $ | — | | $ | — | | $ | — | | $ | 1 | |
Total | | $ | — | | $ | 1 | | $ | — | | $ | — | | $ | — | | $ | — | | $ | 1 | |
* Other financial instruments are derivative instruments. Future Contracts, Forward Foreign Currency Contracts and Swap Contracts are valued at unrealized appreciation (depreciation) on the instrument.
The notes to the financial statements are an integral part of this report.
63
Transamerica BlackRock Large Cap Value
SCHEDULE OF INVESTMENTS
At October 31, 2009
(all amounts except share amounts in thousands)
| | Shares | | Value | |
COMMON STOCKS - 99.7% | | | | | |
Aerospace & Defense - 2.8% | | | | | |
L-3 Communications Holdings, Inc. | | 62,000 | | $ | 4,482 | |
Northrop Grumman Corp. | | 146,500 | | 7,343 | |
Raytheon Co. | | 115,000 | | 5,207 | |
Beverages - 0.8% | | | | | |
Coca-Cola Enterprises, Inc. | | 282,000 | | 5,378 | |
Biotechnology - 0.6% | | | | | |
Amgen, Inc. ‡ | | 72,000 | | 3,869 | |
Building Products - 0.2% | | | | | |
Armstrong World Industries, Inc. ‡ | | 34,000 | | 1,267 | |
Capital Markets - 2.6% | | | | | |
Goldman Sachs Group, Inc. | | 95,000 | | 16,166 | |
Chemicals - 0.6% | | | | | |
Eastman Chemical Co. | | 27,000 | | 1,417 | |
Lubrizol Corp. | | 20,100 | | 1,338 | |
RPM International, Inc. | | 77,000 | | 1,357 | |
Commercial Banks - 0.2% | | | | | |
Wells Fargo & Co. | | 55,000 | | 1,514 | |
Commercial Services & Supplies - 0.2% | | | | | |
RR Donnelley & Sons Co. | | 74,000 | | 1,486 | |
Computers & Peripherals - 1.8% | | | | | |
EMC Corp./Massachusetts ‡ | | 601,000 | | 9,897 | |
Western Digital Corp. ‡ | | 42,000 | | 1,415 | |
Construction & Engineering - 0.4% | | | | | |
KBR, Inc. | | 59,300 | | 1,214 | |
Shaw Group, Inc. ‡ | | 43,000 | | 1,103 | |
Containers & Packaging - 1.5% | | | | | |
Ball Corp. | | 28,100 | | 1,386 | |
Bemis Co., Inc. | | 203,000 | | 5,243 | |
Pactiv Corp. ‡ | | 53,100 | | 1,226 | |
Sonoco Products Co. | | 50,000 | | 1,338 | |
Diversified Consumer Services - 0.3% | | | | | |
Service Corp. International | | 315,900 | | 2,170 | |
Diversified Financial Services - 3.7% | | | | | |
Bank of America Corp. | | 256,000 | | 3,732 | |
General Electric Co. | | 546,000 | | 7,786 | |
JPMorgan Chase & Co. | | 213,000 | | 8,897 | |
NASDAQ OMX Group ‡ | | 177,000 | | 3,197 | |
Diversified Telecommunication Services - 7.1% | | | | | |
AT&T, Inc. | | 988,000 | | 25,362 | |
Frontier Communications Corp. | | 167,000 | | 1,197 | |
Qwest Communications International, Inc. | | 337,000 | | 1,210 | |
Verizon Communications, Inc. | | 582,000 | | 17,221 | |
Electric Utilities - 1.2% | | | | | |
Edison International | | 175,800 | | 5,594 | |
NV Energy, Inc. | | 185,000 | | 2,120 | |
Electrical Equipment - 0.3% | | | | | |
Hubbell, Inc. -Class B | | 50,100 | | 2,131 | |
Energy Equipment & Services - 8.3% | | | | | |
Atwood Oceanics, Inc. ‡ | | 41,900 | | 1,487 | |
BJ Services Co. | | 287,000 | | 5,510 | |
Ensco International, Inc. | | 154,000 | | 7,052 | |
Helix Energy Solutions Group, Inc. ‡ | | 96,200 | | 1,321 | |
Helmerich & Payne, Inc. | | 118,000 | | 4,486 | |
Nabors Industries, Ltd. ‡ | | 342,000 | | 7,124 | |
National Oilwell Varco, Inc. ‡ | | 193,000 | | 7,911 | |
Oil States International, Inc. ‡ | | 42,700 | | 1,471 | |
Patterson-UTI Energy, Inc. | | 96,100 | | 1,497 | |
Pride International, Inc. ‡ | | 157,500 | | 4,656 | |
Rowan Cos., Inc. | | 263,000 | | 6,115 | |
SEACOR Holdings, Inc. ‡ | | 17,700 | | 1,438 | |
Tidewater, Inc. | | 31,500 | | 1,313 | |
Unit Corp. ‡ | | 33,800 | | 1,321 | |
Food & Staples Retailing - 0.7% | | | | | |
BJ’s Wholesale Club, Inc. ‡ | | 120,000 | | 4,204 | |
Food Products - 3.9% | | | | | |
Archer-Daniels-Midland Co. | | 251,000 | | 7,559 | |
Campbell Soup Co. | | 97,000 | | 3,080 | |
ConAgra Foods, Inc. | | 327,000 | | 6,867 | |
HJ Heinz Co. | | 35,000 | | 1,408 | |
Sara Lee Corp. | | 530,000 | | 5,984 | |
Gas Utilities - 0.2% | | | | | |
UGI Corp. | | 55,200 | | 1,318 | |
Health Care Equipment & Supplies - 0.4% | | | | | |
Cooper Cos., Inc. | | 56,000 | | 1,568 | |
Kinetic Concepts, Inc. ‡ | | 38,200 | | 1,268 | |
Health Care Providers & Services - 9.7% | | | | | |
Aetna, Inc. | | 251,700 | | 6,552 | |
AmerisourceBergen Corp. -Class A | | 274,500 | | 6,080 | |
Cardinal Health, Inc. | | 59,800 | | 1,695 | |
Cigna Corp. | | 112,000 | | 3,118 | |
Coventry Health Care, Inc. ‡ | | 272,300 | | 5,400 | |
Humana, Inc. ‡ | | 36,400 | | 1,368 | |
Lincare Holdings, Inc. ‡ | | 51,800 | | 1,627 | |
McKesson Corp. | | 96,700 | | 5,679 | |
Medco Health Solutions, Inc. ‡ | | 82,000 | | 4,602 | |
Tenet Healthcare Corp. ‡ | | 323,000 | | 1,654 | |
UnitedHealth Group, Inc. | | 420,000 | | 10,898 | |
Universal Health Services, Inc. -Class B | | 52,000 | | 2,894 | |
WellPoint, Inc. ‡ | | 196,000 | | 9,165 | |
Health Care Technology - 0.2% | | | | | |
IMS Health, Inc. | | 93,900 | | 1,539 | |
Household Durables - 0.4% | | | | | |
Leggett & Platt, Inc. | | 125,000 | | 2,416 | |
Independent Power Producers & Energy Traders - 1.4% | | | | | |
AES Corp. ‡ | | 97,900 | | 1,280 | |
Mirant Corp. ‡ | | 80,800 | | 1,130 | |
NRG Energy, Inc. ‡ | | 247,800 | | 5,697 | |
Industrial Conglomerates - 0.5% | | | | | |
Carlisle Cos., Inc. | | 92,000 | | 2,856 | |
Insurance - 10.1% | | | | | |
Allied World Assurance Co. Holdings, Ltd. | | 30,000 | | 1,343 | |
American Financial Group, Inc. | | 133,800 | | 3,291 | |
Assurant, Inc. | | 40,000 | | 1,197 | |
Axis Capital Holdings, Ltd. | | 24,000 | | 693 | |
Chubb Corp. | | 174,200 | | 8,453 | |
Endurance Specialty Holdings, Ltd. | | 117,200 | | 4,218 | |
Everest RE Group, Ltd. | | 64,000 | | 5,599 | |
HCC Insurance Holdings, Inc. | | 217,600 | | 5,742 | |
PartnerRe, Ltd. | | 89,500 | | 6,845 | |
Reinsurance Group of America, Inc. | | 19,000 | | 876 | |
RenaissanceRe Holdings, Ltd. | | 80,500 | | 4,226 | |
StanCorp Financial Group, Inc. | | 73,200 | | 2,687 | |
Travelers Cos., Inc. | | 209,000 | | 10,407 | |
Unitrin, Inc. | | 78,000 | | 1,529 | |
Unum Group | | 347,000 | | 6,923 | |
| | | | | | |
The notes to the financial statements are an integral part of this report.
64
| | Shares | | Value | |
IT Services - 1.5% | | | | | |
Computer Sciences Corp. ‡ | | 112,000 | | $ | 5,680 | |
Convergys Corp. ‡ | | 97,000 | | 1,052 | |
Fidelity National Information Services, Inc. | | 113,000 | | 2,459 | |
Machinery - 1.2% | | | | | |
Joy Global, Inc. | | 130,000 | | 6,554 | |
Timken Co. | | 61,200 | | 1,348 | |
Marine - 0.2% | | | | | |
Alexander & Baldwin, Inc. | | 43,000 | | 1,240 | |
Metals & Mining - 1.1% | | | | | |
Commercial Metals Co. | | 191,000 | | 2,834 | |
Reliance Steel & Aluminum Co. | | 120,000 | | 4,378 | |
Multiline Retail - 1.1% | | | | | |
Dollar Tree, Inc. ‡ | | 34,000 | | 1,534 | |
Kohl’s Corp. ‡ | | 91,000 | | 5,207 | |
Multi-Utilities - 0.2% | | | | | |
CMS Energy Corp. | | 108,000 | | 1,436 | |
Oil, Gas & Consumable Fuels - 21.1% | | | | | |
Anadarko Petroleum Corp. | | 164,200 | | 10,005 | |
Atmos Energy Corp. | | 99,100 | | 2,760 | |
Chesapeake Energy Corp. | | 66,400 | | 1,627 | |
Chevron Corp. | | 274,100 | | 20,981 | |
ConocoPhillips | | 313,300 | | 15,721 | |
El Paso Corp. | | 156,000 | | 1,530 | |
Encore Acquisition Co. ‡ | | 91,000 | | 3,373 | |
Exxon Mobil Corp. | | 269,000 | | 19,279 | |
Marathon Oil Corp. | | 283,600 | | 9,067 | |
Murphy Oil Corp. | | 119,200 | | 7,288 | |
Occidental Petroleum Corp. | | 143,000 | | 10,851 | |
Southern Union Co. | | 177,600 | | 3,476 | |
Sunoco, Inc. | | 118,000 | | 3,634 | |
Teekay Corp. | | 67,300 | | 1,396 | |
Tesoro Corp. | | 168,000 | | 2,376 | |
Valero Energy Corp. | | 307,000 | | 5,557 | |
Williams Cos., Inc. | | 406,000 | | 7,653 | |
XTO Energy, Inc. | | 172,000 | | 7,148 | |
Paper & Forest Products - 1.5% | | | | | |
International Paper Co. | | 330,000 | | 7,362 | |
MeadWestvaco Corp. | | 107,600 | | 2,457 | |
Pharmaceuticals - 5.6% | | | | | |
Endo Pharmaceuticals Holdings, Inc. ‡ | | 61,200 | | 1,371 | |
Johnson & Johnson | | 137,000 | | 8,090 | |
Pfizer, Inc. | | 1,205,992 | | 20,537 | |
Schering-Plough Corp. | | 198,000 | | 5,584 | |
Road & Rail - 1.6% | | | | | |
Con-way, Inc. | | 31,100 | | 1,026 | |
CSX Corp. | | 191,000 | | 8,056 | |
Ryder System, Inc. | | 33,400 | | 1,354 | |
Software - 1.7% | | | | | |
Amdocs, Ltd. ‡ | | 128,000 | | 3,226 | |
CA, Inc. | | 207,600 | | 4,343 | |
Compuware Corp. ‡ | | 450,000 | | 3,177 | |
Specialty Retail - 1.9% | | | | | |
Gap, Inc. | | 315,400 | | 6,731 | |
RadioShack Corp. | | 319,000 | | 5,388 | |
Tobacco - 0.6% | | | | | |
Lorillard, Inc. | | 18,300 | | 1,422 | |
Reynolds American, Inc. | | 52,400 | | 2,541 | |
Wireless Telecommunication Services - 0.3% | | | | | |
Telephone & Data Systems, Inc. | | 32,000 | | 948 | |
U.S. Cellular Corp. ‡ | | 18,000 | | 659 | |
Total Common Stocks (cost $618,900) | | | | 631,616 | |
| | | | | |
Short-Term Investment Company - 0.2% | | | | | |
Capital Markets 0.2% | | | | | |
BlackRock Provident TempFund 24 | | 1,340,168 | | 1,340 | |
Total Short-Term Investment Company (cost $1,340) | | | | | |
| | | | | |
Total Investment Securities (cost $620,240) # | | | | 632,956 | |
Other Assets and Liabilities - Net | | | | 719 | |
| | | | | |
Net Assets | | | | $ | 633,675 | |
NOTES TO SCHEDULE OF INVESTMENTS:
‡ | | Non-income producing security. |
# | | Aggregate cost for federal income tax purposes is $634,634. Aggregate gross unrealized appreciation/depreciation for all securities in which there is an excess of value over tax cost were $36,908 and $38,586, respectively. Net unrealized depreciation for tax purposes is $1,678. |
VALUATION SUMMARY:
Investment Securities | | Level 1 | | Level 2 | | Level 3 | | Total | |
Equities - Consumer Discretionary | | $ | 23,446 | | $ | — | | $ | — | | $ | 23,446 | |
Equities - Consumer Staples | | 38,443 | | — | | — | | 38,443 | |
Equities - Energy | | 183,663 | | — | | — | | 183,663 | |
Equities - Financials | | 105,321 | | — | | — | | 105,321 | |
Equities - Health Care | | 104,558 | | — | | — | | 104,558 | |
Equities - Industrials | | 46,667 | | — | | — | | 46,667 | |
Equities - Information Technology | | 31,249 | | — | | — | | 31,249 | |
Equities - Materials | | 30,336 | | — | | — | | 30,336 | |
Equities - Telecommunication Services | | 46,597 | | — | | — | | 46,597 | |
Equities - Utilities | | 21,336 | | — | | — | | 21,336 | |
Investment Company - Financials | | 1,340 | | — | | — | | 1,340 | |
Total | | $ | 632,956 | | $ | — | | $ | — | | $ | 632,956 | |
The notes to the financial statements are an integral part of this report.
65
Transamerica BlackRock Natural Resources
SCHEDULE OF INVESTMENTS
At October 31, 2009
(all amounts except share amounts in thousands)
| | Shares | | Value | |
COMMON STOCKS - 89.6% | | | | | |
Chemicals - 0.6% | | | | | |
E.I. duPont de Nemours & Co. | | 9,500 | | $ | 302 | |
Praxair, Inc. | | 5,300 | | 421 | |
Energy Equipment & Services - 24.3% | | | | | |
Acergy SA ADR | | 24,200 | | 300 | |
Baker Hughes, Inc. | | 27,200 | | 1,144 | |
BJ Services Co. | | 16,600 | | 319 | |
Cameron International Corp. ‡ | | 56,100 | | 2,074 | |
Diamond Offshore Drilling, Inc. Λ | | 14,900 | | 1,419 | |
Dresser-Rand Group, Inc. ‡ | | 54,100 | | 1,594 | |
Dril-Quip, Inc. ‡ | | 17,000 | | 826 | |
Exterran Holdings, Inc. ‡ | | 130 | | 3 | |
FMC Technologies, Inc. ‡ | | 42,900 | | 2,257 | |
Halliburton Co. | | 52,900 | | 1,545 | |
Helmerich & Payne, Inc. | | 27,600 | | 1,049 | |
Nabors Industries, Ltd. ‡ | | 31,400 | | 654 | |
National Oilwell Varco, Inc. ‡ | | 72,372 | | 2,967 | |
Noble Corp. | | 45,500 | | 1,854 | |
Pride International, Inc. ‡ | | 20,500 | | 606 | |
Rowan Cos., Inc. | | 13,900 | | 323 | |
Saipem SpA | | 45,300 | | 1,337 | |
Schlumberger, Ltd. | | 22,900 | | 1,424 | |
Smith International, Inc. | | 23,600 | | 654 | |
Technip SA ADR | | 18,500 | | 1,172 | |
Tesco Corp. ‡ | | 30,300 | | 263 | |
Transocean, Ltd. ‡ | | 44,621 | | 3,744 | |
Trican Well Service, Ltd. | | 13,100 | | 153 | |
Weatherford International, Ltd. ‡ | | 99,600 | | 1,746 | |
Gas Utilities - 1.0% | | | | | |
EQT Corp. | | 29,400 | | 1,231 | |
Metals & Mining - 8.8% | | | | | |
Alcoa, Inc. | | 6,500 | | 81 | |
Aluminum Corp. of China, Ltd. ADR ‡Λ | | 57,700 | | 1,569 | |
Barrick Gold Corp. | | 15,100 | | 544 | |
BHP Billiton, Ltd. | | 17,300 | | 567 | |
Eldorado Gold Corp. ‡Λ | | 121,600 | | 1,355 | |
Gammon Gold, Inc. ‡ | | 37,500 | | 305 | |
Goldcorp, Inc. | | 40,300 | | 1,482 | |
Hudbay Minerals, Inc. ‡ | | 53,700 | | 695 | |
Inmet Mining Corp. | | 3,700 | | 196 | |
Newcrest Mining, Ltd. | | 42,795 | | 1,230 | |
Newmont Mining Corp. | | 2,500 | | 109 | |
Southern Copper Corp. Λ | | 39,800 | | 1,254 | |
Vale SA -Class B ADR | | 52,500 | | 1,338 | |
Oil, Gas & Consumable Fuels - 54.2% | | | | | |
Anadarko Petroleum Corp. | | 31,600 | | 1,925 | |
Apache Corp. | | 38,100 | | 3,586 | |
Arch Coal, Inc. | | 10,400 | | 225 | |
BP PLC ADR | | 12,300 | | 696 | |
Cabot Oil & Gas Corp. | | 26,400 | | 1,016 | |
Canadian Natural Resources, Ltd. | | 26,400 | | 1,713 | |
Carrizo Oil & Gas, Inc. ‡ | | 17,200 | | 399 | |
Chevron Corp. | | 41,900 | | 3,207 | |
Cimarex Energy Co. | | 5,600 | | 219 | |
CNOOC, Ltd. ADR Λ | | 9,500 | | 1,415 | |
Coastal Energy Co. ‡ | | 144,950 | | 654 | |
ConocoPhillips | | 38,500 | | 1,932 | |
Consol Energy, Inc. | | 20,500 | | 878 | |
Crew Energy, Inc. ‡ | | 81,500 | | 746 | |
Denbury Resources, Inc. ‡ | | 17,600 | | 257 | |
Devon Energy Corp. | | 59,300 | | 3,837 | |
EnCana Corp. | | 37,100 | | 2,057 | |
ENI SpA ADR | | 5,300 | | 263 | |
EOG Resources, Inc. | | 63,400 | | 5,176 | |
Exxon Mobil Corp. | | 38,900 | | 2,788 | |
Forest Oil Corp. ‡ | | 13,100 | | 257 | |
Hess Corp. | | 23,000 | | 1,259 | |
Husky Energy, Inc. | | 29,000 | | 764 | |
Marathon Oil Corp. | | 42,900 | | 1,372 | |
Mariner Energy, Inc. ‡ | | 11,200 | | 143 | |
Murphy Oil Corp. | | 70,700 | | 4,322 | |
Newfield Exploration Co. ‡ | | 20,800 | | 853 | |
Nexen, Inc. | | 32,400 | | 697 | |
Noble Energy, Inc. | | 22,300 | | 1,464 | |
Occidental Petroleum Corp. | | 36,200 | | 2,747 | |
Pan Orient Energy Corp. ‡ | | 61,600 | | 283 | |
Paramount Resources, Ltd. -Class A ‡ | | 19,800 | | 247 | |
Patriot Coal Corp. ‡Λ | | 7,940 | | 90 | |
Peabody Energy Corp. | | 39,700 | | 1,572 | |
PetroBakken Energy, Ltd. | | 16,153 | | 466 | |
Petroleo Brasileiro SA ADR | | 32,500 | | 1,502 | |
Pioneer Natural Resources Co. | | 11,200 | | 460 | |
Progress Energy Resources Corp. | | 44,800 | | 573 | |
Range Resources Corp. | | 47,200 | | 2,362 | |
Seahawk Drilling, Inc. ‡ | | 1,300 | | 35 | |
Southwestern Energy Co. ‡ | | 20,000 | | 872 | |
Suncor Energy, Inc. ‡ | | 109,136 | | 3,623 | |
Talisman Energy, Inc. | | 167,300 | | 2,854 | |
Total SA ADR | | 27,400 | | 1,646 | |
Valero Energy Corp. | | 25,400 | | 460 | |
Whiting Petroleum Corp. ‡ | | 13,500 | | 761 | |
Williams Cos., Inc. | | 19,400 | | 366 | |
XTO Energy, Inc. | | 21,075 | | 876 | |
Paper & Forest Products - 0.3% | | | | | |
Votorantim Celulose e Papel ADR ‡ | | 24,024 | | 330 | |
Transportation Infrastructure - 0.4% | | | | | |
Aegean Marine Petroleum Network, Inc. | | 19,900 | | 468 | |
Total Common Stocks (cost $107,141) | | | | 108,819 | |
| | | | | | |
| | Principal | | | |
REPURCHASE AGREEMENT - 13.8% | | | | | |
State Street Repurchase Agreement 0.01%, dated 10/30/2009, to be repurchased at $16,759 on 11/02/2009. Collateralized by a U.S. Government Agency Obligation, 4.00%, due 12/15/2017, and with a value of $17,095. | | $ | 16,759 | | 16,759 | |
Total Repurchase Agreement (cost $16,759) | | | | | |
| | | | | | |
| | Shares | | | |
SECURITIES LENDING COLLATERAL - 3.7% | | | | | |
State Street Navigator Securities Lending Trust - Prime Portfolio, 0.35% p | | 4,434,473 | | 4,434 | |
Total Securities Lending Collateral (cost $4,434) | | | | | |
| | | | | |
Total Investment Securities (cost $128,334) # | | | | 130,012 | |
Other Assets and Liabilities - Net | | | | (8,670 | ) |
| | | | | |
Net Assets | | | | $ | 121,342 | |
| | | | | | |
The notes to the financial statements are an integral part of this report.
66
(all amounts in thousands)
NOTES TO SCHEDULE OF INVESTMENTS:
‡ | | Non-income producing security. |
Λ | | All or a portion of this security is on loan. The value of all securities on loan is $4,309. |
p | | Rate shown reflects the yield at 10/31/2009. |
# | | Aggregate cost for federal income tax purposes is $127,748. Aggregate gross unrealized appreciation/depreciation for all securities in which there is an excess of value over tax cost were $12,521 and $10,257, respectively. Net unrealized appreciation for tax purposes is $2,264. |
DEFINITION:
ADR American Depository Receipt
VALUATION SUMMARY:
Investment Securities | | Level 1 | | Level 2 | | Level 3 | | Total | |
Equities - Energy | | $ | 94,005 | | $ | 1,337 | | $ | — | | $ | 95,342 | |
Equities - Industrials | | 468 | | — | | — | | 468 | |
Equities - Materials | | 9,981 | | 1,797 | | — | | 11,778 | |
Equities - Utilities | | 1,231 | | — | | — | | 1,231 | |
Cash & Cash Equivalent - Repurchase Agreement | | — | | 16,759 | | — | | 16,759 | |
Cash & Cash Equivalent - Securities Lending Collateral | | 4,434 | | — | | — | | 4,434 | |
Total | | $ | 110,119 | | $ | 19,893 | | $ | — | | $ | 130,012 | |
The notes to the financial statements are an integral part of this report.
67
Transamerica BNY Mellon Market Neutral Strategy
SCHEDULE OF INVESTMENTS
At October 31, 2009
(all amounts except share amounts in thousands)
| | Shares | | Value | |
COMMON STOCKS - 89.7% | | | | | |
Aerospace & Defense - 3.5% | | | | | |
AAR Corp. ‡ | | 2,400 | | $ | 47 | |
Applied Signal Technology, Inc. | | 1,300 | | 27 | |
DynCorp International, Inc. -Class A ‡ | | 1,400 | | 24 | |
General Dynamics Corp. | | 9,000 | | 564 | |
L-3 Communications Holdings, Inc. | | 3,700 | | 267 | |
Lockheed Martin Corp. | | 7,500 | | 516 | |
Northrop Grumman Corp. | | 19,500 | | 977 | |
Raytheon Co. | | 12,300 | | 557 | |
Triumph Group, Inc. | | 600 | | 28 | |
Air Freight & Logistics - 1.2% | | | | | |
Atlas Air Worldwide Holdings, Inc. ‡ | | 1,100 | | 29 | |
Expeditors International of Washington, Inc. | | 10,900 | | 351 | |
United Parcel Service, Inc. -Class B | | 8,600 | | 462 | |
UTI Worldwide, Inc. | | 16,700 | | 208 | |
Airlines - 0.1% | | | | | |
Allegiant Travel Co. -Class A ‡ | | 1,400 | | 53 | |
Hawaiian Holdings, Inc. ‡ | | 5,700 | | 40 | |
Auto Components - 0.2% | | | | | |
Cooper Tire & Rubber Co. | | 1,100 | | 17 | |
Dorman Products, Inc. ‡ | | 3,700 | | 54 | |
Johnson Controls, Inc. | | 3,200 | | 77 | |
Spartan Motors, Inc. | | 6,800 | | 34 | |
Superior Industries International, Inc. | | 700 | | 9 | |
Biotechnology - 0.2% | | | | | |
Harvard Bioscience, Inc. ‡ | | 5,700 | | 21 | |
Kendle International, Inc. ‡ | | 4,300 | | 72 | |
RTI Biologics, Inc. ‡ | | 9,600 | | 38 | |
Building Products - 0.1% | | | | | |
AAON, Inc. | | 700 | | 13 | |
Apogee Enterprises, Inc. | | 3,800 | | 50 | |
Capital Markets - 0.1% | | | | | |
BGC Partners, Inc. -Class A | | 5,500 | | 27 | |
GFI Group, Inc. | | 7,900 | | 40 | |
Knight Capital Group, Inc. -Class A ‡ | | 1,000 | | 17 | |
Chemicals - 3.1% | | | | | |
A Schulman, Inc. | | 1,500 | | 26 | |
Airgas, Inc. | | 5,600 | | 248 | |
Balchem Corp. | | 1,800 | | 50 | |
Cabot Corp. | | 22,700 | | 498 | |
Huntsman Corp. | | 51,100 | | 406 | |
Innophos Holdings, Inc. | | 1,500 | | 29 | |
Landec Corp. ‡ | | 3,800 | | 25 | |
LSB Industries, Inc. ‡ | | 3,100 | | 38 | |
Scotts Miracle-Gro Co. -Class A | | 13,300 | | 541 | |
Symyx Technologies, Inc. ‡ | | 8,400 | | 49 | |
Valspar Corp. | | 31,300 | | 795 | |
Commercial Banks - 0.2% | | | | | |
Dime Community Bancshares | | 2,000 | | 22 | |
First Community Bancshares, Inc. | | 1,100 | | 13 | |
OceanFirst Financial Corp. | | 1,900 | | 18 | |
Smithtown Bancorp, Inc. | | 4,400 | | 46 | |
United Community Banks, Inc. ‡ | | 6,146 | | 25 | |
Wells Fargo & Co. | | 2,900 | | 79 | |
Commercial Services & Supplies - 1.5% | | | | | |
ABM Industries, Inc. | | 2,400 | | 45 | |
ACCO Brands Corp. ‡ | | 8,400 | | 51 | |
ATC Technology Corp. ‡ | | 2,400 | | 50 | |
Comfort Systems USA, Inc. | | 2,000 | | 22 | |
Cornell Companies, Inc. ‡ | | 2,100 | | 48 | |
Diamond Management & Technology Consultants, Inc. -Class A | | 2,700 | | 16 | |
Ennis, Inc. | | 1,800 | | 27 | |
Equifax, Inc. | | 9,500 | | 260 | |
M&F Worldwide Corp. ‡ | | 3,100 | | 66 | |
Metalico, Inc. ‡ | | 5,000 | | 20 | |
Multi Color Corp. | | 3,600 | | 48 | |
Pitney Bowes, Inc. | | 22,100 | | 542 | |
Providence Service Corp. ‡ | | 4,700 | | 59 | |
Waste Services, Inc. ‡ | | 8,600 | | 56 | |
Communications Equipment - 3.3% | | | | | |
ADC Telecommunications, Inc. ‡ | | 65,300 | | 424 | |
Arris Group, Inc. ‡ | | 5,400 | | 55 | |
Bel Fuse, Inc. -Class B | | 1,300 | | 24 | |
Black Box Corp. | | 1,100 | | 29 | |
Corning, Inc. | | 65,800 | | 961 | |
Harris Corp. | | 15,700 | | 655 | |
Loral Space & Communications, Inc. ‡ | | 1,800 | | 48 | |
Netgear, Inc. ‡ | | 2,600 | | 47 | |
PC-Telephone, Inc. ‡ | | 4,900 | | 29 | |
QUALCOMM, Inc. | | 11,400 | | 472 | |
Seachange International, Inc. ‡ | | 3,800 | | 26 | |
Symmetricom, Inc. ‡ | | 8,200 | | 39 | |
Tekelec, Inc. ‡ | | 3,200 | | 48 | |
Computers & Peripherals - 1.5% | | | | | |
Apple, Inc. ‡ | | 2,400 | | 452 | |
Cray, Inc. ‡ | | 8,600 | | 64 | |
Diebold, Inc. | | 8,300 | | 251 | |
International Business Machines Corp. | | 4,300 | | 519 | |
Rimage Corp. ‡ | | 700 | | 13 | |
Construction & Engineering - 1.8% | | | | | |
Dycom Industries, Inc. ‡ | | 55,600 | | 550 | |
EMCOR Group, Inc. ‡ | | 2,900 | | 68 | |
Fluor Corp. | | 4,500 | | 200 | |
Jacobs Engineering Group, Inc. ‡ | | 5,400 | | 228 | |
Michael Baker Corp. ‡ | | 1,100 | | 39 | |
Shaw Group, Inc. ‡ | | 16,100 | | 413 | |
Sterling Construction Co., Inc. ‡ | | 2,900 | | 47 | |
Consumer Finance - 0.3% | | | | | |
AmeriCredit Corp. ‡ | | 13,700 | | 242 | |
World Acceptance Corp. ‡ | | 2,300 | | 58 | |
Containers & Packaging - 3.1% | | | | | |
Bemis Co., Inc. | | 18,500 | | 478 | |
Bway Holding Co. ‡ | | 4,000 | | 71 | |
Crown Holdings, Inc. ‡ | | 28,800 | | 768 | |
Pactiv Corp. ‡ | | 34,900 | | 805 | |
Sealed Air Corp. | | 17,600 | | 338 | |
Temple-Inland, Inc. | | 12,600 | | 195 | |
Distributors - 1.1% | | | | | |
Core-Mark Holding Co., Inc. ‡ | | 1,700 | | 47 | |
Genuine Parts Co. | | 26,700 | | 934 | |
Diversified Consumer Services - 1.3% | | | | | |
Apollo Group, Inc. -Class A ‡ | | 2,900 | | 166 | |
Career Education Corp. ‡ | | 4,100 | | 85 | |
Corinthian Colleges, Inc. ‡ | | 1,500 | | 24 | |
Pre-Paid Legal Services, Inc. ‡ | | 1,000 | | 40 | |
Regis Corp. | | 22,100 | | 359 | |
Weight Watchers International, Inc. | | 15,600 | | 413 | |
| | | | | | |
The notes to the financial statements are an integral part of this report.
68
| | Shares | | Value | |
Diversified Financial Services - 0.0% | | | | | |
Oppenheimer Holdings, Inc. -Class A | | 600 | | $ | 15 | |
Diversified Telecommunication Services - 0.8% | | | | | |
CenturyTel, Inc. | | 19,600 | | 636 | |
Premiere Global Services, Inc. ‡ | | 4,000 | | 30 | |
Electric Utilities - 0.9% | | | | | |
Allegheny Energy, Inc. | | 10,400 | | 237 | |
Exelon Corp. | | 4,100 | | 193 | |
IDACORP, Inc. | | 11,000 | | 309 | |
Electrical Equipment - 1.5% | | | | | |
AO Smith Corp. | | 1,100 | | 44 | |
EnerSys ‡ | | 3,200 | | 71 | |
General Cable Corp. ‡ | | 26,700 | | 831 | |
Powell Industries, Inc. ‡ | | 1,700 | | 63 | |
Thomas & Betts Corp. ‡ | | 9,100 | | 311 | |
Electronic Equipment & Instruments - 2.1% | | | | | |
Arrow Electronics, Inc. ‡ | | 2,800 | | 71 | |
Benchmark Electronics, Inc. ‡ | | 2,200 | | 37 | |
Brightpoint, Inc. ‡ | | 3,100 | | 23 | |
Checkpoint Systems, Inc. ‡ | | 3,400 | | 46 | |
Greatbatch, Inc. ‡ | | 2,500 | | 49 | |
Ingram Micro, Inc. -Class A ‡ | | 29,900 | | 528 | |
Insight Enterprises, Inc. ‡ | | 2,900 | | 31 | |
Kopin Corp. ‡ | | 4,800 | | 21 | |
L-1 Identity Solutions, Inc. ‡ | | 5,300 | | 31 | |
Multi-Fineline Electronix, Inc. ‡ | | 2,600 | | 71 | |
Newport Corp. ‡ | | 1,300 | | 10 | |
OSI Systems, Inc. ‡ | | 3,800 | | 75 | |
PC Mall, Inc. ‡ | | 6,100 | | 43 | |
RadiSys Corp. ‡ | | 5,800 | | 49 | |
ScanSource, Inc. ‡ | | 2,200 | | 56 | |
SYNNEX Corp. ‡ | | 800 | | 21 | |
Tech Data Corp. ‡ | | 15,300 | | 587 | |
TTM Technologies, Inc. ‡ | | 6,300 | | 64 | |
Energy Equipment & Services - 1.4% | | | | | |
Bristow Group, Inc. ‡ | | 1,500 | | 44 | |
Cal Dive International, Inc. ‡ | | 3,000 | | 23 | |
Dawson Geophysical Co. ‡ | | 1,800 | | 43 | |
Gulfmark Offshore, Inc. ‡ | | 1,400 | | 39 | |
Helix Energy Solutions Group, Inc. ‡ | | 8,100 | | 111 | |
ICO, Inc. ‡ | | 8,400 | | 32 | |
Oceaneering International, Inc. ‡ | | 1,400 | | 72 | |
Oyo Geospace Corp. ‡ | | 900 | | 24 | |
SEACOR Holdings, Inc. ‡ | | 3,500 | | 284 | |
T.G.C. Industries, Inc. ‡ | | 2,400 | | 10 | |
T-3 Energy Services, Inc. ‡ | | 1,300 | | 26 | |
Tidewater, Inc. | | 10,700 | | 446 | |
Willbros Group, Inc. ‡ | | 4,300 | | 57 | |
Food & Staples Retailing - 2.1% | | | | | |
Nash Finch Co. | | 1,600 | | 46 | |
Pantry, Inc. ‡ | | 3,300 | | 47 | |
Safeway, Inc. | | 5,200 | | 116 | |
SUPERVALU, Inc. | | 21,800 | | 346 | |
Sysco Corp. | | 26,600 | | 703 | |
United Natural Foods, Inc. ‡ | | 1,900 | | 46 | |
Wal-Mart Stores, Inc. | | 10,200 | | 507 | |
Weis Markets, Inc. | | 800 | | 28 | |
Winn-Dixie Stores, Inc. ‡ | | 1,500 | | 17 | |
Food Products - 3.6% | | | | | |
American Italian Pasta Co. -Class A ‡ | | 900 | | 24 | |
Archer-Daniels-Midland Co. | | 18,500 | | 557 | |
B&G Foods, Inc. -Class A | | 2,700 | | 21 | |
Dean Foods Co. ‡ | | 22,800 | | 416 | |
Hormel Foods Corp. | | 23,100 | | 843 | |
HQ Sustainable Maritime Industries, Inc. ‡ | | 2,600 | | 20 | |
Lancaster Colony Corp. | | 12,900 | | 627 | |
Schiff Nutrition International, Inc. | | 4,300 | | 25 | |
Tyson Foods, Inc. -Class A | | 41,400 | | 518 | |
Gas Utilities - 1.1% | | | | | |
Laclede Group, Inc. | | 700 | | 21 | |
New Jersey Resources Corp. | | 700 | | 25 | |
Questar Corp. | | 7,400 | | 295 | |
Southwest Gas Corp. | | 1,000 | | 25 | |
UGI Corp. | | 23,300 | | 556 | |
Health Care Equipment & Supplies - 3.2% | | | | | |
American Medical Systems Holdings, Inc. ‡ | | 4,500 | | 69 | |
Cantel Medical Corp. ‡ | | 3,800 | | 61 | |
Cooper Cos., Inc. | | 11,900 | | 333 | |
Hologic, Inc. ‡ | | 27,100 | | 401 | |
ICU Medical, Inc. ‡ | | 300 | | 11 | |
Immucor, Inc. ‡ | | 31,900 | | 569 | |
Integra LifeSciences Holdings Corp. ‡ | | 1,600 | | 49 | |
Invacare Corp. | | 3,200 | | 72 | |
Kensey Nash Corp. ‡ | | 2,000 | | 48 | |
Kinetic Concepts, Inc. ‡ | | 16,800 | | 558 | |
Medical Action Industries, Inc. ‡ | | 2,100 | | 23 | |
Quidel Corp. ‡ | | 2,400 | | 34 | |
Stryker Corp. | | 11,200 | | 515 | |
Symmetry Medical, Inc. ‡ | | 6,100 | | 49 | |
Health Care Providers & Services - 3.9% | | | | | |
Aetna, Inc. | | 4,400 | | 115 | |
Amedisys, Inc. ‡ | | 1,100 | | 44 | |
AMICAS Inc. ‡ | | 7,600 | | 24 | |
Centene Corp. ‡ | | 2,700 | | 48 | |
Community Health Systems, Inc. ‡ | | 18,300 | | 572 | |
Emergency Medical Services Corp. -Class A ‡ | | 500 | | 24 | |
Hanger Orthopedic Group, Inc. ‡ | | 3,400 | | 47 | |
Humana, Inc. ‡ | | 17,500 | | 658 | |
Inventiv Health, Inc. ‡ | | 2,800 | | 48 | |
Magellan Health Services, Inc. ‡ | | 800 | | 26 | |
McKesson Corp. | | 6,900 | | 405 | |
Molina Healthcare, Inc. ‡ | | 1,500 | | 28 | |
National Healthcare Corp. | | 1,300 | | 47 | |
Odyssey Healthcare, Inc. ‡ | | 4,100 | | 57 | |
Omnicare, Inc. | | 17,000 | | 368 | |
PharMerica Corp. ‡ | | 2,400 | | 37 | |
RehabCare Group, Inc. ‡ | | 900 | | 17 | |
UnitedHealth Group, Inc. | | 28,500 | | 739 | |
Universal American Corp. ‡ | | 4,100 | | 41 | |
Health Care Technology - 0.1% | | | | | |
IMS Health, Inc. | | 5,500 | | 90 | |
Hotels, Restaurants & Leisure - 3.1% | | | | | |
Brinker International, Inc. | | 26,500 | | 335 | |
Cheesecake Factory, Inc. ‡ | | 19,700 | | 358 | |
Churchill Downs, Inc. | | 1,900 | | 60 | |
Domino’s Pizza, Inc. ‡ | | 6,300 | | 46 | |
Frisch’s Restaurants, Inc. | | 1,000 | | 23 | |
| | | | | | |
The notes to the financial statements are an integral part of this report.
69
| | Shares | | Value | |
Hotels, Restaurants & Leisure - (continued) | | | | | |
Gaylord Entertainment Co. ‡ | | 1,000 | | $ | 15 | |
International Speedway Corp. -Class A | | 8,400 | | 214 | |
Isle of Capri Casinos, Inc. ‡ | | 2,100 | | 16 | |
Panera Bread Co. -Class A ‡ | | 5,000 | | 300 | |
Papa John’s International, Inc. ‡ | | 2,100 | | 47 | |
Penn National Gaming, Inc. ‡ | | 2,900 | | 73 | |
PF Chang’s China Bistro, Inc. ‡ | | 1,200 | | 35 | |
Red Robin Gourmet Burgers, Inc. ‡ | | 800 | | 13 | |
Shuffle Master, Inc. ‡ | | 1,500 | | 12 | |
Steak N Shake Co. ‡ | | 3,800 | | 44 | |
Wyndham Worldwide Corp. | | 63,400 | | 1,082 | |
Household Durables - 2.6% | | | | | |
CSS Industries, Inc. | | 1,200 | | 24 | |
D.R. Horton, Inc. | | 45,000 | | 494 | |
Helen of Troy, Ltd. ‡ | | 1,200 | | 27 | |
Jarden Corp. | | 20,500 | | 562 | |
Kimball International, Inc. -Class B | | 4,000 | | 30 | |
Leggett & Platt, Inc. | | 10,900 | | 211 | |
MDC Holdings, Inc. | | 13,000 | | 424 | |
Pulte Homes, Inc. | | 9,600 | | 86 | |
Snap-On, Inc. | | 10,400 | | 380 | |
Tempur-Pedic International, Inc. ‡ | | 900 | | 17 | |
Universal Electronics, Inc. ‡ | | 600 | | 12 | |
Household Products - 0.5% | | | | | |
Kimberly-Clark Corp. | | 7,200 | | 440 | |
Independent Power Producers & Energy Traders - 1.0% | | | | | |
Mirant Corp. ‡ | | 57,400 | | 802 | |
NRG Energy, Inc. ‡ | | 3,600 | | 83 | |
Industrial Conglomerates - 1.3% | | | | | |
Carlisle Cos., Inc. | | 33,300 | | 1,034 | |
Raven Industries, Inc. | | 2,000 | | 49 | |
Tredegar Corp. | | 3,500 | | 48 | |
Insurance - 1.5% | | | | | |
Delphi Financial Group, Inc. -Class A | | 500 | | 11 | |
Enstar Group, Ltd. ‡ | | 400 | | 24 | |
FBL Financial Group, Inc. -Class A | | 1,300 | | 26 | |
HCC Insurance Holdings, Inc. | | 10,600 | | 280 | |
Infinity Property & Casualty Corp. | | 1,100 | | 43 | |
National Interstate Corp. | | 2,600 | | 47 | |
Principal Financial Group, Inc. | | 18,100 | | 453 | |
Transatlantic Holdings, Inc. | | 6,700 | | 338 | |
Internet Software & Services - 0.1% | | | | | |
DivX, Inc. ‡ | | 8,700 | | 42 | |
S1 Corp. ‡ | | 8,000 | | 48 | |
IT Services - 1.9% | | | | | |
Acxiom Corp. ‡ | | 11,100 | | 127 | |
Agilysys, Inc. | | 7,300 | | 34 | |
CACI International, Inc. -Class A ‡ | | 500 | | 24 | |
Ciber, Inc. ‡ | | 8,000 | | 26 | |
Computer Task Group, Inc. ‡ | | 6,100 | | 43 | |
Convergys Corp. ‡ | | 30,800 | | 334 | |
CSG Systems International, Inc. ‡ | | 3,100 | | 51 | |
Hewitt Associates, Inc. -Class A ‡ | | 18,200 | | 645 | |
ManTech International Corp. -Class A ‡ | | 500 | | 22 | |
NeuStar, Inc. -Class A ‡ | | 8,300 | | 192 | |
Teletech Holdings, Inc. ‡ | | 2,800 | | 50 | |
Unisys Corp. ‡ | | 1,000 | | 29 | |
VeriFone Holdings, Inc. ‡ | | 3,200 | | 43 | |
Virtusa Corp. ‡ | | 4,300 | | 39 | |
Leisure Equipment & Products - 0.1% | | | | | |
Pool Corp. | | 1,500 | | 29 | |
RC2 Corp. ‡ | | 1,700 | | 22 | |
Smith & Wesson Holding Corp. ‡ | | 2,700 | | 12 | |
Sturm Ruger & Co., Inc. | | 2,500 | | 27 | |
Life Sciences Tools & Services - 0.7% | | | | | |
Biodelivery Sciences International, Inc. ‡ | | 10,800 | | 43 | |
Bruker Corp. ‡ | | 2,300 | | 25 | |
Thermo Fisher Scientific, Inc. ‡ | | 12,800 | | 576 | |
Machinery - 5.3% | | | | | |
Alamo Group, Inc. | | 3,100 | | 42 | |
American Railcar Industries, Inc. | | 4,500 | | 45 | |
Briggs & Stratton Corp. | | 1,500 | | 28 | |
Bucyrus International, Inc. -Class A | | 10,500 | | 466 | |
Chart Industries, Inc. ‡ | | 2,400 | | 47 | |
CIRCOR International, Inc. | | 1,600 | | 44 | |
Donaldson Co., Inc. | | 14,100 | | 503 | |
Dynamic Materials Corp. | | 1,800 | | 35 | |
Federal Signal Corp. | | 7,200 | | 44 | |
Flowserve Corp. | | 2,800 | | 275 | |
Force Protection, Inc. ‡ | | 6,600 | | 29 | |
Freightcar America, Inc. | | 2,000 | | 47 | |
ITT Corp. | | 6,700 | | 340 | |
Joy Global, Inc. | | 5,800 | | 292 | |
K-Tron International, Inc. ‡ | | 500 | | 48 | |
LB Foster Co. -Class A ‡ | | 700 | | 20 | |
Miller Industries, Inc. ‡ | | 2,900 | | 29 | |
Mueller Industries, Inc. | | 2,000 | | 47 | |
Navistar International Corp. ‡ | | 20,500 | | 679 | |
Oshkosh Corp. | | 35,500 | | 1,109 | |
Timken Co. | | 17,000 | | 375 | |
Watts Water Technologies, Inc. -Class A | | 800 | | 23 | |
Marine - 0.0% | | | | | |
Horizon Lines, Inc. -Class A | | 4,500 | | 24 | |
Media - 1.4% | | | | | |
Cinemark Holdings, Inc. | | 2,200 | | 25 | |
Comcast Corp. -Class A | | 37,600 | | 546 | |
Courier Corp. | | 1,700 | | 25 | |
MediaCom Communications Corp. -Class A ‡ | | 4,900 | | 23 | |
Reading International, Inc. ‡ | | 3,600 | | 14 | |
Regal Entertainment Group -Class A | | 39,900 | | 504 | |
Scholastic Corp. | | 1,900 | | 47 | |
World Wrestling Entertainment, Inc. -Class A | | 1,800 | | 24 | |
Metals & Mining - 1.9% | | | | | |
Brush Engineered Materials, Inc. ‡ | | 1,800 | | 33 | |
Commercial Metals Co. | | 33,400 | | 496 | |
Freeport-McMoRan Copper & Gold, Inc. ‡ | | 7,400 | | 542 | |
Schnitzer Steel Industries, Inc. -Class A | | 1,400 | | 61 | |
Titanium Metals Corp. | | 53,600 | | 461 | |
Worthington Industries, Inc. | | 3,100 | | 34 | |
Multiline Retail - 0.7% | | | | | |
99 Cents Only Stores ‡ | | 42,400 | | 483 | |
Family Dollar Stores, Inc. | | 2,900 | | 82 | |
Fred’s, Inc. -Class A | | 1,900 | | 22 | |
Multi-Utilities - 1.0% | | | | | |
Ameren Corp. | | 33,700 | | 821 | |
Avista Corp. | | 700 | | 13 | |
Sempra Energy | | 3,000 | | 154 | |
| | | | | | |
The notes to the financial statements are an integral part of this report.
70
| | Shares | | Value | |
Oil, Gas & Consumable Fuels - 4.7% | | | | | |
Bill Barrett Corp. ‡ | | 10,000 | | $ | 310 | |
Chesapeake Utilities Corp. | | 1,700 | | 54 | |
Chevron Corp. | | 4,700 | | 360 | |
Clayton Williams Energy, Inc. ‡ | | 900 | | 24 | |
Encore Acquisition Co. ‡ | | 16,800 | | 622 | |
Exco Resources, Inc. | | 31,600 | | 494 | |
Gulfport Energy Corp. ‡ | | 7,900 | | 60 | |
Harvest Natural Resources, Inc. ‡ | | 8,300 | | 46 | |
Murphy Oil Corp. | | 1,400 | | 86 | |
Plains Exploration & Production Co. ‡ | | 37,300 | | 987 | |
Rosetta Resources, Inc. ‡ | | 1,300 | | 18 | |
Southern Union Co. | | 19,700 | | 386 | |
Warren Resources, Inc. ‡ | | 14,600 | | 32 | |
Williams Cos., Inc. | | 28,000 | | 527 | |
World Fuel Services Corp. | | 1,100 | | 56 | |
Paper & Forest Products - 0.1% | | | | | |
Glatfelter | | 4,500 | | 48 | |
Neenah Paper, Inc. | | 4,900 | | 50 | |
Personal Products - 0.0% | | | | | |
Revlon, Inc. -Class A ‡ | | 4,200 | | 35 | |
Pharmaceuticals - 3.5% | | | | | |
Bristol-Myers Squibb Co. | | 27,500 | | 600 | |
Eli Lilly & Co. | | 30,100 | | 1,024 | |
Forest Laboratories, Inc. ‡ | | 21,000 | | 581 | |
Mylan, Inc. ‡ | | 23,600 | | 383 | |
Valeant Pharmaceuticals International ‡ | | 14,800 | | 435 | |
Professional Services - 0.2% | | | | | |
GP Strategies Corp. ‡ | | 4,900 | | 34 | |
VSE Corp. | | 1,600 | | 71 | |
Watson Wyatt Worldwide, Inc. -Class A | | 600 | | 26 | |
Road & Rail - 0.9% | | | | | |
Con-way, Inc. | | 15,300 | | 505 | |
CSX Corp. | | 6,100 | | 257 | |
Heartland Express, Inc. | | 3,200 | | 44 | |
Semiconductors & Semiconductor Equipment - 3.4% | | | | | |
Advanced Analogic Technologies, Inc. ‡ | | 6,400 | | 20 | |
Broadcom Corp. -Class A ‡ | | 12,700 | | 338 | |
Cree, Inc. ‡ | | 18,100 | | 761 | |
Cypress Semiconductor Corp. ‡ | | 19,700 | | 166 | |
Marvell Technology Group, Ltd. ‡ | | 33,200 | | 456 | |
Microsemi Corp. ‡ | | 3,200 | | 43 | |
Photronics, Inc. ‡ | | 6,500 | | 27 | |
PMC-Sierra, Inc. ‡ | | 50,500 | | 430 | |
RF Micro Devices, Inc. ‡ | | 7,200 | | 29 | |
Sigma Designs, Inc. ‡ | | 4,000 | | 48 | |
Skyworks Solutions, Inc. ‡ | | 3,600 | | 38 | |
Standard Microsystems Corp. ‡ | | 1,100 | | 21 | |
Techwell, Inc. ‡ | | 3,000 | | 31 | |
Tessera Technologies, Inc. ‡ | | 2,500 | | 55 | |
White Electronic Designs Corp. ‡ | | 3,400 | | 15 | |
Xilinx, Inc. | | 22,300 | | 485 | |
Zoran Corp. ‡ | | 2,900 | | 26 | |
Software - 3.7% | | | | | |
ACI Worldwide, Inc. ‡ | | 17,000 | | 274 | |
BMC Software, Inc. ‡ | | 3,800 | | 141 | |
Compuware Corp. ‡ | | 97,200 | | 686 | |
Electronic Arts, Inc. ‡ | | 14,700 | | 268 | |
Fair Isaac Corp. | | 16,500 | | 335 | |
i2 Technologies, Inc. ‡ | | 4,100 | | 65 | |
Netscout Systems, Inc. ‡ | | 2,700 | | 33 | |
Radiant Systems, Inc. ‡ | | 6,000 | | 59 | |
Renaissance Learning, Inc. | | 2,300 | | 21 | |
Symantec Corp. ‡ | | 43,900 | | 772 | |
Synopsys, Inc. ‡ | | 19,000 | | 418 | |
THQ, Inc. ‡ | | 9,200 | | 48 | |
Unica Corp. ‡ | | 6,300 | | 44 | |
Specialty Retail - 3.6% | | | | | |
Aaron’s, Inc. | | 6,300 | | 158 | |
Asbury Automotive Group, Inc. ‡ | | 2,900 | | 28 | |
Barnes & Noble, Inc. | | 8,600 | | 143 | |
Borders Group, Inc. ‡ | | 9,500 | | 18 | |
Cabela’s, Inc. ‡ | | 4,900 | | 62 | |
Chico’s FAS, Inc. ‡ | | 40,300 | | 481 | |
Destination Maternity Corp. ‡ | | 600 | | 12 | |
Finish Line, Inc. -Class A | | 4,700 | | 48 | |
Foot Locker, Inc. | | 66,400 | | 695 | |
Gymboree Corp. ‡ | | 200 | | 9 | |
JOS A. Bank Clothiers, Inc. ‡ | | 1,000 | | 41 | |
Lithia Motors, Inc. -Class A ‡ | | 1,600 | | 13 | |
RadioShack Corp. | | 24,500 | | 414 | |
Rent-A-Center, Inc. ‡ | | 22,200 | | 408 | |
Ross Stores, Inc. | | 10,600 | | 466 | |
Sally Beauty Holdings, Inc. ‡ | | 6,900 | | 47 | |
Stage Stores, Inc. | | 2,800 | | 33 | |
Tractor Supply Co. ‡ | | 1,000 | | 45 | |
Textiles, Apparel & Luxury Goods - 1.6% | | | | | |
Carter’s, Inc. ‡ | | 1,800 | | 42 | |
Coach, Inc. | | 11,600 | | 382 | |
Fossil, Inc. ‡ | | 29,800 | | 797 | |
Maidenform Brands, Inc. ‡ | | 3,300 | | 46 | |
Under Armour, Inc. -Class A ‡ | | 3,300 | | 89 | |
Unifirst Corp. | | 1,100 | | 46 | |
Wolverine World Wide, Inc. | | 500 | | 13 | |
Thrifts & Mortgage Finance - 0.0% | | | | | |
Provident New York Bancorp | | 1,500 | | 13 | |
Trading Companies & Distributors - 0.8% | | | | | |
Aircastle, Ltd. | | 1,800 | | 14 | |
Beacon Roofing Supply, Inc. ‡ | | 3,000 | | 43 | |
WESCO International, Inc. ‡ | | 8,900 | | 227 | |
WW Grainger, Inc. | | 4,400 | | 413 | |
Wireless Telecommunication Services - 0.8% | | | | | |
NII Holdings, Inc. ‡ | | 8,700 | | 234 | |
Syniverse Holdings, Inc. ‡ | | 1,800 | | 31 | |
U.S. Cellular Corp. ‡ | | 10,700 | | 392 | |
USA Mobility, Inc. ‡ | | 5,300 | | 58 | |
Total Common Stocks (cost $69,583) | | | | 77,752 | |
| | | | | |
| | Principal | | | |
REPURCHASE AGREEMENT - 25.7% | | | | | |
State Street Repurchase Agreement 0.01%, dated 10/30/2009, to be repurchased at $22,298 on 11/02/2009. Collateralized by a U.S. Government Agency Obligation, 4.00%, due 12/15/2017, and with a value of $22,747. | | $ | 22,298 | | 22,298 | |
Total Repurchase Agreement (cost $22,298) | | | | | |
| | | | | |
Total Investment Securities (cost $91,881) # | | | | 100,050 | |
Other Assets and Liabilities - Net | | | | (13,368 | ) |
| | | | | |
Net Assets | | | | $ | 86,682 | |
| | | | | | | |
The notes to the financial statements are an integral part of this report.
71
| | Shares | | Value | |
SECURITIES SOLD SHORT (89.2%) ¿ | | | | | |
COMMON STOCKS (89.2%) | | | | | |
Aerospace & Defense (2.3%) | | | | | |
Boeing Co. | | (14,700 | ) | $ | (703 | ) |
Ceradyne, Inc. ‡ | | (1,800 | ) | (29 | ) |
Curtiss-Wright Corp. | | (700 | ) | (21 | ) |
Orbital Sciences Corp. ‡ | | (1,400 | ) | (18 | ) |
Spirit Aerosystems Holdings, Inc. -Class A ‡ | | (28,500 | ) | (454 | ) |
Stanley, Inc. ‡ | | (1,900 | ) | (54 | ) |
Transdigm Group, Inc. | | (18,500 | ) | (724 | ) |
Air Freight & Logistics (0.4%) | | | | | |
FedEx Corp. | | (4,100 | ) | (298 | ) |
Forward Air Corp. | | (2,200 | ) | (47 | ) |
Airlines (0.6%) | | | | | |
Continental Airlines, Inc. -Class B ‡ | | (37,300 | ) | (429 | ) |
Southwest Airlines Co. | | (13,700 | ) | (115 | ) |
US Airways Group, Inc. ‡ | | (4,700 | ) | (14 | ) |
Auto Components (1.1%) | | | | | |
Arvinmeritor, Inc. | | (5,700 | ) | (45 | ) |
BorgWarner, Inc. | | (13,200 | ) | (400 | ) |
Dana Holding Corp. ‡ | | (6,900 | ) | (39 | ) |
Drew Industries, Inc. ‡ | | (1,100 | ) | (21 | ) |
Goodyear Tire & Rubber Co. ‡ | | (33,300 | ) | (429 | ) |
Automobiles (0.6%) | | | | | |
Harley-Davidson, Inc. | | (18,100 | ) | (451 | ) |
Winnebago Industries, Inc. ‡ | | (3,000 | ) | (35 | ) |
Beverages (1.3%) | | | | | |
Boston Beer Co., Inc. -Class A ‡ | | (600 | ) | (23 | ) |
Central European Distribution Corp. ‡ | | (8,200 | ) | (255 | ) |
Coca-Cola Co. | | (16,100 | ) | (858 | ) |
Biotechnology (0.1%) | | | | | |
Metabolix, Inc. ‡ | | (4,500 | ) | (46 | ) |
Building Products (0.1%) | | | | | |
Broadwind Energy, Inc. ‡ | | (4,100 | ) | (24 | ) |
Gibraltar Industries, Inc. | | (3,300 | ) | (36 | ) |
Capital Markets (0.5%) | | | | | |
Lazard, Ltd. -Class A | | (9,500 | ) | (359 | ) |
Riskmetrics Group, Inc. ‡ | | (3,200 | ) | (47 | ) |
Teton Advisors, Inc. -Class B ‡ Ə | | (25 | ) | (♦ | ) |
Chemicals (3.5%) | | | | | |
Air Products & Chemicals, Inc. | | (10,000 | ) | (771 | ) |
Celanese Corp., Series A | | (9,500 | ) | (261 | ) |
Cytec Industries, Inc. | | (31,300 | ) | (1,038 | ) |
Dow Chemical Co. | | (4,100 | ) | (96 | ) |
Ferro Corp. | | (7,400 | ) | (45 | ) |
Mosaic Co. | | (8,200 | ) | (383 | ) |
Praxair, Inc. | | (4,800 | ) | (381 | ) |
Rockwood Holdings, Inc. ‡ | | (2,200 | ) | (44 | ) |
Zoltek Cos., Inc. ‡ | | (4,800 | ) | (43 | ) |
Commercial Banks (0.9%) | | | | | |
Bancorp Rhode Island, Inc. | | (1,000 | ) | (26 | ) |
City National Corp. | | (7,200 | ) | (270 | ) |
Columbia Banking System, Inc. | | (3,300 | ) | (49 | ) |
First Financial Bancorp | | (2,800 | ) | (36 | ) |
Heritage Financial Corp. | | (2,600 | ) | (33 | ) |
Northwest Bancorp, Inc. | | (1,100 | ) | (24 | ) |
PNC Financial Services Group, Inc. | | (2,200 | ) | (108 | ) |
Texas Capital Bancshares, Inc. ‡ | | (1,400 | ) | (20 | ) |
Webster Financial Corp. | | (3,700 | ) | (42 | ) |
Zions Bancorporation | | (9,400 | ) | (133 | ) |
Commercial Services & Supplies (2.4%) | | | | | |
Avery Dennison Corp. | | (2,200 | ) | (78 | ) |
Bowne & Co., Inc. ‡ | | (7,061 | ) | (46 | ) |
Clean Harbors, Inc. ‡ | | (10,700 | ) | (604 | ) |
Dollar Financial Corp. ‡ | | (500 | ) | (9 | ) |
Franklin Covey Co. ‡ | | (3,800 | ) | (20 | ) |
GeoEye, Inc. ‡ | | (1,800 | ) | (46 | ) |
Healthcare Services Group Inc. | | (700 | ) | (14 | ) |
Herman Miller, Inc. | | (30,900 | ) | (477 | ) |
Innerworkings, Inc. ‡ | | (11,200 | ) | (58 | ) |
Knoll, Inc. | | (1,100 | ) | (11 | ) |
RR Donnelley & Sons Co. | | (30,200 | ) | (607 | ) |
Standard Parking Corp. ‡ | | (2,800 | ) | (49 | ) |
Communications Equipment (3.3%) | | | | | |
Adtran, Inc. | | (26,100 | ) | (601 | ) |
Airvana, Inc. ‡ | | (7,400 | ) | (45 | ) |
Blue Coat Systems, Inc. ‡ | | (2,000 | ) | (45 | ) |
Ciena Corp. ‡ | | (22,000 | ) | (258 | ) |
DG Fastchannel, Inc. ‡ | | (2,200 | ) | (46 | ) |
Falconstor Software, Inc. ‡ | | (6,500 | ) | (22 | ) |
Harmonic Lightwaves, Inc. ‡ | | (1,800 | ) | (9 | ) |
Ixia ‡ | | (3,200 | ) | (21 | ) |
Juniper Networks, Inc. ‡ | | (38,300 | ) | (978 | ) |
KVH Industries, Inc. ‡ | | (4,700 | ) | (49 | ) |
Motorola, Inc. | | (28,400 | ) | (243 | ) |
Polycom, Inc. ‡ | | (21,000 | ) | (451 | ) |
Riverbed Technology, Inc. ‡ | | (2,300 | ) | (47 | ) |
Viasat, Inc. ‡ | | (1,600 | ) | (47 | ) |
Computers & Peripherals (0.8%) | | | | | |
3PAR, Inc. ‡ | | (4,400 | ) | (41 | ) |
Compellent Technologies, Inc. ‡ | | (1,300 | ) | (24 | ) |
Electronics for Imaging, Inc. ‡ | | (4,100 | ) | (48 | ) |
Imation Corp. | | (8,600 | ) | (76 | ) |
Immersion Corp. ‡ | | (12,300 | ) | (45 | ) |
Netezza Corp. ‡ | | (3,300 | ) | (30 | ) |
QLogic Corp. ‡ | | (25,100 | ) | (441 | ) |
Construction & Engineering (0.1%) | | | | | |
Furmanite Corp. ‡ | | (11,000 | ) | (39 | ) |
MasTec, Inc. ‡ | | (4,000 | ) | (47 | ) |
Pike Electric Corp. ‡ | | (2,700 | ) | (34 | ) |
Construction Materials (0.2%) | | | | | |
Martin Marietta Materials, Inc. | | (2,400 | ) | (200 | ) |
Containers & Packaging (1.1%) | | | | | |
Greif, Inc. -Class A | | (9,500 | ) | (508 | ) |
Owens-Illinois, Inc. ‡ | | (11,500 | ) | (367 | ) |
Packaging Corp. of America | | (6,600 | ) | (121 | ) |
Distributors (0.6%) | | | | | |
LKQ Corp. ‡ | | (30,300 | ) | (523 | ) |
Diversified Consumer Services (0.6%) | | | | | |
DeVry, Inc. | | (9,100 | ) | (503 | ) |
Universal Technical Institute, Inc. ‡ | | (2,500 | ) | (45 | ) |
Diversified Financial Services (0.1%) | | | | | |
Financial Federal Corp. | | (2,000 | ) | (41 | ) |
SWS Group, Inc. | | (2,500 | ) | (33 | ) |
Diversified Telecommunication Services (0.3%) | | | | | |
Atlantic Tele-Network, Inc. | | (900 | ) | (41 | ) |
Hughes Communications, Inc. ‡ | | (1,900 | ) | (44 | ) |
Iowa Telecommunications Services, Inc. | | (4,100 | ) | (48 | ) |
Shenandoah Telecommunications Co. | | (2,700 | ) | (45 | ) |
TW Telecom, Inc. ‡ | | (5,800 | ) | (74 | ) |
| | | | | | |
The notes to the financial statements are an integral part of this report.
72
| | Shares | | Value | |
Electric Utilities (3.2%) | | | | | |
Cleco Corp. | | (32,800 | ) | $ | (812 | ) |
Great Plains Energy, Inc. | | (35,800 | ) | (619 | ) |
Pepco Holdings, Inc. | | (52,500 | ) | (784 | ) |
Portland General Electric Co. | | (500 | ) | (9 | ) |
Southern Co. | | (17,800 | ) | (555 | ) |
Electrical Equipment (1.4%) | | | | | |
Acuity Brands, Inc. | | (1,900 | ) | (60 | ) |
Ametek, Inc. | | (9,900 | ) | (345 | ) |
Baldor Electric Co. | | (1,600 | ) | (41 | ) |
Chase Corp. | | (2,500 | ) | (30 | ) |
Emerson Electric Co. | | (14,000 | ) | (529 | ) |
GrafTech International, Ltd. ‡ | | (2,600 | ) | (35 | ) |
II-VI, Inc. ‡ | | (1,800 | ) | (48 | ) |
IPG Photonics Corp. ‡ | | (5,100 | ) | (70 | ) |
Rockwell Automation, Inc. | | (2,000 | ) | (82 | ) |
Electronic Equipment & Instruments (2.2%) | | | | | |
Agilent Technologies, Inc. ‡ | | (15,000 | ) | (371 | ) |
Cognex Corp. | | (3,100 | ) | (50 | ) |
Coherent, Inc. ‡ | | (1,500 | ) | (38 | ) |
Echelon Corp. ‡ | | (1,700 | ) | (23 | ) |
Faro Technologies, Inc. ‡ | | (2,800 | ) | (43 | ) |
Itron, Inc. ‡ | | (2,600 | ) | (156 | ) |
Littelfuse, Inc. ‡ | | (1,800 | ) | (50 | ) |
MTS Systems Corp. | | (1,900 | ) | (50 | ) |
National Instruments Corp. | | (35,600 | ) | (952 | ) |
Park Electrochemical Corp. | | (2,100 | ) | (47 | ) |
Rofin-Sinar Technologies, Inc. ‡ | | (2,400 | ) | (51 | ) |
Zygo Corp. ‡ | | (4,800 | ) | (33 | ) |
Energy Equipment & Services (1.2%) | | | | | |
Basic Energy Services, Inc. ‡ | | (1,700 | ) | (12 | ) |
Bronco Drilling Co., Inc. ‡ | | (6,000 | ) | (38 | ) |
Diamond Offshore Drilling, Inc. | | (4,100 | ) | (390 | ) |
Dril-Quip, Inc. ‡ | | (1,000 | ) | (49 | ) |
Helmerich & Payne, Inc. | | (2,200 | ) | (84 | ) |
Key Energy Services, Inc. ‡ | | (5,500 | ) | (40 | ) |
Lufkin Industries, Inc. | | (1,200 | ) | (68 | ) |
Pride International, Inc. ‡ | | (13,100 | ) | (387 | ) |
Food & Staples Retailing (1.9%) | | | | | |
Costco Wholesale Corp. | | (7,900 | ) | (449 | ) |
CVS Caremark Corp. | | (15,400 | ) | (544 | ) |
Great Atlantic & Pacific Tea Co. ‡ | | (2,500 | ) | (25 | ) |
Ingles Markets, Inc. -Class A | | (1,500 | ) | (23 | ) |
Ruddick Corp. | | (22,700 | ) | (606 | ) |
Food Products (2.9%) | | | | | |
Alico, Inc. | | (900 | ) | (26 | ) |
Cal-Maine Foods, Inc. | | (900 | ) | (24 | ) |
Corn Products International, Inc. | | (9,700 | ) | (273 | ) |
Farmer Bros Co. | | (1,100 | ) | (21 | ) |
Flowers Foods, Inc. | | (2,900 | ) | (68 | ) |
Griffin Land & Nurseries, Inc. | | (1,600 | ) | (48 | ) |
Hain Celestial Group, Inc. ‡ | | (1,900 | ) | (33 | ) |
HJ Heinz Co. | | (12,700 | ) | (511 | ) |
Imperial Sugar Co. | | (5,000 | ) | (62 | ) |
JM Smucker Co. | | (14,000 | ) | (739 | ) |
Sensient Technologies Corp. | | (28,100 | ) | (711 | ) |
Smart Balance, Inc. ‡ | | (4,300 | ) | (23 | ) |
Gas Utilities (0.9%) | | | | | |
EQT Corp. | | (17,400 | ) | (729 | ) |
Nicor, Inc. | | (1,300 | ) | (48 | ) |
Health Care Equipment & Supplies (2.7%) | | | | | |
Accuray, Inc. ‡ | | (8,600 | ) | (50 | ) |
Cutera, Inc. ‡ | | (2,500 | ) | (23 | ) |
Dentsply International, Inc. | | (18,200 | ) | (599 | ) |
Dexcom, Inc. ‡ | | (6,100 | ) | (42 | ) |
Edwards Lifesciences Corp. ‡ | | (6,200 | ) | (476 | ) |
Gen-Probe, Inc. ‡ | | (11,200 | ) | (467 | ) |
Home Diagnostics, Inc. ‡ | | (3,700 | ) | (23 | ) |
Inverness Medical Innovations, Inc. ‡ | | (8,600 | ) | (327 | ) |
Merit Medical Systems, Inc. ‡ | | (1,900 | ) | (32 | ) |
Natus Medical, Inc. ‡ | | (3,000 | ) | (42 | ) |
Neogen Corp. ‡ | | (900 | ) | (29 | ) |
NuVasive, Inc. ‡ | | (1,200 | ) | (44 | ) |
Palomar Medical Technologies, Inc. ‡ | | (3,700 | ) | (38 | ) |
Somanetics Corp. ‡ | | (900 | ) | (13 | ) |
Utah Medical Products, Inc. | | (1,500 | ) | (44 | ) |
Volcano Corp. ‡ | | (4,400 | ) | (63 | ) |
West Pharmaceutical Services, Inc. | | (800 | ) | (32 | ) |
Health Care Providers & Services (3.6%) | | | | | |
Alliance Healthcare Services, Inc. ‡ | | (8,500 | ) | (46 | ) |
Assisted Living Concepts, Inc. ‡ | | (1,100 | ) | (23 | ) |
Brookdale Senior Living, Inc. ‡ | | (14,400 | ) | (242 | ) |
DaVita, Inc. ‡ | | (10,100 | ) | (536 | ) |
Emeritus Corp. ‡ | | (2,200 | ) | (41 | ) |
Express Scripts, Inc. ‡ | | (1,000 | ) | (80 | ) |
Genoptix, Inc. ‡ | | (1,400 | ) | (49 | ) |
Health Grades, Inc. ‡ | | (10,200 | ) | (44 | ) |
Health Net, Inc. ‡ | | (9,000 | ) | (134 | ) |
IPC The Hospitalist Co., Inc. ‡ | | (1,600 | ) | (48 | ) |
Landauer, Inc. | | (600 | ) | (31 | ) |
Medcath Corp. ‡ | | (5,800 | ) | (48 | ) |
Mednax, Inc. ‡ | | (11,700 | ) | (607 | ) |
Patterson Cos., Inc. ‡ | | (28,300 | ) | (722 | ) |
Psychiatric Solutions, Inc. ‡ | | (14,400 | ) | (297 | ) |
Stewart Enterprises, Inc. -Class A | | (2,100 | ) | (10 | ) |
Sun Healthcare Group, Inc. ‡ | | (3,800 | ) | (35 | ) |
Transcend Services, Inc. ‡ | | (3,300 | ) | (60 | ) |
VCA Antech, Inc. ‡ | | (8,000 | ) | (191 | ) |
Health Care Technology (0.6%) | | | | | |
Athenahealth, Inc. ‡ | | (900 | ) | (34 | ) |
Cerner Corp. ‡ | | (4,700 | ) | (358 | ) |
Computer Programs & Systems, Inc. | | (1,400 | ) | (59 | ) |
Medassets, Inc. ‡ | | (1,000 | ) | (22 | ) |
Phase Forward, Inc. ‡ | | (3,300 | ) | (43 | ) |
Hotels, Restaurants & Leisure (2.5%) | | | | | |
Bally Technologies, Inc. ‡ | | (1,200 | ) | (47 | ) |
Buffalo Wild Wings, Inc. ‡ | | (1,200 | ) | (49 | ) |
Burger King Holdings, Inc. | | (22,400 | ) | (384 | ) |
Einstein Noah Restaurant Group, Inc. ‡ | | (3,800 | ) | (49 | ) |
International Game Technology | | (37,800 | ) | (675 | ) |
Landry’s Restaurants, Inc. ‡ | | (2,200 | ) | (24 | ) |
Live Nation, Inc. ‡ | | (4,000 | ) | (27 | ) |
Marriott International, Inc. -Class A | | (8,261 | ) | (207 | ) |
National Cinemedia, Inc. | | (3,100 | ) | (50 | ) |
Orient-Express Hotels, Ltd. -Class A ‡ | | (1,600 | ) | (14 | ) |
Starwood Hotels & Resorts Worldwide, Inc. | | (19,400 | ) | (564 | ) |
Vail Resorts, Inc. ‡ | | (1,400 | ) | (48 | ) |
Household Durables (2.9%) | | | | | |
Black & Decker Corp. | | (8,100 | ) | (382 | ) |
Cavco Industries, Inc. ‡ | | (2,000 | ) | (61 | ) |
| | | | | | |
The notes to the financial statements are an integral part of this report.
73
| | Shares | | Value | |
Household Durables (continued) | | | | | |
Ethan Allen Interiors, Inc. | | (2,500 | ) | $ | (31 | ) |
Harman International Industries, Inc. | | (17,900 | ) | (673 | ) |
Skyline Corp. | | (2,500 | ) | (44 | ) |
Stanley Furniture Co., Inc. | | (4,600 | ) | (36 | ) |
Toll Brothers, Inc. ‡ | | (40,300 | ) | (698 | ) |
Whirlpool Corp. | | (8,300 | ) | (594 | ) |
Household Products (0.0%) | | | | | |
WD-40 Co. | | (800 | ) | (25 | ) |
Industrial Conglomerates (1.3%) | | | | | |
3M Co. | | (3,700 | ) | (272 | ) |
McDermott International, Inc. ‡ | | (22,700 | ) | (505 | ) |
Otter Tail Corp. | | (1,000 | ) | (23 | ) |
Textron, Inc. | | (18,600 | ) | (331 | ) |
Insurance (0.3%) | | | | | |
Presidential Life Corp. | | (2,900 | ) | (27 | ) |
State Auto Financial Corp. | | (2,800 | ) | (46 | ) |
XL Capital, Ltd. -Class A | | (13,400 | ) | (219 | ) |
Internet & Catalog Retail (0.1%) | | | | | |
Gaiam, Inc. -Class A ‡ | | (3,100 | ) | (20 | ) |
NutriSystem, Inc. | | (1,000 | ) | (21 | ) |
PetMed Express, Inc. | | (1,000 | ) | (16 | ) |
Internet Software & Services (0.1%) | | | | | |
comScore, Inc. ‡ | | (500 | ) | (8 | ) |
Savvis, Inc. ‡ | | (2,800 | ) | (41 | ) |
Vocus, Inc. ‡ | | (1,800 | ) | (33 | ) |
IT Services (0.8%) | | | | | |
Cass Information Systems, Inc. | | (800 | ) | (24 | ) |
Paychex, Inc. | | (20,100 | ) | (572 | ) |
RightNow Technologies, Inc. ‡ | | (1,200 | ) | (18 | ) |
Sapient Corp. ‡ | | (5,900 | ) | (48 | ) |
Syntel, Inc. | | (600 | ) | (21 | ) |
TNS, Inc. ‡ | | (1,700 | ) | (48 | ) |
Leisure Equipment & Products (0.1%) | | | | | |
Jakks Pacific, Inc. ‡ | | (2,600 | ) | (37 | ) |
Marine Products Corp. | | (5,100 | ) | (25 | ) |
Life Sciences Tools & Services (1.7%) | | | | | |
AMAG Pharmaceuticals, Inc. ‡ | | (1,400 | ) | (53 | ) |
Bio-Rad Laboratories, Inc. -Class A ‡ | | (5,100 | ) | (456 | ) |
Covance, Inc. ‡ | | (18,200 | ) | (940 | ) |
Dionex Corp. ‡ | | (500 | ) | (34 | ) |
Machinery (6.7%) | | | | | |
Astec Industries, Inc. ‡ | | (2,100 | ) | (48 | ) |
Badger Meter, Inc. | | (800 | ) | (30 | ) |
Barnes Group, Inc. | | (2,900 | ) | (46 | ) |
Cascade Corp. | | (1,200 | ) | (30 | ) |
Caterpillar, Inc. | | (5,000 | ) | (275 | ) |
Cummins, Inc. | | (12,600 | ) | (543 | ) |
Eaton Corp. | | (3,400 | ) | (206 | ) |
Gardner Denver, Inc. ‡ | | (12,300 | ) | (442 | ) |
Gorman-Rupp Co. | | (900 | ) | (22 | ) |
Graham Corp. | | (3,500 | ) | (50 | ) |
Hurco Cos., Inc. ‡ | | (2,900 | ) | (46 | ) |
Kaydon Corp. | | (1,500 | ) | (52 | ) |
Kennametal, Inc. | | (3,700 | ) | (87 | ) |
Manitowoc Co., Inc. | | (57,900 | ) | (529 | ) |
Nordson Corp. | | (12,000 | ) | (633 | ) |
PACCAR, Inc. | | (26,300 | ) | (985 | ) |
Parker Hannifin Corp. | | (12,200 | ) | (646 | ) |
RBC Bearings, Inc. ‡ | | (1,300 | ) | (28 | ) |
Robbins & Myers, Inc. | | (2,000 | ) | (46 | ) |
Sun Hydraulics Corp. | | (2,500 | ) | (48 | ) |
Terex Corp. ‡ | | (47,700 | ) | (964 | ) |
Marine (0.1%) | | | | | |
Golar LNG, Ltd. | | (3,000 | ) | (36 | ) |
Hornbeck Offshore Services, Inc. ‡ | | (1,800 | ) | (44 | ) |
Media (1.5%) | | | | | |
Arbitron, Inc. | | (2,500 | ) | (54 | ) |
CKX, Inc. ‡ | | (7,000 | ) | (45 | ) |
Lamar Advertising Co. -Class A ‡ | | (14,800 | ) | (360 | ) |
Martha Stewart Living Omnimedia -Class A ‡ | | (2,700 | ) | (14 | ) |
News Corp. -Class A | | (40,600 | ) | (468 | ) |
Rentrak Corp. ‡ | | (2,700 | ) | (41 | ) |
Walt Disney Co. | | (13,200 | ) | (361 | ) |
Metals & Mining (2.1%) | | | | | |
Alcoa, Inc. | | (7,800 | ) | (97 | ) |
AM Castle & Co. | | (4,300 | ) | (48 | ) |
Century Aluminum Co. ‡ | | (38,400 | ) | (333 | ) |
Compass Minerals International, Inc. | | (12,700 | ) | (791 | ) |
Horsehead Holdings Corp. ‡ | | (4,700 | ) | (45 | ) |
Nucor Corp. | | (9,500 | ) | (379 | ) |
Olympic Steel, Inc. | | (1,700 | ) | (43 | ) |
RTI International Metals, Inc. ‡ | | (2,800 | ) | (58 | ) |
Multiline Retail (0.0%) | | | | | |
Saks, Inc. ‡ | | (4,200 | ) | (24 | ) |
Multi-Utilities (0.5%) | | | | | |
PG&E Corp. | | (8,200 | ) | (335 | ) |
Scana Corp. | | (3,300 | ) | (112 | ) |
Office Electronics (0.3%) | | | | | |
Zebra Technologies Corp. -Class A ‡ | | (11,200 | ) | (280 | ) |
Oil, Gas & Consumable Fuels (4.7%) | | | | | |
Brigham Exploration Co. ‡ | | (2,400 | ) | (23 | ) |
Carrizo Oil & Gas, Inc. ‡ | | (900 | ) | (21 | ) |
Comstock Resources, Inc. ‡ | | (20,000 | ) | (823 | ) |
Credo Petroleum Corp. ‡ | | (3,900 | ) | (38 | ) |
Crosstex Energy, Inc. | | (7,100 | ) | (40 | ) |
Georesources, Inc. ‡ | | (3,000 | ) | (33 | ) |
James River Coal Co. ‡ | | (900 | ) | (17 | ) |
Massey Energy Co. | | (12,800 | ) | (372 | ) |
Occidental Petroleum Corp. | | (7,900 | ) | (599 | ) |
Penn Virginia Corp. | | (700 | ) | (14 | ) |
Petrohawk Energy Corp. ‡ | | (29,100 | ) | (684 | ) |
Spectra Energy Corp. | | (8,200 | ) | (157 | ) |
Swift Energy Co. ‡ | | (1,900 | ) | (40 | ) |
Valero Energy Corp. | | (21,400 | ) | (387 | ) |
Whiting Petroleum Corp. ‡ | | (13,800 | ) | (779 | ) |
Paper & Forest Products (0.6%) | | | | | |
Deltic Timber Corp. | | (1,500 | ) | (64 | ) |
International Paper Co. | | (3,500 | ) | (78 | ) |
Weyerhaeuser Co. | | (9,600 | ) | (349 | ) |
Personal Products (1.9%) | | | | | |
Avon Products, Inc. | | (21,800 | ) | (698 | ) |
Elizabeth Arden, Inc. ‡ | | (4,100 | ) | (44 | ) |
Estee Lauder Cos., Inc. -Class A | | (13,500 | ) | (574 | ) |
Female Health Co. ‡ | | (5,200 | ) | (24 | ) |
NBTY, Inc. ‡ | | (7,800 | ) | (284 | ) |
Pharmaceuticals (2.4%) | | | | | |
Allergan, Inc. | | (7,600 | ) | (428 | ) |
Auxilium Pharmaceuticals, Inc. ‡ | | (1,400 | ) | (44 | ) |
| | | | | | |
The notes to the financial statements are an integral part of this report.
74
| | Shares | | Value | |
Pharmaceuticals (continued) | | | | | |
Biomimetic Therapeutics, Inc. ‡ | | (3,429 | ) | $ | (40 | ) |
King Pharmaceuticals, Inc. ‡ | | (57,300 | ) | (580 | ) |
Medicis Pharmaceutical Corp. -Class A | | (23,500 | ) | (497 | ) |
Merck & Co., Inc. | | (11,900 | ) | (368 | ) |
Obagi Medical Products, Inc. ‡ | | (2,300 | ) | (24 | ) |
Salix Pharmaceuticals, Ltd. ‡ | | (2,500 | ) | (46 | ) |
Vivus, Inc. ‡ | | (4,400 | ) | (35 | ) |
Professional Services (1.0%) | | | | | |
Administaff, Inc. | | (2,000 | ) | (50 | ) |
Costar Group, Inc. ‡ | | (1,200 | ) | (47 | ) |
ICF International, Inc. ‡ | | (1,700 | ) | (49 | ) |
Korn/Ferry International ‡ | | (14,200 | ) | (226 | ) |
Monster Worldwide, Inc. ‡ | | (13,100 | ) | (190 | ) |
Resources Connection, Inc. ‡ | | (3,500 | ) | (60 | ) |
Robert Half International, Inc. | | (8,800 | ) | (204 | ) |
TrueBlue, Inc. ‡ | | (3,300 | ) | (40 | ) |
Real Estate Investment Trusts (0.0%) | | | | | |
Bluegreen Corp. ‡ | | (8,000 | ) | (23 | ) |
Real Estate Management & Development (1.8%) | | | | | |
CB Richard Ellis Group, Inc. -Class A ‡ | | (25,500 | ) | (264 | ) |
Consolidated-Tomoka Land Co. | | (1,400 | ) | (48 | ) |
Jones Lang Lasalle, Inc. | | (22,200 | ) | (1,040 | ) |
St. Joe Co. ‡ | | (8,600 | ) | (206 | ) |
Tejon Ranch Co. ‡ | | (900 | ) | (23 | ) |
Road & Rail (2.2%) | | | | | |
Amerco, Inc. ‡ | | (500 | ) | (21 | ) |
Genesee & Wyoming, Inc. -Class A ‡ | | (800 | ) | (23 | ) |
JB Hunt Transport Services, Inc. | | (24,200 | ) | (728 | ) |
Kansas City Southern ‡ | | (29,500 | ) | (715 | ) |
Old Dominion Freight Line, Inc. ‡ | | (1,500 | ) | (39 | ) |
Patriot Transportation Holding, Inc. ‡ | | (500 | ) | (44 | ) |
Werner Enterprises, Inc. | | (18,400 | ) | (345 | ) |
Semiconductors & Semiconductor Equipment (4.1%) | | | | | |
Altera Corp. | | (9,500 | ) | (188 | ) |
Anadigics, Inc. ‡ | | (10,000 | ) | (32 | ) |
Applied Materials, Inc. | | (44,500 | ) | (543 | ) |
Cabot Microelectronics Corp. ‡ | | (1,400 | ) | (45 | ) |
Cavium Networks, Inc. ‡ | | (1,300 | ) | (25 | ) |
COHU, Inc. | | (4,000 | ) | (46 | ) |
FormFactor, Inc. ‡ | | (2,700 | ) | (46 | ) |
KLA-Tencor Corp. | | (9,200 | ) | (299 | ) |
LAM Research Corp. ‡ | | (14,000 | ) | (472 | ) |
Maxim Integrated Products, Inc. | | (43,900 | ) | (731 | ) |
NVIDIA Corp. ‡ | | (15,200 | ) | (182 | ) |
Pericom Semiconductor Corp. ‡ | | (4,800 | ) | (45 | ) |
Power Integrations, Inc. | | (1,400 | ) | (44 | ) |
Silicon Image, Inc. ‡ | | (12,500 | ) | (26 | ) |
Supertex, Inc. ‡ | | (1,900 | ) | (46 | ) |
Ultratech, Inc. ‡ | | (3,600 | ) | (47 | ) |
Varian Semiconductor Equipment Associates, Inc. ‡ | | (24,300 | ) | (689 | ) |
Software (3.0%) | | | | | |
Adobe Systems, Inc. ‡ | | (7,700 | ) | (254 | ) |
American Reprographics Co. ‡ | | (4,900 | ) | (29 | ) |
Autodesk, Inc. ‡ | | (12,500 | ) | (312 | ) |
Blackbaud, Inc. | | (2,200 | ) | (49 | ) |
Citrix Systems, Inc. ‡ | | (16,900 | ) | (621 | ) |
DemandTec, Inc. ‡ | | (2,700 | ) | (24 | ) |
Ebix, Inc. ‡ | | (800 | ) | (49 | ) |
Parametric Technology Corp. ‡ | | (63,000 | ) | (939 | ) |
Salesforce.com, Inc. ‡ | | (2,800 | ) | (159 | ) |
Taleo Corp. -Class A ‡ | | (1,500 | ) | (33 | ) |
Tivo, Inc. ‡ | | (5,100 | ) | (55 | ) |
Tyler Technologies, Inc. ‡ | | (2,700 | ) | (51 | ) |
Specialty Retail (2.6%) | | | | | |
Abercrombie & Fitch Co. -Class A | | (14,100 | ) | (463 | ) |
American Eagle Outfitters, Inc. | | (39,500 | ) | (691 | ) |
Bed Bath & Beyond, Inc. ‡ | | (16,600 | ) | (584 | ) |
Brown Shoe Co., Inc. | | (4,600 | ) | (48 | ) |
Childrens Place Retail Stores, Inc. ‡ | | (1,700 | ) | (53 | ) |
Haverty Furniture Cos., Inc. ‡ | | (2,000 | ) | (24 | ) |
Lowe’s Cos., Inc. | | (3,800 | ) | (74 | ) |
Lumber Liquidators, Inc. ‡ | | (2,300 | ) | (49 | ) |
Pacific Sunwear of California ‡ | | (1,800 | ) | (11 | ) |
Rex Stores Corp. ‡ | | (4,300 | ) | (53 | ) |
Rush Enterprises, Inc. -Class A ‡ | | (2,100 | ) | (23 | ) |
Urban Outfitters, Inc. ‡ | | (6,300 | ) | (198 | ) |
Textiles, Apparel & Luxury Goods (0.2%) | | | | | |
American Apparel, Inc. ‡ | | (3,800 | ) | (12 | ) |
Cherokee, Inc. | | (2,400 | ) | (45 | ) |
Kenneth Cole Productions, Inc. -Class A | | (2,500 | ) | (24 | ) |
K-Swiss, Inc. -Class A | | (3,200 | ) | (26 | ) |
Movado Group, Inc. | | (4,300 | ) | (45 | ) |
Volcom, Inc. ‡ | | (2,700 | ) | (45 | ) |
Thrifts & Mortgage Finance (0.1%) | | | | | |
Astoria Financial Corp. | | (9,200 | ) | (92 | ) |
Trading Companies & Distributors (0.4%) | | | | | |
GATX Corp. | | (9,800 | ) | (266 | ) |
United Rentals, Inc. ‡ | | (4,500 | ) | (43 | ) |
Water Utilities (0.1%) | | | | | |
Connecticut Water Service, Inc. | | (1,500 | ) | (33 | ) |
Pennichuck Corp. | | (2,200 | ) | (50 | ) |
Wireless Telecommunication Services (1.6%) | | | | | |
American Tower Corp. -Class A ‡ | | (4,400 | ) | (162 | ) |
Crown Castle International Corp. ‡ | | (15,700 | ) | (474 | ) |
Leap Wireless International, Inc. ‡ | | (13,500 | ) | (178 | ) |
SBA Communications Corp. -Class A ‡ | | (20,700 | ) | (585 | ) |
Total Common Stocks (cost $72,755) | | | | (77,359 | ) |
| | | | | |
Total Securities Sold Short (proceeds $72,755) | | | | $ | (77,359 | ) |
The notes to the financial statements are an integral part of this report.
75
NOTES TO SCHEDULE OF INVESTMENTS:
‡ | Non-income producing security. |
(♦) | Value and/or principal is less than $(1). |
Ə | Securities fair valued as determined in good faith in accordance with procedures established by the Board of Trustees. These securities aggregated to less than $1, or 0.00% of the fund’s net assets. |
¿ | Cash in the amount of $63,555 is segregated with the broker to cover margin requirements for open securities sold short transactions. |
# | Aggregate cost for federal income tax purposes is $96,196. Aggregate gross unrealized appreciation/depreciation for all securities in which there is an excess of value over tax cost were $6,333 and $2,479, respectively. Net unrealized appreciation for tax purposes is $3,854. |
VALUATION SUMMARY:
Investment Securities | | Level 1 | | Level 2 | | Level 3 | | Total | |
Equities - Consumer Discretionary | | $ | 13,620 | | $ | — | | $ | — | | $ | 13,620 | |
Equities - Consumer Staples | | 5,382 | | — | | — | | 5,382 | |
Equities - Energy | | 5,219 | | — | | — | | 5,219 | |
Equities - Financials | | 1,837 | | — | | — | | 1,837 | |
Equities - Health Care | | 10,025 | | — | | — | | 10,025 | |
Equities - Industrials | | 15,744 | | — | | — | | 15,744 | |
Equities - Information Technology | | 13,399 | | — | | — | | 13,399 | |
Equities - Materials | | 7,085 | | — | | — | | 7,085 | |
Equities - Telecommunication Services | | 1,853 | | — | | — | | 1,853 | |
Equities - Utilities | | 3,588 | | — | | — | | 3,588 | |
Cash & Cash Equivalent - Repurchase Agreement | | — | | 22,298 | | — | | 22,298 | |
Total | | $ | 77,752 | | $ | 22,298 | | $ | — | | $ | 100,050 | |
Securities Sold Short | | Level 1 | | Level 2 | | Level 3 | | Total | |
Equities - Financials | | $ | (3,209 | ) | $ | — | | $ | (♦ | ) | $ | (3,209 | ) |
Equities - Consumer Discretionary | | (11,103 | ) | — | | — | | (11,103 | ) |
Equities - Industrials | | (16,633 | ) | — | | — | | (16,633 | ) |
Equities - Health Care | | (9,642 | ) | — | | — | | (9,642 | ) |
Equities - Information Technology | | (12,626 | ) | — | | — | | (12,626 | ) |
Equities - Materials | | (6,343 | ) | — | | — | | (6,343 | ) |
Equities - Consumer Staples | | (6,971 | ) | — | | — | | (6,971 | ) |
Equities - Telecommunication Services | | (1,651 | ) | — | | — | | (1,651 | ) |
Equities - Energy | | (5,095 | ) | — | | — | | (5,095 | ) |
Equities - Utilities | | (4,086 | ) | — | | — | | (4,086 | ) |
Total | | $ | (77,359 | ) | $ | — | | $ | (♦ | ) | $ | (77,359 | ) |
Level 3 Rollforward
Securities | | Beginning
Balance at
10/31/2008 | | Net
Purchases/(Sales) | | Accrued
Discounts/(Premiums) | | Total Realized
Gain/(Loss) | | Total Unrealized
Appreciation/(Depreciation) | | Net Transfers
In/(Out) of
Level 3 | | Ending
Balance at
10/31/2009 | |
Equities - Financials | | $ | — | | $ | (♦ | ) | $ | — | | $ | — | | $ | — | | $ | — | | $ | (♦ | ) |
| | | | | | | | | | | | | | | | | | | | | | |
The notes to the financial statements are an integral part of this report.
76
Transamerica Federated Market Opportunity
SCHEDULE OF INVESTMENTS
At October 31, 2009
(all amounts except share amounts in thousands)
| | Principal | | Value | |
U.S. GOVERNMENT OBLIGATIONS - 5.6% | | | | | |
United States - 5.6% | | | | | |
U.S. Treasury Bond | | | | | |
3.50%, 02/15/2039 | | $ | 2,000 | | $ | 1,753 | |
4.25%, 05/15/2039 | | 3,000 | | 3,007 | |
Total U.S. Government Obligations
(cost $4,768) | | | | 4,760 | |
| | | | | |
FOREIGN GOVERNMENT OBLIGATIONS - 6.1% | | | | | | |
Argentina - 1.0% | | | | | | |
Republic of Argentina | | | | | | |
0.94%, 08/03/2012 * | | | 1,000 | | 315 | |
8.28%, 12/31/2033 | | | 752 | | 530 | |
Brazil - 1.6% | | | | | | |
Notas do Tesouro Nacional | | | | | | |
6.00%, 05/15/2015 | | BRL | 600 | | 629 | |
10.00%, 01/01/2012 | | BRL | 1,300 | | 741 | |
Colombia - 0.4% | | | | | | |
Colombia Government International Bond | | | | | | |
11.75%, 03/01/2010 | | COP | 600,000 | | 306 | |
Hungary - 0.6% | | | | | | |
Hungary Government Bond | | | | | | |
8.00%, 02/12/2015 | | HUF | 90,000 | | 495 | |
Poland - 1.0% | | | | | | |
Poland Government Bond | | | | | | |
5.25%, 10/25/2017 | | PLN | 2,500 | | 823 | |
South Africa - 0.6% | | | | | | |
South Africa Government Bond | | | | | | |
7.50%, 01/15/2014 | | ZAR | 4,500 | | 552 | |
Turkey - 0.9% | | | | | | |
Turkey Government Bond | | | | | | |
8.24%, 11/03/2010 | | TRY | 1,300 | | 798 | |
Total Foreign Government Obligations (cost $4,140) | | | | 5,189 | |
| | | | | |
| | Shares | | | |
COMMON STOCKS - 34.1% | | | | | |
Bermuda - 0.6% | | | | | |
Bunge, Ltd. | | 9,700 | | 553 | |
Canada - 7.6% | | | | | |
Barrick Gold Corp. | | 46,000 | | 1,652 | |
Enerplus Resources Trust | | 42,100 | | 914 | |
Kinross Gold Corp. | | 82,000 | | 1,524 | |
Pan American Silver Corp. ‡ | | 39,000 | | 816 | |
Yamana Gold, Inc. | | 150,000 | | 1,598 | |
Greece - 0.9% | | | | | |
Opap SA | | 30,000 | | 764 | |
Japan - 8.9% | | | | | |
Familymart Co., Ltd. | | 14,200 | | 423 | |
Lawson, Inc. | | 14,100 | | 630 | |
Nintendo Co., Ltd. | | 5,500 | | 1,380 | |
NTT DoCoMo, Inc. | | 1,230 | | 1,784 | |
Secom Co., Ltd. | | 18,400 | | 858 | |
Seven & I Holdings Co., Ltd. | | 39,300 | | 860 | |
Takeda Pharmaceutical Co., Ltd. | | 41,500 | | 1,660 | |
Switzerland - 0.9% | | | | | |
Noble Corp. | | 19,400 | | 790 | |
United States - 15.2% | | | | | |
Archer-Daniels-Midland Co. | | 14,500 | | 437 | |
Baker Hughes, Inc. | | 20,000 | | 841 | |
Biogen Idec, Inc. ‡ | | 23,100 | | 973 | |
BJ’s Wholesale Club, Inc. ‡ | | 23,600 | | 827 | |
Bristol-Myers Squibb Co. | | 25,700 | | 560 | |
Cephalon, Inc. ‡ | | 22,000 | | 1,201 | |
Ensco International, Inc. | | 3,200 | | 147 | |
Genzyme Corp. ‡ | | 20,000 | | 1,012 | |
Gilead Sciences, Inc. ‡ | | 22,300 | | 949 | |
Intrepid Potash, Inc. ‡ | | 29,000 | | 747 | |
Mosaic Co. | | 15,200 | | 710 | |
Newmont Mining Corp. | | 24,900 | | 1,082 | |
Patterson-UTI Energy, Inc. | | 33,700 | | 525 | |
Pharmaceutical Product Development, Inc. | | 40,200 | | 866 | |
Rowan Cos., Inc. | | 53,300 | | 1,239 | |
Unit Corp. ‡ | | 23,300 | | 911 | |
Total Common Stocks (cost $25,377) | | | | 29,233 | |
| | | | | |
INVESTMENT COMPANIES - 5.7% | | | | | |
Canada - 2.5% | | | | | |
Central Fund of Canada, Ltd. Λ | | 160,000 | | 2,123 | |
United States - 3.2% | | | | | |
PowerShares DB Agriculture Fund | | 109,000 | | 2,787 | |
Total Investment Companies (cost $4,533) | | | | 4,910 | |
| | | | | |
| | Contracts Г | | | |
PURCHASED OPTIONS - 6.8% | | | | | |
Put Options - 6.8% | | | | | |
Select Sector SPDR Trust | | | | | |
Put Strike $30.00 | | | | | |
Expires 01/16/2010 | | 395 | | 1,423 | |
PowerShares QQQ | | | | | |
Put Strike $45.00 | | | | | |
Expires 01/16/2010 | | 204 | | 924 | |
iShares Trust | | | | | |
Put Strike $66.00 | | | | | |
Expires 01/16/2010 | | 134 | | 1,367 | |
SPDR Trust | | | | | |
Put Strike $115.00 | | | | | |
Expires 12/19/2009 | | 84 | | 1,017 | |
Midcap SPDR Trust | | | | | |
Put Strike $135.00 | | | | | |
Expires 01/16/2010 | | 67 | | 1,111 | |
Total Purchased Options (cost $6,512) | | | | 5,842 | |
| | | | | |
| | Principal | | | |
SHORT-TERM U.S. GOVERNMENT OBLIGATION - 1.3% | | | | | |
U.S. Treasury Bill | | | | | |
0.02%, 12/03/2009 p | | 1,100 | | 1,100 | |
Total Short-Term U.S. Government Obligation (cost $1,100) | | | | | |
| | | | | |
REPURCHASE AGREEMENT - 38.7% | | | | | |
State Street Repurchase Agreement 0.01%, dated 10/30/2009, to be repurchased at $33,118 on 11/02/2009. Collateralized by U.S. Government Agency Obligations, 4.00%, due 12/15/2017, and with a value of $33,780. | | $ | 33,118 | | 33,118 | |
Total Repurchase Agreement (cost $33,118) | | | | | |
| | | | | | | | |
The notes to the financial statements are an integral part of this report.
77
| | Shares | | Value | |
SECURITIES LENDING COLLATERAL - 1.3% | | | | | |
State Street Navigator Securities Lending Trust - Prime Portfolio, 0.35% p | | 1,072,500 | | $ | 1,073 | |
Total Securities Lending Collateral (cost $1,073) | | | | | |
| | | | | |
Total Investment Securities (cost $80,621) # | | | | 85,225 | |
Other Assets and Liabilities - Net | | | | 337 | |
| | | | | |
Net Assets | | | | $ | 85,562 | |
FORWARD FOREIGN CURRENCY CONTRACTS:
Currency | | Bought (Sold) | | Settlement
Date | | Amount in U.S.
Dollars Bought
(Sold) | | Net Unrealized
Appreciation
(Depreciation) | |
Australian Dollar | | (2,000 | ) | 02/03/2010 | | (1,636 | ) | $ | (148 | ) |
Australian Dollar | | (1,900 | ) | 03/08/2010 | | (1,628 | ) | (59 | ) |
Brazilian Real | | (3,067 | ) | 12/02/2009 | | (1,700 | ) | (30 | ) |
Canadian Dollar | | (4,394 | ) | 04/05/2010 | | (4,075 | ) | 15 | |
Canadian Dollar | | (5,227 | ) | 04/05/2010 | | (4,850 | ) | 20 | |
Colombian Peso | | (2,326,199 | ) | 12/16/2009 | | (1,200 | ) | 41 | |
Czech Republic Koruna | | (21,978 | ) | 04/01/2010 | | (1,253 | ) | 37 | |
Euro | | (730 | ) | 02/10/2010 | | (1,036 | ) | (38 | ) |
Hungarian Forint | | (231,601 | ) | 04/06/2010 | | (1,224 | ) | 9 | |
Japanese Yen | | (679,553 | ) | 03/08/2010 | | (7,608 | ) | 51 | |
New Zealand Dollar | | (1,700 | ) | 11/23/2009 | | (1,140 | ) | (78 | ) |
New Zealand Dollar | | (3,500 | ) | 03/08/2010 | | (2,483 | ) | (5 | ) |
Norwegian Krone | | (6,970 | ) | 03/12/2010 | | (1,193 | ) | (18 | ) |
Peruvian Sol | | 607 | | 01/11/2010 | | 212 | | (3 | ) |
Polish Zloty | | (3,658 | ) | 04/06/2010 | | (1,242 | ) | (9 | ) |
Republic of Korea Won | | (297,120 | ) | 05/07/2010 | | (252 | ) | (2 | ) |
Republic of Korea Won | | 297,121 | | 05/07/2010 | | 240 | | 15 | |
Russian Ruble | | 8,400 | | 05/14/2010 | | 240 | | 37 | |
South African Rand | | (9,659 | ) | 04/01/2010 | | (1,218 | ) | 15 | |
Swedish Krona | | (11,903 | ) | 03/12/2010 | | (1,692 | ) | 12 | |
| | | | | | | | $ | (138 | ) |
FORWARD FOREIGN CROSS CURRENCY CONTRACTS:
Bought/Sold | | Currency | | Amount | | Settlement
Date | | Unrealized
Appreciation
(Depreciation) | |
Buy | | Canadian Dollar | | 1,334 | | 02/02/2010 | | $ | 15 | |
Sell | | New Zealand Dollar | | (1,800 | ) | 02/02/2010 | | (64 | ) |
Buy | | Japanese Yen | | 112,688 | | 02/02/2010 | | 38 | |
Sell | | New Zealand Dollar | | (1,800 | ) | 02/02/2010 | | (68 | ) |
Buy | | Norwegian Krone | | 5,223 | | 04/06/2010 | | 6 | |
Sell | | Canadian Dollar | | (960 | ) | 04/06/2010 | | 13 | |
Buy | | Singapore Dollar | | 1,473 | | 02/03/2010 | | 29 | |
Sell | | Australian Dollar | | (1,250 | ) | 02/03/2010 | | (94 | ) |
Buy | | Singapore Dollar | | 1,227 | | 04/08/2010 | | (2 | ) |
Sell | | Swiss Franc | | (897 | ) | 04/08/2010 | | 2 | |
Buy | | Singapore Dollar | | 1,455 | | 02/02/2010 | | 29 | |
Sell | | New Zealand Dollar | | (1,500 | ) | 02/02/2010 | | (60 | ) |
| | | | | | | | $ | (156 | ) |
The notes to the financial statements are an integral part of this report.
78
(all amounts in thousands)
INVESTMENTS BY INDUSTRY (unaudited): | | Percentage of
Total Investments | | Value | |
Metals & Mining | | 7.8 | % | $ | 6,672 | |
Derivative | | 6.8 | | 5,842 | |
Foreign Government Obligation | | 6.1 | | 5,189 | |
Capital Markets | | 5.8 | | 4,910 | |
U.S. Government Obligation | | 5.6 | | 4,760 | |
Energy Equipment & Services | | 5.2 | | 4,453 | |
Biotechnology | | 4.8 | | 4,135 | |
Food & Staples Retailing | | 3.3 | | 2,740 | |
Pharmaceuticals | | 2.6 | | 2,220 | |
Wireless Telecommunication Services | | 2.1 | | 1,784 | |
Chemicals | | 1.7 | | 1,457 | |
Software | | 1.6 | | 1,380 | |
Food Products | | 1.1 | | 990 | |
Oil, Gas & Consumable Fuels | | 1.1 | | 914 | |
Life Sciences Tools & Services | | 1.0 | | 866 | |
Commercial Services & Supplies | | 1.0 | | 858 | |
Hotels, Restaurants & Leisure | | 0.9 | | 764 | |
Investment Securities, at Value | | 58.5 | | 49,934 | |
Short-Term Investments | | 41.5 | | 35,291 | |
Total Investments | | 100.0 | % | $ | 85,225 | |
NOTES TO SCHEDULE OF INVESTMENTS:
* Floating or variable rate note. Rate is listed as of 10/31/2009.
‡ Non-income producing security.
Λ All or a portion of this security is on loan. The value of all securities on loan is $1,035.
p Rate shown reflects the yield at 10/31/2009.
Г Contract amounts are not in thousands.
# Aggregate cost for federal income tax purposes is $80,721. Aggregate gross unrealized appreciation/depreciation for all securities in which there is an excess of value over tax cost were $5,896 and $1,392, respectively. Net unrealized appreciation for tax purposes is $4,504.
DEFINITIONS:
BRL | Brazilian Real |
COP | Columbian Peso |
HUF | Hungarian Forint |
PLN | Polish Zloty |
QQQ | NASDAQ 100 Trust |
SPDR | Standard & Poor’s Depository Receipt |
TRY | Turkish New Lira |
ZAR | South African Rand |
VALUATION SUMMARY:
Investment Securities | | Level 1 | | Level 2 | | Level 3 | | Total | |
Equities - Consumer Discretionary | | $ | — | | $ | 764 | | $ | — | | $ | 764 | |
Equities - Consumer Staples | | 1,817 | | 1,912 | | — | | 3,729 | |
Equities - Derivative | | 5,842 | | — | | — | | 5,842 | |
Equities - Energy | | 5,368 | | — | | — | | 5,368 | |
Equities - Health Care | | 5,561 | | 1,660 | | — | | 7,221 | |
Equities - Industrials | | — | | 858 | | — | | 858 | |
Equities - Information Technology | | — | | 1,380 | | — | | 1,380 | |
Equities - Materials | | 8,129 | | — | | — | | 8,129 | |
Equities - Telecommunication Services | | — | | 1,784 | | — | | 1,784 | |
Fixed Income - Foreign Government Obligation | | — | | 5,189 | | — | | 5,189 | |
Fixed Income - Short-Term U.S. Government Obligation | | — | | 1,100 | | — | | 1,100 | |
Fixed Income - U.S. Government Obligation | | — | | 4,760 | | — | | 4,760 | |
Investment Companies - Financials | | 4,910 | | — | | — | | 4,910 | |
Cash & Cash Equivalent - Repurchase Agreement | | — | | 33,118 | | — | | 33,118 | |
Cash & Cash Equivalent - Securities Lending Collateral | | 1,073 | | — | | — | | 1,073 | |
Total | | $ | 32,700 | | $ | 52,525 | | $ | — | | $ | 85,225 | |
Other Financial Instruments * | | Level 1 | | Level 2 | | Level 3 | | Total | |
Forward Foreign Currency Contracts | | $ | — | | $ | (294 | ) | $ | — | | $ | (294 | ) |
Total | | $ | — | | $ | (294 | ) | $ | — | | $ | (294 | ) |
* Other financial instruments are derivative instruments. Future Contracts, Forward Foreign Currency Contracts and Swap Contracts are valued at unrealized appreciation (depreciation) on the instrument.
The notes to the financial statements are an integral part of this report.
79
Transamerica JPMorgan Core Bond
SCHEDULE OF INVESTMENTS
At October 31, 2009
(all amounts in thousands)
| | Principal | | Value | |
U.S. GOVERNMENT OBLIGATIONS - 25.3% | | | | | |
U.S. Treasury Bond | | | | | |
6.13%, 11/15/2027 | | $ | 150 | | $ | 187 | |
6.38%, 08/15/2027 | | 50 | | 64 | |
6.50%, 11/15/2026 | | 100 | | 129 | |
6.63%, 02/15/2027 | | 100 | | 131 | |
6.75%, 08/15/2026 | | 250 | | 329 | |
7.50%, 11/15/2016 | | 1,950 | | 2,507 | |
8.50%, 02/15/2020 | | 50 | | 71 | |
8.75%, 05/15/2017 | | 3,975 | | 5,482 | |
8.88%, 08/15/2017 | | 12,050 | | 16,803 | |
U.S. Treasury Note | | | | | |
1.38%, 09/15/2012 | | 500 | | 500 | |
1.88%, 02/28/2014 | | 6,000 | | 5,959 | |
2.38%, 03/31/2016 | | 1,000 | | 973 | |
4.50%, 11/30/2011 - 05/15/2017 | | 2,100 | | 2,257 | |
4.63%, 02/15/2017 | | 3,750 | | 4,145 | |
4.75%, 08/15/2017 | | 500 | | 556 | |
U.S. Treasury STRIPS | | | | | |
Zero Coupon, 02/15/2014 - 05/15/2036 | | 18,135 | | 14,453 | |
Total U.S. Government Obligations (cost $53,794) | | | | 54,546 | |
| | | | | |
U.S. GOVERNMENT AGENCY OBLIGATIONS - 53.3% | | | | | |
Fannie Mae, PO | | | | | |
04/25/2019 - 11/25/2033 | | 1,319 | | 1,155 | |
Fannie Mae, IO | | | | | |
0.64%, 10/25/2016 | | 2,455 | | 34 | |
5.76%, 02/25/2038 * | | 1,862 | | 180 | |
Fannie Mae | | | | | |
0.46%, 02/25/2036 - 03/25/2045 * | | 1,117 | | 1,072 | |
0.50%, 11/25/2046 * | | 349 | | 335 | |
0.64%, 06/25/2037 * | | 762 | | 752 | |
4.50%, 12/25/2017 | | 608 | | 623 | |
4.55%, 06/25/2043 | | 459 | | 464 | |
5.00%, 03/25/2018 - 06/25/2019 | | 1,475 | | 1,559 | |
5.50%, 01/01/2018 - 06/25/2023 | | 3,255 | | 3,424 | |
5.51%, 07/01/2037 * | | 646 | | 680 | |
5.59%, 12/01/2036 * | | 1,081 | | 1,137 | |
5.62%, 11/01/2037 * | | 756 | | 793 | |
5.66%, 11/01/2036 * | | 307 | | 323 | |
5.67%, 03/01/2036 * | | 844 | | 891 | |
5.73%, 09/01/2036 * | | 477 | | 502 | |
5.76%, 08/01/2037 * | | 931 | | 981 | |
5.86%, 04/01/2037 * | | 381 | | 404 | |
5.90%, 02/25/2015 | | 626 | | 620 | |
5.90%, 11/01/2036 - 12/01/2036 * | | 2,228 | | 2,355 | |
6.00%, 03/01/2019 - 10/25/2036 | | 8,248 | | 8,887 | |
6.01%, 02/01/2037 * | | 630 | | 670 | |
6.02%, 07/01/2037 * | | 552 | | 585 | |
6.02%, 04/01/2036 * | | 1,242 | | 1,312 | |
6.04%, 05/01/2036 * | | 1,646 | | 1,739 | |
6.12%, 09/01/2037 * | | 753 | | 800 | |
6.20%, 08/01/2036 * | | 363 | | 385 | |
6.20%, 11/01/2037 * | | 919 | | 975 | |
6.21%, 06/01/2036 * | | 788 | | 836 | |
6.23%, 02/01/2037 * | | 933 | | 985 | |
6.23%, 10/01/2036 * | | 1,040 | | 1,103 | |
6.26%, 07/01/2037 * | | 812 | | 863 | |
6.29%, 09/01/2037 * | | 344 | | 365 | |
6.35%, 09/01/2036 * | | 1,383 | | 1,472 | |
6.50%, 05/25/2017 - 07/25/2042 | | 4,695 | | 5,082 | |
6.59%, 09/01/2036 * | | 453 | | 479 | |
7.00%, 12/25/2033 - 02/25/2044 | | 4,358 | | 4,773 | |
7.50%, 10/01/2037 - 12/25/2045 | | 2,620 | | 2,887 | |
16.27%, 08/25/2035 * | | 431 | | 479 | |
17.20%, 09/25/2024 * | | 573 | | 654 | |
23.67%, 11/25/2035 * | | 589 | | 795 | |
Freddie Mac, IO | | | | | |
6.21%, 11/15/2037 * | | 354 | | 41 | |
Freddie Mac | | | | | |
0.55%, 04/15/2035 - 03/15/2036 * | | 542 | | 537 | |
4.50%, 06/15/2018 - 03/15/2035 | | 1,798 | | 1,884 | |
5.42%, 05/01/2038 * | | 474 | | 499 | |
5.50%, 01/01/2023 - 07/15/2035 | | 4,360 | | 4,635 | |
5.75%, 03/01/2036 * | | 1,705 | | 1,797 | |
5.81%, 06/01/2037 * | | 842 | | 896 | |
5.81%, 05/01/2037 * | | 567 | | 599 | |
5.82%, 04/01/2037 * | | 667 | | 709 | |
5.85%, 05/01/2037 * | | 1,996 | | 2,113 | |
5.87%, 05/01/2036 * | | 550 | | 580 | |
5.95%, 11/01/2036 * | | 1,041 | | 1,099 | |
5.97%, 05/01/2037 * | | 833 | | 886 | |
5.99%, 03/01/2037 * | | 1,988 | | 2,107 | |
5.99%, 04/01/2037 * | | 1,001 | | 1,061 | |
6.00%, 10/15/2026 | | 403 | | 405 | |
6.02%, 04/01/2037 * | | 295 | | 313 | |
6.05%, 11/01/2036 * | | 453 | | 479 | |
6.05%, 10/01/2037 * | | 696 | | 737 | |
6.17%, 12/01/2036 * | | 1,628 | | 1,730 | |
6.20%, 05/01/2037 * | | 889 | | 947 | |
6.25%, 10/15/2023 | | 1,567 | | 1,689 | |
6.30%, 10/01/2036 * | | 1,125 | | 1,194 | |
6.36%, 12/01/2036 * | | 2,268 | | 2,414 | |
6.38%, 10/01/2037 * | | 1,023 | | 1,086 | |
6.49%, 02/01/2037 * | | 1,157 | | 1,231 | |
6.50%, 02/15/2028 - 09/25/2043 | | 6,877 | | 7,397 | |
7.00%, 02/25/2043 - 07/25/2043 | | 825 | | 902 | |
7.50%, 02/01/2038 - 09/25/2043 | | 2,531 | | 2,782 | |
8.50%, 09/01/2015 | | 355 | | 390 | |
8.63%, 11/15/2033 * | | 103 | | 93 | |
8.78%, 10/15/2033 * | | 358 | | 329 | |
10.00%, 03/17/2026 - 10/01/2030 | | 1,968 | | 2,243 | |
11.00%, 02/17/2021 | | 980 | | 1,081 | |
14.40%, 06/15/2033 * | | 456 | | 507 | |
20.29%, 08/15/2031 * | | 336 | | 412 | |
21.02%, 05/15/2035 * | | 171 | | 194 | |
23.65%, 06/15/2035 * | | 148 | | 171 | |
Freddie Mac, PO | | | | | |
03/15/2020 | | 219 | | 190 | |
11/15/2031 - 04/15/2036 | | 1,058 | | 883 | |
Ginnie Mae, PO | | | | | |
02/20/2034 | | 165 | | 143 | |
Ginnie Mae, IO | | | | | |
5.80%, 02/20/2039 * | | 1,090 | | 94 | |
5.96%, 03/20/2037 - 06/20/2038 * | | 2,317 | | 183 | |
6.06%, 03/20/2039 * | | 972 | | 109 | |
6.16%, 12/20/2038 * | | 1,970 | | 206 | |
| | | | | | | |
The notes to the financial statements are an integral part of this report.
80
| | Principal | | Value | |
U.S. GOVERNMENT AGENCY OBLIGATIONS - (continued) | | | | | |
Ginnie Mae, IO | | | | | |
6.29%, 12/20/2037 * | | $ | 460 | | $ | 35 | |
6.31%, 11/16/2033 - 11/20/2037 * | | 1,111 | | 122 | |
6.50%, 03/20/2039 | | 612 | | 103 | |
6.51%, 03/20/2039 * | | 2,448 | | 293 | |
7.36%, 09/20/2038 * | | 569 | | 69 | |
7.46%, 04/16/2038 * | | 402 | | 36 | |
Ginnie Mae | | | | | |
0.45%, 04/16/2037 * | | 310 | | 303 | |
5.50%, 09/20/2039 | | 500 | | 525 | |
6.00%, 04/20/2020 | | 978 | | 1,064 | |
6.50%, 12/20/2031 - 12/15/2035 | | 1,713 | | 1,880 | |
7.00%, 09/20/2034 * | | 117 | | 109 | |
7.39%, 03/17/2033 * | | 471 | | 452 | |
7.50%, 12/20/2029 - 10/15/2037 | | 4,407 | | 4,754 | |
8.76%, 04/20/2034 * | | 538 | | 546 | |
14.25%, 11/17/2032 * | | 150 | | 172 | |
16.79%, 02/20/2034 * | | 73 | | 82 | |
Tennessee Valley Authority | | | | | |
5.25%, 09/15/2039 | | 40 | | 41 | |
Total U.S. Government Agency Obligations (cost $114,901) | | | | 114,973 | |
| | | | | |
MORTGAGE-BACKED SECURITIES - 6.9% | | | | | |
ASG Resecuritization Trust | | | | | |
Series 2009-2, Class A55 | | | | | |
5.81%, 05/24/2036 -144A | | 177 | | 172 | |
Series 2009-3, Class A65 | | | | | |
5.59%, 03/26/2037 -144A | | 783 | | 765 | |
Banc of America Alternative Loan Trust | | | | | |
Series 2003-11, Class 1A1 | | | | | |
6.00%, 01/25/2034 | | 214 | | 206 | |
Series 2003-11, Class 2A1 | | | | | |
6.00%, 01/25/2034 | | 293 | | 281 | |
Series 2003-9, Class 1CB2 | | | | | |
5.50%, 11/25/2033 | | 398 | | 399 | |
Series 2004-1, Class 5A1 | | | | | |
5.50%, 02/25/2019 | | 150 | | 144 | |
Series 2004-8, Class 3A1 | | | | | |
5.50%, 09/25/2019 | | 185 | | 184 | |
Banc of America Commercial Mortgage, Inc. | | | | | |
Series 2005-3, Class AM | | | | | |
4.73%, 07/10/2043 | | 150 | | 128 | |
Banc of America Funding Corp. | | | | | |
Series 2004-3, Class 1A7 | | | | | |
5.50%, 10/25/2034 | | 288 | | 285 | |
Banc of America Mortgage Securities, Inc. | | | | | |
Series 2003-3, Class 2A1 | | | | | |
0.79%, 05/25/2018 * | | 301 | | 286 | |
Series 2004-3, Class 1A23 | | | | | |
4.50%, 04/25/2034 | | 318 | | 318 | |
Series 2004-5, Class 4A1 | | | | | |
4.75%, 06/25/2019 | | 296 | | 296 | |
BCAP LLC Trust | | | | | |
Series 2009-RR10, Class 17A1 | | | | | |
5.75%, 06/26/2037 -144A Ə | | 400 | | 395 | |
Series 2009-RR5, Class 8A1 | | | | | |
5.50%, 11/26/2034 -144A Ə | | 531 | | 505 | |
Chase Mortgage Finance Corp., PO | | | | | |
Series 2003-S9, Class AP | | | | | |
10/25/2018 | | 197 | | 142 | |
Chase Mortgage Finance Corp. | | | | | |
Series 2007-A2, Class 1A1 | | | | | |
4.05%, 07/25/2037 | | 206 | | 194 | |
Countrywide Home Loan Mortgage Pass-Through Trust | | | | | |
Series 2003-34, Class A6 | | | | | |
5.25%, 09/25/2033 | | 250 | | 252 | |
Series 2004-8, Class 2A1 | | | | | |
4.50%, 06/25/2019 | | 266 | | 263 | |
Credit Suisse First Boston Mortgage Securities Corp. | | | | | |
Series 2003-29, Class 8A1 | | | | | |
6.00%, 11/25/2018 | | 203 | | 198 | |
First Horizon Asset Securities, Inc. | | | | | |
Series 2003-8, Class 2A1 | | | | | |
4.50%, 09/25/2018 | | 359 | | 359 | |
First Union National Bank Commercial Mortgage | | | | | |
Series 2000-C2, Class B | | | | | |
7.28%, 10/15/2032 | | 150 | | 156 | |
GMAC Mortgage Corp. Loan Trust | | | | | |
Series 2003-AR1, Class A4 | | | | | |
4.14%, 10/19/2033 * | | 403 | | 384 | |
Impac Secured Assets CMN Owner Trust | | | | | |
Series 2003-2, Class A1 | | | | | |
5.50%, 08/25/2033 | | 202 | | 202 | |
JPMorgan Mortgage Trust | | | | | |
Series 2006-A2, Class 4A1 | | | | | |
4.06%, 08/25/2034 | | 959 | | 947 | |
Series 2006-A3, Class 6A1 | | | | | |
4.01%, 08/25/2034 | | 251 | | 224 | |
LB-UBS Commercial Mortgage Trust | | | | | |
Series 2006-C1, Class A4 | | | | | |
5.16%, 02/15/2031 | | 150 | | 147 | |
Master Adjustable Rate Mortgages Trust | | | | | |
Series 2004-13, Class 3A6 | | | | | |
3.10%, 11/21/2034 * | | 300 | | 295 | |
Master Alternative Loans Trust | | | | | |
Series 2003-9, Class 2A1 | | | | | |
6.00%, 12/25/2033 | | 319 | | 310 | |
Morgan Stanley Capital I | | | | | |
Series 2006-T21, Class A4 | | | | | |
5.16%, 10/12/2052 | | 200 | | 195 | |
Prime Mortgage Trust, PO | | | | | |
Series 2004-CL1, Class 1PO | | | | | |
02/25/2034 | | 54 | | 37 | |
Residential Accredit Loans, Inc. | | | | | |
Series 2003-QS18, Class A1 | | | | | |
5.00%, 09/25/2018 | | 305 | | 300 | |
Series 2004-QS7, Class A4 | | | | | |
5.50%, 05/25/2034 | | 337 | | 230 | |
Residential Asset Securitization Trust | | | | | |
Series 2002-A13, Class A4 | | | | | |
5.25%, 12/25/2017 | | 343 | | 336 | |
Salomon Brothers Mortgage Securities VII, Inc. | | | | | |
Series 2003-UP1, Class A | | | | | |
3.45%, 04/25/2032 -144A | | 94 | | 77 | |
Structured Asset Securities Corp. | | | | | |
Series 2003-16, Class A3 | | | | | |
0.74%, 06/25/2033 * | | 288 | | 265 | |
TIAA Seasoned Commercial Mortgage Trust | | | | | |
Series 2007-C4, Class A3 | | | | | |
6.07%, 08/15/2039 | | 650 | | 682 | |
| | | | | | | |
The notes to the financial statements are an integral part of this report.
81
| | Principal | | Value | |
MORTGAGE-BACKED SECURITIES - (continued) | | | | | |
Vendee Mortgage Trust | | | | | |
Series 1993-1, Class ZB | | | | | |
7.25%, 02/15/2023 | | $ | 589 | | $ | 647 | |
WaMu Mortgage Pass Through Certificates | | | | | |
Series 2003-S4, Class 2A10 | | | | | |
16.79%, 06/25/2033 * | | 80 | | 78 | |
Series 2004-AR3, Class A1 | | | | | |
3.13%, 06/25/2034 | | 135 | | 128 | |
Series 2004-CB2, Class 7A | | | | | |
5.50%, 08/25/2019 | | 323 | | 320 | |
WaMu Mortgage Pass-Through Certificates | | | | | |
Series 2003-AR6, Class A1 | | | | | |
3.05%, 06/25/2033 * | | 298 | | 281 | |
Series 2004-AR14, Class A1 | | | | | |
4.20%, 01/25/2035 | | 300 | | 286 | |
Series 2004-AR3, Class A2 | | | | | |
3.13%, 06/25/2034 | | 232 | | 218 | |
Wells Fargo Mortgage Backed Securities Trust | | | | | |
Series 2003-15, Class 1A1 | | | | | |
4.75%, 12/25/2018 | | 503 | | 509 | |
Series 2003-J, Class 2A5 | | | | | |
4.44%, 10/25/2033 * | | 82 | | 79 | |
Series 2003-K, Class 1A1 | | | | | |
4.47%, 11/25/2033 * | | 193 | | 190 | |
Series 2004-E, Class A8 | | | | | |
4.86%, 05/25/2034 * | | 345 | | 338 | |
Series 2004-EE, Class 2A1 | | | | | |
3.17%, 12/25/2034 * | | 400 | | 383 | |
Series 2004-EE, Class 2A2 | | | | | |
3.17%, 12/25/2034 * | | 200 | | 193 | |
Series 2004-EE, Class 3A1 | | | | | |
4.06%, 12/25/2034 * | | 218 | | 218 | |
Series 2004-V, Class 1A2 | | | | | |
3.33%, 10/25/2034 | | 209 | | 201 | |
Series 2005-AR8, Class 2A1 | | | | | |
3.67%, 06/25/2035 | | 339 | | 321 | |
Total Mortgage-Backed Securities (cost $14,758) | | | | 14,949 | |
| | | | | |
ASSET-BACKED SECURITIES - 0.4% | | | | | |
Ally Auto Receivables Trust | | | | | |
Series 2009-A, Class A3 | | | | | |
2.33%, 06/17/2013 -144A | | 100 | | 100 | |
Bank of America Auto Trust | | | | | |
Series 2009-2A, Class A3 | | | | | |
2.13%, 09/15/2013 -144A | | 100 | | 101 | |
HFC Home Equity Loan Asset Backed Certificates | | | | | |
Series 2005-2, Class A1 | | | | | |
0.52%, 01/20/2035 * | | 118 | | 108 | |
Series 2006-1, Class A1 | | | | | |
0.41%, 01/20/2036 * | | 229 | | 194 | |
Series 2007-1, Class A2F | | | | | |
5.60%, 03/20/2036 | | 200 | | 203 | |
Series 2007-3, Class APT | | | | | |
1.45%, 11/20/2036 * | | 176 | | 146 | |
Morgan Stanley ABS Capital I | | | | | |
Series 2004-WMC3, Class M1 | | | | | |
0.99%, 01/25/2035 * | | 106 | | 94 | |
Total Asset-Backed Securities (cost $931) | | | | 946 | |
| | | | | |
MUNICIPAL GOVERNMENT OBLIGATION - 0.0% | | | | | |
State of Illinois | | | | | |
5.10%, 06/01/2033 | | 85 | | 77 | |
Total Municipal Government Obligation (cost $79) | | | | | |
| | | | | |
CORPORATE DEBT SECURITIES - 8.9% | | | | | |
Aerospace & Defense - 0.0% | | | | | |
Lockheed Martin Corp. | | | | | |
8.50%, 12/01/2029 | | 80 | | 107 | |
Automobiles - 0.1% | | | | | |
Daimler Finance North America LLC | | | | | |
7.30%, 01/15/2012 | | 160 | | 174 | |
Beverages - 0.1% | | | | | |
Anheuser-Busch InBev Worldwide, Inc. | | | | | |
7.20%, 01/15/2014 -144A | | 60 | | 68 | |
Diageo Capital PLC | | | | | |
7.38%, 01/15/2014 | | 90 | | 104 | |
Capital Markets - 1.0% | | | | | |
Goldman Sachs Group, Inc. | | | | | |
3.63%, 08/01/2012 | | 225 | | 232 | |
6.15%, 04/01/2018 | | 200 | | 213 | |
6.25%, 09/01/2017 | | 650 | | 696 | |
Jefferies Group, Inc. | | | | | |
6.45%, 06/08/2027 | | 180 | | 152 | |
Morgan Stanley | | | | | |
5.55%, 04/27/2017 | | 170 | | 171 | |
5.63%, 09/23/2019 | | 200 | | 201 | |
6.25%, 08/28/2017 | | 250 | | 263 | |
6.63%, 04/01/2018 | | 200 | | 214 | |
Chemicals - 0.1% | | | | | |
Dow Chemical Co. | | | | | |
4.85%, 08/15/2012 | | 190 | | 198 | |
Commercial Banks - 1.3% | | | | | |
Barclays Bank PLC | | | | | |
5.00%, 09/22/2016 | | 100 | | 102 | |
5.20%, 07/10/2014 | | 125 | | 133 | |
BB&T Corp. | | | | | |
3.38%, 09/25/2013 | | 195 | | 196 | |
3.85%, 07/27/2012 | | 85 | | 88 | |
4.90%, 06/30/2017 | | 250 | | 241 | |
Credit Suisse/New York NY | | | | | |
5.30%, 08/13/2019 | | 280 | | 290 | |
Deutsche Bank AG/London | | | | | |
3.88%, 08/18/2014 | | 100 | | 102 | |
M&T Bank Corp. | | | | | |
5.38%, 05/24/2012 | | 80 | | 83 | |
National City Corp. | | | | | |
4.90%, 01/15/2015 | | 165 | | 170 | |
UBS AG | | | | | |
5.88%, 12/20/2017 | | 110 | | 113 | |
Wachovia Bank NA | | | | | |
0.63%, 03/15/2016 * | | 450 | | 402 | |
Wachovia Corp. | | | | | |
5.75%, 06/15/2017 | | 370 | | 386 | |
Wells Fargo & Co. | | | | | |
3.75%, 10/01/2014 | | 390 | | 390 | |
5.63%, 12/11/2017 | | 100 | | 104 | |
Computers & Peripherals - 0.0% | | | | | |
Dell, Inc. | | | | | |
5.65%, 04/15/2018 | | 90 | | 95 | |
| | | | | | | |
The notes to the financial statements are an integral part of this report.
82
| | Principal | | Value | |
CORPORATE DEBT SECURITIES - (continued) | | | | | |
Consumer Finance - 0.2% | | | | | |
American Express Credit Corp. | | | | | |
7.30%, 08/20/2013 | | $ | 200 | | $ | 225 | |
Capital One Financial Corp. | | | | | |
6.75%, 09/15/2017 | | 180 | | 191 | |
7.38%, 05/23/2014 | | 75 | | 85 | |
Diversified Financial Services - 2.6% | | | | | |
Associates Corp. | | | | | |
6.95%, 11/01/2018 | | 300 | | 311 | |
Bank of America Corp. | | | | | |
6.50%, 08/01/2016 | | 500 | | 535 | |
7.38%, 05/15/2014 | | 650 | | 728 | |
Caterpillar Financial Services Corp. | | | | | |
5.85%, 09/01/2017 | | 150 | | 162 | |
7.15%, 02/15/2019 | | 100 | | 117 | |
Citigroup, Inc. | | | | | |
5.50%, 10/15/2014 | | 175 | | 179 | |
6.38%, 08/12/2014 | | 310 | | 329 | |
8.13%, 07/15/2039 | | 100 | | 116 | |
8.50%, 05/22/2019 | | 50 | | 58 | |
Credit Suisse USA, Inc. | | | | | |
5.13%, 08/15/2015 | | 170 | | 181 | |
General Electric Capital Corp. | | | | | |
5.40%, 02/15/2017 | | 400 | | 407 | |
5.63%, 09/15/2017 | | 800 | | 827 | |
6.00%, 08/07/2019 | | 620 | | 652 | |
HSBC Finance Corp. | | | | | |
4.75%, 07/15/2013 | | 165 | | 172 | |
5.50%, 01/19/2016 | | 160 | | 166 | |
John Deere Capital Corp. | | | | | |
5.75%, 09/10/2018 | | 100 | | 109 | |
Merrill Lynch & Co., Inc. - Series MTN | | | | | |
6.88%, 04/25/2018 | | 100 | | 108 | |
Merrill Lynch & Co., Inc. | | | | | |
6.40%, 08/28/2017 | | 150 | | 155 | |
National Rural Utilities Cooperative Finance Corp. | | | | | |
2.63%, 09/16/2012 | | 25 | | 25 | |
Diversified Telecommunication Services - 0.7% | | | | | |
AT&T Corp. | | | | | |
8.00%, 11/15/2031 Ђ | | 270 | | 332 | |
BellSouth Telecommunications, Inc. | | | | | |
6.30%, 12/15/2015 | | 187 | | 201 | |
Cisco Systems, Inc. | | | | | |
5.90%, 02/15/2039 | | 100 | | 106 | |
Deutsche Telekom International Finance BV | | | | | |
6.00%, 07/08/2019 | | 175 | | 188 | |
GTE Corp. | | | | | |
8.75%, 11/01/2021 | | 250 | | 304 | |
Verizon Global Funding Corp. | | | | | |
7.75%, 12/01/2030 | | 100 | | 120 | |
Electric Utilities - 0.3% | | | | | |
Appalachian Power Co. | | | | | |
5.95%, 05/15/2033 | | 50 | | 49 | |
Cleveland Electric Illuminating Co. | | | | | |
7.88%, 11/01/2017 | | 180 | | 217 | |
Consumers Energy Co. | | | | | |
6.70%, 09/15/2019 | | 100 | | 115 | |
Enel Finance International SA | | | | | |
5.13%, 10/07/2019 -144A | | 100 | | 102 | |
Niagara Mohawk Power | | | | | |
4.88%, 08/15/2019 -144A | | 50 | | 50 | |
Pacificorp | | | | | |
5.65%, 07/15/2018 | | 100 | | 109 | |
Electronic Equipment & Instruments - 0.0% | | | | | |
Arrow Electronics, Inc. | | | | | |
6.88%, 06/01/2018 | | 65 | | 68 | |
Energy Equipment & Services - 0.0% | | | | | |
Halliburton Co. | | | | | |
6.15%, 09/15/2019 | | 70 | | 78 | |
Food Products - 0.3% | | | | | |
Cargill, Inc. | | | | | |
7.35%, 03/06/2019 -144A | | 250 | | 292 | |
Kraft Foods, Inc. | | | | | |
6.13%, 08/23/2018 | | 225 | | 240 | |
Gas Utilities - 0.1% | | | | | |
TransCanada Pipelines, Ltd. | | | | | |
6.50%, 08/15/2018 | | 175 | | 198 | |
Health Care Equipment & Supplies - 0.0% | | | | | |
Hospira, Inc. | | | | | |
5.55%, 03/30/2012 | | 100 | | 107 | |
Industrial Conglomerates - 0.0% | | | | | |
Bunge, Ltd. Finance Corp. | | | | | |
8.50%, 06/15/2019 | | 110 | | 128 | |
Insurance - 0.3% | | | | | |
Allstate Corp. | | | | | |
5.00%, 08/15/2014 | | 70 | | 74 | |
Jackson National Life Global Funding | | | | | |
5.38%, 05/08/2013 -144A | | 50 | | 51 | |
Metropolitan Life Global Funding I | | | | | |
2.88%, 09/17/2012 -144A | | 200 | | 201 | |
New York Life Global Funding | | | | | |
4.65%, 05/09/2013 -144A | | 150 | | 159 | |
Principal Life Income Funding Trusts | | | | | |
5.30%, 12/14/2012 | | 200 | | 212 | |
Media - 0.4% | | | | | |
COX Communications, Inc. | | | | | |
5.45%, 12/15/2014 | | 50 | | 54 | |
Historic TW, Inc. | | | | | |
9.15%, 02/01/2023 | | 200 | | 239 | |
News America, Inc. | | | | | |
7.25%, 05/18/2018 | | 55 | | 61 | |
7.30%, 04/30/2028 | | 130 | | 135 | |
TCI Communications, Inc. | | | | | |
7.13%, 02/15/2028 | | 100 | | 105 | |
Thomson Reuters Corp. | | | | | |
4.70%, 10/15/2019 | | 75 | | 75 | |
Time Warner Cable, Inc. | | | | | |
6.75%, 07/01/2018 | | 40 | | 44 | |
8.25%, 04/01/2019 | | 200 | | 241 | |
Viacom, Inc. | | | | | |
6.25%, 04/30/2016 | | 100 | | 109 | |
Multi-Utilities - 0.2% | | | | | |
Dominion Resources, Inc./VA | | | | | |
6.40%, 06/15/2018 | | 170 | | 190 | |
Sempra Energy | | | | | |
8.90%, 11/15/2013 | | 180 | | 213 | |
Oil, Gas & Consumable Fuels - 0.7% | | | | | |
Carolina Power & Light Co. | | | | | |
5.30%, 01/15/2019 | | 80 | | 86 | |
Cenovus Energy, Inc. | | | | | |
5.70%, 10/15/2019 -144A | | 40 | | 42 | |
ConocoPhillips | | | | | |
6.00%, 01/15/2020 | | 105 | | 116 | |
| | | | | | | |
The notes to the financial statements are an integral part of this report.
83
| | Principal | | Value | |
Oil, Gas & Consumable Fuels - (continued) | | | | | |
EnCana Corp. | | | | | |
6.50%, 05/15/2019 | | $ | 150 | | $ | 167 | |
Marathon Oil Corp. | | | | | |
7.50%, 02/15/2019 | | 100 | | 117 | |
Nevada Power Co. | | | | | |
7.13%, 03/15/2019 | | 100 | | 114 | |
NiSource Finance Corp. | | | | | |
10.75%, 03/15/2016 | | 100 | | 119 | |
Petro-Canada | | | | | |
6.05%, 05/15/2018 | | 110 | | 117 | |
Shell International Finance BV | | | | | |
4.30%, 09/22/2019 | | 300 | | 302 | |
Spectra Energy Capital LLC | | | | | |
8.00%, 10/01/2019 | | 190 | | 222 | |
Union Pacific Resources Group, Inc. | | | | | |
7.15%, 05/15/2028 | | 52 | | 53 | |
XTO Energy, Inc. | | | | | |
4.63%, 06/15/2013 | | 60 | | 62 | |
6.25%, 08/01/2017 | | 105 | | 114 | |
Real Estate Investment Trusts - 0.1% | | | | | |
Simon Property Group, LP | | | | | |
6.75%, 05/15/2014 | | 50 | | 54 | |
WEA Finance LLC/WT Finance Aust Pty, Ltd. | | | | | |
6.75%, 09/02/2019 -144A | | 55 | | 56 | |
Road & Rail - 0.3% | | | | | |
Burlington Northern Santa Fe Corp. | | | | | |
4.70%, 10/01/2019 | | 75 | | 75 | |
7.29%, 06/01/2036 | | 90 | | 108 | |
CSX Corp. | | | | | |
6.25%, 03/15/2018 | | 160 | | 175 | |
Union Pacific Corp. | | | | | |
7.00%, 02/01/2016 | | 150 | | 173 | |
Software - 0.1% | | | | | |
Intuit, Inc. | | | | | |
5.75%, 03/15/2017 | | 70 | | 74 | |
Oracle Corp. | | | | | |
5.00%, 07/08/2019 | | 100 | | 105 | |
Wireless Telecommunication Services - 0.0% | | | | | |
Vodafone Group PLC | | | | | |
5.45%, 06/10/2019 | | 75 | | 79 | |
Total Corporate Debt Securities (cost $18,816) | | | | 19,223 | |
| | | | | |
REPURCHASE AGREEMENT - 4.7% | | | | | |
State Street Repurchase Agreement 0.01%, dated 10/30/2009, to be repurchased at $10,096 on 11/02/2009. Collateralized by U.S. Government Agency Obligations, 4.00%, due 12/15/2017 - 12/25/2024, and with a total value of $10,301. | | 10,096 | | 10,096 | |
Total Repurchase Agreement (cost $10,096) | | | | | |
| | | | | |
Total Investment Securities (cost $213,375) # | | | | 214,810 | |
Other Assets and Liabilities - Net | | | | 1,006 | |
| | | | | |
Net Assets | | | | $ | 215,816 | |
| | | | | | | |
NOTES TO SCHEDULE OF INVESTMENTS:
* | Floating or variable rate note. Rate is listed as of 10/31/2009. |
Ђ | Step bond. Interest rate may increase or decrease as the credit rating changes. |
Ə | Security fair valued as determined in good faith in accordance with procedures established by the Board of Trustees. This security aggregated to $900, or 0.42% of the fund’s net assets. |
# | Aggregate cost for federal income tax purposes is $213,375. Aggregate gross unrealized appreciation/depreciation for all securities in which there is an excess of value over tax cost were $2,152 and $717, respectively. Net unrealized appreciation for tax purposes is $1,435. |
DEFINITIONS:
144A | 144A Securities are registered pursuant to Rule 144A of the Securities Act of 1933. These securities are deemed to be liquid for purposes of compliance limitations on holdings of illiquid securities and may be resold as transactions exempt from registration, normally to qualified institutional buyers. At 10/31/2009, these securities aggregated $3,136, or 1.45%, of the fund’s net assets. |
IO | Interest only |
LB | Lehman Brothers |
PO | Principal only |
STRIPS | Separate Trading of Registered Interest and Principal of Securities |
VALUATION SUMMARY:
Investment Securities | | Level 1 | | Level 2 | | Level 3 | | Total | |
Fixed Income - Asset-Backed Security | | $ | — | | $ | 946 | | $ | — | | $ | 946 | |
Fixed Income - Consumer Discretionary | | — | | 1,363 | | — | | 1,363 | |
Fixed Income - Consumer Staples | | — | | 412 | | — | | 412 | |
Fixed Income - Energy | | — | | 1,588 | | — | | 1,588 | |
Fixed Income - Financials | | — | | 11,587 | | — | | 11,587 | |
Fixed Income - Health Care | | — | | 107 | | — | | 107 | |
Fixed Income - Industrials | | — | | 706 | | — | | 706 | |
Fixed Income - Information Technology | | — | | 274 | | — | | 274 | |
Fixed Income - Materials | | — | | 198 | | — | | 198 | |
Fixed Income - Mortgage-Backed Security | | — | | 14,949 | | — | | 14,949 | |
Fixed Income - Municipal Government Obligation | | — | | 77 | | — | | 77 | |
Fixed Income - Telecommunication Services | | — | | 1,624 | | — | | 1,624 | |
Fixed Income - U.S. Government Agency Obligation | | — | | 114,973 | | — | | 114,973 | |
Fixed Income - U.S. Government Obligation | | — | | 54,546 | | — | | 54,546 | |
Fixed Income - Utilities | | — | | 1,364 | | — | | 1,364 | |
Cash & Cash Equivalent - Repurchase Agreement | | — | | 10,096 | | — | | 10,096 | |
Total | | $ | — | | $ | 214,810 | | $ | — | | $ | 214,810 | |
The notes to the financial statements are an integral part of this report.
84
Transamerica JPMorgan International Bond
SCHEDULE OF INVESTMENTS
At October 31, 2009
(all amounts in thousands)
| | Principal | | Value | |
FOREIGN GOVERNMENT OBLIGATIONS - 69.2% | | | | | |
Australia - 0.3% | | | | | |
New South Wales Treasury Corp. | | | | | |
5.50%, 03/01/2017 | | AUD | 2,700 | | $ | 2,350 | |
Belgium - 3.6% | | | | | | |
Belgium Government Bond | | | | | | |
4.00%, 03/28/2018 | | EUR | 17,100 | | 26,126 | |
Canada - 3.2% | | | | | | |
Canadian Government Bond | | | | | | |
3.75%, 06/01/2012 - 06/01/2019 | | CAD | 18,200 | | 17,624 | |
5.75%, 06/01/2033 | | CAD | 4,913 | | 5,724 | |
Denmark - 4.7% | | | | | | |
Denmark Government Bond | | | | | | |
5.00%, 11/15/2013 | | DKK | 35,000 | | 7,528 | |
6.00%, 11/15/2009 - 11/15/2011 | | DKK | 132,920 | | 26,843 | |
France - 7.1% | | | | | | |
Caisse D’amortissement de La Dette Sociale | | | | | | |
3.75%, 10/25/2020 | | EUR | 4,520 | | 6,623 | |
French Government Bond | | | | | | |
5.75%, 10/25/2032 | | EUR | 12,500 | | 22,613 | |
Republic of France | | | | | | |
3.00%, 07/12/2014 | | EUR | 13,300 | | 19,995 | |
4.50%, 07/12/2012 | | EUR | 1,800 | | 2,839 | |
Germany - 2.6% | | | | | | |
Bundesrepublik Deutschland | | | | | | |
3.50%, 07/04/2019 | | EUR | 7,100 | | 10,670 | |
4.25%, 01/04/2014 | | EUR | 3,800 | | 6,029 | |
4.75%, 07/04/2034 | | EUR | 1,400 | | 2,264 | |
Ireland - 1.3% | | | | | | |
Ireland Government Bond | | | | | | |
3.90%, 03/05/2012 | | EUR | 6,000 | | 9,194 | |
Italy - 8.6% | | | | | | |
Italy Buoni Poliennali del Tesoro | | | | | | |
4.00%, 02/01/2037 | | EUR | 9,100 | | 11,773 | |
4.25%, 08/01/2014 | | EUR | 8,000 | | 12,550 | |
5.00%, 08/01/2034 | | EUR | 9,660 | | 14,518 | |
5.25%, 08/01/2017 | | EUR | 15,200 | | 25,106 | |
Japan - 22.9% | | | | | | |
Japan Government Bond | | | | | | |
1.30%, 03/20/2015 | | JPY | 990,000 | | 11,308 | |
1.40%, 12/20/2011 | | JPY | 3,870,000 | | 43,990 | |
1.50%, 09/20/2018 | | JPY | 1,990,000 | | 22,527 | |
1.70%, 09/20/2017 | | JPY | 1,680,000 | | 19,463 | |
1.80%, 06/20/2018 | | JPY | 633,500 | | 7,361 | |
1.90%, 06/20/2025 | | JPY | 2,980,000 | | 33,043 | |
2.10%, 09/20/2024 - 09/20/2028 | | JPY | 2,725,000 | | 30,602 | |
Mexico - 0.7% | | | | | | |
United Mexican States | | | | | | |
10.00%, 12/05/2024 | | MXN | 60,000 | | 5,214 | |
Netherlands - 3.0% | | | | | | |
Netherlands Government Bond | | | | | | |
4.00%, 01/15/2037 | | EUR | 5,050 | | 7,288 | |
4.25%, 07/15/2013 | | EUR | 9,400 | | 14,835 | |
Poland - 1.4% | | | | | | |
Poland Government Bond | | | | | | |
5.75%, 04/25/2014 | | PLN | 29,700 | | 10,299 | |
Spain - 4.8% | | | | | | |
Spain Government Bond | | | | | | |
4.25%, 01/31/2014 | | EUR | 8,800 | | 13,831 | |
4.60%, 07/30/2019 | | EUR | 2,300 | | 3,617 | |
4.90%, 07/30/2040 | | EUR | 1,700 | | 2,656 | |
5.40%, 07/30/2011 | | EUR | 9,600 | | 15,105 | |
Sweden - 1.2% | | | | | | |
Sweden Government Bond | | | | | | |
5.50%, 10/08/2012 | | SEK | 56,720 | | 8,795 | |
United Kingdom - 3.8% | | | | | | |
U.K. Gilt | | | | | | |
2.25%, 03/07/2014 | | GBP | 1,000 | | 1,615 | |
4.25%, 06/07/2032 | | GBP | 5,550 | | 9,282 | |
4.50%, 03/07/2019 - 12/07/2042 | | GBP | 5,660 | | 9,925 | |
4.75%, 09/07/2015 | | GBP | 3,700 | | 6,672 | |
Total Foreign Government Obligations (cost $467,036) | | | | | 507,797 | |
| | | | | | |
MORTGAGE-BACKED SECURITY - 0.6% | | | | | | |
Spain - 0.6% | | | | | | |
UCI | | | | | | |
Series 15, Class A | | | | | | |
0.91%, 12/18/2048 * § | | EUR | 4,378 | | 4,205 | |
Total Mortgage-Backed Security (cost $5,867) | | | | | | |
| | | | | | |
ASSET-BACKED SECURITY - 0.1% | | | | | | |
Spain - 0.1% | | | | | | |
Fondo de Titulizacion de Activos Santander Auto | | | | | | |
Series 1, Class A | | | | | | |
0.91%, 11/25/2021 * § | | EUR | 363 | | 529 | |
Total Asset-Backed Security (cost $462) | | | | | | |
| | | | | | |
CORPORATE DEBT SECURITIES - 26.2% | | | | | | |
Denmark - 1.4% | | | | | | |
Nykredit Realkredit A/S | | | | | | |
4.00%, 10/01/2010 | | DKK | 35,000 | | 7,052 | |
5.00%, 01/01/2010 | | EUR | 2,000 | | 2,961 | |
France - 3.4% | | | | | | |
Compagnie de Financement Foncier | | | | | | |
1.25%, 12/01/2011 | | JPY | 2,230,000 | | 24,716 | |
Germany - 6.5% | | | | | | |
Bayerische Landesbank | | | | | | |
1.40%, 04/22/2013 | | JPY | 1,508,000 | | 16,862 | |
Eurohypo AG | | | | | | |
3.75%, 04/11/2011 | | EUR | 14,800 | | 22,437 | |
Kreditanstalt Fuer Wiederaufbau | | | | | | |
2.60%, 06/20/2037 | | JPY | 355,000 | | 3,895 | |
5.50%, 12/07/2015 | | GBP | 2,150 | | 3,903 | |
Landwirtschaftliche Rentenbank | | | | | | |
1.38%, 04/25/2013 | | JPY | 101,000 | | 1,141 | |
Ireland - 1.8% | | | | | | |
Depfa ACS Bank | | | | | | |
1.65%, 12/20/2016 | | JPY | 800,000 | | 7,467 | |
Ulster Bank Finance PLC | | | | | | |
0.83%, 03/29/2011 * | | EUR | 4,000 | | 5,627 | |
Spain - 4.0% | | | | | | |
AyT Cedulas Cajas VII Fondo de Titulizacion de Activos | | | | | | |
4.00%, 06/23/2011 | | EUR | 15,700 | | 23,668 | |
La Caja de Ahorros y Pensiones de Barcelona | | | | | | |
3.25%, 10/05/2015 | | EUR | 3,900 | | 5,671 | |
Supranational - 4.7% | | | | | | |
European Investment Bank | | | | | | |
1.40%, 06/20/2017 | | JPY | 1,946,000 | | 21,819 | |
4.25%, 10/15/2014 | | EUR | 7,900 | | 12,361 | |
| | | | | | | |
The notes to the financial statements are an integral part of this report.
85
| | Principal | | Value | |
United Kingdom - 4.4% | | | | | |
Barclays Bank PLC | | | | | |
0.91%, 04/20/2016 * | | EUR | 4,000 | | $ | 5,367 | |
Lloyds TSB Bank PLC | | | | | | |
3.75%, 11/17/2011 | | EUR | 5,285 | | 8,062 | |
Network Rail Infrastructure Finance PLC | | | | | | |
4.38%, 01/18/2011 | | GBP | 5,870 | | 9,972 | |
4.75%, 11/29/2035 | | GBP | 2,530 | | 4,386 | |
Royal Bank of Scotland PLC | | | | | | |
3.75%, 11/14/2011 | | EUR | 3,130 | | 4,774 | |
Total Corporate Debt Securities (cost $164,230) | | | | | 192,141 | |
| | | | | |
SHORT-TERM GOVERNMENT OBLIGATION - 0.2% | | | | | |
France Treasury Bill £ | | | | | |
05/06/2010 | | $ | 1,096 | | 1,608 | |
Total Short-Term Government Obligation (cost $1,624) | | | | | |
| | | | | |
REPURCHASE AGREEMENT - 1.5% | | | | | |
State Street Repurchase Agreement 0.01%, dated 10/30/2009, to be repurchased at $10,749 on 11/02/2009. Collateralized by a U.S. Government Agency Obligation, 4.00%, due 12/15/2017, and with a value of $10,968. | | 10,749 | | 10,749 | |
Total Repurchase Agreement (cost $10,749) | | | | | |
| | | | | |
Total Investment Securities (cost $649,968) # | | | | 717,029 | |
Other Assets and Liabilities - Net | | | | 15,935 | |
| | | | | |
Net Assets | | | | $ | 732,964 | |
| | | | | | | | |
INVESTMENTS BY INDUSTRY (unaudited): | | Percentage of
Total Investments | | Value | |
Foreign Government Obligation | | 70.8 | % | $ | 507,797 | |
Commercial Banks | | 15.0 | | 106,962 | |
Thrifts & Mortgage Finance | | 6.5 | | 47,153 | |
Diversified Financial Services | | 5.3 | | 38,026 | |
Mortgage-Backed Security | | 0.6 | | 4,205 | |
Asset-Backed Security | | 0.1 | | 529 | |
Investment Securities, at Value | | 98.3 | | 704,672 | |
Short-Term Investments | | 1.7 | | 12,357 | |
Total Investments | | 100.0 | % | $ | 717,029 | |
FUTURES CONTRACTS:
Description | | Contracts Г | | Expiration Date | | Net Unrealized
Appreciation
(Depreciation) | |
10-Year Government of Canada Bond | | 95 | | 12/18/2009 | | $ | (106 | ) |
10-Year Japan Government Bond | | 24 | | 12/10/2009 | | (118 | ) |
3-Year Australian T-Bond | | 4 | | 12/15/2009 | | (3 | ) |
German Euro BOBL | | 76 | | 12/08/2009 | | 43 | |
German Euro Bund | | 185 | | 12/08/2009 | | 235 | |
German Euro Schatz | | (481 | ) | 12/08/2009 | | (235 | ) |
U.K. Long Gilt | | 20 | | 12/29/2009 | | 25 | |
| | | | | | $ | (159 | ) |
FORWARD FOREIGN CROSS CURRENCY CONTRACTS:
Bought/Sold | | Currency | | Amount | | Settlement
Date | | Unrealized
Appreciation
(Depreciation) | |
Buy | | Canadian Dollar | | 1,202 | | 12/14/2009 | | $ | (27 | ) |
Sell | | Swedish Krona | | (7,976 | ) | 12/14/2009 | | 13 | |
Buy | | Euro | | 770 | | 12/14/2009 | | (17 | ) |
Sell | | Swedish Krona | | (7,984 | ) | 12/14/2009 | | 24 | |
Buy | | Euro | | 1,503 | | 12/14/2009 | | 13 | |
Sell | | Norwegian Krone | | (12,629 | ) | 12/14/2009 | | (4 | ) |
Buy | | Euro | | 1,534 | | 12/14/2009 | | (25 | ) |
Sell | | Pound Sterling | | (1,397 | ) | 12/14/2009 | | (10 | ) |
Buy | | Euro | | 1,075 | | 12/14/2009 | | (33 | ) |
Sell | | Pound Sterling | | (990 | ) | 12/14/2009 | | (11 | ) |
Buy | | Euro | | 770 | | 12/14/2009 | | (17 | ) |
Sell | | Norwegian Krone | | (6,448 | ) | 12/14/2009 | | 26 | |
Buy | | Pound Sterling | | 2,216 | | 12/14/2009 | | (47 | ) |
Sell | | Euro | | (2,448 | ) | 12/14/2009 | | 81 | |
Buy | | Pound Sterling | | 771 | | 12/14/2009 | | 40 | |
Sell | | Euro | | (842 | ) | 12/14/2009 | | (14 | ) |
| | | | | | | | $ | (8 | ) |
The notes to the financial statements are an integral part of this report.
86
FORWARD FOREIGN CURRENCY CONTRACTS:
Currency | | Bought (Sold) | | Settlement
Date | | Amount in U.S.
Dollars Bought
(Sold) | | Net Unrealized
Appreciation
(Depreciation) | |
Australian Dollar | | 7,461 | | 12/14/2009 | | $ | 6,634 | | $ | 53 | |
Canadian Dollar | | (3,093 | ) | 12/14/2009 | | (2,935 | ) | 76 | |
Canadian Dollar | | (11,396 | ) | 12/14/2009 | | (10,806 | ) | 272 | |
Canadian Dollar | | 1,414 | | 12/14/2009 | | 1,369 | | (62 | ) |
Canadian Dollar | | (100 | ) | 12/14/2009 | | (97 | ) | 5 | |
Danish Krone | | (111,286 | ) | 12/14/2009 | | (21,990 | ) | 3 | |
Euro | | (35,242 | ) | 12/14/2009 | | (51,876 | ) | 19 | |
Euro | | 1,461 | | 12/14/2009 | | 2,195 | | (46 | ) |
Euro | | (2,000 | ) | 12/14/2009 | | (2,959 | ) | 16 | |
Euro | | 1,042 | | 12/14/2009 | | 1,540 | | (6 | ) |
Japanese Yen | | 5,669,443 | | 12/14/2009 | | 64,227 | | (1,229 | ) |
Japanese Yen | | (120,419 | ) | 12/14/2009 | | (1,351 | ) | 13 | |
Japanese Yen | | 121,126 | | 12/14/2009 | | 1,343 | | 3 | |
Japanese Yen | | (100,000 | ) | 12/14/2009 | | (1,113 | ) | 2 | |
Japanese Yen | | (300,094 | ) | 12/14/2009 | | (3,300 | ) | (34 | ) |
Norwegian Krone | | 69,249 | | 12/14/2009 | | 12,208 | | (134 | ) |
Norwegian Krone | | 8,103 | | 12/14/2009 | | 1,461 | | (48 | ) |
Polish Zloty | | (28,184 | ) | 12/14/2009 | | (9,846 | ) | 134 | |
Pound Sterling | | 9,579 | | 12/14/2009 | | 15,223 | | 493 | |
Swedish Krona | | (12,899 | ) | 12/14/2009 | | (1,833 | ) | 14 | |
Swedish Krona | | 61,832 | | 12/14/2009 | | 8,895 | | (174 | ) |
Swedish Krona | | (17,728 | ) | 12/14/2009 | | (2,536 | ) | 36 | |
Swiss Franc | | 957 | | 12/14/2009 | | 932 | | 2 | |
| | | | | | | | $ | (592 | ) |
| | | | | | | | | | | |
NOTES TO SCHEDULE OF INVESTMENTS:
* | Floating or variable rate note. Rate is listed as of 10/31/2009. |
§ | Illiquid. These securities aggregated to $4,734, or 0.65%, of the fund’s net assets. |
Г | Contract amounts are not in thousands. |
£ | All or a portion of this security is segregated with the broker to cover margin requirements for open futures contracts. The value of this security segregated at 10/31/2009 is $1,093. |
# | Aggregate cost for federal income tax purposes is $651,575. Aggregate gross unrealized appreciation/depreciation for all securities in which there is an excess of value over tax cost were $70,335 and $4,881, respectively. Net unrealized appreciation for tax purposes is $65,454. |
DEFINITIONS:
AUD | Australian Dollar |
CAD | Canadian Dollar |
DKK | Danish Krone |
EUR | Euro |
GBP | Pound Sterling |
JPY | Japanese Yen |
MXN | Mexican Peso |
PLN | Polish Zloty |
SEK | Swedish Krona |
VALUATION SUMMARY:
Investment Securities | | Level 1 | | Level 2 | | Level 3 | | Total | |
Fixed Income - Asset-Backed Security | | $ | — | | $ | 529 | | $ | — | | $ | 529 | |
Fixed Income - Financials | | — | | 192,141 | | — | | 192,141 | |
Fixed Income - Foreign Government Obligation | | — | | 507,797 | | — | | 507,797 | |
Fixed Income - Mortgage-Backed Security | | — | | 4,205 | | — | | 4,205 | |
Fixed Income - Short-Term Foreign Government Obligation | | — | | 1,608 | | — | | 1,608 | |
Cash & Cash Equivalent - Repurchase Agreement | | — | | 10,749 | | — | | 10,749 | |
Total | | $ | — | | $ | 717,029 | | $ | — | | $ | 717,029 | |
Other Financial Instruments * | | Level 1 | | Level 2 | | Level 3 | | Total | |
Forward Foreign Currency Contracts | | $ | — | | $ | (600 | ) | $ | — | | $ | (600 | ) |
Futures Contracts | | — | | (159 | ) | — | | (159 | ) |
Total | | $ | — | | $ | (759 | ) | $ | — | | $ | (759 | ) |
* Other financial instruments are derivative instruments. Future Contracts, Forward Foreign Currency Contracts and Swap Contracts are valued at unrealized appreciation (depreciation) on the instrument.
The notes to the financial statements are an integral part of this report.
87
Transamerica JPMorgan Mid Cap Value
SCHEDULE OF INVESTMENTS
At October 31, 2009
(all amounts except share amounts in thousands)
| | Shares | | Value | |
COMMON STOCKS - 99.3% | | | | | |
Aerospace & Defense - 2.9% | | | | | |
Alliant Techsystems, Inc. ‡ | | 14,900 | | $ | 1,159 | |
L-3 Communications Holdings, Inc. | | 19,900 | | 1,439 | |
Precision Castparts Corp. | | 24,200 | | 2,311 | |
Auto Components - 0.7% | | | | | |
WABCO Holdings, Inc. | | 49,100 | | 1,165 | |
Beverages - 0.5% | | | | | |
Brown-Forman Corp. -Class B | | 15,925 | | 777 | |
Capital Markets - 1.6% | | | | | |
Affiliated Managers Group, Inc. ‡ | | 9,450 | | 600 | |
Northern Trust Corp. | | 13,300 | | 668 | |
T. Rowe Price Group, Inc. | | 29,400 | | 1,433 | |
Chemicals - 4.4% | | | | | |
Airgas, Inc. | | 38,000 | | 1,686 | |
Albemarle Corp. | | 72,272 | | 2,283 | |
PPG Industries, Inc. | | 31,000 | | 1,749 | |
Sigma-Aldrich Corp. | | 31,700 | | 1,646 | |
Commercial Banks - 6.8% | | | | | |
Bancorpsouth, Inc. Λ | | 20,400 | | 461 | |
BB&T Corp. | | 62,400 | | 1,491 | |
City National Corp. Λ | | 15,900 | | 599 | |
Cullen/Frost Bankers, Inc. | | 28,700 | | 1,343 | |
KeyCorp | | 81,000 | | 437 | |
M&T Bank Corp. Λ | | 48,400 | | 3,041 | |
SunTrust Banks, Inc. | | 52,200 | | 998 | |
Synovus Financial Corp. | | 248,100 | | 551 | |
TCF Financial Corp. Λ | | 92,400 | | 1,093 | |
Wilmington Trust Corp. | | 66,300 | | 799 | |
Zions Bancorporation Λ | | 37,000 | | 524 | |
Commercial Services & Supplies - 1.9% | | | | | |
Republic Services, Inc. -Class A | | 119,900 | | 3,107 | |
Computers & Peripherals - 0.6% | | | | | |
Lexmark International, Inc. -Class A ‡ | | 40,751 | | 1,039 | |
Construction Materials - 0.4% | | | | | |
Vulcan Materials Co. | | 13,000 | | 598 | |
Containers & Packaging - 1.6% | | | | | |
Ball Corp. | | 54,800 | | 2,703 | |
Distributors - 1.1% | | | | | |
Genuine Parts Co. | | 50,000 | | 1,750 | |
Diversified Consumer Services - 0.9% | | | | | |
H&R Block, Inc. | | 85,200 | | 1,563 | |
Diversified Telecommunication Services - 1.7% | | | | | |
CenturyTel, Inc. | | 53,000 | | 1,720 | |
Windstream Corp. | | 110,954 | | 1,070 | |
Electric Utilities - 2.9% | | | | | |
American Electric Power Co., Inc. | | 95,000 | | 2,871 | |
Westar Energy, Inc. | | 100,700 | | 1,928 | |
Electrical Equipment - 1.4% | | | | | |
Cooper Industries PLC -Class A | | 33,800 | | 1,308 | |
Roper Industries, Inc. | | 18,600 | | 940 | |
Electronic Equipment & Instruments - 3.9% | | | | | |
Amphenol Corp. -Class A | | 51,100 | | 2,050 | |
Arrow Electronics, Inc. ‡ | | 81,800 | | 2,073 | |
Tyco Electronics, Ltd. | | 103,000 | | 2,188 | |
Food & Staples Retailing - 2.0% | | | | | |
Safeway, Inc. | | 151,400 | | 3,382 | |
Food Products - 1.9% | | | | | |
JM Smucker Co. | | 51,900 | | | 2,736 | |
McCormick & Co., Inc. | | 10,700 | | 375 | |
Gas Utilities - 4.2% | | | | | |
Energen Corp. | | 68,500 | | 3,005 | |
EQT Corp. | | 55,200 | | 2,311 | |
Oneok, Inc. | | 45,200 | | 1,637 | |
Health Care Equipment & Supplies - 1.5% | | | | | |
Becton Dickinson and Co. | | 37,085 | | 2,535 | |
Health Care Providers & Services - 4.0% | | | | | |
Community Health Systems, Inc. ‡ | | 54,100 | | 1,692 | |
Coventry Health Care, Inc. ‡ | | 71,650 | | 1,421 | |
Lincare Holdings, Inc. ‡ | | 82,583 | | 2,594 | |
VCA Antech, Inc. ‡ | | 38,800 | | 924 | |
Hotels, Restaurants & Leisure - 1.4% | | | | | |
Darden Restaurants, Inc. | | 35,880 | | 1,088 | |
Marriott International, Inc. -Class A | | 47,771 | | 1,197 | |
Household Durables - 1.8% | | | | | |
Fortune Brands, Inc. | | 52,500 | | 2,045 | |
Jarden Corp. | | 35,600 | | 975 | |
Household Products - 1.5% | | | | | |
Clorox Co. | | 21,000 | | 1,244 | |
Energizer Holdings, Inc. ‡ | | 20,800 | | 1,266 | |
Industrial Conglomerates - 1.2% | | | | | |
Carlisle Cos., Inc. | | 63,500 | | 1,971 | |
Insurance - 11.6% | | | | | |
Assurant, Inc. | | 77,900 | | 2,332 | |
Cincinnati Financial Corp. | | 133,155 | | 3,377 | |
Loews Corp. | | 64,900 | | 2,148 | |
Old Republic International Corp. | | 349,450 | | 3,733 | |
OneBeacon Insurance Group, Ltd. -Class A | | 127,965 | | 1,525 | |
Principal Financial Group, Inc. | | 77,800 | | 1,948 | |
Transatlantic Holdings, Inc. | | 43,900 | | 2,217 | |
WR Berkley Corp. | | 73,400 | | 1,814 | |
Internet & Catalog Retail - 0.4% | | | | | |
Expedia, Inc. ‡ | | 29,300 | | 664 | |
Machinery - 0.7% | | | | | |
Dover Corp. | | 5,400 | | 203 | |
Illinois Tool Works, Inc. | | 21,700 | | 997 | |
Media - 4.3% | | | | | |
Cablevision Systems Corp. -Class A | | 58,500 | | 1,343 | |
Clear Channel Outdoor Holdings, Inc. -Class A ‡ | | 148,173 | | 1,011 | |
Omnicom Group, Inc. | | 24,100 | | 826 | |
Scripps Networks Interactive, Inc. -Class A | | 51,600 | | 1,948 | |
Washington Post Co. -Class B | | 4,825 | | 2,085 | |
Multi-Utilities - 4.7% | | | | | |
CMS Energy Corp. | | 177,600 | | 2,361 | |
NSTAR | | 33,200 | | 1,028 | |
PG&E Corp. | | 53,235 | | 2,177 | |
Xcel Energy, Inc. | | 121,200 | | 2,286 | |
Oil, Gas & Consumable Fuels - 6.1% | | | | | |
CVR Energy, Inc. ‡ | | 97,700 | | 1,028 | |
Devon Energy Corp. | | 37,300 | | 2,414 | |
Kinder Morgan Management LLC ‡ | | 46,171 | | 2,161 | |
Teekay Corp. | | 72,400 | | 1,502 | |
Williams Cos., Inc. | | 163,700 | | 3,086 | |
The notes to the financial statements are an integral part of this report.
88
| | Shares | | Value | |
Real Estate Investment Trusts - 4.5% | | | | | |
Kimco Realty Corp. | | 122,500 | | $ | 1,548 | |
Public Storage | | 12,700 | | 935 | |
Rayonier, Inc. | | 8,345 | | 322 | |
Regency Centers Corp. | | 40,800 | | 1,369 | |
Ventas, Inc. | | 37,900 | | 1,521 | |
Vornado Realty Trust | | 28,457 | | 1,695 | |
Real Estate Management & Development - 0.9% | | | | | |
Brookfield Properties Corp. | | 152,050 | | 1,545 | |
Road & Rail - 0.4% | | | | | |
Norfolk Southern Corp. | | 14,100 | | 657 | |
Semiconductors & Semiconductor Equipment - 0.5% | | | | | |
Avago Technologies, Ltd. ‡ | | 55,840 | | 838 | |
Software - 1.1% | | | | | |
Jack Henry & Associates, Inc. | | 81,400 | | 1,878 | |
Specialty Retail - 6.7% | | | | | |
AutoNation, Inc. ‡ | | 53,161 | | 916 | |
AutoZone, Inc. ‡ | | 10,100 | | 1,367 | |
Bed Bath & Beyond, Inc. ‡ | | 30,500 | | 1,074 | |
Gap, Inc. | | 128,500 | | 2,742 | |
Sherwin-Williams Co. | | 12,000 | | 684 | |
Staples, Inc. | | 45,800 | | 994 | |
Tiffany & Co. | | 38,000 | | 1,493 | |
TJX Cos., Inc. | | 43,100 | | 1,610 | |
Textiles, Apparel & Luxury Goods - 1.0% | | | | | |
V.F. Corp. | | 24,400 | | | 1,733 | |
Thrifts & Mortgage Finance - 0.6% | | | | | |
People’s United Financial, Inc. | | 62,200 | | 997 | |
Tobacco - 0.8% | | | | | |
Lorillard, Inc. | | 16,100 | | 1,251 | |
Water Utilities - 0.9% | | | | | |
American Water Works Co., Inc. | | 79,800 | | 1,514 | |
Wireless Telecommunication Services - 1.3% | | | | | |
Telephone & Data Systems, Inc. | | 80,500 | | 2,221 | |
Total Common Stocks (cost $172,250) | | | | 164,677 | |
| | Principal | | | |
REPURCHASE AGREEMENT - 0.8% | | | | | |
State Street Repurchase Agreement 0.01%, dated 10/30/2009, to be repurchased at $1,376 on 11/02/2009. Collateralized by a U.S. Government Agency Obligation, 4.00%, due 12/15/2017, and with a value of $1,405. | | $ | 1,376 | | 1,376 | |
Total Repurchase Agreement (cost $1,376) | | | | | |
| | | | | | |
| | Shares | | | |
SECURITIES LENDING COLLATERAL - 2.5% | | | | | |
State Street Navigator Securities Lending Trust - Prime Portfolio, 0.35% p | | 4,139,359 | | 4,139 | |
Total Securities Lending Collateral (cost $4,139) | | | | | |
| | | | | |
Total Investment Securities (cost $177,765) # | | | | 170,192 | |
Other Assets and Liabilities - Net | | | | (4,354 | ) |
| | | | | | |
Net Assets | | | | $ | 165,838 | |
NOTES TO SCHEDULE OF INVESTMENTS:
‡ | Non-income producing security. |
Λ | All or a portion of this security is on loan. The value of all securities on loan is $4,035. |
p | Rate shown reflects the yield at 10/31/2009. |
# | Aggregate cost for federal income tax purposes is $180,847. Aggregate gross unrealized appreciation/depreciation for all securities in which there is an excess of value over tax cost were $13,031 and $23,686, respectively. Net unrealized depreciation for tax purposes is $10,655. |
VALUATION SUMMARY:
Investment Securities | | Level 1 | | Level 2 | | Level 3 | | Total | |
Equities - Consumer Discretionary | | $ | 30,273 | | $ | — | | $ | — | | $ | 30,273 | |
Equities - Consumer Staples | | 11,031 | | — | | — | | 11,031 | |
Equities - Energy | | 10,191 | | — | | — | | 10,191 | |
Equities - Financials | | 43,063 | | — | | — | | 43,063 | |
Equities - Health Care | | 9,166 | | — | | — | | 9,166 | |
Equities - Industrials | | 14,092 | | — | | — | | 14,092 | |
Equities - Information Technology | | 10,066 | | — | | — | | 10,066 | |
Equities - Materials | | 10,665 | | — | | — | | 10,665 | |
Equities - Telecommunication Services | | 5,012 | | — | | — | | 5,012 | |
Equities - Utilities | | 21,118 | | — | | — | | 21,118 | |
Cash & Cash Equivalent - Repurchase Agreement | | — | | 1,376 | | — | | 1,376 | |
Cash & Cash Equivalent - Securities Lending Collateral | | 4,139 | | — | | — | | 4,139 | |
Total | | $ | 168,816 | | $ | 1,376 | | $ | — | | $ | 170,192 | |
The notes to the financial statements are an integral part of this report.
89
Transamerica Loomis Sayles Bond
SCHEDULE OF INVESTMENTS
At October 31, 2009
(all amounts in thousands)
| | Principal | | Value | |
FOREIGN GOVERNMENT OBLIGATIONS - 15.4% | | | | | |
Australia - 2.8% | | | | | |
New South Wales Treasury Corp. | | | | | |
5.50%, 03/01/2017 | | AUD | 16,980 | | $ | 14,780 | |
6.00%, 05/01/2012 | | AUD | 4,340 | | 3,964 | |
7.00%, 12/01/2010 | | AUD | 4,400 | | 4,063 | |
Brazil - 0.9% | | | | | |
Republic of Brazil | | | | | |
10.25%, 01/10/2028 | | BRL | 12,500 | | 7,078 | |
Canada - 6.3% | | | | | |
Canada Housing Trust | | | | | |
3.55%, 09/15/2013 | | CAD | 1,825 | | 1,750 | |
Canadian Government Bond | | | | | |
2.00%, 09/01/2012 | | CAD | 16,295 | | 15,117 | |
3.75%, 06/01/2012 | | CAD | 6,690 | | 6,502 | |
4.00%, 06/01/2016 | | CAD | 1,685 | | 1,655 | |
4.50%, 06/01/2015 | | CAD | 6,540 | | 6,583 | |
5.25%, 06/01/2012 | | CAD | 10,770 | | 10,844 | |
5.75%, 06/01/2033 | | CAD | 5,300 | | 6,175 | |
Province of Ontario Canada | | | | | |
4.20%, 03/08/2018 | | CAD | 150 | | 142 | |
Province of Quebec Canada | | | | | |
6.75%, 11/09/2015 | | CAD | 4,280 | | 3,093 | |
Colombia - 0.3% | | | | | |
Republic of Colombia | | | | | |
9.85%, 06/28/2027 | | COP | 665,000 | | 371 | |
12.00%, 10/22/2015 | | COP | 3,500,000 | | 2,112 | |
Korea, Republic of - 1.9% | | | | | |
Korea Treasury Bond | | | | | |
5.00%, 09/10/2014 | | KRW | 18,384,830 | | 15,579 | |
Mexico - 1.9% | | | | | |
Mexican Bonos | | | | | |
8.00%, 12/07/2023 | | MXN | 207,000 | | 15,285 | |
New Zealand - 0.9% | | | | | |
New Zealand Government Bond | | | | | |
6.00%, 12/15/2017 | | NZD | 10,210 | | 7,450 | |
Norway - 0.4% | | | | | |
Norway Government Bond | | | | | |
6.50%, 05/15/2013 | | NOK | 15,955 | | 3,073 | |
Total Foreign Government Obligations (cost $118,509) | | | | $ | 125,616 | |
| | | | | |
MORTGAGE-BACKED SECURITIES - 5.5% | | | | | |
United States - 5.5% | | | | | |
Banc of America Alternative Loan Trust | | | | | |
Series 2005-10, Class 1CB1 | | | | | |
0.64%, 11/25/2035 * | | $ | 961 | | 584 | |
Banc of America Commercial Mortgage, Inc. | | | | | |
Series 2007-2, Class A4 | | | | | |
5.69%, 04/10/2049 * | | 500 | | 441 | |
Bear Stearns Commercial Mortgage Securities | | | | | |
Series 2006-PW13, Class A4 | | | | | |
5.54%, 09/11/2041 | | 1,000 | | 1,011 | |
Series 2007-PW15, Class A4 | | | | | |
5.33%, 02/11/2044 | | 1,300 | | 1,185 | |
Series 2007-PW16, Class A4 | | | | | |
5.72%, 06/11/2040 | | 700 | | 666 | |
Citigroup Commercial Mortgage Trust | | | | | |
Series 2006-C5, Class A4 | | | | | |
5.43%, 10/15/2049 | | 2,600 | | 2,419 | |
Series 2007-C9, Class A4 | | | | | |
5.82%, 12/10/2049 * | | 1,050 | | 972 | |
Credit Suisse Mortgage Capital Certificates | | | | | |
Series 2007-C3, Class A4 | | | | | |
5.91%, 06/15/2039 | | 2,410 | | 1,993 | |
Series 2007-C4, Class A4 | | | | | |
5.81%, 09/15/2039 | | 1,200 | | 991 | |
Series 2007-C5, Class A4 | | | | | |
5.70%, 09/15/2040 | | 4,785 | | 3,956 | |
Series 2008-C1, Class A3 | | | | | |
6.22%, 02/15/2041 | | 1,540 | | 1,314 | |
Greenwich Capital Commercial Funding Corp. | | | | | |
Series 2006-GG7, Class A4 | | | | | |
6.12%, 07/10/2038 * | | 6,350 | | 6,089 | |
Series 2007-GG11, Class A4 | | | | | |
5.74%, 12/10/2049 | | 3,100 | | 2,852 | |
Series 2007-GG9, Class A4 | | | | | |
5.44%, 03/10/2039 | | 3,000 | | 2,677 | |
JPMorgan Chase Commercial Mortgage Securities Corp. | | | | | |
Series 2006-LDP6, Class A4 | | | | | |
5.48%, 04/15/2043 | | 200 | | 194 | |
Series 2007-CB19, Class A4 | | | | | |
5.94%, 02/12/2049 * | | 740 | | 675 | |
Series 2007-LD11, Class A4 | | | | | |
5.82%, 06/15/2049 * | | 5,310 | | 4,891 | |
Series 2007-LDPX, Class A3 | | | | | |
5.42%, 01/15/2049 | | 1,700 | | 1,489 | |
LB-UBS Commercial Mortgage Trust | | | | | |
Series 2006-C4, Class A4 | | | | | |
5.88%, 06/15/2038 * | | 300 | | 296 | |
Series 2007-C7, Class A3 | | | | | |
5.87%, 09/15/2045 | | 2,070 | | 1,884 | |
Morgan Stanley Capital I | | | | | |
Series 2006-HQ10, Class A4 | | | | | |
5.33%, 11/12/2041 | | 500 | | 485 | |
Series 2008-T29, Class A4 | | | | | |
6.46%, 01/11/2043 | | 1,900 | | 1,947 | |
Wachovia Bank Commercial Mortgage Trust | | | | | |
Series 2006-C23, Class A4 | | | | | |
5.42%, 01/15/2045 | | 1,300 | | 1,241 | |
Series 2006-C29, Class A4 | | | | | |
5.31%, 11/15/2048 | | 4,335 | | 4,194 | |
Total Mortgage-Backed Securities (cost $36,432) | | | | 44,446 | |
| | | | | |
ASSET-BACKED SECURITIES - 0.9% | | | | | |
United States - 0.9% | | | | | |
Chesapeake Funding LLC | | | | | |
Series 2009-2A, Class B | | | | | |
2.00%, 09/15/2021 -144A * | | 1,000 | | 878 | |
Series 2009-2A, Class C | | | | | |
2.00%, 09/15/2021 -144A * | | 1,200 | | 1,002 | |
Citibank Credit Card Issuance Trust | | | | | |
Series 2005-C1, Class C1 | | | | | |
5.50%, 03/24/2017 | | 300 | | 290 | |
Diamond Resorts Owner Trust | | | | | |
Series 2009-1, Class A | | | | | |
9.31%, 03/20/2026 -144A | | 1,473 | | 1,475 | |
Sierra Receivables Funding Co. | | | | | |
Series 2009-1A, Class A1 | | | | | |
9.79%, 12/22/2025 -144A | | 483 | | 484 | |
Series 2009-3A, Class A1 | | | | | |
7.62%, 07/20/2026 -144A | | 3,475 | | 3,476 | |
Total Asset-Backed Securities (cost $7,434) | | | | 7,605 | |
| | | | | | | | |
The notes to the financial statements are an integral part of this report.
90
| | Principal | | Value | |
CORPORATE DEBT SECURITIES - 67.2% | | | | | |
Australia - 0.7% | | | | | |
FBG Finance, Ltd. | | | | | |
5.88%, 06/15/2035 -144A | | $ | 4,450 | | $ | 4,219 | |
General Electric Capital Australia Funding, Ltd. | | | | | |
8.00%, 02/13/2012 | | AUD | 1,635 | | 1,510 | |
Belgium - 0.1% | | | | | |
Delhaize Group SA | | | | | |
6.50%, 06/15/2017 | | $ | 400 | | 438 | |
Bermuda - 0.4% | | | | | |
White Mountains Re Group, Ltd. | | | | | |
6.38%, 03/20/2017 -144A | | 3,955 | | 3,522 | |
Canada - 1.9% | | | | | |
Barrick Gold Finance Co. | | | | | |
5.80%, 11/15/2034 | | 1,610 | | 1,564 | |
Bell Canada | | | | | |
5.00%, 02/15/2017 -144A | | CAD | 130 | | 123 | |
6.10%, 03/16/2035 -144A | | CAD | 475 | | 416 | |
6.55%, 05/01/2029 -144A | | CAD | 375 | | 342 | |
7.30%, 02/23/2032 -144A | | CAD | 45 | | 45 | |
Bombardier, Inc. | | | | | |
6.30%, 05/01/2014 -144A | | $ | 1,510 | | 1,480 | |
7.45%, 05/01/2034 -144A | | 800 | | 706 | |
Nortel Networks, Ltd. | | | | | |
6.88%, 09/01/2023 Џ | | 410 | | 139 | |
Talisman Energy, Inc. | | | | | |
5.85%, 02/01/2037 | | 710 | | 701 | |
6.25%, 02/01/2038 | | 5,995 | | 6,209 | |
Teck Resources, Ltd. | | | | | |
6.13%, 10/01/2035 | | 836 | | 698 | |
10.75%, 05/15/2019 | | 1,580 | | 1,841 | |
TELUS Corp. | | | | | |
4.95%, 03/15/2017 | | CAD | 1,665 | | 1,572 | |
Cayman Islands - 0.8% | | | | | |
Embraer Overseas, Ltd. | | | | | |
6.38%, 01/24/2017 | | $ | 1,300 | | 1,300 | |
Vale Overseas, Ltd. | | | | | |
6.88%, 11/21/2036 | | 5,450 | | 5,483 | |
Ireland - 0.2% | | | | | |
Elan Finance PLC/Elan Finance Corp. | | | | | |
8.88%, 12/01/2013 | | 1,350 | | 1,316 | |
Korea, Republic of - 0.2% | | | | | |
Korea Gas Corp. | | | | | |
6.00%, 07/15/2014 -144A | | 1,200 | | 1,271 | |
Luxembourg - 0.9% | | | | | |
ArcelorMittal | | | | | |
5.38%, 06/01/2013 | | 3,735 | | 3,849 | |
6.13%, 06/01/2018 | | 100 | | 99 | |
Telecom Italia Capital SA | | | | | |
6.00%, 09/30/2034 | | 2,760 | | 2,644 | |
6.38%, 11/15/2033 | | 548 | | 544 | |
Mexico - 0.3% | | | | | |
America Movil SAB de CV | | | | | |
8.46%, 12/18/2036 | | MXN | 12,000 | | 744 | |
Corporacion GEO SAB de CV | | | | | |
8.88%, 09/25/2014 -144A | | $ | 2,030 | | 2,096 | |
Supranational - 1.4% | | | | | |
European Investment Bank | | | | | |
Zero Coupon, 04/24/2013 -144A | | IDR | 118,809,000 | | 9,317 | |
7.00%, 01/18/2012 | | NZD | 1,580 | | 1,187 | |
International Bank For Reconstruction & Development | | | | | |
9.50%, 05/27/2010 | | ISK | 129,100 | | 1,036 | |
Sweden - 0.5% | | | | | |
Volvo Treasury AB | | | | | |
5.95%, 04/01/2015 -144A | | $ | 3,600 | | 3,660 | |
United Arab Emirates - 0.8% | | | | | |
Abu Dhabi National Energy Co. | | | | | |
6.25%, 09/16/2019 -144A | | 700 | | 705 | |
DP World, Ltd. | | | | | |
6.85%, 07/02/2037 -144A | | 6,410 | | 5,739 | |
United Kingdom - 1.0% | | | | | |
Barclays Bank PLC | | | | | |
6.05%, 12/04/2017 -144A | | 2,195 | | 2,236 | |
British Sky Broadcasting Group PLC | | | | | |
6.10%, 02/15/2018 -144A | | 1,500 | | 1,603 | |
BSKYB Finance UK PLC | | | | | |
5.63%, 10/15/2015 -144A | | 860 | | 936 | |
6.50%, 10/15/2035 -144A | | 855 | | 873 | |
Virgin Media Finance PLC | | | | | |
9.50%, 08/15/2016 | | 2,000 | | 2,115 | |
United States - 58.0% | | | | | |
Agilent Technologies, Inc. | | | | | |
5.50%, 09/14/2015 | | 2,915 | | 3,008 | |
Alcatel-Lucent USA, Inc. | | | | | |
6.45%, 03/15/2029 | | 6,210 | | 4,875 | |
6.50%, 01/15/2028 | | 1,275 | | 1,001 | |
Alcoa, Inc. | | | | | |
5.55%, 02/01/2017 | | 100 | | 99 | |
5.72%, 02/23/2019 | | 700 | | 672 | |
5.87%, 02/23/2022 | | 695 | | 642 | |
5.95%, 02/01/2037 | | 4,155 | | 3,586 | |
6.75%, 01/15/2028 | | 1,395 | | 1,324 | |
Allegheny Energy Supply Co., LLC | | | | | |
5.75%, 10/15/2019 -144A | | 1,940 | | 1,912 | |
Ameren Energy Generating Co. | | | | | |
7.00%, 04/15/2018 | | 2,550 | | 2,567 | |
American Airlines Pass-Through Trust | | | | | |
7.86%, 10/01/2011 | | 2,965 | | 2,950 | |
10.38%, 07/02/2019 | | 995 | | 1,104 | |
American General Finance Corp. | | | | | |
6.90%, 12/15/2017 | | 6,900 | | 4,802 | |
American Water Capital Corp. | | | | | |
6.59%, 10/15/2037 | | 3,550 | | 3,700 | |
Amkor Technology, Inc. | | | | | |
7.75%, 05/15/2013 | | 1,360 | | 1,357 | |
Anadarko Petroleum Corp. | | | | | |
6.45%, 09/15/2036 | | 2,425 | | 2,523 | |
Aramark Corp. | | | | | |
5.00%, 06/01/2012 | | 2,200 | | 2,068 | |
ArcelorMittal USA, Inc. | | | | | |
6.50%, 04/15/2014 | | 85 | | 89 | |
Associates Corp. | | | | | |
6.95%, 11/01/2018 | | 1,645 | | 1,704 | |
AT&T, Inc. | | | | | |
6.50%, 03/15/2029 | | 200 | | 204 | |
Avnet, Inc. | | | | | |
6.00%, 09/01/2015 | | 1,210 | | 1,245 | |
Bank of America Corp. | | | | | |
5.42%, 03/15/2017 | | 1,520 | | 1,488 | |
5.75%, 12/01/2017 | | 2,730 | | 2,776 | |
8.00%, 12/29/2049 *■Ž | | 215 | | 193 | |
| | | | | | | | |
The notes to the financial statements are an integral part of this report.
91
| | Principal | | Value | |
United States - (continued) | | | | | |
BMC Software, Inc. | | | | | |
7.25%, 06/01/2018 § | | $ | 2,514 | | $ | 2,707 | |
Boston Scientific Corp. | | | | | |
5.45%, 06/15/2014 | | 55 | | 56 | |
6.40%, 06/15/2016 | | 625 | | 638 | |
7.00%, 11/15/2035 Ђ | | 1,205 | | 1,174 | |
Bruce Mansfield Unit | | | | | |
6.85%, 06/01/2034 § | | 2,787 | | 2,912 | |
Case New Holland, Inc. | | | | | |
7.75%, 09/01/2013 -144A | | 3,980 | | 3,950 | |
Chesapeake Energy Corp. | | | | | |
6.88%, 11/15/2020 | | 1,115 | | 1,026 | |
Citigroup, Inc. | | | | | |
5.00%, 09/15/2014 | | 3,015 | | 2,973 | |
5.50%, 02/15/2017 | | 7,020 | | 7,078 | |
5.85%, 12/11/2034 | | 395 | | 360 | |
5.88%, 05/29/2037 | | 545 | | 502 | |
6.13%, 08/25/2036 | | 215 | | 191 | |
Comcast Corp. | | | | | |
5.65%, 06/15/2035 | | 7,605 | | 7,131 | |
COX Communications, Inc. | | | | | |
6.45%, 12/01/2036 -144A | | 2,275 | | 2,266 | |
6.95%, 06/01/2038 -144A | | 555 | | 581 | |
8.38%, 03/01/2039 -144A | | 485 | | 581 | |
CSC Holdings, Inc. | | | | | |
7.63%, 07/15/2018 | | 1,480 | | 1,517 | |
CSX Corp. | | | | | |
6.00%, 10/01/2036 | | 3,332 | | 3,358 | |
6.25%, 03/15/2018 | | 3,460 | | 3,773 | |
CVS Pass-Through Trust | | | | | |
6.94%, 01/10/2030 | | 1,278 | | 1,315 | |
Cytec Industries, Inc. | | | | | |
8.95%, 07/01/2017 | | 1,485 | | 1,738 | |
D.R. Horton, Inc. | | | | | |
5.63%, 09/15/2014 | | 540 | | 516 | |
6.50%, 04/15/2016 | | 170 | | 162 | |
Delta Air Lines, Inc. | | | | | |
6.82%, 08/10/2022 | | 2,630 | | 2,427 | |
8.02%, 08/10/2022 | | 2,451 | | 2,084 | |
Dillard’s, Inc. | | | | | |
7.13%, 08/01/2018 | | 990 | | 772 | |
Dynegy Holdings, Inc. | | | | | |
7.50%, 06/01/2015 | | 65 | | 60 | |
7.63%, 10/15/2026 | | 450 | | 306 | |
7.75%, 06/01/2019 | | 625 | | 527 | |
El Paso Corp. | | | | | |
7.42%, 02/15/2037 | | 1,235 | | 1,078 | |
El Paso Natural Gas Co. | | | | | |
5.95%, 04/15/2017 | | 1,590 | | 1,624 | |
Embarq Corp. | | | | | |
7.08%, 06/01/2016 | | 515 | | 563 | |
Energy Future Holdings Corp. | | | | | |
5.55%, 11/15/2014 | | 6,735 | | 4,885 | |
6.50%, 11/15/2024 | | 1,110 | | 535 | |
6.55%, 11/15/2034 | | 305 | | 141 | |
Energy Transfer Partners, LP | | | | | |
6.13%, 02/15/2017 | | 4,840 | | 5,114 | |
Equifax, Inc. | | | | | |
7.00%, 07/01/2037 | | 400 | | 384 | |
ERAC USA Finance Co. | | | | | |
6.70%, 06/01/2034 -144A | | 100 | | 90 | |
7.00%, 10/15/2037 -144A | | 4,815 | | 4,649 | |
Ford Motor Co. | | | | | |
6.50%, 08/01/2018 | | 100 | | 80 | |
6.63%, 02/15/2028 | | 4,788 | | 3,495 | |
7.50%, 08/01/2026 | | 115 | | 86 | |
Ford Motor Credit Co. LLC | | | | | |
7.00%, 10/01/2013 | | 200 | | 190 | |
7.25%, 10/25/2011 | | 825 | | 809 | |
7.50%, 08/01/2012 | | 1,080 | | 1,052 | |
8.00%, 12/15/2016 | | 300 | | 290 | |
Fortune Brands, Inc. | | | | | |
5.88%, 01/15/2036 | | 2,060 | | 1,742 | |
Frontier Communications Corp. | | | | | |
7.13%, 03/15/2019 | | 400 | | 376 | |
7.88%, 01/15/2027 | | 1,405 | | 1,289 | |
GATX Corp. | | | | | |
4.75%, 10/01/2012 | | 1,800 | | 1,833 | |
General Electric Capital Corp. | | | | | |
2.96%, 05/18/2012 | | SGD | 2,500 | | 1,754 | |
3.49%, 03/08/2012 | | SGD | 2,400 | | 1,710 | |
4.38%, 09/21/2015 | | $ | 17,475 | | 17,772 | |
7.63%, 12/10/2014 | | NZD | 320 | | 233 | |
Georgia-Pacific LLC | | | | | |
7.25%, 06/01/2028 | | $ | 190 | | 173 | |
7.38%, 12/01/2025 | | 1,000 | | 933 | |
7.70%, 06/15/2015 | | 235 | | 242 | |
7.75%, 11/15/2029 | | 875 | | 818 | |
8.00%, 01/15/2024 | | 2,500 | | 2,525 | |
8.88%, 05/15/2031 | | 2,125 | | 2,178 | |
GMAC, Inc. | | | | | |
5.38%, 06/06/2011 -144A | | 968 | | 910 | |
5.75%, 09/27/2010 -144A | | 1,206 | | 1,182 | |
6.00%, 12/15/2011 -144A | | 1,506 | | 1,412 | |
6.63%, 05/15/2012 -144A | | 1,712 | | 1,614 | |
6.75%, 12/01/2014 -144A | | 1,051 | | 954 | |
6.88%, 09/15/2011 -144A | | 303 | | 289 | |
8.00%, 11/01/2031 -144A | | 595 | | 509 | |
Goldman Sachs Group, Inc. | | | | | |
5.63%, 01/15/2017 | | 370 | | 379 | |
6.75%, 10/01/2037 | | 1,660 | | 1,748 | |
Harley-Davidson Funding Corp. | | | | | |
6.80%, 06/15/2018 -144A | | 6,865 | | 6,823 | |
Hasbro, Inc. | | | | | |
6.60%, 07/15/2028 | | 4,730 | | 4,468 | |
HCA, Inc. | | | | | |
5.75%, 03/15/2014 | | 615 | | 572 | |
6.25%, 02/15/2013 | | 110 | | 106 | |
6.30%, 10/01/2012 | | 180 | | 176 | |
6.38%, 01/15/2015 | | 2,115 | | 1,978 | |
6.50%, 02/15/2016 | | 4,915 | | 4,583 | |
7.05%, 12/01/2027 | | 55 | | 44 | |
7.19%, 11/15/2015 | | 2,555 | | 2,390 | |
7.50%, 12/15/2023 | | 2,680 | | 2,213 | |
7.58%, 09/15/2025 | | 755 | | 641 | |
7.69%, 06/15/2025 | | 1,220 | | 1,048 | |
7.75%, 07/15/2036 | | 125 | | 104 | |
| | | | | | | |
The notes to the financial statements are an integral part of this report.
92
| | Principal | | Value | |
United States - (continued) | | | | | |
Highwoods Properties, Inc. REIT | | | | | |
5.85%, 03/15/2017 | | $ | 1,175 | | $ | 1,060 | |
Home Depot, Inc. | | | | | |
5.88%, 12/16/2036 | | 10,484 | | 10,226 | |
International Lease Finance Corp. | | | | | |
5.25%, 01/10/2013 | | 535 | | 430 | |
5.65%, 06/01/2014 | | 300 | | 227 | |
6.63%, 11/15/2013 | | 555 | | 428 | |
International Paper Co. | | | | | |
5.25%, 04/01/2016 | | 1,800 | | 1,800 | |
7.95%, 06/15/2018 | | 3,515 | | 3,918 | |
Intuit, Inc. | | | | | |
5.75%, 03/15/2017 | | 680 | | 714 | |
Jabil Circuit, Inc. | | | | | |
7.75%, 07/15/2016 | | 850 | | 882 | |
JC Penney Corp., Inc. | | | | | |
5.75%, 02/15/2018 | | 395 | | 373 | |
6.38%, 10/15/2036 | | 5,435 | | 4,579 | |
7.40%, 04/01/2037 | | 355 | | 330 | |
7.63%, 03/01/2097 | | 430 | | 334 | |
Joy Global, Inc. | | | | | |
6.00%, 11/15/2016 | | 1,735 | | 1,739 | |
6.63%, 11/15/2036 | | 2,780 | | 2,563 | |
Kar Holdings, Inc. | | | | | |
10.00%, 05/01/2015 | | 775 | | 794 | |
KB Home | | | | | |
5.75%, 02/01/2014 | | 610 | | 572 | |
5.88%, 01/15/2015 | | 3,415 | | 3,141 | |
6.25%, 06/15/2015 | | 1,055 | | 992 | |
7.25%, 06/15/2018 | | 60 | | 56 | |
Kinder Morgan Energy Partners, LP | | | | | |
6.50%, 02/01/2037 | | 2,600 | | 2,623 | |
6.95%, 01/15/2038 | | 5,730 | | 6,139 | |
KLA-Tencor Corp. | | | | | |
6.90%, 05/01/2018 | | 5,230 | | 5,482 | |
Lennar Corp. | | | | | |
5.50%, 09/01/2014 | | 2,015 | | 1,854 | |
5.60%, 05/31/2015 | | 1,605 | | 1,469 | |
Level 3 Financing, Inc. | | | | | |
8.75%, 02/15/2017 | | 4,045 | | 3,458 | |
9.25%, 11/01/2014 | | 445 | | 396 | |
Mackinaw Power LLC | | | | | |
6.30%, 10/31/2023 -144A | | 1,632 | | 1,588 | |
Macy’s Retail Holdings, Inc. | | | | | |
5.90%, 12/01/2016 | | 195 | | 180 | |
6.38%, 03/15/2037 | | 3,770 | | 3,073 | |
6.79%, 07/15/2027 | | 1,065 | | 847 | |
6.90%, 04/01/2029 | | 1,860 | | 1,535 | |
Masco Corp. | | | | | |
5.85%, 03/15/2017 | | 2,440 | | 2,249 | |
6.13%, 10/03/2016 | | 3,505 | | 3,362 | |
6.50%, 08/15/2032 | | 250 | | 207 | |
McDonald’s Corp. | | | | | |
6.30%, 03/01/2038 | | 475 | | 537 | |
Merrill Lynch & Co., Inc. | | | | | |
5.00%, 01/15/2015 | | 535 | | 543 | |
5.70%, 05/02/2017 | | 300 | | 297 | |
6.05%, 06/01/2034 | | 820 | | 740 | |
6.11%, 01/29/2037 | | 1,410 | | 1,333 | |
6.40%, 08/28/2017 | | 3,180 | | 3,287 | |
6.88%, 04/25/2018 | | 3,990 | | 4,296 | |
Midwest Generation LLC | | | | | |
8.56%, 01/02/2016 | | 885 | | 900 | |
Miller Brewing Co. | | | | | |
5.50%, 08/15/2013 -144A | | 265 | | 283 | |
Morgan Stanley | | | | | |
5.55%, 04/27/2017 | | 2,100 | | 2,114 | |
Mosaic Global Holdings, Inc. | | | | | |
7.30%, 01/15/2028 | | 420 | | 436 | |
7.38%, 08/01/2018 | | 400 | | 436 | |
Motorola, Inc. | | | | | |
5.22%, 10/01/2097 | | 690 | | 371 | |
6.00%, 11/15/2017 | | 230 | | 221 | |
6.50%, 11/15/2028 | | 2,635 | | 2,217 | |
6.63%, 11/15/2037 | | 6,565 | | 5,597 | |
Nabors Industries, Inc. | | | | | |
6.15%, 02/15/2018 | | 1,230 | | 1,256 | |
National Semiconductor Corp. | | | | | |
6.60%, 06/15/2017 | | 1,380 | | 1,396 | |
New Albertsons, Inc. | | | | | |
6.63%, 06/01/2028 | | 4,020 | | 3,095 | |
7.45%, 08/01/2029 | | 630 | | 548 | |
7.75%, 06/15/2026 | | 460 | | 406 | |
News America, Inc. | | | | | |
6.15%, 03/01/2037 | | 4,240 | | 4,121 | |
6.20%, 12/15/2034 | | 870 | | 854 | |
6.40%, 12/15/2035 | | 185 | | 185 | |
Nextel Communications, Inc. | | | | | |
5.95%, 03/15/2014 | | 1,225 | | 1,067 | |
6.88%, 10/31/2013 | | 1,395 | | 1,290 | |
7.38%, 08/01/2015 | | 2,085 | | 1,848 | |
NGC Corp. Capital Trust | | | | | |
8.32%, 06/01/2027 | | 200 | | 110 | |
NGPL Pipeco LLC | | | | | |
7.77%, 12/15/2037 -144A | | 1,215 | | 1,406 | |
NiSource Finance Corp. | | | | | |
6.40%, 03/15/2018 | | 5,855 | | 6,037 | |
Nordstrom, Inc. | | | | | |
7.00%, 01/15/2038 | | 4,900 | | 5,155 | |
Nortel Networks Capital Corp. | | | | | |
7.88%, 06/15/2026 Џ | | 300 | | 165 | |
Northwest Airlines, Inc. | | | | | |
7.03%, 11/01/2019 | | 6,687 | | 5,951 | |
NRG Energy, Inc. | | | | | |
7.38%, 01/15/2017 | | 850 | | 844 | |
8.50%, 06/15/2019 | | 1,035 | | 1,048 | |
Oneok Partners, LP | | | | | |
6.65%, 10/01/2036 | | 2,355 | | 2,481 | |
Owens & Minor, Inc. | | | | | |
6.35%, 04/15/2016 § | | 835 | | 753 | |
Owens Corning, Inc. | | | | | |
6.50%, 12/01/2016 Ђ | | 790 | | 788 | |
7.00%, 12/01/2036 Ђ | | 4,585 | | 3,844 | |
Panhandle Eastern Pipeline Co., LP | | | | | |
8.13%, 06/01/2019 | | 975 | | 1,128 | |
| | | | | | | |
The notes to the financial statements are an integral part of this report.
93
| | Principal | | Value | |
United States - (continued) | | | | | |
Pioneer Natural Resources Co. | | | | | |
5.88%, 07/15/2016 | | $ | 3,415 | | $ | 3,170 | |
6.88%, 05/01/2018 | | 435 | | 416 | |
7.20%, 01/15/2028 | | 925 | | 804 | |
Plains All American Pipeline, LP | | | | | |
6.50%, 05/01/2018 | | 490 | | 528 | |
6.70%, 05/15/2036 | | 930 | | 961 | |
ProLogis REIT | | | | | |
5.63%, 11/15/2015 | | 1,825 | | 1,697 | |
5.75%, 04/01/2016 | | 1,435 | | 1,345 | |
6.63%, 05/15/2018 | | 430 | | 415 | |
Pulte Homes, Inc. | | | | | |
6.00%, 02/15/2035 | | 110 | | 85 | |
6.38%, 05/15/2033 | | 1,780 | | 1,406 | |
7.88%, 06/15/2032 | | 1,500 | | 1,395 | |
Qwest Capital Funding, Inc. | | | | | |
6.50%, 11/15/2018 | | 965 | | 806 | |
6.88%, 07/15/2028 | | 2,405 | | 1,858 | |
7.63%, 08/03/2021 | | 1,000 | | 850 | |
7.75%, 02/15/2031 | | 530 | | 435 | |
Qwest Corp. | | | | | |
6.50%, 06/01/2017 | | 565 | | 535 | |
6.88%, 09/15/2033 | | 2,770 | | 2,334 | |
7.20%, 11/10/2026 | | 895 | | 761 | |
7.25%, 09/15/2025 | | 1,705 | | 1,472 | |
7.50%, 06/15/2023 | | 1,670 | | 1,532 | |
Realty Income Corp. REIT | | | | | |
6.75%, 08/15/2019 | | 3,795 | | 3,787 | |
Reynolds American, Inc. | | | | | |
6.75%, 06/15/2017 | | 358 | | 369 | |
7.25%, 06/15/2037 | | 880 | | 889 | |
RH Donnelley Corp. | | | | | |
6.88%, 01/15/2013 Џ | | 1,870 | | 107 | |
8.88%, 01/15/2016 Џ | | 970 | | 56 | |
Royal Caribbean Cruises, Ltd. | | | | | |
6.88%, 12/01/2013 | | 4,160 | | 3,942 | |
Sara Lee Corp. | | | | | |
6.13%, 11/01/2032 | | 2,195 | | 2,196 | |
Simon Property Group, LP REIT | | | | | |
5.25%, 12/01/2016 | | 155 | | 155 | |
5.75%, 12/01/2015 | | 65 | | 67 | |
5.88%, 03/01/2017 | | 1,265 | | 1,289 | |
6.13%, 05/30/2018 | | 915 | | 948 | |
10.35%, 04/01/2019 | | 1,950 | | 2,453 | |
SLM Corp. | | | | | |
4.00%, 01/15/2010 | | 785 | | 784 | |
4.50%, 07/26/2010 | | 735 | | 725 | |
5.00%, 06/15/2018 | | 3,013 | | 2,391 | |
5.05%, 11/14/2014 | | 435 | | 347 | |
5.13%, 08/27/2012 | | 640 | | 570 | |
5.38%, 05/15/2014 | | 1,927 | | 1,673 | |
5.40%, 10/25/2011 | | 700 | | 661 | |
5.63%, 08/01/2033 | | 779 | | 533 | |
6.50%, 06/15/2010 Ə§ | | NZD | 5,865 | | 4,008 | |
8.45%, 06/15/2018 | | $ | 10,625 | | 9,357 | |
Southern Natural Gas Co. | | | | | |
5.90%, 04/01/2017 -144A Ђ | | 380 | | 388 | |
Sprint Capital Corp. | | | | | |
6.88%, 11/15/2028 | | 10,035 | | 7,526 | |
6.90%, 05/01/2019 | | 710 | | 618 | |
8.75%, 03/15/2032 | | 245 | | 212 | |
Sprint Nextel Corp. | | | | | |
6.00%, 12/01/2016 | | 967 | | 832 | |
Starwood Hotels & Resorts Worldwide, Inc. | | | | | |
6.25%, 02/15/2013 | | 3,635 | | 3,617 | |
Steel Dynamics, Inc. | | | | | |
6.75%, 04/01/2015 | | 1,520 | | 1,440 | |
7.38%, 11/01/2012 | | 3,180 | | 3,192 | |
8.25%, 04/15/2016 -144A Ђ | | 600 | | 603 | |
Tennessee Gas Pipeline Co. | | | | | |
7.50%, 04/01/2017 | | 1,679 | | 1,866 | |
Textron Financial Corp. | | | | | |
5.13%, 08/15/2014 | | 235 | | 219 | |
Textron, Inc. | | | | | |
7.25%, 10/01/2019 | | 2,620 | | 2,668 | |
Time Warner Cable, Inc. | | | | | |
6.75%, 07/01/2018 | | 290 | | 319 | |
Time Warner, Inc. | | | | | |
6.50%, 11/15/2036 | | 4,220 | | 4,288 | |
Toll Corp. | | | | | |
8.25%, 12/01/2011 | | 1,077 | | 1,088 | |
Toro Co. | | | | | |
6.63%, 05/01/2037 § | | 2,500 | | 1,953 | |
Toys “R” Us, Inc. | | | | | |
7.38%, 10/15/2018 | | 6,440 | | 5,732 | |
7.88%, 04/15/2013 | | 355 | | 345 | |
U.S. Steel Corp. | | | | | |
6.05%, 06/01/2017 | | 3,540 | | 3,244 | |
7.00%, 02/01/2018 | | 1,460 | | 1,406 | |
United Airlines, Inc. | | | | | |
6.64%, 07/02/2022 | | 7,095 | | 6,245 | |
USG Corp. | | | | | |
6.30%, 11/15/2016 | | 4,585 | | 3,942 | |
9.50%, 01/15/2018 Ђ | | 1,070 | | 1,051 | |
Valero Energy Corp. | | | | | |
6.63%, 06/15/2037 | | 4,225 | | 3,879 | |
Verizon Maryland, Inc. | | | | | |
5.13%, 06/15/2033 | | 200 | | 163 | |
Viacom, Inc. | | | | | |
6.88%, 04/30/2036 | | 5,990 | | 6,323 | |
Westvaco Corp. | | | | | |
7.95%, 02/15/2031 | | 1,135 | | 1,091 | |
8.20%, 01/15/2030 | | 2,985 | | 2,989 | |
Weyerhaeuser Co. | | | | | |
6.88%, 12/15/2033 | | 115 | | 101 | |
7.38%, 03/15/2032 | | 3,595 | | 3,298 | |
Xerox Capital Trust I | | | | | |
8.00%, 02/01/2027 | | 2,820 | | 2,764 | |
Xerox Corp. | | | | | |
6.35%, 05/15/2018 | | 5,945 | | 6,288 | |
XTO Energy, Inc. | | | | | |
6.10%, 04/01/2036 | | 1,835 | | 1,861 | |
Total Corporate Debt Securities (cost $536,184) | | | | 546,301 | |
| | | | | |
STRUCTURED NOTE DEBTS - 0.6% | | | | | |
United States - 0.6% | | | | | |
JPMorgan Chase & Co. | | | | | |
Zero Coupon, 09/10/2012 -144A | | IDR | 37,004,100 | | 3,013 | |
Zero Coupon, 04/12/2012 -144A | | IDR | 21,967,355 | | 1,865 | |
Total Structured Note Debts (cost $5,186) | | | | 4,878 | |
| | | | | | | | |
The notes to the financial statements are an integral part of this report.
94
(all amounts except share amounts in thousands)
| | Shares | | Value | |
CONVERTIBLE PREFERRED STOCKS - 0.7% | | | | | |
United States - 0.7% | | | | | |
AES Trust III | | | | | |
6.75% p | | 10,950 | | $ | 466 | |
Bank of America Corp. | | | | | |
7.25% pΛ | | 625 | | 523 | |
El Paso Energy Capital Trust I | | | | | |
4.75% p | | 6,300 | | 226 | |
Lucent Technologies Capital Trust I | | | | | |
7.75% p | | 4,900 | | 3,602 | |
Newell Financial Trust I | | | | | |
5.25% p | | 10,000 | | 351 | |
Sovereign Capital Trust IV | | | | | |
4.38% p | | 7,350 | | 226 | |
Total Convertible Preferred Stocks (cost $5,880) | | | | 5,394 | |
| | | | | |
PREFERRED STOCKS - 0.9% | | | | | |
United States - 0.9% | | | | | |
Comcast Corp. | | | | | |
7.00% p | | 108,601 | | 2,654 | |
Countrywide Capital IV | | | | | |
6.75% p | | 88,375 | | 1,747 | |
Fannie Mae | | | | | |
0.00% ‡■ | | 255,925 | | 295 | |
4.75% p‡ | | 8,150 | | 12 | |
5.13% p‡ | | 2,900 | | 4 | |
5.38% p‡ | | 5,800 | | 9 | |
5.81% p‡ | | 2,400 | | 4 | |
6.75% p‡ | | 3,700 | | 3 | |
8.25% p‡ | | 132,200 | | 142 | |
Freddie Mac | | | | | |
0.00% ‡ | | 161,275 | | 178 | |
5.00% p | | 4,150 | | 7 | |
5.57% p | | 63,300 | | 63 | |
5.66% p | | 18,750 | | 19 | |
5.70% p | | 6,500 | | 10 | |
5.79% p | | 12,000 | | 23 | |
5.81% p | | 4,200 | | 8 | |
5.90% p | | 9,300 | | 9 | |
6.00% p | | 5,350 | | 9 | |
6.42% p | | 3,750 | | 7 | |
6.55% p | | 14,400 | | 15 | |
Preferred Blocker, Inc. | | | | | |
7.00% -144A p | | 1,675 | | 1,023 | |
SLM Corp. | | | | | |
6.00% p | | 78,825 | | 1,225 | |
Total Preferred Stocks (cost $19,740) | | | | 7,466 | |
| | | | | |
COMMON STOCKS - 0.1% | | | | | |
United States - 0.1% | | | | | |
Freddie Mac ‡Λ | | 72,000 | | 89 | |
Owens-Illinois, Inc. ‡ | | 10,796 | | 344 | |
Total Common Stocks (cost $2,369) | | | | 433 | |
| | | | | | |
| | Principal | | | |
LOAN ASSIGNMENT - 0.4% | | | | | |
United States - 0.4% | | | | | |
Level 3 Financing, Inc. | | | | | |
11.62%, 03/13/2014 | | $ | 3,250 | | 3,445 | |
Total Loan Assignment (cost $3,221) | | | | | |
| | | | | |
CONVERTIBLE BONDS - 3.6% | | | | | |
Canada - 0.2% | | | | | |
Nortel Networks Corp. | | | | | |
1.75%, 04/15/2012 Џ | | 450 | | 249 | |
2.13%, 04/15/2014 Џ | | 2,870 | | 1,589 | |
Cayman Islands - 0.4% | | | | | |
Transocean, Inc. | | | | | |
1.50%, 12/15/2037 | | 3,450 | | 3,315 | |
United States - 3.0% | | | | | |
Chesapeake Energy Corp. | | | | | |
2.25%, 12/15/2038 | | 265 | | 198 | |
Ciena Corp. | | | | | |
0.88%, 06/15/2017 | | 255 | | 151 | |
Hercules, Inc. | | | | | |
6.50%, 06/30/2029 | | 1,260 | | 819 | |
Human Genome Sciences, Inc. | | | | | |
2.25%, 08/15/2012 | | 1,170 | | 1,524 | |
Incyte Corp., Ltd. | | | | | |
3.50%, 02/15/2011 | | 650 | | 636 | |
Intel Corp. | | | | | |
2.95%, 12/15/2035 | | 945 | | 865 | |
3.25%, 08/01/2039 -144A | | 10,315 | | 11,115 | |
JDS Uniphase Corp. | | | | | |
1.00%, 05/15/2026 | | 450 | | 373 | |
Level 3 Communications, Inc. | | | | | |
7.00%, 03/15/2015 -144A § | | 2,110 | | 2,044 | |
3.50%, 06/15/2012 | | 1,365 | | 1,145 | |
Liberty Media LLC | | | | | |
3.50%, 01/15/2031 | | 123 | | 78 | |
Nektar Therapeutics | | | | | |
3.25%, 09/28/2012 | | 1,960 | | 1,742 | |
Omnicare, Inc. | | | | | |
3.25%, 12/15/2035 | | 610 | | 486 | |
ProLogis REIT | | | | | |
1.88%, 11/15/2037 | | 50 | | 43 | |
Trinity Industries, Inc. | | | | | |
3.88%, 06/01/2036 | | 1,550 | | 1,137 | |
Valeant Pharmaceuticals International | | | | | |
4.00%, 11/15/2013 | | 1,300 | | 1,445 | |
Total Convertible Bonds (cost $27,774) | | | | 28,954 | |
| | | | | |
REPURCHASE AGREEMENT - 2.3% | | | | | |
State Street Repurchase Agreement 0.01%, dated 10/30/2009, to be repurchased at $18,367 on 11/02/2009. Collateralized by a U.S. Government Agency Obligation, 4.00%, due 12/15/2017, and with a value of $18,737. | | 18,367 | | 18,367 | |
Total Repurchase Agreement (cost $18,367) | | | | | |
| | | | | | |
| | Shares | | | |
SECURITIES LENDING COLLATERAL - 0.0% | | | | | |
State Street Navigator Securities Lending Trust - Prime Portfolio, 0.35% p | | 172,225 | | 172 | |
Total Securities Lending Collateral (cost $172) | | | | | |
| | | | | |
Total Investment Securities (cost $781,268) # | | | | 793,077 | |
Other Assets and Liabilities - Net | | | | 19,175 | |
| | | | | |
Net Assets | | | | $ | 812,252 | |
| | | | | | |
The notes to the financial statements are an integral part of this report.
95
(all amounts in thousands)
INVESTMENTS BY INDUSTRY (unaudited): | | Percentage of
Total Investments | | Value | |
Foreign Government Obligation | | 15.8 | % | $ | 125,616 | |
Diversified Financial Services | | 10.5 | | 82,926 | |
Oil, Gas & Consumable Fuels | | 5.9 | | 46,647 | |
Mortgage-Backed Security | | 5.6 | | 44,446 | |
Diversified Telecommunication Services | | 5.0 | | 39,823 | |
Media | | 4.1 | | 32,664 | |
Metals & Mining | | 3.8 | | 29,831 | |
Consumer Finance | | 2.7 | | 21,256 | |
Airlines | | 2.6 | | 20,760 | |
Communications Equipment | | 2.6 | | 20,550 | |
Semiconductors & Semiconductor Equipment | | 2.6 | | 20,215 | |
Paper & Forest Products | | 2.5 | | 20,066 | |
Multiline Retail | | 2.2 | | 17,178 | |
Household Durables | | 2.1 | | 16,925 | |
Specialty Retail | | 2.1 | | 16,303 | |
Building Products | | 1.9 | | 15,443 | |
Health Care Providers & Services | | 1.9 | | 15,094 | |
Commercial Banks | | 1.8 | | 13,776 | |
Real Estate Investment Trusts | | 1.7 | | 13,259 | |
Electric Utilities | | 1.6 | | 13,004 | |
Machinery | | 1.4 | | 11,342 | |
Independent Power Producers & Energy Traders | | 1.4 | | 10,831 | |
Office Electronics | | 1.1 | | 9,052 | |
Hotels, Restaurants & Leisure | | 1.0 | | 8,096 | |
Asset-Backed Security | | 1.0 | | 7,605 | |
Automobiles | | 1.0 | | 7,321 | |
Road & Rail | | 0.9 | | 7,131 | |
Wireless Telecommunication Services | | 0.7 | | 5,781 | |
Transportation Infrastructure | | 0.7 | | 5,739 | |
Electronic Equipment & Instruments | | 0.6 | | 5,135 | |
Commercial Services & Supplies | | 0.6 | | 4,739 | |
Beverages | | 0.6 | | 4,502 | |
Food & Staples Retailing | | 0.6 | | 4,487 | |
Leisure Equipment & Products | | 0.6 | | 4,468 | |
Capital Markets | | 0.5 | | 4,241 | |
Water Utilities | | 0.5 | | 3,700 | |
Insurance | | 0.4 | | 3,522 | |
Aerospace & Defense | | 0.4 | | 3,486 | |
Chemicals | | 0.4 | | 3,429 | |
Software | | 0.4 | | 3,421 | |
Energy Equipment & Services | | 0.4 | | 3,315 | |
Gas Utilities | | 0.4 | | 3,232 | |
Pharmaceuticals | | 0.4 | | 2,761 | |
Industrial Conglomerates | | 0.3 | | 2,668 | |
Food Products | | 0.3 | | 2,196 | |
Biotechnology | | 0.3 | | 2,160 | |
IT Services | | 0.3 | | 2,068 | |
Thrifts & Mortgage Finance | | 0.2 | | 1,973 | |
Health Care Equipment & Supplies | | 0.2 | | 1,868 | |
Trading Companies & Distributors | | 0.2 | | 1,833 | |
Life Sciences Tools & Services | | 0.2 | | 1,742 | |
Retail Store | | 0.2 | | 1,315 | |
Tobacco | | 0.2 | | 1,258 | |
U.S. Government Agency Obligation | | 0.1 | | 906 | |
Multi-Utilities | | 0.1 | | 705 | |
Professional Services | | 0.0 | | 384 | |
Containers & Packaging | | 0.0 | | 344 | |
Investment Securities, at Value | | 97.6 | | 774,538 | |
Short-Term Investments | | 2.4 | | 18,539 | |
Total Investments | | 100.0 | % | $ | 793,077 | |
The notes to the financial statements are an integral part of this report.
96
NOTES TO SCHEDULE OF INVESTMENTS:
* | Floating or variable rate note. Rate is listed as of 10/31/2009. |
Џ | In default. |
Ž | The security has a perpetual maturity. The date shown is the next call date. |
■ | Coupon rate is fixed for a predetermined period of time and then converts to a floating rate until maturity/call date. Rate is listed as of 10/31/2009. |
p | Rate shown reflects the yield at 10/31/2009. |
Λ | All or a portion of this security is on loan. The value of all securities on loan is $155. |
Ђ | Step bond. Interest rate may increase or decrease as the credit rating changes. |
§ | Illiquid. These securities aggregated to $14,377, or 1.77%, of the fund’s net assets. |
Ə | Security fair valued as determined in good faith in accordance with procedures established by the Board of Trustees. This security aggregated to $4,008, or 0.49% of the fund’s net assets. |
‡ | Non-income producing security. |
# | Aggregate cost for federal income tax purposes is $782,556. Aggregate gross unrealized appreciation/depreciation for all securities in which there is an excess of value over tax cost were $50,326 and $39,805, respectively. Net unrealized appreciation for tax purposes is $10,521. |
DEFINITIONS:
144A | 144A Securities are registered pursuant to Rule 144A of the Securities Act of 1933. These securities are deemed to be liquid for purposes of compliance limitations on holdings of illiquid securities and may be resold as transactions exempt from registration, normally to qualified institutional buyers. At 10/31/2009, these securities aggregated $97,654, or 12.02%, of the fund’s net assets. |
AUD | Australian Dollar |
BRL | Brazilian Real |
CAD | Canadian Dollar |
COP | Columbian Peso |
IDR | Indonesian Rupiah |
ISK | Iceland Krona |
KRW | South Korean Won |
LB | Lehman Brothers |
MXN | Mexican Peso |
NOK | Norwegian Krone |
NZD | New Zealand Dollar |
REIT | Real Estate Investment Trust |
SGD | Singapore Dollar |
VALUATION SUMMARY:
Investment Securities | | Level 1 | | Level 2 | | Level 3 | | Total | |
Equities - Consumer Discretionary | | $ | 3,005 | | $ | — | | $ | — | | $ | 3,005 | |
Equities - Energy | | 227 | | — | | — | | 227 | |
Equities - Financials | | 4,744 | | — | | — | | 4,744 | |
Equities - Information Technology | | 3,602 | | — | | — | | 3,602 | |
Equities - Materials | | 344 | | — | | — | | 344 | |
Equities - U.S. Government Agency Obligation | | 905 | | — | | — | | 905 | |
Equities - Utilities | | 466 | | — | | — | | 466 | |
Fixed Income - Asset-Backed Security | | — | | 10,555 | | — | | 10,555 | |
Fixed Income - Consumer Discretionary | | — | | 105,591 | | — | | 105,591 | |
Fixed Income - Consumer Staples | | — | | 12,443 | | — | | 12,443 | |
Fixed Income - Energy | | — | | 54,185 | | — | | 54,185 | |
Fixed Income - Financials | | — | | 136,209 | | — | | 136,209 | |
Fixed Income - Foreign Government Obligation | | — | | 125,616 | | — | | 125,616 | |
Fixed Income - Health Care | | — | | 23,625 | | — | | 23,625 | |
Fixed Income - Industrials | | — | | 64,732 | | — | | 64,732 | |
Fixed Income - Information Technology | | — | | 56,688 | | — | | 56,688 | |
Fixed Income - Materials | | — | | 53,327 | | — | | 53,327 | |
Fixed Income - Mortgage-Backed Security | | — | | 44,446 | | — | | 44,446 | |
Fixed Income - Telecommunication Services | | — | | 47,272 | | — | | 47,272 | |
Fixed Income - Utilities | | — | | 26,556 | | — | | 26,556 | |
Cash & Cash Equivalent - Repurchase Agreement | | — | | 18,367 | | — | | 18,367 | |
Cash & Cash Equivalent - Securities Lending Collateral | | 172 | | — | | — | | 172 | |
Total | | $ | 13,465 | | $ | 779,612 | | $ | — | | $ | 793,077 | |
The notes to the financial statements are an integral part of this report.
97
Transamerica Neuberger Berman International
SCHEDULE OF INVESTMENTS
At October 31, 2009
(all amounts except share amounts in thousands)
| | Shares | | Value | |
COMMON STOCKS - 97.3% | | | | | |
Australia - 0.8% | | | | | |
BHP Billiton, Ltd. ADR | | 61,700 | | $ | 4,046 | |
Austria - 0.6% | | | | | |
Schoeller-Bleckmann Oilfield Equipment AG | | 62,463 | | 2,912 | |
Belgium - 2.7% | | | | | |
Anheuser-Busch InBev NV | | 86,548 | | 4,063 | |
Anheuser-Busch InBev NV - STRIP VVPR ‡ | | 130,726 | | 1 | |
Colruyt SA | | 17,822 | | 4,241 | |
Telenet Group Holding NV ‡ | | 185,704 | | 4,950 | |
Bermuda - 1.5% | | | | | |
Kerry Properties, Ltd. | | 439,500 | | 2,459 | |
Willis Group Holdings, Ltd. | | 175,200 | | 4,730 | |
Brazil - 2.9% | | | | | |
Petroleo Brasileiro SA -Class A ADR | | 151,222 | | 6,067 | |
Ultrapar Participacoes SA ADR Λ | | 125,790 | | 5,545 | |
VIVO Participacoes SA ADR | | 104,400 | | 2,532 | |
Canada - 4.8% | | | | | |
Barrick Gold Corp. | | 82,300 | | 2,963 | |
Cameco Corp. | | 153,380 | | 4,275 | |
Macdonald Dettwiler & Associates, Ltd. ठ| | 330,770 | | 11,281 | |
Talisman Energy, Inc. | | 278,085 | | 4,744 | |
Cayman Islands - 0.0% | | | | | |
Minth Group, Ltd. | | 165,900 | | 172 | |
Chile - 1.0% | | | | | |
Sociedad Quimica y Minera de Chile SA ADR | | 133,285 | | 4,898 | |
Cyprus - 0.8% | | | | | |
ProSafe SE | | 725,750 | | 3,778 | |
Czech Republic - 0.4% | | | | | |
Telefonica O2 Czech Republic AS | | 83,782 | | 1,974 | |
Denmark - 2.5% | | | | | |
A.P. Moller Maersk A/S -Series B | | 330 | | 2,253 | |
Novo Nordisk A/S -Class B | | 95,215 | | 5,915 | |
TrygVesta AS | | 56,090 | | 4,042 | |
France - 8.6% | | | | | |
Arkema SA | | 98,343 | | 3,754 | |
CNP Assurances | | 23,805 | | 2,300 | |
Eutelsat Communications | | 85,310 | | 2,712 | |
France Telecom SA | | 136,345 | | 3,378 | |
Ipsen SA | | 142,213 | | 7,246 | |
IPSOS § | | 207,237 | | 6,345 | |
Societe Generale | | 47,000 | | 3,122 | |
Sodexo | | 62,501 | | 3,569 | |
Teleperformance | | 158,434 | | 5,087 | |
Thales SA | | 90,643 | | 4,392 | |
Germany - 9.3% | | | | | |
Deutsche Boerse AG | | 99,782 | | 8,081 | |
Fresenius Medical Care AG & Co. KGaA | | 87,713 | | 4,257 | |
GEA Group AG | | 230,684 | | 4,353 | |
Gerresheimer AG | | 206,731 | | 5,872 | |
Linde AG | | 62,463 | | 6,556 | |
SAP AG ADR | | 99,035 | | 4,483 | |
SMA Solar Technology AG | | 28,183 | | 2,693 | |
Tognum AG | | 277,378 | | 4,240 | |
Wincor Nixdorf AG | | 77,404 | | 4,526 | |
Greece - 1.8% | | | | | |
National Bank of Greece SA ‡ | | 129,600 | | 4,738 | |
Titan Cement Co. SA | | 113,907 | | 3,937 | |
Guernsey Channel Islands - 0.5% | | | | | |
Amdocs, Ltd. ‡ | | 103,600 | | 2,611 | |
Hong Kong - 1.0% | | | | | |
China Mobile, Ltd. ADR | | 106,665 | | 4,984 | |
India - 1.7% | | | | | |
Hero Honda Motors, Ltd. ‡ | | 102,991 | | 3,400 | |
State Bank of India, Ltd. GDR | | 51,985 | | 4,748 | |
Ireland - 1.1% | | | | | |
DCC PLC | | 197,550 | | 5,202 | |
Israel - 0.9% | | | | | |
Makhteshim-Agan Industries, Ltd. | | 944,183 | | 4,413 | |
Italy - 0.6% | | | | | |
Lottomatica SpA Λ | | 146,402 | | 3,119 | |
Japan - 10.8% | | | | | |
Brother Industries, Ltd. | | 327,500 | | 3,729 | |
Circle K Sunkus Co., Ltd. | | 289,500 | | 3,974 | |
Hisamitsu Pharmaceutical Co., Inc. | | 147,000 | | 5,054 | |
Jupiter Telecommunications Co., Ltd. | | 6,039 | | 5,520 | |
KDDI Corp. | | 608 | | 3,227 | |
Kenedix Realty Investment Corp. REIT Λ | | 725 | | 2,079 | |
Nihon Kohden Corp. | | 386,100 | | 6,463 | |
Nintendo Co., Ltd. ADR | | 150,015 | | 4,713 | |
NSD Co., Ltd. Λ | | 351,900 | | 3,588 | |
Sankyo Co., Ltd. | | 90,600 | | 5,175 | |
Sundrug Co., Ltd. | | 138,600 | | 3,489 | |
Toyota Motor Corp. ADR | | 38,050 | | 3,002 | |
Yahoo! Japan Corp. | | 8,047 | | 2,466 | |
Jersey Channel Islands - 2.7% | | | | | |
Experian Group, Ltd. | | 772,376 | | 7,058 | |
Informa PLC | | 1,197,061 | | 5,742 | |
Korea, Republic of - 1.9% | | | | | |
Hyundai Mobis | | 46,649 | | 6,220 | |
Samsung SDI Co., Ltd. | | 26,662 | | 3,044 | |
Luxembourg - 0.7% | | | | | |
ArcelorMittal | | 99,786 | | 3,377 | |
Netherlands - 9.1% | | | | | |
Fugro NV | | 98,688 | | 5,497 | |
Koninklijke Ahold NV | | 516,442 | | 6,505 | |
Koninklijke DSM NV | | 54,763 | | 2,399 | |
Nutreco Holding NV | | 120,167 | | 6,066 | |
Sligro Food Group NV § | | 195,221 | | 6,015 | |
TNT NV | | 271,407 | | 7,198 | |
Unilever NV | | 337,836 | | 10,409 | |
Norway - 1.1% | | | | | |
DnB NOR ASA ‡ | | 471,385 | | 5,400 | |
Singapore - 0.7% | | | | | |
United Overseas Bank, Ltd. | | 282,000 | | 3,380 | |
Spain - 0.8% | | | | | |
Banco Santander SA | | 248,473 | | 3,998 | |
Sweden - 1.6% | | | | | |
Svenska Handelsbanken AB -Class A | | 172,908 | | 4,469 | |
Swedbank AB ‡Λ | | 358,614 | | 3,089 | |
Switzerland - 7.5% | | | | | |
Barry Callebaut AG ‡ | | 7,310 | | 4,084 | |
Bucher Industries AG | | 21,329 | | 2,241 | |
Credit Suisse Group AG | | 94,184 | | 5,035 | |
Givaudan SA | | 5,103 | | 3,788 | |
Nestle SA | | 112,093 | | 5,213 | |
Nobel Biocare Holding AG | | 128,445 | | 3,644 | |
Roche Holding AG | | 24,871 | | 3,983 | |
SGS SA ‡ | | 2,771 | | 3,701 | |
Sulzer AG | | 60,175 | | 4,685 | |
United Kingdom - 16.9% | | | | | |
Amlin PLC | | 1,174,004 | | 6,795 | |
Antofagasta PLC | | 187,382 | | 2,361 | |
Balfour Beatty PLC | | 254,191 | | 1,105 | |
Barclays PLC ‡ | | 980,361 | | 5,138 | |
BP PLC | | 400,663 | | 3,754 | |
Cairn Energy PLC ‡ | | 105,118 | | 4,534 | |
Chemring Group PLC | | 211,248 | | 9,148 | |
Croda International PLC | | 310,779 | | 3,806 | |
Diageo PLC | | 321,551 | | 5,237 | |
| | | | | | |
The notes to the financial statements are an integral part of this report.
98
| | Shares | | Value | |
United Kingdom - (continued) | | | | | |
HSBC Holdings PLC | | 1,081,751 | | $ | 11,960 | |
Reed Elsevier PLC | | 272,074 | | 2,060 | |
RPS Group PLC | | 1,594,129 | | 5,466 | |
Smith & Nephew PLC | | 529,484 | | 4,681 | |
Tullow Oil PLC | | 222,156 | | 4,304 | |
Vodafone Group PLC | | 5,286,698 | | 11,651 | |
Total Common Stocks (cost $443,958) | | | | 472,678 | |
| | | | | |
RIGHTS - 0.0% | | | | | |
Spain - 0.0% | | | | | |
Banco Santander SA ‡ | | 248,473 | | 44 | |
Total Rights (cost $44) | | | | | |
| | | | | |
WARRANT - 0.0% | | | | | |
Italy - 0.0% | | | | | |
UBI Banca SCpA ‡ | | 138,395 | | 13 | |
Expiration: 06/30/2011 | | | | | |
Exercise Price: €12.30 | | | | | |
Total Warrant (cost $0) | | | | | |
| | | | | | |
| | Principal | | | |
REPURCHASE AGREEMENT - 2.5% | | | | | |
State Street Repurchase Agreement 0.01%, dated 10/30/2009, to be repurchased at $12,257 on 11/02/2009. Collateralized by a U.S. Government Agency Obligation, 4.00%, due 12/15/2017, and with a value of $12,502. | | $ | 12,257 | | 12,257 | |
Total Repurchase Agreement (cost $12,257) | | | | | |
| | | | | | |
| | Shares | | | |
SECURITIES LENDING COLLATERAL - 1.7% | | | | | |
State Street Navigator Securities Lending Trust - Prime Portfolio, 0.35% p | | 8,138,228 | | 8,138 | |
Total Securities Lending Collateral (cost $8,138) | | | | | |
| | | | | |
Total Investment Securities (cost $464,397) # | | | | 493,130 | |
Other Assets and Liabilities - Net | | | | (7,327 | ) |
| | | | | |
Net Assets | | | | $ | 485,803 | |
| | | | | | |
INVESTMENTS BY INDUSTRY(unaudited): | | Percentage of
Total Investments | | Value | |
Commercial Banks | | 10.1 | % | $ | 50,099 | |
Chemicals | | 6.1 | | 29,614 | |
Oil, Gas & Consumable Fuels | | 5.6 | | 27,678 | |
Food Products | | 5.2 | | 25,772 | |
Wireless Telecommunication Services | | 4.5 | | 22,394 | |
Media | | 4.5 | | 22,379 | |
Pharmaceuticals | | 4.5 | | 22,198 | |
Food & Staples Retailing | | 4.1 | | 20,250 | |
Insurance | | 3.7 | | 17,867 | |
Commercial Services & Supplies | | 3.4 | | 16,747 | |
Professional Services | | 3.2 | | 15,846 | |
Software | | 3.1 | | 15,395 | |
Health Care Equipment & Supplies | | 2.9 | | 14,788 | |
Aerospace & Defense | | 2.8 | | 13,540 | |
Metals & Mining | | 2.6 | | 12,747 | |
Energy Equipment & Services | | 2.5 | | 12,187 | |
Machinery | | 2.3 | | 11,279 | |
Diversified Telecommunication Services | | 2.1 | | 10,302 | |
Beverages | | 1.9 | | 9,301 | |
Diversified Financial Services | | 1.6 | | 8,081 | |
Air Freight & Logistics | | 1.5 | | 7,198 | |
Electrical Equipment | | 1.4 | | 6,933 | |
Hotels, Restaurants & Leisure | | 1.3 | | 6,688 | |
Automobiles | | 1.3 | | 6,402 | |
Auto Components | | 1.3 | | 6,392 | |
Life Sciences Tools & Services | | 1.2 | | 5,872 | |
Specialty Retail | | 1.1 | | 5,545 | |
Industrial Conglomerates | | 1.1 | | 5,202 | |
Leisure Equipment & Products | | 1.0 | | 5,175 | |
Capital Markets | | 1.0 | | 5,035 | |
Computers & Peripherals | | 0.9 | | 4,526 | |
Health Care Providers & Services | | 0.9 | | 4,257 | |
Multiline Retail | | 0.8 | | 3,974 | |
Construction Materials | | 0.8 | | 3,937 | |
| | | | | | |
The notes to the financial statements are an integral part of this report.
99
(all amounts in thousands)
INVESTMENTS BY INDUSTRY (continued): | | Percentage of
Total Investments | | Value | |
Office Electronics | | 0.8 | % | $ | 3,729 | |
Electronic Equipment & Instruments | | 0.6 | | 3,044 | |
Internet Software & Services | | 0.5 | | 2,466 | |
Real Estate Management & Development | | 0.5 | | 2,459 | |
Marine | | 0.5 | | 2,253 | |
Real Estate Investment Trusts | | 0.4 | | 2,079 | |
Construction & Engineering | | 0.2 | | 1,105 | |
Investment Securities, at Value | | 95.8 | | 472,735 | |
Short-Term Investments | | 4.2 | | 20,395 | |
Total Investments | | 100.0 | % | $ | 493,130 | |
NOTES TO SCHEDULE OF INVESTMENTS:
‡ Non-income producing security.
Λ All or a portion of this security is on loan. The value of all securities on loan is $7,790.
§ Illiquid. These securities aggregated to $23,641, or 4.87%, of the fund’s net assets.
p Rate shown reflects the yield at 10/31/2009.
# Aggregate cost for federal income tax purposes is $469,929. Aggregate gross unrealized appreciation/depreciation for all securities in which there is an excess of value over tax cost were $45,878 and $22,677, respectively. Net unrealized appreciation for tax purposes is $23,201.
DEFINITIONS:
ADR | American Depositary Receipt |
GDR | Global Depositary Receipt |
REIT | Real Estate Investment Trust (includes domestic REITs and Foreign Real Estate Investment Companies) |
STRIP VVPR | Is a coupon which, if presented along with the corresponding coupon of the share, allows it to benefit from a reduced withholding tax of 15% (rather than 25%) on the dividends paid by the company. |
VALUATION SUMMARY:
Investment Securities | | Level 1 | | Level 2 | | Level 3 | | Total | |
Equities - Consumer Discretionary | | $ | 19,827 | | $ | 53,063 | | $ | — | | $ | 72,889 | |
Equities - Consumer Staples | | 4,063 | | 51,260 | | — | | 55,323 | |
Equities - Energy | | 15,086 | | 24,778 | | — | | 39,865 | |
Equities - Financials | | 4,743 | | 80,877 | | — | | 85,621 | |
Equities - Health Care | | — | | 42,061 | | — | | 42,061 | |
Equities - Industrials | | — | | 68,822 | | — | | 68,822 | |
Equities - Information Technology | | 11,806 | | 17,353 | | — | | 29,159 | |
Equities - Materials | | 11,908 | | 34,391 | | — | | 46,299 | |
Equities - Telecommunication Services | | 7,516 | | 25,180 | | — | | 32,696 | |
Cash & Cash Equivalent - Repurchase Agreement | | — | | 12,257 | | — | | 12,257 | |
Cash & Cash Equivalent - Securities Lending Collateral | | 8,138 | | — | | — | | 8,138 | |
Total | | $ | 83,088 | | $ | 410,042 | | $ | — | | $ | 493,130 | |
The notes to the financial statements are an integral part of this report.
100
Transamerica Oppenheimer Developing Markets
SCHEDULE OF INVESTMENTS
At October 31, 2009
(all amounts except share amounts in thousands)
| | Shares | | Value | |
PREFERRED STOCKS - 2.7% | | | | | |
Brazil - 2.7% | | | | | |
All America Latina Logistica SA, 0.48% p | | 382,000 | | $ | 2,817 | |
Lojas Americanas SA, 0.26% p ‡ | | 982,990 | | 6,472 | |
NET Servicos de Comunicacao SA p ‡ | | 308,897 | | 3,858 | |
Total Preferred Stocks (cost $13,805) | | | | 13,147 | |
| | | | | |
COMMON STOCKS - 95.8% | | | | | |
Argentina - 0.0% | | | | | |
IRSA Inversiones y Representaciones SA GDR ‡Λ | | 15,200 | | 131 | |
Bermuda - 0.7% | | | | | |
Credicorp, Ltd. | | 36,400 | | 2,513 | |
Dairy Farm International Holdings, Ltd. | | 139,900 | | 825 | |
Jardine Strategic Holdings, Ltd. | | 10,035 | | 174 | |
Brazil - 11.4% | | | | | |
B2W Cia Global Do Varejo | | 117,000 | | 3,387 | |
BM&FBOVESPA SA | | 693,146 | | 4,486 | |
Cia de Bebidas das Americas ADR ‡ | | 42,500 | | 3,828 | |
Cyrela Brazil Realty SA | | 262,000 | | 3,346 | |
Diagnosticos da America SA ‡ | | 60,200 | | 1,490 | |
Empresa Brasileira de Aeronautica SA ADR ‡ | | 215,400 | | 4,362 | |
Gafisa SA | | 75,000 | | 1,113 | |
Natura Cosmeticos SA ‡ | | 581,200 | | 10,410 | |
Petroleo Brasileiro SA -Class A ADR | | 309,600 | | 12,422 | |
Vale SA -Class B ADR | | 401,100 | | 9,265 | |
Weg SA | | 227,000 | | 2,242 | |
Canada - 0.4% | | | | | |
Niko Resources, Ltd. | | 21,800 | | 1,765 | |
Cayman Islands - 3.4% | | | | | |
Baidu, Inc. ADR ‡ | | 4,700 | | 1,776 | |
Ctrip.com International, Ltd. ADR ‡ | | 28,400 | | 1,521 | |
Netease.com ADR ‡ | | 11,000 | | 425 | |
SINA Corp. ‡ | | 201,900 | | 7,548 | |
Tencent Holdings, Ltd. | | 271,800 | | 4,733 | |
Tingyi Cayman Islands Holding Corp. | | 406,000 | | 906 | |
Chile - 2.0% | | | | | |
Banco Santander Chile | | 25,632,901 | | 1,303 | |
Centros Comerciales Sudamericanos SA | | 2,428,281 | | 7,479 | |
Parque Arauco SA | | 301,600 | | 312 | |
Sociedad Quimica y Minera de Chile SA ADR | | 19,600 | | 720 | |
China - 1.8% | | | | | |
China Shenhua Energy Co., Ltd. -Class H | | 769,000 | | 3,444 | |
PetroChina Co., Ltd. | | 1,944,000 | | 2,339 | |
Shanghai Zhenhua Heavy Industry Co., Ltd. | | 1,969,270 | | 1,634 | |
Travelsky Technology, Ltd. | | 1,748,000 | | 1,492 | |
Wumart Stores, Inc. | | 81,000 | | 138 | |
Colombia - 1.0% | | | | | |
Almacenes Exito SA -144A GDR | | 164,000 | | 1,266 | |
Almacenes Exito SA | | 61,500 | | 478 | |
Bancolombia SA ADR | | 81,600 | | 3,229 | |
Denmark - 1.1% | | | | | |
Carlsberg AS -Class B | | 79,800 | | 5,595 | |
Egypt - 3.2% | | | | | |
Commercial International Bank | | 361,037 | | 3,719 | |
Eastern Tobacco | | 54,024 | | 1,269 | |
Egyptian Financial Group-Hermes Holding | | 471,370 | | 2,737 | |
Orascom Telecom Holding SAE | | 1,241,228 | | 8,274 | |
Hong Kong - 10.5% | | | | | |
China Mobile, Ltd. | | 955,000 | | 8,953 | |
China Resources Enterprise, Ltd. | | 2,261,000 | | 7,587 | |
China Unicom, Ltd. | | 3,430,000 | | 4,353 | |
CNOOC, Ltd. | | 6,871,000 | | 10,187 | |
Hang Lung Properties, Ltd. | | 1,824,000 | | 6,882 | |
Hong Kong Exchanges & Clearing, Ltd. | | 564,000 | | 9,913 | |
Television Broadcasts, Ltd. | | 899,000 | | 4,237 | |
India - 12.3% | | | | | |
ABB, Ltd. | | 57,900 | | 933 | |
Cairn India, Ltd. ‡ | | 262,200 | | 1,447 | |
Colgate Palmolive Co. ‡ | | 35,000 | | 518 | |
Divi’s Laboratories, Ltd. | | 202,908 | | 2,267 | |
HDFC Bank, Ltd. ADR | | 110,400 | | 12,211 | |
Hindustan Unilever, Ltd. | | 487,700 | | 2,883 | |
Housing Development Finance Corp. | | 139,400 | | 7,756 | |
Infosys Technologies, Ltd. | | 416,000 | | 19,394 | |
ITC, Ltd. | | 173,200 | | 937 | |
Nestle India, Ltd. | | 5,400 | | 294 | |
Sun Pharmaceutical Industries, Ltd. ‡ | | 45,300 | | 1,329 | |
Tata Consultancy Services, Ltd. | | 373,902 | | 4,994 | |
Zee Entertainment Enterprises, Ltd. | | 1,134,500 | | 5,469 | |
Indonesia - 2.9% | | | | | |
Astra International TBK PT | | 990,100 | | 3,185 | |
Bank Central Asia | | 5,756,400 | | 2,711 | |
Telekomunikasi Indonesia | | 8,574,675 | | 7,384 | |
Unilever Indonesia | | 860,000 | | 899 | |
Korea, Republic of - 4.4% | | | | | |
GS Engineering & Construction Corp. | | 13,779 | | 1,208 | |
Hyundai Engineering & Construction Co., Ltd. | | 56,213 | | 3,104 | |
Mirae Asset Securities Co., Ltd. | | 69,894 | | 3,653 | |
NHN Corp. ‡ | | 49,922 | | 7,363 | |
Shinsegae Co., Ltd. | | 14,622 | | 6,313 | |
Luxembourg - 1.8% | | | | | |
Oriflame Cosmetics SA | | 59,700 | | 3,306 | |
Tenaris SA ADR | | 162,600 | | 5,792 | |
Mexico - 8.4% | | | | | |
America Movil SAB de CV -Series L ADR | | 225,800 | | 9,965 | |
Bolsa Mexicana de Valores SA de CV ‡ | | 92,500 | | 106 | |
Corp GEO SAB de CV -Series B ‡ | | 644,900 | | 1,709 | |
Fomento Economico Mexicano SAB de CV | | 1,459,000 | | 8,520 | |
Grupo Modelo SAB de CV -Series C ‡ | | 1,265,300 | | 5,865 | |
Grupo Televisa SA ADR | | 373,100 | | 7,223 | |
Impulsora Del Desarrollo Y El Empleo en America Latina SAB de CV ‡ | | 980,900 | | 966 | |
Sare Holding SAB de CV -Class B ‡Λ | | 2,097,201 | | 751 | |
Wal-Mart de Mexico SAB de CV -Series V | | 1,787,593 | | 6,362 | |
Norway - 0.3% | | | | | |
DNO International ASA ‡Λ | | 2,199,200 | | 1,723 | |
Philippines - 2.8% | | | | | |
Jollibee Foods Corp. | | 1,593,700 | | 1,695 | |
Philippine Long Distance Telephone Co. ‡ | | 49,800 | | 2,676 | |
SM Investments Corp. | | 215,060 | | 1,405 | |
SM Prime Holdings, Inc. | | 40,123,470 | | 8,321 | |
Russian Federation - 5.4% | | | | | |
Gazprom OAO ADR | | 310,400 | | 7,448 | |
Magnit OAO | | 198,500 | | 11,607 | |
Novatek OAO GDR -RegS | | 60,500 | | 3,037 | |
Novatek OAO GDR -144A | | 94,500 | | 4,772 | |
South Africa - 4.6% | | | | | |
Adcock Ingram Holdings, Ltd. | | 82,448 | | 561 | |
Anglo Platinum, Ltd. ‡ | | 53,600 | | 4,633 | |
Impala Platinum Holdings, Ltd. | | 216,800 | | 4,770 | |
JSE, Ltd. Λ | | 41,800 | | 322 | |
MTN Group, Ltd. | | 333,100 | | 4,960 | |
Standard Bank Group, Ltd. | | 455,219 | | 5,682 | |
Tiger Brands, Ltd. | | 83,948 | | 1,681 | |
Taiwan - 6.2% | | | | | |
Epistar Corp. | | 1,144,000 | | 3,331 | |
Epistar Corp. -144A GDR ‡ | | 56,500 | | 898 | |
High Tech Computer Corp. | | 120,750 | | 1,199 | |
Mediatek, Inc. | | 578,370 | | 8,095 | |
President Chain Store Corp. | | 115,336 | | 261 | |
Synnex Technology International Corp. | | 390,198 | | 738 | |
Taiwan Semiconductor Manufacturing Co., Ltd. | | 9,048,459 | | 16,415 | |
| | | | | | |
The notes to the financial statements are an integral part of this report.
101
| | Shares | | Value | |
Turkey - 5.6% | | | | | |
Aksigorta AS | | 347,386 | | $ | 1,049 | |
Anadolu AS | | 271,321 | | 3,100 | |
Bim Birlesik Magazalar AS | | 35,400 | | 1,283 | |
Enka Insaat ve Sanayi AS | | 1,338,750 | | 5,402 | |
Haci Omer Sabanci Holding AS | | 1,045,936 | | 3,824 | |
Turkcell Iletisim Hizmet AS | | 1,672,300 | | 11,065 | |
Yapi ve Kredi Bankasi AS ‡ | | 1,074,978 | | 2,210 | |
United Kingdom - 5.1% | | | | | |
Anglo American PLC ‡ | | 315,910 | | 11,430 | |
SABMiller PLC | | 419,500 | | 10,996 | |
Tullow Oil PLC | | 155,180 | | 3,006 | |
United States - 0.5% | | | | | |
Mercadolibre, Inc. ‡ | | 7,300 | | 261 | |
Sohu.com, Inc. ‡ | | 38,500 | | 2,141 | |
Total Common Stocks (cost $406,873) | | | | 475,022 | |
| | | | | |
RIGHTS - 0.0% | | | | | |
Colombia - 0.0% | | | | | |
Almacenes Exito SA ‡Ə | | 6,315 | | 12 | |
Total Rights (cost $—) | | | | | |
| | | | | |
| | Principal | | | |
REPURCHASE AGREEMENT - 0.8% | | | | | |
State Street Repurchase Agreement 0.01%, dated 10/30/2009, to be repurchased at $4,175 on 11/02/2009. Collateralized by a U.S. Government Agency Obligation, 4.00%, due 12/15/2017, and with a value of $4,260. | | $ | 4,175 | | 4,175 | |
Total Repurchase Agreement (cost $4,175) | | | | | |
| | | | | |
| | Shares | | | |
SECURITIES LENDING COLLATERAL - 0.1% | | | | | |
State Street Navigator Securities Lending Trust - Prime Portfolio, 0.35% p | | 298,864 | | 299 | |
Total Securities Lending Collateral (cost $299) | | | | | |
| | | | | |
Total Investment Securities (cost $425,152) # | | | | 492,655 | |
Other Assets and Liabilities - Net | | | | 2,981 | |
| | | | | |
Net Assets | | | | $ | 495,636 | |
| | | | | | | |
INVESTMENTS BY INDUSTRY: (unaudited) | | Percentage of
Total Investments | | Value | |
Oil, Gas & Consumable Fuels | | 10.4 | % | $ | 51,590 | |
Wireless Telecommunication Services | | 9.2 | | 45,893 | |
Beverages | | 7.6 | | 37,904 | |
Food & Staples Retailing | | 7.4 | | 35,546 | |
Commercial Banks | | 6.7 | | 33,578 | |
Metals & Mining | | 6.2 | | 30,098 | |
Semiconductors & Semiconductor Equipment | | 5.9 | | 28,739 | |
IT Services | | 5.2 | | 25,880 | |
Internet Software & Services | | 4.9 | | 24,247 | |
Media | | 4.3 | | 20,787 | |
Diversified Financial Services | | 3.8 | | 18,651 | |
Real Estate Management & Development | | 3.3 | | 15,646 | |
Personal Products | | 2.8 | | 13,716 | |
Diversified Telecommunication Services | | 2.4 | | 11,737 | |
Multiline Retail | | 1.7 | | 8,355 | |
Thrifts & Mortgage Finance | | 1.6 | | 7,756 | |
Distributors | | 1.5 | | 7,587 | |
Household Durables | | 1.4 | | 6,919 | |
Capital Markets | | 1.3 | | 6,564 | |
Energy Equipment & Services | | 1.1 | | 5,792 | |
Industrial Conglomerates | | 1.1 | | 5,402 | |
Construction & Engineering | | 1.1 | | 5,278 | |
Aerospace & Defense | | 0.9 | | 4,362 | |
Household Products | | 0.9 | | 4,300 | |
Machinery | | 0.8 | | 3,876 | |
Internet & Catalog Retail | | 0.7 | | 3,387 | |
Hotels, Restaurants & Leisure | | 0.6 | | 3,216 | |
Automobiles | | 0.6 | | 3,185 | |
Food Products | | 0.6 | | 2,881 | |
Road & Rail | | 0.6 | | 2,817 | |
Life Sciences Tools & Services | | 0.5 | | 2,267 | |
Tobacco | | 0.5 | | 2,206 | |
Pharmaceuticals | | 0.4 | | 1,890 | |
| | | | | | |
The notes to the financial statements are an integral part of this report.
102
(all amounts in thousands)
INVESTMENTS BY INDUSTRY (continued): (unaudited) | | Percentage of
Total Investments | | Value | |
Health Care Providers & Services | | 0.3 | % | $ | 1,490 | |
Computers & Peripherals | | 0.2 | | 1,199 | |
Insurance | | 0.2 | | 1,049 | |
Electrical Equipment | | 0.2 | | 933 | |
Electronic Equipment & Instruments | | 0.1 | | 738 | |
Chemicals | | 0.1 | | 720 | |
Investment Securities, at Value | | 99.1 | | 488,181 | |
Short-Term Investments | | 0.9 | | 4,474 | |
Total Investments | | 100.0 | % | $ | 492,655 | |
NOTES TO SCHEDULE OF INVESTMENTS:
p | Rate shown reflects the yield at October 31, 2009. |
‡ | Non-income producing security. |
Λ | All or a portion of this security is on loan. The value of all securities on loan is $280. |
Ə | Security fair valued as determined in good faith in accordance with procedures established by the Board of Trustees. This security aggregated to $12, or less than 0.01% of the fund’s net assets. |
# | Aggregate cost for federal income tax purposes is $443,084. Aggregate gross unrealized appreciation/depreciation for all securities in which there is an excess of value over tax cost were $78,161 and $28,590, respectively. Net unrealized appreciation for tax purposes is $49,571. |
DEFINITIONS:
144A | | 144A Securities are registered pursuant to Rule 144A of the Securities Act of 1933. These securities are deemed to be liquid for purposes of compliance limitations on holdings of illiquid securities and may be resold as transactions exempt from registration, normally to qualified institutional buyers. At 10/31/2009, these securities aggregated $6,936, or 1.40%, of the fund’s net assets. |
ADR | | American Depositary Receipt |
GDR | | Global Depositary Receipt |
VALUATION SUMMARY:
Investment Securities | | Level 1 | | Level 2 | | Level 3 | | Total | |
Equities - Consumer Discretionary | | $ | 37,023 | | $ | 15,009 | | $ | — | | $ | 52,032 | |
Equities - Consumer Staples | | 42,299 | | 55,657 | | — | | 97,956 | |
Equities - Energy | | 26,745 | | 30,638 | | — | | 57,383 | |
Equities - Financials | | 38,753 | | 44,493 | | — | | 83,246 | |
Equities - Health Care | | 5,086 | | 561 | | — | | 5,647 | |
Equities - Industrials | | 11,319 | | 11,348 | | — | | 22,667 | |
Equities - Information Technology | | 37,438 | | 43,365 | | — | | 80,803 | |
Equities - Materials | | 9,986 | | 20,834 | | — | | 30,820 | |
Equities - Telecommunication Services | | 12,641 | | 44,986 | | — | | 57,627 | |
Cash & Cash Equivalent - Repurchase Agreement | | — | | 4,175 | | — | | 4,175 | |
Cash & Cash Equivalent - Securities Lending Collateral | | 299 | | — | | — | | 299 | |
Total | | $ | 221,589 | | $ | 271,066 | | $ | — | | $ | 492,655 | |
The notes to the financial statements are an integral part of this report.
103
Transamerica Oppenheimer Small- & Mid-Cap Value
SCHEDULE OF INVESTMENTS
At October 31, 2009
(all amounts except share amounts in thousands)
| | Shares | | Value | |
COMMON STOCKS - 98.5% | | | | | |
Aerospace & Defense - 1.6% | | | | | |
Goodrich Corp. | | 80,120 | | $ | 4,355 | |
Air Freight & Logistics - 0.4% | | | | | |
Atlas Air Worldwide Holdings, Inc. ‡ | | 45,620 | | 1,199 | |
Auto Components - 1.1% | | | | | |
Goodyear Tire & Rubber Co. ‡ | | 228,010 | | 2,937 | |
Beverages - 1.7% | | | | | |
Molson Coors Brewing Co. -Class B | | 91,530 | | 4,482 | |
Capital Markets - 2.3% | | | | | |
Affiliated Managers Group, Inc. ‡ | | 63,104 | | 4,006 | |
Investment Technology Group, Inc. ‡ | | 103,099 | | 2,224 | |
Chemicals - 3.6% | | | | | |
Celanese Corp. -Series A | | 102,700 | | 2,819 | |
Intrepid Potash, Inc. ‡ | | 122,200 | | 3,148 | |
Lubrizol Corp. | | 57,100 | | 3,800 | |
Commercial Banks - 2.2% | | | | | |
Comerica, Inc. | | 68,460 | | 1,899 | |
Fifth Third Bancorp | | 171,100 | | 1,530 | |
KeyCorp | | 230,790 | | 1,244 | |
Marshall & Ilsley Corp. | | 136,800 | | 728 | |
Regions Financial Corp. | | 114,700 | | 555 | |
Communications Equipment - 1.1% | | | | | |
ADC Telecommunications, Inc. ‡ | | 287,890 | | 1,869 | |
Juniper Networks, Inc. ‡ | | 45,600 | | 1,163 | |
Computers & Peripherals - 1.4% | | | | | |
Seagate Technology | | 262,300 | | 3,659 | |
Construction & Engineering - 0.6% | | | | | |
Foster Wheeler AG ‡ | | 57,500 | | 1,609 | |
Consumer Finance - 1.0% | | | | | |
SLM Corp. ‡ | | 274,030 | | 2,658 | |
Diversified Consumer Services - 0.7% | | | | | |
Apollo Group, Inc. -Class A ‡ | | 34,200 | | 1,953 | |
Diversified Financial Services - 1.7% | | | | | |
Fifth Street Finance Corp. | | 173,195 | | 1,703 | |
Invesco, Ltd. | | 136,900 | | 2,895 | |
Electric Utilities - 3.9% | | | | | |
Allegheny Energy, Inc. | | 171,120 | | 3,905 | |
Cleco Corp. | | 114,090 | | 2,824 | |
NV Energy, Inc. | | 345,590 | | 3,961 | |
Electrical Equipment - 1.5% | | | | | |
General Cable Corp. ‡ | | 125,560 | | 3,910 | |
Electronic Equipment & Instruments - 2.1% | | | | | |
Agilent Technologies, Inc. ‡ | | 114,794 | | 2,840 | |
Amphenol Corp. -Class A | | 69,118 | | 2,773 | |
Energy Equipment & Services - 1.4% | | | | | |
Smith International, Inc. | | 45,600 | | 1,264 | |
Weatherford International, Ltd. ‡ | | 143,692 | | 2,519 | |
Food & Staples Retailing - 1.9% | | | | | |
Kroger Co. | | 228,190 | | 5,279 | |
Food Products - 1.3% | | | | | |
Campbell Soup Co. | | 68,820 | | 2,185 | |
Dole Food Co., Inc. ‡ | | 114,000 | | 1,338 | |
Gas Utilities - 1.1% | | | | | |
EQT Corp. | | 68,500 | | 2,867 | |
Health Care Equipment & Supplies - 1.9% | | | | | |
Hospira, Inc. ‡ | | 115,230 | | 5,144 | |
Health Care Providers & Services - 3.1% | | | | | |
Aetna, Inc. | | 142,030 | | 3,697 | |
DaVita, Inc. ‡ | | 86,137 | | 4,567 | |
Hotels, Restaurants & Leisure - 4.1% | | | | | |
Bally Technologies, Inc. ‡ | | 40,160 | | 1,582 | |
Brinker International, Inc. | | 342,300 | | 4,327 | |
Burger King Holdings, Inc. | | 172,170 | | 2,954 | |
Pinnacle Entertainment, Inc. ‡ | | 285,130 | | 2,409 | |
Household Durables - 0.3% | | | | | |
Lennar Corp. -Class A | | 57,400 | | 723 | |
Household Products - 1.6% | | | | | |
Energizer Holdings, Inc. ‡ | | 68,678 | | 4,180 | |
Independent Power Producers & Energy Traders - 1.0% | | | | | |
NRG Energy, Inc. ‡ | | 113,830 | | 2,617 | |
Industrial Conglomerates - 2.0% | | | | | |
Tyco International, Ltd. | | 159,790 | | 5,361 | |
Insurance - 8.5% | | | | | |
ACE, Ltd. ‡ | | 103,678 | | 5,325 | |
Assurant, Inc. | | 171,190 | | 5,124 | |
Everest RE Group, Ltd. | | 80,354 | | 7,031 | |
Fidelity National Financial, Inc. -Class A | | 182,591 | | 2,478 | |
Genworth Financial, Inc. -Class A ‡ | | 136,900 | | 1,454 | |
Transatlantic Holdings, Inc. | | 28,480 | | 1,438 | |
Internet Software & Services - 0.4% | | | | | |
Valueclick, Inc. ‡ | | 114,500 | | 1,127 | |
IT Services - 1.9% | | | | | |
Teletech Holdings, Inc. ‡ | | 287,487 | | 5,143 | |
Leisure Equipment & Products - 1.5% | | | | | |
Mattel, Inc. | | 207,350 | | 3,925 | |
Life Sciences Tools & Services - 2.5% | | | | | |
Charles River Laboratories International, Inc. ‡ | | 115,040 | | 4,201 | |
Thermo Fisher Scientific, Inc. ‡ | | 57,620 | | 2,593 | |
Machinery - 2.1% | | | | | |
Navistar International Corp. ‡ | | 171,001 | | 5,667 | |
Media - 2.5% | | | | | |
Cablevision Systems Corp. -Class A | | 171,850 | | 3,946 | |
Time Warner Cable, Inc. | | 68,840 | | 2,715 | |
Metals & Mining - 1.8% | | | | | |
Cliffs Natural Resources, Inc. | | 68,500 | | 2,437 | |
Nucor Corp. | | 57,600 | | 2,295 | |
Multi-Utilities - 2.3% | | | | | |
CMS Energy Corp. | | 456,578 | | 6,072 | |
Oil, Gas & Consumable Fuels - 5.3% | | | | | |
Alpha Natural Resources, Inc. ‡ | | 102,700 | | 3,490 | |
Cabot Oil & Gas Corp. | | 57,480 | | 2,211 | |
Noble Energy, Inc. | | 46,080 | | 3,024 | |
Peabody Energy Corp. | | 68,461 | | 2,710 | |
Range Resources Corp. | | 57,519 | | 2,879 | |
Pharmaceuticals - 2.2% | | | | | |
Biovail Corp. | | 102,700 | | 1,382 | |
Shire PLC ADR | | 85,520 | | 4,559 | |
Professional Services - 2.4% | | | | | |
FTI Consulting, Inc. ‡ | | 68,700 | | 2,804 | |
Watson Wyatt Worldwide, Inc. -Class A | | 80,130 | | 3,492 | |
Real Estate Investment Trusts - 2.8% | | | | | |
BioMed Realty Trust, Inc. | | 115,196 | | 1,563 | |
CreXus Investment Corp. ‡ | | 91,600 | | 1,299 | |
ProLogis | | 258,450 | | 2,928 | |
Starwood Property Trust, Inc. | | 91,900 | | 1,850 | |
Road & Rail - 0.8% | | | | | |
Norfolk Southern Corp. | | 45,640 | | 2,128 | |
| | | | | | |
The notes to the financial statements are an integral part of this report.
104
| | Shares | | Value | |
Semiconductors & Semiconductor Equipment - 4.2% | | | | | |
Avago Technologies, Ltd. ‡ | | 159,700 | | $ | 2,396 | |
LAM Research Corp. ‡ | | 69,115 | | 2,331 | |
LSI Corp. ‡ | | 573,690 | | 2,936 | |
Marvell Technology Group, Ltd. ‡ | | 137,700 | | 1,889 | |
Varian Semiconductor Equipment Associates, Inc. ‡ | | 69,115 | | 1,962 | |
Software - 1.7% | | | | | |
Electronic Arts, Inc. ‡ | | 114,760 | | 2,093 | |
McAfee, Inc. ‡ | | 57,416 | | 2,405 | |
Specialty Retail - 3.6% | | | | | |
Abercrombie & Fitch Co. -Class A | | 57,100 | | 1,874 | |
Advance Auto Parts, Inc. | | 79,901 | | 2,977 | |
Bed Bath & Beyond, Inc. ‡ | | 80,310 | | 2,828 | |
Chico’s FAS, Inc. ‡ | | 171,130 | | 2,045 | |
Textiles, Apparel & Luxury Goods - 1.0% | | | | | |
Phillips-Van Heusen Corp. | | 68,860 | | 2,765 | |
Thrifts & Mortgage Finance - 0.9% | | | | | |
NewAlliance Bancshares, Inc. | | 229,550 | | 2,543 | |
Tobacco - 1.1% | | | | | |
Lorillard, Inc. | | 36,921 | | 2,870 | |
Trading Companies & Distributors - 1.0% | | | | | |
Aircastle, Ltd. | | 345,590 | | 2,737 | |
Wireless Telecommunication Services - 1.4% | | | | | |
Crown Castle International Corp. ‡ | | 45,700 | | 1,381 | |
NII Holdings, Inc. ‡ | | 91,230 | | 2,457 | |
Total Common Stocks (cost $225,316) | | | | 265,440 | |
| | | | | |
| | Principal | | | |
REPURCHASE AGREEMENT - 3.5% | | | | | |
State Street Repurchase Agreement 0.01%, dated 10/30/2009, to be repurchased at $9,315 on 11/02/2009. Collateralized by a U.S. Government Agency Obligation, 4.00%, due 12/15/2017, and with a value of $9,505. | | $ | 9,315 | | 9,315 | |
Total Repurchase Agreement (cost $9,315) | | | | | |
| | | | | |
Total Investment Securities (cost $234,631) # | | | | 274,755 | |
Other Assets and Liabilities - Net | | | | (5,474 | ) |
| | | | | |
Net Assets | | | | $ | 269,281 | |
| | | | | | | |
NOTES TO SCHEDULE OF INVESTMENTS:
‡ | Non-income producing security. |
# | Aggregate cost for federal income tax purposes is $243,570. Aggregate gross unrealized appreciation/depreciation for all securities in which there is an excess of value over tax cost were $37,930 and $6,745, respectively. Net unrealized appreciation for tax purposes is $31,185. |
DEFINITION:
ADR | | American Depositary Receipt |
VALUATION SUMMARY:
Investment Securities | | Level 1 | | Level 2 | | Level 3 | | Total | |
Equities - Consumer Discretionary | | $ | 39,960 | | $ | — | | $ | — | | $ | 39,960 | |
Equities - Consumer Staples | | 20,334 | | — | | — | | 20,334 | |
Equities - Energy | | 18,097 | | — | | — | | 18,097 | |
Equities - Financials | | 52,475 | | — | | — | | 52,475 | |
Equities - Health Care | | 26,143 | | — | | — | | 26,143 | |
Equities - Industrials | | 33,262 | | — | | — | | 33,262 | |
Equities - Information Technology | | 34,586 | | — | | — | | 34,586 | |
Equities - Materials | | 14,499 | | — | | — | | 14,499 | |
Equities - Telecommunication Services | | 3,838 | | — | | — | | 3,838 | |
Equities - Utilities | | 22,246 | | — | | — | | 22,246 | |
Cash & Cash Equivalent - Repurchase Agreement | | — | | 9,315 | | — | | 9,315 | |
Total | | $ | 265,440 | | $ | 9,315 | | $ | — | | $ | 274,755 | |
The notes to the financial statements are an integral part of this report.
105
Transamerica Schroders International Small Cap
SCHEDULE OF INVESTMENTS
At October 31, 2009
(all amounts except share amounts in thousands)
| | Shares | | Value | |
COMMON STOCKS - 95.9% | | | | | |
Australia - 5.9% | | | | | |
Amcor, Ltd. | | 586,631 | | $ | 3,021 | |
Ansell, Ltd. | | 430,611 | | 3,979 | |
Computershare, Ltd. | | 559,324 | | 5,430 | |
Crane Group, Ltd. | | 313,615 | | 2,527 | |
Elders, Ltd. ‡ | | 5,773,354 | | 947 | |
Fairfax Media, Ltd. Λ | | 1,020,044 | | 1,446 | |
Iluka Resources, Ltd. ‡Λ | | 1,439,458 | | 4,459 | |
Mirvac Group REIT | | 2,527,473 | | 3,309 | |
Sonic Healthcare, Ltd. | | 428,088 | | 5,345 | |
Transpacific Industries Group, Ltd. ‡ | | 1,337,516 | | 1,788 | |
Austria - 2.6% | | | | | |
Andritz AG | | 91,645 | | 5,046 | |
Kapsch Trafficcom AG § | | 66,000 | | 2,321 | |
Oesterreichische Post AG | | 55,000 | | 1,605 | |
Rosenbauer International AG § | | 60,408 | | 2,336 | |
Schoeller-Bleckmann Oilfield Equipment AG | | 64,962 | | 3,028 | |
Belgium - 1.6% | | | | | |
Bekaert SA | | 26,000 | | 3,344 | |
EVS Broadcast Equipment SA | | 43,405 | | 3,192 | |
Telenet Group Holding NV ‡ | | 88,056 | | 2,347 | |
Bermuda - 3.1% | | | | | |
Aquarius Platinum, Ltd. ‡ | | 289,058 | | 1,233 | |
ARA Asset Management, Ltd. -144A | | 4,255,000 | | 2,498 | |
Beijing Enterprises Water Group, Ltd. ‡ | | 11,276,000 | | 2,735 | |
China Resources Gas Group, Ltd. | | 3,918,000 | | 3,792 | |
Coslight Technology International Group, Ltd. | | 196,000 | | 391 | |
Dockwise, Ltd. ‡ | | 1,092,751 | | 1,607 | |
Kerry Properties, Ltd. | | 842,000 | | 4,710 | |
Canada - 0.4% | | | | | |
Niko Resources, Ltd. | | 20,030 | | 1,621 | |
Sino-Forest Corp. -Class A ‡ | | 52,212 | | 735 | |
Cayman Islands - 0.8% | | | | | |
Inspur International, Ltd. | | 4,370,000 | | 620 | |
Lee & Man Paper Manufacturing, Ltd. | | 1,837,600 | | 3,633 | |
Shanda Games, Ltd. ADR ‡ | | 34,800 | | 347 | |
China - 0.7% | | | | | |
Centron Telecom International Holdings, Ltd. ‡ | | 2,073,000 | | 589 | |
China Southern Airlines Co., Ltd. ‡ | | 10,928,000 | | 3,192 | |
Denmark - 1.5% | | | | | |
Topdanmark A/S ‡ | | 28,000 | | 4,037 | |
TrygVesta AS | | 60,000 | | 4,324 | |
Finland - 0.3% | | | | | |
Elisa OYJ | | 97,026 | | 1,879 | |
France - 6.2% | | | | | |
Alten, Ltd. ‡ | | 142,000 | | 3,562 | |
Bourbon SA Λ | | 125,000 | | 5,199 | |
Compagnie des Alpes | | 4,431 | | 163 | |
Easydentic ‡ | | 30,619 | | 318 | |
Homair SA ‡ | | 68,000 | | 287 | |
Ipsen SA | | 76,879 | | 3,918 | |
IPSOS | | 80,000 | | 2,449 | |
Maximiles ‡ | | 19,000 | | 195 | |
Meetic ‡ | | 80,000 | | 2,342 | |
Neopost SA | | 26,000 | | 2,275 | |
Rubis | | 54,039 | | 4,961 | |
Saft Groupe SA | | 31,100 | | 1,615 | |
Seloger Promesses ‡ | | 35,000 | | 1,226 | |
Store Electronic ‡ | | 60,000 | | 1,046 | |
Sword Group | | 78,655 | | 2,725 | |
Virbac SA | | 16,623 | | 1,564 | |
Germany - 7.2% | | | | | |
Bauer AG | | 56,166 | | 2,226 | |
Bilfinger Berger AG | | 76,581 | | 4,932 | |
Centrotherm Photovoltaics AG ‡ | | 14,117 | | 644 | |
Demag Cranes AG | | 79,195 | | 2,745 | |
GFK Se | | 80,000 | | 2,531 | |
Grenkeleasing AG § | | 49,044 | | 1,899 | |
Hawesko Holding AG § | | 26,512 | | 741 | |
Medion AG | | 28,493 | | 299 | |
Morphosys AG ‡ | | 80,000 | | 2,096 | |
MTU Aero Engines Holding AG | | 87,098 | | 3,958 | |
Rheinmetall AG | | 98,947 | | 5,379 | |
SFC Smart Fuel Cell AG ठ| | 101,922 | | 1,102 | |
Symrise AG | | 137,515 | | 2,493 | |
Tipp24 SE | | 31,607 | | 1,287 | |
Tognum AG | | 125,000 | | 1,911 | |
United Internet AG ‡ | | 77,166 | | 1,005 | |
Wirecard AG | | 240,000 | | 3,122 | |
Xing AG ‡ | | 11,316 | | 585 | |
Greece - 0.6% | | | | | |
Aegean Airlines SA | | 180,000 | | 1,102 | |
Eurobank Properties Real Estate Investment Co. REIT | | 77,429 | | 974 | |
Jumbo SA | | 111,736 | | 1,397 | |
Hong Kong - 2.9% | | | | | |
China Everbright, Ltd. | | 314,000 | | 742 | |
China Taiping Insurance Holdings Co., Ltd. ‡ | | 1,258,000 | | 4,402 | |
Citic 1616 Holdings, Ltd. | | 385,000 | | 126 | |
Citic Pacific, Ltd. | | 703,000 | | 1,807 | |
Dah Sing Banking Group, Ltd. ‡ | | 2,468,400 | | 3,429 | |
MTR Corp. | | 580,000 | | 2,006 | |
Techtronic Industries Co. ‡ | | 3,757,000 | | 3,013 | |
Ireland - 0.7% | | | | | |
DCC PLC | | 139,459 | | 3,657 | |
Israel - 0.2% | | | | | |
Oridion Systems, Ltd. ठ| | 145,500 | | 954 | |
Italy - 3.3% | | | | | |
Acea SpA ‡ | | 168,000 | | 1,965 | |
Azimut Holding SpA | | 612,696 | | 7,393 | |
Buzzi Unicem SpA | | 152,898 | | 1,507 | |
CIR-Compagnie Industriali Riunite SpA ‡ | | 1,491,319 | | 3,356 | |
Natuzzi SpA ADR ठ| | 361,000 | | 1,148 | |
Zignago Vetro SpA | | 400,000 | | 2,322 | |
Japan - 19.5% | | | | | |
AICA Kogyo Co., Ltd. | | 175,500 | | 1,679 | |
Arcs Co., Ltd. | | 251,200 | | 3,690 | |
Chugoku Marine Paints, Ltd. | | 555,000 | | 3,893 | |
Daido Steel Co., Ltd. Λ | | 585,000 | | 1,991 | |
Daihatsu Diesel Manufacturing Co., Ltd. | | 221,000 | | 962 | |
DC Co., Ltd. | | 47,800 | | 148 | |
DOWA Holdings Co., Ltd. | | 291,000 | | 1,699 | |
Exedy Corp. | | 103,000 | | 2,118 | |
Fujikura Kasei Co., Ltd. | | 272,800 | | 1,409 | |
Glory, Ltd. | | 111,800 | | 2,460 | |
HIS Co., Ltd. | | 135,200 | | 2,906 | |
Hisaka Works, Ltd. | | 138,000 | | 1,444 | |
Icom, Inc. | | 35,800 | | 865 | |
JSP Corp. | | 246,100 | | 2,353 | |
Kuroda Electric Co., Ltd. | | 166,900 | | 2,413 | |
Lintec Corp. | | 127,600 | | 2,259 | |
Miura Co., Ltd. | | 99,900 | | 2,790 | |
Modec, Inc. | | 166,400 | | 3,307 | |
Moshi Moshi Hotline, Inc. ‡ | | 147,050 | | 2,672 | |
Musashi Seimitsu Industry Co., Ltd. | | 228,300 | | 4,737 | |
Nabtesco Corp. | | 392,000 | | 4,514 | |
NEC Networks & System Integration Corp. | | 181,500 | | 2,205 | |
Nichi-Iko Pharmaceutical Co., Ltd. Λ | | 140,700 | | 4,185 | |
Nidec Copal Corp. | | 205,700 | | 3,084 | |
Nifco, Inc. | | 193,700 | | 3,964 | |
Nihon Parkerizing Co., Ltd. | | 165,000 | | 1,956 | |
Nippon Thompson Co., Ltd. | | 792,000 | | 4,154 | |
| | | | | | |
The notes to the financial statements are an integral part of this report.
106
| | Shares | | Value | |
Japan (continued) | | | | | |
Nishimatsuya Chain Co., Ltd. | | 120,100 | | $ | 1,203 | |
Nitta Corp. | | 252,100 | | 3,678 | |
Obic Co., Ltd. Λ | | 23,900 | | 4,041 | |
Seven Bank, Ltd. | | 917 | | 2,240 | |
Shinko Plantech Co., Ltd. | | 111,000 | | 1,134 | |
Shinmaywa Industries, Ltd. | | 728,000 | | 2,624 | |
Sumida Corp. | | 300,600 | | 1,987 | |
Takasago International Corp. | | 469,000 | | 2,450 | |
Tokai Tokyo Financial Holdings | | 886,000 | | 2,871 | |
Tokyo Tomin Bank, Ltd. | | 86,500 | | 1,261 | |
Trusco Nakayama Corp. | | 185,200 | | 2,885 | |
Tsumura & Co. | | 63,400 | | 2,182 | |
Tsuruha Holdings, Inc. Λ | | 66,600 | | 2,596 | |
Tsutsumi Jewelry Co., Ltd. | | 96,000 | | 2,260 | |
Union Tool Co. | | 83,100 | | 2,423 | |
Korea, Republic of - 1.8% | | | | | |
Doosan Infracore Co., Ltd. | | 198,920 | | 2,831 | |
Hite Brewery Co., Ltd. | | 4,313 | | 587 | |
Industrial Bank of Korea ‡ | | 128,380 | | 1,555 | |
Samsung SDI Co., Ltd. | | 36,397 | | 4,154 | |
Yuhan Corp. | | 3,408 | | 551 | |
Netherlands - 4.6% | | | | | |
Accell Group | | 27,900 | | 1,359 | |
Exact Holding NV | | 43,700 | | 1,205 | |
Fugro NV | | 88,752 | | 4,944 | |
Imtech NV | | 117,820 | | 2,995 | |
James Hardie Industries NV ‡ | | 369,873 | | 2,344 | |
SBM Offshore NV | | 202,500 | | 3,878 | |
Smartrac NV ‡ | | 77,927 | | 1,347 | |
Smit Internationale NV | | 32,020 | | 2,517 | |
Ten Cate NV | | 193,400 | | 4,528 | |
New Zealand - 1.2% | | | | | |
Fisher & Paykel Healthcare Corp., Ltd. | | 541,452 | | 1,200 | |
Fletcher Building, Ltd. | | 940,181 | | 5,553 | |
Norway - 0.4% | | | | | |
Pronova BioPharma AS ‡ | | 635,000 | | 1,970 | |
Singapore - 2.0% | | | | | |
Goodpack, Ltd. Λ | | 2,213,000 | | 2,000 | |
Keppel Land, Ltd. | | 408,000 | | 812 | |
Olam International, Ltd. Λ | | 1,165,000 | | 2,236 | |
Singapore Airport Terminal Services, Ltd. | | 1,820,000 | | 3,181 | |
Wing Tai Holdings, Ltd. | | 2,330,000 | | 2,727 | |
Spain - 1.8% | | | | | |
Baron de Ley ‡ | | 3,994 | | 194 | |
Enagas | | 170,000 | | 3,497 | |
Laboratorios Farmaceuticos Rovi SA | | 97,904 | | 1,106 | |
Red Electrica Corp. SA | | 92,000 | | 4,752 | |
Sweden - 1.6% | | | | | |
Mekonomen AB | | 2,872 | | 55 | |
Saab AB ‡ | | 126,000 | | 1,654 | |
Swedish Match AB | | 331,551 | | 6,805 | |
Switzerland - 9.7% | | | | | |
Acino Holding AG | | 34,000 | | 5,580 | |
Bank Sarasin & Cie AG ‡ | | 125,000 | | 4,977 | |
Banque Cantonale Vaudoise | | 10,500 | | 3,955 | |
BKW FMB Energie AG | | 32,430 | | 2,668 | |
Bucher Industries AG | | 25,000 | | 2,627 | |
Compagnie Financiere Tradition SA | | 7,800 | | 967 | |
Dufry Group ‡ | | 68,809 | | 4,347 | |
GAM Holding, Ltd. | | 250,000 | | 3,050 | |
Gategroup Holding AG ‡ | | 150,000 | | 3,948 | |
Gurit Holding AG | | 2,827 | | 1,560 | |
Helvetia Holding AG | | 9,466 | | 3,018 | |
Kuoni Reisen Holding AG | | 3,885 | | 1,317 | |
Lonza Group AG | | 25,000 | | 1,944 | |
Mobilezone Holding AG | | 304,041 | | 2,335 | |
Newave Energy Holding SA ठ| | 12,286 | | 496 | |
Partners Group Holding AG | | 19,822 | | 2,431 | |
Sika AG | | 2,476 | | 3,357 | |
Temenos Group AG ‡Λ | | 85,134 | | 1,943 | |
Valora Holding AG | | 7,819 | | 1,864 | |
VZ Holding AG | | 4,521 | | 348 | |
United Kingdom - 14.6% | | | | | |
Air Berlin, PLC ‡ | | 146,048 | | 738 | |
Albemarle & Bond Holdings | | 372,313 | | 1,472 | |
AMEC PLC | | 136,234 | | 1,794 | |
Anglo Pacific Group PLC | | 409,268 | | 1,388 | |
Assetco PLC | | 262,853 | | 272 | |
Babcock International Group | | 144,684 | | 1,436 | |
Bodycote PLC | | 526,291 | | 1,406 | |
BSS Group PLC | | 233,460 | | 1,018 | |
Burberry Group PLC | | 191,518 | | 1,689 | |
Carillion PLC | | 345,894 | | 1,666 | |
Chloride Group PLC | | 572,616 | | 1,511 | |
Consort Medical PLC | | 195,489 | | 1,307 | |
Cranswick PLC | | 105,715 | | 1,215 | |
CSR PLC ‡ | | 259,521 | | 1,894 | |
Daily Mail & General Trust | | 305,129 | | 1,985 | |
Dana Petroleum PLC ‡ | | 64,500 | | 1,349 | |
Dechra Pharmaceuticals PLC | | 263,470 | | 1,983 | |
E2V Technologies PLC § | | 600,131 | | 699 | |
eaga PLC ‡ | | 807,549 | | 1,927 | |
Elementis PLC | | 1,716,762 | | 1,787 | |
Fidessa Group PLC | | 83,775 | | 1,642 | |
Forth Ports PLC | | 67,192 | | 1,217 | |
Future PLC | | 1,540,001 | | 516 | |
Go-Ahead Group PLC | | 64,775 | | 1,508 | |
Grainger PLC | | 219,213 | | 1,030 | |
Greggs PLC | | 212,155 | | 1,498 | |
Hamworthy PLC | | 390,342 | | 1,627 | |
Helphire Group PLC ‡ | | 477,353 | | 449 | |
HMV Group PLC | | 600,000 | | 1,090 | |
Holidaybreak PLC | | 144,444 | | 661 | |
Homeserve PLC | | 58,143 | | 1,539 | |
Hunting PLC | | 211,113 | | 1,813 | |
IG Group Holdings PLC | | 311,353 | | 1,540 | |
Inchcape PLC ‡ | | 1,912,337 | | 917 | |
Intec Telecom Systems PLC ‡ | | 1,385,869 | | 2,483 | |
Investec PLC | | 217,397 | | 1,552 | |
John Wood Group PLC | | 308,963 | | 1,618 | |
Keller Group PLC | | 154,801 | | 1,812 | |
Kier Group PLC | | 92,564 | | 1,461 | |
Laird PLC | | 137,625 | | 329 | |
Millennium & Copthorne Hotels PLC | | 100,000 | | 553 | |
Mitie Group PLC | | 368,036 | | 1,440 | |
Oxford Instruments PLC | | 200,598 | | 800 | |
Premier Oil PLC ‡ | | 78,202 | | 1,508 | |
Provident Financial PLC | | 98,667 | | 1,505 | |
PV Crystalox Solar PLC | | 711,762 | | 762 | |
Scott Wilson Group PLC | | 967,802 | | 2,037 | |
SDL PLC ‡ | | 194,848 | | 1,290 | |
Shanks Group PLC | | 1,294,041 | | 1,823 | |
Stagecoach Group PLC Λ | | 585,225 | | 1,386 | |
Tate & Lyle PLC | | 234,229 | | 1,724 | |
Ultra Electronic Corp. ‡ | | 52,177 | | 1,126 | |
Victrex PLC | | 113,217 | | 1,409 | |
Vitec Group PLC | | 101,031 | | 629 | |
VT Group PLC | | 198,231 | | 1,765 | |
Wellstream Holdings PLC | | 171,752 | | 1,439 | |
WH Smith PLC | | 195,766 | | 1,615 | |
William Hill PLC | | 562,042 | | 1,543 | |
United States - 0.7% | | | | | |
Sohu.com, Inc. ‡ | | 63,788 | | 3,547 | |
Total Common Stocks (cost $496,408) | | | | 521,213 | |
| | | | | | |
The notes to the financial statements are an integral part of this report.
107
| | Shares | | Value | |
RIGHTS - 0.0% | | | | | |
United Kingdom - 0.0% | | | | | |
Laird PLC ‡ | | 68,812 | | $ | 46 | |
Total Rights (cost $101) | | | | | |
| | | | | |
| | Principal | | | |
REPURCHASE AGREEMENT - 3.8% | | | | | |
State Street Repurchase Agreement 0.01%, dated 10/30/2009, to be repurchased at $20,715 on 11/02/2009. Collateralized by a U.S. Government Agency Obligation, 4.00%, due 12/15/2017, and with a value of $21,132. | | $ | 20,715 | | 20,715 | |
Total Repurchase Agreement (cost $20,715) | | | | | |
| | | | | |
| | Shares | | | |
SECURITIES LENDING COLLATERAL - 1.6% | | | | | |
State Street Navigator Securities Lending Trust - Prime Portfolio, 0.35% p | | 8,547,011 | | 8,547 | |
Total Securities Lending Collateral (cost $8,547) | | | | | |
| | | | | |
Total Investment Securities (cost $525,771) # | | | | 550,521 | |
Other Assets and Liabilities - Net | | | | (6,848 | ) |
| | | | | |
Net Assets | | | | $ | 543,673 | |
| | | | | | | |
INVESTMENTS BY INDUSTRY (unaudited): | | Percentage of
Total Investments | | Value | |
Machinery | | 8.7 | % | $ | 47,731 | |
Energy Equipment & Services | | 5.4 | | 29,875 | |
Chemicals | | 5.3 | | 28,890 | |
Capital Markets | | 4.3 | | 24,187 | |
Pharmaceuticals | | 4.2 | | 23,039 | |
Construction & Engineering | | 4.2 | | 22,850 | |
Insurance | | 3.2 | | 17,320 | |
IT Services | | 2.9 | | 16,155 | |
Commercial Services & Supplies | | 2.9 | | 15,638 | |
Specialty Retail | | 2.8 | | 15,455 | |
Industrial Conglomerates | | 2.6 | | 14,199 | |
Electronic Equipment & Instruments | | 2.4 | | 13,667 | |
Software | | 2.2 | | 11,635 | |
Electrical Equipment | | 2.1 | | 11,385 | |
Commercial Banks | | 1.8 | | 10,037 | |
Diversified Financial Services | | 1.8 | | 9,989 | |
Metals & Mining | | 1.7 | | 9,382 | |
Real Estate Management & Development | | 1.6 | | 9,279 | |
Hotels, Restaurants & Leisure | | 1.5 | | 8,717 | |
Food & Staples Retailing | | 1.5 | | 8,522 | |
Aerospace & Defense | | 1.5 | | 8,503 | |
Gas Utilities | | 1.5 | | 8,458 | |
Oil, Gas & Consumable Fuels | | 1.5 | | 7,679 | |
Media | | 1.4 | | 7,622 | |
Internet Software & Services | | 1.4 | | 7,479 | |
Health Care Equipment & Supplies | | 1.4 | | 7,440 | |
Electric Utilities | | 1.3 | | 7,420 | |
Communications Equipment | | 1.3 | | 7,381 | |
Transportation Infrastructure | | 1.3 | | 6,915 | |
Auto Components | | 1.2 | | 6,910 | |
Tobacco | | 1.2 | | 6,805 | |
Leisure Equipment & Products | | 1.2 | | 6,469 | |
Trading Companies & Distributors | | 1.2 | | 6,316 | |
Textiles, Apparel & Luxury Goods | | 1.1 | | 6,217 | |
Food Products | | 1.0 | | 5,384 | |
Road & Rail | | 1.0 | | 5,349 | |
Health Care Providers & Services | | 1.0 | | 5,345 | |
Containers & Packaging | | 0.9 | | 5,343 | |
Airlines | | 0.9 | | 5,032 | |
Paper & Forest Products | | 0.8 | | 4,368 | |
| | | | | | |
The notes to the financial statements are an integral part of this report.
108
(all amounts in thousands)
INVESTMENTS BY INDUSTRY (unaudited): (continued) | | Percentage of
Total Investments | | Value | |
Diversified Telecommunication Services | | 0.8 | % | $ | 4,352 | |
Real Estate Investment Trusts | | 0.8 | | 4,283 | |
Building Products | | 0.7 | | 4,206 | |
Household Durables | | 0.7 | | 4,161 | |
Life Sciences Tools & Services | | 0.7 | | 4,040 | |
Construction Materials | | 0.7 | | 3,999 | |
Air Freight & Logistics | | 0.7 | | 3,605 | |
Office Electronics | | 0.4 | | 2,275 | |
Professional Services | | 0.4 | | 2,037 | |
Multi-Utilities | | 0.4 | | 1,965 | |
Semiconductors & Semiconductor Equipment | | 0.3 | | 1,894 | |
Consumer Finance | | 0.3 | | 1,472 | |
Distributors | | 0.3 | | 1,216 | |
Beverages | | 0.1 | | 781 | |
Household Products | | 0.1 | | 391 | |
Internet & Catalog Retail | | 0.0 | | 195 | |
Investment Securities, at Value | | 94.6 | | 521,259 | |
Short-Term Investments | | 5.4 | | 29,262 | |
Total Investments | | 100.0 | % | $ | 550,521 | |
NOTES TO SCHEDULE OF INVESTMENTS:
‡ Non-income producing security.
Λ All or a portion of this security is on loan. The value of all securities on loan is $8,007.
p Rate shown reflects the yield at 10/31/2009.
§ Illiquid. These securities aggregated to less than $11,696, or less than 2.15%, of the fund’s net assets.
# Aggregate cost for federal income tax purposes is $527,939. Aggregate gross unrealized appreciation/depreciation for all securities in which there is an excess of value over tax cost were $40,864 and $18,282, respectively. Net unrealized appreciation for tax purposes is $22,582.
DEFINITIONS:
144A | 144A Securities are registered pursuant to Rule 144A of the Securities Act of 1933. These securities are deemed to be liquid for purposes of compliance limitations on holdings of illiquid securities and may be resold as transactions exempt from registration, normally to qualified institutional buyers. At 10/31/2009, these securities aggregated $2,498, or 0.46%, of the fund’s net assets. |
ADR | American Depositary Receipt |
REIT | Real Estate Investment Trust (includes domestic REITs and Foreign Real Estate Investment Companies) |
VALUATION SUMMARY:
Investment Securities | | Level 1 | | Level 2 | | Level 3 | | Total | |
Equities - Consumer Discretionary | | $ | 3,241 | | $ | 53,722 | | $ | — | | $ | 56,963 | |
Equities - Consumer Staples | | — | | 21,882 | | — | | 21,882 | |
Equities - Energy | | 3,060 | | 34,494 | | — | | 37,554 | |
Equities - Financials | | — | | 76,567 | | — | | 76,567 | |
Equities - Health Care | | 2,262 | | 37,601 | | — | | 39,863 | |
Equities - Industrials | | 5,867 | | 142,344 | | — | | 148,211 | |
Equities - Information Technology | | 5,438 | | 55,049 | | — | | 60,487 | |
Equities - Materials | | 735 | | 56,801 | | — | | 57,536 | |
Equities - Telecommunication Services | | — | | 4,352 | | — | | 4,352 | |
Equities - Utilities | | 2,668 | | 15,175 | | — | | 17,843 | |
Cash & Cash Equivalent - Repurchase Agreement | | — | | 20,716 | | — | | 20,716 | |
Cash & Cash Equivalent - Securities Lending Collateral | | 8,547 | | — | | — | | 8,547 | |
Total | | $ | 31,818 | | $ | 518,703 | | $ | — | | $ | 550,521 | |
The notes to the financial statements are an integral part of this report.
109
Transamerica Third Avenue Value
SCHEDULE OF INVESTMENTS
At October 31, 2009
(all amounts except share amounts in thousands)
| | Shares | | Value | |
COMMON STOCKS - 86.8% | | | | | |
Austria - 0.3% | | | | | |
Andritz AG | | 25,000 | | $ | 1,377 | |
Bermuda - 2.3% | | | | | |
Brookfield Infrastructure Partners, LP | | 26,617 | | 386 | |
Montpelier Re Holdings, Ltd. | | 325,711 | | 5,263 | |
Nabors Industries, Ltd. ‡ | | 196,865 | | 4,101 | |
Canada - 14.6% | | | | | |
Brookfield Asset Management, Inc. -Class A Λ | | 864,586 | | 18,070 | |
Canfor Corp. ‡ | | 739,723 | | 4,136 | |
E-L Financial Corp., Ltd. § | | 5,786 | | 2,540 | |
EnCana Corp. | | 327,000 | | 18,113 | |
Power Corp. of Canada | | 507,564 | | 11,961 | |
Viterra, Inc. ‡ | | 732,150 | | 6,969 | |
France - 0.6% | | | | | |
Sanofi-Aventis SA | | 32,950 | | 2,415 | |
Germany - 1.1% | | | | | |
Lanxess AG | | 148,000 | | 4,640 | |
Hong Kong - 18.5% | | | | | |
Cheung Kong Holdings, Ltd. | | 1,479,153 | | 18,866 | |
Chong Hing Bank, Ltd. | | 486,190 | | 943 | |
Hang Lung Group, Ltd. | | 928,692 | | 4,702 | |
Hang Lung Properties, Ltd. | | 1,703,749 | | 6,428 | |
Henderson Land Development Co., Ltd. | | 3,474,538 | | 24,586 | |
Hutchison Whampoa, Ltd. | | 2,095,888 | | 14,711 | |
Wharf Holdings, Ltd. | | 1,507,141 | | 8,172 | |
Japan - 11.6% | | | | | |
Mitsui Fudosan Co., Ltd. | | 949,462 | | 15,362 | |
Sapporo Holdings, Ltd. Λ | | 534,000 | | 2,788 | |
Tokio Marine Holdings, Inc. | | 470,080 | | 12,020 | |
Toyota Industries Corp. | | 705,107 | | 19,098 | |
Korea, Republic of - 4.2% | | | | | |
POSCO ADR | | 174,261 | | 17,796 | |
Sweden - 3.4% | | | | | |
Investor AB -Class A | | 841,546 | | 14,453 | |
United Kingdom - 0.3% | | | | | |
Derwent London PLC REIT | | 70,050 | | 1,427 | |
United States - 29.9% | | | | | |
Alamo Group, Inc. | | 213,981 | | 2,932 | |
Alexander & Baldwin, Inc. | | 118,770 | | 3,424 | |
Applied Materials, Inc. | | 493,961 | | 6,026 | |
AVX Corp. | | 861,145 | | 9,748 | |
Bank of New York Mellon Corp. | | 560,052 | | 14,930 | |
Bristow Group, Inc. ‡ | | 173,630 | | 5,061 | |
Capital Southwest Corp. | | 19,256 | | 1,430 | |
Cimarex Energy Co. | | 526,128 | | 20,603 | |
Cross Country Healthcare, Inc. ‡ | | 211,206 | | 1,745 | |
Electro Scientific Industries, Inc. ‡ | | 196,486 | | 2,150 | |
Electronics for Imaging, Inc. ‡ | | 177,436 | | 2,069 | |
Forest City Enterprises, Inc. -Class A | | 679,836 | | 5,928 | |
Intel Corp. | | 355,961 | | 6,803 | |
Investment Technology Group, Inc. ‡ | | 314,815 | | 6,790 | |
Leucadia National Corp. ‡ | | 50,000 | | 1,124 | |
Lexmark International, Inc. -Class A ‡ | | 66,205 | | 1,688 | |
MDC Holdings, Inc. | | 53,363 | | 1,741 | |
Pharmaceutical Product Development, Inc. | | 300,710 | | 6,480 | |
St. Joe Co. ‡ | | 370,892 | | 8,879 | |
St. Mary Land & Exploration Co. | | 34,198 | | 1,166 | |
Sycamore Networks, Inc. ‡ | | 1,508,183 | | 4,298 | |
Tejon Ranch Co. ‡ | | 76,574 | | 1,996 | |
Tellabs, Inc. ‡ | | 941,479 | | 5,668 | |
Westwood Holdings Group, Inc. | | 111,753 | | 3,944 | |
Total Common Stocks (cost $464,461) | | | | 367,946 | |
| | | | | |
| | Principal | | | |
SHORT-TERM U.S. GOVERNMENT OBLIGATION - 7.1% | | | | | |
United States - 7.1% | | | | | |
U.S. Treasury Bill | | | | | |
0.15%, 04/08/2010 p | | $ | 30,000 | | | 29,980 | |
Total Short-Term U.S. Government Obligation (cost $29,979) | | | | | |
| | | | | |
REPURCHASE AGREEMENT - 5.8% | | | | | |
State Street Repurchase Agreement 0.01%, dated 10/30/2009, to be repurchased at $24,577 on 11/02/2009. Collateralized by a U.S. Government Agency Obligation, 4.00%, due 12/15/2017, and with a value of $25,074. | | 24,577 | | 24,577 | |
Total Repurchase Agreement (cost $24,577) | | | | | |
| | | | | |
| | Shares | | | |
SECURITIES LENDING COLLATERAL - 4.1% | | | | | |
State Street Navigator Securities Lending Trust - Prime Portfolio, 0.35% p | | 17,277,762 | | 17,278 | |
Total Securities Lending Collateral (cost $17,278) | | | | | |
| | | | | |
Total Investment Securities (cost $536,295) # | | | | 439,781 | |
Other Assets and Liabilities - Net | | | | (16,231 | ) |
| | | | | |
Net Assets | | | | $ | 423,550 | |
| | | | | | | |
The notes to the financial statements are an integral part of this report.
110
(all amounts in thousands)
INVESTMENTS BY INDUSTRY (unaudited): | | Percentage of
Total Investments | | Value | |
Real Estate Management & Development | | 25.8 | % | $ | 112,989 | |
Oil, Gas & Consumable Fuels | | 9.0 | | 39,882 | |
Insurance | | 7.2 | | 31,784 | |
Capital Markets | | 6.1 | | 27,094 | |
Auto Components | | 4.4 | | 19,098 | |
Metals & Mining | | 4.0 | | 17,796 | |
Diversified Financial Services | | 3.6 | | 15,577 | |
Industrial Conglomerates | | 3.3 | | 14,711 | |
Semiconductors & Semiconductor Equipment | | 2.9 | | 12,829 | |
Electronic Equipment & Instruments | | 2.7 | | 11,898 | |
Communications Equipment | | 2.3 | | 9,966 | |
Energy Equipment & Services | | 2.1 | | 9,162 | |
Food Products | | 1.6 | | 6,969 | |
Life Sciences Tools & Services | | 1.5 | | 6,480 | |
Chemicals | | 1.1 | | 4,640 | |
Machinery | | 1.0 | | 4,309 | |
Paper & Forest Products | | 0.9 | | 4,136 | |
Computers & Peripherals | | 0.9 | | 3,757 | |
Marine | | 0.8 | | 3,424 | |
Beverages | | 0.6 | | 2,788 | |
Pharmaceuticals | | 0.5 | | 2,415 | |
Health Care Providers & Services | | 0.4 | | 1,745 | |
Household Durables | | 0.4 | | 1,741 | |
Real Estate Investment Trusts | | 0.3 | | 1,427 | |
Commercial Banks | | 0.2 | | 943 | |
Electric Utilities | | 0.1 | | 386 | |
Investment Securities, at Value | | 83.7 | | 367,946 | |
Short-Term Investments | | 16.3 | | 71,835 | |
Total Investments | | 100.0 | % | $ | 439,781 | |
NOTES TO SCHEDULE OF INVESTMENTS:
‡ | Non-income producing security. |
Λ | All or a portion of this security is on loan. The value of all securities on loan is $16,733. |
p | Rate shown reflects the yield at 10/31/2009. |
§ | Illiquid. These securities aggregated to less than $2,540, or less than 0.60%, of the fund’s net assets. |
# | Aggregate cost for federal income tax purposes is $537,898. Aggregate gross unrealized appreciation/depreciation for all securities in which there is an excess of value over tax cost were $15,354 and $113,471, respectively. Net unrealized depreciation for tax purposes is $98,117. |
DEFINITIONS:
ADR | American Depositary Receipt |
REIT | Real Estate Investment Trust (includes domestic REITs and Foreign Real Estate Investment Companies) |
VALUATION SUMMARY:
Investment Securities | | Level 1 | | Level 2 | | Level 3 | | Total | |
Equities - Consumer Discretionary | | $ | 1,741 | | $ | 19,097 | | $ | — | | $ | 20,838 | |
Equities - Consumer Staples | | 6,969 | | 2,788 | | — | | 9,757 | |
Equities - Energy | | 49,044 | | — | | — | | 49,044 | |
Equities - Financials | | 82,856 | | 106,959 | | — | | 189,815 | |
Equities - Health Care | | 8,225 | | 2,415 | | — | | 10,640 | |
Equities - Industrials | | 6,356 | | 16,088 | | — | | 22,444 | |
Equities - Information Technology | | 38,450 | | — | | — | | 38,450 | |
Equities - Materials | | 21,932 | | 4,640 | | — | | 26,572 | |
Equities - Utilities | | 386 | | — | | — | | 386 | |
Fixed Income - Short-Term U.S. Government Obligation | | — | | 29,980 | | — | | 29,980 | |
Cash & Cash Equivalent - Repurchase Agreement | | — | | 24,577 | | — | | 24,577 | |
Cash & Cash Equivalent - Securities Lending Collateral | | 17,278 | | — | | — | | 17,278 | |
Total | | $ | 233,237 | | $ | 206,544 | | $ | — | | $ | 439,781 | |
The notes to the financial statements are an integral part of this report.
111
Transamerica Thornburg International Value
SCHEDULE OF INVESTMENTS
At October 31, 2009
(all amounts except share amounts in thousands)
| | Shares | | Value | |
COMMON STOCKS - 97.3% | | | | | |
Australia - 1.9% | | | | | |
BHP Billiton, Ltd. | | 347,888 | | $ | 11,410 | |
Brazil - 4.6% | | | | | |
BM&FBOVESPA SA | | 955,500 | | 6,183 | |
Companhia Brasileira de Meios de Pagamento | | 102,600 | | 941 | |
Empresa Brasileira de Aeronautica SA ADR ‡ | | 176,327 | | 3,571 | |
Natura Cosmeticos SA ‡ | | 235,600 | | 4,220 | |
Petroleo Brasileiro SA ADR | | 271,000 | | 12,525 | |
Canada - 6.1% | | | | | |
Canadian National Railway Co. | | 207,289 | | 10,019 | |
Canadian Natural Resources, Ltd. | | 158,407 | | 10,279 | |
Potash Corp. of Saskatchewan, Inc. | | 67,965 | | 6,306 | |
Rogers Communications, Inc. -Class B | | 331,795 | | 9,736 | |
Cayman Islands - 0.8% | | | | | |
Baidu, Inc. ADR ‡ | | 12,300 | | 4,648 | |
China - 4.9% | | | | | |
China Merchants Bank Co., Ltd. -Class H | | 4,400,540 | | 11,258 | |
Industrial & Commercial Bank of China -Class H | | 19,510,200 | | 15,523 | |
Sinopharm Group Co. -Class H ‡ | | 681,200 | | 2,465 | |
Denmark - 4.4% | | | | | |
Novo Nordisk A/S -Class B | | 240,894 | | 14,966 | |
Vestas Wind Systems A/S ‡ | | 155,365 | | 10,897 | |
Finland - 1.5% | | | | | |
Fortum OYJ | | 58,270 | | 1,379 | |
Nokia OYJ | | 591,165 | | 7,467 | |
France - 9.6% | | | | | |
Air Liquide SA | | 79,024 | | 8,511 | |
AXA SA | | 500,731 | | 12,453 | |
BNP Paribas | | 150,805 | | 11,361 | |
Lafarge SA | | 127,746 | | 10,369 | |
LVMH Moet Hennessy Louis Vuitton SA | | 132,990 | | 13,771 | |
Germany - 6.8% | | | | | |
Deutsche Bank AG | | 134,146 | | 9,746 | |
Deutsche Boerse AG | | 36,241 | | 2,935 | |
E.ON AG | | 157,695 | | 6,044 | |
Fresenius Medical Care AG & Co. KGaA | | 182,496 | | 8,857 | |
SAP AG | | 285,640 | | 12,938 | |
Greece - 2.3% | | | | | |
National Bank of Greece SA ‡ | | 365,996 | | 13,381 | |
Guernsey, Channel Islands - 1.0% | | | | | |
Amdocs, Ltd. ‡ | | 241,913 | | 6,096 | |
Hong Kong - 4.2% | | | | | |
CNOOC, Ltd. | | 7,173,192 | | 10,636 | |
Hong Kong Exchanges & Clearing, Ltd. | | 822,500 | | 14,457 | |
Ireland - 0.8% | | | | | |
Covidien PLC | | 111,200 | | 4,684 | |
Israel - 3.0% | | | | | |
Teva Pharmaceutical Industries, Ltd. ADR | | 348,538 | | 17,594 | |
Italy - 1.2% | | | | | |
Intesa Sanpaolo SpA ‡ | | 1,663,918 | | 7,003 | |
Japan - 8.4% | | | | | |
Fanuc, Ltd. | | 82,126 | | 6,821 | |
Komatsu, Ltd. | | 749,112 | | 14,604 | |
Mitsubishi UFJ Financial Group, Inc. | | 2,077,400 | | 11,065 | |
Nintendo Co., Ltd. | | 20,680 | | 5,187 | |
Toyota Motor Corp. | | 304,955 | | 12,039 | |
Korea, Republic of - 0.8% | | | | | |
Hyundai Motor Co. | | 51,043 | | 4,630 | |
Mexico - 3.1% | | | | | |
America Movil SAB de CV -Series L ADR | | 169,889 | | 7,497 | |
Wal-Mart de Mexico SAB de CV -Series V | | 2,974,240 | | 10,585 | |
Netherlands Antilles - 1.4% | | | | | |
Schlumberger, Ltd. | | 130,714 | | 8,130 | |
Spain - 2.3% | | | | | |
Telefonica SA | | 490,342 | | | 13,694 | |
Sweden - 2.0% | | | | | |
Hennes & Mauritz AB - Class B | | 213,390 | | 12,121 | |
Switzerland - 7.9% | | | | | |
Julius Baer Group, Ltd. | | 165,455 | | 6,229 | |
Logitech International SA ‡ | | 264,562 | | 4,516 | |
Nestle SA | | 302,446 | | 14,064 | |
Novartis AG | | 238,841 | | 12,438 | |
Roche Holding AG | | 59,029 | | 9,454 | |
Turkey - 1.0% | | | | | |
Turkcell Iletisim Hizmet AS | | 857,796 | | 5,675 | |
United Kingdom - 16.1% | | | | | |
ARM Holdings PLC | | 2,400,314 | | 5,831 | |
Barclays PLC ‡ | | 933,243 | | 4,891 | |
British American Tobacco PLC | | 294,229 | | 9,376 | |
British Sky Broadcasting Group PLC | | 975,324 | | 8,504 | |
Carnival PLC | | 390,455 | | 12,105 | |
Kingfisher PLC | | 2,352,498 | | 8,599 | |
Pearson PLC | | 477,707 | | 6,493 | |
Reckitt Benckiser Group PLC | | 249,026 | | 12,370 | |
SABMiller PLC | | 339,798 | | 8,907 | |
Smith & Nephew PLC | | 633,958 | | 5,604 | |
Standard Chartered PLC | | 489,688 | | 12,012 | |
United States - 1.2% | | | | | |
Southern Copper Corp. | | 166,200 | | 5,236 | |
Synthes, Inc. | | 18,176 | | 2,156 | |
Total Common Stocks (cost $529,192) | | | | 575,462 | |
| | Principal | | | |
REPURCHASE AGREEMENT - 2.6% | | | | | |
State Street Repurchase Agreement 0.01%, dated 10/30/2009, to be repurchased at $15,590 on 11/02/2009. Collateralized by a U.S. Government Agency Obligation, 4.00%, due 12/15/2017, and with a value of $15,902. | | $ | 15,590 | | 15,590 | |
Total Repurchase Agreement (cost $15,590) | | | | | |
| | | | | |
Total Investment Securities (cost $544,782) # | | | | 591,052 | |
Other Assets and Liabilities - Net | | | | 487 | |
| | | | | |
Net Assets | | | | $ | 591,539 | |
| | | | | | | |
The notes to the financial statements are an integral part of this report.
112
(all amounts in thousands)
FORWARD FOREIGN CURRENCY CONTRACTS:
Currency | | Bought (Sold) | | Settlement
Date | | Amount in U.S.
Dollars Bought
(Sold) | | Net Unrealized
Appreciation
(Depreciation) | |
Brazilian Real | | (20,601 | ) | 01/22/2010 | | (11,559 | ) | 50 | |
Mexican Peso | | 12,301 | | 11/30/2009 | | 902 | | 26 | |
Mexican Peso | | (97,496 | ) | 11/30/2009 | | (7,222 | ) | (134 | ) |
Mexican Peso | | (22,596 | ) | 11/30/2009 | | (1,655 | ) | (49 | ) |
Mexican Peso | | (107,876 | ) | 11/30/2009 | | (7,920 | ) | (219 | ) |
| | | | | | | | $ | (326 | ) |
| | | | | | | | | | |
INVESTMENTS BY INDUSTRY (unaudited): | | Percentage of
Total Investments | | Value | | | | | |
Commercial Banks | | 14.6 | % | $ | 86,494 | | | | | |
Pharmaceuticals | | 9.6 | | 56,917 | | | | | |
Oil, Gas & Consumable Fuels | | 5.6 | | 33,440 | | | | | |
Software | | 4.2 | | 24,221 | | | | | |
Diversified Financial Services | | 3.9 | | 23,575 | | | | | |
Wireless Telecommunication Services | | 3.9 | | 22,908 | | | | | |
Machinery | | 3.6 | | 21,425 | | | | | |
Specialty Retail | | 3.6 | | 20,720 | | | | | |
Automobiles | | 2.8 | | 16,669 | | | | | |
Metals & Mining | | 2.8 | | 16,646 | | | | | |
Capital Markets | | 2.7 | | 15,975 | | | | | |
Media | | 2.5 | | 14,997 | | | | | |
Chemicals | | 2.5 | | 14,817 | | | | | |
Food Products | | 2.4 | | 14,064 | | | | | |
Textiles, Apparel & Luxury Goods | | 2.4 | | 13,771 | | | | | |
Diversified Telecommunication Services | | 2.3 | | 13,694 | | | | | |
Insurance | | 2.1 | | 12,453 | | | | | |
Health Care Equipment & Supplies | | 2.1 | | 12,444 | | | | | |
Household Products | | 2.1 | | 12,370 | | | | | |
Hotels, Restaurants & Leisure | | 2.0 | | 12,105 | | | | | |
Electrical Equipment | | 1.8 | | 10,897 | | | | | |
Food & Staples Retailing | | 1.8 | | 10,585 | | | | | |
Construction Materials | | 1.8 | | 10,369 | | | | | |
Road & Rail | | 1.7 | | 10,019 | | | | | |
Tobacco | | 1.6 | | 9,376 | | | | | |
Beverages | | 1.5 | | 8,907 | | | | | |
Health Care Providers & Services | | 1.5 | | 8,857 | | | | | |
Energy Equipment & Services | | 1.4 | | 8,130 | | | | | |
Communications Equipment | | 1.3 | | 7,467 | | | | | |
Electric Utilities | | 1.2 | | 7,423 | | | | | |
Semiconductors & Semiconductor Equipment | | 1.0 | | 5,831 | | | | | |
Internet Software & Services | | 0.8 | | 4,648 | | | | | |
Computers & Peripherals | | 0.8 | | 4,516 | | | | | |
Personal Products | | 0.7 | | 4,220 | | | | | |
Aerospace & Defense | | 0.6 | | 3,571 | | | | | |
IT Services | | 0.2 | | 941 | | | | | |
Investment Securities, at Value | | 97.4 | | 575,462 | | | | | |
Short-Term Investments | | 2.6 | | 15,590 | | | | | |
Total Investments | | 100.0 | % | $ | 591,052 | | | | | |
NOTES TO SCHEDULE OF INVESTMENTS:
‡ | Non-income producing security. |
# | Aggregate cost for federal income tax purposes is $546,717. Aggregate gross unrealized appreciation/depreciation for all securities in which there is an excess of value over tax cost were $51,711 and $7,336, respectively. Net unrealized appreciation for tax purposes is $44,375. |
The notes to the financial statements are an integral part of this report.
113
DEFINITION:
ADR American Depositary Receipt
VALUATION SUMMARY:
Investment Securities | | Level 1 | | Level 2 | | Level 3 | | Total | |
Equities - Consumer Discretionary | | $ | 2,465 | | $ | 78,262 | | $ | — | | $ | 80,727 | |
Equities - Consumer Staples | | 14,804 | | 44,717 | | — | | 59,521 | |
Equities - Energy | | 30,936 | | 10,635 | | — | | 41,571 | |
Equities - Financials | | 12,412 | | 126,086 | | — | | 138,498 | |
Equities - Health Care | | 22,278 | | 53,475 | | — | | 75,753 | |
Equities - Industrials | | 13,590 | | 32,322 | | — | | 45,912 | |
Equities - Information Technology | | 11,685 | | 35,939 | | — | | 47,624 | |
Equities - Materials | | 11,541 | | 30,290 | | — | | 41,831 | |
Equities - Telecommunication Services | | 17,233 | | 19,369 | | — | | 36,602 | |
Equities - Utilities | | — | | 7,423 | | — | | 7,423 | |
Cash & Cash Equivalent - Repurchase Agreement | | — | | 15,590 | | — | | 15,590 | |
Total | | $ | 136,944 | | $ | 454,108 | | $ | — | | $ | 591,052 | |
Other Financial Instruments * | | Level 1 | | Level 2 | | Level 3 | | Total | |
Forward Foreign Currency Contracts | | $ | — | | $ | (326 | ) | $ | — | | $ | (326 | ) |
Total | | $ | — | | $ | (326 | ) | $ | — | | $ | (326 | ) |
* Other financial instruments are derivative instruments. Future Contracts, Forward Foreign Currency Contracts and Swap Contracts are valued at unrealized appreciation (depreciation) on the instrument.
The notes to the financial statements are an integral part of this report.
114
Transamerica UBS Dynamic Alpha
SCHEDULE OF INVESTMENTS
At October 31, 2009
(all amounts except share amounts in thousands)
| | Shares | | Value | |
COMMON STOCKS - 0.0% | | | | | |
France - 0.0% | | | | | |
Societe Generale | | 530 | | $ | 34 | |
Ireland - 0.0% | | | | | |
CRH PLC | | 104 | | 3 | |
Spain - 0.0% | | | | | |
Banco Santander SA ‡ | | 297 | | 5 | |
United Kingdom - 0.0% | | | | | |
Cattles PLC ठ| | 51,630 | | 6 | |
Total Common Stocks (cost $312) | | | | 48 | |
| | | | | | |
| | Principal | | | |
REPURCHASE AGREEMENT - 99.2% | | | | | |
State Street Repurchase Agreement 0.01%, dated 10/30/2009, to be repurchased at $106,130 on 11/02/2009. Collateralized by U.S. Government Agency Obligations, 4.00%, due 12/15/2017, and with a values of $108,257. | | $ | 106,130 | | | 106,130 | |
Total Repurchase Agreement (cost $106,130) | | | | | |
| | | | | |
Total Investment Securities (cost $106,442) # | | | | 106,178 | |
Other Assets and Liabilities - Net | | | | 839 | |
| | | | | |
Net Assets | | | | $ | 107,017 | |
| | | | | | | |
FORWARD FOREIGN CURRENCY CONTRACTS:
Currency | | Bought (Sold) | | Settlement
Date | | Amount in U.S.
Dollars Bought
(Sold) | | Net Unrealized
Appreciation
(Depreciation) | |
Malaysian Ringgit | | (10,368 | ) | 12/02/2009 | | (3,042 | ) | 9 | |
Malaysian Ringgit | | 10,368 | | 12/02/2009 | | 2,939 | | 95 | |
Republic of Korea Won | | (2,456,000 | ) | 12/02/2009 | | (2,063 | ) | (23 | ) |
Republic of Korea Won | | 2,456,000 | | 12/02/2009 | | 1,965 | | 120 | |
Russian Ruble | | (12,955 | ) | 12/02/2009 | | (402 | ) | (39 | ) |
Russian Ruble | | 12,955 | | 12/02/2009 | | 440 | | 1 | |
Taiwan Dollar | | (82,600 | ) | 12/02/2009 | | (2,546 | ) | (3 | ) |
Taiwan Dollar | | 82,600 | | 12/02/2009 | | 2,526 | | 23 | |
| | | | | | | | $ | 183 | |
| | | | | | | | | | |
INVESTMENTS BY INDUSTRY (unaudited): | | Percentage of
Total Investments | | Value | | | | | |
Commercial Banks | | 0.0 | % | $ | 39 | | | | | |
Consumer Finance | | 0.0 | | 6 | | | | | |
Construction Materials | | 0.0 | | 3 | | | | | |
Investment Securities, at Value | | 0.0 | | 48 | | | | | |
Short-Term Investments | | 100.0 | | 106,130 | | | | | |
Total Investments | | 100.0 | % | $ | 106,178 | | | | | |
NOTES TO SCHEDULE OF INVESTMENTS:
‡ | Non-income producing security. |
§ | Illiquid. These securities aggregated to less than $6, or less than 0.01%, of the fund’s net assets. |
# | Aggregate cost for federal income tax purposes is $106,792. Aggregate gross unrealized depreciation for all securities in which there is an excess of value over tax cost was $614. |
VALUATION SUMMARY:
Investment Securities | | Level 1 | | Level 2 | | Level 3 | | Total | |
Equities - Financials | | $ | 5 | | $ | 34 | | $ | 6 | | $ | 45 | |
Equities - Materials | | — | | 3 | | — | | 3 | |
Cash & Cash Equivalent - Repurchase Agreement | | — | | 106,130 | | — | | 106,130 | |
Total | | $ | 5 | | $ | 106,167 | | $ | 6 | | $ | 106,178 | |
Other Financial Instruments * | | Level 1 | | Level 2 | | Level 3 | | Total | |
Forward Foreign Currency Contracts | | $ | — | | $ | 183 | | $ | — | | $ | 183 | |
Total | | $ | — | | $ | 183 | | $ | — | | $ | 183 | |
Level 3 Rollforward - Investment Securities
Securities | | Beginning
Balance at
10/31/2008 | | Net
Purchases/(Sales) | | Accrued
Discounts/(Premiums) | | Total Realized
Gain/(Loss) | | Change in Unrealized
Appreciation/(Depreciation) | | Net Transfers
In/(Out) of
Level 3 | | Ending
Balance at
10/31/2009 | |
Fixed Income - Materials | | $ | — | | $ | — | | $ | — | | $ | — | | $ | (21 | ) | $ | 27 | | $ | 6 | |
Total | | $ | — | | $ | — | | $ | — | | $ | — | | $ | (21 | ) | $ | 27 | | $ | 6 | |
* | Other financial instruments are derivative instruments. Futures Contracts, Forward Foreign Currency Contracts and Swap Contracts are valued at unrealized appreciation (depreciation) on the instrument. |
The notes to the financial statements are an integral part of this report.
115
Transamerica UBS Large Cap Value
SCHEDULE OF INVESTMENTS
At October 31, 2009
(all amounts except share amounts in thousands)
| | Shares | | Value | |
COMMON STOCKS - 97.9% | | | | | |
Aerospace & Defense - 2.1% | | | | | |
General Dynamics Corp. | | 339,100 | | $ | 21,262 | |
Air Freight & Logistics - 2.5% | | | | | |
FedEx Corp. | | 343,400 | | 24,962 | |
Airlines - 1.0% | | | | | |
Southwest Airlines Co. | | 1,137,000 | | 9,551 | |
Auto Components - 0.7% | | | | | |
BorgWarner, Inc. | | 235,000 | | 7,125 | |
Beverages - 1.3% | | | | | |
PepsiCo, Inc. | | 217,500 | | 13,170 | |
Capital Markets - 4.0% | | | | | |
Bank of New York Mellon Corp. | | 629,455 | | 16,781 | |
Morgan Stanley | | 724,200 | | 23,262 | |
Chemicals - 2.1% | | | | | |
EI du Pont de Nemours & Co. | | 653,200 | | 20,785 | |
Commercial Banks - 4.2% | | | | | |
City National Corp. Λ | | 146,600 | | 5,522 | |
Wells Fargo & Co. | | 1,326,000 | | 36,492 | |
Computers & Peripherals - 3.7% | | | | | |
Hewlett-Packard Co. | | 447,800 | | 21,252 | |
Seagate Technology | | 1,154,100 | | 16,100 | |
Diversified Financial Services - 7.6% | | | | | |
Bank of America Corp. | | 2,190,800 | | 31,942 | |
JPMorgan Chase & Co. | | 1,046,400 | | 43,708 | |
Diversified Operations - 2.6% | | | | | |
General Electric Co. | | 1,833,600 | | 26,147 | |
Diversified Telecommunication Services - 3.1% | | | | | |
AT&T, Inc. | | 1,218,900 | | 31,289 | |
Electric Utilities - 6.7% | | | | | |
American Electric Power Co., Inc. | | 627,000 | | 18,948 | |
Exelon Corp. | | 426,700 | | 20,037 | |
FirstEnergy Corp. | | 339,300 | | 14,685 | |
Pepco Holdings, Inc. | | 960,200 | | 14,336 | |
Energy Equipment & Services - 3.2% | | | | | |
Baker Hughes, Inc. | | 486,700 | | 20,476 | |
Noble Corp. | | 295,000 | | 12,018 | |
Health Care Equipment & Supplies - 3.1% | | | | | |
Covidien PLC | | 740,400 | | 31,186 | |
Health Care Providers & Services - 2.7% | | | | | |
Medco Health Solutions, Inc. ‡ | | 168,300 | | 9,445 | |
UnitedHealth Group, Inc. | | 682,500 | | 17,711 | |
Hotels, Restaurants & Leisure - 1.6% | | | | | |
Carnival Corp. | | 557,100 | | 16,223 | |
Household Durables - 1.0% | | | | | |
Fortune Brands, Inc. | | 250,200 | | 9,745 | |
Household Products - 2.4% | | | | | |
Procter & Gamble Co. | | 416,600 | | 24,162 | |
Independent Power Producers & Energy Traders - 0.5% | | | | | |
Dynegy, Inc. -Class A ‡ | | 2,345,600 | | 4,691 | |
Insurance - 5.3% | | | | | |
ACE, Ltd. ‡ | | 336,300 | | 17,272 | |
Aflac, Inc. | | 478,000 | | 19,833 | |
Principal Financial Group, Inc. | | 613,500 | | 15,362 | |
Machinery - 4.2% | | | | | |
Illinois Tool Works, Inc. | | 497,800 | | 22,858 | |
PACCAR, Inc. | | 530,900 | | 19,861 | |
Media - 4.6% | | | | �� | |
Comcast Corp. -Class A | | 1,656,000 | | 24,013 | |
Interpublic Group of Cos., Inc. ‡ | | 1,537,600 | | 9,256 | |
Time Warner, Inc. | | 441,400 | | 13,295 | |
Multi-Utilities - 1.1% | | | | | |
MDU Resources Group, Inc. | | 516,900 | | 10,726 | |
Oil, Gas & Consumable Fuels - 18.1% | | | | | |
Chevron Corp. | | 475,700 | | 36,410 | |
EOG Resources, Inc. | | 114,200 | | 9,326 | |
Exxon Mobil Corp. | | 646,100 | | 46,305 | |
Hess Corp. | | 325,100 | | 17,796 | |
Marathon Oil Corp. | | 732,000 | | 23,402 | |
Peabody Energy Corp. | | 525,300 | | 20,797 | |
Ultra Petroleum Corp. ‡ | | 326,200 | | 15,837 | |
Williams Cos., Inc. | | 571,200 | | 10,767 | |
Pharmaceuticals - 5.3% | | | | | |
Merck & Co., Inc. | | 423,900 | | 13,111 | |
Pfizer, Inc. | | 2,355,400 | | 40,112 | |
Road & Rail - 2.5% | | | | | |
Burlington Northern Santa Fe Corp. | | 176,600 | | 13,302 | |
Ryder System, Inc. | | 291,700 | | 11,828 | |
Wireless Telecommunication Services - 0.7% | | | | | |
Sprint Nextel Corp. ‡ | | 2,300,963 | | 6,811 | |
Total Common Stocks (cost $1,056,982) | | | | 981,293 | |
| | | | | |
INVESTMENT COMPANY - 1.0% | | | | | |
Capital Markets - 1.0% | | | | | |
SPDR Trust -Series 1 | | 97,000 | | 10,045 | |
Total Investment Company (cost $8,295) | | | | | |
| | | | | | |
| | Principal | | | |
REPURCHASE AGREEMENT - 1.2% | | | | | |
State Street Repurchase Agreement 0.01%, dated 10/30/2009, to be repurchased at $11,652 on 11/02/2009. Collateralized by a U.S. Government Agency Obligation, 4.00%, due 12/15/2017, and with a value of $11,887. | | $ | 11,652 | | 11,652 | |
Total Repurchase Agreement (cost $11,652) | | | | | |
| | | | | | |
| | Shares | | | |
SECURITIES LENDING COLLATERAL - 0.2% | | | | | |
State Street Navigator Securities Lending Trust - Prime Portfolio, 0.35% p | | 2,272,078 | | 2,272 | |
Total Securities Lending Collateral (cost $2,272) | | | | | |
| | | | | |
Total Investment Securities (cost $1,079,201) # | | | | 1,005,262 | |
Other Assets and Liabilities - Net | | | | (2,634) | |
| | | | | |
Net Assets | | | | $ | 1,002,628 | |
| | | | | | |
The notes to the financial statements are an integral part of this report.
116
(all amounts in thousands)
NOTES TO SCHEDULE OF INVESTMENTS:
Λ All or a portion of this security is on loan. The value of all securities on loan is $2,223.
‡ Non-income producing security.
p Rate shown reflects the yield at 10/31/2009.
# Aggregate cost for federal income tax purposes is $1,093,269. Aggregate gross unrealized appreciation/depreciation for all securities in which there is an excess of value over tax cost were $36,437 and $124,444, respectively. Net unrealized depreciation for tax purposes is $88,007.
DEFINITION:
SPDR Standard & Poor’s Depository Receipt
VALUATION SUMMARY:
Investment Securities | | Level 1 | | Level 2 | | Level 3 | | Total | |
Equities - Consumer Discretionary | | $ | 79,657 | | $ | — | | $ | — | | $ | 79,657 | |
Equities - Consumer Staples | | 37,333 | | — | | — | | 37,333 | |
Equities - Energy | | 213,134 | | — | | — | | 213,134 | |
Equities - Financials | | 236,320 | | — | | — | | 236,320 | |
Equities - Health Care | | 111,565 | | — | | — | | 111,565 | |
Equities - Industrials | | 123,624 | | — | | — | | 123,624 | |
Equities - Information Technology | | 37,352 | | — | | — | | 37,352 | |
Equities - Materials | | 20,785 | | — | | — | | 20,785 | |
Equities - Telecommunication Services | | 38,100 | | — | | — | | 38,100 | |
Equities - Utilities | | 83,423 | | — | | — | | 83,423 | |
Investment Company - Financials | | 10,045 | | — | | — | | 10,045 | |
Cash & Cash Equivalent - Repurchase Agreement | | — | | 11,652 | | — | | 11,652 | |
Cash & Cash Equivalent - Securities Lending Collateral | | 2,272 | | — | | — | | 2,272 | |
Total | | $ | 993,610 | | $ | 11,652 | | $ | — | | $ | 1,005,262 | |
The notes to the financial statements are an integral part of this report.
117
Transamerica Van Kampen Emerging Markets Debt
SCHEDULE OF INVESTMENTS
At October 31, 2009
(all amounts in thousands)
| | Principal | | Value | |
FOREIGN GOVERNMENT OBLIGATIONS - 77.9% | | | | | |
Argentina - 3.3% | | | | | |
Republic of Argentina | | | | | |
0.94%, 08/03/2012 * | | $ | 32,267 | | $ | 10,164 | |
8.28%, 12/31/2033 | | 3,676 | | 2,591 | |
Brazil - 12.7% | | | | | |
Banco Nacional de Desenvolvimento Economico e Social | | | | | |
6.37%, 06/16/2018 -144A | | 4,300 | | 4,537 | |
Notas Do Tesouro Nacional | | | | | |
10.00%, 01/01/2017 | | BRL | 15,400 | | 7,814 | |
Republic of Brazil | | | | | |
5.88%, 01/15/2019 | | $ | 400 | | 423 | |
7.13%, 01/20/2037 | | 970 | | 1,118 | |
8.00%, 01/15/2018 | | 7,028 | | 8,029 | |
8.88%, 10/14/2019 - 04/15/2024 | | 4,833 | | 6,180 | |
10.00%, 08/07/2011 | | 3,200 | | 3,648 | |
10.50%, 07/14/2014 | | 2,580 | | 3,277 | |
11.00%, 08/17/2040 | | 10,370 | | 13,844 | |
Bulgaria - 0.4% | | | | | |
Republic of Bulgaria | | | | | |
8.25%, 01/15/2015 | | 1,263 | | 1,468 | |
Colombia - 3.7% | | | | | |
Republic of Colombia | | | | | |
7.38%, 03/18/2019 | | 6,020 | | 6,809 | |
11.75%, 02/25/2020 | | 5,160 | | 7,456 | |
Cote d’Ivoire - 0.5% | | | | | |
Republic of Ivory Coast | | | | | |
4.00%, 03/31/2018 Џ | | 3,495 | | 1,748 | |
Croatia - 0.5% | | | | | |
Republic of Croatia | | | | | |
6.75%, 11/05/2019 -144A | | 1,740 | | 1,756 | |
Dominican Republic - 0.2% | | | | | |
Republic of the Dominican Republic | | | | | |
9.04%, 01/23/2018 | | 743 | | 780 | |
Ecuador - 0.6% | | | | | |
Republic of Ecuador | | | | | |
9.38%, 12/15/2015 Reg S | | 2,360 | | 2,183 | |
Georgia - 0.3% | | | | | |
Republic of Georgia | | | | | |
7.50%, 04/15/2013 | | 1,290 | | 1,290 | |
Ghana - 0.7% | | | | | |
Republic of Ghana | | | | | |
8.50%, 10/04/2017 -144A | | 2,596 | | 2,570 | |
Indonesia - 4.2% | | | | | |
Republic of Indonesia | | | | | |
6.88%, 01/17/2018 -144A | | 3,710 | | 3,942 | |
6.88%, 01/17/2018 Reg S | | 1,740 | | 1,848 | |
7.75%, 01/17/2038 -144A | | 8,531 | | 9,213 | |
7.75%, 01/17/2038 Reg S | | 893 | | 975 | |
Korea, Republic of - 1.2% | | | | | |
Export-Import Bank of Korea | | | | | |
5.88%, 01/14/2015 | | 2,990 | | 3,152 | |
Republic of Korea | | | | | |
5.75%, 04/16/2014 | | 1,220 | | 1,322 | |
Lithuania - 0.5% | | | | | |
Republic of Lithuania | | | | | |
6.75%, 01/15/2015 -144A | | 1,810 | | 1,821 | |
Mexico - 10.4% | | | | | |
Mexican Bonos | | | | | |
8.50%, 11/18/2038 | | MXN | 115,630 | | 8,552 | |
United Mexican States | | | | | |
5.63%, 01/15/2017 | | $ | 2,020 | | | 2,096 | |
5.95%, 03/19/2019 | | 15,540 | | 16,240 | |
6.05%, 01/11/2040 | | 2,750 | | 2,761 | |
6.75%, 09/27/2034 | | 5,887 | | 6,387 | |
10.00%, 12/05/2024 | | MXN | 42,910 | | 3,729 | |
Pakistan - 0.5% | | | | | |
Republic of Pakistan | | | | | |
6.88%, 06/01/2017 | | $ | 940 | | 837 | |
7.13%, 03/31/2016 -144A | | 360 | | 325 | |
7.13%, 03/31/2016 | | 830 | | 754 | |
Panama - 2.0% | | | | | |
Republic of Panama | | | | | |
7.13%, 01/29/2026 | | 1,690 | | 1,859 | |
8.88%, 09/30/2027 Λ | | 1,694 | | 2,134 | |
9.38%, 04/01/2029 | | 2,560 | | 3,482 | |
Peru - 3.9% | | | | | |
Republic of Peru | | | | | |
7.13%, 03/30/2019 | | 890 | | 1,012 | |
7.35%, 07/21/2025 | | 2,600 | | 2,984 | |
8.75%, 11/21/2033 | | 8,351 | | 10,897 | |
Philippines - 4.3% | | | | | |
Republic of the Philippines | | | | | |
8.38%, 06/17/2019 | | 1,841 | | 2,227 | |
8.88%, 03/17/2015 | | 3,086 | | 3,703 | |
9.00%, 02/15/2013 | | 7,000 | | 8,121 | |
9.50%, 02/02/2030 | | 1,796 | | 2,384 | |
Poland - 0.2% | | | | | |
Republic of Poland | | | | | |
6.38%, 07/15/2019 | | 865 | | 953 | |
Qatar - 0.5% | | | | | |
State of Qatar | | | | | |
9.75%, 06/15/2030 | | 1,220 | | 1,793 | |
Russian Federation - 10.6% | | | | | |
Russian Federation | | | | | |
7.50%, 03/31/2030 | | 29,774 | | 33,126 | |
12.75%, 06/24/2028 | | 4,470 | | 7,711 | |
South Africa - 0.2% | | | | | |
Republic of South Africa | | | | | |
6.88%, 05/27/2019 | | 790 | | 882 | |
Sri Lanka - 0.5% | | | | | |
Republic of Sri Lanka | | | | | |
7.40%, 01/22/2015 -144A | | 1,200 | | 1,200 | |
8.25%, 10/24/2012 | | 600 | | 629 | |
Turkey - 11.2% | | | | | |
Republic of Turkey | | | | | |
Zero Coupon, 05/11/2011 | | TRY | 13,220 | | 7,746 | |
6.88%, 03/17/2036 | | $ | 6,054 | | 6,099 | |
7.00%, 09/26/2016 | | 10,500 | | 11,603 | |
7.50%, 07/14/2017 | | 2,724 | | 3,041 | |
8.00%, 02/14/2034 | | 1,579 | | 1,792 | |
11.00%, 01/14/2013 - 08/06/2014 | | TRY | 5,760 | | 3,997 | |
11.00%, 01/14/2013 - 08/06/2014 | | $ | 1,912 | | 2,318 | |
11.88%, 01/15/2030 | | 1,951 | | 3,161 | |
16.00%, 03/07/2012 | | TRY | 4,480 | | 3,387 | |
Ukraine - 0.7% | | | | | |
Republic of Ukraine | | | | | |
6.58%, 11/21/2016 | | $ | 1,096 | | 806 | |
6.75%, 11/14/2017 | | 120 | | 88 | |
7.65%, 06/11/2013 | | 2,146 | | 1,910 | |
| | | | | | | | | |
The notes to the financial statements are an integral part of this report.
118
(all amounts except share amounts in thousands)
| | Principal | | Value | |
Uruguay - 0.3% | | | | | |
Republic of Uruguay | | | | | |
8.00%, 11/18/2022 | | $ | 953 | | $ | 1,077 | |
Venezuela - 3.8% | | | | | |
Republic of Venezuela | | | | | |
5.75%, 02/26/2016 Reg S | | 3,400 | | 2,287 | |
7.00%, 03/31/2038 | | 2,907 | | 1,613 | |
7.65%, 04/21/2025 | | 4,700 | | 2,867 | |
9.00%, 05/07/2023 Reg S | | 1,100 | | 776 | |
9.25%, 05/07/2028 | | 4,222 | | 3,008 | |
10.75%, 09/19/2013 | | 4,180 | | 3,979 | |
Total Foreign Government Obligations (cost $273,310) | | | | $ | 298,291 | |
| | | | | |
CORPORATE DEBT SECURITIES - 8.5% | | | | | |
Chile - 0.9% | | | | | |
Empresa Nacional del Petroleo | | | | | |
6.75%, 11/15/2012 -144A | | 500 | | 545 | |
6.75%, 11/15/2012 Reg S | | 2,810 | | 3,063 | |
Korea, Republic of - 0.4% | | | | | |
Korea Development Bank | | | | | |
8.00%, 01/23/2014 | | 1,460 | | 1,667 | |
Luxembourg - 1.7% | | | | | |
RSHB Capital SA for OJSC Russian Agricultural Bank | | | | | |
6.30%, 05/15/2017 -144A | | 1,527 | | 1,504 | |
7.18%, 05/16/2013 Reg S | | 450 | | 470 | |
7.18%, 05/16/2013 -144A | | 4,130 | | 4,301 | |
Mexico - 0.5% | | | | | |
Pemex Project Funding Master Trust | | | | | |
8.63%, 12/01/2023 Ђ | | 1,750 | | 1,997 | |
Netherlands - 3.3% | | | | | |
Intergas Finance BV | | | | | |
6.38%, 05/14/2017 Reg S | | 900 | | 846 | |
Kazmunaigaz Finance Sub BV | | | | | |
9.13%, 07/02/2018 -144A | | 9,600 | | 10,560 | |
Pindo Deli Finance BV | | | | | |
0.00%, 04/28/2025 Reg S * § | | 1,500 | | 15 | |
1.00%, 04/28/2025 -144A * § | | 9,415 | | 94 | |
2.29%, 04/28/2018 Reg S * Џ § | | 1,500 | | 166 | |
2.29%, 04/28/2015 -144A * Џ § | | 150 | | 16 | |
2.29%, 04/28/2015 Reg S * Џ § | | 297 | | 40 | |
Tjiwi Kimia Finance BV | | | | | |
0.00%, 04/28/2027 -144A * § | | 1,045 | | 10 | |
2.29%, 04/28/2015 Reg S * Џ § | | 988 | | 128 | |
2.29%, 04/28/2015 -144A * Џ § | | 2,148 | | 237 | |
2.29%, 04/28/2018 Reg S * Џ § | | 1,000 | | 110 | |
4.94%, 04/28/2027 Reg S § | | 1,500 | | 15 | |
Trinidad and Tobago - 0.8% | | | | | |
National Gas Co. of Trinidad & Tobago, Ltd. | | | | | |
6.05%, 01/15/2036 -144A | | 2,406 | | 2,215 | |
6.05%, 01/15/2036 Reg S | | 1,000 | | 920 | |
United States - 0.9% | | | | | |
Pemex Project Funding Master Trust | | | | | |
9.13%, 10/13/2010 | | 3,400 | | 3,604 | |
Total Corporate Debt Securities (cost $38,213) | | | | 32,523 | |
| | | | | |
REPURCHASE AGREEMENT - 0.6% | | | | | |
State Street Repurchase Agreement 0.01%, dated 10/30/2009, to be repurchased at $2,139 on 11/02/2009. Collateralized by a U.S. Government Agency Obligation, 4.00%, due 12/15/2017, and with a value of $2,183. | | 2,139 | | 2,139 | |
Total Repurchase Agreement (cost $2,139) | | | | | |
| | | | | | | | |
| | Shares | | | |
SECURITIES LENDING COLLATERAL - 0.0% | | | | | |
State Street Navigator Securities Lending Trust - Prime Portfolio, 0.35% p | | 73,815 | | 74 | |
Total Securities Lending Collateral (cost $74) | | | | | |
| | | | | |
Total Investment Securities (cost $313,736) # | | | | 333,027 | |
Other Assets and Liabilities - Net | | | | 49,591 | |
| | | | | | |
Net Assets | | | | $ | 382,618 | |
The notes to the financial statements are an integral part of this report.
119
(all amounts in thousands)
INVESTMENTS BY INDUSTRY (unaudited): | | Percentage of
Total Investments | | Value | |
Foreign Government Obligation | | 89.6 | % | $ | 298,291 | |
Oil, Gas & Consumable Fuels | | 5.9 | | 19,769 | |
Commercial Banks | | 2.4 | | 7,942 | |
Diversified Financial Services | | 0.9 | | 3,135 | |
Gas Utilities | | 0.3 | | 846 | |
Paper & Forest Products | | 0.2 | | 831 | |
Investment Securities, at Value | | 99.3 | | 330,814 | |
Short-Term Investments | | 0.7 | | 2,213 | |
Total Investments | | 100.0 | % | $ | 333,027 | |
NOTES TO SCHEDULE OF INVESTMENTS:
* Floating or variable rate note. Rate is listed as of 10/31/2009.
Џ In default.
Λ All or a portion of this security is on loan. The value of all securities on loan is $72.
Ђ Step bond. Interest rate may increase or decrease as the credit rating changes.
p Rate shown reflects the yield at 10/31/2009.
§ Illiquid. These securities aggregated to $831, or less than 0.22%, of the fund’s net assets.
# Aggregate cost for federal income tax purposes is $326,979. Aggregate gross unrealized appreciation/depreciation for all securities in which there is an excess of value over tax cost were $14,790 and $8,742, respectively. Net unrealized appreciation for tax purposes is $6,048.
DEFINITIONS:
144A | | 144A Securities are registered pursuant to Rule 144A of the Securities Act of 1933. These securities are deemed to be liquid for purposes of compliance limitations on holdings of illiquid securities and may be resold as transactions exempt from registration, normally to qualified institutional buyers. At 10/31/2009, these securities aggregated $44,846, or 11.73%, of the fund’s net assets. |
BRL | | Brazilian Real |
MXN | | Mexican Peso |
OJSC | | Open Joint Stock Company |
TRY | | Turkish New Lira |
VALUATION SUMMARY:
Investment Securities | | Level 1 | | Level 2 | | Level 3 | | Total | |
Fixed Income - Energy | | $ | — | | $ | 19,769 | | $ | — | | $ | 19,769 | |
Fixed Income - Financials | | — | | 11,077 | | — | | 11,077 | |
Fixed Income - Foreign Government Obligation | | — | | 298,291 | | — | | 298,291 | |
Fixed Income - Materials | | — | | — | | 831 | | 831 | |
Fixed Income - Utilities | | — | | 846 | | — | | 846 | |
Cash & Cash Equivalent - Repurchase Agreement | | — | | 2,139 | | — | | 2,139 | |
Cash & Cash Equivalent - Securities Lending Collateral | | 74 | | — | | — | | 74 | |
Total | | $ | 74 | | $ | 332,122 | | $ | 831 | | $ | 333,027 | |
Level 3 Rollforward - Investment Securities
Securities | | Beginning
Balance at
10/31/2008 | | Net
Purchases/(Sales) | | Accrued
Discounts/(Premiums) | | Total Realized
Gain/(Loss) | | Change in Unrealized
Appreciation/(Depreciation) | | Net Transfers
In/(Out) of
Level 3 | | Ending
Balance at
10/31/2009 | |
Fixed Income - Materials | | $ | — | | $ | (275 | ) | $ | 188 | | $ | 36 | | $ | (2,919 | ) | $ | 3,801 | | $ | 831 | |
Total | | $ | — | | $ | (275 | ) | $ | 188 | | $ | 36 | | $ | (2,919 | ) | $ | 3,801 | | $ | 831 | |
The notes to the financial statements are an integral part of this report.
120
Transamerica Van Kampen Mid-Cap Growth
SCHEDULE OF INVESTMENTS
At October 31, 2009
(all amounts except share amounts in thousands)
| | Shares | | Value | |
COMMON STOCKS - 90.4% | | | | | |
Air Freight & Logistics - 3.9% | | | | | |
CH Robinson Worldwide, Inc. | | 82,762 | | $ | 4,561 | |
Expeditors International of Washington, Inc. | | 171,697 | | 5,532 | |
Capital Markets - 3.5% | | | | | |
Calamos Asset Management, Inc. -Class A | | 147,402 | | 1,562 | |
Greenhill & Co., Inc. Λ | | 43,763 | | 3,774 | |
T. Rowe Price Group, Inc. | | 75,584 | | 3,683 | |
Chemicals - 4.0% | | | | | |
Intrepid Potash, Inc. ‡Λ | | 114,347 | | 2,946 | |
Nalco Holding Co. | | 203,226 | | 4,298 | |
Rockwood Holdings, Inc. ‡ | | 144,697 | | 2,877 | |
Commercial Services & Supplies - 0.9% | | | | | |
Covanta Holding Corp. ‡ | | 139,387 | | 2,395 | |
Communications Equipment - 1.4% | | | | | |
Palm, Inc. ‡Λ | | 306,818 | | 3,562 | |
Computers & Peripherals - 2.6% | | | | | |
Teradata Corp. ‡ | | 234,679 | | 6,543 | |
Construction Materials - 2.5% | | | | | |
Martin Marietta Materials, Inc. | | 62,500 | | 5,208 | |
Texas Industries, Inc. Λ | | 39,118 | | 1,302 | |
Distributors - 3.7% | | | | | |
Li & Fung, Ltd. | | 2,242,000 | | 9,409 | |
Diversified Consumer Services - 2.6% | | | | | |
New Oriental Education & Technology Group ADR ‡ | | 56,621 | | 3,954 | |
Strayer Education, Inc. | | 13,283 | | 2,696 | |
Diversified Financial Services - 6.7% | | | | | |
IntercontinentalExchange, Inc. ‡ | | 39,758 | | 3,983 | |
Leucadia National Corp. ‡ | | 237,869 | | 5,345 | |
Moody’s Corp. | | 64,550 | | 1,529 | |
MSCI, Inc. -Class A ‡ | | 207,319 | | 6,303 | |
Health Care Equipment & Supplies - 3.2% | | | | | |
Gen-Probe, Inc. ‡ | | 120,638 | | 5,033 | |
Intuitive Surgical, Inc. ‡ | | 12,808 | | 3,155 | |
Hotels, Restaurants & Leisure - 6.7% | | | | | |
Ctrip.com International, Ltd. ADR ‡ | | 144,143 | | 7,717 | |
Las Vegas Sands Corp. ‡Λ | | 209,162 | | 3,156 | |
Wynn Resorts, Ltd. ‡Λ | | 112,280 | | 6,088 | |
Household Durables - 3.4% | | | | | |
Gafisa SA ADR Λ | | 115,121 | | 3,429 | |
Mohawk Industries, Inc. ‡ | | 32,817 | | 1,406 | |
NVR, Inc. ‡ | | 5,863 | | 3,883 | |
Industrial Conglomerates - 0.9% | | | | | |
BYD Co., Ltd. -Class H ‡ | | 258,200 | | 2,367 | |
Internet & Catalog Retail - 3.8% | | | | | |
NetFlix, Inc. ‡Λ | | 37,501 | | 2,004 | |
priceline.com, Inc. ‡ | | 48,296 | | 7,621 | |
Internet Software & Services - 8.4% | | | | | |
Akamai Technologies, Inc. ‡ | | 199,918 | | 4,398 | |
Alibaba.com, Ltd. | | 2,214,700 | | 5,114 | |
Baidu, Inc. ADR ‡ | | 24,890 | | 9,406 | |
Equinix, Inc. ‡ | | 32,185 | | 2,746 | |
IT Services - 2.1% | | | | | |
Redecard SA | | 354,451 | | 5,262 | |
Life Sciences Tools & Services - 4.6% | | | | | |
Illumina, Inc. ‡ | | 206,793 | | 6,638 | |
Techne Corp. | | 83,155 | | 5,198 | |
Media - 2.0% | | | | | |
Discovery Communications, Inc. -Series C ‡ | | 104,283 | | 2,505 | |
Groupe Aeroplan, Inc. | | 307,069 | | 2,628 | |
Multiline Retail - 0.8% | | | | | |
Sears Holdings Corp. ‡Λ | | 30,563 | | | 2,074 | |
Oil, Gas & Consumable Fuels - 7.5% | | | | | |
Petrohawk Energy Corp. ‡ | | 81,614 | | 1,920 | |
Range Resources Corp. | | 144,053 | | 7,210 | |
Ultra Petroleum Corp. ‡ | | 209,549 | | 10,173 | |
Personal Products - 0.9% | | | | | |
Mead Johnson Nutrition Co. -Class A | | 57,400 | | 2,413 | |
Pharmaceuticals - 1.5% | | | | | |
Allergan, Inc. | | 54,916 | | 3,089 | |
Ironwood Pharmaceutical ‡Ə | | 54,887 | | 659 | |
Professional Services - 6.1% | | | | | |
Corporate Executive Board Co. | | 88,474 | | 2,124 | |
IHS, Inc. -Class A ‡ | | 69,661 | | 3,606 | |
Monster Worldwide, Inc. ‡ | | 124,940 | | 1,814 | |
Verisk Analytics, Inc. -Class A ‡ | | 286,407 | | 7,856 | |
Semiconductors & Semiconductor Equipment - 0.8% | | | | | |
Rovi Corp. ‡ | | 77,067 | | 2,123 | |
Software - 4.1% | | | | | |
Autodesk, Inc. ‡ | | 142,650 | | 3,556 | |
Salesforce.com, Inc. ‡ | | 124,786 | | 7,082 | |
Wireless Telecommunication Services - 1.8% | | | | | |
Millicom International Cellular SA ‡ | | 35,507 | | 2,225 | |
NII Holdings, Inc. ‡ | | 91,974 | | 2,477 | |
Total Common Stocks (cost $222,552) | | | | 231,617 | |
| | Principal | | | |
REPURCHASE AGREEMENT - 10.6% | | | | | |
State Street Repurchase Agreement 0.01%, dated 10/30/2009, to be repurchased at $27,202 on 11/02/2009. Collateralized by a U.S. Government Agency Obligation, 4.00%, due 12/15/2017, and with a value of $27,746. | | $ | 27,202 | | 27,202 | |
Total Repurchase Agreement (cost $27,202) | | | | | |
| | | | | | |
| | Shares | | | |
SECURITIES LENDING COLLATERAL - 6.3% | | | | | |
State Street Navigator Securities Lending Trust - Prime Portfolio, 0.35% p | | 16,191,125 | | 16,191 | |
Total Securities Lending Collateral (cost $16,191) | | | | | |
| | | | | |
Total Investment Securities (cost $265,945) # | | | | 275,010 | |
Other Assets and Liabilities - Net | | | | (18,798 | ) |
| | | | | |
Net Assets | | | | $ | 256,212 | |
| | | | | | |
The notes to the financial statements are an integral part of this report.
121
(all amounts in thousands)
NOTES TO SCHEDULE OF INVESTMENTS:
Λ | | All or a portion of this security is on loan. The value of all securities on loan is $15,776. |
‡ | | Non-income producing security. |
Ə | | Security fair valued as determined in good faith in accordance with procedures established by the Board of Trustees. This security had a Market Value of $659, or 0.26% of the fund’s net assets. |
p | | Rate shown reflects the yield at 10/31/2009. |
# | | Aggregate cost for federal income tax purposes is $266,444. Aggregate gross unrealized appreciation/depreciation for all securities in which there is an excess of value over tax cost were $26,603 and $18,037, respectively. Net unrealized appreciation for tax purposes is $8,566. |
DEFINITION:
ADR | | American Depositary Receipt |
VALUATION SUMMARY:
Investment Securities | | Level 1 | | Level 2 | | Level 3 | | Total | |
Equities - Consumer Discretionary | | $ | 49,162 | | $ | 9,409 | | $ | — | | $ | 58,571 | |
Equities - Consumer Staples | | 2,413 | | — | | — | | 2,413 | |
Equities - Energy | | 19,303 | | — | | — | | 19,303 | |
Equities - Financials | | 26,179 | | — | | — | | 26,179 | |
Equities - Health Care | | 23,113 | | — | | 659 | | 23,772 | |
Equities - Industrials | | 33,095 | | 2,367 | | — | | 35,462 | |
Equities - Information Technology | | 44,678 | | 5,114 | | — | | 49,792 | |
Equities - Materials | | 11,423 | | — | | — | | 11,423 | |
Equities - Telecommunication Services | | 4,702 | | — | | — | | 4,702 | |
Cash & Cash Equivalent - Repurchase Agreement | | — | | 27,202 | | — | | 27,202 | |
Cash & Cash Equivalent - Securities Lending Collateral | | 16,191 | | — | | — | | 16,191 | |
Total | | $ | 230,259 | | $ | 44,092 | | $ | 659 | | $ | 275,010 | |
Level 3 Rollforward
Securities | | Beginning
Balance at
10/31/2008 | | Net
Purchases/(Sales) | | Accrued
Discounts/(Premiums) | | Total Realized
Gain/(Loss) | | Total Unrealized
Appreciation/(Depreciation) | | Net Transfers
In/(Out) of
Level 3 | | Ending
Balance at
10/31/2009 | |
Equities - Health Care | | $ | 659 | | $ | — | | $ | — | | $ | — | | $ | — | | $ | — | | $ | 659 | |
Total | | $ | 659 | | $ | — | | $ | — | | $ | — | | $ | — | | $ | — | | $ | 659 | |
The notes to the financial statements are an integral part of this report.
122
Transamerica Van Kampen Small Company Growth
SCHEDULE OF INVESTMENTS
At October 31, 2009
(all amounts except share amounts in thousands)
| | Shares | | Value | |
PREFERRED STOCKS - 2.5% | | | | | |
Biotechnology - 0.3% | | | | | |
Pacific Bioscience ‡Ə | | 63,479 | | $ | 444 | |
Internet Software & Services - 0.5% | | | | | |
Twitter, Inc. ‡Ə | | 41,309 | | 660 | |
IT Services - 0.7% | | | | | |
Ning, Inc. ‡Ə | | 108,208 | | 953 | |
Pharmaceuticals - 1.0% | | | | | |
Microbia, Inc., 8.00% pƏ | | 96,357 | | 1,157 | |
Total Preferred Stocks (cost $2,480) | | | | 3,214 | |
| | | | | |
COMMON STOCKS - 92.1% | | | | | |
Biotechnology - 1.0% | | | | | |
Alnylam Pharmaceuticals, Inc. ‡Λ | | 73,592 | | 1,254 | |
Capital Markets - 7.5% | | | | | |
Capital Southwest Corp. | | 4,183 | | 311 | |
GLG Partners, Inc. ‡Λ | | 162,869 | | 427 | |
Greenhill & Co., Inc. Λ | | 71,403 | | 6,157 | |
Riskmetrics Group, Inc. ‡ | | 192,799 | | 2,832 | |
Chemicals - 2.7% | | | | | |
Intrepid Potash, Inc. ‡ | | 60,150 | | 1,549 | |
Rockwood Holdings, Inc. ‡ | | 100,003 | | 1,989 | |
Communications Equipment - 1.5% | | | | | |
Palm, Inc. ‡Λ | | 162,627 | | 1,888 | |
Construction Materials - 4.2% | | | | | |
Eagle Materials, Inc. | | 125,655 | | 3,122 | |
Texas Industries, Inc. Λ | | 68,155 | | 2,269 | |
Distributors - 0.5% | | | | | |
Integrated Distribution Services Group, Ltd. | | 441,000 | | 617 | |
Diversified Consumer Services - 1.2% | | | | | |
New Oriental Education & Technology Group ADR ‡ | | 22,525 | | 1,573 | |
Diversified Financial Services - 3.4% | | | | | |
Climate Exchange PLC ‡ | | 19,735 | | 275 | |
MSCI, Inc. -Class A ‡ | | 105,363 | | 3,203 | |
Pico Holdings, Inc. ‡ | | 28,877 | | 980 | |
Diversified Telecommunication Services - 1.4% | | | | | |
Cogent Communications Group, Inc. ‡Λ | | 182,343 | | 1,847 | |
Electric Utilities - 2.4% | | | | | |
Brookfield Infrastructure Partners, LP | | 216,761 | | 3,143 | |
Health Care Equipment & Supplies - 2.0% | | | | | |
Gen-Probe, Inc. ‡ | | 61,509 | | 2,566 | |
Health Care Technology - 2.8% | | | | | |
Athenahealth, Inc. ‡ | | 98,629 | | 3,709 | |
Hotels, Restaurants & Leisure - 11.0% | | | | | |
Ambassadors Group, Inc. | | 94,226 | | 1,198 | |
BJ’s Restaurants, Inc. ‡ | | 96,164 | | 1,535 | |
Ctrip.com International, Ltd. ADR ‡ | | 67,403 | | 3,609 | |
Gaylord Entertainment Co. ‡Λ | | 36,991 | | 556 | |
Mandarin Oriental International, Ltd. Λ | | 576,288 | | 723 | |
PF Chang’s China Bistro, Inc. ‡Λ | | 114,941 | | 3,355 | |
Vail Resorts, Inc. ‡ | | 94,681 | | 3,261 | |
Household Durables - 4.2% | | | | | |
Brookfield Incorporacoes SA | | 476,991 | | 1,839 | |
Gafisa SA ADR Λ | | 90,748 | | 2,703 | |
iRobot Corp. ‡Λ | | 64,874 | | 867 | |
Insurance - 1.8% | | | | | |
Greenlight Capital Re, Ltd. -Class A ‡ | | 126,060 | | 2,352 | |
Internet & Catalog Retail - 5.3% | | | | | |
Blue Nile, Inc. ‡Λ | | 99,131 | | | 5,953 | |
DeNA Co., Ltd. Λ | | 258 | | 892 | |
Internet Software & Services - 8.1% | | | | | |
comScore, Inc. ‡ | | 49,398 | | 757 | |
GSI Commerce, Inc. ‡ | | 96,648 | | 1,833 | |
Mercadolibre, Inc. ‡ | | 58,156 | | 2,081 | |
Opentable, Inc. ‡Λ | | 75,831 | | 1,870 | |
Rediff.com India, Ltd. ADR ‡Λ | | 74,225 | | 223 | |
SINA Corp. ‡Λ | | 32,565 | | 1,218 | |
VistaPrint NV ‡ | | 53,029 | | 2,708 | |
IT Services - 2.7% | | | | | |
Forrester Research, Inc. ‡ | | 105,705 | | 2,678 | |
Information Services Group, Inc. ‡ | | 219,022 | | 788 | |
Leisure Equipment & Products - 1.1% | | | | | |
Aruze Corp. ‡Λ | | 107,300 | | 1,395 | |
Life Sciences Tools & Services - 4.1% | | | | | |
Techne Corp. | | 86,591 | | 5,413 | |
Media - 1.5% | | | | | |
CKX, Inc. ‡ | | 103,110 | | 660 | |
Interactive Data Corp. | | 45,712 | | 1,202 | |
Lakes Entertainment, Inc. ‡ | | 58,083 | | 143 | |
Oil, Gas & Consumable Fuels - 4.1% | | | | | |
Atlas Energy, Inc. | | 22,202 | | 581 | |
Contango Oil & Gas Co. ‡ | | 69,086 | | 3,292 | |
GMX Resources, Inc. ‡Λ | | 119,150 | | 1,517 | |
Pharmaceuticals - 0.8% | | | | | |
Xenoport, Inc. ‡ | | 59,364 | | 992 | |
Professional Services - 5.3% | | | | | |
Advisory Board Co. ‡ | | 103,052 | | 2,539 | |
Corporate Executive Board Co. | | 38,721 | | 930 | |
Costar Group, Inc. ‡Λ | | 88,508 | | 3,435 | |
Real Estate Management & Development - 0.5% | | | | | |
Consolidated-Tomoka Land Co. | | 12,174 | | 419 | |
Market Leader, Inc. ‡ | | 97,023 | | 194 | |
Semiconductors & Semiconductor Equipment - 2.7% | | �� | | | |
Tessera Technologies, Inc. ‡ | | 156,340 | | 3,457 | |
Software - 3.1% | | | | | |
Blackboard, Inc. ‡ | | 45,422 | | 1,611 | |
Longtop Financial Technologies, Ltd. ADR ‡ | | 70,389 | | 1,865 | |
Netsuite, Inc. ‡Λ | | 38,479 | | 538 | |
Specialty Retail - 1.6% | | | | | |
Citi Trends, Inc. ‡ | | 79,368 | | 2,090 | |
Textiles, Apparel & Luxury Goods - 2.2% | | | | | |
Lululemon Athletica, Inc. ‡Λ | | 115,029 | | 2,890 | |
Transportation Infrastructure - 1.4% | | | | | |
Grupo Aeroportuario del Pacifico SAB de CV ADR | | 71,349 | | 1,818 | |
Total Common Stocks (cost $117,346) | | | | 119,691 | |
| | Principal | | | |
REPURCHASE AGREEMENT - 6.2% | | | | | |
State Street Repurchase Agreement 0.01%, dated 10/30/2009, to be repurchased at $8,065 on 11/02/2009. Collateralized by a U.S. Government Agency Obligation, 4.00%, due 12/15/2017, and with a value of $8,230. | | $ | 8,065 | | 8,065 | |
Total Repurchase Agreement (cost $8,065) | | | | | |
| | | | | | |
The notes to the financial statements are an integral part of this report.
123
| | Shares | | Value | |
SECURITIES LENDING COLLATERAL - 13.4% | | | | | |
State Street Navigator Securities Lending Trust - Prime Portfolio, 0.35% p | | 17,383,133 | | $ | 17,383 | |
Total Securities Lending Collateral (cost $17,383) | | | | | |
| | | | | |
Total Investment Securities (cost $145,274) # | | | | 148,353 | |
Other Assets and Liabilities - Net | | | | (18,464 | ) |
| | | | | |
Net Assets | | | | $ | 129,889 | |
NOTES TO SCHEDULE OF INVESTMENTS:
p | Rate shown reflects the yield at 10/31/2009. |
Ə | Security fair valued as determined in good faith in accordance with procedures established by the Board of Trustees. This security had a Market Value of $3,214, or 2.48% of the fund’s net assets. |
‡ | Non-income producing security. |
Λ | All or a portion of this security is on loan. The value of all securities on loan is $16,924. |
# | Aggregate cost for federal income tax purposes is $150,076. Aggregate gross unrealized appreciation/depreciation for all securities in which there is an excess of value over tax cost were $9,447 and $11,170, respectively. Net unrealized depreciation for tax purposes is $1,723. |
DEFINITION:
ADR | | American Depositary Receipt |
VALUATION SUMMARY:
Investment Securities | | Level 1 | | Level 2 | | Level 3 | | Total | |
Equities - Consumer Discretionary | | $ | 33,433 | | $ | 3,628 | | $ | — | | $ | 37,061 | |
Equities - Energy | | 5,390 | | — | | — | | 5,390 | |
Equities - Financials | | 16,875 | | 275 | | — | | 17,150 | |
Equities - Health Care | | 13,934 | | — | | 1,601 | | 15,535 | |
Equities - Industrials | | 8,723 | | — | | — | | 8,723 | |
Equities - Information Technology | | 25,361 | | — | | 953 | | 26,314 | |
Equities - Materials | | 8,929 | | — | | — | | 8,929 | |
Equities - Telecommunication Services | | — | | — | | 660 | | 660 | |
Equities - Utilities | | 3,143 | | — | | — | | 3,143 | |
Cash & Cash Equivalent - Repurchase Agreement | | — | | 8,065 | | — | | 8,065 | |
Cash & Cash Equivalent - Securities Lending Collateral | | 17,383 | | — | | — | | 17,383 | |
Total | | $ | 133,171 | | $ | 11,968 | | $ | 3,214 | | $ | 148,353 | |
Level 3 Rollforward - Investment Securities
Securities | | Beginning
Balance at
10/31/2008 | | Net
Purchases/(Sales) | | Accrued
Discounts/(Premiums) | | Total Realized
Gain/(Loss) | | Change in Unrealized
Appreciation/(Depreciation) | | Net
Transfers
In/(Out) of
Level 3 | | Ending
Balance at
10/31/2009 | |
Equities - Health Care | | $ | 1,584 | | $ | — | | $ | — | | $ | — | | $ | 17 | | $ | — | | $ | 1,601 | |
Equities - Information Technology | | $ | 774 | | $ | — | | $ | — | | $ | — | | $ | 179 | | $ | — | | $ | 953 | |
Equities - Telecommunication Services | | $ | — | | $ | 660 | | $ | — | | $ | — | | $ | — | | $ | — | | $ | 660 | |
Total | | $ | 2,358 | | $ | 660 | | $ | — | | $ | — | | $ | 196 | | $ | — | | $ | 3,214 | |
The notes to the financial statements are an integral part of this report.
124
Transamerica WMC Emerging Markets
SCHEDULE OF INVESTMENTS
At October 31, 2009
(all amounts except share amounts in thousands)
| | Shares | | Value | |
CONVERTIBLE PREFERRED STOCK - 0.7% | | | | | |
Mexico - 0.7% | | | | | |
Cemex SAB de CV -Class Preference ‡ | | 1,234,012 | | $ | 1,285 | |
Total Convertible Preferred Stock (cost $1,070) | | | | | |
| | | | | |
PREFERRED STOCKS - 2.3% | | | | | |
Brazil - 2.3% | | | | | |
Cia Paranaense de Energia, 0.38% p | | 49,000 | | 853 | |
Usinas Siderurgicas de Minas Gerais SA, 0.97% p | | 86,800 | | 2,266 | |
VIVO Participacoes SA, 1.45% p | | 42,900 | | 1,052 | |
Total Preferred Stocks (cost $3,821) | | | | 4,171 | |
| | | | | |
COMMON STOCKS - 88.9% | | | | | |
Bermuda - 2.7% | | | | | |
Central European Media Enterprises, Ltd. -Class A ‡ | | 53,300 | | 1,340 | |
Cosco Pacific, Ltd. | | 974,000 | | 1,348 | |
Shangri-La Asia, Ltd. | | 1,142,000 | | 2,185 | |
Brazil - 13.4% | | | | | |
Banco Bradesco SA ADR | | 36,700 | | 723 | |
Banco Santander Brasil SA ADR ‡ | | 89,900 | | 1,066 | |
BM&FBOVESPA SA | | 288,700 | | 1,868 | |
Cia Energetica de Minas Gerais ADR | | 81,125 | | 1,281 | |
Cyrela Brazil Realty SA | | 143,400 | | 1,832 | |
Itau Unibanco Holding SA ADR | | 176,330 | | 3,375 | |
Lojas Renner SA | | 93,000 | | 1,637 | |
PDG Realty SA Empreendimentos e Participacoes | | 116,500 | | 985 | |
Petroleo Brasileiro SA ADR | | 115,400 | | 5,334 | |
Tam SA ADR ‡ | | 77,400 | | 1,104 | |
Vale SA -Class B ADR | | 194,200 | | 4,950 | |
Cayman Islands - 0.9% | | | | | |
Netease.com ADR ‡ | | 23,300 | | 900 | |
Simcere Pharmaceutical Group ADR ‡ | | 98,500 | | 778 | |
China - 8.6% | | | | | |
China Construction Bank Corp. | | 2,810,000 | | 2,423 | |
China Life Insurance Co., Ltd. -Class H | | 645,000 | | 2,962 | |
China Petroleum & Chemical Corp. ADR | | 16,100 | | 1,358 | |
China Shenhua Energy Co., Ltd. -Class H | | 539,000 | | 2,414 | |
China Shipping Development Co., Ltd. -Class H | | 1,360,000 | | 1,923 | |
Industrial & Commercial Bank of China -Class H | | 3,129,000 | | 2,489 | |
PetroChina Co., Ltd. ADR | | 14,300 | | 1,717 | |
Egypt - 3.7% | | | | | |
Egyptian Financial Group-Hermes Holding | | 464,375 | | 2,696 | |
Orascom Construction Industries | | 50,102 | | 2,368 | |
Orascom Telecom Holding SAE GDR | | 43,600 | | 1,483 | |
Hong Kong - 3.0% | | | | | |
China Mobile, Ltd. ADR | | 57,600 | | 2,691 | |
Hong Kong Exchanges & Clearing, Ltd. | | 63,600 | | 1,118 | |
Sino-Ocean Land Holdings, Ltd. | | 1,597,500 | | 1,552 | |
Hungary - 0.8% | | | | | |
Richter Gedeon | | 6,768 | | 1,410 | |
India - 8.2% | | | | | |
Canara Bank | | 139,306 | | 1,011 | |
Crompton Greaves, Ltd. | | 113,115 | | 910 | |
Educomp Solutions, Ltd. | | 72,450 | | 1,208 | |
ICICI Bank, Ltd. ADR | | 26,300 | | 827 | |
Indiabulls Real Estate, Ltd. ‡ | | 183,673 | | 943 | |
Infrastructure Development Finance Co., Ltd. | | 358,221 | | 1,106 | |
Lanco Infratech, Ltd. ‡ | | 104,160 | | 1,062 | |
Mahindra & Mahindra, Ltd. GDR ‡ | | 44,915 | | 871 | |
Piramal Healthcare, Ltd. | | 244,428 | | 1,942 | |
Sterlite Industries India, Ltd. ADR | | 49,500 | | 781 | |
Tata Consultancy Services, Ltd. | | 127,762 | | 1,706 | |
Tata Motors, Ltd. ‡ | | 105,570 | | | 1,247 | |
United Spirits, Ltd. GDR | | 86,242 | | 984 | |
Indonesia - 2.0% | | | | | |
Bank Mandiri | | 3,283,500 | | 1,576 | |
Indo Tambangraya Megah PT | | 401,000 | | 935 | |
Indosat Tbk PT | | 2,154,500 | | 1,144 | |
Israel - 1.9% | | | | | |
Bezeq Israeli Telecommunication Corp., Ltd. | | 513,512 | | 1,146 | |
Teva Pharmaceutical Industries, Ltd. ADR | | 44,300 | | 2,236 | |
Korea, Republic of - 8.2% | | | | | |
Dong-A Pharmaceutical Co., Ltd. | | 11,546 | | 1,123 | |
Doosan Infracore Co., Ltd. | | 96,620 | | 1,375 | |
Hanmi Pharm Co., Ltd. | | 11,341 | | 1,097 | |
KB Financial Group, Inc. ‡ | | 27,945 | | 1,344 | |
Korean Air Lines Co., Ltd. ‡ | | 42,030 | | 1,599 | |
KT Corp. | | 30,460 | | 993 | |
LG Electronics, Inc. | | 22,415 | | 2,084 | |
POSCO ADR | | 19,970 | | 2,039 | |
Samsung Card Co. | | 22,120 | | 876 | |
Shinhan Financial Group Co., Ltd. ‡ | | 55,700 | | 2,114 | |
Malaysia - 1.1% | | | | | |
Genting BHD | | 910,000 | | 1,913 | |
Mexico - 3.5% | | | | | |
America Movil SAB de CV -Series L ADR | | 70,990 | | 3,133 | |
Cemex SAB de CV ADR ‡ | | 30,600 | | 318 | |
Desarrolladora Homex SAB de CV ADR ‡ | | 23,800 | | 846 | |
Grupo Aeroportuario del Sureste SAB de CV ADR | | 19,300 | | 785 | |
Wal-Mart de Mexico SAB de CV -Series V | | 324,900 | | 1,156 | |
Netherlands - 0.7% | | | | | |
X5 Retail Group NV GDR ‡ | | 51,432 | | 1,228 | |
Papua New Guinea - 0.2% | | | | | |
New Britain Palm Oil, Ltd. | | 52,073 | | 311 | |
Peru - 0.9% | | | | | |
Cia de Minas Buenaventura SA ADR | | 50,490 | | 1,695 | |
Poland - 1.0% | | | | | |
Bank Pekao SA ‡ | | 31,671 | | 1,700 | |
Russian Federation - 6.3% | | | | | |
Gazprom OAO ADR | | 204,345 | | 4,900 | |
Mechel OAO ADR | | 139,200 | | 2,389 | |
Rosneft Oil Co. GDR ‡ | | 321,834 | | 2,462 | |
Uralkali GDR ‡ | | 64,508 | | 1,452 | |
South Africa - 8.9% | | | | | |
Adcock Ingram Holdings, Ltd. | | 140,908 | | 959 | |
Anglo Platinum, Ltd. ‡ | | 9,012 | | 779 | |
AngloGold Ashanti, Ltd. ADR | | 19,800 | | 743 | |
Aspen Pharmacare Holdings, Ltd. ‡ | | 131,023 | | 1,104 | |
Barloworld, Ltd. | | 327,525 | | 2,042 | |
Harmony Gold Mining Co., Ltd. ADR | | 122,100 | | 1,216 | |
Impala Platinum Holdings, Ltd. | | 74,740 | | 1,645 | |
Imperial Holdings, Ltd. | | 156,346 | | 1,610 | |
MTN Group, Ltd. | | 100,161 | | 1,491 | |
Nasionale Pers Beperk -Class N | | 56,496 | | 2,039 | |
Sasol, Ltd. | | 60,471 | | 2,266 | |
Taiwan - 8.6% | | | | | |
Acer, Inc. | | 591,000 | | 1,393 | |
Advanced Semiconductor Engineering, Inc. ADR | | 1,805,400 | | 1,495 | |
Chinatrust Financial Holding Co., Ltd. | | 1,892,273 | | 1,137 | |
Delta Electronics, Inc. | | 476,000 | | 1,322 | |
Hon Hai Precision Industry Co., Ltd. | | 915,963 | | 3,607 | |
Mediatek, Inc. | | 56,170 | | 786 | |
Taiwan Semiconductor Manufacturing Co., Ltd. | | 2,289,354 | | 4,153 | |
Yuanta Financial Holding Co., Ltd. | | 2,196,000 | | 1,449 | |
Thailand - 1.7% | | | | | |
Kasikornbank PCL ‡ | | 906,000 | | 2,196 | |
PTT Chemical PCL | | 453,000 | | 773 | |
The notes to the financial statements are an integral part of this report.
125
| | Shares | | Value | |
Turkey - 1.5% | | | | | |
Ford Otomotiv Sanayi AS | | 235,069 | | $ | 1,478 | |
Hurriyet Gazetecilik AS ‡ | | 1,083,049 | | 1,155 | |
United Kingdom - 1.1% | | | | | |
Hikma Pharmaceuticals PLC | | 149,248 | | 1,153 | |
Vedanta Resources PLC | | 22,493 | | 770 | |
Total Common Stocks (cost $134,439) | | | | 158,638 | |
| | | | | |
INVESTMENT COMPANY - 4.7% | | | | | |
United States - 4.7% | | | | | |
iShares MSCI Emerging Markets Index Fund | | 225,400 | | 8,466 | |
Total Investment Company (cost $8,719) | | | | | |
| | | | | |
WARRANTS - 0.4% | | | | | |
India - 0.4% | | | | | |
Lanco Infratech, Ltd. ‡ | | | | | |
Expiration: 01/25/2013 | | | | | |
Exercise Price: $0.00 | | 57,528 | | 602 | |
Piramal Life Sciences, Ltd.-144A ‡ | | | | | |
Expiration: 10/24/2012 | | | | | |
Exercise Price: $0.00 | | 39,375 | | 67 | |
Mauritius - 0.0% | | | | | |
Golden Agri-Resources, Ltd. ‡ | | | | | |
Expiration: 07/23/2012 | | | | | |
Exercise Price: $0.54 | | 123,202 | | 10 | |
Total Warrants (cost $573) | | | | 679 | |
| | | | | | |
| | Principal | | | |
REPURCHASE AGREEMENT - 2.8% | | | | | |
State Street Repurchase Agreement 0.01%, dated 10/30/2009, to be repurchased at $4,944 on 11/02/2009. Collateralized by a U.S. Government Agency Obligation, 4.00%, due 12/15/2017, and with a value of $5,047. | | $ | 4,944 | | 4,944 | |
Total Repurchase Agreement (cost $4,944) | | | | | |
| | | | | |
Total Investment Securities (cost $153,566) # | | | | 178,183 | |
Other Assets and Liabilities - Net | | | | 409 | |
| | | | | |
Net Assets | | | | $ | 178,592 | |
| | | | | | | |
FORWARD FOREIGN CURRENCY CONTRACTS:
Currency | | Bought (Sold) | | Settlement
Date | | Amount in U.S.
Dollars Bought
(Sold) | | Net Unrealized
Appreciation
(Depreciation) | |
Hungarian Forint | | (9,339 | ) | 02/04/2010 | | (41 | ) | (8 | ) |
Hungarian Forint | | (99,942 | ) | 02/04/2010 | | (398 | ) | (130 | ) |
Hungarian Forint | | (18,169 | ) | 02/04/2010 | | (90 | ) | (6 | ) |
Israeli Shekel | | (5,706 | ) | 01/28/2010 | | (1,407 | ) | (114 | ) |
Israeli Shekel | | 6,216 | | 01/28/2010 | | 1,602 | | 56 | |
Israeli Shekel | | (510 | ) | 01/28/2010 | | (122 | ) | (14 | ) |
Mexican Peso | | (8,107 | ) | 02/26/2010 | | (495 | ) | (110 | ) |
Mexican Peso | | (692 | ) | 02/26/2010 | | (48 | ) | (4 | ) |
Mexican Peso | | (1,763 | ) | 02/26/2010 | | (130 | ) | (2 | ) |
Mexican Peso | | 10,562 | | 02/26/2010 | | 804 | | (16 | ) |
| | | | | | | | $ | (348 | ) |
| | | | | | | | | | |
The notes to the financial statements are an integral part of this report.
126
(all amounts in thousands)
INVESTMENTS BY INDUSTRY (unaudited): | | Percentage of
Total Investments | | Value | |
Commercial Banks | | 12.3 | % | $ | 21,981 | |
Oil, Gas & Consumable Fuels | | 12.0 | | 21,386 | |
Metals & Mining | | 10.8 | | 19,273 | |
Capital Markets | | 7.2 | | 12,611 | |
Pharmaceuticals | | 6.7 | | 11,802 | |
Wireless Telecommunication Services | | 6.1 | | 10,994 | |
Semiconductors & Semiconductor Equipment | | 3.5 | | 6,434 | |
Household Durables | | 3.3 | | 5,747 | |
Electronic Equipment & Instruments | | 2.8 | | 4,929 | |
Media | | 2.5 | | 4,534 | |
Hotels, Restaurants & Leisure | | 2.3 | | 4,098 | |
Diversified Financial Services | | 2.2 | | 4,092 | |
Construction & Engineering | | 2.2 | | 4,032 | |
Insurance | | 1.7 | | 2,962 | |
Airlines | | 1.5 | | 2,703 | |
Machinery | | 1.5 | | 2,622 | |
Real Estate Management & Development | | 1.4 | | 2,495 | |
Food & Staples Retailing | | 1.4 | | 2,384 | |
Automobiles | | 1.3 | | 2,349 | |
Chemicals | | 1.2 | | 2,225 | |
Diversified Telecommunication Services | | 1.2 | | 2,139 | |
Electric Utilities | | 1.2 | | 2,134 | |
Transportation Infrastructure | | 1.2 | | 2,133 | |
Industrial Conglomerates | | 1.1 | | 2,042 | |
Marine | | 1.1 | | 1,923 | |
IT Services | | 1.0 | | 1,706 | |
Multiline Retail | | 0.9 | | 1,637 | |
Distributors | | 0.9 | | 1,610 | |
Construction Materials | | 0.9 | | 1,603 | |
Computers & Peripherals | | 0.8 | | 1,393 | |
Diversified Consumer Services | | 0.7 | | 1,208 | |
Beverages | | 0.6 | | 984 | |
Electrical Equipment | | 0.5 | | 910 | |
Internet Software & Services | | 0.5 | | 900 | |
Consumer Finance | | 0.5 | | 876 | |
Food Products | | 0.2 | | 321 | |
Biotechnology | | 0.0 | | 67 | |
Investment Securities, at Value | | 97.2 | | 173,239 | |
Short-Term Investments | | 2.8 | | 4,944 | |
Total Investments | | 100.0 | % | $ | 178,183 | |
NOTES TO SCHEDULE OF INVESTMENTS:
‡ | Non-income producing security. |
p | Rate shown reflects yield at 10/31/2009. |
# | Aggregate cost for federal income tax purposes is $153,887. Aggregate gross unrealized appreciation/depreciation for all securities in which there is an excess of value over tax cost were $27,072 and $2,776, respectively. Net unrealized appreciation for tax purposes is $24,296. |
DEFINITIONS:
144A | | 144A Securities are registered pursuant to Rule 144A of the Securities Act of 1933. These securities are deemed to be liquid for purposes of compliance limitations on holdings of illiquid securities and may be resold as transactions exempt from registration, normally to qualified institutional buyers. At 10/31/2009, these securities aggregated $67, or 0.04%, of the fund’s net assets. |
ADR | | American Depositary Receipt |
GDR | | Global Depositary Receipt |
The notes to the financial statements are an integral part of this report.
127
VALUATION SUMMARY:
Investment Securities | | Level 1 | | Level 2 | | Level 3 | | Total | |
Equities - Consumer Discretionary | | $ | 8,720 | | $ | 12,463 | | $ | — | | $ | 21,183 | |
Equities - Consumer Staples | | 1,156 | | 1,550 | | — | | 2,706 | |
Equities - Energy | | 10,871 | | 10,516 | | — | | 21,387 | |
Equities - Financials | | 10,920 | | 25,631 | | — | | 36,551 | |
Equities - Health Care | | 4,956 | | 6,912 | | — | | 11,868 | |
Equities - Industrials | | 5,108 | | 12,240 | | — | | 17,348 | |
Equities - Information Technology | | 2,697 | | 12,666 | | — | | 15,363 | |
Equities - Materials | | 18,454 | | 4,645 | | — | | 23,099 | |
Equities - Telecommunication Services | | 6,876 | | 6,258 | | — | | 13,134 | |
Equities - Utilities | | 2,134 | | — | | — | | 2,134 | |
Investment Company - Financials | | 8,466 | | — | | — | | 8,466 | |
Cash & Cash Equivalent - Repurchase Agreement | | — | | 4,944 | | — | | 4,944 | |
Total | | $ | 80,358 | | $ | 97,825 | | $ | — | | $ | 178,183 | |
Other Financial Instruments* | | Level 1 | | Level 2 | | Level 3 | | Total | |
Forward Foreign Currency Contracts | | $ | — | | $ | (348 | ) | $ | — | | $ | (348 | ) |
Total | | $ | — | | $ | (348 | ) | $ | — | | $ | (348 | ) |
* Other financial instruments are derivative instruments. Future Contracts, Forward Foreign Currency Contracts and Swap Contracts are valued at unrealized appreciation (depreciation) on the instrument.
The notes to the financial statements are an integral part of this report.
128
STATEMENTS OF ASSETS AND LIABILITIES
At October 31, 2009
(all amounts except share amounts in thousands)
| | Transamerica
AllianceBernstein
International
Value | | Transamerica
BlackRock
Global
Allocation | | Transamerica
BlackRock
Large Cap
Value | | Transamerica
BlackRock
Natural
Resources | | Transamerica
BNY Mellon
Market Neutral
Strategy | | Transamerica
Federated
Market
Opportunity | |
Assets: | | | | | | | | | | | | | |
Investment securities, at value | | $ | 320,073 | | $ | 456,792 | | $ | 632,956 | | $ | 113,253 | | $ | 77,752 | | $ | 52,107 | |
Repurchase agreement, at value | | 4,801 | | — | | — | | 16,759 | | 22,298 | | 33,118 | |
Cash on deposit with broker | | — | | — | | — | | — | | 63,555 | | — | |
Cash on deposit with custodian | | — | | 17 | | — | | — | | — | | — | |
Foreign currency, at value | | 1,591 | | 812 | | — | | 186 | | — | | 105 | |
Receivables: | | | | | | | | | | | | | |
Investment securities sold | | 3,744 | | 9,257 | | — | | — | | 3,019 | | 1,476 | |
Shares of beneficial interest sold | | 155 | | 24 | | 126 | | 278 | | 73 | | 83 | |
Interest | | — | (a) | 1,374 | | — | (a) | — | (a) | — | (a) | 168 | |
Securities lending income (net) | | 3 | | 2 | | — | (a) | 2 | | — | | — | (a) |
Dividends | | 539 | | 549 | | 1,066 | | 87 | | 23 | | 112 | |
Dividend reclaims | | 440 | | 115 | | — | | 32 | | — | | 9 | |
Swap agreements, at value | | — | | 231 | | — | | — | | — | | — | |
Unrealized appreciation on forward foreign currency contracts | | — | | 123 | | — | | — | | — | | 384 | |
| | $ | 331,346 | | $ | 469,296 | | $ | 634,148 | | $ | 130,597 | | $ | 166,720 | | $ | 87,562 | |
Liabilities: | | | | | | | | | | | | | |
Due to custodian | | — | | 361 | | — | | — | | — | | — | |
Accounts payable and accrued liabilities: | | | | | | | | | | | | | |
Investment securities purchased | | 1,010 | | 5,863 | | — | | 4,713 | | 2,492 | | 163 | |
Shares of beneficial interest redeemed | | 22 | | 105 | | — | | 3 | | 6 | | 8 | |
Management and advisory fees | | 236 | | 288 | | 436 | | 85 | | 101 | | 56 | |
Administration fees | | 6 | | 8 | | 11 | | 2 | | 1 | | 1 | |
Dividends from short sales | | — | | — | | — | | — | | 56 | | — | |
Variation margin | | — | | 160 | | — | | — | | — | | — | |
Capital gains tax | | — | | 55 | | — | | — | | — | | — | |
Other | | 37 | | 60 | | 26 | | 18 | | 23 | | 21 | |
Collateral for securities on loan | | 13,967 | | 11,984 | | — | | 4,434 | | — | | 1,073 | |
Written options, at value | | — | | 1,151 | | — | | — | | — | | — | |
Securities sold short, at value | | — | | — | | — | | — | | 77,359 | | — | |
Unrealized depreciation on forward foreign currency contracts | | — | | 282 | | — | | — | | — | | 678 | |
| | 15,278 | | 20,317 | | 473 | | 9,255 | | 80,038 | | 2,000 | |
Net assets | | $ | 316,068 | | $ | 448,979 | | $ | 633,675 | | $ | 121,342 | | $ | 86,682 | | $ | 85,562 | |
| | | | | | | | | | | | | |
Net assets consist of: | | | | | | | | | | | | | |
Shares of beneficial interest, unlimited shares authorized, no par value | | $ | 484,339 | | $ | 459,043 | | $ | 790,683 | | $ | 122,731 | | $ | 97,740 | | $ | 93,021 | |
Undistributed (accumulated) net investment income (loss) | | 5,809 | | 5,644 | | 6,661 | | 433 | | — | | — | |
Accumulated net realized gain (loss) from investments | | (144,405 | ) | (22,928 | ) | (176,385 | ) | (3,504 | ) | (14,623 | ) | (11,773 | ) |
Net unrealized appreciation (depreciation) on: | | | | | | | | | | | | | |
Investment securities | | (29,722 | ) | 7,835 | | 12,716 | | 1,678 | | 8,169 | | 4,604 | |
Futures contracts | | — | | (163 | ) | — | | — | | — | | — | |
Written option contracts | | — | | (538 | ) | — | | — | | — | | — | |
Swap agreements | | — | | 231 | | — | | — | | — | | — | |
Translation of assets and liabilities denominated in foreign currencies | | 47 | | (145 | ) | — | | 4 | | — | | (290 | ) |
Securities sold short | | — | | — | | — | | — | | (4,604 | ) | — | |
Net assets | | $ | 316,068 | | $ | 448,979 | | $ | 633,675 | | $ | 121,342 | | $ | 86,682 | | $ | 85,562 | |
| | | | | | | | | | | | | |
Shares outstanding | | 40,548 | | 44,938 | | 81,138 | | 12,094 | | 10,279 | | 9,517 | |
| | | | | | | | | | | | | |
Net asset value and offering price per share | | $ | 7.79 | | $ | 9.99 | | $ | 7.81 | | $ | 10.03 | | $ | 8.43 | | $ | 8.99 | |
| | | | | | | | | | | | | |
Investment securities, at cost | | $ | 349,795 | | $ | 448,957 | | $ | 620,240 | | $ | 111,575 | | $ | 69,583 | | $ | 47,503 | |
Repurchase agreement, at cost | | $ | 4,801 | | $ | — | | $ | — | | $ | 16,759 | | $ | 22,298 | | $ | 33,118 | |
Foreign currency, at cost | | $ | 1,559 | | $ | 806 | | $ | — | | $ | 192 | | $ | — | | $ | 105 | |
Securities loaned, at value | | $ | 13,262 | | $ | 11,627 | | $ | — | | $ | 4,309 | | $ | — | | $ | 1,035 | |
Premium received on written option & swaption contracts | | $ | — | | $ | 613 | | $ | — | | $ | — | | $ | — | | $ | — | |
Proceeds received from securities sold short | | $ | — | | $ | — | | $ | — | | $ | — | | $ | 72,755 | | $ | — | |
The notes to the financial statements are an integral part of this report.
129
| | Transamerica
JPMorgan Core
Bond | | Transamerica
JPMorgan
International
Bond | | Transamerica
JPMorgan Mid
Cap Value | | Transamerica
Loomis Sayles
Bond | | Transamerica
Neuberger
Berman
International | | Transamerica
Oppenheimer
Developing
Markets | |
Assets: | | | | | | | | | | | | | |
Investment securities, at value | | $ | 204,714 | | $ | 706,280 | | $ | 168,816 | | $ | 774,710 | | $ | 480,873 | | $ | 488,480 | |
Repurchase agreement, at value | | 10,096 | | 10,749 | | 1,376 | | 18,367 | | 12,257 | | 4,175 | |
Cash | | — | | — | | — | | — | | — | | 43 | |
Foreign currency, at value | | — | | 3,353 | | — | | — | | 151 | | 5,069 | |
Receivables: | | | | | | | | | | | | | |
Investment securities sold | | 682 | | 6,707 | | 762 | | 6,837 | | 1 | | 4,120 | |
Shares of beneficial interest sold | | 72 | | 130 | | — | | 50 | | 97 | | 171 | |
Interest | | 1,561 | | 9,951 | | — | (a) | 13,282 | | — | (a) | — | (a) |
Securities lending income (net) | | — | | — | | 5 | | 2 | | 8 | | — | (a) |
Dividends | | — | | — | | 102 | | 28 | | 515 | | 702 | |
Dividend reclaims | | — | | 3 | | — | | — | | 791 | | 14 | |
Variation margin | | — | | 221 | | — | | — | | — | | — | |
Other | | — | | — | | — | | — | | 1 | | — | |
Unrealized appreciation on forward foreign currency contracts | | — | | 1,338 | | — | | — | | — | | — | |
| | $ | 217,125 | | $ | 738,732 | | $ | 171,061 | | $ | 813,276 | | $ | 494,694 | | $ | 502,774 | |
Liabilities: | | | | | | | | | | | | | |
Accounts payable and accrued liabilities: | | | | | | | | | | | | | |
Investment securities purchased | | 1,132 | | 3,238 | | 938 | | 140 | | 213 | | 5,857 | |
Shares of beneficial interest redeemed | | 61 | | 204 | | — | | 220 | | 61 | | 107 | |
Management and advisory fees | | 81 | | 320 | | 123 | | 436 | | 408 | | 490 | |
Administration fees | | 4 | | 13 | | 3 | | 14 | | 9 | | 9 | |
Capital gains tax | | — | | — | | — | | — | | 14 | | 297 | |
Other | | 31 | | 55 | | 20 | | 42 | | 48 | | 79 | |
Collateral for securities on loan | | — | | — | | 4,139 | | 172 | | 8,138 | | 299 | |
Unrealized depreciation on forward foreign currency contracts | | — | | 1,938 | | — | | — | | — | | — | |
| | 1,309 | | 5,768 | | 5,223 | | 1,024 | | 8,891 | | 7,138 | |
Net assets | | $ | 215,816 | | $ | 732,964 | | $ | 165,838 | | $ | 812,252 | | $ | 485,803 | | $ | 495,636 | |
| | | | | | | | | | | | | |
Net assets consist of: | | | | | | | | | | | | | |
Shares of beneficial interest, unlimited shares authorized, no par value | | $ | 214,088 | | $ | 650,557 | | $ | 199,318 | | $ | 811,479 | | $ | 671,997 | | $ | 514,184 | |
Undistributed (accumulated) net investment income (loss) | | 499 | | 10,160 | | 2,369 | | 5,777 | | 4,121 | | 2,441 | |
Undistributed (accumulated) net realized gain (loss) from investments | | (206 | ) | 5,404 | | (28,276 | ) | (16,886 | ) | (219,060 | ) | (87,950 | ) |
Net unrealized appreciation (depreciation) on: | | | | | | | | | | | | | |
Investment securities | | 1,435 | | 67,061 | | (7,573 | ) | 11,809 | | 28,733 | | 67,503 | |
Futures contracts | | — | | (159 | ) | — | | — | | — | | — | |
Translation of assets and liabilities denominated in foreign currencies | | — | | (59 | ) | — | | 73 | | 12 | | (542 | ) |
Net assets | | $ | 215,816 | | $ | 732,964 | | $ | 165,838 | | $ | 812,252 | | $ | 485,803 | | $ | 495,636 | |
| | | | | | | | | | | | | |
Shares outstanding | | 21,414 | | 62,978 | | 20,021 | | 81,757 | | 64,202 | | 48,977 | |
| | | | | | | | | | | | | |
Net asset value and offering price per share | | $ | 10.08 | | $ | 11.64 | | $ | 8.28 | | $ | 9.93 | | $ | 7.57 | | $ | 10.12 | |
| | | | | | | | | | | | | |
Investment securities, at cost | | $ | 203,279 | | $ | 639,219 | | $ | 176,389 | | $ | 762,901 | | $ | 452,140 | | $ | 420,977 | |
Repurchase agreement, at cost | | $ | 10,096 | | $ | 10,749 | | $ | 1,376 | | $ | 18,367 | | $ | 12,257 | | $ | 4,175 | |
Foreign currency, at cost | | $ | — | | $ | 3,397 | | $ | — | | $ | — | | $ | 152 | | $ | 5,149 | |
Securities loaned, at value | | $ | — | | $ | — | | $ | 4,035 | | $ | 155 | | $ | 7,790 | | $ | 280 | |
The notes to the financial statements are an integral part of this report.
130
| | Transamerica
Oppenheimer
Small- & Mid-
Cap Value | | Transamerica
Schroders
International
Small Cap | | Transamerica
Third Avenue
Value | | Transamerica
Thornburg
International
Value | | Transamerica
UBS Dynamic
Alpha | | Transamerica
UBS Large Cap
Value | |
Assets: | | | | | | | | | | | | | |
Investment securities, at value | | $ | 265,440 | | $ | 529,806 | | $ | 415,204 | | $ | 575,462 | | $ | 48 | | $ | 993,610 | |
Repurchase agreement, at value | | 9,315 | | 20,715 | | 24,577 | | 15,590 | | 106,130 | | 11,652 | |
Foreign currency, at value | | — | | 632 | | — | | — | | 30 | | — | |
Receivables: | | | | | | | | | | | | | |
Investment securities sold | | 1,638 | | 565 | | 759 | | 1,029 | | 585 | | — | |
Shares of beneficial interest sold | | — | | 335 | | — | | 424 | | 36 | | 282 | |
Interest | | — | (a) | — | (a) | — | (a) | — | (a) | — | (a) | — | (a) |
Securities lending income (net) | | 1 | | 2 | | 5 | | — | | — | (a) | 2 | |
Dividends | | 71 | | 607 | | 629 | | 562 | | 61 | | 1,175 | |
Dividend reclaims | | 21 | | 256 | | 14 | | 190 | | 134 | | — | |
Other | | — | | 316 | | 57 | | — | | 1 | | — | |
Unrealized appreciation on forward foreign currency contracts | | — | | — | | — | | 76 | | 248 | | — | |
| | $ | 276,486 | | $ | 553,234 | | $ | 441,245 | | $ | 593,333 | | $ | 107,273 | | $ | 1,006,721 | |
Liabilities: | | | | | | | | | | | | | |
Accounts payable and accrued liabilities: | | | | | | | | | | | | | |
Investment securities purchased | | 6,887 | | 374 | | — | | 718 | | 28 | | 1,046 | |
Shares of beneficial interest redeemed | | 68 | | 59 | | 73 | | 49 | | 2 | | 63 | |
Management and advisory fees | | 222 | | 516 | | 303 | | 554 | | 126 | | 664 | |
Administration fees | | 5 | | 10 | | 7 | | 10 | | 2 | | 18 | |
Other | | 23 | | 55 | | 34 | | 61 | | 33 | | 30 | |
Collateral for securities on loan | | — | | 8,547 | | 17,278 | | — | | — | | 2,272 | |
Unrealized depreciation on forward foreign currency contracts | | — | | — | | — | | 402 | | 65 | | — | |
| | 7,205 | | 9,561 | | 17,695 | | 1,794 | | 256 | | 4,093 | |
Net assets | | $ | 269,281 | | $ | 543,673 | | $ | 423,550 | | $ | 591,539 | | $ | 107,017 | | $ | 1,002,628 | |
| | | | | | | | | | | | | |
Net assets consist of: | | | | | | | | | | | | | |
Shares of beneficial interest, unlimited shares authorized, no par value | | $ | 299,905 | | $ | 537,504 | | $ | 623,749 | | $ | 543,275 | | $ | 176,405 | | $ | 1,313,953 | |
Undistributed (accumulated) net investment income (loss) | | 789 | | 2,970 | | 3,221 | | 2,364 | | — | | 9,473 | |
Accumulated net realized gain (loss) from investments | | (71,537 | ) | (21,586 | ) | (106,907 | ) | (56 | ) | (69,317 | ) | (246,859 | ) |
Net unrealized appreciation (depreciation) on: | | | | | | | | | | | | | |
Investment securities | | 40,124 | | 24,750 | | (96,514 | ) | 46,270 | | (264 | ) | (73,939 | ) |
Translation of assets and liabilities denominated in foreign currencies | | — | | 35 | | 1 | | (314 | ) | 193 | | — | |
Net assets | | $ | 269,281 | | $ | 543,673 | | $ | 423,550 | | $ | 591,539 | | $ | 107,017 | | $ | 1,002,628 | |
| | | | | | | | | | | | | |
Shares outstanding | | 34,873 | | 66,152 | | 22,969 | | 61,038 | | 17,602 | | 118,828 | |
| | | | | | | | | | | | | |
Net asset value and offering price per share | | $ | 7.72 | | $ | 8.22 | | $ | 18.44 | | $ | 9.69 | | $ | 6.08 | | $ | 8.44 | |
| | | | | | | | | | | | | |
Investment securities, at cost | | $ | 225,316 | | $ | 505,056 | | $ | 511,718 | | $ | 529,192 | | $ | 312 | | $ | 1,067,549 | |
Repurchase agreement, at cost | | $ | 9,315 | | $ | 20,715 | | $ | 24,577 | | $ | 15,590 | | $ | 106,130 | | $ | 11,652 | |
Foreign currency, at cost | | $ | — | | $ | 619 | | $ | — | | $ | — | | $ | 30 | | $ | — | |
Securities loaned, at value | | $ | — | | $ | 8,007 | | $ | 16,733 | | $ | — | | $ | — | | $ | 2,223 | |
The notes to the financial statements are an integral part of this report.
131
| | Transamerica
Van Kampen
Emerging
Markets Debt | | Transamerica
Van Kampen
Mid-Cap Growth | | Transamerica
Van Kampen
Small Company
Growth | | Transamerica
WMC Emerging
Markets | | | | | |
Assets: | | | | | | | | | | | | | |
Investment securities, at value | | $ | 330,888 | | $ | 247,808 | | $ | 140,288 | | $ | 173,239 | | | | | |
Repurchase agreement, at value | | 2,139 | | 27,202 | | 8,065 | | 4,944 | | | | | |
Foreign currency, at value | | 1,487 | | — | | — | | 70 | | | | | |
Receivables: | | | | | | | | | | | | | |
Investment securities sold | | 45,110 | | 1,748 | | 344 | | 1,598 | | | | | |
Shares of beneficial interest sold | | — | | 570 | | 338 | | 401 | | | | | |
Interest | | 5,218 | | — | (a) | — | (a) | — | (a) | | | | |
Securities lending income (net) | | — | (a) | 37 | | 21 | | — | | | | | |
Dividends | | — | | 16 | | 55 | | 194 | | | | | |
Dividend reclaims | | — | | — | | — | | 2 | | | | | |
Unrealized appreciation on forward foreign currency contracts | | — | | — | | — | | 56 | | | | | |
| | $ | 384,842 | | $ | 277,381 | | $ | 149,111 | | $ | 180,504 | | | | | |
Liabilities: | | | | | | | | | | | | | |
Due to custodian | | — | | — | | — | | 48 | | | | | |
Accounts payable and accrued liabilities: | | | | | | | | | | | | | |
Investment securities purchased | | 1,708 | | 4,740 | | 1,688 | | 919 | | | | | |
Shares of beneficial interest redeemed | | 99 | | 25 | | 18 | | 17 | | | | | |
Management and advisory fees | | 302 | | 181 | | 110 | | 145 | | | | | |
Administration fees | | 7 | | 5 | | 2 | | 3 | | | | | |
Capital gains tax | | — | | — | | — | | 328 | | | | | |
Other | | 34 | | 27 | | 21 | | 48 | | | | | |
Collateral for securities on loan | | 74 | | 16,191 | | 17,383 | | — | | | | | |
Unrealized depreciation on forward foreign currency contracts | | — | | — | | — | | 404 | | | | | |
| | 2,224 | | 21,169 | | 19,222 | | 1,912 | | | | | |
Net assets | | $ | 382,618 | | $ | 256,212 | | $ | 129,889 | | $ | 178,592 | | | | | |
| | | | | | | | | | | | | |
Net assets consist of: | | | | | | | | | | | | | |
Shares of beneficial interest, unlimited shares authorized, no par value | | $ | 388,320 | | $ | 253,163 | | $ | 143,672 | | $ | 151,334 | | | | | |
Undistributed (accumulated) net investment income (loss) | | 990 | | 1 | | (25 | ) | 308 | | | | | |
Undistributed (accumulated) net realized gain (loss) from investments | | (25,905 | ) | (6,017 | ) | (16,837 | ) | 3,011 | | | | | |
Net unrealized appreciation (depreciation) on: | | | | | | | | | | | | | |
Investment securities | | 19,291 | | 9,065 | | 3,079 | | 24,617 | | | | | |
Translation of assets and liabilities denominated in foreign currencies | | (78 | ) | — | | — | | (678 | ) | | | | |
Net assets | | $ | 382,618 | | $ | 256,212 | | $ | 129,889 | | $ | 178,592 | | | | | |
| | | | | | | | | | | | | |
Shares outstanding | | 37,396 | | 26,758 | | 14,725 | | 14,810 | | | | | |
| | | | | | | | | | | | | |
Net asset value and offering price per share | | $ | 10.23 | | $ | 9.58 | | $ | 8.82 | | $ | 12.06 | | | | | |
| | | | | | | | | | | | | |
Investment securities, at cost | | $ | 311,596 | | $ | 238,743 | | $ | 137,209 | | $ | 148,622 | | | | | |
Repurchase agreement, at cost | | $ | 2,139 | | $ | 27,202 | | $ | 8,065 | | $ | 4,944 | | | | | |
Foreign currency, at cost | | $ | 1,563 | | $ | — | | $ | — | | $ | 70 | | | | | |
Securities loaned, at value | | $ | 72 | | $ | 15,776 | | $ | 16,924 | | $ | — | | | | | |
(a) Rounds to less than $1.
The notes to the financial statements are an integral part of this report.
132
STATEMENTS OF OPERATIONS
For the year ended October 31, 2009
(all amounts in thousands)
| | Transamerica
AllianceBernstein
International
Value | | Transamerica
BlackRock
Global Allocation | | Transamerica
BlackRock Large
Cap Value | | Transamerica
BlackRock
Natural
Resources | | Transamerica
BNY Mellon
Market Neutral
Strategy | | Transamerica
Federated
Market
Opportunity | |
Investment income: | | | | | | | | | | | | | |
Dividend income | | $ | 9,039 | | $ | 6,005 | | $ | 12,232 | | $ | 1,381 | | $ | 1,618 | | $ | 826 | |
Withholding taxes on foreign dividends | | (892 | ) | (209 | ) | — | | (65 | ) | — | | (52 | ) |
Interest income | | 2 | | 5,955 | | 1 | | 1 | | 2 | | 359 | |
Securities lending income (net) | | 195 | | 279 | | 55 | | 51 | | 1 | | 41 | |
| | 8,344 | | 12,030 | | 12,288 | | 1,368 | | 1,621 | | 1,174 | |
| | | | | | | | | | | | | |
Expenses: | | | | | | | | | | | | | |
Management and advisory | | 2,148 | | 2,984 | | 3,579 | | 721 | | 1,304 | | 635 | |
Transfer agent | | — | (a) | — | (a) | — | (a) | — | (a) | — | (a) | — | (a) |
Printing and shareholder reports | | 10 | | 6 | | 7 | | 1 | | 1 | | 3 | |
Custody | | 163 | | 460 | | 52 | | 20 | | 59 | | 35 | |
Administration | | 50 | | 81 | | 91 | | 18 | | 19 | | 16 | |
Legal | | 8 | | 13 | | 15 | | 3 | | 3 | | 3 | |
Audit and tax | | 22 | | 82 | | 21 | | 31 | | 23 | | 25 | |
Trustees | | 5 | | 9 | | 10 | | 2 | | 2 | | 2 | |
Registration | | — | | 1 | | — | | — | | — | | — | |
Dividend on securities sold short | | — | | — | | — | | — | | 1,695 | | — | |
Broker expense on short sales | | — | | — | | — | | — | | 257 | | — | |
Other | | 7 | | 9 | | 10 | | 3 | | 2 | | 2 | |
Total expenses | | 2,413 | | 3,645 | | 3,785 | | 799 | | 3,365 | | 721 | |
| | | | | | | | | | | | | |
Net investment income (loss) | | 5,931 | | 8,385 | | 8,503 | | 569 | | (1,744 | ) | 453 | |
| | | | | | | | | | | | | |
Net realized gain (loss) on transactions from: | | | | | | | | | | | | | |
Investment securities | | (103,738 | ) | (23,548 | )(b) | (118,880 | ) | (3,500 | ) | (34,146 | ) | (13,957 | ) |
Futures contracts | | — | | 3,949 | | — | | — | | — | | — | |
Written option contracts | | — | | 679 | | — | | — | | — | | 108 | |
Swap agreements | | — | | (103 | ) | — | | — | | — | | — | |
Foreign currency transactions | | (2,299 | ) | (2,890 | ) | — | | (8 | ) | — | | 2,447 | |
Securities sold short | | — | | — | | — | | — | | 24,416 | | — | |
| | (106,037 | ) | (21,913 | ) | (118,880 | ) | (3,508 | ) | (9,730 | ) | (11,402 | ) |
| | | | | | | | | | | | | |
Net increase (decrease) in unrealized appreciation (depreciation) on: | | | | | | | | | | | | | |
Investment securities | | 155,231 | | 91,883 | (c) | 131,940 | | 23,795 | | 42,548 | | 21,104 | |
Futures contracts | | — | | (1,263 | ) | — | | — | | — | | — | |
Written option contracts | | — | | (806 | ) | — | | — | | — | | 218 | |
Swap agreements | | — | | 231 | | — | | — | | — | | — | |
Translation of assets and liabilities denominated in foreign currencies | | 102 | | 999 | | — | | 26 | | — | | (612 | ) |
Securities sold short | | — | | — | | — | | — | | (41,185 | ) | — | |
Change in unrealized appreciation (depreciation): | | 155,333 | | 91,044 | | 131,940 | | 23,821 | | 1,363 | | 20,710 | |
Net realized and unrealized gain (loss) | | 49,296 | | 69,131 | | 13,060 | | 20,313 | | (8,367 | ) | 9,308 | |
Net increase (decrease) in net assets resulting from operations | | $ | 55,227 | | $ | 77,516 | | $ | 21,563 | | $ | 20,882 | | $ | (10,111 | ) | $ | 9,761 | |
The notes to the financial statements are an integral part of this report.
133
For the period or year ended October 31, 2009
| | Transamerica
JPMorgan Core
Bond* | | Transamerica
JPMorgan
International
Bond | | Transamerica
JPMorgan Mid
Cap Value | | Transamerica
Loomis Sayles
Bond | | Transamerica
Neuberger
Berman
International | | Transamerica
Oppenheimer
Developing
Markets | |
Investment income: | | | | | | | | | | | | | |
Dividend income | | $ | — | | $ | — | | $ | 4,358 | | $ | 1,030 | | $ | 9,349 | | $ | 8,369 | |
Withholding taxes on foreign dividends | | — | | — | | (13 | ) | (30 | ) | (764 | ) | (662 | ) |
Interest income | | 1,764 | | 20,465 | | 1 | | 51,472 | | 3 | | 1 | |
Securities lending income (net) | | — | | 25 | | 107 | | 126 | | 220 | | 129 | |
| | 1,764 | | 20,490 | | 4,453 | | 52,598 | | 8,808 | | 7,837 | |
| | | | | | | | | | | | | |
Expenses: | | | | | | | | | | | | | |
Management and advisory | | 292 | | 3,543 | | 1,257 | | 4,253 | | 3,137 | | 4,194 | |
Transfer agent | | — | (a) | — | (a) | — | (a) | — | (a) | — | (a) | — | (a) |
Printing and shareholder reports | | 1 | | 9 | | 4 | | 9 | | 5 | | 5 | |
Custody | | 18 | | 322 | | 29 | | 140 | | 234 | | 589 | |
Administration | | 13 | | 138 | | 30 | | 133 | | 65 | | 74 | |
Legal | | 2 | | 21 | | 5 | | 21 | | 52 | | 13 | |
Audit and tax | | 23 | | 32 | | 21 | | 27 | | 25 | | 93 | |
Trustees | | 2 | | 14 | | 4 | | 15 | | 7 | | 8 | |
Registration | | 7 | | — | | — | | — | | — | | 2 | |
Other | | — | | 18 | | 4 | | 12 | | 8 | | 5 | |
Total expenses | | 358 | | 4,097 | | 1,354 | | 4,610 | | 3,533 | | 4,983 | |
| | | | | | | | | | | | | |
Net investment income | | 1,406 | | 16,393 | | 3,099 | | 47,988 | | 5,275 | | 2,854 | |
| | | | | | | | | | | | | |
Net realized gain (loss) on transactions from: | | | | | | | | | | | | | |
Investment securities | | 14 | | 10,760 | | (25,131 | ) | (22,248 | ) | (98,546 | ) | (80,052 | )(d) |
Futures contracts | | — | | 2,940 | | — | | — | | — | | — | |
Foreign currency transactions | | — | | 3,935 | | — | | (88 | ) | (732 | ) | 697 | |
| | 14 | | 17,635 | | (25,131 | ) | (22,336 | ) | (99,278 | ) | (79,355 | ) |
| | | | | | | | | | | | | |
Net increase (decrease) in unrealized appreciation (depreciation) on: | | | | | | | | | | | | | |
Investment securities | | 1,435 | | 85,002 | | 43,368 | | 230,253 | | 179,139 | (e) | 254,813 | (f) |
Futures contracts | | — | | (979 | ) | — | | — | | — | | — | |
Translation of assets and liabilities denominated in foreign currencies | | — | | (5,270 | ) | — | | 139 | | 88 | | (634 | ) |
Change in unrealized appreciation (depreciation): | | 1,435 | | 78,753 | | 43,368 | | 230,392 | | 179,227 | | 254,179 | |
Net realized and unrealized gain | | 1,449 | | 96,388 | | 18,237 | | 208,056 | | 79,949 | | 174,824 | |
Net increase in net assets resulting from operations | | $ | 2,855 | | $ | 112,781 | | $ | 21,336 | | $ | 256,044 | | $ | 85,224 | | $ | 177,678 | |
The notes to the financial statements are an integral part of this report.
134
For the year ended October 31, 2009
| | Transamerica
Oppenheimer
Small- & Mid-Cap
Value | | Transamerica
Schroders
International
Small Cap | | Transamerica
Third Avenue
Value | | Transamerica
Thornburg
International
Value | | Transamerica
UBS Dynamic
Alpha | | Transamerica
UBS Large Cap
Value | |
Investment income: | | | | | | | | | | | | | |
Dividend income | | $ | 3,133 | | $ | 5,606 | | $ | 6,422 | | $ | 5,888 | | $ | 1,953 | | $ | 17,207 | |
Withholding taxes on foreign dividends | | (16 | ) | (482 | ) | (382 | ) | (538 | ) | (51 | ) | — | |
Interest income | | 3 | | 1 | | 230 | | 2 | | 7 | | 2 | |
Securities lending income (net) | | 79 | | 44 | | 256 | | — | | 87 | | 134 | |
| | 3,199 | | 5,169 | | 6,526 | | 5,352 | | 1,996 | | 17,343 | |
| | | | | | | | | | | | | |
Expenses: | | | | | | | | | | | | | |
Management and advisory | | 2,076 | | 2,235 | | 2,939 | | 2,392 | | 1,478 | | 5,096 | |
Transfer agent | | — | (a) | — | (a) | — | (a) | — | (a) | — | (a) | — | (a) |
Printing and shareholder reports | | 3 | | 3 | | 5 | | 4 | | 2 | | 9 | |
Custody | | 47 | | 223 | | 113 | | 173 | | 115 | | 69 | |
Administration | | 45 | | 42 | | 74 | | 46 | | 21 | | 133 | |
Legal | | 7 | | 7 | | 11 | | 8 | | 4 | | 22 | |
Audit and tax | | 27 | | 30 | | 22 | | 27 | | 33 | | 21 | |
Trustees | | 5 | | 5 | | 8 | | 6 | | 2 | | 15 | |
Registration | | 3 | | 3 | | 2 | | 6 | | — | | — | |
Other | | 9 | | 3 | | 9 | | 2 | | 8 | | 14 | |
Total expenses | | 2,222 | | 2,551 | | 3,183 | | 2,664 | | 1,663 | | 5,379 | |
Expenses recaptured | | — | | 26 | | — | | 45 | | — | | — | |
Net expenses | | 2,222 | | 2,577 | | 3,183 | | 2,709 | | 1,663 | | 5,379 | |
| | | | | | | | | | | | | |
Net investment income | | 977 | | 2,592 | | 3,343 | | 2,643 | | 333 | | 11,964 | |
| | | | | | | | | | | | | |
Net realized gain (loss) on transactions from: | | | | | | | | | | | | | |
Investment securities | | (44,773 | ) | (13,733 | ) | (85,810 | ) | 887 | | (46,478 | ) | (205,633 | ) |
Futures contracts | | — | | — | | — | | — | | 1,886 | | — | |
Swap agreements | | — | | — | | — | | — | | (11,824 | ) | — | |
Foreign currency transactions | | (54 | ) | 39 | | (148 | ) | 776 | | 16,292 | | — | |
| | (44,827 | ) | (13,694 | ) | (85,958 | ) | 1,663 | | (40,124 | ) | (205,633 | ) |
| | | | | | | | | | | | | |
Net increase (decrease) in unrealized appreciation (depreciation) on: | | | | | | | | | | | | | |
Investment securities | | 107,779 | | 92,499 | | 127,243 | | 66,602 | | 58,000 | | 234,116 | |
Futures contracts | | — | | — | | — | | — | | (12,343 | ) | — | |
Swap agreements | | — | | — | | — | | — | | 9,514 | | — | |
Translation of assets and liabilities denominated in foreign currencies | | — | | 102 | | (15 | ) | (2,305 | ) | (20,950 | ) | — | |
Change in unrealized appreciation (depreciation): | | 107,779 | | 92,601 | | 127,228 | | 64,297 | | 34,221 | | 234,116 | |
Net realized and unrealized gain (loss) | | 62,952 | | 78,907 | | 41,270 | | 65,960 | | (5,903 | ) | 28,483 | |
Net increase (decrease) in net assets resulting from operations | | $ | 63,929 | | $ | 81,499 | | $ | 44,613 | | $ | 68,603 | | $ | (5,570 | ) | $ | 40,447 | |
The notes to the financial statements are an integral part of this report.
135
| | Transamerica
Van Kampen
Emerging
Markets Debt | | Transamerica
Van Kampen
Mid-Cap Growth | | Transamerica
Van Kampen
Small Company
Growth | | Transamerica
WMC Emerging
Markets | | | | | |
Investment income: | | | | | | | | | | | | | |
Dividend income | | $ | — | | $ | 1,120 | | $ | 506 | | $ | 2,766 | | | | | |
Withholding taxes on foreign dividends | | — | | (21 | ) | — | | (250 | ) | | | | |
Interest income | | 26,572 | | 2 | | 1 | | 1 | | | | | |
Securities lending income (net) | | 126 | | 156 | | 175 | | — | | | | | |
| | 26,698 | | 1,257 | | 682 | | 2,517 | | | | | |
| | | | | | | | | | | | | |
Expenses: | | | | | | | | | | | | | |
Management and advisory | | 3,215 | | 1,231 | | 758 | | 1,265 | | | | | |
Transfer agent | | — | (a) | — | (a) | — | (a) | — | (a) | | | | |
Printing and shareholder reports | | 5 | | 2 | | 1 | | 2 | | | | | |
Custody | | 82 | | 49 | | 29 | | 248 | | | | | |
Administration | | 70 | | 31 | | 16 | | 22 | | | | | |
Legal | | 11 | | 5 | | 3 | | 3 | | | | | |
Audit and tax | | 29 | | 20 | | 20 | | 28 | | | | | |
Trustees | | 7 | | 4 | | 2 | | 3 | | | | | |
Registration | | — | | 3 | | 2 | | 2 | | | | | |
Other | | 7 | | 3 | | 2 | | 1 | | | | | |
Total expenses | | 3,426 | | 1,348 | | 833 | | 1,574 | | | | | |
Expenses reimbursed | | — | | — | | — | | (34 | ) | | | | |
Net expenses | | 3,426 | | 1,348 | | 833 | | 1,540 | | | | | |
| | | | | | | | | | | | | |
Net investment income (loss) | | 23,272 | | (91 | ) | (151 | ) | 977 | | | | | |
| | | | | | | | | | | | | |
Net realized gain (loss) on transactions from: | | | | | | | | | | | | | |
Investment securities | | (15,441 | ) | 1,479 | | (3,621 | ) | 3,963 | (g) | | | | |
Futures contracts | | (1,763 | ) | — | | — | | — | | | | | |
Foreign currency transactions | | (186 | ) | (14 | ) | (6 | ) | 254 | | | | | |
| | (17,390 | ) | 1,465 | | (3,627 | ) | 4,217 | | | | | |
| | | | | | | | | | | | | |
Net increase (decrease) in unrealized appreciation (depreciation) on: | | | | | | | | | | | | | |
Investment securities | | 100,765 | | 51,429 | | 22,009 | | 46,164 | (h) | | | | |
Futures contracts | | 859 | | — | | — | | — | | | | | |
Translation of assets and liabilities denominated in foreign currencies | | 130 | | — | | — | | (1,169 | ) | | | | |
Change in unrealized appreciation (depreciation): | | 101,754 | | 51,429 | | 22,009 | | 44,995 | | | | | |
Net realized and unrealized gain | | 84,364 | | 52,894 | | 18,382 | | 49,212 | | | | | |
Net increase in net assets resulting from operations | | $ | 107,636 | | $ | 52,803 | | $ | 18,231 | | $ | 50,189 | | | | | |
(a) Rounds to less than $1.
(b) Net of foreign capital gains tax of $1.
(c) Net of foreign capital gains tax of $55.
(d) Net of foreign capital gains tax of $150.
(e) Net of foreign capital gains tax of $14.
(f) Net of foreign capital gains tax of $466.
(g) Net of foreign capital gains tax of $191.
(h) Net of foreign capital gains tax of $328.
* Commenced operations on July 1, 2009.
The notes to the financial statements are an integral part of this report.
136
STATEMENTS OF CHANGES IN NET ASSETS
For the years ended:
(all amounts in thousands)
| | Transamerica AllianceBernstein
International Value | | Transamerica BlackRock Global
Allocation | | Transamerica BlackRock Large
Cap Value | |
| | October 31, 2009 | | October 31, 2008 | | October 31, 2009 | | October 31, 2008 | | October 31, 2009 | | October 31, 2008 | |
From operations: | | | | | | | | | | | | | |
Net investment income | | $ | 5,931 | | $ | 12,435 | | $ | 8,385 | | $ | 11,108 | | $ | 8,503 | | $ | 6,826 | |
Net realized gain (loss)(a) | | (106,037 | ) | (38,030 | ) | (21,913 | ) | 31,728 | | (118,880 | ) | (57,165 | ) |
Change in unrealized appreciation (depreciation)(b) | | 155,333 | | (269,436 | ) | 91,044 | | (167,402 | ) | 131,940 | | (211,987 | ) |
Net increase (decrease) in net assets resulting from operations | | 55,227 | | (295,031 | ) | 77,516 | | (124,566 | ) | 21,563 | | (262,326 | ) |
| | | | | | | | | | | | | |
Distributions to shareholders: | | | | | | | | | | | | | |
From net investment income | | (12,685 | ) | (7,597 | ) | (22,476 | ) | (13,764 | ) | (8,083 | ) | (4,474 | ) |
From net realized gains | | — | | (33,605 | ) | (20,996 | ) | (22,930 | ) | — | | (34,049 | ) |
Total distributions to shareholders | | (12,685 | ) | (41,202 | ) | (43,472 | ) | (36,694 | ) | (8,083 | ) | (38,523 | ) |
| | | | | | | | | | | | | |
Capital share transactions: | | | | | | | | | | | | | |
Proceeds from shares sold | | 33,207 | | 93,000 | | 20,209 | | 54,017 | | 175,569 | | 146,655 | |
Dividends and distributions reinvested | | 12,685 | | 41,202 | | 43,472 | | 36,694 | | 8,083 | | 38,523 | |
Cost of shares redeemed | | (20,703 | ) | (68,849 | ) | (26,527 | ) | (72,154 | ) | (25,273 | ) | (32,648 | ) |
Net increase in net assets resulting from capital shares transactions | | 25,189 | | 65,353 | | 37,154 | | 18,557 | | 158,379 | | 152,530 | |
| | | | | | | | | | | | | |
Net increase (decrease) in net assets | | 67,731 | | (270,880 | ) | 71,198 | | (142,703 | ) | 171,859 | | (148,319 | ) |
| | | | | | | | | | | | | |
Net assets: | | | | | | | | | | | | | |
Beginning of year | | 248,337 | | 519,217 | | 377,781 | | 520,484 | | 461,816 | | 610,135 | |
End of year | | $ | 316,068 | | $ | 248,337 | | $ | 448,979 | | $ | 377,781 | | $ | 633,675 | | $ | 461,816 | |
Undistributed net investment income (loss) | | $ | 5,809 | | $ | 12,245 | | $ | 5,644 | | $ | 21,295 | | $ | 6,661 | | $ | 6,241 | |
| | | | | | | | | | | | | |
Share activity: | | | | | | | | | | | | | |
Shares issued | | 4,629 | | 7,797 | | 2,172 | | 4,536 | | 22,694 | | 15,062 | |
Shares issued-reinvested from distributions | | 2,013 | | 3,133 | | 5,084 | | 2,993 | | 1,107 | | 3,267 | |
Shares redeemed | | (3,691 | ) | (8,235 | ) | (2,809 | ) | (6,380 | ) | (3,379 | ) | (4,257 | ) |
Net increase in shares outstanding | | 2,951 | | 2,695 | | 4,447 | | 1,149 | | 20,422 | | 14,072 | |
| | Transamerica BlackRock Natural
Resources | | Transamerica BNY Mellon Market
Neutral Strategy | | Transamerica Federated Market
Opportunity | |
| | October 31, 2009 | | October 31, 2008 | | October 31, 2009 | | October 31, 2008 | | October 31, 2009 | | October 31, 2008 | |
From operations: | | | | | | | | | | | | | |
Net investment income (loss) | | $ | 569 | | $ | 312 | | $ | (1,744 | ) | $ | 1,280 | | $ | 453 | | $ | 801 | |
Net realized gain (loss)(a) | | (3,508 | ) | 46 | | (9,730 | ) | (1,772 | ) | (11,402 | ) | 8,608 | |
Change in unrealized appreciation (depreciation)(b) | | 23,821 | | (64,043 | ) | 1,363 | | 4,178 | | 20,710 | | (16,387 | ) |
Net increase (decrease) in net assets resulting from operations | | 20,882 | | (63,685 | ) | (10,111 | ) | 3,686 | | 9,761 | | (6,978 | ) |
| | | | | | | | | | | | | |
Distributions to shareholders: | | | | | | | | | | | | | |
From net investment income | | (413 | ) | (323 | ) | — | | (6,638 | ) | (39 | ) | (769 | ) |
From net realized gains | | (50 | ) | (1,682 | ) | — | | — | | (4,308 | ) | — | |
From return of capital | | — | | — | | (1,349 | ) | — | | (1,344 | ) | — | |
Total distributions to shareholders | | (463 | ) | (2,005 | ) | (1,349 | ) | (6,638 | ) | (5,691 | ) | (769 | ) |
| | | | | | | | | | | | | |
Capital share transactions: | | | | | | | | | | | | | |
Proceeds from shares sold | | 18,094 | | 14,918 | | 7,254 | | 16,449 | | 3,527 | | 29,847 | |
Dividends and distributions reinvested | | 463 | | 2,005 | | 1,349 | | 6,638 | | 5,691 | | 769 | |
Cost of shares redeemed | | (4,886 | ) | (20,760 | ) | (31,809 | ) | (11,181 | ) | (2,206 | ) | (2,136 | ) |
Net increase (decrease) in net assets resulting from capital shares transactions | | 13,671 | | (3,837 | ) | (23,206 | ) | 11,906 | | 7,012 | | 28,480 | |
| | | | | | | | | | | | | |
Net increase (decrease) in net assets | | 34,090 | | (69,527 | ) | (34,666 | ) | 8,954 | | 11,082 | | 20,733 | |
| | | | | | | | | | | | | |
Net assets: | | | | | | | | | | | | | |
Beginning of year | | 87,252 | | 156,779 | | 121,348 | | 112,394 | | 74,480 | | 53,747 | |
End of year | | $ | 121,342 | | $ | 87,252 | | $ | 86,682 | | $ | 121,348 | | $ | 85,562 | | $ | 74,480 | |
Undistributed (accumulated) net investment income (loss) | | $ | 433 | | $ | 284 | | $ | — | | $ | — | | $ | — | | $ | 849 | |
| | | | | | | | | | | | | |
Share activity: | | | | | | | | | | | | | |
Shares issued | | 1,992 | | 1,162 | | 849 | | 1,742 | | 395 | | 3,086 | |
Shares issued-reinvested from distributions | | 63 | | 148 | | 145 | | 730 | | 664 | | 81 | |
Shares redeemed | | (714 | ) | (1,671 | ) | (3,481 | ) | (1,193 | ) | (246 | ) | (224 | ) |
Net increase (decrease) in shares outstanding | | 1,341 | | (361 | ) | (2,487 | ) | 1,279 | | 813 | | 2,943 | |
The notes to the financial statements are an integral part of this report.
137
For the period and years ended:
| | Transamerica
JPMorgan Core
Bond* | | Transamerica JPMorgan
International Bond | | Transamerica JPMorgan Mid Cap
Value | | | |
| | October 31, 2009 | | October 31, 2009 | | October 31, 2008 | | October 31, 2009 | | October 31, 2008 | | | |
From operations: | | | | | | | | | | | | | |
Net investment income | | $ | 1,406 | | $ | 16,393 | | $ | 20,478 | | $ | 3,099 | | $ | 2,796 | | | |
Net realized gain (loss)(a) | | 14 | | 17,635 | | 37,830 | | (25,131 | ) | (1,435 | ) | | |
Change in unrealized appreciation (depreciation)(b) | | 1,435 | | 78,753 | | (57,280 | ) | 43,368 | | (87,726 | ) | | |
Net increase (decrease) in net assets resulting from operations | | 2,855 | | 112,781 | | 1,028 | | 21,336 | | (86,365 | ) | | |
| | | | | | | | | | | | | |
Distributions to shareholders: | | | | | | | | | | | | | |
From net investment income | | (1,127 | ) | (43,396 | ) | (30,789 | ) | (3,382 | ) | (2,266 | ) | | |
From net realized gains | | — | | (6,155 | ) | — | | (1,094 | ) | (13,316 | ) | | |
Total distributions to shareholders | | (1,127 | ) | (49,551 | ) | (30,789 | ) | (4,476 | ) | (15,582 | ) | | |
| | | | | | | | | | | | | |
Capital share transactions: | | | | | | | | | | | | | |
Proceeds from shares sold | | 218,178 | | 15,190 | | 65,402 | | 17,074 | | 10,000 | | | |
Dividends and distributions reinvested | | 1,127 | | 49,551 | | 30,789 | | 4,476 | | 15,582 | | | |
Cost of shares redeemed | | (5,217 | ) | (94,085 | ) | (129,179 | ) | (20,344 | ) | (46,524 | ) | | |
Net increase (decrease) in net assets resulting from capital shares transactions | | 214,088 | | (29,344 | ) | (32,988 | ) | 1,206 | | (20,942 | ) | | |
| | | | | | | | | | | | | |
Net increase (decrease) in net assets | | 215,816 | | 33,886 | | (62,749 | ) | 18,066 | | (122,889 | ) | | |
| | | | | | | | | | | | | |
Net assets: | | | | | | | | | | | | | |
Beginning of year | | — | | 699,078 | | 761,827 | | 147,772 | | 270,661 | | | |
End of year | | $ | 215,816 | | $ | 732,964 | | $ | 699,078 | | $ | 165,838 | | $ | 147,772 | | | |
Undistributed net investment income (loss) | | $ | 499 | | $ | 10,160 | | $ | 31,840 | | $ | 2,369 | | $ | 2,731 | | | |
| | | | | | | | | | | | | |
Share activity: | | | | | | | | | | | | | |
Shares issued | | 21,821 | | 1,355 | | 5,807 | | 2,416 | | 1,408 | | | |
Shares issued-reinvested from distributions | | 112 | | 4,407 | | 2,798 | | 643 | | 1,389 | | | |
Shares redeemed | | (519 | ) | (8,964 | ) | (11,675 | ) | (2,638 | ) | (5,176 | ) | | |
Net increase (decrease) in shares outstanding | | 21,414 | | (3,202 | ) | (3,070 | ) | 421 | | (2,379 | ) | | |
| | Transamerica Loomis Sayles
Bond | | Transamerica Neuberger Berman
International | | Transamerica Oppenheimer
Developing Markets | |
| | October 31, 2009 | | October 31, 2008 | | October 31, 2009 | | October 31, 2008 | | October 31, 2009 | | October 31, 2008 | |
From operations: | | | | | | | | | | | | | |
Net investment income | | $ | 47,988 | | $ | 40,626 | | $ | 5,275 | | $ | 10,066 | | $ | 2,854 | | $ | 8,340 | |
Net realized gain (loss)(a) | | (22,336 | ) | 5,644 | | (99,278 | ) | (121,034 | ) | (79,355 | ) | 47,480 | |
Change in unrealized appreciation (depreciation)(b) | | 230,392 | | (223,926 | ) | 179,227 | | (235,226 | ) | 254,179 | | (381,426 | ) |
Net increase (decrease) in net assets resulting from operations | | 256,044 | | (177,656 | ) | 85,224 | | (346,194 | ) | 177,678 | | (325,606 | ) |
| | | | | | | | | | | | | |
Distributions to shareholders: | | | | | | | | | | | | | |
From net investment income | | (44,761 | ) | (37,734 | ) | (8,575 | ) | (6,201 | ) | (6,340 | ) | (3,529 | ) |
From net realized gains | | (4,085 | ) | — | | — | | (46,627 | ) | (57,434 | ) | (53,093 | ) |
Total distributions to shareholders | | (48,846 | ) | (37,734 | ) | (8,575 | ) | (52,828 | ) | (63,774 | ) | (56,622 | ) |
| | | | | | | | | | | | | |
Capital share transactions: | | | | | | | | | | | | | |
Proceeds from shares sold | | 35,720 | | 273,608 | | 142,391 | | 151,963 | | 39,328 | | 87,581 | |
Dividends and distributions reinvested | | 48,845 | | 37,734 | | 8,575 | | 52,828 | | 63,774 | | 56,622 | |
Cost of shares redeemed | | (56,879 | ) | (31,833 | ) | (49,793 | ) | (94,276 | ) | (39,343 | ) | (118,563 | ) |
Net increase in net assets resulting from capital shares transactions | | 27,686 | | 279,509 | | 101,173 | | 110,515 | | 63,759 | | 25,640 | |
| | | | | | | | | | | | | |
Net increase (decrease) in net assets | | 234,884 | | 64,119 | | 177,822 | | (288,507 | ) | 177,663 | | (356,588 | ) |
| | | | | | | | | | | | | |
Net assets: | | | | | | | | | | | | | |
Beginning of year | | 577,368 | | 513,249 | | 307,981 | | 596,488 | | 317,973 | | 674,561 | |
End of year | | $ | 812,252 | | $ | 577,368 | | $ | 485,803 | | $ | 307,981 | | $ | 495,636 | | $ | 317,973 | |
Undistributed net investment income (loss) | | $ | 5,777 | | $ | 8,371 | | $ | 4,121 | | $ | 8,208 | | $ | 2,441 | | $ | 6,339 | |
| | | | | | | | | | | | | |
Share activity: | | | | | | | | | | | | | |
Shares issued | | 4,217 | | 28,283 | | 19,249 | | 15,789 | | 4,766 | | 7,542 | |
Shares issued-reinvested from distributions | | 6,195 | | 3,970 | | 1,441 | | 4,574 | | 10,204 | | 3,762 | |
Shares redeemed | | (7,306 | ) | (3,978 | ) | (8,229 | ) | (12,637 | ) | (4,790 | ) | (12,028 | ) |
Net increase (decrease) in shares outstanding | | 3,106 | | 28,275 | | 12,461 | | 7,726 | | 10,180 | | (724 | ) |
The notes to the financial statements are an integral part of this report.
138
For the year ended:
| | Transamerica Oppenheimer Small- &
Mid-Cap Value | | Transamerica Schroders
International Small Cap | | Transamerica Third Avenue Value | |
| | October 31, 2009 | | October 31, 2008 | | October 31, 2009 | | October 31, 2008 | | October 31, 2009 | | October 31, 2008 | |
From operations: | | | | | | | | | | | | | |
Net investment income | | $ | 977 | | $ | 604 | | $ | 2,592 | | $ | 1,713 | | $ | 3,343 | | $ | 5,406 | |
Net realized gain (loss)(a) | | (44,827 | ) | (26,228 | ) | (13,694 | ) | (7,358 | ) | (85,958 | ) | (20,981 | ) |
Change in unrealized appreciation (depreciation)(b) | | 107,779 | | (84,639 | ) | 92,601 | | (67,816 | ) | 127,228 | | (232,767 | ) |
Net increase (decrease) in net assets resulting from operations | | 63,929 | | (110,263 | ) | 81,499 | | (73,461 | ) | 44,613 | | (248,342 | ) |
| | | | | | | | | | | | | |
Distributions to shareholders: | | | | | | | | | | | | | |
From net investment income | | (701 | ) | (7 | ) | (1,875 | ) | — | | — | | (9,916 | ) |
From net realized gains | | — | | (13,315 | ) | — | | — | | — | | (8,580 | ) |
Total distributions to shareholders | | (701 | ) | (13,322 | ) | (1,875 | ) | — | | — | | (18,496 | ) |
| | | | | | | | | | | | | |
Capital share transactions: | | | | | | | | | | | | | |
Proceeds from shares sold | | 91,818 | | 64,372 | | 374,388 | | 184,350 | | 98,997 | | 126,924 | |
Dividends and distributions reinvested | | 701 | | 13,322 | | 1,875 | | — | | — | | 18,496 | |
Cost of shares redeemed | | (14,352 | ) | (9,349 | ) | (20,869 | ) | (2,234 | ) | (56,905 | ) | (220,315 | ) |
Net increase (decrease) in net assets resulting from capital shares transactions | | 78,167 | | 68,345 | | 355,394 | | 182,116 | | 42,092 | | (74,895 | ) |
| | | | | | | | | | | | | |
Net increase (decrease) in net assets | | 141,395 | | (55,240 | ) | 435,018 | | 108,655 | | 86,705 | | (341,733 | ) |
| | | | | | | | | | | | | |
Net assets: | | | | | | | | | | | | | |
Beginning of year | | 127,886 | | 183,126 | | 108,655 | | — | | 336,845 | | 678,578 | |
End of year | | $ | 269,281 | | $ | 127,886 | | $ | 543,673 | | $ | 108,655 | | $ | 423,550 | | $ | 336,845 | |
Undistributed (accumulated) net investment income (loss) | | $ | 789 | | $ | 474 | | $ | 2,970 | | $ | 1,857 | | $ | 3,221 | | $ | (41 | ) |
| | | | | | | | | | | | | |
Share activity: | | | | | | | | | | | | | |
Shares issued | | 16,552 | | 6,551 | | 50,555 | | 19,050 | | 6,775 | | 5,410 | |
Shares issued-reinvested from distributions | | 123 | | 1,142 | | 328 | | — | | — | | 693 | |
Shares redeemed | | (2,096 | ) | (1,297 | ) | (3,389 | ) | (392 | ) | (3,698 | ) | (9,666 | ) |
Net increase (decrease) in shares outstanding | | 14,579 | | 6,396 | | 47,494 | | 18,658 | | 3,077 | | (3,563 | ) |
| | Transamerica Thornburg
International Value | | Transamerica UBS Dynamic
Alpha | | Transamerica UBS Large Cap
Value | |
| | October 31, 2009 | | October 31, 2008 | | October 31, 2009 | | October 31, 2008 | | October 31, 2009 | | October 31, 2008 | |
From operations: | | | | | | | | | | | | | |
Net investment income (loss) | | $ | 2,643 | | $ | (19 | ) | $ | 333 | | $ | 2,049 | | $ | 11,964 | | $ | 15,032 | |
Net realized gain (loss)(a) | | 1,663 | | (1,861 | ) | (40,124 | ) | 11,898 | | (205,633 | ) | (40,819 | ) |
Change in unrealized appreciation (depreciation)(b) | | 64,297 | | (18,341 | ) | 34,221 | | (37,163 | ) | 234,116 | | (389,642 | ) |
Net increase (decrease) in net assets resulting from operations | | 68,603 | | (20,221 | ) | (5,570 | ) | (23,216 | ) | 40,447 | | (415,429 | ) |
| | | | | | | | | | | | | |
Distributions to shareholders: | | | | | | | | | | | | | |
From net investment income | | — | | — | | (606 | ) | (2,297 | ) | (16,273 | ) | (9,912 | ) |
From net realized gains | | (634 | ) | — | | (41,308 | ) | — | | — | | (10,449 | ) |
From return of capital | | — | | — | | (1,013 | ) | — | | — | | — | |
Total distributions to shareholders | | (634 | ) | — | | (42,927 | ) | (2,297 | ) | (16,273 | ) | (20,361 | ) |
| | | | | | | | | | | | | |
Capital share transactions: | | | | | | | | | | | | | |
Proceeds from shares sold | | 480,007 | | 100,000 | | 7,143 | | 20,811 | | 326,000 | | 301,727 | |
Dividends and distributions reinvested | | 634 | | — | | 42,927 | | 2,297 | | 16,273 | | 20,361 | |
Cost of shares redeemed | | (36,587 | ) | (263 | ) | (60,123 | ) | (41,329 | ) | (65,816 | ) | (65,223 | ) |
Net increase (decrease) in net assets resulting from capital shares transactions | | 444,054 | | 99,737 | | (10,053 | ) | (18,221 | ) | 276,457 | | 256,865 | |
| | | | | | | | | | | | | |
Net increase (decrease) in net assets | | 512,023 | | 79,516 | | (58,550 | ) | (43,734 | ) | 300,631 | | (178,925 | ) |
| | | | | | | | | | | | | |
Net assets: | | | | | | | | | | | | | |
Beginning of year | | 79,516 | | — | | 165,567 | | 209,301 | | 701,997 | | 880,922 | |
End of year | | $ | 591,539 | | $ | 79,516 | | $ | 107,017 | | $ | 165,567 | | $ | 1,002,628 | | $ | 701,997 | |
Undistributed (accumulated) net investment income (loss) | | $ | 2,364 | | $ | — | | $ | — | | $ | — | | $ | 9,473 | | $ | 13,782 | |
| | | | | | | | | | | | | |
Share activity: | | | | | | | | | | | | | |
Shares issued | | 55,369 | | 10,000 | | 1,233 | | 2,108 | | 38,667 | | 29,211 | |
Shares issued-reinvested from distributions | | 81 | | — | | 8,401 | | 237 | | 2,238 | | 1,602 | |
Shares redeemed | | (4,377 | ) | (35 | ) | (11,261 | ) | (4,416 | ) | (9,307 | ) | (7,465 | ) |
Net increase (decrease) in shares outstanding | | 51,073 | | 9,965 | | (1,627 | ) | (2,071 | ) | 31,598 | | 23,348 | |
The notes to the financial statements are an integral part of this report.
139
| | Transamerica Van Kampen
Emerging Markets Debt | | Transamerica Van Kampen Mid-
Cap Growth | | Transamerica Van Kampen Small
Company Growth | |
| | October 31, 2009 | | October 31, 2008 | | October 31, 2009 | | October 31, 2008 | | October 31, 2009 | | October 31, 2008 | |
From operations: | | | | | | | | | | | | | |
Net investment income (loss) | | $ | 23,272 | | $ | 20,607 | | $ | (91 | ) | $ | 242 | | $ | (151 | ) | $ | 1,212 | |
Net realized gain (loss)(a) | | (17,390 | ) | (10,262 | ) | 1,465 | | (7,374 | ) | (3,627 | ) | (13,078 | ) |
Change in unrealized appreciation (depreciation)(b) | | 101,754 | | (96,386 | ) | 51,429 | | (64,974 | ) | 22,009 | | (53,280 | ) |
Net increase (decrease) in net assets resulting from operations | | 107,636 | | (86,041 | ) | 52,803 | | (72,106 | ) | 18,231 | | (65,146 | ) |
| | | | | | | | | | | | | |
Distributions to shareholders: | | | | | | | | | | | | | |
From net investment income | | (20,808 | ) | (25,745 | ) | (121 | ) | (178 | ) | (1,228 | ) | (194 | ) |
From net realized gains | | — | | (10,119 | ) | — | | (7,668 | ) | — | | (17,774 | ) |
From return of capital | | — | | — | | — | | — | | (126 | ) | — | |
Total distributions to shareholders | | (20,808 | ) | (35,864 | ) | (121 | ) | (7,846 | ) | (1,354 | ) | (17,968 | ) |
| | | | | | | | | | | | | |
Capital share transactions: | | | | | | | | | | | | | |
Proceeds from shares sold | | 1,679 | | 102,612 | | 106,246 | | 66,567 | | 65,454 | | 22,945 | |
Dividends and distributions reinvested | | 20,807 | | 35,864 | | 121 | | 7,846 | | 1,354 | | 17,968 | |
Cost of shares redeemed | | (47,046 | ) | (13,549 | ) | (978 | ) | (21,700 | ) | (15,010 | ) | (84,932 | ) |
Net increase (decrease) in net assets resulting from capital shares transactions | | (24,560 | ) | 124,927 | | 105,389 | | 52,713 | | 51,798 | | (44,019 | ) |
| | | | | | | | | | | | | |
Net increase (decrease) in net assets | | 62,268 | | 3,022 | | 158,071 | | (27,239 | ) | 68,675 | | (127,133 | ) |
| | | | | | | | | | | | | |
Net assets: | | | | | | | | | | | | | |
Beginning of year | | 320,350 | | 317,328 | | 98,141 | | 125,380 | | 61,214 | | 188,347 | |
End of year | | $ | 382,618 | | $ | 320,350 | | $ | 256,212 | | $ | 98,141 | | $ | 129,889 | | $ | 61,214 | |
Undistributed (accumulated) net investment income (loss) | | $ | 990 | | $ | 4,534 | | $ | 1 | | $ | 92 | | $ | (25 | ) | $ | 1,203 | |
| | | | | | | | | | | | | |
Share activity: | | | | | | | | | | | | | |
Shares issued | | 179 | | 9,937 | | 13,628 | | 5,898 | | 8,645 | | 2,409 | |
Shares issued-reinvested from distributions | | 2,409 | | 3,504 | | 18 | | 627 | | 203 | | 1,533 | |
Shares redeemed | | (5,349 | ) | (1,551 | ) | (106 | ) | (2,163 | ) | (2,401 | ) | (8,982 | ) |
Net increase (decrease) in shares outstanding | | (2,761 | ) | 11,890 | | 13,540 | | 4,362 | | 6,447 | | (5,040 | ) |
| | Transamerica WMC Emerging
Markets | |
| | October 31, 2009 | | October 31, 2008 | |
From operations: | | | | | |
Net investment income | | $ | 977 | | $ | 10 | |
Net realized gain (loss)(a) | | 4,217 | | (2,334 | ) |
Change in unrealized appreciation (depreciation)(b) | | 44,995 | | (21,056 | ) |
Net decrease in net assets resulting from operations | | 50,189 | | (23,380 | ) |
| | | | | |
Capital share transactions: | | | | | |
Proceeds from shares sold | | 56,923 | | 100,000 | |
Cost of shares redeemed | | (4,647 | ) | (493 | ) |
Net increase in net assets resulting from capital shares transactions | | 52,276 | | 99,507 | |
| | | | | |
Net increase in net assets | | 102,465 | | 76,127 | |
| | | | | |
Net assets: | | | | | |
Beginning of year | | 76,127 | | — | |
End of year | | $ | 178,592 | | $ | 76,127 | |
Undistributed net investment income (loss) | | $ | 308 | | $ | — | |
| | | | | |
Share activity: | | | | | |
Shares issued | | 5,415 | | 10,000 | |
Shares redeemed | | (542 | ) | (63 | ) |
Net increase in shares outstanding | | 4,873 | | 9,937 | |
(a) | Net realized gain (loss) includes investment securities, futures contracts, written options and swaptions, securities sold short, swaps, and foreign currency transactions. |
(b) | Change in unrealized appreciation (depreciation) includes investment securities, futures contracts, written options and swaptions, securities sold short, swaps, and foreign currency translation. |
* | Commenced operations on July 1, 2009. |
The notes to the financial statements are an integral part of this report.
140
FINANCIAL HIGHLIGHTS
For the period or years ended:
For a share outstanding throughout each period
| | Transamerica AllianceBernstein International Value | |
| | October 31, 2009 | | October 31, 2008 | | October 31, 2007 | | October 31,
2006(a) | |
Net asset value | | | | | | | | | |
Beginning of year | | $ | 6.61 | | $ | 14.88 | | $ | 12.35 | | $ | 10.00 | |
| | | | | | | | | |
Investment operations | | | | | | | | | |
Net investment income(b) | | 0.16 | | 0.30 | | 0.25 | | 0.20 | |
Net realized and unrealized gain (loss) on investments | | 1.37 | | (7.43 | ) | 2.65 | | 2.16 | |
Total from investment operations | | 1.53 | | (7.13 | ) | 2.90 | | 2.36 | |
| | | | | | | | | |
Distributions | | | | | | | | | |
Net investment income | | (0.35 | ) | (0.21 | ) | (0.15 | ) | (0.01 | ) |
Net realized gains on investments | | — | | (0.93 | ) | (0.22 | ) | — | |
Total distributions | | (0.35 | ) | (1.14 | ) | (0.37 | ) | (0.01 | ) |
| | | | | | | | | |
Net asset value | | | | | | | | | |
End of year | | $ | 7.79 | | $ | 6.61 | | $ | 14.88 | | $ | 12.35 | |
| | | | | | | | | |
Total return(c) | | 24.32 | % | (51.72 | )% | 23.99 | % | 23.67 | %(d) |
| | | | | | | | | |
Net assets end of year | | $ | 316,068 | | $ | 248,337 | | $ | 519,217 | | $ | 376,531 | |
| | | | | | | | | |
Ratio and supplemental data | | | | | | | | | |
| | | | | | | | | |
Expenses to average net assets: | | | | | | | | | |
After reimbursement/recapture | | 0.97 | % | 0.94 | % | 0.93 | % | 0.99 | %(e) |
Before reimbursement/recapture | | 0.97 | % | 0.94 | % | 0.93 | % | 0.99 | %(e) |
Net investment income, to average net assets | | 2.39 | % | 2.71 | % | 1.82 | % | 1.91 | %(e) |
Portfolio turnover rate | | 59 | % | 33 | % | 36 | % | 22 | %(d) |
For a share outstanding throughout each period
| | Transamerica BlackRock Global Allocation | |
| | October 31, 2009 | | October 31, 2008 | | October 31, 2007 | | October 31,
2006(a) | |
Net asset value | | | | | | | | | |
Beginning of year | | $ | 9.32 | | $ | 13.23 | | $ | 11.23 | | $ | 10.00 | |
| | | | | | | | | |
Investment operations | | | | | | | | | |
Net investment income(b) | | 0.19 | | 0.27 | | 0.24 | | 0.19 | |
Net realized and unrealized gain (loss) on investments | | 1.55 | | (3.25 | ) | 2.15 | | 1.06 | |
Total from investment operations | | 1.74 | | (2.98 | ) | 2.39 | | 1.25 | |
| | | | | | | | | |
Distributions | | | | | | | | | |
Net investment income | | (0.55 | ) | (0.35 | ) | (0.20 | ) | (0.02 | ) |
Net realized gains on investments | | (0.52 | ) | (0.58 | ) | (0.19 | ) | — | |
Total distributions | | (1.07 | ) | (0.93 | ) | (0.39 | ) | (0.02 | ) |
| | | | | | | | | |
Net asset value | | | | | | | | | |
End of year | | $ | 9.99 | | $ | 9.32 | | $ | 13.23 | | $ | 11.23 | |
| | | | | | | | | |
Total return(c) | | 20.57 | % | (24.23 | )% | 21.95 | % | 12.45 | %(d) |
| | | | | | | | | |
Net assets end of year | | $ | 448,979 | | $ | 377,781 | | $ | 520,484 | | $ | 490,941 | |
| | | | | | | | | |
Ratio and supplemental data | | | | | | | | | |
| | | | | | | | | |
Expenses to average net assets: | | | | | | | | | |
After reimbursement/recapture | | 0.90 | % | 0.88 | % | 0.85 | % | 0.90 | %(e) |
Before reimbursement/recapture | | 0.90 | % | 0.88 | % | 0.85 | % | 0.90 | %(e) |
Net investment income, to average net assets | | 2.08 | % | 2.25 | % | 2.04 | % | 2.02 | %(e) |
Portfolio turnover rate | | 43 | % | 49 | % | 30 | % | 31 | %(d) |
The notes to the financial statements are an integral part of this report.
141
For a share outstanding throughout each period
| | Transamerica BlackRock Large Cap Value | | | | | |
| | October 31, 2009 | | October 31, 2008 | | October 31, 2007 | | October 31,
2006(g) | | | | | |
Net asset value | | | | | | | | | | | | | |
Beginning of year | | $ | 7.61 | | $ | 13.08 | | $ | 12.15 | | $ | 10.47 | | | | | |
| | | | | | | | | | | | | |
Investment operations | | | | | | | | | | | | | |
Net investment income(b) | | 0.13 | | 0.13 | | 0.12 | | 0.07 | | | | | |
Net realized and unrealized gain (loss) on investments | | 0.20 | | (4.78 | ) | 1.27 | | 1.64 | | | | | |
Total from investment operations | | 0.33 | | (4.65 | ) | 1.39 | | 1.71 | | | | | |
| | | | | | | | | | | | | |
Distributions | | | | | | | | | | | | | |
Net investment income | | (0.13 | ) | (0.09 | ) | (0.09 | ) | (0.03 | ) | | | | |
Net realized gains on investments | | — | | (0.73 | ) | (0.37 | ) | — | | | | | |
Total distributions | | (0.13 | ) | (0.82 | ) | (0.46 | ) | (0.03 | ) | | | | |
| | | | | | | | | | | | | |
Net asset value | | | | | | | | | | | | | |
End of year | | $ | 7.81 | | $ | 7.61 | | $ | 13.08 | | $ | 12.15 | | | | | |
| | | | | | | | | | | | | |
Total return(c) | | 4.50 | % | (37.76 | )% | 11.80 | % | 16.36 | %(d) | | | | |
| | | | | | | | | | | | | |
Net assets end of year | | $ | 633,675 | | $ | 461,816 | | $ | 610,135 | | $ | 506,529 | | | | | |
| | | | | | | | | | | | | |
Ratio and supplemental data | | | | | | | | | | | | | |
| | | | | | | | | | | | | |
Expenses to average net assets: | | | | | | | | | | | | | |
After reimbursement/recapture | | 0.83 | % | 0.83 | % | 0.84 | % | 0.84 | %(e) | | | | |
Before reimbursement/recapture | | 0.83 | % | 0.83 | % | 0.84 | % | 0.84 | %(e) | | | | |
Net investment income, to average net assets | | 1.87 | % | 1.21 | % | 0.96 | % | 0.62 | %(e) | | | | |
Portfolio turnover rate | | 130 | % | 71 | % | 69 | % | 56 | %(d) | | | | |
| | | | | |
For a share outstanding throughout each period | | | |
| | | | | |
| | Transamerica BlackRock Natural Resources | | Transamerica BNY Mellon Market Neutral Strategy | |
| | October 31, 2009 | | October 31, 2008 | | October 31,
2007(h) | | October 31, 2009 | | October 31, 2008 | | October 31,
2007(h) | |
Net asset value | | | | | | | | | | | | | |
Beginning of year | | $ | 8.11 | | $ | 14.11 | | $ | 10.00 | | $ | 9.51 | | $ | 9.78 | | $ | 10.00 | |
| | | | | | | | | | | | | |
Investment operations | | | | | | | | | | | | | |
Net investment income (loss)(b) | | 0.05 | | 0.03 | | 0.04 | | (0.17 | ) | 0.10 | | 0.23 | |
Net realized and unrealized gain (loss) on investments | | 1.91 | | (5.85 | ) | 4.07 | | (0.80 | ) | 0.20 | | (0.45 | ) |
Total from investment operations | | 1.96 | | (5.82 | ) | 4.11 | | (0.97 | ) | 0.30 | | 0.22 | |
| | | | | | | | | | | | | |
Distributions | | | | | | | | | | | | | |
Net investment income | | (0.04 | ) | (0.03 | ) | — | | — | | (0.57 | ) | — | |
Net realized gains on investments | | — | (i) | (0.15 | ) | — | | — | | — | | — | |
Return of capital | | — | | — | | — | | (0.11 | ) | — | | — | |
Total distributions | | (0.04 | ) | (0.18 | ) | — | | (0.11 | ) | (0.57 | ) | — | |
| | | | | | | | | | | | | |
Net asset value | | | | | | | | | | | | | |
End of year | | $ | 10.03 | | $ | 8.11 | | $ | 14.11 | | $ | 8.43 | | $ | 9.51 | | $ | 9.78 | |
| | | | | | | | | | | | | |
Total return(c) | | 24.41 | % | (41.77 | )% | 41.10 | %(d) | (10.27 | )% | 3.30 | % | (2.20 | )%(d) |
| | | | | | | | | | | | | |
Net assets end of year | | $ | 121,342 | | $ | 87,252 | | $ | 156,779 | | $ | 86,682 | | $ | 121,348 | | $ | 112,394 | |
| | | | | | | | | | | | | |
Ratio and supplemental data | | | | | | | | | | | | | |
| | | | | | | | | | | | | |
Expenses to average net assets: | | | | | | | | | | | | | |
After reimbursement/recapture | | 0.89 | % | 0.86 | % | 0.89 | %(e) | 3.61 | %(f) | 2.79 | %(f) | 3.05 | %(e),(f) |
Before reimbursement/recapture | | 0.89 | % | 0.86 | % | 0.89 | %(e) | 3.61 | %(f) | 2.79 | %(f) | 3.05 | %(e),(f) |
Net investment income (loss), to average net assets | | 0.63 | % | 0.21 | % | 0.39 | %(e) | (1.87 | )% | 1.05 | % | 2.77 | %(e) |
Portfolio turnover rate | | 5 | % | 4 | % | 7 | %(d) | 463 | % | 192 | % | 119 | %(d) |
The notes to the financial statements are an integral part of this report.
142
For a share outstanding throughout each period
| | Transamerica Federated Market Opportunity | | Transamerica
JPMorgan Core
Bond | |
| | October 31, 2009 | | October 31, 2008 | | October 31, 2007 | | October 31,
2006(a) | | October 31,
2009(j) | |
Net asset value | | | | | | | | | | | |
Beginning of year | | $ | 8.56 | | $ | 9.33 | | $ | 9.71 | | $ | 10.00 | | $ | 10.00 | |
| | | | | | | | | | | |
Investment operations | | | | | | | | | | | |
Net investment income(b) | | 0.05 | | 0.11 | | 0.24 | | 0.27 | | 0.07 | |
Net realized and unrealized gain (loss) on investments | | 1.03 | | (0.77 | ) | (0.34 | ) | (0.30 | ) | 0.06 | |
Total from investment operations | | 1.08 | | (0.66 | ) | (0.10 | ) | (0.03 | ) | 0.13 | |
| | | | | | | | | | | |
Distributions | | | | | | | | | | | |
Net investment income | | (0.01 | ) | (0.11 | ) | (0.28 | ) | (0.26 | ) | (0.05 | ) |
Net realized gains on investments | | (0.49 | ) | — | | — | | — | | — | |
Return of capital | | (0.15 | ) | — | | — | | — | | — | |
Total distributions | | (0.65 | ) | (0.11 | ) | (0.28 | ) | (0.26 | ) | (0.05 | ) |
| | | | | | | | | | | |
Net asset value | | | | | | | | | | | |
End of year | | $ | 8.99 | | $ | 8.56 | | $ | 9.33 | | $ | 9.71 | | $ | 10.08 | |
| | | | | | | | | | | |
Total return(c) | | 13.01 | % | (7.16 | )% | (1.03 | )% | (0.35 | )%(d) | 1.34 | %(d) |
| | | | | | | | | | | |
Net assets end of year | | $ | 85,562 | | $ | 74,480 | | $ | 53,747 | | $ | 83,188 | | $ | 215,816 | |
| | | | | | | | | | | |
Ratio and supplemental data | | | | | | | | | | | |
| | | | | | | | | | | |
Expenses to average net assets: | | | | | | | | | | | |
After reimbursement/recapture | | 0.89 | % | 0.88 | % | 0.93 | % | 0.88 | %(e) | 0.55 | %(e) |
Before reimbursement/recapture | | 0.89 | % | 0.88 | % | 0.93 | % | 0.88 | %(e) | 0.55 | %(e) |
Net investment income, to average net assets | | 0.56 | % | 1.13 | % | 2.49 | % | 2.97 | %(e) | 2.15 | %(e) |
Portfolio turnover rate | | 180 | % | 195 | % | 97 | % | 72 | %(d) | 3 | %(d) |
| | | | | | | | | | | |
For a share outstanding throughout each period | | | | | | | |
| | | | | | | | | | | |
| | Transamerica JPMorgan International Bond | | | |
| | October 31, 2009 | | October 31, 2008 | | October 31, 2007 | | October 31,
2006(a) | | | |
Net asset value | | | | | | | | | | | |
Beginning of year | | $ | 10.56 | | $ | 11.00 | | $ | 10.51 | | $ | 10.00 | | | |
| | | | | | | | | | | |
Investment operations | | | | | | | | | | | |
Net investment income(b) | | 0.26 | | 0.29 | | 0.28 | | 0.22 | | | |
Net realized and unrealized gain (loss) on investments | | 1.59 | | (0.29 | ) | 0.59 | | 0.49 | | | |
Total from investment operations | | 1.85 | | — | (i) | 0.87 | | 0.71 | | | |
| | | | | | | | | | | |
Distributions | | | | | | | | | | | |
Net investment income | | (0.68 | ) | (0.44 | ) | (0.38 | ) | (0.20 | ) | | |
Net realized gains on investments | | (0.09 | ) | — | | — | | — | | | |
Total distributions | | (0.77 | ) | (0.44 | ) | (0.38 | ) | (0.20 | ) | | |
| | | | | | | | | | | |
Net asset value | | | | | | | | | | | |
End of year | | $ | 11.64 | | $ | 10.56 | | $ | 11.00 | | $ | 10.51 | | | |
| | | | | | | | | | | |
Total return(c) | | 17.90 | % | (0.14 | )% | 8.55 | % | 7.12 | %(d) | | |
| | | | | | | | | | | |
Net assets end of year | | $ | 732,964 | | $ | 699,078 | | $ | 761,827 | | $ | 682,254 | | | |
| | | | | | | | | | | |
Ratio and supplemental data | | | | | | | | | | | |
| | | | | | | | | | | |
Expenses to average net assets: | | | | | | | | | | | |
After reimbursement/recapture | | 0.60 | % | 0.61 | % | 0.61 | % | 0.64 | %(e) | | |
Before reimbursement/recapture | | 0.60 | % | 0.61 | % | 0.61 | % | 0.64 | %(e) | | |
Net investment income, to average net assets | | 2.38 | % | 2.55 | % | 2.68 | % | 2.34 | %(e) | | |
Portfolio turnover rate | | 53 | % | 74 | % | 86 | % | 145 | %(d) | | |
The notes to the financial statements are an integral part of this report.
143
For a share outstanding throughout each period
| | Transamerica JPMorgan Mid Cap Value | |
| | October 31, 2009 | | October 31, 2008 | | October 31, 2007 | | October 31,
2006(g) | |
Net asset value | | | | | | | | | |
Beginning of year | | $ | 7.54 | | $ | 12.32 | | $ | 11.67 | | $ | 10.09 | |
| | | | | | | | | |
Investment operations | | | | | | | | | |
Net investment income(b) | | 0.15 | | 0.13 | | 0.13 | | 0.11 | |
Net realized and unrealized gain (loss) on investments | | 0.82 | | (4.20 | ) | 1.13 | | 1.57 | |
Total from investment operations | | 0.97 | | (4.07 | ) | 1.26 | | 1.68 | |
| | | | | | | | | |
Distributions | | | | | | | | | |
Net investment income | | (0.17 | ) | (0.10 | ) | (0.11 | ) | (0.05 | ) |
Net realized gains on investments | | (0.06 | ) | (0.61 | ) | (0.50 | ) | (0.05 | ) |
Total distributions | | (0.23 | ) | (0.71 | ) | (0.61 | ) | (0.10 | ) |
| | | | | | | | | |
Net asset value | | | | | | | | | |
End of year | | $ | 8.28 | | $ | 7.54 | | $ | 12.32 | | $ | 11.67 | |
| | | | | | | | | |
Total return(c) | | 13.39 | % | (34.92 | )% | 11.07 | % | 16.71 | %(d) |
| | | | | | | | | |
Net assets end of year | | $ | 165,838 | | $ | 147,772 | | $ | 270,661 | | $ | 245,188 | |
| | | | | | | | | |
Ratio and supplemental data | | | | | | | | | |
| | | | | | | | | |
Expenses to average net assets: | | | | | | | | | |
After reimbursement/recapture | | 0.90 | % | 0.87 | % | 0.87 | % | 0.88 | %(e) |
Before reimbursement/recapture | | 0.90 | % | 0.87 | % | 0.87 | % | 0.88 | %(e) |
Net investment income, to average net assets | | 2.05 | % | 1.22 | % | 0.98 | % | 1.10 | %(e) |
Portfolio turnover rate | | 43 | % | 45 | % | 50 | % | 46 | %(d) |
| | | | | | | | | |
For a share outstanding throughout each period | | | | | |
| | | | | | | | | |
| | Transamerica Loomis Sayles Bond | | | |
| | October 31, 2009 | | October 31, 2008 | | October 31,
2007(h) | | | |
Net asset value | | | | | | | | | |
Beginning of year | | $ | 7.34 | | $ | 10.19 | | $ | 10.00 | | | |
| | | | | | | | | |
Investment operations | | | | | | | | | |
Net investment income(b) | | 0.60 | | 0.60 | | 0.45 | | | |
Net realized and unrealized gain (loss) on investments | | 2.61 | | (2.88 | ) | (0.01 | ) | | |
Total from investment operations | | 3.21 | | (2.28 | ) | 0.44 | | | |
| | | | | | | | | |
Distributions | | | | | | | | | |
Net investment income | | (0.57 | ) | (0.57 | ) | (0.25 | ) | | |
Net realized gains on investments | | (0.05 | ) | — | | — | | | |
Total distributions | | (0.62 | ) | (0.57 | ) | (0.25 | ) | | |
| | | | | | | | | |
Net asset value | | | | | | | | | |
End of year | | $ | 9.93 | | $ | 7.34 | | $ | 10.19 | | | |
| | | | | | | | | |
Total return(c) | | 46.27 | % | (23.56 | )% | 4.50 | %(d) | | |
| | | | | | | | | |
Net assets end of year | | $ | 812,252 | | $ | 577,368 | | $ | 513,249 | | | |
| | | | | | | | | |
Ratio and supplemental data | | | | | | | | | |
| | | | | | | | | |
Expenses to average net assets: | | | | | | | | | |
After reimbursement/recapture | | 0.69 | % | 0.69 | % | 0.73 | %(e) | | |
Before reimbursement/recapture | | 0.69 | % | 0.69 | % | 0.73 | %(e) | | |
Net investment income, to average net assets | | 7.22 | % | 6.34 | % | 5.42 | %(e) | | |
Portfolio turnover rate | | 42 | % | 24 | % | 18 | %(d) | | |
The notes to the financial statements are an integral part of this report.
144
For a share outstanding throughout each period
| | Transamerica Neuberger Berman International | |
| | October 31, 2009 | | October 31, 2008 | | October 31, 2007 | | October 31,
2006(a) | |
Net asset value | | | | | | | | | |
Beginning of year | | $ | 5.95 | | $ | 13.55 | | $ | 11.74 | | $ | 10.00 | |
| | | | | | | | | |
Investment operations | | | | | | | | | |
Net investment income(b) | | 0.10 | | 0.19 | | 0.15 | | 0.12 | |
Net realized and unrealized gain (loss) on investments | | 1.69 | | (6.63 | ) | 2.37 | | 1.64 | |
Total from investment operations | | 1.79 | | (6.44 | ) | 2.52 | | 1.76 | |
| | | | | | | | | |
Distributions | | | | | | | | | |
Net investment income | | (0.17 | ) | (0.13 | ) | (0.13 | ) | (0.02 | ) |
Net realized gains on investments | | — | | (1.03 | ) | (0.58 | ) | — | |
Total distributions | | (0.17 | ) | (1.16 | ) | (0.71 | ) | (0.02 | ) |
| | | | | | | | | |
Net asset value | | | | | | | | | |
End of year | | $ | 7.57 | | $ | 5.95 | | $ | 13.55 | | $ | 11.74 | |
| | | | | | | | | |
Total return(c) | | 30.83 | % | (51.66 | )% | 22.37 | % | 17.61 | %(d) |
| | | | | | | | | |
Net assets end of year | | $ | 485,803 | | $ | 307,981 | | $ | 596,488 | | $ | 459,996 | |
| | | | | | | | | |
Ratio and supplemental data | | | | | | | | | |
| | | | | | | | | |
Expenses to average net assets: | | | | | | | | | |
After reimbursement/recapture | | 1.09 | % | 1.06 | % | 1.06 | % | 1.07 | %(e) |
Before reimbursement/recapture | | 1.09 | % | 1.06 | % | 1.06 | % | 1.07 | %(e) |
Net investment income, to average net assets | | 1.62 | % | 1.87 | % | 1.21 | % | 1.21 | %(e) |
Portfolio turnover rate | | 75 | % | 72 | % | 57 | % | 52 | %(d) |
For a share outstanding throughout each period
| | Transamerica Oppenheimer Developing Markets | |
| | October 31, 2009 | | October 31, 2008 | | October 31, 2007 | | October 31,
2006(a) | |
Net asset value | | | | | | | | | |
Beginning of year | | $ | 8.20 | | $ | 17.07 | | $ | 11.41 | | $ | 10.00 | |
| | | | | | | | | |
Investment operations | | | | | | | | | |
Net investment income(b) | | 0.06 | | 0.19 | | 0.12 | | 0.09 | |
Net realized and unrealized gain (loss) on investments | | 3.51 | | (7.65 | ) | 5.99 | | 1.37 | |
Total from investment operations | | 3.57 | | (7.46 | ) | 6.11 | | 1.46 | |
| | | | | | | | | |
Distributions | | | | | | | | | |
Net investment income | | (0.16 | ) | (0.09 | ) | (0.06 | ) | (0.05 | ) |
Net realized gains on investments | | (1.49 | ) | (1.32 | ) | (0.39 | ) | — | |
Total distributions | | (1.65 | ) | (1.41 | ) | (0.45 | ) | (0.05 | ) |
| | | | | | | | | |
Net asset value | | | | | | | | | |
End of year | | $ | 10.12 | | $ | 8.20 | | $ | 17.07 | | $ | 11.41 | |
| | | | | | | | | |
Total return(c) | | 56.01 | % | (47.48 | )% | 55.27 | % | 14.64 | %(d) |
| | | | | | | | | |
Net assets end of year | | $ | 495,636 | | $ | 317,973 | | $ | 674,561 | | $ | 362,080 | |
| | | | | | | | | |
Ratio and supplemental data | | | | | | | | | |
| | | | | | | | | |
Expenses to average net assets: | | | | | | | | | |
After reimbursement/recapture | | 1.35 | % | 1.32 | % | 1.34 | % | 1.45 | %(e) |
Before reimbursement/recapture | | 1.35 | % | 1.32 | % | 1.34 | % | 1.45 | %(e) |
Net investment income, to average net assets | | 0.77 | % | 1.42 | % | 0.87 | % | 0.89 | %(e) |
Portfolio turnover rate | | 50 | % | 67 | % | 59 | % | 77 | %(d) |
The notes to the financial statements are an integral part of this report.
145
For a share outstanding throughout each period
| | Transamerica Oppenheimer Small- & Mid-Cap Value | | Transamerica Schroders
International Small Cap | |
| | October 31, 2009 | | October 31, 2008 | | October 31, 2007 | | October 31,
2006(k) | | October 31, 2009 | | October 31,
2008(l) | |
Net asset value | | | | | | | | | | | | | |
Beginning of year | | $ | 6.30 | | $ | 13.18 | | $ | 10.94 | | $ | 10.00 | | $ | 5.82 | | $ | 10.00 | |
| | | | | | | | | | | | | |
Investment operations | | | | | | | | | | | | | |
Net investment income(b) | | 0.03 | | 0.04 | | — | | 0.02 | | 0.08 | | 0.12 | |
Net realized and unrealized gain (loss) on investments | | 1.41 | | (5.98 | ) | 2.44 | | 0.92 | | 2.41 | | (4.30 | ) |
Total from investment operations | | 1.44 | | (5.94 | ) | 2.44 | | 0.94 | | 2.49 | | (4.18 | ) |
| | | | | | | | | | | | | |
Distributions | | | | | | | | | | | | | |
Net investment income | | (0.02 | ) | — | (i) | (0.02 | ) | — | | (0.09 | ) | — | |
Net realized gains on investments | | — | | (0.94 | ) | (0.18 | ) | — | | — | | — | |
Total distributions | | (0.02 | ) | (0.94 | ) | (0.20 | ) | — | | (0.09 | ) | — | |
| | | | | | | | | | | | | |
Net asset value | | | | | | | | | | | | | |
End of year | | $ | 7.72 | | $ | 6.30 | | $ | 13.18 | | $ | 10.94 | | $ | 8.22 | | $ | 5.82 | |
| | | | | | | | | | | | | |
Total return(c) | | 22.99 | % | (48.36 | )% | 22.57 | % | 9.40 | %(d) | 43.56 | % | (41.80 | )%(d) |
| | | | | | | | | | | | | |
Net assets end of year | | $ | 269,281 | | $ | 127,886 | | $ | 183,126 | | $ | 91,899 | | $ | 543,673 | | $ | 108,655 | |
| | | | | | | | | | | | | |
Ratio and supplemental data | | | | | | | | | | | | | |
| | | | | | | | | | | | | |
Expenses to average net assets: | | | | | | | | | | | | | |
After reimbursement/recapture | | 0.98 | % | 1.00 | % | 1.03 | %(*) | 1.15 | %(e) | 1.23 | % | 1.27 | %(e) |
Before reimbursement/recapture | | 0.98 | % | 1.00 | % | 1.03 | %(*) | 1.22 | %(e) | 1.21 | % | 1.30 | %(e) |
Net investment income, to average net assets | | 0.43 | % | 0.34 | % | — | % | 0.74 | %(e) | 1.23 | % | 1.96 | %(e) |
Portfolio turnover rate | | 110 | % | 102 | % | 118 | % | 33 | %(d) | 46 | % | 14 | %(d) |
| | | | | | | | | | | | | |
For a share outstanding throughout each period | | | | | | | | |
| | | | | | | | | | | | | |
| | Transamerica Third Avenue Value | | Transamerica Thornburg
International Value | | | |
| | October 31, 2009 | | October 31, 2008 | | October 31,
2007(m) | | October 31, 2009 | | October 31,
2008(n) | | | |
Net asset value | | | | | | | | | | | | | |
Beginning of year | | $ | 16.93 | | $ | 28.93 | | $ | 28.01 | | $ | 7.98 | | $ | 10.00 | | | |
| | | | | | | | | | | | | |
Investment operations | | | | | | | | | | | | | |
Net investment income(b) | | 0.15 | | 0.24 | | 0.14 | | 0.10 | | — | (i) | | |
Net realized and unrealized gain (loss) on investments | | 1.36 | | (11.45 | ) | 0.78 | | 1.66 | | (2.02 | ) | | |
Total from investment operations | | 1.51 | | (11.21 | ) | 0.92 | | 1.76 | | (2.02 | ) | | |
| | | | | | | | | | | | | |
Distributions | | | | | | | | | | | | | |
Net investment income | | — | | (0.42 | ) | — | | — | | — | | | |
Net realized gains on investments | | — | | (0.37 | ) | — | | (0.05 | ) | — | | | |
Total distributions | | — | | (0.79 | ) | — | | (0.05 | ) | — | | | |
| | | | | | | | | | | | | |
Net asset value | | | | | | | | | | | | | |
End of year | | $ | 18.44 | | $ | 16.93 | | $ | 28.93 | | $ | 9.69 | | $ | 7.98 | | | |
| | | | | | | | | | | | | |
Total return(c) | | 8.92 | % | (39.75 | )% | 3.28 | %(d) | 22.21 | % | (20.20 | )%(d) | | |
| | | | | | | | | | | | | |
Net assets end of year | | $ | 423,550 | | $ | 336,845 | | $ | 678,578 | | $ | 591,539 | | $ | 79,516 | | | |
| | | | | | | | | | | | | |
Ratio and supplemental data | | | | | | | | | | | | | |
| | | | | | | | | | | | | |
Expenses to average net assets: | | | | | | | | | | | | | |
After reimbursement/recapture | | 0.87 | % | 0.86 | % | 0.86 | %(e) | 1.17 | % | 1.35 | %(e) | | |
Before reimbursement/recapture | | 0.87 | % | 0.86 | % | 0.86 | %(e) | 1.15 | % | 1.76 | %(e) | | |
Net investment income (loss), to average net assets | | 0.91 | % | 1.00 | % | 0.98 | %(e) | 1.14 | % | (0.18 | )%(e) | | |
Portfolio turnover rate | | 17 | % | 29 | % | 11 | %(d) | 39 | % | 5 | %(d) | | |
The notes to the financial statements are an integral part of this report.
146
For a share outstanding throughout each period
| | Transamerica UBS Dynamic Alpha | | | | | |
| | October 31, 2009 | | October 31, 2008 | | October 31,
2007(h) | | | | | |
Net asset value | | | | | | | | | | | |
Beginning of year | | $ | 8.60 | | $ | 9.83 | | $ | 10.00 | | | | | |
| | | | | | | | | | | |
Investment operations | | | | | | | | | | | |
Net investment income(b) | | 0.02 | | 0.18 | | 0.09 | | | | | |
Net realized and unrealized loss on investments | | (0.04 | ) | (1.30 | ) | (0.26 | ) | | | | |
Total from investment operations | | (0.02 | ) | (1.12 | ) | (0.17 | ) | | | | |
| | | | | | | | | | | |
Distributions | | | | | | | | | | | |
Net investment income | | (0.03 | ) | (0.11 | ) | — | | | | | |
Net realized gains on investments | | (2.40 | ) | — | | — | | | | | |
Return of capital | | (0.07 | ) | — | | — | | | | | |
Total distributions | | (2.50 | ) | (0.11 | ) | — | | | | | |
| | | | | | | | | | | |
Net asset value | | | | | | | | | | | |
End of year | | $ | 6.08 | | $ | 8.60 | | $ | 9.83 | | | | | |
| | | | | | | | | | | |
Total return(c) | | 5.34 | % | (11.55 | )% | (1.70 | )%(d) | | | | |
| | | | | | | | | | | |
Net assets end of year | | $ | 107,017 | | $ | 165,567 | | $ | 209,382 | | | | | |
| | | | | | | | | | | |
Ratio and supplemental data | | | | | | | | | | | |
| | | | | | | | | | | |
Expenses to average net assets: | | | | | | | | | | | |
After reimbursement/recapture | | 1.58 | % | 1.51 | % | 1.51 | %(e) | | | | |
Before reimbursement/recapture | | 1.58 | % | 1.51 | % | 1.51 | %(e) | | | | |
Net investment income, to average net assets | | 0.32 | % | 1.81 | % | 1.16 | %(e) | | | | |
Portfolio turnover rate | | 358 | % | 84 | % | 45 | %(d) | | | | |
| | | | | | | | | | | | | | | | |
| | | | | | | | | | | | | | | | | |
For a share outstanding throughout each period
| | Transamerica UBS Large Cap Value | |
| | October 31, 2009 | | October 31, 2008 | | October 31, 2007 | | October 31, 2006 | | October 31,
2005(o) | |
Net asset value | | | | | | | | | | | |
Beginning of year | | $ | 8.05 | | $ | 13.79 | | $ | 12.73 | | $ | 10.95 | | $ | 10.00 | |
| | | | | | | | | | | |
Investment operations | | | | | | | | | | | |
Net investment income(b) | | 0.14 | | 0.21 | | 0.19 | | 0.14 | | 0.12 | |
Net realized and unrealized gain (loss) on investments | | 0.44 | | (5.64 | ) | 1.36 | | 1.92 | | 0.84 | |
Total from investment operations | | 0.58 | | (5.43 | ) | 1.55 | | 2.06 | | 0.96 | |
| | | | | | | | | | | |
Distributions | | | | | | | | | | | |
Net investment income | | (0.19 | ) | (0.15 | ) | (0.13 | ) | (0.10 | ) | (0.01 | ) |
Net realized gains on investments | | — | | (0.16 | ) | (0.36 | ) | (0.18 | ) | — | |
Total distributions | | (0.19 | ) | (0.31 | ) | (0.49 | ) | (0.28 | ) | (0.01 | ) |
| | | | | | | | | | | |
Net asset value | | | | | | | | | | | |
End of year | | $ | 8.44 | | $ | 8.05 | | $ | 13.79 | | $ | 12.73 | | $ | 10.95 | |
| | | | | | | | | | | |
Total return(c) | | 7.56 | % | (40.19 | )% | 12.48 | % | 19.19 | % | 9.60 | %(d) |
| | | | | | | | | | | |
Net assets end of year | | $ | 1,002,628 | | $ | 701,997 | | $ | 880,922 | | $ | 226,782 | | $ | 94,135 | |
| | | | | | | | | | | |
Ratio and supplemental data | | | | | | | | | | | |
| | | | | | | | | | | |
Expenses to average net assets: | | | | | | | | | | | |
After reimbursement/recapture | | 0.81 | % | 0.80 | % | 0.81 | % | 0.88 | % | 0.92 | %(e) |
Before reimbursement/recapture | | 0.81 | % | 0.80 | % | 0.81 | % | 0.88 | % | 0.92 | %(e) |
Net investment income, to average net assets | | 1.80 | % | 1.86 | % | 1.41 | % | 1.21 | % | 1.14 | %(e) |
Portfolio turnover rate | | 66 | % | 47 | % | 27 | % | 32 | % | 43 | %(d) |
The notes to the financial statements are an integral part of this report.
147
For a share outstanding throughout each period
| | Transamerica Van Kampen Emerging Markets Debt | |
| | October 31, 2009 | | October 31, 2008 | | October 31, 2007 | | October 31, 2006 | | October 31,
2005(o) | |
Net asset value | | | | | | | | | | | |
Beginning of year | | $ | 7.98 | | $ | 11.23 | | $ | 10.91 | | $ | 10.45 | | $ | 10.00 | |
| | | | | | | | | | | |
Investment operations | | | | | | | | | | | |
Net investment income(b) | | 0.60 | | 0.61 | | 0.59 | | 0.55 | | 0.49 | |
Net realized and unrealized gain (loss) on investments | | 2.18 | | (2.72 | ) | 0.46 | | 0.52 | | 0.45 | |
Total from investment operations | | 2.78 | | (2.11 | ) | 1.05 | | 1.07 | | 0.94 | |
| | | | | | | | | | | |
Distributions | | | | | | | | | | | |
Net investment income | | (0.53 | ) | (0.79 | ) | (0.63 | ) | (0.54 | ) | (0.49 | ) |
Net realized gains on investments | | — | | (0.35 | ) | (0.10 | ) | (0.07 | ) | — | |
Total distributions | | (0.53 | ) | (1.14 | ) | (0.73 | ) | (0.61 | ) | (0.49 | ) |
| | | | | | | | | | | |
Net asset value | | | | | | | | | | | |
End of year | | $ | 10.23 | | $ | 7.98 | | $ | 11.23 | | $ | 10.91 | | $ | 10.45 | |
| | | | | | | | | | | |
Total return(c) | | 36.29 | % | (20.81 | )% | 9.94 | % | 10.61 | % | 9.36 | %(d) |
| | | | | | | | | | | |
Net assets end of year | | $ | 382,618 | | $ | 320,350 | | $ | 317,328 | | $ | 425,726 | | $ | 136,022 | |
| | | | | | | | | | | |
Ratio and supplemental data | | | | | | | | | | | |
| | | | | | | | | | | |
Expenses to average net assets: | | | | | | | | | | | |
After reimbursement/recapture | | 0.98 | % | 0.98 | % | 1.03 | % | 1.03 | % | 1.07 | %(e) |
Before reimbursement/recapture | | 0.98 | % | 0.98 | % | 1.03 | % | 1.03 | % | 1.07 | %(e) |
Net investment income, to average net assets | | 6.67 | % | 5.92 | % | 5.36 | % | 5.24 | % | 4.91 | %(e) |
Portfolio turnover rate | | 118 | % | 81 | % | 79 | % | 79 | % | 67 | %(d) |
| | | | | | | | | | | |
For a share outstanding throughout each period | | | | | | | |
| | | | | | | | | | | |
| | Transamerica Van Kampen Mid-Cap Growth | | | |
| | October 31, 2009 | | October 31, 2008 | | October 31, 2007 | | October 31,
2006(p) | | | |
Net asset value | | | | | | | | | | | |
Beginning of year | | $ | 7.42 | | $ | 14.16 | | $ | 10.33 | | $ | 10.00 | | | |
| | | | | | | | | | | |
Investment operations | | | | | | | | | | | |
Net investment income(b) | | — | (i) | 0.02 | | 0.04 | | 0.01 | | | |
Net realized and unrealized gain (loss) on investments | | 2.17 | | (5.90 | ) | 3.81 | | 0.32 | | | |
Total from investment operations | | 2.17 | | (5.88 | ) | 3.85 | | 0.33 | | | |
| | | | | | | | | | | |
Distributions | | | | | | | | | | | |
Net investment income | | (0.01 | ) | (0.02 | ) | (0.02 | ) | — | | | |
Net realized gains on investments | | — | | (0.84 | ) | — | | — | | | |
Total distributions | | (0.01 | ) | (0.86 | ) | (0.02 | ) | — | | | |
| | | | | | | | | | | |
Net asset value | | | | | | | | | | | |
End of year | | $ | 9.58 | | $ | 7.42 | | $ | 14.16 | | $ | 10.33 | | | |
| | | | | | | | | | | |
Total return(c) | | 29.29 | % | (43.99 | )% | 37.32 | % | 3.30 | %(d) | | |
| | | | | | | | | | | |
Net assets end of year | | $ | 256,212 | | $ | 98,141 | | $ | 125,380 | | $ | 75,092 | | | |
| | | | | | | | | | | |
Ratio and supplemental data | | | | | | | | | | | |
| | | | | | | | | | | |
Expenses to average net assets: | | | | | | | | | | | |
After reimbursement/recapture | | 0.88 | % | 0.87 | % | 0.90 | % | 0.92 | %(e) | | |
Before reimbursement/recapture | | 0.88 | % | 0.87 | % | 0.90 | % | 0.92 | %(e) | | |
Net investment income (loss), to average net assets | | (0.06 | )% | 0.19 | % | 0.32 | % | 0.11 | %(e) | | |
Portfolio turnover rate | | 38 | % | 40 | % | 74 | % | 50 | %(d) | | |
The notes to the financial statements are an integral part of this report.
148
For a share outstanding throughout each period
| | Transamerica Van Kampen Small Company Growth | |
| | October 31, 2009 | | October 31, 2008 | | October 31, 2007 | | October 31, 2006 | | October 31,
2005(o) | |
Net asset value | | | | | | | | | | | |
Beginning of year | | $ | 7.39 | | $ | 14.14 | | $ | 12.78 | | $ | 11.29 | | $ | 10.00 | |
| | | | | | | | | | | |
Investment operations | | | | | | | | | | | |
Net investment income (loss)(b) | | (0.02 | ) | 0.10 | | 0.02 | | (0.02 | ) | 0.01 | |
Net realized and unrealized gain (loss) on investments | | 1.62 | | (5.50 | ) | 1.81 | | 1.69 | | 1.28 | |
Total from investment operations | | 1.60 | | (5.40 | ) | 1.83 | | 1.67 | | 1.29 | |
| | | | | | | | | | | |
Distributions | | | | | | | | | | | |
Net investment income | | (0.15 | ) | (0.02 | ) | — | | (0.01 | ) | — | |
Net realized gains on investments | | — | | (1.33 | ) | (0.47 | ) | (0.17 | ) | — | |
Return of capital | | (0.02 | ) | — | | — | | — | | — | |
Total distributions | | (0.17 | ) | (1.35 | ) | (0.47 | ) | (0.18 | ) | — | |
| | | | | | | | | | | |
Net asset value | | | | | | | | | | | |
End of year | | $ | 8.82 | | $ | 7.39 | | $ | 14.14 | | $ | 12.78 | | $ | 11.29 | |
| | | | | | | | | | | |
Total return(c) | | 22.43 | % | (41.72 | )% | 14.75 | % | 14.92 | % | 12.80 | %(d) |
| | | | | | | | | | | |
Net assets end of year | | $ | 129,889 | | $ | 61,214 | | $ | 188,347 | | $ | 301,649 | | $ | 86,432 | |
| | | | | | | | | | | |
Ratio and supplemental data | | | | | | | | | | | |
| | | | | | | | | | | |
Expenses to average net assets: | | | | | | | | | | | |
After reimbursement/recapture | | 1.04 | % | 1.02 | % | 1.01 | % | 1.01 | % | 1.07 | %(e) |
Before reimbursement/recapture | | 1.04 | % | 1.02 | % | 1.01 | % | 1.01 | % | 1.07 | %(e) |
Net investment income (loss), to average net assets | | (0.19 | )% | 0.89 | % | 0.13 | % | (0.19 | )% | 0.06 | %(e) |
Portfolio turnover rate | | 40 | % | 44 | % | 71 | % | 67 | % | 75 | %(d) |
| | | | | | | | | | | |
For a share outstanding throughout each period | | | | | | | |
| | | | | | | | | | | |
| | Transamerica WMC Emerging
Markets | | | | | | | |
| | October 31, 2009 | | October 31,
2008(q) | | | | | | | |
Net asset value | | | | | | | | | | | |
Beginning of year | | $ | 7.66 | | $ | 10.00 | | | | | | | |
| | | | | | | | | | | |
Investment operations | | | | | | | | | | | |
Net investment income(b) | | 0.09 | | — | (i) | | | | | | |
Net realized and unrealized gain (loss) on investments | | 4.31 | | (2.34 | ) | | | | | | |
Total from investment operations | | 4.40 | | (2.34 | ) | | | | | | |
| | | | | | | | | | | |
Net asset value | | | | | | | | | | | |
End of year | | $ | 12.06 | | $ | 7.66 | | | | | | | |
| | | | | | | | | | | |
Total return(c) | | 57.44 | % | (23.40 | )%(d) | | | | | | |
| | | | | | | | | | | |
Net assets end of year | | $ | 178,592 | | $ | 76,127 | | | | | | | |
| | | | | | | | | | | |
Ratio and supplemental data | | | | | | | | | | | |
| | | | | | | | | | | |
Expenses to average net assets: | | | | | | | | | | | |
After reimbursement/recapture | | 1.40 | % | 1.40 | %(e) | | | | | | |
Before reimbursement/recapture | | 1.43 | % | 2.26 | %(e) | | | | | | |
Net investment income, to average net assets | | 0.89 | % | 0.15 | %(e) | | | | | | |
Portfolio turnover rate | | 141 | % | 10 | %(d) | | | | | | |
| | | | | | | | | | | | | | | | | |
The notes to the financial statements are an integral part of this report.
149
(a) | | Commenced operations on December 6, 2005. |
(b) | | Calculated based on average number of shares outstanding. |
(c) | | Total return has been calculated for the applicable period without deduction of a sales load, if any, on an initial purchase. |
(d) | | Not annualized. |
(e) | | Annualized. |
(f) | | Includes dividends and interest on securities sold short (representing 2.09%, 1.30%, and 1.56% of Average Net Assets for 2009, 2008 and 2007, respectively). |
(g) | | Commenced operations on November 15, 2005. |
(h) | | Commenced operations on January 3, 2007. |
(i) | | Rounds to less than $(0.01) or $0.01. |
(j) | | Commenced operations on July 1, 2009. |
(k) | | Commenced operations on August 1, 2006. |
(l) | | Commenced operations on March 1, 2008. |
(m) | | Commenced operations on May 1, 2007. |
(n) | | Commenced operations on September 15, 2008. |
(o) | | Commenced operations on November 8, 2004. |
(p) | | Commenced operations on January 3, 2006. |
(q) | | Commenced operations on September 30, 2008. |
(*) | | Includes recaptured expenses by the investment adviser. The impact of recaptured expenses was 0.01% (see Note 2). |
The notes to the financial statements are an integral part of this report.
150
Transamerica Clarion Global Real Estate Securities
(unaudited)
MARKET ENVIRONMENT
The past twelve months have been a period of positive total returns for global real estate stocks, which have advanced by more than 23% as improving capital market conditions and improving economic conditions have benefited investors. Governments and central banks responded quickly and aggressively to credit issues in the fourth quarter of the year 2008 and first quarter of the year 2009, providing access to significant capital support for financial institutions as well as interest rate cuts. The resulting impact is beginning to become evident via recent economic reports, including second quarter of Gross Domestic Product (“GDP”) data that surpassed expectations, which has led to positive revisions to future growth estimates and has led to an acknowledgment that the recession which impacted several of the world’s developed economies may have ended. The Asia-Pacific property stocks fared the best over the past twelve months, up 41%, followed by the European region and Americas, which were up 34% and 2%, respectively.
Within the Asia-Pacific region, performance was driven by the strength of the Singapore and Hong Kong markets, up 81% and 80%, respectively. Economic growth in Asia has been robust. China’s economic growth accelerated to an 8.9% rate year-on-year versus 6.1% and 7.9% during the first two quarters of 2009, respectively. Singapore revised its GDP growth forecast range for 2009 to -2.0% to -2.5% from the previous forecast range of -4% to - -6%. The notable laggard in the region has been Japan, where property markets were up by a modest 9% during the past twelve months.
Within the European region, the return differential among countries has been quite substantial, ranging from a 156% return posted by Austria, the best-performing market during the period, to a -42% return posted by Spain, the poorest-performing market during the period. On the whole, the countries which fared the best in the current environment were the countries in the Benelux region as well as Germany and France; the countries which fared the worst were in Southern, Central and Eastern Europe as well as the U.K., which was down 5% during the period.
Within the North American region, U.S. property stocks were flat during the period while Canadian property companies posted a 33% increase.
PERFORMANCE
For the year ended October 31, 2009, Transamerica Clarion Global Real Estate Securities Class I returned 15.72%. By comparison, its benchmark, the Standard & Poor’s Developed Property Index (“S&P Developed Property”), returned 23.43%.
STRATEGY REVIEW
While absolute returns were strong during the period, the Fund lagged its benchmark as the result of both stock selection and asset allocation decisions. Stock selection, which accounted for approximately half of the period’s underperformance, was mixed as positive stock selection in the Americas and the U.K was more than offset by sub-par stock selection in the Asia-Pacific region (primarily Japan, Australia and Singapore), while stock selection in Continental Europe was flat.
Country allocation decisions hurt returns as an average underweight to the outperforming Asia-Pacific region, along with an overweight to the underperforming Americas more than offset the positive contribution of country selection decisions in Europe.
Transamerica Clarion Global Real Estate Securities offers a global strategy for real estate securities investors in the U.S. The Fund generally owns between 80-110 real estate stocks with the goal of outperforming the S&P Developed Property. The Fund seeks to own attractively priced stocks that own property in markets with favorable underlying real estate fundamentals. The global universe of public real estate companies is approximately three times the size of the U.S. public company universe, which offers additional choices and diversification opportunities to the manager.
The Fund continues to maintain a bias toward high-quality companies. We remain overweight sectors and geographies offering long-term leases and high percentages of earnings from recurring sources (primarily contract lease rental income). We prefer companies offering more transparency, strong balance sheets and good, experienced management teams. This focus on quality has driven our longer-term outperformance.
We believe global property companies are fairly valued. We estimate the average global property company is trading in-line with our internal estimate of inherent private real estate market value.
The rationale for a global listed property strategy remains very much intact including diversification via low long-term correlation to broad equities and bonds, attractive current yield, reasonable valuations and the continued, gradual spread of the Real Estate Investment Trust (“REIT”) structure globally. Through an average four percent to five percent dividend yield plus, fundamentals which we believe are bottoming, and access to the capital markets, global property stocks may be well-positioned to deliver modestly attractive total returns over the next several years.
We appreciate your continued faith and confidence in our portfolio management team.
T. Ritson Ferguson, CFA
Joseph P. Smith, CFA
Steven D. Burton, CFA
Co-Portfolio Managers
ING Clarion Real Estate Securities, L.P.
151
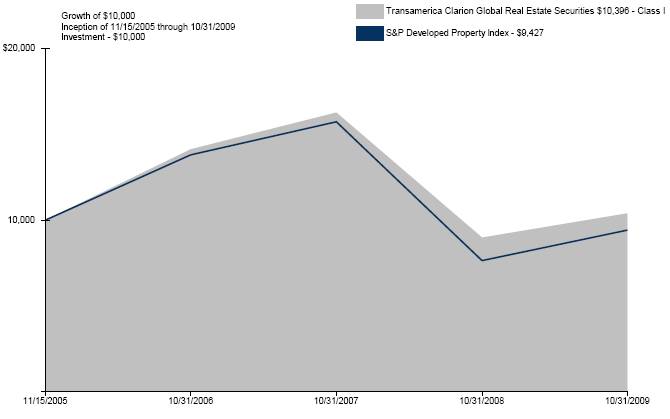
Average Annual Total Return for Periods Ended 10/31/2009
| | 1 Year | | 10 Years or
Life of Fund | | Inception Date | |
Class I (NAV) | | 15.72 | % | 0.98 | % | 11/15/2005 | |
S&P Developed Property* | | 23.43 | % | (1.48 | )% | 11/15/2005 | |
NOTES
* The Standard & Poor’s Developed Property (“S&P Developed Property”) Index is an unmanaged index used as a general measure of market performance. Calculations assume dividends and capital gains are reinvested and do not include any managerial expenses. The 10 Years or Life of Fund calculation is based on life of the fund. You cannot invest directly in an Index.
The performance data presented represents past performance; future results may vary. Performance data does not reflect the deduction of taxes that would be paid on fund distributions or the redemption of fund shares. Investment return and principal value will fluctuate so that an investor’s shares, when redeemed, may be worth more or less than their original cost. Current performance may be lower or higher than performance quoted. Please see www.transamericafunds.com for performance data current to the most recent month-end. Net Asset Value (“NAV”) returns include the reinvestment of dividends and capital gains. Fund shares are sold without a sales load.
Performance figures may reflect fee waivers and/or expense reimbursements by the Investment Adviser. Without such waivers and/or reimbursements, the performance would be lower. Future waivers and/or reimbursements are at the discretion of the Investment Adviser.
International investing involves special risks including currency fluctuations, political instability, and different financial accounting standards. This material must be preceded or accompanied by a current prospectus, which includes specific contents regarding the investment objectives and policies of this fund. This fund is only available in Class I shares, which are not available for direct investment by the public.
152
Transamerica Jennison Growth
(unaudited)
MARKET ENVIRONMENT
The fiscal year ended October 31, 2009 was marked by a severe decline in financial markets followed by an even sharper rebound. The credit crisis that began in 2008 escalated as the period began, prompting unprecedented coordination between the US Treasury and Federal Reserve in efforts to resuscitate credit markets and stabilize the financial system. A collapsing housing market, debt deflation, rising unemployment, and stalled production and consumption contributed to the most severe recession since the Great Depression.
President Obama moved swiftly after his inauguration in January 2009 to revive the economy. New programs designed to thaw credit and address the issue of distressed bank loans were introduced, capital was injected into major financial institutions, and an almost $800 billion fiscal stimulus package was enacted.
In the second half of the period, signs of economic stabilization led to a strong resurgence in the US equity market. Distressed sale prices, low interest rates, increased mortgage credit, and first-time homebuyers’ tax credits stimulated housing activity. Stimulus measures revitalized car sales, and declines in retail sales and corporate revenue moderated.
After contracting steeply at the end of 2008 and in the first quarter of 2009, US Gross Domestic Product (“GDP”) grew 3.5% in 2009’s third quarter. However, unemployment, which climbed to 9.8% at the end of September, remained a substantial impediment to growth and suggested an uneven path to recovery.
PERFORMANCE
For the year ended October 31, 2009, Transamerica Jennison Growth Class I returned 21.79%. By comparison, its benchmark, the Russell 1000® Growth Index, returned 17.51%.
STRATEGY REVIEW
The Fund is built from the bottom up based on the fundamentals of individual companies. Technology positions contributed to positive return. Apple’s gain was fueled by better-than-expected iPod and iPhone sales. The company’s cutting-edge software for managing, editing, and sharing content is making Apple a prime beneficiary of the digitization of music, photos, and video. With iPhone, Apple is also seeing significant incremental growth in the mobile phone market. We believe the company’s creativity and innovation in product design and marketing will continue to drive share gains.
Internet search leader Google advanced on solid earnings growth and margin expansion. We consider Google’s technological lead and dominant position in Internet search a unique strength that has enabled it to monetize search traffic at a meaningfully higher rate than its competitors. Its continued investment in capacity and research and development should, we believe, lead to new streams of revenue through product, format, and technological innovation.
In the consumer discretionary sector, Amazon.com’s strong earnings reflected the ongoing secular shift toward e-commerce and market share gains by the world’s largest online retailer.
Goldman Sachs was a standout performer in financials, advancing on strong earnings and revenue. We view the company as “best in class” and expect it to continue to benefit from its solid balance sheet and deft navigation of the uneven market environment.
In health care, optical care leader Alcon rose on better-than-expected earnings and moves by Swiss pharmaceutical company Novartis to buy a majority stake in it. Pharmacy-benefits manager Medco Health Solutions gained on strong retail prescriptions and operating leverage.
Key individual detractors from return included Celgene, Thermo Fisher Scientific, and First Solar. Thermo, a provider of instruments and services to scientists and manufacturers, declined on disappointing earnings and revenue, while First Solar fell as price discounting by competitors pressured its pricing and profit margins. We eliminated the Fund’s positions in both stocks.
Celgene declined on concerns that its drug Revlimid might not meet high sales expectations. Already approved in patients who have failed other therapies, Revlimid is being tested as a first-line treatment for the blood cancer multiple myeloma. We like the prospects for its approval as an initial therapy and believe the drug could eventually be approved to treat other diseases, such as non-Hodgkin’s lymphoma and chronic lymphocytic leukemia.
Michael A. Del Balso
Spiros Segalas
Blair A. Boyer
Co-Portfolio Managers
Jennison Associates LLC
153
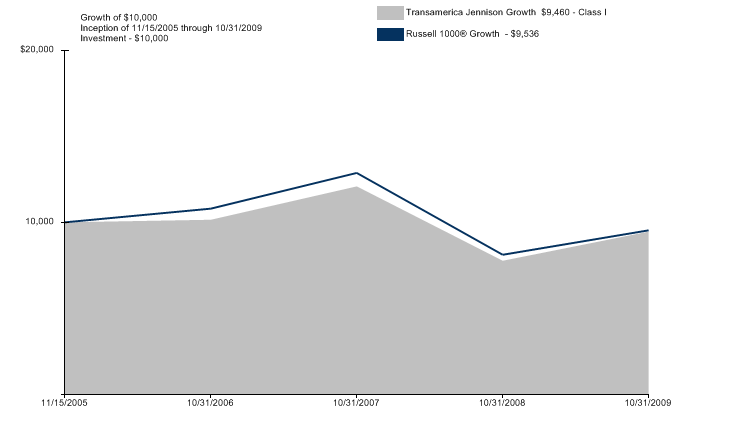
Average Annual Total Return for Periods Ended 10/31/2009
| | 1 Year | | 10 Years or
Life of Fund | | Inception Date | |
Class I (NAV) | | 21.79 | % | (1.39 | )% | 11/15/2005 | |
Russell 1000® Growth * | | 17.51 | % | (1.19 | )% | 11/15/2005 | |
NOTES
* The Russell 1000® Growth (“Russell 1000® Growth”) Index is an unmanaged index used as a general measure of market performance. Calculations assume dividends and capital gains are reinvested and do not include any managerial expenses. The 10 Years or Life of Fund calculation is based on life of the Fund. You cannot invest directly in an Index.
The performance data presented represents past performance; future results may vary. Performance data does not reflect the deduction of taxes that would be paid on fund distributions or the redemption of fund shares. Investment return and principal value will fluctuate so that an investor’s shares, when redeemed, may be worth more or less than their original cost. Current performance may be lower or higher than performance quoted. Please see www.transamericafunds.com for performance data current to the most recent month-end. Net Asset Value (“NAV”) returns include the reinvestment of dividends and capital gains. Fund shares are sold without a sales load.
Performance figures may reflect fee waivers and/or expense reimbursements by the Investment Adviser. Without such waivers and/or reimbursements, the performance would be lower. Future waivers and/or reimbursements are at the discretion of the Investment Adviser.
This material must be preceded or accompanied by a current prospectus, which includes specific contents regarding the investment objectives and policies of this Fund. This Fund is only available in Class I shares, which are not available for direct investment by the public.
154
Transamerica MFS International Equity
(unaudited)
MARKET ENVIRONMENT
The global economy and financial markets deteriorated amid extraordinary volatility over most of the reporting period. Through the first quarter, the headwinds in the U.S. included the housing market, corporate investment, the job market, and tighter credit. The downturn in economic activity experienced in the fourth quarter of 2008 and the first quarter of 2009 was among the most intense in the post-WW II period. Not only did Europe and Japan fall into deep recessions, but emerging markets also contracted. The recovery has been similarly synchronized, led by emerging Asian economies, but broadening to include most of the global economy. Drivers of the recovery included an unwinding of the inventory destocking, as well as massive fiscal and monetary stimulus. As a result, credit conditions and equity indices improved considerably during the second half of the period. Nevertheless, the degree of financial and macroeconomic dislocation remained significant.
During the first half of the period, the Fed implemented its final interest rate cut, and the U.S. Treasury began implementing a massive stimulus package. Central banks around the world also cut interest rates dramatically. Globally, policy makers sought to coordinate rescue efforts, resulting in the establishment of swap lines among the Federal Reserve and a number of other central banks, as well as an increase in the financial resources of the International Monetary Fund. By the middle of the period, several central banks had approached their lower bound on policy rates and were examining quantitative easing to loosen monetary policy to offset the continuing fall in economic activity. However, by the end of the period, there were signs that the worst of the macroeconomic deterioration had passed, which caused a rise in asset valuations. As asset prices rebounded in the second half of the period and the demand for liquidity waned, the debate concerning monetary exit strategies had begun, creating uncertainty regarding the forward path of policy rates.
PERFORMANCE
For the year ended October 31, 2009, Transamerica MFS International Equity Class I returned 24.01%. By comparison, its benchmark, the Morgan Stanley Capital International-Europe, Australasia, and Far East Index (“MSCI-EAFE”), returned 28.41%.
STRATEGY REVIEW
Stock selection in the consumer staples sector held back performance relative to the MSCI-EAFE. Overweighted positions in manufacturer Kao Corp. (Japan) and alcoholic drink producer DiageoPLC (U.K.) were among the portfolio’s top detractors as the stocks significantly underperformed the benchmark over the reporting period.
An underweighted position in the financial services sector hindered relative returns. Within this sector, our holdings of reinsurance company Swiss Reinsurance (Switzerland) was a top relative detractor. Not holding strong-performing Spanish bank operator Banco Santander also hurt.
Strong stock selection in the retailing sector was the primary contributor to relative performance. Our overweighted positions in luxury goods company LVMH Moët Hennessy Louis Vuitton (France) and consumer products trading company Li & Fung (Hong Kong) boosted relative results as both stocks significantly outperformed the benchmark over the reporting period.
Driven by stock selection, the industrial goods and services sector also contributed to relative performance. The portfolio’s holdings of electrical distribution equipment maker Schneider Electric S.A. (France) and wiring accessories company Legrand S.A. (France) bolstered results.
David R. Mannheim
Marcus L. Smith
Co-Portfolio Managers
MFS® Investment Management
155
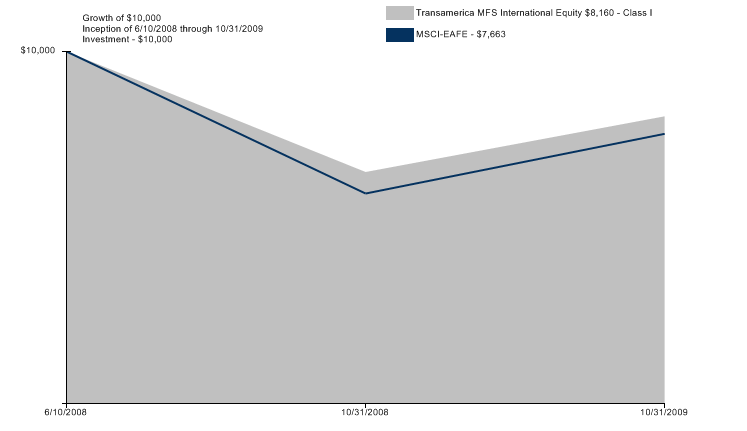
Average Annual Total Return for Periods Ended 10/31/2009
| | 1 Year | | 10 Years or
Life of Fund | | Inception Date | |
Class I (NAV) | | 24.01 | % | (13.57 | )% | 06/10/2008 | |
MSCI-EAFE* | | 28.41 | % | (17.38 | )% | 06/10/2008 | |
NOTES
* The Morgan Stanley Capital International-Europe, Australasia, and Far East (“MSCI EAFE”) Index is an unmanaged index used as a general measure of market performance. Calculations assume dividends and capital gains are reinvested and do not include any managerial expenses. The 10 Years or Life of Fund calculation is based on life of the Fund. You cannot invest directly in an Index.
The performance data presented represents past performance; future results may vary. Performance data does not reflect the deduction of taxes that would be paid on fund distributions or the redemption of fund shares. Investment return and principal value will fluctuate so that an investor’s shares, when redeemed, may be worth more or less than their original cost. Current performance may be lower or higher than performance quoted. Please see www.transamericafunds.com for performance data current to the most recent month-end. Net Asset Value (“NAV”) returns include the reinvestment of dividends and capital gains. Fund shares are sold without a sales load.
Performance figures may reflect fee waivers and/or expense reimbursements by the Investment Adviser. Without such waivers and/or reimbursements, the performance would be lower. Future waivers and/or reimbursements are at the discretion of the Investment Adviser.
International investing involves special risks including currency fluctuations, political instability, and different financial accounting standards. This material must be preceded or accompanied by a current prospectus, which includes specific contents regarding the investment objectives and policies of this Fund. This Fund is only available in Class I shares, which are not available for direct investment by the public.
156
Transamerica PIMCO Real Return TIPS
(unaudited)
MARKET ENVIRONMENT
During the start of the fiscal year most fixed-income securities lost ground along with other financial assets as the most severe credit crisis since the 1930s rocked global markets with the collapse and troubles of large financial institutions. Massive deleveraging arising from the subprime debacle produced an upheaval in the U.S. financial system and an unprecedented level of intervention by the Federal Reserve (“Fed”) and the Treasury was implemented during the fiscal year. Through the end of 2008, interest rates fell worldwide and yield curves in the U.S., Europe and the U.K. steepened as investors fled to the safety of government bonds, especially shorter maturities.
During 2009, capital flowed back toward riskier assets. Government policy initiatives helped restore a measure of stability to financial markets after the extreme stress and volatility of 2008. Higher U.S. Treasury yields were a drag on economic recovery as they muted the impact of narrower yield and credit premiums for borrowers, especially in the home mortgage market. While some of the weakening in U.S. Treasury valuations could be explained by a reversal of 2008’s flight to liquidity and quality, other factors were in play as well. Investors worried that the massive new issuance of U.S. Treasuries looming on the horizon would overwhelm demand. Another concern was that the Fed’s injection of liquidity into the economy via purchases of U.S. Treasuries and other securities, a tactic known as quantitative easing, would eventually fuel inflation once the economy started to recover.
PERFORMANCE
For the year ended October 31, 2009, Transamerica PIMCO Real Return TIPS Class I returned 21.00%. By comparison, its benchmark, the Barclays Capital Global Real US TIPS Index, returned 17.15%.
STRATEGY REVIEW
An emphasis on shorter maturities in the U.S., U.K., and Euroland added to returns over the past fiscal year as yield curves steepened across all three regions. Overweight nominal duration in the U.S. during the second half of the fiscal year detracted from returns as U.S. yields rose; however, an overweight to nominal duration during the first half of the year partially mitigated the negative effect as yields fell. Favoring inflation-linked bonds (“ILBs”) over nominal securities in Japan added to returns, as real yields fell over the year. In the U.S., an overweight to Treasury Inflation-Protected Securities (“TIPS”) was also positive for performance as they outperformed their nominal counterparts. An allocation to U.S. agency mortgages was positive for returns as these bonds outperformed U.S. Treasuries, as mortgage-backed securities (“MBS”) benefitted from the success of the Fed MBS Purchase Program. Exposure to investment-grade corporates also added to returns as the sector outperformed U.S. Treasuries over the fiscal year; security selection within high-grade financials added further to returns. Beyond core sectors, an allocation to emerging market debt added to returns as the rally in emerging market debt continued through October; spreads over comparable maturity U.S. Treasuries continued to narrow, finishing near the lowest level of the year. Additionally, an allocation to high yield bonds added to returns over the period as the sector outperformed like-duration treasuries. Exposure to municipal bonds also contributed to performance as inflows into municipal funds remained strong and new issue supply was modest.
Mihir Worah
Portfolio Manager
Pacific Investment Management Company LLC
157

Average Annual Total Return for Periods Ended 10/31/2009
| | 1 Year | | 10 Years or
Life of Fund | | Inception Date | |
Class I (NAV) | | 21.00 | % | 5.08 | % | 11/08/2004 | |
Barclays Capital U.S. Global Real TIPS* | | 17.15 | % | 4.83 | % | 11/08/2004 | |
NOTES
* The Barclays Capital Global Real US TIPS (“Barclays Capital U.S. Global Real TIPS”) Index is an unmanaged index used as a general measure of market performance. Calculations assume dividends and capital gains are reinvested and do not include any managerial expenses. The 10 Years or Life of Fund calculation is based on life of the Fund. You cannot invest directly in an Index.
The performance data presented represents past performance; future results may vary. Performance data does not reflect the deduction of taxes that would be paid on fund distributions or the redemption of fund shares. Investment return and principal value will fluctuate so that an investor’s shares, when redeemed, may be worth more or less than their original cost. Current performance may be lower or higher than performance quoted. Please see www.transamericafunds.com for performance data current to the most recent month-end. Net Asset Value (“NAV”) returns include the reinvestment of dividends and capital gains. Fund shares are sold without a sales load.
Performance figures may reflect fee waivers and/or expense reimbursements by the Investment Adviser. Without such waivers and/or reimbursements, the performance would be lower. Future waivers and/or reimbursements are at the discretion of the Investment Adviser.
This material must be preceded or accompanied by a current prospectus, which includes specific contents regarding the investment objectives and policies of this Fund. This Fund is only available in Class I shares, which are not available for direct investment by the public.
158
Transamerica PIMCO Total Return
(unaudited)
MARKET ENVIRONMENT
During the start of the fiscal year most fixed-income securities lost ground along with other financial assets as the most severe credit crisis since the 1930s rocked global markets with the collapse and troubles of large financial institutions. Massive deleveraging arising from the subprime debacle produced an upheaval in the U.S. financial system and an unprecedented level of intervention by the Federal Reserve (“Fed”) and the Treasury was implemented during the fiscal year. Through the end of 2008, interest rates fell worldwide and yield curves in the U.S., Europe and the U.K. steepened as investors fled to the safety of government bonds, especially shorter maturities.
During 2009, capital flowed back toward riskier assets. Government policy initiatives helped restore a measure of stability to financial markets after the extreme stress and volatility of 2008. Higher U.S. Treasury yields were a drag on economic recovery as they muted the impact of narrower yield and credit premiums for borrowers, especially in the home mortgage market. While some of the weakening in U.S. Treasury valuations could be explained by a reversal of 2008’s flight to liquidity and quality, other factors were in play as well. Investors worried that the massive new issuance of U.S. Treasuries looming on the horizon would overwhelm demand. Another concern was that the Fed’s injection of liquidity into the economy via purchases of U.S. Treasuries and other securities, a tactic known as quantitative easing, would eventually fuel inflation once the economy started to recover.
PERFORMANCE
For the year ended October 31, 2009, Transamerica PIMCO Total Return Class I returned 23.74%. By comparison, its benchmark, the Barclays Capital U.S. Aggregate Bond Index, returned 13.79%.
STRATEGY REVIEW
An emphasis on shorter maturities in the U.S., U.K., and Euroland added to returns over the past fiscal year as yield curves steepened across all three regions. U.S. duration positioning detracted from performance over the year as U.S. yields fell in the first half and rose in the second half. An overweight to mortgages was positive for returns as these bonds outperformed U.S. Treasuries, as mortgage-backed securities (“MBS”) benefitted from the success of the Fed MBS Purchase Program. An underweight to investment grade corporates detracted from returns as the sector outperformed U.S. Treasuries over the fiscal year; however security selection within high-grade financials helped mitigate this negative effect. Beyond core sectors, a small allocation to emerging market debt added to returns as the rally in emerging market debt continued through October; spreads over comparable maturity U.S. Treasuries continued to narrow, finishing near the lowest level of the year. Additionally, an allocation to high yield bonds added to returns over the period as the sector outperformed like-duration treasuries, and exposure to municipal bonds also contributed to performance as inflows into municipal funds remained strong and new issue supply was modest.
Chris P. Dialynas
Portfolio Manager
Pacific Investment Management Company LLC
159
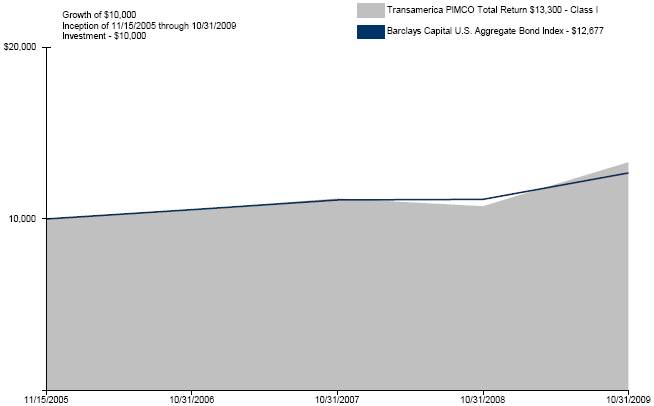
Average Annual Total Return for Periods Ended 10/31/2009
| | 1 Year | | 10 Years or
Life of Fund | | Inception Date | |
Class I (NAV) | | 23.74 | % | 7.46 | % | 11/15/2005 | |
Barclays Capital U.S. Aggregate Bond* | | 13.79 | % | 6.17 | % | 11/15/2005 | |
NOTES
* The Barclays Capital U.S. Aggregate Bond (“Barclays Capital U.S. Aggregate Bond”) Index is an unmanaged index used as a general measure of market performance. Calculations assume dividends and capital gains are reinvested and do not include any managerial expenses. The 10 Years or Life of Fund calculation is based on life of the Fund. You cannot invest directly in an Index.
The performance data presented represents past performance; future results may vary. Performance data does not reflect the deduction of taxes that would be paid on fund distributions or the redemption of fund shares. Investment return and principal value will fluctuate so that an investor’s shares, when redeemed, may be worth more or less than their original cost. Current performance may be lower or higher than performance quoted. Please see www.transamericafunds.com for performance data current to the most recent month-end. Net Asset Value (“NAV”) returns include the reinvestment of dividends and capital gains. Fund shares are sold without a sales load.
Performance figures may reflect fee waivers and/or expense reimbursements by the Investment Adviser. Without such waivers and/or reimbursements, the performance would be lower. Future waivers and/or reimbursements are at the discretion of the Investment Adviser.
This material must be preceded or accompanied by a current prospectus, which includes specific contents regarding the investment objectives and policies of this Fund. This Fund is only available in Class I shares, which are not available for direct investment by the public.
160
Understanding Your Funds’ Expenses
(unaudited)
SHAREHOLDER EXPENSES
Fund shareholders may incur two types of costs: (1) transaction costs, including sales charges (loads) on purchases, contingent deferred sales charges on redemptions; and (2) ongoing costs, including management fees, dividend expense on short-sales, and other fund expenses.
The following examples are intended to help you understand your ongoing costs (in dollars and cents) of investing in the funds and to compare these costs with the ongoing costs of investing in other funds.
The examples are based on an investment of $1,000 invested at May 1, 2009 and held for the entire period until October 31, 2009.
ACTUAL EXPENSES
The information in the table under the heading “Actual Expenses” provides information about actual account values and actual expenses. You may use the information in these columns, together with the amount you invested, to estimate the expenses that you paid over the period. Simply divide your account value by $1,000 (for example, an $8,600 account value divided by $1,000 = $8.60), then multiply the result by the number in the appropriate column for your share class titled “Expenses Paid During Period” to estimate the expenses you paid on your account during this period.
HYPOTHETICAL EXAMPLES FOR COMPARISON PURPOSES
The information in the table under the heading “Hypothetical Expenses” provides information about hypothetical account values and hypothetical expenses based on the funds’ actual expense ratios and an assumed rate of return of 5% per year before expenses, which are not the funds’ actual returns. The hypothetical account values and expenses may not be used to estimate the actual ending account balance or expenses you paid for the period. You may use this information to compare the ongoing costs of investing in the funds versus other funds. To do so, compare this 5% hypothetical example with the 5% hypothetical examples that appear in the shareholder reports of the other funds.
Please note that the expenses shown in the table are meant to highlight your ongoing costs only and do not reflect any transactional costs. Therefore, the information under the heading “Hypothetical Expenses” is useful in comparing ongoing costs only, and will not help you determine the relative total costs of owning different funds. In addition, if these transactional costs were included, your costs would have been higher.
Expense ratios may vary period to period because of various factors, such as an increase in expenses that are not covered by the advisory and administrative fees, such as fees and expenses of the trustees and their counsel, extraordinary expenses and interest expense.
| | | | Actual Expenses | | Hypothetical Expenses (b) | | | |
Fund Name | | Beginning Account Value | | Ending Account
Value | | Expenses Paid
During Period (a) | | Ending Account
Value | | Expenses Paid During Period (a) | | Annualized Expense Ratio | |
Transamerica Clarion Global Real Estate Securities | | $ | 1,000.00 | | $ | 1,359.20 | | $ | 5.47 | | $ | 1,020.57 | | $ | 4.69 | | 0.92 | % |
Transamerica Jennison Growth | | 1,000.00 | | 1,192.30 | | 4.64 | | 1,020.97 | | 4.28 | | 0.84 | % |
Transamerica MFS International Equity | | 1,000.00 | | 1,303.50 | | 6.21 | | 1,019.81 | | 5.45 | | 1.07 | % |
Transamerica PIMCO Real Return TIPS | | 1,000.00 | | 1,104.40 | | 3.87 | | 1,021.53 | | 3.72 | | 0.73 | % |
Transamerica PIMCO Total Return | | 1,000.00 | | 1,145.20 | | 4.00 | | 1,021.48 | | 3.77 | | 0.74 | % |
| | | | | | | | | | | | | | | | | | |
(a) | | Expenses are calculated using the funds’ annualized expense ratios (as disclosed in the table), multiplied by the average account values for the period, multiplied by the number of days in the period (184 days), and divided by the number of days in the year (365 days). |
| | |
(b) | | 5% return per year before expenses. |
161
Schedules of Investments Composition
At October 31, 2009
(The following charts summarize the Schedules of Investments of the funds by asset type)
(unaudited)
Transamerica Clarion Global Real Estate Securities
Common Stock | | 96.7 | % |
Securities Lending Collateral | | 3.7 | |
Repurchase Agreement | | 1.8 | |
Investment Company | | 0.4 | |
Other Assets and Liabilities - Net | | (2.6 | ) |
Total | | 100.0 | % |
Transamerica Jennison Growth
Common Stock | | 99.2 | % |
Repurchase Agreement | | 0.3 | |
Other Assets and Liabilities - Net | | 0.5 | |
Total | | 100.0 | % |
Transamerica MFS International Equity
Common Stock | | 98.2 | % |
Repurchase Agreement | | 1.5 | |
Securities Lending Collateral | | 0.6 | |
Other Assets and Liabilities - Net | | (0.3 | ) |
Total | | 100.0 | % |
Transamerica PIMCO Real Return TIPS
U.S. Government Obligation | | 95.6 | % |
Corporate Debt Securities | | 15.9 | |
Repurchase Agreement | | 1.9 | |
Mortgage-Backed Securities | | 1.5 | |
Certificate of Deposit | | 1.4 | |
Foreign Government Obligations | | 1.1 | |
U.S. Government Agency Obligations | | 0.8 | |
Asset-Backed Securities | | 0.4 | |
Municipal Government Obligations | | 0.3 | |
Loan Assignment | | 0.3 | |
Convertible Preferred Stock | | 0.0 | * |
Other Assets and Liabilities - Net | | (19.2 | )(a) |
Total | | 100.0 | % |
Transamerica PIMCO Total Return
U.S. Government Agency Obligations | | 42.4 | % |
Corporate Debt Securities | | 24.4 | |
U.S. Government Obligations | | 16.6 | |
Mortgage-Backed Securities | | 10.3 | |
Municipal Government Obligations | | 5.4 | |
Asset-Backed Securities | | 3.6 | |
Foreign Government Obligations | | 1.4 | |
Loan Assignments | | 0.9 | |
Convertible Preferred Stocks | | 0.4 | |
Preferred Stocks | | 0.2 | |
Repurchase Agreement | | 0.2 | |
Short-Term U.S. Government Obligations | | 0.2 | |
Securities Lending Collateral | | 0.1 | |
Other Assets and Liabilities - Net | | (6.1 | )(a) |
Total | | 100.0 | % |
(a) The Other Assets and Liabilities - Net category may include, but is not limited to, Forward Currencies Contracts, Futures Contracts, Swap Agreements, Written Options and Swaptions, and Securities Sold Short.
* Amount rounds to less than 0.05% or (0.05)%.
162
Transamerica Clarion Global Real Estate Securities
SCHEDULE OF INVESTMENTS
At October 31, 2009
(all amounts except share amounts in thousands)
| | Shares | | Value | |
COMMON STOCKS - 96.7% | | | | | |
Australia - 11.5% | | | | | |
CFS Retail Property Trust REIT Λ | | 1,020,400 | | $ | 1,753 | |
Dexus Property Group REIT | | 5,341,398 | | 3,774 | |
Goodman Group REIT | | 6,263,255 | | 3,358 | |
GPT Group REIT | | 3,473,868 | | 1,773 | |
ING Office Fund | | 2,833,300 | | 1,495 | |
Lend Lease Corp., Ltd. | | 240,300 | | 1,992 | |
Mirvac Group REIT | | 1,600,451 | | 2,096 | |
Stockland REIT | | 1,524,840 | | 5,065 | |
Westfield Group REIT | | 1,055,443 | | 11,435 | |
Austria - 0.2% | | | | | |
Immoeast AG ‡Λ | | 104,000 | | 549 | |
Bermuda - 2.5% | | | | | |
Great Eagle Holdings, Ltd. | | 192,400 | | 503 | |
Hongkong Land Holdings, Ltd. Λ | | 653,900 | | 3,087 | |
Kerry Properties, Ltd. | | 654,000 | | 3,658 | |
Brazil - 1.3% | | | | | |
BR Malls Participacoes SA ‡ | | 218,700 | | 2,421 | |
PDG Realty SA Empreendimentos e Participacoes | | 142,200 | | 1,203 | |
Canada - 1.1% | | | | | |
Calloway REIT | | 57,700 | | 943 | |
Canadian REIT | | 21,200 | | 501 | |
Primaris Retail REIT | | 47,700 | | 694 | |
RioCan REIT | | 52,000 | | 881 | |
Cayman Islands - 0.7% | | | | | |
KWG Property Holding, Ltd. | | 1,732,500 | | 1,241 | |
Shui On Land, Ltd. | | 1,031,600 | | 625 | |
Finland - 0.1% | | | | | |
Sponda OYJ ‡ | | 60,330 | | 216 | |
France - 7.4% | | | | | |
Gecina SA REIT | | 11,730 | | 1,248 | |
ICADE REIT | | 5,730 | | 603 | |
Klepierre REIT | | 107,744 | | 4,466 | |
Mercialys SA REIT | | 57,721 | | 2,326 | |
Unibail-Rodamco REIT | | 55,920 | | 12,384 | |
Hong Kong - 13.3% | | | | | |
Cheung Kong Holdings, Ltd. | | 895,424 | | 11,421 | |
Hang Lung Group, Ltd. | | 398,848 | | 2,020 | |
Hang Lung Properties, Ltd. | | 866,000 | | 3,267 | |
Henderson Land Development Co., Ltd. | | 318,000 | | 2,250 | |
Link REIT | | 763,300 | | 1,733 | |
Sino Land Co., Ltd. | | 306,700 | | 587 | |
Sun Hung Kai Properties, Ltd. | | 924,145 | | 13,953 | |
Wharf Holdings, Ltd. | | 562,250 | | 3,049 | |
Japan - 12.0% | | | | | |
AEON Mall Co., Ltd. Λ | | 52,600 | | 1,102 | |
Daito Trust Construction Co., Ltd. | | 30,700 | | 1,276 | |
Daiwa House Industry Co., Ltd. | | 254,900 | | 2,723 | |
Frontier Real Estate Investment Corp. REIT Λ | | 193 | | 1,455 | |
Japan Excellent, Inc. -Class A REIT | | 36 | | 169 | |
Japan Logistics Fund, Inc. REIT | | 142 | | 1,079 | |
Japan Real Estate Investment Corp. REIT | | 145 | | 1,157 | |
Japan Retail Fund Investment Corp. REIT Λ | | 57 | | 268 | |
Kenedix Realty Investment Corp. REIT Λ | | 263 | | 754 | |
Mitsubishi Estate Co., Ltd. | | 384,620 | | 5,810 | |
Mitsui Fudosan Co., Ltd. | | 562,246 | | 9,097 | |
Nippon Accommodations Fund, Inc. REIT Λ | | 105 | | 580 | |
Nippon Building Fund, Inc. REIT | | 27 | | 221 | |
NTT Urban Development Corp. | | 343 | | 276 | |
ORIX, Inc. -Class A REIT | | 307 | | 1,406 | |
Sumitomo Realty & Development Co., Ltd. | | 288,900 | | 5,478 | |
Top REIT, Inc. -Class A REIT Λ | | 34 | | 151 | |
United Urban Investment Corp. -Class A REIT | | 196 | | 1,143 | |
Jersey, Channel Island - 0.5% | | | | | |
Atrium European Real Estate, Ltd. ठ| | 216,800 | | 1,384 | |
Luxembourg - 0.3% | | | | | |
Gagfah SA | | 96,750 | | | 920 | |
Netherlands - 1.4% | | | | | |
Corio NV REIT | | 47,032 | | 3,189 | |
Eurocommercial Properties NV REIT | | 21,411 | | 928 | |
Norway - 0.9% | | | | | |
Norwegian Property ASA ‡ | | 1,318,010 | | 2,500 | |
Singapore - 2.6% | | | | | |
Ascendas REIT | | 1,682,039 | | 2,186 | |
Capitaland, Ltd. Λ | | 1,239,550 | | 3,594 | |
CapitaMall Trust REIT ‡Λ | | 724,414 | | 814 | |
City Developments, Ltd. Λ | | 121,000 | | 848 | |
Sweden - 0.4% | | | | | |
Castellum AB | | 128,290 | | 1,194 | |
Switzerland - 0.7% | | | | | |
Swiss Prime Site AG ‡ | | 36,760 | | 2,023 | |
United Kingdom - 7.1% | | | | | |
British Land Co. PLC REIT | | 570,942 | | 4,410 | |
Derwent London PLC REIT | | 31,319 | | 638 | |
Grainger PLC | | 111,160 | | 522 | |
Hammerson PLC REIT | | 444,802 | | 2,950 | |
Helical Bar PLC | | 85,550 | | 464 | |
Land Securities Group PLC REIT | | 700,332 | | 7,577 | |
Liberty International PLC REIT | | 287,009 | | 2,119 | |
Safestore Holdings PLC | | 574,000 | | 1,334 | |
Segro PLC REIT | | 63,355 | | 365 | |
United States - 32.7% | | | | | |
Acadia Realty Trust REIT | | 49,710 | | 790 | |
Alexandria Real Estate Equities, Inc. REIT Λ | | 36,400 | | 1,972 | |
AMB Property Corp. REIT | | 104,600 | | 2,299 | |
Apartment Investment & Management Co. -Class A REIT | | 107,900 | | 1,333 | |
AvalonBay Communities, Inc. | | 39,325 | | 2,705 | |
Boston Properties, Inc. REIT | | 42,900 | | 2,607 | |
BRE Properties, Inc. REIT | | 58,900 | | 1,604 | |
Camden Property Trust REIT | | 54,300 | | 1,968 | |
Corporate Office Properties Trust REIT | | 7,100 | | 236 | |
Digital Realty Trust, Inc. REIT | | 61,600 | | 2,780 | |
Duke Realty Corp. REIT | | 175,400 | | 1,971 | |
Equity Residential REIT | | 51,900 | | 1,499 | |
Essex Property Trust, Inc. REIT | | 14,500 | | 1,090 | |
Extra Space Storage, Inc. REIT | | 65,100 | | 623 | |
Federal Realty Investment Trust REIT | | 32,900 | | 1,942 | |
HCP, Inc. REIT | | 155,200 | | 4,592 | |
Highwoods Properties, Inc. REIT | | 74,300 | | 2,045 | |
Host Hotels & Resorts, Inc. REIT | | 356,443 | | 3,604 | |
Kimco Realty Corp. REIT | | 88,900 | | 1,124 | |
Liberty Property Trust | | 107,500 | | 3,157 | |
Macerich Co. REIT | | 145,025 | | 4,322 | |
Nationwide Health Properties, Inc. REIT | | 131,200 | | 4,231 | |
Omega Healthcare Investors, Inc. REIT | | 80,900 | | 1,226 | |
ProLogis REIT | | 347,700 | | 3,939 | |
Public Storage REIT | | 32,700 | | 2,407 | |
Regency Centers Corp. REIT | | 43,600 | | 1,463 | |
Simon Property Group, Inc. REIT | | 214,575 | | 14,568 | |
SL Green Realty Corp. REIT | | 48,200 | | 1,868 | |
Tanger Factory Outlet Centers REIT | | 55,900 | | 2,128 | |
Taubman Centers, Inc. REIT | | 44,900 | | 1,370 | |
UDR, Inc. REIT | | 192,883 | | 2,774 | |
Ventas, Inc. REIT | | 100,900 | | 4,049 | |
Vornado Realty Trust REIT | | 122,294 | | 7,284 | |
Weingarten Realty Investors REIT | | 107,500 | | 1,989 | |
Total Common Stocks (cost $272,253) | | | | $ | 276,233 | |
The notes to the financial statements are an integral part of this report.
163
| | Shares | | Value | |
INVESTMENT COMPANY - 0.4% | | | | | |
Luxembourg - 0.4% | | | | | |
ProLogis European Properties | | 165,150 | | $ | 1,065 | |
Total Investment Company (cost $781) | | | | | |
| | | | | | |
| | Principal | | | |
REPURCHASE AGREEMENT - 1.8% | | | | | |
State Street Repurchase Agreement 0.01%, dated 10/30/2009, to be repurchased at $5,220 on 11/02/2009. Collateralized by a U.S. Government Agency Obligation, 4.00%, due 12/15/2017, and with a value of $5,329. | | $ | 5,220 | | 5,220 | |
Total Repurchase Agreement (cost $5,220) | | | | | |
| | | | | | |
| | Shares | | | |
SECURITIES LENDING COLLATERAL - 3.7% | | | | | |
State Street Navigator Securities Lending Trust - Prime Portfolio, 0.35% p | | 10,431,464 | | | 10,431 | |
Total Securities Lending Collateral (cost $10,431) | | | | | |
Total Investment Securities (cost $288,685) # | | | | 292,949 | |
Other Assets and Liabilities - Net | | | | (7,447 | ) |
| | | | | |
Net Assets | | | | $ | 285,502 | |
INVESTMENTS BY INDUSTRY (unaudited): | | Percentage of
Total Investments | | Value | |
Real Estate Investment Trusts | | 62.6 | % | $ | 183,646 | |
Real Estate Management & Development | | 31.6 | | 92,587 | |
Capital Markets | | 0.4 | | 1,065 | |
Investment Securities, at Value | | 94.6 | | 277,298 | |
Short-Term Investments | | 5.4 | | 15,651 | |
Total Investments | | 100.0 | % | $ | 292,949 | |
NOTES TO SCHEDULE OF INVESTMENTS:
| | |
Λ | | All or a portion of this security is on loan. The value of all securities on loan is $9,871. |
‡ | | Non-income producing security. |
p | | Rate shown reflects the yield at 10/31/2009. |
§ | | Illiquid. These securities aggregated to $1,384, or 0.48%, of the fund’s net assets. |
# | | Aggregate cost for federal income tax purposes is $307,035. Aggregate gross unrealized appreciation/depreciation for all securities in which there is an excess of value over tax cost were $10,417 and $24,503, respectively. Net unrealized depreciation for tax purposes is $14,086. |
DEFINITION:
REIT | | Real Estate Investment Trust (includes domestic REITs and Foreign Real Estate Investment Companies) |
VALUATION SUMMARY:
Investment Securities | | Level 1 | | Level 2 | | Level 3 | | Total | |
Equities - Consumer Discretionary | | $ | 1,203 | | $ | — | | $ | — | | $ | 1,203 | |
Equities - Financials | | 100,931 | | 174,099 | | — | | 275,030 | |
Investment Company - Financials | | — | | 1,065 | | — | | 1,065 | |
Cash & Cash Equivalent - Repurchase Agreement | | — | | 5,220 | | — | | 5,220 | |
Cash & Cash Equivalent - Securities Lending Collateral | | 10,431 | | — | | — | | 10,431 | |
Total | | $ | 112,565 | | $ | 180,384 | | $ | — | | $ | 292,949 | |
The notes to the financial statements are an integral part of this report.
164
Transamerica Jennison Growth
SCHEDULE OF INVESTMENTS
At October 31, 2009
(all amounts except share amounts in thousands)
| | Shares | | Value | |
COMMON STOCKS - 99.2% | | | | | |
Aerospace & Defense - 1.2% | | | | | |
Precision Castparts Corp. | | 47,300 | | $ | 4,519 | |
United Technologies Corp. | | 50,940 | | 3,130 | |
Auto Components - 0.6% | | | | | |
Johnson Controls, Inc. | | 173,200 | | 4,143 | |
Beverages - 2.1% | | | | | |
PepsiCo, Inc. | | 224,300 | | 13,581 | |
Biotechnology - 5.1% | | | | | |
Celgene Corp. ‡ | | 239,500 | | 12,226 | |
Gilead Sciences, Inc. ‡ | | 410,594 | | 17,471 | |
Vertex Pharmaceuticals, Inc. ‡ | | 118,000 | | 3,960 | |
Capital Markets - 4.4% | | | | | |
Charles Schwab Corp. | | 512,700 | | 8,890 | |
Goldman Sachs Group, Inc. | | 107,500 | | 18,294 | |
Morgan Stanley | | 38,800 | | 1,246 | |
Chemicals - 0.8% | | | | | |
Praxair, Inc. | | 64,600 | | 5,132 | |
Communications Equipment - 5.4% | | | | | |
Cisco Systems, Inc. ‡ | | 709,900 | | 16,221 | |
QUALCOMM, Inc. | | 464,700 | | 19,243 | |
Computers & Peripherals - 9.2% | | | | | |
Apple, Inc. ‡ | | 155,500 | | 29,312 | |
Hewlett-Packard Co. | | 304,800 | | 14,466 | |
International Business Machines Corp. | | 55,600 | | 6,706 | |
NetApp, Inc. ‡ | | 349,100 | | 9,443 | |
Diversified Financial Services - 0.9% | | | | | |
JPMorgan Chase & Co. | | 146,400 | | 6,115 | |
Electronic Equipment & Instruments - 1.1% | | | | | |
Agilent Technologies, Inc. ‡ | | 288,118 | | 7,128 | |
Energy Equipment & Services - 2.9% | | | | | |
Schlumberger, Ltd. | | 208,800 | | 12,987 | |
Weatherford International, Ltd. ‡ | | 346,300 | | 6,071 | |
Food & Staples Retailing - 2.8% | | | | | |
Costco Wholesale Corp. | | 137,900 | | 7,840 | |
CVS Caremark Corp. | | 285,000 | | 10,061 | |
Food Products - 1.2% | | | | | |
Cadbury PLC | | 119,400 | | 1,510 | |
Unilever PLC | | 222,989 | | 6,661 | |
Health Care Equipment & Supplies - 4.2% | | | | | |
Alcon, Inc. | | 107,100 | | 15,292 | |
Baxter International, Inc. | | 226,500 | | 12,245 | |
Health Care Providers & Services - 2.7% | | | | | |
Medco Health Solutions, Inc. ‡ | | 314,500 | | 17,650 | |
Hotels, Restaurants & Leisure - 1.5% | | | | | |
Marriott International, Inc. -Class A | | 245,800 | | 6,159 | |
Starbucks Corp. ‡ | | 194,500 | | 3,692 | |
Household Products - 1.8% | | | | | |
Colgate-Palmolive Co. | | 151,700 | | 11,928 | |
Internet & Catalog Retail - 4.1% | | | | | |
Amazon.com, Inc. ‡ | | 222,800 | | 26,471 | |
Internet Software & Services - 6.5% | | | | | |
Baidu, Inc. ADR ‡ | | 16,349 | | 6,179 | |
Google, Inc. -Class A ‡ | | 60,116 | | 32,229 | |
Tencent Holdings, Ltd. | | 229,000 | | 3,987 | |
IT Services - 5.8% | | | | | |
Mastercard, Inc. -Class A | | 74,400 | | 16,295 | |
Visa, Inc. -Class A | | 286,800 | | 21,728 | |
Life Sciences Tools & Services - 0.4% | | | | | |
Illumina, Inc. ‡ | | 90,700 | | 2,911 | |
Media - 1.7% | | | | | |
Walt Disney Co. | | 407,700 | | 11,159 | |
Multiline Retail - 3.1% | | | | | |
Kohl’s Corp. ‡ | | 190,500 | | 10,900 | |
Target Corp. | | 193,000 | | 9,347 | |
Oil, Gas & Consumable Fuels - 6.5% | | | | | |
Occidental Petroleum Corp. | | 211,300 | | 16,033 | |
Petroleo Brasileiro SA ADR | | 219,400 | | 10,141 | |
Southwestern Energy Co. ‡ | | 236,800 | | 10,320 | |
Suncor Energy, Inc. | | 182,200 | | 6,016 | |
Pharmaceuticals - 8.2% | | | | | |
Abbott Laboratories | | 162,000 | | 8,192 | |
Mylan, Inc. ‡ | | 280,200 | | 4,550 | |
Novartis AG ADR | | 132,000 | | 6,857 | |
Roche Holding AG ADR | | 314,600 | | 12,553 | |
Shire PLC ADR | | 132,060 | | 7,039 | |
Teva Pharmaceutical Industries, Ltd. ADR | | 270,400 | | 13,651 | |
Road & Rail - 1.0% | | | | | |
Union Pacific Corp. | | 122,800 | | 6,771 | |
Semiconductors & Semiconductor Equipment - 1.3% | | | | | |
Advanced Micro Devices, Inc. ‡ | | 579,900 | | 2,668 | |
Analog Devices, Inc. | | 237,500 | | 6,087 | |
Software - 9.5% | | | | | |
Adobe Systems, Inc. ‡ | | 437,900 | | 14,424 | |
Microsoft Corp. | | 850,600 | | 23,588 | |
Oracle Corp. | | 450,000 | | 9,495 | |
Salesforce.com, Inc. ‡ | | 100,600 | | 5,709 | |
SAP AG ADR | | 157,000 | | 7,107 | |
VMware, Inc. -Class A ‡ | | 60,800 | | 2,337 | |
Specialty Retail - 0.7% | | | | | |
Tiffany & Co. | | 110,703 | | 4,350 | |
Textiles, Apparel & Luxury Goods - 2.5% | | | | | |
Coach, Inc. | | 106,650 | | 3,516 | |
Nike, Inc. -Class B | | 209,730 | | 13,041 | |
Total Common Stocks (cost $588,293) | | | | 648,973 | |
| | | | | | |
| | Principal | | | |
REPURCHASE AGREEMENT - 0.3% | | | | | |
State Street Repurchase Agreement 0.01%, dated 10/30/2009, to be repurchased at $2,046 on 11/02/2009. Collateralized by a U.S. Government Obligation, zero coupon, due 04/08/2010, and with a value of $2,089. | | $ | 2,046 | | 2,046 | |
Total Repurchase Agreement (cost $2,046) | | | | | |
| | | | | |
Total Investment Securities (cost $590,339) # | | | | 651,019 | |
Other Assets and Liabilities - Net | | | | 3,591 | |
| | | | | |
Net Assets | | | | $ | 654,610 | |
| | | | | | | |
The notes to the financial statements are an integral part of this report.
165
(all amounts in thousands)
NOTES TO SCHEDULE OF INVESTMENTS:
‡ | | Non-income producing security. |
# | | Aggregate cost for federal income tax purposes is $600,896. Aggregate gross unrealized appreciation/depreciation for all securities in which there is an excess of value over tax cost were $56,566 and $6,443, respectively. Net unrealized appreciation for tax purposes is $50,123. |
DEFINITION:
ADR | | American Depositary Receipt |
VALUATION SUMMARY:
Investment Securities | | Level 1 | | Level 2 | | Level 3 | | Total | |
Equities - Consumer Discretionary | | $ | 92,777 | | $ | — | | $ | — | | $ | 92,777 | |
Equities - Consumer Staples | | 43,410 | | 8,171 | | — | | 51,581 | |
Equities - Energy | | 61,568 | | — | | — | | 61,568 | |
Equities - Financials | | 34,545 | | — | | — | | 34,545 | |
Equities - Health Care | | 134,598 | | — | | — | | 134,598 | |
Equities - Industrials | | 14,420 | | — | | — | | 14,420 | |
Equities - Information Technology | | 231,121 | | 3,988 | | — | | 235,109 | |
Equities - Materials | | 5,132 | | — | | — | | 5,132 | |
Equities - Telecommunication Services | | 19,243 | | — | | — | | 19,243 | |
Cash & Cash Equivalent - Repurchase Agreement | | — | | 2,046 | | — | | 2,046 | |
Total | | $ | 636,814 | | $ | 14,205 | | $ | — | | $ | 651,019 | |
The notes to the financial statements are an integral part of this report.
166
Transamerica MFS International Equity
SCHEDULE OF INVESTMENTS
At October 31, 2009
(all amounts except share amounts in thousands)
| | Shares | | Value | |
COMMON STOCKS - 98.2% | | | | | |
Austria - 0.6% | | | | | |
Erste Group Bank AG Λ | | 58,836 | | $ | 2,365 | |
Bermuda - 0.9% | | | | | |
Li & Fung, Ltd. | | 840,000 | | 3,525 | |
Canada - 2.1% | | | | | |
Canadian National Railway Co. | | 174,423 | | 8,414 | |
Czech Republic - 0.8% | | | | | |
Komercni Banka AS | | 16,346 | | 3,205 | |
France - 20.5% | | | | | |
Air Liquide SA | | 65,178 | | 7,020 | |
AXA SA | | 377,828 | | 9,397 | |
GDF Suez | | 185,969 | | 7,775 | |
Groupe Danone SA | | 103,239 | | 6,202 | |
Legrand SA | | 170,642 | | 4,629 | |
LVMH Moet Hennessy Louis Vuitton SA | | 153,952 | | 15,942 | |
Pernod-Ricard SA | | 84,872 | | 7,070 | |
Schneider Electric SA | | 127,097 | | 13,217 | |
Total SA Λ | | 107,096 | | 6,409 | |
Vivendi | | 139,723 | | 3,876 | |
Germany - 11.8% | | | | | |
Bayer AG | | 146,247 | | 10,148 | |
Beiersdorf AG | | 75,432 | | 4,646 | |
Deutsche Boerse AG | | 78,106 | | 6,326 | |
E.ON AG | | 82,599 | | 3,166 | |
Linde AG | | 132,687 | | 13,926 | |
Merck KGaA | | 57,701 | | 5,424 | |
SAP AG | | 71,776 | | 3,251 | |
Hong Kong - 0.6% | | | | | |
CNOOC, Ltd. | | 1,696,000 | | 2,515 | |
India - 1.5% | | | | | |
Infosys Technologies, Ltd. ADR | | 129,700 | | 5,966 | |
Italy - 0.8% | | | | | |
Intesa Sanpaolo SpA ‡ | | 767,808 | | 3,231 | |
Japan - 10.8% | | | | | |
AEON Credit Service Co., Ltd. | | 208,100 | | 2,004 | |
Canon, Inc. | | 213,600 | | 8,052 | |
Fanuc, Ltd. | | 58,000 | | 4,818 | |
Hirose Electric Co., Ltd. Λ | | 8,700 | | 897 | |
Hoya Corp. | | 331,200 | | 7,289 | |
INPEX Corp. | | 1,017 | | 8,305 | |
KAO Corp. | | 160,000 | | 3,564 | |
Konica Minolta Holdings, Inc. | | 109,500 | | 1,029 | |
Lawson, Inc. | | 40,100 | | 1,793 | |
Shin-Etsu Chemical Co., Ltd. | | 63,800 | | 3,383 | |
Tokyo Electron, Ltd. | | 33,100 | | 1,862 | |
Jersey, Channel Islands - 2.0% | | | | | |
WPP PLC | | 903,527 | | 8,097 | |
Korea, Republic of - 1.4% | | | | | |
Samsung Electronics Co., Ltd. | | 9,236 | | 5,558 | |
Mexico - 1.1% | | | | | |
America Movil SAB de CV -Series L ADR | | 75,230 | | 3,320 | |
Grupo Modelo SAB de CV -Series C ‡ | | 200,600 | | 930 | |
Netherlands - 6.7% | | | | | |
Heineken NV | | 269,415 | | 11,910 | |
TNT NV | | 279,222 | | 7,405 | |
Wolters Kluwer NV | | 318,722 | | 7,105 | |
Singapore - 1.0% | | | | | |
Singapore Telecommunications, Ltd. | | 1,959,150 | | 4,063 | |
South Africa - 0.7% | | | | | |
MTN Group, Ltd. | | 181,791 | | 2,707 | |
Switzerland - 15.8% | | | | | |
Actelion, Ltd. ‡ | | 58,811 | | 3,242 | |
Compagnie Financiere Richemont SA | | 155,469 | | 4,352 | |
Givaudan SA | | 9,843 | | 7,307 | |
Julius Baer Group, Ltd. | | 141,120 | | 5,312 | |
Nestle SA | | 396,120 | | 18,420 | |
Roche Holding AG | | 111,490 | | 17,857 | |
Sonova Holding AG | | 23,427 | | 2,411 | |
Swiss Reinsurance Co., Ltd. | | 31,145 | | 1,268 | |
UBS AG ‡ | | 139,120 | | 2,320 | |
Taiwan - 1.1% | | | | | |
Taiwan Semiconductor Manufacturing Co., Ltd. ADR | | 441,111 | | 4,208 | |
United Kingdom - 15.9% | | | | | |
BHP Billiton PLC | | 76,126 | | 2,051 | |
Burberry Group PLC | | 260,189 | | 2,295 | |
Diageo PLC | | 593,838 | | 9,672 | |
GlaxoSmithKline PLC | | 123,352 | | 2,530 | |
Hays PLC | | 997,270 | | 1,598 | |
HSBC Holdings PLC | | 535,287 | | 5,915 | |
Ladbrokes PLC | | 611,971 | | 1,219 | |
Reckitt Benckiser Group PLC | | 302,856 | | 15,044 | |
Royal Dutch Shell PLC -Class A | | 233,642 | | 6,898 | |
Smiths Group PLC | | 269,113 | | 3,928 | |
Standard Chartered PLC | | 277,272 | | 6,802 | |
Tesco PLC | | 468,171 | | 3,122 | |
William Hill PLC | | 723,374 | | 1,986 | |
United States - 2.1% | | | | | |
Synthes, Inc. | | 70,415 | | 8,353 | |
Total Common Stocks (cost $353,666) | | | | 389,846 | |
| | | | | | |
| | Principal | | | |
REPURCHASE AGREEMENT - 1.5% | | | | | |
State Street Repurchase Agreement 0.01%, dated 10/30/2009, to be repurchased at $5,878 on 11/02/2009. Collateralized by a U.S. Government Agency Obligation, 4.00%, due 12/15/2017, and with a value of $5,996. | | $ | 5,878 | | 5,878 | |
Total Repurchase Agreement (cost $5,878) | | | | | |
| | | | | | |
| | Shares | | | |
SECURITIES LENDING COLLATERAL - 0.6% | | | | | |
State Street Navigator Securities Lending Trust - Prime Portfolio, 0.35% p | | 2,296,479 | | 2,296 | |
Total Securities Lending Collateral (cost $2,296) | | | | | |
Total Investment Securities (cost $361,840) # | | | | 398,020 | |
Other Assets and Liabilities - Net | | | | (1,266 | ) |
| | | | | |
Net Assets | | | | $ | 396,754 | |
| | | | | | |
The notes to the financial statements are an integral part of this report.
167
(all amounts in thousands)
INVESTMENTS BY INDUSTRY (unaudited): | | Percentage of
Total Investments | | Value | |
Pharmaceuticals | | 9.0 | % | $ | 35,959 | |
Chemicals | | 7.9 | | 31,636 | |
Beverages | | 7.3 | | 29,582 | |
Food Products | | 6.3 | | 24,622 | |
Oil, Gas & Consumable Fuels | | 6.0 | | 24,127 | |
Textiles, Apparel & Luxury Goods | | 5.6 | | 22,589 | |
Commercial Banks | | 5.4 | | 21,518 | |
Media | | 4.8 | | 19,078 | |
Household Products | | 4.7 | | 18,608 | |
Electrical Equipment | | 4.4 | | 17,846 | |
Semiconductors & Semiconductor Equipment | | 3.0 | | 11,628 | |
Health Care Equipment & Supplies | | 2.7 | | 10,764 | |
Insurance | | 2.7 | | 10,665 | |
Office Electronics | | 2.2 | | 9,081 | |
Road & Rail | | 2.1 | | 8,414 | |
Electronic Equipment & Instruments | | 2.1 | | 8,186 | |
Multi-Utilities | | 2.0 | | 7,775 | |
Capital Markets | | 1.9 | | 7,632 | |
Air Freight & Logistics | | 1.9 | | 7,405 | |
Diversified Financial Services | | 1.6 | | 6,326 | |
Wireless Telecommunication Services | | 1.6 | | 6,027 | |
IT Services | | 1.5 | | 5,966 | |
Food & Staples Retailing | | 1.3 | | 4,915 | |
Machinery | | 1.2 | | 4,818 | |
Personal Products | | 1.2 | | 4,646 | |
Diversified Telecommunication Services | | 1.0 | | 4,063 | |
Industrial Conglomerates | | 1.0 | | 3,928 | |
Distributors | | 0.9 | | 3,525 | |
Software | | 0.8 | | 3,251 | |
Biotechnology | | 0.8 | | 3,242 | |
Hotels, Restaurants & Leisure | | 0.8 | | 3,205 | |
Electric Utilities | | 0.8 | | 3,166 | |
Metals & Mining | | 0.5 | | 2,051 | |
Consumer Finance | | 0.5 | | 2,004 | |
Professional Services | | 0.4 | | 1,598 | |
Investment Securities, at Value | | 97.9 | | 389,846 | |
Short-Term Investments | | 2.1 | | 8,174 | |
Total Investments | | 100.0 | % | $ | 398,020 | |
NOTES TO SCHEDULE OF INVESTMENTS:
Λ All or a portion of this security is on loan. The value of all securities on loan is $2,186.
‡ Non-income producing security.
p Rate shown reflects the yield at 10/31/2009.
# Aggregate cost for federal income tax purposes is $362,113. Aggregate gross unrealized appreciation/depreciation for all securities in which there is an excess of value over tax cost were $39,466 and $3,559, respectively. Net unrealized appreciation for tax purposes is $35,907.
DEFINITION:
ADR | | American Depositary Receipt |
The notes to the financial statements are an integral part of this report.
168
VALUATION SUMMARY:
Investment Securities | | Level 1 | | Level 2 | | Level 3 | | Total | |
Equities - Consumer Discretionary | | $ | — | | $ | 48,399 | | $ | — | | $ | 48,399 | |
Equities - Consumer Staples | | 2,932 | | 79,443 | | — | | 82,375 | |
Equities - Energy | | — | | 24,126 | | — | | 24,126 | |
Equities - Financials | | 5,312 | | 42,833 | | — | | 48,145 | |
Equities - Health Care | | — | | 49,964 | | — | | 49,964 | |
Equities - Industrials | | 8,414 | | 35,594 | | — | | 44,008 | |
Equities - Information Technology | | 10,174 | | 27,938 | | — | | 38,112 | |
Equities - Materials | | — | | 33,688 | | — | | 33,688 | |
Equities - Telecommunication Services | | 3,320 | | 6,769 | | — | | 10,089 | |
Equities - Utilities | | — | | 10,940 | | — | | 10,940 | |
Cash & Cash Equivalent - Repurchase Agreement | | — | | 5,878 | | — | | 5,878 | |
Cash & Cash Equivalent - Securities Lending Collateral | | 2,296 | | — | | — | | 2,296 | |
Total | | $ | 32,448 | | $ | 365,572 | | $ | — | | $ | 398,020 | |
The notes to the financial statements are an integral part of this report.
169
Transamerica PIMCO Real Return TIPS
SCHEDULE OF INVESTMENTS
At October 31, 2009
(all amounts in thousands)
| | Principal | | Value | |
U.S. GOVERNMENT OBLIGATIONS - 95.6% | | | | | |
U.S. Treasury Inflation Indexed Bond | | | | | |
1.75%, 01/15/2028 | | $ | 2,060 | | $ | 1,983 | |
2.00%, 01/15/2026 | | 30,664 | | 30,937 | |
2.38%, 01/15/2025 - 01/15/2027 | | 92,407 | | 98,077 | |
2.50%, 01/15/2029 | | 9,047 | | 9,735 | |
3.38%, 04/15/2032 | | 608 | | 752 | |
3.63%, 04/15/2028 | | 40,031 | | 49,635 | |
3.88%, 04/15/2029 | | 48,898 | | 63,021 | |
U.S. Treasury Inflation Indexed Note | | | | | |
0.63%, 04/15/2013 | | 1,225 | | 1,236 | |
1.25%, 04/15/2014 | | 1,938 | | 1,990 | |
1.38%, 07/15/2018 | | 6,906 | | 6,936 | |
1.63%, 01/15/2018 | | 14,629 | | 14,985 | |
1.88%, 07/15/2013 - 07/15/2019 | | 100,481 | | 105,246 | |
2.00%, 04/15/2012 - 01/15/2016 | | 131,432 | | 138,167 | |
2.13%, 01/15/2019 | | 804 | | 856 | |
2.38%, 04/15/2011 - 01/15/2017 | | 101,223 | | 106,501 | |
2.50%, 07/15/2016 | | 14,213 | | 15,445 | |
2.63%, 07/15/2017 | | 19,577 | | 21,542 | |
3.00%, 07/15/2012 | | 21,726 | | 23,326 | |
3.38%, 01/15/2012 | | 11,126 | | 11,905 | |
3.50%, 01/15/2011 | | 4,216 | | 4,401 | |
U.S. Treasury Note | | | | | |
0.88%, 04/30/2011 (a) | | 9,587 | | 9,627 | |
1.13%, 06/30/2011 | | 3,300 | | 3,324 | |
3.00%, 08/31/2016 | | 700 | | 703 | |
Total U.S. Government Obligations (cost $680,603) | | | | 720,330 | |
| | | | | |
U.S. GOVERNMENT AGENCY OBLIGATIONS - 0.8% | | | | | |
Fannie Mae | | | | | |
0.39%, 08/25/2034 * | | 131 | | 126 | |
1.96%, 10/01/2044 * | | 67 | | 66 | |
Freddie Mac | | | | | |
0.34%, 02/01/2011 * (b) | | 313 | | 313 | |
0.48%, 02/15/2019 * | | 3,888 | | 3,886 | |
4.50%, 05/15/2017 | | 98 | | 102 | |
5.00%, 02/15/2020 | | 1,532 | | 1,601 | |
Total U.S. Government Agency Obligations (cost $6,067) | | | | 6,094 | |
| | | | | |
FOREIGN GOVERNMENT OBLIGATIONS - 1.1% | | | | | |
Japanese Government CPI Linked Bond | | | | | |
1.20%, 06/10/2017 - 12/10/2017 | | JPY | 589,870 | | 6,063 | |
1.40%, 06/10/2018 | | JPY | 238,320 | | 2,461 | |
Total Foreign Government Obligations (cost $7,269) | | | | 8,524 | |
| | | | | |
MORTGAGE-BACKED SECURITIES - 1.5% | | | | | |
Banc of America Commercial Mortgage, Inc. | | | | | |
Series 2007-5, Class A4 | | | | | |
5.49%, 02/10/2051 | | $ | 530 | | 469 | |
Banc of America Mortgage Securities, Inc. | | | | | |
Series 2004-1, Class 5A1 | | | | | |
6.50%, 09/25/2033 | | 51 | | 52 | |
Bear Stearns Adjustable Rate Mortgage Trust | | | | | |
Series 2005-2, Class A1 | | | | | |
2.86%, 03/25/2035 * | | 947 | | 851 | |
Series 2005-2, Class A2 | | | | | |
2.20%, 03/25/2035 * | | 324 | | 290 | |
Series 2005-5, Class A1 | | | | | |
2.46%, 08/25/2035 * | | 289 | | 256 | |
Series 2005-5, Class A2 | | | | | |
4.55%, 08/25/2035 * | | | 512 | | | 455 | |
Citigroup Mortgage Loan Trust, Inc. | | | | | |
Series 2005-11, Class A1A | | | | | |
2.81%, 12/25/2035 * | | 44 | | 40 | |
Series 2005-6, Class A1 | | | | | |
2.51%, 08/25/2035 * | | 344 | | 325 | |
Series 2005-6, Class A2 | | | | | |
4.25%, 08/25/2035 * | | 455 | | 408 | |
Series 2005-6, Class A3 | | | | | |
4.10%, 08/25/2035 * | | 70 | | 62 | |
Citigroup/Deutsche Bank Commercial Mortgage Trust | | | | | |
Series 2007-CD5, Class A4 | | | | | |
5.89%, 11/15/2044 | | 400 | | 395 | |
Countrywide Home Loan Mortgage Pass-Through Trust | | | | | |
Series 2005-3, Class 1A2 | | | | | |
0.53%, 04/25/2035 * | | 1,202 | | 651 | |
Series 2005-R2, Class 1AF1 | | | | | |
0.58%, 06/25/2035 -144A * | | 313 | | 215 | |
Greenpoint Mortgage Funding Trust | | | | | |
Series 2005-AR1, Class A2 | | | | | |
0.46%, 06/25/2045 * | | 511 | | 270 | |
GSR Mortgage Loan Trust | | | | | |
Series 2005-AR6, Class 2A1 | | | | | |
3.94%, 09/25/2035 * | | 897 | | 801 | |
JPMorgan Chase Commercial Mortgage Securities Corp. | | | | | |
Series 2006-CB17, Class A4 | | | | | |
5.43%, 12/12/2043 | | 510 | | 494 | |
LB-UBS Commercial Mortgage Trust | | | | | |
Series 2007-C7, Class A3 | | | | | |
5.87%, 09/15/2045 | | 200 | | 182 | |
Master Alternative Loans Trust | | | | | |
Series 2006-2, Class 2A1 | | | | | |
0.64%, 03/25/2036 * | | 907 | | 439 | |
Merrill Lynch/Countrywide Commercial Mortgage Trust | | | | | |
Series 2007-9, Class A4 | | | | | |
5.70%, 09/12/2049 | | 300 | | 251 | |
Morgan Stanley Capital I | | | | | |
Series 2007-IQ15, Class A4 | | | | | |
5.88%, 06/11/2049 | | 1,200 | | 1,104 | |
Residential Accredit Loans, Inc. | | | | | |
Series 2006-QO6, Class A1 | | | | | |
0.42%, 06/25/2046 * | | 1,336 | | 525 | |
Sequoia Mortgage Trust | | | | | |
Series 5, Class A | | | | | |
0.60%, 10/19/2026 * | | 148 | | 112 | |
Structured Asset Mortgage Investments, Inc. | | | | | |
Series 2006-AR5, Class 1A1 | | | | | |
0.45%, 05/25/2046 * | | 1,134 | | 642 | |
Wachovia Bank Commercial Mortgage Trust | | | | | |
Series 2006-C23, Class A4 | | | | | |
5.42%, 01/15/2045 | | 720 | | 687 | |
Series 2006-C28, Class A4 | | | | | |
5.57%, 10/15/2048 | | 400 | | 388 | |
WaMu Mortgage Pass Through Certificates | | | | | |
Series 2003-AR9, Class 2A | | | | | |
2.88%, 09/25/2033 * | | 881 | | 820 | |
Total Mortgage-Backed Securities (cost $12,421) | | | | 11,184 | |
| | | | | | | | |
The notes to the financial statements are an integral part of this report.
170
| | Principal | | Value | |
ASSET-BACKED SECURITIES - 0.4% | | | | | |
CSAB Mortgage Backed Trust | | | | | |
Series 2006-1, Class A6A | | | | | |
6.17%, 06/25/2036 | | $ | 1,282 | | $ | 634 | |
Equity One, Inc. | | | | | |
Series 2004-1, Class AV2 | | | | | |
0.54%, 04/25/2034 * | | 48 | | 30 | |
Ford Credit Auto Owner Trust | | | | | |
Series 2009-D, Class A1 | | | | | |
0.36%, 09/15/2010 -144A | | 1,443 | | 1,443 | |
GSAMP Trust | | | | | |
Series 2004-SEA2, Class A2A | | | | | |
0.53%, 03/25/2034 * | | 7 | | 7 | |
Morgan Stanley Mortgage Loan Trust | | | | | |
Series 2006-12XS, Class A6A | | | | | |
5.73%, 10/25/2036 | | 498 | | 275 | |
Small Business Administration | | | | | |
Series 2004-P10A, Class 1 | | | | | |
4.50%, 02/01/2014 | | 365 | | 376 | |
Truman Capital Mortgage Loan Trust | | | | | |
Series 2004-1, Class A1 | | | | | |
0.58%, 01/25/2034 -144A * | | 6 | | 6 | |
Total Asset-Backed Securities (cost $3,276) | | | | 2,771 | |
| | | | | |
MUNICIPAL GOVERNMENT OBLIGATIONS - 0.3% | | | | | |
Buckeye Tobacco Settlement Financing Authority | | | | | |
5.88%, 06/01/2047 | | 500 | | 369 | |
State of California | | | | | |
5.00%, 11/01/2037 | | 600 | | 550 | |
Tobacco Settlement Financing Corp. | | | | | |
6.00%, 06/01/2023 | | 460 | | 463 | |
7.47%, 06/01/2047 | | 675 | | 534 | |
Total Municipal Government Obligations (cost $2,144) | | | | 1,916 | |
| | | | | |
CORPORATE DEBT SECURITIES - 15.9% | | | | | |
Capital Markets - 2.6% | | | | | |
Goldman Sachs Group, Inc. | | | | | |
0.58%, 06/28/2010 * | | 3,000 | | 3,003 | |
0.74%, 03/22/2016 * | | 5,455 | | 5,010 | |
6.60%, 01/15/2012 | | 500 | | 544 | |
Morgan Stanley - Series MTN | | | | | |
0.53%, 01/09/2012 * | | 200 | | 196 | |
Morgan Stanley | | | | | |
0.58%, 01/09/2014 * | | 700 | | 661 | |
0.73%, 10/18/2016 * | | 800 | | 721 | |
2.55%, 05/14/2010 * | | 9,400 | | 9,499 | |
Commercial Banks - 3.6% | | | | | |
ANZ National International, Ltd./New Zealand | | | | | |
6.20%, 07/19/2013 -144A | | 1,700 | | 1,858 | |
ANZ National Int’l Ltd./London | | | | | |
0.87%, 08/19/2014 -144A * | | 2,000 | | 2,018 | |
Bank of Scotland PLC | | | | | |
4.88%, 04/15/2011 Reg S § | | 1,100 | | 1,141 | |
Credit Suisse/New York NY | | | | | |
5.00%, 05/15/2013 | | 6,900 | | 7,365 | |
HBOS PLC | | | | | |
6.75%, 05/21/2018 -144A | | 1,000 | | 923 | |
National Australia Bank, Ltd. | | | | | |
5.35%, 06/12/2013 -144A | | 1,400 | | 1,500 | |
Royal Bank of Scotland Group PLC | | | | | |
7.09%, 09/29/2017 Ž ■ | | EUR | 300 | | 203 | |
Wachovia Bank NA | | | | | |
0.42%, 12/02/2010 * | | $ | 1,200 | | | 1,196 | |
1.35%, 05/14/2010 * | | 7,300 | | 7,333 | |
Wachovia Corp. | | | | | |
0.41%, 04/23/2012 * | | 1,100 | | 1,076 | |
Wells Fargo & Co. | | | | | |
7.98%, 03/15/2018 Ž ■ | | 1,500 | | 1,404 | |
Wells Fargo Capital XIII | | | | | |
7.70%, 03/26/2013 Ž ■ | | 800 | | 744 | |
Computers & Peripherals - 0.4% | | | | | |
Hewlett-Packard Co. | | | | | |
2.25%, 05/27/2011 | | 3,100 | | 3,160 | |
Consumer Finance - 0.3% | | | | | |
American Express Credit Corp. | | | | | |
1.64%, 05/27/2010 * | | 2,600 | | 2,610 | |
Diversified Financial Services - 5.1% | | | | | |
Citigroup Capital XXI | | | | | |
8.30%, 12/21/2057 ■ | | 800 | | 740 | |
Citigroup Funding, Inc. | | | | | |
1.33%, 05/07/2010 * | | 6,600 | | 6,618 | |
Citigroup, Inc. | | | | | |
0.52%, 05/18/2011 * | | 1,500 | | 1,471 | |
Ford Motor Credit Co. LLC | | | | | |
7.25%, 10/25/2011 | | 1,950 | | 1,913 | |
7.80%, 06/01/2012 | | 150 | | 147 | |
General Electric Capital Corp. | | | | | |
0.29%, 12/21/2012 * | | 2,800 | | 2,801 | |
2.63%, 12/28/2012 | | 7,000 | | 7,188 | |
Green Valley, Ltd. | | | | | |
4.34%, 01/10/2011 -144A * § | | EUR | 300 | | 425 | |
JPMorgan Chase & Co. | | | | | |
5.38%, 10/01/2012 | | $ | 400 | | 437 | |
Longpoint Re, Ltd. | | | | | |
5.55%, 05/08/2010 -144A * § | | 600 | | 605 | |
Macquarie Bank, Ltd. | | | | | |
3.30%, 07/17/2014 -144A | | 7,200 | | 7,296 | |
Metropolitan Life Global Funding I | | | | | |
2.20%, 06/10/2011 -144A * | | 7,000 | | 6,989 | |
Mystic Re, Ltd. | | | | | |
10.36%, 06/07/2011 -144A * § | | 1,000 | | 1,023 | |
Vita Capital III, Ltd. | | | | | |
1.41%, 01/01/2012 -144A * § | | 400 | | 365 | |
Health Care Providers & Services - 0.8% | | | | | |
Roche Holdings, Inc. | | | | | |
2.39%, 02/25/2011 -144A * | | 6,400 | | 6,564 | |
Household Durables - 0.5% | | | | | |
Black & Decker Corp. | | | | | |
8.95%, 04/15/2014 | | 3,000 | | 3,540 | |
Insurance - 2.1% | | | | | |
AIG SunAmerica Life Assurance Company | | | | | |
0.43%, 07/26/2010 * | | 2,500 | | 2,364 | |
American International Group, Inc. | | | | | |
8.18%, 05/15/2058 ■ | | 3,650 | | 2,190 | |
8.63%, 05/22/2038 Reg S ■ | | GBP | 500 | | 455 | |
Foundation RE II, Ltd. | | | | | |
7.19%, 11/26/2010 -144A * § | | $ | 500 | | 495 | |
Marsh & McLennan Cos., Inc. | | | | | |
5.75%, 09/15/2015 | | 6,000 | | 6,321 | |
New York Life Global Funding | | | | | |
4.65%, 05/09/2013 -144A | | 1,600 | | 1,691 | |
| | | | | | | | | |
The notes to the financial statements are an integral part of this report.
171
(all amounts except shares amounts in thousands)
| | Principal | | Value | |
Insurance - (continued) | | | | | |
Pacific Life Global Funding | | | | | |
5.15%, 04/15/2013 -144A | | $ | 500 | | $ | 524 | |
Residential Reinsurance 2007, Ltd. | | | | | |
7.61%, 06/07/2010 -144A * § | | 1,600 | | 1,621 | |
Oil, Gas & Consumable Fuels - 0.1% | | | | | |
GAZ Capital SA | | | | | |
7.34%, 04/11/2013 -144A | | 300 | | 315 | |
8.15%, 04/11/2018 -144A | | 400 | | 422 | |
Road & Rail - 0.3% | | | | | |
CSX Corp. | | | | | |
6.25%, 03/15/2018 | | 2,000 | | 2,180 | |
Thrifts & Mortgage Finance - 0.1% | | | | | |
Countrywide Home Loans, Inc. | | | | | |
4.00%, 03/22/2011 | | 500 | | 510 | |
Total Corporate Debt Securities (cost $115,133) | | | | 119,375 | |
| | | | | | | |
| | Shares | | | |
CONVERTIBLE PREFERRED STOCK - 0.0% | | | | | |
Commercial Banks - 0.0% | | | | | |
Wells Fargo & Co. 7.50% p | | 400 | | 358 | |
Total Convertible Preferred Stock (cost $400) | | | | | |
| | Principal | | | |
LOAN ASSIGNMENT - 0.3% | | | | | |
Automobiles - 0.3% | | | | | |
DaimlerChrysler Finance Co. | | | | | |
4.32%, 08/03/2012 * | | $ | 2,247 | | | 2,144 | |
Total Loan Assignment (cost $2,134) | | | | | |
| | | | | |
CERTIFICATE OF DEPOSIT - 1.4% | | | | | |
Diversified Financial Services - 1.4% | | | | | |
Barclays Bank PLC | | | | | |
1.11% 03/22/2011 | | 10,600 | | 10,600 | |
Total Certificate of Deposit (cost $10,600) | | | | | |
| | | | | |
REPURCHASE AGREEMENT - 1.9% | | | | | |
U.S. Treasury Repurchase Agreement 0.08%, dated 10/30/2009, to be repurchased at $14,000 on 11/02/2009. Collateralized by a U.S. Government Agency Obligation, 4.88%, due 06/13/2018, and with a value of $14,133. | | 14,000 | | 14,000 | |
Total Repurchase Agreement (cost $14,000) | | | | | |
| | | | | |
Total Investment Securities (cost $854,047) # | | | | 897,296 | |
Other Assets and Liabilities - Net | | | | (144,573 | ) |
| | | | | | |
Net Assets | | | | $ | 752,723 | |
| | | | | | | |
WRITTEN SWAPTIONS:
Description | | Floating Rate Index | | Pay/Receivable
Floating Rate | | Exercise
Rate | | Expiration
Date | | Notional Amount | | Premiums
Received | | Value | |
Call - Interest Rate Swap, European Style | | 10-Year IRO RYL | | Receive | | $ | 3.00 | | 11/23/2009 | | $ | 10,000 | | $ | 63 | | $ | (3 | ) |
Put - Interest Rate Swap, European Style | | 5-Year IRO USD | | Receive | | 3.42 | | 11/23/2009 | | 1,000 | | 10 | | ♦ | |
Put - Interest Rate Swap, European Style | | 5-Year IRO USD | | Receive | | 3.42 | | 11/23/2009 | | 1,100 | | 4 | | ♦ | |
Put - Interest Rate Swap, European Style | | 5-Year IRO USD | | Receive | | 3.75 | | 11/23/2009 | | 30,000 | | 255 | | ♦ | |
Put - Interest Rate Swap, European Style | | 5-Year IRO USD | | Receive | | 3.75 | | 11/23/2009 | | 41,000 | | 404 | | ♦ | |
Put - Interest Rate Swap, European Style | | 5-Year IRO USD | | Receive | | 3.75 | | 11/23/2009 | | 5,000 | | 44 | | ♦ | |
Put - Interest Rate Swap, European Style | | 7-Year IRO USD | | Receive | | 4.00 | | 11/23/2009 | | 4,000 | | 21 | | ♦ | |
Put - Interest Rate Swap, European Style | | 7-Year IRO USD | | Receive | | 4.00 | | 11/23/2009 | | 23,000 | | 267 | | (2 | ) |
Put - Interest Rate Swap, European Style | | 7-Year IRO USD | | Receive | | 4.00 | | 11/23/2009 | | 10,000 | | 110 | | (1 | ) |
Put - Interest Rate Swap, European Style | | 10-Year IRO RYL | | Receive | | 4.25 | | 12/29/2009 | | 2,900 | | 18 | | (11 | ) |
Put - Interest Rate Swap, European Style | | 10-Year IRO USD | | Receive | | 4.35 | | 11/23/2009 | | 700 | | 3 | | ♦ | |
Put - Interest Rate Swap, European Style | | OTC USD vs RYL | | Receive | | 5.37 | | 09/20/2010 | | 8,000 | | 159 | | (58 | ) |
Put - Interest Rate Swap, European Style | | 5-Year IRO USD | | Receive | | 5.50 | | 08/31/2010 | | 7,000 | | 75 | | (21 | ) |
Put - Interest Rate Swap, European Style | | 7-Year IRO USD | | Receive | | 6.00 | | 08/31/2010 | | 500 | | 4 | | (2 | ) |
| | | | | | | | | | | | $ | 1,437 | | $ | (98 | ) |
| | | | | | | | | | | | | | | | | | | |
SWAP AGREEMENTS: (c)
CREDIT DEFAULT SWAPS ON CORPORATE AND SOVEREIGN ISSUES - BUY PROTECTION: (1)
Reference Obligation | | Fixed
Deal Pay
Rate | | Maturity
Date | | Counterparty | | Implied Credit
Spread at
10/31/2009 (3) | | Notional
Amount (4) | | Market
Value | | Premiums
Paid(Received) | | Unrealized
(Depreciation) | |
Black and Decker Corp., 8.95%, 04/15/2014 | | 2.20 | % | 06/20/2014 | | CBK | | $ | 102.32 | | $ | 3,000 | | $ | (162 | ) | $ | — | | $ | (162 | ) |
CSX Corp., 6.25%, 03/15/2018 | | 1.40 | % | 03/20/2018 | | BRC | | 68.76 | | 2,000 | | (114 | ) | — | | (114 | ) |
Marsh & McLennan Cos., Inc., 5.75%, 09/15/2015 | | 0.76 | % | 09/20/2015 | | BRC | | 61.14 | | 6,000 | | (64 | ) | — | | (64 | ) |
| | | | | | | | | | | | $ | (340 | ) | $ | — | | $ | (340 | ) |
| | | | | | | | | | | | | | | | | | | | | | |
The notes to the financial statements are an integral part of this report.
172
(all amounts in thousands)
CREDIT DEFAULT SWAPS ON CORPORATE AND SOVEREIGN ISSUES - SELL PROTECTION: (2)
Reference Obligation | | Fixed Deal
Receive Rate | | Maturity
Date | | Counterparty | | Implied
Credit
Spread at
10/31/2009 (3) | | Notional
Amount (4) | | Market
Value | | Premiums
(Received) | | Unrealized
Appreciation
(Depreciation) | |
American International Group, Inc., 6.25%, 05/01/2036 | | 5.00 | % | 12/20/2013 | | DUB | | $ | 759.63 | | $ | 6,500 | | $ | (535 | ) | $ | (542 | ) | $ | 7 | |
General Electric Capital Corp., 5.63%, 09/15/2017 | | 3.73 | % | 12/20/2013 | | CBK | | 193.26 | | 1,900 | | 147 | | — | | 147 | |
General Electric Capital Corp., 6.00%, 06/15/2012 | | 1.01 | % | 03/20/2013 | | BRC | | 191.08 | | 2,800 | | (66 | ) | — | | (66 | ) |
| | | | | | | | | | | | $ | (454 | ) | $ | (542 | ) | $ | 88 | |
| | | | | | | | | | | | | | | | | | | | | | |
CREDIT DEFAULT SWAPS ON CREDIT INDICES - BUY PROTECTION: (1)
Reference Obligation | | Fixed Deal
Pay Rate | | Maturity Date | | Counterparty | | Notional Amount
(4) | | Market
Value (5) | | Premiums Paid | | Unrealized
(Depreciation) | |
CDX.NA.HY.12 § | | 5.00 | % | 06/20/2014 | | MYC | | $ | 1,222 | | $ | 58 | | $ | 65 | | $ | (7 | ) |
CDX.NA.HY.12 § | | 5.00 | % | 06/20/2014 | | UAG | | 7,520 | | 357 | | 446 | | (89 | ) |
CDX.NA.HY.12 § | | 5.00 | % | 06/20/2014 | | BOA | | 658 | | 31 | | 31 | | ♦ | |
CDX.NA.HY.12 § | | 5.00 | % | 06/20/2014 | | DUB | | 6,298 | | 299 | | 302 | | (3 | ) |
CDX.NA.IG.12 § | | 1.00 | % | 06/20/2014 | | DUB | | 6,200 | | 30 | | 149 | | (119 | ) |
CDX.NA.IG.12 § | | 1.00 | % | 06/20/2014 | | GST | | 5,300 | | 26 | | 152 | | (126 | ) |
| | | | | | | | | | $ | 801 | | $ | 1,145 | | $ | (344 | ) |
| | | | | | | | | | | | | | | | | | | |
INTEREST RATE SWAP AGREEMENTS - RECEIVABLE:
Floating Rate Index | | Fixed
Rate | | Maturity Date | | Counterparty | | Currency
Code | | Notional
Amount | | Market
Value | | Premiums
Paid(Received) | | Unrealized
Appreciation | |
BRL-CDI | | 14.77 | % | 01/02/2012 | | MLC | | BRL | | $ | 1,100 | | $ | 47 | | $ | 2 | | $ | 45 | |
BRL-CDI | | 14.77 | % | 01/02/2012 | | HUS | | BRL | | 200 | | 9 | | 1 | | 8 | |
FRC - Excluding Tobacco-Non-Revised CPI | | 2.10 | % | 10/15/2010 | | BRC | | EUR | | 5,000 | | 302 | | (2 | ) | 304 | |
FRC - Excluding Tobacco-Non-Revised CPI | | 2.04 | % | 02/21/2011 | | BPS | | EUR | | 5,500 | | 307 | | — | | 307 | |
FRC - Excluding Tobacco-Non-Revised CPI | | 2.03 | % | 10/15/2011 | | JPM | | EUR | | 1,400 | | 72 | | — | | 72 | |
| | | | | | | | | | | | $ | 737 | | $ | 1 | | $ | 736 | |
| | | | | | | | | | | | | | | | | | | | | |
INTEREST RATE SWAP AGREEMENTS - PAYABLE:
Floating Rate Index | | Fixed
Rate | | Maturity Date | | Counterparty | | Currency
Code | | Notional
Amount | | Market
Value | | Premiums
Paid(Received) | | Unrealized
Appreciation
(Depreciation) | |
3-month USD-LIBOR | | 2.35 | % | 10/15/2016 | | JPM | | EUR | | $ | 1,100 | | $ | (16 | ) | $ | — | | $ | (16 | ) |
6-month GBP-LIBOR | | 5.00 | % | 09/15/2010 | | RYL | | GBP | | 3,300 | | 220 | | (87 | ) | 307 | |
6-month GBP-LIBOR | | 5.00 | % | 09/15/2010 | | FBF | | GBP | | 3,400 | | 227 | | (92 | ) | 319 | |
6-month GBP-LIBOR | | 4.50 | % | 03/18/2011 | | GLM | | EUR | | 3,300 | | 280 | | (4 | ) | 284 | |
BRL-CDI | | 12.41 | % | 01/04/2010 | | UAG | | BRL | | 1,300 | | 19 | | 1 | | 18 | |
BRL-CDI | | 10.68 | % | 01/02/2012 | | BRC | | BRL | | 14,800 | | (209 | ) | (85 | ) | (124 | ) |
BRL-CDI | | 10.58 | % | 01/02/2012 | | UAG | | BRL | | 13,000 | | (212 | ) | (2 | ) | (210 | ) |
BRL-CDI | | 10.12 | % | 01/02/2012 | | MYC | | BRL | | 3,000 | | (79 | ) | (17 | ) | (62 | ) |
FRC - Excluding Tobacco-Non-Revised CPI | | 2.10 | % | 10/15/2011 | | UAG | | EUR | | 3,600 | | 205 | | — | | 205 | |
FRC - Excluding Tobacco-Non-Revised CPI | | 1.99 | % | 12/15/2011 | | BPS | | EUR | | 2,900 | | 116 | | — | | 116 | |
| | | | | | | | | | | | $ | 551 | | $ | (286 | ) | $ | 837 | |
| | | | | | | | | | | | | | | | | | | | | |
FUTURES CONTRACTS:
Description | | Contracts Г | | Expiration Date | | Net Unrealized
Appreciation
(Depreciation) | |
3-Month EURIBOR | | 32 | | 12/13/2010 | | $ | 23 | |
3-Month EURIBOR | | 76 | | 09/13/2010 | | 88 | |
3-Month EURIBOR | | 29 | | 06/14/2010 | | 51 | |
3-Month Pound Sterling | | 174 | | 06/16/2010 | | 265 | |
90-Day Euro | | 191 | | 12/14/2009 | | 215 | |
90-Day Euro | | 128 | | 06/14/2010 | | 153 | |
90-Day Euro | | 158 | | 03/15/2010 | | 221 | |
| | | | | | $ | 1,016 | |
The notes to the financial statements are an integral part of this report.
173
FORWARD FOREIGN CURRENCY CONTRACTS:
Currency | | Bought (Sold) | | Settlement
Date | | Amount in U.S.
Dollars Bought
(Sold) | | Net Unrealized
Appreciation
(Depreciation) | |
Australian Dollar | | (150 | ) | 11/30/2009 | | $ | (137 | ) | $ | 2 | |
Brazilian Real | | 732 | | 02/02/2010 | | 400 | | 8 | |
Chinese Yuan Renminbi | | 9,723 | | 03/29/2010 | | 1,437 | | (13 | ) |
Chinese Yuan Renminbi | | 247 | | 03/29/2010 | | 36 | | ♦ | |
Chinese Yuan Renminbi | | 1,172 | | 03/29/2010 | | 174 | | (2 | ) |
Chinese Yuan Renminbi | | 16 | | 03/29/2010 | | 2 | | ♦ | |
Chinese Yuan Renminbi | | 2 | | 03/29/2010 | | ♦ | | ♦ | |
Chinese Yuan Renminbi | | 1,753 | | 03/29/2010 | | 260 | | (3 | ) |
Chinese Yuan Renminbi | | 1,687 | | 03/29/2010 | | 249 | | (2 | ) |
Chinese Yuan Renminbi | | 4,138 | | 03/29/2010 | | 614 | | (7 | ) |
Chinese Yuan Renminbi | | 3,196 | | 06/07/2010 | | 470 | | (1 | ) |
Chinese Yuan Renminbi | | 3,901 | | 06/07/2010 | | 575 | | (2 | ) |
Chinese Yuan Renminbi | | 9,936 | | 06/07/2010 | | 1,465 | | (5 | ) |
Euro | | (1,460 | ) | 12/08/2009 | | (2,133 | ) | (15 | ) |
Japanese Yen | | 558,531 | | 11/17/2009 | | 6,229 | | (23 | ) |
Japanese Yen | | (1,545,888 | ) | 11/17/2009 | | (17,274 | ) | 98 | |
Japanese Yen | | 477,699 | | 11/24/2009 | | 5,202 | | 107 | |
Japanese Yen | | (282,851 | ) | 11/24/2009 | | (3,133 | ) | (10 | ) |
Malaysian Ringgit | | 16 | | 11/12/2009 | | 5 | | ♦ | |
Malaysian Ringgit | | 20 | | 11/12/2009 | | 6 | | ♦ | |
Malaysian Ringgit | | (10 | ) | 11/12/2009 | | (3 | ) | ♦ | |
Malaysian Ringgit | | (10 | ) | 11/12/2009 | | (3 | ) | ♦ | |
Malaysian Ringgit | | 13 | | 11/12/2009 | | 4 | | ♦ | |
Malaysian Ringgit | | (10 | ) | 11/12/2009 | | (3 | ) | ♦ | |
Malaysian Ringgit | | 23 | | 11/12/2009 | | 6 | | ♦ | |
Malaysian Ringgit | | 18 | | 11/12/2009 | | 5 | | ♦ | |
Malaysian Ringgit | | (10 | ) | 11/12/2009 | | (3 | ) | ♦ | |
Malaysian Ringgit | | 10 | | 02/12/2010 | | 3 | | ♦ | |
Malaysian Ringgit | | 10 | | 02/12/2010 | | 3 | | ♦ | |
Malaysian Ringgit | | 10 | | 02/12/2010 | | 3 | | ♦ | |
Malaysian Ringgit | | 10 | | 02/12/2010 | | 3 | | ♦ | |
Malaysian Ringgit | | 3 | | 02/12/2010 | | 1 | | ♦ | |
Mexican Peso | | 16,084 | | 11/27/2009 | | 1,200 | | 14 | |
Mexican Peso | | 5,319 | | 11/27/2009 | | 400 | | 1 | |
Mexican Peso | | (70,562 | ) | 11/27/2009 | | (5,430 | ) | 105 | |
Mexican Peso | | (183 | ) | 11/27/2009 | | (12 | ) | (2 | ) |
Mexican Peso | | 19,104 | | 11/27/2009 | | 1,400 | | 42 | |
Mexican Peso | | 19,058 | | 11/27/2009 | | 1,400 | | 38 | |
Mexican Peso | | 183 | | 11/27/2009 | | 13 | | 1 | |
Mexican Peso | | 16,315 | | 11/27/2009 | | 1,200 | | 31 | |
Mexican Peso | | 70,562 | | 04/22/2010 | | 5,320 | | (100 | ) |
Philippines Peso | | 588 | | 11/16/2009 | | 13 | | ♦ | |
Philippines Peso | | (588 | ) | 11/16/2009 | | (12 | ) | ♦ | |
Philippines Peso | | (588 | ) | 04/16/2010 | | (12 | ) | ♦ | |
Pound Sterling | | (1,100 | ) | 11/06/2009 | | (1,820 | ) | 15 | |
Pound Sterling | | 1,583 | | 11/24/2009 | | 2,623 | | (26 | ) |
Pound Sterling | | (1,731 | ) | 01/27/2010 | | (2,830 | ) | (10 | ) |
Republic of Korea Won | | 713,400 | | 11/18/2009 | | 600 | | 5 | |
Republic of Korea Won | | (96,000 | ) | 11/18/2009 | | (81 | ) | ♦ | |
Republic of Korea Won | | 716,400 | | 11/18/2009 | | 600 | | 8 | |
Republic of Korea Won | | 896,550 | | 02/11/2010 | | 750 | | 15 | |
Republic of Korea Won | | 893,250 | | 02/11/2010 | | 750 | | 12 | |
Republic of Korea Won | | 763,425 | | 02/11/2010 | | 650 | | 1 | |
Republic of Korea Won | | 1,447,320 | | 02/11/2010 | | 1,200 | | 34 | |
Republic of Korea Won | | 761,280 | | 02/11/2010 | | 650 | | (1 | ) |
Republic of Korea Won | | 96,000 | | 07/28/2010 | | 81 | | 1 | |
Republic of Korea Won | | 601,400 | | 07/28/2010 | | 500 | | 16 | |
Swiss Franc | | (640 | ) | 12/21/2009 | | (621 | ) | (3 | ) |
| | | | | | | | $ | 329 | |
| | | | | | | | | | | |
The notes to the financial statements are an integral part of this report.
174
NOTES TO SCHEDULE OF INVESTMENTS:
* | Floating or variable rate note. Rate is listed as of 10/31/2009. |
Ž | The security has a perpetual maturity. The date shown is the next call date. |
■ | Coupon rate is fixed for a predetermined period of time and then converts to a floating rate until maturity/call date. Rate is listed as of 10/31/2009. |
p | Rate shown reflects the yield at 10/31/2009. |
§ | Illiquid. These securities aggregated to $5,675, or 0.75%; and illiquid derivatives aggregated to $801, or 0.11%, of the fund’s net assets. |
♦ | Value and/or principal is less than $1 or ($1). |
Г | Contract amounts are not in thousands. |
# | Aggregate cost for federal income tax purposes is $866,829. Aggregate gross unrealized appreciation/depreciation for all securities in which there is an excess of value over tax cost were $34,096 and $3,629, respectively. Net unrealized appreciation for tax purposes is $30,467. |
(1) | If the fund is a buyer of protection and a credit event occurs, as defined under the terms of that particular swap agreement, the fund will either (a) receive from the seller of protection an amount equal to the notional amount of the swap and deliver the referenced obligation or underlying securities comprising the referenced index or (b) receive a net settlement amount in the form of cash or securities equal to the notional amount of the swap less the recovery value of the referenced obligation or underlying securities comprising the referenced index. |
| |
(2) | If the fund is a seller of protection and a credit event occurs, as defined under the terms of that particular swap agreement, the fund will either (a) pay to the buyer of protection an amount equal to the notional amount of the swap and take delivery of the referenced obligation or underlying securities comprising the referenced index or (b) pay a net settlement amount in the form of cash or securities equal to the notional amount of the swap less the recovery value of the referenced obligation or underlying securities comprising the referenced index. |
| |
(3) | Implied credit spreads, represented in absolute terms, utilized in determining the market value of credit default swap agreements on corporate issues or sovereign issues of an emerging country as of period end serve as an indicator of the current status of the payment/performance risk and represent the likelihood of risk of default for the credit derivative. The implied credit spread of a particular referenced entity reflects the cost of buying/selling protection and may include the referenced entity’s credit soundness and a greater likelihood or risk of default or other credit event occurring as defined under the terms of the agreement. A credit spread identified as “Defaulted” indicates a credit event has occurred for the referenced entity or obligation. |
| |
(4) | The maximum potential amount the fund could be required to make as a seller of credit protection or receive as a buyer of credit protection if a credit event occurs as defined under the terms of that particular swap agreement. |
| |
(5) | The quoted market prices and resulting values of credit default swap agreements on asset-backed securities and credit indices serve as an indicator of the current status of the payment/performance risk and represent the likelihood of an expected liability (or profit) for the credit derivative should the notional amount of the swap agreement been closed/sold as of the period end. Increasing market values, in absolute terms when compared to the notional amount of the swap, represent a deterioration of the referenced entity’s credit soundness and a greater likelihood or risk of default or other credit event occurring as defined under the terms of the agreement. |
(a) | A portion of this security has been pledged as collateral with the broker in the amount of $790 to cover margin requirements for open future contracts. |
| |
(b) | All of this security has been pledged as collateral with the broker in the amount of $313 to cover margin requirements for open swap contracts. |
| |
(c) | A security with an aggregate market value of $370 and cash in the amount of $1,470 has been segregated with the custodian to cover margin requirements for open swap contracts. |
The notes to the financial statements are an integral part of this report.
175
DEFINITIONS:
144A | 144A Securities are registered pursuant to Rule 144A of the Securities Act of 1933. These securities are deemed to be liquid for purposes of compliance limitations on holdings of illiquid securities and may be resold as transactions exempt from registration, normally to qualified institutional buyers. At 10/31/2009, these securities aggregated $36,298, or 4.82%, of the fund’s net assets. |
BOA | Bank of America |
BPS | BNP Paribas |
BRC | Barclays Bank PLC |
BRL | Brazilian Real |
CBK | Citibank N.A. |
CDI | Credit Default Index |
CDX | A series of indices that track North American and emerging market credit derivative indices. |
CPI | Consumer Price Index |
DUB | Deutsche Bank AG |
EUR | Euro |
EURIBOR | Euro InterBank Offered Rate |
FBF | Credit Suisse |
FRC | Fixed Rate Credit |
GBP | Pound Sterling |
GLM | Goldman Sachs Capital Markets |
GST | Goldman Sachs Capital Markets |
HUS | HSBC Bank USA |
HY | High Yield |
IRO | Interest Rate Option |
JPM | JPMorgan Chase Bank |
JPY | Japanese Yen |
LB | Lehman Brothers |
LIBOR | London Interbank Offered Rates |
MLC | Merrill Lynch Capital Services |
MSCI | Morgan Stanley Capital International |
MYC | Morgan Stanley Capital Services |
NA | North American |
RYL | Royal Bank of Scotland PLC |
UAG | UBS AG |
USD | United States Dollar |
VALUATION SUMMARY:
Investment Securities | | Level 1 | | Level 2 | | Level 3 | | Total | |
Equities - Financials | | $ | 358 | | $ | — | | $ | — | | $ | 358 | |
Fixed Income - Asset-Backed Security | | — | | 2,771 | | — | | 2,771 | |
Fixed Income - Consumer Discretionary | | — | | 12,248 | | — | | 12,248 | |
Fixed Income - Energy | | — | | 739 | | — | | 739 | |
Fixed Income - Financials | | — | | 113,793 | | — | | 113,793 | |
Fixed Income - Foreign Government Obligation | | — | | 8,524 | | — | | 8,524 | |
Fixed Income - Industrials | | — | | 2,180 | | — | | 2,180 | |
Fixed Income - Information Technology | | — | | 3,160 | | — | | 3,160 | |
Fixed Income - Mortgage-Backed Security | | — | | 11,184 | | — | | 11,184 | |
Fixed Income - Municipal Government Obligation | | — | | 1,916 | | — | | 1,916 | |
Fixed Income - U.S. Government Agency Obligation | | — | | 6,094 | | — | | 6,094 | |
Fixed Income - U.S. Government Obligation | | — | | 720,329 | | — | | 720,329 | |
Cash & Cash Equivalent - Repurchase Agreement | | — | | 14,000 | | — | | 14,000 | |
Total | | $ | 358 | | $ | 896,938 | | $ | — | | $ | 897,296 | |
Other Financial Instruments* | | Level 1 | | Level 2 | | Level 3 | | Total | |
Forward Foreign Currency Contracts | | $ | — | | $ | 329 | | $ | — | | $ | 329 | |
Futures Contracts | | — | | 1,016 | | — | | 1,016 | |
Interest Rate Swap | | — | | 1,573 | | — | | 1,573 | |
Credit Default Swap | | — | | (596 | ) | — | | (596 | ) |
Written Swaption | | — | �� | 1,339 | | — | | 1,339 | |
Total | | $ | — | | $ | 3,661 | | $ | — | | $ | 3,661 | |
* Other financial instruments are valued at unrealized appreciation (depreciation).
The notes to the financial statements are an integral part of this report.
176
Transamerica PIMCO Total Return
SCHEDULE OF INVESTMENTS
At October 31, 2009
(all amounts in thousands)
| | Principal | | Value | |
U.S. GOVERNMENT OBLIGATIONS - 16.6% | | | | | |
U.S. Treasury Bond | | | | | |
3.25%, 07/31/2016 | | $ | 2,400 | | $ | 2,453 | |
3.50%, 02/15/2039 | | 500 | | 438 | |
4.25%, 05/15/2039 | | 1,300 | | 1,303 | |
4.38%, 02/15/2038 | | 800 | | 819 | |
4.50%, 02/15/2036 - 08/15/2039 | | 12,500 | | 13,056 | |
7.88%, 02/15/2021 | | 10,100 | | 14,012 | |
8.13%, 05/15/2021 | | 300 | | 424 | |
U.S. Treasury Inflation Indexed Bond | | | | | |
2.50%, 01/15/2029 | | 4,724 | | 5,084 | |
U.S. Treasury Inflation Indexed Note | | | | | |
1.63%, 01/15/2015 | | 2,374 | | 2,454 | |
2.00%, 07/15/2014 (a) | | 5,725 | | 6,038 | |
U.S. Treasury Note | | | | | |
2.25%, 05/31/2014 | | 1,000 | | 1,004 | |
2.38%, 08/31/2014 - 09/30/2014 | | 9,650 | | 9,691 | |
2.63%, 07/31/2014 | | 10,400 | | 10,587 | |
3.00%, 08/31/2016 | | 8,400 | | 8,437 | |
3.50%, 02/15/2018 | | 6,000 | | 6,115 | |
3.63%, 08/15/2019 | | 1,400 | | 1,427 | |
3.88%, 05/15/2018 | | 400 | | 418 | |
Total U.S. Government Obligations (cost $82,263) | | | | 83,760 | |
| | | | | |
U.S. GOVERNMENT AGENCY OBLIGATIONS - 42.4% | | | | | |
Fannie Mae | | | | | |
0.34%, 01/25/2021 * | | 693 | | 683 | |
0.59%, 09/25/2042 * | | 545 | | 530 | |
1.96%, 03/01/2044 - 10/01/2044 * | | 2,586 | | 2,581 | |
3.17%, 01/01/2026 * | | 4 | | 4 | |
3.26%, 11/01/2033 * | | 203 | | 207 | |
3.35%, 01/01/2028 * | | 61 | | 61 | |
3.72%, 03/01/2034 * | | 454 | | 464 | |
4.00%, 07/01/2015 | | 1,499 | | 1,540 | |
4.50%, 06/01/2039 - 10/01/2039 | | 10,899 | | 11,049 | |
4.71%, 09/01/2035 * | | 1,129 | | 1,153 | |
4.72%, 07/01/2035 * | | 943 | | 980 | |
5.00%, 06/01/2013 - 02/01/2036 | | 4,694 | | 4,964 | |
5.50%, 02/01/2038 (a) | | 5,839 | | 6,158 | |
5.50%, 07/01/2016 - 06/01/2038 | | 66,577 | | 70,300 | |
6.00%, 10/01/2034 - 11/01/2037 | | 3,428 | | 3,649 | |
6.30%, 10/17/2038 | | 1,204 | | 1,203 | |
6.50%, 08/01/2029 | | 503 | | 546 | |
Fannie Mae, IO | | | | | |
6.86%, 07/25/2034 * § | | 2,887 | | 359 | |
Fannie Mae, TBA | | | | | |
4.00%, 12/01/2024 | | 11,000 | | 11,163 | |
5.00%, 11/01/2039 | | 500 | | 518 | |
Freddie Mac | | | | | |
2.10%, 10/25/2044 * | | 555 | | 540 | |
2.30%, 07/25/2044 * | | 571 | | 558 | |
2.73%, 03/01/2034 * | | 272 | | 277 | |
2.78%, 03/01/2034 * | | 250 | | 256 | |
2.81%, 11/01/2033 * | | 223 | | 228 | |
4.00%, 05/01/2014 | | 520 | | 535 | |
4.50%, 06/15/2017 - 09/15/2018 | | 2,648 | | 2,750 | |
4.73%, 09/01/2035 * | | 1,128 | | 1,176 | |
5.00%, 02/15/2020 - 04/15/2030 | | 10,369 | | 10,642 | |
5.08%, 01/01/2036 * | | 5,711 | | 5,920 | |
5.29%, 09/01/2035 * | | 87 | | 91 | |
5.50%, 03/15/2017 - 08/01/2038 | | 5,768 | | 6,079 | |
6.50%, 04/15/2029 - 07/25/2043 | | 35 | | 38 | |
Ginnie Mae, IO | | | | | |
6.32%, 04/16/2033 - 10/16/2033 * § | | 2,386 | | 312 | |
6.36%, 08/16/2033 - 09/20/2034 * § | | 5,305 | | 527 | |
Ginnie Mae | | | | | |
4.38%, 05/20/2024 * | | 62 | | 64 | |
6.00%, 11/15/2037 - 07/15/2039 | | 49,640 | | 52,805 | |
6.50%, 07/15/2023 - 02/15/2039 | | 10,010 | | 10,656 | |
Overseas Private Investment Corp. | | | | | |
5.10%, 12/10/2012 | | 2,600 | | 2,796 | |
Total U.S. Government Agency Obligations (cost $207,211) | | | | 214,362 | |
| | | | | |
FOREIGN GOVERNMENT OBLIGATIONS - 1.4% | | | | | |
Export-Import Bank of Korea | | | | | |
0.50%, 10/04/2011 -144A * | �� | 2,500 | | 2,504 | |
8.13%, 01/21/2014 | | 3,300 | | 3,779 | |
Korea Expressway Corp. | | | | | |
5.13%, 05/20/2015 -144A | | 200 | | 206 | |
Republic of Brazil | | | | | |
10.25%, 01/10/2028 | | BRL | 1,000 | | 566 | |
Total Foreign Government Obligations (cost $6,445) | | | | 7,055 | |
| | | | | |
MORTGAGE-BACKED SECURITIES - 10.3% | | | | | |
American Home Mortgage Assets | | | | | |
Series 2006-2, Class 2A1 | | | | | |
0.43%, 09/25/2046 * | | $ | 1,173 | | 611 | |
Series 2006-4, Class 1A12 | | | | | |
0.45%, 10/25/2046 * | | 2,699 | | 1,263 | |
Banc of America Commercial Mortgage, Inc. | | | | | |
Series 2007-1, Class A4 | | | | | |
5.45%, 01/15/2049 | | 200 | | 185 | |
Banc of America Funding Corp. | | | | | |
Series 2005-D, Class A1 | | | | | |
3.44%, 05/25/2035 * | | 1,250 | | 1,224 | |
Series 2006-J, Class 4A1 | | | | | |
6.08%, 01/20/2047 | | 147 | | 103 | |
BCAP LLC Trust | | | | | |
Series 2006-AA2, Class A1 | | | | | |
0.41%, 01/25/2037 * | | 675 | | 382 | |
Bear Stearns Adjustable Rate Mortgage Trust | | | | | |
Series 2003-5, Class 2A1 | | | | | |
4.53%, 08/25/2033 * | | 1,274 | | 1,208 | |
Series 2003-8, Class 2A1 | | | | | |
5.29%, 01/25/2034 * | | 23 | | 22 | |
Series 2003-8, Class 4A1 | | | | | |
4.24%, 01/25/2034 * | | 161 | | 145 | |
Series 2005-2, Class A2 | | | | | |
2.20%, 03/25/2035 * | | 953 | | 854 | |
Series 2005-5, Class A2 | | | | | |
4.55%, 08/25/2035 * | | 375 | | 333 | |
Series 2005-7, Class 22A1 | | | | | |
5.49%, 09/25/2035 | | 361 | | 243 | |
Series 2006-6, Class 32A1 | | | | | |
5.64%, 11/25/2036 | | 415 | | 255 | |
| | | | | | | | |
The notes to the financial statements are an integral part of this report.
177
| | Principal | | Value | |
Bear Stearns Structured Products, Inc. | | | | | |
Series 2007-R6, Class 1A1 | | | | | |
5.63%, 01/26/2036 * | | $ | 369 | | $ | 230 | |
CC Mortgage Funding Corp. | | | | | |
Series 2004-3A, Class A1 | | | | | |
0.49%, 08/25/2035 -144A * | | 290 | | 130 | |
Citigroup Mortgage Loan Trust, Inc. | | | | | |
Series 2005-6, Class A2 | | | | | |
4.25%, 08/25/2035 * | | 455 | | 408 | |
Series 2007-10, Class 22AA | | | | | |
5.99%, 09/25/2037 | | 2,705 | | 1,612 | |
Citigroup/Deutsche Bank Commercial Mortgage Trust | | | | | |
Series 2006-CD3, Class A5 | | | | | |
5.62%, 10/15/2048 | | 330 | | 329 | |
Series 2007-CD5, Class A4 | | | | | |
5.89%, 11/15/2044 | | 200 | | 198 | |
Countrywide Alternative Loan Trust | | | | | |
Series 2003-J1, Class 4A1 | | | | | |
6.00%, 10/25/2032 | | 6 | | 5 | |
Series 2005-81, Class A1 | | | | | |
0.52%, 02/25/2037 * | | 731 | | 399 | |
Series 2006-30T1, Class 1A3 | | | | | |
6.25%, 11/25/2036 | | 655 | | 418 | |
Series 2006-J8, Class A2 | | | | | |
6.00%, 02/25/2037 | | 553 | | 463 | |
Series 2006-OA17, Class 1A1A | | | | | |
0.44%, 12/20/2046 * | | 2,831 | | 1,434 | |
Series 2007-2CB, Class 1A13 | | | | | |
5.75%, 03/25/2037 * | | 700 | | 432 | |
Series 2007-HY4, Class 1A1 | | | | | |
5.24%, 06/25/2037 * | | 1,311 | | 685 | |
Series 2007-OA6, Class A1B | | | | | |
0.44%, 06/25/2037 * | | 1,368 | | 654 | |
Countrywide Home Loan Mortgage Pass-Through Trust | | | | | |
Series 2002-30, Class M | | | | | |
4.67%, 10/19/2032 * | | 18 | | 8 | |
Series 2004-12, Class 12A1 | | | | | |
3.98%, 08/25/2034 * | | 576 | | 427 | |
Series 2004-R1, Class 2A | | | | | |
6.50%, 11/25/2034 -144A | | 740 | | 661 | |
Series 2005-R2, Class 1AF1 | | | | | |
0.58%, 06/25/2035 -144A * | | 2,149 | | 1,475 | |
Credit Suisse First Boston Mortgage Securities Corp. | | | | | |
Series 2003-AR15, Class 2A1 | | | | | |
3.68%, 06/25/2033 | | 1,133 | | 1,001 | |
Series 2002-P1A, Class A | | | | | |
0.93%, 03/25/2032 -144A * | | 1 | | 1 | |
Credit Suisse Mortgage Capital Certificates | | | | | |
Series 2006-C4, Class A3 | | | | | |
5.47%, 09/15/2039 | | 3,000 | | 2,619 | |
Deutsche Alt-A Securities, Inc. | | | | | |
Series 2005-6, Class 2A3 | | | | | |
5.50%, 12/25/2035 | | 900 | | 654 | |
Series 2006-AR6, Class A1 | | | | | |
0.32%, 02/25/2037 * | | 296 | | 283 | |
Series 2007-AR1, Class A3B | | | | | |
0.31%, 01/25/2047 * | | 352 | | 332 | |
First Horizon Alternative Mortgage Securities | | | | | |
Series 2007-FA4, Class 1A8 | | | | | |
6.25%, 08/25/2037 | | 546 | | 426 | |
First Horizon Asset Securities, Inc. | | | | | |
Series 2005-AR3, Class 2A1 | | | | | |
5.37%, 08/25/2035 * | | 89 | | 77 | |
GS Mortgage Securities Corp. II | | | | | |
Series 2007-EOP, Class A1 | | | | | |
0.33%, 03/06/2020 -144A * | | 792 | | 750 | |
GSR Mortgage Loan Trust | | | | | |
Series 2005-AR6, Class 2A1 | | | | | |
3.94%, 09/25/2035 * | | 185 | | 165 | |
Harborview Mortgage Loan Trust | | | | | |
Series 2006-1, Class 2A1A | | | | | |
0.49%, 03/19/2036 * | | 1,914 | | 1,065 | |
Series 2006-12, Class 2A11 | | | | | |
0.34%, 01/19/2038 * | | 219 | | 208 | |
Series 2006-12, Class 2A2A | | | | | |
0.44%, 01/19/2038 * | | 901 | | 442 | |
Series 2006-6, Class 5A1A | | | | | |
5.83%, 08/19/2036 | | 785 | | 513 | |
Series 2007-1, Class 2A1A | | | | | |
0.38%, 04/19/2038 * | | 1,402 | | 737 | |
IndyMac Index Mortgage Loan Trust | | | | | |
Series 2004-AR11, Class 2A | | | | | |
4.70%, 12/25/2034 | | 59 | | 41 | |
Series 2006-AR14, Class 1A1A | | | | | |
0.33%, 11/25/2046 * | | 310 | | 283 | |
JPMorgan Mortgage Trust | | | | | |
Series 2005-A1, Class 6T1 | | | | | |
5.01%, 02/25/2035 * | | 326 | | 309 | |
Series 2007-A1, Class 5A5 | | | | | |
4.35%, 07/25/2035 * | | 1,167 | | 1,108 | |
LB-UBS Commercial Mortgage Trust | | | | | |
Series 2007-C2, Class A3 | | | | | |
5.43%, 02/15/2040 | | 300 | | 254 | |
Series 2007-C7, Class A3 | | | | | |
5.87%, 09/15/2045 | | 1,900 | | 1,729 | |
Luminent Mortgage Trust | | | | | |
Series 2006-6, Class 2A1 | | | | | |
0.44%, 10/25/2046 * | | 826 | | 378 | |
Master Alternative Loans Trust | | | | | |
Series 2006-2, Class 2A1 | | | | | |
0.64%, 03/25/2036 * | | 191 | | 92 | |
Mellon Residential Funding Corp. | | | | | |
Series 2000-TBC3, Class A1 | | | | | |
0.69%, 12/15/2030 * | | 527 | | 451 | |
Merrill Lynch/Countrywide Commercial Mortgage Trust | | | | | |
Series 2007-9, Class A4 | | | | | |
5.70%, 09/12/2049 | | 1,600 | | 1,337 | |
MLCC Mortgage Investors, Inc. | | | | | |
Series 2005-2, Class 3A | | | | | |
1.25%, 10/25/2035 * | | 51 | | 43 | |
Series 2005-3, Class 4A | | | | | |
0.49%, 11/25/2035 * | | 53 | | 38 | |
Series 2005-A10, Class A | | | | | |
0.45%, 02/25/2036 * | | 203 | | 139 | |
Morgan Stanley Capital I | | | | | |
Series 2007-IQ15, Class A4 | | | | | |
5.88%, 06/11/2049 | | 100 | | 92 | |
Series 2007-XLFA, Class A1 | | | | | |
0.31%, 10/15/2020 -144A * | | 725 | | 594 | |
| | | | | | | |
The notes to the financial statements are an integral part of this report.
178
| | Principal | | Value | |
Residential Accredit Loans, Inc. | | | | | |
Series 2006-QO3, Class A1 | | | | | |
0.45%, 04/25/2046 * | | $ | 617 | | $ | 235 | |
Series 2006-QO6, Class A1 | | | | | |
0.42%, 06/25/2046 * | | 401 | | 157 | |
Residential Asset Securitization Trust | | | | | |
Series 2006-R1, Class A2 | | | | | |
0.64%, 01/25/2046 * | | 400 | | 188 | |
Residential Funding Mortgage Securities I | | | | | |
Series 2003-S9, Class A1 | | | | | |
6.50%, 03/25/2032 | | 5 | | 5 | |
Sequoia Mortgage Trust | | | | | |
Series 10, Class 2A1 | | | | | |
0.63%, 10/20/2027 * | | 57 | | 47 | |
Series 2007-1, Class 1A1 | | | | | |
4.17%, 01/20/2047 * | | 800 | | 621 | |
Structured Adjustable Rate Mortgage Loan Trust | | | | | |
Series 2004-19, Class 2A1 | | | | | |
2.16%, 01/25/2035 * | | 252 | | 126 | |
Structured Asset Mortgage Investments, Inc. | | | | | |
Series 2002-AR3, Class A1 | | | | | |
0.91%, 09/19/2032 * | | 24 | | 20 | |
Series 2005-AR5, Class A1 | | | | | |
0.50%, 07/19/2035 * | | 42 | | 32 | |
Series 2005-AR5, Class A2 | | | | | |
0.50%, 07/19/2035 * | | 78 | | 60 | |
Series 2005-AR5, Class A3 | | | | | |
0.50%, 07/19/2035 * | | 149 | | 113 | |
Series 2005-AR8, Class A1A | | | | | |
0.52%, 02/25/2036 * | | 670 | | 372 | |
Series 2006-AR3, Class 12A1 | | | | | |
0.46%, 05/25/2036 * | | 770 | | 394 | |
Series 2006-AR6, Class 2A1 | | | | | |
0.43%, 07/25/2046 * | | 2,716 | | 1,324 | |
Structured Asset Securities Corp. | | | | | |
Series 2003-22A, Class 2A1 | | | | | |
3.96%, 06/25/2033 * | | 1,309 | | 1,152 | |
TBW Mortgage Backed Pass-Through Certificates | | | | | |
Series 2006-6, Class A1 | | | | | |
0.35%, 01/25/2037 * | | 300 | | 275 | |
Thornburg Mortgage Securities Trust | | | | | |
Series 2006-6, Class A1 | | | | | |
0.35%, 11/25/2046 * | | 742 | | 717 | |
Wachovia Bank Commercial Mortgage Trust | | | | | |
Series 2006-WL7A, Class A1 | | | | | |
0.34%, 09/15/2021 -144A * | | 1,328 | | 1,165 | |
Series 2007-C30, Class A5 | | | | | |
5.34%, 12/15/2043 | | 2,100 | | 1,620 | |
WaMu Mortgage Pass Through Certificates | | | | | |
Series 2002-AR2, Class A | | | | | |
2.66%, 02/27/2034 * | | 27 | | 24 | |
Series 2002-AR9, Class 1A | | | | | |
2.16%, 08/25/2042 * | | 13 | | 10 | |
Series 2003-AR5, Class A7 | | | | | |
2.91%, 06/25/2033 * | | 888 | | 772 | |
Series 2003-AR9, Class 2A | | | | | |
2.88%, 09/25/2033 * | | 1,740 | | 1,619 | |
Series 2003-R1, Class A1 | | | | | |
0.78%, 12/25/2027 * | | 906 | | 702 | |
Series 2005-AR11, Class A1A | | | | | |
0.56%, 08/25/2045 * | | 724 | | 521 | |
Series 2006-AR19, Class 1A | | | | | |
1.50%, 01/25/2047 * | | 1,316 | | 549 | |
Series 2006-AR19, Class 1A1A | | | | | |
1.49%, 01/25/2047 * | | 1,120 | | 636 | |
Series 2006-AR9, Class 2A | | | | | |
2.97%, 08/25/2046 * | | 714 | | 408 | |
Series 2007-HY1, Class 4A1 | | | | | |
5.39%, 02/25/2037 | | 2,641 | | 1,753 | |
Series 2007-OA1, Class A1A | | | | | |
1.60%, 02/25/2047 * | | 2,754 | | 1,514 | |
Wells Fargo Mortgage Backed Securities Trust | | | | | |
Series 2003-13, Class A5 | | | | | |
4.50%, 11/25/2018 | | 457 | | 461 | |
Series 2004-CC, Class A1 | | | | | |
4.94%, 01/25/2035 * | | 394 | | 368 | |
Series 2006-AR4, Class 2A6 | | | | | |
5.78%, 04/25/2036 * | | 331 | | 103 | |
Series 2006-AR8, Class 2A4 | | | | | |
5.24%, 04/25/2036 | | 1,277 | | 1,089 | |
Total Mortgage-Backed Securities (cost $64,763) | | | | 52,109 | |
| | | | | |
ASSET-BACKED SECURITIES - 3.6% | | | | | |
Accredited Mortgage Loan Trust | | | | | |
Series 2007-1, Class A1 | | | | | |
0.29%, 02/25/2037 * | | 448 | | 430 | |
ACE Securities Corp. | | | | | |
Series 2006-NC3, Class A2A | | | | | |
0.29%, 12/25/2036 * | | 212 | | 182 | |
Amortizing Residential Collateral Trust | | | | | |
Series 2002-BC4, Class A | | | | | |
0.53%, 07/25/2032 * | | 4 | | 3 | |
Asset Backed Funding Certificates | | | | | |
Series 2004-OPT5, Class A1 | | | | | |
0.59%, 06/25/2034 * | | 406 | | 266 | |
Series 2006-HE1, Class A2A | | | | | |
0.30%, 01/25/2037 * | | 275 | | 260 | |
Aurum CLO, Ltd. | | | | | |
Series 2002-1A, Class A1 | | | | | |
0.71%, 04/15/2014 -144A Ə * | | 961 | | 892 | |
Bear Stearns Asset Backed Securities Trust | | | | | |
Series 2002-2, Class A1 | | | | | |
0.90%, 10/25/2032 * | | 22 | | 17 | |
Series 2006-SD4, Class 1A1 | | | | | |
4.61%, 10/25/2036 | | 980 | | 625 | |
Series 2007-AQ1, Class A1 | | | | | |
0.35%, 11/25/2036 * | | 1,055 | | 748 | |
Carrington Mortgage Loan Trust | | | | | |
Series 2006-NC4, Class A1 | | | | | |
0.29%, 10/25/2036 * | | 242 | | 235 | |
Chase Issuance Trust | | | | | |
Series 2009-A8, Class A8 | | | | | |
0.65%, 09/17/2012 * | | 1,900 | | 1,901 | |
Citigroup Mortgage Loan Trust, Inc. | | | | | |
Series 2006-WFH3, Class A2 | | | | | |
0.34%, 10/25/2036 * | | 536 | | 509 | |
| | | | | | | |
The notes to the financial statements are an integral part of this report.
179
| | Principal | | Value | |
Citigroup Mortgage Loan Trust, Inc. (continued) | | | | | |
Series 2007-AHL1, Class A2A | | | | | |
0.28%, 12/25/2036 * | | $ | 739 | | $ | 620 | |
Countrywide Asset-Backed Certificates | | | | | |
Series 2006-23, Class 2A1 | | | | | |
0.29%, 05/25/2037 * | | 635 | | 618 | |
Series 2006-26, Class 2A1 | | | | | |
0.32%, 06/25/2037 * | | 483 | | 458 | |
Series 2006-SD1, Class A1 | | | | | |
0.40%, 02/25/2036 -144A * | | 46 | | 44 | |
Series 2007-1, Class 2A1 | | | | | |
0.29%, 07/25/2037 * | | 816 | | 768 | |
Series 2007-7, Class 2A1 | | | | | |
0.32%, 10/25/2047 * | | 143 | | 129 | |
Credit-Based Asset Servicing and Securitization LLC | | | | | |
Series 2007-CB1, Class AF1A | | | | | |
0.31%, 01/25/2037 * | | 713 | | 347 | |
Series 2007-SP1, Class A1 | | | | | |
0.33%, 12/25/2037 -144A * | | 144 | | 140 | |
First Franklin Mortgage Loan Asset Backed Certificates | | | | | |
Series 2005-FF1, Class A2C | | | | | |
0.61%, 12/25/2034 * | | 118 | | 101 | |
Series 2007-FF1, Class A2A | | | | | |
0.28%, 01/25/2038 * | | 258 | | 248 | |
Fremont Home Loan Trust | | | | | |
Series 2006-E, Class 2A1 | | | | | |
0.30%, 01/25/2037 * | | 442 | | 286 | |
HFC Home Equity Loan Asset Backed Certificates | | | | | |
Series 2006-4, Class A1V | | | | | |
0.32%, 03/20/2036 * | | 21 | | 21 | |
Home Equity Asset Trust | | | | | |
Series 2002-1, Class A4 | | | | | |
0.84%, 11/25/2032 * | | 1 | | ♦ | |
JPMorgan Mortgage Acquisition Corp. | | | | | |
Series 2006-CH1, Class A2 | | | | | |
0.29%, 07/25/2036 * | | 99 | | 96 | |
Series 2006-CH2, Class AV2 | | | | | |
0.29%, 10/25/2036 * | | 973 | | 890 | |
Series 2007-CH3, Class A5 | | | | | |
0.50%, 03/25/2037 * | | 3,500 | | 1,257 | |
Lehman XS Trust | | | | | |
Series 2006-16N, Class A1A | | | | | |
0.32%, 11/25/2046 * | | 262 | | 250 | |
Series 2006-17, Class WF11 | | | | | |
0.36%, 11/25/2036 * | | 23 | | 23 | |
Long Beach Mortgage Loan Trust | | | | | |
Series 2006-9, Class 2A1 | | | | | |
0.30%, 10/25/2036 * | | 22 | | 22 | |
Mid-State Trust | | | | | |
Series 4, Class A | | | | | |
8.33%, 04/01/2030 | | 258 | | 268 | |
Morgan Stanley ABS Capital I | | | | | |
Series 2006-HE7, Class A2A | | | | | |
0.29%, 09/25/2036 * | | 90 | | 88 | |
Series 2006-HE8, Class A2A | | | | | |
0.29%, 10/25/2036 * | | 131 | | 126 | |
Series 2007-NC1, Class A2A | | | | | |
0.29%, 11/25/2036 * | | 220 | | 216 | |
Morgan Stanley Home Equity Loans | | | | | |
Series 2007-1, Class A1 | | | | | |
0.29%, 12/25/2036 * | | 772 | | 746 | |
Morgan Stanley Mortgage Loan Trust | | | | | |
Series 2007-10XS, Class A1 | | | | | |
6.00%, 07/25/2047 | | 538 | | 409 | |
Series 2007-3XS, Class 2A1A | | | | | |
0.31%, 01/25/2047 * | | 677 | | 574 | |
Series 2007-8XS, Class A1 | | | | | |
5.75%, 04/25/2037 | | 576 | | 439 | |
Nationstar Home Equity Loan Trust | | | | | |
Series 2007-A, Class AV1 | | | | | |
0.30%, 03/25/2037 * | | 266 | | 258 | |
New Century Home Equity Loan Trust | | | | | |
Series 2006-1, Class A2B | | | | | |
0.42%, 05/25/2036 * | | 222 | | 139 | |
Option One Mortgage Loan Trust | | | | | |
Series 2007-1, Class 2A1 | | | | | |
0.29%, 01/25/2037 * | | 116 | | 115 | |
Park Place Securities, Inc. | | | | | |
Series 2005-WCW1, Class A1B | | | | | |
0.50%, 09/25/2035 * | | 77 | | 50 | |
Residential Asset Securities Corp. | | | | | |
Series 2006-EMX9, Class 1A1 | | | | | |
0.31%, 11/25/2036 * | | 4 | | 4 | |
Series 2007-KS2, Class AI1 | | | | | |
0.31%, 02/25/2037 * | | 690 | | 651 | |
Saxon Asset Securities Trust | | | | | |
Series 2006-3, Class A1 | | | | | |
0.30%, 10/25/2046 * | | 26 | | 26 | |
SBI Heloc Trust | | | | | |
Series 2006-1A, Class 1A2A | | | | | |
0.41%, 08/25/2036 -144A * | | 30 | | 26 | |
Securitized Asset Backed Receivables LLC Trust | | | | | |
Series 2007-HE1, Class A2A | | | | | |
0.30%, 12/25/2036 * | | 117 | | 58 | |
SLM Student Loan Trust | | | | | |
Series 2007-3, Class A1 | | | | | |
0.27%, 10/27/2014 * | | 303 | | 302 | |
Small Business Administration | | | | | |
Series 2004-P10A, Class 1 | | | | | |
4.50%, 02/01/2014 | | 91 | | 94 | |
Small Business Administration Participation Certficates | | | | | |
Series 2004-20C, Class 1 | | | | | |
4.34%, 03/01/2024 | | 363 | | 377 | |
Series 2003-20I, Class 1 | | | | | |
5.13%, 09/01/2023 | | 56 | | 59 | |
Structured Asset Securities Corp. | | | | | |
Series 2002-HF1, Class A | | | | | |
0.53%, 01/25/2033 * | | 4 | | 3 | |
Series 2006-BC3, Class A2 | | | | | |
0.29%, 10/25/2036 * | | 206 | | 194 | |
Series 2006-BC6, Class A2 | | | | | |
0.32%, 01/25/2037 * | | 407 | | 374 | |
Total Asset-Backed Securities (cost $20,053) | | | | 17,982 | |
| | | | | |
MUNICIPAL GOVERNMENT OBLIGATIONS - 5.4% | | | | | |
Buckeye Tobacco Settlement Financing Authority | | | | | |
5.88%, 06/01/2047 | | 600 | | 442 | |
Chicago Board of Education -Class A | | | | | |
5.00%, 12/01/2012 | | 255 | | 278 | |
Chicago Transit Authority -Class A | | | | | |
6.90%, 12/01/2040 | | 7,600 | | 8,279 | |
| | | | | | | |
The notes to the financial statements are an integral part of this report.
180
| | Principal | | Value | |
City of Chicago Illinois | | | | | |
4.75%, 01/01/2036 | | $ | 7,290 | | $ | 7,236 | |
Los Angeles Unified School District -Class A | | | | | |
4.50%, 01/01/2028 | | 1,200 | | 1,141 | |
State of California | | | | | |
5.65%, 04/01/2039 | | 5,900 | | 6,230 | |
6.00%, 04/01/2038 | | 100 | | 106 | |
7.50%, 04/01/2034 | | 300 | | 311 | |
7.55%, 04/01/2039 | | 700 | | 731 | |
Tobacco Settlement Financing Corp. | | | | | |
5.00%, 06/01/2041 | | 1,400 | | 940 | |
5.25%, 06/01/2019 | | 165 | | 173 | |
5.50%, 06/01/2026 | | 200 | | 222 | |
5.88%, 05/15/2039 | | 40 | | 36 | |
7.47%, 06/01/2047 | | 1,155 | | 914 | |
Total Municipal Government Obligations (cost $25,958) | | | | 27,039 | |
| | | | | |
CORPORATE DEBT SECURITIES - 24.4% | | | | | |
Automobiles - 0.3% | | | | | |
Daimler Finance North America LLC | | | | | |
7.75%, 01/18/2011 | | 1,000 | | 1,062 | |
Motors Liquidation Co. | | | | | |
8.38%, 07/05/2033 Џ | | EUR | 800 | | 159 | |
Capital Markets - 3.1% | | | | | | |
Goldman Sachs Group, Inc. | | | | | | |
1.17%, 11/15/2014 * | | EUR | 500 | | 689 | |
1.19%, 02/04/2013 * | | EUR | 300 | | 420 | |
6.75%, 10/01/2037 | | $ | 3,300 | | 3,475 | |
Lehman Brothers Holdings, Inc. | | | | | |
Zero Coupon, 10/22/2049 Џ | | 200 | | 32 | |
2.85%, 12/23/2008 Џ | | 1,600 | | 252 | |
5.63%, 01/24/2013 Џ | | 4,100 | | 656 | |
6.75%, 12/28/2017 Џ | | 1,700 | | ♦ | |
6.88%, 05/02/2018 Џ | | 500 | | 81 | |
Morgan Stanley | | | | | |
0.73%, 10/18/2016 * | | 2,800 | | 2,523 | |
2.55%, 05/14/2010 * | | 3,000 | | 3,031 | |
6.00%, 04/28/2015 | | 1,900 | | 2,033 | |
Morgan Stanley Group, Inc. | | | | | |
0.53%, 01/18/2011 * | | 2,500 | | 2,479 | |
Commercial Banks - 6.2% | | | | | |
ANZ National International, Ltd./New Zealand | | | | | |
6.20%, 07/19/2013 -144A | | 3,700 | | 4,043 | |
Barclays Bank PLC | | | | | |
5.45%, 09/12/2012 | | 4,100 | | 4,438 | |
6.05%, 12/04/2017 -144A | | 2,600 | | 2,649 | |
7.43%, 12/15/2017 -144A Ž ■ | | 900 | | 828 | |
10.18%, 06/12/2021 -144A | | 2,240 | | 2,956 | |
Fortis Bank Nederland Holding NV | | | | | |
1.74%, 06/10/2011 * | | EUR | 1,200 | | 1,769 | |
HSBC Capital Funding, LP | | | | | |
10.18%, 06/30/2030 -144A Ž ■ | | $ | 150 | | 179 | |
ING Bank NV | | | | | |
2.63%, 02/05/2012 -144A | | 9,500 | | 9,628 | |
Lloyds TSB Bank PLC | | | | | |
0.95%, 06/09/2011 * | | EUR | 1,000 | | 1,475 | |
Sumitomo Mitsui Banking Corp. | | | | | |
5.63%, 10/15/2015 -144A Ž ■ | | $ | 150 | | 146 | |
Royal Bank of Scotland Group PLC | | | | | |
7.64%, 09/29/2017 Ž ■ | | 3,000 | | 1,470 | |
Wells Fargo & Co. | | | | | |
7.98%, 03/15/2018 Ž ■ | | | 1,800 | | | 1,685 | |
Consumer Finance - 1.6% | | | | | |
American Express Co. | | | | | |
6.15%, 08/28/2017 | | 700 | | 738 | |
American Express Credit Corp. - Series C | | | | | |
5.88%, 05/02/2013 | | 4,500 | | 4,829 | |
HSBC Finance Corp. | | | | | |
0.38%, 03/12/2010 * | | 2,400 | | 2,396 | |
Diversified Financial Services - 8.7% | | | | | |
Bank of America Corp. | | | | | |
5.65%, 05/01/2018 | | 3,900 | | 3,942 | |
Bear Stearns Cos. LLC | | | | | |
5.70%, 11/15/2014 | | 1,900 | | 2,064 | |
6.40%, 10/02/2017 | | 900 | | 984 | |
6.95%, 08/10/2012 | | 1,800 | | 2,020 | |
7.25%, 02/01/2018 | | 2,100 | | 2,402 | |
Citigroup, Inc. | | | | | |
0.44%, 03/07/2014 * | | 2,000 | | 1,826 | |
5.50%, 04/11/2013 | | 2,200 | | 2,293 | |
Ford Motor Credit Co. LLC | | | | | |
7.00%, 10/01/2013 | | 400 | | 379 | |
7.80%, 06/01/2012 | | 600 | | 588 | |
General Electric Capital Corp. | | | | | |
5.88%, 01/14/2038 | | 3,000 | | 2,867 | |
6.38%, 11/15/2067 ■ | | 300 | | 260 | |
6.50%, 09/15/2067 -144A ■ | | GBP | 1,600 | | 2,153 | |
GMAC, Inc. | | | | | |
6.63%, 05/15/2012 | | $ | 900 | | 847 | |
7.00%, 02/01/2012 Λ | | 1,500 | | 1,427 | |
7.25%, 03/02/2011 | | 300 | | 295 | |
JPMorgan Chase & Co. | | | | | |
7.90%, 04/30/2018 Ž ■ | | 2,000 | | 2,011 | |
Merrill Lynch & Co., Inc. | | | | | |
0.98%, 01/31/2014 * | | EUR | 1,000 | | 1,361 | |
6.05%, 08/15/2012 | | $ | 200 | | 214 | |
6.40%, 08/28/2017 | | 400 | | 413 | |
6.88%, 04/25/2018 | | 7,400 | | 7,967 | |
Petroleum Export, Ltd. | | | | | |
5.27%, 06/15/2011 -144A | | 86 | | 84 | |
Rabobank Nederland NV | | | | | |
11.00%, 06/30/2019 -144A Ž ■ | | 378 | | 475 | |
Santander SA | | | | | |
0.37%, 11/20/2009 -144A * | | 1,500 | | 1,500 | |
6.67%, 10/24/2017 -144A Ž ■ | | 900 | | 821 | |
SMFG Preferred Capital, Ltd. | | | | | |
10.23%, 07/29/2049 Reg S Ž ■ | | GBP | 2,900 | | 5,258 | |
Diversified Telecommunication Services - 0.1% | | | | | |
Deutsche Telekom International Finance BV | | | | | |
8.13%, 05/29/2012 | | EUR | 124 | | 206 | |
KT Corp. | | | | | |
4.88%, 07/15/2015 -144A | | $ | 200 | | 199 | |
Electric Utilities - 0.1% | | | | | |
Entergy Gulf States, Inc. | | | | | |
5.70%, 06/01/2015 | | 200 | | 202 | |
PSEG Power LLC | | | | | |
6.95%, 06/01/2012 | | 210 | | 232 | |
Health Care Providers & Services - 0.0% | | | | | |
HCA, Inc. | | | | | |
9.25%, 11/15/2016 | | 200 | | 209 | |
| | | | | | | | |
The notes to the financial statements are an integral part of this report.
181
(all amounts except share amounts in thousands)
| | Principal | | Value | |
Insurance - 1.9% | | | | | |
American International Group, Inc. | | | | | |
5.60%, 10/18/2016 | | $ | 1,000 | | $ | 767 | |
8.25%, 08/15/2018 | | 5,300 | | 4,517 | |
New York Life Global Funding | | | | | |
4.65%, 05/09/2013 -144A | | 4,200 | | 4,440 | |
Media - 0.0% | | | | | |
Time Warner, Inc. | | | | | |
6.88%, 05/01/2012 | | 20 | | 22 | |
Oil, Gas & Consumable Fuels - 0.8% | | | | | |
Enterprise Products Operating LLC | | | | | |
4.95%, 06/01/2010 | | 100 | | 101 | |
GAZ Capital SA | | | | | |
8.15%, 04/11/2018 -144A | | 1,000 | | 1,055 | |
8.63%, 04/28/2034 Reg S | | 500 | | 550 | |
NGPL Pipeco LLC | | | | | |
7.12%, 12/15/2017 -144A | | 1,800 | | 1,991 | |
Sonat, Inc. | | | | | |
7.63%, 07/15/2011 | | 370 | | 376 | |
Tobacco - 1.6% | | | | | |
Altria Group, Inc. | | | | | |
9.25%, 08/06/2019 | | 5,700 | | 6,912 | |
Reynolds American, Inc. | | | | | |
7.63%, 06/01/2016 | | 200 | | 215 | |
7.75%, 06/01/2018 | | 1,000 | | 1,080 | |
Wireless Telecommunication Services - 0.0% | | | | | |
AT&T Mobility LLC | | | | | |
6.50%, 12/15/2011 | | 180 | | 198 | |
Total Corporate Debt Securities (cost $127,034) | | | | 123,844 | |
| | | | | |
| | Shares | | | |
CONVERTIBLE PREFERRED STOCKS - 0.4% | | | | | |
Commercial Banks - 0.3% | | | | | |
Wells Fargo & Co. | | | | | |
7.50% p | | 1,600 | | 1,432 | |
Insurance - 0.1% | | | | | |
American International Group, Inc. | | | | | |
8.50% p | | 40,000 | | 450 | |
Total Convertible Preferred Stocks (cost $4,384) | | | | 1,882 | |
| | | | | |
PREFERRED STOCKS - 0.2% | | | | | |
Thrifts & Mortgage Finance - 0.2% | | | | | |
DG Funding Trust | | | | | |
0.61% -144A * p § | | 119 | | 1,059 | |
U.S. Government Agency Obligation - 0.0% | | | | | |
Fannie Mae | | | | | |
8.25% p ‡ ■ | | 26,000 | | 30 | |
Total Preferred Stocks (cost $1,916) | | | | 1,089 | |
| | | | | |
| | Principal | | | |
LOAN ASSIGNMENTS - 0.9% | | | | | |
Automobiles - 0.3% | | | | | |
DaimlerChrysler Finance Co. | | | | | |
4.32%, 08/03/2012 * | | $ | 1,960 | | | 1,871 | |
Health Care Providers & Services - 0.2% | | | | | |
HCA, Inc. | | | | | |
6.01%, 11/18/2013 | | 1,111 | | 1,033 | |
Media - 0.2% | | | | | |
CSC Holdings, Inc. | | | | | |
1.00%, 02/24/2013 * | | 982 | | 933 | |
Paper & Forest Products - 0.2% | | | | | |
Koch Forest Products, Inc. | | | | | |
7.47%, 12/20/2012 | | 794 | | 763 | |
Total Loan Assignments (cost $4,621) | | | | 4,600 | |
| | | | | |
SHORT-TERM U.S. GOVERNMENT OBLIGATIONS - 0.2% | | | | | |
U.S. Treasury Bill | | | | | |
0.15%, 04/08/2010 (b) | | 360 | | 360 | |
0.07%, 02/25/2010 (b) | | 900 | | 899 | |
Total Short-Term U.S. Government Obligations (cost $1,259) | | | | 1,259 | |
| | | | | |
REPURCHASE AGREEMENT - 0.2% | | | | | |
U.S. Treasury Repurchase Agreement 0.08%, dated 10/30/2009, to be repurchased at $1,100 on 11/02/2009. Collateralized by a U.S. Government Agency Obligation, 4.63%, due 10/15/2014, and with a value of $1,124. | | 1,100 | | 1,100 | |
Total Repurchase Agreement (cost $1,100) | | | | | |
| | | | | |
| | Shares | | | |
SECURITIES LENDING COLLATERAL - 0.1% | | | | | |
State Street Navigator Securities Lending Trust - Prime Portfolio, 0.35% p | | 622,125 | | 622 | |
Total Securities Lending Collateral (cost $622) | | | | | |
| | | | | |
Total Investment Securities (cost $547,629) # | | | | 536,703 | |
Other Assets and Liabilities - Net | | | | (31,374 | ) |
| | | | | | |
Net Assets | | | | $ | 505,329 | |
| | | | | |
| | Principal | | | |
SECURITIES SOLD SHORT - (7.4%) | | | | | |
U.S. Government Agency Obligation - (7.4%) | | | | | |
Fannie Mae, TBA (c) | | | | | |
5.50%, 11/01/2022-11/01/2037 | | $ | (26,600 | ) | (27,990 | ) |
6.00%, 12/01/2036-11/01/2037 | | (3,400 | ) | (3,604 | ) |
6.50%, 11/01/2036 | | (400 | ) | (429 | ) |
Freddie Mac, TBA (c) | | | | | |
5.50%, 11/01/2037 | | (5,000 | ) | (5,263 | ) |
Total Securities Sold Short (proceeds $36,981) | | | | (37,286 | ) |
The notes to the financial statements are an integral part of this report.
182
(all amounts in thousands)
WRITTEN SWAPTIONS:
Description | | Floating Rate Index | | Pay/Receivable
Floating Rate | | Exercise
Rate | | Expiration
Date | | Notional Amount | | Premiums
Received | | Value | |
Call - Interest Rate Swap, European Style | | 10-Year IRO RYL | | Receive | | $ | 3.00 | | 11/23/2009 | | $ | 7,000 | | $ | 44 | | $ | (2 | ) |
Put - Interest Rate Swap, European Style | | 5-Year IRO USD | | Receive | | 3.42 | | 11/23/2009 | | 11,000 | | 105 | | (1 | ) |
Put - Interest Rate Swap, European Style | | 5-Year IRO USD | | Receive | | 3.75 | | 11/23/2009 | | 2,000 | | 16 | | ♦ | |
Put - Interest Rate Swap, European Style | | 5-Year IRO USD | | Receive | | 3.75 | | 11/23/2009 | | 5,000 | | 45 | | ♦ | |
Put - Interest Rate Swap, European Style | | 7-Year IRO USD | | Receive | | 4.00 | | 11/23/2009 | | 21,700 | | 114 | | (2 | ) |
Put - Interest Rate Swap, European Style | | 7-Year IRO USD | | Receive | | 4.00 | | 11/23/2009 | | 14,300 | | 78 | | (1 | ) |
Put - Interest Rate Swap, European Style | | 10-Year IRO USD | | Receive | | 4.25 | | 04/19/2010 | | 3,900 | | 80 | | (73 | ) |
Put - Interest Rate Swap, European Style | | 10-Year IRO USD | | Receive | | 4.35 | | 11/23/2009 | | 700 | | 3 | | ♦ | |
Put - Interest Rate Swap, European Style | | 10-Year IRO RYL | | Receive | | 4.35 | | 11/23/2009 | | 15,100 | | 83 | | (3 | ) |
Put - Interest Rate Swap, European Style | | 5-Year IRO USD | | Receive | | 5.00 | | 06/15/2010 | | 1,000 | | 11 | | (3 | ) |
Put - Interest Rate Swap, European Style | | 10-Year IRO USD | | Receive | | 6.00 | | 08/31/2010 | | 12,100 | | 99 | | (66 | ) |
| | | | | | | | | | | | $ | 678 | | $ | (151 | ) |
| | | | | | | | | | | | | | | | | | | |
SWAP AGREEMENTS: (d)
CREDIT DEFAULT SWAPS ON CORPORATE AND SOVEREIGN ISSUES - SELL PROTECTION: (2)
Reference Obligation | | Fixed Deal
Receive Rate | | Maturity
Date | | Counterparty | | Implied
Credit
Spread at
10/31/2009 (3) | | Notional
Amount (4) | | Market
Value | | Premiums
Paid | | Unrealized
Appreciation
(Depreciation) | |
Altria Group, Inc., 9.25%, 08/06/2019 | | 1.46 | % | 03/20/2019 | | DUB | | $ | 133.68 | | $ | 5,700 | | $ | (93 | ) | $ | — | | $ | (93 | ) |
General Electric Capital Corp., 6.00%, 06/15/2012 | | 1.15 | % | 03/20/2010 | | CBK | | 143.49 | | 2,000 | | 1 | | — | | 1 | |
General Electric Capital Corp., 6.00%, 06/15/2012 | | 1.05 | % | 03/20/2010 | | CBK | | 143.49 | | 2,500 | | ♦ | | — | | ♦ | |
General Electric Capital Corp., 6.00%, 06/15/2012 § | | 5.00 | % | 06/20/2010 | | DUB | | 141.24 | | 300 | | 9 | | 5 | | 14 | |
Time Warner, Inc., 5.88%, 11/15/2016 | | 1.19 | % | 03/20/2014 | | DUB | | 49.42 | | 20 | | (1 | ) | — | | (1 | ) |
| | | | | | | | | | | | $ | (84 | ) | $ | 5 | | $ | (79 | ) |
| | | | | | | | | | | | | | | | | | | | | | |
CREDIT DEFAULT SWAPS ON CREDIT INDICES - BUY PROTECTION: (1)
Reference Obligation | | Fixed Deal
Pay Rate | | Maturity
Date | | Counterparty | | Currency
Code | | Notional
Amount (4) | | Market Value (5) | | Premiums
Paid
(Received) | | Unrealized
Appreciation | |
Dow Jones CDX.IG.5 7 Year Index 10-15% BP | | 0.14 | % | 12/20/2012 | | MYC | | — | | $ | 4,500 | | $ | 299 | | $ | — | | $ | 299 | |
Dow Jones CDX.IG.9 1 Year Index | | 0.80 | % | 12/20/2017 | | MYC | | — | | 11,700 | | 551 | | 224 | | 327 | |
Dow Jones CDX.IG.9 1 Year Index | | 0.80 | % | 12/20/2017 | | BRC | | — | | 2,200 | | 104 | | 21 | | 83 | |
Dow Jones CDX.NA.IG.10 10 Year Index | | 1.50 | % | 06/20/2018 | | DUB | | — | | 293 | | 1 | | (5 | ) | 6 | |
| | | | | | | | | | | | $ | 955 | | $ | 240 | | $ | 715 | |
| | | | | | | | | | | | | | | | | | | | | |
CREDIT DEFAULT SWAPS ON CREDIT INDICES - SELL PROTECTION: (2)
Reference Obligation | | Fixed Deal
Pay Rate | | Maturity
Date | | Counterparty | | Currency
Code | | Notional
Amount (4) | | Market Value
(5) | | Premiums
(Received) | | Unrealized
Appreciation
(Depreciation) | |
ABX.HE.AAA.06-2 | | 0.11 | % | 05/25/2046 | | GST | | — | | $ | 2,000 | | $ | (1,148 | ) | $ | (624 | ) | $ | (524 | ) |
Dow Jones CDX.IG.10 1 Year Index | | 1.50 | % | 06/20/2018 | | MYC | | — | | 21,374 | | 38 | | (541 | ) | 579 | |
Dow Jones CDX.IG.10 1 Year Index | | 1.50 | % | 06/20/2018 | | GST | | — | | 12,100 | | 32 | | (342 | ) | 374 | |
Dow Jones CDX.IG.5 1 Year Index 10-15% SP | | 0.46 | % | 12/20/2015 | | MYC | | — | | 3,200 | | (539 | ) | — | | (539 | ) |
| | | | | | | | | | | | $ | (1,617 | ) | $ | (1,507 | ) | $ | (110 | ) |
| | | | | | | | | | | | | | | | | | | | | |
INTEREST RATE SWAP AGREEMENTS - RECEIVABLE:
Floating Rate Index | | Fixed Rate | | Maturity
Date | | Counterparty | | Currency
Code | | Notional
Amount | | Market Value | | Premiums Paid | | Unrealized
Appreciation
(Depreciation) | |
BRL-CDI | | 12.67 | % | 01/04/2010 | | MLC | | BRL | | $ | 6,800 | | $ | 105 | | $ | — | | $ | 105 | |
| | | | | | | | | | | | | | | | | | | | | |
The notes to the financial statements are an integral part of this report.
183
INTEREST RATE SWAP AGREEMENTS - PAYABLE:
Floating Rate Index | | Fixed Rate | | Maturity
Date | | Counterparty | | Currency
Code | | Notional
Amount | | Market
Value | | Premiums
Paid
(Received) | | Unrealized
Appreciation
(Depreciation) | |
6-month GBP-LIBOR | | 5.00 | % | 09/15/2010 | | BRC | | GBP | | $ | 11,200 | | $ | 747 | | $ | (181 | ) | $ | 928 | |
6-month GBP-LIBOR | | 5.00 | % | 09/15/2010 | | RYL | | GBP | | 1,300 | | 87 | | (22 | ) | 109 | |
6-month GBP-LIBOR | | 5.00 | % | 03/18/2011 | | DUB | | GBP | | 4,200 | | 369 | | (38 | ) | 407 | |
BRL-CDI | | 12.67 | % | 01/04/2010 | | MYC | | BRL | | 2,900 | | 38 | | 1 | | 37 | |
BRL-CDI | | 10.68 | % | 01/02/2012 | | BRC | | BRL | | 1,300 | | (18 | ) | (10 | ) | (8 | ) |
| | | | | | | | | | | | $ | 1,223 | | $ | (250 | ) | $ | 1,473 | |
| | | | | | | | | | | | | | | | | | | | | |
FUTURES CONTRACTS:
Description | | Contracts Г | | Expiration Date | | Net Unrealized
Appreciation
(Depreciation) | |
10-Year U.S. Treasury Note | | 144 | | 12/21/2009 | | $ | 136 | |
2-Year U.S. Treasury Note | | 7 | | 12/31/2009 | | 8 | |
3-Month EURIBOR | | 208 | | 09/13/2010 | | 396 | |
3-Month EURIBOR | | 43 | | 06/14/2010 | | 46 | |
3-Month Pound Sterling | | 49 | | 06/16/2010 | | 45 | |
5-Year U.S. Treasury Note | | 11 | | 12/31/2009 | | 20 | |
90-Day Euro | | 344 | | 06/14/2010 | | 643 | |
90-Day Euro | | 73 | | 09/14/2010 | | 183 | |
90-Day GBP-LIBOR | | 423 | | 09/16/2010 | | 654 | |
| | | | | | $ | 2,131 | |
The notes to the financial statements are an integral part of this report.
184
FORWARD FOREIGN CURRENCY CONTRACTS:
Currency | | Bought (Sold) | | Settlement
Date | | Amount in U.S.
Dollars Bought
(Sold) | | Net Unrealized
Appreciation
(Depreciation) | |
Australian Dollar | | (57 | ) | 11/05/2009 | | $ | (50 | ) | $ | (2 | ) |
Brazilian Real | | (1,112 | ) | 11/04/2009 | | (625 | ) | (6 | ) |
Brazilian Real | | 1,144 | | 11/04/2009 | | 642 | | 7 | |
Brazilian Real | | 1,112 | | 11/04/2009 | | 625 | | 6 | |
Brazilian Real | | (1,144 | ) | 11/04/2009 | | (642 | ) | (7 | ) |
Brazilian Real | | (1,131 | ) | 02/02/2010 | | (625 | ) | (5 | ) |
Brazilian Real | | (1,130 | ) | 02/02/2010 | | (625 | ) | (5 | ) |
Brazilian Real | | (1,164 | ) | 02/02/2010 | | (642 | ) | (7 | ) |
Brazilian Real | | (1,163 | ) | 02/02/2010 | | (642 | ) | (6 | ) |
Brazilian Real | | 8,006 | | 02/02/2010 | | 4,309 | | 155 | |
Chinese Yuan Renminbi | | (5,401 | ) | 03/16/2010 | | (796 | ) | 5 | |
Chinese Yuan Renminbi | | (5,537 | ) | 03/29/2010 | | (821 | ) | 10 | |
Chinese Yuan Renminbi | | 12,049 | | 06/07/2010 | | 1,790 | | (19 | ) |
Chinese Yuan Renminbi | | 1,940 | | 06/07/2010 | | 288 | | (3 | ) |
Chinese Yuan Renminbi | | 16,379 | | 06/07/2010 | | 2,415 | | (8 | ) |
Chinese Yuan Renminbi | | 15,484 | | 06/07/2010 | | 2,300 | | (25 | ) |
Chinese Yuan Renminbi | | 6,259 | | 06/07/2010 | | 929 | | (9 | ) |
Chinese Yuan Renminbi | | 6,222 | | 06/07/2010 | | 924 | | (10 | ) |
Chinese Yuan Renminbi | | 3,751 | | 06/07/2010 | | 557 | | (6 | ) |
Chinese Yuan Renminbi | | 2,489 | | 06/07/2010 | | 370 | | (4 | ) |
Chinese Yuan Renminbi | | 5,270 | | 06/07/2010 | | 776 | | (1 | ) |
Chinese Yuan Renminbi | | 2,020 | | 06/07/2010 | | 300 | | (3 | ) |
Chinese Yuan Renminbi | | 6,425 | | 06/07/2010 | | 947 | | (3 | ) |
Danish Krone | | 732 | | 12/21/2009 | | 144 | | 1 | |
Euro | | (6,262 | ) | 12/08/2009 | | (9,149 | ) | (66 | ) |
Japanese Yen | | (26,281 | ) | 11/17/2009 | | (294 | ) | 2 | |
Malaysian Ringgit | | 2 | | 11/12/2009 | | 1 | | ♦ | |
Malaysian Ringgit | | 1 | | 11/12/2009 | | ♦ | | ♦ | |
Malaysian Ringgit | | 2 | | 11/12/2009 | | 1 | | ♦ | |
Malaysian Ringgit | | (1 | ) | 11/12/2009 | | ♦ | | ♦ | |
Malaysian Ringgit | | 1 | | 11/12/2009 | | ♦ | | ♦ | |
Malaysian Ringgit | | 2 | | 11/12/2009 | | 1 | | ♦ | |
Malaysian Ringgit | | (8 | ) | 11/12/2009 | | (2 | ) | ♦ | |
Malaysian Ringgit | | ♦ | | 02/12/2010 | | ♦ | | ♦ | |
Malaysian Ringgit | | 1 | | 02/12/2010 | | ♦ | | ♦ | |
Malaysian Ringgit | | 8 | | 02/12/2010 | | 2 | | ♦ | |
Mexican Peso | | 186 | | 11/27/2009 | | 13 | | 1 | |
Mexican Peso | | 51,034 | | 11/27/2009 | | 3,424 | | 427 | |
Mexican Peso | | 78 | | 11/27/2009 | | 6 | | ♦ | |
Mexican Peso | | 42 | | 11/27/2009 | | 3 | | ♦ | |
Mexican Peso | | 42 | | 11/27/2009 | | 3 | | ♦ | |
Mexican Peso | | (51,297 | ) | 11/27/2009 | | (3,578 | ) | (294 | ) |
Mexican Peso | | (84 | ) | 11/27/2009 | | (6 | ) | ♦ | |
Mexican Peso | | 84 | | 04/22/2010 | | 6 | | ♦ | |
Pound Sterling | | (8,191 | ) | 11/24/2009 | | (13,380 | ) | (61 | ) |
Singapore Dollar | | (398 | ) | 11/18/2009 | | (276 | ) | (8 | ) |
| | | | | | | | $ | 56 | |
| | | | | | | | | | | |
NOTES TO SCHEDULE OF INVESTMENTS:
* Floating or variable rate note. Rate is listed as of 10/31/2009.
IO Interest Only.
§ Illiquid. These securities aggregated to $2,257, or 0.45%; and illiquid derivatives aggregated to $9, or less than 0.00%, of the fund’s net assets.
♦ Value and/or principal is less than $1.
Џ In default.
■ Coupon rate is fixed for a predetermined period of time and then converts to a floating rate until maturity/call date. Rate is listed as of 10/31/2009.
Ž The security has a perpetual maturity. The date shown is the next call date.
Λ All or a portion of this security is on loan. The value of all securities on loan is $610.
p Rate shown reflects the yield at 10/31/2009.
‡ Non-income producing security.
Г Contract amounts are not in thousands.
# Aggregate cost for federal income tax purposes is $548,239. Aggregate gross unrealized appreciation/depreciation for all securities in which there is an excess of value over tax cost were $19,807 and $31,343, respectively. Net unrealized depreciation for tax purposes is $11,536.
The notes to the financial statements are an integral part of this report.
185
(1) | | If the fund is a buyer of protection and a credit event occurs, as defined under the terms of that particular swap agreement, the fund will either (i) receive from the seller of protection an amount equal to the notional amount of the swap and deliver the referenced obligation or underlying securities comprising the referenced index or (ii) receive a net settlement amount in the form of cash or securities equal to the notional amount of the swap less the recovery value of the referenced obligation or underlying securities comprising the referenced index. |
| | |
(2) | | If the fund is a seller of protection and a credit event occurs, as defined under the terms of that particular swap agreement, the fund will either (i) pay to the buyer of protection an amount equal to the notional amount of the swap and take delivery of the referenced obligation or underlying securities comprising the referenced index or (ii) pay a net settlement amount in the form of cash or securities equal to the notional amount of the swap less the recovery value of the referenced obligation or underlying securities comprising the referenced index. |
| | |
(3) | | Implied credit spreads, represented in absolute terms, utilized in determining the market value of credit default swap agreements on corporate issues or sovereign issues of an emerging country as of period end serve as an indicator of the current status of the payment/performance risk and represent the likelihood or risk of default for the credit derivative. The implied credit spread of a particular referenced entity reflects the cost of buying/selling protection and may include upfront payments required to be made to enter into the agreement. Wider credit spreads represent a deterioration of the referenced entity’s credit soundness and a greater likelihood or risk of default or other credit event occurring as defined under the terms of the agreement. |
| | |
(4) | | The maximum potential amount the fund could be required to make as a seller of credit protection or receive as a buyer of credit protection if a credit event occurs as defined under the terms of that particular swap agreement. |
| | |
(5) | | The quoted market prices and resulting values for credit default swap agreements on asset-backed securities and credit indices serve as an indicator of the current status of the payment/performance risk and represent the likelihood of an expected liability (or profit) for the credit derivative should the notional amount of the swap agreement been closed/sold as of the period end. Increasing market values, in absolute terms when compared to the notional amount of the swap, represent a deterioration of the referenced entity’s credit soundness and a greater likelihood or risk of default or other credit event occurring as defined under the terms of the agreement. |
| | |
(a) | | All or a portion of this security has been pledged as collateral with the broker in the amount of $1,500 to cover margin requirements for open future contracts |
| | |
(b) | | All of this security has been pledged as collateral with the broker in the amount of $1,259 to cover margin requirements for open swap contracts. |
| | |
(c) | | Securities with an aggregate market value of $580 and cash in the amount of $471 has been pledged as collateral segregated with the custodian to cover margin requirements for open TBA transactions. |
| | |
(d) | | Cash in the amount of $2,120 has been pledged as collateral and segregated with the custodian to cover margin requirements for open swap contracts. |
DEFINITIONS:
144A | | 144A Securities are registered pursuant to Rule 144A of the Securities Act of 1933. These securities are deemed to be liquid for purposes of compliance limitations on holdings of illiquid securities and may be resold as transactions exempt from registration, normally to qualified institutional buyers. At 10/31/2009, these securities aggregated $42,794, or 8.47%, of the fund’s net assets. |
BRC | | Barclays Bank PLC |
BRL | | Brazilian Real |
CBK | | Citibank N.A. |
CDI | | Credit Default Index |
CDX | | A series of indices that track North American and emerging market credit derivative indices. |
CLO | | Collateralized Loan Obligation |
DUB | | Deutsche Bank AG |
EUR | | Euro |
EURIBOR | | Euro InterBank Offered Rate |
GBP | | Pound Sterling |
GST | | Goldman Sachs Capital Markets |
IG | | Investment Grade |
IRO | | Interest Rate Option |
LB | | Lehman Brothers |
LIBOR | | London Interbank Offered Rates |
MLC | | Merrill Lynch Capital Services |
MYC | | Morgan Stanley Capital Services |
NA | | North American |
RYL | | Royal Bank of Scotland PLC |
TBA | | To Be Announced |
USD | | United States Dollar |
The notes to the financial statements are an integral part of this report.
186
VALUATION SUMMARY:
Investment Securities | | Level 1 | | Level 2 | | Level 3 | | Total | |
Equities - Financials | | $ | 2,942 | | $ | — | | $ | — | | $ | 2,942 | |
Equities - U.S. Government Agency Obligation | | 30 | | — | | — | | 30 | |
Fixed Income - Asset-Backed Security | | — | | 17,090 | | 892 | | 17,982 | |
Fixed Income - Consumer Discretionary | | — | | 5,289 | | — | | 5,289 | |
Fixed Income - Consumer Staples | | — | | 8,207 | | — | | 8,207 | |
Fixed Income - Energy | | — | | 4,073 | | — | | 4,073 | |
Fixed Income - Financials | | — | | 109,076 | | — | | 109,076 | |
Fixed Income - Foreign Government Obligation | | — | | 7,055 | | — | | 7,055 | |
Fixed Income - Industrials | | — | | 763 | | — | | 763 | |
Fixed Income - Mortgage-Backed Security | | — | | 52,109 | | — | | 52,109 | |
Fixed Income - Municipal Government Obligation | | — | | 27,039 | | — | | 27,039 | |
Fixed Income - Short-Term U.S. Government Obligation | | — | | 1,259 | | — | | 1,259 | |
Fixed Income - Telecommunication Services | | — | | 603 | | — | | 603 | |
Fixed Income - U.S. Government Agency Obligation | | — | | 214,362 | | — | | 214,362 | |
Fixed Income - U.S. Government Obligation | | — | | 83,760 | | — | | 83,760 | |
Fixed Income - Utilities | | — | | 434 | | — | | 434 | |
Cash & Cash Equivalent - Financials | | — | | 1,100 | | — | | 1,100 | |
Cash & Cash Equivalent - Securities Lending Collateral | | 622 | | — | | — | | 622 | |
Total | | $ | 3,594 | | $ | 532,217 | | $ | 892 | | $ | 536,703 | |
| | | | | | | | | |
Other Financial Instruments* | | Level 1 | | Level 2 | | Level 3 | | Total | |
Forward Foreign Currency Contracts | | $ | — | | $ | 56 | | $ | — | | $ | 56 | |
Credit Default Swap | | — | | 526 | | — | | 526 | |
Interest Rate Swap | | — | | 1,578 | | — | | 1,578 | |
Futures Contracts | | — | | 2,131 | | — | | 2,131 | |
Written Swaption | | — | | 527 | | — | | 527 | |
Total | | $ | — | | $ | 4,818 | | $ | — | | $ | 4,818 | |
| | | | | | | | | |
Securities Sold Short | | Level 1 | | Level 2 | | Level 3 | | Total | |
Fixed Income - U.S. Government Agency Obligation | | $ | — | | $ | (37,286 | ) | $ | — | | $ | (37,286 | ) |
Total | | $ | — | | $ | (37,286 | ) | $ | — | | $ | (37,286 | ) |
Level 3 Rollforward - Investment Securities
Securities | | Beginning Balance
at 10/31/2008 | | Net Purchases
/(Sales) | | Accrued
Discounts/
(Premiums) | | Total
Realized
Loss | | Change in
Unrealized
Depreciation | | Net Transfers
In/(Out)
of Level 3 | | Ending Balance
at 10/31/2009 | |
Fixed Income - Asset-Backed Security | | $ | 1,221 | | $ | — | | $ | ♦ | | $ | (291 | ) | $ | (38 | ) | $ | — | | $ | 892 | |
| | | | | | | | | | | | | | | | | | | | | | |
* Other financial instruments are derivative instruments. Future Contracts, Forward Foreign Currency Contracts and Swap Contracts are valued at unrealized appreciation (depreciation) on the instrument.
The notes to the financial statements are an integral part of this report.
187
STATEMENTS OF ASSETS AND LIABILITIES
At October 31, 2009
(all amounts except per share amounts in thousands)
| | Transamerica
Clarion Global
Real Estate
Securities | | Transamerica
Jennison
Growth | | Transamerica
MFS
International
Equity | | Transamerica
PIMCO Real
Return TIPS | | Transamerica
PIMCO Total
Return | |
Assets: | | | | | | | | | | | |
Investment securities, at value | | $ | 287,729 | | $ | 648,973 | | $ | 392,142 | | $ | 883,296 | | $ | 535,603 | |
Repurchase agreement, at value | | 5,220 | | 2,046 | | 5,878 | | 14,000 | | 1,100 | |
Cash | | — | | — | | — | | 1,405 | | 1,793 | |
Foreign currency, at value | | 7 | | — | | 1 | | 4,930 | | 4,908 | |
Receivables: | | | | | | | | | | | |
Investment securities sold | | 4,054 | | 3,594 | | — | | 17,961 | | 83,474 | |
Shares of beneficial interest sold | | 62 | | 145 | | 512 | | 255 | | 365 | |
Interest | | — | (a) | — | (a) | — | (a) | 4,433 | | 4,430 | |
Securities lending income (net) | | 6 | | — | (a) | — | (a) | — | | — | (a) |
Dividends | | 672 | | 302 | | 485 | | — | | 64 | |
Dividend reclaims | | 73 | | 20 | | 480 | | — | | — | |
Variation margin | | — | | — | | — | | 63 | | 284 | |
Swap agreements, at value | | — | | — | | — | | 2,752 | | 2,381 | |
Unrealized appreciation on forward foreign currency contracts | | — | | — | | — | | 554 | | 614 | |
| | $ | 297,823 | | $ | 655,080 | | $ | 399,498 | | $ | 929,649 | | $ | 635,016 | |
Liabilities: | | | | | | | | | | | |
Cash deposit due to broker | | — | | — | | — | | 1,470 | | 2,591 | |
Accounts payable and accrued liabilities: | | | | | | | | | | | |
Investment securities purchased | | 1,642 | | — | | 43 | | 172,978 | | 86,344 | |
Shares of beneficial interest redeemed | | — | | 1 | | 47 | | 215 | | — | |
Management and advisory fees | | 197 | | 433 | | 304 | | 422 | | 280 | |
Administration fees | | 5 | | 11 | | 7 | | 13 | | 8 | |
Other | | 46 | | 25 | | 47 | | 48 | | 48 | |
Collateral for securities on loan | | 10,431 | | — | | 2,296 | | — | | 622 | |
Written options and swaptions, at value | | — | | — | | — | | 98 | | 151 | |
Swap agreements, at value | | — | | — | | — | | 1,457 | | 1,799 | |
Securities sold short, at value | | — | | — | | — | | — | | 37,286 | |
Unrealized depreciation on forward foreign currency contracts | | — | | — | | — | | 225 | | 558 | |
| | 12,321 | | 470 | | 2,744 | | 176,926 | | 129,687 | |
Net assets | | $ | 285,502 | | $ | 654,610 | | $ | 396,754 | | $ | 752,723 | | $ | 505,329 | |
| | | | | | | | | | | |
Net assets consist of: | | | | | | | | | | | |
Shares of beneficial interest, unlimited shares authorized, no par value | | $ | 374,170 | | $ | 645,679 | | $ | 348,956 | | $ | 725,883 | | $ | 481,843 | |
Undistributed net investment income | | 3,532 | | 279 | | 3,132 | | 8,924 | | 854 | |
Undistributed (accumulated) net realized gain (loss) from investments | | (96,456 | ) | (52,029 | ) | 8,436 | | (29,101 | ) | 29,304 | |
Net unrealized appreciation (depreciation) on: | | | | | | | | | | | |
Investment securities | | 4,264 | | 60,680 | | 36,180 | | 43,249 | | (10,926 | ) |
Futures contracts | | — | | — | | — | | 1,016 | | 2,131 | |
Written option and swaptions contracts | | — | | — | | — | | 1,339 | | 527 | |
Swap agreements | | — | | — | | — | | 977 | | 2,104 | |
Translation of assets and liabilities denominated in foreign currencies | | (8 | ) | 1 | | 50 | | 436 | | (203 | ) |
Securities sold short | | — | | — | | — | | — | | (305 | ) |
Net assets | | $ | 285,502 | | $ | 654,610 | | $ | 396,754 | | $ | 752,723 | | $ | 505,329 | |
| | | | | | | | | | | |
Shares outstanding | | 26,521 | | 64,375 | | 48,639 | | 70,212 | | 46,586 | |
| | | | | | | | | | | |
Net asset value and offering price per share | | $ | 10.77 | | $ | 10.17 | | $ | 8.16 | | $ | 10.72 | | $ | 10.85 | |
| | | | | | | | | | | |
Investment securities, at cost | | $ | 283,465 | | $ | 588,293 | | $ | 355,962 | | $ | 840,047 | | $ | 546,529 | |
Repurchase agreement, at cost | | $ | 5,220 | | $ | 2,046 | | $ | 5,878 | | $ | 14,000 | | $ | 1,100 | |
Foreign currency, at cost | | $ | 7 | | $ | — | | $ | 1 | | $ | 4,946 | | $ | 4,899 | |
Securities loaned, at value | | $ | 9,871 | | $ | — | | $ | 2,186 | | $ | — | | $ | 610 | |
Premium received on written option & swaption contracts | | $ | — | | $ | — | | $ | — | | $ | 1,437 | | $ | 678 | |
Premium paid on swap agreements | | $ | — | | $ | — | | $ | — | | $ | 831 | | $ | 1,768 | |
Premium received on swap agreements | | $ | — | | $ | — | | $ | — | | $ | 1,149 | | $ | 246 | |
Proceeds received from securities sold short | | $ | — | | $ | — | | $ | — | | $ | — | | $ | 36,981 | |
(a) Rounds to less than $1.
The notes to the financial statements are an integral part of this report.
188
STATEMENTS OF OPERATIONS
For the year ended October 31, 2009
(all amounts in thousands)
| | Transamerica
Clarion Global Real
Estate Securities | | Transamerica
Jennison Growth | | Transamerica MFS
International Equity | | Transamerica
PIMCO Real Return
TIPS | | Transamerica
PIMCO Total Return | |
Investment income: | | | | | | | | | | | |
Dividend income | | $ | 9,896 | | $ | 2,866 | | $ | 6,135 | | $ | 30 | | $ | 434 | |
Withholding taxes on foreign dividends | | (550 | ) | (35 | ) | (649 | ) | — | | — | |
Interest income | | 2 | | 1 | | 1 | | 26,631 | | 30,008 | |
Securities lending income (net) | | 142 | | 57 | | 40 | | 249 | | 90 | |
| | 9,490 | | 2,889 | | 5,527 | | 26,910 | | 30,532 | |
Expenses: | | | | | | | | | | | |
Management and advisory | | 1,784 | | 2,260 | | 1,754 | | 4,530 | | 3,549 | |
Transfer agent: | | | | | | | | | | | |
Class A | | 12 | | 32 | | 42 | | 4 | | 14 | |
Class B | | 6 | | 27 | | 33 | | 3 | | 11 | |
Class C | | 2 | | 10 | | 10 | | 2 | | 6 | |
Class I | | — | (a) | — | (a) | — | (a) | — | (a) | — | (a) |
Printing and shareholder reports | | 7 | | 11 | | 8 | | 25 | | 21 | |
Custody | | 181 | | 44 | | 257 | | 202 | | 225 | |
Administration | | 45 | | 57 | | 38 | | 135 | | 107 | |
Legal | | 7 | | 10 | | 6 | | 21 | | 17 | |
Audit and tax | | 28 | | 21 | | 22 | | 40 | | 40 | |
Trustees | | 5 | | 7 | | 5 | | 15 | | 11 | |
Registration | | 2 | | 1 | | 6 | | — | | — | |
Other | | 11 | | 10 | | 4 | | 33 | | 22 | |
Total expenses | | 2,090 | | 2,490 | | 2,185 | | 5,010 | | 4,023 | |
| | | | | | | | | | | |
Net investment income | | 7,400 | | 399 | | 3,342 | | 21,900 | | 26,509 | |
| | | | | | | | | | | |
Net realized gain (loss) on transactions from: | | | | | | | | | | | |
Investment securities | | (63,221 | ) | (19,018 | ) | 10,325 | | 28,219 | | 30,131 | |
Futures contracts | | — | | — | | — | | 9,332 | | 6,363 | |
Written option & swaption contracts | | — | | — | | — | | 356 | | (1,422 | ) |
Swap agreements | | — | | — | | — | | (21,057 | ) | (7,372 | ) |
Foreign currency transactions | | (72 | ) | (38 | ) | (410 | ) | (4,430 | ) | (1,657 | ) |
Securities sold short | | — | | — | | — | | (2,639 | ) | (1,101 | ) |
| | (63,293 | ) | (19,056 | ) | 9,915 | | 9,781 | | 24,942 | |
| | | | | | | | | | | |
Net increase (decrease) in unrealized appreciation (depreciation) on: | | | | | | | | | | | |
Investment securities | | 95,198 | | 83,219 | | 53,821 | | 98,115 | | 61,239 | |
Futures contracts | | — | | — | | — | | (4,662 | ) | 782 | |
Written option and swaption contracts | | — | | — | | — | | 1,406 | | 475 | |
Swap agreements | | — | | — | | — | | 5,176 | | 933 | |
Translation of assets and liabilities denominated in foreign currencies | | (14 | ) | 1 | | 53 | | 2,110 | | (2,190 | ) |
Securities sold short | | — | | — | | — | | (5,794 | ) | (218 | ) |
Change in unrealized appreciation (depreciation) | | 95,184 | | 83,220 | | 53,874 | | 96,351 | | 61,021 | |
Net realized and unrealized gain: | | 31,891 | | 64,164 | | 63,789 | | 106,132 | | 85,963 | |
Net increase In net assets resulting from operations | | $ | 39,291 | | $ | 64,563 | | $ | 67,131 | | $ | 128,032 | | $ | 112,472 | |
(a) Rounds to less than $1.
The notes to the financial statements are an integral part of this report.
189
STATEMENTS OF CHANGES IN NET ASSETS
For the years ended:
(all amounts in thousands)
| | Transamerica Clarion Global Real
Estate Securities | | Transamerica Jennison Growth | | Transamerica MFS International
Equity | |
| | October 31, 2009 | | October 31, 2008 | | October 31, 2009 | | October 31, 2008 | | October 31, 2009 | | October 31, 2008 | |
From operations: | | | | | | | | | | | | | |
Net investment income | | $ | 7,400 | | $ | 7,539 | | $ | 399 | | $ | 353 | | $ | 3,342 | | $ | 220 | |
Net realized gain (loss)(a) | | (63,293 | ) | (29,260 | ) | (19,056 | ) | (32,716 | ) | 9,915 | | (174 | ) |
Change in unrealized appreciation (depreciation)(b) | | 95,184 | | (162,319 | ) | 83,220 | | (63,764 | ) | 53,874 | | (22,621 | ) |
Net increase (decrease) in net assets resulting from operations | | 39,291 | | (184,040 | ) | 64,563 | | (96,127 | ) | 67,131 | | (22,575 | ) |
| | | | | | | | | | | | | |
Distributions to shareholders: | | | | | | | | | | | | | |
From net investment income: | | | | | | | | | | | | | |
Class A | | (30 | ) | (254 | ) | — | | — | | — | | (143 | ) |
Class B | | (10 | ) | (159 | ) | — | | — | | — | | (232 | ) |
Class C | | (17 | ) | (106 | ) | — | | — | | — | | (98 | ) |
Class I | | (4,922 | ) | (16,445 | ) | (430 | ) | (228 | ) | — | | — | |
| | (4,979 | ) | (16,964 | ) | (430 | ) | (228 | ) | — | | (473 | ) |
From net realized gains: | | | | | | | | | | | | | |
Class A | | — | | (588 | ) | — | | — | | — | | (557 | ) |
Class B | | — | | (369 | ) | — | | — | | — | | (861 | ) |
Class C | | — | | (243 | ) | — | | — | | — | | (335 | ) |
Class I | | — | | (37,556 | ) | — | | — | | — | | — | |
| | — | | (38,756 | ) | — | | — | | — | | (1,753 | ) |
Total distributions to shareholders | | (4,979 | ) | (55,720 | ) | (430 | ) | (228 | ) | — | | (2,226 | ) |
| | | | | | | | | | | | | |
Capital share transactions: | | | | | | | | | | | | | |
Proceeds from shares sold: | | | | | | | | | | | | | |
Class A | | 1 | | 5 | | 27 | | 27 | | 27 | | 49 | |
Class B | | — | | 2 | | 3 | | 6 | | 6 | | 13 | |
Class C | | — | | 4 | | — | | — | | — | | 6 | |
Class I | | 15,388 | | 48,177 | | 451,224 | | 147,775 | | 321,484 | | 53,956 | |
| | 15,389 | | 48,188 | | 451,254 | | 147,808 | | 321,517 | | 54,024 | |
Dividends and distributions reinvested: | | | | | | | | | | | | | |
Class A | | 27 | | 793 | | — | | — | | — | | 687 | |
Class B | | 9 | | 457 | | — | | — | | — | | 1,065 | |
Class C | | 16 | | 311 | | — | | — | | — | | 367 | |
Class I | | 4,922 | | 54,001 | | 430 | | 228 | | — | | — | |
| | 4,974 | | 55,562 | | 430 | | 228 | | — | | 2,119 | |
Cost of shares redeemed: | | | | | | | | | | | | | |
Class A | | (3,025 | ) | (1,578 | ) | (7,471 | ) | (1,969 | ) | (9,247 | ) | (2,210 | ) |
Class B | | (962 | ) | (971 | ) | (5,295 | ) | (2,815 | ) | (3,533 | ) | (2,970 | ) |
Class C | | (1,216 | ) | (354 | ) | (2,986 | ) | (746 | ) | (2,363 | ) | (1,784 | ) |
Class I | | (895 | ) | (4,425 | ) | (44,034 | ) | (36,134 | ) | (30,496 | ) | — | |
| | (6,098 | ) | (7,328 | ) | (59,786 | ) | (41,664 | ) | (45,639 | ) | (6,964 | ) |
Automatic conversions: | | | | | | | | | | | | | |
Class A | | 126 | | 723 | | 1,268 | | 1,195 | | 2,402 | | 1,054 | |
Class B | | (126 | ) | (723 | ) | (1,268 | ) | (1,195 | ) | (2,402 | ) | (1,054 | ) |
| | — | | — | | — | | — | | — | | — | |
Net increase in net assets resulting from capital shares transactions | | 14,265 | | 96,422 | | 391,898 | | 106,372 | | 275,878 | | 49,179 | |
| | | | | | | | | | | | | |
Net increase (decrease) in net assets | | 48,577 | | (143,338 | ) | 456,031 | | 10,017 | | 343,009 | | 24,378 | |
| | | | | | | | | | | | | |
Net assets: | | | | | | | | | | | | | |
Beginning of year | | $ | 236,925 | | $ | 380,263 | | $ | 198,579 | | $ | 188,562 | | $ | 53,745 | | $ | 29,367 | |
End of year | | $ | 285,502 | | $ | 236,925 | | $ | 654,610 | | $ | 198,579 | | $ | 396,754 | | $ | 53,745 | |
Undistributed (accumulated) net investment income (loss) | | $ | 3,532 | | $ | (722 | ) | $ | 279 | | $ | 349 | | $ | 3,132 | | $ | (1 | ) |
The notes to the financial statements are an integral part of this report.
190
| | Transamerica Clarion Global Real
Estate Securities | | Transamerica Jennison Growth | | Transamerica MFS International
Equity | |
| | October 31, 2009 | | October 31, 2008 | | October 31, 2009 | | October 31, 2008 | | October 31, 2009 | | October 31, 2008 | |
Share activity: | | | | | | | | | | | | | |
Shares issued: | | | | | | | | | | | | | |
Class A | | — | | 1 | | 3 | | 2 | | 9 | | 12 | |
Class B | | — | | — | | — | | 1 | | 3 | | 4 | |
Class C | | — | | — | | — | | — | | — | | 3 | |
Class I | | 1,667 | | 3,314 | | 47,919 | | 14,148 | | 46,747 | | 6,234 | |
| | 1,667 | | 3,315 | | 47,922 | | 14,151 | | 46,759 | | 6,253 | |
Shares issued-reinvested from distributions: | | | | | | | | | | | | | |
Class A | | 3 | | 50 | | — | | — | | — | | 152 | |
Class B | | 1 | | 29 | | — | | — | | — | | 275 | |
Class C | | 2 | | 20 | | — | | — | | — | | 97 | |
Class I | | 573 | | 3,424 | | 56 | | 18 | | — | | — | |
| | 579 | | 3,523 | | 56 | | 18 | | — | | 524 | |
Shares redeemed: | | | | | | | | | | | | | |
Class A | | (299 | ) | (114 | ) | (774 | ) | (181 | ) | (2,815 | ) | (565 | ) |
Class B | | (95 | ) | (67 | ) | (600 | ) | (273 | ) | (1,312 | ) | (857 | ) |
Class C | | (118 | ) | (25 | ) | (334 | ) | (73 | ) | (864 | ) | (512 | ) |
Class I | | (93 | ) | (322 | ) | (5,706 | ) | (4,386 | ) | (4,342 | ) | — | |
| | (605 | ) | (528 | ) | (7,414 | ) | (4,913 | ) | (9,333 | ) | (1,934 | ) |
Automatic conversions: | | | | | | | | | | | | | |
Class A | | 15 | | 49 | | 143 | | 106 | | 895 | | 254 | |
Class B | | (15 | ) | (49 | ) | (153 | ) | (113 | ) | (1,050 | ) | (298 | ) |
| | — | | — | | (10 | ) | (7 | ) | (155 | ) | (44 | ) |
Net increase (decrease) in shares outstanding: | | | | | | | | | | | | | |
Class A | | (281 | ) | (14 | ) | (628 | ) | (73 | ) | (1,911 | ) | (147 | ) |
Class B | | (109 | ) | (87 | ) | (753 | ) | (385 | ) | (2,359 | ) | (876 | ) |
Class C | | (116 | ) | (5 | ) | (334 | ) | (73 | ) | (864 | ) | (412 | ) |
Class I | | 2,147 | | 6,416 | | 42,269 | | 9,780 | | 42,405 | | 6,234 | |
| | 1,641 | | 6,310 | | 40,554 | | 9,249 | | 37,271 | | 4,799 | |
The notes to the financial statements are an integral part of this report.
191
| | Transamerica PIMCO Real Return
TIPS | | Transamerica PIMCO Total Return | |
| | October 31, 2009 | | October 31, 2008 | | October 31, 2009 | | October 31, 2008 | |
From operations: | | | | | | | | | |
Net investment income | | $ | 21,900 | | $ | 33,282 | | $ | 26,509 | | $ | 27,295 | |
Net realized gain (loss)(a) | | 9,781 | | (2,877 | ) | 24,942 | | 24,977 | |
Change in unrealized appreciation (depreciation)(b) | | 96,351 | | (64,174 | ) | 61,021 | | (78,111 | ) |
Net increase (decrease) in net assets resulting from operations | | 128,032 | | (33,769 | ) | 112,472 | | (25,839 | ) |
| | | | | | | | | |
Distributions to shareholders: | | | | | | | | | |
From net investment income: | | | | | | | | | |
Class A | | (69 | ) | (131 | ) | (273 | ) | (188 | ) |
Class B | | (51 | ) | (113 | ) | (248 | ) | (259 | ) |
Class C | | (44 | ) | (91 | ) | (185 | ) | (143 | ) |
Class I | | (22,794 | ) | (35,353 | ) | (35,568 | ) | (24,014 | ) |
| | (22,958 | ) | (35,688 | ) | (36,274 | ) | (24,604 | ) |
From net realized gains: | | | | | | | | | |
Class A | | (13 | ) | — | | (92 | ) | (25 | ) |
Class B | | (10 | ) | — | | (89 | ) | (42 | ) |
Class C | | (8 | ) | — | | (62 | ) | (20 | ) |
Class I | | (3,862 | ) | — | | (11,115 | ) | (2,969 | ) |
| | (3,893 | ) | — | | (11,358 | ) | (3,056 | ) |
Total distributions to shareholders | | (26,851 | ) | (35,688 | ) | (47,632 | ) | (27,660 | ) |
| | | | | | | | | |
Capital share transactions: | | | | | | | | | |
Proceeds from shares sold: | | | | | | | | | |
Class A | | 9 | | 46 | | 3 | | 92 | |
Class B | | 1 | | 24 | | 7 | | 54 | |
Class C | | 7 | | 32 | | 15 | | 37 | |
Class I | | 90,261 | | 70,880 | | 14,123 | | 68,212 | |
| | 90,278 | | 70,982 | | 14,148 | | 68,395 | |
Dividends and distributions reinvested: | | | | | | | | | |
Class A | | 69 | | 79 | | 318 | | 146 | |
Class B | | 49 | | 68 | | 283 | | 200 | |
Class C | | 43 | | 49 | | 195 | | 101 | |
Class I | | 26,655 | | 25,244 | | 46,683 | | 20,711 | |
| | 26,816 | | 25,440 | | 47,479 | | 21,158 | |
Cost of shares redeemed: | | | | | | | | | |
Class A | | (2,950 | ) | (903 | ) | (5,808 | ) | (1,086 | ) |
Class B | | (1,787 | ) | (480 | ) | (5,045 | ) | (1,837 | ) |
Class C | | (1,688 | ) | (525 | ) | (3,675 | ) | (462 | ) |
Class I | | (85,752 | ) | (97,080 | ) | (174,373 | ) | (21,488 | ) |
| | (92,177 | ) | (98,988 | ) | (188,901 | ) | (24,873 | ) |
Automatic conversions: | | | | | | | | | |
Class A | | 233 | | 308 | | 367 | | 1,285 | |
Class B | | (233 | ) | (308 | ) | (367 | ) | (1,285 | ) |
| | — | | — | | — | | — | |
Net increase (decrease) in net assets resulting from capital shares transactions | | 24,917 | | (2,566 | ) | (127,274 | ) | 64,680 | |
| | | | | | | | | |
Net increase (decrease) in net assets | | 126,098 | | (72,023 | ) | (62,434 | ) | 11,181 | |
| | | | | | | | | |
Net assets: | | | | | | | | | |
Beginning of year | | $ | 626,625 | | $ | 698,648 | | $ | 567,763 | | $ | 556,582 | |
End of year | | $ | 752,723 | | $ | 626,625 | | $ | 505,329 | | $ | 567,763 | |
Undistributed net investment income | | $ | 8,924 | | $ | 1,933 | | $ | 854 | | $ | 11,197 | |
The notes to the financial statements are an integral part of this report.
192
| | Transamerica PIMCO Real Return
TIPS | | Transamerica PIMCO Total Return | |
| | October 31, 2009 | | October 31, 2008 | | October 31, 2009 | | October 31, 2008 | |
Share activity: | | | | | | | | | |
Shares issued: | | | | | | | | | |
Class A | | 1 | | 2 | | 1 | | 5 | |
Class B | | — | | — | | — | | 1 | |
Class C | | 1 | | 1 | | 2 | | 1 | |
Class I | | 9,035 | | 5,765 | | 1,332 | | 5,939 | |
| | 9,037 | | 5,768 | | 1,335 | | 5,946 | |
Shares issued-reinvested from distributions: | | | | | | | | | |
Class A | | 7 | | 10 | | 33 | | 18 | |
Class B | | 5 | | 9 | | 30 | | 23 | |
Class C | | 4 | | 7 | | 20 | | 13 | |
Class I | | 2,650 | | 3,387 | | 4,858 | | 2,600 | |
| | 2,666 | | 3,413 | | 4,941 | | 2,654 | |
Shares redeemed: | | | | | | | | | |
Class A | | (285 | ) | (86 | ) | (547 | ) | (104 | ) |
Class B | | (173 | ) | (47 | ) | (479 | ) | (177 | ) |
Class C | | (165 | ) | (51 | ) | (347 | ) | (45 | ) |
Class I | | (8,878 | ) | (9,325 | ) | (17,605 | ) | (2,124 | ) |
| | (9,501 | ) | (9,509 | ) | (18,978 | ) | (2,450 | ) |
Automatic conversions: | | | | | | | | | |
Class A | | 24 | | 29 | | 37 | | 121 | |
Class B | | (24 | ) | (29 | ) | (37 | ) | (121 | ) |
| | — | | — | | — | | — | |
Net increase (decrease) in shares outstanding: | | | | | | | | | |
Class A | | (253 | ) | (45 | ) | (476 | ) | 40 | |
Class B | | (192 | ) | (67 | ) | (486 | ) | (274 | ) |
Class C | | (160 | ) | (43 | ) | (325 | ) | (31 | ) |
Class I | | 2,807 | | (173 | ) | (11,415 | ) | 6,415 | |
| | 2,202 | | (328 | ) | (12,702 | ) | 6,150 | |
(a) Net realized gain (loss) includes investment securities, futures contracts, written options and swaptions, securities sold short, swaps, and foreign currency transactions.
(b) Change in unrealized appreciation (depreciation) includes investment securities, futures contracts, written options and swaptions, securities sold short, swaps, and foreign currency translation.
The notes to the financial statements are an integral part of this report.
193
FINANCIAL HIGHLIGHTS
For the periods and years ended:
For a share outstanding throughout each period
| | Transamerica Clarion Global Real Estate Securities | | | | | |
| | October 31,
2009 | | October 31,
2008 | | October 31,
2007 | | October 31,
2006(a) | | | | | |
Net asset value | | | | | | | | | | | | | |
Beginning of year | | $ | 9.52 | | $ | 20.48 | | $ | 20.25 | | $ | 15.85 | | | | | |
| | | | | | | | | | | | | |
Investment operations | | | | | | | | | | | | | |
Net investment income(b) | | 0.29 | | 0.32 | | 0.36 | | 0.21 | | | | | |
Net realized and unrealized gain (loss) on investments | | 1.15 | | (8.33 | ) | 2.45 | | 5.85 | | | | | |
Total from investment operations | | 1.44 | | (8.01 | ) | 2.81 | | 6.06 | | | | | |
| | | | | | | | | | | | | |
Distributions | | | | | | | | | | | | | |
Net investment income | | (0.19 | ) | (0.90 | ) | (0.80 | ) | (0.28 | ) | | | | |
Net realized gains on investments | | — | | (2.05 | ) | (1.78 | ) | (1.38 | ) | | | | |
Total distributions | | (0.19 | ) | (2.95 | ) | (2.58 | ) | (1.66 | ) | | | | |
| | | | | | | | | | | | | |
Net asset value | | | | | | | | | | | | | |
End of year | | $ | 10.77 | | $ | 9.52 | | $ | 20.48 | | $ | 20.25 | | | | | |
| | | | | | | | | | | | | |
Total return(c) | | 15.72 | % | (44.82 | )% | 15.11 | % | 41.43 | %(d) | | | | |
| | | | | | | | | | | | | |
Net assets end of year | | $ | 285,502 | | $ | 232,115 | | $ | 367,750 | | $ | 331,620 | | | | | |
| | | | | | | | | | | | | |
Ratio and supplemental data | | | | | | | | | | | | | |
| | | | | | | | | | | | | |
Expenses to average net assets: | | | | | | | | | | | | | |
After reimbursement/recapture | | 0.93 | % | 0.89 | % | 0.88 | % | 0.91 | %(e) | | | | |
Before reimbursement/recapture | | 0.93 | % | 0.89 | % | 0.88 | % | 0.91 | %(e) | | | | |
Net investment income, to average net assets | | 3.30 | % | 2.29 | % | 1.29 | % | 1.27 | %(e) | | | | |
Portfolio turnover rate | | 61 | % | 41 | % | 72 | % | 76 | %(d) | | | | |
For a share outstanding throughout each period
| | Transamerica Jennison Growth | | Transamerica MFS International
Equity | |
| | October 31,
2009 | | October 31,
2008 | | October 31,
2007 | | October 31,
2006(a) | | October 31,
2009 | | October 31,
2008(f) | |
Net asset value | | | | | | | | | | | | | |
Beginning of year | | $ | 8.37 | | $ | 13.05 | | $ | 11.40 | | $ | 11.43 | | $ | 6.58 | | $ | 10.00 | |
| | | | | | | | | | | | | |
Investment operations | | | | | | | | | | | | | |
Net investment income(b) | | 0.01 | | 0.02 | | 0.03 | | — | (g) | 0.12 | | 0.02 | |
Net realized and unrealized gain (loss) on investments | | 1.81 | | (4.68 | ) | 2.08 | | 0.18 | | 1.46 | | (3.44 | ) |
Total from investment operations | | 1.82 | | (4.66 | ) | 2.11 | | 0.18 | | 1.58 | | (3.42 | ) |
| | | | | | | | | | | | | |
Distributions | | | | | | | | | | | | | |
Net investment income | | (0.02 | ) | (0.02 | ) | — | | — | | — | | — | |
Net realized gains on investments | | — | | — | | (0.46 | ) | (0.21 | ) | — | | — | |
Total distributions | | (0.02 | ) | (0.02 | ) | (0.46 | ) | (0.21 | ) | — | | — | |
| | | | | | | | | | | | | |
Net asset value | | | | | | | | | | | | | |
End of year | | $ | 10.17 | | $ | 8.37 | | $ | 13.05 | | $ | 11.40 | | $ | 8.16 | | $ | 6.58 | |
| | | | | | | | | | | | | |
Total return(c) | | 21.79 | % | (35.77 | )% | 19.14 | % | 1.50 | %(d) | 24.01 | % | (34.20 | )%(d) |
| | | | | | | | | | | | | |
Net assets end of year | | $ | 654,610 | | $ | 184,981 | | $ | 160,815 | | $ | 96,273 | | $ | 396,754 | | $ | 40,997 | |
| | | | | | | | | | | | | |
Ratio and supplemental data | | | | | | | | | | | | | |
| | | | | | | | | | | | | |
Expenses to average net assets: | | | | | | | | | | | | | |
After reimbursement/recapture | | 0.85 | % | 0.85 | % | 0.87 | % | 0.89 | %(e) | 1.09 | % | 1.23 | %(e) |
Before reimbursement/recapture | | 0.85 | % | 0.85 | % | 0.87 | % | 0.89 | %(e) | 1.09 | % | 1.23 | %(e) |
Net investment income (loss), to average net assets | | 0.16 | % | 0.21 | % | 0.22 | % | (0.02 | )%(e) | 1.78 | % | 0.71 | %(e) |
Portfolio turnover rate | | 82 | % | 70 | % | 63 | % | 80 | %(d) | 24 | % | 37 | %(d) |
The notes to the financial statements are an integral part of this report.
194
For a share outstanding throughout each period
| | Transamerica PIMCO Real Return TIPS | |
| | October 31,
2009 | | October 31,
2008 | | October 31,
2007 | | October 31,
2006 | | October 31,
2005(h) | |
Net asset value | | | | | | | | | | | |
Beginning of year | | $ | 9.21 | | $ | 10.21 | | $ | 10.05 | | $ | 10.25 | | $ | 10.45 | |
| | | | | | | | | | | |
Investment operations | | | | | | | | | | | |
Net investment income(b) | | 0.32 | | 0.47 | | 0.38 | | 0.48 | | 0.37 | |
Net realized and unrealized gain (loss) on investments | | 1.58 | | (0.96 | ) | 0.16 | | (0.22 | ) | (0.04 | ) |
Total from investment operations | | 1.90 | | (0.49 | ) | 0.54 | | 0.26 | | 0.33 | |
| | | | | | | | | | | |
Distributions | | | | | | | | | | | |
Net investment income | | (0.33 | ) | (0.51 | ) | (0.38 | ) | (0.45 | ) | (0.36 | ) |
Net realized gains on investments | | (0.06 | ) | — | | — | | (0.01 | ) | (0.17 | ) |
Total distributions | | (0.39 | ) | (0.51 | ) | (0.38 | ) | (0.46 | ) | (0.53 | ) |
| | | | | | | | | | | |
Net asset value | | | | | | | | | | | |
End of year | | $ | 10.72 | | $ | 9.21 | | $ | 10.21 | | $ | 10.05 | | $ | 10.25 | |
| | | | | | | | | | | |
Total return(c) | | 21.00 | % | (5.29 | )% | 5.54 | % | 2.55 | % | 3.20 | %(d) |
| | | | | | | | | | | |
Net assets end of year | | $ | 752,723 | | $ | 621,092 | | $ | 690,942 | | $ | 603,597 | | $ | 295,966 | |
| | | | | | | | | | | |
Ratio and supplemental data | | | | | | | | | | | |
| | | | | | | | | | | |
Expenses to average net assets: | | | | | | | | | | | |
After reimbursement/recapture | | 0.74 | % | 0.74 | % | 0.73 | % | 0.73 | % | 0.73 | %(e) |
Before reimbursement/recapture | | 0.74 | % | 0.74 | % | 0.73 | % | 0.73 | % | 0.73 | %(e) |
Net investment income, to average net assets | | 3.23 | % | 4.47 | % | 3.82 | % | 4.79 | % | 3.60 | %(e) |
Portfolio turnover rate | | 583 | % | 1,028 | % | 375 | % | 384 | % | 662 | %(d) |
For a share outstanding throughout each period
| | Transamerica PIMCO Total Return | | | |
| | October 31,
2009 | | October 31,
2008 | | October 31,
2007 | | October 31,
2006(a) | | | |
Net asset value | | | | | | | | | | | |
Beginning of year | | $ | 9.58 | | $ | 10.47 | | $ | 10.28 | | $ | 10.12 | | | |
| | | | | | | | | | | |
Investment operations | | | | | | | | | | | |
Net investment income(b) | | 0.49 | | 0.49 | | 0.46 | | 0.41 | | | |
Net realized and unrealized gain (loss) on investments | | 1.64 | | (0.88 | ) | 0.18 | | 0.12 | | | |
Total from investment operations | | 2.13 | | (0.39 | ) | 0.64 | | 0.53 | | | |
| | | | | | | | | | | |
Distributions | | | | | | | | | | | |
Net investment income | | (0.67 | ) | (0.44 | ) | (0.44 | ) | (0.37 | ) | | |
Net realized gains on investments | | (0.19 | ) | (0.06 | ) | (0.01 | ) | — | | | |
Total distributions | | (0.86 | ) | (0.50 | ) | (0.45 | ) | (0.37 | ) | | |
| | | | | | | | | | | |
Net asset value | | | | | | | | | | | |
End of year | | $ | 10.85 | | $ | 9.58 | | $ | 10.47 | | $ | 10.28 | | | |
| | | | | | | | | | | |
Total return(c) | | 23.74 | % | (4.04 | )% | 6.33 | % | 5.33 | %(d) | | |
| | | | | | | | | | | |
Net assets end of year | | $ | 505,329 | | $ | 555,428 | | $ | 540,310 | | $ | 268,173 | | | |
| | | | | | | | | | | |
Ratio and supplemental data | | | | | | | | | | | |
| | | | | | | | | | | |
Expenses to average net assets: | | | | | | | | | | | |
After reimbursement/recapture | | 0.74 | % | 0.75 | % | 0.75 | % | 0.80 | %(e) | | |
Before reimbursement/recapture | | 0.74 | % | 0.75 | % | 0.75 | % | 0.80 | %(e) | | |
Net investment income, to average net assets | | 4.95 | % | 4.66 | % | 4.39 | % | 4.18 | %(e) | | |
Portfolio turnover rate | | 841 | % | 751 | % | 756 | % | 544 | %(d) | | |
(a) Commenced operations on November 15, 2005.
(b) Calculated based on average number of shares outstanding.
(c) Total return has been calculated for the applicable period without deduction of a sales load, if any, on an initial purchase.
(d) Not annualized.
(e) Annualized.
(f) Commenced operations on June 10, 2008.
(g) Rounds to less than $(0.01) or $0.01.
(h) Commenced operations on November 8, 2004.
The notes to the financial statements are an integral part of this report.
195
NOTES TO FINANCIAL STATEMENTS
At October 31, 2009
(all amounts in thousands)
NOTE 1. ORGANIZATION AND SIGNIFICANT ACCOUNTING POLICIES
Transamerica Funds (the “Trust”) is an open-end management investment company registered under the Investment Company Act of 1940, as amended (the “1940 Act”). Transamerica AllianceBernstein International Value, Transamerica BlackRock Global Allocation, Transamerica BlackRock Large Cap Value, Transamerica BlackRock Natural Resources, Transamerica BNY Mellon Market Neutral Strategy, Transamerica Federated Market Opportunity, Transamerica JPMorgan Core Bond, Transamerica JPMorgan International Bond, Transamerica JPMorgan Mid Cap Value, Transamerica Loomis Sayles Bond, Transamerica Neuberger Berman International, Transamerica Oppenheimer Developing Markets, Transamerica Oppenheimer Small- & Mid-Cap Value, Transamerica Schroders International Small Cap, Transamerica Third Avenue Value, Transamerica Thornburg International Value, Transamerica UBS Dynamic Alpha, Transamerica UBS Large Cap Value, Transamerica Van Kampen Emerging Markets Debt, Transamerica Van Kampen Mid-Cap Growth, Transamerica Van Kampen Small Company Growth, and Transamerica WMC Emerging Markets, Transamerica Clarion Global Real Estate Securities, Transamerica Jennison Growth, Transamerica MFS International Equity, Transamerica PIMCO Real Return TIPS, Transamerica PIMCO Total Return (each a “Fund”; collectively, the “Funds”) are part of Transamerica Funds.
Effective September 25, 2009, Class A, Class B, and Class C shares were liquidated for the following funds: Transamerica Clarion Global Real Estates Securities, Transamerica Jennison Growth, Transamerica MFS International Equity, Transamerica PIMCO Real Return TIPS, and Transamerica PIMCO Total Return. Class I shares is the only remaining share class for these funds.
Class I shares are currently offered for investment primarily to certain affiliated asset allocation funds and other investors, including institutional investors such as foreign insurers, domestic insurance companies and their separate accounts, and eligible retirement plans whose record keepers or financial service firm intermediaries have entered into agreements with Transamerica Funds or its agents.
Transamerica BlackRock Natural Resources, Transamerica Clarion Global Real Estates Securities, Transamerica JPMorgan International Bond, Transamerica PIMCO Real Return TIPS, Transamerica Third Avenue Value, Transamerica UBS Dynamic Alpha, and Transamerica Van Kampen Emerging Markets Debt are “non-diversified” under the 1940 Act.
This report should be read in conjunction with the Funds’ current prospectus, which contains more complete information about the Funds, including investment objectives and strategies.
In the normal course of business, the Funds enter into contracts that contain a variety of representations that provide general indemnifications. The Funds’ maximum exposure under these arrangements is unknown, as this would involve future claims that may be made against the Funds and/or their affiliates that have not yet occurred. However, based on experience, the Funds expect the risk of loss to be remote.
In preparing the Funds’ financial statements in accordance with accounting principles generally accepted in the United States of America (“GAAP”), estimates or assumptions (which could differ from actual results) may be used that affect reported amounts and disclosures. The following is a summary of significant accounting policies followed by the Funds.
Repurchase agreements: Securities purchased subject to repurchase agreements are held at the Funds’ custodian and, pursuant to the terms of the repurchase agreements, must have an aggregate market value greater than or equal to 100% of the resale price. The Funds will bear the risk of value fluctuations until the securities can be sold and may encounter delays and incur costs in liquidating the securities. In the event of bankruptcy or insolvency of the seller, delays and costs may be incurred.
Foreign currency denominated investments: The accounting records of the Funds are maintained in U.S. dollars. Securities and other assets and liabilities denominated in foreign currencies are translated into U.S. dollars at the closing exchange rate each day. Income, expenses, purchases and sales of investment securities denominated in foreign currencies are translated at prevailing exchange rates on the respective dates of such transactions. Each Fund combines fluctuations from currency exchange rates and fluctuations in value when computing net realized and unrealized gains or losses from investments.
Net foreign currency gains and losses resulting from changes in exchange rates include: 1) foreign currency fluctuations between trade date and settlement date of investment security transactions; 2) gains and losses on forward foreign currency contracts; and 3) the difference between the receivable amounts of interest and dividends recorded in the accounting records in U.S. dollars and the amounts actually received.
Foreign currency denominated assets may involve risks not typically associated with domestic transactions. These risks include revaluation of currencies, adverse fluctuations in foreign currency values and possible adverse political, social and economic developments, including those particular to a specific industry, country or region.
Foreign capital gains taxes: The Funds may be subject to taxes imposed by countries in which they invest, with respect to their investments in issuers existing or operating in such countries. Such taxes are generally based on income earned or repatriated and capital gains realized on the sale of such investments. The Funds accrue such taxes when the related income or capital gains are earned. Some countries require governmental approval for the repatriation of investment income, capital or the proceeds of sales earned by foreign investors. In addition, if there is deterioration in a country’s balance of payments or for other reasons, a country may impose temporary restrictions on foreign capital remittances abroad.
196
NOTES TO FINANCIAL STATEMENTS (continued)
At October 31, 2009
(all amounts in thousands)
NOTE 1. (continued)
Forward foreign currency contracts: The Funds are subject to foreign currency exchange rate risk exposure in the normal course of pursuing their investment objectives. The Funds that enter into forward foreign currency contracts are using the contracts to hedge against exchange rate risk arising from investments in securities denominated in foreign currencies. Forward foreign currency contracts are marked to market daily, with the change in value recorded as an unrealized gain or loss. When the contracts are settled, a realized gain or loss is incurred. Risks arise from changes in market value of the underlying currencies and from the possible inability of counterparties to meet the terms of their contracts.
Open forward foreign currency contracts at October 31, 2009 are listed in the Schedules of Investments.
Option contracts: The Funds are subject to equity price risk, interest rate risk, and foreign currency exchange rate risk in the normal course of pursuing their investment objectives. The Funds enter into option contracts to manage exposure to various market fluctuations. The primary risks associated with options are an imperfect correlation between the change in value of the securities held and the prices of the option contracts; the possibility of an illiquid market and an inability of the counterparty to meet the contract terms. Funds write call and put options on futures, swaps (“swaptions”), securities or currencies they own or in which they invest. When a Fund writes a covered call or put option/swaption, an amount equal to the premium received by a Fund is included in the Fund’s Statement of Assets and Liabilities as an asset and as an equivalent liability. Premiums received from writing options/swaptions which expire are treated as realized gains. Premiums received from writing options/swaptions which are exercised or closed are added to the proceeds or offset against amounts paid on the underlying future, swap, security or currency transaction to determine the realized gain or loss. Options are marked-to-market daily to reflect the current value of the option/swaption written.
The underlying face amounts of open option and swaption contracts at October 31, 2009 are listed in the Schedules of Investments.
Transactions in written options were as follows:
Transamerica BlackRock Global Allocation | | Premium | | Notional
Amount | |
Balance at October 31, 2008 | | $ | 2,296 | | $ | 556 | |
Sales | | 1,573 | | 412 | |
Closing Buys | | (1,246 | ) | (195 | ) |
Expirations | | (1,783 | ) | (506 | ) |
Exercised | | (227 | ) | (78 | ) |
Balance at October 31, 2009 | | $ | 613 | | $ | 189 | |
Transamerica Federated Market
Opportunity | | Premium | | Notional
Amount | |
Balance at October 31, 2008 | | $ | 172 | | $ | 30 | |
Sales | | — | | — | |
Closing Buys | | (57 | ) | (10 | ) |
Expirations | | (115 | ) | (20 | ) |
Exercised | | — | | — | |
Balance at October 31, 2009 | | $ | — | | $ | — | |
Transactions in written swaptions were as follows:
Transamerica PIMCO Real Return TIPS | | Premium | | Notional
Amount | |
Balance at October 31, 2008 | | $ | 410 | | $ | 13,700 | |
Sales | | 2,083 | | 263,800 | |
Closing Buys | | (519 | ) | (41,800 | ) |
Expirations | | (537 | ) | (91,500 | ) |
Exercised | | — | | — | |
Balance at October 31, 2009 | | $ | 1,437 | | $ | 144,200 | |
Transamerica PIMCO Real Return TIPS | | Premium | | Notional
Amount | |
Balance at October 31, 2008 | | $ | 197 | | $ | 322 | |
Sales | | 200 | | 1,004 | |
Closing Buys | | — | | — | |
Expirations | | (397 | ) | (1,326 | ) |
Exercised | | — | | — | |
Balance at October 31, 2009 | | $ | — | | $ | — | |
Transamerica PIMCO Total Return | | Premium | | Notional
Amount | |
Balance at October 31, 2008 | | $ | 87 | | 309 | |
Sales | | 173 | | 401 | |
Closing Buys | | (19 | ) | (138 | ) |
Expirations | | (183 | ) | (498 | ) |
Exercised | | (58 | ) | (74 | ) |
Balance at October 31, 2009 | | $ | — | | $ | — | |
| | | | | | | |
Transamerica PIMCO Total Return | | Premium | | Notional
Amount | |
Balance at October 31, 2008 | | $ | 1,494 | | $ | 63,500 | |
Sales | | 1,448 | | 213,600 | |
Closing Buys | | (1,894 | ) | (130,300 | ) |
Expirations | | (370 | ) | (53,000 | ) |
Exercised | | — | | — | |
Balance at October 31, 2009 | | $ | 678 | | $ | 93,800 | |
197
NOTES TO FINANCIAL STATEMENTS (continued)
At October 31, 2009
(all amounts in thousands)
NOTE 1. (continued)
Futures contracts: The Funds are subject to equity price risk, interest rate risk, and foreign currency exchange rate risk in the normal course of pursuing their investment objectives. Certain Funds use futures contracts to gain exposure to, or hedge against changes in the value of equities, interest rates or foreign currencies. A futures contract represents a commitment for the future purchase or sale of an asset at a specified price on a specified date. Upon entering into such contracts, the Funds are required to deposit with the broker either in cash or securities an initial margin in an amount equal to a certain percentage of the contract amount.
Subsequent payments (variation margin) are paid or received by the Funds each day, depending on the daily fluctuations in the value of the contracts, and are recorded for financial statement purposes as unrealized gains or losses by the Funds. Upon entering into such contracts, the Funds bear the risk of interest or exchange rates or securities prices moving unexpectedly, in which case, the Funds may not achieve the anticipated benefits of the futures contracts and may realize losses. With futures, there is minimal counterparty credit risk to the Funds since futures are exchange traded and the exchange’s clearinghouse, as counterparty to all exchange traded futures, guarantees the futures against default.
The underlying face amounts of open futures contracts at October 31, 2009 are listed in the Schedules of Investments. The variation margin receivable or payable, as applicable, is included in the Statements of Assets and Liabilities.
Swap agreements: Swap agreements are privately negotiated agreements between the Funds and a counterparty to exchange or swap investments, cash flows, assets, foreign currencies or market-linked returns at specified, future intervals. Certain Funds enter into credit default, cross-currency, interest rate, total return, variance and other forms of swap agreements to manage exposure to credit, currency and interest rate risk. In connection with these agreements, securities may be identified as collateral in accordance with the terms of the respective swap agreements to provide assets of value and recourse in the event of default or bankruptcy/insolvency. Specific risks and accounting related to each type of swap agreement are identified and described in the following paragraphs.
Swaps are marked to market daily based upon values from third party vendors or quotations from market makers to the extent available and the change in value, if any, is recorded as an unrealized gain or loss on the Statements of Assets and Liabilities. Payments received or made at the beginning of the measurement period are reflected as such on the Statements of Assets and Liabilities and represent payments made or received upon entering into the swap agreement to compensate for differences between the stated terms of the swap agreement and prevailing market conditions (credit spreads, currency exchange rates, interest rates, and other relevant factors). These upfront payments are recorded as realized gains or losses on the Statements of Operations over the life of the swap. A liquidation payment received or made at the termination of the swap is recorded as realized gain or loss on the Statements of Operations. Net periodic payments received or paid by a Fund are included as part of realized gains or losses on the Statements of Operations.
Credit default swap agreements: The Funds are subject to credit risk in the normal course of pursuing their investment objective. The Funds enter into credit default swaps to manage their exposure to the market or certain sectors of the market, to reduce their risk exposure to defaults of corporate and sovereign issuers, or to create exposure to corporate or sovereign issuers to which it is not otherwise exposed. Credit default swaps involve the exchange of a fixed rate premium for protection against the loss in value of an underlying security in the event of a defined credit event, such as payment default or bankruptcy (buy protection).
Under a credit default swap, one party acts as a guarantor by receiving the fixed periodic payment in exchange for the commitment to purchase the underlying security at par if the defined credit event occurs (sell protection). The Funds’ maximum risk of loss from counterparty risk, either as the protection seller or as the protection buyer, is the notional amount of the contract. This risk is mitigated by having a master netting arrangement between the Funds and the counterparty and by the posting of collateral by the counterparty to the Funds to cover the Funds’ exposure to the counterparty.
Certain Funds sell credit default swaps which expose them to risk of loss from credit risk related events specified in the contracts. Although contract-specific, credit events are generally defined as bankruptcy, failure to pay, restructuring, obligation acceleration, obligation default, or repudiation/moratorium. The aggregate fair value of the credit default swaps are disclosed in the Schedules of Investments. The aggregate fair value of assets posted as collateral, net of assets received as collateral, for these swaps is included in the footnotes to the Schedules of Investments. If a defined credit event had occurred during the period, the swaps’ credit-risk-related contingent features would have been triggered and the Funds would have been required to pay the notional amounts for the credit default swaps with a sell protection less the value of the contracts’ related reference obligations.
Interest rate swap agreements: The Funds are subject to interest rate risk exposure in the normal course of pursuing their investment objectives. To help hedge against this risk, the Funds enter into interest rate swap contracts. Interest rate swaps are agreements between two parties to exchange cash flows based on a notional principal amount. The Funds with interest rate swap agreements can elect to pay a fixed rate and receive a floating rate, or, receive a fixed rate and pay a floating rate on a notional principal amount. The risks of interest rate swaps include changes in market conditions which will affect the value of the contract or the cash flows and the possible inability of the counterparty to fulfill its obligations under the agreement. The Funds’ maximum risk of loss from counterparty credit risk is the discounted net value of the cash flows to be received from/paid to the counterparties over the contracts’ remaining lives, to the extent that that amount is positive. This risk is mitigated by having a master netting arrangement between the Funds and the counterparty and by the posting of collateral by the counterparty to the Funds to cover the Funds’ exposure to the counterparty.
198
NOTES TO FINANCIAL STATEMENTS (continued)
At October 31, 2009
(all amounts in thousands)
NOTE 1. (continued)
Total return swap agreements: The Funds are subject to equity and other risks related to the underlying investments of the swap agreement in the normal course of pursuing their investment objectives. Total return swap agreements on commodities involve commitments where by cash flows are exchanged based on the price of a commodity and in exchange for either a fixed or floating price or rate. One party would receive payments based on the market value of the commodity involved and pay a fixed amount. Total return swap agreements on indices involve commitments to pay interest in exchange for a market-linked return. One counterparty pays out the total return of a specific reference asset, which may be an equity, index, or bond, and in return receives a regular stream of payments.
The aggregate fair value of the total return swaps is disclosed in the Schedules of Investments. Payments received or made at the beginning of the measurement period represent payments made or received upon entering into the swap agreements to compensate for differences between the stated terms of the swap agreement and prevailing market conditions. To the extent the total return of the security or index underlying the transaction exceeds or falls short of the offsetting interest rate obligation, the Funds will receive payments from or make payments to the counterparty.
Short sales: A short sale is a transaction in which a Fund sells securities it does not own, but has borrowed, in anticipation of a decline in the market price of the securities. The Funds are obligated to replace the borrowed securities at the market price at the time of replacement. The Funds’ obligation to replace the securities borrowed in connection with a short sale is fully secured by collateral deposited with the custodian. In addition, the Funds consider the short sale to be a borrowing by the Funds that is subject to the asset coverage requirements of the 1940 Act, as amended. The Funds incur a profit or a loss, depending upon whether the market price of the securities decreases or increases between the date of the short sale and the date on which the Funds must replace the borrowed securities. Short sales represent an aggressive trading practice with a high risk/return potential, and short sales involve special considerations. Risks of short sales include that possible losses from short sales may be unlimited (e.g., if the price of stocks sold short rises), whereas losses from direct purchases of securities are limited to the total amount invested, and the Funds may be unable to replace borrowed securities sold short.
The Funds investing in short sales are liable for any dividends payable on securities while those securities are in a short position and also bear other costs, such as charges for the prime brokerage accounts, in connection with its short positions. These costs are reported as broker expense on short sales in the Statements of Operations.
Loan participations/assignments: Participations/assignments in commercial loans may be secured or unsecured. These investments may include standby financing commitments, including revolving credit facilities that obligate the Funds to supply additional cash to the borrowers on demand. Loan participations/assignments involve risks of insolvency of the lending banks or other financial intermediaries. As such, the Funds assume the credit risks associated with the corporate borrowers and may assume the credit risks associated with the interposed banks or other financial intermediaries.
The Funds may be contractually obligated to receive approval from the agent banks and/or borrowers prior to the sale of these investments. Loan participations typically represent direct participation in loans to corporate borrowers, and generally are offered by banks or other financial institutions or lending syndicates. The Funds that participate in such syndications, or can buy a portion of the loans, become part lenders. Loans are often administered by agent banks acting as agents for all holders. The agent banks administer the terms of the loans, as specified in the loan agreements. In addition, the agent banks are normally responsible for the collection of principal and interest payments from the corporate borrowers and the apportionment of these payments to the credit of all institutions that are parties to the loan agreements. Unless, under the terms of the loans or other indebtedness, the portfolios have direct recourse against the corporate borrowers, the Funds may have to rely on the agent banks or other financial intermediaries to apply appropriate credit remedies against corporate borrowers.
TBA purchase commitments: To be announced (“TBA”) purchase commitments are entered into to purchase securities for a fixed price at a future date, typically not to exceed 45 days. TBA purchase commitments are considered securities in themselves, and involve a risk of loss if the value of the security to be purchased declines prior to settlement date, in addition to the risk of decline in the value of the Funds’ other assets. Unsettled TBA purchase commitments are valued at the current value of the underlying securities, according to the procedures described under Security Valuations.
Treasury Inflation-Protected Securities (“TIPS”): Certain Funds invest in TIPS, specially structured bonds in which the principal amount is adjusted daily to keep pace with inflation as measured by the U.S. Consumer Price Index. The adjustments to principal due to inflation/deflation are reflected as increases/decreases to interest income with a corresponding adjustment to cost.
Restricted and illiquid securities: Restricted and illiquid securities are subject to legal or contractual restrictions on resale or are illiquid. Restricted securities generally may be resold in transactions exempt from registration. A security may be considered illiquid if it lacks a readily available market or if its valuation has not changed for a certain period of time. Disposal of these securities may involve time-consuming negotiations and expense, and prompt sale at the current valuation may be difficult.
The restricted and illiquid securities at October 31, 2009 are listed in the Schedules of Investments.
Cash overdraft: Throughout the year, the Funds may have cash overdraft balances. A fee is incurred on these overdrafts at a rate based on the federal funds rate.
199
NOTES TO FINANCIAL STATEMENTS (continued)
At October 31, 2009
(all amounts in thousands)
NOTE 1. (continued)
Securities lending: Securities are lent to qualified financial institutions and brokers. The lending of Funds’ securities exposes the Funds to risks such as the following: (i) the borrowers may fail to return the loaned securities; (ii) the borrowers may not be able to provide additional collateral; (iii) the Funds may experience delays in recovery of the loaned securities or delays in access to collateral; or (iv) the Funds may experience losses related to the investment collateral. To minimize certain risks, loan counterparties pledge cash collateral equal to at least the market value of the securities loaned. Cash collateral received is invested in the State Street Navigator Securities Lending Trust-Prime Portfolio, a money market mutual fund registered under the 1940 Act. By lending such securities, the Funds seek to increase their net investment income through the receipt of interest (after rebates and fees).
Such income is reflected separately on the Statements of Operations. The value of loaned securities and related collateral outstanding at October 31, 2009 are shown in the Schedules of Investments and Statements of Assets and Liabilities.
Income from loaned securities on the Statements of Operations is net of fees earned by the lending agent for its services.
Commission recapture: The sub-advisers of certain Funds, to the extent consistent with the best execution and usual commission rate policies and practices, have elected to place security transactions of the Funds with broker/dealers with which Transamerica Funds has established a Commission Recapture Program. A Commission Recapture Program is any arrangement under which a broker/dealer applies a portion of the commissions received by such broker/dealer on the security transactions to the Funds. In no event will commissions paid by the Funds be used to pay expenses that would otherwise be borne by any other funds within Transamerica Funds, or by any other party.
Recaptured commissions for the year ended October 31, 2009, are included in net realized gain (loss) in the Statements of Operations and are summarized as follows:
Fund | | Commissions | |
Transamerica AllianceBernstein International Value | | $ | — | (a) |
Transamerica Federated Market Opportunity | | 29 | |
Transamerica JPMorgan Mid Cap Value | | 9 | |
Transamerica Third Avenue Value | | 18 | |
Transamerica Thornburg International Value | | — | (a) |
Transamerica UBS Dynamic Alpha | | 9 | |
Transamerica UBS Large Cap Value | | 115 | |
Transamerica Van Kampen Mid-Cap Growth | | 15 | |
Transamerica Van Kampen Small Company Growth | | 11 | |
Transamerica WMC Emerging Markets | | 4 | |
Transamerica Clarion Global Real Estate Securities | | 32 | |
Transamerica Jennison Growth | | 63 | |
| | | | |
(a) Rounds to less than $1.
Security transactions and investment income: Security transactions are recorded on the trade date. Security gains and losses are calculated on the specific identification basis. Dividend income, if any, is recorded on the ex-dividend dates or, in the case of foreign securities, as soon as the Funds are informed of the ex-dividend dates. Interest income, including accretion of discounts and amortization of premiums, is recorded on the accrual basis commencing on the settlement date.
Dividend income related to Real Estate Investment Trusts (“REIT”) is recorded at management’s estimate of the income included in distributions from the REIT investments. Distributions received in excess of the estimated amount are recorded as a reduction of the cost of investments. The actual amounts of income, return of capital and capital gains are only determined by each REIT after the fiscal year end and may differ from the estimated amounts.
Dividend distributions: Distributions to shareholders are recorded on the ex-dividend dates and are determined in accordance with federal income tax regulations which may differ from GAAP.
Foreign taxes: The Funds may be subject to foreign taxes on income, gains on investments or currency repatriation, a portion of which may be recoverable. The Funds accrue such taxes and recoveries as applicable, based upon the current interpretation of tax rules and regulations that exist in the markets in which the Funds invest.
200
NOTES TO FINANCIAL STATEMENTS (continued)
At October 31, 2009
(all amounts in thousands)
NOTE 2. SECURITY VALUATIONS
All investments in securities are recorded at their estimated fair value. The Funds values their investments at the close of the New York Stock Exchange (“NYSE”), normally 4 p.m. ET, each day the NYSE is open for business. The Funds utilizes various methods to measure the fair value of their investments on a recurring basis. GAAP establishes a hierarchy that prioritizes inputs to valuation methods. The three Levels of inputs are:
Level 1—Unadjusted quoted prices in active markets for identical securities.
Level 2—Inputs, other than quoted prices included in Level 1, that are observable, either directly or indirectly. These inputs may include quoted prices for the identical instrument on an inactive market, prices for similar instruments, interest rates, prepayment speeds, credit risk, yield curves, default rates and similar data.
Level 3—Unobservable inputs, to the extent that relevant observable inputs are not available, representing the Funds’ own assumptions about the assumptions a market participant would use in valuing the investment, based on the best information available.
The availability of observable inputs can vary from security to security and is affected by a wide variety of factors, including, but not limited to, the type of security, whether the security is new and not yet established in the marketplace, the liquidity of markets, and other characteristics particular to the security. To the extent that valuation is based on models or inputs that are less observable or unobservable in the market, the determination of fair value requires more judgment. Accordingly, the degree of judgment exercised in determining fair value is generally greatest for instruments categorized in Level 3.
The inputs used to measure fair value may fall into different Levels of the fair value hierarchy. In such cases, for disclosure purposes, the Level in the fair value hierarchy that is assigned to the fair value measurement of a security is determined based on the lowest Level input that is significant to the fair value measurement in its entirety.
Fair value measurements: A description of the valuation techniques applied to the Funds’ major categories of assets and liabilities measured at fair value on a recurring basis is as follows:
Equity securities (common and preferred stock): Securities are stated at the last reported sales price or closing price on the day of valuation taken from the primary exchange where the security is principally traded. To the extent these securities are actively traded and valuation adjustments are not applied, they are categorized in Level 1 of the fair value hierarchy.
Foreign securities generally are valued based on quotations from the primary market in which they are traded and are categorized in Level 1. Because many foreign securities markets and exchanges close prior to the close of the NYSE, closing prices for foreign securities in those markets or on those exchanges do not reflect the events that occur after that close. Certain foreign securities may be fair valued using a pricing service that considers the correlation of the trading patterns of the foreign security to the intraday trading in the U.S. markets for investments such as American Depositary Receipts (“ADR”), financial futures, Exchange Traded Funds (“ETF”), and the movement of the certain indices of securities based on a statistical analysis of their historical relationship such valuations generally are categorized in Level 2.
Preferred stock and other equities traded on inactive markets or valued by reference to similar instruments are also generally categorized in Level 2.
Corporate bonds: The fair value of corporate bonds is estimated using various techniques, which consider recently executed transactions in securities of the issuer or comparable issuers, market price quotations (where observable), bond spreads, fundamental data relating to the issuer, and credit default swap spreads adjusted for any basis difference between cash and derivative instruments. While most corporate bonds are categorized in Level 2 of the fair value hierarchy, in instances where lower relative weight is placed on transaction prices, quotations, or similar observable inputs, they are categorized in Level 3.
Asset backed securities: The fair value of asset backed securities is estimated based on models that consider the estimated cash flows of each tranche of the entity, establish a benchmark yield, and develop an estimated tranche specific spread to the benchmark yield based on the unique attributes of the tranche. To the extent the inputs are observable and timely, the values would generally be categorized in Level 2 of the fair value hierarchy; otherwise they would be categorized as Level 3.
Short-term notes: Short-term notes are valued using amortized cost, which approximates fair value. To the extent the inputs are observable and timely, the values would be generally categorized in Level 2 of the fair value hierarchy.
U.S. government securities: U.S. government securities are normally valued using a model that incorporates market observable data such as reported sales of similar securities, broker quotes, yields, bids, offers, and reference data. Certain securities are valued by principally using dealer quotations. U.S. government securities generally are categorized in Level 2 of the fair value hierarchy.
201
NOTES TO FINANCIAL STATEMENTS (continued)
At October 31, 2009
(all amounts in thousands)
NOTE 2. (continued)
U.S ..government agency securities: U.S. government agency securities are comprised of two main categories consisting of agency issued debt and mortgage pass-throughs. Generally, agency issued debt securities are valued in a manner similar to U. S. government securities. Mortgage pass-throughs include to-be-announced (“TBA”) securities and mortgage pass-through certificates. Generally, TBA securities and mortgage pass-throughs are valued using dealer quotations. Depending on market activity levels and whether quotations or other observable data are used, these securities are typically categorized in Level 2 of the fair value hierarchy.
Restricted securities (equity and debt): Restricted securities for which quotations are not readily available are valued at fair value as determined in good faith by Transamerica Asset Management, Inc.’s (“TAM”) Valuation Committee under the supervision of the Board of Trustees. Restricted securities issued by publicly traded companies are generally valued at a discount to similar publicly traded securities. Restricted securities issued by nonpublic entities may be valued by reference to comparable public entities and/or fundamental data relating to the issuer. Depending on the relative significance of valuation inputs, these instruments may be classified in either Level 2 or Level 3 of the fair value hierarchy.
Derivative instruments: Listed derivatives that are actively traded are valued based on quoted prices from the exchange and generally are categorized in Level 1 of the fair value hierarchy. Over the counter (“OTC”) derivative contracts include forward, swap, and option contracts related to interest rates, foreign currencies, credit standing of reference entities, equity prices, or commodity prices. Depending on the product and the terms of the transaction, the fair value of the OTC derivative products are modeled by taking into account the counterparties’ creditworthiness and using a series of techniques, including simulation models. Many pricing models do not entail material subjectivity because the methodologies employed do not necessitate significant judgments and the pricing inputs are observed from actively quoted markets, as is the case for interest rate swap and option contracts. A substantial majority of OTC derivative products valued by the Funds using pricing models fall into this category and generally are categorized in Level 2 or the fair value hierarchy.
Other: Securities for which quotations are not readily available or whose values have been determined to be unreliable are valued at fair market value as determined in good faith by TAM’s Valuation Committee under the supervision of the Board of Trustees.
The hierarchy classification of inputs used to value the Funds’ investments, at October 31, 2009, as well as a reconciliation of assets for which significant unobservable inputs (Level 3) were used in determining value, are included at the end of the Funds’ Schedules of Investments.
NOTE 3. RELATED PARTY TRANSACTIONS
TAM is the Funds’ investment adviser and is directly owned by Western Reserve Life Assurance Co. of Ohio (77%) and AUSA Holding Company (23%) (“AUSA”), both of which are indirect, wholly owned subsidiaries of AEGON NV. AUSA is wholly owned by AEGON USA, LLC (“AEGON USA”), a financial services holding company whose primary emphasis is on life and health insurance, and annuity and investment products. AEGON USA is owned by AEGON US Holding Corporation, which is owned by Transamerica Corporation (DE). Transamerica Corporation (DE) is owned by The AEGON Trust, which is owned by AEGON International B.V., which is owned by AEGON NV, a Netherlands corporation, and a publicly traded international insurance group.
Transamerica Fund Services, Inc. (“TFS”) is the Funds’ administrator and transfer agent. Transamerica Capital, Inc. (“TCI”) is the Funds’ distributor/principal underwriter. TAM, TFS, and TCI are affiliates of AEGON NV.
Certain officers and trustees of the Funds are also officers and/or directors of TAM, TFS, and TCI.
202
NOTES TO FINANCIAL STATEMENTS (continued)
At October 31, 2009
(all amounts in thousands)
NOTE 3. (continued)
The following schedule reflects the percentage of the Funds that are owned by affiliated investment companies at October 31, 2009:
Transamerica AllianceBernstein International
Value | | Market
Values | | % of Net Assets | |
Transamerica Asset Allocation-Conservative Portfolio | | $ | 6,319 | | 2.00 | % |
Transamerica Asset Allocation-Growth Portfolio | | 36,720 | | 11.62 | |
Transamerica Asset Allocation-Moderate Portfolio | | 21,792 | | 6.89 | |
Transamerica Asset Allocation-Moderate Growth Portfolio | | 50,627 | | 16.02 | |
Transamerica Multi-Manager International Portfolio | | 31,415 | | 9.94 | |
Transamerica Asset Allocation-Conservative VP | | 11,048 | | 3.50 | |
Transamerica Asset Allocation-Growth VP | | 15,701 | | 4.97 | |
Transamerica Asset Allocation-Moderate Growth VP | | 63,856 | | 20.20 | |
Transamerica Asset Allocation-Moderate VP | | 29,685 | | 9.39 | |
Transamerica International Moderate Growth VP | | 47,204 | | 14.93 | |
Total | | $ | 314,367 | | 99.46 | % |
Transamerica BlackRock Global Allocation | | Market
Values | | % of Net Assets | |
Transamerica Asset Allocation-Conservative Portfolio | | $ | 18,323 | | 4.07 | % |
Transamerica Asset Allocation-Growth Portfolio | | 48,478 | | 10.77 | |
Transamerica Asset Allocation-Moderate Portfolio | | 39,588 | | 8.82 | |
Transamerica Asset Allocation-Moderate Growth Portfolio | | 81,623 | | 18.18 | |
Transamerica Multi-Manager Alternative Strategies Portfolio | | 12,503 | | 2.78 | |
Transamerica Multi-Manager International Portfolio | | 17,631 | | 3.92 | |
Transamerica Asset Allocation-Conservative VP | | 18,284 | | 4.07 | |
Transamerica Asset Allocation-Growth VP | | 31,909 | | 6.80 | |
Transamerica Asset Allocation-Moderate Growth VP | | 130,120 | | 27.75 | |
Transamerica Asset Allocation-Moderate VP | | 46,966 | | 10.02 | |
Total | | $ | 445,425 | | 97.18 | % |
Transamerica BlackRock Large Cap Value | | Market
Values | | % of Net Assets | |
Transamerica Asset Allocation-Conservative Portfolio | | $ | 45,173 | | 7.13 | % |
Transamerica Asset Allocation-Growth Portfolio | | 201,798 | | 31.85 | |
Transamerica Asset Allocation-Moderate Portfolio | | 123,699 | | 19.52 | |
Transamerica Asset Allocation-Moderate Growth Portfolio | | 257,674 | | 40.66 | |
Total | | $ | 628,344 | | 99.16 | % |
Transamerica BlackRock Natural Resources | | Market
Values | | % of Net Assets | |
Transamerica Asset Allocation-Conservative Portfolio | | $ | 9,531 | | 7.86 | % |
Transamerica Asset Allocation-Growth Portfolio | | 16,088 | | 13.26 | |
Transamerica Asset Allocation-Moderate Portfolio | | 24,304 | | 20.03 | |
Transamerica Asset Allocation-Moderate Growth Portfolio | | 38,127 | | 31.42 | |
Transamerica Multi-Manager Alternative Strategies Portfolio | | 21,482 | | 17.70 | |
Transamerica Asset Allocation-Growth VP | | 10,744 | | 8.85 | |
Total | | $ | 120,276 | | 99.12 | % |
Transamerica BNY Mellon Market Neutral
Strategy | | Market
Values | | % of Net Assets | |
Transamerica Asset Allocation-Conservative Portfolio | | $ | 7,291 | | 8.41 | % |
Transamerica Asset Allocation-Growth Portfolio | | 9,475 | | 10.93 | |
Transamerica Asset Allocation-Moderate Portfolio | | 15,098 | | 17.42 | |
Transamerica Asset Allocation-Moderate Growth Portfolio | | 27,309 | | 31.50 | |
Transamerica Multi-Manager Alternative Strategies Portfolio | | 19,041 | | 21.97 | |
Transamerica Asset Allocation-Growth VP | | 8,378 | | 9.67 | |
Total | | $ | 86,592 | | 99.90 | % |
Transamerica Federated Market Opportunity | | Market
Values | | % of Net Assets | |
Transamerica Asset Allocation-Conservative Portfolio | | $ | 9,757 | | 11.40 | % |
Transamerica Asset Allocation-Growth Portfolio | | 12,116 | | 14.16 | |
Transamerica Asset Allocation-Moderate Portfolio | | 17,985 | | 21.02 | |
Transamerica Asset Allocation-Moderate Growth Portfolio | | 23,014 | | 26.90 | |
Transamerica Multi-Manager Alternative Strategies Portfolio | | 21,848 | | 25.54 | |
Total | | $ | 84,720 | | 99.02 | % |
Transamerica JPMorgan Core Bond | | Market
Values | | % of Net Assets | |
Transamerica Asset Allocation-Conservative Portfolio | | $ | 20,136 | | 9.33 | % |
Transamerica Asset Allocation-Moderate Portfolio | | 27,273 | | 12.64 | |
Transamerica Asset Allocation-Moderate Growth Portfolio | | 32,207 | | 14.92 | |
Transamerica Asset Allocation-Conservative VP | | 30,287 | | 14.03 | |
Transamerica Asset Allocation-Moderate Growth VP | | 47,127 | | 21.84 | |
Transamerica Asset Allocation-Moderate VP | | 57,680 | | 26.73 | |
Total | | $ | 214,710 | | 99.49 | % |
Transamerica JPMorgan International Bond | | Market
Values | | % of Net Assets | |
Transamerica Asset Allocation-Conservative Portfolio | | $ | 69,264 | | 9.45 | % |
Transamerica Asset Allocation-Moderate Portfolio | | 131,847 | | 17.99 | |
Transamerica Asset Allocation-Moderate Growth Portfolio | | 105,144 | | 14.34 | |
Transamerica Multi-Manager Alternative Strategies Portfolio | | 23,732 | | 3.24 | |
Transamerica Asset Allocation-Conservative VP | | 97,895 | | 13.36 | |
Transamerica Asset Allocation-Moderate Growth VP | | 143,509 | | 19.58 | |
Transamerica Asset Allocation-Moderate VP | | 158,395 | | 21.61 | |
Total | | $ | 729,786 | | 99.57 | % |
Transamerica JPMorgan Mid Cap Value | | Market
Values | | % of Net Assets | |
Transamerica Asset Allocation-Conservative Portfolio | | $ | 9,309 | | 5.61 | % |
Transamerica Asset Allocation-Growth Portfolio | | 45,313 | | 27.32 | |
Transamerica Asset Allocation-Moderate Portfolio | | 35,769 | | 21.57 | |
Transamerica Asset Allocation-Moderate Growth Portfolio | | 75,379 | | 45.46 | |
Total | | $ | 165,770 | | 99.96 | % |
Transamerica Loomis Sayles Bond | | Market
Values | | % of Net Assets | |
Transamerica Asset Allocation-Conservative Portfolio | | $ | 80,506 | | 9.91 | % |
Transamerica Asset Allocation-Moderate Portfolio | | 131,738 | | 16.22 | |
Transamerica Asset Allocation-Moderate Growth Portfolio | | 88,074 | | 10.84 | |
Transamerica Multi-Manager Alternative Strategies Portfolio | | 36,833 | | 4.53 | |
Transamerica Asset Allocation-Conservative VP | | 109,066 | | 13.43 | |
Transamerica Asset Allocation-Moderate Growth VP | | 165,659 | | 20.40 | |
Transamerica Asset Allocation-Moderate VP | | 174,769 | | 21.52 | |
Transamerica International Moderate Growth VP | | 18,291 | | 2.25 | |
Total | | $ | 804,936 | | 99.10 | % |
203
NOTES TO FINANCIAL STATEMENTS (continued)
At October 31, 2009
(all amounts in thousands)
NOTE 3. (continued)
Transamerica Neuberger Berman International | | Market
Values | | % of Net Assets | |
Transamerica Asset Allocation-Conservative Portfolio | | $ | 8,526 | | 1.75 | % |
Transamerica Asset Allocation-Growth Portfolio | | 71,418 | | 14.70 | |
Transamerica Asset Allocation-Moderate Portfolio | | 28,856 | | 5.94 | |
Transamerica Asset Allocation-Moderate Growth Portfolio | | 99,194 | | 20.42 | |
Transamerica Multi-Manager Alternative Strategies Portfolio | | 581 | | 0.12 | |
Transamerica Multi-Manager International Portfolio | | 29,663 | | 6.11 | |
Transamerica Asset Allocation-Conservative VP | | 11,566 | | 2.38 | |
Transamerica Asset Allocation-Growth VP | | 39,850 | | 8.20 | |
Transamerica Asset Allocation-Moderate Growth VP | | 119,013 | | 24.50 | |
Transamerica Asset Allocation-Moderate VP | | 40,916 | | 8.42 | |
Transamerica International Moderate Growth VP | | 34,104 | | 7.02 | |
Total | | $ | 483,687 | | 99.56 | % |
Transamerica Oppenheimer Developing
Markets | | Market
Values | | % of Net Assets | |
Transamerica Asset Allocation-Conservative Portfolio | | $ | 11,113 | | 2.24 | % |
Transamerica Asset Allocation-Growth Portfolio | | 74,980 | | 15.13 | |
Transamerica Asset Allocation-Moderate Portfolio | | 29,840 | | 6.02 | |
Transamerica Asset Allocation-Moderate Growth Portfolio | | 86,545 | | 17.46 | |
Transamerica Multi-Manager Alternative Strategies Portfolio | | 8,481 | | 1.71 | |
Transamerica Multi-Manager International Portfolio | | 33,294 | | 6.72 | |
Transamerica Asset Allocation-Conservative VP | | 16,281 | | 3.29 | |
Transamerica Asset Allocation-Growth VP | | 48,328 | | 9.75 | |
Transamerica Asset Allocation-Moderate Growth VP | | 122,172 | | 24.65 | |
Transamerica Asset Allocation-Moderate VP | | 55,214 | | 11.14 | |
Transamerica International Moderate Growth VP | | 7,099 | | 1.43 | |
Total | | $ | 493,347 | | 99.54 | % |
Transamerica Oppenheimer Small- & Mid-Cap
Value | | Market
Values | | % of Net Assets | |
Transamerica Asset Allocation-Conservative Portfolio | | $ | 8,000 | | 2.97 | % |
Transamerica Asset Allocation-Growth Portfolio | | 32,002 | | 11.88 | |
Transamerica Asset Allocation-Moderate Portfolio | | 25,586 | | 9.50 | |
Transamerica Asset Allocation-Moderate Growth Portfolio | | 50,282 | | 18.67 | |
Transamerica Asset Allocation-Conservative VP | | 11,169 | | 4.15 | |
Transamerica Asset Allocation-Growth VP | | 25,897 | | 9.62 | |
Transamerica Asset Allocation-Moderate Growth VP | | 80,690 | | 29.97 | |
Transamerica Asset Allocation-Moderate VP | | 34,026 | | 12.64 | |
Total | | $ | 267,652 | | 99.40 | % |
Transamerica Schroders International Small
Cap | | Market
Values | | % of Net Assets | |
Transamerica Asset Allocation-Conservative Portfolio | | $ | 15,336 | | 2.82 | % |
Transamerica Asset Allocation-Growth Portfolio | | 60,408 | | 11.11 | |
Transamerica Asset Allocation-Moderate Portfolio | | 42,144 | | 7.75 | |
Transamerica Asset Allocation-Moderate Growth Portfolio | | 69,537 | | 12.79 | |
Transamerica Multi-Manager Alternative Strategies Portfolio | | 9,804 | | 1.80 | |
Transamerica Multi-Manager International Portfolio | | 38,012 | | 6.99 | |
Transamerica Asset Allocation-Conservative VP | | 29,108 | | 5.35 | |
Transamerica Asset Allocation-Growth VP | | 39,069 | | 7.19 | |
Transamerica Asset Allocation-Moderate Growth VP | | 136,565 | | 25.12 | |
Transamerica Asset Allocation-Moderate VP | | 68,595 | | 12.62 | |
Transamerica International Moderate Growth VP | | 32,397 | | 5.96 | |
Total | | $ | 540,975 | | 99.50 | % |
Transamerica Third Avenue Value | | Market
Values | | % of Net Assets | |
Transamerica Asset Allocation-Conservative Portfolio | | $ | 18,210 | | 4.30 | % |
Transamerica Asset Allocation-Growth Portfolio | | 55,631 | | 13.13 | |
Transamerica Asset Allocation-Moderate Portfolio | | 37,904 | | 8.95 | |
Transamerica Asset Allocation-Moderate Growth Portfolio | | 82,357 | | 19.44 | |
Transamerica Multi-Manager Alternative Strategies Portfolio | | 6,686 | | 1.58 | |
Transamerica Asset Allocation-Conservative VP | | 16,922 | | 4.00 | |
Transamerica Asset Allocation-Growth VP | | 35,738 | | 8.44 | |
Transamerica Asset Allocation-Moderate Growth VP | | 111,873 | | 26.41 | |
Transamerica Asset Allocation-Moderate VP | | 56,123 | | 13.25 | |
Total | | $ | 421,444 | | 99.50 | % |
Transamerica Thornburg International Value | | Market
Values | | % of Net Assets | |
Transamerica Asset Allocation-Conservative Portfolio | | $ | 19,335 | | 3.27 | % |
Transamerica Asset Allocation-Growth Portfolio | | 46,519 | | 7.86 | |
Transamerica Asset Allocation-Moderate Portfolio | | 31,239 | | 5.28 | |
Transamerica Asset Allocation-Moderate Growth Portfolio | | 61,560 | | 10.41 | |
Transamerica Multi-Manager International Portfolio | | 60,710 | | 10.26 | |
Transamerica Asset Allocation-Conservative VP | | 24,561 | | 4.15 | |
Transamerica Asset Allocation-Growth VP | | 31,976 | | 5.41 | |
Transamerica Asset Allocation-Moderate Growth VP | | 148,477 | | 25.10 | |
Transamerica Asset Allocation-Moderate VP | | 80,229 | | 13.56 | |
Transamerica International Moderate Growth VP | | 85,299 | | 14.42 | |
Total | | $ | 589,905 | | 99.72 | % |
Transamerica UBS Dynamic Alpha | | Market
Values | | % of Net Assets | |
Transamerica Asset Allocation-Conservative Portfolio | | $ | 9,447 | | 8.83 | % |
Transamerica Asset Allocation-Growth Portfolio | | 14,421 | | 13.48 | |
Transamerica Asset Allocation-Moderate Portfolio | | 16,330 | | 15.26 | |
Transamerica Asset Allocation-Moderate Growth Portfolio | | 34,003 | | 31.77 | |
Transamerica Multi-Manager Alternative Strategies Portfolio | | 22,605 | | 21.12 | |
Transamerica Asset Allocation-Growth VP | | 10,150 | | 9.48 | |
Total | | $ | 106,956 | | 99.94 | % |
Transamerica UBS Large Cap Value | | Market
Values | | % of Net Assets | |
Transamerica Asset Allocation-Conservative Portfolio | | $ | 38,424 | | 3.83 | % |
Transamerica Asset Allocation-Growth Portfolio | | 194,791 | | 19.43 | |
Transamerica Asset Allocation-Moderate Portfolio | | 115,082 | | 11.48 | |
Transamerica Asset Allocation-Moderate Growth Portfolio | | 282,460 | | 28.17 | |
Transamerica Asset Allocation-Conservative VP | | 31,122 | | 3.10 | |
Transamerica Asset Allocation-Growth VP | | 55,359 | | 5.52 | |
Transamerica Asset Allocation-Moderate Growth VP | | 190,701 | | 19.02 | |
Transamerica Asset Allocation-Moderate VP | | 90,102 | | 8.99 | |
Total | | $ | 998,041 | | 99.54 | % |
Transamerica Van Kampen Emerging Markets
Debt | | Market
Values | | % of Net Assets | |
Transamerica Asset Allocation-Conservative Portfolio | | $ | 38,373 | | 10.03 | % |
Transamerica Asset Allocation-Moderate Portfolio | | 57,059 | | 14.91 | |
Transamerica Asset Allocation-Moderate Growth Portfolio | | 59,384 | | 15.52 | |
Transamerica Asset Allocation-Conservative VP | | 49,325 | | 12.89 | |
Transamerica Asset Allocation-Moderate Growth VP | | 86,173 | | 22.52 | |
Transamerica Asset Allocation-Moderate VP | | 90,669 | | 23.70 | |
Total | | $ | 380,983 | | 99.57 | % |
204
NOTES TO FINANCIAL STATEMENTS (continued)
At October 31, 2009
(all amounts in thousands)
NOTE 3. (continued)
Transamerica Van Kampen Mid-Cap Growth | | Market
Values | | % of Net Assets | |
Transamerica Asset Allocation-Conservative Portfolio | | $ | 8,058 | | 3.14 | % |
Transamerica Asset Allocation-Growth Portfolio | | 36,992 | | 14.44 | |
Transamerica Asset Allocation-Moderate Portfolio | | 20,028 | | 7.82 | |
Transamerica Asset Allocation-Moderate Growth Portfolio | | 50,689 | | 19.78 | |
Transamerica Asset Allocation-Conservative VP | | 12,396 | | 4.84 | |
Transamerica Asset Allocation-Growth VP | | 14,449 | | 5.64 | |
Transamerica Asset Allocation-Moderate Growth VP | | 77,423 | | 30.22 | |
Transamerica Asset Allocation-Moderate VP | | 35,243 | | 13.76 | |
Total | | $ | 255,278 | | 99.64 | % |
Transamerica Van Kampen Small Company
Growth | | Market
Values | | % of Net Assets | |
Transamerica Asset Allocation-Conservative Portfolio | | $ | 5,615 | | 4.32 | % |
Transamerica Asset Allocation-Growth Portfolio | | 19,713 | | 15.18 | |
Transamerica Asset Allocation-Moderate Portfolio | | 7,402 | | 5.70 | |
Transamerica Asset Allocation-Moderate Growth Portfolio | | 18,657 | | 14.36 | |
Transamerica Asset Allocation-Conservative VP | | 9,016 | | 6.94 | |
Transamerica Asset Allocation-Growth VP | | 10,481 | | 8.07 | |
Transamerica Asset Allocation-Moderate Growth VP | | 38,571 | | 29.70 | |
Transamerica Asset Allocation-Moderate VP | | 19,711 | | 15.17 | |
Total | | $ | 129,166 | | 99.44 | % |
Transamerica WMC Emerging Markets | | Market
Values | | % of Net Assets | |
Transamerica Asset Allocation-Conservative Portfolio | | $ | 5,143 | | 2.88 | % |
Transamerica Asset Allocation-Growth Portfolio | | 4,673 | | 2.62 | |
Transamerica Asset Allocation-Moderate Portfolio | | 25,666 | | 14.37 | |
Transamerica Asset Allocation-Moderate Growth Portfolio | | 18,410 | | 10.31 | |
Transamerica Multi-Manager International Portfolio | | 25,328 | | 14.18 | |
Transamerica Asset Allocation-Conservative VP | | 8,259 | | 4.62 | |
Transamerica Asset Allocation-Growth VP | | 7,530 | | 4.22 | |
Transamerica Asset Allocation-Moderate Growth VP | | 50,849 | | 28.47 | |
Transamerica Asset Allocation-Moderate VP | | 32,750 | | 18.34 | |
Total | | $ | 178,608 | | 100.01 | % |
Transamerica Clarion Global Real Estate
Securities | | Market
Values | | % of Net Assets | |
Transamerica Asset Allocation-Conservative Portfolio | | $ | 13,992 | | 4.90 | % |
Transamerica Asset Allocation-Growth Portfolio | | 77,454 | | 27.13 | |
Transamerica Asset Allocation-Moderate Portfolio | | 47,366 | | 16.59 | |
Transamerica Asset Allocation-Moderate Growth Portfolio | | 106,841 | | 37.42 | |
Transamerica Multi-Manager Alternative Strategies Portfolio | | 22,466 | | 7.87 | |
Transamerica Multi-Manager International Portfolio | | 15,208 | | 5.33 | |
Total | | $ | 283,327 | | 99.24 | % |
Transamerica Jennison Growth | | Market
Values | | % of Net Assets | |
Transamerica Asset Allocation-Conservative Portfolio | | $ | 52,296 | | 7.99 | % |
Transamerica Asset Allocation-Growth Portfolio | | 209,126 | | 31.95 | |
Transamerica Asset Allocation-Moderate Portfolio | | 131,965 | | 20.16 | |
Transamerica Asset Allocation-Moderate Growth Portfolio | | 232,725 | | 35.55 | |
Transamerica Asset Allocation-Conservative VP | | 576 | | 0.09 | |
Transamerica Asset Allocation-Growth VP | | 4,714 | | 0.72 | |
Transamerica Asset Allocation-Moderate Growth VP | | 16,340 | | 2.50 | |
Transamerica Asset Allocation-Moderate VP | | 1,338 | | 0.20 | |
Total | | $ | 649,080 | | 99.16 | % |
Transamerica MFS International Equity | | Market
Values | | % of Net Assets | |
Transamerica Asset Allocation-Conservative Portfolio | | $ | 14,521 | | 3.66 | % |
Transamerica Asset Allocation-Growth Portfolio | | 25,544 | | 6.44 | |
Transamerica Asset Allocation-Moderate Portfolio | | 22,179 | | 5.59 | |
Transamerica Asset Allocation-Moderate Growth Portfolio | | 26,747 | | 6.74 | |
Transamerica Multi-Manager International Portfolio | | 33,621 | | 8.48 | |
Transamerica Asset Allocation-Conservative VP | | 23,104 | | 5.82 | |
Transamerica Asset Allocation-Growth VP | | 16,915 | | 4.26 | |
Transamerica Asset Allocation-Moderate Growth VP | | 93,757 | | 23.63 | |
Transamerica Asset Allocation-Moderate VP | | 59,099 | | 14.90 | |
Transamerica International Moderate Growth VP | | 79,872 | | 20.13 | |
Total | | $ | 395,359 | | 99.65 | % |
Transamerica PIMCO Real Return TIPS | | Market
Values | | % of Net Assets | |
Transamerica Asset Allocation-Conservative Portfolio | | $ | 74,427 | | 9.89 | % |
Transamerica Asset Allocation-Moderate Portfolio | | 114,309 | | 15.19 | |
Transamerica Asset Allocation-Moderate Growth Portfolio | | 115,834 | | 15.39 | |
Transamerica Asset Allocation-Conservative VP | | 106,702 | | 14.17 | |
Transamerica Asset Allocation-Moderate Growth VP | | 149,531 | | 19.86 | |
Transamerica Asset Allocation-Moderate VP | | 169,862 | | 22.57 | |
Transamerica International Moderate Growth VP | | 16,737 | | 2.22 | |
Total | | $ | 747,402 | | 99.29 | % |
Transamerica PIMCO Total Return | | Market
Values | | % of Net Assets | |
Transamerica Asset Allocation-Conservative Portfolio | | $ | 128,965 | | 25.52 | % |
Transamerica Asset Allocation-Moderate Portfolio | | 198,720 | | 39.33 | |
Transamerica Asset Allocation-Moderate Growth Portfolio | | 170,447 | | 33.73 | |
Total | | $ | 498,132 | | 98.58 | % |
205
NOTES TO FINANCIAL STATEMENTS (continued)
At October 31, 2009
(all amounts in thousands)
NOTE 3. (continued)
Investment advisory fees: The Funds pay management fees to TAM based on average daily net assets (“ANA”) at the following breakpoints:
Transamerica AllianceBernstein International Value | | | |
First $200 million | | 0.88 | % |
Over $200 million up to $500 million | | 0.81 | % |
Over $500 million | | 0.77 | % |
Transamerica BlackRock Global Allocation | | | |
First $100 million | | 0.80 | % |
Over $100 million | | 0.72 | % |
Transamerica BlackRock Large Cap Value | | | |
First $250 million | | 0.80 | % |
Over $250 million up to $750 million | | 0.775 | % |
Over $750 million | | 0.75 | % |
Transamerica BlackRock Natural Resources | | | |
First $250 million | | 0.80 | % |
Over $250 million up to $500 million | | 0.775 | % |
Over $500 million | | 0.75 | % |
Transamerica BNY Mellon Market Neutral Strategy | | | |
ANA | | 1.40 | % |
Transamerica Federated Market Opportunity | | | |
First $30 million | | 0.85 | % |
Over $30 million up to $50 million | | 0.80 | % |
Over $50 million up to $500 million | | 0.70 | % |
Over $500 million up to $750 million | | 0.675 | % |
Over $750 million | | 0.65 | % |
Transamerica JPMorgan Core Bond | | | |
First $750 million | | 0.45 | % |
Over $750 million up to $1 billion | | 0.40 | % |
Over $1 billion | | 0.375 | % |
Transamerica JPMorgan International Bond | | | |
First $100 million | | 0.55 | % |
Over $100 million up to $250 million | | 0.52 | % |
Over $250 million up to $500 million | | 0.51 | % |
Over $500 million up to $1 billion | | 0.50 | % |
Over $1 billion | | 0.47 | % |
Transamerica JPMorgan Mid Cap Value | | | |
First $100 million | | 0.85 | % |
Over $100 million | | 0.80 | % |
Transamerica Loomis Sayles Bond | | | |
First $200 million | | 0.675 | % |
Over $200 million up to $750 million | | 0.625 | % |
Over $750 million | | 0.60 | % |
Transamerica Neuberger Berman International | | | |
First $100 million | | 1.00 | % |
Over $100 million | | 0.95 | % |
Transamerica Oppenheimer Developing Markets | | | |
First $50 million | | 1.20 | % |
Over $50 million up to $200 million | | 1.15 | % |
Over $200 million up to $500 million | | 1.10 | % |
Over $500 million | | 1.05 | % |
Transamerica Oppenheimer Small- & Mid-Cap Value | | | |
First $100 million | | 0.95 | % |
Over $100 million up to $250 million | | 0.90 | % |
Over $250 million up to $500 million | | 0.85 | % |
Over $500 million | | 0.825 | % |
Transamerica Schroders International Small Cap | | | |
First $300 million | | 1.07 | % |
Over $300 million | | 1.00 | % |
Transamerica Third Avenue Value | | | |
ANA | | 0.80 | % |
Transamerica Thornburg International Value | | | |
First $100 million | | 1.10 | % |
Over $100 million up to $300 million | | 1.00 | % |
Over $300 million | | 0.95 | % |
Transamerica UBS Dynamic Alpha | | | |
First $150 million | | 1.40 | % |
Over $150 million up to $300 million | | 1.30 | % |
Over $300 million | | 1.20 | % |
Transamerica UBS Large Cap Value | | | |
First $200 million | | 0.82 | % |
Over $200 million up to $400 million | | 0.76 | % |
Over $400 million up to $750 million | | 0.74 | % |
Over $750 billion up to $1 billion | | 0.71 | % |
Over $1 billion up to $1.5 billion | | 0.67 | % |
Over $1.5 billion | | 0.62 | % |
Transamerica Van Kampen Emerging Markets Debt | | | |
First $250 million | | 0.95 | % |
Over $250 million up to $500 million | | 0.85 | % |
Over $500 million | | 0.80 | % |
Transamerica Van Kampen Mid-Cap Growth | | | |
First $1 billion | | 0.80 | % |
Over $1 billion | | 0.775 | % |
Transamerica Van Kampen Small Company Growth | | | |
First $500 million | | 0.95 | % |
Over $500 million | | 0.85 | % |
Transamerica WMC Emerging Markets | | | |
First $300 million | | 1.15 | % |
Over $300 million | | 1.10 | % |
Transamerica Clarion Global Real Estate Securities | | | |
First $250 million | | 0.80 | % |
Over $250 million up to $500 million | | 0.775 | % |
Over $500 million up to $1 billion | | 0.70 | % |
Over $1 billion | | 0.65 | % |
Transamerica Jennison Growth | | | |
First $250 million | | 0.80 | % |
Over $250 million up to $500 million | | 0.775 | % |
Over $500 million up to $1 billion | | 0.70 | % |
Over $1 billion up to $1.5 billion | | 0.675 | % |
Over $1.5 billion | | 0.65 | % |
Transamerica MFS International Equity (Effective August 1, 2009) | | | |
First $250 million | | 0.90 | % |
Over $250 million up to $500 million | | 0.875 | % |
Over $500 million up to $1 billion | | 0.85 | % |
Over $1 billion | | 0.80 | % |
Transamerica MFS International Equity (Prior to August 1, 2009) | | | |
First $250 million | | 0.925 | % |
Over $250 million up to $500 million | | 0.90 | % |
Over $500 million up to $1 billion | | 0.85 | % |
Over $1 billion | | 0.80 | % |
Transamerica PIMCO Real Return TIPS (Effective July 1, 2009) | | | |
First $250 million | | 0.70 | % |
Over $250 million up to $750 million | | 0.65 | % |
Over $750 million up to $1 billion | | 0.60 | % |
Over $1 billion | | 0.55 | % |
Transamerica PIMCO Real Return TIPS (Prior to July 1, 2009) | | | |
First $250 million | | 0.70 | % |
Over $250 million up to $750 million | | 0.65 | % |
Over $750 million | | 0.60 | % |
Transamerica PIMCO Total Return | | | |
First $250 million | | 0.675 | % |
Over $250 million up to $750 million | | 0.65 | % |
Over $750 million | | 0.60 | % |
206
NOTES TO FINANCIAL STATEMENTS (continued)
At October 31, 2009
(all amounts in thousands)
NOTE 3. (continued)
TAM has contractually agreed to waive its advisory fee and will reimburse each Fund to the extent that operating expenses, excluding dividend expense on short sales and extraordinary expenses, exceed the following stated annual limit:
Fund | | Expense Limit | |
Transamerica AllianceBernstein International Value * | | 1.13 | % |
Transamerica BlackRock Global Allocation * | | 1.00 | |
Transamerica BlackRock Large Cap Value | | 1.00 | |
Transamerica BlackRock Natural Resources | | 1.00 | |
Transamerica BNY Mellon Market Neutral Strategy | | 1.65 | |
Transamerica Federated Market Opportunity * | | 1.05 | |
Transamerica JPMorgan Core Bond | | 0.70 | |
Transamerica JPMorgan International Bond * | | 0.75 | |
Transamerica JPMorgan Mid Cap Value | | 1.05 | |
Transamerica Loomis Sayles Bond | | 0.88 | |
Transamerica Neuberger Berman International * | | 1.25 | |
Transamerica Oppenheimer Developing Markets * | | 1.45 | |
Transamerica Oppenheimer Small- & Mid-Cap Value | | 1.15 | |
Transamerica Schroders International Small Cap | | 1.27 | |
Transamerica Third Avenue Value | | 1.00 | |
Transamerica Thornburg International Value | | 1.35 | |
Transamerica UBS Dynamic Alpha | | 1.65 | |
Transamerica UBS Large Cap Value | | 1.02 | |
Transamerica Van Kampen Emerging Markets Debt | | 1.15 | |
Transamerica Van Kampen Mid-Cap Growth * | | 1.00 | |
Transamerica Van Kampen Small Company Growth | | 1.15 | |
Transamerica WMC Emerging Markets | | 1.40 | |
*The Fund may not recapture any fees waived and/or reimbursed prior to March 1, 2008.
Funds not listed in the above table did not have an expense limit.
If total Fund expenses fall below the annual expense limitation agreement agreed to by the adviser within the succeeding three years, the Funds may be required to pay the adviser a portion or all of the reimbursed expenses. Amounts recaptured by the adviser during the year ended October 31, 2009 were as follows:
Fund | | Recaptured Amount | |
Transamerica Schroders International Small Cap | | $ | 26 | |
Transamerica Thornburg International Value | | 45 | |
| | | | |
The following amounts were available for recapture as of October 31, 2009:
Transamerica WMC Emerging Markets | | Reimbursement of Class Expenses | | Available for Recapture Through | |
Fiscal Year 2008: | | $ | 56 | | 10/31/2011 | |
Fiscal Year 2009: | | $ | 34 | | 10/31/2012 | |
Administrative services: The Funds have entered into agreements with TFS for financial and legal fund administration services. The Funds pay TFS an annual fee of 0.02% of ANA. The Legal fees on the Statements of Operations are fees paid to external legal counsel.
Transfer agent fees: The Funds pay TFS an annual per-account charge for each open and closed account. For the year ended October 31, 2009, the Funds paid TFS amounts that round to less than $1.
Deferred compensation plan: Each eligible Independent Fund Trustee may elect to participate in a non-qualified deferred compensation plan (the “Plan”) maintained by Transamerica Funds. Under the Plan, such Trustees may defer payment of all or a portion of their total fees earned as a Fund Trustee. Each Trustee who is a participant in the Plan may elect that the earnings, losses or gains credited to his or her deferred fee amounts be determined based on a deemed investment in Class A shares of any series of Transamerica Funds or investment options under Transamerica Partners Institutional Funds Group and Transamerica Institutional Asset Allocation Funds. The right of a participant to receive a distribution from the Plan of the deferred fees is a claim against the general assets of all series of Transamerica Funds.
Retirement plan: Under a prior retirement plan (the “Emeritus Plan”) available to the Independent Trustees, each Independent Trustee was deemed to have been elected to serve as Trustee Emeritus of Transamerica Funds upon his or her termination of service, other than removal for cause, for a maximum period of five years determined by his or her years of service as a Trustee.
Such amounts were to be accrued by Transamerica Funds on a pro rata basis allocable to each Transamerica Fund based on the relative assets of the Fund. If retainers increased in the future, past accruals (and credits) would be adjusted upwards so that 50% of the Trustee’s current retainer was accrued and credited at all times. Upon death, disability or termination of service, other than removal for cause, amounts deferred became payable to an Emeritus Trustee (or his/her beneficiary). Upon commencement of service as Trustee Emeritus, compensation would be paid on a quarterly basis during the time period that the Trustee Emeritus was allowed to serve as such.
207
NOTES TO FINANCIAL STATEMENTS (continued)
At October 31, 2009
(all amounts in thousands)
NOTE 3. (continued)
At October 31, 2009, the Funds’ liability related to the Emeritus Plan was as follows:
Fund | | Emeritus Fees | |
Transamerica AllianceBernstein International Value | | $ | — | (a) |
Transamerica BlackRock Global Allocation | | 1 | |
Transamerica BlackRock Large Cap Value | | 1 | |
Transamerica Federated Market Opportunity | | — | (a) |
Transamerica JPMorgan International Bond | | 1 | |
Transamerica JPMorgan Mid Cap Value | | — | (a) |
Transamerica Neuberger Berman International | | 1 | |
Transamerica Oppenheimer Developing Markets | | 1 | |
Transamerica Oppenheimer Small- & Mid-Cap Value | | — | (a) |
Transamerica UBS Large Cap Value | | — | (a) |
Transamerica Van Kampen Emerging Markets Debt | | 1 | |
Transamerica Van Kampen Mid-Cap Growth | | — | (a) |
Transamerica Van Kampen Small Company Growth | | 1 | |
Transamerica Clarion Global Real Estate Securities | | — | (a) |
Transamerica Jennison Growth | | — | (a) |
Transamerica MFS International Equity | | — | (a) |
Transamerica PIMCO Real Return TIPS | | 1 | |
Transamerica PIMCO Total Return | | — | (a) |
| | | | |
(a) Rounds to less than $1.
Amounts deferred and accrued under the Emeritus Plan are claims against the general assets of Transamerica Funds.
Funds not listed in the above table did not have a liability related to the Emeritus Plan.
The Emeritus Plan was terminated effective October 30, 2007. Upon termination, the Funds continue to pay any remaining benefits in accordance with the Plan, but no further compensation has been accrued.
Brokerage commissions: Brokerage commissions incurred on security transactions placed with affiliates of the adviser or sub-advisers for the year ended October 31, 2009 were as follows:
Fund | | Brokerage Commissions | |
Transamerica Third Avenue Value | | 18 | |
Transamerica UBS Dynamic Alpha | | 9 | |
Transamerica UBS Large Cap Value | | 115 | |
Transamerica Van Kampen Mid-Cap Growth | | 15 | |
Transamerica Van Kampen Small Company Growth | | 11 | |
208
NOTES TO FINANCIAL STATEMENTS (continued)
At October 31, 2009
(all amounts in thousands)
NOTE 4. INVESTMENT TRANSACTIONS
The cost of securities purchased and proceeds from securities sold (excluding short-term securities) for the year ended October 31, 2009 were as follows:
| | Purchases of securities: | | Proceeds from maturities and sales of
securities: | |
Fund | | Long-term | | U.S. Government | | Long-term | | U.S. Government | |
Transamerica AllianceBernstein International Value | | $ | 156,378 | | $ | — | | $ | 144,841 | | $ | — | |
Transamerica BlackRock Global Allocation | | 130,405 | | 26,431 | | 129,055 | | 33,177 | |
Transamerica BlackRock Large Cap Value | | 758,830 | | — | | 601,335 | | — | |
Transamerica BlackRock Natural Resources | | 7,991 | | — | | 3,998 | | — | |
Transamerica BNY Mellon Market Neutral Strategy | | 414,768 | | — | | 409,092 | | — | |
Transamerica Federated Market Opportunity | | 85,063 | | 6,727 | | 143,880 | | 1,893 | |
Transamerica JPMorgan Core Bond | | 154,337 | | 53,872 | | 4,661 | | — | |
Transamerica JPMorgan International Bond | | 351,315 | | — | | 418,840 | | — | |
Transamerica JPMorgan Mid Cap Value | | 65,023 | | — | | 63,087 | | — | |
Transamerica Loomis Sayles Bond | | 322,788 | | — | | 259,723 | | — | |
Transamerica Neuberger Berman International | | 344,612 | | — | | 240,451 | | — | |
Transamerica Oppenheimer Developing Markets | | 180,692 | | — | | 178,538 | | — | |
Transamerica Oppenheimer Small- & Mid-Cap Value | | 308,307 | | — | | 227,737 | | — | |
Transamerica Schroders International Small Cap | | 434,338 | | — | | 99,749 | | — | |
Transamerica Third Avenue Value | | 61,855 | | — | | 54,477 | | — | |
Transamerica Thornburg International Value | | 527,048 | | — | | 91,639 | | — | |
Transamerica UBS Dynamic Alpha | | 289,402 | | — | | 409,981 | | — | |
Transamerica UBS Large Cap Value | | 710,782 | | — | | 446,784 | | — | |
Transamerica Van Kampen Emerging Markets Debt | | 376,567 | | — | | 397,440 | | — | |
Transamerica Van Kampen Mid-Cap Growth | | 140,383 | | — | | 55,607 | | — | |
Transamerica Van Kampen Small Company Growth | | 75,140 | | — | | 30,667 | | — | |
Transamerica WMC Emerging Markets | | 200,703 | | — | | 152,187 | | — | |
Transamerica Clarion Global Real Estate Securities | | 153,118 | | — | | 135,293 | | — | |
Transamerica Jennison Growth | | 639,834 | | — | | 247,306 | | — | |
Transamerica MFS International Equity | | 322,060 | | — | | 46,658 | | — | |
Transamerica PIMCO Real Return TIPS | | 2,576,479 | | 3,325,132 | | 2,856,426 | | 3,356,553 | |
Transamerica PIMCO Total Return | | 4,800,098 | | 1,659,521 | | 5,299,858 | | 1,608,138 | |
| | | | | | | | | | | | | |
NOTE 5. FEDERAL INCOME TAX MATTERS
The Funds have not made any provision for federal income or excise taxes due to their policy to distribute all of their taxable income and capital gains to their shareholders and otherwise qualify as regulated investment companies under Subchapter M of the Internal Revenue Code. Management has evaluated the Funds’ tax positions taken for all open tax years and has concluded that no provision for income tax is required in the Funds’ financial statements. Income and capital gain distributions are determined in accordance with income tax regulations, which may differ from GAAP. These differences are primarily due to differing treatment for items including, but not limited to, wash sales, structured notes, foreign bonds, swaps, net operating losses, distribution reclasses for REITs, passive foreign investment companies, foreign currency transactions, and capital loss carryforwards.
Therefore, distributions determined in accordance with tax regulations may differ significantly in amount or character from net investment income and realized gains for financial reporting purposes. Financial reporting records are adjusted for permanent book/tax differences to reflect tax character. Financial records are not adjusted for temporary differences. These reclassifications are as follows:
Fund | | Shares of beneficial
interest, unlimited shares
authorized | | Undistributed
(accumulated) net
investment income (loss) | | Undistributed
(accumulated) net realized
gain (loss) from
investment securities | |
Transamerica AllianceBernstein International Value | | $ | — | | $ | 318 | | $ | (318 | ) |
Transamerica BlackRock Global Allocation | | — | | (1,560 | ) | 1,560 | |
Transamerica BlackRock Natural Resources | | — | | (7 | ) | 7 | |
Transamerica BNY Mellon Market Neutral Strategy | | (3,093 | ) | 1,744 | | 1,349 | |
Transamerica Federated Market Opportunity | | (1,345 | ) | 81 | | 1,264 | |
Transamerica JPMorgan Core Bond | | (1 | ) | 220 | | (219 | ) |
Transamerica JPMorgan International Bond | | — | | 5,323 | | (5,323 | ) |
Transamerica JPMorgan Mid Cap Value | | — | | (79 | ) | 79 | |
Transamerica Loomis Sayles Bond | | — | | (5,822 | ) | 5,822 | |
Transamerica Neuberger Berman International | | — | | (787 | ) | 787 | |
Transamerica Oppenheimer Developing Markets | | — | | (412 | ) | 412 | |
Transamerica Oppenheimer Small- & Mid-Cap Value | | (7 | ) | 39 | | (32 | ) |
Transamerica Schroders International Small Cap | | (6 | ) | 396 | | (390 | ) |
Transamerica Third Avenue Value | | (16 | ) | (81 | ) | 97 | |
Transamerica Thornburg International Value | | (66 | ) | (279 | ) | 345 | |
Transamerica UBS Dynamic Alpha | | (8,095 | ) | 273 | | 7,822 | |
Transamerica Van Kampen Emerging Markets Debt | | — | | (6,008 | ) | 6,008 | |
Transamerica Van Kampen Mid-Cap Growth | | (129 | ) | 121 | | 8 | |
Transamerica Van Kampen Small Company Growth | | (284 | ) | 277 | | 7 | |
Transamerica WMC Emerging Markets | | — | | (668 | ) | 668 | |
Transamerica Clarion Global Real Estate Securities | | 88 | | 1,833 | | (1,921 | ) |
Transamerica Jennison Growth | | — | | (39 | ) | 39 | |
Transamerica MFS International Equity | | — | | (209 | ) | 209 | |
Transamerica PIMCO Real Return TIPS | | — | | 8,049 | | (8,049 | ) |
Transamerica PIMCO Total Return | | — | | (578 | ) | 578 | |
| | | | | | | | | | |
209
NOTES TO FINANCIAL STATEMENTS (continued)
At October 31, 2009
(all amounts in thousands)
NOTE 5. (continued)
The capital loss carryforwards are available to offset future realized capital gains through the periods listed below. Funds not listed in the table below do not have capital loss carryforwards.
Fund | | Capital Loss Carryforwards | | Available Through | |
Transamerica AllianceBernstein International Value | | $ | 38,050 | | October 31, 2016 | |
Transamerica AllianceBernstein International Value | | 106,355 | | October 31, 2017 | |
Transamerica BlackRock Global Allocation | | 21,624 | | October 31, 2017 | |
Transamerica BlackRock Large Cap Value | | 49,331 | | October 31, 2016 | |
Transamerica BlackRock Large Cap Value | | 112,660 | | October 31, 2017 | |
Transamerica BlackRock Natural Resources | | 4,087 | | October 31, 2017 | |
Transamerica BNY Mellon Market Neutral Strategy | | 1,569 | | October 31, 2015 | |
Transamerica BNY Mellon Market Neutral Strategy | | 8,524 | | October 31, 2017 | |
Transamerica Federated Market Opportunity | | 12,018 | | October 31, 2017 | |
Transamerica JPMorgan Core | | 206 | | October 31, 2017 | |
Transamerica JPMorgan Mid Cap Value | | 25,193 | | October 31, 2017 | |
Transamerica Loomis Sayles Bond | | 16,693 | | October 31, 2017 | |
Transamerica Neuberger Berman International | | 110,404 | | October 31, 2016 | |
Transamerica Neuberger Berman International | | 103,155 | | October 31, 2017 | |
Transamerica Oppenheimer Developing Markets | | 70,019 | | October 31, 2017 | |
Transamerica Oppenheimer Small- & Mid-Cap Value | | 21,482 | | October 31, 2016 | |
Transamerica Oppenheimer Small- & Mid-Cap Value | | 41,116 | | October 31, 2017 | |
Transamerica Schroders International Small Cap | | 7,464 | | October 31, 2016 | |
Transamerica Schroders International Small Cap | | 11,954 | | October 31, 2017 | |
Transamerica Third Avenue Value | | 21,046 | | October 31, 2016 | |
Transamerica Third Avenue Value | | 85,861 | | October 31, 2017 | |
Transamerica UBS Dynamic Alpha | | 68,909 | | October 31, 2017 | |
Transamerica UBS Large Cap Value | | 27,348 | | October 31, 2016 | |
Transamerica UBS Large Cap Value | | 205,443 | | October 31, 2017 | |
Transamerica Van Kampen Emerging Markets Debt | | 9,789 | | October 31, 2016 | |
Transamerica Van Kampen Emerging Markets Debt | | 2,886 | | October 31, 2017 | |
Transamerica Van Kampen Mid-Cap Growth | | 5,517 | | October 31, 2016 | |
Transamerica Van Kampen Small Company Growth | | 12,060 | | October 31, 2016 | |
Transamerica Clarion Global Real Estate Securities | | 26,287 | | October 31, 2016 | |
Transamerica Clarion Global Real Estate Securities | | 60,948 | | October 31, 2017 | |
Transamerica Jennison Growth | | 33 | | October 31, 2015 | |
Transamerica Jennison Growth | | 27,608 | | October 31, 2016 | |
Transamerica Jennison Growth | | 13,821 | | October 31, 2017 | |
Transamerica PIMCO Real Return TIPS | | 15,770 | | October 31, 2017 | |
| | | | | | |
The capital loss carryforwards utilized or expired during the year ended October 31, 2009 was as follows:
Fund | | Capital Loss Carryforwards Utilized/Expired During the Year Ended October 31, 2008 | |
Transamerica Van Kampen Mid Cap Growth | | $ | 1,528 | |
Transamerica Van Kampen Small Company Growth | | 654 | |
Transamerica WMC Emerging Markets | | 1,500 | |
Transamerica MFS International Equity | | 1,564 | |
| | | | |
The tax character of distributions paid may differ from the character of distributions shown in the Statements of Changes in Net Assets due to the short-term gains being treated as ordinary income for tax purposes. The tax character of distributions paid during 2008 and 2009 were as follows:
| | Distributions Paid From: 2008 | | Distributions Paid From: 2009 | |
| | Ordinary
income | | Long-term
Capital Gain | | Return of
Capital | | Ordinary
income | | Long-term
Capital Gain | | Return of
Capital | |
Transamerica AllianceBernstein International Value | | $ | 15,225 | | $ | 25,977 | | $ | — | | $ | 12,685 | | $ | — | | $ | — | |
Transamerica BlackRock Global Allocation | | 19,536 | | 17,158 | | — | | 17,048 | | 26,424 | | — | |
Transamerica BlackRock Large Cap Value | | 4,505 | | 34,018 | | — | | 8,083 | | — | | — | |
Transamerica BlackRock Natural Resources | | 2,002 | | 3 | | — | | 463 | | — | | — | |
Transamerica BNY Mellon Market Neutral Strategy | | 6,638 | | — | | — | | — | | — | | 1,349 | |
Transamerica Federated Market Opportunity | | 769 | | — | | — | | 1,595 | | 2,752 | | 1,344 | |
Transamerica JPMorgan Core Bond | | — | | — | | — | | 1,127 | | — | | — | |
Transamerica JPMorgan International Bond | | 30,789 | | — | | — | | 35,346 | | 14,205 | | — | |
Transamerica JPMorgan Mid Cap Value | | 2,266 | | 13,316 | | — | | 3,462 | | 1,014 | | — | |
Transamerica Loomis Sayles Bond | | 37,734 | | — | | — | | 47,564 | | 1,282 | | — | |
Transamerica Neuberger Berman International | | 10,894 | | 41,934 | | — | | 8,575 | | — | | — | |
Transamerica Oppenheimer Developing Markets | | 15,326 | | 41,296 | | — | | 6,583 | | 57,191 | | — | |
Transamerica Oppenheimer Small- & Mid-Cap Value | | 8,817 | | 4,505 | | — | | 701 | | — | | — | |
Transamerica Schroders International Small Cap | | — | | — | | — | | 1,875 | | — | | — | |
Transamerica Third Avenue Value | | 18,496 | | — | | — | | — | | — | | — | |
Transamerica Thornburg International Value | | — | | — | | — | | 14 | | 620 | | — | |
Transamerica UBS Dynamic Alpha | | 2,297 | | — | | — | | 12,157 | | 29,757 | | 1,013 | |
Transamerica UBS Large Cap Value | | 11,155 | | 9,206 | | — | | 16,273 | | — | | — | |
Transamerica Van Kampen Emerging Markets Debt | | 28,919 | | 6,945 | | — | | 20,808 | | — | �� | — | |
Transamerica Van Kampen Mid-Cap Growth | | 3,386 | | 4,460 | | — | | 121 | | — | | — | |
Transamerica Van Kampen Small Company Growth | | 2,169 | | 15,799 | | — | | 1,229 | | — | | 125 | |
Transamerica Clarion Global Real Estate Securities | | 23,086 | | 32,634 | | — | | 4,979 | | — | | — | |
Transamerica Jennison Growth | | 228 | | — | | — | | 430 | | — | | — | |
Transamerica MFS International Equity | | 689 | | 1,495 | | 42 | | — | | — | | — | |
Transamerica PIMCO Real Return TIPS | | 35,688 | | — | | — | | 22,958 | | 3,893 | | — | |
Transamerica PIMCO Total Return | | 25,987 | | 1,673 | | — | | 47,632 | | — | | — | |
| | | | | | | | | | | | | | | | | | | |
210
NOTES TO FINANCIAL STATEMENTS (continued)
At October 31, 2009
(all amounts in thousands)
NOTE 5. (continued)
The tax basis components of distributable earnings as of October 31, 2009 were as follows:
Fund | | Undistributed
Ordinary Income | | Undistributed
Long-Term
Capital Gain | | Capital Loss
Carryforward | | Other
Temporary
Differences | | Net Unrealized
Appreciation
(Depreciation)* | |
Transamerica AllianceBernstein International Value | | $ | 5,957 | | $ | — | | $ | (144,405 | ) | $ | — | | $ | (29,823 | ) |
Transamerica BlackRock Global Allocation | | 7,492 | | — | | (21,624 | ) | (1,748 | ) | 5,816 | |
Transamerica BlackRock Large Cap Value | | 6,661 | | — | | (161,991 | ) | — | | (1,678 | ) |
Transamerica BlackRock Natural Resources | | 431 | | — | | (4,087 | ) | — | | 2,267 | |
Transamerica BNY Mellon Market Neutral Strategy | | — | | — | | (10,094 | ) | — | | (964 | ) |
Transamerica Federated Market Opportunity | | — | | — | | (12,018 | ) | — | | 4,559 | |
Transamerica JPMorgan Core Bond | | 499 | | — | | (206 | ) | — | | 1,435 | |
Transamerica JPMorgan International Bond | | 11,444 | | 5,124 | | — | | — | | 65,839 | |
Transamerica JPMorgan Mid Cap Value | | 2,368 | | — | | (25,193 | ) | — | | (10,655 | ) |
Transamerica Loomis Sayles Bond | | 6,872 | | — | | (16,693 | ) | — | | 10,594 | |
Transamerica Neuberger Berman International | | 4,151 | | — | | (213,559 | ) | — | | 23,214 | |
Transamerica Oppenheimer Developing Markets | | 2,442 | | — | | (70,019 | ) | — | | 49,029 | |
Transamerica Oppenheimer Small- & Mid-Cap Value | | 789 | | — | | (62,598 | ) | — | | 31,185 | |
Transamerica Schroders International Small Cap | | 2,971 | | — | | (19,418 | ) | — | | 22,616 | |
Transamerica Third Avenue Value | | 4,825 | | — | | (106,907 | ) | — | | (98,117 | ) |
Transamerica Thornburg International Value | | 3,917 | | — | | — | | — | | 44,347 | |
Transamerica UBS Dynamic Alpha | | — | | — | | (68,909 | ) | — | | (480 | ) |
Transamerica UBS Large Cap Value | | 9,473 | | — | | (232,791 | ) | — | | (88,007 | ) |
Transamerica Van Kampen Emerging Markets Debt | | 1,004 | | — | | (12,675 | ) | — | | 5,969 | |
Transamerica Van Kampen Mid-Cap Growth | | — | | — | | (5,517 | ) | — | | 8,566 | |
Transamerica Van Kampen Small Company Growth | | — | | — | | (12,060 | ) | — | | (1,723 | ) |
Transamerica WMC Emerging Markets | | 2,395 | | 896 | | — | | — | | 23,967 | |
Transamerica Clarion Global Real Estate Securities | | 12,661 | | — | | (87,235 | ) | — | | (14,094 | ) |
Transamerica Jennison Growth | | 271 | | — | | (41,462 | ) | — | | 50,122 | |
Transamerica MFS International Equity | | 11,678 | | 165 | | — | | — | | 35,955 | |
Transamerica PIMCO Real Return TIPS | | 10,702 | | — | | (15,770 | ) | (1,677 | ) | 33,585 | |
Transamerica PIMCO Total Return | | 31,517 | | — | | — | | (466 | ) | (7,565 | ) |
| | | | | | | | | | | | | | | | |
* Amounts include unrealized gain/loss from foreign currency and derivative instruments, if applicable.
NOTE 6. ACCOUNTING PRONOUNCEMENT
In March 2008, the Financial Accounting Standards Board issued amendments to authoritative guidance on disclosures about derivative instruments and hedging activities which require that the Fund disclose: a) how and why an entity uses derivative instruments, b) how derivative instruments and related hedged items are accounted for and c) how derivative instruments and related hedged items affect an entity’s financial position, financial performance and cash flows. The adoption of the additional disclosure requirements is effective for financial statements issued for fiscal years beginning after November 15, 2008. Management is currently evaluating the application of the adoption of the additional disclosure requirements and its impact on the Funds’ financial statements.
NOTE 7. SUBSEQUENT EVENTS
Effective on November 1, 2009, TAM terminated its sub-advisory agreement with UBS Global Asset Management (Americas) Inc. with respect to Transamerica UBS Dynamic Alpha and entered into a new investment sub-advisory agreement with First Quadrant, L.P. (“First Quadrant”). In connection with the change in sub-adviser, the Fund’s Board of Trustees has approved changes to the Fund’s objectives, strategies and policies, as well as the Fund’s name. The Fund changed its name to Transamerica First Quadrant Global Macro effective November 1, 2009.
Effective November 30, 2009, all Class I shares were re-designated as Class I2 shares.
Management has evaluated subsequent events through December 21, 2009, the date of issuance of the financial statements, and determined that no other material events or transactions would require recognition or disclosure in the Funds’ Financial Statements.
211
Report of Independent Registered Certified Public Accounting Firm
To the Board of Trustees and Shareholders of Transamerica AllianceBernstein International Value, Transamerica BlackRock Global Allocation, Transamerica BlackRock Large Cap Value, Transamerica BlackRock Natural Resources, Transamerica BNY Mellon Market Neutral Strategy, Transamerica Federated Market Opportunity, Transamerica JPMorgan Core Bond, Transamerica JPMorgan International Bond, Transamerica JPMorgan Mid Cap Value, Transamerica Loomis Sayles Bond, Transamerica Neuberger Berman International, Transamerica Oppenheimer Developing Markets, Transamerica Oppenheimer Small- & Mid-Cap Value, Transamerica Schroders International Small Cap, Transamerica Third Avenue Value, Transamerica Thornburg International Value, Transamerica UBS Dynamic Alpha, Transamerica UBS Large Cap Value, Transamerica Van Kampen Emerging Markets Debt, Transamerica Van Kampen Mid-Cap Growth, Transamerica Van Kampen Small Company Growth, Transamerica WMC Emerging Markets, Transamerica Clarion Global Real Estate Securities, Transamerica Jennison Growth, Transamerica MFS International Equity, Transamerica PIMCO Real Return TIPS, and Transamerica PIMCO Total Return:
In our opinion, the accompanying statements of assets and liabilities, including the schedules of investments, and the related statements of operations and of changes in net assets and the financial highlights present fairly, in all material respects, the financial position of Transamerica AllianceBernstein International Value, Transamerica BlackRock Global Allocation, Transamerica BlackRock Large Cap Value, Transamerica BlackRock Natural Resources, Transamerica BNY Mellon Market Neutral Strategy, Transamerica Federated Market Opportunity, Transamerica JPMorgan Core Bond, Transamerica JPMorgan International Bond, Transamerica JPMorgan Mid Cap Value, Transamerica Loomis Sayles Bond, Transamerica Neuberger Berman International, Transamerica Oppenheimer Developing Markets, Transamerica Oppenheimer Small- & Mid-Cap Value, Transamerica Schroders International Small Cap, Transamerica Third Avenue Value, Transamerica Thornburg International Value, Transamerica UBS Dynamic Alpha, Transamerica UBS Large Cap Value, Transamerica Van Kampen Emerging Markets Debt, Transamerica Van Kampen Mid-Cap Growth, Transamerica Van Kampen Small Company Growth, Transamerica WMC Emerging Markets, Transamerica Clarion Global Real Estate Securities, Transamerica Jennison Growth, Transamerica MFS International Equity, Transamerica PIMCO Real Return TIPS, and Transamerica PIMCO Total Return (individually a “Fund”, collectively the “Funds”) at October 31, 2009, and the results of each of their operations, the changes in each of their net assets and the financial highlights for each of the periods indicated, in conformity with accounting principles generally accepted in the United States of America. These financial statements and financial highlights (hereafter referred to as “financial statements”) are the responsibility of the Funds’ management; our responsibility is to express an opinion on these financial statements based on our audits. We conducted our audits of these financial statements in accordance with the standards of the Public Company Accounting Oversight Board (United States). Those standards require that we plan and perform the audit to obtain reasonable assurance about whether the financial statements are free of material misstatement. An audit includes examining, on a test basis, evidence supporting the amounts and disclosures in the financial statements, assessing the accounting principles used and significant estimates made by management, and evaluating the overall financial statement presentation. We believe that our audits, which included confirmation of securities at October 31, 2009 by correspondence with the custodian and brokers, provide a reasonable basis for our opinion.

| |
| |
Tampa, Florida | |
December 21, 2009 | |
212
TRANSAMERICA ALLIANCEBERNSTEIN INTERNATIONAL VALUE
INVESTMENT ADVISORY AND SUB-ADVISORY AGREEMENTS - CONTRACT RENEWAL
(unaudited)
At a meeting of the Board of Trustees of Transamerica Funds (the “Board”) held on June 4, 2009, the Board reviewed and considered the renewal of the investment advisory agreement (the “Investment Advisory Agreement”) between Transamerica AllianceBernstein International Value (the “Fund”) and Transamerica Asset Management, Inc. (“TAM”), as well as the renewal of the investment sub-advisory agreement (the “Sub-Advisory Agreement”) of the Fund between TAM and AllianceBernstein, L.P. (the “Sub-Adviser”), to determine whether the agreements should be renewed.
Following their review and consideration, the Trustees determined that the renewal of the Investment Advisory Agreement and the Sub-Advisory Agreement would enable shareholders of the Fund to obtain high quality services at a cost that is appropriate, fair, and in the best interests of Fund shareholders. The Board, including the independent members of the Board, unanimously approved the renewal of the Investment Advisory Agreement and Sub-Advisory Agreement through June 30, 2010. In reaching their decision, the Trustees requested and obtained from TAM and the Sub-Adviser such information as they deemed reasonably necessary to evaluate the agreements, including information about fees and performance of comparable funds managed by the Sub-Adviser. The Trustees also carefully considered information they had previously received from TAM and the Sub-Adviser as part of their regular oversight of the Fund, as well as comparative fee, expense, and performance information prepared by Lipper Inc. (“Lipper”), an independent provider of mutual fund performance, and fee and expense information and profitability data prepared by management. In considering the proposed continuation of the Investment Advisory and Sub-Advisory Agreements, the Trustees evaluated a number of considerations that they believed, in light of the legal advice furnished to them by independent legal counsel and their own business judgment, to be relevant. They based their decisions on the following considerations, among others, although they did not identify any consideration or particular information that was controlling of their decisions:
The nature, extent and quality of the advisory services to be provided. The Board considered the nature and quality of the services provided by TAM and the Sub-Adviser to the Fund in the past, as well as the services anticipated to be provided in the future. The Trustees also reviewed the Sub-Adviser’s investment approach for the Fund. The Trustees noted that they receive, on a quarterly basis, an execution analysis from Capital Institutional Services, Inc. (CAPIS), an independent provider of trade analyses, for the Sub-Adviser and a comparison of trading results against a peer universe of managers. The Board concluded that TAM and the Sub-Adviser are capable of providing high quality services to the Fund, as indicated by the nature and quality of services provided in the past by TAM and the Sub-Adviser for this Fund and the experience, capability and integrity of TAM’s senior management, the financial resources of TAM and the Sub-Adviser, TAM’s management oversight process and the professional qualifications of the portfolio management team of the Sub-Adviser. The Trustees determined that TAM and the Sub-Adviser can provide investment and related services that are appropriate in scope and extent in light of the Fund’s operations, the competitive landscape of the investment company business and investor needs.
The investment performance of the Fund. The Board examined the short and longer-term performance of the Fund, including relative performance against a peer universe of comparable mutual funds as prepared by Lipper for various trailing periods ended December 31, 2008. The Board noted that the Fund’s performance was below the median for its peer universe for the past 1- and 3-year periods. The Trustees discussed the reasons for the underperformance with TAM, and agreed to continue to monitor the performance of the Fund closely. On the basis of the Board’s assessment of the nature, extent and quality of advisory services to be provided or procured by TAM and the Sub-Adviser, the Board concluded that TAM and the Sub-Adviser are capable of generating a level of investment performance that is appropriate in light of the Fund’s investment objectives, policies and strategies and competitive with other investment companies.
The cost of advisory services provided and the level of profitability. The Board reviewed profitability information of TAM’s cost of procuring fund management services, as well as the costs of provision of administration, fund accounting and other services, to the Fund and to Transamerica Funds as a whole by TAM and its affiliates. The Board reviewed the management and sub-advisory fees for the Fund. The Trustees noted that the Fund’s contractual management fee was below the medians for its peer group and peer universe and that the total expenses of the Fund were below the medians for its peer group and peer universe. Based on their review, the Trustees determined that the management and sub-advisory fees of the Fund generally are appropriate in light of the services expected to be provided or procured, and the anticipated profitability of the relationship between the Fund, TAM and its affiliates, and the Sub-Adviser. In making these observations and determinations, the Board reviewed comparative information provided by Lipper.
Whether fee levels reflect economies of scale and the extent to which economies of scale would be realized as the Fund grows. The Trustees considered the economies of scale with respect to the management of the Fund, whether the Fund had appropriately benefited from any economies of scale, and whether there was potential for realization of any further economies of scale. In evaluating the extent to which the management fees payable under the Investment Advisory and Sub-Advisory Agreements reflect economies of scale or will permit economies of scale to be realized in the future, the Board noted that TAM and the Sub-Adviser offer breakpoints which appropriately benefit investors by passing on economies of scale in the form of lower management fees as the level of assets grows. The Trustees also concluded that they will have the opportunity to periodically reexamine whether the Fund has achieved economies of scale, and the appropriateness of management fees payable to TAM and fees paid to the Sub-Adviser, in the future.
Benefits to TAM, its affiliates, or the Sub-Adviser from their relationship with the Fund. The Board concluded that other benefits anticipated to be derived by TAM, its affiliates, and the Sub-Adviser from their relationships with the Fund are expected to be consistent with industry practice and the best interests of the Fund and its shareholders. The Trustees noted that TAM would not realize soft dollar benefits from its relationship with the Fund. The Board also noted that the Sub-Adviser is participating in a brokerage program pursuant to which a portion of brokerage commissions paid by the Fund is recaptured for the benefit of the Fund and its shareholders, thus limiting the amount of soft dollar arrangements the Sub-Adviser may engage in with respect to the Fund’s brokerage transactions.
Other considerations. The Board determined that TAM has made a substantial commitment to the recruitment and retention of high quality personnel, and maintains the financial, compliance and operational resources reasonably necessary to manage the Fund in a professional manner that is consistent with the best interests of the Fund and its shareholders. In this regard, the Trustees favorably considered the procedures and policies in place by TAM to enforce compliance with applicable laws and regulations and oversee the portfolio management activities of the Sub-Adviser. The Trustees also determined that TAM has made a significant entrepreneurial commitment to the management and success of the Fund, reflected by TAM’s expense limitation and fee waiver arrangements with the Fund, which may result in TAM waiving fees for the benefit of shareholders.
Conclusion. After consideration of the factors described above as well as other factors, the Trustees, including all of the independent members of the Board, concluded that the Investment Advisory Agreement and the Sub-Advisory Agreement, including the fees payable there under, were fair and reasonable and voted to approve the renewal of the Investment Advisory Agreement and the Sub-Advisory Agreement for the Fund.
213
TRANSAMERICA AMERICAN CENTURY LARGE COMPANY VALUE
INVESTMENT ADVISORY AND SUB-ADVISORY AGREEMENTS - CONTRACT RENEWAL
(unaudited)
At a meeting of the Board of Trustees of Transamerica Funds (the “Board”) held on June 4, 2009, the Board reviewed and considered the renewal of the investment advisory agreement (the “Investment Advisory Agreement”) between Transamerica American Century Large Company Value (the “Fund”) and Transamerica Asset Management, Inc. (“TAM”), as well as the renewal of the investment sub-advisory agreement (the “Sub-Advisory Agreement”) of the Fund between TAM and American Century Investment Management, Inc. (the “Sub-Adviser”), to determine whether the agreements should be renewed.
Following their review and consideration, the Trustees determined that the renewal of the Investment Advisory Agreement and the Sub-Advisory Agreement would enable shareholders of the Fund to obtain high quality services at a cost that is appropriate, fair, and in the best interests of Fund shareholders. The Board, including the independent members of the Board, unanimously approved the renewal of the Investment Advisory Agreement and Sub-Advisory Agreement through June 30, 2010. In reaching their decision, the Trustees requested and obtained from TAM and the Sub-Adviser such information as they deemed reasonably necessary to evaluate the agreements, including information about fees and performance of comparable funds managed by the Sub-Adviser. The Trustees also carefully considered information they had previously received from TAM and the Sub-Adviser as part of their regular oversight of the Fund, as well as comparative fee, expense, and performance information prepared by Lipper Inc. (“Lipper”), an independent provider of mutual fund performance, and fee and expense information and profitability data prepared by management. In considering the proposed continuation of the Investment Advisory and Sub-Advisory Agreements, the Trustees evaluated a number of considerations that they believed, in light of the legal advice furnished to them by independent legal counsel and their own business judgment, to be relevant. They based their decisions on the following considerations, among others, although they did not identify any consideration or particular information that was controlling of their decisions:
The nature, extent and quality of the advisory services to be provided. The Board considered the nature and quality of the services provided by TAM and the Sub-Adviser to the Fund in the past, as well as the services anticipated to be provided in the future. The Trustees also reviewed the Sub-Adviser’s investment approach for the Fund. The Trustees noted that they receive, on a quarterly basis, an execution analysis from Capital Institutional Services, Inc. (CAPIS), an independent provider of trade analyses, for the Sub-Adviser and a comparison of trading results against a peer universe of managers. The Board concluded that TAM and the Sub-Adviser are capable of providing high quality services to the Fund, as indicated by the nature and quality of services provided in the past by TAM and the Sub-Adviser for this Fund and the experience, capability and integrity of TAM’s senior management, the financial resources of TAM and the Sub-Adviser, TAM’s management oversight process and the professional qualifications of the portfolio management team of the Sub-Adviser. The Trustees determined that TAM and the Sub-Adviser can provide investment and related services that are appropriate in scope and extent in light of the Fund’s operations, the competitive landscape of the investment company business and investor needs.
The investment performance of the Fund. The Board examined the short and longer-term performance of the Fund, including relative performance against a peer universe of comparable mutual funds as prepared by Lipper for various trailing periods ended December 31, 2008. The Board noted that the Fund’s performance was in line with the median for its peer universe for the past 1-year period and below the median for the past 3- and 5-year periods. The Trustees discussed the reasons for the underperformance with TAM, and agreed that they would continue to monitor the performance of the Fund closely. On the basis of the Board’s assessment of the nature, extent and quality of advisory services to be provided or procured by TAM and the Sub-Adviser, the Board concluded that TAM and the Sub-Adviser are capable of generating a level of investment performance that is appropriate in light of the Fund’s investment objectives, policies and strategies and competitive with other investment companies.
The cost of advisory services provided and the level of profitability. The Board reviewed profitability information of TAM’s cost of procuring fund management services, as well as the costs of provision of administration, fund accounting and other services, to the Fund and to Transamerica Funds as a whole by TAM and its affiliates. The Board reviewed the management and sub-advisory fees for the Fund. The Trustees noted that the Fund’s contractual management fee was above the medians for its peer group and peer universe and that the total expenses of the Fund were above the medians for its peer group and peer universe. Based on their review, the Trustees determined that the management and sub-advisory fees of the Fund generally are appropriate in light of the services expected to be provided or procured, and the anticipated profitability of the relationship between the Fund, TAM and its affiliates, and the Sub-Adviser. In making these observations and determinations, the Board reviewed comparative information provided by Lipper.
Whether fee levels reflect economies of scale and the extent to which economies of scale would be realized as the Fund grows. The Trustees considered the economies of scale with respect to the management of the Fund, whether the Fund had appropriately benefited from any economies of scale, and whether there was potential for realization of any further economies of scale. In evaluating the extent to which the management fees payable under the Investment Advisory and Sub-Advisory Agreements reflect economies of scale or will permit economies of scale to be realized in the future, the Board noted that TAM and the Sub-Adviser offer breakpoints which appropriately benefit investors by passing on economies of scale in the form of lower management fees as the level of assets grows. The Trustees also concluded that they will have the opportunity to periodically reexamine whether the Fund has achieved economies of scale, and the appropriateness of management fees payable to TAM and fees paid to the Sub-Adviser, in the future.
Benefits to TAM, its affiliates, or the Sub-Adviser from their relationship with the Fund. The Board concluded that other benefits anticipated to be derived by TAM, its affiliates, and the Sub-Adviser from their relationships with the Fund are expected to be consistent with industry practice and the best interests of the Fund and its shareholders. The Trustees noted that TAM would not realize soft dollar benefits from its relationship with the Fund.
Other considerations. The Board determined that TAM has made a substantial commitment to the recruitment and retention of high quality personnel, and maintains the financial, compliance and operational resources reasonably necessary to manage the Fund in a professional manner that is consistent with the best interests of the Fund and its shareholders. In this regard, the Trustees favorably considered the procedures and policies in place by TAM to enforce compliance with applicable laws and regulations and oversee the portfolio management activities of the Sub-Adviser. The Trustees also determined that TAM has made a significant entrepreneurial commitment to the management and success of the Fund, reflected by TAM’s expense limitation and fee waiver arrangements with the Fund, which may result in TAM waiving fees for the benefit of shareholders.
Conclusion. After consideration of the factors described above as well as other factors, the Trustees, including all of the independent members of the Board, concluded that the Investment Advisory Agreement and the Sub-Advisory Agreement, including the fees payable there under, were fair and reasonable and voted to approve the renewal of the Investment Advisory Agreement and the Sub-Advisory Agreement for the Fund.
214
TRANSAMERICA BLACKROCK GLOBAL ALLOCATION
INVESTMENT ADVISORY AND SUB-ADVISORY AGREEMENTS - CONTRACT RENEWAL
(unaudited)
At a meeting of the Board of Trustees of Transamerica Funds (the “Board”) held on June 4, 2009, the Board reviewed and considered the renewal of the investment advisory agreement (the “Investment Advisory Agreement”) between Transamerica BlackRock Global Allocation (the “Fund”) and Transamerica Asset Management, Inc. (“TAM”), as well as the renewal of the investment sub-advisory agreement (the “Sub-Advisory Agreement”) of the Fund between TAM and BlackRock Investment Management, LLC (the “Sub-Adviser”), to determine whether the agreements should be renewed.
Following their review and consideration, the Trustees determined that the renewal of the Investment Advisory Agreement and the Sub-Advisory Agreement would enable shareholders of the Fund to obtain high quality services at a cost that is appropriate, fair, and in the best interests of Fund shareholders. The Board, including the independent members of the Board, unanimously approved the renewal of the Investment Advisory Agreement and Sub-Advisory Agreement through June 30, 2010. In reaching their decision, the Trustees requested and obtained from TAM and the Sub-Adviser such information as they deemed reasonably necessary to evaluate the agreements, including information about fees and performance of comparable funds managed by the Sub-Adviser. The Trustees also carefully considered information they had previously received from TAM and the Sub-Adviser as part of their regular oversight of the Fund, as well as comparative fee, expense, and performance information prepared by Lipper Inc. (“Lipper”), an independent provider of mutual fund performance, and fee and expense information and profitability data prepared by management. In considering the proposed continuation of the Investment Advisory and Sub-Advisory Agreements, the Trustees evaluated a number of considerations that they believed, in light of the legal advice furnished to them by independent legal counsel and their own business judgment, to be relevant. They based their decisions on the following considerations, among others, although they did not identify any consideration or particular information that was controlling of their decisions:
The nature, extent and quality of the advisory services to be provided. The Board considered the nature and quality of the services provided by TAM and the Sub-Adviser to the Fund in the past, as well as the services anticipated to be provided in the future. The Trustees also reviewed the Sub-Adviser’s investment approach for the Fund. The Trustees noted that they receive, on a quarterly basis, an execution analysis from Capital Institutional Services, Inc. (CAPIS), an independent provider of trade analyses, for the Sub-Adviser and a comparison of trading results against a peer universe of managers. The Board concluded that TAM and the Sub-Adviser are capable of providing high quality services to the Fund, as indicated by the nature and quality of services provided in the past by TAM and the Sub-Adviser for this Fund and the experience, capability and integrity of TAM’s senior management, the financial resources of TAM and the Sub-Adviser, TAM’s management oversight process and the professional qualifications of the portfolio management team of the Sub-Adviser. The Trustees determined that TAM and the Sub-Adviser can provide investment and related services that are appropriate in scope and extent in light of the Fund’s operations, the competitive landscape of the investment company business and investor needs.
The investment performance of the Fund. The Board examined the short and longer-term performance of the Fund, including relative performance against a peer universe of comparable mutual funds as prepared by Lipper for various trailing periods ended December 31, 2008. The Board noted that the Fund’s performance was above the median for its peer universe for the past 1- and 3-year periods. On the basis of the Board’s assessment of the nature, extent and quality of advisory services to be provided or procured by TAM and the Sub-Adviser, the Board concluded that TAM and the Sub-Adviser are capable of generating a level of investment performance that is appropriate in light of the Fund’s investment objectives, policies and strategies and competitive with other investment companies.
The cost of advisory services provided and the level of profitability. The Board reviewed profitability information of TAM’s cost of procuring fund management services, as well as the costs of provision of administration, fund accounting and other services, to the Fund and to Transamerica Funds as a whole by TAM and its affiliates. The Board reviewed the management and sub-advisory fees for the Fund. The Trustees noted that the Fund’s contractual management fee was below the medians for its peer group and peer universe and that the total expenses of the Fund were below the medians for its peer group and peer universe. Based on their review, the Trustees determined that the management and sub-advisory fees of the Fund generally are appropriate in light of the services expected to be provided or procured, and the anticipated profitability of the relationship between the Fund, TAM and its affiliates, and the Sub-Adviser. In making these observations and determinations, the Board reviewed comparative information provided by Lipper.
Whether fee levels reflect economies of scale and the extent to which economies of scale would be realized as the Fund grows. The Trustees considered the economies of scale with respect to the management of the Fund, whether the Fund had appropriately benefited from any economies of scale, and whether there was potential for realization of any further economies of scale. In evaluating the extent to which the management fees payable under the Investment Advisory and Sub-Advisory Agreements reflect economies of scale or will permit economies of scale to be realized in the future, the Board noted that TAM and the Sub-Adviser offer breakpoints which appropriately benefit investors by passing on economies of scale in the form of lower management fees as the level of assets grows. The Trustees also concluded that they will have the opportunity to periodically reexamine whether the Fund has achieved economies of scale, and the appropriateness of management fees payable to TAM and fees paid to the Sub-Adviser, in the future.
Benefits to TAM, its affiliates, or the Sub-Adviser from their relationship with the Fund. The Board concluded that other benefits anticipated to be derived by TAM, its affiliates, and the Sub-Adviser from their relationships with the Fund are expected to be consistent with industry practice and the best interests of the Fund and its shareholders. The Trustees noted that TAM would not realize soft dollar benefits from its relationship with the Fund.
Other considerations. The Board determined that TAM has made a substantial commitment to the recruitment and retention of high quality personnel, and maintains the financial, compliance and operational resources reasonably necessary to manage the Fund in a professional manner that is consistent with the best interests of the Fund and its shareholders. In this regard, the Trustees favorably considered the procedures and policies in place by TAM to enforce compliance with applicable laws and regulations and oversee the portfolio management activities of the Sub-Adviser. The Trustees also determined that TAM has made a significant entrepreneurial commitment to the management and success of the Fund, reflected by TAM’s expense limitation and fee waiver arrangements with the Fund, which may result in TAM waiving fees for the benefit of shareholders.
215
TRANSAMERICA BLACKROCK LARGE CAP VALUE
INVESTMENT ADVISORY AND SUB-ADVISORY AGREEMENTS - CONTRACT RENEWAL
(unaudited)
At a meeting of the Board of Trustees of Transamerica Funds (the “Board”) held on June 4, 2009, the Board reviewed and considered the renewal of the investment advisory agreement (the “Investment Advisory Agreement”) between Transamerica BlackRock Large Cap Value (the “Fund”) and Transamerica Asset Management, Inc. (“TAM”), as well as the renewal of the investment sub-advisory agreement (the “Sub-Advisory Agreement”) of the Fund between TAM and BlackRock Investment Management, LLC (the “Sub-Adviser”), to determine whether the agreements should be renewed.
Following their review and consideration, the Trustees determined that the renewal of the Investment Advisory Agreement and the Sub-Advisory Agreement would enable shareholders of the Fund to obtain high quality services at a cost that is appropriate, fair, and in the best interests of Fund shareholders. The Board, including the independent members of the Board, unanimously approved the renewal of the Investment Advisory Agreement and Sub-Advisory Agreement through June 30, 2010. In reaching their decision, the Trustees requested and obtained from TAM and the Sub-Adviser such information as they deemed reasonably necessary to evaluate the agreements, including information about fees and performance of comparable funds managed by the Sub-Adviser. The Trustees also carefully considered information they had previously received from TAM and the Sub-Adviser as part of their regular oversight of the Fund, as well as comparative fee, expense, and performance information prepared by Lipper Inc. (“Lipper”), an independent provider of mutual fund performance, and fee and expense information and profitability data prepared by management. In considering the proposed continuation of the Investment Advisory and Sub-Advisory Agreements, the Trustees evaluated a number of considerations that they believed, in light of the legal advice furnished to them by independent legal counsel and their own business judgment, to be relevant. They based their decisions on the following considerations, among others, although they did not identify any consideration or particular information that was controlling of their decisions:
The nature, extent and quality of the advisory services to be provided. The Board considered the nature and quality of the services provided by TAM and the Sub-Adviser to the Fund in the past, as well as the services anticipated to be provided in the future. The Trustees also reviewed the Sub-Adviser’s investment approach for the Fund. The Trustees noted that they receive, on a quarterly basis, an execution analysis from Capital Institutional Services, Inc. (CAPIS), an independent provider of trade analyses, for the Sub-Adviser and a comparison of trading results against a peer universe of managers. The Board concluded that TAM and the Sub-Adviser are capable of providing high quality services to the Fund, as indicated by the nature and quality of services provided in the past by TAM and the Sub-Adviser for this Fund and the experience, capability and integrity of TAM’s senior management, the financial resources of TAM and the Sub-Adviser, TAM’s management oversight process and the professional qualifications of the portfolio management team of the Sub-Adviser. The Trustees determined that TAM and the Sub-Adviser can provide investment and related services that are appropriate in scope and extent in light of the Fund’s operations, the competitive landscape of the investment company business and investor needs.
The investment performance of the Fund. The Board examined the short and longer-term performance of the Fund, including relative performance against a peer universe of comparable mutual funds as prepared by Lipper for various trailing periods ended December 31, 2008. The Board noted that the Fund’s performance was in line with the median for its peer universe for the past 1- and 3-year periods. On the basis of the Board’s assessment of the nature, extent and quality of advisory services to be provided or procured by TAM and the Sub-Adviser, the Board concluded that TAM and the Sub-Adviser are capable of generating a level of investment performance that is appropriate in light of the Fund’s investment objectives, policies and strategies and competitive with other investment companies.
The cost of advisory services provided and the level of profitability. The Board reviewed profitability information of TAM’s cost of procuring fund management services, as well as the costs of provision of administration, fund accounting and other services, to the Fund and to Transamerica Funds as a whole by TAM and its affiliates. The Board reviewed the management and sub-advisory fees for the Fund. The Trustees noted that the Fund’s contractual management fee was in line with the medians for its peer group and peer universe and that the total expenses of the Fund were below the medians for its peer group and peer universe. Based on their review, the Trustees determined that the management and sub-advisory fees of the Fund generally are appropriate in light of the services expected to be provided or procured, and the anticipated profitability of the relationship between the Fund, TAM and its affiliates, and the Sub-Adviser. In making these observations and determinations, the Board reviewed comparative information provided by Lipper.
Whether fee levels reflect economies of scale and the extent to which economies of scale would be realized as the Fund grows. The Trustees considered the economies of scale with respect to the management of the Fund, whether the Fund had appropriately benefited from any economies of scale, and whether there was potential for realization of any further economies of scale. In evaluating the extent to which the management fees payable under the Investment Advisory and Sub-Advisory Agreements reflect economies of scale or will permit economies of scale to be realized in the future, the Board noted that TAM and the Sub-Adviser offer breakpoints which appropriately benefit investors by passing on economies of scale in the form of lower management fees as the level of assets grows. The Trustees also concluded that they will have the opportunity to periodically reexamine whether the Fund has achieved economies of scale, and the appropriateness of management fees payable to TAM and fees paid to the Sub-Adviser, in the future.
Benefits to TAM, its affiliates, or the Sub-Adviser from their relationship with the Fund. The Board concluded that other benefits anticipated to be derived by TAM, its affiliates, and the Sub-Adviser from their relationships with the Fund are expected to be consistent with industry practice and the best interests of the Fund and its shareholders. The Trustees noted that TAM would not realize soft dollar benefits from its relationship with the Fund.
Other considerations. The Board determined that TAM has made a substantial commitment to the recruitment and retention of high quality personnel, and maintains the financial, compliance and operational resources reasonably necessary to manage the Fund in a professional manner that is consistent with the best interests of the Fund and its shareholders. In this regard, the Trustees favorably considered the procedures and policies in place by TAM to enforce compliance with applicable laws and regulations and oversee the portfolio management activities of the Sub-Adviser. The Trustees also determined that TAM has made a significant entrepreneurial commitment to the management and success of the Fund, reflected by TAM’s expense limitation and fee waiver arrangements with the Fund, which may result in TAM waiving fees for the benefit of shareholders.
Conclusion. After consideration of the factors described above as well as other factors, the Trustees, including all of the independent members of the Board, concluded that the Investment Advisory Agreement and the Sub-Advisory Agreement, including the fees payable there under, were fair and reasonable and voted to approve the renewal of the Investment Advisory Agreement and the Sub-Advisory Agreement for the Fund.
216
TRANSAMERICA BLACKROCK NATURAL RESOURCES
INVESTMENT ADVISORY AND SUB-ADVISORY AGREEMENTS - CONTRACT RENEWAL
(unaudited)
At a meeting of the Board of Trustees of Transamerica Funds (the “Board”) held on June 4, 2009, the Board reviewed and considered the renewal of the investment advisory agreement (the “Investment Advisory Agreement”) between Transamerica BlackRock Natural Resources (the “Fund”) and Transamerica Asset Management, Inc. (“TAM”), as well as the renewal of the investment sub-advisory agreement (the “Sub-Advisory Agreement”) of the Fund between TAM and BlackRock Investment Management, LLC (the “Sub-Adviser”), to determine whether the agreements should be renewed.
Following their review and consideration, the Trustees determined that the renewal of the Investment Advisory Agreement and the Sub-Advisory Agreement would enable shareholders of the Fund to obtain high quality services at a cost that is appropriate, fair, and in the best interests of Fund shareholders. The Board, including the independent members of the Board, unanimously approved the renewal of the Investment Advisory Agreement and Sub-Advisory Agreement through June 30, 2010. In reaching their decision, the Trustees requested and obtained from TAM and the Sub-Adviser such information as they deemed reasonably necessary to evaluate the agreements, including information about fees and performance of comparable funds managed by the Sub-Adviser. The Trustees also carefully considered information they had previously received from TAM and the Sub-Adviser as part of their regular oversight of the Fund, as well as comparative fee, expense, and performance information prepared by Lipper Inc. (“Lipper”), an independent provider of mutual fund performance, and fee and expense information and profitability data prepared by management. In considering the proposed continuation of the Investment Advisory and Sub-Advisory Agreements, the Trustees evaluated a number of considerations that they believed, in light of the legal advice furnished to them by independent legal counsel and their own business judgment, to be relevant. They based their decisions on the following considerations, among others, although they did not identify any consideration or particular information that was controlling of their decisions:
The nature, extent and quality of the advisory services to be provided. The Board considered the nature and quality of the services provided by TAM and the Sub-Adviser to the Fund in the past, as well as the services anticipated to be provided in the future. The Trustees also reviewed the Sub-Adviser’s investment approach for the Fund. The Trustees noted that they receive, on a quarterly basis, an execution analysis from Capital Institutional Services, Inc. (CAPIS), an independent provider of trade analyses, for the Sub-Adviser and a comparison of trading results against a peer universe of managers. The Board concluded that TAM and the Sub-Adviser are capable of providing high quality services to the Fund, as indicated by the nature and quality of services provided in the past by TAM and the Sub-Adviser for this Fund and the experience, capability and integrity of TAM’s senior management, the financial resources of TAM and the Sub-Adviser, TAM’s management oversight process and the professional qualifications of the portfolio management team of the Sub-Adviser. The Trustees determined that TAM and the Sub-Adviser can provide investment and related services that are appropriate in scope and extent in light of the Fund’s operations, the competitive landscape of the investment company business and investor needs.
The investment performance of the Fund. The Board examined the short and longer-term performance of the Fund, including relative performance against a peer universe of comparable mutual funds as prepared by Lipper for various trailing periods ended December 31, 2008, noting that the Fund’s inception date was January 3, 2007. The Board noted that the Fund’s performance was in line with the median for its peer universe for the past 1-year period. On the basis of the Board’s assessment of the nature, extent and quality of advisory services to be provided or procured by TAM and the Sub-Adviser, the Board concluded that TAM and the Sub-Adviser are capable of generating a level of investment performance that is appropriate in light of the Fund���s investment objectives, policies and strategies and competitive with other investment companies.
The cost of advisory services provided and the level of profitability. The Board reviewed profitability information of TAM’s cost of procuring fund management services, as well as the costs of provision of administration, fund accounting and other services, to the Fund and to Transamerica Funds as a whole by TAM and its affiliates. The Board reviewed the management and sub-advisory fees for the Fund. The Trustees noted that the Fund’s contractual management fee was in line with the medians for its peer group and peer universe and that the total expenses of the Fund were below the medians for its peer group and peer universe. Based on their review, the Trustees determined that the management and sub-advisory fees of the Fund generally are appropriate in light of the services expected to be provided or procured, and the anticipated profitability of the relationship between the Fund, TAM and its affiliates, and the Sub-Adviser. In making these observations and determinations, the Board reviewed comparative information provided by Lipper.
Whether fee levels reflect economies of scale and the extent to which economies of scale would be realized as the Fund grows. The Trustees considered the economies of scale with respect to the management of the Fund, whether the Fund had appropriately benefited from any economies of scale, and whether there was potential for realization of any further economies of scale. In evaluating the extent to which the management fees payable under the Investment Advisory and Sub-Advisory Agreements reflect economies of scale or will permit economies of scale to be realized in the future, the Board noted that TAM and the Sub-Adviser offer breakpoints which appropriately benefit investors by passing on economies of scale in the form of lower management fees as the level of assets grows. The Trustees also concluded that they will have the opportunity to periodically reexamine whether the Fund has achieved economies of scale, and the appropriateness of management fees payable to TAM and fees paid to the Sub-Adviser, in the future.
Benefits to TAM, its affiliates, or the Sub-Adviser from their relationship with the Fund. The Board concluded that other benefits anticipated to be derived by TAM, its affiliates, and the Sub-Adviser from their relationships with the Fund are expected to be consistent with industry practice and the best interests of the Fund and its shareholders. The Trustees noted that TAM would not realize soft dollar benefits from its relationship with the Fund.
Other considerations. The Board determined that TAM has made a substantial commitment to the recruitment and retention of high quality personnel, and maintains the financial, compliance and operational resources reasonably necessary to manage the Fund in a professional manner that is consistent with the best interests of the Fund and its shareholders. In this regard, the Trustees favorably considered the procedures and policies in place by TAM to enforce compliance with applicable laws and regulations and oversee the portfolio management activities of the Sub-Adviser. The Trustees also determined that TAM has made a significant entrepreneurial commitment to the management and success of the Fund, reflected by TAM’s expense limitation and fee waiver arrangements with the Fund, which may result in TAM waiving fees for the benefit of shareholders.
Conclusion. After consideration of the factors described above as well as other factors, the Trustees, including all of the independent members of the Board, concluded that the Investment Advisory Agreement and the Sub-Advisory Agreement, including the fees payable there under, were fair and reasonable and voted to approve the renewal of the Investment Advisory Agreement and the Sub-Advisory Agreement for the Fund.
217
TRANSAMERICA BNY MELLON MARKET NEUTRAL STRATEGY
INVESTMENT ADVISORY AND SUB-ADVISORY AGREEMENTS - CONTRACT RENEWAL
(unaudited)
At a meeting of the Board of Trustees of Transamerica Funds (the “Board”) held on June 4, 2009, the Board reviewed and considered the renewal of the investment advisory agreement (the “Investment Advisory Agreement”) between Transamerica BNY Mellon Market Neutral Strategy (the “Fund”) and Transamerica Asset Management, Inc. (“TAM”), as well as the renewal of the investment sub-advisory agreement (the “Sub-Advisory Agreement”) of the Fund between TAM and Mellon Capital Management Corporation (the “Sub-Adviser”), to determine whether the agreements should be renewed.
Following their review and consideration, the Trustees determined that the renewal of the Investment Advisory Agreement and the Sub-Advisory Agreement would enable shareholders of the Fund to obtain high quality services at a cost that is appropriate, fair, and in the best interests of Fund shareholders. The Board, including the independent members of the Board, unanimously approved the renewal of the Investment Advisory Agreement and Sub-Advisory Agreement through June 30, 2010. In reaching their decision, the Trustees requested and obtained from TAM and the Sub-Adviser such information as they deemed reasonably necessary to evaluate the agreements, including information about fees and performance of comparable funds managed by the Sub-Adviser. The Trustees also carefully considered information they had previously received from TAM and the Sub-Adviser as part of their regular oversight of the Fund, as well as comparative fee, expense, and performance information prepared by Lipper Inc. (“Lipper”), an independent provider of mutual fund performance, and fee and expense information and profitability data prepared by management. In considering the proposed continuation of the Investment Advisory and Sub-Advisory Agreements, the Trustees evaluated a number of considerations that they believed, in light of the legal advice furnished to them by independent legal counsel and their own business judgment, to be relevant. They based their decisions on the following considerations, among others, although they did not identify any consideration or particular information that was controlling of their decisions:
The nature, extent and quality of the advisory services to be provided. The Board considered the nature and quality of the services provided by TAM and the Sub-Adviser to the Fund in the past, as well as the services anticipated to be provided in the future. The Trustees also reviewed the Sub-Adviser’s investment approach for the Fund. The Trustees noted that they receive, on a quarterly basis, an execution analysis from Capital Institutional Services, Inc. (CAPIS), an independent provider of trade analyses, for the Sub-Adviser and a comparison of trading results against a peer universe of managers. The Board concluded that TAM and the Sub-Adviser are capable of providing high quality services to the Fund, as indicated by the nature and quality of services provided in the past by TAM and the Sub-Adviser for this Fund and the experience, capability and integrity of TAM’s senior management, the financial resources of TAM and the Sub-Adviser, TAM’s management oversight process and the professional qualifications of the portfolio management team of the Sub-Adviser. The Trustees determined that TAM and the Sub-Adviser can provide investment and related services that are appropriate in scope and extent in light of the Fund’s operations, the competitive landscape of the investment company business and investor needs.
The investment performance of the Fund. The Board examined the short and longer-term performance of the Fund, including relative performance against a peer universe of comparable mutual funds as prepared by Lipper for various trailing periods ended December 31, 2008, noting that the Fund’s inception date was on January 3, 2007. The Board noted that the Fund’s performance was above the median for its peer universe for the past 1-year period. On the basis of the Board’s assessment of the nature, extent and quality of advisory services to be provided or procured by TAM and the Sub-Adviser, the Board concluded that TAM and the Sub-Adviser are capable of generating a level of investment performance that is appropriate in light of the Fund’s investment objectives, policies and strategies and competitive with other investment companies.
The cost of advisory services provided and the level of profitability. The Board reviewed profitability information of TAM’s cost of procuring fund management services, as well as the costs of provision of administration, fund accounting and other services, to the Fund and to Transamerica Funds as a whole by TAM and its affiliates. The Board reviewed the management and sub-advisory fees for the Fund. The Trustees noted that the Fund’s contractual management fee was above the medians for its peer group and peer universe and that the total expenses of the Fund were below the medians for its peer group and peer universe. Based on their review, the Trustees determined that the management and sub-advisory fees of the Fund generally are appropriate in light of the services expected to be provided or procured, and the anticipated profitability of the relationship between the Fund, TAM and its affiliates, and the Sub-Adviser. In making these observations and determinations, the Board reviewed comparative information provided by Lipper.
Whether fee levels reflect economies of scale and the extent to which economies of scale would be realized as the Fund grows. The Trustees considered the economies of scale with respect to the management of the Fund, whether the Fund had appropriately benefited from any economies of scale, and whether there was potential for realization of any further economies of scale. The Board considered the specific reasons for the absence of breakpoints in the management fee schedule, and concluded that the absence of breakpoints was acceptable under the circumstances. The Trustees also concluded that they will have the opportunity to periodically reexamine whether the Fund has achieved economies of scale, and the appropriateness of management fees payable to TAM and fees paid to the Sub-Adviser, in the future.
Benefits to TAM, its affiliates, or the Sub-Adviser from their relationship with the Fund. The Board concluded that other benefits anticipated to be derived by TAM, its affiliates, and the Sub-Adviser from their relationships with the Fund are expected to be consistent with industry practice and the best interests of the Fund and its shareholders. The Trustees noted that TAM would not realize soft dollar benefits from its relationship with the Fund.
Other considerations. The Board determined that TAM has made a substantial commitment to the recruitment and retention of high quality personnel, and maintains the financial, compliance and operational resources reasonably necessary to manage the Fund in a professional manner that is consistent with the best interests of the Fund and its shareholders. In this regard, the Trustees favorably considered the procedures and policies in place by TAM to enforce compliance with applicable laws and regulations and oversee the portfolio management activities of the Sub-Adviser. The Trustees also determined that TAM has made a significant entrepreneurial commitment to the management and success of the Fund, reflected by TAM’s expense limitation and fee waiver arrangements with the Fund, which may result in TAM waiving fees for the benefit of shareholders.
Conclusion. After consideration of the factors described above as well as other factors, the Trustees, including all of the independent members of the Board, concluded that the Investment Advisory Agreement and the Sub-Advisory Agreement, including the fees payable there under, were fair and reasonable and voted to approve the renewal of the Investment Advisory Agreement and the Sub-Advisory Agreement for the Fund.
218
TRANSAMERICA CLARION GLOBAL REAL ESTATE SECURITIES
INVESTMENT ADVISORY AND SUB-ADVISORY AGREEMENTS - CONTRACT RENEWAL
(unaudited)
At a meeting of the Board of Trustees of Transamerica Funds (the “Board”) held on June 4, 2009, the Board reviewed and considered the renewal of the investment advisory agreement (the “Investment Advisory Agreement”) between Transamerica Clarion Global Real Estate Securities (the “Fund”) and Transamerica Asset Management, Inc. (“TAM”), as well as the renewal of the investment sub-advisory agreement (the “Sub-Advisory Agreement”) of the Fund between TAM and ING Clarion Real Estate Securities LP (the “Sub-Adviser”), to determine whether the agreements should be renewed.
Following their review and consideration, the Trustees determined that the renewal of the Investment Advisory Agreement and the Sub-Advisory Agreement would enable shareholders of the Fund to obtain high quality services at a cost that is appropriate, fair, and in the best interests of Fund shareholders. The Board, including the independent members of the Board, unanimously approved the renewal of the Investment Advisory Agreement and Sub-Advisory Agreement through June 30, 2010. In reaching their decision, the Trustees requested and obtained from TAM and the Sub-Adviser such information as they deemed reasonably necessary to evaluate the agreements, including information about fees and performance of comparable funds managed by the Sub-Adviser. The Trustees also carefully considered information they had previously received from TAM and the Sub-Adviser as part of their regular oversight of the Fund, as well as comparative fee, expense, and performance information prepared by Lipper Inc. (“Lipper”), an independent provider of mutual fund performance, and fee and expense information and profitability data prepared by management. In considering the proposed continuation of the Investment Advisory and Sub-Advisory Agreements, the Trustees evaluated a number of considerations that they believed, in light of the legal advice furnished to them by independent legal counsel and their own business judgment, to be relevant. They based their decisions on the following considerations, among others, although they did not identify any consideration or particular information that was controlling of their decisions:
The nature, extent and quality of the advisory services to be provided. The Board considered the nature and quality of the services provided by TAM and the Sub-Adviser to the Fund in the past, as well as the services anticipated to be provided in the future. The Trustees also reviewed the Sub-Adviser’s investment approach for the Fund. The Trustees noted that they receive, on a quarterly basis, an execution analysis from Capital Institutional Services, Inc. (CAPIS), an independent provider of trade analyses, for the Sub-Adviser and a comparison of trading results against a peer universe of managers. The Board concluded that TAM and the Sub-Adviser are capable of providing high quality services to the Fund, as indicated by the nature and quality of services provided in the past by TAM and the Sub-Adviser for this Fund and the experience, capability and integrity of TAM’s senior management, the financial resources of TAM and the Sub-Adviser, TAM’s management oversight process and the professional qualifications of the portfolio management team of the Sub-Adviser. The Trustees determined that TAM and the Sub-Adviser can provide investment and related services that are appropriate in scope and extent in light of the Fund’s operations, the competitive landscape of the investment company business and investor needs.
The investment performance of the Fund. The Board examined the short and longer-term performance of the Fund, including relative performance against a peer universe of comparable mutual funds as prepared by Lipper for various trailing periods ended December 31, 2008. The Board noted that the Fund’s performance was above the median for its peer universe for the past 1-, 3- and 5-year periods. On the basis of the Board’s assessment of the nature, extent and quality of advisory services to be provided or procured by TAM and the Sub-Adviser, the Board concluded that TAM and the Sub-Adviser are capable of generating a level of investment performance that is appropriate in light of the Fund’s investment objectives, policies and strategies and competitive with other investment companies.
The cost of advisory services provided and the level of profitability. The Board reviewed profitability information of TAM’s cost of procuring fund management services, as well as the costs of provision of administration, fund accounting and other services, to the Fund and to Transamerica Funds as a whole by TAM and its affiliates. The Board reviewed the management and sub-advisory fees for the Fund. The Trustees noted that the Fund’s contractual management fee was in line with the medians for its peer group and peer universe and that the total expenses of the Fund were below the medians for its peer group and peer universe. Based on their review, the Trustees determined that the management and sub-advisory fees of the Fund generally are appropriate in light of the services expected to be provided or procured, and the anticipated profitability of the relationship between the Fund, TAM and its affiliates, and the Sub-Adviser. In making these observations and determinations, the Board reviewed comparative information provided by Lipper.
Whether fee levels reflect economies of scale and the extent to which economies of scale would be realized as the Fund grows. The Trustees considered the economies of scale with respect to the management of the Fund, whether the Fund had appropriately benefited from any economies of scale, and whether there was potential for realization of any further economies of scale. In evaluating the extent to which the management fees payable under the Investment Advisory and Sub-Advisory Agreements reflect economies of scale or will permit economies of scale to be realized in the future, the Board noted that TAM and the Sub-Adviser offer breakpoints which appropriately benefit investors by passing on economies of scale in the form of lower management fees as the level of assets grows. The Trustees also concluded that they will have the opportunity to periodically reexamine whether the Fund has achieved economies of scale, and the appropriateness of management fees payable to TAM and fees paid to the Sub-Adviser, in the future.
Benefits to TAM, its affiliates, or the Sub-Adviser from their relationship with the Fund. The Board concluded that other benefits anticipated to be derived by TAM, its affiliates, and the Sub-Adviser from their relationships with the Fund are expected to be consistent with industry practice and the best interests of the Fund and its shareholders. The Trustees noted that TAM would not realize soft dollar benefits from its relationship with the Fund. The Board also noted that the Sub-Adviser is participating in a brokerage program pursuant to which a portion of brokerage commissions paid by the Fund is recaptured for the benefit of the Fund and its shareholders, thus limiting the amount of soft dollar arrangements the Sub-Adviser may engage in with respect to the Fund’s brokerage transactions.
Other considerations. The Board determined that TAM has made a substantial commitment to the recruitment and retention of high quality personnel, and maintains the financial, compliance and operational resources reasonably necessary to manage the Fund in a professional manner that is consistent with the best interests of the Fund and its shareholders. In this regard, the Trustees favorably considered the procedures and policies in place by TAM to enforce compliance with applicable laws and regulations and oversee the portfolio management activities of the Sub-Adviser. The Trustees also determined that TAM has made a significant entrepreneurial commitment to the management and success of the Fund, reflected by TAM’s expense limitation and fee waiver arrangements with the Fund, which may result in TAM waiving fees for the benefit of shareholders.
Conclusion. After consideration of the factors described above as well as other factors, the Trustees, including all of the independent members of the Board, concluded that the Investment Advisory Agreement and the Sub-Advisory Agreement, including the fees payable there under, were fair and reasonable and voted to approve the renewal of the Investment Advisory Agreement and the Sub-Advisory Agreement for the Fund.
219
TRANSAMERICA EVERGREEN HEALTH CARE
INVESTMENT ADVISORY AGREEMENT - CONTRACT RENEWAL
(unaudited)
At a meeting of the Board of Trustees of Transamerica Funds (the “Board”) held on June 4, 2009, the Board reviewed and considered the renewal of the investment advisory agreement (the “Investment Advisory Agreement”) between Transamerica Evergreen Health Care (the “Fund”) and Transamerica Asset Management, Inc. (“TAM”), to determine whether the agreement should be renewed.
Following their review and consideration, the Trustees determined that the renewal of the Investment Advisory Agreement would enable shareholders of the Fund to obtain high quality services at a cost that is appropriate, fair, and in the best interests of Fund shareholders. The Board, including the independent members of the Board, unanimously approved the renewal of the Investment Advisory Agreement through June 30, 2010. In reaching their decision, the Trustees requested and obtained from TAM such information as they deemed reasonably necessary to evaluate the agreement. The Trustees also carefully considered information they had previously received from TAM as part of their regular oversight of the Fund, as well as comparative fee, expense, and performance information prepared by Lipper Inc. (“Lipper”), an independent provider of mutual fund performance, and fee and expense information and profitability data prepared by management. In considering the proposed continuation of the Investment Advisory Agreement, the Trustees evaluated a number of considerations that they believed, in light of the legal advice furnished to them by independent legal counsel and their own business judgment, to be relevant. They based their decision on the following considerations, among others, although they did not identify any consideration or particular information that was controlling of their decision:
The nature, extent and quality of the advisory services to be provided. The Board considered the nature and quality of the services provided by TAM to the Fund in the past, as well as the services anticipated to be provided in the future. The Board concluded that TAM is capable of providing high quality services to the Fund, as indicated by the nature and quality of services provided in the past by TAM for this Fund and the experience, capability and integrity of TAM’s senior management, the financial resources of TAM, and the professional qualifications of the portfolio management team of TAM. The Trustees determined that TAM can provide investment and related services that are appropriate in scope and extent in light of the Fund’s operations, the competitive landscape of the investment company business and investor needs.
The investment performance of the Fund. The Board examined the short and longer-term performance of the Fund, including relative performance against a peer universe of comparable asset allocation funds as prepared by Lipper for various trailing periods ended December 31, 2008. The Board noted that the Fund’s performance was below the median for its peer universe for the past 1-year period and above the median for the past 3- and 5- year periods. On the basis of the Board’s assessment of the nature, extent and quality of advisory services to be provided or procured by TAM, the Board concluded that TAM is capable of generating a level of investment performance that is appropriate in light of the Fund’s investment objectives, policies and strategies and competitive with other investment companies.
The cost of advisory services provided and the level of profitability. The Board reviewed profitability information of TAM’s cost of procuring fund management services, as well as the costs of provision of administration, fund accounting and other services, to the Fund and to Transamerica Funds as a whole by TAM and its affiliates. The Board reviewed the management fee for the Fund. The Trustees noted that the Fund’s contractual management fee was in line with medians for its expense group and universe and total expenses were below the medians for its expense group and universe. Based on their review, the Trustees determined that the management fee of the Fund generally is appropriate in light of the services expected to be provided or procured, and the anticipated profitability of the relationship between the Fund and TAM and its affiliates. In making these observations and determinations, the Board reviewed comparative information provided by Lipper.
Whether fee levels reflect economies of scale and the extent to which economies of scale would be realized as the Fund grows. The Trustees considered the economies of scale with respect to the management of the Fund, whether the Fund had appropriately benefited from any economies of scale, and whether there was potential for realization of any further economies of scale. The Trustees considered the absence of breakpoints in the management fee schedule, and concluded the absence of breakpoints was acceptable under the circumstances. The Trustees also concluded that they will have the opportunity to periodically reexamine whether the Fund has achieved economies of scale, and the appropriateness of management fees payable to TAM, in the future.
Benefits to TAM and its affiliates from their relationship with the Fund. The Board concluded that other benefits anticipated to be derived by TAM and its affiliates from their relationships with the Fund are expected to be consistent with industry practice and the best interests of the Fund and its shareholders. The Trustees noted that TAM would not realize soft dollar benefits from its relationship with the Fund.
Other considerations. The Board determined that TAM has made a substantial commitment to the recruitment and retention of high quality personnel, and maintains the financial, compliance and operational resources reasonably necessary to manage the Fund in a professional manner that is consistent with the best interests of the Fund and its shareholders. In this regard, the Trustees favorably considered the procedures and policies in place by TAM to enforce compliance with applicable laws and regulations. The Trustees also determined that TAM has made a significant entrepreneurial commitment to the management and success of the Fund, reflected by TAM’s expense limitation and fee waiver arrangements with the Fund, which may result in TAM waiving fees for the benefit of shareholders.
Conclusion. After consideration of the factors described above as well as other factors, the Trustees, including all of the independent members of the Board, concluded that the Investment Advisory Agreement, including the fees payable there under, was fair and reasonable and voted to approve the renewal of the Investment Advisory Agreement for the Fund.
220
TRANSAMERICA EVERGREEN INTERNATIONAL SMALL CAP
INVESTMENT ADVISORY AGREEMENT - CONTRACT RENEWAL
(unaudited)
At a meeting of the Board of Trustees of Transamerica Funds (the “Board”) held on June 4, 2009, the Board reviewed and considered the renewal of the investment advisory agreement (the “Investment Advisory Agreement”) between Transamerica Evergreen International Small Cap (the “Fund”) and Transamerica Asset Management, Inc. (“TAM”), to determine whether the agreement should be renewed.
Following their review and consideration, the Trustees determined that the renewal of the Investment Advisory Agreement would enable shareholders of the Fund to obtain high quality services at a cost that is appropriate, fair, and in the best interests of Fund shareholders. The Board, including the independent members of the Board, unanimously approved the renewal of the Investment Advisory Agreement through June 30, 2010. In reaching their decision, the Trustees requested and obtained from TAM such information as they deemed reasonably necessary to evaluate the agreement. The Trustees also carefully considered information they had previously received from TAM as part of their regular oversight of the Fund, as well as comparative fee, expense, and performance information prepared by Lipper Inc. (“Lipper”), an independent provider of mutual fund performance, and fee and expense information and profitability data prepared by management. In considering the proposed continuation of the Investment Advisory Agreement, the Trustees evaluated a number of considerations that they believed, in light of the legal advice furnished to them by independent legal counsel and their own business judgment, to be relevant. They based their decision on the following considerations, among others, although they did not identify any consideration or particular information that was controlling of their decision:
The nature, extent and quality of the advisory services to be provided. The Board considered the nature and quality of the services provided by TAM to the Fund in the past, as well as the services anticipated to be provided in the future. The Board concluded that TAM is capable of providing high quality services to the Fund, as indicated by the nature and quality of services provided in the past by TAM for this Fund and the experience, capability and integrity of TAM’s senior management, the financial resources of TAM, and the professional qualifications of the portfolio management team of TAM. The Trustees determined that TAM can provide investment and related services that are appropriate in scope and extent in light of the Fund’s operations, the competitive landscape of the investment company business and investor needs.
The investment performance of the Fund. The Board examined the short and longer-term performance of the Fund, including relative performance against a peer universe of comparable asset allocation funds as prepared by Lipper for various trailing periods ended December 31, 2008. The Board noted that the Fund’s performance was above the median for its peer universe for the past 1- and 3-year periods. On the basis of the Board’s assessment of the nature, extent and quality of advisory services to be provided or procured by TAM, the Board concluded that TAM is capable of generating a level of investment performance that is appropriate in light of the Fund’s investment objectives, policies and strategies and competitive with other investment companies.
The cost of advisory services provided and the level of profitability. The Board reviewed profitability information of TAM’s cost of procuring fund management services, as well as the costs of provision of administration, fund accounting and other services, to the Fund and to Transamerica Funds as a whole by TAM and its affiliates. The Board reviewed the management fee for the Fund. The Trustees noted that the Fund’s contractual management fee was in line with the medians for its expense group and universe and total expenses were below the medians for its expense group and universe. Based on their review, the Trustees determined that the management fee of the Fund generally is appropriate in light of the services expected to be provided or procured, and the anticipated profitability of the relationship between the Fund and TAM and its affiliates. In making these observations and determinations, the Board reviewed comparative information provided by Lipper.
Whether fee levels reflect economies of scale and the extent to which economies of scale would be realized as the Fund grows. The Trustees considered the economies of scale with respect to the management of the Fund, whether the Fund had appropriately benefited from any economies of scale, and whether there was potential for realization of any further economies of scale. The Trustees considered the absence of breakpoints in the management fee schedule, and concluded the absence of breakpoints was acceptable under the circumstances. The Trustees also concluded that they will have the opportunity to periodically reexamine whether the Fund has achieved economies of scale, and the appropriateness of management fees payable to TAM, in the future.
Benefits to TAM and its affiliates from their relationship with the Fund. The Board concluded that other benefits anticipated to be derived by TAM and its affiliates from their relationships with the Fund are expected to be consistent with industry practice and the best interests of the Fund and its shareholders. The Trustees noted that TAM would not realize soft dollar benefits from its relationship with the Fund.
Other considerations. The Board determined that TAM has made a substantial commitment to the recruitment and retention of high quality personnel, and maintains the financial, compliance and operational resources reasonably necessary to manage the Fund in a professional manner that is consistent with the best interests of the Fund and its shareholders. In this regard, the Trustees favorably considered the procedures and policies in place by TAM to enforce compliance with applicable laws and regulations. The Trustees also determined that TAM has made a significant entrepreneurial commitment to the management and success of the Fund, reflected by TAM’s expense limitation and fee waiver arrangements with the Fund, which may result in TAM waiving fees for the benefit of shareholders.
Conclusion. After consideration of the factors described above as well as other factors, the Trustees, including all of the independent members of the Board, concluded that the Investment Advisory Agreement, including the fees payable there under, was fair and reasonable and voted to approve the renewal of the Investment Advisory Agreement for the Fund.
221
TRANSAMERICA FEDERATED MARKET OPPORTUNITY
INVESTMENT ADVISORY AND SUB-ADVISORY AGREEMENTS - CONTRACT RENEWAL
(unaudited)
At a meeting of the Board of Trustees of Transamerica Funds (the “Board”) held on June 4, 2009, the Board reviewed and considered the renewal of the investment advisory agreement (the “Investment Advisory Agreement”) between Transamerica Federated Market Opportunity (the “Fund”) and Transamerica Asset Management, Inc. (“TAM”), as well as the renewal of the investment sub-advisory agreement (the “Sub-Advisory Agreement”) of the Fund between TAM and Federated Equity Management Co. of Pennsylvania (the “Sub-Adviser”), to determine whether the agreements should be renewed.
Following their review and consideration, the Trustees determined that the renewal of the Investment Advisory Agreement and the Sub-Advisory Agreement would enable shareholders of the Fund to obtain high quality services at a cost that is appropriate, fair, and in the best interests of Fund shareholders. The Board, including the independent members of the Board, unanimously approved the renewal of the Investment Advisory Agreement and Sub-Advisory Agreement through June 30, 2010. In reaching their decision, the Trustees requested and obtained from TAM and the Sub-Adviser such information as they deemed reasonably necessary to evaluate the agreements, including information about fees and performance of comparable funds managed by the Sub-Adviser. The Trustees also carefully considered information they had previously received from TAM and the Sub-Adviser as part of their regular oversight of the Fund, as well as comparative fee, expense, and performance information prepared by Lipper Inc. (“Lipper”), an independent provider of mutual fund performance, and fee and expense information and profitability data prepared by management. In considering the proposed continuation of the Investment Advisory and Sub-Advisory Agreements, the Trustees evaluated a number of considerations that they believed, in light of the legal advice furnished to them by independent legal counsel and their own business judgment, to be relevant. They based their decisions on the following considerations, among others, although they did not identify any consideration or particular information that was controlling of their decisions:
The nature, extent and quality of the advisory services to be provided. The Board considered the nature and quality of the services provided by TAM and the Sub-Adviser to the Fund in the past, as well as the services anticipated to be provided in the future. The Trustees also reviewed the Sub-Adviser’s investment approach for the Fund. The Trustees noted that they receive, on a quarterly basis, an execution analysis from Capital Institutional Services, Inc. (CAPIS), an independent provider of trade analyses, for the Sub-Adviser and a comparison of trading results against a peer universe of managers. The Board concluded that TAM and the Sub-Adviser are capable of providing high quality services to the Fund, as indicated by the nature and quality of services provided in the past by TAM and the Sub-Adviser for this Fund and the experience, capability and integrity of TAM’s senior management, the financial resources of TAM and the Sub-Adviser, TAM’s management oversight process and the professional qualifications of the portfolio management team of the Sub-Adviser. The Trustees determined that TAM and the Sub-Adviser can provide investment and related services that are appropriate in scope and extent in light of the Fund’s operations, the competitive landscape of the investment company business and investor needs.
The investment performance of the Fund. The Board examined the short and longer-term performance of the Fund, including relative performance against a peer universe of comparable mutual funds as prepared by Lipper for various trailing periods ended December 31, 2008, noting that the Fund’s inception date was December 6, 2005. The Board noted that the Fund’s performance was above the median for its peer universe for the past 1- and 3-year periods. On the basis of the Board’s assessment of the nature, extent and quality of advisory services to be provided or procured by TAM and the Sub-Adviser, the Board concluded that TAM and the Sub-Adviser are capable of generating a level of investment performance that is appropriate in light of the Fund’s investment objectives, policies and strategies and competitive with other investment companies.
The cost of advisory services provided and the level of profitability. The Board reviewed profitability information of TAM’s cost of procuring fund management services, as well as the costs of provision of administration, fund accounting and other services, to the Fund and to Transamerica Funds as a whole by TAM and its affiliates. The Board reviewed the management and sub-advisory fees for the Fund. The Trustees noted that the Fund’s contractual management fee was below the medians for its peer group and peer universe and that the total expenses of the Fund were below the medians for its peer group and peer universe. Based on their review, the Trustees determined that the management and sub-advisory fees of the Fund generally are appropriate in light of the services expected to be provided or procured, and the anticipated profitability of the relationship between the Fund, TAM and its affiliates, and the Sub-Adviser. In making these observations and determinations, the Board reviewed comparative information provided by Lipper.
Whether fee levels reflect economies of scale and the extent to which economies of scale would be realized as the Fund grows. The Trustees considered the economies of scale with respect to the management of the Fund, whether the Fund had appropriately benefited from any economies of scale, and whether there was potential for realization of any further economies of scale. In evaluating the extent to which the management fees payable under the Investment Advisory and Sub-Advisory Agreements reflect economies of scale or will permit economies of scale to be realized in the future, the Board noted that TAM and the Sub-Adviser offer breakpoints which appropriately benefit investors by passing on economies of scale in the form of lower management fees as the level of assets grows. The Trustees also concluded that they will have the opportunity to periodically reexamine whether the Fund has achieved economies of scale, and the appropriateness of management fees payable to TAM and fees paid to the Sub-Adviser, in the future.
Benefits to TAM, its affiliates, or the Sub-Adviser from their relationship with the Fund. The Board concluded that other benefits anticipated to be derived by TAM, its affiliates, and the Sub-Adviser from their relationships with the Fund are expected to be consistent with industry practice and the best interests of the Fund and its shareholders. The Trustees noted that TAM would not realize soft dollar benefits from its relationship with the Fund. The Board also noted that the Sub-Adviser is participating in a brokerage program pursuant to which a portion of brokerage commissions paid by the Fund is recaptured for the benefit of the Fund and its shareholders, thus limiting the amount of soft dollar arrangements the Sub-Adviser may engage in with respect to the Fund’s brokerage transactions.
Other considerations. The Board determined that TAM has made a substantial commitment to the recruitment and retention of high quality personnel, and maintains the financial, compliance and operational resources reasonably necessary to manage the Fund in a professional manner that is consistent with the best interests of the Fund and its shareholders. In this regard, the Trustees favorably considered the procedures and policies in place by TAM to enforce compliance with applicable laws and regulations and oversee the portfolio management activities of the Sub-Adviser. The Trustees also determined that TAM has made a significant entrepreneurial commitment to the management and success of the Fund, reflected by TAM’s expense limitation and fee waiver arrangements with the Fund, which may result in TAM waiving fees for the benefit of shareholders.
Conclusion. After consideration of the factors described above as well as other factors, the Trustees, including all of the independent members of the Board, concluded that the Investment Advisory Agreement and the Sub-Advisory Agreement, including the fees payable there under, were fair and reasonable and voted to approve the renewal of the Investment Advisory Agreement and the Sub-Advisory Agreement for the Fund.
222
TRANSAMERICA JENNISON GROWTH
INVESTMENT ADVISORY AND SUB-ADVISORY AGREEMENTS - CONTRACT RENEWAL
(unaudited)
At a meeting of the Board of Trustees of Transamerica Funds (the “Board”) held on June 4, 2009, the Board reviewed and considered the renewal of the investment advisory agreement (the “Investment Advisory Agreement”) between Transamerica Jennison Growth (the “Fund”) and Transamerica Asset Management, Inc. (“TAM”), as well as the renewal of the investment sub-advisory agreement (the “Sub-Advisory Agreement”) of the Fund between TAM and Jennison Associates LLC (the “Sub-Adviser”), to determine whether the agreements should be renewed.
Following their review and consideration, the Trustees determined that the renewal of the Investment Advisory Agreement and the Sub-Advisory Agreement would enable shareholders of the Fund to obtain high quality services at a cost that is appropriate, fair, and in the best interests of Fund shareholders. The Board, including the independent members of the Board, unanimously approved the renewal of the Investment Advisory Agreement and Sub-Advisory Agreement through June 30, 2010. In reaching their decision, the Trustees requested and obtained from TAM and the Sub-Adviser such information as they deemed reasonably necessary to evaluate the agreements, including information about fees and performance of comparable funds managed by the Sub-Adviser. The Trustees also carefully considered information they had previously received from TAM and the Sub-Adviser as part of their regular oversight of the Fund, as well as comparative fee, expense, and performance information prepared by Lipper Inc. (“Lipper”), an independent provider of mutual fund performance, and fee and expense information and profitability data prepared by management. In considering the proposed continuation of the Investment Advisory and Sub-Advisory Agreements, the Trustees evaluated a number of considerations that they believed, in light of the legal advice furnished to them by independent legal counsel and their own business judgment, to be relevant. They based their decisions on the following considerations, among others, although they did not identify any consideration or particular information that was controlling of their decisions:
The nature, extent and quality of the advisory services to be provided. The Board considered the nature and quality of the services provided by TAM and the Sub-Adviser to the Fund in the past, as well as the services anticipated to be provided in the future. The Trustees also reviewed the Sub-Adviser’s investment approach for the Fund. The Trustees noted that they receive, on a quarterly basis, an execution analysis from Capital Institutional Services, Inc. (CAPIS), an independent provider of trade analyses, for the Sub-Adviser and a comparison of trading results against a peer universe of managers. The Board concluded that TAM and the Sub-Adviser are capable of providing high quality services to the Fund, as indicated by the nature and quality of services provided in the past by TAM and the Sub-Adviser for this Fund and the experience, capability and integrity of TAM’s senior management, the financial resources of TAM and the Sub-Adviser, TAM’s management oversight process and the professional qualifications of the portfolio management team of the Sub-Adviser. The Trustees determined that TAM and the Sub-Adviser can provide investment and related services that are appropriate in scope and extent in light of the Fund’s operations, the competitive landscape of the investment company business and investor needs.
The investment performance of the Fund. The Board examined the short and longer-term performance of the Fund, including relative performance against a peer universe of comparable mutual funds as prepared by Lipper for various trailing periods ended December 31, 2008. The Board noted that the Fund’s performance was above the median for its peer universe for the past 1- and 5-year periods and below the median for the past 3-year period. On the basis of the Board’s assessment of the nature, extent and quality of advisory services to be provided or procured by TAM and the Sub-Adviser, the Board concluded that TAM and the Sub-Adviser are capable of generating a level of investment performance that is appropriate in light of the Fund’s investment objectives, policies and strategies and competitive with other investment companies.
The cost of advisory services provided and the level of profitability. The Board reviewed profitability information of TAM’s cost of procuring fund management services, as well as the costs of provision of administration, fund accounting and other services, to the Fund and to Transamerica Funds as a whole by TAM and its affiliates. The Board reviewed the management and sub-advisory fees for the Fund. The Trustees noted that the Fund’s contractual management fee was above the medians for its peer group and peer universe and that the total expenses of the Fund were in line with the median for its peer group and above the median for its peer universe. Based on their review, the Trustees determined that the management and sub-advisory fees of the Fund generally are appropriate in light of the services expected to be provided or procured, and the anticipated profitability of the relationship between the Fund, TAM and its affiliates, and the Sub-Adviser. In making these observations and determinations, the Board reviewed comparative information provided by Lipper.
Whether fee levels reflect economies of scale and the extent to which economies of scale would be realized as the Fund grows. The Trustees considered the economies of scale with respect to the management of the Fund, whether the Fund had appropriately benefited from any economies of scale, and whether there was potential for realization of any further economies of scale. In evaluating the extent to which the management fees payable under the Investment Advisory and Sub-Advisory Agreements reflect economies of scale or will permit economies of scale to be realized in the future, the Board noted that TAM and the Sub-Adviser offer breakpoints which appropriately benefit investors by passing on economies of scale in the form of lower management fees as the level of assets grows. The Trustees also concluded that they will have the opportunity to periodically reexamine whether the Fund has achieved economies of scale, and the appropriateness of management fees payable to TAM and fees paid to the Sub-Adviser, in the future.
Benefits to TAM, its affiliates, or the Sub-Adviser from their relationship with the Fund. The Board concluded that other benefits anticipated to be derived by TAM, its affiliates, and the Sub-Adviser from their relationships with the Fund are expected to be consistent with industry practice and the best interests of the Fund and its shareholders. The Trustees noted that TAM would not realize soft dollar benefits from its relationship with the Fund. The Board also noted that the Sub-Adviser is participating in a brokerage program pursuant to which a portion of brokerage commissions paid by the Fund is recaptured for the benefit of the Fund and its shareholders, thus limiting the amount of soft dollar arrangements the Sub-Adviser may engage in with respect to the Fund’s brokerage transactions.
Other considerations. The Board determined that TAM has made a substantial commitment to the recruitment and retention of high quality personnel, and maintains the financial, compliance and operational resources reasonably necessary to manage the Fund in a professional manner that is consistent with the best interests of the Fund and its shareholders. In this regard, the Trustees favorably considered the procedures and policies in place by TAM to enforce compliance with applicable laws and regulations and oversee the portfolio management activities of the Sub-Adviser. The Trustees also determined that TAM has made a significant entrepreneurial commitment to the management and success of the Fund, reflected by TAM’s expense limitation and fee waiver arrangements with the Fund, which may result in TAM waiving fees for the benefit of shareholders.
Conclusion. After consideration of the factors described above as well as other factors, the Trustees, including all of the independent members of the Board, concluded that the Investment Advisory Agreement and the Sub-Advisory Agreement, including the fees payable there under, were fair and reasonable and voted to approve the renewal of the Investment Advisory Agreement and the Sub-Advisory Agreement for the Fund.
223
TRANSAMERICA JPMORGAN CORE BOND
INVESTMENT ADVISORY AND SUB-ADVISORY AGREEMENTS — INITIAL REVIEW AND APPROVAL
(unaudited)
At a meeting of the Board of Trustees of Transamerica Funds held on April 2, 2009, in approving a mandate to establish Transamerica JPMorgan Core Bond as a New Series of Transamerica Funds, the Board reviewed and considered the proposed investment advisory agreement (the “Investment Advisory Agreement”) between Transamerica Funds on behalf of its series Transamerica JPMorgan Core Bond (the “Fund”) and Transamerica Asset Management, Inc. (“TAM”), as well as the proposed investment sub-advisory agreement (the “Sub-Advisory Agreement”) for the Fund between TAM and J.P. Morgan Investment Management, Inc. (the “Sub-Adviser”), to determine whether the agreements should be approved for an initial two-year period. Following their review and consideration at this meeting, the Trustees determined that the proposed Investment Advisory Agreement and proposed Investment Sub-Advisory Agreement will enable shareholders of the Fund to obtain high quality services at a cost that is appropriate, fair, and in the best interests of its shareholders. The Board, including the Independent members of the Board, unanimously approved the proposed Investment Advisory Agreement and Investment Sub-Advisory Agreement. In reaching their decision, the Trustees requested and obtained from TAM and the Sub-Adviser such information as they deemed reasonably necessary to evaluate the proposed agreements, including information about comparable funds managed by the Sub-Adviser. In considering the proposed approval of the Investment Advisory and Sub-Advisory Agreements, the Trustees evaluated a number of considerations that they believed, in light of the legal advice furnished to them by independent legal counsel and their own business judgment, to be relevant. They based their decisions on the following considerations, among others, although they did not identify any consideration or particular information that was controlling of their decisions:
The nature, extent and quality of the advisory services to be provided. The Board considered the nature and quality of the services expected to be provided by TAM and the Sub-Adviser. They concluded that TAM and the Sub-Adviser are capable of providing high quality services to the Fund, as indicated by the nature and quality of services provided in the past by TAM for other series within the fund complex and the Sub-Adviser’s management capabilities demonstrated with respect to other funds it manages and the experience, capability and integrity of TAM’s senior management, the financial resources of TAM and the Sub-Adviser, TAM’s management oversight process and the professional qualifications and experience of the Sub-Adviser’s portfolio management team (the Board reviewed carefully the qualifications of the prospective manager for the Fund, noting that the Sub-Adviser and TAM already have an established relationship). The Trustees determined that TAM and the Sub-Adviser can provide investment and related services that are appropriate in scope and extent in light of the proposed Fund’s operations, the competitive landscape of the investment company business and investor needs.
The investment performance of the Fund. The Fund had not yet commenced operations and therefore had no historical performance for the Board to review. However, the Board examined information regarding a fund managed by the Sub-Adviser with investment objectives and strategies comparable to those of the Fund. The Board noted that the comparable fund and other funds managed by TAM and the Sub-Adviser have generally performed well and have generated investor interest. On the basis of the Board’s assessment of the nature, extent and quality of advisory services to be provided or procured by TAM and the Sub-Adviser, the Board concluded that TAM and the Sub-Adviser are capable of generating a level of investment performance that is appropriate in light of the Fund’s proposed investment objectives, policies and strategies and competitive with other investment companies, and also determined that TAM’s and the Sub-Adviser’s performance records for the Transamerica Series Trust fund indicate that their management of the Fund is likely to benefit the Fund and its shareholders. In this regard, it was noted that Transamerica JPMorgan Core Bond VP had good performance over relevant time periods.
The cost of advisory services provided and the level of profitability. The Fund had not yet commenced operations and therefore no revenue, cost or profitability data was available for the Board to review. However, the Board reviewed projected profitability information regarding TAM’s costs of procuring portfolio management services, as well as the costs of its provision of administration, transfer agency, fund accounting and other services, to the Fund and other funds within the fund complex. Based on such information and the proposed management and sub-advisory fees for the Fund, the Trustees determined that the proposed management and sub-advisory fees of the Fund generally are consistent with industry averages and are appropriate in light of the services expected to be provided or procured, the management fees and the anticipated profitability of the relationship between the Fund, TAM and its affiliates, and the Sub-Adviser. In making these observations and determinations, the Board reviewed comparative information provided by Lipper, Inc. and FactSet.
Whether fee levels reflect economies of scale and the extent to which economies of scale would be realized as the Fund grows. In evaluating the extent to which the management fees payable under the new Investment Advisory and Sub-Advisory Agreement reflect economies of scale or will permit economies of scale to be realized in the future, the Board took note of TAM’s and the Sub-Adviser’s pricing strategy and the proposed advisory fee breakpoint (as detailed in the materials provided), and noted each fee breakpoint with respect to the various asset levels to be achieved by the Fund. The Board concluded that the proposed fees, and breakpoints should appropriately benefit investors by permitting economies of scale in the form of lower management fees as the level of assets grows for the Fund. The Board also concluded that the Fund’s management fees appropriately reflect the Fund’s anticipated size, the current economic environment for TAM, the competitive nature of the investment company market, and TAM’s pricing strategy. The Board also noted that, in the future, it would have the opportunity to periodically re-examine whether the Fund has achieved economies of scale and the appropriateness of management fees payable to TAM and fees payable by TAM to the Sub-Adviser.
Benefits to TAM, its affiliates, or the Sub-Adviser from their relationship with the Fund. The Board concluded that other benefits anticipated to be derived by TAM, its affiliates, and the Sub-Adviser from their relationships with the Fund are expected to be consistent with industry practice and the best interests of the Fund and its shareholders. The Trustees noted that TAM would not realize soft dollar benefits from its relationship with the Fund, and that the Sub-Adviser has represented that it would engage in any soft dollar arrangements consistent with applicable law and “best execution” requirements. In addition, the Trustees noted that the Sub-Adviser will be asked to participate in a brokerage program pursuant to which a certain portion of brokerage commissions paid by the Fund is recaptured for the benefit of the Fund and its shareholders, which could limit the amount of “soft-dollar” arrangements the Sub-Adviser may engage in with respect to the Fund’s portfolio brokerage transactions. The nature of the Fund’s investments (fixed income securities) also was noted.
Other considerations. The Board considered the investment objective of the Fund and its investment strategies and determined that the Fund would enhance the investment options for the funds of funds investing in the Fund. The Board determined that TAM has made a substantial commitment to the recruitment and retention of high quality personnel, and maintains the financial, compliance and operational resources reasonably necessary to manage the Fund in a professional manner that is consistent with the best interests of the Fund and its shareholders. In this regard, the Trustees favorably considered the procedures and policies in place by TAM to enforce compliance with applicable laws and regulations and oversee the portfolio management activities of the Sub-Adviser. The Trustees also determined that TAM has made a significant entrepreneurial commitment to the management and success of the Fund, reflected by TAM’s expense limitation and fee waiver arrangements with the Fund, which may result in TAM waiving fees for the benefit of shareholders, and the contributions that TAM makes out of its own profits, directly or indirectly, to promote Transamerica Funds and/or provide for desirable investor services. In approving the Agreements, the Board also considered the high quality of the Sub-Adviser’s portfolio management personnel who will manage the Fund under the Sub-Advisory Agreement, and their overall portfolio management capabilities. The Board determined that the Sub-Adviser, too, has made substantial commitments to the recruitment and retention of high quality personnel, and maintains the financial and operational resources reasonably necessary to manage the Fund.
224
TRANSAMERICA JPMORGAN INTERNATIONAL BOND
INVESTMENT ADVISORY AND SUB-ADVISORY AGREEMENTS - CONTRACT RENEWAL
(unaudited)
At a meeting of the Board of Trustees of Transamerica Funds (the “Board”) held on June 4, 2009, the Board reviewed and considered the renewal of the investment advisory agreement (the “Investment Advisory Agreement”) between Transamerica JPMorgan International Bond (the “Fund”) and Transamerica Asset Management, Inc. (“TAM”), as well as the renewal of the investment sub-advisory agreement (the “Sub-Advisory Agreement”) of the Fund between TAM and J.P. Morgan Investment Management Inc. (the “Sub-Adviser”), to determine whether the agreements should be renewed.
Following their review and consideration, the Trustees determined that the renewal of the Investment Advisory Agreement and the Sub-Advisory Agreement would enable shareholders of the Fund to obtain high quality services at a cost that is appropriate, fair, and in the best interests of Fund shareholders. The Board, including the independent members of the Board, unanimously approved the renewal of the Investment Advisory Agreement and Sub-Advisory Agreement through June 30, 2010. In reaching their decision, the Trustees requested and obtained from TAM and the Sub-Adviser such information as they deemed reasonably necessary to evaluate the agreements, including information about fees and performance of comparable funds managed by the Sub-Adviser. The Trustees also carefully considered information they had previously received from TAM and the Sub-Adviser as part of their regular oversight of the Fund, as well as comparative fee, expense, and performance information prepared by Lipper Inc. (“Lipper”), an independent provider of mutual fund performance, and fee and expense information and profitability data prepared by management. In considering the proposed continuation of the Investment Advisory and Sub-Advisory Agreements, the Trustees evaluated a number of considerations that they believed, in light of the legal advice furnished to them by independent legal counsel and their own business judgment, to be relevant. They based their decisions on the following considerations, among others, although they did not identify any consideration or particular information that was controlling of their decisions:
The nature, extent and quality of the advisory services to be provided. The Board considered the nature and quality of the services provided by TAM and the Sub-Adviser to the Fund in the past, as well as the services anticipated to be provided in the future. The Trustees also reviewed the Sub-Adviser’s investment approach for the Fund. The Trustees noted that they receive, on a quarterly basis, an execution analysis from Capital Institutional Services, Inc. (CAPIS), an independent provider of trade analyses, for the Sub-Adviser and a comparison of trading results against a peer universe of managers. The Board concluded that TAM and the Sub-Adviser are capable of providing high quality services to the Fund, as indicated by the nature and quality of services provided in the past by TAM and the Sub-Adviser for this Fund and the experience, capability and integrity of TAM’s senior management, the financial resources of TAM and the Sub-Adviser, TAM’s management oversight process and the professional qualifications of the portfolio management team of the Sub-Adviser. The Trustees determined that TAM and the Sub-Adviser can provide investment and related services that are appropriate in scope and extent in light of the Fund’s operations, the competitive landscape of the investment company business and investor needs.
The investment performance of the Fund. The Board examined the short and longer-term performance of the Fund, including relative performance against a peer universe of comparable mutual funds as prepared by Lipper for various trailing periods ended December 31, 2008, noting that the Fund’s inception date was December 6, 2005. The Board noted that the Fund’s performance was above the median for its peer universe for the past 1- and 3-year periods. On the basis of the Board’s assessment of the nature, extent and quality of advisory services to be provided or procured by TAM and the Sub-Adviser, the Board concluded that TAM and the Sub-Adviser are capable of generating a level of investment performance that is appropriate in light of the Fund’s investment objectives, policies and strategies and competitive with other investment companies.
The cost of advisory services provided and the level of profitability. The Board reviewed profitability information of TAM’s cost of procuring fund management services, as well as the costs of provision of administration, fund accounting and other services, to the Fund and to Transamerica Funds as a whole by TAM and its affiliates. The Board reviewed the management and sub-advisory fees for the Fund. The Trustees noted that the Fund’s contractual management fee was in line with medians for its peer group and peer universe and that the total expenses of the Fund were below the medians for its peer group and peer universe. Based on their review, the Trustees determined that the management and sub-advisory fees of the Fund generally are appropriate in light of the services expected to be provided or procured, and the anticipated profitability of the relationship between the Fund, TAM and its affiliates, and the Sub-Adviser. In making these observations and determinations, the Board reviewed comparative information provided by Lipper.
Whether fee levels reflect economies of scale and the extent to which economies of scale would be realized as the Fund grows. The Trustees considered the economies of scale with respect to the management of the Fund, whether the Fund had appropriately benefited from any economies of scale, and whether there was potential for realization of any further economies of scale. In evaluating the extent to which the management fees payable under the Investment Advisory and Sub-Advisory Agreements reflect economies of scale or will permit economies of scale to be realized in the future, the Board noted that TAM and the Sub-Adviser offer breakpoints which appropriately benefit investors by passing on economies of scale in the form of lower management fees as the level of assets grows. The Trustees also concluded that they will have the opportunity to periodically reexamine whether the Fund has achieved economies of scale, and the appropriateness of management fees payable to TAM and fees paid to the Sub-Adviser, in the future.
Benefits to TAM, its affiliates, or the Sub-Adviser from their relationship with the Fund. The Board concluded that other benefits anticipated to be derived by TAM, its affiliates, and the Sub-Adviser from their relationships with the Fund are expected to be consistent with industry practice and the best interests of the Fund and its shareholders. The Trustees noted that TAM would not realize soft dollar benefits from its relationship with the Fund.
Other considerations. The Board determined that TAM has made a substantial commitment to the recruitment and retention of high quality personnel, and maintains the financial, compliance and operational resources reasonably necessary to manage the Fund in a professional manner that is consistent with the best interests of the Fund and its shareholders. In this regard, the Trustees favorably considered the procedures and policies in place by TAM to enforce compliance with applicable laws and regulations and oversee the portfolio management activities of the Sub-Adviser. The Trustees also determined that TAM has made a significant entrepreneurial commitment to the management and success of the Fund, reflected by TAM’s expense limitation and fee waiver arrangements with the Fund, which may result in TAM waiving fees for the benefit of shareholders.
Conclusion. After consideration of the factors described above as well as other factors, the Trustees, including all of the independent members of the Board, concluded that the Investment Advisory Agreement and the Sub-Advisory Agreement, including the fees payable there under, were fair and reasonable and voted to approve the renewal of the Investment Advisory Agreement and the Sub-Advisory Agreement for the Fund.
225
TRANSAMERICA JPMORGAN MID CAP VALUE
INVESTMENT ADVISORY AND SUB-ADVISORY AGREEMENTS - CONTRACT RENEWAL
(unaudited)
At a meeting of the Board of Trustees of Transamerica Funds (the “Board”) held on June 4, 2009, the Board reviewed and considered the renewal of the investment advisory agreement (the “Investment Advisory Agreement”) between Transamerica JPMorgan Mid Cap Value (the “Fund”) and Transamerica Asset Management, Inc. (“TAM”), as well as the renewal of the investment sub-advisory agreement (the “Sub-Advisory Agreement”) of the Fund between TAM and J.P. Morgan Investment Management Inc. (the “Sub-Adviser”), to determine whether the agreements should be renewed.
Following their review and consideration, the Trustees determined that the renewal of the Investment Advisory Agreement and the Sub-Advisory Agreement would enable shareholders of the Fund to obtain high quality services at a cost that is appropriate, fair, and in the best interests of Fund shareholders. The Board, including the independent members of the Board, unanimously approved the renewal of the Investment Advisory Agreement and Sub-Advisory Agreement through June 30, 2010. In reaching their decision, the Trustees requested and obtained from TAM and the Sub-Adviser such information as they deemed reasonably necessary to evaluate the agreements, including information about fees and performance of comparable funds managed by the Sub-Adviser. The Trustees also carefully considered information they had previously received from TAM and the Sub-Adviser as part of their regular oversight of the Fund, as well as comparative fee, expense, and performance information prepared by Lipper Inc. (“Lipper”), an independent provider of mutual fund performance, and fee and expense information and profitability data prepared by management. In considering the proposed continuation of the Investment Advisory and Sub-Advisory Agreements, the Trustees evaluated a number of considerations that they believed, in light of the legal advice furnished to them by independent legal counsel and their own business judgment, to be relevant. They based their decisions on the following considerations, among others, although they did not identify any consideration or particular information that was controlling of their decisions:
The nature, extent and quality of the advisory services to be provided. The Board considered the nature and quality of the services provided by TAM and the Sub-Adviser to the Fund in the past, as well as the services anticipated to be provided in the future. The Trustees also reviewed the Sub-Adviser’s investment approach for the Fund. The Trustees noted that they receive, on a quarterly basis, an execution analysis from Capital Institutional Services, Inc. (CAPIS), an independent provider of trade analyses, for the Sub-Adviser and a comparison of trading results against a peer universe of managers. The Board concluded that TAM and the Sub-Adviser are capable of providing high quality services to the Fund, as indicated by the nature and quality of services provided in the past by TAM and the Sub-Adviser for this Fund and the experience, capability and integrity of TAM’s senior management, the financial resources of TAM and the Sub-Adviser, TAM’s management oversight process and the professional qualifications of the portfolio management team of the Sub-Adviser. The Trustees determined that TAM and the Sub-Adviser can provide investment and related services that are appropriate in scope and extent in light of the Fund’s operations, the competitive landscape of the investment company business and investor needs.
The investment performance of the Fund. The Board examined the short and longer-term performance of the Fund, including relative performance against a peer universe of comparable mutual funds as prepared by Lipper for various trailing periods ended December 31, 2008. The Board noted that the Fund’s performance was above the median for its peer universe for the past 1- and 3-year periods. On the basis of the Board’s assessment of the nature, extent and quality of advisory services to be provided or procured by TAM and the Sub-Adviser, the Board concluded that TAM and the Sub-Adviser are capable of generating a level of investment performance that is appropriate in light of the Fund’s investment objectives, policies and strategies and competitive with other investment companies.
The cost of advisory services provided and the level of profitability. The Board reviewed profitability information of TAM’s cost of procuring fund management services, as well as the costs of provision of administration, fund accounting and other services, to the Fund and to Transamerica Funds as a whole by TAM and its affiliates. The Board reviewed the management and sub-advisory fees for the Fund. The Trustees noted that the Fund’s contractual management fee was in line with medians for its peer group and peer universe and that the total expenses of the Fund were below the medians for its peer group and peer universe. Based on their review, the Trustees determined that the management and sub-advisory fees of the Fund generally are appropriate in light of the services expected to be provided or procured, and the anticipated profitability of the relationship between the Fund, TAM and its affiliates, and the Sub-Adviser. In making these observations and determinations, the Board reviewed comparative information provided by Lipper.
Whether fee levels reflect economies of scale and the extent to which economies of scale would be realized as the Fund grows. The Trustees considered the economies of scale with respect to the management of the Fund, whether the Fund had appropriately benefited from any economies of scale, and whether there was potential for realization of any further economies of scale. In evaluating the extent to which the management fees payable under the Investment Advisory and Sub-Advisory Agreements reflect economies of scale or will permit economies of scale to be realized in the future, the Board noted that TAM offers breakpoints which appropriately benefit investors by passing on economies of scale in the form of lower management fees as the level of assets grows. The Trustees also concluded that they will have the opportunity to periodically reexamine whether the Fund has achieved economies of scale, and the appropriateness of management fees payable to TAM and fees paid to the Sub-Adviser, in the future.
Benefits to TAM, its affiliates, or the Sub-Adviser from their relationship with the Fund. The Board concluded that other benefits anticipated to be derived by TAM, its affiliates, and the Sub-Adviser from their relationships with the Fund are expected to be consistent with industry practice and the best interests of the Fund and its shareholders. The Trustees noted that TAM would not realize soft dollar benefits from its relationship with the Fund. The Board also noted that the Sub-Adviser is participating in a brokerage program pursuant to which a portion of brokerage commissions paid by the Fund is recaptured for the benefit of the Fund and its shareholders, thus limiting the amount of soft dollar arrangements the Sub-Adviser may engage in with respect to the Fund’s brokerage transactions.
Other considerations. The Board determined that TAM has made a substantial commitment to the recruitment and retention of high quality personnel, and maintains the financial, compliance and operational resources reasonably necessary to manage the Fund in a professional manner that is consistent with the best interests of the Fund and its shareholders. In this regard, the Trustees favorably considered the procedures and policies in place by TAM to enforce compliance with applicable laws and regulations and oversee the portfolio management activities of the Sub-Adviser. The Trustees also determined that TAM has made a significant entrepreneurial commitment to the management and success of the Fund, reflected by TAM’s expense limitation and fee waiver arrangements with the Fund, which may result in TAM waiving fees for the benefit of shareholders.
Conclusion. After consideration of the factors described above as well as other factors, the Trustees, including all of the independent members of the Board, concluded that the Investment Advisory Agreement and the Sub-Advisory Agreement, including the fees payable there under, were fair and reasonable and voted to approve the renewal of the Investment Advisory Agreement and the Sub-Advisory Agreement for the Fund.
226
TRANSAMERICA LEGG MASON PARTNERS ALL CAP
INVESTMENT ADVISORY AND SUB-ADVISORY AGREEMENTS - CONTRACT RENEWAL
(unaudited)
At a meeting of the Board of Trustees of Transamerica Funds (the “Board”) held on June 4, 2009, the Board reviewed and considered the renewal of the investment advisory agreement (the “Investment Advisory Agreement”) between Transamerica Legg Mason Partners All Cap (the “Fund”) and Transamerica Asset Management, Inc. (“TAM”), as well as the renewal of the investment sub-advisory agreement (the “Sub-Advisory Agreement”) of the Fund between TAM and ClearBridge Advisors, LLC (the “Sub-Adviser”), to determine whether the agreements should be renewed.
Following their review and consideration, the Trustees determined that the renewal of the Investment Advisory Agreement and the Sub-Advisory Agreement would enable shareholders of the Fund to obtain high quality services at a cost that is appropriate, fair, and in the best interests of Fund shareholders. The Board, including the independent members of the Board, unanimously approved the renewal of the Investment Advisory Agreement and Sub-Advisory Agreement through June 30, 2010. In reaching their decision, the Trustees requested and obtained from TAM and the Sub-Adviser such information as they deemed reasonably necessary to evaluate the agreements, including information about fees and performance of comparable funds managed by the Sub-Adviser. The Trustees also carefully considered information they had previously received from TAM and the Sub-Adviser as part of their regular oversight of the Fund, as well as comparative fee, expense, and performance information prepared by Lipper Inc. (“Lipper”), an independent provider of mutual fund performance, and fee and expense information and profitability data prepared by management. In considering the proposed continuation of the Investment Advisory and Sub-Advisory Agreements, the Trustees evaluated a number of considerations that they believed, in light of the legal advice furnished to them by independent legal counsel and their own business judgment, to be relevant. They based their decisions on the following considerations, among others, although they did not identify any consideration or particular information that was controlling of their decisions:
The nature, extent and quality of the advisory services to be provided. The Board considered the nature and quality of the services provided by TAM and the Sub-Adviser to the Fund in the past, as well as the services anticipated to be provided in the future. The Trustees also reviewed the Sub-Adviser’s investment approach for the Fund. The Trustees noted that they receive, on a quarterly basis, an execution analysis from Capital Institutional Services, Inc. (CAPIS), an independent provider of trade analyses, for the Sub-Adviser and a comparison of trading results against a peer universe of managers. The Board concluded that TAM and the Sub-Adviser are capable of providing high quality services to the Fund, as indicated by the nature and quality of services provided in the past by TAM and the Sub-Adviser for this Fund and the experience, capability and integrity of TAM’s senior management, the financial resources of TAM and the Sub-Adviser, TAM’s management oversight process and the professional qualifications of the portfolio management team of the Sub-Adviser. The Trustees determined that TAM and the Sub-Adviser can provide investment and related services that are appropriate in scope and extent in light of the Fund’s operations, the competitive landscape of the investment company business and investor needs.
The investment performance of the Fund. The Board examined the short and longer-term performance of the Fund, including relative performance against a peer universe of comparable mutual funds as prepared by Lipper for various trailing periods ended December 31, 2008. The Board noted that the Fund’s performance was above the median for its peer universe for the past 1-year period, in line with the median for the past 3-year period and below the median for the past 5-year period. On the basis of the Board’s assessment of the nature, extent and quality of advisory services to be provided or procured by TAM and the Sub-Adviser, the Board concluded that TAM and the Sub-Adviser are capable of generating a level of investment performance that is appropriate in light of the Fund’s investment objectives, policies and strategies and competitive with other investment companies.
The cost of advisory services provided and the level of profitability. The Board reviewed profitability information of TAM’s cost of procuring fund management services, as well as the costs of provision of administration, fund accounting and other services, to the Fund and to Transamerica Funds as a whole by TAM and its affiliates. The Board reviewed the management and sub-advisory fees for the Fund. The Trustees noted that the Fund’s contractual management fee was in line with the median for its peer group and above the median for its peer universe and that the total expenses of the Fund were above the medians for its peer group and peer universe. Based on their review, the Trustees determined that the management and sub-advisory fees of the Fund generally are appropriate in light of the services expected to be provided or procured, and the anticipated profitability of the relationship between the Fund, TAM and its affiliates, and the Sub-Adviser. In making these observations and determinations, the Board reviewed comparative information provided by Lipper.
Whether fee levels reflect economies of scale and the extent to which economies of scale would be realized as the Fund grows. The Trustees considered the economies of scale with respect to the management of the Fund, whether the Fund had appropriately benefited from any economies of scale, and whether there was potential for realization of any further economies of scale. In evaluating the extent to which the management fees payable under the Investment Advisory and Sub-Advisory Agreements reflect economies of scale or will permit economies of scale to be realized in the future, the Board noted that TAM and the Sub-Adviser offer breakpoints which appropriately benefit investors by passing on economies of scale in the form of lower management fees as the level of assets grows. The Trustees also concluded that they will have the opportunity to periodically reexamine whether the Fund has achieved economies of scale, and the appropriateness of management fees payable to TAM and fees paid to the Sub-Adviser, in the future.
Benefits to TAM, its affiliates, or the Sub-Adviser from their relationship with the Fund. The Board concluded that other benefits anticipated to be derived by TAM, its affiliates, and the Sub-Adviser from their relationships with the Fund are expected to be consistent with industry practice and the best interests of the Fund and its shareholders. The Trustees noted that TAM would not realize soft dollar benefits from its relationship with the Fund. The Board also noted that the Sub-Adviser is participating in a brokerage program pursuant to which a portion of brokerage commissions paid by the Fund is recaptured for the benefit of the Fund and its shareholders, thus limiting the amount of soft dollar arrangements the Sub-Adviser may engage in with respect to the Fund’s brokerage transactions.
Other considerations. The Board determined that TAM has made a substantial commitment to the recruitment and retention of high quality personnel, and maintains the financial, compliance and operational resources reasonably necessary to manage the Fund in a professional manner that is consistent with the best interests of the Fund and its shareholders. In this regard, the Trustees favorably considered the procedures and policies in place by TAM to enforce compliance with applicable laws and regulations and oversee the portfolio management activities of the Sub-Adviser. The Trustees also determined that TAM has made a significant entrepreneurial commitment to the management and success of the Fund, reflected by TAM’s expense limitation and fee waiver arrangements with the Fund, which may result in TAM waiving fees for the benefit of shareholders.
Conclusion. After consideration of the factors described above as well as other factors, the Trustees, including all of the independent members of the Board, concluded that the Investment Advisory Agreement and the Sub-Advisory Agreement, including the fees payable there under, were fair and reasonable and voted to approve the renewal of the Investment Advisory Agreement and the Sub-Advisory Agreement for the Fund.
227
TRANSAMERICA LOOMIS SAYLES BOND
INVESTMENT ADVISORY AND SUB-ADVISORY AGREEMENTS - CONTRACT RENEWAL
(unaudited)
At a meeting of the Board of Trustees of Transamerica Funds (the “Board”) held on June 4, 2009, the Board reviewed and considered the renewal of the investment advisory agreement (the “Investment Advisory Agreement”) between Transamerica Loomis Sayles Bond (the “Fund”) and Transamerica Asset Management, Inc. (“TAM”), as well as the renewal of the investment sub-advisory agreement (the “Sub-Advisory Agreement”) of the Fund between TAM and Loomis, Sayles & Company, L.P. (the “Sub-Adviser”), to determine whether the agreements should be renewed.
Following their review and consideration, the Trustees determined that the renewal of the Investment Advisory Agreement and the Sub-Advisory Agreement would enable shareholders of the Fund to obtain high quality services at a cost that is appropriate, fair, and in the best interests of Fund shareholders. The Board, including the independent members of the Board, unanimously approved the renewal of the Investment Advisory Agreement and Sub-Advisory Agreement through June 30, 2010. In reaching their decision, the Trustees requested and obtained from TAM and the Sub-Adviser such information as they deemed reasonably necessary to evaluate the agreements, including information about fees and performance of comparable funds managed by the Sub-Adviser. The Trustees also carefully considered information they had previously received from TAM and the Sub-Adviser as part of their regular oversight of the Fund, as well as comparative fee, expense, and performance information prepared by Lipper Inc. (“Lipper”), an independent provider of mutual fund performance, and fee and expense information and profitability data prepared by management. In considering the proposed continuation of the Investment Advisory and Sub-Advisory Agreements, the Trustees evaluated a number of considerations that they believed, in light of the legal advice furnished to them by independent legal counsel and their own business judgment, to be relevant. They based their decisions on the following considerations, among others, although they did not identify any consideration or particular information that was controlling of their decisions:
The nature, extent and quality of the advisory services to be provided. The Board considered the nature and quality of the services provided by TAM and the Sub-Adviser to the Fund in the past, as well as the services anticipated to be provided in the future. The Trustees also reviewed the Sub-Adviser’s investment approach for the Fund. The Trustees noted that they receive, on a quarterly basis, an execution analysis from Capital Institutional Services, Inc. (CAPIS), an independent provider of trade analyses, for the Sub-Adviser and a comparison of trading results against a peer universe of managers. The Board concluded that TAM and the Sub-Adviser are capable of providing high quality services to the Fund, as indicated by the nature and quality of services provided in the past by TAM and the Sub-Adviser for this Fund and the experience, capability and integrity of TAM’s senior management, the financial resources of TAM and the Sub-Adviser, TAM’s management oversight process and the professional qualifications of the portfolio management team of the Sub-Adviser. The Trustees determined that TAM and the Sub-Adviser can provide investment and related services that are appropriate in scope and extent in light of the Fund’s operations, the competitive landscape of the investment company business and investor needs.
The investment performance of the Fund. The Board examined the short and longer-term performance of the Fund, including relative performance against a peer universe of comparable mutual funds as prepared by Lipper for various trailing periods ended December 31, 2008, noting that the Fund’s inception date was on January 3, 2007. The Board noted that the Fund’s performance was below the median for its peer universe for the past 1-year period. The Trustees discussed the reasons for the underperformance with TAM, and agreed that they would continue to monitor the performance of the Fund closely. On the basis of the Board’s assessment of the nature, extent and quality of advisory services to be provided or procured by TAM and the Sub-Adviser, the Board concluded that TAM and the Sub-Adviser are capable of generating a level of investment performance that is appropriate in light of the Fund’s investment objectives, policies and strategies and competitive with other investment companies.
The cost of advisory services provided and the level of profitability. The Board reviewed profitability information of TAM’s cost of procuring fund management services, as well as the costs of provision of administration, fund accounting and other services, to the Fund and to Transamerica Funds as a whole by TAM and its affiliates. The Board reviewed the management and sub-advisory fees for the Fund. The Trustees noted that the Fund’s contractual management fee was in line with the median for its peer group and above the median for its peer universe and that the total expenses of the Fund were below the medians for its peer group and peer universe. Based on their review, the Trustees determined that the management and sub-advisory fees of the Fund generally are appropriate in light of the services expected to be provided or procured, and the anticipated profitability of the relationship between the Fund, TAM and its affiliates, and the Sub-Adviser. In making these observations and determinations, the Board reviewed comparative information provided by Lipper.
Whether fee levels reflect economies of scale and the extent to which economies of scale would be realized as the Fund grows. The Trustees considered the economies of scale with respect to the management of the Fund, whether the Fund had appropriately benefited from any economies of scale, and whether there was potential for realization of any further economies of scale. In evaluating the extent to which the management fees payable under the Investment Advisory and Sub-Advisory Agreements reflect economies of scale or will permit economies of scale to be realized in the future, the Board noted that TAM and the Sub-Adviser offer breakpoints which appropriately benefit investors by passing on economies of scale in the form of lower management fees as the level of assets grows. The Trustees also concluded that they will have the opportunity to periodically reexamine whether the Fund has achieved economies of scale, and the appropriateness of management fees payable to TAM and fees paid to the Sub-Adviser, in the future.
Benefits to TAM, its affiliates, or the Sub-Adviser from their relationship with the Fund. The Board concluded that other benefits anticipated to be derived by TAM, its affiliates, and the Sub-Adviser from their relationships with the Fund are expected to be consistent with industry practice and the best interests of the Fund and its shareholders. The Trustees noted that TAM would not realize soft dollar benefits from its relationship with the Fund.
Other considerations. The Board determined that TAM has made a substantial commitment to the recruitment and retention of high quality personnel, and maintains the financial, compliance and operational resources reasonably necessary to manage the Fund in a professional manner that is consistent with the best interests of the Fund and its shareholders. In this regard, the Trustees favorably considered the procedures and policies in place by TAM to enforce compliance with applicable laws and regulations and oversee the portfolio management activities of the Sub-Adviser. The Trustees also determined that TAM has made a significant entrepreneurial commitment to the management and success of the Fund, reflected by TAM’s expense limitation and fee waiver arrangements with the Fund, which may result in TAM waiving fees for the benefit of shareholders.
Conclusion. After consideration of the factors described above as well as other factors, the Trustees, including all of the independent members of the Board, concluded that the Investment Advisory Agreement and the Sub-Advisory Agreement, including the fees payable there under, were fair and reasonable and voted to approve the renewal of the Investment Advisory Agreement and the Sub-Advisory Agreement for the Fund.
228
TRANSAMERICA MARSICO GROWTH
INVESTMENT ADVISORY AND SUB-ADVISORY AGREEMENTS - CONTRACT RENEWAL
(unaudited)
At a meeting of the Board of Trustees of Transamerica Funds (the “Board”) held on June 4, 2009, the Board reviewed and considered the renewal of the investment advisory agreement (the “Investment Advisory Agreement”) between Transamerica Marsico Growth (the “Fund”) and Transamerica Asset Management, Inc. (“TAM”), as well as the renewal of the investment sub-advisory agreement (the “Sub-Advisory Agreement”) of the Fund between TAM and Columbia Management Advisors, LLC (the “Sub-Adviser”) and the portfolio management agreement (the “Portfolio Management Agreement”) between the Sub-Adviser and Marsico Capital Management, LLC (“MCM”), to determine whether the agreements should be renewed. The Board noted that the Sub-Adviser has entered into an agreement with MCM to provide portfolio management services for the Fund.
Following their review and consideration, the Trustees determined that the renewal of the Investment Advisory Agreement, the Sub-Advisory Agreement and the Portfolio Management Agreement would enable shareholders of the Fund to obtain high quality services at a cost that is appropriate, fair, and in the best interests of Fund shareholders. The Board, including the independent members of the Board, unanimously approved the renewal of the Investment Advisory Agreement, Sub-Advisory Agreement and Portfolio Management Agreement through June 30, 2010. In reaching their decision, the Trustees requested and obtained from TAM, the Sub-Adviser and MCM such information as they deemed reasonably necessary to evaluate the agreements, including information about fees and performance of comparable funds managed by the Sub-Adviser and MCM. The Trustees also carefully considered information they had previously received from TAM, the Sub-Adviser and MCM as part of their regular oversight of the Fund, as well as comparative fee, expense, and performance information prepared by Lipper Inc. (“Lipper”), an independent provider of mutual fund performance, and fee and expense information and profitability data prepared by management. In considering the proposed continuation of the Investment Advisory, Sub-Advisory and Portfolio Management Agreements, the Trustees evaluated a number of considerations that they believed, in light of the legal advice furnished to them by independent legal counsel and their own business judgment, to be relevant. They based their decisions on the following considerations, among others, although they did not identify any consideration or particular information that was controlling of their decisions:
The nature, extent and quality of the advisory services to be provided. The Board considered the nature and quality of the services provided by TAM and MCM to the Fund in the past, as well as the services anticipated to be provided in the future. The Trustees also reviewed MCM’s investment approach for the Fund. The Trustees noted that they receive, on a quarterly basis, an execution analysis from Capital Institutional Services, Inc. (CAPIS), an independent provider of trade analyses, for MCM and a comparison of trading results against a peer universe of managers. The Board concluded that TAM and MCM are capable of providing high quality services to the Fund, as indicated by the nature and quality of services provided in the past by TAM and MCM for this Fund and the experience, capability and integrity of TAM’s senior management, the financial resources of TAM and MCM, TAM’s management oversight process and the professional qualifications of the portfolio management team of MCM. The Trustees determined that TAM and MCM can provide investment and related services that are appropriate in scope and extent in light of the Fund’s operations, the competitive landscape of the investment company business and investor needs.
The investment performance of the Fund. The Board examined the short and longer-term performance of the Fund, including relative performance against a peer universe of comparable mutual funds as prepared by Lipper for various trailing periods ended December 31, 2008. The Board noted that the Fund’s performance was above the median for its peer universe for the past 1-, 3- and 5-year periods. On the basis of the Board’s assessment of the nature, extent and quality of advisory services to be provided or procured by TAM and MCM, the Board concluded that TAM and MCM are capable of generating a level of investment performance that is appropriate in light of the Fund’s investment objectives, policies and strategies and competitive with other investment companies.
The cost of advisory services provided and the level of profitability. The Board reviewed profitability information of TAM’s cost of procuring fund management services, as well as the costs of provision of administration, fund accounting and other services, to the Fund and to Transamerica Funds as a whole by TAM and its affiliates. The Board reviewed the management and sub-advisory fees for the Fund. The Trustees noted that the Fund’s contractual management fee was above the medians for its peer group and peer universe and that the total expenses of the Fund were below the median for its peer group and in line with the median for its peer universe. Based on their review, the Trustees determined that the management and sub-advisory fees of the Fund generally are appropriate in light of the services expected to be provided or procured, and the anticipated profitability of the relationship between the Fund, TAM and its affiliates, and the Sub-Adviser. In making these observations and determinations, the Board reviewed comparative information provided by Lipper.
Whether fee levels reflect economies of scale and the extent to which economies of scale would be realized as the Fund grows. The Trustees considered the economies of scale with respect to the management of the Fund, whether the Fund had appropriately benefited from any economies of scale, and whether there was potential for realization of any further economies of scale. In evaluating the extent to which the management fees payable under the Investment Advisory and Sub-Advisory Agreements reflect economies of scale or will permit economies of scale to be realized in the future, the Board noted that TAM and the Sub-Adviser offer breakpoints which appropriately benefit investors by passing on economies of scale in the form of lower management fees as the level of assets grows. The Trustees also concluded that they will have the opportunity to periodically reexamine whether the Fund has achieved economies of scale, and the appropriateness of management fees payable to TAM and fees paid to the Sub-Adviser, in the future.
Benefits to TAM, its affiliates, or MCM from their relationship with the Fund. The Board concluded that other benefits anticipated to be derived by TAM, its affiliates, and MCM from their relationships with the Fund are expected to be consistent with industry practice and the best interests of the Fund and its shareholders. The Trustees noted that TAM would not realize soft dollar benefits from its relationship with the Fund. The Board also noted that MCM is participating in a brokerage program pursuant to which a portion of brokerage commissions paid by the Fund is recaptured for the benefit of the Fund and its shareholders, thus limiting the amount of soft dollar arrangements MCM may engage in with respect to the Fund’s brokerage transactions.
Other considerations. The Board determined that TAM has made a substantial commitment to the recruitment and retention of high quality personnel, and maintains the financial, compliance and operational resources reasonably necessary to manage the Fund in a professional manner that is consistent with the best interests of the Fund and its shareholders. In this regard, the Trustees favorably considered the procedures and policies in place by TAM to enforce compliance with applicable laws and regulations and oversee the portfolio management activities of MCM. The Trustees also determined that TAM has made a significant entrepreneurial commitment to the management and success of the Fund, reflected by TAM’s expense limitation and fee waiver arrangements with the Fund, which may result in TAM waiving fees for the benefit of shareholders.
Conclusion. After consideration of the factors described above as well as other factors, the Trustees, including all of the independent members of the Board, concluded that the Investment Advisory Agreement, the Sub-Advisory Agreement and the Portfolio Management Agreement, including the fees payable there under, were fair and reasonable and voted to approve the renewal of the Investment Advisory Agreement, the Sub-Advisory Agreement and the Portfolio Management Agreement for the Fund.
229
TRANSAMERICA MARSICO INTERNATIONAL GROWTH
INVESTMENT ADVISORY AND SUB-ADVISORY AGREEMENTS - CONTRACT RENEWAL
(unaudited)
At a meeting of the Board of Trustees of Transamerica Funds (the “Board”) held on June 4, 2009, the Board reviewed and considered the renewal of the investment advisory agreement (the “Investment Advisory Agreement”) between Transamerica Marsico International Growth (the “Fund”) and Transamerica Asset Management, Inc. (“TAM”), as well as the renewal of the investment sub-advisory agreement (the “Sub-Advisory Agreement”) of the Fund between TAM and Columbia Management Advisors, LLC (the “Sub-Adviser”) and the portfolio management agreement (the “Portfolio Management Agreement”) between the Sub-Adviser and Marsico Capital Management, LLC (“MCM”), to determine whether the agreements should be renewed. The Board noted that the Sub-Adviser has entered into an agreement with MCM to provide portfolio management services for the Fund.
Following their review and consideration, the Trustees determined that the renewal of the Investment Advisory Agreement, the Sub-Advisory Agreement and the Portfolio Management Agreement would enable shareholders of the Fund to obtain high quality services at a cost that is appropriate, fair, and in the best interests of Fund shareholders. The Board, including the independent members of the Board, unanimously approved the renewal of the Investment Advisory Agreement, Sub-Advisory Agreement and Portfolio Management Agreement through June 30, 2010. In reaching their decision, the Trustees requested and obtained from TAM, the Sub-Adviser and MCM such information as they deemed reasonably necessary to evaluate the agreements, including information about fees and performance of comparable funds managed by the Sub-Adviser and MCM. The Trustees also carefully considered information they had previously received from TAM, the Sub-Adviser and MCM as part of their regular oversight of the Fund, as well as comparative fee, expense, and performance information prepared by Lipper Inc. (“Lipper”), an independent provider of mutual fund performance, and fee and expense information and profitability data prepared by management. In considering the proposed continuation of the Investment Advisory, Sub-Advisory and Portfolio Management Agreements, the Trustees evaluated a number of considerations that they believed, in light of the legal advice furnished to them by independent legal counsel and their own business judgment, to be relevant. They based their decisions on the following considerations, among others, although they did not identify any consideration or particular information that was controlling of their decisions:
The nature, extent and quality of the advisory services to be provided. The Board considered the nature and quality of the services provided by TAM and MCM to the Fund in the past, as well as the services anticipated to be provided in the future. The Trustees also reviewed MCM’s investment approach for the Fund. The Trustees noted that they receive, on a quarterly basis, an execution analysis from Capital Institutional Services, Inc. (CAPIS), an independent provider of trade analyses, for MCM and a comparison of trading results against a peer universe of managers. The Board concluded that TAM and MCM are capable of providing high quality services to the Fund, as indicated by the nature and quality of services provided in the past by TAM and MCM for this Fund and the experience, capability and integrity of TAM’s senior management, the financial resources of TAM and MCM, TAM’s management oversight process and the professional qualifications of the portfolio management team of MCM. The Trustees determined that TAM and MCM can provide investment and related services that are appropriate in scope and extent in light of the Fund’s operations, the competitive landscape of the investment company business and investor needs.
The investment performance of the Fund. The Board examined the short and longer-term performance of the Fund, including relative performance against a peer universe of comparable mutual funds as prepared by Lipper for various trailing periods ended December 31, 2008. The Board noted that the Fund’s performance was below the median for its peer universe for the past 1- and 3-year periods. The Trustees discussed the reasons for the underperformance with TAM, and agreed that they would continue to monitor the performance of the Fund. On the basis of the Board’s assessment of the nature, extent and quality of advisory services to be provided or procured by TAM and MCM, the Board concluded that TAM and MCM are capable of generating a level of investment performance that is appropriate in light of the Fund’s investment objectives, policies and strategies and competitive with other investment companies.
The cost of advisory services provided and the level of profitability. The Board reviewed profitability information of TAM’s cost of procuring fund management services, as well as the costs of provision of administration, fund accounting and other services, to the Fund and to Transamerica Funds as a whole by TAM and its affiliates. The Board reviewed the management and sub-advisory fees for the Fund. The Trustees noted that the Fund’s contractual management fee was in line with the median for its peer group and above the median for its peer universe and that the total expenses of the Fund were below the medians for its peer group and peer universe. Based on their review, the Trustees determined that the management and sub-advisory fees of the Fund generally are appropriate in light of the services expected to be provided or procured, and the anticipated profitability of the relationship between the Fund, TAM and its affiliates, and the Sub-Adviser. In making these observations and determinations, the Board reviewed comparative information provided by Lipper.
Whether fee levels reflect economies of scale and the extent to which economies of scale would be realized as the Fund grows. The Trustees considered the economies of scale with respect to the management of the Fund, whether the Fund had appropriately benefited from any economies of scale, and whether there was potential for realization of any further economies of scale. In evaluating the extent to which the management fees payable under the Investment Advisory and Sub-Advisory Agreements reflect economies of scale or will permit economies of scale to be realized in the future, the Board noted that TAM and the Sub-Adviser offer breakpoints which appropriately benefit investors by passing on economies of scale in the form of lower management fees as the level of assets grows. The Trustees also concluded that they will have the opportunity to periodically reexamine whether the Fund has achieved economies of scale, and the appropriateness of management fees payable to TAM and fees paid to the Sub-Adviser, in the future.
Benefits to TAM, its affiliates, or MCM from their relationship with the Fund. The Board concluded that other benefits anticipated to be derived by TAM, its affiliates, and MCM from their relationships with the Fund are expected to be consistent with industry practice and the best interests of the Fund and its shareholders. The Trustees noted that TAM would not realize soft dollar benefits from its relationship with the Fund. The Board also noted that MCM is participating in a brokerage program pursuant to which a portion of brokerage commissions paid by the Fund is recaptured for the benefit of the Fund and its shareholders, thus limiting the amount of soft dollar arrangements MCM may engage in with respect to the Fund’s brokerage transactions.
Other considerations. The Board determined that TAM has made a substantial commitment to the recruitment and retention of high quality personnel, and maintains the financial, compliance and operational resources reasonably necessary to manage the Fund in a professional manner that is consistent with the best interests of the Fund and its shareholders. In this regard, the Trustees favorably considered the procedures and policies in place by TAM to enforce compliance with applicable laws and regulations and oversee the portfolio management activities of MCM. The Trustees also determined that TAM has made a significant entrepreneurial commitment to the management and success of the Fund, reflected by TAM’s expense limitation and fee waiver arrangements with the Fund, which may result in TAM waiving fees for the benefit of shareholders.
Conclusion. After consideration of the factors described above as well as other factors, the Trustees, including all of the independent members of the Board, concluded that the Investment Advisory Agreement, the Sub-Advisory Agreement and the Portfolio Management Agreement, including the fees payable there under, were fair and reasonable and voted to approve the renewal of the Investment Advisory Agreement, the Sub-Advisory Agreement and the Portfolio Management Agreement for the Fund.
230
TRANSAMERICA MFS INTERNATIONAL EQUITY
INVESTMENT ADVISORY AND SUB-ADVISORY AGREEMENTS - CONTRACT RENEWAL
(unaudited)
At a meeting of the Board of Trustees of Transamerica Funds (the “Board”) held on June 4, 2009, the Board reviewed and considered the renewal of the investment advisory agreement (the “Investment Advisory Agreement”) between Transamerica MFS International Equity (the “Fund”) and Transamerica Asset Management, Inc. (“TAM”), as well as the renewal of the investment sub-advisory agreement (the “Sub-Advisory Agreement”) of the Fund between TAM and MFS Investment Management (the “Sub-Adviser”), to determine whether the agreements should be renewed.
Following their review and consideration, the Trustees determined that the renewal of the Investment Advisory Agreement and the Sub-Advisory Agreement would enable shareholders of the Fund to obtain high quality services at a cost that is appropriate, fair, and in the best interests of Fund shareholders. The Board, including the independent members of the Board, unanimously approved the renewal of the Investment Advisory Agreement and Sub-Advisory Agreement through June 30, 2010. In reaching their decision, the Trustees requested and obtained from TAM and the Sub-Adviser such information as they deemed reasonably necessary to evaluate the agreements, including information about fees and performance of comparable funds managed by the Sub-Adviser. The Trustees also carefully considered information they had previously received from TAM and the Sub-Adviser as part of their regular oversight of the Fund, as well as comparative fee, expense, and performance information prepared by Lipper Inc. (“Lipper”), an independent provider of mutual fund performance, and fee and expense information and profitability data prepared by management. In considering the proposed continuation of the Investment Advisory and Sub-Advisory Agreements, the Trustees evaluated a number of considerations that they believed, in light of the legal advice furnished to them by independent legal counsel and their own business judgment, to be relevant. They based their decisions on the following considerations, among others, although they did not identify any consideration or particular information that was controlling of their decisions:
The nature, extent and quality of the advisory services to be provided. The Board considered the nature and quality of the services provided by TAM and the Sub-Adviser to the Fund in the past, as well as the services anticipated to be provided in the future. The Trustees also reviewed the Sub-Adviser’s investment approach for the Fund. The Trustees noted that they receive, on a quarterly basis, an execution analysis from Capital Institutional Services, Inc. (CAPIS), an independent provider of trade analyses, for the Sub-Adviser and a comparison of trading results against a peer universe of managers. The Board concluded that TAM and the Sub-Adviser are capable of providing high quality services to the Fund, as indicated by the nature and quality of services provided in the past by TAM and the Sub-Adviser for this Fund and the experience, capability and integrity of TAM’s senior management, the financial resources of TAM and the Sub-Adviser, TAM’s management oversight process and the professional qualifications of the portfolio management team of the Sub-Adviser. The Trustees determined that TAM and the Sub-Adviser can provide investment and related services that are appropriate in scope and extent in light of the Fund’s operations, the competitive landscape of the investment company business and investor needs.
The investment performance of the Fund. The Board examined the short and longer-term performance of the Fund, including relative performance against a peer universe of comparable mutual funds as prepared by Lipper for various trailing periods ended December 31, 2008. The Board noted that the Fund’s performance was above the median for its peer universe for the past 1- and 3-year periods and in line with the median for the past 5-year period. On the basis of the Board’s assessment of the nature, extent and quality of advisory services to be provided or procured by TAM and the Sub-Adviser, the Board concluded that TAM and the Sub-Adviser are capable of generating a level of investment performance that is appropriate in light of the Fund’s investment objectives, policies and strategies and competitive with other investment companies.
The cost of advisory services provided and the level of profitability. The Board reviewed profitability information of TAM’s cost of procuring fund management services, as well as the costs of provision of administration, fund accounting and other services, to the Fund and to Transamerica Funds as a whole by TAM and its affiliates. The Board reviewed the management and sub-advisory fees for the Fund. The Trustees noted that the Fund’s contractual management fee was above the medians for its peer group and peer universe and that the total expenses of the Fund were above the medians for its peer group and peer universe. Based on their review, the Trustees determined that the management and sub-advisory fees of the Fund generally are appropriate in light of the services expected to be provided or procured, and the anticipated profitability of the relationship between the Fund, TAM and its affiliates, and the Sub-Adviser. In making these observations and determinations, the Board reviewed comparative information provided by Lipper.
Whether fee levels reflect economies of scale and the extent to which economies of scale would be realized as the Fund grows. The Trustees considered the economies of scale with respect to the management of the Fund, whether the Fund had appropriately benefited from any economies of scale, and whether there was potential for realization of any further economies of scale. In evaluating the extent to which the management fees payable under the Investment Advisory and Sub-Advisory Agreements reflect economies of scale or will permit economies of scale to be realized in the future, the Board noted that TAM and the Sub-Adviser offer breakpoints which appropriately benefit investors by passing on economies of scale in the form of lower management fees as the level of assets grows. The Trustees also concluded that they will have the opportunity to periodically reexamine whether the Fund has achieved economies of scale, and the appropriateness of management fees payable to TAM and fees paid to the Sub-Adviser, in the future.
Benefits to TAM, its affiliates, or the Sub-Adviser from their relationship with the Fund. The Board concluded that other benefits anticipated to be derived by TAM, its affiliates, and the Sub-Adviser from their relationships with the Fund are expected to be consistent with industry practice and the best interests of the Fund and its shareholders. The Trustees noted that TAM would not realize soft dollar benefits from its relationship with the Fund.
Other considerations. The Board determined that TAM has made a substantial commitment to the recruitment and retention of high quality personnel, and maintains the financial, compliance and operational resources reasonably necessary to manage the Fund in a professional manner that is consistent with the best interests of the Fund and its shareholders. In this regard, the Trustees favorably considered the procedures and policies in place by TAM to enforce compliance with applicable laws and regulations and oversee the portfolio management activities of the Sub-Adviser. The Trustees also determined that TAM has made a significant entrepreneurial commitment to the management and success of the Fund, reflected by TAM’s expense limitation and fee waiver arrangements with the Fund, which may result in TAM waiving fees for the benefit of shareholders.
Conclusion. After consideration of the factors described above as well as other factors, the Trustees, including all of the independent members of the Board, concluded that the Investment Advisory Agreement and the Sub-Advisory Agreement, including the fees payable there under, were fair and reasonable and voted to approve the renewal of the Investment Advisory Agreement and the Sub-Advisory Agreement for the Fund.
231
TRANSAMERICA NEUBERGER BERMAN INTERNATIONAL
INVESTMENT ADVISORY AGREEMENT - CONTRACT RENEWAL
(unaudited)
At a meeting of the Board of Trustees of Transamerica Funds (the “Board”) held on June 4, 2009, the Board reviewed and considered the renewal of the investment advisory agreement (the “Investment Advisory Agreement”) between Transamerica Neuberger Berman International (the “Fund”) and Transamerica Asset Management, Inc. (“TAM”), to determine whether the agreement should be renewed.
Following their review and consideration, the Trustees determined that the renewal of the Investment Advisory Agreement would enable shareholders of the Fund to obtain high quality services at a cost that is appropriate, fair, and in the best interests of Fund shareholders. The Board, including the independent members of the Board, unanimously approved the renewal of the Investment Advisory Agreement through June 30, 2010. In reaching their decision, the Trustees requested and obtained from TAM such information as they deemed reasonably necessary to evaluate the agreement. The Trustees also carefully considered information they had previously received from TAM as part of their regular oversight of the Fund, as well as comparative fee, expense, and performance information prepared by Lipper Inc. (“Lipper”), an independent provider of mutual fund performance, and fee and expense information and profitability data prepared by management. In considering the proposed continuation of the Investment Advisory Agreement, the Trustees evaluated a number of considerations that they believed, in light of the legal advice furnished to them by independent legal counsel and their own business judgment, to be relevant. They based their decision on the following considerations, among others, although they did not identify any consideration or particular information that was controlling of their decision:
The nature, extent and quality of the advisory services to be provided. The Board considered the nature and quality of the services provided by TAM to the Fund in the past, as well as the services anticipated to be provided in the future. The Board concluded that TAM is capable of providing high quality services to the Fund, as indicated by the nature and quality of services provided in the past by TAM for this Fund and the experience, capability and integrity of TAM’s senior management, the financial resources of TAM, and the professional qualifications of the portfolio management team of TAM. The Trustees determined that TAM can provide investment and related services that are appropriate in scope and extent in light of the Fund’s operations, the competitive landscape of the investment company business and investor needs.
The investment performance of the Fund. The Board examined the short and longer-term performance of the Fund, including relative performance against a peer universe of comparable asset allocation funds as prepared by Lipper for various trailing periods ended December 31, 2008. The Board noted that the Fund’s performance was above the median for its peer universe for the past 1-year period and below the median for the past 3-year period. On the basis of the Board’s assessment of the nature, extent and quality of advisory services to be provided or procured by TAM, the Board concluded that TAM is capable of generating a level of investment performance that is appropriate in light of the Fund’s investment objectives, policies and strategies and competitive with other investment companies.
The cost of advisory services provided and the level of profitability. The Board reviewed profitability information of TAM’s cost of procuring fund management services, as well as the costs of provision of administration, fund accounting and other services, to the Fund and to Transamerica Funds as a whole by TAM and its affiliates. The Board reviewed the management fee for the Fund. The Trustees noted that the Fund’s contractual management fee was below the median for its expense group and in line with the median for its expense universe and total expenses were below the medians for its expense group and universe. Based on their review, the Trustees determined that the management fee of the Fund generally is appropriate in light of the services expected to be provided or procured, and the anticipated profitability of the relationship between the Fund and TAM and its affiliates. In making these observations and determinations, the Board reviewed comparative information provided by Lipper.
Whether fee levels reflect economies of scale and the extent to which economies of scale would be realized as the Fund grows. The Trustees considered the economies of scale with respect to the management of the Fund, whether the Fund had appropriately benefited from any economies of scale, and whether there was potential for realization of any further economies of scale. The Trustees considered the absence of breakpoints in the management fee schedule, and concluded the absence of breakpoints was acceptable under the circumstances. The Trustees also concluded that they will have the opportunity to periodically reexamine whether the Fund has achieved economies of scale, and the appropriateness of management fees payable to TAM, in the future.
Benefits to TAM and its affiliates from their relationship with the Fund. The Board concluded that other benefits anticipated to be derived by TAM and its affiliates from their relationships with the Fund are expected to be consistent with industry practice and the best interests of the Fund and its shareholders. The Trustees noted that TAM would not realize soft dollar benefits from its relationship with the Fund.
Other considerations. The Board determined that TAM has made a substantial commitment to the recruitment and retention of high quality personnel, and maintains the financial, compliance and operational resources reasonably necessary to manage the Fund in a professional manner that is consistent with the best interests of the Fund and its shareholders. In this regard, the Trustees favorably considered the procedures and policies in place by TAM to enforce compliance with applicable laws and regulations. The Trustees also determined that TAM has made a significant entrepreneurial commitment to the management and success of the Fund, reflected by TAM’s expense limitation and fee waiver arrangements with the Fund, which may result in TAM waiving fees for the benefit of shareholders.
Conclusion. After consideration of the factors described above as well as other factors, the Trustees, including all of the independent members of the Board, concluded that the Investment Advisory Agreement, including the fees payable there under, was fair and reasonable and voted to approve the renewal of the Investment Advisory Agreement for the Fund.
232
TRANSAMERICA OPPENHEIMER DEVELOPING MARKETS
INVESTMENT ADVISORY AND SUB-ADVISORY AGREEMENTS - CONTRACT RENEWAL
(unaudited)
At a meeting of the Board of Trustees of Transamerica Funds (the “Board”) held on June 4, 2009, the Board reviewed and considered the renewal of the investment advisory agreement (the “Investment Advisory Agreement”) between Transamerica Oppenheimer Developing Markets (the “Fund”) and Transamerica Asset Management, Inc. (“TAM”), as well as the renewal of the investment sub-advisory agreement (the “Sub-Advisory Agreement”) of the Fund between TAM and OppenheimerFunds, Inc. (the “Sub-Adviser”), to determine whether the agreements should be renewed.
Following their review and consideration, the Trustees determined that the renewal of the Investment Advisory Agreement and the Sub-Advisory Agreement would enable shareholders of the Fund to obtain high quality services at a cost that is appropriate, fair, and in the best interests of Fund shareholders. The Board, including the independent members of the Board, unanimously approved the renewal of the Investment Advisory Agreement and Sub-Advisory Agreement through June 30, 2010. In reaching their decision, the Trustees requested and obtained from TAM and the Sub-Adviser such information as they deemed reasonably necessary to evaluate the agreements, including information about fees and performance of comparable funds managed by the Sub-Adviser. The Trustees also carefully considered information they had previously received from TAM and the Sub-Adviser as part of their regular oversight of the Fund, as well as comparative fee, expense, and performance information prepared by Lipper Inc. (“Lipper”), an independent provider of mutual fund performance, and fee and expense information and profitability data prepared by management. In considering the proposed continuation of the Investment Advisory and Sub-Advisory Agreements, the Trustees evaluated a number of considerations that they believed, in light of the legal advice furnished to them by independent legal counsel and their own business judgment, to be relevant. They based their decisions on the following considerations, among others, although they did not identify any consideration or particular information that was controlling of their decisions:
The nature, extent and quality of the advisory services to be provided. The Board considered the nature and quality of the services provided by TAM and the Sub-Adviser to the Fund in the past, as well as the services anticipated to be provided in the future. The Trustees also reviewed the Sub-Adviser’s investment approach for the Fund. The Board discussed the replacement of the Fund’s research analyst. The Trustees noted that they receive, on a quarterly basis, an execution analysis from Capital Institutional Services, Inc. (CAPIS), an independent provider of trade analyses, for the Sub-Adviser and a comparison of trading results against a peer universe of managers. The Board concluded that TAM and the Sub-Adviser are capable of providing high quality services to the Fund, as indicated by the nature and quality of services provided in the past by TAM and the Sub-Adviser for this Fund and the experience, capability and integrity of TAM’s senior management, the financial resources of TAM and the Sub-Adviser, TAM’s management oversight process and the professional qualifications of the portfolio management team of the Sub-Adviser. The Trustees determined that TAM and the Sub-Adviser can provide investment and related services that are appropriate in scope and extent in light of the Fund’s operations, the competitive landscape of the investment company business and investor needs.
The investment performance of the Fund. The Board examined the short and longer-term performance of the Fund, including relative performance against a peer universe of comparable mutual funds as prepared by Lipper for various trailing periods ended December 31, 2008. The Board noted that the Fund’s performance was above the median for its peer universe for the past 1- and 3-year periods. On the basis of the Board’s assessment of the nature, extent and quality of advisory services to be provided or procured by TAM and the Sub-Adviser, the Board concluded that TAM and the Sub-Adviser are capable of generating a level of investment performance that is appropriate in light of the Fund’s investment objectives, policies and strategies and competitive with other investment companies.
The cost of advisory services provided and the level of profitability. The Board reviewed profitability information of TAM’s cost of procuring fund management services, as well as the costs of provision of administration, fund accounting and other services, to the Fund and to Transamerica Funds as a whole by TAM and its affiliates. The Board reviewed the management and sub-advisory fees for the Fund. The Trustees noted that the Fund’s contractual management fee was in line with the medians for its expense group and universe and that the total expenses of the Fund were below the medians for its expense group and universe. Based on their review, the Trustees determined that the management and sub-advisory fees of the Fund generally are appropriate in light of the services expected to be provided or procured, and the anticipated profitability of the relationship between the Fund, TAM and its affiliates, and the Sub-Adviser. In making these observations and determinations, the Board reviewed comparative information provided by Lipper.
Whether fee levels reflect economies of scale and the extent to which economies of scale would be realized as the Fund grows. The Trustees considered the economies of scale with respect to the management of the Fund, whether the Fund had appropriately benefited from any economies of scale, and whether there was potential for realization of any further economies of scale. In evaluating the extent to which the management fees payable under the Investment Advisory and Sub-Advisory Agreements reflect economies of scale or will permit economies of scale to be realized in the future, the Board noted that TAM and the Sub-Adviser offer breakpoints which appropriately benefit investors by passing on economies of scale in the form of lower management fees as the level of assets grows. The Trustees also concluded that they will have the opportunity to periodically reexamine whether the Fund has achieved economies of scale, and the appropriateness of management fees payable to TAM and fees paid to the Sub-Adviser, in the future.
Benefits to TAM, its affiliates, or the Sub-Adviser from their relationship with the Fund. The Board concluded that other benefits anticipated to be derived by TAM, its affiliates, and the Sub-Adviser from their relationships with the Fund are expected to be consistent with industry practice and the best interests of the Fund and its shareholders. The Trustees noted that TAM would not realize soft dollar benefits from its relationship with the Fund.
Other considerations. The Board determined that TAM has made a substantial commitment to the recruitment and retention of high quality personnel, and maintains the financial, compliance and operational resources reasonably necessary to manage the Fund in a professional manner that is consistent with the best interests of the Fund and its shareholders. In this regard, the Trustees favorably considered the procedures and policies in place by TAM to enforce compliance with applicable laws and regulations and oversee the portfolio management activities of the Sub-Adviser. The Trustees also determined that TAM has made a significant entrepreneurial commitment to the management and success of the Fund, reflected by TAM’s expense limitation and fee waiver arrangements with the Fund, which may result in TAM waiving fees for the benefit of shareholders.
Conclusion. After consideration of the factors described above as well as other factors, the Trustees, including all of the independent members of the Board, concluded that the Investment Advisory Agreement and the Sub-Advisory Agreement, including the fees payable there under, were fair and reasonable and voted to approve the renewal of the Investment Advisory Agreement and the Sub-Advisory Agreement for the Fund.
233
TRANSAMERICA OPPENHEIMER SMALL- & MID-CAP VALUE
INVESTMENT ADVISORY AND SUB-ADVISORY AGREEMENTS - CONTRACT RENEWAL
(unaudited)
At a meeting of the Board of Trustees of Transamerica Funds (the “Board”) held on June 4, 2009, the Board reviewed and considered the renewal of the investment advisory agreement (the “Investment Advisory Agreement”) between Transamerica Oppenheimer Small- & Mid-Cap Value (the “Fund”) and Transamerica Asset Management, Inc. (“TAM”), as well as the renewal of the investment sub-advisory agreement (the “Sub-Advisory Agreement”) of the Fund between TAM and OppenheimerFunds, Inc. (the “Sub-Adviser”), to determine whether the agreements should be renewed.
Following their review and consideration, the Trustees determined that the renewal of the Investment Advisory Agreement and the Sub-Advisory Agreement would enable shareholders of the Fund to obtain high quality services at a cost that is appropriate, fair, and in the best interests of Fund shareholders. The Board, including the independent members of the Board, unanimously approved the renewal of the Investment Advisory Agreement and Sub-Advisory Agreement through June 30, 2010. In reaching their decision, the Trustees requested and obtained from TAM and the Sub-Adviser such information as they deemed reasonably necessary to evaluate the agreements, including information about fees and performance of comparable funds managed by the Sub-Adviser. The Trustees also carefully considered information they had previously received from TAM and the Sub-Adviser as part of their regular oversight of the Fund, as well as comparative fee, expense, and performance information prepared by Lipper Inc. (“Lipper”), an independent provider of mutual fund performance, and fee and expense information and profitability data prepared by management. In considering the proposed continuation of the Investment Advisory and Sub-Advisory Agreements, the Trustees evaluated a number of considerations that they believed, in light of the legal advice furnished to them by independent legal counsel and their own business judgment, to be relevant. They based their decisions on the following considerations, among others, although they did not identify any consideration or particular information that was controlling of their decisions:
The nature, extent and quality of the advisory services to be provided. The Board considered the nature and quality of the services provided by TAM and the Sub-Adviser to the Fund in the past, as well as the services anticipated to be provided in the future. The Trustees also reviewed the Sub-Adviser’s investment approach for the Fund. The Trustees noted that they receive, on a quarterly basis, an execution analysis from Capital Institutional Services, Inc. (CAPIS), an independent provider of trade analyses, for the Sub-Adviser and a comparison of trading results against a peer universe of managers. The Board concluded that TAM and the Sub-Adviser are capable of providing high quality services to the Fund, as indicated by the nature and quality of services provided in the past by TAM and the Sub-Adviser for this Fund and the experience, capability and integrity of TAM’s senior management, the financial resources of TAM and the Sub-Adviser, TAM’s management oversight process and the professional qualifications of the portfolio management team of the Sub-Adviser. The Trustees determined that TAM and the Sub-Adviser can provide investment and related services that are appropriate in scope and extent in light of the Fund’s operations, the competitive landscape of the investment company business and investor needs.
The investment performance of the Fund. The Board examined the short and longer-term performance of the Fund, including relative performance against a peer universe of comparable mutual funds as prepared by Lipper for various trailing periods ended December 31, 2008. It was noted that the Fund’s inception date was August 1, 2006. The Board noted that the Fund’s performance was below the median for its peer universe for the past 1-year period. On the basis of the Board’s assessment of the nature, extent and quality of advisory services to be provided or procured by TAM and the Sub-Adviser, the Board concluded that TAM and the Sub-Adviser are capable of generating a level of investment performance that is appropriate in light of the Fund’s investment objectives, policies and strategies and competitive with other investment companies.
The cost of advisory services provided and the level of profitability. The Board reviewed profitability information of TAM’s cost of procuring fund management services, as well as the costs of provision of administration, fund accounting and other services, to the Fund and to Transamerica Funds as a whole by TAM and its affiliates. The Board reviewed the management and sub-advisory fees for the Fund. The Trustees noted that the Fund’s contractual management fee was in line with the medians for its expense group and universe and that the total expenses of the Fund were below the medians for its expense group and universe. Based on their review, the Trustees determined that the management and sub-advisory fees of the Fund generally are appropriate in light of the services expected to be provided or procured, and the anticipated profitability of the relationship between the Fund, TAM and its affiliates, and the Sub-Adviser. In making these observations and determinations, the Board reviewed comparative information provided by Lipper.
Whether fee levels reflect economies of scale and the extent to which economies of scale would be realized as the Fund grows. The Trustees considered the economies of scale with respect to the management of the Fund, whether the Fund had appropriately benefited from any economies of scale, and whether there was potential for realization of any further economies of scale. In evaluating the extent to which the management fees payable under the Investment Advisory and Sub-Advisory Agreements reflect economies of scale or will permit economies of scale to be realized in the future, the Board noted that TAM and the Sub-Adviser offer breakpoints which appropriately benefit investors by passing on economies of scale in the form of lower management fees as the level of assets grows. The Trustees also concluded that they will have the opportunity to periodically reexamine whether the Fund has achieved economies of scale, and the appropriateness of management fees payable to TAM and fees paid to the Sub-Adviser, in the future.
Benefits to TAM, its affiliates, or the Sub-Adviser from their relationship with the Fund. The Board concluded that other benefits anticipated to be derived by TAM, its affiliates, and the Sub-Adviser from their relationships with the Fund are expected to be consistent with industry practice and the best interests of the Fund and its shareholders. The Trustees noted that TAM would not realize soft dollar benefits from its relationship with the Fund.
Other considerations. The Board determined that TAM has made a substantial commitment to the recruitment and retention of high quality personnel, and maintains the financial, compliance and operational resources reasonably necessary to manage the Fund in a professional manner that is consistent with the best interests of the Fund and its shareholders. In this regard, the Trustees favorably considered the procedures and policies in place by TAM to enforce compliance with applicable laws and regulations and oversee the portfolio management activities of the Sub-Adviser. The Trustees also determined that TAM has made a significant entrepreneurial commitment to the management and success of the Fund, reflected by TAM’s expense limitation and fee waiver arrangements with the Fund, which may result in TAM waiving fees for the benefit of shareholders.
Conclusion. After consideration of the factors described above as well as other factors, the Trustees, including all of the independent members of the Board, concluded that the Investment Advisory Agreement and the Sub-Advisory Agreement, including the fees payable there under, were fair and reasonable and voted to approve the renewal of the Investment Advisory Agreement and the Sub-Advisory Agreement for the Fund.
234
TRANSAMERICA PIMCO REAL RETURN TIPS
INVESTMENT ADVISORY AND SUB-ADVISORY AGREEMENTS - CONTRACT RENEWAL
(unaudited)
At a meeting of the Board of Trustees of Transamerica Funds (the “Board”) held on June 4, 2009, the Board reviewed and considered the renewal of the investment advisory agreement (the “Investment Advisory Agreement”) between Transamerica PIMCO Real Return TIPS (the “Fund”) and Transamerica Asset Management, Inc. (“TAM”), as well as the renewal of the investment sub-advisory agreement (the “Sub-Advisory Agreement”) of the Fund between TAM and Pacific Investment Management Company LLC (the “Sub-Adviser”), to determine whether the agreements should be renewed.
Following their review and consideration, the Trustees determined that the renewal of the Investment Advisory Agreement and the Sub-Advisory Agreement would enable shareholders of the Fund to obtain high quality services at a cost that is appropriate, fair, and in the best interests of Fund shareholders. The Board, including the independent members of the Board, unanimously approved the renewal of the Investment Advisory Agreement and Sub-Advisory Agreement through June 30, 2010. In reaching their decision, the Trustees requested and obtained from TAM and the Sub-Adviser such information as they deemed reasonably necessary to evaluate the agreements, including information about fees and performance of comparable funds and separate accounts managed by the Sub-Adviser. The Trustees also carefully considered information they had previously received from TAM and the Sub-Adviser as part of their regular oversight of the Fund, as well as comparative fee, expense, and performance information prepared by Lipper Inc. (“Lipper”), an independent provider of mutual fund performance, and fee and expense information and profitability data prepared by management. In considering the proposed continuation of the Investment Advisory and Sub-Advisory Agreements, the Trustees evaluated a number of considerations that they believed, in light of the legal advice furnished to them by independent legal counsel and their own business judgment, to be relevant. They based their decisions on the following considerations, among others, although they did not identify any consideration or particular information that was controlling of their decisions:
The nature, extent and quality of the advisory services to be provided. The Board considered the nature and quality of the services provided by TAM and the Sub-Adviser to the Fund in the past, as well as the services anticipated to be provided in the future. The Trustees also reviewed the Sub-Adviser’s investment approach for the Fund. The Trustees noted that they receive, on a quarterly basis, an execution analysis from Capital Institutional Services, Inc. (CAPIS), an independent provider of trade analyses, for the Sub-Adviser and a comparison of trading results against a peer universe of managers. The Board concluded that TAM and the Sub-Adviser are capable of providing high quality services to the Fund, as indicated by the nature and quality of services provided in the past by TAM and the Sub-Adviser for this Fund and the experience, capability and integrity of TAM’s senior management, the financial resources of TAM and the Sub-Adviser, TAM’s management oversight process and the professional qualifications of the portfolio management team of the Sub-Adviser. The Trustees determined that TAM and the Sub-Adviser can provide investment and related services that are appropriate in scope and extent in light of the Fund’s operations, the competitive landscape of the investment company business and investor needs.
The investment performance of the Fund. The Board examined the short and longer-term performance of the Fund, including relative performance against a peer universe of comparable mutual funds as prepared by Lipper for various trailing periods ended December 31, 2008. The Board noted that the Fund’s performance was below the median for its peer universe for the past 1- and 3-year periods and in line with the median for its peer universe for the past 5-year period. On the basis of the Board’s assessment of the nature, extent and quality of advisory services to be provided or procured by TAM and the Sub-Adviser, the Board concluded that TAM and the Sub-Adviser are capable of generating a level of investment performance that is appropriate in light of the Fund’s investment objectives, policies and strategies and competitive with other investment companies.
The cost of advisory services provided and the level of profitability. The Board reviewed profitability information of TAM’s cost of procuring fund management services, as well as the costs of provision of administration, fund accounting and other services, to the Fund and to Transamerica Funds as a whole by TAM and its affiliates. The Board reviewed the management and sub-advisory fees for the Fund. The Trustees noted that the Fund’s contractual management fee was above the medians for its expense group and universe and that the total expenses of the Fund were in line with the medians for its expense group and universe. Based on their review, the Trustees determined that the management and sub-advisory fees of the Fund generally are appropriate in light of the services expected to be provided or procured, and the anticipated profitability of the relationship between the Fund, TAM and its affiliates, and the Sub-Adviser. In making these observations and determinations, the Board reviewed comparative information provided by Lipper.
Whether fee levels reflect economies of scale and the extent to which economies of scale would be realized as the Fund grows. The Trustees considered the economies of scale with respect to the management of the Fund, whether the Fund had appropriately benefited from any economies of scale, and whether there was potential for realization of any further economies of scale. In evaluating the extent to which the management fees payable under the Investment Advisory and Sub-Advisory Agreements reflect economies of scale or will permit economies of scale to be realized in the future, the Board noted that TAM and the Sub-Adviser offer or will offer breakpoints which appropriately benefit investors by passing on economies of scale in the form of lower management fees as the level of assets grows. The Trustees also concluded that they will have the opportunity to periodically reexamine whether the Fund has achieved economies of scale, and the appropriateness of management fees payable to TAM and fees paid to the Sub-Adviser, in the future.
Benefits to TAM, its affiliates, or the Sub-Adviser from their relationship with the Fund. The Board concluded that other benefits anticipated to be derived by TAM, its affiliates, and the Sub-Adviser from their relationships with the Fund are expected to be consistent with industry practice and the best interests of the Fund and its shareholders. The Trustees noted that TAM would not realize soft dollar benefits from its relationship with the Fund.
Other considerations. The Board determined that TAM has made a substantial commitment to the recruitment and retention of high quality personnel, and maintains the financial, compliance and operational resources reasonably necessary to manage the Fund in a professional manner that is consistent with the best interests of the Fund and its shareholders. In this regard, the Trustees favorably considered the procedures and policies in place by TAM to enforce compliance with applicable laws and regulations and oversee the portfolio management activities of the Sub-Adviser. The Trustees also determined that TAM has made a significant entrepreneurial commitment to the management and success of the Fund, reflected by TAM’s expense limitation and fee waiver arrangements with the Fund, which may result in TAM waiving fees for the benefit of shareholders.
Conclusion. After consideration of the factors described above as well as other factors, the Trustees, including all of the independent members of the Board, concluded that the Investment Advisory Agreement and the Sub-Advisory Agreement, including the fees payable there under, were fair and reasonable and voted to approve the renewal of the Investment Advisory Agreement and the Sub-Advisory Agreement for the Fund.
235
TRANSAMERICA PIMCO TOTAL RETURN
INVESTMENT ADVISORY AND SUB-ADVISORY AGREEMENTS - CONTRACT RENEWAL
(unaudited)
At a meeting of the Board of Trustees of Transamerica Funds (the “Board”) held on June 4, 2009, the Board reviewed and considered the renewal of the investment advisory agreement (the “Investment Advisory Agreement”) between Transamerica PIMCO Total Return (the “Fund”) and Transamerica Asset Management, Inc. (“TAM”), as well as the renewal of the investment sub-advisory agreement (the “Sub-Advisory Agreement”) of the Fund between TAM and Pacific Investment Management Company LLC (the “Sub-Adviser”), to determine whether the agreements should be renewed.
Following their review and consideration, the Trustees determined that the renewal of the Investment Advisory Agreement and the Sub-Advisory Agreement would enable shareholders of the Fund to obtain high quality services at a cost that is appropriate, fair, and in the best interests of Fund shareholders. The Board, including the independent members of the Board, unanimously approved the renewal of the Investment Advisory Agreement and Sub-Advisory Agreement through June 30, 2010. In reaching their decision, the Trustees requested and obtained from TAM and the Sub-Adviser such information as they deemed reasonably necessary to evaluate the agreements, including information about fees and performance of comparable funds and separate accounts managed by the Sub-Adviser. The Trustees also carefully considered information they had previously received from TAM and the Sub-Adviser as part of their regular oversight of the Fund, as well as comparative fee, expense, and performance information prepared by Lipper Inc. (“Lipper”), an independent provider of mutual fund performance, and fee and expense information and profitability data prepared by management. In considering the proposed continuation of the Investment Advisory and Sub-Advisory Agreements, the Trustees evaluated a number of considerations that they believed, in light of the legal advice furnished to them by independent legal counsel and their own business judgment, to be relevant. They based their decisions on the following considerations, among others, although they did not identify any consideration or particular information that was controlling of their decisions:
The nature, extent and quality of the advisory services to be provided. The Board considered the nature and quality of the services provided by TAM and the Sub-Adviser to the Fund in the past, as well as the services anticipated to be provided in the future. The Trustees also reviewed the Sub-Adviser’s investment approach for the Fund. The Trustees noted that they receive, on a quarterly basis, an execution analysis from Capital Institutional Services, Inc. (CAPIS), an independent provider of trade analyses, for the Sub-Adviser and a comparison of trading results against a peer universe of managers. The Board concluded that TAM and the Sub-Adviser are capable of providing high quality services to the Fund, as indicated by the nature and quality of services provided in the past by TAM and the Sub-Adviser for this Fund and the experience, capability and integrity of TAM’s senior management, the financial resources of TAM and the Sub-Adviser, TAM’s management oversight process and the professional qualifications of the portfolio management team of the Sub-Adviser. The Trustees determined that TAM and the Sub-Adviser can provide investment and related services that are appropriate in scope and extent in light of the Fund’s operations, the competitive landscape of the investment company business and investor needs.
The investment performance of the Fund. The Board examined the short and longer-term performance of the Fund, including relative performance against a peer universe of comparable mutual funds as prepared by Lipper for various trailing periods ended December 31, 2008. The Board noted that the Fund’s performance was in line with the median for its peer universe for the past 1-year period and above the median for its peer universe for the past 3- and 5-year periods. On the basis of the Board’s assessment of the nature, extent and quality of advisory services to be provided or procured by TAM and the Sub-Adviser, the Board concluded that TAM and the Sub-Adviser are capable of generating a level of investment performance that is appropriate in light of the Fund’s investment objectives, policies and strategies and competitive with other investment companies.
The cost of advisory services provided and the level of profitability. The Board reviewed profitability information of TAM’s cost of procuring fund management services, as well as the costs of provision of administration, fund accounting and other services, to the Fund and to Transamerica Funds as a whole by TAM and its affiliates. The Board reviewed the management and sub-advisory fees for the Fund. The Trustees noted that the Fund’s contractual management fee and total expenses were above the medians for its expense group and universe. The Trustees noted the management fee was reduced in 2007. Based on their review, the Trustees determined that the management and sub-advisory fees of the Fund generally are appropriate in light of the services expected to be provided or procured, and the anticipated profitability of the relationship between the Fund, TAM and its affiliates, and the Sub-Adviser. In making these observations and determinations, the Board reviewed comparative information provided by Lipper.
Whether fee levels reflect economies of scale and the extent to which economies of scale would be realized as the Fund grows. The Trustees considered the economies of scale with respect to the management of the Fund, whether the Fund had appropriately benefited from any economies of scale, and whether there was potential for realization of any further economies of scale. In evaluating the extent to which the management fees payable under the Investment Advisory and Sub-Advisory Agreements reflect economies of scale or will permit economies of scale to be realized in the future, the Board noted that TAM and the Sub-Adviser offer or will offer breakpoints which appropriately benefit investors by passing on economies of scale in the form of lower management fees as the level of assets grows. The Trustees also concluded that they will have the opportunity to periodically reexamine whether the Fund has achieved economies of scale, and the appropriateness of management fees payable to TAM and fees paid to the Sub-Adviser, in the future.
Benefits to TAM, its affiliates, or the Sub-Adviser from their relationship with the Fund. The Board concluded that other benefits anticipated to be derived by TAM, its affiliates, and the Sub-Adviser from their relationships with the Fund are expected to be consistent with industry practice and the best interests of the Fund and its shareholders. The Trustees noted that TAM would not realize soft dollar benefits from its relationship with the Fund.
Other considerations. The Board determined that TAM has made a substantial commitment to the recruitment and retention of high quality personnel, and maintains the financial, compliance and operational resources reasonably necessary to manage the Fund in a professional manner that is consistent with the best interests of the Fund and its shareholders. In this regard, the Trustees favorably considered the procedures and policies in place by TAM to enforce compliance with applicable laws and regulations and oversee the portfolio management activities of the Sub-Adviser. The Trustees also determined that TAM has made a significant entrepreneurial commitment to the management and success of the Fund, reflected by TAM’s expense limitation and fee waiver arrangements with the Fund, which may result in TAM waiving fees for the benefit of shareholders.
Conclusion. After consideration of the factors described above as well as other factors, the Trustees, including all of the independent members of the Board, concluded that the Investment Advisory Agreement and the Sub-Advisory Agreement, including the fees payable there under, were fair and reasonable and voted to approve the renewal of the Investment Advisory Agreement and the Sub-Advisory Agreement for the Fund.
236
TRANSAMERICA SCHRODERS INTERNATIONAL SMALL CAP
INVESTMENT ADVISORY AND SUB-ADVISORY AGREEMENTS - CONTRACT RENEWAL
(unaudited)
At a meeting of the Board of Trustees of Transamerica Funds (the “Board”) held on June 4, 2009, the Board reviewed and considered the renewal of the investment advisory agreement (the “Investment Advisory Agreement”) between Transamerica Schroders International Small Cap (the “Fund”) and Transamerica Asset Management, Inc. (“TAM”), as well as the renewal of the investment sub-advisory agreement (the “Sub-Advisory Agreement”) of the Fund between TAM and Schroder Investment Management North America Inc. (the “Sub-Adviser”), to determine whether the agreements should be renewed.
Following their review and consideration, the Trustees determined that the renewal of the Investment Advisory Agreement and the Sub-Advisory Agreement would enable shareholders of the Fund to obtain high quality services at a cost that is appropriate, fair, and in the best interests of Fund shareholders. The Board, including the independent members of the Board, unanimously approved the renewal of the Investment Advisory Agreement and Sub-Advisory Agreement through June 30, 2010. In reaching their decision, the Trustees requested and obtained from TAM and the Sub-Adviser such information as they deemed reasonably necessary to evaluate the agreements, including information about fees and performance of comparable funds managed by the Sub-Adviser. The Trustees also carefully considered information they had previously received from TAM and the Sub-Adviser as part of their regular oversight of the Fund, as well as comparative fee, expense, and performance information prepared by Lipper Inc. (“Lipper”), an independent provider of mutual fund performance, and fee and expense information and profitability data prepared by management. In considering the proposed continuation of the Investment Advisory and Sub-Advisory Agreements, the Trustees evaluated a number of considerations that they believed, in light of the legal advice furnished to them by independent legal counsel and their own business judgment, to be relevant. They based their decisions on the following considerations, among others, although they did not identify any consideration or particular information that was controlling of their decisions:
The nature, extent and quality of the advisory services to be provided. The Board considered the nature and quality of the services provided by TAM and the Sub-Adviser to the Fund in the past, as well as the services anticipated to be provided in the future. The Trustees also reviewed the Sub-Adviser’s investment approach for the Fund. The Trustees noted that they receive, on a quarterly basis, an execution analysis from Capital Institutional Services, Inc. (CAPIS), an independent provider of trade analyses, for the Sub-Adviser and a comparison of trading results against a peer universe of managers. The Board concluded that TAM and the Sub-Adviser are capable of providing high quality services to the Fund, as indicated by the nature and quality of services provided in the past by TAM and the Sub-Adviser for this Fund and the experience, capability and integrity of TAM’s senior management, the financial resources of TAM and the Sub-Adviser, TAM’s management oversight process and the professional qualifications of the portfolio management team of the Sub-Adviser. The Trustees determined that TAM and the Sub-Adviser can provide investment and related services that are appropriate in scope and extent in light of the Fund’s operations, the competitive landscape of the investment company business and investor needs.
The investment performance of the Fund. The Board examined the short and longer-term performance of the Fund, including relative performance against a peer universe of comparable mutual funds as prepared by Lipper for various trailing periods ended December 31, 2008. It was noted that the Fund has an inception date of March 1, 2008. The Board noted that the Fund’s performance was above the median for its peer universe since inception. On the basis of the Board’s assessment of the nature, extent and quality of advisory services to be provided or procured by TAM and the Sub-Adviser, the Board concluded that TAM and the Sub-Adviser are capable of generating a level of investment performance that is appropriate in light of the Fund’s investment objectives, policies and strategies and competitive with other investment companies.
The cost of advisory services provided and the level of profitability. The Board reviewed profitability information of TAM’s cost of procuring fund management services, as well as the costs of provision of administration, fund accounting and other services, to the Fund and to Transamerica Funds as a whole by TAM and its affiliates. The Board reviewed the management and sub-advisory fees for the Fund. The Trustees noted that the Fund’s contractual management fee and total expenses were below the medians for its expense group and universe. Based on their review, the Trustees determined that the management and sub-advisory fees of the Fund generally are appropriate in light of the services expected to be provided or procured, and the anticipated profitability of the relationship between the Fund, TAM and its affiliates, and the Sub-Adviser. In making these observations and determinations, the Board reviewed comparative information provided by Lipper.
Whether fee levels reflect economies of scale and the extent to which economies of scale would be realized as the Fund grows. The Trustees considered the economies of scale with respect to the management of the Fund, whether the Fund had appropriately benefited from any economies of scale, and whether there was potential for realization of any further economies of scale. In evaluating the extent to which the management fees payable under the Investment Advisory and Sub-Advisory Agreements reflect economies of scale or will permit economies of scale to be realized in the future, the Board noted that TAM and the Sub-Adviser offer breakpoints which appropriately benefit investors by passing on economies of scale in the form of lower management fees as the level of assets grows. The Trustees also concluded that they will have the opportunity to periodically reexamine whether the Fund has achieved economies of scale, and the appropriateness of management fees payable to TAM and fees paid to the Sub-Adviser, in the future.
Benefits to TAM, its affiliates, or the Sub-Adviser from their relationship with the Fund. The Board concluded that other benefits anticipated to be derived by TAM, its affiliates, and the Sub-Adviser from their relationships with the Fund are expected to be consistent with industry practice and the best interests of the Fund and its shareholders. The Trustees noted that TAM would not realize soft dollar benefits from its relationship with the Fund.
Other considerations. The Board determined that TAM has made a substantial commitment to the recruitment and retention of high quality personnel, and maintains the financial, compliance and operational resources reasonably necessary to manage the Fund in a professional manner that is consistent with the best interests of the Fund and its shareholders. In this regard, the Trustees favorably considered the procedures and policies in place by TAM to enforce compliance with applicable laws and regulations and oversee the portfolio management activities of the Sub-Adviser. The Trustees also determined that TAM has made a significant entrepreneurial commitment to the management and success of the Fund, reflected by TAM’s expense limitation and fee waiver arrangements with the Fund, which may result in TAM waiving fees for the benefit of shareholders.
Conclusion. After consideration of the factors described above as well as other factors, the Trustees, including all of the independent members of the Board, concluded that the Investment Advisory Agreement and the Sub-Advisory Agreement, including the fees payable there under, were fair and reasonable and voted to approve the renewal of the Investment Advisory Agreement and the Sub-Advisory Agreement for the Fund.
237
TRANSAMERICA THIRD AVENUE VALUE
INVESTMENT ADVISORY AND SUB-ADVISORY AGREEMENTS - CONTRACT RENEWAL
(unaudited)
At a meeting of the Board of Trustees of Transamerica Funds (the “Board”) held on June 4, 2009, the Board reviewed and considered the renewal of the investment advisory agreement (the “Investment Advisory Agreement”) between Transamerica Third Avenue Value (the “Fund”) and Transamerica Asset Management, Inc. (“TAM”), as well as the renewal of the investment sub-advisory agreement (the “Sub-Advisory Agreement”) of the Fund between TAM and Third Avenue Management LLC (the “Sub-Adviser”), to determine whether the agreements should be renewed.
Following their review and consideration, the Trustees determined that the renewal of the Investment Advisory Agreement and the Sub-Advisory Agreement would enable shareholders of the Fund to obtain high quality services at a cost that is appropriate, fair, and in the best interests of Fund shareholders. The Board, including the independent members of the Board, unanimously approved the renewal of the Investment Advisory Agreement and Sub-Advisory Agreement through June 30, 2010. In reaching their decision, the Trustees requested and obtained from TAM and the Sub-Adviser such information as they deemed reasonably necessary to evaluate the agreements, including information about fees and performance of comparable funds managed by the Sub-Adviser. The Trustees noted that TAM and the Sub-Adviser do not manage any comparable separate accounts. The Trustees also carefully considered information they had previously received from TAM and the Sub-Adviser as part of their regular oversight of the Fund, as well as comparative fee, expense, and performance information prepared by Lipper Inc. (“Lipper”), an independent provider of mutual fund performance, and fee and expense information and profitability data prepared by management. In considering the proposed continuation of the Investment Advisory and Sub-Advisory Agreements, the Trustees evaluated a number of considerations that they believed, in light of the legal advice furnished to them by independent legal counsel and their own business judgment, to be relevant. They based their decisions on the following considerations, among others, although they did not identify any consideration or particular information that was controlling of their decisions:
The nature, extent and quality of the advisory services to be provided. The Board considered the nature and quality of the services provided by TAM and the Sub-Adviser to the Fund in the past, as well as the services anticipated to be provided in the future. The Trustees also reviewed the Sub-Adviser’s investment approach for the Fund. The Trustees noted that they receive, on a quarterly basis, an execution analysis from Capital Institutional Services, Inc. (CAPIS), an independent provider of trade analyses, for the Sub-Adviser and a comparison of trading results against a peer universe of managers. The Board concluded that TAM and the Sub-Adviser are capable of providing high quality services to the Fund, as indicated by the nature and quality of services provided in the past by TAM and the Sub-Adviser for this Fund and the experience, capability and integrity of TAM’s senior management, the financial resources of TAM and the Sub-Adviser, TAM’s management oversight process and the professional qualifications of the portfolio management team of the Sub-Adviser. The Trustees determined that TAM and the Sub-Adviser can provide investment and related services that are appropriate in scope and extent in light of the Fund’s operations, the competitive landscape of the investment company business and investor needs.
The investment performance of the Fund. The Board examined the short and longer-term performance of the Fund, including relative performance against a peer universe of comparable mutual funds as prepared by Lipper for various trailing periods ended December 31, 2008. The Fund has an inception date of May 1, 2007. The Board noted that the Fund’s performance was below the median for its peer universe for the past 1-year period. On the basis of the Board’s assessment of the nature, extent and quality of advisory services to be provided or procured by TAM and the Sub-Adviser, the Board concluded that TAM and the Sub-Adviser are capable of generating a level of investment performance that is appropriate in light of the Fund’s investment objectives, policies and strategies and competitive with other investment companies.
The cost of advisory services provided and the level of profitability. The Board reviewed profitability information of TAM’s cost of procuring fund management services, as well as the costs of provision of administration, fund accounting and other services, to the Fund and to Transamerica Funds as a whole by TAM and its affiliates. The Board reviewed the management and sub-advisory fees for the Fund. The Trustees noted that the Fund’s contractual management fee was in line with the median for its expense group and below the median for its expense universe and that the total expenses of the Fund were below the medians for its expense group and universe. Based on their review, the Trustees determined that the management and sub-advisory fees of the Fund generally are appropriate in light of the services expected to be provided or procured, and the anticipated profitability of the relationship between the Fund, TAM and its affiliates, and the Sub-Adviser. In making these observations and determinations, the Board reviewed comparative information provided by Lipper.
Whether fee levels reflect economies of scale and the extent to which economies of scale would be realized as the Fund grows. The Trustees considered the economies of scale with respect to the management of the Fund, whether the Fund had appropriately benefited from any economies of scale, and whether there was potential for realization of any further economies of scale. The Board considered the specific reasons for the absence of breakpoints in the management fee schedule, and concluded that the absence of breakpoints was acceptable under the circumstances. The Trustees also concluded that they will have the opportunity to periodically reexamine whether the Fund has achieved economies of scale, and the appropriateness of management fees payable to TAM and fees paid to the Sub-Adviser, in the future.
Benefits to TAM, its affiliates, or the Sub-Adviser from their relationship with the Fund. The Board concluded that other benefits anticipated to be derived by TAM, its affiliates, and the Sub-Adviser from their relationships with the Fund are expected to be consistent with industry practice and the best interests of the Fund and its shareholders. The Trustees noted that TAM would not realize soft dollar benefits from its relationship with the Fund. The Board also noted that the Sub-Adviser is participating in a brokerage program pursuant to which a portion of brokerage commissions paid by the Fund is recaptured for the benefit of the Fund and its shareholders, thus limiting the amount of soft dollar arrangements the Sub-Adviser may engage in with respect to the Fund’s brokerage transactions.
Other considerations. The Board determined that TAM has made a substantial commitment to the recruitment and retention of high quality personnel, and maintains the financial, compliance and operational resources reasonably necessary to manage the Fund in a professional manner that is consistent with the best interests of the Fund and its shareholders. In this regard, the Trustees favorably considered the procedures and policies in place by TAM to enforce compliance with applicable laws and regulations and oversee the portfolio management activities of the Sub-Adviser. The Trustees also determined that TAM has made a significant entrepreneurial commitment to the management and success of the Fund, reflected by TAM’s expense limitation and fee waiver arrangements with the Fund, which may result in TAM waiving fees for the benefit of shareholders.
Conclusion. After consideration of the factors described above as well as other factors, the Trustees, including all of the independent members of the Board, concluded that the Investment Advisory Agreement and the Sub-Advisory Agreement, including the fees payable there under, were fair and reasonable and voted to approve the renewal of the Investment Advisory Agreement and the Sub-Advisory Agreement for the Fund.
238
TRANSAMERICA UBS DYNAMIC ALPHA
INVESTMENT ADVISORY AND SUB-ADVISORY AGREEMENTS - CONTRACT RENEWAL
(unaudited)
At a meeting of the Board of Trustees of Transamerica Funds (the “Board”) held on June 4, 2009, the Board reviewed and considered the renewal of the investment advisory agreement (the “Investment Advisory Agreement”) between Transamerica UBS Dynamic Alpha (the “Fund”) and Transamerica Asset Management, Inc. (“TAM”), as well as the renewal of the investment sub-advisory agreement (the “Sub-Advisory Agreement”) of the Fund between TAM and UBS Global Asset Management (Americas) Inc. (the “Sub-Adviser”), to determine whether the agreements should be renewed.
Following their review and consideration, the Trustees determined that the renewal of the Investment Advisory Agreement and the Sub-Advisory Agreement would enable shareholders of the Fund to obtain high quality services at a cost that is appropriate, fair, and in the best interests of Fund shareholders. The Board, including the independent members of the Board, unanimously approved the renewal of the Investment Advisory Agreement and Sub-Advisory Agreement through June 30, 2010. In reaching their decision, the Trustees requested and obtained from TAM and the Sub-Adviser such information as they deemed reasonably necessary to evaluate the agreements, including information about fees and performance of comparable funds managed by the Sub-Adviser. The Trustees also carefully considered information they had previously received from TAM and the Sub-Adviser as part of their regular oversight of the Fund, as well as comparative fee, expense, and performance information prepared by Lipper Inc. (“Lipper”), an independent provider of mutual fund performance, and fee and expense information and profitability data prepared by management. In considering the proposed continuation of the Investment Advisory and Sub-Advisory Agreements, the Trustees evaluated a number of considerations that they believed, in light of the legal advice furnished to them by independent legal counsel and their own business judgment, to be relevant. They based their decisions on the following considerations, among others, although they did not identify any consideration or particular information that was controlling of their decisions:
The nature, extent and quality of the advisory services to be provided. The Board considered the nature and quality of the services provided by TAM and the Sub-Adviser to the Fund in the past, as well as the services anticipated to be provided in the future. The Trustees also reviewed the Sub-Adviser’s investment approach for the Fund. The Trustees discussed the recent management team changes. The Trustees noted that they receive, on a quarterly basis, an execution analysis from Capital Institutional Services, Inc. (CAPIS), an independent provider of trade analyses, for the Sub-Adviser and a comparison of trading results against a peer universe of managers. The Board concluded that TAM and the Sub-Adviser are capable of providing high quality services to the Fund, as indicated by the nature and quality of services provided in the past by TAM and the Sub-Adviser for this Fund and the experience, capability and integrity of TAM’s senior management, the financial resources of TAM and the Sub-Adviser, TAM’s management oversight process and the professional qualifications of the portfolio management team of the Sub-Adviser. The Trustees determined that TAM and the Sub-Adviser can provide investment and related services that are appropriate in scope and extent in light of the Fund’s operations, the competitive landscape of the investment company business and investor needs.
The investment performance of the Fund. The Board examined the short and longer-term performance of the Fund, including relative performance against a peer universe of comparable mutual funds as prepared by Lipper for various trailing periods ended December 31, 2008. The Fund has an inception date of January 3, 2007. The Board noted that the Fund’s performance was above the median for its peer universe for the past 1-year period. The Trustees agreed that they would continue to monitor the performance of the Fund closely given recent changes to the management team. On the basis of the Board’s assessment of the nature, extent and quality of advisory services to be provided or procured by TAM and the Sub-Adviser, the Board concluded that TAM and the Sub-Adviser are capable of generating a level of investment performance that is appropriate in light of the Fund’s investment objectives, policies and strategies and competitive with other investment companies.
The cost of advisory services provided and the level of profitability. The Board reviewed profitability information of TAM’s cost of procuring fund management services, as well as the costs of provision of administration, fund accounting and other services, to the Fund and to Transamerica Funds as a whole by TAM and its affiliates. The Board reviewed the management and sub-advisory fees for the Fund. The Trustees noted that the Fund’s contractual management fee was above the medians for its expense group and universe and that the total expenses of the Fund were in line with the median for its expense group and above the median for its expense universe. Based on their review, the Trustees determined that the management and sub-advisory fees of the Fund generally are appropriate in light of the services expected to be provided or procured, and the anticipated profitability of the relationship between the Fund, TAM and its affiliates, and the Sub-Adviser. In making these observations and determinations, the Board reviewed comparative information provided by Lipper.
Whether fee levels reflect economies of scale and the extent to which economies of scale would be realized as the Fund grows. The Trustees considered the economies of scale with respect to the management of the Fund, whether the Fund had appropriately benefited from any economies of scale, and whether there was potential for realization of any further economies of scale. In evaluating the extent to which the management fees payable under the Investment Advisory and Sub-Advisory Agreements reflect economies of scale or will permit economies of scale to be realized in the future, the Board noted that TAM and the Sub-Adviser offer breakpoints which appropriately benefit investors by passing on economies of scale in the form of lower management fees as the level of assets grows. The Trustees also concluded that they will have the opportunity to periodically reexamine whether the Fund has achieved economies of scale, and the appropriateness of management fees payable to TAM and fees paid to the Sub-Adviser, in the future.
Benefits to TAM, its affiliates, or the Sub-Adviser from their relationship with the Fund. The Board concluded that other benefits anticipated to be derived by TAM, its affiliates, and the Sub-Adviser from their relationships with the Fund are expected to be consistent with industry practice and the best interests of the Fund and its shareholders. The Trustees noted that TAM would not realize soft dollar benefits from its relationship with the Fund. The Board also noted that the Sub-Adviser is participating in a brokerage program pursuant to which a portion of brokerage commissions paid by the Fund is recaptured for the benefit of the Fund and its shareholders, thus limiting the amount of soft dollar arrangements the Sub-Adviser may engage in with respect to the Fund’s brokerage transactions.
Other considerations. The Board determined that TAM has made a substantial commitment to the recruitment and retention of high quality personnel, and maintains the financial, compliance and operational resources reasonably necessary to manage the Fund in a professional manner that is consistent with the best interests of the Fund and its shareholders. In this regard, the Trustees favorably considered the procedures and policies in place by TAM to enforce compliance with applicable laws and regulations and oversee the portfolio management activities of the Sub-Adviser. The Trustees also determined that TAM has made a significant entrepreneurial commitment to the management and success of the Fund, reflected by TAM’s expense limitation and fee waiver arrangements with the Fund, which may result in TAM waiving fees for the benefit of shareholders.
Conclusion. After consideration of the factors described above as well as other factors, the Trustees, including all of the independent members of the Board, concluded that the Investment Advisory Agreement and the Sub-Advisory Agreement, including the fees payable there under, were fair and reasonable and voted to approve the renewal of the Investment Advisory Agreement and the Sub-Advisory Agreement for the Fund.
239
TRANSAMERICA UBS LARGE CAP VALUE
INVESTMENT ADVISORY AND SUB-ADVISORY AGREEMENTS - CONTRACT RENEWAL
(unaudited)
At a meeting of the Board of Trustees of Transamerica Funds (the “Board”) held on June 4, 2009, the Board reviewed and considered the renewal of the investment advisory agreement (the “Investment Advisory Agreement”) between Transamerica UBS Large Cap Value (the “Fund”) and Transamerica Asset Management, Inc. (“TAM”), as well as the renewal of the investment sub-advisory agreement (the “Sub-Advisory Agreement”) of the Fund between TAM and UBS Global Asset Management (Americas) Inc. (the “Sub-Adviser”), to determine whether the agreements should be renewed.
Following their review and consideration, the Trustees determined that the renewal of the Investment Advisory Agreement and the Sub-Advisory Agreement would enable shareholders of the Fund to obtain high quality services at a cost that is appropriate, fair, and in the best interests of Fund shareholders. The Board, including the independent members of the Board, unanimously approved the renewal of the Investment Advisory Agreement and Sub-Advisory Agreement through June 30, 2010. In reaching their decision, the Trustees requested and obtained from TAM and the Sub-Adviser such information as they deemed reasonably necessary to evaluate the agreements, including information about fees and performance of comparable funds managed by the Sub-Adviser. The Trustees also carefully considered information they had previously received from TAM and the Sub-Adviser as part of their regular oversight of the Fund, as well as comparative fee, expense, and performance information prepared by Lipper Inc. (“Lipper”), an independent provider of mutual fund performance, and fee and expense information and profitability data prepared by management. In considering the proposed continuation of the Investment Advisory and Sub-Advisory Agreements, the Trustees evaluated a number of considerations that they believed, in light of the legal advice furnished to them by independent legal counsel and their own business judgment, to be relevant. They based their decisions on the following considerations, among others, although they did not identify any consideration or particular information that was controlling of their decisions:
The nature, extent and quality of the advisory services to be provided. The Board considered the nature and quality of the services provided by TAM and the Sub-Adviser to the Fund in the past, as well as the services anticipated to be provided in the future. The Trustees also reviewed the Sub-Adviser’s investment approach for the Fund. The Trustees noted that they receive, on a quarterly basis, an execution analysis from Capital Institutional Services, Inc. (CAPIS), an independent provider of trade analyses, for the Sub-Adviser and a comparison of trading results against a peer universe of managers. The Board concluded that TAM and the Sub-Adviser are capable of providing high quality services to the Fund, as indicated by the nature and quality of services provided in the past by TAM and the Sub-Adviser for this Fund and the experience, capability and integrity of TAM’s senior management, the financial resources of TAM and the Sub-Adviser, TAM’s management oversight process and the professional qualifications of the portfolio management team of the Sub-Adviser. The Trustees determined that TAM and the Sub-Adviser can provide investment and related services that are appropriate in scope and extent in light of the Fund’s operations, the competitive landscape of the investment company business and investor needs.
The investment performance of the Fund. The Board examined the short and longer-term performance of the Fund, including relative performance against a peer universe of comparable mutual funds as prepared by Lipper for various trailing periods ended December 31, 2008. The Board noted that the Fund’s performance was below the median for its peer universe for the past 1- and 3-year periods. On the basis of the Board’s assessment of the nature, extent and quality of advisory services to be provided or procured by TAM and the Sub-Adviser, the Board concluded that TAM and the Sub-Adviser are capable of generating a level of investment performance that is appropriate in light of the Fund’s investment objectives, policies and strategies and competitive with other investment companies.
The cost of advisory services provided and the level of profitability. The Board reviewed profitability information of TAM’s cost of procuring fund management services, as well as the costs of provision of administration, fund accounting and other services, to the Fund and to Transamerica Funds as a whole by TAM and its affiliates. The Board reviewed the management and sub-advisory fees for the Fund. The Trustees noted that the Fund’s contractual management fee was above the median for its expense group and in line with the median for its expense universe and that the total expenses of the Fund were below the medians for its expense group and universe. Based on their review, the Trustees determined that the management and sub-advisory fees of the Fund generally are appropriate in light of the services expected to be provided or procured, and the anticipated profitability of the relationship between the Fund, TAM and its affiliates, and the Sub-Adviser. In making these observations and determinations, the Board reviewed comparative information provided by Lipper.
Whether fee levels reflect economies of scale and the extent to which economies of scale would be realized as the Fund grows. The Trustees considered the economies of scale with respect to the management of the Fund, whether the Fund had appropriately benefited from any economies of scale, and whether there was potential for realization of any further economies of scale. In evaluating the extent to which the management fees payable under the Investment Advisory and Sub-Advisory Agreements reflect economies of scale or will permit economies of scale to be realized in the future, the Board noted that TAM and the Sub-Adviser offer breakpoints which appropriately benefit investors by passing on economies of scale in the form of lower management fees as the level of assets grows. The Trustees also concluded that they will have the opportunity to periodically reexamine whether the Fund has achieved economies of scale, and the appropriateness of management fees payable to TAM and fees paid to the Sub-Adviser, in the future.
Benefits to TAM, its affiliates, or the Sub-Adviser from their relationship with the Fund. The Board concluded that other benefits anticipated to be derived by TAM, its affiliates, and the Sub-Adviser from their relationships with the Fund are expected to be consistent with industry practice and the best interests of the Fund and its shareholders. The Trustees noted that TAM would not realize soft dollar benefits from its relationship with the Fund. The Board also noted that the Sub-Adviser is participating in a brokerage program pursuant to which a portion of brokerage commissions paid by the Fund is recaptured for the benefit of the Fund and its shareholders, thus limiting the amount of soft dollar arrangements the Sub-Adviser may engage in with respect to the Fund’s brokerage transactions.
Other considerations. The Board determined that TAM has made a substantial commitment to the recruitment and retention of high quality personnel, and maintains the financial, compliance and operational resources reasonably necessary to manage the Fund in a professional manner that is consistent with the best interests of the Fund and its shareholders. In this regard, the Trustees favorably considered the procedures and policies in place by TAM to enforce compliance with applicable laws and regulations and oversee the portfolio management activities of the Sub-Adviser. The Trustees also determined that TAM has made a significant entrepreneurial commitment to the management and success of the Fund, reflected by TAM’s expense limitation and fee waiver arrangements with the Fund, which may result in TAM waiving fees for the benefit of shareholders.
Conclusion. After consideration of the factors described above as well as other factors, the Trustees, including all of the independent members of the Board, concluded that the Investment Advisory Agreement and the Sub-Advisory Agreement, including the fees payable there under, were fair and reasonable and voted to approve the renewal of the Investment Advisory Agreement and the Sub-Advisory Agreement for the Fund.
240
TRANSAMERICA VAN KAMPEN EMERGING MARKETS DEBT
INVESTMENT ADVISORY AND SUB-ADVISORY AGREEMENTS - CONTRACT RENEWAL
(unaudited)
At a meeting of the Board of Trustees of Transamerica Funds (the “Board”) held on June 4, 2009, the Board reviewed and considered the renewal of the investment advisory agreement (the “Investment Advisory Agreement”) between Transamerica Van Kampen Emerging Markets Debt (the “Fund”) and Transamerica Asset Management, Inc. (“TAM”), as well as the renewal of the investment sub-advisory agreement (the “Sub-Advisory Agreement”) of the Fund between TAM and Morgan Stanley Investment Management Inc. (the “Sub-Adviser”), to determine whether the agreements should be renewed.
Following their review and consideration, the Trustees determined that the renewal of the Investment Advisory Agreement and the Sub-Advisory Agreement would enable shareholders of the Fund to obtain high quality services at a cost that is appropriate, fair, and in the best interests of Fund shareholders. The Board, including the independent members of the Board, unanimously approved the renewal of the Investment Advisory Agreement and Sub-Advisory Agreement through June 30, 2010. In reaching their decision, the Trustees requested and obtained from TAM and the Sub-Adviser such information as they deemed reasonably necessary to evaluate the agreements, including information about fees and performance of comparable funds managed by the Sub-Adviser. The Trustees also carefully considered information they had previously received from TAM and the Sub-Adviser as part of their regular oversight of the Fund, as well as comparative fee, expense, and performance information prepared by Lipper Inc. (“Lipper”), an independent provider of mutual fund performance, and fee and expense information and profitability data prepared by management. In considering the proposed continuation of the Investment Advisory and Sub-Advisory Agreements, the Trustees evaluated a number of considerations that they believed, in light of the legal advice furnished to them by independent legal counsel and their own business judgment, to be relevant. They based their decisions on the following considerations, among others, although they did not identify any consideration or particular information that was controlling of their decisions:
The nature, extent and quality of the advisory services to be provided. The Board considered the nature and quality of the services provided by TAM and the Sub-Adviser to the Fund in the past, as well as the services anticipated to be provided in the future. The Trustees also reviewed the Sub-Adviser’s investment approach for the Fund. The Trustees noted that they receive, on a quarterly basis, an execution analysis from Capital Institutional Services, Inc. (CAPIS), an independent provider of trade analyses, for the Sub-Adviser and a comparison of trading results against a peer universe of managers. The Board concluded that TAM and the Sub-Adviser are capable of providing high quality services to the Fund, as indicated by the nature and quality of services provided in the past by TAM and the Sub-Adviser for this Fund and the experience, capability and integrity of TAM’s senior management, the financial resources of TAM and the Sub-Adviser, TAM’s management oversight process and the professional qualifications of the portfolio management team of the Sub-Adviser. The Trustees determined that TAM and the Sub-Adviser can provide investment and related services that are appropriate in scope and extent in light of the Fund’s operations, the competitive landscape of the investment company business and investor needs.
The investment performance of the Fund. The Board examined the short and longer-term performance of the Fund, including relative performance against a peer universe of comparable mutual funds as prepared by Lipper for various trailing periods ended December 31, 2008. The Board noted that the Fund’s performance was above the median for its peer universe for the previous 1- and 3-year periods. On the basis of the Board’s assessment of the nature, extent and quality of advisory services to be provided or procured by TAM and the Sub-Adviser, the Board concluded that TAM and the Sub-Adviser are capable of generating a level of investment performance that is appropriate in light of the Fund’s investment objectives, policies and strategies and competitive with other investment companies.
The cost of advisory services provided and the level of profitability. The Board reviewed profitability information of TAM’s cost of procuring fund management services, as well as the costs of provision of administration, fund accounting and other services, to the Fund and to Transamerica Funds as a whole by TAM and its affiliates. The Board reviewed the management and sub-advisory fees for the Fund. The Trustees noted that the Fund’s contractual management fee was above the medians for its peer group and peer universe and that the total expenses of the Fund were below the medians for its peer group and peer universe. Based on their review, the Trustees determined that the management and sub-advisory fees of the Fund generally are appropriate in light of the services expected to be provided or procured, and the anticipated profitability of the relationship between the Fund, TAM and its affiliates, and the Sub-Adviser. In making these observations and determinations, the Board reviewed comparative information provided by Lipper.
Whether fee levels reflect economies of scale and the extent to which economies of scale would be realized as the Fund grows. The Trustees considered the economies of scale with respect to the management of the Fund, whether the Fund had appropriately benefited from any economies of scale, and whether there was potential for realization of any further economies of scale. In evaluating the extent to which the management fees payable under the Investment Advisory and Sub-Advisory Agreements reflect economies of scale or will permit economies of scale to be realized in the future, the Board noted that TAM and the Sub-Adviser offer breakpoints which appropriately benefit investors by passing on economies of scale in the form of lower management fees as the level of assets grows. The Trustees also concluded that they will have the opportunity to periodically reexamine whether the Fund has achieved economies of scale, and the appropriateness of management fees payable to TAM and fees paid to the Sub-Adviser, in the future.
Benefits to TAM, its affiliates, or the Sub-Adviser from their relationship with the Fund. The Board concluded that other benefits anticipated to be derived by TAM, its affiliates, and the Sub-Adviser from their relationships with the Fund are expected to be consistent with industry practice and the best interests of the Fund and its shareholders. The Trustees noted that TAM would not realize soft dollar benefits from its relationship with the Fund.
Other considerations. The Board determined that TAM has made a substantial commitment to the recruitment and retention of high quality personnel, and maintains the financial, compliance and operational resources reasonably necessary to manage the Fund in a professional manner that is consistent with the best interests of the Fund and its shareholders. In this regard, the Trustees favorably considered the procedures and policies in place by TAM to enforce compliance with applicable laws and regulations and oversee the portfolio management activities of the Sub-Adviser. The Trustees also determined that TAM has made a significant entrepreneurial commitment to the management and success of the Fund, reflected by TAM’s expense limitation and fee waiver arrangements with the Fund, which may result in TAM waiving fees for the benefit of shareholders.
Conclusion. After consideration of the factors described above as well as other factors, the Trustees, including all of the independent members of the Board, concluded that the Investment Advisory Agreement and the Sub-Advisory Agreement, including the fees payable there under, were fair and reasonable and voted to approve the renewal of the Investment Advisory Agreement and the Sub-Advisory Agreement for the Fund.
241
TRANSAMERICA VAN KAMPEN MID-CAP GROWTH
INVESTMENT ADVISORY AND SUB-ADVISORY AGREEMENTS - CONTRACT RENEWAL
(unaudited)
At a meeting of the Board of Trustees of Transamerica Funds (the “Board”) held on June 4, 2009, the Board reviewed and considered the renewal of the investment advisory agreement (the “Investment Advisory Agreement”) between Transamerica Van Kampen Mid-Cap Growth (the “Fund”) and Transamerica Asset Management, Inc. (“TAM”), as well as the renewal of the investment sub-advisory agreement (the “Sub-Advisory Agreement”) of the Fund between TAM and Morgan Stanley Investment Management Inc. (the “Sub-Adviser”), to determine whether the agreements should be renewed.
Following their review and consideration, the Trustees determined that the renewal of the Investment Advisory Agreement and the Sub-Advisory Agreement would enable shareholders of the Fund to obtain high quality services at a cost that is appropriate, fair, and in the best interests of Fund shareholders. The Board, including the independent members of the Board, unanimously approved the renewal of the Investment Advisory Agreement and Sub-Advisory Agreement through June 30, 2010. In reaching their decision, the Trustees requested and obtained from TAM and the Sub-Adviser such information as they deemed reasonably necessary to evaluate the agreements, including information about fees and performance of comparable funds managed by the Sub-Adviser. The Trustees also carefully considered information they had previously received from TAM and the Sub-Adviser as part of their regular oversight of the Fund, as well as comparative fee, expense, and performance information prepared by Lipper Inc. (“Lipper”), an independent provider of mutual fund performance, and fee and expense information and profitability data prepared by management. In considering the proposed continuation of the Investment Advisory and Sub-Advisory Agreements, the Trustees evaluated a number of considerations that they believed, in light of the legal advice furnished to them by independent legal counsel and their own business judgment, to be relevant. They based their decisions on the following considerations, among others, although they did not identify any consideration or particular information that was controlling of their decisions:
The nature, extent and quality of the advisory services to be provided. The Board considered the nature and quality of the services provided by TAM and the Sub-Adviser to the Fund in the past, as well as the services anticipated to be provided in the future. The Trustees also reviewed the Sub-Adviser’s investment approach for the Fund. The Trustees noted that they receive, on a quarterly basis, an execution analysis from Capital Institutional Services, Inc. (CAPIS), an independent provider of trade analyses, for the Sub-Adviser and a comparison of trading results against a peer universe of managers. The Board concluded that TAM and the Sub-Adviser are capable of providing high quality services to the Fund, as indicated by the nature and quality of services provided in the past by TAM and the Sub-Adviser for this Fund and the experience, capability and integrity of TAM’s senior management, the financial resources of TAM and the Sub-Adviser, TAM’s management oversight process and the professional qualifications of the portfolio management team of the Sub-Adviser. The Trustees determined that TAM and the Sub-Adviser can provide investment and related services that are appropriate in scope and extent in light of the Fund’s operations, the competitive landscape of the investment company business and investor needs.
The investment performance of the Fund. The Board examined the short and longer-term performance of the Fund, including relative performance against a peer universe of comparable mutual funds as prepared by Lipper for various trailing periods ended December 31, 2008, noting that the Fund’s inception date was January 3, 2006. The Board noted that the Fund’s performance was below the median for the past 1-year period. On the basis of the Board’s assessment of the nature, extent and quality of advisory services to be provided or procured by TAM and the Sub-Adviser, the Board concluded that TAM and the Sub-Adviser are capable of generating a level of investment performance that is appropriate in light of the Fund’s investment objectives, policies and strategies and competitive with other investment companies.
The cost of advisory services provided and the level of profitability. The Board reviewed profitability information of TAM’s cost of procuring fund management services, as well as the costs of provision of administration, fund accounting and other services, to the Fund and to Transamerica Funds as a whole by TAM and its affiliates. The Board reviewed the management and sub-advisory fees for the Fund. The Trustees noted that the Fund’s contractual management fee was below the median for its peer group and in line with the median for its peer universe and that the total expenses of the Fund were below the medians for its peer group and peer universe. Based on their review, the Trustees determined that the management and sub-advisory fees of the Fund generally are appropriate in light of the services expected to be provided or procured, and the anticipated profitability of the relationship between the Fund, TAM and its affiliates, and the Sub-Adviser. In making these observations and determinations, the Board reviewed comparative information provided by Lipper.
Whether fee levels reflect economies of scale and the extent to which economies of scale would be realized as the Fund grows. The Trustees considered the economies of scale with respect to the management of the Fund, whether the Fund had appropriately benefited from any economies of scale, and whether there was potential for realization of any further economies of scale. In evaluating the extent to which the management fees payable under the Investment Advisory and Sub-Advisory Agreements reflect economies of scale or will permit economies of scale to be realized in the future, the Board noted that TAM and the Sub-Adviser offer breakpoints which appropriately benefit investors by passing on economies of scale in the form of lower management fees as the level of assets grows. The Trustees also concluded that they will have the opportunity to periodically reexamine whether the Fund has achieved economies of scale, and the appropriateness of management fees payable to TAM and fees paid to the Sub-Adviser, in the future.
Benefits to TAM, its affiliates, or the Sub-Adviser from their relationship with the Fund. The Board concluded that other benefits anticipated to be derived by TAM, its affiliates, and the Sub-Adviser from their relationships with the Fund are expected to be consistent with industry practice and the best interests of the Fund and its shareholders. The Trustees noted that TAM would not realize soft dollar benefits from its relationship with the Fund.
Other considerations. The Board determined that TAM has made a substantial commitment to the recruitment and retention of high quality personnel, and maintains the financial, compliance and operational resources reasonably necessary to manage the Fund in a professional manner that is consistent with the best interests of the Fund and its shareholders. In this regard, the Trustees favorably considered the procedures and policies in place by TAM to enforce compliance with applicable laws and regulations and oversee the portfolio management activities of the Sub-Adviser. The Trustees also determined that TAM has made a significant entrepreneurial commitment to the management and success of the Fund, reflected by TAM’s expense limitation and fee waiver arrangements with the Fund, which may result in TAM waiving fees for the benefit of shareholders.
Conclusion. After consideration of the factors described above as well as other factors, the Trustees, including all of the independent members of the Board, concluded that the Investment Advisory Agreement and the Sub-Advisory Agreement, including the fees payable there under, were fair and reasonable and voted to approve the renewal of the Investment Advisory Agreement and the Sub-Advisory Agreement for the Fund.
242
TRANSAMERICA VAN KAMPEN SMALL COMPANY GROWTH
INVESTMENT ADVISORY AND SUB-ADVISORY AGREEMENTS - CONTRACT RENEWAL
(unaudited)
At a meeting of the Board of Trustees of Transamerica Funds (the “Board”) held on June 4, 2009, the Board reviewed and considered the renewal of the investment advisory agreement (the “Investment Advisory Agreement”) between Transamerica Van Kampen Small Company Growth (the “Fund”) and Transamerica Asset Management, Inc. (“TAM”), as well as the renewal of the investment sub-advisory agreement (the “Sub-Advisory Agreement”) of the Fund between TAM and Morgan Stanley Investment Management Inc. (the “Sub-Adviser”), to determine whether the agreements should be renewed.
Following their review and consideration, the Trustees determined that the renewal of the Investment Advisory Agreement and the Sub-Advisory Agreement would enable shareholders of the Fund to obtain high quality services at a cost that is appropriate, fair, and in the best interests of Fund shareholders. The Board, including the independent members of the Board, unanimously approved the renewal of the Investment Advisory Agreement and Sub-Advisory Agreement through June 30, 2010. In reaching their decision, the Trustees requested and obtained from TAM and the Sub-Adviser such information as they deemed reasonably necessary to evaluate the agreements, including information about fees and performance of comparable funds managed by the Sub-Adviser. The Trustees also carefully considered information they had previously received from TAM and the Sub-Adviser as part of their regular oversight of the Fund, as well as comparative fee, expense, and performance information prepared by Lipper Inc. (“Lipper”), an independent provider of mutual fund performance, and fee and expense information and profitability data prepared by management. In considering the proposed continuation of the Investment Advisory and Sub-Advisory Agreements, the Trustees evaluated a number of considerations that they believed, in light of the legal advice furnished to them by independent legal counsel and their own business judgment, to be relevant. They based their decisions on the following considerations, among others, although they did not identify any consideration or particular information that was controlling of their decisions:
The nature, extent and quality of the advisory services to be provided. The Board considered the nature and quality of the services provided by TAM and the Sub-Adviser to the Fund in the past, as well as the services anticipated to be provided in the future. The Trustees also reviewed the Sub-Adviser’s investment approach for the Fund. The Trustees noted that they receive, on a quarterly basis, an execution analysis from Capital Institutional Services, Inc. (CAPIS), an independent provider of trade analyses, for the Sub-Adviser and a comparison of trading results against a peer universe of managers. The Board concluded that TAM and the Sub-Adviser are capable of providing high quality services to the Fund, as indicated by the nature and quality of services provided in the past by TAM and the Sub-Adviser for this Fund and the experience, capability and integrity of TAM’s senior management, the financial resources of TAM and the Sub-Adviser, TAM’s management oversight process and the professional qualifications of the portfolio management team of the Sub-Adviser. The Trustees determined that TAM and the Sub-Adviser can provide investment and related services that are appropriate in scope and extent in light of the Fund’s operations, the competitive landscape of the investment company business and investor needs.
The investment performance of the Fund. The Board examined the short and longer-term performance of the Fund, including relative performance against a peer universe of comparable mutual funds as prepared by Lipper for various trailing periods ended December 31, 2008. The Board noted that the Fund’s performance was above the median for its peer universe for the past 1-year period and in line with the median for the past 3-year period. On the basis of the Board’s assessment of the nature, extent and quality of advisory services to be provided or procured by TAM and the Sub-Adviser, the Board concluded that TAM and the Sub-Adviser are capable of generating a level of investment performance that is appropriate in light of the Fund’s investment objectives, policies and strategies and competitive with other investment companies.
The cost of advisory services provided and the level of profitability. The Board reviewed profitability information of TAM’s cost of procuring fund management services, as well as the costs of provision of administration, fund accounting and other services, to the Fund and to Transamerica Funds as a whole by TAM and its affiliates. The Board reviewed the management and sub-advisory fees for the Fund. The Trustees noted that the Fund’s contractual management fee was below the median for its peer group and in line with the median for its peer universe and that the total expenses of the Fund were below the medians for its peer group and peer universe. Based on their review, the Trustees determined that the management and sub-advisory fees of the Fund generally are appropriate in light of the services expected to be provided or procured, and the anticipated profitability of the relationship between the Fund, TAM and its affiliates, and the Sub-Adviser. In making these observations and determinations, the Board reviewed comparative information provided by Lipper.
Whether fee levels reflect economies of scale and the extent to which economies of scale would be realized as the Fund grows. The Trustees considered the economies of scale with respect to the management of the Fund, whether the Fund had appropriately benefited from any economies of scale, and whether there was potential for realization of any further economies of scale. In evaluating the extent to which the management fees payable under the Investment Advisory and Sub-Advisory Agreements reflect economies of scale or will permit economies of scale to be realized in the future, the Board noted that TAM and the Sub-Adviser offer breakpoints which appropriately benefit investors by passing on economies of scale in the form of lower management fees as the level of assets grows. The Trustees also concluded that they will have the opportunity to periodically reexamine whether the Fund has achieved economies of scale, and the appropriateness of management fees payable to TAM and fees paid to the Sub-Adviser, in the future.
Benefits to TAM, its affiliates, or the Sub-Adviser from their relationship with the Fund. The Board concluded that other benefits anticipated to be derived by TAM, its affiliates, and the Sub-Adviser from their relationships with the Fund are expected to be consistent with industry practice and the best interests of the Fund and its shareholders. The Trustees noted that TAM would not realize soft dollar benefits from its relationship with the Fund. The Board also noted that the Sub-Adviser is participating in a brokerage program pursuant to which a portion of brokerage commissions paid by the Fund is recaptured for the benefit of the Fund and its shareholders, thus limiting the amount of soft dollar arrangements the Sub-Adviser may engage in with respect to the Fund’s brokerage transactions.
Other considerations. The Board determined that TAM has made a substantial commitment to the recruitment and retention of high quality personnel, and maintains the financial, compliance and operational resources reasonably necessary to manage the Fund in a professional manner that is consistent with the best interests of the Fund and its shareholders. In this regard, the Trustees favorably considered the procedures and policies in place by TAM to enforce compliance with applicable laws and regulations and oversee the portfolio management activities of the Sub-Adviser. The Trustees also determined that TAM has made a significant entrepreneurial commitment to the management and success of the Fund, reflected by TAM’s expense limitation and fee waiver arrangements with the Fund, which may result in TAM waiving fees for the benefit of shareholders.
Conclusion. After consideration of the factors described above as well as other factors, the Trustees, including all of the independent members of the Board, concluded that the Investment Advisory Agreement and the Sub-Advisory Agreement, including the fees payable there under, were fair and reasonable and voted to approve the renewal of the Investment Advisory Agreement and the Sub-Advisory Agreement for the Fund.
243
TRANSAMERICA EVERGREEN HEALTHCARE
TRANSAMERICA EVERGREEN INTERNATIONAL SMALL CAP
APPROVAL OF NEW INVESTMENT SUBADVISORY AGREEMENT
(unaudited)
At a meeting of the Board of Trustees of Transamerica Funds held on October 21, 2008, the Board considered approval of new Investment Subadvisory Agreements with Evergreen Investment Management Company, LLC (“Evergreen”), on behalf of Transamerica Evergreen Healthcare and Transamerica Evergreen International Small Cap (the “New Subadvisory Agreements”). In October 2008, it was announced that Evergreen’s parent company, Wachovia Corporation, would be acquired by Wells Fargo & Company (the “Transaction”).
It was noted that the Transaction would constitute an “assignment” (within the meaning of the 1940 Act) which would result in the termination of the subadvisory agreements with Evergreen (referred to as the Prior Subadvisory Agreements). At the Board meeting on October 21, 2008, prior to the close of the Transaction, the Board approved the New Subadvisory Agreements with Evergreen. Discussed below are some of the material factors considered by the Board in approving the New Subadvisory Agreements.
The Board considered information with respect to Evergreen, the rationale, structure and expected results of the Transaction and whether the New Subadvisory Agreements were in the best interests of Transamerica Evergreen Healthcare and Transamerica Evergreen International Small Cap (the “Funds”) and their shareholders.
The Board considered that the Funds’ portfolio management teams were not expected to change as a result of the Transaction. The Board also noted that, other than the effective and termination dates, the New Subadvisory Agreements were substantially identical to the Prior Subadvisory Agreements. In its deliberations, the Board also considered information that had been received by the Board in its most recent approval of the Prior Subadvisory Agreements, in addition to information provided in connection with the Board’s evaluation of the terms and conditions of the New Subadvisory Agreements.
Based upon its review and the representations made to it, the Board, including all of the Independent Board Members, concluded that (a) the terms of the New Subadvisory Agreements were reasonable, fair and in the best interests of the Funds and their holders of beneficial interests, and (b) the fees provided in the New Subadvisory Agreements were fair and reasonable in light of the usual and customary charges made for services of the same nature and quality. Accordingly, after consideration of the above factors, and such other factors and information as it deemed relevant, the Board, including all of the Independent Board Members, approved the New Subadvisory Agreements.
244
TRANSAMERICA NEUBERGER BERMAN INTERNATIONAL
APPROVAL OF NEW INVESTMENT SUBADVISORY AGREEMENT
(unaudited)
At a meeting of the Board of Trustees of Transamerica Funds held on January 22, 2009, the Board considered approval of a new Investment Subadvisory Agreement with Neuberger Berman Management LLC (“Neuberger”), on behalf of Transamerica Neuberger Berman International (the “New Subadvisory Agreement”) in light of Neuberger’s impending acquisition by NBSH Acquisitions, LLC (the “Transaction”).
It was noted that the Transaction would constitute an “assignment” (within the meaning of the 1940 Act) which would result in the termination of the subadvisory agreement with Neuberger (referred to as the Prior Subadvisory Agreement). At the Board meeting on January 22, 2009, prior to the close of the Transaction, the Board approved the New Subadvisory Agreement with Neuberger. Discussed below are some of the material factors considered by the Board in approving the New Subadvisory Agreement.
The Board considered information with respect to Neuberger, the rationale, structure and expected results of the Transaction and whether the New Subadvisory Agreement was in the best interests of Transamerica Neuberger Berman International (the “Fund”) and its shareholders.
The Board considered that the Fund’s portfolio management team was not expected to change as a result of the Transaction. The Board also noted that, other than the effective and termination dates, the New Subadvisory Agreement was substantially identical to the Prior Subadvisory Agreement. In its deliberations, the Board also considered information that had been received by the Board in its most recent approval of the Prior Subadvisory Agreement, in addition to information provided in connection with the Board’s evaluation of the terms and conditions of the New Subadvisory Agreement.
Based upon its review and the representations made to it, the Board, including all of the Independent Board Members, concluded that (a) the terms of the New Subadvisory Agreement were reasonable, fair and in the best interests of the Fund and its holders of beneficial interests, and (b) the fees provided in the New Subadvisory Agreement were fair and reasonable in light of the usual and customary charges made for services of the same nature and quality. Accordingly, after consideration of the above factors, and such other factors and information as it deemed relevant, the Board, including all of the Independent Board Members, approved the New Subadvisory Agreement.
245
SUPPLEMENTAL INFORMATION (unaudited)
TAX INFORMATION
For dividends paid during the year ended October 31, 2009, the Funds designated the following as qualified dividend income:
Fund | | Qualified Dividend
Income | |
| | | |
Transamerica AllianceBernstein International Value | | $ | 12,685 | |
Transamerica BlackRock Global Allocation | | 6,275 | |
Transamerica BlackRock Large Cap Value | | 8,084 | |
Transamerica BlackRock Natural Resources | | 414 | |
Transamerica Federated Market Opportunity | | 329 | |
Transamerica JPMorgan Mid Cap Value | | 3,382 | |
Transamerica Loomis Sayles Bond | | 443 | |
Transamerica Neuberger Berman International | | 8,575 | |
Transamerica Oppenheimer Developing Markets | | 6,340 | |
Transamerica Oppenheimer Small- & Mid-Cap Value | | 701 | |
Transamerica Schroders International Small Cap | | 1,875 | |
Transamerica UBS Dynamic Alpha | | 606 | |
Transamerica UBS Large Cap Value | | 16,272 | |
Transamerica Van Kampen Mid-Cap Growth | | 121 | |
Transamerica Van Kampen Small Company Growth | | 915 | |
Transamerica Jennison Growth | | 430 | |
Transamerica PIMCO Real Return TIPS | | 2 | |
Transamerica PIMCO Total Return | | 323 | |
| | | | |
For corporate shareholders, investment income (dividend income plus short-term gains, if any) qualifies for the dividends received deductions as follows:
Fund | | Dividend Received
Deduction Percentage | |
| | | |
Transamerica BlackRock Global Allocation | | 13.49 | % |
Transamerica BlackRock Large Cap Value | | 100.00 | |
Transamerica BlackRock Natural Resources | | 100.00 | |
Transamerica BNY Mellon Market Neutral Strategy | | 23.46 | |
Transamerica Federated Market Opportunity | | 17.11 | |
Transamerica JPMorgan Mid Cap Value | | 100.00 | |
Transamerica Loomis Sayles Bond | | 2.30 | |
Transamerica Oppenheimer Small- & Mid-Cap Value | | 100.00 | |
Transamerica UBS Dynamic Alpha | | 100.00 | |
Transamerica UBS Large Cap Value | | 100.00 | |
Transamerica Van Kampen Mid-Cap Growth | | 100.00 | |
Transamerica Van Kampen Small Company Growth | | 51.76 | |
Transamerica Jennison Growth | | 100.00 | |
Transamerica MFS International Equity | | 0.58 | |
Transamerica PIMCO Real Return TIPS | | 0.05 | |
Transamerica PIMCO Total Return | | 0.89 | |
For tax purposes, the Long-Term Capital Gain Designations for the year ended October 31, 2009 were as follows:
Fund | | Long-Term Capital Gain
Designation | |
| | | |
Transamerica BlackRock Global Allocation | | $ | 26,424 | |
Transamerica Federated Market Opportunity | | 2,752 | |
Transamerica JPMorgan International Bond | | 14,205 | |
Transamerica JPMorgan Mid Cap Value | | 1,014 | |
Transamerica Loomis Sayles Bond | | 1,282 | |
Transamerica Oppenheimer Developing Markets | | 57,191 | |
Transamerica Thornburg International Value | | 620 | |
Transamerica UBS Dynamic Alpha | | 29,757 | |
Transamerica PIMCO Real Return TIPS | | 3,893 | |
| | | | |
The information and distributions reported herein may differ from the information and distributions taxable to the shareholders for the calendar year ending December 31, 2009. Complete information will be computed and reported in conjunction with your 2009
Form 1099-DIV.
246
TRANSAMERICA FUNDS
Management of the Funds
The Board Members and executive officers of the Trust are listed below. The Board governs each Fund and is responsible for protecting the interests of the shareholders. The Board Members are experienced executives who meet periodically throughout the year to oversee the business affairs of each Fund and the operation of the Trust by its officers. The Board also reviews the management of each Fund’s assets by the investment adviser and its respective sub-adviser. The Funds are among the funds advised and sponsored by TAM (collectively, the “Transamerica Asset Management Group”). The Transamerica Asset Management Group (“TAMG”) consists of Transamerica Funds, Transamerica Series Trust (“TST”), Transamerica Investors, Inc. (“TII”), Transamerica Income Shares, Inc. (“TIS”), Transamerica Partners Funds Group (“TPFG”), Transamerica Partners Funds Group II (“TPFG II”), Transamerica Partners Portfolios (“TPP”), and Transamerica Asset Allocation Variable Funds (“TAAVF”).
The mailing address of each Board Member is c/o Secretary of the Funds, 570 Carillon Parkway, St. Petersburg, Florida 33716. The Board Members, their ages and their principal occupations for the past five years (their titles may have varied during that period), the number of funds in TAMG the Board oversees, and other board memberships they hold are set forth in the table below.
Name and Age | | Position | | Term of
Office and
Length of
Time
Served* | | Principal Occupation(s) During
Past 5 Years | | Number of
Funds in
Complex
Overseen | | Other
Directorships |
| | | | | | | | | | |
INTERESTED BOARD MEMBER** | | | | | | |
| | | | | | | | | | |
John K. Carter (1961) | | Chairman, Board Member, President, and Chief Executive Officer | | Since 1999 | | Chairman and Board Member (2008 – present), President (2007 – present), Chief Executive Officer (2006 – present), Vice President, Secretary and Chief Compliance Officer (2003 – 2006), TII; Chairman, Board Member, President and Chief Executive Officer, TPP, TPFG, TPFG II and TAAVF (2007 – present); Chairman (2007 – present), Board Member (2006 – present), President and Chief Executive Officer (2006 – present), Senior Vice President (1999 – 2006), Chief Compliance Officer, General Counsel and Secretary (1999 – 2006), Transamerica Funds and TST; Chairman (2007 – present), Board Member (2006 – present), President and Chief Executive Officer (2006 – present), Senior Vice President (2002 – 2006), General Counsel, Secretary and Chief Compliance Officer (2002 – 2006), TIS; President and Chief Executive Officer (2006 – present), Senior Vice President (1999 – 2006), Director (2000 – present), General Counsel and Secretary (2000 – 2006), Chief Compliance Officer (2004 – 2006), TAM; President and Chief Executive Officer (2006 – present), Senior Vice President (1999 – 2006), Director (2001 – present), General Counsel and Secretary (2001 – 2006), Transamerica Fund Services, Inc. (“TFS”); Vice President, AFSG Securities Corporation (2001 –present); Senior Vice President, General Counsel and Secretary, Transamerica Index Funds, Inc. (“TIF”) (2002 – 2004); and Vice President, Transamerica Investment Services, Inc. (“TISI”) (2003 – 2005) and TIM (2001 – 2005). | | 163 | | N/A |
247
Name and Age | | Position | | Term of
Office and
Length of
Time
Served* | | Principal Occupation(s) During
Past 5 Years | | Number of
Funds in
Complex
Overseen | | Other
Directorships |
| | | | | | | | | | |
INDEPENDENT BOARD MEMBERS*** | | | | | | |
| | | | | | | | | | |
Sandra N. Bane (1952) | | Board Member | | Since 2008 | | Retired, KPMG (1999 – present); and Board Member, TII (2003 – present), Transamerica Funds, TST, TIS, TPP, TPFG, TPFG II and TAAVF (March 2008 – present). | | 163 | | Big 5 Sporting Goods (2002 – present); AGL Resources, Inc. (energy services holding company) (2008 – present) |
| | | | | | | | | | |
Leo J. Hill
(1956) | | Lead Independent Board Member | | Since 2002 | | Principal, Advisor Network Solutions, LLC (business consulting) (2006 – present); Board Member, TST (2001 – present); Board Member, Transamerica Funds and TIS (2002 – present); Board Member, TPP, TPFG, TPFG II and TAAVF (2007 – present); TII (February 2008 – present); Owner and President, Prestige Automotive Group (2001 – 2005); President, L. J. Hill & Company (1999 – present); Market President, Nations Bank of Sun Coast Florida (1998 – 1999); President and Chief Executive Officer, Barnett Banks of Treasure Coast Florida (1994 – 1998); Executive Vice President and Senior Credit Officer, Barnett Banks of Jacksonville, Florida (1991 – 1994); and Senior Vice President and Senior Loan Administration Officer, Wachovia Bank of Georgia (1976 – 1991). | | 163 | | N/A |
| | | | | | | | | | |
David W. Jennings (1946) | | Board Member | | Since 2009 | | Board Member, Transamerica Funds, TST, TIS, TPP, TPFG, TPFG II and TAAVF (July 2009 – present); Board Member, TII (July 2009 – present); Principal, Maxam Capital Management, LLC (2006 – 2008); and Principal, Cobble Creek Management LP (2004 – 2006). | | 163 | | N/A |
| | | | | | | | | | |
Neal M. Jewell (1935) | | Independent Board Member | | Since 2007 | | Retired (2004 – present); Lead Independent Board Member, TPP, TPFG, TPFG II and TAAVF (1993 – present); Lead Independent Board Member, Transamerica Funds, TST and TIS (2007 – present); Lead Independent Board Member, TII (February 2008 – present); and Independent Trustee, EAI Select Managers Equity Fund (a mutual fund) (1996 – 2004). | | 163 | | N/A |
| | | | | | | | | | |
Russell A. Kimball, Jr.
(1944) | | Board Member | | 1986 – 1990 and 2002 - Present | | General Manager, Sheraton Sand Key Resort (1975 – present); Board Member, TST (1986 – present); Board Member, Transamerica Funds and TIS (2002 – present); TPP, TPFG, TPFG II and TAAVF (2007 – present); and Board Member, TII (February 2008 – present). | | 163 | | N/A |
248
Name and Age | | Position | | Term of
Office and
Length of
Time
Served* | | Principal Occupation(s) During
Past 5 Years | | Number
of Funds
in
Complex
Overseen | | Other
Directorships |
| | | | | | | | | | |
Eugene M. Mannella (1954) | | Board Member | | Since 2007 | | Chief Executive Officer, Hedge Fund Services LLC (hedge fund administration) January 2008 – present); Self-employed consultant (2006 – present); President, ARAPAHO Partners LLC (limited purpose broker-dealer) (1998 – present); Board Member, TPP, TPFG, TPFG II and TAAVF (1994 – present); Board Member, Transamerica Funds, TIS and TST (2007 – present); Board Member, TII (February 2008 – present); and President, International Fund Services (alternative asset administration) (1993 – 2005). | | 163 | | N/A |
| | | | | | | | | | |
Norm R. Nielsen (1939) | | Board Member | | Since 2006 | | Retired (2005 – present); Board Member, Transamerica Funds, TST and TIS (2006 – present); Board Member, TPP, TPFG, TPFG II and TAAVF (2007 – present); Board Member, TII (February 2008 – present); Director, Iowa City Area Development (1996 – 2004); Director, Iowa Health Systems (1994 – 2003); Director, U.S. Bank (1987 – 1988); and President, Kirkwood Community College (1979 – 2005). | | 163 | | Buena Vista University Board of Trustees (2004 - present) |
| | | | | | | | | | |
Joyce G. Norden (1939) | | Board Member | | Since 2007 | | Retired (2004 – present); Board Member, TPFG, TPFG II and TAAVF (1993 – present); Board Member, TPP (2002 – present); Board Member, Transamerica Funds, TST and TIS (2007 – present); Board Member, TII (February 2008 – present); and Vice President, Institutional Advancement, Reconstructionist Rabbinical College (1996 – 2004). | | 163 | | Board of Governors, Reconstructionist Rabbinical College (2007 - present) |
| | | | | | | | | | |
Patricia L. Sawyer (1950) | | Board Member | | Since 2007 | | President and Executive Search Consultant, Smith & Sawyer LLC (consulting) (1989 – present); Board Member, Transamerica Funds and TST (2007 – present); Board Member, TIS (2007 – present); Board Member, TII (2008 – present); and Board Member, TPP, TPFG, TPFG II and TAAVF (1993 – present). | | 163 | | N/A |
249
Name and Age | | Position | | Term of
Office and
Length of
Time
Served* | | Principal Occupation(s) During
Past 5 Years | | Number
of Funds
in
Complex
Overseen | | Other
Directorships |
| | | | | | | | | | |
John W. Waechter (1952) | | Board Member | | Since 2005 | | Attorney, Englander & Fischer, P.A. (March 2008 – present); Retired (2004 – March 2008); Board Member, TST and TIS (2004 – present); Board Member, Transamerica Funds (2005 – present); Board Member, TPP, TPFG, TPFG II and TAAVF (2007 – present); Board Member, TII (February 2008 – present); Executive Vice President, Chief Financial Officer and Chief Compliance Officer, William R. Hough & Co. (securities dealer) (1979 – 2004); and Treasurer, The Hough Group of Funds (1993 – 2004). | | 163 | | N/A |
* | Each Board Member shall hold office until: 1) his or her successor is elected and qualified or 2) he or she resigns, retires or his or her term as a Board Member is terminated in accordance with the Trust’s Declaration of Trust. |
** | May be deemed an “interested person” (as that term is defined in the 1940 Act) of the Trust because of his employment with TAM or an affiliate of TAM. |
*** | Independent Board Member means a Board Member who is not an “interested person” (as defined under the 1940 Act) of the Trust. |
OFFICERS
The mailing address of each officer is c/o Secretary of the Funds, 570 Carillon Parkway, St. Petersburg, Florida 33716. The following table shows information about the officers, including their ages, their positions held with the Trust and their principal occupations during the past five years (their titles may have varied during that period). Each officer will hold office until his or her successor has been duly elected or appointed or until his or her earlier death, resignation or removal.
Name and Age | | Position | | Term of Office and
Length of Time
Served* | | Principal Occupation(s) or
Employment During Past 5 Years |
| | | | | | |
John K. Carter
(1961) | | Chairman, Board Member, President, and Chief Executive Officer | | Since 1999 | | See the table above. |
| | | | | | |
Dennis P. Gallagher
(1970) | | Vice President, General Counsel and Secretary | | Since 2006 | | Vice President, General Counsel and Secretary, TII, Transamerica Funds, TST and TIS (2006 – present); Vice President, General Counsel and Secretary, TPP, TPFG, TPFG II and TAAVF (2007 – present); Director, Senior Vice President, General Counsel and Secretary, TAM and TFS (2006 – present); Assistant Vice President, TCI (2007 – present); and Director, Deutsche Asset Management (1998 – 2006). |
| | | | | | |
Joseph P. Carusone
(1965) | | Vice President, Treasurer and Principal Financial Officer | | Since 2007 | | Vice President, Treasurer and Principal Financial Officer, Transamerica Funds, TST, TIS and TII (2007 – present); Vice President (2007 – present), Treasurer and Principal Financial Officer (2001 – present), TPP, TPFG, TPFG II and TAAVF; Senior Vice President, TAM and TFS (2007 – present); Senior Vice President (January 2008 – present), Vice President (2001 – January 2008); Diversified Investment Advisors, Inc. (“DIA”); Director and President, Diversified Investors Securities Corp. (“DISC”) (2007 – present); Director, Transamerica Financial Life Insurance Company (“TFLIC”) (2004 – present); and Treasurer, Diversified Actuarial Services, Inc. (December 2002 – present). |
250
Name and Age | | Position | | Term of Office and
Length of Time
Served* | | Principal Occupation(s) or
Employment During Past 5 Years |
| | | | | | |
Christopher A. Staples (1970) | | Vice President and Chief Investment Officer | | Since 2005 | | Vice President and Chief Investment Officer (2007 – present); Vice President - Investment Administration (2005 – 2007), TII; Vice President and Chief Investment Officer (2007 – present), Senior Vice President - Investment Management (2006 – 2007), Vice President - Investment Management (2005 – 2006), Transamerica Funds, TST and TIS; Vice President and Chief Investment Officer, TPP, TPFG, TPFG II and TAAVF (2007 – present); Director (2005 – present), Senior Vice President – Investment Management (2006 – present) and Chief Investment Officer (2007 – present), TAM; Director, TFS (2005 – present); and Assistant Vice President, Raymond James & Associates (1999 – 2004). |
| | | | | | |
Rick B. Resnik
(1967) | | Vice President, Chief Compliance Officer and Conflicts of Interest Officer | | Since 2008 | | Chief Compliance Officer, TPP, TPFG, TPFG II and TAAVF (1998 – present); Chief Compliance Officer, Transamerica Funds, TST, TIS and TII (January 2008 – present); Vice President and Conflicts of Interest Officer, TPP, TPFG, TPFG II, TAAVF, Transamerica Funds, TST, TIS and TII (June 2008 – present); Senior Vice President and Chief Compliance Officer, TAM (January 2008 – present); Senior Vice President, TFS (January 2008 – present); Director (2000 – present), Vice President and Chief Compliance Officer (1997 – present), DISC; and Assistant Vice President, TFLIC (1999 – present). |
| | | | | | |
Robert A. DeVault Jr. (1965) | | Assistant Treasurer | | Since 2009 | | Assistant Treasurer, Transamerica Funds, TST, TII, TIS, TPP, TPFG, TPFG II and TAAVF (January 2009 – present); and Assistant Vice President, (2007 - present), Manager, Fund Administration (2002 – 2007), TFS. |
| | | | | | |
Suzanne Valerio-Montemurro
(1964) | | Assistant Treasurer | | Since 2007 | | Assistant Treasurer, Transamerica Funds, TST, TIS, TII, TPP, TPFG, TPFG II and TAAVF (2007 – present); and Vice President, DIA (1998 – present). |
| | | | | | |
Sarah Bertrand
(1967) | | Assistant Secretary | | Since 2009 | | Assistant Secretary, Transamerica Funds, TST, TIS, TPP, TPFG, TPFG II and TAAVF (January 2009 – present); Assistant Secretary, TII (January 2009 – present) Assistant Vice President and Manager, Legal Administration, TAM and TFS (2007 – present); Assistant Secretary and Chief Compliance Officer, 40|86 Series Trust and 40|86 Strategic Income Fund (2000 – 2007); and Second Vice President and Assistant Secretary, Legal and Compliance, 40|86 Capital Management, Inc. (1994 – 2007). |
251
Name and Age | | Position | | Term of Office and
Length of Time
Served* | | Principal Occupation(s) or
Employment During Past 5 Years |
| | | | | | |
Timothy J. Bresnahan (1968) | | Assistant Secretary | | Since 2009 | | Assistant Secretary, Transamerica Funds, TST, TIS, TPP, TPFG, TPFG II and TAAVF (January 2009 – present); Assistant Secretary, TII (January 2009 – present) Counsel, TAM (2008 – present); Counsel (contract), Massachusetts Financial Services, Inc. (2007); Assistant Counsel, BISYS Fund Services Ohio, Inc. (2005 – 2007); and Associate, Greenberg Traurig, P.A. (2004 – 2005). |
| | | | | | |
Richard E. Shield, Jr. (1974) | | Tax Officer | | Since 2008 | | Tax Officer, Transamerica Funds, TST, TIS, TII, TPP, TPFG, TPFG II and TAAVF (June 2008 – present); Tax Manager, Jeffrey P. McClanathan, CPA (2006 – 2007) and Gregory, Sharer & Stuart (2005 – 2006); Tax Senior, Kirkland, Russ, Murphy & Tapp, P.A. (2003 – 2005); and Certified Public Accountant, Schultz, Chaipel & Co., LLP (1998 – 2003). |
* Elected and serves at the pleasure of the Board of the Trust.
If an officer has held offices for different Funds for different periods of time, the earliest applicable date is shown. No officer of the Trust, except for the Chief Compliance Officer, receives any compensation from the Trust.
Additional information about the Fund’s Board Members can be found in the Statement of Additional Information available, without charge, upon request, by calling toll-free 1-888-233-4339 or on the Fund’s website at www.transamericafunds.com.
252
PROXY VOTING POLICIES AND PROCEDURES AND QUARTERLY PORTFOLIO HOLDINGS
(unaudited)
A description of the Transamerica Funds’ proxy voting policies and procedures is available in the Statement of Additional Information of the Portfolios, available without charge upon request by calling 1-888-233-4339 (toll free) or on the Securities and Exchange Commission’s (—SEC||) website at http://www.sec.gov.
In addition, the Portfolios are required to file Form N-PX, with their complete proxy voting records for the 12 months ended June 30th, no later than August 31st of each year. The Form is available without charge: (1) from the Portfolios, upon request by calling 1-888-233-4339; and (2) on the SEC’s website at http://www.sec.gov.
The Portfolios file their complete schedule of portfolio holdings with the SEC for the first and third quarter of each fiscal year on Form N-Q, which is available on the SEC’s website at http://www.sec.gov. The Portfolios’ Form N-Q may be reviewed and copied at the SEC’s Public Reference Room in Washington, D.C. Information on the operation of the Public Reference Room may be obtained by calling 1-800-SEC-0330.
You may also visit the Trust’s website at www.transamericafunds.com for this and other information about the Portfolios and the Trust. Important Notice Regarding Delivery of Shareholder Documents
Every year we send shareholders informative materials such as the Transamerica Funds Annual Report, the Transamerica Funds Prospectus, and other required documents that keep you informed regarding your Portfolios. Transamerica Funds will only send one piece per mailing address, a method that saves your Portfolios money by reducing mailing and printing costs. We will continue to do this unless you tell us not to. To elect to receive individual mailings, simply call a Transamerica Customer Service Representative toll free at 1-888-233-4339, 8 a.m. to 7 p.m. Eastern Time, Monday–Friday. Your request will take effect within 30 days.
253
NOTICE OF PRIVACY POLICY
Protecting your privacy is very important to us. We want you to understand what information we collect and how we use it. We collect and use “nonpublic personal information” in connection with providing our customers with a broad range of financial products and services as effectively and conveniently as possible. We treat nonpublic personal information in accordance with our Privacy Policy.
What Information We Collect and From Whom We Collect It
We may collect nonpublic personal information about you from the following sources:
· | | Information we receive from you on applications or other forms, such as your name, address, and account number; |
| | |
· | | Information about your transactions with us, our affiliates, or others, such as your account balance and purchase/redemption history; and |
| | |
· | | Information we receive from non-affiliated third parties, including consumer reporting agencies. |
What Information We Disclose and To Whom We Disclose It
We do not disclose any nonpublic personal information about current or former customers to anyone without their express consent, except as permitted by law. We may disclose the nonpublic personal information we collect, as described above, to persons or companies that perform services on our behalf and to other financial institutions with which we have joint marketing agreements. We will require these companies to protect the confidentiality of your nonpublic personal information and to use it only to perform the services for which we have hired them.
Our Security Procedures
We restrict access to your nonpublic personal information and only allow disclosures to persons and companies as permitted by law to assist in providing products or services to you. We maintain physical, electronic, and procedural safeguards to protect your nonpublic personal information and to safeguard the disposal of certain consumer information.
If you have any questions about our privacy policy, please call 1-888-233-4339 on any business day between 8 a.m. and 7 p.m. Eastern Time.
Note: This privacy policy applies only to customers that have a direct relationship with us or our affiliates. If you own shares of our funds in the name of a third party such as a bank or broker-dealer, its privacy policy may apply to you instead of ours.
254
P.O. Box 9012
Clearwater, FL 33758-9012

Customer Service 1-888-233-4339
P.O. Box 9012 · Clearwater, FL 33758-9012
Distributor: Transamerica Capital, Inc.
Item 2: Code of Ethics.
(a) Registrant has adopted a code of ethics that applies to its principal executive officer, principal financial officer, and any other officers who serve a similar function.
(b) Registrant’s code of ethics is reasonably designed as described in this Form N-CSR.
(c) During the period covered by the report, no amendments were made to the provisions of this code of ethics.
(d) During the period covered by the report, Registrant did not grant any waivers, including implicit waivers, from the provisions of this code of ethics.
(e) Not Applicable
(f) Registrant has filed this code of ethics as an exhibit pursuant to Item 12(a)(1) of Form N-CSR.
Item 3: Audit Committee Financial Experts.
Registrant’s Board of Trustees has determined that Sandra N. Bane, John W. Waechter and Eugene M. Mannella are “audit committee financial experts,” as such term is defined in Item 3 of Form N-CSR. Ms. Bane, Mr. Waechter and Mr. Mannella are “independent” under the standards set forth in Item 3 of Form N-CSR. The designation of Ms. Bane, Mr. Waechter and Mr. Mannella as “audit committee financial experts” pursuant to Item 3 of Form N-CSR does not (i) impose upon them any duties, obligations, or liabilities that are greater than the duties, obligations and liabilities imposed upon them as a member of the Registrant’s audit committee or Board of Trustees in the absence of such designation; or (ii) affect the duties, obligations or liabilities of any other member of the Registrant’s audit committee or Board of Trustees.
Item 4: Principal Accountant Fees and Services.
| | | | Fiscal Year Ended 10/31 | |
(in thousands) | | 2008 | | 2009 | |
| | | | | | | |
(a) | | Audit Fees | | 816 | | 690 | |
(b) | | Audit-related Fees | | 66 | | 22 | |
(c) | | Tax Fees | | 484 | | 408 | |
(d) | | All Other Fees | | N/A | | N/A | |
(e) (1) | | Pre-approval policy* (see below) | | | | | |
(e) (2) | | % of above that were pre-approved | | 0 | % | 0 | % |
(f) | | If greater than 50%, disclose hours | | N/A | | N/A | |
(g) | | Non-audit fees rendered to Adviser (or affiliate that provided services to Registrant) | | N/A | | N/A | |
(h) | | Disclose whether the Audit Committee has considered whether the provisions of non-audit services rendered to the Adviser that were NOT pre-approved is compatible with maintaining the auditor’s independence. | | Yes | | Yes | |
2
* (e) (1) The Audit Committee may delegate any portion of its authority, including the authority to grant pre-approvals of audit and permitted non-audit services, to one or more members or a subcommittee. Any decision of the subcommittee to grant pre-approvals shall be presented to the full Audit Committee at its next regularly scheduled meeting.
Item 5: Audit Committee of Listed Registrants.
The following individuals comprise the standing Audit Committee: Sandra N. Bane, Leo J. Hill, David W. Jennings, Neal M. Jewell, Russell A. Kimball, Jr., Eugene M. Mannella, Norman R. Nielsen, Joyce G.Norden, Patricia L. Sawyer and John W. Waechter.
Item 6: Schedule of Investments.
The schedules of investments are included in the annual report to shareholders filed under Item 1 of this Form N-CSR.
Item 7: Disclosure of Proxy Voting Policies and Procedures for Closed-End Management Investment Companies. Not applicable.
Item 8: Portfolio Managers of Closed-End Management Investment Companies. Not applicable.
Item 9. Purchases of Equity Securities by Closed-End Management Investment Company and Affiliated Purchasers. Not applicable.
Item 10: Submission of Matters to a Vote of Security Holders
There have been no material changes to the procedures by which shareholders may recommend nominees to the Registrant’s Board of Trustees that have been implemented since the Registrant last provided disclosure in response to the requirements of this Item.
Item 11: Controls and Procedures.
(a) The Registrant’s principal executive officer and principal financial officer evaluated the Registrant’s disclosure controls and procedures within 90 days of this filing and have concluded that the Registrant’s disclosure controls and procedures (as defined in Rule 30a-3(c) under the Investment Company Act of 1940) are appropriately designed to ensure that information required to be disclosed by Registrant in the reports that it files on Form N-CSR (a) is accumulated and communicated to Registrant’s management, including its principal executive officer and principal financial officer, to allow timely decisions regarding required disclosure, and (b) is recorded, processed, summarized and reported, within the time periods specified in the rules and forms adopted by the U.S. Securities and Exchange Commission.
(b) The Registrant’s principal executive officer and principal financial officer are aware of no change in the Registrant’s internal control over financial reporting that occurred during the Registrant’s most recent fiscal quarter that has materially affected, or is reasonably likely to materially affect, the Registrant’s internal control over financial reporting.
3
Item 12: Exhibits.
(a) (1) Registrant’s code of ethics (that is the subject of the disclosure required by Item 2(a)) is attached.
(2) Separate certifications for Registrant’s principal executive officer and principal financial officer, as required by Rule 30a-2(a) under the 1940 Act, are attached.
(3) Not applicable.
(b) A certification for Registrant’s principal executive officer and principal financial officer, as required by Rule 30a-2(b) under the 1940 Act, is attached. The certification furnished pursuant to this paragraph is not deemed to be “filed” for purposes of Section 18 of the Securities Act of 1934, or otherwise subject to liability of that section. Such certification is not deemed to be incorporated by reference into any filing under the Securities Act of 1933 or the Securities Exchange Act of 1934, except to the extent that the Registrant specifically incorporates it by reference
4
SIGNATURES
Pursuant to the requirements of the Securities Exchange Act of 1934 and the Investment Company Act of 1940, the Registrant has duly caused this report to be signed on its behalf by the undersigned, thereunto duly authorized.
| | Transamerica Funds |
| | (Registrant) |
| | |
| | By: | /s/ John K. Carter |
| | | John K. Carter |
| | | Chief Executive Officer |
| | | Date: December 30, 2009 |
Pursuant to the requirements of the Securities Exchange Act of 1934 and the Investment Company Act of 1940, this report has been signed below by the following persons on behalf of the Registrant and in the capacities and on the dates indicated.
| By: | /s/ John K. Carter | | |
| | John K. Carter | | |
| | Chief Executive Officer | | |
| | Date: December 30, 2009 | | |
| | | | |
| By: | /s/ Joseph P. Carusone | | |
| | Joseph P. Carusone | | |
| | Principal Financial Officer | | |
| | Date: December 30, 2009 | | |
5
EXHIBIT INDEX
Exhibit No. | | Description of Exhibit |
| | |
12(a)(1) | | Code of Ethics for Principal Executive and Senior Financial Officers |
12(a)(2)(i) | | Section 302 N-CSR Certification of Principal Executive Officer |
12(a)(2)(ii) | | Section 302 N-CSR Certification of Principal Financial Officer |
12(b) | | Section 906 N-CSR Certification of Principal Executive Officer and Principal Financial Officer |
6