As filed with the SEC on July 3, 2006.
SECURITIES AND EXCHANGE COMMISSION
WASHINGTON, D.C. 20549
FORM N-CSR
CERTIFIED SHAREHOLDER REPORT OF REGISTERED MANAGEMENT INVESTMENT COMPANIES
Investment Company Act file number: 811-4556
TRANSAMERICA IDEX MUTUAL FUNDS
(Exact Name of Registrant as Specified in Charter)
570 Carillon Parkway, St. Petersburg, Florida 33716
(Address of Principal Executive Offices) (Zip Code)
Registrant’s Telephone Number, including Area Code: (727) 299-1800
John K. Carter, Esq. P.O. Box 9012, Clearwater, Florida 33758-9771
(Name and Address of Agent for Service)
Date of fiscal year end: October 31
Date of reporting period: November 1, 2005 — April 30, 2006
Form N-CSR is to be used by management investment companies to file reports with the Commission not later than 10 days after the transmission to stockholders of any report that is required to be transmitted to stockholders under Rule 30e-1 under the Investment Company Act of 1940 (17 CFR 270.30e-1). The Commission may use the information provided on Form N-CSR in its regulatory, disclosure review, inspection, and policymaking roles.
A registrant is required to disclose the information specified by Form N-CSR, and the Commission will make this information public. A registrant is not required to respond to the collection of information contained in Form N-CSR unless the Form displays a currently valid Office of Management and Budget (“OMB”) control number. Please direct comments concerning the accuracy of the information collection burden estimate and any suggestions for reducing the burden to Secretary, Securities and Exchange Commission, 100 F Street, NE, Washington, DC 20549. The OMB has reviewed this collection of information under the clearance requirements of 44 U.S.C. §3507.
Item 1: Report(s) to Shareholders. The Semi-Annual Report is attached.

Semi-Annual Report
April 30, 2006
www.transamericaidex.com
Customer Service 1-888-233-IDEX (4339)
P.O. Box 9012 • Clearwater, FL 33758-9012
Distributor: AFSG Securities Corporation, Member NASD
Dear Fellow Shareholder,
On behalf of Transamerica IDEX Mutual Funds, I would like to thank you for your continued support and confidence in our products as we look forward to continuing to serve you and your financial advisor in the future. We value the trust you have placed in us.
This semi-annual report is provided to you with the intent of presenting a comprehensive review of the investments of each of your funds. The Securities and Exchange Commission requires that annual and semi-annual reports be sent to all shareholders, and we believe it to be an important part of the investment process. In addition to providing a comprehensive review, this report provides a discussion of accounting policies and any matters presented to shareholders that may have required their vote.
We believe it is important to recognize and understand current market conditions in order to provide a context for reading this report. During the past six months, the Federal Reserve has continued its campaign of fighting inflation by raising interest rates at each Federal Open Market Committee meeting. Oil prices have continued to exhibit significant volatility, with political tensions in Nigeria and Iran, coupled with a lack of excess capacity, adding support to higher prices. However, given these economic headwinds, the U.S. economy has been resilient and has continued its path of positive growth. For the six months ending April 30, 2006, the Dow Jones Industrial Average returned 10.24%, while the Standard & Poor's 500 Index returned 9.63%. Please keep in mind it is important to maintain a diversified portfolio as investment returns have historically been difficult to predict.
In addition to your active involvement in the investment process, we firmly believe that a financial advisor is a key resource to help you build a comprehensive picture of your current and future financial needs. Financial advisors are familiar with the market's history, including long-term returns and volatility of various asset classes.
With your financial advisor, you can develop an investment program that incorporates factors such as your goals, your investment timeline, and your risk tolerance.
Please contact your financial advisor if you have any questions about this report, and thanks again for the confidence you have placed in us.
Sincerely,
| Brian C. Scott President Transamerica IDEX Mutual Funds | Christopher Staples Senior Vice President – Investment Management Transamerica IDEX Mutual Funds | ||||||
TA IDEX American Century International
UNDERSTANDING YOUR FUND'S EXPENSES
(unaudited)
SHAREHOLDER EXPENSES
Fund shareholders may incur two types of costs: (1) transaction costs, including sales charges (loads) on purchases, contingent deferred sales charges on redemptions and redemption fees; and (2) ongoing costs, including management fees, 12b-1 distribution and service fees, and other fund expenses.
The following Example is intended to help you understand your ongoing costs (in dollars and cents) of investing in the Fund and to compare these costs with the ongoing costs of investing in other funds.
The Example is based on an investment of $1,000 invested at November 1, 2005 and held for the entire period until April 30, 2006.
ACTUAL EXPENSES
The first line in the table below provides information about actual account values and actual expenses. You may use the information in this line, together with the amount you invested, to estimate the expenses that you paid over the period. Simply divide your account value by $1,000 (for example, an $8,600 account value divided by $1,000 = 8.6), then multiply the result by the number in the first line of your Fund under the heading entitled "Expenses Paid During Period" to estimate the expenses you paid on your account during this period. If your account is an IRA, your expenses could have included a $15 annual fee. The amount of any fee paid through your account would increase the estimate of expenses you paid during the period and decrease your ending account value.
HYPOTHETICAL EXAMPLE FOR COMPARISON PURPOSES
The second line in the table below provides information about hypothetical account values and hypothetical expenses based on the Fund's actual expense ratio and an assumed rate of return of 5% per year before expenses, which is not the Fund's actual return. The hypothetical account values and expenses may not be used to estimate the actual ending account balance or expenses you paid for the period. You may use this information to compare the ongoing costs of investing in your Fund and other funds. To do so, compare this 5% hypothetical example with the 5% hypothetical examples that appear in the shareholder reports of the other funds. As in the case of the actual expense example, if your account is subject to an IRA fee, the amount of the fee paid through your account would increase the hypothetical expenses you would have paid during the period and decrease the hypothetical ending account value.
Please note that the expenses shown in the table are meant to highlight your ongoing costs only and do not reflect any transactional costs, such as sales charges, redemption fees, brokerage commissions paid on purchases and sales of fund shares. Therefore, the second line under the Fund in the table is useful in comparing ongoing costs only, and will not help you determine the relative total costs of owning different funds. If any of these transaction costs were included, your costs would be higher. The expenses shown in the table do not reflect any fees that may be charged to you by brokers, financial intermediaries or other financial institutions.
| Beginning Account Value | Ending Account Value | Annualized Expense Ratio | Expenses Paid During Period (a) | ||||||||||||||||
| Class A | |||||||||||||||||||
| Actual | $ | 1,000.00 | $ | 1,220.40 | 1.58 | % | $ | 8.70 | |||||||||||
| Hypothetical (b) | 1,000.00 | 1,016.96 | 1.58 | 7.90 | |||||||||||||||
| Class B | |||||||||||||||||||
| Actual | 1,000.00 | 1,218.00 | 2.00 | 11.00 | |||||||||||||||
| Hypothetical (b) | 1,000.00 | 1,014.88 | 2.00 | 9.99 | |||||||||||||||
| Class C | |||||||||||||||||||
| Actual | 1,000.00 | 1,217.60 | 2.00 | 11.00 | |||||||||||||||
| Hypothetical (b) | 1,000.00 | 1,014.93 | 2.00 | 9.99 | |||||||||||||||
(a) Expenses are calculated using the Fund's annualized expense ratio (as disclosed in the table), multiplied by the average account value for the period, multiplied by number of days in the period (181 days), and divided by the number of days in the year (365 days).
(b) 5% return per year before expenses.
GRAPHICAL PRESENTATION OF SCHEDULE OF INVESTMENTS
By Region
At April 30, 2006
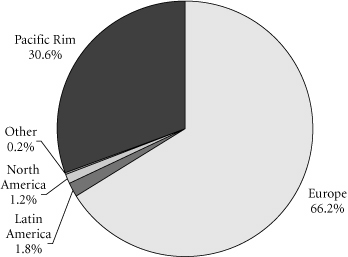
This chart shows the percentage breakdown by region of the Fund's total investment securities.
Transamerica IDEX Mutual Funds
Semi-Annual Report 2006
1
TA IDEX American Century International
SCHEDULE OF INVESTMENTS
At April 30, 2006
(all amounts except share amounts in thousands)
(unaudited)
| Shares | Value | ||||||||||
| COMMON STOCKS ( 98.3%) | |||||||||||
| Australia (3.2%) | |||||||||||
| BHP Billiton, Ltd. | 29,904 | $ | 665 | ||||||||
| CSL, Ltd. | 374 | 16 | |||||||||
| National Australia Bank, Ltd. | 12,840 | 366 | |||||||||
| Rio Tinto, Ltd. | 4,170 | 249 | |||||||||
| Austria (0.8%) | |||||||||||
| Erste Bank der Oesterreichischen Sparkassen AG | 5,412 | 328 | |||||||||
| Belgium (1.4%) | |||||||||||
| KBC Groupe (a) | 4,670 | 541 | |||||||||
| Bermuda (0.2%) | |||||||||||
| Li & Fung, Ltd. | 34,000 | 81 | |||||||||
| Canada (0.6%) | |||||||||||
| Suncor Energy, Inc. | 2,870 | 245 | |||||||||
| China (0.4%) | |||||||||||
| China Construction Bank–Class H ‡§ | 349,217 | 151 | |||||||||
| France (15.4%) | |||||||||||
| Accor SA | 6,640 | 417 | |||||||||
| Alstom ‡ | 4,870 | 440 | |||||||||
| AXA ‡ | 14,262 | 523 | |||||||||
| Cie Generale D'Optique Essilor International SA | 4,090 | 410 | |||||||||
| Groupe Danone | 3,890 | 485 | |||||||||
| Pernod-Ricard | 1,820 | 352 | |||||||||
| PPR SA | 2,610 | 338 | |||||||||
| Sanofi-Aventis | 3,730 | 351 | |||||||||
| Schneider Electric SA | 4,040 | 457 | |||||||||
| Societe Generale–Class A | 3,437 | 524 | |||||||||
| Total SA | 3,650 | 1,008 | |||||||||
| Veolia Environnement | 8,280 | 494 | |||||||||
| Vinci SA | 4,026 | 399 | |||||||||
| Germany (7.7%) | |||||||||||
| Adidas-Salomon AG | 1,460 | 308 | |||||||||
| Bayerische Motoren Werke AG | 5,170 | 281 | |||||||||
| Continental AG | 5,270 | 626 | |||||||||
| Deutsche Boerse AG | 710 | 103 | |||||||||
| Fresenius Medical Care AG | 3,538 | 424 | |||||||||
| Hypo Real Estate Holding | 5,860 | 409 | |||||||||
| SAP AG | 2,490 | 543 | |||||||||
| Siemens AG | 4,240 | 401 | |||||||||
| Greece (3.2%) | |||||||||||
| Hellenic Telecommunications Organization SA ‡ | 16,250 | 363 | |||||||||
| Shares | Value | ||||||||||
| Greece (continued) | |||||||||||
| National Bank of Greece SA | 11,090 | $ | 549 | ||||||||
| OPAP SA | 10,074 | 372 | |||||||||
| Hong Kong (0.4%) | |||||||||||
| China Mobile Hong Kong, Ltd. | 27,500 | 160 | |||||||||
| Ireland (2.5%) | |||||||||||
| Anglo Irish Bank Corp. PLC | 18,730 | 307 | |||||||||
| Bank of Ireland | 19,120 | 359 | |||||||||
| Ryanair Holdings PLC, ADR ‡† | 6,920 | 326 | |||||||||
| Italy (4.2%) | |||||||||||
| Banco Popolare di Verona e Novara SCRL | 16,040 | 451 | |||||||||
| ENI-Ente Nazionale Idrocarburi SpA | 13,030 | 398 | |||||||||
| Luxottica Group SpA | 16,820 | 500 | |||||||||
| Saipem SpA | 14,080 | 352 | |||||||||
| Japan (24.7%) | |||||||||||
| Bank of Yokohama, Ltd. (The) | 42,000 | 328 | |||||||||
| East Japan Railway Co. | 50 | 389 | |||||||||
| Eisai Co., Ltd. | 6,000 | 274 | |||||||||
| Hoya Corp. | 11,800 | 476 | |||||||||
| JTEKT Corp. | 9,400 | 202 | |||||||||
| Keyence Corp. | 1,300 | 340 | |||||||||
| Komatsu, Ltd. | 14,000 | 298 | |||||||||
| Leopalace21 Corp. | 7,000 | 272 | |||||||||
| Matsushita Electric Industrial Co., Ltd. | 26,000 | 626 | |||||||||
| Matsushita Electric Works, Ltd. | 20,000 | 242 | |||||||||
| Mitsubishi Electric Corp. | 20,000 | 174 | |||||||||
| Mitsubishi Tokyo Financial Group, Inc. | 40 | 627 | |||||||||
| Murata Manufacturing Co., Ltd. | 2,500 | 181 | |||||||||
| NGK Insulators, Ltd. | 8,000 | 114 | |||||||||
| Nikko Cordial Corp. | 15,500 | 250 | |||||||||
| Nitto Denko Corp. | 3,200 | 268 | |||||||||
| ORIX Corp. (a) | 2,380 | 713 | |||||||||
| Sega Sammy Holdings, Inc. | 10,300 | 409 | |||||||||
| Sekisui Chemical Co., Ltd. | 23,000 | 198 | |||||||||
| Shin-Etsu Chemical Co., Ltd. | 7,100 | 409 | |||||||||
| Sumitomo Heavy Industries, Ltd. | 30,000 | 315 | |||||||||
| Sumitomo Mitsui Financial Group, Inc. | 30 | 328 | |||||||||
| Sumitomo Realty & Development Co., Ltd. | 11,000 | 291 | |||||||||
| Taisei Corp. | 70,000 | 312 | |||||||||
| Toray Industries, Inc. | 45,000 | 420 | |||||||||
| Toyota Motor Corp. | 12,000 | 700 | |||||||||
| Yamada Denki Co., Ltd. | 4,900 | 532 | |||||||||
| Yamato Transport Co., Ltd. | 11,000 | 219 | |||||||||
| Mexico (1.8%) | |||||||||||
| America Movil SA de CV–Class L, ADR | 14,721 | 543 | |||||||||
| Cemex SA de CV, Sponsored ADR | 2,680 | 181 | |||||||||
The notes to the financial statements are an integral part of this report.
Transamerica IDEX Mutual Funds
Semi-Annual Report 2006
2
TA IDEX American Century International
SCHEDULE OF INVESTMENTS (continued)
At April 30, 2006
(all amounts except share amounts in thousands)
(unaudited)
| Shares | Value | ||||||||||
| Netherlands (2.9%) | |||||||||||
| ASML Holding NV ‡ | 15,060 | $ | 319 | ||||||||
| ING Groep NV | 8,354 | 339 | |||||||||
| Royal Numico NV ‡ | 11,510 | 521 | |||||||||
| Norway (2.5%) | |||||||||||
| Aker Kvaerner ASA | 4,902 | 476 | |||||||||
| Statoil ASA | 3,120 | 103 | |||||||||
| Telenor ASA | 37,700 | 436 | |||||||||
| Singapore (0.5%) | |||||||||||
| Keppel Corp., Ltd. | 22,000 | 213 | |||||||||
| South Korea (1.1%) | |||||||||||
| Samsung Electronics Co., Ltd. | 670 | 457 | |||||||||
| Spain (1.9%) | |||||||||||
| Cintra Concesiones de Infraestructuras de Transporte SA | 18,141 | 246 | |||||||||
| Grupo Ferrovial SA | 1,259 | 103 | |||||||||
| Inditex SA | 10,130 | 412 | |||||||||
| Sweden (1.1%) | |||||||||||
| Atlas Copco AB–Class A | 8,510 | 251 | |||||||||
| ForeningsSparbanken AB | 6,400 | 175 | |||||||||
| Switzerland (9.6%) | |||||||||||
| ABB, Ltd. ‡ | 33,980 | 484 | |||||||||
| Adecco SA | 4,420 | 273 | |||||||||
| Compagnie Financiere Richemont AG–Class A | 8,960 | 463 | |||||||||
| Lonza Group AG | 4,420 | 313 | |||||||||
| Novartis AG | 15,060 | 862 | |||||||||
| Roche Holding AG–Genusschein | 6,167 | 946 | |||||||||
| UBS AG | 4,316 | 510 | |||||||||
| United Kingdom (12.2%) | |||||||||||
| Amvescap PLC | 20,560 | 224 | |||||||||
| BG Group PLC | 43,910 | 588 | |||||||||
| BP PLC | 48,621 | 598 | |||||||||
| British American Tobacco PLC | 19,220 | 490 | |||||||||
| Carphone Warehouse Group PLC | 14,120 | 86 | |||||||||
| GlaxoSmithKline PLC | 34,950 | 988 | |||||||||
| Man Group PLC | 13,970 | 642 | |||||||||
| Marks & Spencer Group PLC | 20,080 | 214 | |||||||||
| Reckitt Benckiser PLC | 16,653 | 605 | |||||||||
| Standard Chartered PLC | 17,410 | 461 | |||||||||
| Total Common Stocks (cost: $31,410) | 39,501 | ||||||||||
| Principal | Value | ||||||||||
| SECURITY LENDING COLLATERAL ( 0.9%) | |||||||||||
| Debt (0.8%) | |||||||||||
| Bank Notes (0.1%) | |||||||||||
| Bank of America 4.81%, due 06/07/2006 * | $ | 11 | $ | 11 | |||||||
| 4.81%, due 08/10/2006 * | 11 | 11 | |||||||||
| Bear Stearns & Co. 5.01%, due 06/06/2006 * | 4 | 4 | |||||||||
| 5.01%, due 09/07/2006 * | 13 | 13 | |||||||||
| Certificates of Deposit (0.1%) | |||||||||||
| Halifax Bank of Scotland 4.78%, due 06/06/2006 * | 11 | 11 | |||||||||
| Rabobank Nederland 4.87%, due 05/31/2006 * | 11 | 11 | |||||||||
| Commercial Paper (0.1%) | |||||||||||
| Banco Santander Central Hispano SA 4.77%, due 05/02/2006 | 6 | 6 | |||||||||
| Sheffield Receivables Corp.–144A 4.81%, due 05/03/2006 | 11 | 11 | |||||||||
| Euro Dollar Overnight (0.1%) | |||||||||||
| Bank of Montreal 4.77%, due 05/02/2006 | 9 | 9 | |||||||||
| Dexia Group 4.78%, due 05/04/2006 | 11 | 11 | |||||||||
| Fortis Bank 4.77%, due 05/01/2006 | 4 | 4 | |||||||||
| Royal Bank of Canada 4.77%, due 05/01/2006 | 14 | 14 | |||||||||
| Royal Bank of Scotland 4.75%, due 05/03/2006 | 11 | 11 | |||||||||
| Svenska Handlesbanken 4.82%, due 05/01/2006 | 8 | 8 | |||||||||
| Euro Dollar Terms (0.2%) | |||||||||||
| BancoBilbao Vizcaya Argentaria SA 4.95%, due 06/20/2006 | 9 | 9 | |||||||||
| Bank of the West 4.94%, due 06/16/2006 | 9 | 9 | |||||||||
| Barclays 4.79%, due 05/10/2006 | 13 | 13 | |||||||||
| 4.77%, due 05/16/2006 | 4 | 4 | |||||||||
| Canadian Imperial Bank of Commerce 4.97%, due 06/23/2006 | 6 | 6 | |||||||||
| Credit Suisse First Boston Corp. 4.73%, due 05/08/2006 | 6 | 6 | |||||||||
| Fortis Bank 4.83%, due 05/08/2006 | 4 | 4 | |||||||||
The notes to the financial statements are an integral part of this report.
Transamerica IDEX Mutual Funds
Semi-Annual Report 2006
3
TA IDEX American Century International
SCHEDULE OF INVESTMENTS (continued)
At April 30, 2006
(all amounts except share amounts in thousands)
(unaudited)
| Principal | Value | ||||||||||
| Euro Dollar Terms (continued) | |||||||||||
| Lloyds TSB Bank 4.81%, due 05/11/2006 | $ | 6 | $ | 6 | |||||||
| Royal Bank of Scotland 4.87%, due 05/12/2006 | 9 | 9 | |||||||||
| Societe Generale 4.79%, due 05/10/2006 | 11 | 11 | |||||||||
| UBS AG 4.95%, due 06/20/2006 | 11 | 11 | |||||||||
| Repurchase Agreements (0.2%) †† | |||||||||||
| Credit Suisse First Boston Corp. 4.92%, dated 04/28/2006 to be repurchased at $15 on 05/01/2006 | 15 | 15 | |||||||||
| Goldman Sachs Group, Inc. (The) 4.92%, dated 04/28/2006 to be repurchased at $32 on 05/01/2006 | 31 | 31 | |||||||||
| Principal | Value | ||||||||||
| Repurchase Agreements (continued) | |||||||||||
| Lehman Brothers, Inc. 4.92%, dated 04/28/2006 to be repurchased at $1 on 05/01/2006 | $ | 1 | $ | 1 | |||||||
| Merrill Lynch & Co. 4.87%, dated 04/28/2006 to be repurchased at $32 on 05/01/2006 | 32 | 32 | |||||||||
| Morgan Stanley Dean Witter & Co. 4.93%, dated 04/28/2006 to be repurchased at $15 on 05/01/2006 | 15 | 15 | |||||||||
| Shares | Value | ||||||||||
| Investment Companies (0.1%) | |||||||||||
| Barclays Global Investors Institutional Money Market Fund 1-day yield of 4.78% | 17,185 | $ | 17 | ||||||||
| Merrimac Cash Fund, Premium Class 1-day yield of 4.61% @ | 4,572 | 5 | |||||||||
| Total Security Lending Collateral (cost: $339) | 339 | ||||||||||
| Total Investment Securities (cost: $31,749) # | $ | 39,840 | |||||||||
NOTES TO SCHEDULE OF INVESTMENTS:
(a) Passive Foreign Investment Company.
§ Security is deemed to be illiquid.
‡ Non-income producing.
† At April 30, 2006, all or a portion of this security is on loan (see Note 1). The value at April 30, 2006, of all securities on loan is $330.
* Floating or variable rate note. Rate is listed as of April 30, 2006.
†† Cash collateral for the Repurchase Agreements, valued at $97, that serve as collateral for securities lending are invested in corporate bonds with interest rates and maturity dates ranging from 0.00%–9.05% and 05/02/2006–12/31/2049, respectively.
@ Regulated investment company advised by Investors Bank and Trust Co. ("IBT"). IBT is also the accounting, custody and lending agent for the Fund.
# Aggregate cost for Federal income tax purposes is $32,283. Aggregate gross unrealized appreciation for all securities in which there is an excess of value over tax cost and aggregate gross unrealized depreciation for all securities in which there is an excess of tax cost over value were $7,595 and $38, respectively. Net unrealized appreciation for tax purposes is $7,557.
DEFINITIONS:
144A 144A Securities are registered pursuant to Rule 144A of the Securities Act of 1933. These securities are deemed to be liquid for purposes of compliance limitations on holdings of illiquid securities and may be resold as transactions exempt from registration, normally to qualified institutional buyers. At April 30, 2006, these securities aggregated $11 or 0.0% of the net assets of the Fund.
ADR American Depositary Receipt
SCRL Società Cooperativa a Responsabilità Limitata (Limited Liability Co-operative)
The notes to the financial statements are an integral part of this report.
Transamerica IDEX Mutual Funds
Semi-Annual Report 2006
4
TA IDEX American Century International
SCHEDULE OF INVESTMENTS (continued)
At April 30, 2006
(all amounts except share amounts in thousands)
(unaudited)
| Percentage of Net Assets | Value | ||||||||||
| INVESTMENTS BY INDUSTRY: | |||||||||||
| Commercial Banks | 16.2 | % | $ | 6,518 | |||||||
| Pharmaceuticals | 8.6 | % | 3,437 | ||||||||
| Petroleum Refining | 4.9 | % | 1,953 | ||||||||
| Industrial Machinery & Equipment | 4.4 | % | 1,762 | ||||||||
| Instruments & Related Products | 4.3 | % | 1,726 | ||||||||
| Chemicals & Allied Products | 4.0 | % | 1,595 | ||||||||
| Telecommunications | 4.0 | % | 1,589 | ||||||||
| Oil & Gas Extraction | 3.3 | % | 1,337 | ||||||||
| Food & Kindred Products | 2.5 | % | 1,005 | ||||||||
| Automotive | 2.4 | % | 981 | ||||||||
| Construction | 2.4 | % | 979 | ||||||||
| Rubber & Misc. Plastic Products | 2.3 | % | 934 | ||||||||
| Metal Mining | 2.3 | % | 914 | ||||||||
| Life Insurance | 2.1 | % | 862 | ||||||||
| Holding & Other Investment Offices | 2.1 | % | 854 | ||||||||
| Engineering & Management Services | 2.0 | % | 796 | ||||||||
| Electronic Components & Accessories | 2.0 | % | 788 | ||||||||
| Business Credit Institutions | 1.8 | % | 713 | ||||||||
| Business Services | 1.7 | % | 674 | ||||||||
| Communications Equipment | 1.6 | % | 626 | ||||||||
| Real Estate | 1.4 | % | 563 | ||||||||
| Department Stores | 1.4 | % | 552 | ||||||||
| Computer & Data Processing Services | 1.4 | % | 543 | ||||||||
| Radio, Television & Computer Stores | 1.3 | % | 532 | ||||||||
| Radio & Television Broadcasting | 1.2 | % | 494 | ||||||||
| Tobacco Products | 1.2 | % | 490 | ||||||||
| Security & Commodity Brokers | 1.2 | % | 474 | ||||||||
| Retail Trade | 1.2 | % | 463 | ||||||||
| Electronic & Other Electric Equipment | 1.1 | % | 457 | ||||||||
| Medical Instruments & Supplies | 1.1 | % | 424 | ||||||||
| Textile Mill Products | 1.0 | % | 420 | ||||||||
| Hotels & Other Lodging Places | 1.0 | % | 417 | ||||||||
| Apparel & Accessory Stores | 1.0 | % | 412 | ||||||||
| Manufacturing Industries | 1.0 | % | 409 | ||||||||
| Railroads | 1.0 | % | 389 | ||||||||
| Amusement & Recreation Services | 0.9 | % | 372 | ||||||||
| Beverages | 0.9 | % | 352 | ||||||||
| Air Transportation | 0.8 | % | 326 | ||||||||
| Public Administration | 0.6 | % | 246 | ||||||||
| Lumber & Other Building Materials | 0.6 | % | 242 | ||||||||
| Trucking & Warehousing | 0.5 | % | 219 | ||||||||
| Motor Vehicles, Parts & Supplies | 0.5 | % | 202 | ||||||||
| Residential Building Construction | 0.5 | % | 198 | ||||||||
| Stone, Clay & Glass Products | 0.4 | % | 181 | ||||||||
| Transportation Equipment | 0.2 | % | 81 | ||||||||
| Investment securities, at value | 98.3 | % | 39,501 | ||||||||
| Short-term investments | 0.9 | % | 339 | ||||||||
| Total investment securities | 99.2 | % | $ | 39,840 | |||||||
The notes to the financial statements are an integral part of this report.
Transamerica IDEX Mutual Funds
Semi-Annual Report 2006
5
TA IDEX American Century International
STATEMENT OF ASSETS AND LIABILITIES
At April 30, 2006
(all amounts except per share amounts in thousands)
(unaudited)
| Assets: | |||||||
| Investment securities, at value (cost: $31,749) (including securities loaned of $330) | $ | 39,840 | |||||
| Cash | 306 | ||||||
| Foreign currency (cost: $102) | 101 | ||||||
| Receivables: | |||||||
| Investment securities sold | 1,314 | ||||||
| Interest | 1 | ||||||
| Dividends | 92 | ||||||
| Dividend reclaims receivable | 140 | ||||||
| Other | 8 | ||||||
| 41,802 | |||||||
| Liabilities: | |||||||
| Investment securities purchased | 966 | ||||||
| Accounts payable and accrued liabilities: | |||||||
| Shares of beneficial interest redeemed | 229 | ||||||
| Management and advisory fees | 34 | ||||||
| Transfer agent fees | 27 | ||||||
| Administration fees | 1 | ||||||
| Payable for collateral for securities on loan | 339 | ||||||
| Unrealized depreciation on forward foreign currency contracts | 8 | ||||||
| Other | 28 | ||||||
| 1,632 | |||||||
| Net Assets | $ | 40,170 | |||||
| Net Assets Consist of: | |||||||
| Shares of beneficial interest, unlimited shares authorized, no par value | $ | 23,913 | |||||
| Distributable net investment income (loss) | (1,020 | ) | |||||
| Accumulated net realized gain (loss) from investment securities and foreign currency transactions | 9,185 | ||||||
| Net unrealized appreciation (depreciation) on: Investment securities | 8,091 | ||||||
| Translation of assets and liabilities denominated in foreign currencies | 1 | ||||||
| Net Assets | $ | 40,170 | |||||
| Net Assets by Class: | |||||||
| Class A | $ | 13,507 | |||||
| Class B | 18,969 | ||||||
| Class C | 7,694 | ||||||
| Shares Outstanding: | |||||||
| Class A | 1,701 | ||||||
| Class B | 2,570 | ||||||
| Class C | 1,055 | ||||||
| Net Asset Value Per Share: | |||||||
| Class A | $ | 7.94 | |||||
| Class B | 7.38 | ||||||
| Class C | 7.29 | ||||||
| Maximum Offering Price Per Share (a): | |||||||
| Class A | $ | 8.40 | |||||
(a) Includes the maximum selling commission (represented as a percentage of offering price) which is reduced on certain levels of sales as set forth in the Prospectus. Net asset value per share for Classes B and C shares represents offering price. The redemption price for Classes B and C shares equals net asset value less any applicable contingent deferred sales charge.
STATEMENT OF OPERATIONS
For the period ended April 30, 2006 (b)
(all amounts in thousands)
(unaudited)
| Investment Income: | |||||||
| Dividends (net of withholding taxes on foreign dividends of $21) | $ | 420 | |||||
| Interest | 8 | ||||||
| Income from loaned securities–net | 1 | ||||||
| 429 | |||||||
| Expenses: | |||||||
| Management and advisory fees | 255 | ||||||
| Distribution and service fees: | |||||||
| Class A | 24 | ||||||
| Class B | 68 | ||||||
| Class C | 28 | ||||||
| Transfer agent fees: | |||||||
| Class A | 37 | ||||||
| Class B | 49 | ||||||
| Class C | 15 | ||||||
| Class I | – | (c) | |||||
| Printing and shareholder reports | 15 | ||||||
| Custody fees | 63 | ||||||
| Administration fees | 6 | ||||||
| Legal fees | 2 | ||||||
| Audit fees | 9 | ||||||
| Trustees fees | 1 | ||||||
| Registration fees | 3 | ||||||
| Other | 2 | ||||||
| Total expenses | 577 | ||||||
| Less: | |||||||
| Reimbursement of class expenses: | |||||||
| Class A | (33 | ) | |||||
| Class B | (48 | ) | |||||
| Class C | (16 | ) | |||||
| Total reimbursed expenses | (97 | ) | |||||
| Net expenses | 480 | ||||||
| Net Investment Income (Loss) | (51 | ) | |||||
| Net Realized Gain (Loss) from: | |||||||
| Investment securities | 14,245 | ||||||
| Foreign currency transactions | (387 | ) | |||||
| 13,858 | |||||||
| Net Increase (Decrease) in Unrealized Appreciation (Depreciation) on: | |||||||
| Investment securities | (2,100 | ) | |||||
| Translation of assets and liabilities denominated in foreign currencies | 8 | ||||||
| (2,092 | ) | ||||||
| Net Realized and Unrealized Gain (Loss) on Investment Securities and Foreign Currency Transactions | 11,766 | ||||||
| Net Increase (Decrease) in Net Assets Resulting from Operations | $ | 11,715 | |||||
(b) Class I was offered for investment on November 15, 2005.
(c) Rounds to less than $1.
The notes to the financial statements are an integral part of this report.
Transamerica IDEX Mutual Funds
Semi-Annual Report 2006
6
TA IDEX American Century International
STATEMENTS OF CHANGES IN NET ASSETS
For the period or year ended
(all amounts in thousands)
| April 30, 2006 (unaudited) (a) | October 31, 2005 | ||||||||||
| Increase (Decrease) In Net Assets From: | |||||||||||
| Operations: | |||||||||||
| Net investment income (loss) | $ | (51 | ) | $ | 420 | ||||||
| Net realized gain (loss) from investment securities and foreign currency transactions | 13,858 | 39,110 | |||||||||
| Change in unrealized appreciation (depreciation) on investment securities and foreign currency translation | (2,092 | ) | (11,474 | ) | |||||||
| 11,715 | 28,056 | ||||||||||
| Distributions to Shareholders: | |||||||||||
| From net investment income: | |||||||||||
| Class A | (106 | ) | (1,352 | ) | |||||||
| Class B | (155 | ) | (3 | ) | |||||||
| Class C | (64 | ) | (52 | ) | |||||||
| Class I | (189 | ) | – | ||||||||
| (514 | ) | (1,407 | ) | ||||||||
| From net realized gains: | |||||||||||
| Class A | (4,776 | ) | – | ||||||||
| Class B | (7,874 | ) | – | ||||||||
| Class C | (3,241 | ) | – | ||||||||
| Class I | (8,013 | ) | – | ||||||||
| (23,904 | ) | – | |||||||||
| Capital Share Transactions: | |||||||||||
| Proceeds from shares sold: | |||||||||||
| Class A | 426 | 6,712 | |||||||||
| Class B | 355 | 3,382 | |||||||||
| Class C | 303 | 1,825 | |||||||||
| Class I | 54,442 | – | |||||||||
| 55,526 | 11,919 | ||||||||||
| Dividends and distributions reinvested: | |||||||||||
| Class A | 4,834 | 1,350 | |||||||||
| Class B | 7,686 | 3 | |||||||||
| Class C | 3,056 | 50 | |||||||||
| Class I | 8,202 | – | |||||||||
| 23,778 | 1,403 | ||||||||||
| Cost of shares redeemed: | |||||||||||
| Class A | (57,650 | ) | (150,811 | ) | |||||||
| Class B | (6,040 | ) | (5,137 | ) | |||||||
| Class C | (2,748 | ) | (3,488 | ) | |||||||
| Class I | (57,455 | ) | – | ||||||||
| (123,893 | ) | (159,436 | ) | ||||||||
(a) Class I was offered for investment on November 15, 2005.
| April 30, 2006 (unaudited) (a) | October 31, 2005 | ||||||||||
| Automatic conversions: | |||||||||||
| Class A | $ | 88 | $ | 160 | |||||||
| Class B | (88 | ) | (160 | ) | |||||||
| – | – | ||||||||||
| (44,589 | ) | (146,114 | ) | ||||||||
| Net increase (decrease) in net assets | (57,292 | ) | (119,465 | ) | |||||||
| Net Assets: | |||||||||||
| Beginning of period | 97,462 | 216,927 | |||||||||
| End of period | $ | 40,170 | $ | 97,462 | |||||||
| Distributable Net Investment Income (Loss) | $ | (1,020 | ) | $ | (455 | ) | |||||
| Share Activity: | |||||||||||
| Shares issued: | |||||||||||
| Class A | 55 | 692 | |||||||||
| Class B | 46 | 366 | |||||||||
| Class C | 43 | 200 | |||||||||
| Class I | 5,373 | – | |||||||||
| 5,517 | 1,258 | ||||||||||
| Shares issued–reinvested from distributions: | |||||||||||
| Class A | 699 | 143 | |||||||||
| Class B | 1,195 | – | |||||||||
| Class C | 481 | 6 | |||||||||
| Class I | 1,189 | – | |||||||||
| 3,564 | 149 | ||||||||||
| Shares redeemed: | |||||||||||
| Class A | (5,780 | ) | (15,422 | ) | |||||||
| Class B | (849 | ) | (555 | ) | |||||||
| Class C | (384 | ) | (383 | ) | |||||||
| Class I | (6,562 | ) | – | ||||||||
| (13,575 | ) | (16,360 | ) | ||||||||
| Automatic conversions: | |||||||||||
| Class A | 11 | 16 | |||||||||
| Class B | (12 | ) | (17 | ) | |||||||
| (1 | ) | (1 | ) | ||||||||
| Net increase (decrease) in shares outstanding: | |||||||||||
| Class A | (5,015 | ) | (14,571 | ) | |||||||
| Class B | 380 | (206 | ) | ||||||||
| Class C | 140 | (177 | ) | ||||||||
| (4,495 | ) | (14,954 | ) | ||||||||
The notes to the financial statements are an integral part of this report.
Transamerica IDEX Mutual Funds
Semi-Annual Report 2006
7
TA IDEX American Century International
FINANCIAL HIGHLIGHTS
(unaudited for the period ended April 30, 2006)
| For a share of beneficial interest outstanding throughout each period | |||||||||||||||||||||||||||||||||||||||
| Net Asset | Investment Operations | Distributions | Net Asset | ||||||||||||||||||||||||||||||||||||
| For the Period Ended (d)(g) | Value, Beginning of Period | Net Investment Income (Loss) | Net Realized and Unrealized Gain (Loss) | Total Operations | From Net Investment Income | From Net Realized Gains | Total Distributions | Value, End of Period | |||||||||||||||||||||||||||||||
| Class A | 4/30/2006 | $ | 10.07 | $ | – | (h) | $ | 1.66 | $ | 1.66 | $ | (0.08 | ) | $ | (3.71 | ) | $ | (3.79 | ) | $ | 7.94 | ||||||||||||||||||
| 10/31/2005 | 8.81 | 0.03 | 1.30 | 1.33 | (0.07 | ) | – | (0.07 | ) | 10.07 | |||||||||||||||||||||||||||||
| 10/31/2004 | 8.03 | – | (h) | 0.80 | 0.80 | (0.02 | ) | – | (0.02 | ) | 8.81 | ||||||||||||||||||||||||||||
| 10/31/2003 | 7.00 | 0.02 | 1.01 | 1.03 | – | – | – | 8.03 | |||||||||||||||||||||||||||||||
| 10/31/2002 | 8.38 | 0.01 | (1.39 | ) | (1.38 | ) | – | – | – | 7.00 | |||||||||||||||||||||||||||||
| 10/31/2001 | 12.76 | 0.05 | (3.05 | ) | (3.00 | ) | – | (1.38 | ) | (1.38 | ) | 8.38 | |||||||||||||||||||||||||||
| Class B | 4/30/2006 | 9.62 | (0.02 | ) | 1.56 | 1.54 | (0.07 | ) | (3.71 | ) | (3.78 | ) | 7.38 | ||||||||||||||||||||||||||
| 10/31/2005 | 8.41 | – | (h) | 1.21 | 1.21 | – | (h) | – | – | 9.62 | |||||||||||||||||||||||||||||
| 10/31/2004 | 7.70 | (0.04 | ) | 0.77 | 0.73 | (0.02 | ) | – | (0.02 | ) | 8.41 | ||||||||||||||||||||||||||||
| 10/31/2003 | 6.76 | (0.03 | ) | 0.97 | 0.94 | – | – | – | 7.70 | ||||||||||||||||||||||||||||||
| 10/31/2002 | 8.15 | (0.04 | ) | (1.35 | ) | (1.39 | ) | – | – | – | 6.76 | ||||||||||||||||||||||||||||
| 10/31/2001 | 12.53 | (0.02 | ) | (2.98 | ) | (3.00 | ) | – | (1.38 | ) | (1.38 | ) | 8.15 | ||||||||||||||||||||||||||
| Class C | 4/30/2006 | 9.55 | (0.02 | ) | 1.54 | 1.52 | (0.07 | ) | (3.71 | ) | (3.78 | ) | 7.29 | ||||||||||||||||||||||||||
| 10/31/2005 | 8.40 | – | (h) | 1.20 | 1.20 | (0.05 | ) | – | (0.05 | ) | 9.55 | ||||||||||||||||||||||||||||
| 10/31/2004 | 7.70 | (0.09 | ) | 0.81 | 0.72 | (0.02 | ) | – | (0.02 | ) | 8.40 | ||||||||||||||||||||||||||||
| 10/31/2003 | 6.73 | (0.03 | ) | 1.00 | 0.97 | – | – | – | 7.70 | ||||||||||||||||||||||||||||||
| Ratios/Supplemental Data | |||||||||||||||||||||||||||||||
| For the Period | Total | Net Assets, End of Period | Ratio of Expenses to Average Net Assets (a) | Net Investment Income (Loss) to Average | Portfolio Turnover | ||||||||||||||||||||||||||
| Ended (g) | Return (c) | (000's) | Net (e) | Total (f) | Net Assets (a) | Rate (b) | |||||||||||||||||||||||||
| Class A | 4/30/2006 | 22.04 | % | $ | 13,507 | 1.58 | % | 1.95 | % | (0.02 | )% | 49 | % | ||||||||||||||||||
| 10/31/2005 | 15.17 | 67,656 | 1.56 | 1.56 | 0.36 | 82 | |||||||||||||||||||||||||
| 10/31/2004 | 9.95 | 187,608 | 1.59 | 1.59 | (0.05 | ) | 159 | ||||||||||||||||||||||||
| 10/31/2003 | 14.71 | 152,086 | 1.78 | 2.39 | 0.23 | 220 | |||||||||||||||||||||||||
| 10/31/2002 | (16.49 | ) | 14,921 | 1.87 | 3.68 | 0.22 | 241 | ||||||||||||||||||||||||
| 10/31/2001 | (26.43 | ) | 5,209 | 1.55 | 2.77 | 0.47 | 129 | ||||||||||||||||||||||||
| Class B | 4/30/2006 | 21.80 | 18,969 | 2.00 | 2.48 | (0.53 | ) | 49 | |||||||||||||||||||||||
| 10/31/2005 | 14.41 | 21,069 | 2.34 | 2.72 | (0.01 | ) | 82 | ||||||||||||||||||||||||
| 10/31/2004 | 9.46 | 20,153 | 2.09 | 2.09 | (0.46 | ) | 159 | ||||||||||||||||||||||||
| 10/31/2003 | 13.91 | 21,421 | 2.44 | 3.05 | (0.42 | ) | 220 | ||||||||||||||||||||||||
| 10/31/2002 | (17.09 | ) | 5,328 | 2.52 | 4.33 | (0.43 | ) | 241 | |||||||||||||||||||||||
| 10/31/2001 | (26.96 | ) | 5,003 | 2.20 | 3.42 | (0.18 | ) | 129 | |||||||||||||||||||||||
| Class C | 4/30/2006 | 21.76 | 7,694 | 2.00 | 2.37 | (0.52 | ) | 49 | |||||||||||||||||||||||
| 10/31/2005 | 14.36 | 8,737 | 2.34 | 2.70 | (0.01 | ) | 82 | ||||||||||||||||||||||||
| 10/31/2004 | 9.33 | 9,166 | 2.40 | 2.49 | (1.07 | ) | 159 | ||||||||||||||||||||||||
| 10/31/2003 | 14.41 | 568 | 2.44 | 3.04 | (0.42 | ) | 220 | ||||||||||||||||||||||||
The notes to the financial statements are an integral part of this report.
Transamerica IDEX Mutual Funds
Semi-Annual Report 2006
8
TA IDEX American Century International
FINANCIAL HIGHLIGHTS (continued)
(unaudited)
NOTES TO FINANCIAL HIGHLIGHTS
(a) Annualized.
(b) Not annualized.
(c) Total Return has been calculated for the applicable period without deduction of a sales load, if any, on an initial purchase. Not annualized.
(d) Per share information is calculated based on average number of shares outstanding.
(e) Ratio of Net Expenses to Average Net Assets is net of fee waivers and reimbursements by the investment adviser, if any (see note 2.)
(f) Ratio of Total Expenses to Average Net Assets includes all expenses before fee waivers and reimbursements by the investment adviser.
(g) The inception date for the Fund's offering of share Class C was November 11, 2002.
(h) Rounds to less than $0.01 per share.
The notes to the financial statements are an integral part of this report.
Transamerica IDEX Mutual Funds
Semi-Annual Report 2006
9
TA IDEX American Century International
NOTES TO FINANCIAL STATEMENTS
At April 30, 2006
(all amounts in thousands)
(unaudited)
NOTE 1. ORGANIZATION AND SIGNIFICANT ACCOUNTING POLICIES
Transamerica IDEX Mutual Funds is an open-end management investment company registered under the Investment Company Act of 1940, as amended (the "1940 Act").
In the normal course of business, TA IDEX American Century International (the "Fund") enters into contracts that contain a variety of representations that provide general indemnifications. The Fund's maximum exposure under these arrangements is unknown, as this would involve future claims that may be made against the Fund and/or its affiliates that have not yet occurred. However, based on experience, the Fund expects the risk of loss to be remote.
This report should be read in conjunction with the current Fund prospectus, which contains more complete information about the Fund.
In preparing the Fund's financial statements in accordance with accounting principles generally accepted in the United States of America ("GAAP"), estimates or assumptions (which could differ from actual results) may be used that affect reported amounts and disclosures. The following is a summary of significant accounting policies followed by the Fund.
Multiple class operations, income and expenses: The Fund currently has four classes of shares, Class A, Class B, Class C and Class I, each with different expense levels. Currently all share classes are closed to new investors. Class I commenced operations on November 15, 2005. Class I is only available for investment to certain affiliated asset allocation funds. Class I is currently uninvested. Class B shares will convert to Class A shares eight years after purchase. Income, non-class specific expenses and realized and unrealized gains and losses, are allocated daily to each class, based upon the value of shares outstanding method as permitted under Rule 18f-3 of the 1940 Act. Each class bears its own specific expenses as well as a portion of general, common expenses.
Security valuations: The Fund values its investments at the close of the New York Stock Exchange ("NYSE"), normally 4 p.m. ET, each day the NYSE is open for business. Fund investments are valued at the last sale price or closing price on the day of valuation taken from the primary exchange where the security is principally traded.
Securities traded in the over-the-counter market and listed securities for which no sale was reported on that date are valued at the last quoted bid price.
Debt securities are valued based on a price quotation or other equivalent indication of value supplied by an exchange, a pricing service or a major market maker; however, those that mature in sixty days or less are valued at amortized cost, which approximates market.
Investment company securities are valued at the net asset value of the underlying portfolio.
Foreign securities generally are valued based on quotations from the primary market in which they are traded. Because many foreign securities markets and exchanges close prior to the close of the NYSE, closing prices for foreign securities in those markets or on those exchanges do not reflect the events that occur after that close. If a significant market event impacting the value of a portfolio security (e.g., natural disaster, company announcement, market volatility) occurs subsequent to the close of trading in the security, but prior to the calculation of the Fund's net asset value per share, market quotations for that security may be determined to be unreliable and, accordingly, not "readily available." As a result, foreign equity securities held by the Fund may be valued at fair market value as determined in good faith by the Fund's Administrative Valuation Committee, under the supervision of the Board's Valuation Committee , using guidelines adopted by the Board of Trustees.
Other securities for which quotations are not readily available or whose values have been determined to be unreliable are valued at fair market value as determined in good faith by the Fund's Administrative Valuation Committee, under the supervision of the Board's Valuation Committee, using guidelines adopted by the Board of Trustees.
Cash: The Fund may leave cash overnight in its cash account with the custodian, Investors Bank & Trust Company ("IBT"). IBT has been contracted on behalf of the Fund to invest the excess cash into a savings account, which at April 30, 2006, was paying an interest rate of 3.24%.
Repurchase agreements: The Fund is authorized to enter into repurchase agreements. The Fund, through its custodian, IBT, receives delivery of the underlying securities, the value of which at the time of purchase is required to be an amount equal to at least 100% of the resale price. The Fund will bear the risk of value fluctuations until the security can be sold and may encounter delays and incur costs in liquidating the security. In the event of bankruptcy or insolvency of the seller, delays and costs may be incurred.
Securities lending: The Fund may lend securities to qualified borrowers, with IBT acting as the Fund's lending agent. The Fund earns negotiated lenders' fees. The Fund receives cash and/or securities as collateral against the loaned securities. Cash collateral received is invested in short term, interest bearing securities. The Fund monitors the market value of securities loaned on a daily basis and requires collateral in an amount at least equal to the value of the securities loaned. Income from loaned securities on the Statement of Operations is net of fees, in the amount of $1, earned by IBT for its services.
Security transactions and investment income: Security transactions are recorded on the trade date. Security gains and losses are calculated on the specific identification basis. Dividend income, if any, is recorded on
Transamerica IDEX Mutual Funds
Semi-Annual Report 2006
10
TA IDEX American Century International
NOTES TO FINANCIAL STATEMENTS (continued)
At April 30, 2006
(all amounts in thousands)
(unaudited)
NOTE 1.–(continued)
the ex-dividend date or, in the case of foreign securities, as soon as the Fund is informed of the ex-dividend date. Interest income, including accretion of discounts and amortization of premiums, is recorded on the accrual basis commencing on the settlement date.
Foreign currency denominated investments: The accounting records of the Fund are maintained in U.S. dollars. Securities and other assets and liabilities denominated in foreign currencies are translated into U.S. dollars at the closing exchange rate each day. The cost of foreign securities is translated at the exchange rate in effect when the investment was acquired. The Fund combines fluctuations from currency exchange rates and fluctuations in value when computing net realized and unrealized gains or losses from investments.
Net foreign currency gains and losses resulting from changes in exchange rates include: 1) foreign currency fluctuations between trade date and settlement date of investment security transactions; 2) gains and losses on forward foreign currency contracts; and 3) the difference between the receivable amounts of interest and dividends recorded in the accounting records in U.S. dollars and the amounts actually received.
Foreign currency denominated assets may involve risks not typically associated with domestic transactions. These risks include revaluation of currencies, adverse fluctuations in foreign currency values and possible adverse political, social and economic developments, including those particular to a specific industry, country or region.
Redemption fees: A short-term trading redemption fee may be assessed on any Fund shares in a fund account that are sold during the first five (5) NYSE trading days following their purchase date. This redemption fee will equal 2% of the amount redeemed and shares held the longest will be treated as being redeemed first and shares held the shortest as being redeemed last. For the six months ended April 30, 2006, the Fund received less than $1 in redemption fees.
Dividend distributions: Distributions to shareholders are recorded on the ex-dividend date and are determined in accordance with Federal income tax regulations which may differ from GAAP.
NOTE 2. RELATED PARTY TRANSACTIONS
Transamerica Fund Advisors, Inc. ("TFAI") is the Fund's investment adviser. Transamerica Fund Services, Inc. ("TFS") is the Fund's administrator and transfer agent. AFSG Securities Corp. ("AFSG") is the Fund's distributor/principal underwriter. TFAI, TFS, and AFSG are affiliates of AEGON, NV, a Netherlands corporation.
Certain officers and trustees of the Fund are also officers and/or directors of TFAI, TFS and AFSG.
Investment advisory fees: The Fund pays management fees to TFAI based on average daily net assets ("ANA") at the following breakpoints:
0.925% of the first $250 million of ANA
0.90% of the next $250 million of ANA
0.85% of the next $500 million of ANA
0.80% of ANA over $1 billion*
* The ANA will be determined on a combined basis with the same named fund managed by the sub-adviser for AEGON/Transamerica Series Trust.
TFAI has contractually agreed to waive its advisory fee and will reimburse the Fund to the extent that operating expenses, excluding 12b-1 fees, exceed the following stated annual limit:
1.32% Expense Limit
If total Fund expenses fall below the annual expense limitation agreement agreed to by the adviser within the succeeding three years, the Fund may be required to pay the adviser a portion or all of the waived advisory fees.
| Advisory Fee Waived | Available for Recapture Through | ||||||||||
| Fiscal Year 2003 | $ | 473 | 10/31/2006 | ||||||||
If total Fund expenses fall below the annual expense limitation agreement agreed to by the adviser within the succeeding three years, the Fund may be required to pay the adviser a portion or all of the reimbursed class expenses.
| Reimbursement of Class Expenses | Available for Recapture Through | ||||||||||
| Fiscal Year 2005: | |||||||||||
| Class B | $ | 83 | 10/31/2008 | ||||||||
| Class C | 33 | 10/31/2008 | |||||||||
| Fiscal Year 2004: | |||||||||||
| Class C | 3 | 10/31/2007 | |||||||||
Distribution and service fees: The Fund has a 12b-1 distribution plan under the 1940 Act pursuant to which an annual fee, based on average daily net assets, is paid to the distributor for various disbursements such as broker-dealer account servicing fees and other promotional expenses of the Fund. The Fund is authorized under the 12b-1 plan to pay fees on each class up to the following limits:
| Class A | 0.35 | % | |||||
| Class B | 1.00 | % | |||||
| Class C | 1.00 | % | |||||
| Class I | N/A | ||||||
From February 28, 2006 through March 1, 2007, the Fund will not pay 12b-1 fees under these plans.
Transamerica IDEX Mutual Funds
Semi-Annual Report 2006
11
TA IDEX American Century International
NOTES TO FINANCIAL STATEMENTS (continued)
At April 30, 2006
(all amounts in thousands)
(unaudited)
NOTE 2.–(continued)
Underwriter commissions relate to front-end sales charges imposed for Class A shares and contingent deferred sales charges from Classes B, C, and certain A share redemptions. For the six months ended April 30, 2006, the underwriter commissions were as follows:
| Received by Underwriter | $ | 9 | |||||
| Retained by Underwriter | 2 | ||||||
| Contingent Deferred Sales Charge | 2 | ||||||
Administrative services: The Fund has entered into an agreement with TFS for financial and legal fund administration services. The Fund pays TFS an annual fee of 0.02% of ANA. The Legal fees on the Statement of Operations are fees paid to external legal counsel.
Transfer agent fees: The Fund pays TFS an annual per-account charge for each open and closed account. The Fund paid TFS $94 for the six months ended April 30, 2006.
Deferred compensation plan: Each eligible independent Fund Trustee may elect to participate in a non-qualified deferred compensation plan maintained by Transamerica IDEX Mutual Funds (the "Plan"). Under the Plan, such Trustees may defer payment of all or a portion of their total fees earned as a Fund Trustee. Each Trustee who is a participant in the Plan may elect that the earnings, losses or gains credited to his or her deferred fee amounts be determined based on a deemed investment in any series of Transamerica IDEX Mutual Funds, including the Fund. The right of a participant to receive a distribution from the Plan of the deferred fees is an unsecured claim against the general assets of all series of Transamerica IDEX Mutual Funds. The pro rata liability to the Fund of all deferred fees in the Plan amounted, as of April 30, 2006, to $7.
Brokerage commissions: Brokerage commissions incurred on security transactions placed with an affiliate of the adviser for the six months ended April 30, 2006 were $3.
NOTE 3. INVESTMENT TRANSACTIONS
The cost of securities purchased and proceeds from securities sold (excluding short-term securities) for the six months ended April 30, 2006 were as follows:
| Purchases of securities: | |||||||
| Long-Term | $ | 28,221 | |||||
| U.S. Government | – | ||||||
| Proceeds from maturities and sales of securities: | |||||||
| Long-Term | 96,975 | ||||||
| U.S. Government | – | ||||||
NOTE 4. FEDERAL INCOME TAX MATTERS
The Fund has not made any provision for federal income or excise taxes due to its policy to distribute all of its taxable income and capital gains to its shareholders and otherwise qualify as a regulated investment company under Subchapter M of the Internal Revenue Code. Income and capital gain distributions are determined in accordance with income tax regulations, which may differ from GAAP. These differences are primarily due to differing treatment for items including, but not limited to, wash sales, foreign currency transactions, passive foreign investment companies and capital loss carryforwards.
The capital loss carryforwards are available to offset future realized capital gains through the periods listed:
| Capital Loss Carryforwards | Available through | ||||||
| $ | 1,287 | October 31, 2009 | |||||
| 3,177 | October 31, 2010 | ||||||
NOTE 5. REGULATORY PROCEEDINGS
There continues to be significant federal and state regulatory activity relating to financial services companies, particularly mutual fund companies and their investment advisers. As part of an ongoing investigation regarding potential market timing, recordkeeping and trading compliance issues and matters affecting the Fund's investment adviser, TFAI, and certain affiliates and former employees of TFAI, the SEC staff has indicated that it is likely to take some action against TFAI and certain of its affiliates at the conclusion of the investigation. The potential timing and the scope of any such action is difficult to predict. Although the impact of any action brought against TFAI and/or its affiliates is difficult to assess at the present time, the Fund currently believes that the likelihood that any such action will have a material adverse impact on it is remote. It is important to note that the Fund is not aware of any allega tion of wrongdoing against it and its Board at the time this semi-annual report is printed. Although it is not anticipated that these developments will have an adverse impact on the Fund, there can be no assurance at this time. TFAI and its affiliates are actively working with the SEC in regard to this matter; however, the exact resolution cannot be determined at this time. TFAI will take such actions that it deems necessary or appropriate to continue providing management services to the Fund and to bring all matters to an appropriate conclusion.
TFAI and/or its affiliates, and not the Fund, will bear the costs regarding these regulatory matters.
Transamerica IDEX Mutual Funds
Semi-Annual Report 2006
12
TA IDEX American Century International
INVESTMENT ADVISORY AND SUB-ADVISORY AGREEMENTS – REVIEW AND RENEWAL (unaudited)
At a meeting of the Board of Trustees of Transamerica IDEX Mutual Funds ("TA IDEX") held on November 2, 2005, the Board reviewed and considered the Investment Advisory Agreement between TA IDEX American Century International (the "Fund") and Transamerica Fund Advisors, Inc. ("TFAI"), as well as the Investment Sub-Advisory Agreement of the Fund between TFAI and American Century Investment Management, Inc. (the "Sub-Adviser"), to determine whether the agreements should be renewed for a one-year period. Following their review and consideration, the Trustees determined that the Investment Advisory Agreement and the Investment Sub-Advisory Agreement will enable shareholders of the Fund to obtain high quality services at a cost that is appropriate, reasonable, and in the best interests of its shareholders. The Board, including the independent members of the Board, unanimously approved the renewal of the Investment Advisory Agreement a nd the Investment Sub-Advisory Agreement. In reaching their decision, the Trustees requested and obtained from TFAI and the Sub-Adviser such information as they deemed reasonably necessary to evaluate the proposed agreements. The Trustees also carefully considered the information that they had received throughout the year from TFAI and the Sub-Adviser (such as in-person presentations by the Sub-Adviser) as part of their regular oversight of the Fund, as well as: comparative fee, expense and performance information prepared by Lipper Inc. ("Lipper"), independent providers of mutual fund performance, fee and expense information, and profitability data. In considering the proposed continuation of the Investment Advisory Agreement and Investment Sub-Advisory Agreement, the Trustees evaluated a number of considerations that they believed, in light of the legal advice furnished to them by TA IDEX counsel and independent legal counsel and their own business judgment, to be relevant. They based their decisions on th e following considerations, among others, although they did not identify any consideration or particular information that was controlling of their decisions:
The nature, extent and quality of the advisory service to be provided. The Board considered the nature and quality of the services provided by TFAI and the Sub-Adviser to the Fund in the past, as well as the services anticipated to be provided in the future. The Board concluded that TFAI and the Sub-Adviser are capable of providing high quality services to the Fund, as indicated by the nature and quality of services provided in the past, TFAI's and the Sub-Adviser's management capabilities demonstrated with respect to the funds they manage, including the Fund, and the experience, capability and integrity of TFAI's senior management, the financial resources of TFAI and the Sub-Adviser, TFAI's management oversight process, and the professional qualifications and experience of the Sub-Adviser's portfolio management team. The Trustees also concluded that TFAI and the Sub-Adviser proposed to provide investment and related services that were of the same quality and quantity as services provided to the Fund in the past, and that these services are appropriate in scope and extent in light of the Fund's operations, the competitive landscape of the investment company business and investor needs, and that TFAI's and the Sub-Adviser's obligations will remain substantially the same.
The investment performance of the Fund. The Board examined both the short-term and longer-term performance of the Fund, including relative performance against a benchmark securities index and a peer group of comparable mutual funds as prepared by Lipper for various trailing periods ended June 30, 2005. The Board expressed concerns about the Fund's performance compared to its peers, although the Board noted that the Fund's recent performance had improved. The Board also noted that a new portfolio manager had assumed management responsibilities with respect to the Fund, and decided to closely monitor the Fund's performance at upcoming meetings to gauge the ability of the new portfolio manager to continue to improve performance. On the basis of the Trustees' assessment of the nature, extent and quality of advisory services to be provided or procured by T FAI and the Sub-Adviser, the Trustees concluded that TFAI and the Sub-Adviser are capable of generating a level of investment performance that is appropriate in light of the Fund's investment objective, policies and strategies and competitive with many other investment companies, and also determined that TFAI's and the Sub-Adviser's performance records indicate that their continued management is likely to benefit the Fund and its shareholders.
The cost of advisory services provided and the level of profitability. The Board reviewed profitability information regarding TFAI's costs of procuring portfolio management services, as well as the costs of provision of administration, transfer agency, fund accounting and other services, to the Fund and to TA IDEX as a whole by TFAI and its affiliates. The Trustees reviewed data from Lipper that compared the Fund's management fees (including management fees at various asset levels), other fees and expenses (including total expenses including and excluding 12b-1 distribution and service fees) and portfolio turnover rate against peer groups of comparable mutual funds. Based on such information, the Trustees determined that the management fees and overall expense ratio of the Fund generally are consistent with industry averages. In addition, on the basis of the Board's review of the management fees to be charged by TFAI for investment advisory and related services, TFAI profitability information (derived from TFAI's audited financial statements), TFAI's estimated management income resulting from its management of the Fund, the estimated margin of the Sub-Adviser, as well as the entirety of TFAI's and its affiliates' service relationship with TA IDEX, the Board concluded that the level of investment management fees and other service fees, as well as TFAI's and the Sub-Adviser's profitability, are appropriate in light of the services provided,
Transamerica IDEX Mutual Funds
Semi-Annual Report 2006
13
TA IDEX American Century International (continued)
the management fees and overall expense ratios of comparable investment companies and the anticipated profitability of the relationship between the Fund, TFAI and its affiliates, and the Sub-Adviser.
Whether fee levels reflect economies of scale and the extent to which economies of scale would be realized as the Fund grows. The Board concluded that the inclusion of asset-based breakpoints in the Fund's advisory fee schedule appropriately benefits investors by realizing economies of scale in the form of lower management fees as the level of assets grows. The Board noted that the Fund is closed to new investors and will be closed to new investments in the near future, except that the Fund may continue selling shares to other TA IDEX funds and other investment companies in the same group of investment companies as TA IDEX, which may limit, to an extent, the ability of the Fund to realize economies of scale. In addition, the Board assessed the current asset levels of the Fund and the long-term development strategy for the Fund, including continued inv estments by the TA IDEX asset allocation funds, and concluded that the Fund's current management fees appropriately reflect the Fund's current size, the current economic environment for TFAI, the competitive nature of the investment company market, and TFAI's pricing strategy. The Trustees also concluded that they will have the opportunity to periodically reexamine whether the Fund has achieved economies of scale, and the appropriateness of management fees payable to TFAI and fees payable by TFAI to the Sub-Adviser, in the future.
Benefits (such as soft dollars) to TFAI, its affiliates, or the Sub-Adviser from their relationship with the Fund. The Board concluded that other benefits derived by TFAI, its affiliates, and the Sub-Adviser from their relationship with the Fund are reasonable and fair, and are consistent with industry practice and the best interests of the Fund and its shareholders. In this regard, the Board noted that TFAI does not realize "soft dollar" benefits from its relationship with the Fund, and that the Sub-Adviser's "soft-dollar" arrangements are consistent with applicable law and "best execution" requirements. In addition, the Trustees determined that the administration, transfer agency, fund accounting and other fees paid by the Fund to affiliates of TFAI are reasonable, fair and in the best interests of shareholders in light of the nature and quality of the services provided, the associated costs to these affiliates of providing the services, the impact of the costs of such services on the Fund's overall operating expenses, and the necessity of the services for the Fund's operations.
Other considerations. The Board also determined that TFAI had made a substantial commitment to the recruitment and retention of high quality personnel, and maintained the financial, compliance and operational resources reasonably necessary to manage the Fund in a professional manner that is consistent with the best interests of the Fund and its shareholders. In this regard, the Trustees favorably considered the procedures and policies in place by TFAI to enforce compliance with applicable laws and regulations and oversee the portfolio management activities of the Sub-Adviser. The Trustees also determined that TFAI had made a significant entrepreneurial commitment to the management and success of the Fund, reflected by TFAI's expense limitation and fee waiver arrangement with the Fund, which may result in TFAI waiving advisory fees for the benefit of s hareholders.
Transamerica IDEX Mutual Funds
Semi-Annual Report 2006
14
TA IDEX American Century Large Company Value
UNDERSTANDING YOUR FUND'S EXPENSES
(unaudited)
SHAREHOLDER EXPENSES
Fund shareholders may incur two types of costs: (1) transaction costs, including sales charges (loads) on purchases, contingent deferred sales charges on redemptions and redemption fees; and (2) ongoing costs, including management fees, 12b-1 distribution and service fees, and other fund expenses.
The following Example is intended to help you understand your ongoing costs (in dollars and cents) of investing in the Fund and to compare these costs with the ongoing costs of investing in other funds.
The Example is based on an investment of $1,000 invested at November 1, 2005 and held for the entire period until April 30, 2006.
ACTUAL EXPENSES
The first line in the table below provides information about actual account values and actual expenses. You may use the information in this line, together with the amount you invested, to estimate the expenses that you paid over the period. Simply divide your account value by $1,000 (for example, an $8,600 account value divided by $1,000 = 8.6), then multiply the result by the number in the first line of your Fund under the heading entitled "Expenses Paid During Period" to estimate the expenses you paid on your account during this period. If your account is an IRA, your expenses could have included a $15 annual fee. The amount of any fee paid through your account would increase the estimate of expenses you paid during the period and decrease your ending account value.
HYPOTHETICAL EXAMPLE FOR COMPARISON PURPOSES
The second line in the table below provides information about hypothetical account values and hypothetical expenses based on the Fund's actual expense ratio and an assumed rate of return of 5% per year before expenses, which is not the Fund's actual return. The hypothetical account values and expenses may not be used to estimate the actual ending account balance or expenses you paid for the period. You may use this information to compare the ongoing costs of investing in your Fund and other funds. To do so, compare this 5% hypothetical example with the 5% hypothetical examples that appear in the shareholder reports of the other funds. As in the case of the actual expense example, if your account is subject to an IRA fee, the amount of the fee paid through your account would increase the hypothetical expenses you would have paid during the period and decrease the hypothetical ending account value.
Please note that the expenses shown in the table are meant to highlight your ongoing costs only and do not reflect any transactional costs, such as sales charges, redemption fees, brokerage commissions paid on purchases and sales of fund shares. Therefore, the second line under the Fund in the table is useful in comparing ongoing costs only, and will not help you determine the relative total costs of owning different funds. If any of these transaction costs were included, your costs would be higher. The expenses shown in the table do not reflect any fees that may be charged to you by brokers, financial intermediaries or other financial institutions.
| Beginning Account Value | Ending Account Value | Annualized Expense Ratio | Expenses Paid During Period (a) | ||||||||||||||||
| Class A | |||||||||||||||||||
| Actual | $ | 1,000.00 | $ | 1,094.30 | 1.31 | % | $ | 6.80 | |||||||||||
| Hypothetical (b) | 1,000.00 | 1,018.30 | 1.31 | 6.56 | |||||||||||||||
| Class B | |||||||||||||||||||
| Actual | 1,000.00 | 1,092.00 | 1.97 | 10.22 | |||||||||||||||
| Hypothetical (b) | 1,000.00 | 1,015.03 | 1.97 | 9.84 | |||||||||||||||
| Class C | |||||||||||||||||||
| Actual | 1,000.00 | 1,092.40 | 1.91 | 9.91 | |||||||||||||||
| Hypothetical (b) | 1,000.00 | 1,015.32 | 1.91 | 9.54 | |||||||||||||||
| Class I | |||||||||||||||||||
| Actual | 1,000.00 | 1,079.00 | 0.90 | 4.25 | |||||||||||||||
| Hypothetical (b) | 1,000.00 | 1,018.65 | 0.90 | 4.13 | |||||||||||||||
(a) Expenses are calculated using the Fund's annualized expense ratio (as disclosed in the table), multiplied by the average account value for the period, multiplied by number of days in the period (181 days for Classes A, B and C and 166 days for Class I), and divided by the number of days in the year (365 days).
(b) 5% return per year before expenses.
GRAPHICAL PRESENTATION OF SCHEDULE OF INVESTMENTS
By Sector
At April 30, 2006
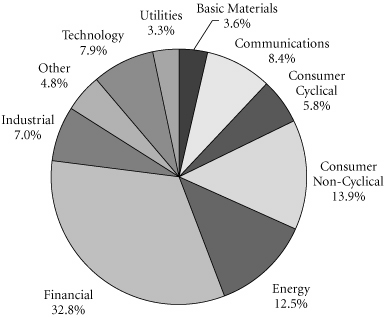
This chart shows the percentage breakdown by sector of the Fund's total investment securities.
Transamerica IDEX Mutual Funds
Semi-Annual Report 2006
1
TA IDEX American Century Large Company Value
SCHEDULE OF INVESTMENTS
At April 30, 2006
(all amounts except share amounts in thousands)
(unaudited)
| Shares | Value | ||||||||||
| COMMON STOCKS (98.0%) | |||||||||||
| Aerospace (0.7%) | |||||||||||
| Northrop Grumman Corp. | 29,000 | $ | 1,940 | ||||||||
| Apparel & Accessory Stores (0.5%) | |||||||||||
| Gap (The), Inc. | 81,600 | 1,476 | |||||||||
| Apparel Products (1.4%) | |||||||||||
| Liz Claiborne, Inc. | 48,200 | 1,882 | |||||||||
| V.F. Corp. | 30,700 | 1,879 | |||||||||
| Automotive (0.2%) | |||||||||||
| Lear Corp. † | 26,400 | 623 | |||||||||
| Beverages (1.8%) | |||||||||||
| Coca-Cola Co. (The) | 59,500 | 2,497 | |||||||||
| Pepsi Bottling Group, Inc. | 74,500 | 2,391 | |||||||||
| Business Credit Institutions (2.9%) | |||||||||||
| Freddie Mac | 131,200 | 8,011 | |||||||||
| Chemicals & Allied Products (2.0%) | |||||||||||
| du Pont (E.I.) de Nemours & Co. | 52,500 | 2,315 | |||||||||
| PPG Industries, Inc. | 48,600 | 3,262 | |||||||||
| Commercial Banks (18.9%) | |||||||||||
| Bank of America Corp. | 196,000 | 9,784 | |||||||||
| Bank of New York Co., Inc. (The) | 76,200 | 2,678 | |||||||||
| Citigroup, Inc. | 261,800 | 13,077 | |||||||||
| JP Morgan Chase & Co. | 159,700 | 7,247 | |||||||||
| National City Corp. | 36,500 | 1,347 | |||||||||
| PNC Financial Services Group, Inc. | 28,400 | 2,030 | |||||||||
| US Bancorp | 127,200 | 3,999 | |||||||||
| Wachovia Corp. | 84,200 | 5,039 | |||||||||
| Wells Fargo & Co. | 91,700 | 6,299 | |||||||||
| Communications Equipment (0.3%) | |||||||||||
| Avaya, Inc. ‡ | 57,800 | 694 | |||||||||
| Computer & Data Processing Services (3.5%) | |||||||||||
| Computer Sciences Corp. ‡ | 27,600 | 1,616 | |||||||||
| Fiserv, Inc. ‡ | 42,200 | 1,902 | |||||||||
| Microsoft Corp. | 175,000 | 4,226 | |||||||||
| Oracle Corp. ‡ | 127,700 | 1,863 | |||||||||
| Computer & Office Equipment (3.1%) | |||||||||||
| Hewlett-Packard Co. | 139,500 | 4,530 | |||||||||
| International Business Machines Corp. | 47,400 | 3,903 | |||||||||
| Electric Services (1.2%) | |||||||||||
| PPL Corp. | 108,800 | 3,160 | |||||||||
| Electric, Gas & Sanitary Services (2.9%) | |||||||||||
| Exelon Corp. | 78,500 | 4,239 | |||||||||
| NiSource, Inc. | 80,200 | 1,693 | |||||||||
| Shares | Value | ||||||||||
| Electric, Gas & Sanitary Services (continued) | |||||||||||
| Waste Management, Inc. | 52,500 | $ | 1,967 | ||||||||
| Electronic & Other Electric Equipment (1.2%) | |||||||||||
| General Electric Co. | 97,600 | 3,376 | |||||||||
| Electronic Components & Accessories (1.8%) | |||||||||||
| Intel Corp. | 101,700 | 2,032 | |||||||||
| Tyco International, Ltd. | 111,300 | 2,933 | |||||||||
| Fabricated Metal Products (0.7%) | |||||||||||
| Parker Hannifin Corp. | 23,500 | 1,905 | |||||||||
| Finance (1.5%) | |||||||||||
| SPDR Trust Series 1 † | 30,600 | 4,018 | |||||||||
| Food & Kindred Products (3.8%) | |||||||||||
| Altria Group, Inc. | 53,300 | 3,899 | |||||||||
| HJ Heinz Co. | 53,600 | 2,225 | |||||||||
| Sara Lee Corp. | 81,800 | 1,462 | |||||||||
| Unilever NV–NY Shares | 36,500 | 2,628 | |||||||||
| Food Stores (1.0%) | |||||||||||
| Kroger Co. †‡ | 128,200 | 2,597 | |||||||||
| Health Services (0.5%) | |||||||||||
| HCA, Inc. | 29,600 | 1,299 | |||||||||
| Industrial Machinery & Equipment (2.6%) | |||||||||||
| Deere & Co. | 29,600 | 2,598 | |||||||||
| Dover Corp. | 39,200 | 1,950 | |||||||||
| Ingersoll-Rand Co.–Class A | 59,200 | 2,590 | |||||||||
| Instruments & Related Products (0.7%) | |||||||||||
| Xerox Corp. †‡ | 133,800 | 1,879 | |||||||||
| Insurance (4.3%) | |||||||||||
| Allstate Corp. (The) | 64,700 | 3,655 | |||||||||
| American International Group, Inc. | 62,200 | 4,059 | |||||||||
| Loews Corp. | 22,300 | 2,367 | |||||||||
| MGIC Investment Corp. | 21,600 | 1,527 | |||||||||
| Insurance Agents, Brokers & Service (1.9%) | |||||||||||
| Hartford Financial Services Group, Inc. (The) | 38,700 | 3,558 | |||||||||
| Marsh & McLennan Cos., Inc. | 52,500 | 1,610 | |||||||||
| Life Insurance (0.8%) | |||||||||||
| Torchmark Corp. | 37,600 | 2,260 | |||||||||
| Lumber & Other Building Materials (0.4%) | |||||||||||
| Home Depot, Inc. (The) | 28,500 | 1,138 | |||||||||
| Lumber & Wood Products (1.1%) | |||||||||||
| Weyerhaeuser Co. | 43,500 | 3,065 | |||||||||
| Motion Pictures (1.7%) | |||||||||||
| Time Warner, Inc. | 257,900 | 4,487 | |||||||||
The notes to the financial statements are an integral part of this report.
Transamerica IDEX Mutual Funds
Semi-Annual Report 2006
2
TA IDEX American Century Large Company Value
SCHEDULE OF INVESTMENTS (continued)
At April 30, 2006
(all amounts except share amounts in thousands)
(unaudited)
| Shares | Value | ||||||||||
| Oil & Gas Extraction (3.3%) | |||||||||||
| Anadarko Petroleum Corp. | 7,300 | $ | 765 | ||||||||
| Devon Energy Corp. | 10,900 | 655 | |||||||||
| Royal Dutch Shell PLC–Class A, ADR | 113,000 | 7,699 | |||||||||
| Petroleum Refining (9.4%) | |||||||||||
| Chevron Corp. | 109,100 | 6,657 | |||||||||
| ConocoPhillips | 96,000 | 6,422 | |||||||||
| Exxon Mobil Corp. | 197,400 | 12,452 | |||||||||
| Pharmaceuticals (6.5%) | |||||||||||
| Abbott Laboratories | 91,200 | 3,898 | |||||||||
| Johnson & Johnson | 63,100 | 3,698 | |||||||||
| Merck & Co., Inc. | 50,100 | 1,724 | |||||||||
| Pfizer, Inc. | 189,300 | 4,795 | |||||||||
| Wyeth | 75,500 | 3,675 | |||||||||
| Primary Metal Industries (0.4%) | |||||||||||
| Nucor Corp. † | 11,000 | 1,197 | |||||||||
| Printing & Publishing (1.9%) | |||||||||||
| CBS Corp.–Class B | 26,800 | 683 | |||||||||
| Gannett Co., Inc. | 50,900 | 2,799 | |||||||||
| RR Donnelley & Sons Co. | 50,000 | 1,685 | |||||||||
| Radio & Television Broadcasting (0.4%) | |||||||||||
| Viacom, Inc.–Class B ‡ | 30,000 | 1,195 | |||||||||
| Restaurants (1.2%) | |||||||||||
| McDonald's Corp. | 92,100 | 3,184 | |||||||||
| Retail Trade (1.4%) | |||||||||||
| Dollar General Corp. | 92,600 | 1,617 | |||||||||
| Wal-Mart Stores, Inc. | 47,300 | 2,130 | |||||||||
| Rubber & Misc. Plastic Products (0.7%) | |||||||||||
| Newell Rubbermaid, Inc. | 73,100 | 2,004 | |||||||||
| Savings Institutions (1.5%) | |||||||||||
| Washington Mutual, Inc. | 88,000 | 3,965 | |||||||||
| Security & Commodity Brokers (3.0%) | |||||||||||
| Merrill Lynch & Co., Inc. | 52,000 | 3,966 | |||||||||
| Morgan Stanley | 66,000 | 4,244 | |||||||||
| Telecommunications (4.9%) | |||||||||||
| AT&T, Inc. | 174,000 | 4,561 | |||||||||
| BellSouth Corp. | 88,600 | 2,993 | |||||||||
| Sprint Nextel Corp. | 100,000 | 2,480 | |||||||||
| Verizon Communications, Inc. | 103,700 | 3,425 | |||||||||
| Total Common Stocks (cost: $245,557) | 267,254 | ||||||||||
| Principal | Value | ||||||||||
| SECURITY LENDING COLLATERAL (3.4%) | |||||||||||
| Debt (3.2%) | |||||||||||
| Bank Notes (0.4%) | |||||||||||
| Bank of America | |||||||||||
| 4.81%, due 06/07/2006 * | $ | 301 | $ | 301 | |||||||
| 4.81%, due 08/10/2006 * | 291 | 291 | |||||||||
| Bear Stearns & Co. 5.01%, due 06/06/2006 * 5.01%, due 09/07/2006 * | 116 349 | 116 349 | |||||||||
| Certificates Of Deposit (0.2%) | |||||||||||
| Halifax Bank of Scotland 4.78%, due 06/06/2006 * | 291 | 291 | |||||||||
| Rabobank Nederland 4.87%, due 05/31/2006 * | 291 | 291 | |||||||||
| Commercial Paper (0.2%) | |||||||||||
| Banco Santander Central Hispano SA 4.77%, due 05/02/2006 | 174 | 174 | |||||||||
| Sheffield Receivables Corp.–144A 4.81%, due 05/03/2006 | 290 | 290 | |||||||||
| Euro Dollar Overnight (0.6%) | |||||||||||
| Bank of Montreal 4.77%, due 05/02/2006 | 232 | 232 | |||||||||
| Dexia Group 4.78%, due 05/04/2006 | 291 | 291 | |||||||||
| Fortis Bank 4.77%, due 05/01/2006 | 116 | 116 | |||||||||
| Royal Bank of Canada 4.77%, due 05/01/2006 | 407 | 407 | |||||||||
| Royal Bank of Scotland 4.75%, due 05/03/2006 | 291 | 291 | |||||||||
| Svenska Handlesbanken 4.82%, due 05/01/2006 | 222 | 222 | |||||||||
| Euro Dollar Terms (0.9%) | |||||||||||
| BancoBilbao Vizcaya Argentaria SA 4.95%, due 06/20/2006 | 233 | 233 | |||||||||
| Bank of the West 4.94%, due 06/16/2006 | 233 | 233 | |||||||||
| Barclays 4.79%, due 05/10/2006 4.77%, due 05/16/2006 | 349 116 | 349 116 | |||||||||
| Canadian Imperial Bank of Commerce 4.97%, due 06/23/2006 | 174 | 174 | |||||||||
| Credit Suisse First Boston Corp. 4.73%, due 05/08/2006 | 174 | 174 | |||||||||
The notes to the financial statements are an integral part of this report.
Transamerica IDEX Mutual Funds
Semi-Annual Report 2006
3
TA IDEX American Century Large Company Value
SCHEDULE OF INVESTMENTS (continued)
At April 30, 2006
(all amounts except share amounts in thousands)
(unaudited)
| Principal | Value | ||||||||||
| Euro Dollar Terms (continued) | |||||||||||
| Fortis Bank | |||||||||||
| 4.83%, due 05/08/2006 | $ | 116 | $ | 116 | |||||||
| Lloyds TSB Bank 4.81%, due 05/11/2006 | 174 | 174 | |||||||||
| Royal Bank of Scotland 4.87%, due 05/12/2006 | 233 | 233 | |||||||||
| Societe Generale 4.79%, due 05/10/2006 | 291 | 291 | |||||||||
| UBS AG 4.95%, due 06/20/2006 | 291 | 291 | |||||||||
| Repurchase Agreements (0.9%) †† | |||||||||||
| Credit Suisse First Boston Corp. 4.92%, dated 04/28/2006 to be repurchased at $395 on 05/01/2006 | 395 | 395 | |||||||||
| Goldman Sachs Group, Inc. (The) 4.92%, dated 04/28/2006 to be repurchased at $854 on 05/01/2006 | 854 | 854 | |||||||||
| Lehman Brothers, Inc. 4.92%, dated 04/28/2006 to be repurchased at $14 on 05/01/2006 | 14 | 14 | |||||||||
| Principal | Value | ||||||||||
| Repurchase Agreements (continued) | |||||||||||
| Merrill Lynch & Co. | |||||||||||
| 4.87%, dated 04/28/2006 to be | |||||||||||
| repurchased at $872 on 05/01/2006 | $ | 872 | $ | 872 | |||||||
| Morgan Stanley Dean Witter & Co. 4.93%, dated 04/28/2006 to be repurchased at $407 on 05/01/2006 | 407 | 407 | |||||||||
| Shares | Value | ||||||||||
| Investment Companies (0.2%) | |||||||||||
| Barclays Global Investors Institutional Money Market Fund 1-day yield of 4.78% | 465,122 | $ | 465 | ||||||||
| Merrimac Cash Fund, Premium Class 1-day yield of 4.61% @ | 123,753 | 124 | |||||||||
| Total Security Lending Collateral (cost: $9,177) | 9,177 | ||||||||||
| Total Investment Securities (cost: $254,734) # | $ | 276,431 | |||||||||
NOTES TO SCHEDULE OF INVESTMENTS:
† At April 30, 2006, all or a portion of this security is on loan (see Note 1). The value at April 30, 2006, of all securities on loan is $8,925.
‡ Non-income producing.
* Floating or variable rate note. Rate is listed as of April 30, 2006.
†† Cash collateral for the Repurchase Agreements, valued at $2,617, that serve as collateral for securities lending are invested in corporate bonds with interest rates and maturity dates ranging from 0.00%–9.05% and 05/02/2006–12/31/2049, respectively.
@ Regulated investment company advised by Investors Bank and Trust Co. ("IBT"). IBT is also the accounting, custody and lending agent for the Fund.
# Aggregate cost for Federal income tax purposes is $255,474. Aggregate gross unrealized appreciation for all securities in which there is an excess of value over tax cost and aggregate gross unrealized depreciation for all securities in which there is an excess of tax cost over value were $27,692 and $6,735, respectively. Net unrealized appreciation for tax purposes is $20,957.
DEFINITIONS:
144A 144A Securities are registered pursuant to Rule 144A of the Securities Act of 1933. These securities are deemed to be liquid for purposes of compliance limitations on holdings of illiquid securities and may be resold as transactions exempt from registration, normally to qualified institutional buyers. At April 30, 2006, these securities aggregated $290 or 0.1% of the net assets of the Fund.
ADR American Depositary Receipt
SPDR Standard & Poor's Depository Receipts
The notes to the financial statements are an integral part of this report.
Transamerica IDEX Mutual Funds
Semi-Annual Report 2006
4
TA IDEX American Century Large Company Value
STATEMENT OF ASSETS AND LIABILITIES
At April 30, 2006
(all amounts except per share amounts in thousands)
(unaudited)
| Assets: | |||||||
| Investment securities, at value (cost: $254,734) (including securities loaned of $8,925) | $ | 276,431 | |||||
| Cash | 4,943 | ||||||
| Receivables: | |||||||
| Investment securities sold | 471 | ||||||
| Interest | 16 | ||||||
| Dividends | 516 | ||||||
| Dividend reclaims receivable | 11 | ||||||
| Other | 7 | ||||||
| 282,395 | |||||||
| Liabilities: | |||||||
| Investment securities purchased | 259 | ||||||
| Accounts payable and accrued liabilities: | |||||||
| Shares of beneficial interest redeemed | 127 | ||||||
| Management and advisory fees | 187 | ||||||
| Transfer agent fees | 14 | ||||||
| Administration fees | 5 | ||||||
| Payable for collateral for securities on loan | 9,177 | ||||||
| Other | 33 | ||||||
| 9,802 | |||||||
| Net Assets | $ | 272,593 | |||||
| Net Assets Consist of: | |||||||
| Shares of beneficial interest, unlimited shares authorized, no par value | $ | 233,261 | |||||
| Distributable net investment income (loss) | 1,344 | ||||||
| Accumulated net realized gain (loss) from investment securities and futures contracts | 16,291 | ||||||
| Net unrealized appreciation (depreciation) on investment securities | 21,697 | ||||||
| Net Assets | $ | 272,593 | |||||
| Net Assets by Class: | |||||||
| Class A | $ | 8,940 | |||||
| Class B | 14,487 | ||||||
| Class C | 5,574 | ||||||
| Class I | 243,592 | ||||||
| Shares Outstanding: | |||||||
| Class A | 773 | ||||||
| Class B | 1,294 | ||||||
| Class C | 499 | ||||||
| Class I | 21,059 | ||||||
| Net Asset Value Per Share: | |||||||
| Class A | $ | 11.57 | |||||
| Class B | 11.20 | ||||||
| Class C | 11.17 | ||||||
| Class I | 11.57 | ||||||
| Maximum Offering Price Per Share (a): | |||||||
| Class A | $ | 12.24 | |||||
(a) Includes the maximum selling commission (represented as a percentage of offering price) which is reduced on certain levels of sales as set forth in the Prospectus. Net asset value per share for Classes B, C and I shares represents offering price. The redemption price for Classes B and C shares equals net asset value less any applicable contingent deferred sales charge.
STATEMENT OF OPERATIONS
For the period ended April 30, 2006 (b)
(all amounts in thousands)
(unaudited)
| Investment Income: | |||||||
| Dividends (net of withholding taxes on foreign dividends of $26) | $ | 4,252 | |||||
| Interest | 131 | ||||||
| Income from loaned securities–net | 11 | ||||||
| 4,394 | |||||||
| Expenses: | |||||||
| Management and advisory fees | 1,293 | ||||||
| Distribution and service fees: | |||||||
| Class A | 69 | ||||||
| Class B | 55 | ||||||
| Class C | 22 | ||||||
| Transfer agent fees: | |||||||
| Class A | 19 | ||||||
| Class B | 30 | ||||||
| Class C | 10 | ||||||
| Class I | – | (c) | |||||
| Printing and shareholder reports | 8 | ||||||
| Custody fees | 19 | ||||||
| Administration fees | 31 | ||||||
| Legal fees | 9 | ||||||
| Audit fees | 9 | ||||||
| Trustees fees | 7 | ||||||
| Registration fees | 5 | ||||||
| Other | 4 | ||||||
| Total expenses | 1,590 | ||||||
| Net Investment Income (Loss) | 2,804 | ||||||
| Net Realized Gain (Loss) from: | |||||||
| Investment securities | 17,292 | ||||||
| Futures contracts | (111 | ) | |||||
| 17,181 | |||||||
| Increase (decrease) in unrealized appreciation (depreciation) on investment securities | 10,993 | ||||||
| Net Realized and Unrealized Gain (Loss) on Investment Securities and Futures Contracts | 28,174 | ||||||
| Net Increase (Decrease) in Net Assets Resulting from Operations | $ | 30,978 | |||||
(b) Class I was offered for investment on November 15, 2005.
(c) Rounds to less than $1.
The notes to the financial statements are an integral part of this report.
Transamerica IDEX Mutual Funds
Semi-Annual Report 2006
5
TA IDEX American Century Large Company Value
STATEMENTS OF CHANGES IN NET ASSETS
For the period or year ended
(all amounts in thousands)
| April 30, 2006 (unaudited) (a) | October 31, 2005 | ||||||||||
| Increase (Decrease) In Net Assets From: | |||||||||||
| Operations: | |||||||||||
| Net investment income (loss) | $ | 2,804 | $ | 4,498 | |||||||
| Net realized gain (loss) from investment securities and futures contracts | 17,181 | 14,033 | |||||||||
| Change in unrealized appreciation (depreciation) on investment securities | 10,993 | 5,916 | |||||||||
| 30,978 | 24,447 | ||||||||||
| Distributions to Shareholders: | |||||||||||
| From net investment income: | |||||||||||
| Class A | (616 | ) | (5,062 | ) | |||||||
| Class B | (35 | ) | – | ||||||||
| Class C | (15 | ) | (5 | ) | |||||||
| Class I | (794 | ) | – | ||||||||
| (1,460 | ) | (5,067 | ) | ||||||||
| From net realized gains: | |||||||||||
| Class A | (372 | ) | – | ||||||||
| Class B | (629 | ) | – | ||||||||
| Class C | (256 | ) | – | ||||||||
| Class I | (10,623 | ) | – | ||||||||
| (11,880 | ) | – | |||||||||
| Capital Share Transactions: | |||||||||||
| Proceeds from shares sold: | |||||||||||
| Class A | 172 | 265,545 | |||||||||
| Class B | 202 | 2,124 | |||||||||
| Class C | 120 | 1,174 | |||||||||
| Class I | 402,482 | – | |||||||||
| 402,976 | 268,843 | ||||||||||
| Dividends and distributions reinvested: | |||||||||||
| Class A | 983 | 5,058 | |||||||||
| Class B | 617 | – | |||||||||
| Class C | 218 | 4 | |||||||||
| Class I | 11,417 | – | |||||||||
| 13,235 | 5,062 | ||||||||||
| Cost of shares redeemed: | |||||||||||
| Class A | (405,451 | ) | (38,506 | ) | |||||||
| Class B | (3,976 | ) | (5,187 | ) | |||||||
| Class C | (2,224 | ) | (2,194 | ) | |||||||
| Class I | (180,304) | – | |||||||||
| (591,955 | ) | (45,887 | ) | ||||||||
(a) Class I was offered for investment on November 15, 2005.
| April 30, 2006 (unaudited) (a) | October 31, 2005 | ||||||||||
| Automatic conversions: | |||||||||||
| Class A | $ | 21 | $ | 91 | |||||||
| Class B | (21 | ) | (91 | ) | |||||||
| – | – | ||||||||||
| (175,744 | ) | 228,018 | |||||||||
| Net increase (decrease) in net assets | (158,106 | ) | 247,398 | ||||||||
| Net Assets: | |||||||||||
| Beginning of period | 430,699 | 183,301 | |||||||||
| End of period | $ | 272,593 | $ | 430,699 | |||||||
| Distributable Net Investment Income (Loss) | $ | 1,344 | $ | – | |||||||
| Share Activity: | |||||||||||
| Shares issued: | |||||||||||
| Class A | 15 | 24,696 | |||||||||
| Class B | 19 | 201 | |||||||||
| Class C | 11 | 112 | |||||||||
| Class I | 36,096 | – | |||||||||
| 36,141 | 25,009 | ||||||||||
| Shares issued–reinvested from distributions: | |||||||||||
| Class A | 89 | 467 | |||||||||
| Class B | 58 | – | |||||||||
| Class C | 21 | – | |||||||||
| Class I | 1,040 | – | |||||||||
| 1,208 | 467 | ||||||||||
| Shares redeemed: | |||||||||||
| Class A | (36,361 | ) | (3,553 | ) | |||||||
| Class B | (367 | ) | (490 | ) | |||||||
| Class C | (206 | ) | (208 | ) | |||||||
| Class I | (16,077 | ) | – | ||||||||
| (53,011 | ) | (4,251 | ) | ||||||||
| Automatic conversions: | |||||||||||
| Class A | 2 | 8 | |||||||||
| Class B | (2 | ) | (9 | ) | |||||||
| – | (1 | ) | |||||||||
| Net increase (decrease) in shares outstanding: | |||||||||||
| Class A | (36,255 | ) | 21,618 | ||||||||
| Class B | (292 | ) | (298 | ) | |||||||
| Class C | (174 | ) | (96 | ) | |||||||
| Class I | 21,059 | – | |||||||||
| (15,662 | ) | 21,224 | |||||||||
The notes to the financial statements are an integral part of this report.
Transamerica IDEX Mutual Funds
Semi-Annual Report 2006
6
TA IDEX American Century Large Company Value
FINANCIAL HIGHLIGHTS
(unaudited for the period ended April 30, 2006)
| For a share of beneficial interest outstanding throughout each period | |||||||||||||||||||||||||||||||||||||||
| Net Asset | Investment Operations | Distributions | Net Asset | ||||||||||||||||||||||||||||||||||||
| For the Period Ended (d)(g) | Value, Beginning of Period | Net Investment Income (Loss) | Net Realized and Unrealized Gain (Loss) | Total Operations | From Net Investment Income | From Net Realized Gains | Total Distributions | Value, End of Period | |||||||||||||||||||||||||||||||
| Class A | 4/30/2006 | $ | 10.98 | $ | 0.21 | $ | 0.81 | $ | 1.02 | $ | (0.02 | ) | $ | (0.41 | ) | $ | (0.43 | ) | $ | 11.57 | |||||||||||||||||||
| 10/31/2005 | 10.20 | 0.13 | 0.80 | 0.93 | (0.15 | ) | – | (0.15 | ) | 10.98 | |||||||||||||||||||||||||||||
| 10/31/2004 | 9.09 | 0.11 | 1.01 | 1.12 | (0.01 | ) | – | (0.01 | ) | 10.20 | |||||||||||||||||||||||||||||
| 10/31/2003 | 7.55 | 0.04 | 1.50 | 1.54 | – | – | – | 9.09 | |||||||||||||||||||||||||||||||
| 10/31/2002 | 8.79 | 0.01 | (1.25 | ) | (1.24 | ) | – | – | – | 7.55 | |||||||||||||||||||||||||||||
| 10/31/2001 | 10.83 | (0.03 | ) | (2.01 | ) | (2.04 | ) | – | – | – | 8.79 | ||||||||||||||||||||||||||||
| Class B | 4/30/2006 | 10.67 | 0.04 | 0.92 | 0.96 | (0.02 | ) | (0.41 | ) | (0.43 | ) | 11.20 | |||||||||||||||||||||||||||
| 10/31/2005 | 9.88 | 0.02 | 0.77 | 0.79 | – | – | – | 10.67 | |||||||||||||||||||||||||||||||
| 10/31/2004 | 8.87 | 0.02 | 1.00 | 1.02 | (0.01 | ) | – | (0.01 | ) | 9.88 | |||||||||||||||||||||||||||||
| 10/31/2003 | 7.41 | (0.01 | ) | 1.47 | 1.46 | – | – | – | 8.87 | ||||||||||||||||||||||||||||||
| 10/31/2002 | 8.69 | (0.05 | ) | (1.23 | ) | (1.28 | ) | – | – | – | 7.41 | ||||||||||||||||||||||||||||
| 10/31/2001 | 10.79 | (0.10 | ) | (2.00 | ) | (2.10 | ) | – | – | – | 8.69 | ||||||||||||||||||||||||||||
| Class C | 4/30/2006 | 10.64 | 0.05 | 0.91 | 0.96 | (0.02 | ) | (0.41 | ) | (0.43 | ) | 11.17 | |||||||||||||||||||||||||||
| 10/31/2005 | 9.86 | 0.02 | 0.77 | 0.79 | (0.01 | ) | – | (0.01 | ) | 10.64 | |||||||||||||||||||||||||||||
| 10/31/2004 | 8.87 | – | 1.00 | 1.00 | (0.01 | ) | – | (0.01 | ) | 9.86 | |||||||||||||||||||||||||||||
| 10/31/2003 | 7.32 | (0.01 | ) | 1.56 | 1.55 | – | – | – | 8.87 | ||||||||||||||||||||||||||||||
| Class I | 4/30/2006 | 11.15 | 0.08 | 0.78 | 0.86 | (0.03 | ) | (0.41 | ) | (0.44 | ) | 11.57 | |||||||||||||||||||||||||||
| Ratios/Supplemental Data | |||||||||||||||||||||||||||||||
| For the Period | Total | Net Assets, End of Period | Ratio of Expenses to Average Net Assets (a) | Net Investment Income (Loss) to Average | Portfolio Turnover | ||||||||||||||||||||||||||
| Ended (g) | Return (c) | (000's) | Net (e) | Total (f) | Net Assets (a) | Rate (b) | |||||||||||||||||||||||||
| Class A | 4/30/2006 | 9.43 | % | $ | 8,940 | 1.31 | % | 1.31 | % | 3.86 | % | 3 | % | ||||||||||||||||||
| 10/31/2005 | 9.10 | 406,609 | 1.31 | (h) | 1.31 | (h) | 1.16 | 28 | |||||||||||||||||||||||
| 10/31/2004 | 12.38 | 157,103 | 1.54 | 1.54 | 1.11 | 61 | |||||||||||||||||||||||||
| 10/31/2003 | 20.40 | 8,988 | 1.85 | 2.56 | 0.53 | 76 | |||||||||||||||||||||||||
| 10/31/2002 | (14.15 | ) | 7,908 | 1.80 | 2.43 | 0.09 | 161 | ||||||||||||||||||||||||
| 10/31/2001 | (18.80 | ) | 5,183 | 1.55 | 2.49 | (0.28 | ) | 113 | |||||||||||||||||||||||
| Class B | 4/30/2006 | 9.20 | 14,487 | 1.97 | 1.97 | 0.77 | 3 | ||||||||||||||||||||||||
| 10/31/2005 | 8.01 | 16,927 | 2.36 | (h) | 2.36 | (h) | 0.23 | 28 | |||||||||||||||||||||||
| 10/31/2004 | 11.54 | 18,612 | 2.32 | 2.32 | 0.20 | 61 | |||||||||||||||||||||||||
| 10/31/2003 | 19.70 | 17,245 | 2.50 | 3.21 | (0.12 | ) | 76 | ||||||||||||||||||||||||
| 10/31/2002 | (14.76 | ) | 14,446 | 2.45 | 3.08 | (0.56 | ) | 161 | |||||||||||||||||||||||
| 10/31/2001 | (19.41 | ) | 11,623 | 2.20 | 3.14 | (0.93 | ) | 113 | |||||||||||||||||||||||
| Class C | 4/30/2006 | 9.24 | 5,574 | 1.91 | 1.91 | 0.85 | 3 | ||||||||||||||||||||||||
| 10/31/2005 | 7.93 | 7,163 | 2.42 | (h) | 2.42 | (h) | 0.16 | 28 | |||||||||||||||||||||||
| 10/31/2004 | 11.38 | 7,586 | 2.50 | 2.54 | 0.04 | 61 | |||||||||||||||||||||||||
| 10/31/2003 | 21.17 | 1,230 | 2.50 | 3.21 | (0.12 | ) | 76 | ||||||||||||||||||||||||
| Class I | 4/30/2006 | 7.90 | 243,592 | 0.90 | 0.90 | 1.56 | 3 | ||||||||||||||||||||||||
The notes to the financial statements are an integral part of this report.
Transamerica IDEX Mutual Funds
Semi-Annual Report 2006
7
TA IDEX American Century Large Company Value
FINANCIAL HIGHLIGHTS (continued)
(unaudited)
NOTES TO FINANCIAL HIGHLIGHTS
(a) Annualized.
(b) Not annualized.
(c) Total Return has been calculated for the applicable period without deduction of a sales load, if any, on an initial purchase. Not annualized.
(d) Per share information is calculated based on average number of shares outstanding.
(e) Ratio of Net Expenses to Average Net Assets is net of fee waivers and reimbursements by the investment adviser, if any (see note 2).
(f) Ratio of Total Expenses to Average Net Assets includes all expenses before fee waivers and reimbursements by the investment adviser.
(g) The inception dates for the Fund's offering of share classes were as follows:
Class C was November 11, 2002.
Class I was November 15, 2005.
(h) Ratios of Total Expenses to Average Net Assets and net Expenses to Average Net Assets are inclusive of recaptured expenses by the investment advisor, if any. The impact of recaptured expenses was 0.06%, 0.06% and 0.07% for Class A, Class B and Class C, respectively (see Note 2).
The notes to the financial statements are an integral part of this report.
Transamerica IDEX Mutual Funds
Semi-Annual Report 2006
8
TA IDEX American Century Large Company Value
NOTES TO FINANCIAL STATEMENTS
At April 30, 2006
(all amounts in thousands)
(unaudited)
NOTE 1. ORGANIZATION AND SIGNIFICANT ACCOUNTING POLICIES
Transamerica IDEX Mutual Funds is an open-end management investment company registered under the Investment Company Act of 1940, as amended (the "1940 Act").
In the normal course of business, TA IDEX American Century Large Company Value (the "Fund") enters into contracts that contain a variety of representations that provide general indemnifications. The Fund's maximum exposure under these arrangements is unknown, as this would involve future claims that may be made against the Fund and/or its affiliates that have not yet occurred. However, based on experience, the Fund expects the risk of loss to be remote.
This report should be read in conjunction with the current Fund prospectus, which contains more complete information about the Fund.
In preparing the Fund's financial statements in accordance with accounting principles generally accepted in the United States of America ("GAAP"), estimates or assumptions (which could differ from actual results) may be used that affect reported amounts and disclosures. The following is a summary of significant accounting policies followed by the Fund.
Multiple class operations, income and expenses: The Fund currently has four classes of shares, Class A, Class B, Class C and Class I, each with different expense levels. Classes A, B, and C are closed to new investors. Class I commenced operations on November 15, 2005. Class I is only available for investment to certain affiliated asset allocation funds. Class B shares will convert to Class A shares eight years after purchase. Income, non-class specific expenses and realized and unrealized gains and losses, are allocated daily to each class, based upon the value of shares outstanding method as permitted under Rule 18f-3 of the 1940 Act. Each class bears its own specific expenses as well as a portion of general, common expenses.
Security valuations: The Fund values its investments at the close of the New York Stock Exchange ("NYSE"), normally 4 p.m. ET, each day the NYSE is open for business. Fund investments are valued at the last sale price or closing price on the day of valuation taken from the primary exchange where the security is principally traded.
Securities traded in the over-the-counter market and listed securities for which no sale was reported on that date are valued at the last quoted bid price.
Debt securities are valued based on a price quotation or other equivalent indication of value supplied by an exchange, a pricing service or a major market maker; however, those that mature in sixty days or less are valued at amortized cost, which approximates market.
Investment company securities are valued at the net asset value of the underlying portfolio.
Other securities for which quotations are not readily available or whose values have been determined to be unreliable are valued at fair market value as determined in good faith by the Fund's Administrative Valuation Committee, under the supervision of the Board's Valuation Committee, using guidelines adopted by the Board of Trustees.
Cash: The Fund may leave cash overnight in its cash account with the custodian, Investors Bank & Trust Company ("IBT"). IBT has been contracted on behalf of the Fund to invest the excess cash into a savings account, which at April 30, 2006, was paying an interest rate of 3.24%.
Repurchase agreements: The Fund is authorized to enter into repurchase agreements. The Fund, through its custodian, IBT, receives delivery of the underlying securities, the value of which at the time of purchase is required to be an amount equal to at least 100% of the resale price. The Fund will bear the risk of value fluctuations until the security can be sold and may encounter delays and incur costs in liquidating the security. In the event of bankruptcy or insolvency of the seller, delays and costs may be incurred.
Securities lending: The Fund may lend securities to qualified borrowers, with IBT acting as the Fund's lending agent. The Fund earns negotiated lenders' fees. The Fund receives cash and/or securities as collateral against the loaned securities. Cash collateral received is invested in short term, interest bearing securities. The Fund monitors the market value of securities loaned on a daily basis and requires collateral in an amount at least equal to the value of the securities loaned. Income from loaned securities on the Statement of Operations is net of fees, in the amount of $5, earned by IBT for its services.
Security transactions and investment income: Security transactions are recorded on the trade date. Security gains and losses are calculated on the specific identification basis. Dividend income, if any, is recorded on the ex-dividend date or, in the case of foreign securities, as soon as the Fund is informed of the ex-dividend date. Interest income, including accretion of discounts and amortization of premiums, is recorded on the accrual basis commencing on the settlement date.
Redemption fees: A short-term trading redemption fee may be assessed on any Fund shares in a fund account that are sold during the first five (5) NYSE trading days following their purchase date. This redemption fee will equal 2% of the amount redeemed and shares held the longest will be treated as being redeemed first and shares held the shortest as being redeemed last. For the six months ended April 30, 2006, the Fund received less than $1 in redemption fees.
Dividend distributions: Distributions to shareholders are recorded on the ex-dividend date and are determined in accordance with Federal income tax regulations which may differ from GAAP.
Transamerica IDEX Mutual Funds
Semi-Annual Report 2006
9
TA IDEX American Century Large Company Value
NOTES TO FINANCIAL STATEMENTS (continued)
At April 30, 2006
(all amounts in thousands)
(unaudited)
NOTE 2. RELATED PARTY TRANSACTIONS
Transamerica Fund Advisors, Inc. ("TFAI") is the Fund's investment adviser. Transamerica Fund Services, Inc. ("TFS") is the Fund's administrator and transfer agent. AFSG Securities Corp. ("AFSG") is the Fund's distributor/principal underwriter. TFAI, TFS, and AFSG are affiliates of AEGON, NV, a Netherlands corporation.
Certain officers and trustees of the Fund are also officers and/or directors of TFAI, TFS and AFSG.
The following schedule reflects the percentage of Fund assets owned by affiliated investment companies at April 30, 2006:
| Net Assets | % of Net Assets | ||||||||||
| TA IDEX Asset Allocation– Conservative Portfolio | $ | 13,463 | 4.94 | % | |||||||
| TA IDEX Asset Allocation– Growth Portfolio | 63,585 | 23.33 | % | ||||||||
| TA IDEX Asset Allocation– Moderate Portfolio | 53,361 | 19.58 | % | ||||||||
| TA IDEX Asset Allocation– Moderate Growth Portfolio | 113,242 | 41.54 | % | ||||||||
| Total | $ | 243,651 | 89.39 | % | |||||||
Investment advisory fees: The Fund pays management fees to TFAI based on average daily net assets ("ANA") at the following breakpoints:
0.85% of the first $250 million of ANA
0.80% of the next $250 million of ANA
0.775% of the next $250 million of ANA
0.70% of ANA over $750 million*
* The ANA will be determined on a combined basis with the same named fund managed by the sub-adviser for AEGON/Transamerica Series Trust.
TFAI has contractually agreed to waive its advisory fee and will reimburse the Fund to the extent that operating expenses, excluding 12b-1 fees, exceed the following stated annual limit:
1.45% Expense Limit
If total Fund expenses fall below the annual expense limitation agreement agreed to by the adviser within the succeeding three years, the Fund may be required to pay the adviser a portion or all of the reimbursed class expenses.
There are no amounts available for recapture at April 30, 2006.
Distribution and service fees: The Fund has a 12b-1 distribution plan under the 1940 Act pursuant to which an annual fee, based on average daily net assets, is paid to the distributor for various disbursements such as broker-dealer account servicing fees and other promotional expenses of the Fund. The Fund is authorized under the 12b-1 plan to pay fees on each class up to the following limits:
| Class A | 0.35 | % | |||||
| Class B | 1.00 | % | |||||
| Class C | 1.00 | % | |||||
| Class I | N/A | ||||||
From February 28, 2006 through March 1, 2007, the Fund will not pay 12b-1 fees under these plans.
Underwriter commissions relate to front-end sales charges imposed for Class A shares and contingent deferred sales charges from Classes B, C, and certain A share redemptions. For the six months ended April 30, 2006, the underwriter commissions were as follows:
| Received by Underwriter | $ | 5 | |||||
| Retained by Underwriter | 1 | ||||||
| Contingent Deferred Sales Charge | 3 | ||||||
Administrative services: The Fund has entered into an agreement with TFS for financial and legal fund administration services. The Fund pays TFS an annual fee of 0.02% of ANA. The Legal fees on the Statement of Operations are fees paid to external legal counsel.
Transfer agent fees: The Fund pays TFS an annual per-account charge for each open and closed account. The Fund paid TFS $54 for the six months ended April 30, 2006.
Brokerage commissions: Brokerage commissions incurred on security transactions placed with an affiliate of the adviser for the six months ended April 30, 2006, were less than $1.
Deferred compensation plan: Each eligible independent Fund Trustee may elect to participate in a non-qualified deferred compensation plan maintained by Transamerica IDEX Mutual Funds (the "Plan"). Under the Plan, such Trustees may defer payment of all or a portion of their total fees earned as a Fund Trustee. Each Trustee who is a participant in the Plan may elect that the earnings, losses or gains credited to his or her deferred fee amounts be determined based on a deemed investment in any series of Transamerica IDEX Mutual Funds, including the Fund. The right of a participant to receive a distribution from the Plan of the deferred fees is an unsecured claim against the general assets of all series of Transamerica IDEX Mutual Funds. The pro rata liability to the Fund of all deferred fees in the Plan amounted, as of April 30, 2006, to $7.
Transamerica IDEX Mutual Funds
Semi-Annual Report 2006
10
TA IDEX American Century Large Company Value
NOTES TO FINANCIAL STATEMENTS (continued)
At April 30, 2006
(all amounts in thousands)
(unaudited)
NOTE 3. INVESTMENT TRANSACTIONS
The cost of securities purchased and proceeds from securities sold (excluding short-term securities) for the six months ended April 30, 2006 were as follows:
| Purchases of securities: | |||||||
| Long-Term | $ | 9,032 | |||||
| U.S. Government | – | ||||||
| Proceeds from maturities and sales of securities: | |||||||
| Long-Term | 189,172 | ||||||
| U.S. Government | – | ||||||
NOTE 4. FEDERAL INCOME TAX MATTERS
The Fund has not made any provision for federal income or excise taxes due to its policy to distribute all of its taxable income and capital gains to its shareholders and otherwise qualify as a regulated investment company under Subchapter M of the Internal Revenue Code. Income and capital gain distributions are determined in accordance with income tax regulations, which may differ from GAAP. These differences are primarily due to differing treatment for items including, but not limited to, wash sales and distribution reclasses.
NOTE 5. REGULATORY PROCEEDINGS
There continues to be significant federal and state regulatory activity relating to financial services companies, particularly mutual fund companies and their investment advisers. As part of an ongoing investigation regarding potential market timing, recordkeeping and trading compliance issues and matters affecting the Fund's investment adviser, TFAI, and certain affiliates and former employees of TFAI, the SEC staff has indicated that it is likely to take some action against TFAI and certain of its affiliates at the conclusion of the investigation. The potential timing and the scope of any such action is difficult to predict. Although the impact of any action brought against TFAI and/or its affiliates is difficult to assess at the present time, the Fund currently believes that the likelihood that any such action will have a material adverse impact on it is remote. It is important to note that the Fund is not aware of any allega tion of wrongdoing against it and its Board at the time this semi-annual report is printed. Although it is not anticipated that these developments will have an adverse impact on the Fund, there can be no assurance at this time. TFAI and its affiliates are actively working with the SEC in regard to this matter; however, the exact resolution cannot be determined at this time. TFAI will take such actions that it deems necessary or appropriate to continue providing management services to the Fund and to bring all matters to an appropriate conclusion.
TFAI and/or its affiliates, and not the Fund, will bear the costs regarding these regulatory matters.
Transamerica IDEX Mutual Funds
Semi-Annual Report 2006
11
TA IDEX American Century Large Company Value
INVESTMENT ADVISORY AND SUB-ADVISORY AGREEMENTS – REVIEW AND RENEWAL (unaudited)
At a meeting of the Board of Trustees of Transamerica IDEX Mutual Funds ("TA IDEX") held on November 2, 2005, the Board reviewed and considered the Investment Advisory Agreement between TA IDEX American Century Large Company Value (the "Fund") and Transamerica Fund Advisors, Inc. ("TFAI"), as well as the Investment Sub-Advisory Agreement of the Fund between TFAI and American Century Investment Management, Inc. (the "Sub-Adviser"), to determine whether the agreements should be renewed for a one-year period. Following their review and consideration, the Trustees determined that the Investment Advisory Agreement and the Investment Sub-Advisory Agreement will enable shareholders of the Fund to obtain high quality services at a cost that is appropriate, reasonable, and in the best interests of its shareholders. The Board, including the independent members of the Board, unanimously approved the renewal of the Investment Advisory Agree ment and the Investment Sub-Advisory Agreement. In reaching their decision, the Trustees requested and obtained from TFAI and the Sub-Adviser such information as they deemed reasonably necessary to evaluate the proposed agreements. The Trustees also carefully considered the information that they had received throughout the year from TFAI and the Sub-Adviser (such as in-person presentations by the Sub-Adviser) as part of their regular oversight of the Fund, as well as: comparative fee, expense and performance information prepared by Lipper Inc. ("Lipper"), independent providers of mutual fund performance, fee and expense information, and profitability data. In considering the proposed continuation of the Investment Advisory Agreement and Investment Sub-Advisory Agreement, the Trustees evaluated a number of considerations that they believed, in light of the legal advice furnished to them by TA IDEX counsel and independent legal counsel and their own business judgment, to be relevant. They based their decisions on the following considerations, among others, although they did not identify any consideration or particular information that was controlling of their decisions:
The nature, extent and quality of the advisory service to be provided. The Board considered the nature and quality of the services provided by TFAI and the Sub-Adviser to the Fund in the past, as well as the services anticipated to be provided in the future. The Board concluded that TFAI and the Sub-Adviser are capable of providing high quality services to the Fund, as indicated by the nature and quality of services provided in the past, TFAI's and the Sub-Adviser's management capabilities demonstrated with respect to the funds they manage, including the Fund, and the experience, capability and integrity of TFAI's senior management, the financial resources of TFAI and the Sub-Adviser, TFAI's management oversight process, the professional qualifications and experience of the Sub-Adviser's portfolio management team, and the Fund's investment performance . The Trustees also concluded that TFAI and the Sub-Adviser proposed to provide investment and related services that were of the same quality and quantity as services provided to the Fund in the past, and that these services are appropriate in scope and extent in light of the Fund's operations, the competitive landscape of the investment company business and investor needs, and that TFAI's and the Sub-Adviser's obligations will remain substantially the same.
The investment performance of the Fund. The Board examined both the short-term and longer-term performance of the Fund, including relative performance against a benchmark securities index and a peer group of comparable mutual funds as prepared by Lipper for various trailing periods ended June 30, 2005. The Trustees concluded that TFAI and the Sub-Adviser generally had achieved competitive investment performance, noting that although the Fund's performance was below median relative to its peers and the benchmark index over the past five-year period, its performance has been at or above median relative to its peers and the benchmark index over the past one-, two- and three-year periods. On the basis of the Trustees' assessment of the nature, extent and quality of advisory services to be provided or procured by TFAI and the Sub-Adviser, the Trustees conc luded that TFAI and the Sub-Adviser are capable of generating a level of investment performance that is appropriate in light of the Fund's investment objective, policies and strategies and competitive with many other investment companies, and also determined that TFAI's and the Sub-Adviser's performance records indicate that their continued management is likely to benefit the Fund and its shareholders.
The cost of advisory services provided and the level of profitability. The Board reviewed profitability information regarding TFAI's costs of procuring portfolio management services, as well as the costs of provision of administration, transfer agency, fund accounting and other services, to the Fund and to TA IDEX as a whole by TFAI and its affiliates. The Trustees reviewed data from Lipper that compared the Fund's management fees (including management fees at various asset levels), other fees and expenses (including total expenses including and excluding 12b-1 distribution and service fees) and portfolio turnover rate against peer groups of comparable mutual funds. The Board noted that although the management fees and overall expense ratio of the Fund are relatively high compared to its peers, the Fund's performance had remained competitive. The Boar d nonetheless instructed TFAI to work with the Sub-Adviser to attempt to lower the Fund's management and sub-advisory fees in order to reduce the Fund's total expense ratio. Therefore, on the basis of its review of the management fees to be charged by TFAI for investment advisory and related services, TFAI profitability information (derived from TFAI's audited financial statements), TFAI's estimated management income resulting from its management of the Fund, the estimated margin of the Sub-Adviser, as well as the entirety of TFAI's and its affiliates' service relationship with TA IDEX, the Board concluded that the level of investment management fees and other service fees, as well as TFAI's and the Sub-Adviser's profitability, are appropriate in light of the services provided, the management fees and overall expense ratios of comparable investment companies and the anticipated profitability of the relationship between the Fund, TFAI and its affiliates, and the Sub-Adviser.
Transamerica IDEX Mutual Funds
Semi-Annual Report 2006
12
TA IDEX American Century Large Company Value (continued)
Whether fee levels reflect economies of scale and the extent to which economies of scale would be realized as the Fund grows. The Board concluded that the inclusion of asset-based breakpoints in the Fund's advisory fee schedule appropriately benefits investors by realizing economies of scale in the form of lower management fees as the level of assets grows. The Board noted that the Fund is closed to new investors and will be closed to new investments in the near future, except that the Fund may continue selling shares to other TA IDEX funds and other investment companies in the same group of investment companies as TA IDEX, which may limit, to an extent, the ability of the Fund to realize economies of scale. In addition, the Board assessed the current asset levels of the Fund and the long-term development strategy for the Fund, including continued inv estments by the TA IDEX asset allocation funds, and concluded that the Fund's current management fees appropriately reflect the Fund's current size, the current economic environment for TFAI, the competitive nature of the investment company market, and TFAI's pricing strategy. The Trustees also concluded that they will have the opportunity to periodically reexamine whether the Fund has achieved economies of scale, and the appropriateness of management fees payable to TFAI and fees payable by TFAI to the Sub-Adviser, in the future.
Benefits (such as soft dollars) to TFAI, its affiliates, or the Sub-Adviser from their relationship with the Fund. The Board concluded that other benefits derived by TFAI, its affiliates, and the Sub-Adviser from their relationship with the Fund, including "soft dollar" benefits (if any) in connection with brokerage transactions, sales charges and distribution/service fees (to the extent applicable) are reasonable and fair, and are consistent with industry practice and the best interests of the Fund and its shareholders. In this regard, the Board noted that TFAI does not realize "soft dollar" benefits from its relationship with the Fund, and that the Sub-Adviser's "soft-dollar" arrangements are consistent with applicable law and "best execution" requirements. In addition, the Trustees determined that the administration, transfer agency, fund accountin g, and other fees paid by the Fund to affiliates of TFAI are reasonable, fair and in the best interests of shareholders in light of the nature and quality of the services provided, the associated costs to these affiliates of providing the services, the impact of the costs of such services on the Fund's overall operating expenses, and the necessity of the services for the Fund's operations.
Other considerations. The Board also determined that TFAI had made a substantial commitment to the recruitment and retention of high quality personnel, and maintained the financial, compliance and operational resources reasonably necessary to manage the Fund in a professional manner that is consistent with the best interests of the Fund and its shareholders. In this regard, the Trustees favorably considered the procedures and policies in place by TFAI to enforce compliance with applicable laws and regulations and oversee the portfolio management activities of the Sub-Adviser. The Trustees also determined that TFAI had made a significant entrepreneurial commitment to the management and success of the Fund, reflected by TFAI's expense limitation and fee waiver arrangement with the Fund, which may result in TFAI waiving advisory fees for the benefit of s hareholders.
Transamerica IDEX Mutual Funds
Semi-Annual Report 2006
13
TA IDEX Asset Allocation – Conservative Portfolio
UNDERSTANDING YOUR FUND'S EXPENSES
(unaudited)
SHAREHOLDER EXPENSES
Fund shareholders may incur two types of costs: (1) transaction costs, including sales charges (loads) on purchases, contingent deferred sales charges on redemptions and redemption fees; and (2) ongoing costs, including management fees, 12b-1 distribution and service fees, and other fund expenses.
The following Example is intended to help you understand your ongoing costs (in dollars and cents) of investing in the Fund and to compare these costs with the ongoing costs of investing in other funds.
The Example is based on an investment of $1,000 invested at November 1, 2005 and held for the entire period until April 30, 2006.
ACTUAL EXPENSES
The first line in the table below provides information about actual account values and actual expenses. You may use the information in this line, together with the amount you invested, to estimate the expenses that you paid over the period. Simply divide your account value by $1,000 (for example, an $8,600 account value divided by $1,000 = 8.6), then multiply the result by the number in the first line of your Fund under the heading entitled "Expenses Paid During Period" to estimate the expenses you paid on your account during this period. If your account is an IRA, your expenses could have included a $15 annual fee. The amount of any fee paid through your account would increase the estimate of expenses you paid during the period and decrease your ending account value.
HYPOTHETICAL EXAMPLE FOR COMPARISON PURPOSES
The second line in the table below provides information about hypothetical account values and hypothetical expenses based on the Fund's actual expense ratio and an assumed rate of return of 5% per year before expenses, which is not the Fund's actual return. The hypothetical account values and expenses may not be used to estimate the actual ending account balance or expenses you paid for the period. You may use this information to compare the ongoing costs of investing in your Fund and other funds. To do so, compare this 5% hypothetical example with the 5% hypothetical examples that appear in the shareholder reports of the other funds. As in the case of the actual expense example, if your account is subject to an IRA fee, the amount of the fee paid through your account would increase the hypothetical expenses you would have paid during the period and decrease the hypothetical ending account value.
Please note that the expenses shown in the table are meant to highlight your ongoing costs only and do not reflect any transactional costs, such as sales charges, redemption fees, brokerage commissions paid on purchases and sales of fund shares. Therefore, the second line under the Fund in the table is useful in comparing ongoing costs only, and will not help you determine the relative total costs of owning different funds. If any of these transaction costs were included, your costs would be higher. The expenses shown in the table do not reflect any fees that may be charged to you by brokers, financial intermediaries or other financial institutions.
The expenses shown in the table do not reflect any expenses from the Funds investment in other affiliated investment companies. The average weighted annualized expense ratio of the underlying investment companies at April 30, 2006, was 0.85%.
| Beginning Account Value | Ending Account Value | Annualized Expense Ratio | Expenses Paid During Period (a) | ||||||||||||||||
| Class A | |||||||||||||||||||
| Actual | $ | 1,000.00 | $ | 1,080.20 | 0.58 | % | $ | 2.99 | |||||||||||
| Hypothetical (b) | 1,000.00 | 1,021.92 | 0.58 | % | 2.91 | ||||||||||||||
| Class B | |||||||||||||||||||
| Actual | 1,000.00 | 1,076.00 | 1.24 | % | 6.38 | ||||||||||||||
| Hypothetical (b) | 1,000.00 | 1,018.65 | 1.24 | % | 6.21 | ||||||||||||||
| Class C | |||||||||||||||||||
| Actual | 1,000.00 | 1,076.30 | 1.21 | % | 6.23 | ||||||||||||||
| Hypothetical (b) | 1,000.00 | 1,018.79 | 1.21 | % | 6.06 | ||||||||||||||
(a) Expenses are calculated using the Fund's annualized expense ratio (as disclosed in the table), multiplied by the average account value for the period, multiplied by number of days in the period (181 days), and divided by the number of days in the year (365 days).
(b) 5% return per year before expenses.
GRAPHICAL PRESENTATION OF SCHEDULE OF INVESTMENTS
By Investment Type
At April 30, 2006
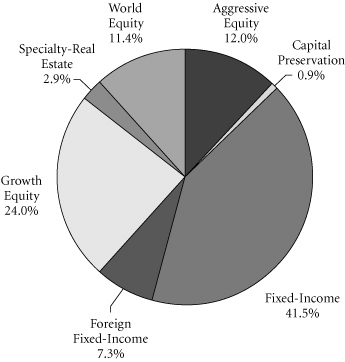
This chart shows the percentage breakdown by investment type of the Fund's total investment securities.
Transamerica IDEX Mutual Funds
Semi-Annual Report 2006
1
TA IDEX Asset Allocation – Conservative Portfolio
SCHEDULE OF INVESTMENTS
At April 30, 2006
(all amounts except share amounts in thousands)
(unaudited)
| Shares | Value | ||||||||||
| INVESTMENT COMPANIES (99.9%) Ø | |||||||||||
| Aggressive Equity (12.0%) | |||||||||||
| TA IDEX Evergreen Health Care | 1,349,809 | $ | 18,101 | ||||||||
| TA IDEX J.P. Morgan Mid Cap Value | 860,812 | 9,503 | |||||||||
| TA IDEX T. Rowe Price Small Cap | 272,909 | 2,399 | |||||||||
| TA IDEX Transamerica Growth Opportunities ‡ | 1,027,529 | 9,258 | |||||||||
| TA IDEX Transamerica Small/Mid Cap Value | 1,033,013 | 18,821 | |||||||||
| Capital Preservation (0.9%) | |||||||||||
| TA IDEX Transamerica Money Market | 4,565,609 | 4,566 | |||||||||
| Fixed-Income (41.4%) | |||||||||||
| TA IDEX PIMCO Real Return TIPS | 4,162,212 | 41,539 | |||||||||
| TA IDEX PIMCO Total Return | 3,060,678 | 30,852 | |||||||||
| TA IDEX Transamerica Convertible Securities | 1,455,523 | 19,155 | |||||||||
| TA IDEX Transamerica Flexible Income | 2,741,604 | 25,442 | |||||||||
| TA IDEX Transamerica High-Yield Bond | 4,261,701 | 39,122 | |||||||||
| TA IDEX Transamerica Short-Term Bond | 4,518,283 | 44,098 | |||||||||
| Foreign Fixed-Income (7.3%) | |||||||||||
| TA IDEX JPMorgan International Bond | 1,280,171 | 13,250 | |||||||||
| TA IDEX Van Kampen Emerging Markets Debt | 2,054,017 | 21,814 | |||||||||
| Shares | Value | ||||||||||
| Growth Equity (24.0%) | |||||||||||
| TA IDEX American Century Large Company Value | 1,163,622 | $ | 13,463 | ||||||||
| TA IDEX Federated Market Opportunity | 3,543,240 | 36,035 | |||||||||
| TA IDEX Great Companies-AmericaSM ‡ | 839,824 | 8,423 | |||||||||
| TA IDEX Janus Growth ‡ | 546,269 | 14,187 | |||||||||
| TA IDEX Marsico Growth ‡ | 58,138 | 656 | |||||||||
| TA IDEX Transamerica Equity | 2,782,123 | 27,460 | |||||||||
| TA IDEX UBS Large Cap Value | 1,303,326 | 15,601 | |||||||||
| Specialty- Real Estate (2.9%) | |||||||||||
| TA IDEX Clarion Global Real Estate Securities | 804,047 | 14,224 | |||||||||
| World Equity (11.4%) | |||||||||||
| TA IDEX AllianceBernstein International Value | 684,059 | 8,140 | |||||||||
| TA IDEX Evergreen International Small Cap | 859,816 | 14,324 | |||||||||
| TA IDEX Marsico International Growth | 628,159 | 8,857 | |||||||||
| TA IDEX Neuberger Berman International | 1,396,257 | 16,867 | |||||||||
| TA IDEX Oppenheimer Developing Markets | 341,108 | 4,018 | |||||||||
| TA IDEX Templeton Great Companies Global ‡ | 93,637 | 2,634 | |||||||||
| Total Investment Companies (cost: $440,539) # | $ | 482,809 | |||||||||
NOTES TO SCHEDULE OF INVESTMENTS:
Ø The Fund invests its assets in Class I shares of the underlying TA IDEX Mutual Funds, which are affiliates of the Fund.
‡ Non-income producing.
# Aggregate cost for Federal income tax purposes is $440,589. Aggregate gross unrealized appreciation for all securities in which there is an excess of value over tax cost and aggregate gross unrealized depreciation for all securities in which there is an excess of tax cost over value were $45,504 and $3,284, respectively. Net unrealized appreciation for tax purposes is $42,220.
The notes to the financial statements are an integral part of this report.
Transamerica IDEX Mutual Funds
Semi-Annual Report 2006
2
TA IDEX Asset Allocation – Conservative Portfolio
STATEMENT OF ASSETS AND LIABILITIES
At April 30, 2006
(all amounts except share amounts in thousands)
(unaudited)
| Assets: | |||||||
| Investment in affiliated investment companies at value (cost: $440,539) | $ | 482,809 | |||||
| Receivables: | |||||||
| Investment securities sold | 69 | ||||||
| Shares of beneficial interest sold | 2,401 | ||||||
| Dividends | 110 | ||||||
| Other | 14 | ||||||
| 485,403 | |||||||
| Liabilities: | |||||||
| Accounts payable and accrued liabilities: | |||||||
| Shares of beneficial interest redeemed | 1,739 | ||||||
| Management and advisory fees | 39 | ||||||
| Distribution and service fees | 317 | ||||||
| Transfer agent fees | 24 | ||||||
| Due to custodian | 23 | ||||||
| Dividends to shareholders | 5 | ||||||
| Other | 42 | ||||||
| 2,189 | |||||||
| Net Assets | $ | 483,214 | |||||
| Net Assets Consist of: | |||||||
| Shares of beneficial interest, unlimited shares authorized, no par value | 425,740 | ||||||
| Distributable net investment income (loss) | 1,404 | ||||||
| Accumulated net realized gain (loss) from investment in affiliated investment companies | 13,801 | ||||||
| Net unrealized appreciation (depreciation) on investment in affiliated investment companies | 42,269 | ||||||
| Net Assets | $ | 483,214 | |||||
| Net Assets by Class: | |||||||
| Class A | $ | 143,112 | |||||
| Class B | 108,005 | ||||||
| Class C | 232,097 | ||||||
| Shares Outstanding: | |||||||
| Class A | 12,235 | ||||||
| Class B | 9,263 | ||||||
| Class C | 19,905 | ||||||
| Net Asset Value Per Share: | |||||||
| Class A | $ | 11.70 | |||||
| Class B | 11.66 | ||||||
| Class C | 11.66 | ||||||
| Maximum Offering Price Per Share (a): | |||||||
| Class A | $ | 12.38 | |||||
(a) Includes the maximum selling commission (represented as a percentage of offering price) which is reduced on certain levels of sales as set forth in the Prospectus. Net asset value per share for Classes B and C shares represents offering price. The redemption price for Classes B and C shares equals net asset value less any applicable contingent deferred sales charge.
STATEMENT OF OPERATIONS
For the period ended April 30, 2006
(all amounts in thousands)
(unaudited)
| Investment Income: | |||||||
| Dividends from affiliated investment companies | $ | 7,654 | |||||
| Expenses: | |||||||
| Management and advisory fees | 231 | ||||||
| Distribution and service fees: | |||||||
| Class A | 221 | ||||||
| Class B | 516 | ||||||
| Class C | 1,063 | ||||||
| Transfer agent fees: | |||||||
| Class A | 59 | ||||||
| Class B | 54 | ||||||
| Class C | 77 | ||||||
| Printing and shareholder reports | 19 | ||||||
| Custody fees | 17 | ||||||
| Administration fees | 35 | ||||||
| Legal fees | 11 | ||||||
| Audit fees | 9 | ||||||
| Trustees fees | 9 | ||||||
| Registration fees | 51 | ||||||
| Other | 4 | ||||||
| Total expenses | 2,376 | ||||||
| Net Investment Income (Loss) | 5,278 | ||||||
| Net Realized and Unrealized Gain (Loss) on Investment in Affiliated Investment Companies: | |||||||
| Realized gain (loss) from investment in affiliated investment companies | 10,045 | ||||||
| Realized gain distributions from investment in affiliated investment companies | 3,850 | ||||||
| 13,895 | |||||||
| Increase (decrease) in unrealized appreciation (depreciation) on investment in affiliated investment companies | 15,409 | ||||||
| Net Realized and Unrealized Gain (Loss) on Investment in Affiliated Investment Companies | 29,304 | ||||||
| Net Increase (Decrease) in Net Assets Resulting from Operations | $ | 34,582 | |||||
The notes to the financial statements are an integral part of this report.
Transamerica IDEX Mutual Funds
Semi-Annual Report 2006
3
TA IDEX Asset Allocation – Conservative Portfolio
STATEMENTS OF CHANGES IN NET ASSETS
For the period or year ended
(all amounts in thousands)
| April 30, 2006 (unaudited) | October 31, 2005 | ||||||||||
| Increase (Decrease) in Net Assets From: | |||||||||||
| Operations: | |||||||||||
| Net investment income (loss) | $ | 5,278 | $ | 9,998 | |||||||
| Net realized gain (loss) from investment in affiliated investment companies | 13,895 | 12,626 | |||||||||
| Change in unrealized appreciation (depreciation) on investment in affiliated investment companies | 15,409 | 683 | |||||||||
| 34,582 | 23,307 | ||||||||||
| Distributions to Shareholders: | |||||||||||
| From net investment income: | |||||||||||
| Class A | (2,493 | ) | (2,144 | ) | |||||||
| Class B | (1,626 | ) | (1,503 | ) | |||||||
| Class C | (3,378 | ) | (2,718 | ) | |||||||
| (7,497 | ) | (6,365 | ) | ||||||||
| From net realized gains: | |||||||||||
| Class A | (3,698 | ) | (1,842 | ) | |||||||
| Class B | (2,932 | ) | (1,833 | ) | |||||||
| Class C | (5,989 | ) | (3,177 | ) | |||||||
| (12,619 | ) | (6,852 | ) | ||||||||
| Capital Share Transactions: | |||||||||||
| Proceeds from shares sold: | |||||||||||
| Class A | 26,178 | 63,509 | |||||||||
| Class B | 7,695 | 20,440 | |||||||||
| Class C | 44,534 | 76,238 | |||||||||
| 78,407 | 160,187 | ||||||||||
| Dividends and distributions reinvested: | |||||||||||
| Class A | 5,404 | 3,385 | |||||||||
| Class B | 3,802 | 2,755 | |||||||||
| Class C | 6,740 | 4,104 | |||||||||
| 15,946 | 10,244 | ||||||||||
| Cost of shares redeemed: | |||||||||||
| Class A | (22,576 | ) | (40,008 | ) | |||||||
| Class B | (13,225 | ) | (25,746 | ) | |||||||
| Class C | (34,939 | ) | (58,161 | ) | |||||||
| (70,740 | ) | (123,915 | ) | ||||||||
| Redemption fees: | |||||||||||
| Class A | 1 | – | |||||||||
| Class B | – | 2 | |||||||||
| Class C | 2 | – | |||||||||
| 3 | 2 | ||||||||||
| April 30, 2006 (unaudited) | October 31, 2005 | ||||||||||
| Automatic conversions: | |||||||||||
| Class A | $ | 46 | $ | 179 | |||||||
| Class B | (46 | ) | (179 | ) | |||||||
| – | – | ||||||||||
| 23,616 | 46,518 | ||||||||||
| Net increase (decrease) in net assets | 38,082 | 56,608 | |||||||||
| Net Assets: | |||||||||||
| Beginning of period | 445,132 | 388,524 | |||||||||
| End of period | $ | 483,214 | $ | 445,132 | |||||||
| Distributable Net Investment Income (Loss) | $ | 1,404 | $ | 3,623 | |||||||
| Share Activity: | |||||||||||
| Shares issued: | |||||||||||
| Class A | 2,279 | 5,666 | |||||||||
| Class B | 672 | 1,832 | |||||||||
| Class C | 3,887 | 6,810 | |||||||||
| 6,838 | 14,308 | ||||||||||
| Shares issued-reinvested from distributions: | |||||||||||
| Class A | 484 | 301 | |||||||||
| Class B | 342 | 246 | |||||||||
| Class C | 605 | 366 | |||||||||
| 1,431 | 913 | ||||||||||
| Shares redeemed: | |||||||||||
| Class A | (1,962 | ) | (3,570 | ) | |||||||
| Class B | (1,154 | ) | (2,298 | ) | |||||||
| Class C | (3,051 | ) | (5,186 | ) | |||||||
| (6,167 | ) | (11,054 | ) | ||||||||
| Automatic conversions: | |||||||||||
| Class A | 4 | 16 | |||||||||
| Class B | (4 | ) | (16 | ) | |||||||
| – | – | ||||||||||
| Net increase (decrease) in shares outstanding: | |||||||||||
| Class A | 805 | 2,413 | |||||||||
| Class B | (144 | ) | (236 | ) | |||||||
| Class C | 1,441 | 1,990 | |||||||||
| 2,102 | 4,167 | ||||||||||
The notes to the financial statements are an integral part of this report.
Transamerica IDEX Mutual Funds
Semi-Annual Report 2006
4
TA IDEX Asset Allocation – Conservative Portfolio
FINANCIAL HIGHLIGHTS
(unaudited for the period ended April 30, 2006)
| For a share of beneficial interest outstanding throughout each period | |||||||||||||||||||||||||||||||||||||||
| Net Asset | Investment Operations | Distributions | Net Asset | ||||||||||||||||||||||||||||||||||||
| For the Period Ended (d)(g) | Value, Beginning of Period | Net Investment Income (Loss) | Net Realized and Unrealized Gain (Loss) | Total Operations | From Net Investment Income | From Net Realized Gains | Total Distributions | Value, End of Period | |||||||||||||||||||||||||||||||
| Class A | 4/30/2006 | $ | 11.35 | $ | 0.16 | $ | 0.72 | $ | 0.88 | $ | (0.21 | ) | $ | (0.32 | ) | $ | (0.53 | ) | $ | 11.70 | |||||||||||||||||||
| 10/31/2005 | 11.07 | 0.32 | 0.37 | 0.69 | (0.22 | ) | (0.19 | ) | (0.41 | ) | 11.35 | ||||||||||||||||||||||||||||
| 10/31/2004 | 10.67 | 0.17 | 0.77 | 0.94 | (0.51 | ) | (0.03 | ) | (0.54 | ) | 11.07 | ||||||||||||||||||||||||||||
| 10/31/2003 | 9.22 | 0.18 | 1.47 | 1.65 | (0.20 | ) | – | (0.20 | ) | 10.67 | |||||||||||||||||||||||||||||
| 10/31/2002 | 10.00 | 0.07 | (0.85 | ) | (0.78 | ) | – | – | – | 9.22 | |||||||||||||||||||||||||||||
| Class B | 4/30/2006 | 11.32 | 0.12 | 0.72 | 0.84 | (0.18 | ) | (0.32 | ) | (0.50 | ) | 11.66 | |||||||||||||||||||||||||||
| 10/31/2005 | 11.05 | 0.24 | 0.38 | 0.62 | (0.16 | ) | (0.19 | ) | (0.35 | ) | 11.32 | ||||||||||||||||||||||||||||
| 10/31/2004 | 10.66 | 0.10 | 0.76 | 0.86 | (0.44 | ) | (0.03 | ) | (0.47 | ) | 11.05 | ||||||||||||||||||||||||||||
| 10/31/2003 | 9.18 | 0.11 | 1.47 | 1.58 | (0.10 | ) | – | (0.10 | ) | 10.66 | |||||||||||||||||||||||||||||
| 10/31/2002 | 10.00 | 0.03 | (0.85 | ) | (0.82 | ) | – | – | – | 9.18 | |||||||||||||||||||||||||||||
| Class C | 4/30/2006 | 11.32 | 0.12 | 0.72 | 0.84 | (0.18 | ) | (0.32 | ) | (0.50 | ) | 11.66 | |||||||||||||||||||||||||||
| 10/31/2005 | 11.05 | 0.25 | 0.37 | 0.62 | (0.16 | ) | (0.19 | ) | (0.35 | ) | 11.32 | ||||||||||||||||||||||||||||
| 10/31/2004 | 10.66 | 0.10 | 0.76 | 0.86 | (0.44 | ) | (0.03 | ) | (0.47 | ) | 11.05 | ||||||||||||||||||||||||||||
| 10/31/2003 | 9.19 | 0.11 | 1.46 | 1.57 | (0.10 | ) | – | (0.10 | ) | 10.66 | |||||||||||||||||||||||||||||
| Ratios/Supplemental Data | |||||||||||||||||||||||||||||||
| For the Period | Total | Net Assets, End of Period | Ratio of Expenses to Average Net Assets (a)(j) | Net Investment Income (Loss) to Average | Portfolio Turnover | ||||||||||||||||||||||||||
| Ended (g) | Return (c) | (000's) | Net (e) | Total (f) | Net Assets (a)(i) | Rate (b) | |||||||||||||||||||||||||
| Class A | 4/30/2006 | 8.02 | % | $ | 143,112 | 0.58 | % | 0.58 | % | 2.73 | % | 28 | % | ||||||||||||||||||
| 10/31/2005 | 6.30 | 129,724 | 0.28 | 0.28 | 2.85 | 32 | |||||||||||||||||||||||||
| 10/31/2004 | 8.97 | 99,811 | 0.29 | (h) | 0.29 | (h) | 1.55 | 11 | |||||||||||||||||||||||
| 10/31/2003 | 18.18 | 59,250 | 0.41 | 0.41 | 1.80 | 22 | |||||||||||||||||||||||||
| 10/31/2002 | (7.80 | ) | 9,482 | 0.45 | 1.21 | 1.27 | 8 | ||||||||||||||||||||||||
| Class B | 4/30/2006 | 7.60 | 108,005 | 1.24 | 1.24 | 2.08 | 28 | ||||||||||||||||||||||||
| 10/31/2005 | 5.65 | 106,449 | 0.93 | 0.93 | 2.15 | 32 | |||||||||||||||||||||||||
| 10/31/2004 | 8.21 | 106,601 | 0.92 | (h) | 0.92 | (h) | 0.93 | 11 | |||||||||||||||||||||||
| 10/31/2003 | 17.38 | 85,134 | 1.06 | 1.06 | 1.15 | 22 | |||||||||||||||||||||||||
| 10/31/2002 | (8.20 | ) | 23,229 | 1.10 | 1.86 | 0.62 | 8 | ||||||||||||||||||||||||
| Class C | 4/30/2006 | 7.63 | 232,097 | 1.21 | 1.21 | 2.11 | 28 | ||||||||||||||||||||||||
| 10/31/2005 | 5.61 | 208,959 | 0.90 | 0.90 | 2.21 | 32 | |||||||||||||||||||||||||
| 10/31/2004 | 8.26 | 182,112 | 0.93 | (h) | 0.93 | (h) | 0.89 | 11 | |||||||||||||||||||||||
| 10/31/2003 | 17.25 | 83,165 | 1.06 | 1.06 | 1.15 | 22 | |||||||||||||||||||||||||
NOTES TO FINANCIAL HIGHLIGHTS
(a) Annualized.
(b) Not annualized.
(c) Total Return has been calculated for the applicable period without deduction of a sales load, if any, on an initial purchase. Not annualized.
(d) Per share information is calculated based on average number of shares outstanding.
(e) Ratio of Net Expenses to Average Net Assets is net of fee waivers and reimbursements by the investment adviser, if any (See Note 2).
(f) Ratio of Total Expenses to Average Net Assets includes all expenses before fee waivers and reimbursements by the investment adviser.
(g) TA IDEX Asset Allocation – Conservative Portfolio ("the Fund") commenced operations on March 1, 2002. The inception date for the Fund's offering of share Class C is November 11, 2002.
(h) Ratios of Total Expenses to Average Net Assets and net Expenses to Average Net Assets are inclusive of recaptured expenses by the investment advisor, if any. The impact of recaptured expenses was 0.01%, 0.01% and 0.01% for Class A, Class B and Class C, respectively (see Note 2).
(i) Recognition of net investment income by the Fund is affected by the timing of the declaration of dividends by the underlying investment companies in which the Fund invests.
(j) Does not include expenses of the investment companies in which the Fund invests.
The notes to the financial statements are an integral part of this report.
Transamerica IDEX Mutual Funds
Semi-Annual Report 2006
5
TA IDEX Asset Allocation – Conservative Portfolio
NOTES TO FINANCIAL STATEMENTS
At April 30, 2006
(all amounts in thousands)
(unaudited)
NOTE 1. ORGANIZATION AND SIGNIFICANT ACCOUNTING POLICIES
Transamerica IDEX Mutual Funds is an open-end management investment company registered under the Investment Company Act of 1940, as amended (the "1940 Act").
In the normal course of business, TA IDEX Asset Allocation - Conservative Portfolio (the "Fund") enters into contracts that contain a variety of representations that provide general indemnifications. The Fund's maximum exposure under these arrangements is unknown, as this would involve future claims that may be made against the Fund and/or its affiliates that have not yet occurred. However, based on experience, the Fund expects the risk of loss to be remote.
This report should be read in conjunction with the current Fund prospectus, which contains more complete information about the Fund.
In preparing the Fund's financial statements in accordance with accounting principles generally accepted in the United States of America ("GAAP"), estimates or assumptions (which could differ from actual results) may be used that affect reported amounts and disclosures. The following is a summary of significant accounting policies followed by the Fund.
Multiple class operations, income and expenses: The Fund currently offers three classes of shares, Class A, Class B, and Class C, each with a public offering price that reflects different sales charges, if any, and expense levels. Class B shares will convert to Class A shares eight years after purchase. Income, non-class specific expenses and realized and unrealized gains and losses, are allocated daily to each class, based upon the value of shares outstanding method as permitted under Rule 18f-3 of the 1940 Act. Each class bears its own specific expenses as well as a portion of general, common expenses.
Security valuations: Investment company securities are valued at the net asset value of the underlying portfolio.
Cash: The Fund may leave cash overnight in its cash account with the custodian, Investors Bank & Trust Company ("IBT"). IBT has been contracted on behalf of the Fund to invest the excess cash into a savings account, which at April 30, 2006, was paying an interest rate of 3.24%.
Throughout the year, the Fund may have a cash overdraft balance. A fee is incurred on this overdraft, calculated by multiplying the overdraft by a rate based on the federal funds rate.
Security transactions and investment income: Security transactions are recorded on the trade date. Security gains and losses are calculated on the specific identification basis. Dividend income, if any, is recorded on the ex-dividend date. Dividends and net realized gain (loss) from investment securities for the Fund are from investments in shares of affiliated investment companies.
Redemption fees: A short-term trading redemption fee may be assessed on any fund shares in a fund account that are sold during the first five (5) New York Stock Exchange ("NYSE") trading days following their purchase date. This redemption fee will equal 2% of the amount redeemed and shares held the longest will be treated as being redeemed first and shares held the shortest as being redeemed last. For the six months ended April 30, 2006, the Fund received $3 in redemption fees.
Dividend distributions: Distributions to shareholders are recorded on the ex-dividend date and are determined in accordance with Federal income tax regulations which may differ from GAAP.
NOTE 2. RELATED PARTY TRANSACTIONS
Transamerica Fund Advisors, Inc. ("TFAI") is the Fund's investment adviser. Transamerica Fund Services, Inc. ("TFS") is the Fund's administrator and transfer agent. AFSG Securities Corp. ("AFSG") is the Fund's distributor/principal underwriter. TFAI, TFS, and AFSG are affiliates of AEGON, NV, a Netherlands corporation.
Transamerica Investment Management, LLC and Great Companies, L.L.C. are affiliates of the Fund and are sub-advisers to other funds within Transamerica IDEX Mutual Funds.
Certain officers and trustees of the Fund are also officers and/or directors of TFAI, TFS and AFSG.
Because the underlying funds have varied expense and fee levels and the Fund may own different proportions of underlying funds at different times, the amount of fees and expenses incurred indirectly by the Fund will vary.
Investment advisory fees: The Fund pays management fees to TFAI based on average daily net assets ("ANA") at the following rate:
0.10% of ANA
TFAI has contractually agreed to waive its advisory fee and will reimburse the Fund to the extent that operating expenses, excluding 12b-1 fees, exceed the following stated annual limit:
0.45% Expense Limit
If total Fund expenses fall below the annual expense limitation agreement agreed to by the adviser within the succeeding three years, the Fund may be required to pay the adviser a portion or all of the waived advisory fees.
Transamerica IDEX Mutual Funds
Semi-Annual Report 2006
6
TA IDEX Asset Allocation – Conservative Portfolio
NOTES TO FINANCIAL STATEMENTS (continued)
At April 30, 2006
(all amounts in thousands)
(unaudited)
NOTE 2.–(continued)
There are no amounts available for recapture at April 30, 2006.
Distribution and service fees: The Fund has a 12b-1 distribution plan under the 1940 Act pursuant to which an annual fee, based on average daily net assets, is paid to the distributor for various disbursements such as broker-dealer account servicing fees and other promotional expenses of the Fund. The Fund is authorized under the 12b-1 plan to pay fees on each class up to the following limits:
| Class A | 0.35 | % | |||||
| Class B | 1.00 | % | |||||
| Class C | 1.00 | % | |||||
In the case the Fund or a class of shares of the Fund is closed to new investors or investments, the Fund is authorized to pay 12b-1 fees for past sales and distribution efforts and present and past investor services.
Underwriter commissions relate to front-end sales charges imposed for Class A shares and contingent deferred sales charges from Classes B, C, and certain A share redemptions. For the six months ended April 30, 2006, the underwriter commissions were as follows:
| Received by Underwriter | $ | 978 | |||||
| Retained by Underwriter | 159 | ||||||
| Contingent Deferred Sales Charge | 201 | ||||||
Administrative services: The Fund has entered into an agreement with TFS for financial and legal fund administration services. As of January 1, 2006, the Fund pays TFS an annual fee of 0.0125% of ANA. For the period November 1, 2005 through December 31, 2005, the Fund paid TFS an annual fee of 0.02% of ANA. The Legal fees on the Statement of Operations are fees paid to external legal counsel.
Transfer agent fees: The Fund pays TFS an annual per-account charge for each open and closed account. The Fund paid TFS $180 for the six months ended April 30, 2006.
Deferred compensation plan: Each eligible independent Fund Trustee may elect to participate in a non-qualified deferred compensation plan maintained by Transamerica IDEX Mutual Funds (the "Plan"). Under the Plan, such Trustees may defer payment of all or a portion of their total fees earned as a Fund Trustee. Each Trustee who is a participant in the Plan may elect that the earnings, losses or gains credited to his or her deferred fee amounts be determined based on a deemed investment in any series of Transamerica IDEX Mutual Funds, including the Fund. The right of a participant to receive a distribution from the Plan of the deferred fees is an unsecured claim against the general assets of all series of Transamerica IDEX Mutual Funds. The pro rata liability to the Fund of all defer red fees in the Plan amounted, as of April 30, 2006, to $14.
NOTE 3. INVESTMENT TRANSACTIONS
The cost of securities purchased and proceeds from securities sold (excluding short-term securities) for the six months ended April 30, 2006 were as follows:
| Purchases of securities: | |||||||
| Long-Term | $ | 142,407 | |||||
| U.S. Government | — | ||||||
| Proceeds from maturities and sales of securities: | |||||||
| Long-Term | 129,947 | ||||||
| U.S. Government | — | ||||||
NOTE 4. FEDERAL INCOME TAX MATTERS
The Fund has not made any provision for federal income or excise taxes due to its policy to distribute all of its taxable income and capital gains to its shareholders and otherwise qualify as a regulated investment company under Subchapter M of the Internal Revenue Code. Income and capital gain distributions are determined in accordance with income tax regulations, which may differ from GAAP. These differences are primarily due to differing treatment for items including, but not limited to, wash sales and distribution reclasses.
NOTE 5. REGULATORY PROCEEDINGS
There continues to be significant federal and state regulatory activity relating to financial services companies, particularly mutual fund companies and their investment advisers. As part of an ongoing investigation regarding potential market timing, recordkeeping and trading compliance issues and matters affecting the Fund's investment adviser, TFAI, and certain affiliates and former employees of TFAI, the SEC staff has indicated that it is likely to take some action against TFAI and certain of its affiliates at the conclusion of the investigation. The potential timing and the scope of any such action is difficult to predict. Although the impact of any action brought against TFAI and/or its affiliates is difficult to assess at the present time, the Fund currently believes that the likelihood that any such action will have a material adverse impact on it is remote. It is important to note that the Fund is not aware of any allega tion of wrongdoing against it and its Board at the time this semi-annual report is printed. Although it is not anticipated that these developments will have an adverse impact on the Fund, there can be no assurance at this time. TFAI and its affiliates are actively working with the SEC in regard to this matter; however, the exact resolution cannot be determined at this time. TFAI will take such actions that it deems necessary or appropriate to continue providing management services to the Fund and to bring all matters to an appropriate conclusion.
TFAI and/or its affiliates, and not the Fund, will bear the costs regarding these regulatory matters.
Transamerica IDEX Mutual Funds
Semi-Annual Report 2006
7
TA IDEX Asset Allocation – Conservative Portfolio
INVESTMENT ADVISORY AND ASSET ALLOCATION MANAGEMENT AGREEMENTS — REVIEW AND RENEWAL (unaudited)
At a meeting of the Board of Trustees of Transamerica IDEX Mutual Funds ("TA IDEX") held on November 2, 2005, the Board reviewed and considered the Investment Advisory Agreement between TA IDEX Asset Allocation - Conservative Portfolio (the "Fund") and Transamerica Fund Advisors, Inc. ("TFAI"), as well as the Asset Allocation Management Agreement of the Fund between TFAI and Morningstar Associates, LLC (the "Portfolio Construction Manager"), to determine whether the agreements should be renewed for a one-year period. Following their review and consideration, the Trustees determined that the Investment Advisory Agreement and the Asset Allocation Management Agreement will enable shareholders of the Fund to obtain high quality services at a cost that is appropriate, reasonable, and in the best interests of its shareholders. The Board, including the independent members of the Board, unanimously approved the renewal of the Investment Advisory Agreement and the Asset Allocation Management Agreement. In reaching their decision, the Trustees requested and obtained from TFAI and the Portfolio Construction Manager such information as they deemed reasonably necessary to evaluate the proposed agreements. The Trustees also carefully considered the information that they had received throughout the year from TFAI and the Portfolio Construction Manager (such as in-person presentations by the Portfolio Construction Manager) as part of their regular oversight of the Fund, as well as: comparative fee, expense and performance information prepared by Lipper Inc. ("Lipper"), independent providers of mutual fund performance, fee and expense information, and profitability data. In considering the proposed continuation of the Investment Advisory Agreement and the Asset Allocation Management Agreement, the Trustees evaluated a number of considerations that they believe, in light of the legal advice furnished to them by TA IDEX counsel and independent legal counsel and their own business judgment, to be relevant. They based their decisions on the following considerations, among others, although they did not identify any consideration or particular information that was controlling of their decisions:
The nature, extent and quality of the advisory service to be provided. The Board considered the nature and quality of the services provided by TFAI and the Portfolio Construction Manager to the Fund in the past, as well as the services anticipated to be provided in the future. The Board concluded that TFAI and the Portfolio Construction Manager are capable of providing high quality services to the Fund, as indicated by the nature and quality of services provided in the past, TFAI's and the Portfolio Construction Manager's management capabilities demonstrated with respect to the funds they manage, including the Fund, and the experience, capability and integrity of TFAI's senior management, the financial resources of TFAI and the Portfolio Construction Manager, TFAI's management oversight process, the professional qualifications and experience of the Po rtfolio Construction Manager's portfolio management team, and the Fund's investment performance. The Trustees also concluded that TFAI and the Portfolio Construction Manager proposed to provide investment and related services that were of the same quality and quantity as services provided to the Fund in the past, and that these services are appropriate in scope and extent in light of the Fund's operations, the competitive landscape of the investment company business and investor needs, and that TFAI's and the Portfolio Construction Manager's obligations will remain substantially the same.
The investment performance of the Fund. The Board examined both the short-term and longer-term performance of the Fund, including relative performance against a benchmark securities index and a peer group of comparable mutual funds as prepared by Lipper, for various trailing periods ended June 30, 2005. The Trustees concluded that TFAI and the Portfolio Construction Manager generally had achieved competitive investment performance, noting that the performance of the Fund has been below median relative to its peers over the past one-year period, but has been above median relative to its peers over the past three-year period, and competitive to the benchmark index over the past one-, two- and three-year periods. On the basis of the Trustees' assessment of the nature, extent and quality of advisory services to be provided or procured by TFAI and the Port folio Construction Manager, the Trustees concluded that TFAI and the Portfolio Construction Manager are capable of generating a level of investment performance that is appropriate in light of the Fund's investment objective, policies and strategies and competitive with many other investment companies, and also determined that TFAI's and the Portfolio Construction Manager's performance records indicate that their continued management is likely to benefit the Fund and its shareholders.
The cost of advisory services provided and the level of profitability. The Board reviewed profitability information regarding TFAI's costs of procuring portfolio management services, as well as the costs of provision of administration, transfer agency, fund accounting and other services, to the Fund and to TA IDEX as a whole by TFAI and its affiliates. However, the Board noted that the profitability data provided to the Board was based on a prior fee arrangement which has been changed following negotiations between TFAI and the Portfolio Construction Manager pursuant to which the Portfolio Construction Manager agreed to assume additional responsibilities in managing the Fund, and the Board noted that the Portfolio Construction Manager receives the entirety of the management fee payable by the Fund while TFAI gets compensated through the management fee s payable by the underlying funds in which the Fund invests. The Trustees reviewed data from Lipper that compared the Fund's management fees, and other fees and expenses (including total expenses including and excluding 12b-1 distribution and service fees). Based on such
Transamerica IDEX Mutual Funds
Semi-Annual Report 2006
8
TA IDEX Asset Allocation – Conservative Portfolio (continued)
information, the Trustees determined that the management fees and overall expense ratio of the Fund generally are consistent with industry averages. In addition, on the basis of the Board's review of the management fees to be charged by TFAI for investment advisory and related services, TFAI profitability information (derived from TFAI's audited financial statements), TFAI's estimated management income resulting from its management of the Fund, the estimated margin of the Portfolio Construction Manager, as well as the entirety of TFAI's and its affiliates' service relationship with TA IDEX, the Board concluded that the level of investment management fees and other service fees, as well as TFAI's and the Portfolio Construction Manager's profitability, are appropriate in light of the services provided, the management fees and overall expense ratios of comparable investment companies and the anticipated profitability of the relatio nship between the Fund, TFAI and its affiliates, and the Portfolio Construction Manager.
Whether fee levels reflect economies of scale and the extent to which economies of scale would be realized as the Fund grows. The Board noted that the management fee of the Fund does not contain asset-based breakpoints, despite TFAI's efforts to negotiate such breakpoints with the Portfolio Construction Manager (the Board instructed TFAI to continue to try to negotiate breakpoints for the Fund in the future). However, the Board also noted that, based on the information provided by TFAI, the Fund's investments in underlying funds have permitted the realization of breakpoints (or lower breakpoints) at the underlying fund level which, indirectly, benefit the Fund and its shareholders, as well as the underlying funds. The Board carefully reviewed the one- and three-year performance record and the fees and expenses of the Fund and the comparative informati on provided by Lipper. The Board concluded that the Fund has management fees in line with, or lower than, its peers. The Board also concluded that the Fund's management fee appropriately reflects the Fund's current size, the current economic environment for TFAI, the competitive nature of the investment company market, and TFAI's pricing strategy. The Trustees also concluded that they will have the opportunity to periodically reexamine whether the Fund has achieved economies of scale, and the appropriateness of management fees payable to TFAI and fees payable to the Portfolio Construction Manager, in the future.
Benefits (such as soft dollars) to TFAI, its affiliates, or the Portfolio Construction Manager from their relationship with the Fund. The Board concluded that other benefits derived by TFAI (including any benefits derived from investment advisory fees payable to TFAI with respect to the underlying funds in which the Fund invests) or the Portfolio Construction Manager from its relationship with the Fund are reasonable and fair, and are consistent with industry practice and the best interests of the Fund and its shareholders. In this regard, the Board noted that neither TFAI nor the Portfolio Construction Manager realizes "soft dollar" benefits from its relationship with the Fund. In addition, the Trustees determined that the administration, transfer agency, fund accounting and other fees paid by the Fund to affiliates of TFAI are reasonable, fair and i n the best interests of shareholders in light of the nature and quality of the services provided, the associated costs to these affiliates of providing the services, the impact of the costs of such services on the Fund's overall operating expenses, and the necessity of the services for the Fund's operations.
Other considerations. The Board determined that TFAI had made a substantial commitment to the recruitment and retention of high quality personnel, and maintained the financial, compliance and operational resources reasonably necessary to manage the Fund in a professional manner that is consistent with the best interests of the Fund and its shareholders. In this regard, the Trustees favorably considered the procedures and policies in place by TFAI to enforce compliance with applicable laws and regulations and oversee the portfolio management activities of the Portfolio Construction Manager. The Trustees also determined that TFAI had made a significant entrepreneurial commitment to the management and success of the Fund, reflected by TFAI's expense limitation and fee waiver arrangement with the Fund, which may result in TFAI waiving advisory fees for th e benefit of shareholders.
Transamerica IDEX Mutual Funds
Semi-Annual Report 2006
9
TA IDEX Asset Allocation – Growth Portfolio
UNDERSTANDING YOUR FUND'S EXPENSES
(unaudited)
SHAREHOLDER EXPENSES
Fund shareholders may incur two types of costs: (1) transaction costs, including sales charges (loads) on purchases, contingent deferred sales charges on redemptions and redemption fees; and (2) ongoing costs, including management fees, 12b-1 distribution and service fees, and other fund expenses.
The following Example is intended to help you understand your ongoing costs (in dollars and cents) of investing in the Fund and to compare these costs with the ongoing costs of investing in other funds.
The Example is based on an investment of $1,000 invested at November 1, 2005 and held for the entire period until April 30, 2006.
ACTUAL EXPENSES
The first line in the table below provides information about actual account values and actual expenses. You may use the information in this line, together with the amount you invested, to estimate the expenses that you paid over the period. Simply divide your account value by $1,000 (for example, an $8,600 account value divided by $1,000 = 8.6), then multiply the result by the number in the first line of your Fund under the heading entitled "Expenses Paid During Period" to estimate the expenses you paid on your account during this period. If your account is an IRA, your expenses could have included a $15 annual fee. The amount of any fee paid through your account would increase the estimate of expenses you paid during the period and decrease your ending account value.
HYPOTHETICAL EXAMPLE FOR COMPARISON PURPOSES
The second line in the table below provides information about hypothetical account values and hypothetical expenses based on the Fund's actual expense ratio and an assumed rate of return of 5% per year before expenses, which is not the Fund's actual return. The hypothetical account values and expenses may not be used to estimate the actual ending account balance or expenses you paid for the period. You may use this information to compare the ongoing costs of investing in your Fund and other funds. To do so, compare this 5% hypothetical example with the 5% hypothetical examples that appear in the shareholder reports of the other funds. As in the case of the actual expense example, if your account is subject to an IRA fee, the amount of the fee paid through your account would increase the hypothetical expenses you would have paid during the period and decrease the hypothetical ending account value.
Please note that the expenses shown in the table are meant to highlight your ongoing costs only and do not reflect any transactional costs, such as sales charges, redemption fees, brokerage commissions paid on purchases and sales of fund shares. Therefore, the second line under the Fund in the table is useful in comparing ongoing costs only, and will not help you determine the relative total costs of owning different funds. If any of these transaction costs were included, your costs would be higher. The expenses shown in the table do not reflect any fees that may be charged to you by brokers, financial intermediaries or other financial institutions. The expenses shown in the table do not reflect any expenses from the Funds investment in other affiliated investment companies. The average weighted annualized expense ratio of the underlying investment companies at April 30, 2006, was 0.93%.
| Beginning Account Value | Ending Account Value | Annualized Expense Ratio | Expenses Paid During Period (a) | ||||||||||||||||
| Class A | |||||||||||||||||||
| Actual | $ | 1,000.00 | $ | 1,154.30 | 0.61 | % | $ | 3.26 | |||||||||||
| Hypothetical(b) | 1,000.00 | 1,021.77 | 0.61 | % | 3.06 | ||||||||||||||
| Class B | |||||||||||||||||||
| Actual | $ | 1,000.00 | $ | 1,150.50 | 1.27 | % | $ | 6.77 | |||||||||||
| Hypothetical(b) | 1,000.00 | 1,018.50 | 1.27 | % | 6.36 | ||||||||||||||
| Class C | |||||||||||||||||||
| Actual | $ | 1,000.00 | $ | 1,150.90 | 1.22 | % | $ | 6.51 | |||||||||||
| Hypothetical(b) | 1,000.00 | 1,018.74 | 1.22 | % | 6.11 | ||||||||||||||
(a) Expenses are calculated using the Fund's annualized expense ratio (as disclosed in the table), multiplied by the average account value for the period, multiplied by number of days in the period (181 days), and divided by the number of days in the year (365 days).
(b) 5% return per year before expenses.
GRAPHIC PRESENTATION OF SCHEDULE OF INVESTMENTS
By Investment Type
At April 30, 2006
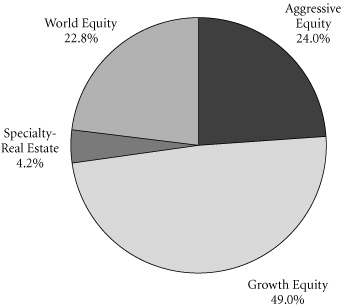
This chart shows the percentage breakdown by investment type of the Fund's total investment securities.
Transamerica IDEX Mutual Funds
Semi-Annual Report 2006
1
TA IDEX Asset Allocation – Growth Portfolio
SCHEDULE OF INVESTMENTS
At April 30, 2006
(all amounts except share amounts in thousands)
(unaudited)
| Shares | Value | ||||||||||
| INVESTMENT COMPANIES (99.6%) Ø | |||||||||||
| Aggressive Equity (23.9%) | |||||||||||
| TA IDEX Evergreen Health Care | 5,144,659 | $ | 68,990 | ||||||||
| TA IDEX J.P. Morgan Mid Cap Value | 6,290,982 | 69,452 | |||||||||
| TA IDEX Transamerica Growth Opportunities ‡ | 7,298,224 | 65,757 | |||||||||
| TA IDEX Transamerica Small/Mid Cap Value | 7,697,567 | 140,250 | |||||||||
| Growth Equity (48.8%) | |||||||||||
| TA IDEX American Century Large Company Value | 5,495,709 | 63,585 | |||||||||
| TA IDEX Great Companies-TechnologySM | 3,943,100 | 16,324 | |||||||||
| TA IDEX Jennison Growth | 8,486,900 | 98,024 | |||||||||
| TA IDEX Mercury Large Cap Value | 22,442,179 | 263,247 | |||||||||
| TA IDEX Transamerica Equity | 17,914,891 | 176,820 | |||||||||
| TA IDEX Van Kampen Mid-Cap Growth ‡ | 3,280,051 | 35,392 | |||||||||
| TA IDEX Van Kampen Small Company Growth | 3,692,716 | 49,039 | |||||||||
| Specialty–Real Estate (4.2%) | |||||||||||
| TA IDEX Clarion Global Real Estate Securities | 3,441,457 | 60,879 | |||||||||
| World Equity (22.7%) | |||||||||||
| TA IDEX AllianceBernstein International Value | 1,896,477 | 22,568 | |||||||||
| TA IDEX Evergreen International Small Cap | 4,060,450 | 67,647 | |||||||||
| TA IDEX Marsico International Growth | 3,260,147 | 45,968 | |||||||||
| TA IDEX Mercury Global Allocation | 5,387,691 | 59,211 | |||||||||
| TA IDEX Neuberger Berman International | 6,445,659 | 77,864 | |||||||||
| TA IDEX Oppenheimer Developing Markets | 4,053,325 | 47,748 | |||||||||
| TA IDEX Templeton Great Companies Global ‡ | 220,718 | 6,209 | |||||||||
| Total Investment Companies (cost: $1,212,320) # | $ | 1,434,974 | |||||||||
NOTES TO SCHEDULE OF INVESTMENTS:
Ø The Fund invests its assets in Class I shares of the underlying TA IDEX Mutual Funds, which are affiliates of the Fund.
‡ Non-income producing.
# Aggregate cost for Federal income tax purposes is $1,213,345. Aggregate gross unrealized appreciation for all securities in which there is an excess of value over tax cost and aggregate gross unrealized depreciation for all securities in which there is an excess of tax cost over value were $221,630 and $1, respectively. Net unrealized appreciation for tax purposes is $221,629.
The notes to the financial statements are an integral part of this report.
Transamerica IDEX Mutual Funds
Semi-Annual Report 2006
2
TA IDEX Asset Allocation – Growth Portfolio
STATEMENT OF ASSETS AND LIABILITIES
At April 30, 2006
(all amounts except share amounts in thousands)
(unaudited)
| Assets: | |||||||
| Investment in affiliated investment companies at value (cost: $1,212,320) | $ | 1,434,974 | |||||
| Cash | 7 | ||||||
| Receivables: | |||||||
| Shares of beneficial interest sold | 11,032 | ||||||
| Other | 22 | ||||||
| 1,446,035 | |||||||
| Liabilities: | |||||||
| Investment securities purchased | 2,809 | ||||||
| Accounts payable and accrued liabilities: | |||||||
| Shares of beneficial interest redeemed | 1,275 | ||||||
| Management and advisory fees | 116 | ||||||
| Distribution and service fees | 935 | ||||||
| Transfer agent fees | 17 | ||||||
| Dividends to shareholders | 9 | ||||||
| Other | 41 | ||||||
| 5,202 | |||||||
| Net Assets | $ | 1,440,833 | |||||
| Net Assets Consist of: | |||||||
| Shares of beneficial interest, unlimited shares authorized, no par value | $ | 1,162,150 | |||||
| Distributable net investment income (loss) | (358 | ) | |||||
| Accumulated net realized gain (loss) from investment in affiliated investment companies | 56,388 | ||||||
| Net unrealized appreciation (depreciation) on investment in affiliated investment companies | 222,653 | ||||||
| Net Assets | $ | 1,440,833 | |||||
| Net Assets by Class: | |||||||
| Class A | $ | 414,114 | |||||
| Class B | 271,954 | ||||||
| Class C | 754,765 | ||||||
| Shares Outstanding: | |||||||
| Class A | 31,059 | ||||||
| Class B | 20,742 | ||||||
| Class C | 57,550 | ||||||
| Net Asset Value Per Share: | |||||||
| Class A | $ | 13.33 | |||||
| Class B | 13.11 | ||||||
| Class C | 13.12 | ||||||
| Maximum Offering Price Per Share (a): | |||||||
| Class A | $ | 14.11 | |||||
(a) Includes the maximum selling commission (represented as a percentage of offering price) which is reduced on certain levels of sales as set forth in the Prospectus. Net asset value per share for Classes B and C shares represents offering price. The redemption price for Classes B and C shares equals net asset value less any applicable contingent deferred sales charge.
STATEMENT OF OPERATIONS
For the period ended April 30, 2006
(all amounts in thousands)
(unaudited)
| Investment Income: | |||||||
| Dividends from affiliated investment companies | $ | 11,300 | |||||
| Expenses: | |||||||
| Management and advisory fees | 602 | ||||||
| Distribution and service fees: | |||||||
| Class A | 556 | ||||||
| Class B | 1,168 | ||||||
| Class C | 3,037 | ||||||
| Transfer agent fees: | |||||||
| Class A | 229 | ||||||
| Class B | 170 | ||||||
| Class C | 288 | ||||||
| Printing and shareholder reports | 66 | ||||||
| Custody fees | 22 | ||||||
| Administration fees | 89 | ||||||
| Legal fees | 27 | ||||||
| Audit fees | 9 | ||||||
| Trustees fees | 22 | ||||||
| Registration fees | 76 | ||||||
| Other | 11 | ||||||
| Total expenses | 6,372 | ||||||
| Net Investment Income (Loss) | 4,928 | ||||||
| Net Realized and Unrealized Gain (Loss) on Investment in Affiliated Investment Companies: | |||||||
| Realized gain (loss) from investment in affiliated investment companies | 35,614 | ||||||
| Realized gain distributions from investment in affiliated investment companies | 21,694 | ||||||
| 57,308 | |||||||
| Increase (decrease) in unrealized appreciation (depreciation) on investment in affiliated investment companies | 104,224 | ||||||
| Net Realized and Unrealized Gain (Loss) on Investment in Affiliated Investment Companies | 161,532 | ||||||
| Net Increase (Decrease) in Net Assets Resulting from Operations | $ | 166,460 | |||||
The notes to the financial statements are an integral part of this report.
Transamerica IDEX Mutual Funds
Semi-Annual Report 2006
3
TA IDEX Asset Allocation – Growth Portfolio
STATEMENTS OF CHANGES IN NET ASSETS
For the period or year ended
(all amounts in thousands)
| April 30, 2006 (unaudited) | October 31, 2005 | ||||||||||
| Increase (Decrease) in Net Assets From: | |||||||||||
| Operations: | |||||||||||
| Net investment income (loss) | $ | 4,928 | $ | (228 | ) | ||||||
| Net realized gain (loss) from investment in affiliated investment companies | 57,308 | 31,932 | |||||||||
| Change in unrealized appreciation (depreciation) on investment in affiliated investment companies | 104,224 | 69,271 | |||||||||
| 166,460 | 100,975 | ||||||||||
| Distributions to Shareholders: | |||||||||||
| From net investment income: | |||||||||||
| Class A | (2,669 | ) | (2,140 | ) | |||||||
| Class B | (678 | ) | (1,002 | ) | |||||||
| Class C | (1,941 | ) | (2,477 | ) | |||||||
| (5,288 | ) | (5,619 | ) | ||||||||
| From net realized gains: | |||||||||||
| Class A | (8,870 | ) | (1,161 | ) | |||||||
| Class B | (6,584 | ) | (1,060 | ) | |||||||
| Class C | (16,475 | ) | (2,385 | ) | |||||||
| (31,929 | ) | (4,606 | ) | ||||||||
| Capital Share Transactions: | |||||||||||
| Proceeds from shares sold: | |||||||||||
| Class A | 113,708 | 131,025 | |||||||||
| Class B | 42,935 | 55,124 | |||||||||
| Class C | 194,673 | 197,065 | |||||||||
| 351,316 | 383,214 | ||||||||||
| Dividends and distributions reinvested: | |||||||||||
| Class A | 10,031 | 2,790 | |||||||||
| Class B | 6,220 | 1,725 | |||||||||
| Class C | 13,231 | 3,362 | |||||||||
| 29,482 | 7,877 | ||||||||||
| Cost of shares redeemed: | |||||||||||
| Class A | (32,651 | ) | (43,846 | ) | |||||||
| Class B | (14,714 | ) | (25,580 | ) | |||||||
| Class C | (48,372 | ) | (75,101 | ) | |||||||
| (95,737 | ) | (144,527 | ) | ||||||||
| Redemption fees: | |||||||||||
| Class A | 1 | 2 | |||||||||
| Class C | 1 | 1 | |||||||||
| 2 | 3 | ||||||||||
| Automatic conversions: | |||||||||||
| Class A | 267 | 351 | |||||||||
| Class B | (267 | ) | (351 | ) | |||||||
| — | — | ||||||||||
| 285,063 | 246,567 | ||||||||||
| Net increase (decrease) in net assets | 414,306 | 337,317 | |||||||||
| Net Assets: | |||||||||||
| Beginning of period | 1,026,527 | 689,210 | |||||||||
| End of period | $ | 1,440,833 | $ | 1,026,527 | |||||||
| Distributable Net Investment Income (Loss) | $ | (358 | ) | $ | 2 | ||||||
| April 30, 2006 (unaudited) | October 31, 2005 | ||||||||||
| Share Activity: | |||||||||||
| Shares issued: | |||||||||||
| Class A | 8,881 | 11,457 | |||||||||
| Class B | 3,413 | 4,905 | |||||||||
| Class C | 15,460 | 17,476 | |||||||||
| 27,754 | 33,838 | ||||||||||
| Shares issued-reinvested from distributions: | |||||||||||
| Class A | 826 | 246 | |||||||||
| Class B | 520 | 154 | |||||||||
| Class C | 1,105 | 301 | |||||||||
| 2,451 | 701 | ||||||||||
| Shares redeemed: | |||||||||||
| Class A | (2,551 | ) | (3,822 | ) | |||||||
| Class B | (1,172 | ) | (2,258 | ) | |||||||
| Class C | (3,870 | ) | (6,645 | ) | |||||||
| (7,593 | ) | (12,725 | ) | ||||||||
| Automatic conversions: | |||||||||||
| Class A | 21 | 30 | |||||||||
| Class B | (21 | ) | (31 | ) | |||||||
| — | (1 | ) | |||||||||
| Net increase (decrease) in shares outstanding: | |||||||||||
| Class A | 7,177 | 7,911 | |||||||||
| Class B | 2,740 | 2,770 | |||||||||
| Class C | 12,695 | 11,132 | |||||||||
| 22,612 | 21,813 | ||||||||||
The notes to the financial statements are an integral part of this report.
Transamerica IDEX Mutual Funds
Semi-Annual Report 2006
4
TA IDEX Asset Allocation – Growth Portfolio
FINANCIAL HIGHLIGHTS
(unaudited for the period ended April 30, 2006)
| For a share of beneficial interest outstanding throughout each period | |||||||||||||||||||||||||||||||||||||||
| Net Asset | Investment Operations | Distributions | Net Asset | ||||||||||||||||||||||||||||||||||||
| For the Period Ended (d)(g) | Value, Beginning of Period | Net Investment Income (Loss) | Net Realized and Unrealized Gain (Loss) | Total Operations | From Net Investment Income | From Net Realized Gains | Total Distributions | Value, End of Period | |||||||||||||||||||||||||||||||
| Class A | 4/30/2006 | $ | 11.99 | $ | 0.08 | $ | 1.73 | $ | 1.81 | $ | (0.11 | ) | $ | (0.36 | ) | $ | (0.47 | ) | $ | 13.33 | |||||||||||||||||||
| 10/31/2005 | 10.75 | 0.05 | 1.38 | 1.43 | (0.12 | ) | (0.07 | ) | (0.19 | ) | 11.99 | ||||||||||||||||||||||||||||
| 10/31/2004 | 9.82 | (0.02 | ) | 0.95 | 0.93 | - | - | - | 10.75 | ||||||||||||||||||||||||||||||
| 10/31/2003 | 7.95 | (0.03 | ) | 1.90 | 1.87 | - | - | - | 9.82 | ||||||||||||||||||||||||||||||
| 10/31/2002 | 10.00 | (0.02 | ) | (2.03 | ) | (2.05 | ) | - | - | - | 7.95 | ||||||||||||||||||||||||||||
| Class B | 4/30/2006 | 11.77 | 0.04 | 1.70 | 1.74 | (0.04 | ) | (0.36 | ) | (0.40 | ) | 13.11 | |||||||||||||||||||||||||||
| 10/31/2005 | 10.57 | (0.03 | ) | 1.36 | 1.33 | (0.06 | ) | (0.07 | ) | (0.13 | ) | 11.77 | |||||||||||||||||||||||||||
| 10/31/2004 | 9.71 | (0.09 | ) | 0.95 | 0.86 | - | - | - | 10.57 | ||||||||||||||||||||||||||||||
| 10/31/2003 | 7.91 | (0.08 | ) | 1.88 | 1.80 | - | - | - | 9.71 | ||||||||||||||||||||||||||||||
| 10/31/2002 | 10.00 | (0.06 | ) | (2.03 | ) | (2.09 | ) | - | - | - | 7.91 | ||||||||||||||||||||||||||||
| Class C | 4/30/2006 | 11.78 | 0.04 | 1.70 | 1.74 | (0.04 | ) | (0.36 | ) | (0.40 | ) | 13.12 | |||||||||||||||||||||||||||
| 10/31/2005 | 10.57 | (0.02 | ) | 1.37 | 1.35 | (0.07 | ) | (0.07 | ) | (0.14 | ) | 11.78 | |||||||||||||||||||||||||||
| 10/31/2004 | 9.71 | (0.08 | ) | 0.94 | 0.86 | - | - | - | 10.57 | ||||||||||||||||||||||||||||||
| 10/31/2003 | 7.86 | (0.08 | ) | 1.93 | 1.85 | - | - | - | 9.71 | ||||||||||||||||||||||||||||||
| Ratios/Supplemental Data | |||||||||||||||||||||||||||||||
| For the Period | Total | Net Assets, End of Period | Ratio of Expenses to Average Net Assets (a)(j) | Net Investment Income (Loss) to Average | Portfolio Turnover | ||||||||||||||||||||||||||
| Ended (g) | Return (c) | (000's) | Net (e) | Total (f) | Net Assets (a)(i) | Rate (b) | |||||||||||||||||||||||||
| Class A | 4/30/2006 | 15.43 | % | $ | 414,114 | 0.61 | % | 0.61 | % | 1.26 | % | 24 | % | ||||||||||||||||||
| 10/31/2005 | 13.42 | 286,412 | 0.34 | 0.34 | 0.42 | 35 | |||||||||||||||||||||||||
| 10/31/2004 | 9.47 | 171,708 | 0.43 | (h) | 0.43 | (h) | (0.22 | ) | 5 | ||||||||||||||||||||||
| 10/31/2003 | 23.52 | 55,209 | 0.45 | 0.60 | (0.30 | ) | 25 | ||||||||||||||||||||||||
| 10/31/2002 | (20.50 | ) | 8,368 | 0.45 | 1.65 | (0.44 | ) | 31 | |||||||||||||||||||||||
| Class B | 4/30/2006 | 15.05 | 271,954 | 1.27 | 1.27 | 0.62 | 24 | ||||||||||||||||||||||||
| 10/31/2005 | 12.55 | 211,904 | 0.99 | 0.99 | (0.24 | ) | 35 | ||||||||||||||||||||||||
| 10/31/2004 | 8.96 | 160,959 | 1.05 | (h) | 1.05 | (h) | (0.82 | ) | 5 | ||||||||||||||||||||||
| 10/31/2003 | 22.76 | 82,318 | 1.10 | 1.25 | (0.95 | ) | 25 | ||||||||||||||||||||||||
| 10/31/2002 | (20.90 | ) | 10,452 | 1.10 | 2.30 | (1.09 | ) | 31 | |||||||||||||||||||||||
| Class C | 4/30/2006 | 15.09 | 754,765 | 1.22 | 1.22 | 0.65 | 24 | ||||||||||||||||||||||||
| 10/31/2005 | 12.82 | 528,211 | 0.93 | 0.93 | (0.17 | ) | 35 | ||||||||||||||||||||||||
| 10/31/2004 | 8.86 | 356,543 | 0.99 | (h) | 0.99 | (h) | (0.78 | ) | 5 | ||||||||||||||||||||||
| 10/31/2003 | 23.54 | 116,956 | 1.10 | 1.25 | (0.95 | ) | 25 | ||||||||||||||||||||||||
NOTES TO FINANCIAL HIGHLIGHTS
(a) Annualized.
(b) Not annualized.
(c) Total Return has been calculated for the applicable period without deduction of a sales load, if any, on an initial purchase. Not annualized.
(d) Per share information is calculated based on the average number of shares outstanding.
(e) Ratio of Net Expenses to Average Net Assets is net of fee waivers and reimbursements by the investment adviser, if any (see Note 2).
(f) Ratio of Total Expenses to Average Net Assets includes all expenses before fee waivers and reimbursements by the investment adviser.
(g) TA IDEX Asset Allocation-Growth Portfolio ("the Fund") commenced operations on March 1, 2002. The inception date for the Fund's offering of share Class C was November 11, 2002.
(h) Ratios of Total Expenses to Average Net Assets and net Expenses to Average Net Assets are inclusive of recaptured expenses by the investment advisor, if any. The impact of recaptured expenses was 0.05%, 0.05% and 0.05% for Class A, Class B and Class C, respectively (see Note 2).
(i) Recognition of net investment income by the Fund is affected by the timing of the declaration of dividends by the underlying companies in which the Fund invests.
(j) Does not include expenses of the investment companies in which the Fund invests.
The notes to the financial statements are an integral part of this report.
Transamerica IDEX Mutual Funds
Semi-Annual Report 2006
5
TA IDEX Asset Allocation – Growth Portfolio
NOTES TO FINANCIAL STATEMENTS
At April 30, 2006
(all amounts in thousands)
(unaudited)
NOTE 1. ORGANIZATION AND SIGNIFICANT ACCOUNTING POLICIES
Transamerica IDEX Mutual Funds is an open-end management investment company registered under the Investment Company Act of 1940, as amended (the "1940 Act").
In the normal course of business, TA IDEX Asset Allocation – Growth Portfolio (the "Fund") enters into contracts that contain a variety of representations that provide general indemnifications. The Fund's maximum exposure under these arrangements is unknown, as this would involve future claims that may be made against the Fund and/or its affiliates that have not yet occurred. However, based on experience, the Fund expects the risk of loss to be remote.
This report should be read in conjunction with the current Fund prospectus, which contains more complete information about the Fund.
In preparing the Fund's financial statements in accordance with accounting principles generally accepted in the United States of America ("GAAP"), estimates or assumptions (which could differ from actual results) may be used that affect reported amounts and disclosures. The following is a summary of significant accounting policies followed by the Fund.
Multiple class operations, income and expenses: The Fund currently offers three classes of shares, Class A, Class B, and Class C, each with a public offering price that reflects different sales charges, if any, and expense levels. Class B shares will convert to Class A shares eight years after purchase. Income, non-class specific expenses and realized and unrealized gains and losses, are allocated daily to each class, based upon the value of shares outstanding method as permitted under Rule 18f-3 of the 1940 Act. Each class bears its own specific expenses as well as a portion of general, common expenses.
Security valuations: Investment company securities are valued at the net asset value of the underlying portfolio.
Cash: The Fund may leave cash overnight in its cash account with the custodian, Investors Bank & Trust Company ("IBT"). IBT has been contracted on behalf of the Fund to invest the excess cash into a savings account, which at April 30, 2006, was paying an interest rate of 3.24%.
Security transactions and investment income: Security transactions are recorded on the trade date. Security gains and losses are calculated on the specific identification basis. Dividend income, if any, is recorded on the ex-dividend date. Dividends and net realized gain (loss) from investment securities for the Fund are from investments in shares of affiliated investment companies.
Redemption fees: A short-term trading redemption fee may be assessed on any fund shares in a fund account that are sold during the first five (5) New York Stock Exchange ("NYSE") trading days following their purchase date. This redemption fee will equal 2% of the amount redeemed and shares held the longest will be treated as being redeemed first and shares held the shortest as being redeemed last. For the six months ended April 30, 2006, the Fund received $2 in redemption fees.
Dividend distributions: Distributions to shareholders are recorded on the ex-dividend date and are determined in accordance with Federal income tax regulations which may differ from GAAP.
NOTE 2. RELATED PARTY TRANSACTIONS
Transamerica Fund Advisors, Inc. ("TFAI") is the Fund's investment adviser. Transamerica Fund Services, Inc. ("TFS") is the Fund's administrator and transfer agent. AFSG Securities Corp. ("AFSG") is the Fund's distributor/principal underwriter. TFAI, TFS, and AFSG are affiliates of AEGON, NV, a Netherlands corporation.
Transamerica Investment Management, LLC and Great Companies, L.L.C. are affiliates of the Fund and are sub-advisers to other funds within Transamerica IDEX Mutual Funds.
Certain officers and trustees of the Fund are also officers and/or directors of TFAI, TFS and AFSG.
Because the underlying funds have varied expense and fee levels and the Fund may own different proportions of underlying funds at different times, the amount of fees and expenses incurred indirectly by the Fund will vary.
Investment advisory fees: The Fund pays management fees to TFAI based on average daily net assets ("ANA") at the following rate:
0.10% of ANA
TFAI has contractually agreed to waive its advisory fee and will reimburse the Fund to the extent that operating expenses, excluding 12b-1 fees, exceed the following stated annual limit:
0.45% Expense Limit
If total Fund expenses fall below the annual expense limitation agreement agreed to by the adviser within the succeeding three years, the Fund may be required to pay the adviser a portion or all of the waived advisory fees.
There are no amounts available for recapture at April 30, 2006.
Transamerica IDEX Mutual Funds
Semi-Annual Report 2006
6
TA IDEX Asset Allocation – Growth Portfolio
NOTES TO FINANCIAL STATEMENTS (continued)
At April 30, 2006
(all amounts in thousands)
(unaudited)
NOTE 2.–(continued)
Distribution and service fees: The Fund has a 12b-1 distribution plan under the 1940 Act pursuant to which an annual fee, based on average daily net assets, is paid to the distributor for various disbursements such as broker-dealer account servicing fees and other promotional expenses of the Fund. The Fund is authorized under the 12b-1 plan to pay fees on each class up to the following limits:
| Class A | 0.35 | % | |||||
| Class B | 1.00 | % | |||||
| Class C | 1.00 | % | |||||
In the case the Fund or a class of shares of the Fund is closed to new investors or investments, the Fund is authorized to pay 12b-1 fees for past sales and distribution efforts and present and past investor services.
Underwriter commissions relate to front-end sales charges imposed for Class A shares and contingent deferred sales charges from Classes B, C and certain A share redemptions. For the six months ended April 30, 2006, the underwriter commissions were as follows:
| Received by Underwriter | $ | 3,450 | |||||
| Retained by Underwriter | 546 | ||||||
| Contingent Deferred Sales Charge | 340 | ||||||
Administrative services: The Fund has entered into an agreement with TFS for financial and legal fund administration services. As of January 1, 2006, the Fund pays TFS an annual fee of 0.0125% of ANA. For the period November 1, 2005 through December 31, 2005, the Fund paid TFS an annual fee of 0.02% of ANA. The Legal fees on the Statement of Operations are fees paid to external legal counsel.
Transfer agent fees: The Fund pays TFS an annual per-account charge for each open and closed account. The Fund paid TFS $652 for the six months ended April 30, 2006.
Deferred compensation plan: Each eligible independent Fund Trustee may elect to participate in a non-qualified deferred compensation plan maintained by Transamerica IDEX Mutual Funds (the "Plan"). Under the Plan, such Trustees may defer payment of all or a portion of their total fees earned as a Fund Trustee. Each Trustee who is a participant in the Plan may elect that the earnings, losses or gains credited to his or her deferred fee amounts be determined based on a deemed investment in any series of Transamerica IDEX Mutual Funds, including the Fund. The right of a participant to receive a distribution from the Plan of the deferred fees is an unsecured claim against the general assets of all series of Transamerica IDEX Mutual Funds. The pro rata liability to the Fund of all deferred fees in the Plan amounted, as of April 30, 2006, to $22.
NOTE 3. INVESTMENT TRANSACTIONS
The cost of securities purchased and proceeds from securities sold (excluding short-term securities) for the six months ended April 30, 2006 were as follows:
| Purchases of securities: | |||||||
| Long-Term | $ | 559,927 | |||||
| U.S. Government | – | ||||||
| Proceeds from maturities and sales of securities: | |||||||
| Long-Term | 288,942 | ||||||
| U.S. Government | – | ||||||
NOTE 4. FEDERAL INCOME TAX MATTERS
The Fund has not made any provision for federal income or excise taxes due to its policy to distribute all of its taxable income and capital gains to its shareholders and otherwise qualify as a regulated investment company under Subchapter M of the Internal Revenue Code. Income and capital gain distributions are determined in accordance with income tax regulations, which may differ from GAAP. These differences are primarily due to differing treatment for items including, but not limited to, wash sales and distribution reclasses.
NOTE 5. REGULATORY PROCEEDINGS
There continues to be significant federal and state regulatory activity relating to financial services companies, particularly mutual fund companies and their investment advisers. As part of an ongoing investigation regarding potential market timing, recordkeeping and trading compliance issues and matters affecting the Fund's investment adviser, TFAI, and certain affiliates and former employees of TFAI, the SEC staff has indicated that it is likely to take some action against TFAI and certain of its affiliates at the conclusion of the investigation. The potential timing and the scope of any such action is difficult to predict. Although the impact of any action brought against TFAI and/or its affiliates is difficult to assess at the present time, the Fund currently believes that the likelihood that any such action will have a material adverse impact on it is remote. It is important to note that the Fund is not aware of any allega tion of wrongdoing against it and its Board at the time this semi-annual report is printed. Although it is not anticipated that these developments will have an adverse impact on the Fund, there can be no assurance at this time. TFAI and its affiliates are actively working with the SEC in regard to this matter; however, the exact resolution cannot be determined at this time. TFAI will take such actions that it deems necessary or appropriate to continue providing management services to the Fund and to bring all matters to an appropriate conclusion.
TFAI and/or its affiliates, and not the Fund, will bear the costs regarding these regulatory matters.
Transamerica IDEX Mutual Funds
Semi-Annual Report 2006
7
TA IDEX Asset Allocation – Growth Portfolio
INVESTMENT ADVISORY AND ASSET ALLOCATION MANAGEMENT AGREEMENTS – REVIEW AND RENEWAL (unaudited)
At a meeting of the Board of Trustees of Transamerica IDEX Mutual Funds ("TA IDEX") held on November 2, 2005, the Board reviewed and considered the Investment Advisory Agreement between TA IDEX Asset Allocation - Growth Portfolio (the "Fund") and Transamerica Fund Advisors, Inc. ("TFAI"), as well as the Asset Allocation Management Agreement of the Fund between TFAI and Morningstar Associates, LLC (the "Portfolio Construction Manager"), to determine whether the agreements should be renewed for a one-year period. Following their review and consideration, the Trustees determined that the Investment Advisory Agreement and the Asset Allocation Management Agreement will enable shareholders of the Fund to obtain high quality services at a cost that is appropriate, reasonable, and in the best interests of its shareholders. The Board, including the independent members of the Board, unanimously approved the renewal of the Investment Advis ory Agreement and the Asset Allocation Management Agreement. In reaching their decision, the Trustees requested and obtained from TFAI and the Portfolio Construction Manager such information as they deemed reasonably necessary to evaluate the proposed agreements. The Trustees also carefully considered the information that they had received throughout the year from TFAI and the Portfolio Construction Manager (such as in-person presentations by the Portfolio Construction Manager) as part of their regular oversight of the Fund, as well as: comparative fee, expense and performance information prepared by Lipper Inc. ("Lipper"), independent providers of mutual fund performance, fee and expense information, and profitability data. In considering the proposed continuation of the Investment Advisory Agreement and the Asset Allocation Management Agreement, the Trustees evaluated a number of considerations that they believe, in light of the legal advice furnished to them by TA IDEX counsel and independent legal counse l and their own business judgment, to be relevant. They based their decisions on the following considerations, among others, although they did not identify any consideration or particular information that was controlling of their decisions:
The nature, extent and quality of the advisory service to be provided. The Board considered the nature and quality of the services provided by TFAI and the Portfolio Construction Manager to the Fund in the past, as well as the services anticipated to be provided in the future. The Board concluded that TFAI and the Portfolio Construction Manager are capable of providing high quality services to the Fund, as indicated by the nature and quality of services provided in the past, TFAI's and the Portfolio Construction Manager's management capabilities demonstrated with respect to the funds they manage, including the Fund, and the experience, capability and integrity of TFAI's senior management, the financial resources of TFAI and the Portfolio Construction Manager, TFAI's management oversight process, the professional qualifications and experience of the Po rtfolio Construction Manager's portfolio management team, and the Fund's investment performance. The Trustees also concluded that TFAI and the Portfolio Construction Manager proposed to provide investment and related services that were of the same quality and quantity as services provided to the Fund in the past, and that these services are appropriate in scope and extent in light of the Fund's operations, the competitive landscape of the investment company business and investor needs, and that TFAI's and the Portfolio Construction Manager's obligations will remain substantially the same.
The investment performance of the Fund. The Board examined both the short-term and longer-term performance of the Fund, including relative performance against a benchmark securities index and a peer group of comparable mutual funds as prepared by Lipper, for various trailing periods ended June 30, 2005. The Trustees concluded that TFAI and the Portfolio Construction Manager generally had achieved competitive investment performance, noting that the performance of the Fund has been at median relative to its peers over the past one- and three-year periods, above median relative to its peers over the past two-year period, and competitive to the benchmark index over the past one-, two- and three-year periods. On the basis of the Trustees' assessment of the nature, extent and quality of advisory services to be provided or procured by TFAI and the Portfolio Construction Manager, the Trustees concluded that TFAI and the Portfolio Construction Manager are capable of generating a level of investment performance that is appropriate in light of the Fund's investment objective, policies and strategies and competitive with many other investment companies, and also determined that TFAI's and the Portfolio Construction Manager's performance records indicate that their continued management is likely to benefit the Fund and its shareholders.
The cost of advisory services provided and the level of profitability. The Board reviewed profitability information regarding TFAI's costs of procuring portfolio management services, as well as the costs of provision of administration, transfer agency, fund accounting and other services, to the Fund and to TA IDEX as a whole by TFAI and its affiliates. However, the Board noted that the profitability data provided to the Board was based on a prior fee arrangement which has been changed following negotiations between TFAI and the Portfolio Construction Manager pursuant to which the Portfolio Construction Manager agreed to assume additional responsibilities in managing the Fund, and the Board noted that the Portfolio Construction Manager receives the entirety of the management fee payable by the Fund while TFAI gets compensated through the management fee s payable by the underlying funds in which the Fund invests. The Trustees reviewed data from Lipper that compared the Fund's management fees, and other fees and expenses (including total expenses including and excluding 12b-1 distribution and service fees). Based on such
Transamerica IDEX Mutual Funds
Semi-Annual Report 2006
8
TA IDEX Asset Allocation – Growth Portfolio (continued)
information, the Trustees determined that the management fees and overall expense ratio of the Fund generally are consistent with industry averages. In addition, on the basis of the Board's review of the management fees to be charged by TFAI for investment advisory and related services, TFAI profitability information (derived from TFAI's audited financial statements), TFAI's estimated management income resulting from its management of the Fund, the estimated margin of the Portfolio Construction Manager, as well as the entirety of TFAI's and its affiliates' service relationship with TA IDEX, the Board concluded that the level of investment management fees and other service fees, as well as TFAI's and the Portfolio Construction Manager's profitability, are appropriate in light of the services provided, the management fees and overall expense ratios of comparable investment companies and the anticipated profitability of the relatio nship between the Fund, TFAI and its affiliates, and the Portfolio Construction Manager.
Whether fee levels reflect economies of scale and the extent to which economies of scale would be realized as the Fund grows. The Board noted that the management fee of the Fund does not contain asset-based breakpoints, despite TFAI's efforts to negotiate such breakpoints with the Portfolio Construction Manager (the Board instructed TFAI to continue to try to negotiate breakpoints for the Fund in the future). However, the Board also noted that, based on the information provided by TFAI, the Fund's investments in underlying funds have permitted the realization of breakpoints (or lower breakpoints) at the underlying fund level which, indirectly, benefit the Fund and its shareholders, as well as the underlying funds. The Board carefully reviewed the one- and three-year performance record and the fees and expenses of the Fund and the comparative informati on provided by Lipper. The Board concluded that the Fund has management fees in line with, or lower than, its peers. The Board also concluded that the Fund's management fee appropriately reflects the Fund's current size, the current economic environment for TFAI, the competitive nature of the investment company market, and TFAI's pricing strategy. The Trustees also concluded that they will have the opportunity to periodically reexamine whether the Fund has achieved economies of scale, and the appropriateness of management fees payable to TFAI and fees payable to the Portfolio Construction Manager, in the future.
Benefits (such as soft dollars) to TFAI, its affiliates, or the Portfolio Construction Manager from their relationship with the Fund. The Board concluded that other benefits derived by TFAI (including any benefits derived from investment advisory fees payable to TFAI with respect to the underlying funds in which the Fund invests) or the Portfolio Construction Manager from its relationship with the Fund are reasonable and fair, and are consistent with industry practice and the best interests of the Fund and its shareholders. In this regard, the Board noted that neither TFAI nor the Portfolio Construction Manager realizes "soft dollar" benefits from its relationship with the Fund. In addition, the Trustees determined that the administration, transfer agency, fund accounting and other fees paid by the Fund to affiliates of TFAI are reasonable, fair and i n the best interests of shareholders in light of the nature and quality of the services provided, the associated costs to these affiliates of providing the services, the impact of the costs of such services on the Fund's overall operating expenses, and the necessity of the services for the Fund's operations.
Other considerations. The Board determined that TFAI had made a substantial commitment to the recruitment and retention of high quality personnel, and maintained the financial, compliance and operational resources reasonably necessary to manage the Fund in a professional manner that is consistent with the best interests of the Fund and its shareholders. In this regard, the Trustees favorably considered the procedures and policies in place by TFAI to enforce compliance with applicable laws and regulations and oversee the portfolio management activities of the Portfolio Construction Manager. The Trustees also determined that TFAI had made a significant entrepreneurial commitment to the management and success of the Fund, reflected by TFAI's expense limitation and fee waiver arrangement with the Fund, which may result in TFAI waiving advisory fees for th e benefit of shareholders.
Transamerica IDEX Mutual Funds
Semi-Annual Report 2006
9
TA IDEX Asset Allocation – Moderate Growth Portfolio
UNDERSTANDING YOUR FUND'S EXPENSES
(unaudited)
SHAREHOLDER EXPENSES
Fund shareholders may incur two types of costs: (1) transaction costs, including sales charges (loads) on purchases, contingent deferred sales charges on redemptions and redemption fees; and (2) ongoing costs, including management fees, 12b-1 distribution and service fees, and other fund expenses.
The following Example is intended to help you understand your ongoing costs (in dollars and cents) of investing in the Fund and to compare these costs with the ongoing costs of investing in other funds.
The Example is based on an investment of $1,000 invested at November 1, 2005 and held for the entire period until April 30, 2006.
ACTUAL EXPENSES
The first line in the table below provides information about actual account values and actual expenses. You may use the information in this line, together with the amount you invested, to estimate the expenses that you paid over the period. Simply divide your account value by $1,000 (for example, an $8,600 account value divided by $1,000 = 8.6), then multiply the result by the number in the first line of your Fund under the heading entitled "Expenses Paid During Period" to estimate the expenses you paid on your account during this period. If your account is an IRA, your expenses could have included a $15 annual fee. The amount of any fee paid through your account would increase the estimate of expenses you paid during the period and decrease your ending account value.
HYPOTHETICAL EXAMPLE FOR COMPARISON PURPOSES
The second line in the table below provides information about hypothetical account values and hypothetical expenses based on the Fund's actual expense ratio and an assumed rate of return of 5% per year before expenses, which is not the Fund's actual return. The hypothetical account values and expenses may not be used to estimate the actual ending account balance or expenses you paid for the period. You may use this information to compare the ongoing costs of investing in your Fund and other funds. To do so, compare this 5% hypothetical example with the 5% hypothetical examples that appear in the shareholder reports of the other funds. As in the case of the actual expense example, if your account is subject to an IRA fee, the amount of the fee paid through your account would increase the hypothetical expenses you would have paid during the period and decrease the hypothetical ending account value.
Please note that the expenses shown in the table are meant to highlight your ongoing costs only and do not reflect any transactional costs, such as sales charges, redemption fees, brokerage commissions paid on purchases and sales of fund shares. Therefore, the second line under the Fund in the table is useful in comparing ongoing costs only, and will not help you determine the relative total costs of owning different funds. If any of these transaction costs were included, your costs would be higher. The expenses shown in the table do not reflect any fees that may be charged to you by brokers, financial intermediaries or other financial institutions. The expenses shown in the table do not reflect any expenses from the Funds investment in other affiliated investment companies. The average weighted annualized expense ratio of the underlying investment companies at April 30, 2006, was 0.90%.
| Beginning Account Value | Ending Account Value | Annualized Expense Ratio | Expenses Paid During Period (a) | ||||||||||||||||
| Class A | |||||||||||||||||||
| Actual | $ | 1,000.00 | $ | 1,129.20 | 0.57 | % | $ | 3.01 | |||||||||||
| Hypothetical (b) | 1,000.00 | 1,021.97 | 0.57 | 2.86 | |||||||||||||||
| Class B | |||||||||||||||||||
| Actual | 1,000.00 | 1,125.10 | 1.24 | 6.53 | |||||||||||||||
| Hypothetical (b) | 1,000.00 | 1,018.65 | 1.24 | 6.21 | |||||||||||||||
| Class C | |||||||||||||||||||
| Actual | 1,000.00 | 1,125.50 | 1.20 | 6.32 | |||||||||||||||
| Hypothetical (b) | 1,000.00 | 1,018.84 | 1.20 | 6.01 | |||||||||||||||
(a) Expenses are calculated using the Fund's annualized expense ratio (as disclosed in the table), multiplied by the average account value for the period, multiplied by number of days in the period (181 days), and divided by the number of days in the year (365 days).
(b) 5% return per year before expenses.
GRAPHICAL PRESENTATION OF SCHEDULE OF INVESTMENTS
By Investment Type
At April 30, 2006
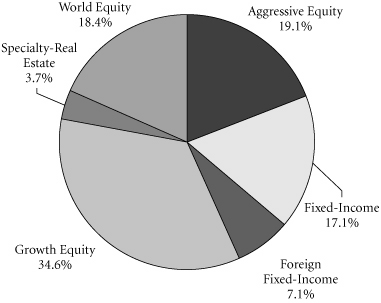
This chart shows the percentage breakdown by investment type of the Fund's total investment securities.
Transamerica IDEX Mutual Funds
Semi-Annual Report 2006
1
TA IDEX Asset Allocation – Moderate Growth Portfolio
SCHEDULE OF INVESTMENTS
At April 30, 2006
(all amounts except share amounts in thousands)
(unaudited)
| Shares | Value | ||||||||||
| INVESTMENT COMPANIES (99.6%) Ø | |||||||||||
| Aggressive Equity (19.0%) | |||||||||||
| TA IDEX Evergreen Health Care | 6,527,953 | $ | 87,540 | ||||||||
| TA IDEX J.P. Morgan Mid Cap Value | 10,728,913 | 118,447 | |||||||||
| TA IDEX Transamerica Growth Opportunities ‡ | 12,094,239 | 108,969 | |||||||||
| TA IDEX Transamerica Small/Mid Cap Value | 9,829,934 | 179,101 | |||||||||
| Capital Preservation (0.0%) | |||||||||||
| TA IDEX Transamerica Money Market | 629,424 | 629 | |||||||||
| Fixed-Income (17.0%) | |||||||||||
| TA IDEX PIMCO Real Return TIPS | 12,471,900 | 124,470 | |||||||||
| TA IDEX PIMCO Total Return | 6,163,268 | 62,126 | |||||||||
| TA IDEX Transamerica Convertible Securities | 8,321,981 | 109,517 | |||||||||
| TA IDEX Transamerica Flexible Income | 4,864,813 | 45,146 | |||||||||
| TA IDEX Transamerica High-Yield Bond | 10,986,656 | 100,858 | |||||||||
| Foreign Fixed-Income (7.1%) | |||||||||||
| TA IDEX JPMorgan International Bond | 10,334,872 | 106,966 | |||||||||
| TA IDEX Van Kampen Emerging Markets Debt | 7,353,621 | 78,096 | |||||||||
| Shares | Value | ||||||||||
| Growth Equity (34.5%) | |||||||||||
| TA IDEX American Century Large Company Value | 9,787,512 | $ | 113,242 | ||||||||
| TA IDEX Great Companies-TechnologySM | 7,663,388 | 31,726 | |||||||||
| TA IDEX Janus Growth ‡ | 4,372,791 | 113,561 | |||||||||
| TA IDEX Marsico Growth ‡ | 5,337,402 | 60,259 | |||||||||
| TA IDEX Mercury Large Cap Value | 19,286,101 | 226,226 | |||||||||
| TA IDEX Salomon Investors Value | 5,662,285 | 59,567 | |||||||||
| TA IDEX Transamerica Equity | 20,722,442 | 204,531 | |||||||||
| TA IDEX Van Kampen Mid-Cap Growth ‡ | 1,748,933 | 18,871 | |||||||||
| TA IDEX Van Kampen Small Company Growth | 5,275,704 | 70,061 | |||||||||
| Specialty–Real Estate (3.7%) | |||||||||||
| TA IDEX Clarion Global Real Estate Securities | 5,443,711 | 96,299 | |||||||||
| World Equity (18.3%) | |||||||||||
| TA IDEX AllianceBernstein International Value | 3,991,819 | 47,503 | |||||||||
| TA IDEX Evergreen International Small Cap | 5,044,290 | 84,038 | |||||||||
| TA IDEX Marsico International Growth | 6,315,080 | 89,043 | |||||||||
| TA IDEX Mercury Global Allocation | 8,095,374 | 88,968 | |||||||||
| TA IDEX Neuberger Berman International | 7,379,656 | 89,146 | |||||||||
| TA IDEX Oppenheimer Developing Markets | 5,924,279 | 69,788 | |||||||||
| TA IDEX Templeton Great Companies Global ‡ | 287,143 | 8,077 | |||||||||
| Total Investment Companies (cost: $2,233,104) # | $ | 2,592,771 | |||||||||
NOTES TO SCHEDULE OF INVESTMENTS:
Ø The Fund invests its assets in Class I shares of the underlying TA IDEX Mutual Funds, which are affiliates of the Fund.
‡ Non-income producing.
# Aggregate cost for Federal income tax purposes is $2,235,891. Aggregate gross unrealized appreciation for all securities in which there is an excess of value over tax cost and aggregate gross unrealized depreciation for all securities in which there is an excess of tax cost over value were $362,213 and $5,333, respectively. Net unrealized appreciation for tax purposes is $356,880.
The notes to the financial statements are an integral part of this report.
Transamerica IDEX Mutual Funds
Semi-Annual Report 2006
2
TA IDEX Asset Allocation – Moderate Growth Portfolio
STATEMENT OF ASSETS AND LIABILITIES
At April 30, 2006
(all amounts except per share amounts in thousands)
(unaudited)
| Assets: | |||||||
| Investment in affiliated investment companies at value (cost: $2,233,104) | $ | 2,592,771 | |||||
| Receivables: | |||||||
| Shares of beneficial interest sold | 18,835 | ||||||
| Interest | 1 | ||||||
| Dividends | 111 | ||||||
| Other | 46 | ||||||
| 2,611,764 | |||||||
| Liabilities: | |||||||
| Investment securities purchased | 3,439 | ||||||
| Accounts payable and accrued liabilities: | |||||||
| Shares of beneficial interest redeemed | 3,622 | ||||||
| Management and advisory fees | 209 | ||||||
| Distribution and service fees | 1,686 | ||||||
| Transfer agent fees | 40 | ||||||
| Due to custodian | 35 | ||||||
| Dividends to shareholders | 33 | ||||||
| Other | 94 | ||||||
| 9,158 | |||||||
| Net Assets | $ | 2,602,606 | |||||
| Net Assets Consist of: | |||||||
| Shares of beneficial interest, unlimited shares authorized, no par value | $ | 2,170,695 | |||||
| Distributable net investment income (loss) | (796 | ) | |||||
| Accumulated net realized gain (loss) from investment in affiliated investment companies | 73,042 | ||||||
| Net unrealized appreciation (depreciation) on investment in affiliated investment companies | 359,665 | ||||||
| Net Assets | $ | 2,602,606 | |||||
| Net Assets by Class: | |||||||
| Class A | $ | 769,151 | |||||
| Class B | 522,206 | ||||||
| Class C | 1,311,249 | ||||||
| Shares Outstanding: | |||||||
| Class A | 59,801 | ||||||
| Class B | 40,796 | ||||||
| Class C | 102,421 | ||||||
| Net Asset Value Per Share: | |||||||
| Class A | $ | 12.86 | |||||
| Class B | 12.80 | ||||||
| Class C | 12.80 | ||||||
| Maximum Offering Price Per Share (a): | |||||||
| Class A | $ | 13.61 | |||||
(a) Includes the maximum selling commission (represented as a percentage of offering price) which is reduced on certain levels of sales as set forth in the Prospectus. Net asset value per share for Classes B and C shares represents offering price. The redemption price for Classes B and C shares equals net asset value less any applicable contingent deferred sales charge.
STATEMENT OF OPERATIONS
For the period ended April 30, 2006
(all amounts in thousands)
(unaudited)
| Investment Income: | |||||||
| Dividends from affiliated investment companies | $ | 28,978 | |||||
| Interest | 2 | ||||||
| 28,980 | |||||||
| Expenses: | |||||||
| Management and advisory fees | 1,126 | ||||||
| Distribution and service fees: | |||||||
| Class A | 1,062 | ||||||
| Class B | 2,300 | ||||||
| Class C | 5,487 | ||||||
| Transfer agent fees: | |||||||
| Class A | 323 | ||||||
| Class B | 288 | ||||||
| Class C | 459 | ||||||
| Printing and shareholder reports | 102 | ||||||
| Custody fees | 32 | ||||||
| Administration fees | 167 | ||||||
| Legal fees | 52 | ||||||
| Audit fees | 9 | ||||||
| Trustees fees | 42 | ||||||
| Registration fees | 104 | ||||||
| Other | 20 | ||||||
| Total expenses | 11,573 | ||||||
| Net Investment Income (Loss) | 17,407 | ||||||
| Net Realized and Unrealized Gain (Loss) on Investment in Affiliated Investment Companies: | |||||||
| Realized gain (loss) from investment in affiliated investment companies | 32,850 | ||||||
| Realized gain distributions from investment in affiliated investment companies | 40,276 | ||||||
| 73,126 | |||||||
| Increase (decrease) in unrealized appreciation (depreciation) on investment in affiliated investment companies | 173,431 | ||||||
| Net Realized and Unrealized Gain (Loss) on Investment in Affiliated Investment Companies | 246,557 | ||||||
| Net Increase (Decrease) in Net Assets Resulting from Operations | $ | 263,964 | |||||
The notes to the financial statements are an integral part of this report.
Transamerica IDEX Mutual Funds
Semi-Annual Report 2006
3
TA IDEX Asset Allocation – Moderate Growth Portfolio
STATEMENTS OF CHANGES IN NET ASSETS
For the period or year ended
(all amounts in thousands)
| April 30, 2006 (unaudited) | October 31, 2005 | ||||||||||
| Increase (Decrease) in Net Assets From: | |||||||||||
| Operations: | |||||||||||
| Net investment income (loss) | $ | 17,407 | $ | 15,323 | |||||||
| Net realized gain (loss) from investment in affiliated investment companies | 73,126 | 53,747 | |||||||||
| Change in unrealized appreciation (depreciation) on investment in affiliated investment companies | 173,431 | 87,330 | |||||||||
| 263,964 | 156,400 | ||||||||||
| Distributions to Shareholders: | |||||||||||
| From net investment income: | |||||||||||
| Class A | (9,787 | ) | (7,069 | ) | |||||||
| Class B | (4,723 | ) | (4,398 | ) | |||||||
| Class C | (11,388 | ) | (9,608 | ) | |||||||
| (25,898 | ) | (21,075 | ) | ||||||||
| From net realized gains: | |||||||||||
| Class A | (15,305 | ) | (1,708 | ) | |||||||
| Class B | (11,562 | ) | (1,542 | ) | |||||||
| Class C | (26,861 | ) | (3,196 | ) | |||||||
| (53,728 | ) | (6,446 | ) | ||||||||
| Capital Share Transactions: | |||||||||||
| Proceeds from shares sold: | |||||||||||
| Class A | 188,872 | 246,518 | |||||||||
| Class B | 68,052 | 109,566 | |||||||||
| Class C | 296,308 | 356,953 | |||||||||
| 553,232 | 713,037 | ||||||||||
| Dividends and distributions reinvested: | |||||||||||
| Class A | 22,753 | 7,807 | |||||||||
| Class B | 14,113 | 5,035 | |||||||||
| Class C | 27,389 | 8,956 | |||||||||
| 64,255 | 21,798 | ||||||||||
| Cost of shares redeemed: | |||||||||||
| Class A | (55,718 | ) | (83,068 | ) | |||||||
| Class B | (27,379 | ) | (48,778 | ) | |||||||
| Class C | (86,191 | ) | (123,757 | ) | |||||||
| (169,288 | ) | (255,603 | ) | ||||||||
| Redemption fees: | |||||||||||
| Class A | 1 | 4 | |||||||||
| Class C | 4 | 2 | |||||||||
| 5 | 6 | ||||||||||
| April 30, 2006 (unaudited) | October 31, 2005 | ||||||||||
| Automatic conversions: | |||||||||||
| Class A | $ | 259 | $ | 422 | |||||||
| Class B | (259 | ) | (422 | ) | |||||||
| – | – | ||||||||||
| 448,204 | 479,238 | ||||||||||
| Net increase (decrease) in net assets | 632,542 | 608,117 | |||||||||
| Net Assets: | |||||||||||
| Beginning of period | 1,970,064 | 1,361,947 | |||||||||
| End of period | $ | 2,602,606 | $ | 1,970,064 | |||||||
| Distributable Net Investment Income (Loss) | $ | (796 | ) | $ | 7,695 | ||||||
| Share Activity: | |||||||||||
| Shares issued: | |||||||||||
| Class A | 15,197 | 21,482 | |||||||||
| Class B | 5,502 | 9,598 | |||||||||
| Class C | 23,947 | 31,214 | |||||||||
| 44,646 | 62,294 | ||||||||||
| Shares issued–reinvested from distributions: | |||||||||||
| Class A | 1,915 | 686 | |||||||||
| Class B | 1,191 | 443 | |||||||||
| Class C | 2,311 | 788 | |||||||||
| 5,417 | 1,917 | ||||||||||
| Shares redeemed: | |||||||||||
| Class A | (4,479 | ) | (7,228 | ) | |||||||
| Class B | (2,213 | ) | (4,260 | ) | |||||||
| Class C | (6,975 | ) | (10,790 | ) | |||||||
| (13,667 | ) | (22,278 | ) | ||||||||
| Automatic conversions: | |||||||||||
| Class A | 21 | 36 | |||||||||
| Class B | (21 | ) | (36 | ) | |||||||
| – | – | ||||||||||
| Net increase (decrease) in shares outstanding: | |||||||||||
| Class A | 12,654 | 14,976 | |||||||||
| Class B | 4,459 | 5,745 | |||||||||
| Class C | 19,283 | 21,212 | |||||||||
| 36,396 | 41,933 | ||||||||||
The notes to the financial statements are an integral part of this report.
Transamerica IDEX Mutual Funds
Semi-Annual Report 2006
4
TA IDEX Asset Allocation – Moderate Growth Portfolio
FINANCIAL HIGHLIGHTS
(unaudited for the period ended April 30, 2006)
| For a share of beneficial interest outstanding throughout each period | |||||||||||||||||||||||||||||||||||||||
| Net Asset | Investment Operations | Distributions | Net Asset | ||||||||||||||||||||||||||||||||||||
| For the Period Ended (d)(g) | Value, Beginning of Period | Net Investment Income (Loss) | Net Realized and Unrealized Gain (Loss) | Total Operations | From Net Investment Income | From Net Realized Gains | Total Distributions | Value, End of Period | |||||||||||||||||||||||||||||||
| Class A | 4/30/2006 | $ | 11.88 | $ | 0.12 | $ | 1.37 | $ | 1.49 | $ | (0.20 | ) | $ | (0.31 | ) | $ | (0.51 | ) | $ | 12.86 | |||||||||||||||||||
| 10/31/2005 | 10.97 | 0.16 | 1.00 | 1.16 | (0.20 | ) | (0.05 | ) | (0.25 | ) | 11.88 | ||||||||||||||||||||||||||||
| 10/31/2004 | 10.13 | 0.05 | 0.87 | 0.92 | (0.08 | ) | – | (0.08 | ) | 10.97 | |||||||||||||||||||||||||||||
| 10/31/2003 | 8.37 | 0.04 | 1.77 | 1.81 | (0.05 | ) | – | (0.05 | ) | 10.13 | |||||||||||||||||||||||||||||
| 10/31/2002 | 10.00 | 0.02 | (1.65 | ) | (1.63 | ) | – | – | – | 8.37 | |||||||||||||||||||||||||||||
| Class B | 4/30/2006 | 11.80 | 0.08 | 1.36 | 1.44 | (0.13 | ) | (0.31 | ) | (0.44 | ) | 12.80 | |||||||||||||||||||||||||||
| 10/31/2005 | 10.90 | 0.08 | 1.01 | 1.09 | (0.14 | ) | (0.05 | ) | (0.19 | ) | 11.80 | ||||||||||||||||||||||||||||
| 10/31/2004 | 10.09 | (0.02 | ) | 0.85 | 0.83 | (0.02 | ) | – | (0.02 | ) | 10.90 | ||||||||||||||||||||||||||||
| 10/31/2003 | 8.33 | (0.02 | ) | 1.78 | 1.76 | – | – | – | 10.09 | ||||||||||||||||||||||||||||||
| 10/31/2002 | 10.00 | (0.01 | ) | (1.66 | ) | (1.67 | ) | – | – | – | 8.33 | ||||||||||||||||||||||||||||
| Class C | 4/30/2006 | 11.80 | 0.08 | 1.36 | 1.44 | (0.13 | ) | (0.31 | ) | (0.44 | ) | 12.80 | |||||||||||||||||||||||||||
| 10/31/2005 | 10.91 | 0.08 | 1.01 | 1.09 | (0.15 | ) | (0.05 | ) | (0.20 | ) | 11.80 | ||||||||||||||||||||||||||||
| 10/31/2004 | 10.09 | (0.02 | ) | 0.86 | 0.84 | (0.02 | ) | – | (0.02 | ) | 10.91 | ||||||||||||||||||||||||||||
| 10/31/2003 | 8.31 | (0.02 | ) | 1.80 | 1.78 | – | – | – | 10.09 | ||||||||||||||||||||||||||||||
| Ratios/Supplemental Data | |||||||||||||||||||||||||||||||
| For the Period | Total | Net Assets, End of Period | Ratio of Expenses to Average Net Assets (a)(j) | Net Investment Income (Loss) to Average | Portfolio Turnover | ||||||||||||||||||||||||||
| Ended (g) | Return (c) | (000's) | Net (e) | Total (f) | Net Assets (a)(i) | Rate (b) | |||||||||||||||||||||||||
| Class A | 4/30/2006 | 12.92 | % | $ | 769,151 | 0.57 | % | 0.57 | % | 2.00 | % | 22 | % | ||||||||||||||||||
| 10/31/2005 | 10.69 | 560,231 | 0.28 | 0.28 | 1.37 | 26 | |||||||||||||||||||||||||
| 10/31/2004 | 9.09 | 352,852 | 0.32 | (h) | 0.32 | (h) | 0.45 | 3 | |||||||||||||||||||||||
| 10/31/2003 | 21.79 | 136,295 | 0.44 | 0.44 | 0.48 | 15 | |||||||||||||||||||||||||
| 10/31/2002 | (16.30 | ) | 20,681 | 0.45 | 0.90 | 0.41 | 21 | ||||||||||||||||||||||||
| Class B | 4/30/2006 | 12.51 | 522,206 | 1.24 | 1.24 | 1.34 | 22 | ||||||||||||||||||||||||
| 10/31/2005 | 10.05 | 428,677 | 0.95 | 0.95 | 0.68 | 26 | |||||||||||||||||||||||||
| 10/31/2004 | 8.25 | 333,533 | 0.97 | (h) | 0.97 | (h) | (0.19 | ) | 3 | ||||||||||||||||||||||
| 10/31/2003 | 21.15 | 190,621 | 1.09 | 1.09 | (0.17 | ) | 15 | ||||||||||||||||||||||||
| 10/31/2002 | (16.70 | ) | 33,241 | 1.10 | 1.55 | (0.24 | ) | 21 | |||||||||||||||||||||||
| Class C | 4/30/2006 | 12.55 | 1,311,249 | 1.20 | 1.20 | 1.37 | 22 | ||||||||||||||||||||||||
| 10/31/2005 | 10.02 | 981,156 | 0.90 | 0.90 | 0.74 | 26 | |||||||||||||||||||||||||
| 10/31/2004 | 8.35 | 675,562 | 0.92 | (h) | 0.92 | (h) | (0.15 | ) | 3 | ||||||||||||||||||||||
| 10/31/2003 | 21.44 | 239,043 | 1.09 | 1.09 | (0.17 | ) | 15 | ||||||||||||||||||||||||
NOTES TO FINANCIAL HIGHLIGHTS
(a) Annualized.
(b) Not annualized.
(c) Total Return has been calculated for the applicable period without deduction of a sales load, if any, on an initial purchase. Not annualized.
(d) Per share information is calculated based on average number of shares outstanding.
(e) Ratio of Net Expenses to Average Net Assets is net of fee waivers and reimbursements by the investment adviser, if any (see note 2).
(f) Ratio of Total Expenses to Average Net Assets includes all expenses before fee waivers and reimbursements by the investment adviser.
(g) TA IDEX Asset Allocation - Moderate Growth Portfolio ("the Fund") commenced operations on March 1, 2002. The inception date for the Fund's offering of share Class C was November 11, 2002.
(h) Ratios of Total Expenses to Average Net Assets and net Expenses to Average Net Assets are inclusive of recaptured expenses by the investment advisor, if any. The impact of recaptured expenses was 0.01%, 0.01% and 0.01% for Class A, Class B and Class C, respectively (see Note 2).
(i) Recognition of net investment income by the Fund is affected by the timing of the declaration of dividends by the underlying investment companies in which the Fund invests.
(j) Does not include expenses of the investment companies in which the Fund invests.
The notes to the financial statements are an integral part of this report.
Transamerica IDEX Mutual Funds
Semi-Annual Report 2006
5
TA IDEX Asset Allocation – Moderate Growth Portfolio
NOTES TO FINANCIAL STATEMENTS
At April 30, 2006
(all amounts in thousands)
(unaudited)
NOTE 1. ORGANIZATION AND SIGNIFICANT ACCOUNTING POLICIES
Transamerica IDEX Mutual Funds is an open-end management investment company registered under the Investment Company Act of 1940, as amended (the "1940 Act").
In the normal course of business, TA IDEX Asset Allocation - Moderate Growth Portfolio (the "Fund") enters into contracts that contain a variety of representations that provide general indemnifications. The Fund's maximum exposure under these arrangements is unknown, as this would involve future claims that may be made against the Fund and/or its affiliates that have not yet occurred. However, based on experience, the Fund expects the risk of loss to be remote.
This report should be read in conjunction with the current Fund prospectus, which contains more complete information about the Fund.
In preparing the Fund's financial statements in accordance with accounting principles generally accepted in the United States of America ("GAAP"), estimates or assumptions (which could differ from actual results) may be used that affect reported amounts and disclosures. The following is a summary of significant accounting policies followed by the Fund.
Multiple class operations, income and expenses: The Fund currently offers three classes of shares, Class A, Class B, and Class C, each with a public offering price that reflects different sales charges, if any, and expense levels. Class B shares will convert to Class A shares eight years after purchase. Income, non-class specific expenses and realized and unrealized gains and losses, are allocated daily to each class, based upon the value of shares outstanding method as permitted under Rule 18f-3 of the 1940 Act. Each class bears its own specific expenses as well as a portion of general, common expenses.
Security valuations: Investment company securities are valued at the net asset value of the underlying portfolio.
Cash: The Fund may leave cash overnight in its cash account with the custodian, Investors Bank & Trust Company ("IBT"). IBT has been contracted on behalf of the Fund to invest the excess cash into a savings account, which at April 30, 2006, was paying an interest rate of 3.24%.
Throughout the year, the Fund may have a cash overdraft balance. A fee is incurred on this overdraft, calculated by multiplying the overdraft by a rate based on the federal funds rate.
Security transactions and investment income: Security transactions are recorded on the trade date. Security gains and losses are calculated on the specific identification basis. Dividend income, if any, is recorded on the ex-dividend date. Dividends and net realized gain (loss) from investment securities for the Fund are from investments in shares of affiliated investment companies.
Redemption fees: A short-term trading redemption fee may be assessed on any fund shares in a fund account that are sold during the first five (5) New York Stock Exchange ("NYSE") trading days following their purchase date. This redemption fee will equal 2% of the amount redeemed and shares held the longest will be treated as being redeemed first and shares held the shortest as being redeemed last. For the six months ended April 30, 2006, the Fund received $5 in redemption fees.
Dividend distributions: Distributions to shareholders are recorded on the ex-dividend date and are determined in accordance with Federal income tax regulations which may differ from GAAP.
NOTE 2. RELATED PARTY TRANSACTIONS
Transamerica Fund Advisors, Inc. ("TFAI") is the Fund's investment adviser. Transamerica Fund Services, Inc. ("TFS") is the Fund's administrator and transfer agent. AFSG Securities Corp. ("AFSG") is the Fund's distributor/principal underwriter. TFAI, TFS, and AFSG are affiliates of AEGON, NV, a Netherlands corporation.
Transamerica Investment Management, LLC and Great Companies, L.L.C. are affiliates of the Fund and are sub-advisers to other funds within Transamerica IDEX Mutual Funds.
Certain officers and trustees of the Fund are also officers and/or directors of TFAI, TFS and AFSG.
Because the underlying funds have varied expense and fee levels and the Fund may own different proportions of underlying funds at different times, the amount of fees and expenses incurred indirectly by the Fund will vary.
Investment advisory fees: The Fund pays management fees to TFAI based on average daily net assets ("ANA") at the following rate:
0.10% of ANA
TFAI has contractually agreed to waive its advisory fee and will reimburse the Fund to the extent that operating expenses, excluding 12b-1 fees, exceed the following stated annual limit:
0.45% Expense Limit
If total Fund expenses fall below the annual expense limitation agreement agreed to by the adviser within the succeeding three years, the Fund may be required to pay the adviser a portion or all of the waived advisory fees.
There are no amounts available for recapture at April 30, 2006.
Transamerica IDEX Mutual Funds
Semi-Annual Report 2006
6
TA IDEX Asset Allocation – Moderate Growth Portfolio
NOTES TO FINANCIAL STATEMENTS (continued)
At April 30, 2006
(all amounts in thousands)
(unaudited)
NOTE 2.–(continued)
Distribution and service fees: The Fund has a 12b-1 distribution plan under the 1940 Act pursuant to which an annual fee, based on average daily net assets, is paid to the distributor for various disbursements such as broker-dealer account servicing fees and other promotional expenses of the Fund. The Fund is authorized under the 12b-1 plan to pay fees on each class up to the following limits:
| Class A | 0.35 | % | |||||
| Class B | 1.00 | % | |||||
| Class C | 1.00 | % | |||||
In the case the Fund or a class of shares of the Fund is closed to new investors or investments, the Fund is authorized to pay 12b-1 fees for past sales and distribution efforts and present and past investor services.
Underwriter commissions relate to front-end sales charges imposed for Class A shares and contingent deferred sales charges from Classes B, C, and certain A share redemptions. For the six months ended April 30, 2006, the underwriter commissions were as follows:
| Received by Underwriter | $ | 6,377 | |||||
| Retained by Underwriter | 1,025 | ||||||
| Contingent Deferred Sales Charge | 620 | ||||||
Administrative services: The Fund has entered into an agreement with TFS for financial and legal fund administration services. As of January 1, 2006, the Fund pays TFS an annual fee of 0.0125% of ANA. For the period November 1, 2005 through December 31, 2005, the Fund paid TFS an annual fee of 0.02% of ANA. The Legal fees on the Statement of Operations are fees paid to external legal counsel.
Transfer agent fees: The Fund pays TFS an annual per-account charge for each open and closed account. The Fund paid TFS $1,028 for the six months ended April 30, 2006.
Deferred compensation plan: Each eligible independent Fund Trustee may elect to participate in a non-qualified deferred compensation plan maintained by Transamerica IDEX Mutual Funds (the "Plan"). Under the Plan, such Trustees may defer payment of all or a portion of their total fees earned as a Fund Trustee. Each Trustee who is a participant in the Plan may elect that the earnings, losses or gains credited to his or her deferred fee amounts be determined based on a deemed investment in any series of Transamerica IDEX Mutual Funds, including the Fund. The right of a participant to receive a distribution from the Plan of the deferred fees is an unsecured claim against the general assets of all series of Transamerica IDEX Mutual Funds. The pro rata liability to the Fund of all deferred fees in the Plan amounted, as of April 30, 2006, to $46.
NOTE 3. INVESTMENT TRANSACTIONS
The cost of securities purchased and proceeds from securities sold (excluding short-term securities) for the six months ended April 30, 2006 were as follows:
| Purchases of securities: | |||||||
| Long-Term | $ | 919,861 | |||||
| U.S. Government | – | ||||||
| Proceeds from maturities and sales of securities: | |||||||
| Long-Term | 501,231 | ||||||
| U.S. Government | – | ||||||
NOTE 4. FEDERAL INCOME TAX MATTERS
The Fund has not made any provision for federal income or excise taxes due to its policy to distribute all of its taxable income and capital gains to its shareholders and otherwise qualify as a regulated investment company under Subchapter M of the Internal Revenue Code. Income and capital gain distributions are determined in accordance with income tax regulations, which may differ from GAAP. These differences are primarily due to differing treatment for items including, but not limited to, wash sales and distribution reclasses.
NOTE 5. REGULATORY PROCEEDINGS
There continues to be significant federal and state regulatory activity relating to financial services companies, particularly mutual fund companies and their investment advisers. As part of an ongoing investigation regarding potential market timing, recordkeeping and trading compliance issues and matters affecting the Fund's investment adviser, TFAI, and certain affiliates and former employees of TFAI, the SEC staff has indicated that it is likely to take some action against TFAI and certain of its affiliates at the conclusion of the investigation. The potential timing and the scope of any such action is difficult to predict. Although the impact of any action brought against TFAI and/or its affiliates is difficult to assess at the present time, the Fund currently believes that the likelihood that any such action will have a material adverse impact on it is remote. It is important to note that the Fund is not aware of any allega tion of wrongdoing against it and its Board at the time this semi-annual report is printed. Although it is not anticipated that these developments will have an adverse impact on the Fund, there can be no assurance at this time. TFAI and its affiliates are actively working with the SEC in regard to this matter; however, the exact resolution cannot be determined at this time. TFAI will take such actions that it deems necessary or appropriate to continue providing management services to the Fund and to bring all matters to an appropriate conclusion.
TFAI and/or its affiliates, and not the Fund, will bear the costs regarding these regulatory matters.
Transamerica IDEX Mutual Funds
Semi-Annual Report 2006
7
TA IDEX Asset Allocation – Moderate Growth Portfolio
INVESTMENT ADVISORY AND ASSET ALLOCATION MANAGEMENT AGREEMENTS – REVIEW AND RENEWAL (unaudited)
At a meeting of the Board of Trustees of Transamerica IDEX Mutual Funds ("TA IDEX") held on November 2, 2005, the Board reviewed and considered the Investment Advisory Agreement between TA IDEX Asset Allocation - Moderate Growth Portfolio (the "Fund") and Transamerica Fund Advisors, Inc. ("TFAI"), as well as the Asset Allocation Management Agreement of the Fund between TFAI and Morningstar Associates, LLC (the "Portfolio Construction Manager"), to determine whether the agreements should be renewed for a one-year period. Following their review and consideration, the Trustees determined that the Investment Advisory Agreement and the Asset Allocation Management Agreement will enable shareholders of the Fund to obtain high quality services at a cost that is appropriate, reasonable, and in the best interests of its shareholders. The Board, including the independent members of the Board, unanimously approved the renewal of the Investm ent Advisory Agreement and the Asset Allocation Management Agreement. In reaching their decision, the Trustees requested and obtained from TFAI and the Portfolio Construction Manager such information as they deemed reasonably necessary to evaluate the proposed agreements. The Trustees also carefully considered the information that they had received throughout the year from TFAI and the Portfolio Construction Manager (such as in-person presentations by the Portfolio Construction Manager) as part of their regular oversight of the Fund, as well as: comparative fee, expense and performance information prepared by Lipper Inc. ("Lipper"), independent providers of mutual fund performance, fee and expense information, and profitability data. In considering the proposed continuation of the Investment Advisory Agreement and the Asset Allocation Management Agreement, the Trustees evaluated a number of considerations that they believe, in light of the legal advice furnished to them by TA IDEX counsel and independent leg al counsel and their own business judgment, to be relevant. They based their decisions on the following considerations, among others, although they did not identify any consideration or particular information that was controlling of their decisions:
The nature, extent and quality of the advisory service to be provided. The Board considered the nature and quality of the services provided by TFAI and the Portfolio Construction Manager to the Fund in the past, as well as the services anticipated to be provided in the future. The Board concluded that TFAI and the Portfolio Construction Manager are capable of providing high quality services to the Fund, as indicated by the nature and quality of services provided in the past, TFAI's and the Portfolio Construction Manager's management capabilities demonstrated with respect to the funds they manage, including the Fund, and the experience, capability and integrity of TFAI's senior management, the financial resources of TFAI and the Portfolio Construction Manager, TFAI's management oversight process, the professional qualifications and experience of the Po rtfolio Construction Manager's portfolio management team, and the Fund's investment performance. The Trustees also concluded that TFAI and the Portfolio Construction Manager proposed to provide investment and related services that were of the same quality and quantity as services provided to the Fund in the past, and that these services are appropriate in scope and extent in light of the Fund's operations, the competitive landscape of the investment company business and investor needs, and that TFAI's and the Portfolio Construction Manager's obligations will remain substantially the same.
The investment performance of the Fund. The Board examined both the short-term and longer-term performance of the Fund, including relative performance against a benchmark securities index and a peer group of comparable mutual funds as prepared by Lipper, for various trailing periods ended June 30, 2005. The Trustees concluded that TFAI and the Portfolio Construction Manager generally had achieved acceptable investment performance, noting that the performance of the Fund has been at median relative to its peers over the past one-, two- and three-year periods and competitive to the benchmark index over the past one-, two- and three-year periods. On the basis of the Trustees' assessment of the nature, extent and quality of advisory services to be provided or procured by TFAI and the Portfolio Construction Manager, the Trustees concluded that TFAI and the Portfolio Construction Manager are capable of generating a level of investment performance that is appropriate in light of the Fund's investment objective, policies and strategies and competitive with many other investment companies, and also determined that TFAI's and the Portfolio Construction Manager's performance records indicate that their continued management is likely to benefit the Fund and its shareholders.
The cost of advisory services provided and the level of profitability. The Board reviewed profitability information regarding TFAI's costs of procuring portfolio management services, as well as the costs of provision of administration, transfer agency, fund accounting and other services, to the Fund and to TA IDEX as a whole by TFAI and its affiliates. However, the Board noted that the profitability data provided to the Board was based on a prior fee arrangement which has been changed following negotiations between TFAI and the Portfolio Construction Manager pursuant to which the Portfolio Construction Manager agreed to assume additional responsibilities in managing the Fund, and the Board noted that the Portfolio Construction Manager receives the entirety of the management fee payable by the Fund while TFAI gets compensated through the management fee s payable by the underlying funds in which the Fund invests. The Trustees reviewed data from Lipper that compared the Fund's management fees, and other fees and expenses (including total expenses including and excluding 12b-1 distribution and service fees). Based on such information, the Trustees determined that the management fees and overall expense ratio of the Fund generally are consistent with industry
Transamerica IDEX Mutual Funds
Semi-Annual Report 2006
8
TA IDEX Asset Allocation – Moderate Growth Portfolio (continued)
averages. In addition, on the basis of the Board's review of the management fees to be charged by TFAI for investment advisory and related services, TFAI profitability information (derived from TFAI's audited financial statements), TFAI's estimated management income resulting from its management of the Fund, the estimated margin of the Portfolio Construction Manager, as well as the entirety of TFAI's and its affiliates' service relationship with TA IDEX, the Board concluded that the level of investment management fees and other service fees, as well as TFAI's and the Portfolio Construction Manager's profitability, are appropriate in light of the services provided, the management fees and overall expense ratios of comparable investment companies and the anticipated profitability of the relationship between the Fund, TFAI and its affiliates, and the Portfolio Construction Manager.
Whether fee levels reflect economies of scale and the extent to which economies of scale would be realized as the Fund grows. The Board noted that the management fee of the Fund does not contain asset-based breakpoints, despite TFAI's efforts to negotiate such breakpoints with the Portfolio Construction Manager (the Board instructed TFAI to continue to try to negotiate breakpoints for the Fund in the future). However, the Board also noted that, based on the information provided by TFAI, the Fund's investments in underlying funds have permitted the realization of breakpoints (or lower breakpoints) at the underlying fund level which, indirectly, benefit the Fund and its shareholders, as well as the underlying funds. The Board carefully reviewed the one- and three-year performance record and the fees and expenses of the Fund and the comparative informati on provided by Lipper. The Board concluded that the Fund has management fees in line with, or lower than, its peers. The Board also concluded that the Fund's management fee appropriately reflects the Fund's current size, the current economic environment for TFAI, the competitive nature of the investment company market, and TFAI's pricing strategy. The Trustees also concluded that they will have the opportunity to periodically reexamine whether the Fund has achieved economies of scale, and the appropriateness of management fees payable to TFAI and fees payable to the Portfolio Construction Manager, in the future.
Benefits (such as soft dollars) to TFAI, its affiliates, or the Portfolio Construction Manager from their relationship with the Fund. The Board concluded that other benefits derived by TFAI (including any benefits derived from investment advisory fees payable to TFAI with respect to the underlying funds in which the Fund invests) or the Portfolio Construction Manager from its relationship with the Fund are reasonable and fair, and are consistent with industry practice and the best interests of the Fund and its shareholders. In this regard, the Board noted that neither TFAI nor the Portfolio Construction Manager realizes "soft dollar" benefits from its relationship with the Fund. In addition, the Trustees determined that the administration, transfer agency, fund accounting and other fees paid by the Fund to affiliates of TFAI are reasonable, fair and i n the best interests of shareholders in light of the nature and quality of the services provided, the associated costs to these affiliates of providing the services, the impact of the costs of such services on the Fund's overall operating expenses, and the necessity of the services for the Fund's operations.
Other considerations. The Board determined that TFAI had made a substantial commitment to the recruitment and retention of high quality personnel, and maintained the financial, compliance and operational resources reasonably necessary to manage the Fund in a professional manner that is consistent with the best interests of the Fund and its shareholders. In this regard, the Trustees favorably considered the procedures and policies in place by TFAI to enforce compliance with applicable laws and regulations and oversee the portfolio management activities of the Portfolio Construction Manager. The Trustees also determined that TFAI had made a significant entrepreneurial commitment to the management and success of the Fund, reflected by TFAI's expense limitation and fee waiver arrangement with the Fund, which may result in TFAI waiving advisory fees for th e benefit of shareholders.
Transamerica IDEX Mutual Funds
Semi-Annual Report 2006
9
TA IDEX Asset Allocation – Moderate Portfolio
UNDERSTANDING YOUR FUND'S EXPENSES
(unaudited)
SHAREHOLDER EXPENSES
Fund shareholders may incur two types of costs: (1) transaction costs, including sales charges (loads) on purchases, contingent deferred sales charges on redemptions and redemption fees; and (2) ongoing costs, including management fees, 12b-1 distribution and service fees, and other fund expenses.
The following Example is intended to help you understand your ongoing costs (in dollars and cents) of investing in the Fund and to compare these costs with the ongoing costs of investing in other funds.
The Example is based on an investment of $1,000 invested at November 1, 2005 and held for the entire period until April 30, 2006.
ACTUAL EXPENSES
The first line in the table below provides information about actual account values and actual expenses. You may use the information in this line, together with the amount you invested, to estimate the expenses that you paid over the period. Simply divide your account value by $1,000 (for example, an $8,600 account value divided by $1,000 = 8.6), then multiply the result by the number in the first line of your Fund under the heading entitled "Expenses Paid During Period" to estimate the expenses you paid on your account during this period. If your account is an IRA, your expenses could have included a $15 annual fee. The amount of any fee paid through your account would increase the estimate of expenses you paid during the period and decrease your ending account value.
HYPOTHETICAL EXAMPLE FOR COMPARISON PURPOSES
The second line in the table below provides information about hypothetical account values and hypothetical expenses based on the Fund's actual expense ratio and an assumed rate of return of 5% per year before expenses, which is not the Fund's actual return. The hypothetical account values and expenses may not be used to estimate the actual ending account balance or expenses you paid for the period. You may use this information to compare the ongoing costs of investing in your Fund and other funds. To do so, compare this 5% hypothetical example with the 5% hypothetical examples that appear in the shareholder reports of the other funds. As in the case of the actual expense example, if your account is subject to an IRA fee, the amount of the fee paid through your account would increase the hypothetical expenses you would have paid during the period and decrease the hypothetical ending account value.
Please note that the expenses shown in the table are meant to highlight your ongoing costs only and do not reflect any transactional costs, such as sales charges, redemption fees, brokerage commissions paid on purchases and sales of fund shares. Therefore, the second line under the Fund in the table is useful in comparing ongoing costs only, and will not help you determine the relative total costs of owning different funds. If any of these transaction costs were included, your costs would be higher. The expenses shown in the table do not reflect any fees that may be charged to you by brokers, financial intermediaries or other financial institutions. The expenses shown in the table do not reflect any expenses from the Funds investment in other affiliated investment companies. The average weighted annualized expense ratio of the underlying investment companies at April 30, 2006, was 0.88%.
| Beginning Account Value | Ending Account Value | Annualized Expense Ratio | Expenses Paid During Period (a) | ||||||||||||||||
| Class A | |||||||||||||||||||
| Actual | $ | 1,000.00 | $ | 1,102.60 | 0.56 | % | $ | 2.92 | |||||||||||
| Hypothetical (b) | 1,000.00 | 1,022.02 | 0.56 | 2.81 | |||||||||||||||
| Class B | |||||||||||||||||||
| Actual | 1,000.00 | 1,099.00 | 1.23 | 6.40 | |||||||||||||||
| Hypothetical (b) | 1,000.00 | 1,018.70 | 1.23 | 6.16 | |||||||||||||||
| Class C | |||||||||||||||||||
| Actual | 1,000.00 | 1,099.50 | 1.19 | 6.19 | |||||||||||||||
| Hypothetical (b) | 1,000.00 | 1,018.89 | 1.19 | 5.96 | |||||||||||||||
(a) Expenses are calculated using the Fund's annualized expense ratio (as disclosed in the table), multiplied by the average account value for the period, multiplied by number of days in the period (181 days), and divided by the number of days in the year (365 days).
(b) 5% return per year before expenses.
GRAPHICAL PRESENTATION OF SCHEDULE OF INVESTMENTS
By Investment Type
At April 30, 2006

This chart shows the percentage breakdown by investment type of the Fund's total investment securities.
Transamerica IDEX Mutual Funds
Semi-Annual Report 2006
1
TA IDEX Asset Allocation – Moderate Portfolio
SCHEDULE OF INVESTMENTS
At April 30, 2006
(all amounts except share amounts in thousands)
(unaudited)
| Shares | Value | ||||||||||
| INVESTMENT COMPANIES (99.9%) Ø | |||||||||||
| Aggressive Equity (15.6%) | |||||||||||
| TA IDEX Evergreen Health Care | 4,437,366 | $ | 59,505 | ||||||||
| TA IDEX J.P. Morgan Mid Cap Value | 3,223,573 | 35,588 | |||||||||
| TA IDEX T. Rowe Price Small Cap | 262,916 | 2,311 | |||||||||
| TA IDEX Transamerica Growth Opportunities ‡ | 5,220,619 | 47,038 | |||||||||
| TA IDEX Transamerica Small/Mid Cap Value | 5,309,004 | 96,730 | |||||||||
| Capital Preservation (0.0%) | |||||||||||
| TA IDEX Transamerica Money Market | 170,509 | 171 | |||||||||
| Fixed-Income (32.2%) | |||||||||||
| TA IDEX PIMCO Real Return TIPS | 8,629,958 | 86,127 | |||||||||
| TA IDEX PIMCO Total Return | 10,241,588 | 103,235 | |||||||||
| TA IDEX Transamerica Convertible Securities | 7,139,915 | 93,961 | |||||||||
| TA IDEX Transamerica Flexible Income | 5,306,146 | 49,241 | |||||||||
| TA IDEX Transamerica High-Yield Bond | 10,685,810 | 98,096 | |||||||||
| TA IDEX Transamerica Short-Term Bond | 7,074,487 | 69,047 | |||||||||
| Foreign Fixed-Income (8.2%) | |||||||||||
| TA IDEX JPMorgan International Bond | 5,487,842 | 56,799 | |||||||||
| TA IDEX Van Kampen Emerging Markets Debt | 6,605,309 | 70,148 | |||||||||
| Shares | Value | ||||||||||
| Growth Equity (26.3%) | |||||||||||
| TA IDEX American Century Large Company Value | 4,611,983 | $ | 53,361 | ||||||||
| TA IDEX Federated Market Opportunity | 4,020,299 | 40,887 | |||||||||
| TA IDEX Great Companies-TechnologySM | 3,057,294 | 12,657 | |||||||||
| TA IDEX Janus Growth ‡ | 985,461 | 25,593 | |||||||||
| TA IDEX Marsico Growth ‡ | 3,666,284 | 41,392 | |||||||||
| TA IDEX Salomon Investors Value | 307,261 | 3,232 | |||||||||
| TA IDEX Transamerica Equity | 10,552,820 | 104,156 | |||||||||
| TA IDEX UBS Large Cap Value | 8,175,862 | 97,865 | |||||||||
| TA IDEX Van Kampen Mid-Cap Growth ‡ | 179,642 | 1,938 | |||||||||
| TA IDEX Van Kampen Small Company Growth | 2,076,611 | 27,577 | |||||||||
| Specialty – Real Estate (4.0%) | |||||||||||
| TA IDEX Clarion Global Real Estate Securities | 3,466,364 | 61,320 | |||||||||
| World Equity (13.6%) | |||||||||||
| TA IDEX AllianceBernstein International Value | 2,974,170 | 35,393 | |||||||||
| TA IDEX Evergreen International Small Cap | 1,868,088 | 31,122 | |||||||||
| TA IDEX Marsico International Growth | 2,636,869 | 37,180 | |||||||||
| TA IDEX Neuberger Berman International | 4,481,572 | 54,138 | |||||||||
| TA IDEX Oppenheimer Developing Markets | 2,492,102 | 29,357 | |||||||||
| TA IDEX Templeton Great Companies Global ‡ | 851,446 | 23,951 | |||||||||
| Total Investment Companies (cost: $1,355,017) # | $ | 1,549,116 | |||||||||
NOTES TO SCHEDULE OF INVESTMENTS:
Ø The Fund invests its assets in Class I shares of the underlying TA IDEX Mutual Funds, which are affiliates of the Fund.
‡ Non-income producing.
# Aggregate cost for Federal income tax purposes is $1,355,440. Aggregate gross unrealized appreciation for all securities in which there is an excess of value over tax cost and aggregate gross unrealized depreciation for all securities in which there is an excess of tax cost over value were $199,957 and $6,281, respectively. Net unrealized appreciation for tax purposes is $193,676.
The notes to the financial statements are an integral part of this report.
Transamerica IDEX Mutual Funds
Semi-Annual Report 2006
2
TA IDEX Asset Allocation – Moderate Portfolio
STATEMENT OF ASSETS AND LIABILITIES
At April 30, 2006
(all amounts except share amounts in thousands)
(unaudited)
| Assets: | |||||||
| Investment in affiliated investment companies at value (cost: $1,355,017) | $ | 1,549,116 | |||||
| Cash | 12 | ||||||
| Receivables: | |||||||
| Shares of beneficial interest sold | 8,118 | ||||||
| Dividends | 211 | ||||||
| Other | 33 | ||||||
| 1,557,490 | |||||||
| Liabilities: | |||||||
| Investment securities purchased | 2,303 | ||||||
| Accounts payable and accrued liabilities: | |||||||
| Shares of beneficial interest redeemed | 2,471 | ||||||
| Management and advisory fees | 125 | ||||||
| Distribution and service fees | 1,040 | ||||||
| Transfer agent fees | 57 | ||||||
| Dividends to shareholders | 32 | ||||||
| Other | 83 | ||||||
| 6,111 | |||||||
| Net Assets | $ | 1,551,379 | |||||
| Net Assets Consist of: | |||||||
| Shares of beneficial interest, unlimited shares authorized, no par value | $ | 1,309,314 | |||||
| Distributable net investment income (loss) | 2,363 | ||||||
| Accumulated net realized gain (loss) from investment in affiliated investment companies | 45,603 | ||||||
| Net unrealized appreciation (depreciation) on investment in affiliated investment companies | 194,099 | ||||||
| Net Assets | $ | 1,551,379 | |||||
| Net Assets by Class: | |||||||
| Class A | $ | 407,191 | |||||
| Class B | 328,681 | ||||||
| Class C | 815,507 | ||||||
| Shares Outstanding: | |||||||
| Class A | 32,782 | ||||||
| Class B | 26,573 | ||||||
| Class C | 65,956 | ||||||
| Net Asset Value Per Share: | |||||||
| Class A | $ | 12.42 | |||||
| Class B | 12.37 | ||||||
| Class C | 12.36 | ||||||
| Maximum Offering Price Per Share (a): | |||||||
| Class A | $ | 13.14 | |||||
(a) Includes the maximum selling commission (represented as a percentage of offering price) which is reduced on certain levels of sales as set forth in the Prospectus. Net asset value per share for Classes B and C shares represents offering price. The redemption price for Classes B and C shares equals net asset value less any applicable contingent deferred sales charge.
STATEMENT OF OPERATIONS
For the period ended April 30, 2006
(all amounts in thousands)
(unaudited)
| Investment Income: | |||||||
| Dividends from affiliated investment companies | $ | 22,597 | |||||
| Interest | 1 | ||||||
| 22,598 | |||||||
| Expenses: | |||||||
| Management and advisory fees | 708 | ||||||
| Distribution and service fees: | |||||||
| Class A | 591 | ||||||
| Class B | 1,512 | ||||||
| Class C | 3,598 | ||||||
| Transfer agent fees: | |||||||
| Class A | 153 | ||||||
| Class B | 167 | ||||||
| Class C | 260 | ||||||
| Printing and shareholder reports | 55 | ||||||
| Custody fees | 26 | ||||||
| Administration fees | 105 | ||||||
| Legal fees | 34 | ||||||
| Audit fees | 9 | ||||||
| Trustees fees | 27 | ||||||
| Registration fees | 77 | ||||||
| Other | 14 | ||||||
| Total expenses | 7,336 | ||||||
| Net Investment Income (Loss) | 15,262 | ||||||
| Net Realized and Unrealized Gain (Loss) on Investment in Affiliated Investment Companies: | |||||||
| Realized gain (loss) from investment in affiliated investment companies | 23,435 | ||||||
| Realized gain distributions from investment in affiliated investment companies | 22,375 | ||||||
| 45,810 | |||||||
| Increase (decrease) in unrealized appreciation (depreciation) on investment in affiliated investment companies | 73,048 | ||||||
| Net Realized and Unrealized Gain (Loss) on Investment in Affiliated Investment Companies | 118,858 | ||||||
| Net Increase (Decrease) in Net Assets Resulting from Operations | $ | 134,120 | |||||
The notes to the financial statements are an integral part of this report.
Transamerica IDEX Mutual Funds
Semi-Annual Report 2006
3
TA IDEX Asset Allocation – Moderate Portfolio
STATEMENTS OF CHANGES IN NET ASSETS
For the period or year ended
(all amounts in thousands)
| April 30, 2006 (unaudited) | October 31, 2005 | ||||||||||
| Increase (Decrease) in Net Assets From: | |||||||||||
| Operations: | |||||||||||
| Net investment income (loss) | $ | 15,262 | $ | 21,466 | |||||||
| Net realized gain (loss) from investment in affiliated investment companies | 45,810 | 28,426 | |||||||||
| Change in unrealized appreciation (depreciation) on investment in affiliated investment companies | 73,048 | 37,659 | |||||||||
| 134,120 | 87,551 | ||||||||||
| Distributions to Shareholders: | |||||||||||
| From net investment income: | |||||||||||
| Class A | (8,163 | ) | (7,272 | ) | |||||||
| Class B | (5,253 | ) | (6,249 | ) | |||||||
| Class C | (12,582 | ) | (13,126 | ) | |||||||
| (25,998 | ) | (26,647 | ) | ||||||||
| From net realized gains: | |||||||||||
| Class A | (7,262 | ) | (1,417 | ) | |||||||
| Class B | (6,368 | ) | (1,533 | ) | |||||||
| Class C | (14,834 | ) | (3,103 | ) | |||||||
| (28,464 | ) | (6,053 | ) | ||||||||
| Capital Share Transactions: | |||||||||||
| Proceeds from shares sold: | |||||||||||
| Class A | 83,384 | 143,277 | |||||||||
| Class B | 27,553 | 56,165 | |||||||||
| Class C | 140,673 | 228,072 | |||||||||
| 251,610 | 427,514 | ||||||||||
| Dividends and distributions reinvested: | |||||||||||
| Class A | 13,604 | 7,496 | |||||||||
| Class B | 9,722 | 6,500 | |||||||||
| Class C | 19,404 | 11,211 | |||||||||
| 42,730 | 25,207 | ||||||||||
| Cost of shares redeemed: | |||||||||||
| Class A | (39,831 | ) | (67,750 | ) | |||||||
| Class B | (21,682 | ) | (41,772 | ) | |||||||
| Class C | (65,340 | ) | (106,871 | ) | |||||||
| (126,853 | ) | (216,393 | ) | ||||||||
| Redemption fees: | |||||||||||
| Class A | 4 | 1 | |||||||||
| Class C | 1 | 2 | |||||||||
| 5 | 3 | ||||||||||
| April 30, 2006 (unaudited) | October 31, 2005 | ||||||||||
| Automatic conversions: | |||||||||||
| Class A | $ | 262 | $ | 281 | |||||||
| Class B | (262 | ) | (281 | ) | |||||||
| – | – | ||||||||||
| 167,492 | 236,331 | ||||||||||
| Net increase (decrease) in net assets | 247,150 | 291,182 | |||||||||
| Net Assets: | |||||||||||
| Beginning of period | 1,304,229 | 1,013,047 | |||||||||
| End of period | $ | 1,551,379 | $ | 1,304,229 | |||||||
| Distributable Net Investment Income (Loss) | $ | 2,363 | $ | 13,099 | |||||||
| Share Activity: | |||||||||||
| Shares issued: | |||||||||||
| Class A | 6,893 | 12,481 | |||||||||
| Class B | 2,291 | 4,921 | |||||||||
| Class C | 11,699 | 19,929 | |||||||||
| 20,883 | 37,331 | ||||||||||
| Shares issued–reinvested from distributions: | |||||||||||
| Class A | 1,169 | 658 | |||||||||
| Class B | 837 | 571 | |||||||||
| Class C | 1,671 | 986 | |||||||||
| 3,677 | 2,215 | ||||||||||
| Shares redeemed: | |||||||||||
| Class A | (3,293 | ) | (5,897 | ) | |||||||
| Class B | (1,802 | ) | (3,650 | ) | |||||||
| Class C | (5,431 | ) | (9,329 | ) | |||||||
| (10,526 | ) | (18,876 | ) | ||||||||
| Automatic conversions: | |||||||||||
| Class A | 22 | 25 | |||||||||
| Class B | (22 | ) | (25 | ) | |||||||
| – | – | ||||||||||
| Net increase (decrease) in shares outstanding: | |||||||||||
| Class A | 4,791 | 7,267 | |||||||||
| Class B | 1,304 | 1,817 | |||||||||
| Class C | 7,939 | 11,586 | |||||||||
| 14,034 | 20,670 | ||||||||||
The notes to the financial statements are an integral part of this report.
Transamerica IDEX Mutual Funds
Semi-Annual Report 2006
4
TA IDEX Asset Allocation – Moderate Portfolio
FINANCIAL HIGHLIGHTS
(unaudited for the period ended April 30, 2006)
| For a share of beneficial interest outstanding throughout each period | |||||||||||||||||||||||||||||||||||||||
| Net Asset | Investment Operations | Distributions | Net Asset | ||||||||||||||||||||||||||||||||||||
| For the Period Ended (d)(g) | Value, Beginning of Period | Net Investment Income (Loss) | Net Realized and Unrealized Gain (Loss) | Total Operations | From Net Investment Income | From Net Realized Gains | Total Distributions | Value, End of Period | |||||||||||||||||||||||||||||||
| Class A | 4/30/2006 | $ | 11.78 | $ | 0.16 | $ | 1.01 | $ | 1.17 | $ | (0.28 | ) | $ | (0.25 | ) | $ | (0.53 | ) | $ | 12.42 | |||||||||||||||||||
| 10/31/2005 | 11.23 | 0.27 | 0.67 | 0.94 | (0.33 | ) | (0.06 | ) | (0.39 | ) | 11.78 | ||||||||||||||||||||||||||||
| 10/31/2004 | 10.42 | 0.12 | 0.84 | 0.96 | (0.15 | ) | – | (0.15 | ) | 11.23 | |||||||||||||||||||||||||||||
| 10/31/2003 | 8.76 | 0.12 | 1.62 | 1.74 | (0.08 | ) | – | (0.08 | ) | 10.42 | |||||||||||||||||||||||||||||
| 10/31/2002 | 10.00 | 0.04 | (1.28 | ) | (1.24 | ) | – | – | – | 8.76 | |||||||||||||||||||||||||||||
| Class B | 4/30/2006 | 11.70 | 0.12 | 1.01 | 1.13 | (0.21 | ) | (0.25 | ) | (0.46 | ) | 12.37 | |||||||||||||||||||||||||||
| 10/31/2005 | 11.16 | 0.18 | 0.68 | 0.86 | (0.26 | ) | (0.06 | ) | (0.32 | ) | 11.70 | ||||||||||||||||||||||||||||
| 10/31/2004 | 10.37 | 0.05 | 0.83 | 0.88 | (0.09 | ) | – | (0.09 | ) | 11.16 | |||||||||||||||||||||||||||||
| 10/31/2003 | 8.71 | 0.05 | 1.63 | 1.68 | (0.02 | ) | – | (0.02 | ) | 10.37 | |||||||||||||||||||||||||||||
| 10/31/2002 | 10.00 | 0.01 | (1.30 | ) | (1.29 | ) | – | – | – | 8.71 | |||||||||||||||||||||||||||||
| Class C | 4/30/2006 | 11.70 | 0.12 | 1.00 | 1.12 | (0.21 | ) | (0.25 | ) | (0.46 | ) | 12.36 | |||||||||||||||||||||||||||
| 10/31/2005 | 11.17 | 0.19 | 0.67 | 0.86 | (0.27 | ) | (0.06 | ) | (0.33 | ) | 11.70 | ||||||||||||||||||||||||||||
| 10/31/2004 | 10.37 | 0.05 | 0.84 | 0.89 | (0.09 | ) | – | (0.09 | ) | 11.17 | |||||||||||||||||||||||||||||
| 10/31/2003 | 8.71 | 0.05 | 1.63 | 1.68 | (0.02 | ) | – | (0.02 | ) | 10.37 | |||||||||||||||||||||||||||||
| Ratios/Supplemental Data | |||||||||||||||||||||||||||||||
| For the Period | Total | Net Assets, End of Period | Ratio of Expenses to Average Net Assets (a)(i) | Net Investment Income (Loss) to Average | Portfolio Turnover | ||||||||||||||||||||||||||
| Ended (g) | Return (c) | (000's) | Net (e) | Total (f) | Net Assets (a)(h) | Rate (b) | |||||||||||||||||||||||||
| Class A | 4/30/2006 | 10.26 | % | $ | 407,191 | 0.56 | % | 0.56 | % | 2.63 | % | 23 | % | ||||||||||||||||||
| 10/31/2005 | 8.54 | 329,797 | 0.26 | 0.26 | 2.31 | 19 | |||||||||||||||||||||||||
| 10/31/2004 | 9.32 | 232,748 | 0.28 | 0.28 | 1.13 | 1 | |||||||||||||||||||||||||
| 10/31/2003 | 19.98 | 116,102 | 0.37 | 0.37 | 1.22 | 18 | |||||||||||||||||||||||||
| 10/31/2002 | (12.40 | ) | 17,517 | 0.45 | 0.78 | 0.83 | 12 | ||||||||||||||||||||||||
| Class B | 4/30/2006 | 9.90 | 328,681 | 1.23 | 1.23 | 1.97 | 23 | ||||||||||||||||||||||||
| 10/31/2005 | 7.81 | 295,649 | 0.92 | 0.92 | 1.61 | 19 | |||||||||||||||||||||||||
| 10/31/2004 | 8.62 | 261,772 | 0.93 | 0.93 | 0.48 | 1 | |||||||||||||||||||||||||
| 10/31/2003 | 19.39 | 183,148 | 1.02 | 1.02 | 0.57 | 18 | |||||||||||||||||||||||||
| 10/31/2002 | (12.90 | ) | 38,969 | 1.10 | 1.43 | 0.18 | 12 | ||||||||||||||||||||||||
| Class C | 4/30/2006 | 9.95 | 815,507 | 1.19 | 1.19 | 2.00 | 23 | ||||||||||||||||||||||||
| 10/31/2005 | 7.85 | 678,783 | 0.89 | 0.89 | 1.67 | 19 | |||||||||||||||||||||||||
| 10/31/2004 | 8.67 | 518,527 | 0.89 | 0.89 | 0.50 | 1 | |||||||||||||||||||||||||
| 10/31/2003 | 19.39 | 201,774 | 1.02 | 1.02 | 0.57 | 18 | |||||||||||||||||||||||||
NOTES TO FINANCIAL HIGHLIGHTS
(a) Annualized.
(b) Not annualized.
(c) Total Return has been calculated for the applicable period without deduction of a sales load, if any, on an initial purchase. Not annualized.
(d) Per share information is calculated based on average number of shares outstanding.
(e) Ratio of Net Expenses to Average Net Assets is net of fee waivers and reimbursements by the investment adviser, if any (see note 2).
(f) Ratio of Total Expenses to Average Net Assets includes all expenses before fee waivers and reimbursements by the investment adviser.
(g) TA IDEX Asset Allocation – Moderate Portfolio ("the Fund") commenced operations on March 1, 2002. The inception date for the Fund's offering of share Class C was November 11, 2002.
(h) Recognition of net investment income by the Fund is affected by the timing of the declaration of dividends by the underlying investment companies in which the Fund invests.
(i) Does not include expenses of the investment companies in which the Fund invests.
The notes to the financial statements are an integral part of this report.
Transamerica IDEX Mutual Funds
Semi-Annual Report 2006
5
TA IDEX Asset Allocation – Moderate Portfolio
NOTES TO FINANCIAL STATEMENTS
At April 30, 2006
(all amounts in thousands)
(unaudited)
NOTE 1. ORGANIZATION AND SIGNIFICANT ACCOUNTING POLICIES
Transamerica IDEX Mutual Funds is an open-end management investment company registered under the Investment Company Act of 1940, as amended (the "1940 Act").
In the normal course of business, TA IDEX Asset Allocation – Moderate Portfolio (the "Fund") enters into contracts that contain a variety of representations that provide general indemnifications. The Fund's maximum exposure under these arrangements is unknown, as this would involve future claims that may be made against the Fund and/or its affiliates that have not yet occurred. However, based on experience, the Fund expects the risk of loss to be remote.
This report should be read in conjunction with the current Fund prospectus, which contains more complete information about the Fund.
In preparing the Fund's financial statements in accordance with accounting principles generally accepted in the United States of America ("GAAP"), estimates or assumptions (which could differ from actual results) may be used that affect reported amounts and disclosures. The following is a summary of significant accounting policies followed by the Fund.
Multiple class operations, income and expenses: The Fund currently offers three classes of shares, Class A, Class B, and Class C, each with a public offering price that reflects different sales charges, if any, and expense levels. Class B shares will convert to Class A shares eight years after purchase. Income, non-class specific expenses and realized and unrealized gains and losses, are allocated daily to each class, based upon the value of shares outstanding method as permitted under Rule 18f-3 of the 1940 Act. Each class bears its own specific expenses as well as a portion of general, common expenses.
Security valuations: Investment company securities are valued at the net asset value of the underlying portfolio.
Cash: The Fund may leave cash overnight in its cash account with the custodian, Investors Bank & Trust Company ("IBT"). IBT has been contracted on behalf of the Fund to invest the excess cash into a savings account, which at April 30, 2006, was paying an interest rate of 3.24%.
Security transactions and investment income: Security transactions are recorded on the trade date. Security gains and losses are calculated on the specific identification basis. Dividend income, if any, is recorded on the ex-dividend date. Dividends and net realized gain (loss) from investment securities for the Fund are from investments in shares of affiliated investment companies.
Redemption fees: A short-term trading redemption fee may be assessed on any fund shares in a fund account that are sold during the first five (5) New York Stock Exchange ("NYSE") trading days following their purchase date. This redemption fee will equal 2% of the amount redeemed and shares held the longest will be treated as being redeemed first and shares held the shortest as being redeemed last. For the six months ended April 30, 2006, the Fund received $5 in redemption fees.
Dividend distributions: Distributions to shareholders are recorded on the ex-dividend date and are determined in accordance with Federal income tax regulations which may differ from GAAP.
NOTE 2. RELATED PARTY TRANSACTIONS
Transamerica Fund Advisors, Inc. ("TFAI") is the Fund's investment adviser. Transamerica Fund Services, Inc. ("TFS") is the Fund's administrator and transfer agent. AFSG Securities Corp. ("AFSG") is the Fund's distributor/principal underwriter. TFAI, TFS, and AFSG are affiliates of AEGON, NV, a Netherlands corporation.
Transamerica Investment Management, LLC and Great Companies, L.L.C. are affiliates of the Fund and are sub-advisers to other funds within Transamerica IDEX Mutual Funds.
Certain officers and trustees of the Fund are also officers and/or directors of TFAI, TFS and AFSG.
Because the underlying funds have varied expense and fee levels and the Fund may own different proportions of underlying funds at different times, the amount of fees and expenses incurred indirectly by the Fund will vary.
Investment advisory fees: The Fund pays management fees to TFAI based on average daily net assets ("ANA") at the following rate:
0.10% of ANA
TFAI has contractually agreed to waive its advisory fee and will reimburse the Fund to the extent that operating expenses, excluding 12b-1 fees, exceed the following stated annual limit:
0.45% Expense Limit
If total Fund expenses fall below the annual expense limitation agreement agreed to by the adviser within the succeeding three years, the Fund may be required to pay the adviser a portion or all of the waived advisory fees.
There are no amounts available for recapture at April 30, 2006.
Distribution and service fees: The Fund has a 12b-1 distribution plan under the 1940 Act pursuant to which an annual fee, based on average daily net assets, is paid to the distributor for various disbursements
Transamerica IDEX Mutual Funds
Semi-Annual Report 2006
6
TA IDEX Asset Allocation – Moderate Portfolio
NOTES TO FINANCIAL STATEMENTS (continued)
At April 30, 2006
(all amounts in thousands)
(unaudited)
NOTE 2.–(continued)
such as broker-dealer account servicing fees and other promotional expenses of the Fund. The Fund is authorized under the 12b-1 plan to pay fees on each class up to the following limits:
Class A 0.35%
Class B 1.00%
Class C 1.00%
In the case the Fund or a class of shares of the Fund is closed to new investors or investments, the Fund is authorized to pay 12b-1 fees for past sales and distribution efforts and present and past investor services.
Underwriter commissions relate to front-end sales charges imposed for Class A shares and contingent deferred sales charges from Classes B, C, and certain A share redemptions. For the six months ended April 30, 2006, the underwriter commissions were as follows:
| Received by Underwriter | $ | 2,860 | |||||
| Retained by Underwriter | 468 | ||||||
| Contingent Deferred Sales Charge | 413 | ||||||
Administrative services: The Fund has entered into an agreement with TFS for financial and legal fund administration services. As of January 1, 2006, the Fund pays TFS an annual fee of 0.0125% of ANA. For the period November 1, 2005 through December 31, 2005, the Fund paid TFS an annual fee of 0.02% of ANA. The Legal fees on the Statement of Operations are fees paid to external legal counsel.
Transfer agent fees: The Fund pays TFS an annual per-account charge for each open and closed account. The Fund paid TFS $559 for the six months ended April 30, 2006.
Deferred compensation plan: Each eligible independent Fund Trustee may elect to participate in a non-qualified deferred compensation plan maintained by Transamerica IDEX Mutual Funds (the "Plan"). Under the Plan, such Trustees may defer payment of all or a portion of their total fees earned as a Fund Trustee. Each Trustee who is a participant in the Plan may elect that the earnings, losses or gains credited to his or her deferred fee amounts be determined based on a deemed investment in any series of Transamerica IDEX Mutual Funds, including the Fund. The right of a participant to receive a distribution from the Plan of the deferred fees is an unsecured claim against the general assets of all series of Transamerica IDEX Mutual Funds. The pro rata liability to the Fund of all deferred fees in the Plan amounted, as of April 30, 2006, to $33.
NOTE 3. INVESTMENT TRANSACTIONS
The cost of securities purchased and proceeds from securities sold (excluding short-term securities) for the six months ended April 30, 2006 were as follows:
| Purchases of securities: | |||||||
| Long-Term | $ | 475,161 | |||||
| U.S. Government | – | ||||||
| Proceeds from maturities and sales of securities: | |||||||
| Long-Term | 325,557 | ||||||
| U.S. Government | – | ||||||
NOTE 4. FEDERAL INCOME TAX MATTERS
The Fund has not made any provision for federal income or excise taxes due to its policy to distribute all of its taxable income and capital gains to its shareholders and otherwise qualify as a regulated investment company under Subchapter M of the Internal Revenue Code. Income and capital gain distributions are determined in accordance with income tax regulations, which may differ from GAAP. These differences are primarily due to differing treatment for items including, but not limited to, wash sales and distribution reclasses.
NOTE 5. REGULATORY PROCEEDINGS
There continues to be significant federal and state regulatory activity relating to financial services companies, particularly mutual fund companies and their investment advisers. As part of an ongoing investigation regarding potential market timing, recordkeeping and trading compliance issues and matters affecting the Fund's investment adviser, TFAI, and certain affiliates and former employees of TFAI, the SEC staff has indicated that it is likely to take some action against TFAI and certain of its affiliates at the conclusion of the investigation. The potential timing and the scope of any such action is difficult to predict. Although the impact of any action brought against TFAI and/or its affiliates is difficult to assess at the present time, the Fund currently believes that the likelihood that any such action will have a material adverse impact on it is remote. It is important to note that the Fund is not aware of any allega tion of wrongdoing against it and its Board at the time this semi-annual report is printed. Although it is not anticipated that these developments will have an adverse impact on the Fund, there can be no assurance at this time. TFAI and its affiliates are actively working with the SEC in regard to this matter; however, the exact resolution cannot be determined at this time. TFAI will take such actions that it deems necessary or appropriate to continue providing management services to the Fund and to bring all matters to an appropriate conclusion.
TFAI and/or its affiliates, and not the Fund, will bear the costs regarding these regulatory matters.
Transamerica IDEX Mutual Funds
Semi-Annual Report 2006
7
TA IDEX Asset Allocation – Moderate Portfolio
INVESTMENT ADVISORY AND ASSET ALLOCATION MANAGEMENT AGREEMENTS – REVIEW AND RENEWAL (unaudited)
At a meeting of the Board of Trustees of Transamerica IDEX Mutual Funds ("TA IDEX") held on November 2, 2005, the Board reviewed and considered the Investment Advisory Agreement between TA IDEX Asset Allocation – Moderate Portfolio (the "Fund") and Transamerica Fund Advisors, Inc. ("TFAI"), as well as the Asset Allocation Management Agreement of the Fund between TFAI and Morningstar Associates, LLC (the "Portfolio Construction Manager"), to determine whether the agreements should be renewed for a one-year period. Following their review and consideration, the Trustees determined that the Investment Advisory Agreement and the Asset Allocation Management Agreement will enable shareholders of the Fund to obtain high quality services at a cost that is appropriate, reasonable, and in the best interests of its shareholders. The Board, including the independent members of the Board, unanimously approved the renewal of the Investmen t Advisory Agreement and the Asset Allocation Management Agreement. In reaching their decision, the Trustees requested and obtained from TFAI and the Portfolio Construction Manager such information as they deemed reasonably necessary to evaluate the proposed agreements. The Trustees also carefully considered the information that they had received throughout the year from TFAI and the Portfolio Construction Manager (such as in-person presentations by the Portfolio Construction Manager) as part of their regular oversight of the Fund, as well as: comparative fee, expense and performance information prepared by Lipper Inc. ("Lipper"), independent providers of mutual fund performance, fee and expense information, and profitability data. In considering the proposed continuation of the Investment Advisory Agreement and the Asset Allocation Management Agreement, the Trustees evaluated a number of considerations that they believe, in light of the legal advice furnished to them by TA IDEX counsel and independent legal counsel and their own business judgment, to be relevant. They based their decisions on the following considerations, among others, although they did not identify any consideration or particular information that was controlling of their decisions:
The nature, extent and quality of the advisory service to be provided. The Board considered the nature and quality of the services provided by TFAI and the Portfolio Construction Manager to the Fund in the past, as well as the services anticipated to be provided in the future. The Board concluded that TFAI and the Portfolio Construction Manager are capable of providing high quality services to the Fund, as indicated by the nature and quality of services provided in the past, TFAI's and the Portfolio Construction Manager's management capabilities demonstrated with respect to the funds they manage, including the Fund, and the experience, capability and integrity of TFAI's senior management, the financial resources of TFAI and the Portfolio Construction Manager, TFAI's management oversight process, the professional qualifications and experience of the Po rtfolio Construction Manager's portfolio management team, and the Fund's investment performance. The Trustees also concluded that TFAI and the Portfolio Construction Manager proposed to provide investment and related services that were of the same quality and quantity as services provided to the Fund in the past, and that these services are appropriate in scope and extent in light of the Fund's operations, the competitive landscape of the investment company business and investor needs, and that TFAI's and the Portfolio Construction Manager's obligations will remain substantially the same.
The investment performance of the Fund. The Board examined both the short-term and longer-term performance of the Fund, including relative performance against a benchmark securities index and a peer group of comparable mutual funds as prepared by Lipper, for various trailing periods ended June 30, 2005. The Trustees concluded that TFAI and the Portfolio Construction Manager generally had achieved superior investment performance, noting that the performance of the Fund has been superior relative to its peers over the past one-, two- and three-year periods and superior to the benchmark index over the past one-, two- and three-year periods. On the basis of the Trustees' assessment of the nature, extent and quality of advisory services to be provided or procured by TFAI and the Portfolio Construction Manager, the Trustees concluded that TFAI and the Portf olio Construction Manager are capable of generating a level of investment performance that is appropriate in light of the Fund's investment objective, policies and strategies and competitive with many other investment companies, and also determined that TFAI's and the Portfolio Construction Manager's performance records indicate that their continued management is likely to benefit the Fund and its shareholders.
The cost of advisory services provided and the level of profitability. The Board reviewed profitability information regarding TFAI's costs of procuring portfolio management services, as well as the costs of provision of administration, transfer agency, fund accounting and other services, to the Fund and to TA IDEX as a whole by TFAI and its affiliates. However, the Board noted that the profitability data provided to the Board was based on a prior fee arrangement which has been changed following negotiations between TFAI and the Portfolio Construction Manager pursuant to which the Portfolio Construction Manager agreed to assume additional responsibilities in managing the Fund as a sub-adviser, and the Board noted that the Portfolio Construction Manager receives the entirety of the management fee payable by the Fund while TFAI gets compensated through t he management fees payable by the underlying funds in which the Fund invests. The Trustees reviewed data from Lipper that compared the Fund's management fees, and other fees and expenses (including total expenses including and excluding 12b-1 distribution and service fees). Based on such information, the Trustees determined that the management fees and overall expense ratio of the Fund generally are consistent with
Transamerica IDEX Mutual Funds
Semi-Annual Report 2006
8
TA IDEX Asset Allocation – Moderate Portfolio (continued)
industry averages. In addition, on the basis of the Board's review of the management fees to be charged by TFAI for investment advisory and related services, TFAI profitability information (derived from TFAI's audited financial statements), TFAI's estimated management income resulting from its management of the Fund, the estimated margin of the Portfolio Construction Manager, as well as the entirety of TFAI's and its affiliates' service relationship with TA IDEX, the Board concluded that the level of investment management fees and other service fees, as well as TFAI's and the Portfolio Construction Manager's profitability, are appropriate in light of the services provided, the management fees and overall expense ratios of comparable investment companies and the anticipated profitability of the relationship between the Fund, TFAI and its affiliates, and the Portfolio Construction Manager.
Whether fee levels reflect economies of scale and the extent to which economies of scale would be realized as the Fund grows. The Board noted that the management fee of the Fund does not contain asset-based breakpoints, despite TFAI's efforts to negotiate such breakpoints with the Portfolio Construction Manager (the Board instructed TFAI to continue to try to negotiate breakpoints for the Fund in the future). However, the Board also noted that, based on the information provided by TFAI, the Fund's investments in underlying funds have permitted the realization of breakpoints (or lower breakpoints) at the underlying fund level which, indirectly, benefit the Fund and its shareholders, as well as the underlying funds. The Board carefully reviewed the one- and three-year performance record and the fees and expenses of the Fund and the comparative informati on provided by Lipper. The Board concluded that the Fund has management fees in line with, or lower than, its peers. The Board also concluded that the Fund's management fee appropriately reflects the Fund's current size, the current economic environment for TFAI, the competitive nature of the investment company market, and TFAI's pricing strategy. The Trustees also concluded that they will have the opportunity to periodically reexamine whether the Fund has achieved economies of scale, and the appropriateness of management fees payable to TFAI and fees payable to the Portfolio Construction Manager, in the future.
Benefits (such as soft dollars) to TFAI, its affiliates, or the Portfolio Construction Manager from their relationship with the Fund. The Board concluded that other benefits derived by TFAI (including any benefits derived from investment advisory fees payable to TFAI with respect to the underlying funds in which the Fund invests) or the Portfolio Construction Manager from its relationship with the Fund are reasonable and fair, and are consistent with industry practice and the best interests of the Fund and its shareholders. In this regard, the Board noted that neither TFAI nor the Portfolio Construction Manager realizes "soft dollar" benefits from its relationship with the Fund. In addition, the Trustees determined that the administration, transfer agency, fund accounting and other fees paid by the Fund to affiliates of TFAI are reasonable, fair and i n the best interests of shareholders in light of the nature and quality of the services provided, the associated costs to these affiliates of providing the services, the impact of the costs of such services on the Fund's overall operating expenses, and the necessity of the services for the Fund's operations.
Other considerations. The Board determined that TFAI had made a substantial commitment to the recruitment and retention of high quality personnel, and maintained the financial, compliance and operational resources reasonably necessary to manage the Fund in a professional manner that is consistent with the best interests of the Fund and its shareholders. In this regard, the Trustees favorably considered the procedures and policies in place by TFAI to enforce compliance with applicable laws and regulations and oversee the portfolio management activities of the Portfolio Construction Manager. The Trustees also determined that TFAI had made a significant entrepreneurial commitment to the management and success of the Fund, reflected by TFAI's expense limitation and fee waiver arrangement with the Fund, which may result in TFAI waiving advisory fees for th e benefit of shareholders.
Transamerica IDEX Mutual Funds
Semi-Annual Report 2006
9
TA IDEX Clarion Global Real Estate Securities
UNDERSTANDING YOUR FUND'S EXPENSES
(unaudited)
SHAREHOLDER EXPENSES
Fund shareholders may incur two types of costs: (1) transaction costs, including sales charges (loads) on purchases, contingent deferred sales charges on redemptions and redemption fees; and (2) ongoing costs, including management fees, 12b-1 distribution and service fees, and other fund expenses.
The following Example is intended to help you understand your ongoing costs (in dollars and cents) of investing in the Fund and to compare these costs with the ongoing costs of investing in other funds.
The Example is based on an investment of $1,000 invested at November 1, 2005 and held for the entire period until April 30, 2006.
ACTUAL EXPENSES
The first line in the table below provides information about actual account values and actual expenses. You may use the information in this line, together with the amount you invested, to estimate the expenses that you paid over the period. Simply divide your account value by $1,000 (for example, an $8,600 account value divided by $1,000 = 8.6), then multiply the result by the number in the first line of your Fund under the heading entitled "Expenses Paid During Period" to estimate the expenses you paid on your account during this period. If your account is an IRA, your expenses could have included a $15 annual fee. The amount of any fee paid through your account would increase the estimate of expenses you paid during the period and decrease your ending account value.
HYPOTHETICAL EXAMPLE FOR COMPARISON PURPOSES
The second line in the table below provides information about hypothetical account values and hypothetical expenses based on the Fund's actual expense ratio and an assumed rate of return of 5% per year before expenses, which is not the Fund's actual return. The hypothetical account values and expenses may not be used to estimate the actual ending account balance or expenses you paid for the period. You may use this information to compare the ongoing costs of investing in your Fund and other funds. To do so, compare this 5% hypothetical example with the 5% hypothetical examples that appear in the shareholder reports of the other funds. As in the case of the actual expense example, if your account is subject to an IRA fee, the amount of the fee paid through your account would increase the hypothetical expenses you would have paid during the period and decrease the hypothetical ending account value.
Please note that the expenses shown in the table are meant to highlight your ongoing costs only and do not reflect any transactional costs, such as sales charges, redemption fees, brokerage commissions paid on purchases and sales of fund shares. Therefore, the second line under the Fund in the table is useful in comparing ongoing costs only, and will not help you determine the relative total costs of owning different funds. If any of these transaction costs were included, your costs would be higher. The expenses shown in the table do not reflect any fees that may be charged to you by brokers, financial intermediaries or other financial institutions.
| Beginning Account Value | Ending Account Value | Annualized Expense Ratio | Expenses Paid During Period (a) | ||||||||||||||||
| Class A | |||||||||||||||||||
| Actual | $ | 1,000.00 | $ | 1,200.90 | 1.33 | % | $ | 7.26 | |||||||||||
| Hypothetical (b) | 1,000.00 | 1,018.20 | 1.33 | 6.66 | |||||||||||||||
| Class B | |||||||||||||||||||
| Actual | 1,000.00 | 1,198.80 | 1.87 | 10.19 | |||||||||||||||
| Hypothetical (b) | 1,000.00 | 1,015.52 | 1.87 | 9.35 | |||||||||||||||
| Class C | |||||||||||||||||||
| Actual | 1,000.00 | 1,199.60 | 1.85 | 10.09 | |||||||||||||||
| Hypothetical (b) | 1,000.00 | 1,015.62 | 1.85 | 9.25 | |||||||||||||||
| Class I | |||||||||||||||||||
| Actual | 1,000.00 | 1,224.60 | 0.92 | 4.65 | |||||||||||||||
| Hypothetical (b) | 1,000.00 | 1,018.56 | 0.92 | 4.22 | |||||||||||||||
(a) Expenses are calculated using the Fund's annualized expense ratio (as disclosed in the table), multiplied by the average account value for the period, multiplied by number of days in the period (181 days for Classes A, B and C, and 166 days for Class I), and divided by the number of days in the year (365 days).
(b) 5% return per year before expenses.
GRAPHICAL PRESENTATION OF SCHEDULE OF INVESTMENTS
By Real Estate Property Breakdown
At April 30, 2006
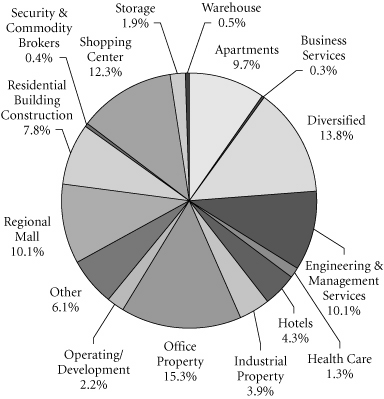
This chart shows the percentage breakdown by real estate property breakdown of the Fund's total investment securities.
Transamerica IDEX Mutual Funds
Semi-Annual Report 2006
1
TA IDEX Clarion Global Real Estate Securities
SCHEDULE OF INVESTMENTS
At April 30, 2006
(all amounts except share amounts in thousands)
(unaudited)
| Shares | Value | ||||||||||
| COMMON STOCKS ( 97.5%) | |||||||||||
| Australia (8.6%) | |||||||||||
| Centro Properties Group | 589,183 | $ | 2,906 | ||||||||
| DB RREEF Trust | 1,067,554 | 1,187 | |||||||||
| GPT Group (a) | 1,228,184 | 3,914 | |||||||||
| Investa Property Group | 953,300 | 1,570 | |||||||||
| Macquarie CountryWide Trust | 797,170 | 1,167 | |||||||||
| Macquarie Goodman Group | 437,684 | 1,710 | |||||||||
| Mirvac Group | 376,164 | 1,207 | |||||||||
| Westfield Group (a) | 625,804 | 8,039 | |||||||||
| Bermuda (2.5%) | |||||||||||
| Great Eagle Holdings, Ltd. | 468,997 | 1,697 | |||||||||
| Hongkong Land Holdings, Ltd. | 728,100 | 2,854 | |||||||||
| Kerry Properties, Ltd. | 510,000 | 1,805 | |||||||||
| Canada (2.4%) | |||||||||||
| Calloway Real Estate Investment Trust–144A | 54,700 | 1,215 | |||||||||
| RioCan Real Estate Investment Trust | 122,700 | 2,332 | |||||||||
| Summit Real Estate Investment Trust | 105,100 | 2,346 | |||||||||
| Finland (0.5%) | |||||||||||
| Citycon Oyj | 20,500 | 96 | |||||||||
| Citycon Oyj - New ‡ | 4,100 | 19 | |||||||||
| Sponda Oyj | 114,500 | 1,226 | |||||||||
| France (2.9%) | |||||||||||
| Klepierre | 15,080 | 1,766 | |||||||||
| Nexity | 17,901 | 1,249 | |||||||||
| Societe de la Tour Eiffel | 14,800 | 1,678 | |||||||||
| Unibail (a) | 14,120 | 2,456 | |||||||||
| Germany (1.4%) | |||||||||||
| Deutsche Wohnen AG | 5,107 | 1,675 | |||||||||
| IVG Immobilien AG | 20,012 | 574 | |||||||||
| Patrizia Immobilien AG ‡ | 45,600 | 1,227 | |||||||||
| Hong Kong (8.3%) | |||||||||||
| Agile Property Holdings, Ltd. ‡ | 4,737,000 | 3,666 | |||||||||
| Cheung Kong Holdings, Ltd. (a) | 378,700 | 4,266 | |||||||||
| China Overseas Land & Investment, Ltd. | 1,842,000 | 1,176 | |||||||||
| Hang Lung Development Co. | 625,648 | 1,489 | |||||||||
| Hysan Development Co., Ltd. | 702,165 | 2,019 | |||||||||
| Link (The) (a) ‡ | 420,600 | 928 | |||||||||
| New World Development, Ltd. | 537,207 | 963 | |||||||||
| Sun Hung Kai Properties, Ltd. | 389,345 | 4,449 | |||||||||
| Swire Pacific, Ltd.–Class A | 69,500 | 711 | |||||||||
| Wharf Holdings, Ltd. | 319,042 | 1,280 | |||||||||
| Italy (0.3%) | |||||||||||
| Beni Stabili SpA (a) | 652,160 | 756 | |||||||||
| Shares | Value | ||||||||||
| Japan (12.9%) | |||||||||||
| Japan Logistics Fund, Inc. | 128 | $ | 986 | ||||||||
| Kenedix Realty Investment Corp. | 125 | 670 | |||||||||
| Leopalace21 Corp. | 31,800 | 1,236 | |||||||||
| Mitsubishi Estate Co., Ltd. | 508,700 | 11,092 | |||||||||
| Mitsui Fudosan Co., Ltd. | 408,400 | 9,119 | |||||||||
| Nippon Building Fund, Inc. (a) | 188 | 1,778 | |||||||||
| Sumitomo Realty & Development Co., Ltd. | 282,600 | 7,473 | |||||||||
| Netherlands (2.1%) | |||||||||||
| Rodamco Europe NV | 45,340 | 4,872 | |||||||||
| Vastned Retail NV | 6,100 | 499 | |||||||||
| Singapore (1.8%) | |||||||||||
| Capitaland, Ltd. | 1,051,100 | 3,256 | |||||||||
| City Developments, Ltd. | 212,200 | 1,355 | |||||||||
| Spain (0.8%) | |||||||||||
| Inmobiliaria Colonial | 27,800 | 1,982 | |||||||||
| Sweden (0.8%) | |||||||||||
| Castellum AB | 212,400 | 2,063 | |||||||||
| United Kingdom (9.9%) | |||||||||||
| Atlas Estates, Ltd. ‡ | 189,700 | 1,137 | |||||||||
| British Land Co. PLC | 214,200 | 4,890 | |||||||||
| Capital & Regional PLC | 120,512 | 2,423 | |||||||||
| Derwent Valley Holdings PLC | 76,729 | 2,198 | |||||||||
| Hammerson PLC | 117,700 | 2,490 | |||||||||
| Land Securities Group PLC | 252,160 | 8,498 | |||||||||
| Liberty International PLC | 35,540 | 737 | |||||||||
| Mapeley, Ltd. | 16,855 | 984 | |||||||||
| Slough Estates PLC | 150,380 | 1,673 | |||||||||
| United States (42.3%) | |||||||||||
| AMB Property Corp. | 61,400 | 3,069 | |||||||||
| Archstone-Smith Trust | 103,500 | 5,059 | |||||||||
| AvalonBay Communities, Inc. † | 42,200 | 4,545 | |||||||||
| BioMed Realty Trust, Inc. | 43,200 | 1,196 | |||||||||
| Boston Properties, Inc. | 56,700 | 5,005 | |||||||||
| BRE Properties–Class A | 36,100 | 1,945 | |||||||||
| Camden Property Trust | 39,560 | 2,719 | |||||||||
| Corporate Office Properties Trust † | 29,600 | 1,228 | |||||||||
| Developers Diversified Realty Corp. † | 47,000 | 2,500 | |||||||||
| Equity Office Properties Trust | 84,700 | 2,736 | |||||||||
| Equity Residential | 127,700 | 5,730 | |||||||||
| Extra Space Storage, Inc. (b) | 35,000 | 550 | |||||||||
| Federal Realty Investment Trust | 27,600 | 1,883 | |||||||||
| General Growth Properties, Inc. | 64,160 | 3,012 | |||||||||
| Heritage Property Investment Trust | 30,900 | 1,193 | |||||||||
| Highwood Properties, Inc. | 51,300 | 1,618 | |||||||||
The notes to the financial statements are an integral part of this report.
Transamerica IDEX Mutual Funds
Semi-Annual Report 2006
2
TA IDEX Clarion Global Real Estate Securities
SCHEDULE OF INVESTMENTS (continued)
At April 30, 2006
(all amounts except share amounts in thousands)
(unaudited)
| Shares | Value | ||||||||||
| United States (continued) | |||||||||||
| Host Hotels & Resorts, Inc. | 94,143 | $ | 1,979 | ||||||||
| Kilroy Realty Corp. † | 16,500 | 1,177 | |||||||||
| Liberty Property Trust † | 38,649 | 1,728 | |||||||||
| Macerich Co. (The) | 57,600 | 4,217 | |||||||||
| Maguire Properties, Inc. | 64,200 | 2,180 | |||||||||
| New Plan Excel Realty Trust | 50,700 | 1,250 | |||||||||
| Omega Healthcare Investors, Inc. | 118,600 | 1,517 | |||||||||
| Pan Pacific Retail Properties, Inc. | 38,700 | 2,579 | |||||||||
| Post Properties, Inc. | 51,000 | 2,228 | |||||||||
| Prologis | 108,000 | 5,424 | |||||||||
| Public Storage, Inc. † | 25,400 | 1,953 | |||||||||
| Reckson Associates Realty Corp. † | 79,000 | 3,214 | |||||||||
| Regency Centers Corp. | 39,500 | 2,492 | |||||||||
| Shurgard Storage Centers, Inc.–Class A | 20,000 | 1,260 | |||||||||
| Simon Property Group, Inc. | 78,800 | 6,452 | |||||||||
| SL Green Realty Corp. | 36,400 | 3,604 | |||||||||
| Starwood Hotels & Resorts Worldwide, Inc. | 44,500 | 2,553 | |||||||||
| Strategic Hotel Capital, Inc. | 77,600 | 1,760 | |||||||||
| Sunstone Hotel Investors, Inc. | 39,900 | 1,147 | |||||||||
| Taubman Centers, Inc. | 28,700 | 1,181 | |||||||||
| Trizec Properties, Inc. | 160,700 | 4,021 | |||||||||
| United Dominion Realty Trust, Inc. † | 41,300 | 1,123 | |||||||||
| U-Store-It Trust | 67,300 | 1,230 | |||||||||
| Ventas, Inc. | 59,100 | 1,931 | |||||||||
| Vornado Realty Trust † | 45,500 | 4,352 | |||||||||
| Total Common Stocks (cost: $204,372) | 245,569 | ||||||||||
| Principal | Value | ||||||||||
| SECURITY LENDING COLLATERAL ( 6.3%) | |||||||||||
| Debt (5.9%) | |||||||||||
| Bank Notes (0.7%) | |||||||||||
| Bank of America | |||||||||||
| 4.81%, due 06/07/2006 * | $ | 522 | $ | 522 | |||||||
| 4.81%, due 08/10/2006 * | 504 | 504 | |||||||||
| Bear Stearns & Co. 5.01%, due 06/06/2006 * 5.01%, due 09/07/2006 * | 202 605 | 202 605 | |||||||||
| Certificates of Deposit (0.4%) | |||||||||||
| Halifax Bank of Scotland 4.78%, due 06/06/2006 * | 504 | 504 | |||||||||
| Rabobank Nederland 4.87%, due 05/31/2006 * | 504 | 504 | |||||||||
| Commercial Paper (0.3%) | |||||||||||
| Banco Santander Central Hispano SA 4.77%, due 05/02/2006 | 303 | 303 | |||||||||
| Principal | Value | ||||||||||
| Commercial Paper (continued) | |||||||||||
| Sheffield Receivables Corp.–144A 4.81%, due 05/03/2006 | $ | 503 | $ | 503 | |||||||
| Euro Dollar Overnight (1.1%) | |||||||||||
| Bank of Montreal 4.77%, due 05/02/2006 | 403 | 403 | |||||||||
| Dexia Group 4.78%, due 05/04/2006 | 504 | 504 | |||||||||
| Fortis Bank 4.77%, due 05/01/2006 | 202 | 202 | |||||||||
| Royal Bank of Canada 4.77%, due 05/01/2006 | 706 | 706 | |||||||||
| Royal Bank of Scotland 4.75%, due 05/03/2006 | 504 | 504 | |||||||||
| Svenska Handlesbanken 4.82%, due 05/01/2006 | 385 | 385 | |||||||||
| Euro Dollar Terms (1.6%) | |||||||||||
| BancoBilbao Vizcaya Argentaria SA 4.95%, due 06/20/2006 | 403 | 403 | |||||||||
| Bank of the West 4.94%, due 06/16/2006 | 403 | 403 | |||||||||
| Barclays 4.79%, due 05/10/2006 4.77%, due 05/16/2006 | 605 202 | 605 202 | |||||||||
| Canadian Imperial Bank of Commerce 4.97%, due 06/23/2006 | 303 | 303 | |||||||||
| Credit Suisse First Boston Corp. 4.73%, due 05/08/2006 | 303 | 303 | |||||||||
| Fortis Bank 4.83%, due 05/08/2006 | 202 | 202 | |||||||||
| Lloyds TSB Bank 4.81%, due 05/11/2006 | 303 | 303 | |||||||||
| Royal Bank of Scotland 4.87%, due 05/12/2006 | 403 | 403 | |||||||||
| Societe Generale 4.79%, due 05/10/2006 | 504 | 504 | |||||||||
| UBS AG 4.95%, due 06/20/2006 | 504 | 504 | |||||||||
| Repurchase Agreements (1.8%) †† | |||||||||||
| Credit Suisse First Boston Corp. 4.92%, dated 04/28/2006 to be repurchased at $685 on 05/01/2006 | 685 | 685 | |||||||||
| Goldman Sachs Group, Inc. (The) 4.92%, dated 04/28/2006 to be repurchased at $1,482 on 05/01/2006 | 1,481 | 1,481 | |||||||||
The notes to the financial statements are an integral part of this report.
Transamerica IDEX Mutual Funds
Semi-Annual Report 2006
3
TA IDEX Clarion Global Real Estate Securities
SCHEDULE OF INVESTMENTS (continued)
At April 30, 2006
(all amounts except share amounts in thousands)
(unaudited)
| Principal | Value | ||||||||||
| Repurchase Agreements (continued) | |||||||||||
| Lehman Brothers, Inc. 4.92%, dated 04/28/2006 to be repurchased at $25 on 05/01/2006 | $ | 25 | $ | 25 | |||||||
| Merrill Lynch & Co. 4.87%, dated 04/28/2006 to be repurchased at $1,513 on 05/01/2006 | 1,513 | 1,513 | |||||||||
| Morgan Stanley Dean Witter & Co. 4.93%, dated 04/28/2006 to be repurchased at $706 on 05/01/2006 | 706 | 706 | |||||||||
| Shares | Value | ||||||||||
| Investment Companies (0.4%) | |||||||||||
| Barclays Global Investors Institutional Money Market Fund 1-day yield of 4.78% | 806,730 | $ | 807 | ||||||||
| Merrimac Cash Fund, Premium Class 1-day yield of 4.61% @ | 214,643 | 215 | |||||||||
| Total Security Lending Collateral (cost: $15,918) | 15,918 | ||||||||||
| Total Investment Securities (cost: $220,290) # | $ | 261,487 | |||||||||
| FORWARD FOREIGN CURRENCY CONTRACTS: | |||||||||||||||||||
| Currency | Bought (Sold) | Settlement Date | Amount in U.S. Dollars Bought (Sold) | Net Unrealized Appreciation (Depreciation) | |||||||||||||||
| Japanese Yen | 37,958 | 05/02/2006 | $ | 325 | $ | 7 | |||||||||||||
| $ | 325 | $ | 7 | ||||||||||||||||
NOTES TO SCHEDULE OF INVESTMENTS:
(a) Passive Foreign Investment Company.
(b) Restricted security. At April 30, 2006, the Fund owned the following security (representing 0.2% of Net Assets) which was restricted as to public resale.
| Description | Date of Acquisition | Shares | Cost | Value | |||||||||||||||
| Extra Space Storage, Inc. | 06/20/2005– 10/12/2005 | 35,000 | $ | 480 | $ | 550 | |||||||||||||
‡ Non-income producing.
† At April 30, 2006, all or a portion of this security is on loan (see Note 1). The value at April 30, 2006, of all securities on loan is $15,496.
* Floating or variable rate note. Rate is listed as of April 30, 2006.
†† Cash collateral for the Repurchase Agreements, valued at $4,539, that serve as collateral for securities lending are invested in corporate bonds with interest rates and maturity dates ranging from 0.00%–9.05% and 05/02/2006–12/31/2049, respectively.
@ Regulated investment company advised by Investors Bank and Trust Co. ("IBT"). IBT is also the accounting, custody and lending agent for the Fund.
# Aggregate cost for Federal income tax purposes is $219,974. Aggregate gross unrealized appreciation for all securities in which there is an excess of value over tax cost and aggregate gross unrealized depreciation for all securities in which there is an excess of tax cost over value were $41,644 and $131, respectively. Net unrealized appreciation for tax purposes is $41,513.
DEFINITIONS:
144A 144A Securities are registered pursuant to Rule 144A of the Securities Act of 1933. These securities are deemed to be liquid for purposes of compliance limitations on holdings of illiquid securities and may be resold as transactions exempt from registration, normally to qualified institutional buyers. At April 30, 2006, these securities aggregated $1,718 or 0.7% of the net assets of the Fund.
The notes to the financial statements are an integral part of this report.
Transamerica IDEX Mutual Funds
Semi-Annual Report 2006
4
TA IDEX Clarion Global Real Estate Securities
SCHEDULE OF INVESTMENTS (continued)
At April 30, 2006
(all amounts except share amounts in thousands)
(unaudited)
| Percentage of Net Assets | Value | ||||||||||
| INVESTMENTS BY INDUSTRY: | |||||||||||
| Office Property | 15.9 | % | $ | 39,994 | |||||||
| Diversified | 14.3 | % | 36,050 | ||||||||
| Shopping Center | 12.8 | % | 32,144 | ||||||||
| Regional Mall | 10.5 | % | 26,521 | ||||||||
| Engineering & Management Services | 10.5 | % | 26,365 | ||||||||
| Apartments | 10.1 | % | 25,368 | ||||||||
| Residential Building Construction | 8.1 | % | 20,443 | ||||||||
| Hotels | 4.5 | % | 11,353 | ||||||||
| Industrial Property | 4.0 | % | 10,221 | ||||||||
| Operating/ Development | 2.3 | % | 5,836 | ||||||||
| Storage | 2.0 | % | 4,992 | ||||||||
| Health Care | 1.4 | % | 3,448 | ||||||||
| Security & Commodity Brokers | 0.4 | % | 1,137 | ||||||||
| Warehouse | 0.4 | % | 986 | ||||||||
| Business Services | 0.3 | % | 711 | ||||||||
| Investment Securities, at value | 97.5 | % | 245,569 | ||||||||
| Short-Term Investments | 6.3 | % | 15,918 | ||||||||
| Total Investment Securities | 103.8 | % | $ | 261,487 | |||||||
The notes to the financial statements are an integral part of this report.
Transamerica IDEX Mutual Funds
Semi-Annual Report 2006
5
TA IDEX Clarion Global Real Estate Securities
STATEMENT OF ASSETS AND LIABILITIES
At April 30, 2006
(all amounts except per share amounts in thousands)
(unaudited)
| Assets: | |||||||
| Investment securities, at value (cost: $220,290) (including securities loaned of $15,496) | $ | 261,487 | |||||
| Cash | 8,031 | ||||||
| Receivables: | |||||||
| Investment securities sold | 2,367 | ||||||
| Shares of beneficial interest sold | 638 | ||||||
| Interest | 18 | ||||||
| Dividends | 579 | ||||||
| Dividend reclaims receivable | 2 | ||||||
| Unrealized appreciation on forward foreign currency contracts | 7 | ||||||
| Other | 4 | ||||||
| 273,133 | |||||||
| Liabilities: | |||||||
| Investment securities purchased | 5,153 | ||||||
| Accounts payable and accrued liabilities: | |||||||
| Shares of beneficial interest redeemed | 15 | ||||||
| Management and advisory fees | 160 | ||||||
| Transfer agent fees | 2 | ||||||
| Administration fees | 4 | ||||||
| Payable for collateral for securities on loan | 15,918 | ||||||
| Other | 27 | ||||||
| 21,279 | |||||||
| Net Assets | $ | 251,854 | |||||
| Net Assets Consist of: | |||||||
| Shares of beneficial interest, unlimited shares authorized, no par value | $ | 191,499 | |||||
| Distributable net investment income (loss) | 967 | ||||||
| Accumulated net realized gain (loss) from investment securities and foreign currency transactions | 18,196 | ||||||
| Net unrealized appreciation (depreciation) on: | |||||||
| Investment securities | 41,197 | ||||||
| Translation of assets and liabilities denominated in foreign currencies | (5 | ) | |||||
| Net Assets | $ | 251,854 | |||||
| Net Assets by Class: | |||||||
| Class A | $ | 7,345 | |||||
| Class B | 6,066 | ||||||
| Class C | 2,946 | ||||||
| Class I | 235,497 | ||||||
| Shares Outstanding: | |||||||
| Class A | 414 | ||||||
| Class B | 343 | ||||||
| Class C | 168 | ||||||
| Class I | 13,309 | ||||||
| Net Asset Value Per Share: | |||||||
| Class A | $ | 17.74 | |||||
| Class B | 17.69 | ||||||
| Class C | 17.55 | ||||||
| Class I | 17.69 | ||||||
| Maximum Offering Price Per Share (a): | |||||||
| Class A | $ | 18.77 | |||||
(a) Includes the maximum selling commission (represented as a percentage of offering price) which is reduced on certain levels of sales as set forth in the Prospectus. Net asset value per share for Classes B, C and I shares represents offering price. The redemption price for Classes B and C shares equals net asset value less any applicable contingent deferred sales charge.
STATEMENT OF OPERATIONS
For the period ended April 30, 2006 (b)
(all amounts in thousands)
(unaudited)
| Investment Income: | |||||||
| Dividends (net of withholding taxes on foreign dividends of $234) | $ | 3,258 | |||||
| Interest | 65 | ||||||
| Income from loaned securities–net | 6 | ||||||
| 3,329 | |||||||
| Expenses: | |||||||
| Management and advisory fees | 832 | ||||||
| Distribution and service fees: | |||||||
| Class A | 27 | ||||||
| Class B | 21 | ||||||
| Class C | 14 | ||||||
| Transfer agent fees: | |||||||
| Class A | 11 | ||||||
| Class B | 10 | ||||||
| Class C | 4 | ||||||
| Class I | – | (c) | |||||
| Printing and shareholder reports | 3 | ||||||
| Custody fees | 66 | ||||||
| Administration fees | 21 | ||||||
| Legal fees | 5 | ||||||
| Audit fees | 9 | ||||||
| Trustees fees | 4 | ||||||
| Registration fees | 10 | ||||||
| Other | 2 | ||||||
| Total expenses | 1,039 | ||||||
| Net Investment Income (Loss) | 2,290 | ||||||
| Net Realized Gain (Loss) from: | |||||||
| Investment securities | 18,597 | ||||||
| Foreign currency transactions | (248 | ) | |||||
| 18,349 | |||||||
| Net Increase (Decrease) in Unrealized Appreciation (Depreciation) on: | |||||||
| Investment securities | 18,809 | ||||||
| Translation of assets and liabilities denominated in foreign currencies | (5 | ) | |||||
| 18,804 | |||||||
| Net Realized and Unrealized Gain (Loss) on Investment Securities and Foreign Currency Transactions | 37,153 | ||||||
| Net Increase (Decrease) in Net Assets Resulting from Operations | $ | 39,443 | |||||
(b) Class I was offered for investment on November 15, 2005.
(c) Rounds to less than $1.
The notes to the financial statements are an integral part of this report.
Transamerica IDEX Mutual Funds
Semi-Annual Report 2006
6
TA IDEX Clarion Global Real Estate Securities
STATEMENTS OF CHANGES IN NET ASSETS
For the period or year ended
(all amounts in thousands)
| April 30, 2006 (unaudited) (a) | October 31, 2005 | ||||||||||
| Increase (Decrease) In Net Assets From: | |||||||||||
| Operations: | |||||||||||
| Net investment income (loss) | $ | 2,290 | $ | 2,249 | |||||||
| Net realized gain (loss) from investment securities and foreign currency transactions | 18,349 | 17,287 | |||||||||
| Change in unrealized appreciation (depreciation) on investment securities and foreign currency translation | 18,804 | 3,612 | |||||||||
| 39,443 | 23,148 | ||||||||||
| Distributions to Shareholders: | |||||||||||
| From net investment income: | |||||||||||
| Class A | (18 | ) | (3,317 | ) | |||||||
| Class B | (26 | ) | (82 | ) | |||||||
| Class C | (16 | ) | (107 | ) | |||||||
| Class I | (1,263 | ) | – | ||||||||
| (1,323 | ) | (3,506 | ) | ||||||||
| From net realized gains: | |||||||||||
| Class A | (603 | ) | (1,619 | ) | |||||||
| Class B | (537 | ) | (57 | ) | |||||||
| Class C | (345 | ) | (76 | ) | |||||||
| Class I | (14,490 | ) | – | ||||||||
| (15,975 | ) | (1,752 | ) | ||||||||
| Capital Share Transactions: | |||||||||||
| Proceeds from shares sold: | |||||||||||
| Class A | 2,116 | 19,659 | |||||||||
| Class B | 112 | 3,365 | |||||||||
| Class C | 60 | 2,151 | |||||||||
| Class I | 256,411 | – | |||||||||
| 258,699 | 25,175 | ||||||||||
| Dividends and distributions reinvested: | |||||||||||
| Class A | 604 | 4,922 | |||||||||
| Class B | 504 | 121 | |||||||||
| Class C | 320 | 145 | |||||||||
| Class I | 15,753 | – | |||||||||
| 17,181 | 5,188 | ||||||||||
| Cost of shares redeemed: | |||||||||||
| Class A | (133,168 | ) | (27,189 | ) | |||||||
| Class B | (1,786 | ) | (1,527 | ) | |||||||
| Class C | (3,378 | ) | (2,761 | ) | |||||||
| Class I | (59,405 | ) | – | ||||||||
| (197,737 | ) | (31,477 | ) | ||||||||
| Automatic conversions: | |||||||||||
| Class A | 6 | 90 | |||||||||
| Class B | (6 | ) | (90 | ) | |||||||
| – | – | ||||||||||
| 78,143 | (1,114 | ) | |||||||||
| Net increase (decrease) in net assets | 100,288 | 16,776 | |||||||||
| Net Assets: | |||||||||||
| Beginning of period | 151,566 | 134,790 | |||||||||
| End of period | $ | 251,854 | $ | 151,566 | |||||||
| Distributable Net Investment Income (Loss) | $ | 967 | $ | – | |||||||
| April 30, 2006 (unaudited) (a) | October 31, 2005 | ||||||||||
| Share Activity: | |||||||||||
| Shares issued: | |||||||||||
| Class A | 134 | 1,233 | |||||||||
| Class B | 7 | 221 | |||||||||
| Class C | 4 | 141 | |||||||||
| Class I | 16,149 | – | |||||||||
| 16,294 | 1,595 | ||||||||||
| Shares issued–reinvested from distributions: | |||||||||||
| Class A | 39 | 321 | |||||||||
| Class B | 32 | 8 | |||||||||
| Class C | 21 | 9 | |||||||||
| Class I | 1,025 | – | |||||||||
| 1,117 | 338 | ||||||||||
| Shares redeemed: | |||||||||||
| Class A | (8,397 | ) | (1,888 | ) | |||||||
| Class B | (108 | ) | (100 | ) | |||||||
| Class C | (208 | ) | (182 | ) | |||||||
| Class I | (3,865 | ) | – | ||||||||
| (12,578 | ) | (2,170 | ) | ||||||||
| Automatic conversions: | |||||||||||
| Class A | – | 6 | |||||||||
| Class B | – | (6 | ) | ||||||||
| – | – | ||||||||||
| Net increase (decrease) in shares outstanding: | |||||||||||
| Class A | (8,224 | ) | (328 | ) | |||||||
| Class B | (69 | ) | 123 | ||||||||
| Class C | (183 | ) | (32 | ) | |||||||
| Class I | 13,309 | – | |||||||||
| 4,833 | (237 | ) | |||||||||
(a) Class I was offered for investment on November 15, 2005.
The notes to the financial statements are an integral part of this report.
Transamerica IDEX Mutual Funds
Semi-Annual Report 2006
7
TA IDEX Clarion Global Real Estate Securities
| FINANCIAL HIGHLIGHTS (unaudited for the period ended April 30, 2006) | |||||||||||||||||||||||||||||||||||||||
| For a share of beneficial interest outstanding throughout each period | |||||||||||||||||||||||||||||||||||||||
| Net Asset | Investment Operations | Distributions | Net Asset | ||||||||||||||||||||||||||||||||||||
| For the Period Ended (d)(g) | Value, Beginning of Period | Net Investment Income (Loss) | Net Realized and Unrealized Gain (Loss) | Total Operations | From Net Investment Income | From Net Realized Gains | Total Distributions | Value, End of Period | |||||||||||||||||||||||||||||||
| Class A | 4/30/2006 | $ | 16.13 | $ | 0.13 | $ | 2.90 | $ | 3.03 | $ | (0.04 | ) | $ | (1.38 | ) | $ | (1.42 | ) | $ | 17.74 | |||||||||||||||||||
| 10/31/2005 | 13.99 | 0.27 | 2.46 | 2.73 | (0.41 | ) | (0.18 | ) | (0.59 | ) | 16.13 | ||||||||||||||||||||||||||||
| 10/31/2004 | 12.25 | 0.28 | 3.05 | 3.33 | (0.53 | ) | (1.06 | ) | (1.59 | ) | 13.99 | ||||||||||||||||||||||||||||
| 10/31/2003 | 10.00 | 0.43 | 1.95 | 2.38 | (0.13 | ) | – | (0.13 | ) | 12.25 | |||||||||||||||||||||||||||||
| Class B | 4/30/2006 | 16.14 | 0.10 | 2.90 | 3.00 | (0.07 | ) | (1.38 | ) | (1.45 | ) | 17.69 | |||||||||||||||||||||||||||
| 10/31/2005 | 13.99 | 0.06 | 2.49 | 2.55 | (0.22 | ) | (0.18 | ) | (0.40 | ) | 16.14 | ||||||||||||||||||||||||||||
| 10/31/2004 | 12.22 | 0.25 | 3.03 | 3.28 | (0.45 | ) | (1.06 | ) | (1.51 | ) | 13.99 | ||||||||||||||||||||||||||||
| 10/31/2003 | 10.00 | 0.38 | 1.95 | 2.33 | (0.11 | ) | – | (0.11 | ) | 12.22 | |||||||||||||||||||||||||||||
| Class C | 4/30/2006 | 16.02 | 0.10 | 2.87 | 2.97 | (0.06 | ) | (1.38 | ) | (1.44 | ) | 17.55 | |||||||||||||||||||||||||||
| 10/31/2005 | 13.92 | 0.11 | 2.44 | 2.55 | (0.27 | ) | (0.18 | ) | (0.45 | ) | 16.02 | ||||||||||||||||||||||||||||
| 10/31/2004 | 12.22 | 0.17 | 3.04 | 3.21 | (0.45 | ) | (1.06 | ) | (1.51 | ) | 13.92 | ||||||||||||||||||||||||||||
| 10/31/2003 | 10.00 | 0.38 | 1.95 | 2.33 | (0.11 | ) | – | (0.11 | ) | 12.22 | |||||||||||||||||||||||||||||
| Class I | 4/30/2006 | 15.85 | 0.18 | 3.16 | 3.34 | (0.12 | ) | (1.38 | ) | (1.50 | ) | 17.69 | |||||||||||||||||||||||||||
| Ratios/Supplemental Data | |||||||||||||||||||||||||||||||
| For the Period | Total | Net Assets, End of Period | Ratio of Expenses to Average Net Assets (a) | Net Investment Income (Loss) to Average | Portfolio Turnover | ||||||||||||||||||||||||||
| Ended (g) | Return (c) | (000's) | Net (e) | Total (f) | Net Assets (a) | Rate (b) | |||||||||||||||||||||||||
| Class A | 4/30/2006 | 20.09 | % | $ | 7,345 | 1.33 | % | 1.33 | % | 1.64 | % | 58 | % | ||||||||||||||||||
| 10/31/2005 | 19.87 | 139,290 | 1.25 | 1.25 | 1.77 | 66 | |||||||||||||||||||||||||
| 10/31/2004 | 29.30 | 125,423 | 1.30 | 1.30 | 2.16 | 73 | |||||||||||||||||||||||||
| 10/31/2003 | 23.80 | 64,090 | 1.75 | 1.76 | 5.55 | 95 | |||||||||||||||||||||||||
| Class B | 4/30/2006 | 19.88 | 6,066 | 1.87 | 1.87 | 1.25 | 58 | ||||||||||||||||||||||||
| 10/31/2005 | 18.45 | 6,644 | 2.38 | 2.38 | 0.42 | 66 | |||||||||||||||||||||||||
| 10/31/2004 | 28.96 | 4,042 | 1.51 | 1.51 | 1.97 | 73 | |||||||||||||||||||||||||
| 10/31/2003 | 23.33 | 1,804 | 2.40 | 2.41 | 4.91 | 95 | |||||||||||||||||||||||||
| Class C | 4/30/2006 | 19.96 | 2,946 | 1.85 | 1.85 | 1.23 | 58 | ||||||||||||||||||||||||
| 10/31/2005 | 18.53 | 5,632 | 2.27 | 2.27 | 0.76 | 66 | |||||||||||||||||||||||||
| 10/31/2004 | 28.32 | 5,325 | 2.22 | 2.22 | 1.32 | 73 | |||||||||||||||||||||||||
| 10/31/2003 | 23.33 | 1,913 | 2.40 | 2.41 | 4.91 | 95 | |||||||||||||||||||||||||
| Class I | 4/30/2006 | 22.46 | 235,497 | 0.92 | 0.92 | 2.31 | 58 | ||||||||||||||||||||||||
NOTES TO FINANCIAL HIGHLIGHTS
(a) Annualized.
(b) Not annualized.
(c) Total Return has been calculated for the applicable period without deduction of a sales load, if any, on an initial purchase. Not annualized.
(d) Per share information is calculated based on average number of shares outstanding.
(e) Ratio of Net Expenses to Average Net Assets shows the net expense ratio, which is total expenses less reimbursement by the investment adviser, if any (see note 2).
(f) Ratio of Total Expenses to Average Net Assets includes all expenses before fee waivers and reimbursements by the investment adviser.
(g) TA IDEX Clarion Global Real Estate Securities (the "Fund") commenced operations on March 1, 2003. The inception date for the Fund's offering of share Class I was November 15, 2005.
The notes to the financial statements are an integral part of this report.
Transamerica IDEX Mutual Funds
Semi-Annual Report 2006
8
TA IDEX Clarion Global Real Estate Securities
NOTES TO FINANCIAL STATEMENTS
At April 30, 2006
(all amounts in thousands)
(unaudited)
NOTE 1. ORGANIZATION AND SIGNIFICANT ACCOUNTING POLICIES
Transamerica IDEX Mutual Funds is an open-end management investment company registered under the Investment Company Act of 1940, as amended (the "1940 Act").
Effective November 1, 2005, TA IDEX Clarion Real Estate Securities changed its name to TA IDEX Clarion Global Real Estate Securities (the "Fund").
The Fund is "non-diversified" under the 1940 Act.
In the normal course of business, the Fund enters into contracts that contain a variety of representations that provide general indemnifications. The Fund's maximum exposure under these arrangements is unknown, as this would involve future claims that may be made against the Fund and/or its affiliates that have not yet occurred. However, based on experience, the Fund expects the risk of loss to be remote.
This report should be read in conjunction with the current Fund prospectus, which contains more complete information about the Fund.
In preparing the Fund's financial statements in accordance with accounting principles generally accepted in the United States of America ("GAAP"), estimates or assumptions (which could differ from actual results) may be used that affect reported amounts and disclosures. The following is a summary of significant accounting policies followed by the Fund.
Multiple class operations, income and expenses: The Fund currently has four classes of shares, Class A, Class B, Class C and Class I, each with different expense levels. Classes A, B, and C are closed to new investors. Class I commenced operations on November 15, 2005. Class I is only available for investment to certain affiliated asset allocation funds. Class B shares will convert to Class A shares eight years after purchase. Income, non-class specific expenses and realized and unrealized gains and losses, are allocated daily to each class, based upon the value of shares outstanding method as permitted under Rule 18f-3 of the 1940 Act. Each class bears its own specific expenses as well as a portion of general, common expenses.
Security valuations: The Fund values its investments at the close of the New York Stock Exchange ("NYSE"), normally 4 p.m. ET, each day the NYSE is open for business. Fund investments are valued at the last sale price or closing price on the day of valuation taken from the primary exchange where the security is principally traded.
Securities traded in the over-the-counter market and listed securities for which no sale was reported on that date are valued at the last quoted bid price.
Debt securities are valued based on a price quotation or other equivalent indication of value supplied by an exchange, a pricing service or a major market maker; however, those that mature in sixty days or less are valued at amortized cost, which approximates market.
Investment company securities are valued at the net asset value of the underlying portfolio.
Foreign securities generally are valued based on quotations from the primary market in which they are traded. Because many foreign securities markets and exchanges close prior to the close of the NYSE, closing prices for foreign securities in those markets or on those exchanges do not reflect the events that occur after that close. If a significant market event impacting the value of a portfolio security (e.g., natural disaster, company announcement, market volatility) occurs subsequent to the close of trading in the security, but prior to the calculation of the Fund's net asset value per share, market quotations for that security may be determined to be unreliable and, accordingly, not "readily available." As a result, foreign equity securities held by the Fund may be valued at fair market value as determined in good faith by the Fund's Administrative Valuation Committee, under the supervision of the Board's Valuation Committee , using guidelines adopted by the Board of Trustees.
Other securities for which quotations are not readily available or whose values have been determined to be unreliable are valued at fair market value as determined in good faith by the Fund's Administrative Valuation Committee, under the supervision of the Board's Valuation Committee, using guidelines adopted by the Board of Trustees.
Cash: The Fund may leave cash overnight in its cash account with the custodian, Investors Bank & Trust Company ("IBT"). IBT has been contracted on behalf of the Fund to invest the excess cash into a savings account, which at April 30, 2006, was paying an interest rate of 3.24%.
Repurchase agreements: The Fund is authorized to enter into repurchase agreements. The Fund, through its custodian, IBT, receives delivery of the underlying securities, the value of which at the time of purchase is required to be an amount equal to at least 100% of the resale price. The Fund will bear the risk of value fluctuations until the security can be sold and may encounter delays and incur costs in liquidating the security. In the event of bankruptcy or insolvency of the seller, delays and costs may be incurred.
Commission recapture: The sub-adviser, to the extent consistent with the best execution and usual commission rate policies and practices, may place security transactions of the Fund with broker/dealers with which Transamerica IDEX Mutual Funds has established a Commission Recapture Program. A Commission Recapture Program is any arrangement under which a broker/dealer applies a portion of the commissions received by such broker/dealer on the security transactions to the
Transamerica IDEX Mutual Funds
Semi-Annual Report 2006
9
TA IDEX Clarion Global Real Estate Securities
NOTES TO FINANCIAL STATEMENTS (continued)
At April 30, 2006
(all amounts in thousands)
(unaudited)
NOTE 1.–(continued)
Fund. In no event will commissions paid by the Fund be used to pay expenses that would otherwise be borne by any other funds within Transamerica IDEX Mutual Funds, or by any other party.
Recaptured commissions during the six months ended April 30, 2006, of $18 are included in net realized gains in the Statement of Operations.
Securities lending: The Fund may lend securities to qualified borrowers, with IBT acting as the Fund's lending agent. The Fund earns negotiated lenders' fees. The Fund receives cash and/or securities as collateral against the loaned securities. Cash collateral received is invested in short term, interest bearing securities. The Fund monitors the market value of securities loaned on a daily basis and requires collateral in an amount at least equal to the value of the securities loaned. Income from loaned securities on the Statement of Operations is net of fees, in the amount of $3, earned by IBT for its services.
Real Estate Investment Trusts ("REITs"): There are certain additional risks involved in investing in REITs. These include, but are not limited to, economic conditions, changes in zoning laws, real estate values, property taxes and interest rates. Since the Fund invests primarily in real estate securities, the net asset value per share may fluctuate more widely than the net asset value of shares of a fund that invests in a broad range of industries.
Dividend income is recorded at management's estimate of the income included in distributions from the REIT investments. Distributions received in excess of the estimated amount are recorded as a reduction of the cost of investments. The actual amounts of income, return of capital and capital gains are only determined by each REIT after the fiscal year end and may differ from the estimated amounts.
Security transactions and investment income: Security transactions are recorded on the trade date. Security gains and losses are calculated on the specific identification basis. Dividend income, if any, is recorded on the ex-dividend date or, in the case of foreign securities, as soon as the Fund is informed of the ex-dividend date. Interest income, including accretion of discounts and amortization of premiums, is recorded on the accrual basis commencing on the settlement date.
Foreign currency denominated investments: The accounting records of the Fund are maintained in U.S. dollars. Securities and other assets and liabilities denominated in foreign currencies are translated into U.S. dollars at the closing exchange rate each day. The cost of foreign securities is translated at the exchange rate in effect when the investment was acquired. The Fund combines fluctuations from currency exchange rates and fluctuations in value when computing net realized and unrealized gains or losses from investments.
Net foreign currency gains and losses resulting from changes in exchange rates include: 1) foreign currency fluctuations between trade date and settlement date of investment security transactions; 2) gains and losses on forward foreign currency contracts; and 3) the difference between the receivable amounts of interest and dividends recorded in the accounting records in U.S. dollars and the amounts actually received.
Foreign currency denominated assets may involve risks not typically associated with domestic transactions. These risks include revaluation of currencies, adverse fluctuations in foreign currency values and possible adverse political, social and economic developments, including those particular to a specific industry, country or region.
Forward foreign currency contracts: The Fund may enter into forward foreign currency contracts to hedge against exchange rate risk arising from investments in securities denominated in foreign currencies. Contracts are valued at the contractual forward rate and are marked to market daily, with the change in value recorded as an unrealized gain or loss. When the contracts are settled a realized gain or loss is incurred. Risks may arise from changes in market value of the underlying currencies and from the possible inability of counterparties to meet the terms of their contracts. Open forward foreign currency contracts at April 30, 2006 are listed in the Schedule of Investments.
Redemption fees: A short-term trading redemption fee may be assessed on any Fund shares in a fund account that are sold during the first five (5) NYSE trading days following their purchase date. This redemption fee will equal 2% of the amount redeemed and shares held the longest will be treated as being redeemed first and shares held the shortest as being redeemed last. For the six months ended April 30, 2006, the Fund received less than $1 in redemption fees.
Dividend distributions: Distributions to shareholders are recorded on the ex-dividend date and are determined in accordance with Federal income tax regulations which may differ from GAAP.
NOTE 2. RELATED PARTY TRANSACTIONS
Transamerica Fund Advisors, Inc. ("TFAI") is the Fund's investment adviser. Transamerica Fund Services, Inc. ("TFS") is the Fund's administrator and transfer agent. AFSG Securities Corp. ("AFSG") is the Fund's distributor/principal underwriter. TFAI, TFS, and AFSG are affiliates of AEGON, NV, a Netherlands corporation.
Certain officers and trustees of the Fund are also officers and/or directors of TFAI, TFS and AFSG.
Transamerica IDEX Mutual Funds
Semi-Annual Report 2006
10
TA IDEX Clarion Global Real Estate Securities
NOTES TO FINANCIAL STATEMENTS (continued)
At April 30, 2006
(all amounts in thousands)
(unaudited)
NOTE 2.–(continued)
The following schedule reflects the percentage of Fund assets owned by affiliated investment companies at April 30, 2006:
| Net Assets | % of Net Assets | ||||||||||
| TA IDEX Asset Allocation– Conservative Portfolio | $ | 14,224 | 5.65 | % | |||||||
| TA IDEX Asset Allocation– Growth Portfolio | 60,879 | 24.17 | % | ||||||||
| TA IDEX Asset Allocation– Moderate Portfolio | 61,320 | 24.35 | % | ||||||||
| TA IDEX Asset Allocation– Moderate Growth Portfolio | 96,299 | 38.24 | % | ||||||||
| TA IDEX Multi-Manager International Fund | 2,723 | 1.08 | % | ||||||||
| Total | $ | 235,445 | 93.49 | % | |||||||
Investment advisory fees: The Fund pays management fees to TFAI based on average daily net assets ("ANA") at the following breakpoints:
0.80% of the first $250 million of ANA
0.775% of the next $250 million of ANA
0.70% of the next $500 million of ANA
0.65% of ANA over $1 billion
TFAI has contractually agreed to waive its advisory fee and will reimburse the Fund to the extent that operating expenses, excluding 12b-1 fees, exceed the following stated annual limit:
1.40% Expense Limit
If total Fund expenses fall below the annual expense limitation agreement agreed to by the adviser within the succeeding three years, the Fund may be required to pay the adviser a portion or all of the waived advisory fees.
There are no amounts available for recapture at April 30, 2006.
Distribution and service fees: The Fund has a 12b-1 distribution plan under the 1940 Act pursuant to which an annual fee, based on average daily net assets, is paid to the distributor for various disbursements such as broker-dealer account servicing fees and other promotional expenses of the Fund. The Fund is authorized under the 12b-1 plan to pay fees on each class up to the following limits:
| Class A | 0.35 | % | |||||
| Class B | 1.00 | % | |||||
| Class C | 1.00 | % | |||||
| Class I | N/A | ||||||
From February 28, 2006 through March 1, 2007, the Fund will not pay any 12b-1 fees under these plans.
Underwriter commissions relate to front-end sales charges imposed for Class A shares and contingent deferred sales charges from Classes B, C, and certain A share redemptions. For the six months ended April 30, 2006, the underwriter commissions were as follows:
| Received by Underwriter | $ | 6 | |||||
| Retained by Underwriter | 1 | ||||||
| Contingent Deferred Sales Charge | 2 | ||||||
Administrative services: The Fund has entered into an agreement with TFS for financial and legal fund administration services. The Fund pays TFS an annual fee of 0.02% of ANA. The Legal fees on the Statement of Operations are fees paid to external legal counsel.
Transfer agent fees: The Fund pays TFS an annual per-account charge for each open and closed account. The Fund paid TFS $23 for the six months ended April 30, 2006.
Deferred compensation plan: Each eligible independent Fund Trustee may elect to participate in a non-qualified deferred compensation plan maintained by Transamerica IDEX Mutual Funds (the "Plan"). Under the Plan, such Trustees may defer payment of all or a portion of their total fees earned as a Fund Trustee. Each Trustee who is a participant in the Plan may elect that the earnings, losses or gains credited to his or her deferred fee amounts be determined based on a deemed investment in any series of Transamerica IDEX Mutual Funds, including the Fund. The right of a participant to receive a distribution from the Plan of the deferred fees is an unsecured claim against the general assets of all series of Transamerica IDEX Mutual Funds. The pro rata liability to the Fund of all deferred fees in the Plan amounted, as of April 30, 2006, to $4.
NOTE 3. INVESTMENT TRANSACTIONS
The cost of securities purchased and proceeds from securities sold (excluding short-term securities) for the six months ended April 30, 2006 were as follows:
| Purchases of securities: | |||||||
| Long-Term | $ | 179,159 | |||||
| U.S. Government | – | ||||||
| Proceeds from maturities and sales of securities: | |||||||
| Long-Term | 119,927 | ||||||
| U.S. Government | – | ||||||
Transamerica IDEX Mutual Funds
Semi-Annual Report 2006
11
TA IDEX Clarion Global Real Estate Securities
NOTES TO FINANCIAL STATEMENTS (continued)
At April 30, 2006
(all amounts in thousands)
(unaudited)
NOTE 4. FEDERAL INCOME TAX MATTERS
The Fund has not made any provision for federal income or excise taxes due to its policy to distribute all of its taxable income and capital gains to its shareholders and otherwise qualify as a regulated investment company under Subchapter M of the Internal Revenue Code. Income and capital gain distributions are determined in accordance with income tax regulations, which may differ from GAAP. These differences are primarily due to differing treatment for items including, but not limited to, wash sales and distribution reclasses.
NOTE 5. REGULATORY PROCEEDINGS
There continues to be significant federal and state regulatory activity relating to financial services companies, particularly mutual fund companies and their investment advisers. As part of an ongoing investigation regarding potential market timing, recordkeeping and trading compliance issues and matters affecting the Fund's investment adviser, TFAI, and certain affiliates and former employees of TFAI, the SEC staff has indicated that it is likely to take some action against TFAI and certain of its affiliates at the conclusion of the investigation. The potential timing and the scope of any such action is difficult to predict. Although the impact of any action brought against TFAI and/or its affiliates is difficult to assess at the present time, the Fund currently believes that the likelihood that any such action will have a material adverse impact on it is remote. It is important to note that the Fund is not aware of any allega tion of wrongdoing against it and its Board at the time this semi-annual report is printed. Although it is not anticipated that these developments will have an adverse impact on the Fund, there can be no assurance at this time. TFAI and its affiliates are actively working with the SEC in regard to this matter; however, the exact resolution cannot be determined at this time. TFAI will take such actions that it deems necessary or appropriate to continue providing management services to the Fund and to bring all matters to an appropriate conclusion.
TFAI and/or its affiliates, and not the Fund, will bear the costs regarding these regulatory matters.
Transamerica IDEX Mutual Funds
Semi-Annual Report 2006
12
TA IDEX Clarion Global Real Estate Securities
INVESTMENT ADVISORY AND SUB-ADVISORY AGREEMENTS – REVIEW AND RENEWAL (unaudited)
At a meeting of the Board of Trustees of Transamerica IDEX Mutual Funds ("TA IDEX") held on November 2, 2005, the Board reviewed and considered the Investment Advisory Agreement between TA IDEX Clarion Global Real Estate Securities (the "Fund") and Transamerica Fund Advisors, Inc. ("TFAI"), as well as the Investment Sub-Advisory Agreement of the Fund between TFAI and ING Clarion Real Estate Securities, L.P. (the "Sub-Adviser"), to determine whether the agreements should be renewed for a one-year period. Following their review and consideration, the Trustees determined that the Investment Advisory Agreement and the Investment Sub-Advisory Agreement will enable shareholders of the Fund to obtain high quality services at a cost that is appropriate, reasonable, and in the best interests of its shareholders. The Board, including the independent members of the Board, unanimously approved the renewal of the Investment Advisory Agreemen t and the Investment Sub-Advisory Agreement. In reaching their decision, the Trustees requested and obtained from TFAI and the Sub-Adviser such information as they deemed reasonably necessary to evaluate the proposed agreements. The Trustees also carefully considered the information that they had received throughout the year from TFAI and the Sub-Adviser (such as in-person presentations by the Sub-Adviser) as part of their regular oversight of the Fund, as well as: comparative fee, expense and performance information prepared by Lipper Inc. ("Lipper"), independent providers of mutual fund performance, fee and expense information, and profitability data. In considering the proposed continuation of the Investment Advisory Agreement and the Investment Sub-Advisory Agreement, the Trustees evaluated a number of considerations that they believe, in light of the legal advice furnished to them by TA IDEX counsel and independent legal counsel and their own business judgment, to be relevant. They based their decisions on the following considerations, among others, although they did not identify any consideration or particular information that was controlling of their decisions:
The nature, extent and quality of the advisory service to be provided. The Board considered the nature and quality of the services provided by TFAI and the Sub-Adviser to the Fund in the past, as well as the services anticipated to be provided in the future. The Board concluded that TFAI and the Sub-Adviser are capable of providing high quality services to the Fund, as indicated by the nature and quality of services provided in the past, TFAI's and the Sub-Adviser's management capabilities demonstrated with respect to the funds they manage, including the Fund, and the experience, capability and integrity of TFAI's senior management, the financial resources of TFAI and the Sub-Adviser, TFAI's management oversight process, and the professional qualifications and experience of the Sub-Adviser's portfolio management team. The Trustees also concluded that TFAI and the Sub-Adviser proposed to provide investment and related services that were of the same quality and quantity as services provided to the Fund in the past, and that these services are appropriate in scope and extent in light of the Fund's operations, the competitive landscape of the investment company business and investor needs, and that TFAI's and the Sub-Adviser's obligations will remain substantially the same.
The investment performance of the Fund. The Board examined both the short-term and longer-term performance of the Fund, including relative performance against a benchmark securities index and a peer group of comparable mutual funds as prepared by Lipper, for various trailing periods ended June 30, 2005. The Board noted the Fund's high absolute performance, but expressed some concerns about the Fund's relative performance in comparison to its peer group and benchmark index. The Trustees concluded that TFAI and the Sub-Adviser generally had achieved acceptable investment performance and also concluded that recent changes to the Fund's investment objectives and strategies to seek high total return and permit more investment in global real estate securities could enhance return opportunities. On the basis of the Trustees' assessment of the nature, extent and quality of advisory services to be provided or procured by TFAI and the Sub-Adviser, the Trustees concluded that TFAI and the Sub-Adviser are capable of generating a level of investment performance that is appropriate in light of the Fund's investment objective, policies and strategies and competitive with many other investment companies, and also determined that TFAI's and the Sub-Adviser's performance records indicate that their continued management is likely to benefit the Fund and its shareholders.
The cost of advisory services provided and the level of profitability. The Board reviewed profitability information regarding TFAI's costs of procuring portfolio management services, as well as the costs of provision of administration, transfer agency, fund accounting and other services, to the Fund and to TA IDEX as a whole by TFAI and its affiliates. The Trustees reviewed data from Lipper that compared the Fund's management fees (including management fees at various asset levels), other fees and expenses (including total expenses including and excluding 12b-1 distribution and service fees) and portfolio turnover rate against a peer group of comparable mutual funds. Based on such information, the Trustees determined that the management fees and overall expense ratio of the Fund generally are consistent with industry averages. In addition, on the basi s of the Board's review of the management fees to be charged by TFAI for investment advisory and related services, TFAI profitability information (derived from TFAI's audited financial statements), TFAI's estimated management income resulting from its management of the Fund, the estimated margin of the Sub-Adviser, as well as the entirety of TFAI's and its affiliates' service relationship with TA IDEX, the Board concluded that the level of investment management fees and other service fees, as well as TFAI's and the Sub-Adviser's profitability, are appropriate in light of the services provided, the management fees and overall expense ratios of comparable investment companies and the anticipated profitability of the relationship between the Fund, TFAI and its affiliates, and the Sub-Adviser.
Transamerica IDEX Mutual Funds
Semi-Annual Report 2006
13
TA IDEX Clarion Global Real Estate Securities (continued)
Whether fee levels reflect economies of scale and the extent to which economies of scale would be realized as the Fund grows. The Board concluded that the inclusion of asset-based breakpoints in the Fund's advisory fee schedule appropriately benefits investors by realizing economies of scale in the form of lower management fees as the level of assets grows. The Board noted that the Fund is closed to new investors and will be closed to new investments in the near future, except that the Fund may continue selling shares to other TA IDEX funds and other investment companies in the same group of investment companies as TA IDEX, which may limit, to an extent, the ability of the Fund to realize economies of scale. In addition, the Board assessed the current asset levels of the Fund and the long-term development strategy for the Fund, including continued inv estments by the TA IDEX asset allocation funds, and concluded that the Fund's current management fees appropriately reflect the Fund's current size, the current economic environment for TFAI, the competitive nature of the investment company market, and TFAI's pricing strategy. The Trustees also concluded that they will have the opportunity to periodically reexamine whether the Fund has achieved economies of scale, and the appropriateness of management fees payable to TFAI and fees payable by TFAI to the Sub-Adviser, in the future.
Benefits (such as soft dollars) to TFAI, its affiliates, or the Sub-Adviser from their relationship with the Fund. The Board concluded that other benefits derived by TFAI, its affiliates, and the Sub-Adviser from their relationship with the Fund, including "soft dollar" benefits (if any) in connection with brokerage transactions, sales charges and distribution/service fees (to the extent applicable) are reasonable and fair, and are consistent with industry practice and the best interests of the Fund and its shareholders. In this regard, the Board noted that TFAI does not realize "soft dollar" benefits from its relationship with the Fund, and that the Sub-Adviser is participating in a brokerage program pursuant to which a portion of brokerage commissions paid by the Fund is recaptured for the benefit of the Fund and its shareholders, thus limiting the amount of "soft-dollar" arrangements the Sub-Adviser may engage in with respect to the Fund's brokerage transactions. In addition, the Trustees determined that the administration, transfer agency, fund accounting and other fees paid by the Fund to affiliates of TFAI are reasonable, fair and in the best interests of shareholders in light of the nature and quality of the services provided, the associated costs to these affiliates of providing the services, the impact of the costs of such services on the Fund's overall operating expenses, and the necessity of the services for the Fund's operations.
Other considerations. The Board determined that TFAI had made a substantial commitment to the recruitment and retention of high quality personnel, and maintained the financial, compliance and operational resources reasonably necessary to manage the Fund in a professional manner that is consistent with the best interests of the Fund and its shareholders. In this regard, the Trustees favorably considered the procedures and policies in place by TFAI to enforce compliance with applicable laws and regulations and oversee the portfolio management activities of the Sub-Adviser. The Trustees also determined that TFAI had made a significant entrepreneurial commitment to the management and success of the Fund, reflected by TFAI's expense limitation and fee waiver arrangement with the Fund, which may result in TFAI waiving advisory fees for the benefit of shareh olders.
Transamerica IDEX Mutual Funds
Semi-Annual Report 2006
14
TA IDEX Evergreen Health Care
UNDERSTANDING YOUR FUND'S EXPENSES
(unaudited)
SHAREHOLDER EXPENSES
Fund shareholders may incur two types of costs: (1) transaction costs, including sales charges (loads) on purchases, contingent deferred sales charges on redemptions and redemption fees; and (2) ongoing costs, including management fees, 12b-1 distribution and service fees, and other fund expenses.
The following Example is intended to help you understand your ongoing costs (in dollars and cents) of investing in the Fund and to compare these costs with the ongoing costs of investing in other funds.
The Example is based on an investment of $1,000 invested at November 1, 2005 and held for the entire period until April 30, 2006.
ACTUAL EXPENSES
The first line in the table below provides information about actual account values and actual expenses. You may use the information in this line, together with the amount you invested, to estimate the expenses that you paid over the period. Simply divide your account value by $1,000 (for example, an $8,600 account value divided by $1,000 = 8.6), then multiply the result by the number in the first line of your Fund under the heading entitled "Expenses Paid During Period" to estimate the expenses you paid on your account during this period. If your account is an IRA, your expenses could have included a $15 annual fee. The amount of any fee paid through your account would increase the estimate of expenses you paid during the period and decrease your ending account value.
HYPOTHETICAL EXAMPLE FOR COMPARISON PURPOSES
The second line in the table below provides information about hypothetical account values and hypothetical expenses based on the Fund's actual expense ratio and an assumed rate of return of 5% per year before expenses, which is not the Fund's actual return. The hypothetical account values and expenses may not be used to estimate the actual ending account balance or expenses you paid for the period. You may use this information to compare the ongoing costs of investing in your Fund and other funds. To do so, compare this 5% hypothetical example with the 5% hypothetical examples that appear in the shareholder reports of the other funds. As in the case of the actual expense example, if your account is subject to an IRA fee, the amount of the fee paid through your account would increase the hypothetical expenses you would have paid during the period and decrease the hypothetical ending account value.
Please note that the expenses shown in the table are meant to highlight your ongoing costs only and do not reflect any transactional costs, such as sales charges, redemption fees, brokerage commissions paid on purchases and sales of fund shares. Therefore, the second line under the Fund in the table is useful in comparing ongoing costs only, and will not help you determine the relative total costs of owning different funds. If any of these transaction costs were included, your costs would be higher. The expenses shown in the table do not reflect any fees that may be charged to you by brokers, financial intermediaries or other financial institutions.
| Beginning Account Value | Ending Account Value | Annualized Expense Ratio | Expenses Paid During Period (a) | ||||||||||||||||
| Class A | |||||||||||||||||||
| Actual | $ | 1,000.00 | $ | 1,128.60 | 1.49 | % | $ | 7.86 | |||||||||||
| Hypothetical (b) | 1,000.00 | 1,017.41 | 1.49 | 7.45 | |||||||||||||||
| Class B | |||||||||||||||||||
| Actual | 1,000.00 | 1,124.60 | 2.15 | 11.33 | |||||||||||||||
| Hypothetical (b) | 1,000.00 | 1,014.13 | 2.15 | 10.74 | |||||||||||||||
| Class C | |||||||||||||||||||
| Actual | 1,000.00 | 1,124.90 | 2.23 | 11.75 | |||||||||||||||
| Hypothetical (b) | 1,000.00 | 1,013.74 | 2.23 | 11.13 | |||||||||||||||
| Class I | |||||||||||||||||||
| Actual | 1,000.00 | 1,131.80 | 1.03 | 5.44 | |||||||||||||||
| Hypothetical (b) | 1,000.00 | 1,019.69 | 1.03 | 5.16 | |||||||||||||||
(a) Expenses are calculated using the Fund's annualized expense ratio (as disclosed in the table), multiplied by the average account value for the period, multiplied by number of days in the period (181 days), and divided by the number of days in the year (365 days).
(b) 5% return per year before expenses.
GRAPHICAL PRESENTATION OF SCHEDULE OF INVESTMENTS
By Industry
At April 30, 2006
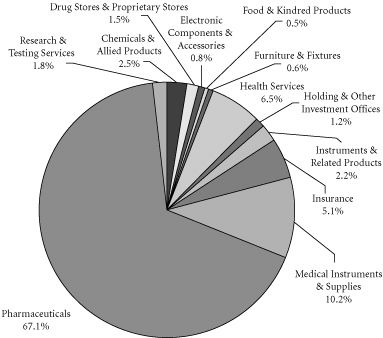
This chart shows the percentage breakdown by industry of the Fund's total investment securities.
Transamerica IDEX Mutual Funds
Semi-Annual Report 2006
1
TA IDEX Evergreen Health Care
SCHEDULE OF INVESTMENTS
At April 30, 2006
(all amounts except share amounts in thousands)
(unaudited)
| Shares | Value | ||||||||||
| CONVERTIBLE PREFERRED STOCKS (0.0%) | |||||||||||
| Pharmaceuticals (0.0%) | |||||||||||
| NeoRx Corp. ‡§m | 3 | $ | 8 | ||||||||
| Total Convertible Preferred Stocks (cost: $30) | 8 | ||||||||||
| PREFERRED STOCKS (1.6%) | |||||||||||
| Medical Instruments & Supplies (0.1%) | |||||||||||
| Fresenius Medical Care AG & Co. KGaA | 2,300 | 261 | |||||||||
| Pharmaceuticals (1.5%) | |||||||||||
| Fresenius AG | 41,500 | 7,169 | |||||||||
| Total Preferred Stocks (cost: $7,034) | 7,430 | ||||||||||
| COMMON STOCKS (96.3%) | |||||||||||
| Chemicals & Allied Products (2.5%) | |||||||||||
| Bayer AG | 110,810 | 5,110 | |||||||||
| Syngenta AG ‡ | 48,100 | 6,691 | |||||||||
| Drug Stores & Proprietary Stores (1.5%) | |||||||||||
| CVS Corp. | 238,100 | 7,076 | |||||||||
| Electronic Components & Accessories (0.7%) | |||||||||||
| Tyco International, Ltd. | 133,662 | 3,522 | |||||||||
| Food & Kindred Products (0.5%) | |||||||||||
| Altus Pharmaceuticals, Inc. ‡ | 109,000 | 2,381 | |||||||||
| Furniture & Fixtures (0.5%) | |||||||||||
| Kinetic Concepts, Inc. ‡ | 60,000 | 2,620 | |||||||||
| Health Services (6.4%) | |||||||||||
| HCA, Inc. | 117,300 | 5,148 | |||||||||
| Human Genome Sciences, Inc. ‡ | 276,962 | 3,160 | |||||||||
| Manor Care, Inc. | 109,500 | 4,802 | |||||||||
| Nektar Therapeutics ‡ | 127,432 | 2,741 | |||||||||
| Quest Diagnostics, Inc. | 216,300 | 12,054 | |||||||||
| Universal Health Services, Inc.–Class B | 44,600 | 2,265 | |||||||||
| Holding & Other Investment Offices (1.2%) | |||||||||||
| Daiichi Sanyko Co., Ltd. | 221,500 | 5,693 | |||||||||
| Instruments & Related Products (2.2%) | |||||||||||
| Bausch & Lomb, Inc. | 115,018 | 5,630 | |||||||||
| Bio-Rad Laboratories, Inc.–Class A ‡ | 59,300 | 3,879 | |||||||||
| Cyberonics, Inc. ‡ | 32,250 | 748 | |||||||||
| Insurance (5.0%) | |||||||||||
| Aetna, Inc. | 99,795 | 3,842 | |||||||||
| Cigna Corp. | 49,135 | 5,257 | |||||||||
| WellPoint, Inc. ‡ | 206,300 | 14,647 | |||||||||
| Medical Instruments & Supplies (9.9%) | |||||||||||
| Applera Corp.–Applied Biosystems Group | 158,100 | 4,560 | |||||||||
| Baxter International, Inc. | 63,268 | 2,385 | |||||||||
| Shares | Value | ||||||||||
| Medical Instruments & Supplies (continued) | |||||||||||
| Biomet, Inc. | 120,566 | $ | 4,483 | ||||||||
| Cepheid, Inc. ‡ | 175,001 | 1,594 | |||||||||
| Fresenius Medical Care AG | 30,000 | 3,594 | |||||||||
| Medtronic, Inc. | 81,822 | 4,101 | |||||||||
| Smith & Nephew PLC | 382,500 | 3,153 | |||||||||
| St. Jude Medical, Inc. ‡ | 156,722 | 6,187 | |||||||||
| Vital Signs, Inc. | 44,300 | 2,202 | |||||||||
| Wright Medical Group, Inc. ‡ | 421,300 | 9,888 | |||||||||
| Zimmer Holdings, Inc. ‡ | 81,300 | 5,114 | |||||||||
| Pharmaceuticals (64.2%) | |||||||||||
| Abbott Laboratories | 349,420 | 14,934 | |||||||||
| Adolor Corp. ‡ | 73,107 | 1,720 | |||||||||
| Alkermes, Inc. ‡ | 85,700 | 1,840 | |||||||||
| Alnylam Pharmaceuticals, Inc. ‡ | 145,400 | 2,239 | |||||||||
| Amgen, Inc. ‡ | 182,000 | 12,321 | |||||||||
| Anadys Pharmaceuticals, Inc. ‡ | 140,400 | 1,947 | |||||||||
| Andrx Corp. ‡ | 117,500 | 2,739 | |||||||||
| Angiotech Pharmaceuticals, Inc. ‡ | 146,300 | 2,221 | |||||||||
| Arena Pharmaceuticals, Inc. ‡ | 129,200 | 1,829 | |||||||||
| Arqule, Inc. ‡ | 291,900 | 1,807 | |||||||||
| AstraZeneca PLC | 185,166 | 10,198 | |||||||||
| AtheroGenics, Inc. ‡ | 146,100 | 2,067 | |||||||||
| BioCryst Pharmaceuticals, Inc. ‡ | 163,500 | 2,542 | |||||||||
| Biogen Idec, Inc. ‡ | 137,100 | 6,149 | |||||||||
| BioMarin Pharmaceuticals, Inc. ‡ | 96,831 | 1,191 | |||||||||
| Bristol-Myers Squibb Co. | 197,300 | 5,008 | |||||||||
| Cambridge Antibody Technology Group PLC ‡ | 51,200 | 689 | |||||||||
| Celgene Corp. ‡ | 60,000 | 2,530 | |||||||||
| Chugai Pharmaceutical Co., Ltd. | 261,900 | 5,653 | |||||||||
| Cubist Pharmaceuticals, Inc. ‡ | 149,000 | 3,378 | |||||||||
| CV Therapeutics, Inc. ‡ | 84,300 | 1,673 | |||||||||
| Dov Pharmaceutical, Inc. ‡ | 119,000 | 969 | |||||||||
| Genentech, Inc. ‡ | 159,500 | 12,714 | |||||||||
| Genmab A/S ‡ | 154,600 | 5,469 | |||||||||
| Genzyme Corp. ‡ | 98,100 | 6,000 | |||||||||
| GlaxoSmithKline PLC, ADR | 246,000 | 13,993 | |||||||||
| Hospira, Inc. ‡ | 73,000 | 2,814 | |||||||||
| ICOS Corp. ‡ | 138,300 | 3,033 | |||||||||
| ImClone Systems, Inc. ‡ | 59,400 | 2,144 | |||||||||
| Ipsen ‡ | 7,550 | 338 | |||||||||
| Johnson & Johnson | 237,200 | 13,902 | |||||||||
| K-V Pharmaceutical Company–Class A ‡ | 99,900 | 2,156 | |||||||||
| Lilly (Eli) & Co. | 121,000 | 6,403 | |||||||||
| MannKind Corp., Warrants, Expires 8/5/2020 ‡§m | 30,624 | 48 | |||||||||
The notes to the financial statements are an integral part of this report.
Transamerica IDEX Mutual Funds
Semi-Annual Report 2006
2
TA IDEX Evergreen Health Care
SCHEDULE OF INVESTMENTS (continued)
At April 30, 2006
(all amounts except share amounts in thousands)
(unaudited)
| Shares | Value | ||||||||||
| Pharmaceuticals (continued) | |||||||||||
| Martek Biosciences Corp. ‡ | 165,100 | $ | 4,903 | ||||||||
| Medarex, Inc. ‡ | 102,583 | 1,232 | |||||||||
| Medicis Pharmaceutical Corp.–Class A | 55,891 | 1,838 | |||||||||
| MedImmune, Inc. ‡ | 122,500 | 3,855 | |||||||||
| Merck & Co., Inc. | 203,725 | 7,012 | |||||||||
| Merck KGaA ‡ | 45,300 | 4,793 | |||||||||
| Mylan Laboratories | 96,700 | 2,112 | |||||||||
| Myogen, Inc. ‡ | 114,600 | 3,789 | |||||||||
| Myogen, Inc. Warrants ‡§m | 2,900 | 73 | |||||||||
| NeoRx Corp. Warrants, Expires 12/8/2008 ‡§m | 1,200 | – | o | ||||||||
| Novartis AG, ADR | 250,200 | 14,389 | |||||||||
| Novo Nordisk A/S–Class B | 115,900 | 7,515 | |||||||||
| NPS Pharmaceuticals, Inc. ‡ | 129,309 | 1,108 | |||||||||
| Nuvelo, Inc. ‡ | 125,400 | 2,053 | |||||||||
| OSI Pharmaceuticals, Inc. ‡ | 210,500 | 5,593 | |||||||||
| PDL BioPharma, Inc. ‡ | 112,400 | 3,235 | |||||||||
| Pfizer, Inc. | 516,500 | 13,083 | |||||||||
| QLT, Inc. ‡ | 216,871 | 1,783 | |||||||||
| Roche Holding AG–Genusschein | 91,742 | 14,067 | |||||||||
| Sanofi-Aventis, ADR | 157,800 | 7,423 | |||||||||
| Shares | Value | ||||||||||
| Pharmaceuticals (continued) | |||||||||||
| Schering AG | 44,715 | $ | 4,794 | ||||||||
| Schering-Plough Corp. | 604,100 | 11,671 | |||||||||
| Sepracor, Inc. ‡ | 77,289 | 3,450 | |||||||||
| Sigma-Aldrich Corp. | 70,700 | 4,851 | |||||||||
| Tanox, Inc. ‡ | 180,700 | 2,907 | |||||||||
| Trimeris, Inc. ‡ | 193,963 | 2,180 | |||||||||
| United Therapeutics Corp. ‡ | 20,000 | 1,191 | |||||||||
| Valeant Pharmaceuticals International | 134,300 | 2,404 | |||||||||
| Valera Pharmaceuticals, Inc. ‡ | 239,700 | 2,373 | |||||||||
| Vertex Pharmaceuticals, Inc. ‡ | 25,900 | 942 | |||||||||
| Wyeth | 211,501 | 10,294 | |||||||||
| Zymogenetics, Inc. ‡ | 153,200 | 3,136 | |||||||||
| Research & Testing Services (1.7%) | |||||||||||
| Applera Corp.–Celera Genomics Group ‡ | 186,600 | 2,237 | |||||||||
| Incyte Corp. ‡ | 286,240 | 1,194 | |||||||||
| Insmed, Inc. ‡ | 481,000 | 866 | |||||||||
| Regeneron Pharmaceuticals, Inc. ‡ | 261,600 | 3,798 | |||||||||
| Total Common Stocks (cost: $447,212) | 457,329 | ||||||||||
| Total Investment Securities (cost: $454,276) # | $ | 464,767 | |||||||||
NOTES TO SCHEDULE OF INVESTMENTS:
‡ Non-income producing.
§ Security is deemed to be illiquid.
o Value is less than $1.
m Securities valued as determined in good faith in accordance with procedure established by the Fund's Board of Trustees.
# Aggregate cost for Federal income tax purposes is $456,631. Aggregate gross unrealized appreciation for all securities in which there is an excess of value over tax cost and aggregate gross unrealized depreciation for all securities in which there is an excess of tax cost over value were $30,043 and $21,907, respectively. Net unrealized appreciation for tax purposes is $8,136.
DEFINITIONS:
ADR American Depositary Receipt
The notes to the financial statements are an integral part of this report.
Transamerica IDEX Mutual Funds
Semi-Annual Report 2006
3
TA IDEX Evergreen Health Care
STATEMENT OF ASSETS AND LIABILITIES
At April 30, 2006
(all amounts except per share amounts in thousands)
(unaudited)
| Assets: | |||||||
| Investment securities, at value (cost: $454,276) | $ | 464,767 | |||||
| Cash | 7,388 | ||||||
| Foreign currency (cost: $1,914) | 1,912 | ||||||
| Receivables: | |||||||
| Investment securities sold | 2,669 | ||||||
| Shares of beneficial interest sold | 276 | ||||||
| Interest | 15 | ||||||
| Dividends | 281 | ||||||
| Dividend reclaims receivable | 75 | ||||||
| Other | 7 | ||||||
| 477,390 | |||||||
| Liabilities: | |||||||
| Investment securities purchased | 2,064 | ||||||
| Accounts payable and accrued liabilities: | |||||||
| Shares of beneficial interest redeemed | 30 | ||||||
| Management and advisory fees | 387 | ||||||
| Deferred foreign taxes | 8 | ||||||
| Transfer agent fees | 4 | ||||||
| Administration fees | 8 | ||||||
| Other | 26 | ||||||
| 2,527 | |||||||
| Net Assets | $ | 474,863 | |||||
| Net Assets Consist of: | |||||||
| Shares of beneficial interest, unlimited shares authorized, no par value | 401,558 | ||||||
| Distributable net investment income (loss) | (758 | ) | |||||
| Accumulated net realized gain (loss) from investment securities, written options and foreign currency transactions | 63,582 | ||||||
| Net unrealized appreciation (depreciation) on: Investment securities | 10,491 | ||||||
| Translation of assets and liabilities denominated in foreign currencies | (10 | ) | |||||
| Net Assets | $ | 474,863 | |||||
| Net Assets by Class: | |||||||
| Class A | $ | 3,783 | |||||
| Class B | 4,998 | ||||||
| Class C | 2,106 | ||||||
| Class I | 463,976 | ||||||
| Shares Outstanding: | |||||||
| Class A | 285 | ||||||
| Class B | 389 | ||||||
| Class C | 164 | ||||||
| Class I | 34,617 | ||||||
| Net Asset Value Per Share: | |||||||
| Class A | $ | 13.28 | |||||
| Class B | 12.85 | ||||||
| Class C | 12.82 | ||||||
| Class I | 13.41 | ||||||
| Maximum Offering Price Per Share (a): | |||||||
| Class A | $ | 14.05 | |||||
(a) Includes the maximum selling commission (represented as a percentage of offering price) which is reduced on certain levels of sales as set forth in the Prospectus. Net asset value per share for Classes B, C and I shares represents offering price. The redemption price for Classes B and C shares equals net asset value less any applicable contingent deferred sales charge.
STATEMENT OF OPERATIONS
For the period ended April 30, 2006
(all amounts in thousands)
(unaudited)
| Investment Income: | |||||||
| Dividends (net of withholding taxes on foreign dividends of $66) | $ | 1,186 | |||||
| Interest | 422 | ||||||
| 1,608 | |||||||
| Expenses: | |||||||
| Management and advisory fees | 2,061 | ||||||
| Distribution and service fees: | |||||||
| Class A | 33 | ||||||
| Class B | 18 | ||||||
| Class C | 7 | ||||||
| Transfer agent fees: | |||||||
| Class A | 8 | ||||||
| Class B | 9 | ||||||
| Class C | 3 | ||||||
| Class I | – | (b) | |||||
| Printing and shareholder reports | 3 | ||||||
| Custody fees | 77 | ||||||
| Administration fees | 44 | ||||||
| Legal fees | 10 | ||||||
| Audit fees | 9 | ||||||
| Trustees fees | 8 | ||||||
| Registration fees | 6 | ||||||
| Other | 5 | ||||||
| Total expenses | 2,301 | ||||||
| Recaptured expenses | 66 | ||||||
| Total recaptured expenses | 66 | ||||||
| Net expenses | 2,367 | ||||||
| Net Investment Income (Loss) | (759 | ) | |||||
| Net Realized Gain (Loss) from: | |||||||
| Investment securities | 65,621 | ||||||
| Written option contracts | 1,905 | ||||||
| Foreign currency transactions | (236 | ) | |||||
| 67,290 | |||||||
| Net Increase (Decrease) in Unrealized Appreciation (Depreciation) on: | |||||||
| Investment securities | (14,179 | ) | |||||
| Written option contracts | (570 | ) | |||||
| Translation of assets and liabilities denominated in foreign currencies | (12 | ) | |||||
| (14,761 | ) | ||||||
| Net Realized and Unrealized Gain (Loss) on Investment Securities, Written Options and Foreign Currency Transactions | 52,529 | ||||||
| Net Increase (Decrease) in Net Assets Resulting from Operations | $ | 51,770 | |||||
(b) Rounds to less than $1.
The notes to the financial statements are an integral part of this report.
Transamerica IDEX Mutual Funds
Semi-Annual Report 2006
4
TA IDEX Evergreen Health Care
STATEMENTS OF CHANGES IN NET ASSETS
For the period or year ended
(all amounts in thousands)
| April 30, 2006 (unaudited) | October 31, 2005 (a) | ||||||||||
| Increase (Decrease) In Net Assets From: | |||||||||||
| Operations: | |||||||||||
| Net investment income (loss) | $ | (759 | ) | $ | (2,819 | ) | |||||
| Net realized gain (loss) from investment securities, written options and foreign currency transactions | 67,290 | 22,678 | |||||||||
| Change in unrealized appreciation (depreciation) on investment securities, written options and foreign currency translation | (14,761 | ) | 22,477 | ||||||||
| 51,770 | 42,336 | ||||||||||
| Distributions to Shareholders: | |||||||||||
| From net realized gains: | |||||||||||
| Class A | (229 | ) | (1,404 | ) | |||||||
| Class B | (300 | ) | (39 | ) | |||||||
| Class C | (127 | ) | (19 | ) | |||||||
| Class I | (22,213 | ) | (1,010 | ) | |||||||
| (22,869 | ) | (2,472 | ) | ||||||||
| Capital Share Transactions: | |||||||||||
| Proceeds from shares sold: | |||||||||||
| Class A | 1,353 | 16,484 | |||||||||
| Class B | 157 | 1,602 | |||||||||
| Class C | 62 | 812 | |||||||||
| Class I | 250,296 | 157,147 | |||||||||
| 251,868 | 176,045 | ||||||||||
| Dividends and distributions reinvested: | |||||||||||
| Class A | 219 | 1,404 | |||||||||
| Class B | 290 | 39 | |||||||||
| Class C | 107 | 14 | |||||||||
| Class I | 22,213 | 1,010 | |||||||||
| 22,829 | 2,467 | ||||||||||
| Cost of shares redeemed: | |||||||||||
| Class A | (198,296 | ) | (2,348 | ) | |||||||
| Class B | (1,050 | ) | (1,520 | ) | |||||||
| Class C | (424 | ) | (955 | ) | |||||||
| Class I | (4,146 | ) | – | ||||||||
| (203,916 | ) | (4,823 | ) | ||||||||
| Automatic conversions: | |||||||||||
| Class A | 10 | 42 | |||||||||
| Class B | (10 | ) | (42 | ) | |||||||
| – | – | ||||||||||
| 70,781 | 173,689 | ||||||||||
| Net increase (decrease) in net assets | 99,682 | 213,553 | |||||||||
| Net Assets: | |||||||||||
| Beginning of period | 375,181 | 161,628 | |||||||||
| End of period | $ | 474,863 | $ | 375,181 | |||||||
| Distributable Net Investment Income (Loss) | $ | (758 | ) | $ | 1 | ||||||
| April 30, 2006 (unaudited) | October 31, 2005 (a) | ||||||||||
| Share Activity: | |||||||||||
| Shares issued: | |||||||||||
| Class A | 106 | 1,405 | |||||||||
| Class B | 12 | 140 | |||||||||
| Class C | 5 | 71 | |||||||||
| Class I | 19,330 | 13,750 | |||||||||
| 19,453 | 15,366 | ||||||||||
| Shares issued–reinvested from distributions: | |||||||||||
| Class A | 18 | 120 | |||||||||
| Class B | 24 | 3 | |||||||||
| Class C | 9 | 1 | |||||||||
| Class I | 1,760 | 86 | |||||||||
| 1,811 | 210 | ||||||||||
| Shares redeemed: | |||||||||||
| Class A | (15,463 | ) | (207 | ) | |||||||
| Class B | (82 | ) | (134 | ) | |||||||
| Class C | (34 | ) | (84 | ) | |||||||
| Class I | (309 | ) | – | ||||||||
| (15,888 | ) | (425 | ) | ||||||||
| Automatic conversions: | |||||||||||
| Class A | 1 | 4 | |||||||||
| Class B | (1 | ) | (4 | ) | |||||||
| – | – | ||||||||||
| Net increase (decrease) in shares outstanding: | |||||||||||
| Class A | (15,338 | ) | 1,322 | ||||||||
| Class B | (47 | ) | 5 | ||||||||
| Class C | (20 | ) | (12 | ) | |||||||
| Class I | 20,781 | 13,836 | |||||||||
| 5,376 | 15,151 | ||||||||||
(a) Class I was offered for investment on November 8, 2004.
The notes to the financial statements are an integral part of this report.
Transamerica IDEX Mutual Funds
Semi-Annual Report 2006
5
TA IDEX Evergreen Health Care
FINANCIAL HIGHLIGHTS
(unaudited for the period ended April 30, 2006)
| For a share of beneficial interest outstanding throughout each period | |||||||||||||||||||||||||||||||||||||||
| Net Asset | Investment Operations | Distributions | Net Asset | ||||||||||||||||||||||||||||||||||||
| For the Period Ended (d)(g) | Value, Beginning of Period | Net Investment Income (Loss) | Net Realized and Unrealized Gain (Loss) | Total Operations | From Net Investment Income | From Net Realized Gains | Total Distributions | Value, End of Period | |||||||||||||||||||||||||||||||
| Class A | 4/30/2006 | $ | 12.44 | $ | (0.05 | ) | $ | 1.52 | $ | 1.47 | $ | – | $ | (0.72 | ) | $ | (0.72 | ) | $ | 13.19 | |||||||||||||||||||
| 10/31/2005 | 10.84 | (0.12 | ) | 1.82 | 1.70 | – | (0.10 | ) | (0.10 | ) | 12.44 | ||||||||||||||||||||||||||||
| 10/31/2004 | 10.14 | (0.13 | ) | 1.18 | 1.05 | – | (0.35 | ) | (0.35 | ) | 10.84 | ||||||||||||||||||||||||||||
| 10/31/2003 | 8.28 | (0.16 | ) | 2.02 | 1.86 | – | – | – | 10.14 | ||||||||||||||||||||||||||||||
| 10/31/2002 | 10.00 | (0.08 | ) | (1.64 | ) | (1.72) | – | – | – | 8.28 | |||||||||||||||||||||||||||||
| Class B | 4/30/2006 | 12.10 | (0.09 | ) | 1.56 | 1.47 | – | (0.72 | ) | (0.72 | ) | 12.85 | |||||||||||||||||||||||||||
| 10/31/2005 | 10.66 | (0.25 | ) | 1.79 | 1.54 | – | (0.10 | ) | (0.10 | ) | 12.10 | ||||||||||||||||||||||||||||
| 10/31/2004 | 10.03 | (0.17 | ) | 1.15 | 0.98 | – | (0.35 | ) | (0.35 | ) | 10.66 | ||||||||||||||||||||||||||||
| 10/31/2003 | 8.24 | (0.21 | ) | 2.00 | 1.79 | – | – | – | 10.03 | ||||||||||||||||||||||||||||||
| 10/31/2002 | 10.00 | (0.11 | ) | (1.65 | ) | (1.76 | ) | – | – | – | 8.24 | ||||||||||||||||||||||||||||
| Class C | 4/30/2006 | 12.07 | (0.09 | ) | 1.56 | 1.47 | – | (0.72 | ) | (0.72 | ) | 12.82 | |||||||||||||||||||||||||||
| 10/31/2005 | 10.63 | (0.25 | ) | 1.79 | 1.54 | – | (0.10 | ) | (0.10 | ) | 12.07 | ||||||||||||||||||||||||||||
| 10/31/2004 | 10.03 | (0.24 | ) | 1.19 | 0.95 | – | (0.35 | ) | (0.35 | ) | 10.63 | ||||||||||||||||||||||||||||
| 10/31/2003 | 8.10 | (0.22 | ) | 2.15 | 1.93 | – | – | – | 10.03 | ||||||||||||||||||||||||||||||
| Class I | 4/30/2006 | 12.52 | (0.02 | ) | 1.63 | 1.61 | – | (0.72 | ) | (0.72 | ) | 13.41 | |||||||||||||||||||||||||||
| 10/31/2005 | 11.26 | (0.07 | ) | 1.43 | 1.36 | – | (0.10 | ) | (0.10 | ) | 12.52 | ||||||||||||||||||||||||||||
| Ratios/Supplemental Data | |||||||||||||||||||||||||||||||
| For the Period | Total | Net Assets, End of Period | Ratio of Expenses to Average Net Assets (a) | Net Investment Income (Loss) to Average | Portfolio Turnover | ||||||||||||||||||||||||||
| Ended (g) | Return (c) | (000's) | Net (e) | Total (f) | Net Assets (a) | Rate (b) | |||||||||||||||||||||||||
| Class A | 4/30/2006 | 12.86 | % | $ | 3,783 | 1.49 | %(h) | 1.49 | %(h) | (0.62 | )% | 87 | % | ||||||||||||||||||
| 10/31/2005 | 15.69 | 194,414 | 1.44 | 1.44 | (1.02 | ) | 59 | ||||||||||||||||||||||||
| 10/31/2004 | 10.19 | 154,957 | 1.53 | 1.53 | (1.15 | ) | 35 | ||||||||||||||||||||||||
| 10/31/2003 | 22.46 | 59,115 | 1.95 | 2.19 | (1.61 | ) | 30 | ||||||||||||||||||||||||
| 10/31/2002 | (17.20 | ) | 3,804 | 1.95 | 8.76 | (1.51 | ) | 43 | |||||||||||||||||||||||
| Class B | 4/30/2006 | 12.46 | 4,998 | 2.15 | (h) | 2.15 | (h) | (1.43 | ) | 87 | |||||||||||||||||||||
| 10/31/2005 | 14.45 | 5,274 | 2.60 | 2.66 | (2.18 | ) | 59 | ||||||||||||||||||||||||
| 10/31/2004 | 9.59 | 4,590 | 2.09 | 2.09 | (1.58 | ) | 35 | ||||||||||||||||||||||||
| 10/31/2003 | 21.72 | 2,952 | 2.60 | 2.84 | (2.26 | ) | 30 | ||||||||||||||||||||||||
| 10/31/2002 | (17.60 | ) | 758 | 2.60 | 9.41 | (2.16 | ) | 43 | |||||||||||||||||||||||
| Class C | 4/30/2006 | 12.49 | 2,106 | 2.23 | (h) | 2.23 | (h) | (1.52 | ) | 87 | |||||||||||||||||||||
| 10/31/2005 | 14.44 | 2,223 | 2.60 | 2.90 | (2.18 | ) | 59 | ||||||||||||||||||||||||
| 10/31/2004 | 9.28 | 2,081 | 2.60 | 3.41 | (1.61 | ) | 35 | ||||||||||||||||||||||||
| 10/31/2003 | 23.83 | 201 | 2.60 | 2.84 | (2.26 | ) | 30 | ||||||||||||||||||||||||
| Class I | 4/30/2006 | 13.18 | 463,976 | 1.03 | (h) | 1.03 | (h) | (0.31 | ) | 87 | |||||||||||||||||||||
| 10/31/2005 | 12.09 | 173,270 | 1.06 | 1.06 | (0.65 | ) | 59 | ||||||||||||||||||||||||
The notes to the financial statements are an integral part of this report.
Transamerica IDEX Mutual Funds
Semi-Annual Report 2006
6
TA IDEX Evergreen Health Care
FINANCIAL HIGHLIGHTS (continued)
(unaudited)
NOTES TO FINANCIAL HIGHLIGHTS
(a) Annualized.
(b) Not annualized.
(c) Total Return has been calculated for the applicable period without deduction of a sales load, if any, on an initial purchase. Not annualized.
(d) Per share information is calculated based on average shares outstanding.
(e) Ratio of Net Expenses to Average Net Assets is net of fee waivers and reimbursements by the investment adviser and includes the recapture of previously waived expenses, if any ( see note 2).
(f) Ratio of Total Expenses to Average Net Assets includes all expenses before fee waivers, reimbursements and recapture of previously waived expenses by the investment adviser.
(g) TA IDEX Evergreen Health Care ("the Fund") commenced operations on March 1, 2002. The inception dates for the Fund's offering of share classes were as follows:
Class C was November 11, 2002.
Class I was November 8, 2004.
(h) Ratios of Total Expenses to Average Net Assets and Net Expenses to Average Net Assets are inclusive of recaptured expenses by the investment advisor, if any. The impact of recaptured expenses was 0.03%, 0.14%, 0.27% and 0.03% for Class A, Class B, Class C and Class I respectively (see note 2).
The notes to the financial statements are an integral part of this report.
Transamerica IDEX Mutual Funds
Semi-Annual Report 2006
7
TA IDEX Evergreen Health Care
NOTES TO FINANCIAL STATEMENTS
At April 30, 2006
(all amounts in thousands)
(unaudited)
NOTE 1. ORGANIZATION AND SIGNIFICANT ACCOUNTING POLICIES
Transamerica IDEX Mutual Funds is an open-end management investment company registered under the Investment Company Act of 1940, as amended (the "1940 Act").
Effective March 1, 2006, TA IDEX T. Rowe Price Health Sciences changed its name to TA IDEX Evergreen Health Care (the "Fund") and changed its sub-advisor from T. Rowe Price Associates, Inc. ("T. Rowe Price") to Evergreen Investment Management Company, LLC ("Evergreen").
The Fund is "non-diversified" under the 1940 Act.
In the normal course of business, the Fund enters into contracts that contain a variety of representations that provide general indemnifications. The Fund's maximum exposure under these arrangements is unknown, as this would involve future claims that may be made against the Fund and/or its affiliates that have not yet occurred. However, based on experience, the Fund expects the risk of loss to be remote.
This report should be read in conjunction with the current Fund prospectus, which contains more complete information about the Fund.
In preparing the Fund's financial statements in accordance with accounting principles generally accepted in the United States of America ("GAAP"), estimates or assumptions (which could differ from actual results) may be used that affect reported amounts and disclosures. The following is a summary of significant accounting policies followed by the Fund.
Multiple class operations, income and expenses: The Fund currently has four classes of shares, Class A, Class B, Class C and Class I, each with different expense levels. Classes A, B, and C are closed to new investors. Class I is only available for investment to certain affiliated asset allocation funds. Class B shares will convert to Class A shares eight years after purchase. Income, non-class specific expenses and realized and unrealized gains and losses, are allocated daily to each class, based upon the value of shares outstanding method as permitted under Rule 18f-3 of the 1940 Act. Each class bears its own specific expenses as well as a portion of general, common expenses.
Security valuations: The Fund values its investments at the close of the New York Stock Exchange ("NYSE"), normally 4 p.m. ET, each day the NYSE is open for business. Fund investments are valued at the last sale price or closing price on the day of valuation taken from the primary exchange where the security is principally traded.
Securities traded in the over-the-counter market and listed securities for which no sale was reported on that date are valued at the last quoted bid price.
Foreign securities generally are valued based on quotations from the primary market in which they are traded. Because many foreign securities markets and exchanges close prior to the close of the NYSE, closing prices for foreign securities in those markets or on those exchanges do not reflect the events that occur after that close. If a significant market event impacting the value of a portfolio security (e.g., natural disaster, company announcement, market volatility) occurs subsequent to the close of trading in the security, but prior to the calculation of the Fund's net asset value per share, market quotations for that security may be determined to be unreliable and, accordingly, not "readily available." As a result, foreign equity securities held by the Fund may be valued at fair market value as determined in good faith by the Fund's Administrative Valuation Committee, under the supervision of the Board's Valuation Committee , using guidelines adopted by the Board of Trustees.
Other securities for which quotations are not readily available or whose values have been determined to be unreliable are valued at fair market value as determined in good faith by the Fund's Administrative Valuation Committee, under the supervision of the Board's Valuation Committee, using guidelines adopted by the Board of Trustees.
Cash: The Fund may leave cash overnight in its cash account with the custodian, Investors Bank & Trust Company ("IBT"). IBT has been contracted on behalf of the Fund to invest the excess cash into a savings account, which at April 30, 2006, was paying an interest rate of 3.24%.
Commission recapture: The Fund's previous sub-adviser, T. Rowe Price, to the extent consistent with the best execution and usual commission rate policies and practices, placed security transactions of the Fund with broker/dealers with which Transamerica IDEX Mutual Funds has established a Commission Recapture Program. A Commission Recapture Program is any arrangement under which a broker/dealer applies a portion of the commissions received by such broker/dealer on the security transactions to the Fund. In no event will commissions paid by the Fund be used to pay expenses that would otherwise be borne by any other funds within Transamerica IDEX Mutual Funds, or by any other party. Evergreen does not participate in the Commission Recapture Program.
Recaptured commissions during the six months ended April 30, 2006, of $16 are included in net realized gains in the Statement of Operations.
Security transactions and investment income: Security transactions are recorded on the trade date. Security gains and losses are calculated on the specific identification basis. Dividend income, if any, is recorded on the ex-dividend date or, in the case of foreign securities, as soon as the Fund is informed of the ex-dividend date. Interest income, including accretion of discounts and amortization of premiums, is recorded on the accrual basis commencing on the settlement date.
Foreign currency denominated investments: The accounting records of the Fund are maintained in U.S. dollars. Securities and other assets
Transamerica IDEX Mutual Funds
Semi-Annual Report 2006
8
TA IDEX Evergreen Health Care
NOTES TO FINANCIAL STATEMENTS (continued)
At April 30, 2006
(all amounts in thousands)
(unaudited)
NOTE 1.–(continued)
and liabilities denominated in foreign currencies are translated into U.S. dollars at the closing exchange rate each day. The cost of foreign securities is translated at the exchange rate in effect when the investment was acquired. The Fund combines fluctuations from currency exchange rates and fluctuations in value when computing net realized and unrealized gains or losses from investments.
Net foreign currency gains and losses resulting from changes in exchange rates include: 1) foreign currency fluctuations between trade date and settlement date of investment security transactions; 2) gains and losses on forward foreign currency contracts; and 3) the difference between the receivable amounts of interest and dividends recorded in the accounting records in U.S. dollars and the amounts actually received.
Foreign currency denominated assets may involve risks not typically associated with domestic transactions. These risks include revaluation of currencies, adverse fluctuations in foreign currency values and possible adverse political, social and economic developments, including those particular to a specific industry, country or region.
Option contracts: The Fund may enter into options contracts to manage exposure to market fluctuations. Options are valued at the average of the bid and ask ("Mean Quote") established each day at the close of the board of trade or exchange on which they are traded. The primary risks associated with options are imperfect correlation between the change in value of the securities held and the prices of the options contracts; the possibility of an illiquid market and inability of the counterparty to meet the contracts terms. When the Fund writes a covered call or put option, an amount equal to the premium received by the Fund is included in the Fund's Statement of Assets and Liabilities as an asset and as an equivalent liability. Options are marked-to-market daily to reflect the current value of the option written.
The underlying face amounts of open option contracts at April 30, 2006, are listed in the Schedule of Investments.
Transactions in written call and put options were as follows:
| Premium | Contracts* | ||||||||||
| Beginning Balance October 31, 2005 | $ | 3,825 | 10,651 | ||||||||
| Sales | 6,851 | 22,206 | |||||||||
| Closing Buys | (9,710 | ) | (30,191 | ) | |||||||
| Expirations | (334 | ) | (1,593 | ) | |||||||
| Exercised | (632 | ) | (1,073 | ) | |||||||
| Balance at April 30, 2006 | $ | — | — | ||||||||
* Contracts not in thousands
Redemption fees: A short-term trading redemption fee may be assessed on any Fund shares in a fund account that are sold during the first five (5) NYSE trading days following their purchase date. This redemption fee will equal 2% of the amount redeemed and shares held the longest will be treated as being redeemed first and shares held the shortest as being redeemed last. For the six months ended April 30, 2006, the Fund received less than $1 in redemption fees.
Dividend distributions: Distributions to shareholders are recorded on the ex-dividend date and are determined in accordance with Federal income tax regulations which may differ from GAAP.
NOTE 2. RELATED PARTY TRANSACTIONS
Transamerica Fund Advisors, Inc. ("TFAI") is the Fund's investment adviser. Transamerica Fund Services, Inc. ("TFS") is the Fund's administrator and transfer agent. AFSG Securities Corp. ("AFSG") is the Fund's distributor/principal underwriter. TFAI, TFS, and AFSG are affiliates of AEGON, NV, a Netherlands corporation.
Certain officers and trustees of the Fund are also officers and/or directors of TFAI, TFS and AFSG.
The following schedule reflects the percentage of Fund assets owned by affiliated investment companies at April 30, 2006:
| Net Assets | % of Net Assets | ||||||||||
| TA IDEX Asset Allocation– Conservative Portfolio | $ | 18,101 | 3.81 | % | |||||||
| TA IDEX Asset Allocation– Growth Portfolio | 68,990 | 14.53 | % | ||||||||
| TA IDEX Asset Allocation– Moderate Portfolio | 59,505 | 12.53 | % | ||||||||
| TA IDEX Asset Allocation– Moderate Growth Portfolio | 87,540 | 18.43 | % | ||||||||
| Asset Allocation–Conservative Portfolio | 27,182 | 5.72 | % | ||||||||
| Asset Allocation–Growth Portfolio | 48,763 | 10.27 | % | ||||||||
| Asset Allocation– Moderate Growth Portfolio | 97,347 | 20.50 | % | ||||||||
| Asset Allocation–Moderate Portfolio | 56,647 | 11.93 | % | ||||||||
| Total | $ | 464,075 | 97.72 | % | |||||||
Investment advisory fees: The Fund pays management fees to TFAI based on average daily net assets ("ANA") at the following breakpoints:
From November 1, 2005 to February 28, 2006:
1.00% of the first $500 million of ANA
0.95% of ANA over $500 million
Transamerica IDEX Mutual Funds
Semi-Annual Report 2006
9
TA IDEX Evergreen Health Care
NOTES TO FINANCIAL STATEMENTS (continued)
At April 30, 2006
(all amounts in thousands)
(unaudited)
NOTE 2.–(continued)
From March 1, 2006 on:
0.87% of the first $100 million of ANA
0.85% of the next $150 million of ANA
0.80% of ANA over $250 million
TFAI has contractually agreed to waive its advisory fee and will reimburse the Fund to the extent that operating expenses, excluding 12b-1 fees, exceed the following stated annual limit:
From November 1, 2005 to November 6, 2005:
1.60% Expense Limit-Classes A, B and C
1.30% Expense Limit-Class I
From November 7, 2005 to February 28, 2006:
1.60% Expense Limit
From March 1, 2006 on:
1.47% Expense Limit
If total Fund expenses fall below the annual expense limitation agreement agreed to by the adviser within the succeeding three years, the Fund may be required to pay the adviser a portion or all of the waived advisory fees.
| Advisory Fee Waived | Available for Recapture Through | ||||||||||
| Fiscal Year 2003 | $ | 60 | 10/31/2006 | ||||||||
If total Fund expenses fall below the annual expense limitation agreement agreed to by the adviser within the succeeding three years, the Fund may be required to pay the adviser a portion or all of the reimbursed class expenses.
| Reimbursement of Class Expenses | Available for Recapture Through | ||||||||||
| Fiscal Year 2005: | |||||||||||
| Class B | $ | 3 | 10/31/2008 | ||||||||
| Class C | 7 | 10/31/2008 | |||||||||
| Fiscal Year 2004: | |||||||||||
| Class C | 8 | 10/31/2007 | |||||||||
The former sub-adviser, T. Rowe Price, has agreed to a pricing discount based on the aggregate assets that they manage in the Transamerica IDEX Mutual Funds. The amount of the discount received by the Fund for the period from November 1, 2005 through February 28, 2006 was $11.
Distribution and service fees: The Fund has a 12b-1 distribution plan under the 1940 Act pursuant to which an annual fee, based on average daily net assets, is paid to the distributor for various disbursements such as broker-dealer account servicing fees and other promotional expenses of the Fund. The Fund is authorized under the 12b-1 plan to pay fees on each class up to the following limits:
| Class A | 0.35 | % | |||||
| Class B | 1.00 | % | |||||
| Class C | 1.00 | % | |||||
| Class I | N/A | ||||||
From February 28, 2006 through March 1, 2007, the Fund will not pay 12b-1 fees under these plans.
Underwriter commissions relate to front-end sales charges imposed for Class A shares and contingent deferred sales charges from Classes B, C, and certain A share redemptions. For the six months ended April 30, 2006, the underwriter commissions were as follows:
| Received by Underwriter | $ | 3 | |||||
| Retained by Underwriter | – | ||||||
| Contingent Deferred Sales Charge | 2 | ||||||
Administrative services: The Fund has entered into an agreement with TFS for financial and legal fund administration services. The Fund pays TFS an annual fee of 0.02% of ANA. The Legal fees on the Statement of Operations are fees paid to external legal counsel.
Transfer agent fees: The Fund pays TFS an annual per-account charge for each open and closed account. The Fund paid TFS $19 for the six months ended April 30, 2006.
Deferred compensation plan: Each eligible independent Fund Trustee may elect to participate in a non-qualified deferred compensation plan maintained by Transamerica IDEX Mutual Funds (the "Plan"). Under the Plan, such Trustees may defer payment of all or a portion of their total fees earned as a Fund Trustee. Each Trustee who is a participant in the Plan may elect that the earnings, losses or gains credited to his or her deferred fee amounts be determined based on a deemed investment in any series of Transamerica IDEX Mutual Funds, including the Fund. The right of a participant to receive a distribution from the Plan of the deferred fees is an unsecured claim against the general assets of all series of Transamerica IDEX Mutual Funds. The pro rata liability to the Fund of all deferred fees in the Plan amounted, as of April 30, 2006, to $7.
Transamerica IDEX Mutual Funds
Semi-Annual Report 2006
10
TA IDEX Evergreen Health Care
NOTES TO FINANCIAL STATEMENTS (continued)
At April 30, 2006
(all amounts in thousands)
(unaudited)
NOTE 3. INVESTMENT TRANSACTIONS
The cost of securities purchased and proceeds from securities sold (excluding short-term securities) for the six months ended April 30, 2006 were as follows:
| Purchases of securities: | |||||||
| Long-Term | $ | 431,784 | |||||
| U.S. Government | – | ||||||
| Proceeds from maturities and sales of securities: | |||||||
| Long-Term | 367,650 | ||||||
| U.S. Government | – | ||||||
NOTE 4. FEDERAL INCOME TAX MATTERS
The Fund has not made any provision for federal income or excise taxes due to its policy to distribute all of its taxable income and capital gains to its shareholders and otherwise qualify as a regulated investment company under Subchapter M of the Internal Revenue Code. Income and capital gain distributions are determined in accordance with income tax regulations, which may differ from GAAP. These differences are primarily due to differing treatment for items including, but not limited to, wash sales, foreign currency transactions, net operating losses and straddles.
NOTE 5. REGULATORY PROCEEDINGS
There continues to be significant federal and state regulatory activity relating to financial services companies, particularly mutual fund companies and their investment advisers. As part of an ongoing investigation regarding potential market timing, recordkeeping and trading compliance issues and matters affecting the Fund's investment adviser, TFAI, and certain affiliates and former employees of TFAI, the SEC staff has indicated that it is likely to take some action against TFAI and certain of its affiliates at the conclusion of the investigation. The potential timing and the scope of any such action is difficult to predict. Although the impact of any action brought against TFAI and/or its affiliates is difficult to assess at the present time, the Fund currently believes that the likelihood that any such action will have a material adverse impact on it is remote. It is important to note that the Fund is not aware of any allega tion of wrongdoing against it and its Board at the time this semi-annual report is printed. Although it is not anticipated that these developments will have an adverse impact on the Fund, there can be no assurance at this time. TFAI and its affiliates are actively working with the SEC in regard to this matter; however, the exact resolution cannot be determined at this time. TFAI will take such actions that it deems necessary or appropriate to continue providing management services to the Fund and to bring all matters to an appropriate conclusion.
TFAI and/or its affiliates, and not the Fund, will bear the costs regarding these regulatory matters.
Transamerica IDEX Mutual Funds
Semi-Annual Report 2006
11
TA IDEX Evergreen Health Care
INVESTMENT ADVISORY AND SUB-ADVISORY AGREEMENTS – REVIEW, RENEWAL AND APPROVAL (unaudited)
At a meeting of the Board of Trustees of Transamerica IDEX Mutual Funds ("TA IDEX") held on November 2, 2005, the Board reviewed and considered the Investment Advisory Agreement between TA IDEX Evergreen Health Care (the "Fund") and Transamerica Fund Advisors, Inc. ("TFAI") to determine whether the Investment Advisory Agreement should be renewed for a one-year period. During the meeting, TFAI also proposed that the Board approve the replacement of T. Rowe Price Associates, Inc. ("T. Rowe"), then the Fund's sub-adviser, with Evergreen Investment Management Company LLC ("Evergreen") effective on or about March 1, 2006. Following their review and consideration, the Trustees determined that the Investment Advisory Agreement and the proposed change in investment sub-adviser will enable shareholders of the Fund to obtain high quality services at a cost that is appropriate, reasonable, and in the best interests of its shareholders. The Board, including the independent members of the Board, unanimously approved the renewal of the Investment Advisory Agreement and the renewal of the Investment Sub-Advisory Agreement with T. Rowe until it was replaced by Evergreen, effective on or about March 1, 2006. The Board also approved the successor Evergreen Investment Sub-Advisory Agreement and the Fund's name change to "TA IDEX Evergreen Health Care." In reaching their decision, the Trustees requested and obtained from TFAI and Evergreen such information as they deemed reasonably necessary to evaluate the Investment Advisory Agreement and the proposed Evergreen Investment Sub-Advisory Agreement. The Trustees also carefully considered the information that they had received throughout the year from TFAI as part of their regular oversight of the Fund, as well as: comparative fee, expense and performance information prepared by Lipper Inc. ("Lipper"), independent providers of mutual fund performance, fee and expense information, and profitability data p repared by TFAI. In considering the continuation of the Investment Advisory Agreement and the proposed Evergreen Investment Sub-Advisory Agreement, the Trustees evaluated a number of considerations that they believe, in light of the legal advice furnished to them by TA IDEX counsel and independent legal counsel and their own business judgment, to be relevant. They based their decisions on the following considerations, among others, although they did not identify any consideration or particular information that was controlling of their decisions:
The nature, extent and quality of the advisory service to be provided. The Board considered the nature and quality of the services expected to be provided by TFAI and Evergreen to the Fund in the future. The Trustees favorably noted that Evergreen proposed to manage the Fund with an experienced team of fund managers at a lower sub-advisory fee rate than T. Rowe. The Board concluded that TFAI and Evergreen are capable of providing high quality services to the Fund, as indicated by the nature and quality of services provided by TFAI in the past, TFAI's and Evergreen's management capabilities demonstrated with respect to the funds they manage, and the experience, capability and integrity of TFAI's senior management, the financial resources of TFAI and Evergreen, TFAI's management oversight process, and the professional qualifications and experience of Ev ergreen's portfolio management team. The Trustees also concluded that TFAI and Evergreen proposed to provide investment and related services that were of comparable or superior quality and quantity as services provided to the Fund in the past, and that these services are appropriate in scope and extent in light of the Fund's operations, the competitive landscape of the investment company business and investor needs, and that TFAI's obligations will remain substantially the same.
The investment performance of the Fund. The Board examined the short-term and longer-term performance of the Fund under the management of T. Rowe, including relative performance against a benchmark securities index and a peer group of comparable mutual funds as prepared by Lipper, for various trailing periods ended June 30, 2005. The Trustees concluded that the Fund had achieved acceptable investment performance, noting that although the performance of the Fund was below median relative to its peers and trailed the benchmark index over the past one-year period, the Fund's performance was above median relative to its peers and the benchmark index over the past two- and three-year periods. On the basis of the Trustees' assessment of the nature, extent and quality of advisory services expected to be provided or procured by TFAI and Evergreen and Evergree n's track record in managing similar funds, the Trustees concluded that TFAI and Evergreen should be capable of generating a level of investment performance that is appropriate in light of the Fund's investment objective, policies and strategies and competitive with many other investment companies, and also determined that TFAI's performance record in managing the Fund and Evergreen's performance record in managing other funds indicate that their management is likely to benefit the Fund and its shareholders.
The cost of advisory services provided and the level of profitability. The Board reviewed profitability information regarding TFAI's costs of procuring portfolio management services, as well as the costs of provision of administration, transfer agency, fund accounting and other services, to the Fund and to TA IDEX as a whole by TFAI and its affiliates. The Trustees reviewed data from Lipper that compared the Fund's management fees (including management fees at various asset levels), other fees and expenses (including total expenses including and excluding 12b-1 distribution and service fees) and portfolio turnover rate against a peer group of comparable mutual funds. The Board noted that Evergreen had agreed to manage the Fund at a lower sub-advisory fee rate, which would in turn permit TFAI to lower its advisory fees. The Board carefully reviewed the
Transamerica IDEX Mutual Funds
Semi-Annual Report 2006
12
TA IDEX Evergreen Health Care (continued)
proposal, and considered, among other things, the proposed investment advisory fees, sub-advisory fees and estimated operating expenses of the Fund, which the Board determined to be generally consistent with industry averages. The Board concluded that the proposed changes are reasonably likely to benefit the Fund and its shareholders. In addition, on the basis of the Board's review of the proposed management fees to be charged by TFAI for investment advisory and related services, the proposed sub-advisory fees to be paid by Evergreen, TFAI profitability information (derived from TFAI's audited financial statements), TFAI's estimated management income resulting from its management of the Fund, and the estimated pre-tax profit margins of Evergreen, as well as the entirety of TFAI's and its affiliates' service relationship with TA IDEX, the Board concluded that the proposed level of investment management fees and other service fees , as well as TFAI's and Evergreen's profitability, are appropriate in light of the services provided, the management fees and overall expense ratios of comparable investment companies and the anticipated profitability of the relationship between the Fund, TFAI and its affiliates, and Evergreen.
Whether fee levels reflect economies of scale and the extent to which economies of scale would be realized as the Fund grows. The Board concluded that the inclusion of asset-based breakpoints in the Fund's advisory fee schedule appropriately benefits investors by realizing economies of scale in the form of lower management fees as the level of assets grows. The Board noted that the Fund is closed to new investors and will be closed to new investments in the near future, except that it may continue selling shares to other funds of TA IDEX and other investment companies in the same group of investment companies as TA IDEX, which may limit the ability of the Fund to realize economies of scale. The Board also concluded that the lowered investment advisory and sub-advisory fees reflect potential economies of scale to some extent by virtue of their competit ive levels determined with reference to industry standards as reported by Lipper and the estimated profitability at current or foreseeable asset levels. In addition, the Board concluded that the Fund's investment management and sub-advisory fees appropriately reflect the Fund's current size, the current economic environment for TFAI and Evergreen and the competitive nature of the investment company industry. The Trustees also determined that they will have the opportunity to periodically reexamine whether the Fund has achieved economies of scale, and the appropriateness of management fees payable to TFAI and fees payable by TFAI to Evergreen, in the future.
Benefits (such as soft dollars) to TFAI, its affiliates, or Evergreen from their relationship with the Fund. The Board concluded that other benefits derived by TFAI, its affiliates, and the Sub-Adviser from their relationship with the Fund are reasonable and fair, and are consistent with industry practice and the best interests of the Fund and its shareholders. In this regard, the Board noted that TFAI does not realize "soft dollar" benefits from its relationship with the Fund. In addition, the Trustees determined that the administration, transfer agency, fund accounting and other fees paid by the Fund to affiliates of TFAI are reasonable, fair and in the best interests of shareholders in light of the nature and quality of the services provided, the associated costs to these affiliates of providing the services, the impact of the costs of such service s on the Fund's overall operating expenses, and the necessity of the services for the Fund's operations.
Other considerations. The Board determined that TFAI and Evergreen had made a substantial commitment to the recruitment and retention of high quality personnel, and maintained the financial, compliance and operational resources reasonably necessary to manage the Fund in a professional manner that is consistent with the best interests of the Fund and its shareholders. In this regard, the Trustees favorably considered the procedures and policies in place by TFAI and Evergreen to enforce compliance with applicable laws and regulations and oversee the portfolio management activities of the Sub-Adviser. The Trustees also determined that TFAI had made a significant entrepreneurial commitment to the management and success of the Fund, reflected by TFAI's expense limitation and fee waiver arrangement with the Fund, which may result in TFAI waiving advisory fe es for the benefit of shareholders.
Transamerica IDEX Mutual Funds
Semi-Annual Report 2006
13
TA IDEX Great Companies–AmericaSM
UNDERSTANDING YOUR FUND'S EXPENSES
(unaudited)
SHAREHOLDER EXPENSES
Fund shareholders may incur two types of costs: (1) transaction costs, including sales charges (loads) on purchases, contingent deferred sales charges on redemptions and redemption fees; and (2) ongoing costs, including management fees, 12b-1 distribution and service fees, and other fund expenses.
The following Example is intended to help you understand your ongoing costs (in dollars and cents) of investing in the Fund and to compare these costs with the ongoing costs of investing in other funds.
The Example is based on an investment of $1,000 invested at November 1, 2005 and held for the entire period until April 30, 2006.
ACTUAL EXPENSES
The first line in the table below provides information about actual account values and actual expenses. You may use the information in this line, together with the amount you invested, to estimate the expenses that you paid over the period. Simply divide your account value by $1,000 (for example, an $8,600 account value divided by $1,000 = 8.6), then multiply the result by the number in the first line of your Fund under the heading entitled "Expenses Paid During Period" to estimate the expenses you paid on your account during this period. If your account is an IRA, your expenses could have included a $15 annual fee. The amount of any fee paid through your account would increase the estimate of expenses you paid during the period and decrease your ending account value.
HYPOTHETICAL EXAMPLE FOR COMPARISON PURPOSES
The second line in the table below provides information about hypothetical account values and hypothetical expenses based on the Fund's actual expense ratio and an assumed rate of return of 5% per year before expenses, which is not the Fund's actual return. The hypothetical account values and expenses may not be used to estimate the actual ending account balance or expenses you paid for the period. You may use this information to compare the ongoing costs of investing in your Fund and other funds. To do so, compare this 5% hypothetical example with the 5% hypothetical examples that appear in the shareholder reports of the other funds. As in the case of the actual expense example, if your account is subject to an IRA fee, the amount of the fee paid through your account would increase the hypothetical expenses you would have paid during the period and decrease the hypothetical ending account value.
Please note that the expenses shown in the table are meant to highlight your ongoing costs only and do not reflect any transactional costs, such as sales charges, redemption fees, brokerage commissions paid on purchases and sales of fund shares. Therefore, the second line under the Fund in the table is useful in comparing ongoing costs only, and will not help you determine the relative total costs of owning different funds. If any of these transaction costs were included, your costs would be higher. The expenses shown in the table do not reflect any fees that may be charged to you by brokers, financial intermediaries or other financial institutions.
| Beginning Account Value | Ending Account Value | Annualized Expense Ratio | Expenses Paid During Period (a) | ||||||||||||||||
| Class A | |||||||||||||||||||
| Actual | $ | 1,000.00 | $ | 1,068.30 | 1.51 | % | $ | 7.74 | |||||||||||
| Hypothetical (b) | 1,000.00 | 1,017.31 | 1.51 | 7.55 | |||||||||||||||
| Class B | |||||||||||||||||||
| Actual | 1,000.00 | 1,064.20 | 2.16 | 11.06 | |||||||||||||||
| Hypothetical (b) | 1,000.00 | 1,014.08 | 2.16 | 10.79 | |||||||||||||||
| Class C | |||||||||||||||||||
| Actual | 1,000.00 | 1,064.20 | 2.16 | 11.06 | |||||||||||||||
| Hypothetical (b) | 1,000.00 | 1,014.08 | 2.16 | 10.79 | |||||||||||||||
| Class I | |||||||||||||||||||
| Actual | 1,000.00 | 1,021.40 | 0.90 | 3.61 | |||||||||||||||
| Hypothetical (b) | 1,000.00 | 1,016.29 | 0.90 | 3.60 | |||||||||||||||
(a) Expenses are calculated using the Fund's annualized expense ratio (as disclosed in the table), multiplied by the average account value for the period, multiplied by number of days in the period (181 days for Classes A, B and C, and 145 days for Class I), and divided by the number of days in the year (365 days).
(b) 5% return per year before expenses.
GRAPHICAL PRESENTATION OF SCHEDULE OF INVESTMENTS
By Sector
At April 30, 2006
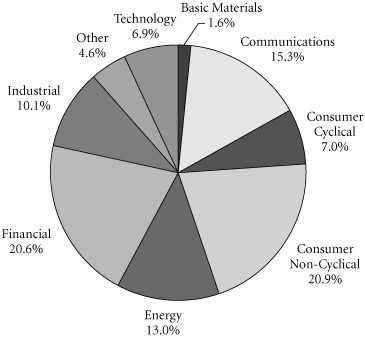
This chart shows the percentage breakdown by sector of the Fund's total investment securities.
Transamerica IDEX Mutual Funds
Semi-Annual Report 2006
1
TA IDEX Great Companies–AmericaSM
SCHEDULE OF INVESTMENTS
At April 30, 2006
(all amounts except share amounts in thousands)
(unaudited)
| Shares | Value | ||||||||||
| COMMON STOCKS (97.7%) | |||||||||||
| Aerospace (3.6%) | |||||||||||
| United Technologies Corp. | 50,000 | $ | 3,141 | ||||||||
| Amusement & Recreation Services (2.1%) | |||||||||||
| Disney (Walt) Co. (The) | 64,660 | 1,808 | |||||||||
| Beverages (3.5%) | |||||||||||
| PepsiCo, Inc. | 52,350 | 3,049 | |||||||||
| Chemicals & Allied Products (4.4%) | |||||||||||
| Clorox Co. | 29,000 | 1,861 | |||||||||
| Procter & Gamble Co. | 33,970 | 1,977 | |||||||||
| Commercial Banks (2.3%) | |||||||||||
| JP Morgan Chase & Co. | 44,000 | 1,997 | |||||||||
| Communications Equipment (5.1%) | |||||||||||
| Corning, Inc. ‡ | 81,000 | 2,238 | |||||||||
| QUALCOMM, Inc. | 42,000 | 2,156 | |||||||||
| Computer & Data Processing Services (4.8%) | |||||||||||
| F5 Networks, Inc. ‡† | 16,000 | 937 | |||||||||
| Sun Microsystems, Inc. ‡ | 275,000 | 1,375 | |||||||||
| Yahoo!, Inc. ‡ | 56,000 | 1,836 | |||||||||
| Computer & Office Equipment (2.1%) | |||||||||||
| Apple Computer, Inc. ‡ | 25,700 | 1,809 | |||||||||
| Electronic & Other Electric Equipment (2.1%) | |||||||||||
| Emerson Electric Co. | 21,000 | 1,784 | |||||||||
| Electronic Components & Accessories (3.4%) | |||||||||||
| Intel Corp. | 100,000 | 1,998 | |||||||||
| Trident Microsystems, Inc. ‡ | 35,000 | 931 | |||||||||
| Furniture & Fixtures (2.3%) | |||||||||||
| Johnson Controls, Inc. | 24,000 | 1,957 | |||||||||
| Industrial Machinery & Equipment (1.1%) | |||||||||||
| National Oilwell Varco, Inc. ‡ | 14,000 | 966 | |||||||||
| Instruments & Related Products (2.2%) | |||||||||||
| Danaher Corp. | 30,000 | 1,923 | |||||||||
| Insurance (4.0%) | |||||||||||
| AFLAC, Inc. | 39,000 | 1,854 | |||||||||
| UnitedHealth Group, Inc. | 32,440 | 1,614 | |||||||||
| Leather & Leather Products (2.9%) | |||||||||||
| Coach, Inc. ‡ | 75,000 | 2,477 | |||||||||
| Life Insurance (3.1%) | |||||||||||
| Prudential Financial, Inc. | 34,600 | 2,703 | |||||||||
| Medical Instruments & Supplies (4.3%) | |||||||||||
| Bard, (C.R.) Inc. | 15,000 | 1,117 | |||||||||
| Medtronic, Inc. | 33,400 | 1,674 | |||||||||
| St. Jude Medical, Inc. ‡ | 24,190 | �� | 955 | ||||||||
| Shares | Value | ||||||||||
| Mining (1.7%) | |||||||||||
| Vulcan Materials Co. | 17,000 | $ | 1,444 | ||||||||
| Motor Vehicles, Parts & Supplies (1.3%) | |||||||||||
| BorgWarner, Inc. | 18,000 | 1,093 | |||||||||
| Oil & Gas Extraction (9.9%) | |||||||||||
| BJ Services Co. | 65,760 | 2,502 | |||||||||
| Chesapeake Energy Corp. † | 28,000 | 887 | |||||||||
| Hugoton Royalty Trust | 2,050 | 57 | |||||||||
| Nabors Industries, Ltd. ‡ | 36,000 | 1,344 | |||||||||
| Weatherford International, Ltd. ‡ | 44,000 | 2,329 | |||||||||
| XTO Energy, Inc. † | 34,410 | 1,457 | |||||||||
| Paper & Allied Products (2.4%) | |||||||||||
| 3M Co. | 24,000 | 2,050 | |||||||||
| Petroleum Refining (2.3%) | |||||||||||
| Marathon Oil Corp. | 13,000 | 1,032 | |||||||||
| Valero Energy Corp. | 15,000 | 971 | |||||||||
| Pharmaceuticals (7.2%) | |||||||||||
| Alkermes, Inc. ‡† | 33,460 | 718 | |||||||||
| Biogen Idec, Inc. ‡ | 20,420 | 916 | |||||||||
| Genzyme Corp. ‡ | 25,810 | 1,579 | |||||||||
| Gilead Sciences, Inc. ‡ | 17,000 | 978 | |||||||||
| Wyeth | 42,620 | 2,074 | |||||||||
| Radio & Television Broadcasting (1.3%) | |||||||||||
| Viacom, Inc.–Class B ‡ | 29,000 | 1,155 | |||||||||
| Rubber & Misc. Plastic Products (0.8%) | |||||||||||
| Newell Rubbermaid, Inc. | 25,790 | 707 | |||||||||
| Security & Commodity Brokers (13.5%) | |||||||||||
| American Express Co. | 51,000 | 2,744 | |||||||||
| E*TRADE Financial Corp. ‡ | 72,000 | 1,791 | |||||||||
| Goldman Sachs Group, Inc. (The) | 11,200 | 1,795 | |||||||||
| Morgan Stanley | 41,000 | 2,636 | |||||||||
| T. Rowe Price Group, Inc. | 32,000 | 2,694 | |||||||||
| Telecommunications (4.0%) | |||||||||||
| Sprint Nextel Corp. | 67,000 | 1,662 | |||||||||
| Verizon Communications, Inc. | 53,000 | 1,751 | |||||||||
| Total Common Stocks (cost: $78,096) | 84,503 | ||||||||||
The notes to the financial statements are an integral part of this report.
Transamerica IDEX Mutual Funds
Semi-Annual Report 2006
2
TA IDEX Great Companies–AmericaSM
SCHEDULE OF INVESTMENTS (continued)
At April 30, 2006
(all amounts except share amounts in thousands)
(unaudited)
| Principal | Value | ||||||||||
| SECURITY LENDING COLLATERAL (4.6%) | |||||||||||
| Debt (4.3%) | |||||||||||
| Bank Notes (0.5%) | |||||||||||
| Bank of America | |||||||||||
| 4.81%, due 06/07/2006 * | $ | 130 | $ | 130 | |||||||
| 4.81%, due 08/10/2006 * | 126 | 126 | |||||||||
| Bear Stearns & Co. 5.01%, due 06/06/2006 * 5.01%, due 09/07/2006 * | 50 151 | 50 151 | |||||||||
| Certificates Of Deposit (0.3%) | |||||||||||
| Halifax Bank of Scotland 4.78%, due 06/06/2006 * | 126 | 126 | |||||||||
| Rabobank Nederland 4.87%, due 05/31/2006 * | 126 | 126 | |||||||||
| Commercial Paper (0.2%) | |||||||||||
| Banco Santander Central Hispano SA 4.77%, due 05/02/2006 | 75 | 75 | |||||||||
| Sheffield Receivables Corp.-144A 4.81%, due 05/03/2006 | 125 | 125 | |||||||||
| Euro Dollar Overnight (0.8%) | |||||||||||
| Bank of Montreal 4.77%, due 05/02/2006 | 100 | 100 | |||||||||
| Dexia Group 4.78%, due 05/04/2006 | 126 | 126 | |||||||||
| Fortis Bank 4.77%, due 05/01/2006 | 50 | 50 | |||||||||
| Royal Bank of Canada 4.77%, due 05/01/2006 | 176 | 176 | |||||||||
| Royal Bank of Scotland 4.75%, due 05/03/2006 | 126 | 126 | |||||||||
| Svenska Handlesbanken 4.82%, due 05/01/2006 | 96 | 96 | |||||||||
| Euro Dollar Terms (1.2%) | |||||||||||
| BancoBilbao Vizcaya Argentaria SA 4.95%, due 06/20/2006 | 100 | 100 | |||||||||
| Bank of the West 4.94%, due 06/16/2006 | 100 | 100 | |||||||||
| Barclays 4.79%, due 05/10/2006 4.77%, due 05/16/2006 | 151 50 | 151 50 | |||||||||
| Canadian Imperial Bank of Commerce 4.97%, due 06/23/2006 | 75 | 75 | |||||||||
| Credit Suisse First Boston Corp. 4.73%, due 05/08/2006 | 75 | 75 | |||||||||
| Principal | Value | ||||||||||
| Euro Dollar Terms (continued) | |||||||||||
| Fortis Bank | |||||||||||
| 4.83%, due 05/08/2006 | $ | 50 | $ | 50 | |||||||
| Lloyds TSB Bank 4.81%, due 05/11/2006 | 75 | 75 | |||||||||
| Royal Bank of Scotland 4.87%, due 05/12/2006 | 100 | 100 | |||||||||
| Societe Generale 4.79%, due 05/10/2006 | 126 | 126 | |||||||||
| UBS AG 4.95%, due 06/20/2006 | 126 | 126 | |||||||||
| Repurchase Agreements (1.3%) †† | |||||||||||
| Credit Suisse First Boston Corp. 4.92%, dated 04/28/2006 to be repurchased at $171 on 05/01/2006 | 170 | 170 | |||||||||
| Goldman Sachs Group, Inc. (The) 4.92%, dated 04/28/2006 to be repurchased at $369 on 05/01/2006 | 369 | 369 | |||||||||
| Lehman Brothers, Inc. 4.92%, dated 04/28/2006 to be repurchased at $6 on 05/01/2006 | 6 | 6 | |||||||||
| Merrill Lynch & Co. 4.87%, dated 04/28/2006 to be repurchased at $377 on 05/01/2006 | 377 | 377 | |||||||||
| Morgan Stanley Dean Witter & Co. 4.93%, dated 04/28/2006 to be repurchased at $176 on 05/01/2006 | 176 | 176 | |||||||||
| Shares | Value | ||||||||||
| Investment Companies (0.3%) | |||||||||||
| Barclays Global Investors Institutional Money Market Fund 1-day yield of 4.78% | 200,852 | $ | 201 | ||||||||
| Merrimac Cash Fund, Premium Class 1-day yield of 4.61% @ | 53,440 | 53 | |||||||||
| Total Security Lending Collateral (cost: $3,963) | 3,963 | ||||||||||
| Total Investment Securities (cost: $82,059) # | $ | 88,466 | |||||||||
The notes to the financial statements are an integral part of this report.
Transamerica IDEX Mutual Funds
Semi-Annual Report 2006
3
TA IDEX Great Companies–AmericaSM
SCHEDULE OF INVESTMENTS (continued)
At April 30, 2006
(all amounts except share amounts in thousands)
(unaudited)
NOTES TO SCHEDULE OF INVESTMENTS:
‡ Non-income producing.
† At April 30, 2006, all or a portion of this security is on loan (see Note 1). The value at April 30, 2006, of all securities on loan is $3,867.
* Floating or variable rate note. Rate is listed as of April 30, 2006.
†† Cash collateral for the Repurchase Agreements, valued at $1,130, that serve as collateral for securities lending are invested in corporate bonds with interest rates and maturity dates ranging from 0.00%–9.05% and 05/02/2006–12/31/2049, respectively.
@ Regulated investment company advised by Investors Bank and Trust Co. ("IBT"). IBT is also the accounting, custody and lending agent for the Fund.
# Aggregate cost for Federal income tax purposes is $82,449. Aggregate gross unrealized appreciation for all securities in which there is an excess of value over tax cost and aggregate gross unrealized depreciation for all securities in which there is an excess of tax cost over value were $8,365 and $2,348, respectively. Net unrealized appreciation for tax purposes is $6,017.
DEFINITIONS:
144A 144A Securities are registered pursuant to Rule 144A of the Securities Act of 1933. These securities are deemed to be liquid for purposes of compliance limitations on holdings of illiquid securities and may be resold as transactions exempt from registration, normally to qualified institutional buyers. At April 30, 2006, these securities aggregated $125 or 0.1% of the net assets of the Fund.
The notes to the financial statements are an integral part of this report.
Transamerica IDEX Mutual Funds
Semi-Annual Report 2006
4
TA IDEX Great Companies–AmericaSM
STATEMENT OF ASSETS AND LIABILITIES
At April 30, 2006
(all amounts except per share amounts in thousands)
(unaudited)
| Assets: | |||||||
| Investment securities, at value (cost: $82,059) (including securities loaned of $3,867) | $ | 88,466 | |||||
| Cash | 117 | ||||||
| Receivables: | |||||||
| Investment securities sold | 2,917 | ||||||
| Shares of beneficial interest sold | 7 | ||||||
| Interest | 6 | ||||||
| Dividends | 96 | ||||||
| Other | 8 | ||||||
| 91,617 | |||||||
| Liabilities: | |||||||
| Investment securities purchased | 711 | ||||||
| Accounts payable and accrued liabilities: | |||||||
| Shares of beneficial interest redeemed | 278 | ||||||
| Management and advisory fees | 51 | ||||||
| Distribution and service fees | 51 | ||||||
| Transfer agent fees | 43 | ||||||
| Administration fees | 1 | ||||||
| Payable for collateral for securities on loan | 3,963 | ||||||
| Other | 27 | ||||||
| 5,125 | |||||||
| Net Assets | $ | 86,492 | |||||
| Net Assets Consist of: | |||||||
| Shares of beneficial interest, unlimited shares authorized, no par value | $ | 88,455 | |||||
| Distributable net investment income (loss) | (290 | ) | |||||
| Accumulated net realized gain (loss) from investment securities | (8,079 | ) | |||||
| Net unrealized appreciation (depreciation) on investment securities | 6,406 | ||||||
| Net Assets | $ | 86,492 | |||||
| Net Assets by Class: | |||||||
| Class A | $ | 26,937 | |||||
| Class B | 35,571 | ||||||
| Class C | 15,559 | ||||||
| Class I | 8,425 | ||||||
| Shares Outstanding: | |||||||
| Class A | 2,692 | ||||||
| Class B | 3,697 | ||||||
| Class C | 1,617 | ||||||
| Class I | 840 | ||||||
| Net Asset Value Per Share: | |||||||
| Class A | $ | 10.01 | |||||
| Class B | 9.62 | ||||||
| Class C | 9.62 | ||||||
| Class I | 10.03 | ||||||
| Maximum Offering Price Per Share (a): | |||||||
| Class A | $ | 10.59 | |||||
(a) Includes the maximum selling commission (represented as a percentage of offering price) which is reduced on certain levels of sales as set forth in the Prospectus. Net asset value per share for Classes B, C and I shares represents offering price. The redemption price for Classes B and C shares equals net asset value less any applicable contingent deferred sales charge.
STATEMENT OF OPERATIONS
For the period ended April 30, 2006 (b)
(all amounts in thousands)
(unaudited)
| Investment Income: | |||||||
| Dividends | $ | 524 | |||||
| Interest | 50 | ||||||
| Income from loaned securities–net | 2 | ||||||
| 576 | |||||||
| Expenses: | |||||||
| Management and advisory fees | 353 | ||||||
| Distribution and service fees: | |||||||
| Class A | 55 | ||||||
| Class B | 191 | ||||||
| Class C | 88 | ||||||
| Transfer agent fees: | |||||||
| Class A | 53 | ||||||
| Class B | 71 | ||||||
| Class C | 27 | ||||||
| Class I | – | (c) | |||||
| Printing and shareholder reports | 18 | ||||||
| Custody fees | 6 | ||||||
| Administration fees | 9 | ||||||
| Legal fees | 2 | ||||||
| Audit fees | 9 | ||||||
| Trustees fees | 2 | ||||||
| Registration fees | 17 | ||||||
| Other | 2 | ||||||
| Total expenses | 903 | ||||||
| Less: | |||||||
| Reimbursement of class expenses: | |||||||
| Class A | (13 | ) | |||||
| Class B | (22 | ) | |||||
| Class C | (5 | ) | |||||
| Total reimbursed expenses | (40 | ) | |||||
| Net expenses | 863 | ||||||
| Net Investment Income (Loss) | (287 | ) | |||||
| Net Realized and Unrealized Gain (Loss): | |||||||
| Realized gain (loss) from investment securities | 4,777 | ||||||
| Increase (decrease) in unrealized appreciation (depreciation) on investment securities | 1,424 | ||||||
| Net Realized and Unrealized Gain (Loss) on Investment Securities | 6,201 | ||||||
| Net Increase (Decrease) in Net Assets Resulting from Operations | $ | 5,914 | |||||
(b) Class I was offered for investment on November 15, 2005.
(c) Rounds to less than $1.
The notes to the financial statements are an integral part of this report.
Transamerica IDEX Mutual Funds
Semi-Annual Report 2006
5
TA IDEX Great Companies–AmericaSM
STATEMENTS OF CHANGES IN NET ASSETS
For the period or year ended
(all amounts in thousands)
| April 30, 2006 (unaudited) (a) | October 31, 2005 | ||||||||||
| Increase (Decrease) In Net Assets From: | |||||||||||
| Operations: | |||||||||||
| Net investment income (loss) | $ | (287 | ) | $ | (613 | ) | |||||
| Net realized gain (loss) from investment securities | 4,777 | 9,945 | |||||||||
| Change in unrealized appreciation (depreciation) on investment securities | 1,424 | (2,797 | ) | ||||||||
| 5,914 | 6,535 | ||||||||||
| Capital Share Transactions: | |||||||||||
| Proceeds from shares sold: | |||||||||||
| Class A | 1,010 | 3,043 | |||||||||
| Class B | 588 | 1,547 | |||||||||
| Class C | 455 | 2,777 | |||||||||
| Class I | 8,254 | – | |||||||||
| 10,307 | 7,367 | ||||||||||
| Cost of shares redeemed: | |||||||||||
| Class A | (9,401 | ) | (16,413 | ) | |||||||
| Class B | (7,769 | ) | (18,429 | ) | |||||||
| Class C | (4,852 | ) | (11,983 | ) | |||||||
| (22,022 | ) | (46,825 | ) | ||||||||
| Automatic conversions: | |||||||||||
| Class A | 31 | 15 | |||||||||
| Class B | (31 | ) | (15 | ) | |||||||
| – | – | ||||||||||
| (11,715 | ) | (39,458 | ) | ||||||||
| Net increase (decrease) in net assets | (5,801 | ) | (32,923 | ) | |||||||
| Net Assets: | |||||||||||
| Beginning of period | 92,293 | 125,216 | |||||||||
| End of period | $ | 86,492 | $ | 92,293 | |||||||
| Distributable Net Investment Income (Loss) | $ | (290 | ) | $ | (3 | ) | |||||
(a) Class I was offered for investment on November 15, 2005.
| April 30, 2006 (unaudited) (a) | October 31, 2005 | ||||||||||
| Share Activity: | |||||||||||
| Shares issued: | |||||||||||
| Class A | 103 | 327 | |||||||||
| Class B | 62 | 172 | |||||||||
| Class C | 48 | 305 | |||||||||
| Class I | 840 | – | |||||||||
| 1,053 | 804 | ||||||||||
| Shares redeemed: | |||||||||||
| Class A | (955 | ) | (1,765 | ) | |||||||
| Class B | (822 | ) | (2,045 | ) | |||||||
| Class C | (513 | ) | (1,330 | ) | |||||||
| (2,290 | ) | (5,140 | ) | ||||||||
| Automatic conversions: | |||||||||||
| Class A | 3 | 2 | |||||||||
| Class B | (3 | ) | (2 | ) | |||||||
| – | – | ||||||||||
| Net increase (decrease) in shares outstanding: | |||||||||||
| Class A | (849 | ) | (1,436 | ) | |||||||
| Class B | (763 | ) | (1,875 | ) | |||||||
| Class C | (465 | ) | (1,025 | ) | |||||||
| Class I | 840 | – | |||||||||
| (1,237 | ) | (4,336 | ) | ||||||||
The notes to the financial statements are an integral part of this report.
Transamerica IDEX Mutual Funds
Semi-Annual Report 2006
6
TA IDEX Great Companies–AmericaSM
FINANCIAL HIGHLIGHTS
(unaudited for the period ended April 30, 2006)
| For a share of beneficial interest outstanding throughout each period | |||||||||||||||||||||||||||||||||||||||
| Net Asset | Investment Operations | Distributions | Net Asset | ||||||||||||||||||||||||||||||||||||
| For the Period Ended (d)(g) | Value, Beginning of Period | Net Investment Income (Loss) | Net Realized and Unrealized Gain (Loss) | Total Operations | From Net Investment Income | From Net Realized Gains | Total Distributions | Value, End of Period | |||||||||||||||||||||||||||||||
| Class A | 4/30/2006 | $ | 9.37 | $ | (0.01 | ) | $ | 0.65 | $ | 0.64 | $ | – | $ | – | $ | – | $ | 10.01 | |||||||||||||||||||||
| 10/31/2005 | 8.85 | (0.01 | ) | 0.53 | 0.52 | – | – | – | 9.37 | ||||||||||||||||||||||||||||||
| 10/31/2004 | 8.77 | – | (h) | 0.08 | 0.08 | – | – | – | 8.85 | ||||||||||||||||||||||||||||||
| 10/31/2003 | 7.65 | – | (h) | 1.12 | 1.12 | – | – | – | 8.77 | ||||||||||||||||||||||||||||||
| 10/31/2002 | 8.96 | (0.01 | ) | (1.30 | ) | (1.31 | ) | – | – | – | 7.65 | ||||||||||||||||||||||||||||
| 10/31/2001 | 10.58 | (0.02 | ) | (1.60 | ) | (1.62 | ) | – | – | – | 8.96 | ||||||||||||||||||||||||||||
| Class B | 4/30/2006 | 9.04 | (0.04 | ) | 0.62 | 0.58 | – | – | – | 9.62 | |||||||||||||||||||||||||||||
| 10/31/2005 | 8.60 | (0.07 | ) | 0.51 | 0.44 | – | – | – | 9.04 | ||||||||||||||||||||||||||||||
| 10/31/2004 | 8.57 | (0.06 | ) | 0.09 | 0.03 | – | – | – | 8.60 | ||||||||||||||||||||||||||||||
| 10/31/2003 | 7.52 | (0.05 | ) | 1.10 | 1.05 | – | – | – | 8.57 | ||||||||||||||||||||||||||||||
| 10/31/2002 | 8.87 | (0.08 | ) | (1.27 | ) | (1.35 | ) | – | – | – | 7.52 | ||||||||||||||||||||||||||||
| 10/31/2001 | 10.56 | (0.08 | ) | (1.61 | ) | (1.69 | ) | – | – | – | 8.87 | ||||||||||||||||||||||||||||
| Class C | 4/30/2006 | 9.04 | (0.04 | ) | 0.62 | 0.58 | – | – | – | 9.62 | |||||||||||||||||||||||||||||
| 10/31/2005 | 8.59 | (0.07 | ) | 0.52 | 0.45 | – | – | – | 9.04 | ||||||||||||||||||||||||||||||
| 10/31/2004 | 8.57 | (0.06 | ) | 0.08 | 0.02 | – | – | – | 8.59 | ||||||||||||||||||||||||||||||
| 10/31/2003 | 7.51 | (0.05 | ) | 1.11 | 1.06 | – | – | – | 8.57 | ||||||||||||||||||||||||||||||
| Class I | 4/30/2006 | 9.82 | 0.01 | 0.20 | 0.21 | – | – | – | 10.03 | ||||||||||||||||||||||||||||||
| Ratios/Supplemental Data | |||||||||||||||||||||||||||||||
| For the Period | Total | Net Assets, End of Period | Ratio of Expenses to Average Net Assets (a) | Net Investment Income (Loss) to Average | Portfolio Turnover | ||||||||||||||||||||||||||
| Ended (g) | Return (c) | (000's) | Net (e) | Total (f) | Net Assets (a) | Rate (b) | |||||||||||||||||||||||||
| Class A | 4/30/2006 | 6.83 | % | $ | 26,937 | 1.51 | % | 1.59 | % | (0.26 | )% | 65 | % | ||||||||||||||||||
| 10/31/2005 | 5.86 | 33,170 | 1.53 | 1.59 | (0.13 | ) | 100 | ||||||||||||||||||||||||
| 10/31/2004 | 0.93 | 44,056 | 1.55 | 1.55 | – | 23 | |||||||||||||||||||||||||
| 10/31/2003 | 14.64 | 49,040 | 1.55 | 1.66 | 0.05 | 54 | |||||||||||||||||||||||||
| 10/31/2002 | (14.59 | ) | 55,508 | 1.55 | 1.66 | (0.16 | ) | 28 | |||||||||||||||||||||||
| 10/31/2001 | (15.35 | ) | 38,345 | 1.55 | 1.78 | (0.18 | ) | 65 | |||||||||||||||||||||||
| Class B | 4/30/2006 | 6.42 | 35,571 | 2.16 | 2.27 | (0.91 | ) | 65 | |||||||||||||||||||||||
| 10/31/2005 | 5.12 | 40,313 | 2.18 | 2.26 | (0.79 | ) | 100 | ||||||||||||||||||||||||
| 10/31/2004 | 0.35 | 54,460 | 2.17 | 2.17 | (0.62 | ) | 23 | ||||||||||||||||||||||||
| 10/31/2003 | 13.96 | 62,205 | 2.20 | 2.31 | (0.60 | ) | 54 | ||||||||||||||||||||||||
| 10/31/2002 | (15.26 | ) | 53,256 | 2.20 | 2.31 | (0.81 | ) | 28 | |||||||||||||||||||||||
| 10/31/2001 | (15.98 | ) | 40,769 | 2.20 | 2.43 | (0.83 | ) | 65 | |||||||||||||||||||||||
| Class C | 4/30/2006 | 6.42 | 15,559 | 2.16 | 2.21 | (0.91 | ) | 65 | |||||||||||||||||||||||
| 10/31/2005 | 5.24 | 18,810 | 2.18 | 2.24 | (0.79 | ) | 100 | ||||||||||||||||||||||||
| 10/31/2004 | 0.23 | 26,700 | 2.20 | 2.26 | (0.64 | ) | 23 | ||||||||||||||||||||||||
| 10/31/2003 | 14.11 | 4,474 | 2.20 | 2.31 | (0.60 | ) | 54 | ||||||||||||||||||||||||
| Class I | 4/30/2006 | 2.14 | 8,425 | 0.90 | 0.90 | 0.25 | 65 | ||||||||||||||||||||||||
The notes to the financial statements are an integral part of this report.
Transamerica IDEX Mutual Funds
Semi-Annual Report 2006
7
TA IDEX Great Companies–AmericaSM
FINANCIAL HIGHLIGHTS (continued)
(unaudited)
NOTES TO FINANCIAL HIGHLIGHTS
(a) Annualized.
(b) Not annualized.
(c) Total Return has been calculated for the applicable period without deduction of a sales load, if any, on an initial purchase. Not annualized.
(d) Per share information is calculated based on average number of shares outstanding.
(e) Ratio of Net Expenses to Average Net Assets is net of fee waivers and reimbursements by the investment adviser, if any (see note 2).
(f) Ratio of Total Expenses to Average Net Assets includes all expenses before fee waivers and reimbursements by the investment adviser.
(g) The inception dates for the Fund's offering of share classes were as follows:
Class C was November 11, 2002.
Class I was November 15, 2005 (see note 1).
(h) Rounds to less than $(0.01).
The notes to the financial statements are an integral part of this report.
Transamerica IDEX Mutual Funds
Semi-Annual Report 2006
8
TA IDEX Great Companies–AmericaSM
NOTES TO FINANCIAL STATEMENTS
At April 30, 2006
(all amounts in thousands)
(unaudited)
NOTE 1. ORGANIZATION AND SIGNIFICANT ACCOUNTING POLICIES
Transamerica IDEX Mutual Funds is an open-end management investment company registered under the Investment Company Act of 1940, as amended (the "1940 Act"). TA IDEX Great Companies – AmericaSM (the "Fund") is "non-diversified" under the 1940 Act.
In the normal course of business, the Fund enters into contracts that contain a variety of representations that provide general indemnifications. The Fund's maximum exposure under these arrangements is unknown, as this would involve future claims that may be made against the Fund and/or its affiliates that have not yet occurred. However, based on experience, the Fund expects the risk of loss to be remote.
This report should be read in conjunction with the current Fund prospectus, which contains more complete information about the Fund.
In preparing the Fund's financial statements in accordance with accounting principles generally accepted in the United States of America ("GAAP"), estimates or assumptions (which could differ from actual results) may be used that affect reported amounts and disclosures. The following is a summary of significant accounting policies followed by the Fund.
Multiple class operations, income and expenses: The Fund currently offers four classes of shares, Class A, Class B, Class C and Class I, each with a public offering price that reflects different sales charges, if any, and expense levels. Class I shares were offered for investment on November 15, 2005, and investment activity began on December 6, 2005. Class I is only available for investment to certain affiliated asset allocation funds. Class B shares will convert to Class A shares eight years after purchase. Income, non-class specific expenses and realized and unrealized gains and losses, are allocated daily to each class, based upon the value of shares outstanding method as permitted under Rule 18f-3 of the 1940 Act. Each class bears its own specific expenses as well as a portion of general, common expenses.
Security valuations: The Fund values its investments at the close of the New York Stock Exchange ("NYSE"), normally 4 p.m. ET, each day the NYSE is open for business. Fund investments are valued at the last sale price or closing price on the day of valuation taken from the primary exchange where the security is principally traded.
Securities traded in the over-the-counter market and listed securities for which no sale was reported on that date are valued at the last quoted bid price.
Debt securities are valued based on a price quotation or other equivalent indication of value supplied by an exchange, a pricing service or a major market maker; however, those that mature in sixty days or less are valued at amortized cost, which approximates market.
Investment company securities are valued at the net asset value of the underlying portfolio.
Other securities for which quotations are not readily available or whose values have been determined to be unreliable are valued at fair market value as determined in good faith by the Fund's Administrative Valuation Committee, under the supervision of the Board's Valuation Committee, using guidelines adopted by the Board of Trustees.
Cash: The Fund may leave cash overnight in its cash account with the custodian, Investors Bank & Trust Company ("IBT"). IBT has been contracted on behalf of the Fund to invest the excess cash into a savings account, which at April 30, 2006, was paying an interest rate of 3.24%.
Repurchase agreements: The Fund is authorized to enter into repurchase agreements. The Fund, through its custodian, IBT, receives delivery of the underlying securities, the value of which at the time of purchase is required to be an amount equal to at least 100% of the resale price. The Fund will bear the risk of value fluctuations until the security can be sold and may encounter delays and incur costs in liquidating the security. In the event of bankruptcy or insolvency of the seller, delays and costs may be incurred.
Commission recapture: The sub-adviser, to the extent consistent with the best execution and usual commission rate policies and practices, may place security transactions of the Fund with broker/dealers with which Transamerica IDEX Mutual Funds has established a Commission Recapture Program. A Commission Recapture Program is any arrangement under which a broker/dealer applies a portion of the commissions received by such broker/dealer on the security transactions to the Fund. In no event will commissions paid by the Fund be used to pay expenses that would otherwise be borne by any other funds within Transamerica IDEX Mutual Funds, or by any other party.
Recaptured commissions during the six months ended April 30, 2006, of $29 are included in net realized gains in the Statement of Operations
Securities lending: The Fund may lend securities to qualified borrowers, with IBT acting as the Fund's lending agent. The Fund earns negotiated lenders' fees. The Fund receives cash and/or securities as collateral against the loaned securities. Cash collateral received is invested in short term, interest bearing securities. The Fund monitors the market value of securities loaned on a daily basis and requires collateral in an amount at least equal to the value of the securities loaned. Income from loaned securities on the Statement of Operations is net of fees, in the amount of $1, earned by IBT for its services.
Security transactions and investment income: Security transactions are recorded on the trade date. Security gains and losses are calculated on the specific identification basis. Dividend income, if any, is recorded
Transamerica IDEX Mutual Funds
Semi-Annual Report 2006
9
TA IDEX Great Companies–AmericaSM
NOTES TO FINANCIAL STATEMENTS (continued)
At April 30, 2006
(all amounts in thousands)
(unaudited)
NOTE 1.–(continued)
on the ex-dividend date or, in the case of foreign securities, as soon as the Fund is informed of the ex-dividend date. Interest income, including accretion of discounts and amortization of premiums, is recorded on the accrual basis commencing on the settlement date.
Redemption fees: A short-term trading redemption fee may be assessed on any Fund shares in a fund account that are sold during the first five (5) NYSE trading days following their purchase date. This redemption fee will equal 2% of the amount redeemed and shares held the longest will be treated as being redeemed first and shares held the shortest as being redeemed last. For the six months ended April 30, 2006, the Fund received less than $1 in redemption fees.
Dividend distributions: Distributions to shareholders are recorded on the ex-dividend date and are determined in accordance with Federal income tax regulations which may differ from GAAP.
NOTE 2. RELATED PARTY TRANSACTIONS
Transamerica Fund Advisors, Inc. ("TFAI") is the Fund's investment adviser. Transamerica Fund Services, Inc. ("TFS") is the Fund's administrator and transfer agent. AFSG Securities Corp. ("AFSG") is the Fund's distributor/principal underwriter. TFAI, TFS, and AFSG are affiliates of AEGON, NV, a Netherlands corporation.
Great Companies, L.L.C. is both an affiliate of the Fund and a sub-adviser to the Fund.
Certain officers and trustees of the Fund are also officers and/or directors of TFAI, TFS and AFSG.
Investment advisory fees: The Fund pays management fees to TFAI based on average daily net assets ("ANA") at the following breakpoints:
From November 1, 2005 to December 31, 2005:
0.775% of the first $250 million of ANA
0.75% of the next $250 million of ANA
0.70% of the next $500 million of ANA
0.65% of ANA over $1 billion
From January 1, 2006 on:
0.75% of the first $500 million of ANA
0.70% of the next $500 million of ANA
0.65% of ANA over $1 billion
TFAI has contractually agreed to waive its advisory fee and will reimburse the Fund to the extent that operating expenses, excluding 12b-1 fees, exceed the following stated annual limit:
From November 1, 2005 to December 31, 2005:
1.17% Expense Limit
From January 1, 2006 on:
1.15% Expense Limit
If total Fund expenses fall below the annual expense limitation agreement agreed to by the adviser within the succeeding three years, the Fund may be required to pay the adviser a portion or all of the waived advisory fees.
| Advisory Fee Waived | Available for Recapture Through | ||||||||||
| Fiscal Year 2003 | $ | 148 | 10/31/2006 | ||||||||
If total Fund expenses fall below the annual expense limitation agreement agreed to by the adviser within the succeeding three years, the Fund may be required to pay the adviser a portion or all of the reimbursed class expenses.
| Reimbursement of Class Expenses | Available for Recapture Through | ||||||||||
| Fiscal Year 2005: | |||||||||||
| Class A | $ | 25 | 10/31/2008 | ||||||||
| Class B | 40 | 10/31/2008 | |||||||||
| Class C | 14 | 10/31/2008 | |||||||||
| Fiscal Year 2004: | |||||||||||
| Class A | 2 | 10/31/2007 | |||||||||
| Class C | 7 | 10/31/2007 | |||||||||
Distribution and service fees: The Fund has a 12b-1 distribution plan under the 1940 Act pursuant to which an annual fee, based on average daily net assets, is paid to the distributor for various disbursements such as broker-dealer account servicing fees and other promotional expenses of the Fund. The Fund is authorized under the 12b-1 plan to pay fees on each class up to the following limits:
| Class A | 0.35 | % | |||||
| Class B | 1.00 | % | |||||
| Class C | 1.00 | % | |||||
| Class I | N/A | ||||||
In the case the Fund or a class of shares of the Fund is closed to new investors or investments, the Fund is authorized to pay 12b-1 fees for past sales and distribution efforts and present and past investor services.
Underwriter commissions relate to front-end sales charges imposed for Class A shares and contingent deferred sales charges
Transamerica IDEX Mutual Funds
Semi-Annual Report 2006
10
TA IDEX Great Companies–AmericaSM
NOTES TO FINANCIAL STATEMENTS (continued)
At April 30, 2006
(all amounts in thousands)
(unaudited)
NOTE 2.–(continued)
from Classes B, C, and certain A share redemptions. For the six months ended April 30, 2006, the underwriter commissions were as follows:
| Received by Underwriter | $ | 24 | |||||
| Retained by Underwriter | 4 | ||||||
| Contingent Deferred Sales Charge | 82 | ||||||
Administrative services: The Fund has entered into an agreement with TFS for financial and legal fund administration services. The Fund pays TFS an annual fee of 0.02% of ANA. The Legal fees on the Statement of Operations are fees paid to external legal counsel.
Transfer agent fees: The Fund pays TFS an annual per-account charge for each open and closed account. The Fund paid TFS $143 for the six months ended April 30, 2006.
Deferred compensation plan: Each eligible independent Fund Trustee may elect to participate in a non-qualified deferred compensation plan maintained by Transamerica IDEX Mutual Funds (the "Plan"). Under the Plan, such Trustees may defer payment of all or a portion of their total fees earned as a Fund Trustee. Each Trustee who is a participant in the Plan may elect that the earnings, losses or gains credited to his or her deferred fee amounts be determined based on a deemed investment in any series of Transamerica IDEX Mutual Funds, including the Fund. The right of a participant to receive a distribution from the Plan of the deferred fees is an unsecured claim against the general assets of all series of Transamerica IDEX Mutual Funds. The pro rata liability to the Fund of all deferred fees in the Plan amounted, as of April 30, 2006, to $8.
NOTE 3. INVESTMENT TRANSACTIONS
The cost of securities purchased and proceeds from securities sold (excluding short-term securities) for the six months ended April 30, 2006 were as follows:
| Purchases of securities: | |||||||
| Long-Term | $ | 57,493 | |||||
| U.S. Government | – | ||||||
| Proceeds from maturities and sales of securities: | |||||||
| Long-Term | 68,148 | ||||||
| U.S. Government | – | ||||||
NOTE 4. FEDERAL INCOME TAX MATTERS
The Fund has not made any provision for federal income or excise taxes due to its policy to distribute all of its taxable income and capital gains to its shareholders and otherwise qualify as a regulated investment company under Subchapter M of the Internal Revenue
Code. Income and capital gain distributions are determined in accordance with income tax regulations, which may differ from GAAP. These differences are primarily due to differing treatment for items including, but not limited to, wash sales, net operating losses and capital loss carryforwards.
The capital loss carryforwards are available to offset future realized capital gains through the periods listed:
| Capital Loss Carryforwards | Available through | ||||||
| $ | 1,301 | October 31, 2010 | |||||
| 10,217 | October 31, 2011 | ||||||
NOTE 5. REGULATORY PROCEEDINGS
There continues to be significant federal and state regulatory activity relating to financial services companies, particularly mutual fund companies and their investment advisers. As part of an ongoing investigation regarding potential market timing, recordkeeping and trading compliance issues and matters affecting the Fund's investment adviser, TFAI, and certain affiliates and former employees of TFAI, the SEC staff has indicated that it is likely to take some action against TFAI and certain of its affiliates at the conclusion of the investigation. The potential timing and the scope of any such action is difficult to predict. Although the impact of any action brought against TFAI and/or its affiliates is difficult to assess at the present time, the Fund currently believes that the likelihood that any such action will have a material adverse impact on it is remote. It is important to note that the Fund is not aware of any allega tion of wrongdoing against it and its Board at the time this semi-annual report is printed. Although it is not anticipated that these developments will have an adverse impact on the Fund, there can be no assurance at this time. TFAI and its affiliates are actively working with the SEC in regard to this matter; however, the exact resolution cannot be determined at this time. TFAI will take such actions that it deems necessary or appropriate to continue providing management services to the Fund and to bring all matters to an appropriate conclusion.
TFAI and/or its affiliates, and not the Fund, will bear the costs regarding these regulatory matters.
Transamerica IDEX Mutual Funds
Semi-Annual Report 2006
11
TA IDEX Great Companies–AmericaSM
INVESTMENT ADVISORY AND SUB-ADVISORY AGREEMENTS – REVIEW AND RENEWAL (unaudited)
At a meeting of the Board of Trustees of Transamerica IDEX Mutual Funds ("TA IDEX") held on November 2, 2005, the Board reviewed and considered the Investment Advisory Agreement between TA IDEX Great Companies - AmericaSM (the "Fund") and Transamerica Fund Advisors, Inc. ("TFAI"), as well as the Investment Sub-Advisory Agreement of the Fund between TFAI and Great Companies, LLC (the "Sub-Adviser"), to determine whether the agreements should be renewed for a one-year period. Following their review and consideration, the Trustees determined that the Investment Advisory Agreement and the Investment Sub-Advisory Agreement will enable shareholders of the Fund to obtain high quality services at a cost that is appropriate, reasonable, and in the best interests of its shareholders. The Board, including the independent members of the Board, unanimously approved the renewal of the Investment Advisory Agreement and the Investment Sub-Advis ory Agreement. In reaching their decision, the Trustees requested and obtained from TFAI and the Sub-Adviser such information as they deemed reasonably necessary to evaluate the proposed agreements. The Trustees also carefully considered the information that they had received throughout the year from TFAI and the Sub-Adviser (such as in-person presentations by the Sub-Adviser) as part of their regular oversight of the Fund, as well as: comparative fee, expense and performance information prepared by Lipper Inc. ("Lipper"), independent providers of mutual fund performance, fee and expense information, and profitability data. In considering the proposed continuation of the Investment Advisory Agreement and Investment Sub-Advisory Agreement, the Trustees evaluated a number of considerations that they believed, in light of the legal advice furnished to them by TA IDEX counsel and independent legal counsel and their own business judgment, to be relevant. They based their decisions on the following considerations, among others, although they did not identify any consideration or particular information that was controlling of their decisions:
The nature, extent and quality of the advisory service to be provided. The Board considered the nature and quality of the services provided by TFAI and the Sub-Adviser to the Fund in the past, as well as the services anticipated to be provided in the future. The Board concluded that TFAI and the Sub-Adviser are capable of providing high quality services to the Fund, as indicated by the nature and quality of services provided in the past, TFAI's and the Sub-Adviser's management capabilities demonstrated with respect to the Fund, and the experience, capability and integrity of TFAI's senior management, the financial resources of TFAI and the Sub-Adviser, TFAI's management oversight process, and the professional qualifications and experience of the Sub-Adviser's portfolio management team. The Trustees also concluded that TFAI and the Sub-Adviser proposed to provide investment and related services that were of the same quality and quantity as services provided to the Fund in the past, and that these services are appropriate in scope and extent in light of the Fund's operations, the competitive landscape of the investment company business and investor needs, and that TFAI's and the Sub-Adviser's obligations will remain substantially the same.
The investment performance of the Fund. The Board examined both the short-term and longer-term performance of the Fund, including relative performance against a benchmark securities index and a peer group of comparable mutual funds as prepared by Lipper for various trailing periods ended June 30, 2005. The Board expressed concerns about the Fund's performance, but noted that the Fund's new pricing will result in lower management and sub-advisory fees, which could contribute to improving performance. The Board undertook to closely monitor the Fund's performance or asked that TFAI work with the Sub-Adviser to take steps to improve performance. On the basis of the Trustees' assessment of the nature, extent and quality of advisory services to be provided or procured by TFAI and the Sub-Adviser, the Trustees concluded that TFAI and the Sub-Adviser are capa ble of generating a level of investment performance that is appropriate in light of the Fund's investment objective, policies and strategies and competitive with many other investment companies, and also determined that TFAI's and the Sub-Adviser's continued management is likely to benefit the Fund and its shareholders.
The cost of advisory services provided and the level of profitability. The Board reviewed profitability information regarding TFAI's costs of procuring portfolio management services, as well as the costs of provision of administration, transfer agency, fund accounting and other services, to the Fund and to TA IDEX as a whole by TFAI and its affiliates. The Trustees reviewed data from Lipper that compared the Fund's new pricing schedule (including management fees at various asset levels), other fees and expenses (including total expenses including and excluding 12b-1 distribution and service fees) and portfolio turnover rate against peer groups of comparable mutual funds. The Board favorably noted the Fund's new pricing, which results in lower management and sub-advisory fees to the benefit of the Fund and its shareholders. Based on such information, t he Trustees determined that the management fees and overall expense ratio of the Fund generally are consistent with industry averages. In addition, on the basis of the Board's review of the management fees to be charged by TFAI for investment advisory and related services, TFAI profitability information (derived from TFAI's audited financial statements), TFAI's estimated management income resulting from its management of the Fund, the estimated margin of the Sub-Adviser, as well as the entirety of TFAI's and its affiliates' service relationship with TA IDEX, the Board concluded that the level of investment management fees and other service fees, as well as TFAI's and the Sub-Adviser's profitability, are appropriate in light of the
Transamerica IDEX Mutual Funds
Semi-Annual Report 2006
12
TA IDEX Great Companies–AmericaSM (continued)
services provided, the management fees and overall expense ratios of comparable investment companies and the anticipated profitability of the relationship between the Fund, TFAI and its affiliates, and the Sub-Adviser.
Whether fee levels reflect economies of scale and the extent to which economies of scale would be realized as the Fund grows. The Board concluded that the inclusion of asset-based breakpoints in the Fund's advisory fee schedule appropriately benefits investors by realizing economies of scale in the form of lower management fees as the level of assets grows. In addition, the Board concluded that the Fund's management fees appropriately reflect the Fund's current size, the current economic environment for TFAI, the competitive nature of the investment company market, and TFAI's pricing strategy. The Trustees also concluded that they will have the opportunity to periodically reexamine whether the Fund has achieved economies of scale, and the appropriateness of management fees payable to TFAI and fees payable by TFAI to the Sub-Adviser, in the future.
Benefits (such as soft dollars) to TFAI, its affiliates, or the Sub-Adviser from their relationship with the Fund. The Board concluded that other benefits derived by TFAI, its affiliates, and the Sub-Adviser from their relationship with the Fund, including "soft dollar" benefits (if any) in connection with brokerage transactions, sales charges and distribution/service fees (to the extent applicable) are reasonable and fair, and are consistent with industry practice and the best interests of the Fund and its shareholders. In this regard, the Board noted that TFAI does not realize "soft dollar" benefits from its relationship with the Fund, and that the Sub-Adviser is participating in a brokerage program pursuant to which a portion of brokerage commissions paid by the Fund is recaptured for the benefit of the Fund and its shareholders, thus limiting the amount of "soft-dollar" arrangements the Sub-Adviser may engage in with respect to the Fund's brokerage transactions. In addition, the Trustees determined that the administration, transfer agency, fund accounting and other fees paid by the Fund to affiliates of TFAI are reasonable, fair and in the best interests of shareholders in light of the nature and quality of the services provided, the associated costs to these affiliates of providing the services, the impact of the costs of such services on the Fund's overall operating expenses, and the necessity of the services for the Fund's operations.
Other considerations. The Board also determined that TFAI had made a substantial commitment to the recruitment and retention of high quality personnel, and maintained the financial, compliance and operational resources reasonably necessary to manage the Fund in a professional manner that is consistent with the best interests of the Fund and its shareholders. In this regard, the Trustees favorably considered the procedures and policies in place by TFAI to enforce compliance with applicable laws and regulations and oversee the portfolio management activities of the Sub-Adviser. The Trustees also determined that TFAI had made a significant entrepreneurial commitment to the management and success of the Fund, reflected by TFAI's expense limitation and fee waiver arrangement with the Fund, which may result in TFAI waiving advisory fees for the benefit of s hareholders.
Transamerica IDEX Mutual Funds
Semi-Annual Report 2006
13
TA IDEX Great Companies–TechnologySM
UNDERSTANDING YOUR FUND'S EXPENSES
(unaudited)
SHAREHOLDER EXPENSES
Fund shareholders may incur two types of costs: (1) transaction costs, including sales charges (loads) on purchases, contingent deferred sales charges on redemptions and redemption fees; and (2) ongoing costs, including management fees, 12b-1 distribution and service fees, and other fund expenses.
The following Example is intended to help you understand your ongoing costs (in dollars and cents) of investing in the Fund and to compare these costs with the ongoing costs of investing in other funds.
The Example is based on an investment of $1,000 invested at November 1, 2005 and held for the entire period until April 30, 2006.
ACTUAL EXPENSES
The first line in the table below provides information about actual account values and actual expenses. You may use the information in this line, together with the amount you invested, to estimate the expenses that you paid over the period. Simply divide your account value by $1,000 (for example, an $8,600 account value divided by $1,000 = 8.6), then multiply the result by the number in the first line of your Fund under the heading entitled "Expenses Paid During Period" to estimate the expenses you paid on your account during this period. If your account is an IRA, your expenses could have included a $15 annual fee. The amount of any fee paid through your account would increase the estimate of expenses you paid during the period and decrease your ending account value.
HYPOTHETICAL EXAMPLE FOR COMPARISON PURPOSES
The second line in the table below provides information about hypothetical account values and hypothetical expenses based on the Fund's actual expense ratio and an assumed rate of return of 5% per year before expenses, which is not the Fund's actual return. The hypothetical account values and expenses may not be used to estimate the actual ending account balance or expenses you paid for the period. You may use this information to compare the ongoing costs of investing in your Fund and other funds. To do so, compare this 5% hypothetical example with the 5% hypothetical examples that appear in the shareholder reports of the other funds. As in the case of the actual expense example, if your account is subject to an IRA fee, the amount of the fee paid through your account would increase the hypothetical expenses you would have paid during the period and decrease the hypothetical ending account value.
Please note that the expenses shown in the table are meant to highlight your ongoing costs only and do not reflect any transactional costs, such as sales charges, redemption fees, brokerage commissions paid on purchases and sales of fund shares. Therefore, the second line under the Fund in the table is useful in comparing ongoing costs only, and will not help you determine the relative total costs of owning different funds. If any of these transaction costs were included, your costs would be higher. The expenses shown in the table do not reflect any fees that may be charged to you by brokers, financial intermediaries or other financial institutions.
| Beginning Account Value | Ending Account Value | Annualized Expense Ratio | Expenses Paid During Period (a) | ||||||||||||||||
| Class A | |||||||||||||||||||
| Actual | $ | 1,000.00 | $ | 1,093.60 | 1.50 | % | $ | 7.79 | |||||||||||
| Hypothetical (b) | 1,000.00 | 1,017.36 | 1.50 | 7.50 | |||||||||||||||
| Class B | |||||||||||||||||||
| Actual | 1,000.00 | 1,091.70 | 2.19 | 11.36 | |||||||||||||||
| Hypothetical (b) | 1,000.00 | 1,013.93 | 2.19 | 10.94 | |||||||||||||||
| Class C | |||||||||||||||||||
| Actual | 1,000.00 | 1,091.90 | 2.19 | 11.36 | |||||||||||||||
| Hypothetical (b) | 1,000.00 | 1,013.93 | 2.19 | 10.94 | |||||||||||||||
| Class I | |||||||||||||||||||
| Actual | 1,000.00 | 1,054.70 | 0.91 | 4.25 | |||||||||||||||
| Hypothetical (b) | 1,000.00 | 1,018.60 | 0.91 | 4.18 | |||||||||||||||
(a) Expenses are calculated using the Fund's annualized expense ratio (as disclosed in the table), multiplied by the average account value for the period, multiplied by number of days in the period (181 days for Classes A, B and C, and 166 days for Class I), and divided by the number of days in the year (365 days).
(b) 5% return per year before expenses.
GRAPHICAL PRESENTATION OF SCHEDULE OF INVESTMENTS
By Industry
At April 30, 2006
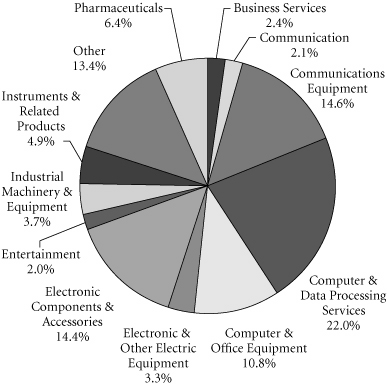
This chart shows the percentage breakdown by industry of the Fund's total investment securities.
Transamerica IDEX Mutual Funds
Semi-Annual Report 2006
1
TA IDEX Great Companies–TechnologySM
SCHEDULE OF INVESTMENTS
At April 30, 2006
(all amounts except share amounts in thousands)
(unaudited)
| Shares | Value | ||||||||||
| COMMON STOCKS (94.5%) | |||||||||||
| Business Services (2.6%) | |||||||||||
| Akamai Technologies, Inc. ‡† | 59,000 | $ | 1,988 | ||||||||
| Communication (2.3%) | |||||||||||
| American Tower Corp.-Class A ‡ | 50,000 | 1,707 | |||||||||
| Communications Equipment (15.9%) | |||||||||||
| Andrew Corp. ‡ | 133,000 | 1,407 | |||||||||
| Corning, Inc. ‡ | 117,000 | 3,233 | |||||||||
| Motorola, Inc. | 69,000 | 1,473 | |||||||||
| Network Appliance, Inc. ‡ | 45,000 | 1,668 | |||||||||
| Nokia Corp., ADR | 75,000 | 1,700 | |||||||||
| QUALCOMM, Inc. | 49,250 | 2,528 | |||||||||
| Computer & Data Processing Services (24.0%) | |||||||||||
| Adobe Systems, Inc. ‡ | 40,000 | 1,568 | |||||||||
| Autodesk, Inc. ‡ | 35,000 | 1,471 | |||||||||
| Cerner Corp. ‡† | 25,000 | 991 | |||||||||
| Electronic Arts, Inc. ‡ | 28,000 | 1,590 | |||||||||
| F5 Networks, Inc. ‡† | 25,000 | 1,464 | |||||||||
| Juniper Networks, Inc. ‡ | 86,000 | 1,589 | |||||||||
| Microsoft Corp. | 144,700 | 3,495 | |||||||||
| NAVTEQ Corp. ‡† | 35,500 | 1,474 | |||||||||
| Sun Microsystems, Inc. ‡ | 310,000 | 1,550 | |||||||||
| Yahoo!, Inc. ‡ | 91,000 | 2,983 | |||||||||
| Computer & Office Equipment (11.8%) | |||||||||||
| Apple Computer, Inc. ‡ | 33,070 | 2,328 | |||||||||
| EMC Corp. ‡ | 132,600 | 1,791 | |||||||||
| Logitech International SA, ADR ‡† | 62,808 | 2,594 | |||||||||
| Nuance Communications, Inc. ‡ | 171,000 | 2,194 | |||||||||
| Electronic & Other Electric Equipment (3.6%) | |||||||||||
| Samsung Electronics Co., Ltd., GDR-144A | 8,000 | 2,728 | |||||||||
| Electronic Components & Accessories (15.7%) | |||||||||||
| Analog Devices, Inc. | 29,200 | 1,107 | |||||||||
| ATI Technologies, Inc. ‡ | 88,000 | 1,366 | |||||||||
| Broadcom Corp.-Class A ‡ | 48,000 | 1,973 | |||||||||
| Cypress Semiconductor Corp. ‡ | 85,000 | 1,459 | |||||||||
| Dolby Laboratories, Inc.-Class A ‡ | 36,000 | 847 | |||||||||
| Intel Corp. | 73,524 | 1,469 | |||||||||
| JDS Uniphase Corp. ‡ | 304,000 | 1,061 | |||||||||
| Linear Technology Corp. | 41,400 | 1,470 | |||||||||
| Trident Microsystems, Inc. ‡ | 43,000 | 1,144 | |||||||||
| Entertainment (2.2%) | |||||||||||
| International Game Technology | 43,900 | 1,665 | |||||||||
| Industrial Machinery & Equipment (4.0%) | |||||||||||
| Applied Materials, Inc. | 82,300 | 1,477 | |||||||||
| Lam Research Corp. ‡† | 32,000 | 1,564 | |||||||||
| Shares | Value | ||||||||||
| Instruments & Related Products (5.4%) | |||||||||||
| FLIR Systems, Inc. ‡† | 25,000 | $ | 611 | ||||||||
| Formfactor, Inc. ‡ | 40,000 | 1,668 | |||||||||
| Sirf Technology Holdings, Inc. ‡ | 52,000 | 1,776 | |||||||||
| Pharmaceuticals (7.0%) | |||||||||||
| Alkermes, Inc. ‡† | 45,700 | 981 | |||||||||
| Biogen Idec, Inc. ‡ | 16,000 | 718 | |||||||||
| Conor Medsystems, Inc. ‡ | 28,000 | 756 | |||||||||
| Genzyme Corp. ‡ | 32,600 | 1,994 | |||||||||
| Vertex Pharmaceuticals, Inc. ‡† | 22,700 | 826 | |||||||||
| Total Common Stocks (cost: $66,030) | 71,446 | ||||||||||
| Principal | Value | ||||||||||
| SECURITY LENDING COLLATERAL (14.6%) | |||||||||||
| Debt (13.7%) | |||||||||||
| Bank Notes (1.7%) | |||||||||||
| Bank of America | |||||||||||
| 4.81%, due 06/07/2006 * | $ | 363 | $ | 363 | |||||||
| 4.81%, due 08/10/2006 * | 350 | 350 | |||||||||
| Bear Stearns & Co. 5.01%, due 06/06/2006 * 5.01%, due 09/07/2006 * | 140 420 | 140 420 | |||||||||
| Certificates Of Deposit (0.9%) | |||||||||||
| Halifax Bank of Scotland 4.78%, due 06/06/2006 * | 350 | 350 | |||||||||
| Rabobank Nederland 4.87%, due 05/31/2006 * | 350 | 350 | |||||||||
| Commercial Paper (0.7%) | |||||||||||
| Banco Santander Central Hispano SA 4.77%, due 05/02/2006 | 210 | 210 | |||||||||
| Sheffield Receivables Corp.-144A 4.81%, due 05/03/2006 | 350 | 350 | |||||||||
| Euro Dollar Overnight (2.5%) | |||||||||||
| Bank of Montreal 4.77%, due 05/02/2006 | 280 | 280 | |||||||||
| Dexia Group 4.78%, due 05/04/2006 | 350 | 350 | |||||||||
| Fortis Bank 4.77%, due 05/01/2006 | 140 | 140 | |||||||||
| Royal Bank of Canada 4.77%, due 05/01/2006 | 490 | 490 | |||||||||
| Royal Bank of Scotland 4.75%, due 05/03/2006 | 350 | 350 | |||||||||
| Svenska Handlesbanken 4.82%, due 05/01/2006 | 267 | 267 | |||||||||
The notes to the financial statements are an integral part of this report.
Transamerica IDEX Mutual Funds
Semi-Annual Report 2006
2
TA IDEX Great Companies–TechnologySM
SCHEDULE OF INVESTMENTS (continued)
At April 30, 2006
(all amounts except share amounts in thousands)
(unaudited)
| Principal | Value | ||||||||||
| Euro Dollar Terms (3.8%) | |||||||||||
| BancoBilbao Vizcaya Argentaria SA 4.95%, due 06/20/2006 | $ | 280 | $ | 280 | |||||||
| Bank of the West 4.94%, due 06/16/2006 | 280 | 280 | |||||||||
| Barclays 4.79%, due 05/10/2006 420 420 4.77%, due 05/16/2006 | 140 | 140 | |||||||||
| Canadian Imperial Bank of Commerce 4.97%, due 06/23/2006 | 210 | 210 | |||||||||
| Credit Suisse First Boston Corp. 4.73%, due 05/08/2006 | 210 | 210 | |||||||||
| Fortis Bank 4.83%, due 05/08/2006 | 140 | 140 | |||||||||
| Lloyds TSB Bank 4.81%, due 05/11/2006 | 210 | 210 | |||||||||
| Royal Bank of Scotland 4.87%, due 05/12/2006 | 280 | 280 | |||||||||
| Societe Generale 4.79%, due 05/10/2006 | 350 | 350 | |||||||||
| UBS AG 4.95%, due 06/20/2006 | 350 | 350 | |||||||||
| Principal | Value | ||||||||||
| Repurchase Agreements (4.1%) †† | |||||||||||
| Credit Suisse First Boston Corp. 4.92%, dated 04/28/2006 to be repurchased at $475 on 05/01/2006 | $ | 475 | $ | 475 | |||||||
| Goldman Sachs Group, Inc. (The) 4.92%, dated 04/28/2006 to be repurchased at $1,029 on 05/01/2006 | 1,028 | 1,028 | |||||||||
| Lehman Brothers, Inc. 4.92%, dated 04/28/2006 to be repurchased at $17 on 05/01/2006 | 17 | 17 | |||||||||
| Merrill Lynch & Co. 4.87%, dated 04/28/2006 to be repurchased at $1,050 on 05/01/2006 | 1,050 | 1,050 | |||||||||
| Morgan Stanley Dean Witter & Co. 4.93%, dated 04/28/2006 to be repurchased at $490 on 05/01/2006 | 490 | 490 | |||||||||
| Shares | Value | ||||||||||
| Investment Companies (0.9%) | |||||||||||
| Barclays Global Investors Institutional Money Market Fund 1-day yield of 4.78% | 559,990 | $ | 560 | ||||||||
| Merrimac Cash Fund, Premium Class 1-day yield of 4.61% @ | 148,994 | 149 | |||||||||
| Total Security Lending Collateral (cost: $11,049) | 11,049 | ||||||||||
| Total Investment Securities (cost: $77,079) # | $ | 82,495 | |||||||||
NOTES TO SCHEDULE OF INVESTMENTS:
‡ Non-income producing.
† At April 30, 2006, all or a portion of this security is on loan (see Note 1). The value at April 30, 2006, of all securities on loan is $10,698.
* Floating or variable rate note. Rate is listed as of April 30, 2006.
†† Cash collateral for the Repurchase Agreements, valued at $3,151, that serve as collateral for securities lending are invested in corporate bonds with interest rates and maturity dates ranging from 0.00% - 9.05% and 05/02/2006 - 12/31/2049, respectively.
@ Regulated investment company advised by Investors Bank and Trust Co. ("IBT"). IBT is also the accounting, custody and lending agent for the Fund.
# Aggregate cost for Federal income tax purposes is $77,077. Aggregate gross unrealized appreciation for all securities in which there is an excess of value over tax cost and aggregate gross unrealized depreciation for all securities in which there is an excess of tax cost over value were $7,628 and $2,210, respectively. Net unrealized appreciation for tax purposes is $5,418.
DEFINITIONS:
144A 144A Securities are registered pursuant to Rule 144A of the Securities Act of 1933. These securities are deemed to be liquid for purposes of compliance limitations on holdings of illiquid securities and may be resold as transactions exempt from registration, normally to qualified institutional buyers. At April 30, 2006, these securities aggregated $3,078 or 4.1% of the net assets of the Fund.
ADR American Depositary Receipt
GDR Global Depositary Receipt
The notes to the financial statements are an integral part of this report.
Transamerica IDEX Mutual Funds
Semi-Annual Report 2006
3
TA IDEX Great Companies–TechnologySM
STATEMENT OF ASSETS AND LIABILITIES
At April 30, 2006
(all amounts except per share amounts in thousands)
(unaudited)
| Assets: | |||||||
| Investment securities, at value (cost: $77,079) (including securities loaned of $10,698) | $ | 82,495 | |||||
| Cash | 4,221 | ||||||
| Receivables: | |||||||
| Shares of beneficial interest sold | 3 | ||||||
| Interest | 14 | ||||||
| Dividends | 6 | ||||||
| Other | 3 | ||||||
| 86,742 | |||||||
| Liabilities: | |||||||
| Accounts payable and accrued liabilities: Shares of beneficial interest redeemed | 20 | ||||||
| Management and advisory fees | 46 | ||||||
| Distribution and service fees | 9 | ||||||
| Transfer agent fees | 13 | ||||||
| Administration fees | 1 | ||||||
| Payable for collateral for securities on loan | 11,049 | ||||||
| Other | 18 | ||||||
| 11,156 | |||||||
| Net Assets | $ | 75,586 | |||||
| Net Assets Consist of: | |||||||
| Shares of beneficial interest, unlimited shares authorized, no par value | $ | 67,168 | |||||
| Distributable net investment income (loss) | (181 | ) | |||||
| Accumulated net realized gain (loss) from investment securities | 3,183 | ||||||
| Net unrealized appreciation (depreciation) on investment securities | 5,416 | ||||||
| Net Assets | $ | 75,586 | |||||
| Net Assets by Class: | |||||||
| Class A | $ | 7,031 | |||||
| Class B | 5,093 | ||||||
| Class C | 2,826 | ||||||
| Class I | 60,636 | ||||||
| Shares Outstanding: | |||||||
| Class A | 1,705 | ||||||
| Class B | 1,287 | ||||||
| Class C | 715 | ||||||
| Class I | 14,664 | ||||||
| Net Asset Value Per Share: | |||||||
| Class A | $ | 4.12 | |||||
| Class B | 3.96 | ||||||
| Class C | 3.95 | ||||||
| Class I | 4.14 | ||||||
| Maximum Offering Price Per Share (a): | |||||||
| Class A | $ | 4.36 | |||||
(a) Includes the maximum selling commission (represented as a percentage of offering price) which is reduced on certain levels of sales as set forth in the Prospectus. Net asset value per share for Classes B, C and I shares represents offering price. The redemption price for Classes B and C shares equals net asset value less any applicable contingent deferred sales charge.
STATEMENT OF OPERATIONS
For the period ended April 30, 2006 (b)
(all amounts in thousands)
(unaudited)
| Investment Income: | |||||||
| Dividends (net of withholding taxes on foreign dividends of $8) | $ | 171 | |||||
| Interest | 73 | ||||||
| Income from loaned securities–net | 10 | ||||||
| 254 | |||||||
| Expenses: | |||||||
| Management and advisory fees | 300 | ||||||
| Distribution and service fees: | |||||||
| Class A | 22 | ||||||
| Class B | 27 | ||||||
| Class C | 14 | ||||||
| Class I | – | (c) | |||||
| Transfer agent fees: | |||||||
| Class A | 21 | ||||||
| Class B | 18 | ||||||
| Class C | 7 | ||||||
| Printing and shareholder reports | 6 | ||||||
| Custody fees | 5 | ||||||
| Administration fees | 7 | ||||||
| Legal fees | 2 | ||||||
| Audit fees | 9 | ||||||
| Trustees fees | 1 | ||||||
| Registration fees | 17 | ||||||
| Other | 1 | ||||||
| Total expenses | 457 | ||||||
| Less: | |||||||
| Reimbursement of class expenses: | |||||||
| Class A | (6 | ) | |||||
| Class B | (11 | ) | |||||
| Class C | (3 | ) | |||||
| Total reimbursed expenses | (20 | ) | |||||
| Net expenses | 437 | ||||||
| Net Investment Income (Loss) | (183 | ) | |||||
| Net Realized and Unrealized Gain (Loss) | |||||||
| Realized gain (loss) from investment securities | 3,183 | ||||||
| Increase (decrease) in unrealized appreciation (depreciation) on investment securities | 4,060 | ||||||
| Net Realized and Unrealized Gain (Loss) on Investment Securities | 7,243 | ||||||
| Net Increase (Decrease) in Net Assets Resulting from Operations | $ | 7,060 | |||||
(b) Class I was offered for investment on November 15, 2005.
(c) Rounds to less than $1.
The notes to the financial statements are an integral part of this report.
Transamerica IDEX Mutual Funds
Semi-Annual Report 2006
4
TA IDEX Great Companies–TechnologySM
STATEMENTS OF CHANGES IN NET ASSETS
For the period or year ended
(all amounts in thousands)
| April 30, 2006 (unaudited) (a) | October 31, 2005 | ||||||||||
| Increase (Decrease) in Net Assets From: | |||||||||||
| Operations: | |||||||||||
| Net investment income (loss) | $ | (183 | ) | $ | 452 | ||||||
| Net realized gain (loss) from investment securities | 3,183 | 10,268 | |||||||||
| Change in unrealized appreciation (depreciation) on investment securities | 4,060 | (9,975 | ) | ||||||||
| 7,060 | 745 | ||||||||||
| Distributions to Shareholders: | |||||||||||
| From net investment income: | |||||||||||
| Class A | – | (455 | ) | ||||||||
| – | (455 | ) | |||||||||
| From net realized gains: | |||||||||||
| Class A | (105 | ) | – | ||||||||
| Class B | (81 | ) | – | ||||||||
| Class C | (42 | ) | – | ||||||||
| Class I | (839 | ) | – | ||||||||
| (1,067 | ) | – | |||||||||
| Capital Share Transactions: | |||||||||||
| Proceeds from shares sold: | |||||||||||
| Class A | 346 | 898 | |||||||||
| Class B | 255 | 371 | |||||||||
| Class C | 173 | 357 | |||||||||
| Class I | 60,735 | – | |||||||||
| 61,509 | 1,626 | ||||||||||
| Dividends and distributions reinvested: | |||||||||||
| Class A | 103 | 454 | |||||||||
| Class B | 76 | – | |||||||||
| Class C | 37 | – | |||||||||
| Class I | 839 | – | |||||||||
| 1,055 | 454 | ||||||||||
| Cost of shares redeemed: | |||||||||||
| Class A | (61,903 | ) | (56,227 | ) | |||||||
| Class B | (957 | ) | (1,906 | ) | |||||||
| Class C | (371 | ) | (1,667 | ) | |||||||
| Class I | (3,258 | ) | – | ||||||||
| (66,489 | ) | (59,800 | ) | ||||||||
| Automatic conversions: | |||||||||||
| Class A | 1 | 17 | |||||||||
| Class B | (1 | ) | (17 | ) | |||||||
| – | – | ||||||||||
| (3,925 | ) | (57,720 | ) | ||||||||
| Net increase (decrease) in net assets | 2,068 | (57,430 | ) | ||||||||
| Net Assets: | |||||||||||
| Beginning of period | 73,518 | 130,948 | |||||||||
| End of period | $ | 75,586 | $ | 73,518 | |||||||
| Distributable Net Investment Income (Loss) | $ | (181 | ) | $ | 2 | ||||||
| April 30, 2006 (unaudited) (a) | October 31, 2005 | ||||||||||
| Share Activity: | |||||||||||
| Shares issued: | |||||||||||
| Class A | 84 | 233 | |||||||||
| Class B | 65 | 101 | |||||||||
| Class C | 44 | 97 | |||||||||
| Class I | 15,252 | – | |||||||||
| 15,445 | 431 | ||||||||||
| Shares issued–reinvested from distributions: | |||||||||||
| Class A | 25 | 120 | |||||||||
| Class B | 19 | – | |||||||||
| Class C | 9 | – | |||||||||
| Class I | 206 | – | |||||||||
| 259 | 120 | ||||||||||
| Shares redeemed: | |||||||||||
| Class A | (15,535 | ) | (14,766 | ) | |||||||
| Class B | (242 | ) | (522 | ) | |||||||
| Class C | (94 | ) | (456 | ) | |||||||
| Class I | (794 | ) | – | ||||||||
| (16,665 | ) | (15,744 | ) | ||||||||
| Automatic conversions: | |||||||||||
| Class A | – | 5 | |||||||||
| Class B | – | (5 | ) | ||||||||
| – | – | ||||||||||
| Net increase (decrease) in shares outstanding: | |||||||||||
| Class A | (15,426 | ) | (14,408 | ) | |||||||
| Class B | (158 | ) | (426 | ) | |||||||
| Class C | (41 | ) | (359 | ) | |||||||
| Class I | 14,664 | – | |||||||||
| (961 | ) | (15,193 | ) | ||||||||
(a) Class I was offered for investment on November 15, 2005.
The notes to the financial statements are an integral part of this report.
Transamerica IDEX Mutual Funds
Semi-Annual Report 2006
5
TA IDEX Great Companies–TechnologySM
FINANCIAL HIGHLIGHTS
(unaudited for the period ended April 30, 2006)
| For a share of beneficial interest outstanding throughout each period | |||||||||||||||||||||||||||||||||||||||
| Net Asset | Investment Operations | Distributions | Net Asset | ||||||||||||||||||||||||||||||||||||
| For the Period Ended (d)(g) | Value, Beginning of Period | Net Investment Income (Loss) | Net Realized and Unrealized Gain (Loss) | Total Operations | From Net Investment Income | From Net Realized Gains | Total Distributions | Value, End of Period | |||||||||||||||||||||||||||||||
| Class A | 4/30/2006 | $ | 3.82 | $ | (0.01 | ) | $ | 0.37 | $ | 0.36 | $ | – | $ | (0.06 | ) | $ | (0.06 | ) | $ | 4.12 | |||||||||||||||||||
| 10/31/2005 | 3.80 | 0.03 | 0.02 | 0.05 | (0.03 | ) | – | (0.03 | ) | 3.82 | |||||||||||||||||||||||||||||
| 10/31/2004 | 3.61 | (0.04 | ) | 0.23 | 0.19 | – | – | – | 3.80 | ||||||||||||||||||||||||||||||
| 10/31/2003 | 2.56 | (0.04 | ) | 1.09 | 1.05 | – | – | – | 3.61 | ||||||||||||||||||||||||||||||
| 10/31/2002 | 3.63 | (0.05 | ) | (1.02 | ) | (1.07 | ) | – | – | – | 2.56 | ||||||||||||||||||||||||||||
| 10/31/2001 | 7.93 | (0.06 | ) | (4.24 | ) | (4.30 | ) | – | – | – | 3.63 | ||||||||||||||||||||||||||||
| Class B | 4/30/2006 | 3.68 | (0.03 | ) | 0.37 | 0.34 | – | (0.06 | ) | (0.06 | ) | 3.96 | |||||||||||||||||||||||||||
| 10/31/2005 | 3.68 | (0.02 | ) | 0.02 | – | – | – | – | 3.68 | ||||||||||||||||||||||||||||||
| 10/31/2004 | 3.51 | (0.06 | ) | 0.23 | 0.17 | – | – | – | 3.68 | ||||||||||||||||||||||||||||||
| 10/31/2003 | 2.50 | (0.06 | ) | 1.07 | 1.01 | – | – | – | 3.51 | ||||||||||||||||||||||||||||||
| 10/31/2002 | 3.58 | (0.08 | ) | (1.00 | ) | (1.08 | ) | – | – | – | 2.50 | ||||||||||||||||||||||||||||
| 10/31/2001 | 7.91 | (0.10 | ) | (4.23 | ) | (4.33 | ) | – | – | – | 3.58 | ||||||||||||||||||||||||||||
| Class C | 4/30/2006 | 3.67 | (0.03 | ) | 0.37 | 0.34 | – | (0.06 | ) | (0.06 | ) | 3.95 | |||||||||||||||||||||||||||
| 10/31/2005 | 3.67 | (0.02 | ) | 0.02 | – | – | – | – | 3.67 | ||||||||||||||||||||||||||||||
| 10/31/2004 | 3.51 | (0.07 | ) | 0.23 | 0.16 | – | – | – | 3.67 | ||||||||||||||||||||||||||||||
| 10/31/2003 | 2.45 | (0.06 | ) | 1.12 | 1.06 | – | – | – | 3.51 | ||||||||||||||||||||||||||||||
| Class I | 4/30/2006 | 3.98 | (0.01 | ) | 0.23 | 0.22 | – | (0.06 | ) | (0.06 | ) | 4.14 | |||||||||||||||||||||||||||
| Ratios/Supplemental Data | |||||||||||||||||||||||||||||||
| For the Period | Total | Net Assets, End of Period | Ratio of Expenses to Average Net Assets (a) | Net Investment Income (Loss) to Average | Portfolio Turnover | ||||||||||||||||||||||||||
| Ended (g) | Return (c) | (000's) | Net (e) | Total (f) | Net Assets (a) | Rate (b) | |||||||||||||||||||||||||
| Class A | 4/30/2006 | 9.36 | % | $ | 7,031 | 1.50 | % | 1.61 | % | (0.56 | )% | 61 | % | ||||||||||||||||||
| 10/31/2005 | 1.23 | 65,423 | 1.32 | 1.32 | 0.63 | 73 | |||||||||||||||||||||||||
| 10/31/2004 | 5.26 | 119,985 | 1.36 | 1.36 | (1.12 | ) | 41 | ||||||||||||||||||||||||
| 10/31/2003 | 41.02 | 78,289 | 1.55 | 1.90 | (1.23 | ) | 24 | ||||||||||||||||||||||||
| 10/31/2002 | (29.45 | ) | 6,445 | 1.55 | 2.61 | (1.40 | ) | 64 | |||||||||||||||||||||||
| 10/31/2001 | (54.26 | ) | 7,106 | 1.55 | 2.68 | (1.04 | ) | 58 | |||||||||||||||||||||||
| Class B | 4/30/2006 | 9.17 | 5,093 | 2.19 | 2.59 | (1.52 | ) | 61 | |||||||||||||||||||||||
| 10/31/2005 | 0.00 | 5,316 | 2.20 | 2.68 | (0.58 | ) | 73 | ||||||||||||||||||||||||
| 10/31/2004 | 4.84 | 6,874 | 1.91 | 1.91 | (1.68 | ) | 41 | ||||||||||||||||||||||||
| 10/31/2003 | 40.40 | 7,864 | 2.20 | 2.55 | (1.88 | ) | 24 | ||||||||||||||||||||||||
| 10/31/2002 | (30.12 | ) | 4,348 | 2.20 | 3.26 | (2.05 | ) | 64 | |||||||||||||||||||||||
| 10/31/2001 | (54.80 | ) | 5,938 | 2.20 | 3.33 | (1.69 | ) | 58 | |||||||||||||||||||||||
| Class C | 4/30/2006 | 9.19 | 2,826 | 2.19 | 2.38 | (1.52 | ) | 61 | |||||||||||||||||||||||
| 10/31/2005 | 0.00 | 2,779 | 2.20 | 2.65 | (0.51 | ) | 73 | ||||||||||||||||||||||||
| 10/31/2004 | 4.56 | 4,089 | 2.20 | 2.60 | (1.94 | ) | 41 | ||||||||||||||||||||||||
| 10/31/2003 | 43.27 | 739 | 2.20 | 2.55 | (1.88 | ) | 24 | ||||||||||||||||||||||||
| Class I | 4/30/2006 | 5.47 | 60,636 | 0.91 | 0.91 | (0.31 | ) | 61 | |||||||||||||||||||||||
The notes to the financial statements are an integral part of this report.
Transamerica IDEX Mutual Funds
Semi-Annual Report 2006
6
TA IDEX Great Companies–TechnologySM
FINANCIAL HIGHLIGHTS (continued)
(unaudited)
NOTES TO FINANCIAL HIGHLIGHTS
(a) Annualized.
(b) Not annualized.
(c) Total Return has been calculated for the applicable periods without deduction of a sales load, if any, on an initial purchase. Not annualized.
(d) Per share information is calculated based on average number of shares outstanding.
(e) Ratio of Net Expenses to Average Net Assets is net of fee waivers and reimbursements by the investment adviser, if any (see note 2).
(f) Ratio of Total Expenses to Average Net Assets includes all expenses before fee waivers and reimbursements by the investment adviser.
(g) The inception dates for the Fund's offering of share classes were as follows:
Class C was November 11, 2002.
Class I was November 15, 2005.
The notes to the financial statements are an integral part of this report.
Transamerica IDEX Mutual Funds
Semi-Annual Report 2006
7
TA IDEX Great Companies–TechnologySM
NOTES TO FINANCIAL STATEMENTS
At April 30, 2006
(all amounts in thousands)
(unaudited)
NOTE 1. ORGANIZATION AND SIGNIFICANT ACCOUNTING POLICIES
Transamerica IDEX Mutual Funds is an open-end management investment company registered under the Investment Company Act of 1940, as amended (the "1940 Act"). The TA IDEX Great Companies–
TechnologySM (the "Fund") is "non-diversified" under the 1940 Act.
In the normal course of business, the Fund enters into contracts that contain a variety of representations that provide general indemnifications. The Fund's maximum exposure under these arrangements is unknown, as this would involve future claims that may be made against the Fund and/or its affiliates that have not yet occurred. However, based on experience, the Fund expects the risk of loss to be remote.
This report should be read in conjunction with the current Fund prospectus, which contains more complete information about the Fund.
In preparing the Fund's financial statements in accordance with accounting principles generally accepted in the United States of America ("GAAP"), estimates or assumptions (which could differ from actual results) may be used that affect reported amounts and disclosures. The following is a summary of significant accounting policies followed by the Fund.
Multiple class operations, income and expenses: The Fund currently offers four classes of shares, Class A, Class B, Class C and Class I, each with a public offering price that reflects different sales charges, if any, and expense levels. Class I shares commenced operations on November 15, 2005. Class I is only available for investment to certain affiliated asset allocation funds. Class B shares will convert to Class A shares eight years after purchase. Income, non-class specific expenses and realized and unrealized gains and losses, are allocated daily to each class, based upon the value of shares outstanding method as permitted under Rule 18f-3 of the 1940 Act. Each class bears its own specific expenses as well as a portion of general, common expenses.
Security valuations: The Fund values its investments at the close of the New York Stock Exchange ("NYSE"), normally 4 p.m. ET, each day the NYSE is open for business. Fund investments are valued at the last sale price or closing price on the day of valuation taken from the primary exchange where the security is principally traded.
Securities traded in the over-the-counter market and listed securities for which no sale was reported on that date are valued at the last quoted bid price.
Debt securities are valued based on a price quotation or other equivalent indication of value supplied by an exchange, a pricing service or a major market maker; however, those that mature in sixty days or less are valued at amortized cost, which approximates market.
Investment company securities are valued at the net asset value of the underlying portfolio.
Other securities for which quotations are not readily available or whose values have been determined to be unreliable are valued at fair market value as determined in good faith by the Fund's Administrative Valuation Committee, under the supervision of the Board's Valuation Committee, using guidelines adopted by the Board of Trustees.
Cash: The Fund may leave cash overnight in its cash account with the custodian, Investors Bank & Trust Company ("IBT"). IBT has been contracted on behalf of the Fund to invest the excess cash into a savings account, which at April 30, 2006, was paying an interest rate of 3.24%.
Repurchase agreements: The Fund is authorized to enter into repurchase agreements. The Fund, through its custodian, IBT, receives delivery of the underlying securities, the value of which at the time of purchase is required to be an amount equal to at least 100% of the resale price. The Fund will bear the risk of value fluctuations until the security can be sold and may encounter delays and incur costs in liquidating the security. In the event of bankruptcy or insolvency of the seller, delays and costs may be incurred.
Commission recapture: The sub-adviser, to the extent consistent with the best execution and usual commission rate policies and practices, may place security transactions of the Fund with broker/dealers with which Transamerica IDEX Mutual Funds has established a Commission Recapture Program. A Commission Recapture Program is any arrangement under which a broker/dealer applies a portion of the commissions received by such broker/dealer on the security transactions to the Fund. In no event will commissions paid by the Fund be used to pay expenses that would otherwise be borne by any other funds within Transamerica IDEX Mutual Funds, or by any other party.
Recaptured commissions during the six months ended April 30, 2006, of $21 are included in net realized gains in the Statement of Operations.
Securities lending: The Fund may lend securities to qualified borrowers, with IBT acting as the Fund's lending agent. The Fund earns negotiated lenders' fees. The Fund receives cash and/or securities as collateral against the loaned securities. Cash collateral received is invested in short term, interest bearing securities. The Fund monitors the market value of securities loaned on a daily basis and requires collateral in an amount at least equal to the value of the securities loaned. Income from loaned securities on the Statement of Operations is net of fees, in the amount of $4, earned by IBT for its services.
Transamerica IDEX Mutual Funds
Semi-Annual Report 2006
8
TA IDEX Great Companies–TechnologySM
NOTES TO FINANCIAL STATEMENTS (continued)
At April 30, 2006
(all amounts in thousands)
(unaudited)
NOTE 1.–(continued)
Security transactions and investment income: Security transactions are recorded on the trade date. Security gains and losses are calculated on the specific identification basis. Dividend income, if any, is recorded on the ex-dividend date or, in the case of foreign securities, as soon as the Fund is informed of the ex-dividend date. Interest income, including accretion of discounts and amortization of premiums, is recorded on the accrual basis commencing on the settlement date.
Redemption fees: A short-term trading redemption fee may be assessed on any Fund shares in a fund account that are sold during the first five (5) NYSE trading days following their purchase date. This redemption fee will equal 2% of the amount redeemed and shares held the longest will be treated as being redeemed first and shares held the shortest as being redeemed last. For the six months ended April 30, 2006, the Fund received less than $1 in redemption fees.
Dividend distributions: Distributions to shareholders are recorded on the ex-dividend date and are determined in accordance with Federal income tax regulations which may differ from GAAP.
NOTE 2. RELATED PARTY TRANSACTIONS
Transamerica Fund Advisors, Inc. ("TFAI") is the Fund's investment adviser. Transamerica Fund Services, Inc. ("TFS") is the Fund's administrator and transfer agent. AFSG Securities Corp. ("AFSG") is the Fund's distributor/principal underwriter. TFAI, TFS, and AFSG are affiliates of AEGON, NV, a Netherlands corporation.
Great Companies, L.L.C. is both an affiliate of the Fund and a sub-adviser to the Fund.
Certain officers and trustees of the Fund are also officers and/or directors of TFAI, TFS and AFSG.
The following schedule reflects the percentage of Fund assets owned by affiliated investment companies at April 30, 2006:
| Net Assets | % of Net Assets | ||||||||||
| TA IDEX Asset Allocation – Growth Portfolio | $ | 16,324 | 21.60 | % | |||||||
| TA IDEX Asset Allocation – Moderate Portfolio | 12,657 | 16.75 | % | ||||||||
| TA IDEX Asset Allocation – Moderate Growth Portfolio | 31,726 | 41.97 | % | ||||||||
| Total | $ | 60,707 | 80.32 | % | |||||||
Investment advisory fees: The Fund pays management fees to TFAI based on average daily net assets ("ANA") at the following breakpoints:
From November 1, 2005 to December 31, 2005:
0.80% of the first $500 million of ANA
0.70% of ANA over $500 million
From January 1, 2006:
0.78% of the first $500 million of ANA
0.70% of ANA over $500 million
TFAI has contractually agreed to waive its advisory fee and will reimburse the Fund to the extent that operating expenses, excluding 12b-1 fees, exceed the following stated annual limit:
From November 1, 2005 to December 31, 2005:
1.20% Expense Limit
From January 1, 2006 on:
1.18% Expense Limit
If total Fund expenses fall below the annual expense limitation agreement agreed to by the adviser within the succeeding three years, the Fund may be required to pay the adviser a portion or all of the waived advisory fees.
| Advisory Fee Waived | Available for Recapture Through | ||||||||||
| Fiscal Year 2003 | $ | 138 | 10/31/2006 | ||||||||
If total Fund expenses fall below the annual expense limitation agreement agreed to by the adviser within the succeeding three years, the Fund may be required to pay the adviser a portion or all of the reimbursed class expenses.
| Reimbursement of Class Expenses | Available for Recapture Through | ||||||||||
| Fiscal Year 2005 Class B | $ | 30 | 10/31/2008 | ||||||||
| Class C | 15 | 10/31/2008 | |||||||||
| Fiscal Year 2004 Class C | 7 | 10/31/2007 | |||||||||
Distribution and service fees: The Fund has a 12b-1 distribution plan under the 1940 Act pursuant to which an annual fee, based on average daily net assets, is paid to the distributor for various disbursements such as broker-dealer account servicing fees and other promotional expenses of the Fund. The Fund is authorized under the 12b-1 plan to pay fees on each class up to the following limits:
| Class A | 0.35 | % | |||||
| Class B | 1.00 | % | |||||
| Class C | 1.00 | % | |||||
| Class I | N/A | ||||||
Transamerica IDEX Mutual Funds
Semi-Annual Report 2006
9
TA IDEX Great Companies–TechnologySM
NOTES TO FINANCIAL STATEMENTS (continued)
At April 30, 2006
(all amounts in thousands)
(unaudited)
NOTE 2.–(continued)
In the case the Fund or a class of shares of the Fund is closed to new investors or investments, the Fund is authorized to pay 12b-1 fees for past sales and distribution efforts and present and past investor services.
Underwriter commissions relate to front-end sales charges imposed for Class A shares and contingent deferred sales charges from Classes B, C, and certain A share redemptions. For the six months ended April 30, 2006, the underwriter commissions were as follows:
| Received by Underwriter | $ | 8 | |||||
| Retained by Underwriter | 1 | ||||||
| Contingent Deferred Sales Charge | 8 | ||||||
Administrative services: The Fund has entered into an agreement with TFS for financial and legal fund administration services. The Fund pays TFS an annual fee of 0.02% of ANA. The Legal fees on the Statement of Operations are fees paid to external legal counsel.
Transfer agent fees: The Fund pays TFS an annual per-account charge for each open and closed account. The Fund paid TFS $43 for the six months ended April 30, 2006.
Deferred compensation plan: Each eligible independent Fund Trustee may elect to participate in a non-qualified deferred compensation plan maintained by Transamerica IDEX Mutual Funds (the "Plan"). Under the Plan, such Trustees may defer payment of all or a portion of their total fees earned as a Fund Trustee. Each Trustee who is a participant in the Plan may elect that the earnings, losses or gains credited to his or her deferred fee amounts be determined based on a deemed investment in any series of Transamerica IDEX Mutual Funds, including the Fund. The right of a participant to receive a distribution from the Plan of the deferred fees is an unsecured claim against the general assets of all series of Transamerica IDEX Mutual Funds. The pro rata liability to the Fund of all deferred fees in the Plan amounted, as of April 30, 2006, to $3.
NOTE 3. INVESTMENT TRANSACTIONS
The cost of securities purchased and proceeds from securities sold (excluding short-term securities) for the six months ended April 30, 2006 were as follows:
| Purchases of securities: | |||||||
| Long-Term | $ | 43,260 | |||||
| U.S. Government | – | ||||||
| Proceeds from maturities and sales of securities: | |||||||
| Long-Term | 48,301 | ||||||
| U.S. Government | – | ||||||
NOTE 4. FEDERAL INCOME TAX MATTERS
The Fund has not made any provision for federal income or excise taxes due to its policy to distribute all of its taxable income and capital gains to its shareholders and otherwise qualify as a regulated investment company under Subchapter M of the Internal Revenue Code. Income and capital gain distributions are determined in accordance with income tax regulations, which may differ from GAAP. These differences are primarily due to differing treatment for items including, but not limited to, net operating losses, distribution reclasses and return of capital from underlying investments.
NOTE 5. REGULATORY PROCEEDINGS
There continues to be significant federal and state regulatory activity relating to financial services companies, particularly mutual fund companies and their investment advisers. As part of an ongoing investigation regarding potential market timing, recordkeeping and trading compliance issues and matters affecting the Fund's investment adviser, TFAI, and certain affiliates and former employees of TFAI, the SEC staff has indicated that it is likely to take some action against TFAI and certain of its affiliates at the conclusion of the investigation. The potential timing and the scope of any such action is difficult to predict. Although the impact of any action brought against TFAI and/or its affiliates is difficult to assess at the present time, the Fund currently believes that the likelihood that any such action will have a material adverse impact on it is remote. It is important to note that the Fund is not aware of any allega tion of wrongdoing against it and its Board at the time this semi-annual report is printed. Although it is not anticipated that these developments will have an adverse impact on the Fund, there can be no assurance at this time. TFAI and its affiliates are actively working with the SEC in regard to this matter; however, the exact resolution cannot be determined at this time. TFAI will take such actions that it deems necessary or appropriate to continue providing management services to the Fund and to bring all matters to an appropriate conclusion.
TFAI and/or its affiliates, and not the Fund, will bear the costs regarding these regulatory matters.
Transamerica IDEX Mutual Funds
Semi-Annual Report 2006
10
TA IDEX Great Companies–TechnologySM
INVESTMENT ADVISORY AND SUB-ADVISORY AGREEMENTS – REVIEW AND RENEWAL (unaudited)
At a meeting of the Board of Trustees of Transamerica IDEX Mutual Funds ("TA IDEX") held on November 2, 2005, the Board reviewed and considered the Investment Advisory Agreement between TA IDEX Great Companies - TechnologySM (the "Fund") and Transamerica Fund Advisors, Inc. ("TFAI"), as well as the Investment Sub-Advisory Agreement of the Fund between TFAI and Great Companies, LLC (the "Sub-Adviser"), to determine whether the agreements should be renewed for a one-year period. Following their review and consideration, the Trustees determined that the Investment Advisory Agreement and the Investment Sub-Advisory Agreement will enable shareholders of the Fund to obtain high quality services at a cost that is appropriate, reasonable, and in the best interests of its shareholders. The Board, including the independent members of the Board, unanimously approved the renewal of the Investment Advisory Agreement and the Investment Sub-Ad visory Agreement. In reaching their decision, the Trustees requested and obtained from TFAI and the Sub-Adviser such information as they deemed reasonably necessary to evaluate the proposed agreements. The Trustees also carefully considered the information that they had received throughout the year from TFAI and the Sub-Adviser (such as in-person presentations by the Sub-Adviser) as part of their regular oversight of the Fund, as well as: comparative fee, expense and performance information prepared by Lipper Inc. ("Lipper"), independent providers of mutual fund performance, fee and expense information, and profitability data. In considering the proposed continuation of the Investment Advisory Agreement and Investment Sub-Advisory Agreement, the Trustees evaluated a number of considerations that they believed, in light of the legal advice furnished to them by TA IDEX counsel and independent legal counsel and their own business judgment, to be relevant. They based their decisions on the following consideratio ns, among others, although they did not identify any consideration or particular information that was controlling of their decisions:
The nature, extent and quality of the advisory service to be provided. The Board considered the nature and quality of the services provided by TFAI and the Sub-Adviser to the Fund in the past, as well as the services anticipated to be provided in the future. The Board concluded that TFAI and the Sub-Adviser are capable of providing high quality services to the Fund, as indicated by the nature and quality of services provided in the past, TFAI's and the Sub-Adviser's management capabilities demonstrated with respect to the Fund, and the experience, capability and integrity of TFAI's senior management, the financial resources of TFAI and the Sub-Adviser, TFAI's management oversight process, and the professional qualifications and experience of the Sub-Adviser's portfolio management team. The Trustees also concluded that TFAI and the Sub-Adviser proposed to provide investment and related services that were of the same quality and quantity as services provided to the Fund in the past, and that these services are appropriate in scope and extent in light of the Fund's operations, the competitive landscape of the investment company business and investor needs, and that TFAI's and the Sub-Adviser's obligations will remain substantially the same.
The investment performance of the Fund. The Board examined both the short-term and longer-term performance of the Fund, including relative performance against a benchmark securities index and a peer group of comparable mutual funds as prepared by Lipper for various trailing periods ended June 30, 2005. The Board expressed concerns about the Fund's performance, but noted that the Fund's new pricing will result in lower management and sub-advisory fees, which could contribute to improving performance. The Board undertook to closely monitor the Fund's performance or asked that TFAI work with the Sub-Adviser to take steps to improve performance. On the basis of the Trustees' assessment of the nature, extent and quality of advisory services to be provided or procured by TFAI and the Sub-Adviser, the Trustees concluded that TFAI and the Sub-Adviser are capa ble of generating a level of investment performance that is appropriate in light of the Fund's investment objective, policies and strategies and competitive with many other investment companies, and also determined that TFAI's and the Sub-Adviser's continued management is likely to benefit the Fund and its shareholders.
The cost of advisory services provided and the level of profitability. The Board reviewed profitability information regarding TFAI's costs of procuring portfolio management services, as well as the costs of provision of administration, transfer agency, fund accounting and other services, to the Fund and to TA IDEX as a whole by TFAI and its affiliates. The Trustees reviewed data from Lipper that compared the Fund's new pricing schedule (including management fees at various asset levels), other fees and expenses (including total expenses including and excluding 12b-1 distribution and service fees) and portfolio turnover rate against peer groups of comparable mutual funds. The Board favorably noted the Fund's new pricing, which results in lower management and sub-advisory fees to the benefit of the Fund and its shareholders. Based on such information, t he Trustees determined that the management fees and overall expense ratio of the Fund generally are consistent with industry averages. In addition, on the basis of the Board's review of the management fees to be charged by TFAI for investment advisory and related services, TFAI profitability information (derived from TFAI's audited financial statements), TFAI's estimated management income resulting from its management of the Fund, the estimated margin of the Sub-Adviser, as well as the entirety of TFAI's and its affiliates' service relationship with TA IDEX, the Board concluded that the level of investment management fees and other service fees, as well as TFAI's and the Sub-Adviser's profitability, are appropriate in light of the services provided, the management fees and overall expense ratios of comparable investment companies and the anticipated profitability of the relationship between the Fund, TFAI and its affiliates, and the Sub-Adviser.
Transamerica IDEX Mutual Funds
Semi-Annual Report 2006
11
TA IDEX Great Companies–TechnologySM (continued)
Whether fee levels reflect economies of scale and the extent to which economies of scale would be realized as the Fund grows. The Board concluded that the inclusion of asset-based breakpoints in the Fund's advisory fee schedule appropriately benefits investors by realizing economies of scale in the form of lower management fees as the level of assets grows. In addition, the Board concluded that the Fund's management fees appropriately reflect the Fund's current size, the current economic environment for TFAI, the competitive nature of the investment company market, and TFAI's pricing strategy. The Trustees also concluded that they will have the opportunity to periodically reexamine whether the Fund has achieved economies of scale, and the appropriateness of management fees payable to TFAI and fees payable by TFAI to the Sub-Adviser, in the future.
Benefits (such as soft dollars) to TFAI, its affiliates, or the Sub-Adviser from their relationship with the Fund. The Board concluded that other benefits derived by TFAI, its affiliates, and the Sub-Adviser from their relationship with the Fund, including "soft dollar" benefits (if any) in connection with brokerage transactions, sales charges and distribution/service fees (to the extent applicable) are reasonable and fair, and are consistent with industry practice and the best interests of the Fund and its shareholders. In this regard, the Board noted that TFAI does not realize "soft dollar" benefits from its relationship with the Fund, and that the Sub-Adviser is participating in a brokerage program pursuant to which a portion of brokerage commissions paid by the Fund is recaptured for the benefit of the Fund and its shareholders, thus limiting the amount of "soft-dollar" arrangements the Sub-Adviser may engage in with respect to the Fund's brokerage transactions. In addition, the Trustees determined that the administration, transfer agency, fund accounting and other fees paid by the Fund to affiliates of TFAI are reasonable, fair and in the best interests of shareholders in light of the nature and quality of the services provided, the associated costs to these affiliates of providing the services, the impact of the costs of such services on the Fund's overall operating expenses, and the necessity of the services for the Fund's operations.
Other considerations. The Board also determined that TFAI had made a substantial commitment to the recruitment and retention of high quality personnel, and maintained the financial, compliance and operational resources reasonably necessary to manage the Fund in a professional manner that is consistent with the best interests of the Fund and its shareholders. In this regard, the Trustees favorably considered the procedures and policies in place by TFAI to enforce compliance with applicable laws and regulations and oversee the portfolio management activities of the Sub-Adviser. The Trustees also determined that TFAI had made a significant entrepreneurial commitment to the management and success of the Fund, reflected by TFAI's expense limitation and fee waiver arrangement with the Fund, which may result in TFAI waiving advisory fees for the benefit of s hareholders.
Transamerica IDEX Mutual Funds
Semi-Annual Report 2006
12
TA IDEX Janus Growth
UNDERSTANDING YOUR FUND'S EXPENSES
(unaudited)
SHAREHOLDER EXPENSES
Fund shareholders may incur two types of costs: (1) transaction costs, including sales charges (loads) on purchases, contingent deferred sales charges on redemptions and redemption fees; and (2) ongoing costs, including management fees, 12b-1 distribution and service fees, and other fund expenses.
The following Example is intended to help you understand your ongoing costs (in dollars and cents) of investing in the Fund and to compare these costs with the ongoing costs of investing in other funds.
The Example is based on an investment of $1,000 invested at November 1, 2005 and held for the entire period until April 30, 2006.
ACTUAL EXPENSES
The first line in the table below provides information about actual account values and actual expenses. You may use the information in this line, together with the amount you invested, to estimate the expenses that you paid over the period. Simply divide your account value by $1,000 (for example, an $8,600 account value divided by $1,000 = 8.6), then multiply the result by the number in the first line of your Fund under the heading entitled "Expenses Paid During Period" to estimate the expenses you paid on your account during this period. If your account is an IRA, your expenses could have included a $15 annual fee. The amount of any fee paid through your account would increase the estimate of expenses you paid during the period and decrease your ending account value.
HYPOTHETICAL EXAMPLE FOR COMPARISON PURPOSES
The second line in the table below provides information about hypothetical account values and hypothetical expenses based on the Fund's actual expense ratio and an assumed rate of return of 5% per year before expenses, which is not the Fund's actual return. The hypothetical account values and expenses may not be used to estimate the actual ending account balance or expenses you paid for the period. You may use this information to compare the ongoing costs of investing in your Fund and other funds. To do so, compare this 5% hypothetical example with the 5% hypothetical examples that appear in the shareholder reports of the other funds. As in the case of the actual expense example, if your account is subject to an IRA fee, the amount of the fee paid through your account would increase the hypothetical expenses you would have paid during the period and decrease the hypothetical ending account value.
Please note that the expenses shown in the table are meant to highlight your ongoing costs only and do not reflect any transactional costs, such as sales charges, redemption fees, brokerage commissions paid on purchases and sales of fund shares. Therefore, the second line under the Fund in the table is useful in comparing ongoing costs only, and will not help you determine the relative total costs of owning different funds. If any of these transaction costs were included, your costs would be higher. The expenses shown in the table do not reflect any fees that may be charged to you by brokers, financial intermediaries or other financial institutions.
| Beginning Account Value | Ending Account Value | Annualized Expense Ratio | Expenses Paid During Period (a) | ||||||||||||||||
| Class A | |||||||||||||||||||
| Actual | $ | 1,000.00 | $ | 1,050.30 | 1.49 | % | $ | 7.57 | |||||||||||
| Hypothetical (b) | 1,000.00 | 1,017.41 | 1.49 | 7.45 | |||||||||||||||
| Class B | |||||||||||||||||||
| Actual | 1,000.00 | 1,046.20 | 2.30 | 11.67 | |||||||||||||||
| Hypothetical (b) | 1,000.00 | 1,013.39 | 2.30 | 11.48 | |||||||||||||||
| Class C | |||||||||||||||||||
| Actual | 1,000.00 | 1,046.30 | 2.30 | 11.67 | |||||||||||||||
| Hypothetical (b) | 1,000.00 | 1,013.39 | 2.30 | 11.48 | |||||||||||||||
| Class I | |||||||||||||||||||
| Actual | 1,000.00 | 1,016.80 | 0.86 | 3.94 | |||||||||||||||
| Hypothetical (b) | 1,000.00 | 1,018.83 | 0.86 | 3.95 | |||||||||||||||
| Class T | |||||||||||||||||||
| Actual | 1,000.00 | 1,052.90 | 0.99 | 5.04 | |||||||||||||||
| Hypothetical (b) | 1,000.00 | 1,019.89 | 0.99 | 4.96 | |||||||||||||||
(a) Expenses are calculated using the Fund's annualized expense ratio (as disclosed in the table), multiplied by the average account value for the period, multiplied by number of days in the period (181 days for Classes A, B, C and T, and 166 days for Class I), and divided by the number of days in the year (365 days).
(b) 5% return per year before expenses.
GRAPHICAL PRESENTATION OF SCHEDULE OF INVESTMENTS
By Sector
At April 30, 2006
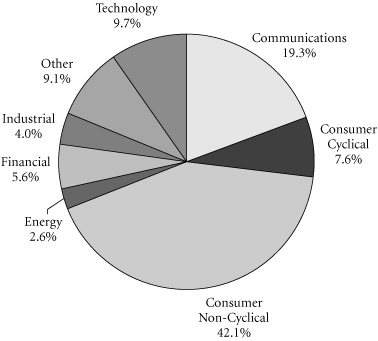
This chart shows the percentage breakdown by sector of the Fund's total investment securities.
Transamerica IDEX Mutual Funds
Semi-Annual Report 2006
1
TA IDEX Janus Growth
SCHEDULE OF INVESTMENTS
At April 30, 2006
(all amounts except share amounts in thousands)
(unaudited)
| Shares | Value | ||||||||||
| COMMON STOCKS (91.6%) | |||||||||||
| Amusement & Recreation Services (2.4%) | |||||||||||
| Harrah's Entertainment, Inc. | 309,960 | $ | 25,305 | ||||||||
| Business Services (6.5%) | |||||||||||
| Akamai Technologies, Inc. ‡† | 117,160 | 3,947 | |||||||||
| eBay, Inc. ‡ | 814,965 | 28,043 | |||||||||
| Fannie Mae | 238,905 | 12,089 | |||||||||
| Lamar Advertising Co. ‡ | 412,685 | 22,694 | |||||||||
| Chemicals & Allied Products (4.1%) | |||||||||||
| Procter & Gamble Co. | 348,125 | 20,264 | |||||||||
| Reckitt Benckiser PLC | 599,447 | 21,781 | |||||||||
| Communication (1.0%) | |||||||||||
| XM Satellite Radio Holdings, Inc.–Class A ‡† | 531,545 | 10,748 | |||||||||
| Communications Equipment (3.6%) | |||||||||||
| QUALCOMM, Inc. | 457,010 | 23,463 | |||||||||
| Research In Motion, Ltd. ‡† | 176,740 | 13,544 | |||||||||
| Computer & Data Processing Services (14.3%) | |||||||||||
| Amdocs, Ltd. ‡† | 600,355 | 22,333 | |||||||||
| Ceridian Corp. ‡ | 626,150 | 15,172 | |||||||||
| Google, Inc.–Class A ‡ | 58,450 | 24,429 | |||||||||
| NAVTEQ Corp. ‡ | 493,485 | 20,489 | |||||||||
| Yahoo!, Inc. ‡ | 2,006,435 | 65,771 | |||||||||
| Computer & Office Equipment (2.5%) | |||||||||||
| Apple Computer, Inc. ‡ | 175,965 | 12,386 | |||||||||
| EMC Corp. ‡ | 958,165 | 12,945 | |||||||||
| Electronic & Other Electric Equipment (3.0%) | |||||||||||
| General Electric Co. | 908,695 | 31,432 | |||||||||
| Electronic Components & Accessories (2.6%) | |||||||||||
| Advanced Micro Devices, Inc. ‡† | 822,680 | 26,614 | |||||||||
| Food Stores (1.4%) | |||||||||||
| Safeway, Inc. | 572,305 | 14,382 | |||||||||
| Health Services (2.3%) | |||||||||||
| Coventry Health Care, Inc. ‡ | 481,105 | 23,896 | |||||||||
| Holding & Other Investment Offices (0.2%) | |||||||||||
| Host Hotels & Resorts, Inc. REIT | 101,537 | 2,134 | |||||||||
| Hotels & Other Lodging Places (2.0%) | |||||||||||
| Starwood Hotels & Resorts Worldwide, Inc. | 358,530 | 20,572 | |||||||||
| Instruments & Related Products (1.5%) | |||||||||||
| Alcon, Inc. † | 155,365 | 15,802 | |||||||||
| Insurance (4.4%) | |||||||||||
| UnitedHealth Group, Inc. | 923,625 | 45,941 | |||||||||
| Shares | Value | ||||||||||
| Medical Instruments & Supplies (9.0%) | |||||||||||
| Medtronic, Inc. † | 614,085 | $ | 30,778 | ||||||||
| Synthes, Inc. † | 276,877 | 34,283 | |||||||||
| Varian Medical Systems, Inc. ‡ | 530,560 | 27,791 | |||||||||
| Oil & Gas Extraction (1.2%) | |||||||||||
| Apache Corp. | 83,975 | 5,966 | |||||||||
| Schlumberger, Ltd. † | 93,220 | 6,445 | |||||||||
| Personal Credit Institutions (1.3%) | |||||||||||
| SLM Corp. | 258,935 | 13,692 | |||||||||
| Petroleum Refining (1.4%) | |||||||||||
| Valero Energy Corp. | 231,005 | 14,955 | |||||||||
| Pharmaceuticals (18.2%) | |||||||||||
| Celgene Corp. ‡ | 1,817,840 | 76,640 | |||||||||
| Dade Behring Holdings, Inc. | 373,970 | 14,585 | |||||||||
| Genentech, Inc. ‡ | 130,110 | 10,371 | |||||||||
| Roche Holding AG–Genusschein | 362,798 | 55,627 | |||||||||
| Teva Pharmaceutical Industries, Ltd., ADR | 764,060 | 30,944 | |||||||||
| Retail Trade (3.2%) | |||||||||||
| Staples, Inc. | 1,249,432 | 32,998 | |||||||||
| Security & Commodity Brokers (3.0%) | |||||||||||
| Chicago Mercantile Exchange † | 44,570 | 20,413 | |||||||||
| Merrill Lynch & Co., Inc. | 133,260 | 10,162 | |||||||||
| Trucking & Warehousing (1.0%) | |||||||||||
| United Parcel Service, Inc.–Class B | 129,065 | 10,463 | |||||||||
| Wholesale Trade Nondurable Goods (1.5%) | |||||||||||
| SYSCO Corp. | 511,030 | 15,275 | |||||||||
| Total Common Stocks (cost: $719,371) | 947,564 | ||||||||||
| Principal | Value | ||||||||||
| SECURITY LENDING COLLATERAL (9.1%) | |||||||||||
| Debt (8.5%) | |||||||||||
| Bank Notes (1.0%) | |||||||||||
| Bank of America 4.81%, due 06/07/2006 * | $ | 3,078 | $ | 3,078 | |||||||
| 4.81%, due 08/10/2006 * | 2,970 | 2,970 | |||||||||
| Bear Stearns & Co. 5.01%, due 06/06/2006 * 5.01%, due 09/07/2006 * | 1,188 3,564 | 1,188 3,564 | |||||||||
| Certificates Of Deposit (0.6%) | |||||||||||
| Halifax Bank of Scotland 4.78%, due 06/06/2006 * | 2,970 | 2,970 | |||||||||
| Rabobank Nederland 4.87%, due 05/31/2006 * | 2,970 | 2,970 | |||||||||
The notes to the financial statements are an integral part of this report.
Transamerica IDEX Mutual Funds
Semi-Annual Report 2006
2
TA IDEX Janus Growth
SCHEDULE OF INVESTMENTS (continued)
At April 30, 2006
(all amounts except share amounts in thousands)
(unaudited)
| Principal | Value | ||||||||||
| Commercial Paper (0.5%) | |||||||||||
| Banco Santander Central Hispano SA 4.77%, due 05/02/2006 | $ | 1,782 | $ | 1,782 | |||||||
| Sheffield Receivables Corp.–144A 4.81%, due 05/03/2006 | 2,966 | 2,966 | |||||||||
| Euro Dollar Overnight (1.5%) | |||||||||||
| Bank of Montreal 4.77%, due 05/02/2006 | 2,376 | 2,376 | |||||||||
| Dexia Group 4.78%, due 05/04/2006 | 2,970 | 2,970 | |||||||||
| Fortis Bank 4.77%, due 05/01/2006 | 1,188 | 1,188 | |||||||||
| Royal Bank of Canada 4.77%, due 05/01/2006 | 4,158 | 4,158 | |||||||||
| Royal Bank of Scotland 4.75%, due 05/03/2006 | 2,970 | 2,970 | |||||||||
| Svenska Handlesbanken 4.82%, due 05/01/2006 | 2,269 | 2,269 | |||||||||
| Euro Dollar Terms (2.4%) | |||||||||||
| BancoBilbao Vizcaya Argentaria SA 4.95%, due 06/20/2006 | 2,376 | 2,376 | |||||||||
| Bank of the West 4.94%, due 06/16/2006 | 2,376 | 2,376 | |||||||||
| Barclays 4.79%, due 05/10/2006 4.77%, due 05/16/2006 | 3,564 1,188 | 3,564 1,188 | |||||||||
| Canadian Imperial Bank of Commerce 4.97%, due 06/23/2006 | 1,782 | 1,782 | |||||||||
| Credit Suisse First Boston Corp. 4.73%, due 05/08/2006 | 1,782 | 1,782 | |||||||||
| Fortis Bank 4.83%, due 05/08/2006 | 1,188 | 1,188 | |||||||||
| Lloyds TSB Bank 4.81%, due 05/11/2006 | 1,782 | 1,782 | |||||||||
| Royal Bank of Scotland 4.87%, due 05/12/2006 | 2,376 | 2,376 | |||||||||
| Societe Generale 4.79%, due 05/10/2006 | 2,970 | 2,970 | |||||||||
| UBS AG 4.95%, due 06/20/2006 | 2,970 | 2,970 | |||||||||
| Principal | Value | ||||||||||
| Repurchase Agreements (2.5%) †† | |||||||||||
| Credit Suisse First Boston Corp. 4.92%, dated 04/28/2006 to be repurchased at $4,035 on 05/01/2006 | $ | 4,033 | $ | 4,033 | |||||||
| Goldman Sachs Group, Inc. (The) 4.92%, dated 04/28/2006 to be repurchased at $8,729 on 05/01/2006 | 8,726 | 8,726 | |||||||||
| Lehman Brothers, Inc. 4.92%, dated 04/28/2006 to be repurchased at $147 on 05/01/2006 | 147 | 147 | |||||||||
| Merrill Lynch & Co. 4.87%, dated 04/28/2006 to be repurchased at $8,914 on 05/01/2006 | 8,910 | 8,910 | |||||||||
| Morgan Stanley Dean Witter & Co. 4.93%, dated 04/28/2006 to be repurchased at $4,160 on 05/01/2006 | 4,158 | 4,158 | |||||||||
| Shares | Value | ||||||||||
| Investment Companies (0.6%) | |||||||||||
| Barclays Global Investors Institutional Money Market Fund 1-day yield of 4.78% | 4,752,009 | $ | 4,752 | ||||||||
| Merrimac Cash Fund, Premium Class 1-day yield of 4.61%@ | 1,264,347 | 1,264 | |||||||||
| Total Security Lending Collateral (cost: $93,763) | 93,763 | ||||||||||
| Total Investment Securities (cost: $813,134) # | $ | 1,041,327 | |||||||||
| FORWARD FOREIGN CURRENCY CONTRACTS: | |||||||||||||||||||
| Currency | Bought (Sold) | Settlement Date | Amount in U.S. Dollars Bought (Sold) | Net Unrealized Appreciation (Depreciation) | |||||||||||||||
| Swiss Franc | (46,300 | ) | 06/28/2006 | $ | (37,183 | ) | $ | (262 | ) | ||||||||||
| $ | (37,183 | ) | $ | (262 | ) | ||||||||||||||
The notes to the financial statements are an integral part of this report.
Transamerica IDEX Mutual Funds
Semi-Annual Report 2006
3
TA IDEX Janus Growth
SCHEDULE OF INVESTMENTS (continued)
At April 30, 2006
(all amounts except share amounts in thousands)
(unaudited)
NOTES TO SCHEDULE OF INVESTMENTS:
‡ Non-income producing.
† At April 30, 2006, all or a portion of this security is on loan (see Note 1). The value at April 30, 2006, of all securities on loan is $91,406.
* Floating or variable rate note. Rate is listed as of April 30, 2006.
†† Cash collateral for the Repurchase Agreements, valued at $26,740, that serve as collateral for securities lending are invested in corporate bonds with interest rates and maturity dates ranging from 0.00% - 9.05% and 05/02/2006 - 12/31/2049, respectively.
@ Regulated investment company advised by Investors Bank and Trust Co. ("IBT"). IBT is also the accounting, custody and lending agent for the Fund.
# Aggregate cost for Federal income tax purposes is $815,949. Aggregate gross unrealized appreciation for all securities in which there is an excess of value over tax cost and aggregate gross unrealized depreciation for all securities in which there is an excess of tax cost over value were $244,021 and $18,643, respectively. Net unrealized appreciation for tax purposes is $225,378.
DEFINITIONS:
144A 144A Securities are registered pursuant to Rule 144A of the Securities Act of 1933. These securities are deemed to be liquid for purposes of compliance limitations on holdings of illiquid securities and may be resold as transactions exempt from registration, normally to qualified institutional buyers. At April 30, 2006, these securities aggregated $2,966 or 0.3% of the net assets of the Fund.
ADR American Depositary Receipt
REIT Real Estate Investment Trust
The notes to the financial statements are an integral part of this report.
Transamerica IDEX Mutual Funds
Semi-Annual Report 2006
4
TA IDEX Janus Growth
STATEMENT OF ASSETS AND LIABILITIES
At April 30, 2006
(all amounts except per share amounts in thousands)
(unaudited)
| Assets: | |||||||
| Investment securities, at value (cost: $813,134) (including securities loaned of $91,406) | $ | 1,041,327 | |||||
| Cash | 79,594 | ||||||
| Receivables: | |||||||
| Investment securities sold | 11,699 | ||||||
| Shares of beneficial interest sold | 93 | ||||||
| Interest | 180 | ||||||
| Dividends | 588 | ||||||
| Dividend reclaims receivable | 328 | ||||||
| Other | 356 | ||||||
| 1,134,165 | |||||||
| Liabilities: | |||||||
| Investment securities purchased | 1,943 | ||||||
| Accounts payable and accrued liabilities: | |||||||
| Shares of beneficial interest redeemed | 1,877 | ||||||
| Management and advisory fees | 665 | ||||||
| Distribution and service fees | 314 | ||||||
| Transfer agent fees | 346 | ||||||
| Administration fees | 16 | ||||||
| Payable for collateral for securities on loan | 93,763 | ||||||
| Unrealized depreciation on forward foreign currency contracts | 262 | ||||||
| Other | 509 | ||||||
| 99,695 | |||||||
| Net Assets | $ | 1,034,470 | |||||
| Net Assets Consist of: | |||||||
| Shares of beneficial interest, unlimited shares authorized, no par value | $ | 1,506,484 | |||||
| Distributable net investment income (loss) | (3,243 | ) | |||||
| Accumulated net realized gain (loss) from investment securities and foreign currency transactions | (696,701 | ) | |||||
| Net unrealized appreciation (depreciation) on: | |||||||
| Investment securities | 228,180 | ||||||
| Translation of assets and liabilities denominated in foreign currencies | (250 | ) | |||||
| Net Assets | $ | 1,034,470 | |||||
| Net Assets by Class: | |||||||
| Class A | $ | 437,575 | |||||
| Class B | 164,899 | ||||||
| Class C | 57,679 | ||||||
| Class I | 153,330 | ||||||
| Class T | 220,987 | ||||||
| Shares Outstanding: | |||||||
| Class A | 16,897 | ||||||
| Class B | 6,940 | ||||||
| Class C | 2,429 | ||||||
| Class I | 5,905 | ||||||
| Class T | 8,163 | ||||||
| Net Asset Value Per Share: | |||||||
| Class A | $ | 25.90 | |||||
| Class B | 23.76 | ||||||
| Class C | 23.75 | ||||||
| Class I | 25.97 | ||||||
| Class T | 27.07 | ||||||
| Maximum Offering Price Per Share (a): | |||||||
| Class A | $ | 27.41 | |||||
| Class T | 29.58 | ||||||
(a) Includes the maximum selling commission (represented as a percentage of offering price) which is reduced on certain levels of sales as set forth in the Prospectus. Net asset value per share for Classes B, C and I shares represents offering price. The redemption price for Classes B and C shares equals net asset value less any applicable contingent deferred sales charge.
STATEMENT OF OPERATIONS
For the period ended April 30, 2006 (b)
(all amounts in thousands)
(unaudited)
| Investment Income: | |||||||
| Dividends (net of withholding taxes on foreign dividends of $126) | $ | 4,179 | |||||
| Interest | 980 | ||||||
| Income from loaned securities–net | 54 | ||||||
| 5,213 | |||||||
| Expenses: | |||||||
| Management and advisory fees | 4,196 | ||||||
| Distribution and service fees: | |||||||
| Class A | 827 | ||||||
| Class B | 885 | ||||||
| Class C | 316 | ||||||
| Transfer agent fees: | |||||||
| Class A | 658 | ||||||
| Class B | 466 | ||||||
| Class C | 147 | ||||||
| Class I | – | (c) | |||||
| Class T | 147 | ||||||
| Printing and shareholder reports | 200 | ||||||
| Custody fees | 78 | ||||||
| Administration fees | 109 | ||||||
| Legal fees | 28 | ||||||
| Audit fees | 9 | ||||||
| Trustees fees | 22 | ||||||
| Registration fees | 38 | ||||||
| Other | 25 | ||||||
| Total expenses | 8,151 | ||||||
| Less: | |||||||
| Reimbursement of class expenses: | |||||||
| Class B | (78 | ) | |||||
| Class C | (8 | ) | |||||
| Total reimbursed expenses | (86 | ) | |||||
| Net expenses | 8,065 | ||||||
| Net Investment Income (Loss) | (2,852 | ) | |||||
| Net Realized Gain (Loss) from: | |||||||
| Investment securities | 78,782 | ||||||
| Foreign currency transactions | 81 | ||||||
| 78,863 | |||||||
| Net Increase (Decrease) in Unrealized Appreciation (Depreciation) on: | |||||||
| Investment securities | (18,838 | ) | |||||
| Translation of assets and liabilities denominated in foreign currencies | (815 | ) | |||||
| (19,653 | ) | ||||||
| Net Realized and Unrealized Gain (Loss) on Investment Securities and Foreign Currency Transactions | 59,210 | ||||||
| Net Increase (Decrease) in Net Assets Resulting from Operations | $ | 56,358 | |||||
(b) Class I was offered for investment on November 15, 2005.
(c) Rounds to less than $1.
The notes to the financial statements are an integral part of this report.
Transamerica IDEX Mutual Funds
Semi-Annual Report 2006
5
TA IDEX Janus Growth
STATEMENTS OF CHANGES IN NET ASSETS
For the period or year ended
(all amounts in thousands)
| April 30, 2006 (unaudited) (a) | October 31, 2005 | ||||||||||
| Increase (Decrease) In Net Assets From: | |||||||||||
| Operations: | |||||||||||
| Net investment income (loss) | $ | (2,852 | ) | $ | (9,198 | ) | |||||
| Net realized gain (loss) from investment securities and foreign currency transactions | 78,863 | 101,404 | |||||||||
| Change in unrealized appreciation (depreciation) on investment securities and foreign currency translation | (19,653 | ) | 55,566 | ||||||||
| 56,358 | 147,772 | ||||||||||
| Capital Share Transactions: | |||||||||||
| Proceeds from shares sold: | |||||||||||
| Class A | 7,992 | 92,689 | |||||||||
| Class B | 3,427 | 6,817 | |||||||||
| Class C | 1,836 | 5,221 | |||||||||
| Class I | 194,638 | – | |||||||||
| Class T | 1,349 | 2,681 | |||||||||
| 209,242 | 107,408 | ||||||||||
| Cost of shares redeemed: | |||||||||||
| Class A | (229,439 | ) | (119,995 | ) | |||||||
| Class B | (25,091 | ) | (54,012 | ) | |||||||
| Class C | (10,502 | ) | (21,745 | ) | |||||||
| Class I | (44,612 | ) | – | ||||||||
| Class T | (23,332 | ) | (51,883 | ) | |||||||
| (332,976 | ) | (247,635 | ) | ||||||||
| Redemption fees: | |||||||||||
| Class A | 2 | – | |||||||||
| Class B | 3 | – | |||||||||
| 5 | – | ||||||||||
| Automatic conversions: | |||||||||||
| Class A | 960 | 1,929 | |||||||||
| Class B | (960 | ) | (1,929 | ) | |||||||
| – | – | ||||||||||
| (123,729 | ) | (140,227 | ) | ||||||||
| Net increase (decrease) in net assets | (67,371 | ) | 7,545 | ||||||||
| Net Assets: | |||||||||||
| Beginning of period | 1,101,841 | 1,094,296 | |||||||||
| End of period | $ | 1,034,470 | $ | 1,101,841 | |||||||
| Distributable Net Investment Income (Loss) | $ | (3,243 | ) | $ | (391 | ) | |||||
(a) Class I was offered for investment on November 15, 2005.
| April 30, 2006 (unaudited) (a) | October 31, 2005 | ||||||||||
| Share Activity: | |||||||||||
| Shares issued: | |||||||||||
| Class A | 304 | 3,958 | |||||||||
| Class B | 142 | 315 | |||||||||
| Class C | 76 | 242 | |||||||||
| Class I | 7,605 | – | |||||||||
| Class T | 48 | 111 | |||||||||
| 8,175 | 4,626 | ||||||||||
| Shares redeemed: | |||||||||||
| Class A | (8,943 | ) | (5,148 | ) | |||||||
| Class B | (1,047 | ) | (2,491 | ) | |||||||
| Class C | (439 | ) | (1,005 | ) | |||||||
| Class I | (1,700 | ) | – | ||||||||
| Class T | (857 | ) | (2,130 | ) | |||||||
| (12,986 | ) | (10,774 | ) | ||||||||
| Automatic conversions: | |||||||||||
| Class A | 37 | 83 | |||||||||
| Class B | (40 | ) | (89 | ) | |||||||
| (3 | ) | (6 | ) | ||||||||
| Net increase (decrease) in shares outstanding: | |||||||||||
| Class A | (8,602 | ) | (1,107 | ) | |||||||
| Class B | (945 | ) | (2,265 | ) | |||||||
| Class C | (363 | ) | (763 | ) | |||||||
| Class I | 5,905 | – | |||||||||
| Class T | (809 | ) | (2,019 | ) | |||||||
| (4,814 | ) | (6,154 | ) | ||||||||
The notes to the financial statements are an integral part of this report.
Transamerica IDEX Mutual Funds
Semi-Annual Report 2006
6
TA IDEX Janus Growth
FINANCIAL HIGHLIGHTS
(unaudited for the period ended April 30, 2006)
| For a share of beneficial interest outstanding throughout each period | |||||||||||||||||||||||||||||||||||||||
| Net Asset | Investment Operations | Distributions | Net Asset | ||||||||||||||||||||||||||||||||||||
| For the Period Ended (d)(g) | Value, Beginning of Period | Net Investment Income (Loss) | Net Realized and Unrealized Gain (Loss) | Total Operations | From Net Investment Income | From Net Realized Gains | Total Distributions | Value, End of Period | |||||||||||||||||||||||||||||||
| Class A | 4/30/2006 | $ | 24.66 | $ | (0.07 | ) | $ | 1.31 | $ | 1.24 | $ | – | $ | – | $ | – | $ | 25.90 | |||||||||||||||||||||
| 10/31/2005 | 21.56 | (0.17 | ) | 3.27 | 3.10 | – | – | – | 24.66 | ||||||||||||||||||||||||||||||
| 10/31/2004 | 19.73 | (0.21 | ) | 2.04 | 1.83 | – | – | – | 21.56 | ||||||||||||||||||||||||||||||
| 10/31/2003 | 15.87 | (0.21 | ) | 4.07 | 3.86 | – | – | – | 19.73 | ||||||||||||||||||||||||||||||
| 10/31/2002 | 19.64 | (0.22 | ) | (3.55 | ) | (3.77 | ) | – | – | – | 15.87 | ||||||||||||||||||||||||||||
| 10/31/2001 | 43.81 | (0.24 | ) | (20.80 | ) | (21.04 | ) | – | (3.13 | ) | (3.13 | ) | 19.64 | ||||||||||||||||||||||||||
| Class B | 4/30/2006 | 22.71 | (0.16 | ) | 1.21 | 1.05 | – | – | – | 23.76 | |||||||||||||||||||||||||||||
| 10/31/2005 | 20.04 | (0.34 | ) | 3.01 | 2.67 | – | – | – | 22.71 | ||||||||||||||||||||||||||||||
| 10/31/2004 | 18.45 | (0.32 | ) | 1.91 | 1.59 | – | – | – | 20.04 | ||||||||||||||||||||||||||||||
| 10/31/2003 | 14.93 | (0.31 | ) | 3.83 | 3.52 | – | – | – | 18.45 | ||||||||||||||||||||||||||||||
| 10/31/2002 | 18.63 | (0.34 | ) | (3.36 | ) | (3.70 | ) | – | – | – | 14.93 | ||||||||||||||||||||||||||||
| 10/31/2001 | 42.08 | (0.41 | ) | (19.91 | ) | (20.32 | ) | – | (3.13 | ) | (3.13 | ) | 18.63 | ||||||||||||||||||||||||||
| Class C | 4/30/2006 | 22.70 | (0.16 | ) | 1.21 | 1.05 | – | – | – | 23.75 | |||||||||||||||||||||||||||||
| 10/31/2005 | 20.03 | (0.34 | ) | 3.01 | 2.67 | – | – | – | 22.70 | ||||||||||||||||||||||||||||||
| 10/31/2004 | 18.45 | (0.30 | ) | 1.88 | 1.58 | – | – | – | 20.03 | ||||||||||||||||||||||||||||||
| 10/31/2003 | 14.74 | (0.32 | ) | 4.03 | 3.71 | – | – | – | 18.45 | ||||||||||||||||||||||||||||||
| Class I | 4/30/2006 | 25.54 | 0.01 | 0.42 | 0.43 | – | – | – | 25.97 | ||||||||||||||||||||||||||||||
| Class T | 4/30/2006 | 25.71 | – | (h) | 1.36 | 1.36 | – | – | – | 27.07 | |||||||||||||||||||||||||||||
| 10/31/2005 | 22.39 | (0.06 | ) | 3.38 | 3.32 | – | – | – | 25.71 | ||||||||||||||||||||||||||||||
| 10/31/2004 | 20.45 | (0.16 | ) | 2.10 | 1.94 | – | – | – | 22.39 | ||||||||||||||||||||||||||||||
| 10/31/2003 | 16.40 | (0.16 | ) | 4.21 | 4.05 | – | – | – | 20.45 | ||||||||||||||||||||||||||||||
| 10/31/2002 | 20.20 | (0.16 | ) | (3.64 | ) | (3.80 | ) | – | – | – | 16.40 | ||||||||||||||||||||||||||||
| 10/31/2001 | 44.76 | (0.14 | ) | (21.29 | ) | (21.43 | ) | – | (3.13 | ) | (3.13 | ) | 20.20 | ||||||||||||||||||||||||||
| Ratios/Supplemental Data | |||||||||||||||||||||||||||||||
| For the Period | Total | Net Assets, End of Period | Ratio of Expenses to Average Net Assets (a) | Net Investment Income (Loss) to Average | Portfolio Turnover | ||||||||||||||||||||||||||
| Ended (g) | Return (c) | (000's) | Net (e) | Total (f) | Net Assets (a) | Rate (b) | |||||||||||||||||||||||||
| Class A | 4/30/2006 | 5.03 | % | $ | 437,575 | 1.49 | % | 1.49 | % | (0.54 | )% | 27 | % | ||||||||||||||||||
| 10/31/2005 | 14.38 | 628,693 | 1.45 | 1.45 | (0.71 | ) | 57 | ||||||||||||||||||||||||
| 10/31/2004 | 9.28 | 573,640 | 1.60 | 1.60 | (1.01 | ) | 41 | ||||||||||||||||||||||||
| 10/31/2003 | 24.32 | 583,674 | 1.70 | 1.72 | (1.22 | ) | 62 | ||||||||||||||||||||||||
| 10/31/2002 | (19.21 | ) | 505,704 | 1.66 | 1.69 | (1.10 | ) | 62 | |||||||||||||||||||||||
| 10/31/2001 | (51.31 | ) | 770,590 | 1.49 | 1.49 | (0.83 | ) | 64 | |||||||||||||||||||||||
| Class B | 4/30/2006 | 4.62 | 164,899 | 2.30 | 2.39 | (1.35 | ) | 27 | |||||||||||||||||||||||
| 10/31/2005 | 13.32 | 179,090 | 2.33 | 2.40 | (1.58 | ) | 57 | ||||||||||||||||||||||||
| 10/31/2004 | 8.62 | 203,408 | 2.22 | 2.22 | (1.59 | ) | 41 | ||||||||||||||||||||||||
| 10/31/2003 | 23.58 | 233,731 | 2.35 | 2.37 | (1.87 | ) | 62 | ||||||||||||||||||||||||
| 10/31/2002 | (19.86 | ) | 224,348 | 2.31 | 2.35 | (1.75 | ) | 62 | |||||||||||||||||||||||
| 10/31/2001 | (51.74 | ) | 354,949 | 2.14 | 2.14 | (1.48 | ) | 64 | |||||||||||||||||||||||
| Class C | 4/30/2006 | 4.63 | 57,679 | 2.30 | 2.33 | (1.34 | ) | 27 | |||||||||||||||||||||||
| 10/31/2005 | 13.27 | 63,366 | 2.33 | 2.39 | (1.58 | ) | 57 | ||||||||||||||||||||||||
| 10/31/2004 | 8.62 | 71,196 | 2.08 | 2.08 | (1.44 | ) | 41 | ||||||||||||||||||||||||
| 10/31/2003 | 25.17 | 735 | 2.35 | 2.37 | (1.88 | ) | 62 | ||||||||||||||||||||||||
| Class I | 4/30/2006 | 1.68 | 153,330 | 0.86 | 0.86 | 0.10 | 27 | ||||||||||||||||||||||||
| Class T | 4/30/2006 | 5.29 | 220,987 | 0.99 | 0.99 | (0.03 | ) | 27 | |||||||||||||||||||||||
| 10/31/2005 | 14.83 | 230,692 | 1.01 | 1.01 | (0.26 | ) | 57 | ||||||||||||||||||||||||
| 10/31/2004 | 9.49 | 246,052 | 1.38 | 1.38 | (0.75 | ) | 41 | ||||||||||||||||||||||||
| 10/31/2003 | 24.70 | 416,719 | 1.35 | 1.37 | (0.87 | ) | 62 | ||||||||||||||||||||||||
| 10/31/2002 | (18.82 | ) | 368,301 | 1.31 | 1.34 | (0.75 | ) | 62 | |||||||||||||||||||||||
| 10/31/2001 | (51.07 | ) | 546,317 | 1.14 | 1.14 | (0.48 | ) | 64 | |||||||||||||||||||||||
The notes to the financial statements are an integral part of this report.
Transamerica IDEX Mutual Funds
Semi-Annual Report 2006
7
TA IDEX Janus Growth
FINANCIAL HIGHLIGHTS (continued)
(unaudited)
NOTES TO FINANCIAL HIGHLIGHTS
(a) Annualized.
(b) Not annualized.
(c) Total Return has been calculated for the applicable period without deduction of a sales load, if any, on an initial purchase. Not annualized.
(d) Per share information is calculated based on average number of shares outstanding.
(e) Ratio of Net Expenses to Average Net Assets is net of fee waivers and reimbursements by the investment adviser, if any (see note 2).
(f) Ratio of Total Expenses to Average Net Assets includes all expenses before fee waivers and reimbursements by the investment adviser.
(g) The inception dates for the Fund's offering of share classes were as follows:
Class C was November 11, 2002.
Class I was November 15, 2005.
(h) Rounds to less than $0.01.
The notes to the financial statements are an integral part of this report.
Transamerica IDEX Mutual Funds
Semi-Annual Report 2006
8
TA IDEX Janus Growth
NOTES TO FINANCIAL STATEMENTS
At April 30, 2006
(all amounts in thousands)
(unaudited)
NOTE 1. ORGANIZATION AND SIGNIFICANT ACCOUNTING POLICIES
Transamerica IDEX Mutual Funds is an open-end management investment company registered under the Investment Company Act of 1940, as amended (the "1940 Act").
In the normal course of business, TA IDEX Janus Growth (the "Fund") enters into contracts that contain a variety of representations that provide general indemnifications. The Fund's maximum exposure under these arrangements is unknown, as this would involve future claims that may be made against the Fund and/or its affiliates that have not yet occurred. However, based on experience, the Fund expects the risk of loss to be remote.
This report should be read in conjunction with the current Fund prospectus, which contains more complete information about the Fund.
In preparing the Fund's financial statements in accordance with accounting principles generally accepted in the United States of America ("GAAP"), estimates or assumptions (which could differ from actual results) may be used that affect reported amounts and disclosures. The following is a summary of significant accounting policies followed by the Fund.
Multiple class operations, income and expenses: The Fund currently offers five classes of shares, Class A, Class B, Class C, Class I and Class T, each with a public offering price that reflects different sales charges, if any, and expense levels. Class I shares commenced operations on November 15, 2005. Class I is only available for investment to certain affiliated asset allocation funds. Class T shares are not available to new investors. Class B shares will convert to Class A shares eight years after purchase. Income, non-class specific expenses and realized and unrealized gains and losses, are allocated daily to each class, based upon the value of shares outstanding method as permitted under Rule 18f-3 of the 1940 Act. Each class bears its own specific expenses as well as a portion of general, common expenses.
Security valuations: The Fund values its investments at the close of the New York Stock Exchange ("NYSE"), normally 4 p.m. ET, each day the NYSE is open for business. Fund investments are valued at the last sale price or closing price on the day of valuation taken from the primary exchange where the security is principally traded.
Securities traded in the over-the-counter market and listed securities for which no sale was reported on that date are valued at the last quoted bid price.
Debt securities are valued based on a price quotation or other equivalent indication of value supplied by an exchange, a pricing service or a major market maker; however, those that mature in sixty days or less are valued at amortized cost, which approximates market.
Investment company securities are valued at the net asset value of the underlying portfolio.
Foreign securities generally are valued based on quotations from the primary market in which they are traded. Because many foreign securities markets and exchanges close prior to the close of the NYSE, closing prices for foreign securities in those markets or on those exchanges do not reflect the events that occur after that close. If a significant market event impacting the value of a portfolio security (e.g., natural disaster, company announcement, market volatility) occurs subsequent to the close of trading in the security, but prior to the calculation of the Fund's net asset value per share, market quotations for that security may be determined to be unreliable and, accordingly, not "readily available." As a result, foreign equity securities held by the Fund may be valued at fair market value as determined in good faith by the Fund's Administrative Valuation Committee, under the supervision of the Board's Valuation Committee , using guidelines adopted by the Board of Trustees.
Other securities for which quotations are not readily available or whose values have been determined to be unreliable are valued at fair market value as determined in good faith by the Fund's Administrative Valuation Committee, under the supervision of the Board's Valuation Committee, using guidelines adopted by the Board of Trustees.
Cash: The Fund may leave cash overnight in its cash account with the custodian, Investors Bank & Trust Company ("IBT"). IBT has been contracted on behalf of the Fund to invest the excess cash into a savings account, which at April 30, 2006, was paying an interest rate of 3.24%.
Repurchase agreements: The Fund is authorized to enter into repurchase agreements. The Fund, through its custodian, IBT, receives delivery of the underlying securities, the value of which at the time of purchase is required to be an amount equal to at least 100% of the resale price. The Fund will bear the risk of value fluctuations until the security can be sold and may encounter delays and incur costs in liquidating the security. In the event of bankruptcy or insolvency of the seller, delays and costs may be incurred.
Commission recapture: The sub-adviser, to the extent consistent with the best execution and usual commission rate policies and practices, may place security transactions of the Fund with broker/dealers with which Transamerica IDEX Mutual Funds has established a Commission Recapture Program. A Commission Recapture Program is any arrangement under which a broker/dealer applies a portion of the commissions received by such broker/dealer on the security transactions to the Fund. In no event will commissions paid by the Fund be used to pay expenses that would otherwise be borne by any other funds within Transamerica IDEX Mutual Funds, or by any other party.
Transamerica IDEX Mutual Funds
Semi-Annual Report 2006
9
TA IDEX Janus Growth
NOTES TO FINANCIAL STATEMENTS (continued)
At April 30, 2006
(all amounts in thousands)
(unaudited)
NOTE 1.–(continued)
Recaptured commissions during the six months ended April 30, 2006, of $89 are included in net realized gains in the Statement of Operations.
Securities lending: The Fund may lend securities to qualified borrowers, with IBT acting as the Fund's lending agent. The Fund earns negotiated lenders' fees. The Fund receives cash and/or securities as collateral against the loaned securities. Cash collateral received is invested in short term, interest bearing securities. The Fund monitors the market value of securities loaned on a daily basis and requires collateral in an amount at least equal to the value of the securities loaned. Income from loaned securities on the Statement of Operations is net of fees, in the amount of $23, earned by IBT for its services.
Security transactions and investment income: Security transactions are recorded on the trade date. Security gains and losses are calculated on the specific identification basis. Dividend income, if any, is recorded on the ex-dividend date or, in the case of foreign securities, as soon as the Fund is informed of the ex-dividend date. Interest income, including accretion of discounts and amortization of premiums, is recorded on the accrual basis commencing on the settlement date.
Foreign currency denominated investments: The accounting records of the Fund are maintained in U.S. dollars. Securities and other assets and liabilities denominated in foreign currencies are translated into U.S. dollars at the closing exchange rate each day. The cost of foreign securities is translated at the exchange rate in effect when the investment was acquired. The Fund combines fluctuations from currency exchange rates and fluctuations in value when computing net realized and unrealized gains or losses from investments.
Net foreign currency gains and losses resulting from changes in exchange rates include: 1) foreign currency fluctuations between trade date and settlement date of investment security transactions; 2) gains and losses on forward foreign currency contracts; and 3) the difference between the receivable amounts of interest and dividends recorded in the accounting records in U.S. dollars and the amounts actually received.
Foreign currency denominated assets may involve risks not typically associated with domestic transactions. These risks include revaluation of currencies, adverse fluctuations in foreign currency values and possible adverse political, social and economic developments, including those particular to a specific industry, country or region.
Forward foreign currency contracts: The Fund may enter into forward foreign currency contracts to hedge against exchange rate risk arising from investments in securities denominated in foreign currencies. Contracts are valued at the contractual forward rate and are marked to market daily, with the change in value recorded as an unrealized gain or loss. When the contracts are settled a realized gain or loss is incurred. Risks may arise from changes in market value of the underlying currencies and from the possible inability of counterparties to meet the terms of their contracts.
Open forward currency contracts at April 30, 2006, are listed in the Schedule of Investments.
Redemption fees: A short-term trading redemption fee may be assessed on any Fund shares in a fund account that are sold during the first five (5) NYSE trading days following their purchase date. This redemption fee will equal 2% of the amount redeemed and shares held the longest will be treated as being redeemed first and shares held the shortest as being redeemed last. For the six months ended April 30, 2006, the Fund received $5 in redemption fees.
Dividend distributions: Distributions to shareholders are recorded on the ex-dividend date and are determined in accordance with Federal income tax regulations which may differ from GAAP.
NOTE 2. RELATED PARTY TRANSACTIONS
Transamerica Fund Advisors, Inc. ("TFAI") is the Fund's investment adviser. Transamerica Fund Services, Inc. ("TFS") is the Fund's administrator and transfer agent. AFSG Securities Corp. ("AFSG") is the Fund's distributor/principal underwriter. TFAI, TFS, and AFSG are affiliates of AEGON, NV, a Netherlands corporation.
Certain officers and trustees of the Fund are also officers and/or directors of TFAI, TFS and AFSG.
The following schedule reflects the percentage of Fund assets owned by affiliated investment companies at April 30, 2006:
| Net Assets | % of Net Assets | ||||||||||
| TA IDEX Asset Allocation – Conservative Portfolio | $ | 14,187 | 1.37 | % | |||||||
| TA IDEX Asset Allocation – Moderate Portfolio | 25,593 | 2.47 | % | ||||||||
| TA IDEX Asset Allocation – Moderate Growth Portfolio | 113,561 | 10.98 | % | ||||||||
| Total | $ | 153,341 | 14.82 | % | |||||||
Transamerica IDEX Mutual Funds
Semi-Annual Report 2006
10
TA IDEX Janus Growth
NOTES TO FINANCIAL STATEMENTS (continued)
At April 30, 2006
(all amounts in thousands)
(unaudited)
NOTE 2.–(continued)
Investment advisory fees: The Fund pays management fees to TFAI based on average daily net assets ("ANA") at the following breakpoints:
0.80% of the first $250 million of ANA
0.77% of the next $500 million of ANA
0.75% of the next $750 million of ANA
0.70% of the next $1.5 billion of ANA
0.675% of ANA over $3 billion
TFAI has contractually agreed to waive its advisory fee and will reimburse the Fund to the extent that operating expenses, excluding 12b-1 fees, exceed the following stated annual limit:
1.30% Expense Limit
The sub-adviser, Janus Capital Management, LLC, has agreed to a pricing discount based on the aggregate assets that they manage in the AEGON/Transamerica Series Trust and Transamerica IDEX Mutual Funds. There was no discount received by the Fund for the six months ended April 30, 2006.
Distribution and service fees: The Fund has a 12b-1 distribution plan under the 1940 Act pursuant to which an annual fee, based on average daily net assets, is paid to the distributor for various disbursements such as broker-dealer account servicing fees and other promotional expenses of the Fund, excluding Class T. The 12b-1 fee for the Fund is comprised of a 0.25% service fee and the remaining amount is an asset-based sales charge/distribution fee. The Fund is authorized under the 12b-1 plan to pay fees on each class up to the following limits:
| Class A | 0.35 | % | |||||
| Class B | 1.00 | % | |||||
| Class C | 1.00 | % | |||||
| Class I | N/A | ||||||
| Class T | N/A | ||||||
In the case the Fund or a class of shares of the Fund is closed to new investors or investments, the Fund is authorized to pay 12b-1 fees for past sales and distribution efforts and present and past investor services.
Underwriter commissions relate to front-end sales charges imposed for Class A and T shares and contingent deferred sales charges from Classes B, C, and certain A share redemptions. For the six months ended April 30, 2006, the underwriter commissions were as follows:
| Received by Underwriter | $ | 262 | |||||
| Retained by Underwriter | 39 | ||||||
| Contingent Deferred Sales Charge | 131 | ||||||
Administrative services: The Fund has entered into an agreement with TFS for financial and legal fund administration services. The Fund pays TFS an annual fee of 0.02% of ANA. The Legal fees on the Statement of Operations are fees paid to external legal counsel.
Transfer agent fees: The Fund pays TFS an annual per-account charge for each open and closed account. The Fund paid TFS $1,305 for the six months ended April 30, 2006.
Deferred compensation plan: Each eligible independent Fund Trustee may elect to participate in a non-qualified deferred compensation plan maintained by Transamerica IDEX Mutual Funds (the "Plan"). Under the Plan, such Trustees may defer payment of all or a portion of their total fees earned as a Fund Trustee. Each Trustee who is a participant in the Plan may elect that the earnings, losses or gains credited to his or her deferred fee amounts be determined based on a deemed investment in any series of Transamerica IDEX Mutual Funds, including the Fund. The right of a participant to receive a distribution from the Plan of the deferred fees is an unsecured claim against the general assets of all series of Transamerica IDEX Mutual Funds. The pro rata liability to the Fund of all deferred fees in the Plan amounted, as of April 30, 2006, to $356.
NOTE 3. INVESTMENT TRANSACTIONS
The cost of securities purchased and proceeds from securities sold (excluding short-term securities) for the six months ended April 30, 2006 were as follows:
| Purchases of securities: | |||||||
| Long-Term | $ | 272,283 | |||||
| U.S. Government | – | ||||||
| Proceeds from maturities and sales of securities: | |||||||
| Long-Term | 419,405 | ||||||
| U.S. Government | – | ||||||
NOTE 4. FEDERAL INCOME TAX MATTERS
The Fund has not made any provision for federal income or excise taxes due to its policy to distribute all of its taxable income and capital gains to its shareholders and otherwise qualify as a regulated investment company under Subchapter M of the Internal Revenue Code. Income and capital gain distributions are determined in accordance with income tax regulations, which may differ from GAAP. These differences are primarily due to differing treatment for items including, but not limited to, wash sales, net operating losses, foreign currency transactions, deferred compensation and capital loss carryforwards.
The capital loss carryforwards are available to offset future realized capital gains through the periods listed:
| Capital Loss Carryforwards | Available through | ||||||
| $ | 425,701 | October 31, 2009 | |||||
| 259,422 | October 31, 2010 | ||||||
| 86,859 | October 31, 2011 | ||||||
Transamerica IDEX Mutual Funds
Semi-Annual Report 2006
11
TA IDEX Janus Growth
NOTES TO FINANCIAL STATEMENTS (continued)
At April 30, 2006
(all amounts in thousands)
(unaudited)
NOTE 5. REGULATORY PROCEEDINGS
There continues to be significant federal and state regulatory activity relating to financial services companies, particularly mutual fund companies and their investment advisers. As part of an ongoing investigation regarding potential market timing, recordkeeping and trading compliance issues and matters affecting the Fund's investment adviser, TFAI, and certain affiliates and former employees of TFAI, the SEC staff has indicated that it is likely to take some action against TFAI and certain of its affiliates at the conclusion of the investigation. The potential timing and the scope of any such action is difficult to predict. Although the impact of any action brought against TFAI and/or its affiliates is difficult to assess at the present time, the Fund currently believes that the likelihood that any such action will have a material adverse impact on it is remote. It is important to note that the Fund is not aware of any allega tion of wrongdoing against it and its Board at the time this semi-annual report is printed. Although it is not anticipated that these developments will have an adverse impact on the Fund, there can be no assurance at this time. TFAI and its affiliates are actively working with the SEC in regard to this matter; however, the exact resolution cannot be determined at this time. TFAI will take such actions that it deems necessary or appropriate to continue providing management services to the Fund and to bring all matters to an appropriate conclusion.
TFAI and/or its affiliates, and not the Fund, will bear the costs regarding these regulatory matters.
Transamerica IDEX Mutual Funds
Semi-Annual Report 2006
12
TA IDEX Janus Growth
INVESTMENT ADVISORY AND SUB-ADVISORY AGREEMENTS – REVIEW AND RENEWAL (unaudited)
At a meeting of the Board of Trustees of Transamerica IDEX Mutual Funds ("TA IDEX") held on November 2, 2005, the Board reviewed and considered the Investment Advisory Agreement between TA IDEX Janus Growth (the "Fund") and Transamerica Fund Advisors, Inc. ("TFAI"), as well as the Investment Sub-Advisory Agreement of the Fund between TFAI and Janus Capital Management LLC (the "Sub-Adviser"), to determine whether the agreements should be renewed for a one-year period. Following their review and consideration, the Trustees determined that the Investment Advisory Agreement and the Investment Sub-Advisory Agreement will enable shareholders of the Fund to obtain high quality services at a cost that is appropriate, reasonable, and in the best interests of its shareholders. The Board, including the independent members of the Board, unanimously approved the renewal of the Investment Advisory Agreement and the Investment Sub-Advisory Agr eement. In reaching their decision, the Trustees requested and obtained from TFAI and the Sub-Adviser such information as they deemed reasonably necessary to evaluate the proposed agreements. The Trustees also carefully considered the information that they had received throughout the year from TFAI and the Sub-Adviser (such as in-person presentations by the Sub-Adviser) as part of their regular oversight of the Fund, as well as: comparative fee, expense and performance information prepared by Lipper Inc. ("Lipper"), independent providers of mutual fund performance, fee and expense information, and profitability data. In considering the proposed continuation of the Investment Advisory Agreement and the Investment Sub-Advisory Agreement, the Trustees evaluated a number of considerations that they believe, in light of the legal advice furnished to them by TA IDEX counsel and independent legal counsel and their own business judgment, to be relevant. They based their decisions on the following considerations, amo ng others, although they did not identify any consideration or particular information that was controlling of their decisions:
The nature, extent and quality of the advisory service to be provided. The Board considered the nature and quality of the services provided by TFAI and the Sub-Adviser to the Fund in the past, as well as the services anticipated to be provided in the future. The Board discussed recent developments affecting the Sub-Adviser (i.e., regulatory scrutiny, new management and rumors of a potential change of control transaction) and considered how those may impact the Fund. The Board was satisfied with TFAI's representation about a perceived improvement in the Sub-Adviser's management and improved corporate culture, which could benefit the Fund, and concluded that TFAI and the Sub-Adviser are capable of providing high quality services to the Fund, as indicated by the nature and quality of services provided in the past, TFAI's and the Sub-Adviser's management capabilities demonstrated with respect to the funds they manage, including the Fund, and the experience, capability and integrity of TFAI's senior management, the financial resources of TFAI and the Sub-Adviser, TFAI's management oversight process, the professional qualifications and experience of the Sub-Adviser's portfolio management team, and the Fund's investment performance. The Trustees also concluded that TFAI and the Sub-Adviser proposed to provide investment and related services that were of the same quality and quantity as services provided to the Fund in the past, and that these services are appropriate in scope and extent in light of the Fund's operations, the competitive landscape of the investment company business and investor needs, and that TFAI's and the Sub-Adviser's obligations will remain substantially the same.
The investment performance of the Fund. The Board examined both the short-term and longer-term performance of the Fund, including relative performance against a benchmark securities index and a peer group of comparable mutual funds as prepared by Lipper, for various trailing periods ended June 30, 2005. The Board concluded that TFAI and the Sub-Adviser generally had achieved superior investment performance, noting that the performance of the Fund was above median relative to its peers over the past one-, two-, three- and ten-year periods, and superior to the benchmark index over the past one-, two-, three- and ten-year periods. On the basis of the Trustees' assessment of the nature, extent and quality of advisory services to be provided or procured by TFAI and the Sub-Adviser, the Trustees concluded that TFAI and the Sub-Adviser are capable of generat ing a level of investment performance that is appropriate in light of the Fund's investment objective, policies and strategies and competitive with many other investment companies, and also determined that TFAI's and the Sub-Adviser's performance records indicate that their continued management is likely to benefit the Fund and its shareholders.
The cost of advisory services provided and the level of profitability. The Board reviewed profitability information regarding TFAI's costs of procuring portfolio management services, as well as the costs of provision of administration, transfer agency, fund accounting and other services, to the Fund and to TA IDEX as a whole by TFAI and its affiliates. The Trustees reviewed data from Lipper that compared the Fund's management fees (including management fees at various asset levels), other fees and expenses (including total expenses including and excluding 12b-1 distribution and service fees) and portfolio turnover rate against a peer group of comparable mutual funds. Based on such information, the Trustees determined that the management fees and overall expense ratio of the Fund generally are consistent with industry averages, although, the Board requ ested that Fund management seek improved pricing for the Fund in the coming year. In addition, on the basis of the Board's review of the management fees to be charged by TFAI for investment advisory and related services, TFAI profitability information (derived from TFAI's audited financial statements), TFAI's estimated management income resulting from its management of the Fund, the estimated margin of the Sub-Adviser,
Transamerica IDEX Mutual Funds
Semi-Annual Report 2006
13
TA IDEX Janus Growth (continued)
as well as the entirety of TFAI's and its affiliates' service relationship with TA IDEX. The Board concluded that the current level of investment management fees and other service fees, as well as TFAI's and the Sub-Adviser's profitability, are appropriate in light of the services provided, the management fees and overall expense ratios of comparable investment companies and the anticipated profitability of the relationship between the Fund, TFAI and its affiliates, and the Sub-Adviser.
Whether fee levels reflect economies of scale and the extent to which economies of scale would be realized as the Fund grows. The Board concluded that the inclusion of asset-based breakpoints in the Fund's advisory fee schedule appropriately benefits investors by realizing economies of scale in the form of lower management fees as the level of assets grows. In addition, the Board concluded that the Fund's management fees appropriately reflect the Fund's current size, the current economic environment for TFAI, the competitive nature of the investment company market, and TFAI's pricing strategy. The Trustees also concluded that they will have the opportunity to periodically reexamine whether the Fund has achieved economies of scale, and the appropriateness of management fees payable to TFAI and fees payable by TFAI to the Sub-Adviser in the future.
Benefits (such as soft dollars) to TFAI, its affiliates, or the Sub-Adviser from their relationship with the Fund. The Board concluded that other benefits derived by TFAI, its affiliates, and the Sub-Adviser from their relationship with the Fund, including "soft dollar" benefits (if any) in connection with brokerage transactions, sales charges and distribution/service fees (to the extent applicable) are reasonable and fair, and are consistent with industry practice and the best interests of the Fund and its shareholders. In this regard, the Board noted that TFAI does not realize "soft dollar" benefits from its relationship with the Fund, and that the Sub-Adviser is participating in a brokerage program pursuant to which a portion of brokerage commissions paid by the Fund is recaptured for the benefit of the Fund and its shareholders, thus limiting the amount of "soft-dollar" arrangements the Sub-Adviser may engage in with respect to the Fund's brokerage transactions. In addition, the Trustees determined that the administration, transfer agency, fund accounting and other fees paid by the Fund to affiliates of TFAI are reasonable, fair and in the best interests of shareholders in light of the nature and quality of the services provided, the associated costs to these affiliates of providing the services, the impact of the costs of such services on the Fund's overall operating expenses, and the necessity of the services for the Fund's operations.
Other considerations. The Board determined that TFAI had made a substantial commitment to the recruitment and retention of high quality personnel, and maintained the financial, compliance and operational resources reasonably necessary to manage the Fund in a professional manner that is consistent with the best interests of the Fund and its shareholders. In this regard, the Trustees favorably considered the procedures and policies in place by TFAI to enforce compliance with applicable laws and regulations and oversee the portfolio management activities of the Sub-Adviser. The Trustees also determined that TFAI had made a significant entrepreneurial commitment to the management and success of the Fund, reflected by TFAI's expense limitation and fee waiver arrangement with the Fund, which may result in TFAI waiving advisory fees for the benefit of shareh olders.
Transamerica IDEX Mutual Funds
Semi-Annual Report 2006
14
TA IDEX Jennison Growth
UNDERSTANDING YOUR FUND'S EXPENSES
(unaudited)
SHAREHOLDER EXPENSES
Fund shareholders may incur two types of costs: (1) transaction costs, including sales charges (loads) on purchases, contingent deferred sales charges on redemptions and redemption fees; and (2) ongoing costs, including management fees, 12b-1 distribution and service fees, and other fund expenses.
The following Example is intended to help you understand your ongoing costs (in dollars and cents) of investing in the Fund and to compare these costs with the ongoing costs of investing in other funds.
The Example is based on an investment of $1,000 invested at November 1, 2005 and held for the entire period until April 30, 2006.
ACTUAL EXPENSES
The first line in the table below provides information about actual account values and actual expenses. You may use the information in this line, together with the amount you invested, to estimate the expenses that you paid over the period. Simply divide your account value by $1,000 (for example, an $8,600 account value divided by $1,000 = 8.6), then multiply the result by the number in the first line of your Fund under the heading entitled "Expenses Paid During Period" to estimate the expenses you paid on your account during this period. If your account is an IRA, your expenses could have included a $15 annual fee. The amount of any fee paid through your account would increase the estimate of expenses you paid during the period and decrease your ending account value.
HYPOTHETICAL EXAMPLE FOR COMPARISON PURPOSES
The second line in the table below provides information about hypothetical account values and hypothetical expenses based on the Fund's actual expense ratio and an assumed rate of return of 5% per year before expenses, which is not the Fund's actual return. The hypothetical account values and expenses may not be used to estimate the actual ending account balance or expenses you paid for the period. You may use this information to compare the ongoing costs of investing in your Fund and other funds. To do so, compare this 5% hypothetical example with the 5% hypothetical examples that appear in the shareholder reports of the other funds. As in the case of the actual expense example, if your account is subject to an IRA fee, the amount of the fee paid through your account would increase the hypothetical expenses you would have paid during the period and decrease the hypothetical ending account value.
Please note that the expenses shown in the table are meant to highlight your ongoing costs only and do not reflect any transactional costs, such as sales charges, redemption fees, brokerage commissions paid on purchases and sales of fund shares. Therefore, the second line under the Fund in the table is useful in comparing ongoing costs only, and will not help you determine the relative total costs of owning different funds. If any of these transaction costs were included, your costs would be higher. The expenses shown in the table do not reflect any fees that may be charged to you by brokers, financial intermediaries or other financial institutions.
| Beginning Account Value | Ending Account Value | Annualized Expense Ratio | Expenses Paid During Period (a) | ||||||||||||||||
| Class A | |||||||||||||||||||
| Actual | $ | 1,000.00 | $ | 1,059.10 | 1.50 | % | $ | 7.66 | |||||||||||
| Hypothetical (b) | 1,000.00 | 1,017.36 | 1.50 | 7.50 | |||||||||||||||
| Class B | |||||||||||||||||||
| Actual | 1,000.00 | 1,057.10 | 1.92 | 9.79 | |||||||||||||||
| Hypothetical (b) | 1,000.00 | 1,015.27 | 1.92 | 9.59 | |||||||||||||||
| Class C | |||||||||||||||||||
| Actual | 1,000.00 | 1,057.00 | 1.99 | 10.15 | |||||||||||||||
| Hypothetical (b) | 1,000.00 | 1,014.93 | 1.99 | 9.94 | |||||||||||||||
| Class I | |||||||||||||||||||
| Actual | 1,000.00 | 1,028.40 | 0.90 | 4.15 | |||||||||||||||
| Hypothetical (b) | 1,000.00 | 1,018.65 | 0.90 | 4.13 | |||||||||||||||
(a) Expenses are calculated using the Fund's annualized expense ratio (as disclosed in the table), multiplied by the average account value for the period, multiplied by number of days in the period (181 days for Classes A, B and C, and 166 days for Class I), and divided by the number of days in the year (365 days).
(b) 5% return per year before expenses.
GRAPHICAL PRESENTATION OF SCHEDULE OF INVESTMENTS
By Sector
At April 30, 2006
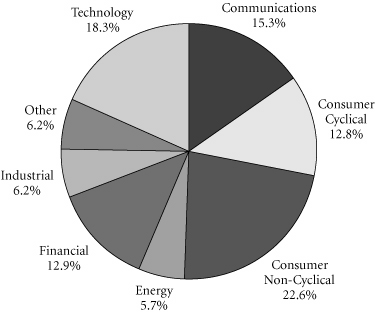
This chart shows the percentage breakdown by sector of the Fund's total investment securities.
Transamerica IDEX Mutual Funds
Semi-Annual Report 2006
1
TA IDEX Jennison Growth
SCHEDULE OF INVESTMENTS
At April 30, 2006
(all amounts except share amounts in thousands)
(unaudited)
| Shares | Value | ||||||||||
| COMMON STOCKS (98.8%) | |||||||||||
| Aerospace (1.8%) | |||||||||||
| Boeing Co. (The) | 17,100 | $ | 1,427 | ||||||||
| United Technologies Corp. | 20,100 | 1,262 | |||||||||
| Amusement & Recreation Services (1.9%) | |||||||||||
| Disney (Walt) Co. (The) | 97,700 | 2,732 | |||||||||
| Apparel & Accessory Stores (2.5%) | |||||||||||
| Chico's FAS, Inc. ‡ | 55,100 | 2,042 | |||||||||
| Kohl's Corp. ‡ | 14,200 | 793 | |||||||||
| Urban Outfitters, Inc. ‡ | 35,800 | 831 | |||||||||
| Beverages (1.9%) | |||||||||||
| PepsiCo, Inc. | 46,800 | 2,726 | |||||||||
| Business Services (1.8%) | |||||||||||
| eBay, Inc. ‡ | 76,600 | 2,636 | |||||||||
| Chemicals & Allied Products (2.6%) | |||||||||||
| Procter & Gamble Co. | 66,120 | 3,849 | |||||||||
| Commercial Banks (2.1%) | |||||||||||
| UBS AG-Registered | 26,000 | 3,038 | |||||||||
| Communications Equipment (5.2%) | |||||||||||
| Corning, Inc. ‡ | 79,200 | 2,188 | |||||||||
| Nokia Corp., ADR | 82,700 | 1,874 | |||||||||
| QUALCOMM, Inc. | 68,300 | 3,506 | |||||||||
| Computer & Data Processing Services (14.5%) | |||||||||||
| Adobe Systems, Inc. ‡ | 106,400 | 4,171 | |||||||||
| Electronic Arts, Inc. ‡ | 48,000 | 2,726 | |||||||||
| Google, Inc.–Class A ‡ | 12,200 | 5,099 | |||||||||
| Microsoft Corp. | 126,300 | 3,050 | |||||||||
| NAVTEQ Corp. ‡† | 16,300 | 677 | |||||||||
| SAP AG, ADR † | 48,200 | 2,633 | |||||||||
| Yahoo!, Inc. ‡ | 82,000 | 2,688 | |||||||||
| Computer & Office Equipment (3.5%) | |||||||||||
| Apple Computer, Inc. ‡ | 35,100 | 2,471 | |||||||||
| Cisco Systems, Inc. ‡ | 123,800 | 2,594 | |||||||||
| Department Stores (1.9%) | |||||||||||
| Federated Department Stores, Inc. | 35,600 | 2,771 | |||||||||
| Electronic & Other Electric Equipment (1.9%) | |||||||||||
| General Electric Co. | 78,200 | 2,705 | |||||||||
| Electronic Components & Accessories (8.4%) | |||||||||||
| Broadcom Corp.–Class A ‡ | 84,750 | 3,484 | |||||||||
| Marvell Technology Group, Ltd. ‡† | 57,500 | 3,283 | |||||||||
| Maxim Integrated Products, Inc. | 60,200 | 2,123 | |||||||||
| Texas Instruments, Inc. | 95,100 | 3,301 | |||||||||
| Shares | Value | ||||||||||
| Food Stores (1.7%) | |||||||||||
| Whole Foods Market, Inc. | 39,200 | $ | 2,406 | ||||||||
| Furniture & Home Furnishings Stores (0.9%) | |||||||||||
| Williams-Sonoma, Inc. | 32,700 | 1,369 | |||||||||
| Health Services (1.2%) | |||||||||||
| Caremark Rx, Inc. ‡ | 39,100 | 1,781 | |||||||||
| Hotels & Other Lodging Places (1.6%) | |||||||||||
| Marriott International, Inc.–Class A | 32,700 | 2,389 | |||||||||
| Instruments & Related Products (3.8%) | |||||||||||
| Agilent Technologies, Inc. ‡ | 69,500 | 2,670 | |||||||||
| Alcon, Inc. † | 27,800 | 2,827 | |||||||||
| Insurance (5.1%) | |||||||||||
| American International Group, Inc. | 40,900 | 2,669 | |||||||||
| Cigna Corp. | 10,000 | 1,070 | |||||||||
| UnitedHealth Group, Inc. | 44,600 | 2,218 | |||||||||
| WellPoint, Inc. ‡ | 20,800 | 1,477 | |||||||||
| Leather & Leather Products (1.4%) | |||||||||||
| Coach, Inc. ‡ | 62,900 | 2,077 | |||||||||
| Lumber & Other Building Materials (1.5%) | |||||||||||
| Home Depot, Inc. (The) | 53,700 | 2,144 | |||||||||
| Medical Instruments & Supplies (1.2%) | |||||||||||
| St. Jude Medical, Inc. ‡ | 43,500 | 1,717 | |||||||||
| Oil & Gas Extraction (4.6%) | |||||||||||
| Apache Corp. | 10,100 | 718 | |||||||||
| Occidental Petroleum Corp. | 20,300 | 2,086 | |||||||||
| Schlumberger, Ltd. | 55,800 | 3,858 | |||||||||
| Paper & Allied Products (1.0%) | |||||||||||
| 3M Co. | 16,400 | 1,401 | |||||||||
| Petroleum Refining (1.4%) | |||||||||||
| Suncor Energy, Inc. | 24,200 | 2,075 | |||||||||
| Pharmaceuticals (10.8%) | |||||||||||
| Amgen, Inc. ‡ | 42,300 | 2,864 | |||||||||
| Genentech, Inc. ‡ | 32,100 | 2,559 | |||||||||
| Gilead Sciences, Inc. ‡ | 46,500 | 2,674 | |||||||||
| Novartis AG, ADR | 54,900 | 3,157 | |||||||||
| Roche Holding AG, ADR | 35,238 | 2,701 | |||||||||
| Sanofi-Aventis, ADR | 35,400 | 1,665 | |||||||||
| Restaurants (0.8%) | |||||||||||
| Cheesecake Factory (The) ‡† | 35,200 | 1,111 | |||||||||
| Retail Trade (1.4%) | |||||||||||
| Target Corp. | 37,700 | 2,002 | |||||||||
The notes to the financial statements are an integral part of this report.
Transamerica IDEX Mutual Funds
Semi-Annual Report 2006
2
TA IDEX Jennison Growth
SCHEDULE OF INVESTMENTS (continued)
At April 30, 2006
(all amounts except share amounts in thousands)
(unaudited)
| Shares | Value | ||||||||||
| Rubber & Misc. Plastic Products (1.4%) | |||||||||||
| NIKE, Inc.–Class B | 25,800 | $ | 2,111 | ||||||||
| Security & Commodity Brokers (9.0%) | |||||||||||
| American Express Co. | 62,400 | 3,358 | |||||||||
| Charles Schwab Corp. (The) | 151,000 | 2,703 | |||||||||
| Goldman Sachs Group, Inc. (The) | 14,900 | 2,388 | |||||||||
| Legg Mason, Inc. | 12,000 | 1,422 | |||||||||
| Merrill Lynch & Co., Inc. | 41,200 | 3,142 | |||||||||
| Total Common Stocks (cost: $128,945) | 143,489 | ||||||||||
| Principal | Value | ||||||||||
| SECURITY LENDING COLLATERAL (6.5%) | |||||||||||
| Debt (6.1%) | |||||||||||
| Bank Notes (0.8%) | |||||||||||
| Bank of America 4.81%, due 06/07/2006 * $308 $308 4.81%, due 08/10/2006 * | 297 | 297 | |||||||||
| Bear Stearns & Co. 5.01%, due 06/06/2006 * 119 119 5.01%, due 09/07/2006 * | 357 | 357 | |||||||||
| Certificates Of Deposit (0.4%) | |||||||||||
| Halifax Bank of Scotland 4.78%, due 06/06/2006 * | 297 | 297 | |||||||||
| Rabobank Nederland 4.87%, due 05/31/2006 * | 298 | 298 | |||||||||
| Commercial Paper (0.3%) | |||||||||||
| Banco Santander Central Hispano SA 4.77%, due 05/02/2006 | 178 | 178 | |||||||||
| Sheffield Receivables Corp.–144A 4.81%, due 05/03/2006 | 297 | 297 | |||||||||
| Euro Dollar Overnight (1.1%) | |||||||||||
| Bank of Montreal 4.77%, due 05/02/2006 | 238 | 238 | |||||||||
| Dexia Group 4.78%, due 05/04/2006 | 298 | 298 | |||||||||
| Fortis Bank 4.77%, due 05/01/2006 | 119 | 119 | |||||||||
| Royal Bank of Canada 4.77%, due 05/01/2006 | 417 | 417 | |||||||||
| Royal Bank of Scotland 4.75%, due 05/03/2006 | 298 | 298 | |||||||||
| Svenska Handlesbanken 4.82%, due 05/01/2006 | 227 | 227 | |||||||||
| Principal | Value | ||||||||||
| Euro Dollar Terms (1.7%) | |||||||||||
| BancoBilbao Vizcaya Argentaria SA 4.95%, due 06/20/2006 | $ | 238 | $ | 238 | |||||||
| Bank of the West 4.94%, due 06/16/2006 | 238 | 238 | |||||||||
| Barclays 4.79%, due 05/10/2006 357 357 4.77%, due 05/16/2006 | 119 | 119 | |||||||||
| Canadian Imperial Bank of Commerce 4.97%, due 06/23/2006 | 178 | 178 | |||||||||
| Credit Suisse First Boston Corp. 4.73%, due 05/08/2006 | 178 | 178 | |||||||||
| Fortis Bank 4.83%, due 05/08/2006 | 119 | 119 | |||||||||
| Lloyds TSB Bank 4.81%, due 05/11/2006 | 178 | 178 | |||||||||
| Royal Bank of Scotland 4.87%, due 05/12/2006 | 238 | 238 | |||||||||
| Societe Generale 4.79%, due 05/10/2006 | 298 | 298 | |||||||||
| UBS AG 4.95%, due 06/20/2006 | 298 | 298 | |||||||||
| Repurchase Agreements (1.8%) †† | |||||||||||
| Credit Suisse First Boston Corp. 4.92%, dated 04/28/2006 to be repurchased at $404 on 05/01/2006 | 404 | 404 | |||||||||
| Goldman Sachs Group, Inc. (The) 4.92%, dated 04/28/2006 to be repurchased at $874 on 05/01/2006 | 874 | 874 | |||||||||
| Lehman Brothers, Inc. 4.92%, dated 04/28/2006 to be repurchased at $15 on 05/01/2006 | 15 | 15 | |||||||||
| Merrill Lynch & Co. 4.87%, dated 04/28/2006 to be repurchased at $893 on 05/01/2006 | 893 | 893 | |||||||||
| Morgan Stanley Dean Witter & Co. 4.93%, dated 04/28/2006 to be repurchased at $417 on 05/01/2006 | 417 | 417 | |||||||||
The notes to the financial statements are an integral part of this report.
Transamerica IDEX Mutual Funds
Semi-Annual Report 2006
3
TA IDEX Jennison Growth
SCHEDULE OF INVESTMENTS (continued)
At April 30, 2006
(all amounts except share amounts in thousands)
(unaudited)
| Shares | Value | ||||||||||
| Investment Companies (0.4%) | |||||||||||
| Barclays Global Investors Institutional Money Market Fund 1-day yield of 4.78% | 476,049 | $ | 476 | ||||||||
| Merrimac Cash Fund, Premium Class 1-day yield of 4.61% @ | 126,660 | 127 | |||||||||
| Total Security Lending Collateral (cost: $9,393) | 9,393 | ||||||||||
| Total Investment Securities (cost: $138,338) # | $ | 152,882 | |||||||||
NOTES TO SCHEDULE OF INVESTMENTS:
‡ Non-income producing.
† At April 30, 2006, all or a portion of this security is on loan (see Note 1). The value at April 30, 2006, of all securities on loan is $9,135.
* Floating or variable rate note. Rate is listed as of April 30, 2006.
†† Cash collateral for the Repurchase Agreements, valued at $2,679, that serve as collateral for securities lending are invested in corporate bonds with interest rates and maturity dates ranging from 0.00%–9.05% and 05/02/2006–12/31/2049, respectively.
@ Regulated investment company advised by Investors Bank and Trust Co. ("IBT"). IBT is also the accounting, custody and lending agent for the Fund.
# Aggregate cost for Federal income tax purposes is $138,879. Aggregate gross unrealized appreciation for all securities in which there is an excess of value over tax cost and aggregate gross unrealized depreciation for all securities in which there is an excess of tax cost over value were $16,451 and $2,448, respectively. Net unrealized appreciation for tax purposes is $14,003.
DEFINITIONS:
144A 144A Securities are registered pursuant to Rule 144A of the Securities Act of 1933. These securities are deemed to be liquid for purposes of compliance limitations on holdings of illiquid securities and may be resold as transactions exempt from registration, normally to qualified institutional buyers. At April 30, 2006, these securities aggregated $297 or 0.2% of the net assets of the Fund.
ADR American Depositary Receipt
The notes to the financial statements are an integral part of this report.
Transamerica IDEX Mutual Funds
Semi-Annual Report 2006
4
TA IDEX Jennison Growth
STATEMENT OF ASSETS AND LIABILITIES
At April 30, 2006
(all amounts except per share amounts in thousands)
(unaudited)
| Assets: | |||||||
| Investment securities, at value (cost: $138,338) (including securities loaned of $9,135) | $ | 152,882 | |||||
| Cash | 1,583 | ||||||
| Receivables: | |||||||
| Investment securities sold | 4,064 | ||||||
| Interest | 13 | ||||||
| Dividends | 43 | ||||||
| Dividend reclaims receivable | 13 | ||||||
| Other | 7 | ||||||
| 158,605 | |||||||
| Liabilities: | |||||||
| Investment securities purchased | 3,525 | ||||||
| Accounts payable and accrued liabilities: | |||||||
| Shares of beneficial interest redeemed | 278 | ||||||
| Management and advisory fees | 96 | ||||||
| Transfer agent fees | 28 | ||||||
| Administration fees | 2 | ||||||
| Payable for collateral for securities on loan | 9,393 | ||||||
| Other | 42 | ||||||
| 13,364 | |||||||
| Net Assets | $ | 145,241 | |||||
| Net Assets Consist of: | |||||||
| Shares of beneficial interest, unlimited shares authorized, no par value | $ | 124,536 | |||||
| Distributable net investment income (loss) | (245 | ) | |||||
| Accumulated net realized gain (loss) from investment securities | 6,406 | ||||||
| Net unrealized appreciation (depreciation) on investment securities | 14,544 | ||||||
| Net Assets | $ | 145,241 | |||||
| Net Assets by Class: | |||||||
| Class A | $ | 13,655 | |||||
| Class B | 25,413 | ||||||
| Class C | 8,192 | ||||||
| Class I | 97,981 | ||||||
| Shares Outstanding: | |||||||
| Class A | 1,186 | ||||||
| Class B | 2,357 | ||||||
| Class C | 758 | ||||||
| Class I | 8,487 | ||||||
| Net Asset Value Per Share: | |||||||
| Class A | $ | 11.51 | |||||
| Class B | 10.78 | ||||||
| Class C | 10.80 | ||||||
| Class I | 11.54 | ||||||
| Maximum Offering Price Per Share (a): | |||||||
| Class A | $ | 12.18 | |||||
(a) Includes the maximum selling commission (represented as a percentage of offering price) which is reduced on certain levels of sales as set forth in the Prospectus. Net asset value per share for Classes B, C, and I shares represents offering price. The redemption price for Classes B and C shares equals net asset value less any applicable contingent deferred sales charge.
STATEMENT OF OPERATIONS
For the period ended April 30, 2006 (b)
(all amounts in thousands)
(unaudited)
| Investment Income: | |||||||
| Dividends (net of withholding taxes on foreign dividends of $29) | $ | 591 | |||||
| Interest | 38 | ||||||
| Income from loaned securities–net | 5 | ||||||
| 634 | |||||||
| Expenses: | |||||||
| Management and advisory fees | 541 | ||||||
| Distribution and service fees: | |||||||
| Class A | 25 | ||||||
| Class B | 107 | ||||||
| Class C | 36 | ||||||
| Transfer agent fees: | |||||||
| Class A | 31 | ||||||
| Class B | 47 | ||||||
| Class C | 19 | ||||||
| Class I | – | (c) | |||||
| Printing and shareholder reports | 13 | ||||||
| Custody fees | 22 | ||||||
| Administration fees | 14 | ||||||
| Legal fees | 3 | ||||||
| Audit fees | 9 | ||||||
| Trustees fees | 3 | ||||||
| Registration fees | 6 | ||||||
| Total expenses | 876 | ||||||
| Net Investment Income (Loss) | (242 | ) | |||||
| Net Realized and Unrealized Gain (Loss): | |||||||
| Realized gain (loss) from investment securities | 6,954 | ||||||
| Increase (decrease) in unrealized appreciation (depreciation) on investment securities | (373 | ) | |||||
| Net Realized and Unrealized Gain (Loss) on Investment Securities | 6,581 | ||||||
| Net Increase (Decrease) in Net Assets Resulting from Operations | $ | 6,339 | |||||
(b) Class I was offered for investment on November 15, 2005.
(c) Rounds to less than $1.
The notes to the financial statements are an integral part of this report.
Transamerica IDEX Mutual Funds
Semi-Annual Report 2006
5
TA IDEX Jennison Growth
STATEMENTS OF CHANGES IN NET ASSETS
For the period or year ended
(all amounts in thousands)
| April 30, 2006 (unaudited) (a) | October 31, 2005 | ||||||||||
| Increase (Decrease) In Net Assets From: | |||||||||||
| Operations: | |||||||||||
| Net investment income (loss) | $ | (242 | ) | $ | (750 | ) | |||||
| Net realized gain (loss) from investment securities | 6,954 | 4,168 | |||||||||
| Change in unrealized appreciation (depreciation) on investment securities | (373 | ) | 11,261 | ||||||||
| 6,339 | 14,679 | ||||||||||
| Distributions to Shareholders: | |||||||||||
| From net realized gains: | |||||||||||
| Class A | (277 | ) | – | ||||||||
| Class B | (623 | ) | – | ||||||||
| Class C | (208 | ) | – | ||||||||
| Class I | (1,276 | ) | – | ||||||||
| (2,384 | ) | – | |||||||||
| Capital Share Transactions: | |||||||||||
| Proceeds from shares sold: | |||||||||||
| Class A | 381 | 31,699 | |||||||||
| Class B | 1,300 | 2,484 | |||||||||
| Class C | 151 | 3,501 | |||||||||
| Class I | 97,107 | – | |||||||||
| 98,939 | 37,684 | ||||||||||
| Dividends and distributions reinvested: | |||||||||||
| Class A | 266 | – | |||||||||
| Class B | 544 | – | |||||||||
| Class C | 189 | – | |||||||||
| Class I | 1,276 | – | |||||||||
| 2,275 | – | ||||||||||
| Cost of shares redeemed: | |||||||||||
| Class A | (54,366 | ) | (33,134 | ) | |||||||
| Class B | (10,394 | ) | (8,862 | ) | |||||||
| Class C | (3,768 | ) | (7,650 | ) | |||||||
| Class I | (261 | ) | – | ||||||||
| (68,789 | ) | (49,646 | ) | ||||||||
| Automatic conversions: | |||||||||||
| Class A | 155 | 177 | |||||||||
| Class B | (155 | ) | (177 | ) | |||||||
| – | – | ||||||||||
| 32,425 | (11,962 | ) | |||||||||
| Net increase (decrease) in net assets | 36,380 | 2,717 | |||||||||
| Net Assets: | |||||||||||
| Beginning of period | 108,861 | 106,144 | |||||||||
| End of period | $ | 145,241 | $ | 108,861 | |||||||
| Distributable Net Investment Income (Loss) | $ | (245 | ) | $ | (3 | ) | |||||
(a) Class I was offered for investment on November 15, 2005.
| April 30, 2006 (unaudited) (a) | October 31, 2005 | ||||||||||
| Share Activity: | |||||||||||
| Shares issued: | |||||||||||
| Class A | 32 | 3,083 | |||||||||
| Class B | 118 | 251 | |||||||||
| Class C | 14 | 364 | |||||||||
| Class I | 8,401 | – | |||||||||
| 8,565 | 3,698 | ||||||||||
| Shares issued–reinvested from distributions: | |||||||||||
| Class A | 23 | – | |||||||||
| Class B | 50 | – | |||||||||
| Class C | 17 | – | |||||||||
| Class I | 109 | – | |||||||||
| 199 | – | ||||||||||
| Shares redeemed: | |||||||||||
| Class A | (4,752 | ) | (3,299 | ) | |||||||
| Class B | (952 | ) | (919 | ) | |||||||
| Class C | (345 | ) | (807 | ) | |||||||
| Class I | (23 | ) | – | ||||||||
| (6,072 | ) | (5,025 | ) | ||||||||
| Automatic conversions: | |||||||||||
| Class A | 13 | 17 | |||||||||
| Class B | (14 | ) | (18 | ) | |||||||
| (1 | ) | (1 | ) | ||||||||
| Net increase (decrease) in shares outstanding: | |||||||||||
| Class A | (4,684 | ) | (199 | ) | |||||||
| Class B | (798 | ) | (686 | ) | |||||||
| Class C | (314 | ) | (443 | ) | |||||||
| Class I | 8,487 | – | |||||||||
| 2,691 | (1,328 | ) | |||||||||
The notes to the financial statements are an integral part of this report.
Transamerica IDEX Mutual Funds
Semi-Annual Report 2006
6
TA IDEX Jennison Growth
FINANCIAL HIGHLIGHTS
(unaudited for the period ended April 30, 2006)
| For a share of beneficial interest outstanding throughout each period | |||||||||||||||||||||||||||||||||||||||
| Net Asset | Investment Operations | Distributions | Net Asset | ||||||||||||||||||||||||||||||||||||
| For the Period Ended (d)(g) | Value, Beginning of Period | Net Investment Income (Loss) | Net Realized and Unrealized Gain (Loss) | Total Operations | From Net Investment Income | From Net Realized Gains | Total Distributions | Value, End of Period | |||||||||||||||||||||||||||||||
| Class A | 4/30/2006 | $ | 11.06 | $ | (0.04 | ) | $ | 0.70 | $ | 0.66 | $ | – | $ | (0.21 | ) | $ | (0.21 | ) | $ | 11.51 | |||||||||||||||||||
| 10/31/2005 | 9.52 | (0.03 | ) | 1.57 | 1.54 | – | – | – | 11.06 | ||||||||||||||||||||||||||||||
| 10/31/2004 | 8.54 | (0.07 | ) | 1.05 | 0.98 | – | – | – | 9.52 | ||||||||||||||||||||||||||||||
| 10/31/2003 | 6.88 | (0.04 | ) | 1.70 | 1.66 | – | – | – | 8.54 | ||||||||||||||||||||||||||||||
| 10/31/2002 | 8.04 | (0.05 | ) | (1.11 | ) | (1.16 | ) | – | – | – | 6.88 | ||||||||||||||||||||||||||||
| 10/31/2001 | 10.26 | (0.01 | ) | (1.17 | ) | (1.18 | ) | – | (1.04 | ) | (1.04 | ) | 8.04 | ||||||||||||||||||||||||||
| Class B | 4/30/2006 | 10.39 | (0.05 | ) | 0.65 | 0.60 | – | (0.21 | ) | (0.21 | ) | 10.78 | |||||||||||||||||||||||||||
| 10/31/2005 | 9.03 | (0.11 | ) | 1.47 | 1.36 | – | – | – | 10.39 | ||||||||||||||||||||||||||||||
| 10/31/2004 | 8.14 | (0.12 | ) | 1.01 | 0.89 | – | – | – | 9.03 | ||||||||||||||||||||||||||||||
| 10/31/2003 | 6.60 | (0.08 | ) | 1.62 | 1.54 | – | – | – | 8.14 | ||||||||||||||||||||||||||||||
| 10/31/2002 | 7.77 | (0.10 | ) | (1.07 | ) | (1.17 | ) | – | – | – | 6.60 | ||||||||||||||||||||||||||||
| 10/31/2001 | 10.01 | (0.05 | ) | (1.15 | ) | (1.20 | ) | – | (1.04 | ) | (1.04 | ) | 7.77 | ||||||||||||||||||||||||||
| Class C | 4/30/2006 | 10.41 | (0.06 | ) | 0.66 | 0.60 | – | (0.21 | ) | (0.21 | ) | 10.80 | |||||||||||||||||||||||||||
| 10/31/2005 | 9.05 | (0.12 | ) | 1.48 | 1.36 | – | – | – | 10.41 | ||||||||||||||||||||||||||||||
| 10/31/2004 | 8.14 | (0.15 | ) | 1.06 | 0.91 | – | – | – | 9.05 | ||||||||||||||||||||||||||||||
| 10/31/2003 | 6.60 | (0.09 | ) | 1.63 | 1.54 | – | – | – | 8.14 | ||||||||||||||||||||||||||||||
| Class I | 4/30/2006 | 11.43 | – | (h) | 0.32 | 0.32 | – | (0.21 | ) | (0.21 | ) | 11.54 | |||||||||||||||||||||||||||
| Ratios/Supplemental Data | |||||||||||||||||||||||||||||||
| For the Period | Total | Net Assets, End of Period | Ratio of Expenses to Average Net Assets (a) | Net Investment Income (Loss) to Average | Portfolio Turnover | ||||||||||||||||||||||||||
| Ended (g) | Return (c) | (000's) | Net (e) | Total (f) | Net Assets (a) | Rate (b) | |||||||||||||||||||||||||
| Class A | 4/30/2006 | 5.91 | % | $ | 13,655 | 1.50 | % | 1.50 | % | (0.64 | )% | 39 | % | ||||||||||||||||||
| 10/31/2005 | 16.18 | 64,920 | 1.41 | 1.41 | (0.33 | ) | 86 | ||||||||||||||||||||||||
| 10/31/2004 | 11.48 | 57,760 | 1.59 | 1.59 | (0.79 | ) | 147 | ||||||||||||||||||||||||
| 10/31/2003 | 24.13 | 18,833 | 1.75 | 1.90 | (0.54 | ) | 100 | ||||||||||||||||||||||||
| 10/31/2002 | (14.47 | ) | 21,836 | 1.75 | 1.82 | (0.52 | ) | 98 | |||||||||||||||||||||||
| 10/31/2001 | (11.08 | ) | 17,670 | 1.55 | 2.44 | (0.11 | ) | 158 | |||||||||||||||||||||||
| Class B | 4/30/2006 | 5.71 | 25,413 | 1.92 | 1.92 | (1.01 | ) | 39 | |||||||||||||||||||||||
| 10/31/2005 | 15.06 | 32,778 | 2.27 | 2.27 | (1.18 | ) | 86 | ||||||||||||||||||||||||
| 10/31/2004 | 10.93 | 34,667 | 2.24 | 2.24 | (1.37 | ) | 147 | ||||||||||||||||||||||||
| 10/31/2003 | 23.33 | 37,500 | 2.40 | 2.55 | (1.19 | ) | 100 | ||||||||||||||||||||||||
| 10/31/2002 | (15.10 | ) | 37,363 | 2.40 | 2.47 | (1.17 | ) | 98 | |||||||||||||||||||||||
| 10/31/2001 | (11.54 | ) | 31,922 | 2.20 | 3.09 | (0.76 | ) | 158 | |||||||||||||||||||||||
| Class C | 4/30/2006 | 5.70 | 8,192 | 1.99 | 1.99 | (1.09 | ) | 39 | |||||||||||||||||||||||
| 10/31/2005 | 15.03 | 11,163 | 2.37 | 2.37 | (1.20 | ) | 86 | ||||||||||||||||||||||||
| 10/31/2004 | 11.18 | 13,717 | 2.39 | 2.39 | (1.68 | ) | 147 | ||||||||||||||||||||||||
| 10/31/2003 | 23.33 | 607 | 2.40 | 2.55 | (1.19 | ) | 100 | ||||||||||||||||||||||||
| Class I | 4/30/2006 | 2.84 | 97,981 | 0.90 | 0.90 | 0.07 | 39 | ||||||||||||||||||||||||
The notes to the financial statements are an integral part of this report.
Transamerica IDEX Mutual Funds
Semi-Annual Report 2006
7
TA IDEX Jennison Growth
FINANCIAL HIGHLIGHTS (continued)
(unaudited)
NOTES TO FINANCIAL HIGHLIGHTS
(a) Annualized.
(b) Not annualized.
(c) Total Return has been calculated for the applicable period without deduction of a sales load, if any, on an initial purchase. Not annualized.
(d) Per share information is calculated based on the average number of shares outstanding.
(e) Ratio of Net Expenses to Average Net Assets is net of fee waivers and reimbursements by the investment adviser, if any (see note 2).
(f) Ratio of Total Expenses to Average Net Assets includes all expenses before fee waivers and reimbursements by the investment adviser.
(g) The inception dates for the Fund's offering of share classes were as follows:
Class C was November 11, 2002.
Class I was November 15, 2005.
(h) Rounds to less than $0.01 per share.
The notes to the financial statements are an integral part of this report.
Transamerica IDEX Mutual Funds
Semi-Annual Report 2006
8
TA IDEX Jennison Growth
NOTES TO FINANCIAL STATEMENTS
At April 30, 2006
(all amounts in thousands)
(unaudited)
NOTE 1. ORGANIZATION AND SIGNIFICANT ACCOUNTING POLICIES
Transamerica IDEX Mutual Funds is an open-end management investment company registered under the Investment Company Act of 1940, as amended (the "1940 Act").
In the normal course of business, TA IDEX Jennison Growth (the "Fund") enters into contracts that contain a variety of representations that provide general indemnifications. The Fund's maximum exposure under these arrangements is unknown, as this would involve future claims that may be made against the Fund and/or its affiliates that have not yet occurred. However, based on experience, the Fund expects the risk of loss to be remote.
This report should be read in conjunction with the current Fund prospectus, which contains more complete information about the Fund.
In preparing the Fund's financial statements in accordance with accounting principles generally accepted in the United States of America ("GAAP"), estimates or assumptions (which could differ from actual results) may be used that affect reported amounts and disclosures. The following is a summary of significant accounting policies followed by the Fund.
Multiple class operations, income and expenses: The Fund currently has four classes of shares, Class A, Class B, Class C and Class I, each with different expense levels. Classes A, B, and C are closed to new investors. Class I commenced operations on November 15, 2005. Class I is only available for investment to certain affiliated asset allocation funds. Class B shares will convert to Class A shares eight years after purchase. Income, non-class specific expenses and realized and unrealized gains and losses, are allocated daily to each class, based upon the value of shares outstanding method as permitted under Rule 18f-3 of the 1940 Act. Each class bears its own specific expenses as well as a portion of general, common expenses.
Security valuations: The Fund values its investments at the close of the New York Stock Exchange ("NYSE"), normally 4 p.m. ET, each day the NYSE is open for business. Fund investments are valued at the last sale price or closing price on the day of valuation taken from the primary exchange where the security is principally traded.
Securities traded in the over-the-counter market and listed securities for which no sale was reported on that date are valued at the last quoted bid price.
Debt securities are valued based on a price quotation or other equivalent indication of value supplied by an exchange, a pricing service or a major market maker; however, those that mature in sixty days or less are valued at amortized cost, which approximates market.
Investment company securities are valued at the net asset value of the underlying portfolio.
Other securities for which quotations are not readily available or whose values have been determined to be unreliable are valued at fair market value as determined in good faith by the Fund's Administrative Valuation Committee, under the supervision of the Board's Valuation Committee, using guidelines adopted by the Board of Trustees.
Cash: The Fund may leave cash overnight in its cash account with the custodian, Investors Bank & Trust Company ("IBT"). IBT has been contracted on behalf of the Fund to invest the excess cash into a savings account, which at April 30, 2006, was paying an interest rate of 3.24%.
Repurchase agreements: The Fund is authorized to enter into repurchase agreements. The Fund, through its custodian, IBT, receives delivery of the underlying securities, the value of which at the time of purchase is required to be an amount equal to at least 100% of the resale price. The Fund will bear the risk of value fluctuations until the security can be sold and may encounter delays and incur costs in liquidating the security. In the event of bankruptcy or insolvency of the seller, delays and costs may be incurred.
Commission recapture: The sub-adviser, to the extent consistent with the best execution and usual commission rate policies and practices, may place security transactions of the Fund with broker/dealers with which Transamerica IDEX Mutual Funds has established a Commission Recapture Program. A Commission Recapture Program is any arrangement under which a broker/dealer applies a portion of the commissions received by such broker/dealer on the security transactions to the Fund. In no event will commissions paid by the Fund be used to pay expenses that would otherwise be borne by any other funds within Transamerica IDEX Mutual Funds, or by any other party.
Recaptured commissions during the six months ended April 30, 2006, of $11 are included in net realized gains in the Statement of Operations.
Securities lending: The Fund may lend securities to qualified borrowers, with IBT acting as the Fund's lending agent. The Fund earns negotiated lenders' fees. The Fund receives cash and/or securities as collateral against the loaned securities. Cash collateral received is invested in short term, interest bearing securities. The Fund monitors the market value of securities loaned on a daily basis and requires collateral in an amount at least equal to the value of the securities loaned. Income from loaned securities on the Statement of Operations is net of fees, in the amount of $2, earned by IBT for its services.
Security transactions and investment income: Security transactions are recorded on the trade date. Security gains and losses are calculated on the specific identification basis. Dividend income, if any, is
Transamerica IDEX Mutual Funds
Semi-Annual Report 2006
9
TA IDEX Jennison Growth
NOTES TO FINANCIAL STATEMENTS (continued)
At April 30, 2006
(all amounts in thousands)
(unaudited)
NOTE 1.–(continued)
recorded on the ex-dividend date or, in the case of foreign securities, as soon as the Fund is informed of the ex-dividend date. Interest income, including accretion of discounts and amortization of premiums, is recorded on the accrual basis commencing on the settlement date.
Redemption fees: A short-term trading redemption fee may be assessed on any Fund shares in a fund account that are sold during the first five (5) NYSE trading days following their purchase date. This redemption fee will equal 2% of the amount redeemed and shares held the longest will be treated as being redeemed first and shares held the shortest as being redeemed last. For the six months ended April 30, 2006, the Fund received less than $1 in redemption fees.
Dividend distributions: Distributions to shareholders are recorded on the ex-dividend date and are determined in accordance with Federal income tax regulations which may differ from GAAP.
NOTE 2. RELATED PARTY TRANSACTIONS
Transamerica Fund Advisors, Inc. ("TFAI") is the Fund's investment adviser. Transamerica Fund Services, Inc. ("TFS") is the Fund's administrator and transfer agent. AFSG Securities Corp. ("AFSG") is the Fund's distributor/principal underwriter. TFAI, TFS, and AFSG are affiliates of AEGON, NV, a Netherlands corporation.
Certain officers and trustees of the Fund are also officers and/or directors of TFAI, TFS and AFSG.
The following schedule reflects the percentage of Fund assets owned by affiliated investment companies at April 30, 2006:
| Net Assets | % of Net Assets | ||||||||||
| TA IDEX Asset Allocation – Growth Portfolio | $ | 98,024 | 67.49 | % | |||||||
| Total | $ | 98,024 | 67.49 | % | |||||||
Investment advisory fees: The Fund pays management fees to TFAI based on average daily net assets ("ANA") at the following breakpoints:
From November 1, 2005 to December 31, 2005:
0.80% of the first $500 million of ANA
0.70% of ANA over $500 million
From January 1, 2006 on:
0.80% of the first $250 million of ANA
0.775% of the next $250 million of ANA
0.70% of the next $500 million of ANA
0.675% of the next $500 million of ANA
0.65% of ANA over $1.5 billion
TFAI has contractually agreed to waive its advisory fee and will reimburse the Fund to the extent that operating expenses, excluding 12b-1 fees, exceed the following stated annual limit:
1.40% Expense Limit
Distribution and service fees: The Fund has a 12b-1 distribution plan under the 1940 Act pursuant to which an annual fee, based on average daily net assets, is paid to the distributor for various disbursements such as broker-dealer account servicing fees and other promotional expenses of the Fund. The Fund is authorized under the 12b-1 plan to pay fees on each class up to the following limits:
| Class A | 0.35 | % | |||||
| Class B | 1.00 | % | |||||
| Class C | 1.00 | % | |||||
| Class I | N/A | ||||||
From February 28, 2006 through March 1, 2007, the Fund will not pay 12b-1 fees under these plans.
Underwriter commissions relate to front-end sales charges imposed for Class A shares and contingent deferred sales charges from Classes B, C, and certain A share redemptions. For the six months ended April 30, 2006, the underwriter commissions were as follows:
| Received by Underwriter | $ | 10 | |||||
| Retained by Underwriter | 1 | ||||||
| Contingent Deferred Sales Charge | 6 | ||||||
Administrative services: The Fund has entered into an agreement with TFS for financial and legal fund administration services. The Fund pays TFS an annual fee of 0.02% of ANA. The Legal fees on the Statement of Operations are fees paid to external legal counsel.
Transfer agent fees: The Fund pays TFS an annual per-account charge for each open and closed account. The Fund paid TFS $92 for the six months ended April 30, 2006.
Brokerage commissions: Brokerage commissions incurred on security transactions placed with an affiliate of the adviser for the six months ended April 30, 2006, were less than $1.
Deferred compensation plan: Each eligible independent Fund Trustee may elect to participate in a non-qualified deferred compensation plan maintained by Transamerica IDEX Mutual Funds (the "Plan"). Under
Transamerica IDEX Mutual Funds
Semi-Annual Report 2006
10
TA IDEX Jennison Growth
NOTES TO FINANCIAL STATEMENTS (continued)
At April 30, 2006
(all amounts in thousands)
(unaudited)
NOTE 2.–(continued)
the Plan, such Trustees may defer payment of all or a portion of their total fees earned as a Fund Trustee. Each Trustee who is a participant in the Plan may elect that the earnings, losses or gains credited to his or her deferred fee amounts be determined based on a deemed investment in any series of Transamerica IDEX Mutual Funds, including the Fund. The right of a participant to receive a distribution from the Plan of the deferred fees is an unsecured claim against the general assets of all series of Transamerica IDEX Mutual Funds. The pro rata liability to the Fund of all deferred fees in the Plan amounted, as of April 30, 2006, to $7.
NOTE 3. INVESTMENT TRANSACTIONS
The cost of securities purchased and proceeds from securities sold (excluding short-term securities) for the six months ended April 30, 2006, were as follows:
| Purchases of securities: | |||||||
| Long-Term | $ | 80,005 | |||||
| U.S. Government | – | ||||||
| Proceeds from maturities and sales of securities: | |||||||
| Long-Term | 51,039 | ||||||
| U.S. Government | – | ||||||
NOTE 4. FEDERAL INCOME TAX MATTERS
The Fund has not made any provision for federal income or excise taxes due to its policy to distribute all of its taxable income and capital gains to its shareholders and otherwise qualify as a regulated investment company under Subchapter M of the Internal Revenue Code. Income and capital gain distributions are determined in accordance with income tax regulations, which may differ from GAAP. These differences are primarily due to differing treatment for items including, but not limited to, wash sales.
NOTE 5. REGULATORY PROCEEDINGS
There continues to be significant federal and state regulatory activity relating to financial services companies, particularly mutual fund companies and their investment advisers. As part of an ongoing investigation regarding potential market timing, recordkeeping and trading compliance issues and matters affecting the Fund's investment adviser, TFAI, and certain affiliates and former employees of TFAI, the SEC staff has indicated that it is likely to take some action against TFAI and certain of its affiliates at the conclusion of the investigation. The potential timing and the scope of any such action is difficult to predict. Although the impact of any action brought against TFAI and/or its affiliates is difficult to assess at the present time, the Fund currently believes that the likelihood that any such action will have a material adverse impact on it is remote. It is important to note that the Fund is not aware of any allegation of wrongdoing against it and its Board at the time this semi-annual report is printed. Although it is not anticipated that these developments will have an adverse impact on the Fund, there can be no assurance at this time. TFAI and its affiliates are actively working with the SEC in regard to this matter; however, the exact resolution cannot be determined at this time. TFAI will take such actions that it deems necessary or appropriate to continue providing management services to the Fund and to bring all matters to an appropriate conclusion.
TFAI and/or its affiliates, and not the Fund, will bear the costs regarding these regulatory matters.
Transamerica IDEX Mutual Funds
Semi-Annual Report 2006
11
TA IDEX Jennison Growth
INVESTMENT ADVISORY AND SUB-ADVISORY AGREEMENTS – REVIEW AND RENEWAL (unaudited)
At a meeting of the Board of Trustees of Transamerica IDEX Mutual Funds ("TA IDEX") held on November 2, 2005, the Board reviewed and considered the Investment Advisory Agreement between TA IDEX Jennison Growth (the "Fund") and Transamerica Fund Advisors, Inc. ("TFAI"), as well as the Investment Sub-Advisory Agreement of the Fund between TFAI and Jennison Associates LLC (the "Sub-Adviser"), to determine whether the agreements should be renewed for a one-year period. Following their review and consideration, the Trustees determined that the Investment Advisory Agreement and the Investment Sub-Advisory Agreement will enable shareholders of the Fund to obtain high quality services at a cost that is appropriate, reasonable, and in the best interests of its shareholders. The Board, including the independent members of the Board, unanimously approved the renewal of the Investment Advisory Agreement and the Investment Sub-Advisory Agree ment. In reaching their decision, the Trustees requested and obtained from TFAI and the Sub-Adviser such information as they deemed reasonably necessary to evaluate the proposed agreements. The Trustees also carefully considered the information that they had received throughout the year from TFAI and the Sub-Adviser (such as in-person presentations by the Sub-Adviser) as part of their regular oversight of the Fund, as well as: comparative fee, expense and performance information prepared by Lipper Inc. ("Lipper"), independent providers of mutual fund performance, fee and expense information, and profitability data. In considering the proposed continuation of the Investment Advisory Agreement and the Investment Sub-Advisory Agreement, the Trustees evaluated a number of considerations that they believe, in light of the legal advice furnished to them by TA IDEX counsel and independent legal counsel and their own business judgment, to be relevant. They based their decisions on the following considerations, among others, although they did not identify any consideration or particular information that was controlling of their decisions:
The nature, extent and quality of the advisory service to be provided. The Board considered the nature and quality of the services provided by TFAI and the Sub-Adviser to the Fund in the past, as well as the services anticipated to be provided in the future. The Board concluded that TFAI and the Sub-Adviser are capable of providing high quality services to the Fund, as indicated by the nature and quality of services provided in the past, TFAI's and the Sub-Adviser's management capabilities demonstrated with respect to the funds they manage, including the Fund, and the experience, capability and integrity of TFAI's senior management, the financial resources of TFAI and the Sub-Adviser, TFAI's management oversight process, the professional qualifications and experience of the Sub-Adviser's portfolio management team, and the Fund's investment performance . The Trustees also concluded that TFAI and the Sub-Adviser proposed to provide investment and related services that were of the same quality and quantity as services provided to the Fund in the past, and that these services are appropriate in scope and extent in light of the Fund's operations, the competitive landscape of the investment company business and investor needs, and that TFAI's and the Sub-Adviser's obligations will remain substantially the same.
The investment performance of the Fund. The Board examined both the short-term and longer-term performance of the Fund, including relative performance against a benchmark securities index and a peer group of comparable mutual funds as prepared by Lipper, for various trailing periods ended June 30, 2005. The Trustees conclude that TFAI and the Sub-Adviser generally had achieved superior investment performance, noting the superior performance of the Fund relative to its peers and the benchmark index over the past one-, two- and three-year periods, although the performance of the Fund was at median compared to its peers and approximated the benchmark index over the past five-year period. On the basis of the Trustees' assessment of the nature, extent and quality of advisory services to be provided or procured by TFAI and the Sub-Adviser, the Trustees conc luded that TFAI and the Sub-Adviser are capable of generating a level of investment performance that is appropriate in light of the Fund's investment objective, policies and strategies and competitive with many other investment companies, and also determined that TFAI's and the Sub-Adviser's performance records indicate that their continued management is likely to benefit the Fund and its shareholders.
The cost of advisory services provided and the level of profitability. The Board favorably noted the Fund's new pricing schedule, which results in lower asset-based management and sub-advisory fee breakpoints, which, based upon current asset levels, should result in lower management fees to the benefit of the Fund and its shareholders. The Board reviewed profitability information regarding TFAI's costs of procuring portfolio management services, as well as the costs of provision of administration, transfer agency, fund accounting and other services, to the Fund and to TA IDEX as a whole by TFAI and its affiliates. The Trustees reviewed data from Lipper that compared the Fund's management fees (including management fees at various asset levels), other fees and expenses (including total expenses including and excluding 12b-1 distribution and service fee s) and portfolio turnover rate against a peer group of comparable mutual funds. Based on such information, the Trustees determined that the management fees and overall expense ratio of the Fund generally are consistent with industry averages. In addition, on the basis of the Board's review of the management fees to be charged by TFAI for investment advisory and related services, TFAI profitability information (derived from TFAI's audited financial statements), TFAI's estimated management income resulting from its management of the Fund, the estimated margin of the Sub-Adviser, as well as the entirety of TFAI's and its affiliates' service relationship with TA IDEX, the Board concluded that the level of investment
Transamerica IDEX Mutual Funds
Semi-Annual Report 2006
12
TA IDEX Jennison Growth (continued)
management fees and other service fees, as well as TFAI's and the Sub-Adviser's profitability, are appropriate in light of the services provided, the management fees and overall expense ratios of comparable investment companies and the anticipated profitability of the relationship between the Fund, TFAI and its affiliates, and the Sub-Adviser.
Whether fee levels reflect economies of scale and the extent to which economies of scale would be realized as the Fund grows. The Board concluded that the inclusion of asset-based breakpoints in the Fund's advisory fee schedule appropriately benefits investors by realizing economies of scale in the form of lower management fees as the level of assets grows. The Board noted that Fund is closed to new investors and will be closed to new investments in the near future, except that the Fund may continue selling shares to other TA IDEX funds and other investment companies in the same group of investment companies as TA IDEX, which may limit, to an extent, the ability of the Fund to realize economies of scale. In addition, the Board assessed the current asset levels of the Fund and the long-term development strategy for the Fund, including continued investm ents by the TA IDEX asset allocation funds, and concluded that the Fund's current management fees appropriately reflect the Fund's current size, the current economic environment for TFAI, the competitive nature of the investment company market, and TFAI's pricing strategy. The Trustees also concluded that they will have the opportunity to periodically reexamine whether the Fund has achieved economies of scale, and the appropriateness of management fees payable to TFAI and fees payable by TFAI to the Sub-Adviser, in the future.
Benefits (such as soft dollars) to TFAI, its affiliates, or the Sub-Adviser from their relationship with the Fund. The Board concluded that other benefits derived by TFAI, its affiliates, and the Sub-Adviser from their relationship with the Fund, including "soft dollar" benefits (if any) in connection with brokerage transactions, sales charges and distribution/service fees (to the extent applicable) are reasonable and fair, and are consistent with industry practice and the best interests of the Fund and its shareholders. In this regard, the Board noted that TFAI does not realize "soft dollar" benefits from its relationship with the Fund, and that the Sub-Adviser is participating in a brokerage program pursuant to which a portion of brokerage commissions paid by the Fund is recaptured for the benefit of the Fund and its shareholders, thus limiting the amount of "soft-dollar" arrangements the Sub-Adviser may engage in with respect to the Fund's brokerage transactions. In addition, the Trustees determined that the administration, transfer agency, fund accounting and other fees paid by the Fund to affiliates of TFAI are reasonable, fair and in the best interests of shareholders in light of the nature and quality of the services provided, the associated costs to these affiliates of providing the services, the impact of the costs of such services on the Fund's overall operating expenses, and the necessity of the services for the Fund's operations.
Other considerations. The Board determined that TFAI had made a substantial commitment to the recruitment and retention of high quality personnel, and maintained the financial, compliance and operational resources reasonably necessary to manage the Fund in a professional manner that is consistent with the best interests of the Fund and its shareholders. In this regard, the Trustees favorably considered the procedures and policies in place by TFAI to enforce compliance with applicable laws and regulations and oversee the portfolio management activities of the Sub-Adviser. The Trustees also determined that TFAI had made a significant entrepreneurial commitment to the management and success of the Fund, reflected by TFAI's expense limitation and fee waiver arrangement with the Fund, which may result in TFAI waiving advisory fees for the benefit of shareh olders.
Transamerica IDEX Mutual Funds
Semi-Annual Report 2006
13
TA IDEX Marsico Growth
UNDERSTANDING YOUR FUND'S EXPENSES
(unaudited)
SHAREHOLDER EXPENSES
Fund shareholders may incur two types of costs: (1) transaction costs, including sales charges (loads) on purchases, contingent deferred sales charges on redemptions and redemption fees; and (2) ongoing costs, including management fees, 12b-1 distribution and service fees, and other fund expenses.
The following Example is intended to help you understand your ongoing costs (in dollars and cents) of investing in the Fund and to compare these costs with the ongoing costs of investing in other funds.
The Example is based on an investment of $1,000 invested at November 1, 2005 and held for the entire period until April 30, 2006.
ACTUAL EXPENSES
The first line in the table below provides information about actual account values and actual expenses. You may use the information in this line, together with the amount you invested, to estimate the expenses that you paid over the period. Simply divide your account value by $1,000 (for example, an $8,600 account value divided by $1,000 = 8.6), then multiply the result by the number in the first line of your Fund under the heading entitled "Expenses Paid During Period" to estimate the expenses you paid on your account during this period. If your account is an IRA, your expenses could have included a $15 annual fee. The amount of any fee paid through your account would increase the estimate of expenses you paid during the period and decrease your ending account value.
HYPOTHETICAL EXAMPLE FOR COMPARISON PURPOSES
The second line in the table below provides information about hypothetical account values and hypothetical expenses based on the Fund's actual expense ratio and an assumed rate of return of 5% per year before expenses, which is not the Fund's actual return. The hypothetical account values and expenses may not be used to estimate the actual ending account balance or expenses you paid for the period. You may use this information to compare the ongoing costs of investing in your Fund and other funds. To do so, compare this 5% hypothetical example with the 5% hypothetical examples that appear in the shareholder reports of the other funds. As in the case of the actual expense example, if your account is subject to an IRA fee, the amount of the fee paid through your account would increase the hypothetical expenses you would have paid during the period and decrease the hypothetical ending account value.
Please note that the expenses shown in the table are meant to highlight your ongoing costs only and do not reflect any transactional costs, such as sales charges, redemption fees, brokerage commissions paid on purchases and sales of fund shares. Therefore, the second line under the Fund in the table is useful in comparing ongoing costs only, and will not help you determine the relative total costs of owning different funds. If any of these transaction costs were included, your costs would be higher. The expenses shown in the table do not reflect any fees that may be charged to you by brokers, financial intermediaries or other financial institutions.
| Beginning Account Value | Ending Account Value | Annualized Expense Ratio | Expenses Paid During Period (a) | ||||||||||||||||
| Class A | |||||||||||||||||||
| Actual | $ | 1,000.00 | $ | 1,091.10 | 1.40 | % | $ | 7.26 | |||||||||||
| Hypothetical (b) | 1,000.00 | 1,017.85 | 1.40 | 7.00 | |||||||||||||||
| Class B | |||||||||||||||||||
| Actual | 1,000.00 | 1,088.50 | 1.88 | 9.74 | |||||||||||||||
| Hypothetical (b) | 1,000.00 | 1,015.47 | 1.88 | 9.39 | |||||||||||||||
| Class C | |||||||||||||||||||
| Actual | 1,000.00 | 1,089.70 | 1.79 | 9.27 | |||||||||||||||
| Hypothetical (b) | 1,000.00 | 1,015.92 | 1.79 | 8.95 | |||||||||||||||
| Class I | |||||||||||||||||||
| Actual | 1,000.00 | 1,062.10 | 0.89 | 4.17 | |||||||||||||||
| Hypothetical (b) | 1,000.00 | 1,018.69 | 0.89 | 4.09 | |||||||||||||||
(a) Expenses are calculated using the Fund's annualized expense ratio (as disclosed in the table), multiplied by the average account value for the period, multiplied by number of days in the period (181 days for Classes A, B and C, and 166 days for Class I), and divided by the number of days in the year (365 days).
(b) 5% return per year before expenses.
GRAPHICAL PRESENTATION OF SCHEDULE OF INVESTMENTS
By Sector
At April 30, 2006
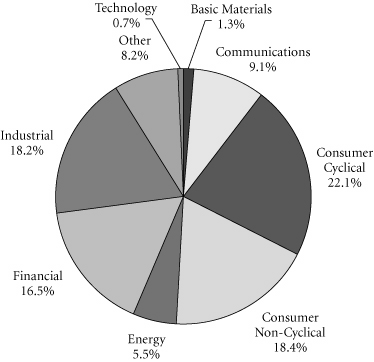
This chart shows the percentage breakdown by region of the Fund's total investment securities.
Transamerica IDEX Mutual Funds
Semi-Annual Report 2006
1
TA IDEX Marsico Growth
SCHEDULE OF INVESTMENTS
At April 30, 2006
(all amounts except share amounts in thousands)
(unaudited)
| Shares | Value | ||||||||||
| COMMON STOCKS (98.0%) | |||||||||||
| Aerospace (5.3%) | |||||||||||
| General Dynamics Corp. | 52,484 | $ | 3,444 | ||||||||
| Lockheed Martin Corp. | 28,339 | 2,151 | |||||||||
| United Technologies Corp. | 31,125 | 1,955 | |||||||||
| Air Transportation (4.5%) | |||||||||||
| FedEx Corp. | 55,133 | 6,347 | |||||||||
| Amusement & Recreation Services (0.5%) | |||||||||||
| Station Casinos, Inc. † | 8,522 | 657 | |||||||||
| Automotive (1.9%) | |||||||||||
| Toyota Motor Corp., ADR | 23,437 | 2,745 | |||||||||
| Chemicals & Allied Products (4.0%) | |||||||||||
| Air Products & Chemicals, Inc. | 2,768 | 190 | |||||||||
| Monsanto Co. | 3,712 | 310 | |||||||||
| Procter & Gamble Co. | 88,141 | 5,131 | |||||||||
| Commercial Banks (4.3%) | |||||||||||
| UBS AG-Registered | 51,566 | 6,025 | |||||||||
| Communication (1.5%) | |||||||||||
| Comcast Corp.–Class A ‡ | 69,711 | 2,158 | |||||||||
| Communications Equipment (6.1%) | |||||||||||
| Motorola, Inc. | 183,428 | 3,916 | |||||||||
| QUALCOMM, Inc. | 93,182 | 4,784 | |||||||||
| Computer & Office Equipment (0.6%) | |||||||||||
| Cisco Systems, Inc. ‡ | 39,281 | 823 | |||||||||
| Construction (1.5%) | |||||||||||
| KB Home † | 33,678 | 2,074 | |||||||||
| Drug Stores & Proprietary Stores (0.8%) | |||||||||||
| Walgreen Co. | 26,219 | 1,099 | |||||||||
| Electronic Components & Accessories (0.8%) | |||||||||||
| Texas Instruments, Inc. | 31,709 | 1,101 | |||||||||
| Food & Kindred Products (0.2%) | |||||||||||
| Archer-Daniels-Midland Co. | 8,497 | 309 | |||||||||
| Health Services (0.5%) | |||||||||||
| Quest Diagnostics, Inc. | 12,825 | 715 | |||||||||
| Hotels & Other Lodging Places (6.9%) | |||||||||||
| Las Vegas Sands Corp. ‡ | 40,712 | 2,639 | |||||||||
| MGM Mirage, Inc. †‡ | 91,643 | 4,115 | |||||||||
| Wynn Resorts, Ltd. †‡ | 40,300 | 3,067 | |||||||||
| Industrial Machinery & Equipment (3.8%) | |||||||||||
| Caterpillar, Inc. | 60,038 | 4,547 | |||||||||
| Deere & Co. | 9,395 | 825 | |||||||||
| Shares | Value | ||||||||||
| Insurance (6.8%) | |||||||||||
| Progressive Corp. (The) | 13,233 | $ | 1,436 | ||||||||
| UnitedHealth Group, Inc. | 164,512 | 8,183 | |||||||||
| Leather & Leather Products (0.7%) | |||||||||||
| Coach, Inc. ‡ | 31,329 | 1,034 | |||||||||
| Life Insurance (0.3%) | |||||||||||
| Genworth Financial, Inc.–Class A | 11,239 | 373 | |||||||||
| Lumber & Other Building Materials (5.1%) | |||||||||||
| Home Depot, Inc. (The) | 72,772 | 2,906 | |||||||||
| Lowe's Cos., Inc. | 68,743 | 4,334 | |||||||||
| Medical Instruments & Supplies (2.1%) | |||||||||||
| Medtronic, Inc. | 58,293 | 2,922 | |||||||||
| Metal Mining (1.0%) | |||||||||||
| Cia Vale do Rio Doce, ADR | 28,266 | 1,456 | |||||||||
| Mining (1.2%) | |||||||||||
| Peabody Energy Corp. | 27,005 | 1,724 | |||||||||
| Oil & Gas Extraction (4.7%) | |||||||||||
| Halliburton Co. | 44,546 | 3,481 | |||||||||
| Schlumberger, Ltd. | 46,120 | 3,189 | |||||||||
| Personal Credit Institutions (1.9%) | |||||||||||
| SLM Corp. | 50,461 | 2,668 | |||||||||
| Pharmaceuticals (7.4%) | |||||||||||
| Amylin Pharmaceuticals, Inc. †‡ | 46,621 | 2,030 | |||||||||
| Genentech, Inc. ‡ | 93,305 | 7,437 | |||||||||
| Genzyme Corp. ‡ | 17,388 | 1,063 | |||||||||
| Railroads (5.8%) | |||||||||||
| Burlington Northern Santa Fe Corp. | 61,634 | 4,902 | |||||||||
| Union Pacific Corp. | 37,094 | 3,383 | |||||||||
| Real Estate (0.6%) | |||||||||||
| St. Joe Co. (The) † | 15,962 | 896 | |||||||||
| Residential Building Construction (1.5%) | |||||||||||
| Lennar Corp.–Class A | 28,361 | 1,558 | |||||||||
| Toll Brothers, Inc. ‡ | 17,170 | 552 | |||||||||
| Restaurants (3.7%) | |||||||||||
| Starbucks Corp. ‡ | 58,641 | 2,186 | |||||||||
| Yum! Brands, Inc. | 59,421 | 3,071 | |||||||||
| Retail Trade (1.0%) | |||||||||||
| Target Corp. | 27,533 | 1,462 | |||||||||
| Security & Commodity Brokers (9.5%) | |||||||||||
| Chicago Mercantile Exchange † | 7,790 | 3,568 | |||||||||
| Goldman Sachs Group, Inc. (The) | 25,098 | 4,023 | |||||||||
| Lehman Brothers Holdings, Inc. | 39,259 | 5,934 | |||||||||
The notes to the financial statements are an integral part of this report.
Transamerica IDEX Mutual Funds
Semi-Annual Report 2006
2
TA IDEX Marsico Growth
SCHEDULE OF INVESTMENTS (continued)
At April 30, 2006
(all amounts except share amounts in thousands)
(unaudited)
| Shares | Value | ||||||||||
| Telecommunications (1.5%) | |||||||||||
| America Movil SA de CV–Class L, ADR | 57,129 | $ | 2,109 | ||||||||
| Total Common Stocks (cost: $111,954) | 139,007 | ||||||||||
| Principal | Value | ||||||||||
| SECURITY LENDING COLLATERAL (8.6%) | |||||||||||
| Debt (8.1%) | |||||||||||
| Bank Notes (1.0%) | |||||||||||
| Bank of America 4.81%, due 06/07/2006 * $403 $403 4.81%, due 08/10/2006 * | 389 | 389 | |||||||||
| Bear Stearns & Co. 5.01%, due 06/06/2006 * 156 156 5.01%, due 09/07/2006 * | 467 | 467 | |||||||||
| Certificates Of Deposit (0.6%) | |||||||||||
| Halifax Bank of Scotland 4.78%, due 06/06/2006 * | 389 | 389 | |||||||||
| Rabobank Nederland 4.87%, due 05/31/2006 * | 389 | 389 | |||||||||
| Commercial Paper (0.4%) | |||||||||||
| Banco Santander Central Hispano SA 4.77%, due 05/02/2006 | 233 | 233 | |||||||||
| Sheffield Receivables Corp.–144A 4.81%, due 05/03/2006 | 388 | 388 | |||||||||
| Euro Dollar Overnight (1.5%) | |||||||||||
| Bank of Montreal 4.77%, due 05/02/2006 | 311 | 311 | |||||||||
| Dexia Group 4.78%, due 05/04/2006 | 389 | 389 | |||||||||
| Fortis Bank 4.77%, due 05/01/2006 | 156 | 156 | |||||||||
| Royal Bank of Canada 4.77%, due 05/01/2006 | 544 | 544 | |||||||||
| Royal Bank of Scotland 4.75%, due 05/03/2006 | 389 | 389 | |||||||||
| Svenska Handlesbanken 4.82%, due 05/01/2006 | 297 | 297 | |||||||||
| Euro Dollar Terms (2.2%) | |||||||||||
| BancoBilbao Vizcaya Argentaria SA 4.95%, due 06/20/2006 | 311 | 311 | |||||||||
| Bank of the West 4.94%, due 06/16/2006 | 311 | 311 | |||||||||
| Barclays 4.79%, due 05/10/2006 467 467 4.77%, due 05/16/2006 | 156 | 156 | |||||||||
| Principal | Value | ||||||||||
| Euro Dollar Terms (continued) | |||||||||||
| Canadian Imperial Bank of Commerce 4.97%, due 06/23/2006 | $ | 233 | $ | 233 | |||||||
| Credit Suisse First Boston Corp. 4.73%, due 05/08/2006 | 233 | 233 | |||||||||
| Fortis Bank 4.83%, due 05/08/2006 | 156 | 156 | |||||||||
| Lloyds TSB Bank 4.81%, due 05/11/2006 | 233 | 233 | |||||||||
| Royal Bank of Scotland 4.87%, due 05/12/2006 | 311 | 311 | |||||||||
| Societe Generale 4.79%, due 05/10/2006 | 389 | 389 | |||||||||
| UBS AG 4.95%, due 06/20/2006 | 389 | 389 | |||||||||
| Repurchase Agreements (2.4%) †† | |||||||||||
| Credit Suisse First Boston Corp. 4.92%, dated 04/28/2006 to be repurchased at $528 on 05/01/2006 | 528 | 528 | |||||||||
| Goldman Sachs Group, Inc. (The) 4.92%, dated 04/28/2006 to be repurchased at $1,143 on 05/01/2006 | 1,142 | 1,142 | |||||||||
| Lehman Brothers, Inc. 4.92%, dated 04/28/2006 to be repurchased at $19 on 05/01/2006 | 19 | 19 | |||||||||
| Merrill Lynch & Co. 4.87%, dated 04/28/2006 to be repurchased at $1,167 on 05/01/2006 | 1,166 | 1,166 | |||||||||
| Morgan Stanley Dean Witter & Co. 4.93%, dated 04/28/2006 to be repurchased at $545 on 05/01/2006 | 544 | 544 | |||||||||
| Shares | Value | ||||||||||
| Investment Companies (0.5%) | |||||||||||
| Barclays Global Investors Institutional Money Market Fund 1-day yield of 4.78% | 622,116 | $ | 622 | ||||||||
| Merrimac Cash Fund, Premium Class 1-day yield of 4.61% @ | 165,524 | 165 | |||||||||
| Total Security Lending Collateral (cost: $12,275) | 12,275 | ||||||||||
| Total Investment Securities (cost: $124,229) # | $ | 151,282 | |||||||||
The notes to the financial statements are an integral part of this report.
Transamerica IDEX Mutual Funds
Semi-Annual Report 2006
3
TA IDEX Marsico Growth
SCHEDULE OF INVESTMENTS (continued)
At April 30, 2006
(all amounts except share amounts in thousands)
(unaudited)
NOTES TO SCHEDULE OF INVESTMENTS:
† At April 30, 2006, all or a portion of this security is on loan (see Note 1). The value at April 30, 2006, of all securities on loan is $11,930.
‡ Non-income producing.
* Floating or variable rate note. Rate is listed as of April 30, 2006.
†† Cash collateral for the Repurchase Agreements, valued at $3,501, that serve as collateral for securities lending are invested in corporate bonds with interest rates and maturity dates ranging from 0.00%–9.05% and 05/02/2006–12/31/2049, respectively.
@ Regulated investment company advised by Investors Bank and Trust Co. ("IBT"). IBT is also the accounting, custody and lending agent for the Fund.
# Aggregate cost for Federal income tax purposes is $124,286. Aggregate gross unrealized appreciation for all securities in which there is an excess of value over tax cost and aggregate gross unrealized depreciation for all securities in which there is an excess of tax cost over value were $28,083 and $1,087, respectively. Net unrealized appreciation for tax purposes is $26,996.
DEFINITIONS:
144A 144A Securities are registered pursuant to Rule 144A of the Securities Act of 1933. These securities are deemed to be liquid for purposes of compliance limitations on holdings of illiquid securities and may be resold as transactions exempt from registration, normally to qualified institutional buyers. At April 30, 2006, these securities aggregated $388 or 0.3% of the net assets of the Fund.
ADR American Depositary Receipt
The notes to the financial statements are an integral part of this report.
Transamerica IDEX Mutual Funds
Semi-Annual Report 2006
4
TA IDEX Marsico Growth
STATEMENT OF ASSETS AND LIABILITIES
At April 30, 2006
(all amounts except per share amounts in thousands)
(unaudited)
| Assets: | |||||||
| Investment securities, at value (cost: $124,229) (including securities loaned of $11,930) | $ | 151,282 | |||||
| Cash | 2,320 | ||||||
| Receivables: | |||||||
| Investment securities sold | 2,998 | ||||||
| Interest | 12 | ||||||
| Dividends | 103 | ||||||
| Dividend reclaims receivable | 26 | ||||||
| Other | 4 | ||||||
| 156,745 | |||||||
| Liabilities: | |||||||
| Investment securities purchased | 2,141 | ||||||
| Accounts payable and accrued liabilities: | |||||||
| Shares of beneficial interest redeemed | 307 | ||||||
| Management and advisory fees | 94 | ||||||
| Transfer agent fees | 12 | ||||||
| Administration fees | 2 | ||||||
| Payable for collateral for securities on loan | 12,275 | ||||||
| Other | 24 | ||||||
| 14,855 | |||||||
| Net Assets | $ | 141,890 | |||||
| Net Assets Consist of: | |||||||
| Shares of beneficial interest, unlimited shares authorized, no par value | $ | 120,621 | |||||
| Distributable net investment income (loss) | (155 | ) | |||||
| Accumulated net realized gain (loss) from investment securities | (5,629 | ) | |||||
| Net unrealized appreciation (depreciation) on investment securities | 27,053 | ||||||
| Net Assets | $ | 141,890 | |||||
| Net Assets by Class: | |||||||
| Class A | $ | 11,071 | |||||
| Class B | 18,672 | ||||||
| Class C | 9,843 | ||||||
| Class I | 102,304 | ||||||
| Shares Outstanding: | |||||||
| Class A | 983 | ||||||
| Class B | 1,745 | ||||||
| Class C | 921 | ||||||
| Class I | 9,062 | ||||||
| Net Asset Value Per Share: | |||||||
| Class A | $ | 11.26 | |||||
| Class B | 10.70 | ||||||
| Class C | 10.69 | ||||||
| Class I | 11.29 | ||||||
| Maximum Offering Price Per Share (a): | |||||||
| Class A | $ | 11.92 | |||||
(a) Includes the maximum selling commission (represented as a percentage of offering price) which is reduced on certain levels of sales as set forth in the Prospectus. Net asset value per share for Classes B, C and I shares represents offering price. The redemption price for Classes B and C shares equals net asset value less any applicable contingent deferred sales charge.
STATEMENT OF OPERATIONS
For the period ended April 30, 2006 (b)
(all amounts in thousands)
(unaudited)
| Investment Income: | |||||||
| Dividends (net of withholding taxes on foreign dividends of $19) | $ | 594 | |||||
| Interest | 44 | ||||||
| Income from loaned securities–net | 45 | ||||||
| 683 | |||||||
| Expenses: | |||||||
| Management and advisory fees | 571 | ||||||
| Distribution and service fees: | |||||||
| Class A | 29 | ||||||
| Class B | 69 | ||||||
| Class C | 38 | ||||||
| Transfer agent fees: | |||||||
| Class A | 23 | ||||||
| Class B | 31 | ||||||
| Class C | 12 | ||||||
| Class I | – | (c) | |||||
| Printing and shareholder reports | 8 | ||||||
| Custody fees | 12 | ||||||
| Administration fees | 14 | ||||||
| Legal fees | 3 | ||||||
| Audit fees | 9 | ||||||
| Trustees fees | 3 | ||||||
| Registration fees | 13 | ||||||
| Other | 2 | ||||||
| Total expenses | 837 | ||||||
| Net Investment Income (Loss) | (154 | ) | |||||
| Net Realized and Unrealized Gain (Loss): | |||||||
| Realized gain (loss) from investment securities | 7,023 | ||||||
| Increase (decrease) in unrealized appreciation (depreciation) on investment securities | 5,610 | ||||||
| Net Realized and Unrealized Gain (Loss) on Investment Securities | 12,633 | ||||||
| Net Increase (Decrease) in Net Assets Resulting from Operations | $ | 12,479 | |||||
(b) Class I was offered for investment on November 15, 2005.
(c) Rounds to less than $1.
The notes to the financial statements are an integral part of this report.
Transamerica IDEX Mutual Funds
Semi-Annual Report 2006
5
TA IDEX Marsico Growth
STATEMENTS OF CHANGES IN NET ASSETS
For the period or year ended
(all amounts in thousands)
| April 30, 2006 (unaudited) (a) | October 31, 2005 | ||||||||||
| Increase (Decrease) In Net Assets From: | |||||||||||
| Operations: | |||||||||||
| Net investment income (loss) | $ | (154 | ) | $ | (642 | ) | |||||
| Net realized gain (loss) from investment securities | 7,023 | 1,538 | |||||||||
| Change in unrealized appreciation (depreciation) on investment securities | 5,610 | 9,880 | |||||||||
| 12,479 | 10,776 | ||||||||||
| Capital Share Transactions: | |||||||||||
| Proceeds from shares sold: | |||||||||||
| Class A | 1,085 | 62,340 | |||||||||
| Class B | 2,135 | 4,047 | |||||||||
| Class C | 287 | 5,097 | |||||||||
| Class I | 96,416 | – | |||||||||
| 99,923 | 71,484 | ||||||||||
| Cost of shares redeemed: | |||||||||||
| Class A | (96,772 | ) | (4,039 | ) | |||||||
| Class B | (5,855 | ) | (5,390 | ) | |||||||
| Class C | (3,451 | ) | (3,623 | ) | |||||||
| (106,078 | ) | (13,052 | ) | ||||||||
| Redemption fees: | |||||||||||
| Class B | 1 | – | |||||||||
| 1 | – | ||||||||||
| Automatic conversions: | |||||||||||
| Class A | 22 | 56 | |||||||||
| Class B | (22 | ) | (56 | ) | |||||||
| – | – | ||||||||||
| (6,154 | ) | 58,432 | |||||||||
| Net increase (decrease) in net assets | 6,325 | 69,208 | |||||||||
| Net Assets: | |||||||||||
| Beginning of period | 135,565 | 66,357 | |||||||||
| End of period | $ | 141,890 | $ | 135,565 | |||||||
| Distributable Net Investment Income (Loss) | $ | (155 | ) | $ | (1 | ) | |||||
(a) Class I was offered for investment on November 15, 2005.
| April 30, 2006 (unaudited) (a) | October 31, 2005 | ||||||||||
| Share Activity: | |||||||||||
| Shares issued: | |||||||||||
| Class A | 101 | 6,306 | |||||||||
| Class B | 203 | 425 | |||||||||
| Class C | 27 | 534 | |||||||||
| Class I | 9,062 | – | |||||||||
| 9,393 | 7,265 | ||||||||||
| Shares redeemed: | |||||||||||
| Class A | (9,090 | ) | (404 | ) | |||||||
| Class B | (557 | ) | (567 | ) | |||||||
| Class C | (330 | ) | (378 | ) | |||||||
| (9,977 | ) | (1,349 | ) | ||||||||
| Automatic conversions: | |||||||||||
| Class A | 2 | 6 | |||||||||
| Class B | (2 | ) | (6 | ) | |||||||
| – | – | ||||||||||
| Net increase (decrease) in shares outstanding: | |||||||||||
| Class A | (8,987 | ) | 5,908 | ||||||||
| Class B | (356 | ) | (148 | ) | |||||||
| Class C | (303 | ) | 156 | ||||||||
| Class I | 9,062 | – | |||||||||
| (584 | ) | 5,916 | |||||||||
The notes to the financial statements are an integral part of this report.
Transamerica IDEX Mutual Funds
Semi-Annual Report 2006
6
TA IDEX Marsico Growth
FINANCIAL HIGHLIGHTS
(unaudited for the period ended April 30, 2006)
| For a share of beneficial interest outstanding throughout each period | |||||||||||||||||||||||||||||||||||||||
| Net Asset | Investment Operations | Distributions | Net Asset | ||||||||||||||||||||||||||||||||||||
| For the Period Ended (d)(g) | Value, Beginning of Period | Net Investment Income (Loss) | Net Realized and Unrealized Gain (Loss) | Total Operations | From Net Investment Income | From Net Realized Gains | Total Distributions | Value, End of Period | |||||||||||||||||||||||||||||||
| Class A | 4/30/2006 | $ | 10.32 | $ | (0.03 | ) | $ | 0.97 | $ | 0.94 | $ | – | $ | – | $ | – | $ | 11.26 | |||||||||||||||||||||
| 10/31/2005 | 9.15 | (0.03 | ) | 1.20 | 1.17 | – | – | – | 10.32 | ||||||||||||||||||||||||||||||
| 10/31/2004 | 8.97 | (0.05 | ) | 0.23 | 0.18 | – | – | – | 9.15 | ||||||||||||||||||||||||||||||
| 10/31/2003 | 7.56 | (0.08 | ) | 1.49 | 1.41 | – | – | – | 8.97 | ||||||||||||||||||||||||||||||
| 10/31/2002 | 9.10 | (0.06 | ) | (1.48 | ) | (1.54 | ) | – | – | – | 7.56 | ||||||||||||||||||||||||||||
| 10/31/2001 | 12.54 | (0.05 | ) | (3.25 | ) | (3.30 | ) | – | (0.14 | ) | (0.14 | ) | 9.10 | ||||||||||||||||||||||||||
| Class B | 4/30/2006 | 9.83 | (0.05 | ) | 0.92 | 0.87 | – | – | – | 10.70 | |||||||||||||||||||||||||||||
| 10/31/2005 | 8.80 | (0.12 | ) | 1.15 | 1.03 | – | – | – | 9.83 | ||||||||||||||||||||||||||||||
| 10/31/2004 | 8.68 | (0.10 | ) | 0.22 | 0.12 | – | – | – | 8.80 | ||||||||||||||||||||||||||||||
| 10/31/2003 | 7.36 | (0.12 | ) | 1.44 | 1.32 | – | – | – | 8.68 | ||||||||||||||||||||||||||||||
| 10/31/2002 | 8.92 | (0.11 | ) | (1.45 | ) | (1.56 | ) | – | – | – | 7.36 | ||||||||||||||||||||||||||||
| 10/31/2001 | 12.41 | (0.11 | ) | (3.24 | ) | (3.35 | ) | – | (0.14 | ) | (0.14 | ) | 8.92 | ||||||||||||||||||||||||||
| Class C | 4/30/2006 | 9.81 | (0.04 | ) | 0.92 | 0.88 | – | – | – | 10.69 | |||||||||||||||||||||||||||||
| 10/31/2005 | 8.78 | (0.11 | ) | 1.14 | 1.03 | – | – | – | 9.81 | ||||||||||||||||||||||||||||||
| 10/31/2004 | 8.68 | (0.12 | ) | 0.22 | 0.10 | – | – | – | 8.78 | ||||||||||||||||||||||||||||||
| 10/31/2003 | 7.18 | (0.12 | ) | 1.62 | 1.50 | – | – | – | 8.68 | ||||||||||||||||||||||||||||||
| Class I | 4/30/2006 | 10.63 | – | (i) | 0.66 | 0.66 | – | – | – | 11.29 | |||||||||||||||||||||||||||||
| Ratios/Supplemental Data | |||||||||||||||||||||||||||||||
| For the Period | Total | Net Assets, End of Period | Ratio of Expenses to Average Net Assets (a) | Net Investment Income (Loss) to Average | Portfolio Turnover | ||||||||||||||||||||||||||
| Ended (g) | Return (c) | (000's) | Net (e) | Total (f) | Net Assets (a) | Rate (b) | |||||||||||||||||||||||||
| Class A | 4/30/2006 | 9.11 | % | $ | 11,071 | 1.40 | % | 1.40 | % | (0.50 | )% | 33 | % | ||||||||||||||||||
| 10/31/2005 | 12.79 | 102,906 | 1.35 | (h) | 1.35 | (h) | (0.30 | ) | 74 | ||||||||||||||||||||||
| 10/31/2004 | 2.01 | 37,186 | 1.52 | 1.52 | (0.58 | ) | 85 | ||||||||||||||||||||||||
| 10/31/2003 | 18.65 | 34,167 | 1.75 | 1.80 | (0.97 | ) | 129 | ||||||||||||||||||||||||
| 10/31/2002 | (16.88 | ) | 5,752 | 1.73 | 2.05 | (0.56 | ) | 34 | |||||||||||||||||||||||
| 10/31/2001 | (26.63 | ) | 7,361 | 1.55 | 2.03 | (0.43 | ) | 15 | |||||||||||||||||||||||
| Class B | 4/30/2006 | 8.85 | 18,672 | 1.88 | 1.88 | (0.93 | ) | 33 | |||||||||||||||||||||||
| 10/31/2005 | 11.70 | 20,650 | 2.31 | (h) | 2.31 | (h) | (1.24 | ) | 74 | ||||||||||||||||||||||
| 10/31/2004 | 1.38 | 19,792 | 2.13 | 2.13 | (1.19 | ) | 85 | ||||||||||||||||||||||||
| 10/31/2003 | 17.93 | 19,723 | 2.40 | 2.45 | (1.62 | ) | 129 | ||||||||||||||||||||||||
| 10/31/2002 | (17.52 | ) | 14,130 | 2.38 | 2.70 | (1.21 | ) | 34 | |||||||||||||||||||||||
| 10/31/2001 | (27.25 | ) | 15,081 | 2.20 | 2.68 | (1.08 | ) | 15 | |||||||||||||||||||||||
| Class C | 4/30/2006 | 8.97 | 9,843 | 1.79 | 1.79 | (0.85 | ) | 33 | |||||||||||||||||||||||
| 10/31/2005 | 11.69 | 12,009 | 2.26 | (h) | 2.26 | (h) | (1.20 | ) | 74 | ||||||||||||||||||||||
| 10/31/2004 | 1.27 | 9,379 | 2.40 | 2.40 | (1.38 | ) | 85 | ||||||||||||||||||||||||
| 10/31/2003 | 20.89 | 1,200 | 2.40 | 2.46 | (1.62 | ) | 129 | ||||||||||||||||||||||||
| Class I | 4/30/2006 | 6.21 | 102,304 | 0.89 | 0.89 | 0.08 | 33 | ||||||||||||||||||||||||
The notes to the financial statements are an integral part of this report.
Transamerica IDEX Mutual Funds
Semi-Annual Report 2006
7
TA IDEX Marsico Growth
FINANCIAL HIGHLIGHTS (continued)
(unaudited)
NOTES TO FINANCIAL HIGHLIGHTS
(a) Annualized.
(b) Not annualized.
(c) Total Return has been calculated for the applicable period without deduction of a sales load, if any, on an initial purchase. Not annualized.
(d) Per share information is calculated based on average number of shares outstanding.
(e) Ratio of Net Expenses to Average Net Assets is net of fee waivers and reimbursements by the investment adviser, if any (see note 2).
(f) Ratio of Total Expenses to Average Net Assets includes all expenses before fee waivers and reimbursements by the investment adviser.
(g) The inception dates for the Fund's offering of share classes were as follows:
Class C was November 11, 2002.
Class I was November 15, 2005.
(h) Ratios of Total Expenses to Average Net Assets and net Expenses to Average Net Assets are inclusive of recaptured expenses by the investment advisor, if any. The impact of recaptured expenses was 0.03%, 0.03% and 0.03% for Class A, Class B and Class C, respectively (see Note 2).
(i) Amount rounds to less than $0.01.
The notes to the financial statements are an integral part of this report.
Transamerica IDEX Mutual Funds
Semi-Annual Report 2006
8
TA IDEX Marsico Growth
NOTES TO FINANCIAL STATEMENTS
At April 30, 2006
(all amounts in thousands)
(unaudited)
NOTE 1. ORGANIZATION AND SIGNIFICANT ACCOUNTING POLICIES
Transamerica IDEX Mutual Funds is an open-end management investment company registered under the Investment Company Act of 1940, as amended (the "1940 Act").
In the normal course of business, TA IDEX Marsico Growth (the "Fund") enters into contracts that contain a variety of representations that provide general indemnifications. The Fund's maximum exposure under these arrangements is unknown, as this would involve future claims that may be made against the Fund and/or its affiliates that have not yet occurred. However, based on experience, the Fund expects the risk of loss to be remote.
This report should be read in conjunction with the current Fund prospectus, which contains more complete information about the Fund.
In preparing the Fund's financial statements in accordance with accounting principles generally accepted in the United States of America ("GAAP"), estimates or assumptions (which could differ from actual results) may be used that affect reported amounts and disclosures. The following is a summary of significant accounting policies followed by the Fund.
Multiple class operations, income and expenses: The Fund currently has four classes of shares, Class A, Class B, Class C and Class I, each with different expense levels. Classes A, B, and C are closed to new investors. Class I commenced operations on November 15, 2005. Class I is only available for investment to certain affiliated asset allocation funds. Class B shares will convert to Class A shares eight years after purchase. Income, non-class specific expenses and realized and unrealized gains and losses, are allocated daily to each class, based upon the value of shares outstanding method as permitted under Rule 18f-3 of the 1940 Act. Each class bears its own specific expenses as well as a portion of general, common expenses.
Security valuations: The Fund values its investments at the close of the New York Stock Exchange ("NYSE"), normally 4 p.m. ET, each day the NYSE is open for business. Fund investments are valued at the last sale price or closing price on the day of valuation taken from the primary exchange where the security is principally traded.
Securities traded in the over-the-counter market and listed securities for which no sale was reported on that date are valued at the last quoted bid price.
Debt securities are valued based on a price quotation or other equivalent indication of value supplied by an exchange, a pricing service or a major market maker; however, those that mature in sixty days or less are valued at amortized cost, which approximates market.
Investment company securities are valued at the net asset value of the underlying portfolio.
Other securities for which quotations are not readily available or whose values have been determined to be unreliable are valued at fair market value as determined in good faith by the Fund's Administrative Valuation Committee, under the supervision of the Board's Valuation Committee, using guidelines adopted by the Board of Trustees.
Cash: The Fund may leave cash overnight in its cash account with the custodian, Investors Bank & Trust Company ("IBT"). IBT has been contracted on behalf of the Fund to invest the excess cash into a savings account, which at April 30, 2006, was paying an interest rate of 3.24%.
Repurchase agreements: The Fund is authorized to enter into repurchase agreements. The Fund, through its custodian, IBT, receives delivery of the underlying securities, the value of which at the time of purchase is required to be an amount equal to at least 100% of the resale price. The Fund will bear the risk of value fluctuations until the security can be sold and may encounter delays and incur costs in liquidating the security. In the event of bankruptcy or insolvency of the seller, delays and costs may be incurred.
Commission recapture: The sub-adviser, to the extent consistent with the best execution and usual commission rate policies and practices, may place security transactions of the Fund with broker/dealers with which Transamerica IDEX Mutual Funds has established a Commission Recapture Program. A Commission Recapture Program is any arrangement under which a broker/dealer applies a portion of the commissions received by such broker/dealer on the security transactions to the Fund. In no event will commissions paid by the Fund be used to pay expenses that would otherwise be borne by any other funds within Transamerica IDEX Mutual Funds, or by any other party.
Recaptured commissions during the six months ended April 30, 2006, of $12 are included in net realized gains in the Statement of Operations.
Securities lending: The Fund may lend securities to qualified borrowers, with IBT acting as the Fund's lending agent. The Fund earns negotiated lenders' fees. The Fund receives cash and/or securities as collateral against the loaned securities. Cash collateral received is invested in short term, interest bearing securities. The Fund monitors the market value of securities loaned on a daily basis and requires collateral in an amount at least equal to the value of the securities loaned. Income from loaned securities on the Statement of Operations is net of fees, in the amount of $19, earned by IBT for its services.
Security transactions and investment income: Security transactions are recorded on the trade date. Security gains and losses are calculated on the specific identification basis. Dividend income, if any, is recorded
Transamerica IDEX Mutual Funds
Semi-Annual Report 2006
9
TA IDEX Marsico Growth
NOTES TO FINANCIAL STATEMENTS (continued)
At April 30, 2006
(all amounts in thousands)
(unaudited)
NOTE 1.–(continued)
on the ex-dividend date or, in the case of foreign securities, as soon as the Fund is informed of the ex-dividend date. Interest income, including accretion of discounts and amortization of premiums, is recorded on the accrual basis commencing on the settlement date.
Redemption fees: A short-term trading redemption fee may be assessed on any Fund shares in a fund account that are sold during the first five (5) NYSE trading days following their purchase date. This redemption fee will equal 2% of the amount redeemed and shares held the longest will be treated as being redeemed first and shares held the shortest as being redeemed last. For the six months ended April 30, 2006, the Fund received $1 in redemption fees.
Dividend distributions: Distributions to shareholders are recorded on the ex-dividend date and are determined in accordance with Federal income tax regulations which may differ from GAAP.
NOTE 2. RELATED PARTY TRANSACTIONS
Transamerica Fund Advisors, Inc. ("TFAI") is the Fund's investment adviser. Transamerica Fund Services, Inc. ("TFS") is the Fund's administrator and transfer agent. AFSG Securities Corp. ("AFSG") is the Fund's distributor/principal underwriter. TFAI, TFS, and AFSG are affiliates of AEGON, NV, a Netherlands corporation.
Certain officers and trustees of the Fund are also officers and/or directors of TFAI, TFS and AFSG.
The following schedule reflects the percentage of Fund assets owned by affiliated investment companies at April 30, 2006:
| Net Assets | % of Net Assets | ||||||||||
| TA IDEX Asset Allocation – Conservative Portfolio | $ | 656 | 0.46 | % | |||||||
| TA IDEX Asset Allocation – Moderate Portfolio | 41,392 | 29.17 | % | ||||||||
| TA IDEX Asset Allocation – Moderate Growth Portfolio | 60,259 | 42.47 | % | ||||||||
| Total | $ | 102,307 | 72.10 | % | |||||||
Investment advisory fees: The Fund pays management fees to TFAI based on average daily net assets ("ANA") at the following breakpoints:
0.80% of the first $500 million of ANA
0.70% of ANA over $500 million
TFAI has contractually agreed to waive its advisory fee and will reimburse the Fund to the extent that operating expenses, excluding 12b-1 fees, exceed the following stated annual limit:
1.40% Expense Limit
If total Fund expenses fall below the annual expense limitation agreement agreed to by the adviser within the succeeding three years, the Fund may be required to pay the adviser a portion or all of the waived advisory fees.
There are no amounts available for recapture at April 30, 2006.
Distribution and service fees: The Fund has a 12b-1 distribution plan under the 1940 Act pursuant to which an annual fee, based on average daily net assets, is paid to the distributor for various disbursements such as broker-dealer account servicing fees and other promotional expenses of the Fund. The Fund is authorized under the 12b-1 plan to pay fees on each class up to the following limits:
| Class A | 0.35 | % | |||||
| Class B | 1.00 | % | |||||
| Class C | 1.00 | % | |||||
| Class I | N/A | ||||||
From February 28, 2006 through March 1, 2007, the Fund will not pay 12b-1 fees under these plans.
Underwriter commissions relate to front-end sales charges imposed for Class A shares and contingent deferred sales charges from Classes B, C, and certain A share redemptions. For the six months ended April 30, 2006, the underwriter commissions were as follows:
| Received by Underwriter | $ | 11 | |||||
| Retained by Underwriter | 2 | ||||||
| Contingent Deferred Sales Charge | 2 | ||||||
Administrative services: The Fund has entered into an agreement with TFS for financial and legal fund administration services. The Fund pays TFS an annual fee of 0.02% of ANA. The Legal fees on the Statement of Operations are fees paid to external legal counsel.
Transfer agent fees: The Fund pays TFS an annual per-account charge for each open and closed account. The Fund paid TFS $63 for the six months ended April 30, 2006.
Deferred compensation plan: Each eligible independent Fund Trustee may elect to participate in a non-qualified deferred compensation plan maintained by Transamerica IDEX Mutual Funds (the "Plan"). Under the Plan, such Trustees may defer payment of all or a portion of their total fees earned as a Fund Trustee. Each Trustee who is a participant in the Plan may elect that the earnings, losses or gains credited to his or her deferred fee amounts be determined based on a deemed investment in any series of Transamerica IDEX Mutual Funds, including the
Transamerica IDEX Mutual Funds
Semi-Annual Report 2006
10
TA IDEX Marsico Growth
NOTES TO FINANCIAL STATEMENTS (continued)
At April 30, 2006
(all amounts in thousands)
(unaudited)
NOTE 2.–(continued)
Fund. The right of a participant to receive a distribution from the Plan of the deferred fees is an unsecured claim against the general assets of all series of Transamerica IDEX Mutual Funds. The pro rata liability to the Fund of all deferred fees in the Plan amounted, as of April 30, 2006, to $4.
NOTE 3. INVESTMENT TRANSACTIONS
The cost of securities purchased and proceeds from securities sold (excluding short-term securities) for the six months ended April 30, 2006 were as follows:
| Purchases of securities: | |||||||
| Long-Term | $ | 50,186 | |||||
| U.S. Government | – | ||||||
| Proceeds from maturities and sales of securities: | |||||||
| Long-Term | 44,921 | ||||||
| U.S. Government | – | ||||||
NOTE 4. FEDERAL INCOME TAX MATTERS
The Fund has not made any provision for federal income or excise taxes due to its policy to distribute all of its taxable income and capital gains to its shareholders and otherwise qualify as a regulated investment company under Subchapter M of the Internal Revenue Code. Income and capital gain distributions are determined in accordance with income tax regulations, which may differ from GAAP. These differences are primarily due to differing treatment for items including, but not limited to, wash sales, net operating losses, foreign currency transactions and capital loss carryforwards.
The capital loss carryforwards are available to offset future realized capital gains through the periods listed:
| Capital Loss Carryforwards | Available through | ||||||
| $ | 4,018 | October 31, 2010 | |||||
| 8,550 | October 31, 2011 | ||||||
NOTE 5. REGULATORY PROCEEDINGS
There continues to be significant federal and state regulatory activity relating to financial services companies, particularly mutual fund companies and their investment advisers. As part of an ongoing investigation regarding potential market timing, recordkeeping and trading compliance issues and matters affecting the Fund's investment adviser, TFAI, and certain affiliates and former employees of TFAI, the SEC staff has indicated that it is likely to take some action against TFAI and certain of its affiliates at the conclusion of the investigation. The potential timing and the scope of any such action is difficult to predict. Although the impact of any action brought against TFAI and/or its affiliates is difficult to assess at the present time, the Fund currently believes that the likelihood that any such action will have a material adverse impact on it is remote. It is important to note that the Fund is not aware of any allegation of wrongdoing against it and its Board at the time this semi-annual report is printed. Although it is not anticipated that these developments will have an adverse impact on the Fund, there can be no assurance at this time. TFAI and its affiliates are actively working with the SEC in regard to this matter; however, the exact resolution cannot be determined at this time. TFAI will take such actions that it deems necessary or appropriate to continue providing management services to the Fund and to bring all matters to an appropriate conclusion.
TFAI and/or its affiliates, and not the Fund, will bear the costs regarding these regulatory matters.
Transamerica IDEX Mutual Funds
Semi-Annual Report 2006
11
TA IDEX Marsico Growth
INVESTMENT ADVISORY AND SUB-ADVISORY AGREEMENTS – REVIEW AND RENEWAL (unaudited)
At a meeting of the Board of Trustees of Transamerica IDEX Mutual Funds ("TA IDEX") held on November 2, 2005, the Board reviewed and considered the Investment Advisory Agreement between TA IDEX Marsico Growth (the "Fund") and Transamerica Fund Advisors, Inc. ("TFAI"), as well as the Investment Sub-Advisory Agreement of the Fund between TFAI and Columbia Management Advisors, LLC (the "Sub-Adviser"), to determine whether the agreements should be renewed for a one-year period. Following their review and consideration, the Trustees determined that the Investment Advisory Agreement and the Investment Sub-Advisory Agreement will enable shareholders of the Fund to obtain high quality services at a cost that is appropriate, reasonable, and in the best interests of its shareholders. The Board, including the independent members of the Board, approved the renewal of the Investment Advisory Agreement and the Investment Sub-Advisory Agreemen t. In reaching their decision, the Trustees requested and obtained from TFAI and the Sub-Adviser such information as they deemed reasonably necessary to evaluate the proposed agreements. The Trustees also carefully considered the information that they had received throughout the year from TFAI and the Sub-Adviser (such as in-person presentations by the Sub-Adviser) as part of their regular oversight of the Fund, as well as: comparative fee, expense and performance information prepared by Lipper Inc. ("Lipper"), independent providers of mutual fund performance, fee and expense information, and profitability data. In considering the proposed continuation of the Investment Advisory Agreement and Investment Sub-Advisory Agreement, the Trustees evaluated a number of considerations that they believed, in light of the legal advice furnished to them by TA IDEX counsel and independent legal counsel and their own business judgment, to be relevant. They based their decisions on the following considerations, among other s, although they did not identify any consideration or particular information that was controlling of their decisions:
The nature, extent and quality of the advisory service to be provided. The Board considered the nature and quality of the services provided by TFAI and the Sub-Adviser to the Fund in the past, as well as the services anticipated to be provided in the future. The Board concluded that TFAI and the Sub-Adviser are capable of providing high quality services to the Fund, as indicated by the nature and quality of services provided in the past, TFAI's and the Sub-Adviser's management capabilities demonstrated with respect to the funds they manage, including the Fund, and the experience, capability and integrity of TFAI's senior management, the financial resources of TFAI and the Sub-Adviser, TFAI's management oversight process, the professional qualifications and experience of the Sub-Adviser's portfolio management team, and the Fund's investment performance . The Trustees also concluded that TFAI and the Sub-Adviser proposed to provide investment and related services that were of the same quality and quantity as services provided to the Fund in the past, and that these services are appropriate in scope and extent in light of the Fund's operations, the competitive landscape of the investment company business and investor needs, and that TFAI's and the Sub-Adviser's obligations will remain substantially the same.
The investment performance of the Fund. The Board examined both the short-term and longer-term performance of the Fund, including relative performance against a benchmark securities index and a peer group of comparable mutual funds as prepared by Lipper for various trailing periods ended June 30, 2005. The Trustees concluded that TFAI and the Sub-Adviser generally had achieved superior performance and noted that the Fund's performance has been above median relative to its peers and superior to the benchmark index over the past one-, two-, three- and five- year periods. On the basis of the Trustees' assessment of the nature, extent and quality of advisory services to be provided or procured by TFAI and the Sub-Adviser, the Trustees concluded that TFAI and the Sub-Adviser are capable of generating a level of investment performance that is appropriate in light of the Fund's investment objective, policies and strategies and competitive with many other investment companies, and also determined that TFAI's and the Sub-Adviser's performance records indicate that their continued management is likely to benefit the Fund and its shareholders.
The cost of advisory services provided and the level of profitability. The Board reviewed profitability information regarding TFAI's costs of procuring portfolio management services, as well as the costs of provision of administration, transfer agency, fund accounting and other services, to the Fund and to TA IDEX as a whole by TFAI and its affiliates. The Trustees reviewed data from Lipper that compared the Fund's management fees (including management fees at various asset levels), other fees and expenses (including total expenses including and excluding 12b-1 distribution and service fees) and portfolio turnover rate against peer groups of comparable mutual funds. Based on such information, the Trustees determined that the management fees and overall expense ratio of the Fund generally are consistent with industry averages. In addition, on the basis of the Board's review of the management fees to be charged by TFAI for investment advisory and related services, TFAI profitability information (derived from TFAI's audited financial statements), TFAI's estimated management income resulting from its management of the Fund, the estimated margin of the Sub-Adviser, as well as the entirety of TFAI's and its affiliates' service relationship with TA IDEX, the Board concluded that the level of investment management fees and other service fees, as well as TFAI's and the Sub-Adviser's profitability, are appropriate in light of the services provided, the management fees and overall expense ratios of comparable investment companies and the anticipated profitability of the relationship between the Fund, TFAI and its affiliates, and the Sub-Adviser.
Transamerica IDEX Mutual Funds
Semi-Annual Report 2006
12
TA IDEX Marsico Growth (continued)
Whether fee levels reflect economies of scale and the extent to which economies of scale would be realized as the Fund grows. The Board concluded that the inclusion of asset-based breakpoints in the Fund's advisory fee schedule appropriately benefits investors by realizing economies of scale in the form of lower management fees as the level of assets grows. The Board noted that the Fund is closed to new investors and will be closed to new investments in the near future, except that the Fund may continue selling shares to other TA IDEX funds and other investment companies in the same group of investment companies as TA IDEX, which may limit, to an extent, the ability of the Fund to realize economies of scale. In addition, the Board assessed the current asset levels of the Fund and the long-term development strategy for the Fund, including continued inv estments by the TA IDEX asset allocation funds, and concluded that the Fund's current management fees appropriately reflect the Fund's current size, the current economic environment for TFAI, the competitive nature of the investment company market, and TFAI's pricing strategy. The Trustees also concluded that they will have the opportunity to periodically reexamine whether the Fund has achieved economies of scale, and the appropriateness of management fees payable to TFAI and fees payable by TFAI to the Sub-Adviser, in the future.
Benefits (such as soft dollars) to TFAI, its affiliates, or the Sub-Adviser from their relationship with the Fund. The Board concluded that other benefits derived by TFAI, its affiliates, and the Sub-Adviser from their relationship with the Fund, including "soft dollar" benefits (if any) in connection with brokerage transactions, sales charges and distribution/service fees (to the extent applicable) are reasonable and fair, and are consistent with industry practice and the best interests of the Fund and its shareholders. In this regard, the Board noted that TFAI does not realize "soft dollar" benefits from its relationship with the Fund, and that the Sub-Adviser is participating in a brokerage program pursuant to which a portion of brokerage commissions paid by the Fund is recaptured for the benefit of the Fund and its shareholders, thus limiting the amount of "soft-dollar" arrangements the Sub-Adviser may engage in with respect to the Fund's brokerage transactions. In addition, the Trustees determined that the administration, transfer agency, fund accounting and other fees paid by the Fund to affiliates of TFAI are reasonable, fair and in the best interests of shareholders in light of the nature and quality of the services provided, the associated costs to these affiliates of providing the services, the impact of the costs of such services on the Fund's overall operating expenses, and the necessity of the services for the Fund's operations.
Other considerations. The Board also determined that TFAI had made a substantial commitment to the recruitment and retention of high quality personnel, and maintained the financial, compliance and operational resources reasonably necessary to manage the Fund in a professional manner that is consistent with the best interests of the Fund and its shareholders. In this regard, the Trustees favorably considered the procedures and policies in place by TFAI to enforce compliance with applicable laws and regulations and oversee the portfolio management activities of the Sub-Adviser. The Trustees also determined that TFAI had made a significant entrepreneurial commitment to the management and success of the Fund, reflected by TFAI's expense limitation and fee waiver arrangement with the Fund, which may result in TFAI waiving advisory fees for the benefit of s hareholders.
Transamerica IDEX Mutual Funds
Semi-Annual Report 2006
13
TA IDEX Multi-Manager International Fund
UNDERSTANDING YOUR FUND'S EXPENSES
(unaudited)
SHAREHOLDER EXPENSES
Fund shareholders may incur two types of costs: (1) transaction costs, including sales charges (loads) on purchases, contingent deferred sales charges on redemptions and redemption fees; and (2) ongoing costs, including management fees, 12b-1 distribution and service fees, and other fund expenses.
The following Example is intended to help you understand your ongoing costs (in dollars and cents) of investing in the Fund and to compare these costs with the ongoing costs of investing in other funds.
The Example is based on an investment of $1,000 invested at March 1, 2006 and held for the entire period until April 30, 2006.
ACTUAL EXPENSES
The first line in the table below provides information about actual account values and actual expenses. You may use the information in this line, together with the amount you invested, to estimate the expenses that you paid over the period. Simply divide your account value by $1,000 (for example, an $8,600 account value divided by $1,000 = 8.6), then multiply the result by the number in the first line of your Fund under the heading entitled "Expenses Paid During Period" to estimate the expenses you paid on your account during this period. If your account is an IRA, your expenses could have included a $15 annual fee. The amount of any fee paid through your account would increase the estimate of expenses you paid during the period and decrease your ending account value.
HYPOTHETICAL EXAMPLE FOR COMPARISON PURPOSES
The second line in the table below provides information about hypothetical account values and hypothetical expenses based on the Fund's actual expense ratio and an assumed rate of return of 5% per year before expenses, which is not the Fund's actual return. The hypothetical account values and expenses may not be used to estimate the actual ending account balance or expenses you paid for the period. You may use this information to compare the ongoing costs of investing in your Fund and other funds. To do so, compare this 5% hypothetical example with the 5% hypothetical examples that appear in the shareholder reports of the other funds. As in the case of the actual expense example, if your account is subject to an IRA fee, the amount of the fee paid through your account would increase the hypothetical expenses you would have paid during the period and decrease the hypothetical ending account value.
Please note that the expenses shown in the table are meant to highlight your ongoing costs only and do not reflect any transactional costs, such as sales charges, redemption fees, brokerage commissions paid on purchases and sales of fund shares. Therefore, the second line under the Fund in the table is useful in comparing ongoing costs only, and will not help you determine the relative total costs of owning different funds. If any of these transaction costs were included, your costs would be higher. The expenses shown in the table do not reflect any fees that may be charged to you by brokers, financial intermediaries or other financial institutions.
The expenses shown in the table do not reflect any expenses from the Funds investment in other affiliated investment companies. The average weighted annualized expense ratio of the underlying investment companies at April 30, 2006, was 1.15%.
| Beginning Account Value | Ending Account Value | Annualized Expense Ratio | Expenses Paid During Period (a) | ||||||||||||||||
| Class A | |||||||||||||||||||
| Actual | $ | 1,000.00 | $ | 1,062.00 | 0.80 | % | $ | 1.36 | |||||||||||
| Hypothetical (b) | 1,000.00 | 1,006.90 | 0.80 | 1.32 | |||||||||||||||
| Class B | |||||||||||||||||||
| Actual | $ | 1,000.00 | $ | 1,062.00 | 1.45 | $ | 2.46 | ||||||||||||
| Hypothetical (b) | 1,000.00 | 1,005.84 | 1.45 | 2.39 | |||||||||||||||
| Class C | |||||||||||||||||||
| Actual | $ | 1,000.00 | $ | 1,061.00 | 1.45 | $ | 2.46 | ||||||||||||
| Hypothetical (b) | 1,000.00 | 1,005.84 | 1.45 | 2.39 | |||||||||||||||
(a) Expenses are calculated using the Fund's annualized expense ratio (as disclosed in the table), multiplied by the average account value for the period, multiplied by number of days in the period (60 days), and divided by the number of days in the year (365 days).
(b) 5% return per year before expenses.
GRAPHIC PRESENTATION OF SCHEDULE OF INVESTMENTS
By Investment Type
At April 30, 2006
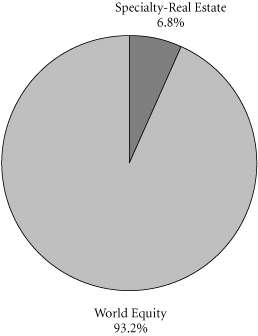
This chart shows the percentage breakdown by investment type of the Fund's total investment securities.
Transamerica IDEX Mutual Funds
Semi-Annual Report 2006
1
TA IDEX Multi-Manager International Fund
SCHEDULE OF INVESTMENTS
At April 30, 2006
(all amounts except share amounts in thousands)
(unaudited)
| Shares | Value | ||||||||||
| INVESTMENT COMPANIES (91.8%)Ø | |||||||||||
| Specialty–Real Estate (6.2%) | |||||||||||
| TA IDEX Clarion Global Real Estate Securities | 153,910 | $ | 2,723 | ||||||||
| World Equity (85.6%) | |||||||||||
| TA IDEX AllianceBernstein International Value | 670,699 | 7,981 | |||||||||
| TA IDEX Evergreen International Small Cap | 412,921 | 6,879 | |||||||||
| TA IDEX Marsico International Growth | 478,652 | 6,749 | |||||||||
| TA IDEX Neuberger Berman International | 634,996 | 7,671 | |||||||||
| TA IDEX Oppenheimer Developing Markets | 675,968 | 7,963 | |||||||||
| Total Investment Companies (cost: $38,619)# | $ | 39,966 | |||||||||
NOTES TO SCHEDULE OF INVESTMENTS:
Ø The Fund invests its assets in Class I shares of the underlying TA IDEX Mutual Funds, which are affiliates of the Fund.
# Aggregate cost for Federal income tax purposes is $38,619. Aggregate gross unrealized appreciation for all securities in which there is an excess of value over tax cost and aggregate gross unrealized depreciation for all securities in which there is an excess of tax cost over value were $1,347 and $0, respectively. Net unrealized appreciation for tax purposes is $1,347.
The notes to the financial statements are an integral part of this report.
Transamerica IDEX Mutual Funds
Semi-Annual Report 2006
2
TA IDEX Multi-Manager International Fund
STATEMENT OF ASSETS AND LIABILITIES
At April 30, 2006
(all amounts except per share amounts in thousands)
(unaudited)
| Assets: | |||||||
| Investment in affiliated investment companies at value (cost: $38,619) | $ | 39,966 | |||||
| Cash | 15 | ||||||
| Receivables: | |||||||
| Shares of beneficial interest sold | 5,775 | ||||||
| Due from investment advisor | 11 | ||||||
| 45,767 | |||||||
| Liabilities: | |||||||
| Investment securities purchased | 2,189 | ||||||
| Accounts payable and accrued liabilities: | |||||||
| Shares of beneficial interest redeemed | 9 | ||||||
| Management and advisory fees | 2 | ||||||
| Distribution and service fees | 16 | ||||||
| Transfer agent fees | 15 | ||||||
| Other | 8 | ||||||
| 2,239 | |||||||
| Net Assets | $ | 43,528 | |||||
| Net Assets Consist of: | |||||||
| Shares of beneficial interest, unlimited shares authorized, no par value | 42,212 | ||||||
| Distributable net investment income (loss) | (31 | ) | |||||
| Net unrealized appreciation (depreciation) on investment in affiliated investment companies | 1,347 | ||||||
| Net Assets | $ | 43,528 | |||||
| Net Assets by Class: | |||||||
| Class A | $ | 17,709 | |||||
| Class B | 3,249 | ||||||
| Class C | 22,570 | ||||||
| Shares Outstanding: | |||||||
| Class A | 1,667 | ||||||
| Class B | 306 | ||||||
| Class C | 2,127 | ||||||
| Net Asset Value Per Share: | |||||||
| Class A | $ | 10.62 | |||||
| Class B | 10.62 | ||||||
| Class C | 10.61 | ||||||
| Maximum Offering Price Per Share (a): | |||||||
| Class A | $ | 11.24 | |||||
(a) Includes the maximum selling commission (represented as a percentage of offering price) which is reduced on certain levels of sales as set forth in the Prospectus. Net asset value per share for Classes B, and C shares represents offering price. The redemption price for Classes B and C shares equals net asset value less any applicable contingent deferred sales charge.
STATEMENT OF OPERATIONS
For the period ended April 30, 2006
(all amounts in thousands) (b)
(unaudited)
| Investment Income: | |||||||
| Dividends from affiliated investment companies | $ | – | |||||
| – | |||||||
| Expenses: | |||||||
| Management and advisory fees | 3 | ||||||
| Distribution and service fees: | |||||||
| Class A | 4 | ||||||
| Class B | 2 | ||||||
| Class C | 14 | ||||||
| Transfer agent fees: | |||||||
| Class A | 5 | ||||||
| Class B | 4 | ||||||
| Class C | 6 | ||||||
| Printing and shareholder reports | 2 | ||||||
| Custody fees | 2 | ||||||
| Legal fees | 4 | ||||||
| Audit fees | 4 | ||||||
| Trustees fees | 3 | ||||||
| Registration fees | 5 | ||||||
| Other | 2 | ||||||
| Total expenses | 60 | ||||||
| Less: | |||||||
| Reimbursement of class expenses: | |||||||
| Class A | (10 | ) | |||||
| Class B | (6 | ) | |||||
| Class C | (13 | ) | |||||
| Total reimbursed expenses | (29 | ) | |||||
| Net expenses | 31 | ||||||
| Net Investment Income (Loss) | (31 | ) | |||||
| Net Realized and Unrealized Gain (Loss) on Investment in Affiliated Investment Companies: | |||||||
| Realized gain (loss) from investment in affiliated investment companies | – | ||||||
| Increase (decrease) in unrealized appreciation (depreciation) on investment in affiliated investment companies | 1,347 | ||||||
| Net Realized and Unrealized Gain (Loss) on Investment in Affiliated Investment Companies | 1,347 | ||||||
| Net Increase (Decrease) in Net Assets Resulting from Operations | $ | 1,316 | |||||
(b) Commenced operations on March 1, 2006.
The notes to the financial statements are an integral part of this report.
Transamerica IDEX Mutual Funds
Semi-Annual Report 2006
3
TA IDEX Multi-Manager International Fund
STATEMENT OF CHANGES IN NET ASSETS
For the period ended
(all amounts in thousands)
| April 30, 2006 (unaudited) (a) | |||||||
| Increase (Decrease) In Net Assets From: | |||||||
| Operations: | |||||||
| Net investment income (loss) | $ | (31 | ) | ||||
| Change in unrealized appreciation (depreciation) on investment in affiliated investment companies | 1,347 | ||||||
| 1,316 | |||||||
| Capital Share Transactions: | |||||||
| Proceeds from shares sold: | |||||||
| Class A | 17,239 | ||||||
| Class B | 3,201 | ||||||
| Class C | 21,977 | ||||||
| 42,417 | |||||||
| Cost of shares redeemed: | |||||||
| Class A | (45 | ) | |||||
| Class B | (56 | ) | |||||
| Class C | (105 | ) | |||||
| (206 | ) | ||||||
| Redemption fees: | |||||||
| Class C | 1 | ||||||
| 1 | |||||||
| 42,212 | |||||||
| Net increase (decrease) in net assets | 43,528 | ||||||
| Net Assets: | |||||||
| Beginning of period | – | ||||||
| End of period | $ | 43,528 | |||||
| Distributable Net Investment Income (Loss) | $ | (31 | ) | ||||
| April 30, 2006 (unaudited) (a) | |||||||
| Share Activity: | |||||||
| Shares issued: | |||||||
| Class A | 1,671 | ||||||
| Class B | 312 | ||||||
| Class C | 2,137 | ||||||
| 4,120 | |||||||
| Shares redeemed: | |||||||
| Class A | (4 | ) | |||||
| Class B | (6 | ) | |||||
| Class C | (10 | ) | |||||
| (20 | ) | ||||||
| Net increase (decrease) in shares outstanding: | |||||||
| Class A | 1,667 | ||||||
| Class B | 306 | ||||||
| Class C | 2,127 | ||||||
| 4,100 | |||||||
(a) Commenced operations on March 1, 2006.
The notes to the financial statements are an integral part of this report.
Transamerica IDEX Mutual Funds
Semi-Annual Report 2006
4
TA IDEX Multi-Manager International Fund
FINANCIAL HIGHLIGHTS
(unaudited)
| For a share of beneficial interest outstanding throughout each period | |||||||||||||||||||||||||||||||||||||||
| Net Asset | Investment Operations | Distributions | Net Asset | ||||||||||||||||||||||||||||||||||||
| For the Period Ended (d)(g) | Value, Beginning of Period | Net Investment Income (Loss) | Net Realized and Unrealized Gain (Loss) | Total Operations | From Net Investment Income | From Net Realized Gains | Total Distributions | Value, End of Period | |||||||||||||||||||||||||||||||
| Class A | 4/30/2006 | $ | 10.00 | $ | (0.01 | ) | $ | 0.63 | $ | 0.62 | $ | – | $ | – | $ | – | $ | 10.62 | |||||||||||||||||||||
| Class B | 4/30/2006 | 10.00 | (0.02 | ) | 0.64 | 0.62 | – | – | – | 10.62 | |||||||||||||||||||||||||||||
| Class C | 4/30/2006 | 10.00 | (0.02 | ) | 0.63 | 0.61 | – | – | – | 10.61 | |||||||||||||||||||||||||||||
| Ratios/Supplemental Data | |||||||||||||||||||||||||||||||
For the Period | Total | Net Assets, End of Period | Ratio of Expenses to Average Net Assets (a)(i) | Net Investment Income (Loss) to Average | Portfolio Turnover | ||||||||||||||||||||||||||
| Ended (g) | Return (c) | (000's) | Net (e) | Total (f) | Net Assets (a)(h) | Rate (b) | |||||||||||||||||||||||||
| Class A | 4/30/2006 | 6.20 | % | $ | 17,709 | 0.80 | % | 1.79 | % | (0.79 | )% | – | % | ||||||||||||||||||
| Class B | 4/30/2006 | 6.20 | 3,249 | 1.45 | 4.12 | (1.44 | ) | – | |||||||||||||||||||||||
| Class C | 4/30/2006 | 6.10 | 22,570 | 1.45 | 2.40 | (1.44 | ) | – | |||||||||||||||||||||||
NOTES TO FINANCIAL HIGHLIGHTS
(a) Annualized.
(b) Not annualized.
(c) Total Return has been calculated for the applicable period without deduction of a sales load, if any, on an initial purchase. Not annualized.
(d) Per share information is calculated based on average number of shares outstanding.
(e) Ratio of Net Expenses to Average Net Assets is net of fee waivers and reimbursements by the investment adviser, if any (see note 2).
(f) Ratio of Total Expenses to Average Net Assets includes all expenses before fee waivers and reimbursements by the investment adviser.
(g) TA IDEX Multi-Manager International Fund ("the Fund") commenced operations on March 1, 2006.
(h) Recognition of net investment income by the Fund is affected by the timing of the declaration of dividends by the underlying investment companies in which the Fund invests.
(i) Does not include expenses of the investment companies in which the Fund invests.
The notes to the financial statements are an integral part of this report.
Transamerica IDEX Mutual Funds
Semi-Annual Report 2006
5
TA IDEX Multi-Manager International Fund
NOTES TO FINANCIAL STATEMENTS
At April 30, 2006
(all amounts in thousands)
(unaudited)
NOTE 1. ORGANIZATION AND SIGNIFICANT ACCOUNTING POLICIES
Transamerica IDEX Mutual Funds is an open-end management investment company registered under the Investment Company Act of 1940, as amended (the "1940 Act"). TA IDEX Multi-Manager International Fund (the "Fund") began operations on March 1, 2006.
In the normal course of business, the Fund enters into contracts that contain a variety of representations that provide general indemnifications. The Fund's maximum exposure under these arrangements is unknown, as this would involve future claims that may be made against the Fund and/or its affiliates that have not yet occurred. However, based on experience, the Fund expects the risk of loss to be remote.
This report should be read in conjunction with the current Fund prospectus, which contains more complete information about the Fund.
In preparing the Fund's financial statements in accordance with accounting principles generally accepted in the United States of America ("GAAP"), estimates or assumptions (which could differ from actual results) may be used that affect reported amounts and disclosures. The following is a summary of significant accounting policies followed by the Fund.
Multiple class operations, income and expenses: The Fund currently offers three classes of shares, Class A, Class B, and Class C, each with a public offering price that reflects different sales charges, if any, and expense levels. Class B shares will convert to Class A shares eight years after purchase. Income, non-class specific expenses and realized and unrealized gains and losses, are allocated daily to each class, based upon the value of shares outstanding method as permitted under Rule 18f-3 of the 1940 Act. Each class bears its own specific expenses as well as a portion of general, common expenses.
Security valuations: Investment company securities are valued at the net asset value of the underlying portfolio.
Cash: The Fund may leave cash overnight in its cash account with the custodian, Investors Bank & Trust Company ("IBT"). IBT has been contracted on behalf of the Fund to invest the excess cash into a savings account, which at April 30, 2006, was paying an interest rate of 3.24%.
Security transactions and investment income: Security transactions are recorded on the trade date. Security gains and losses are calculated on the specific identification basis. Dividend income, if any, is recorded on the ex-dividend date or, in the case of foreign securities, as soon as the Fund is informed of the ex-dividend date. Interest income, including accretion of discounts and amortization of premiums, is recorded on the accrual basis commencing on the settlement date.
Redemption fees: A short-term trading redemption fee may be assessed on any Fund shares in a fund account that are sold during the first five (5) NYSE trading days following their purchase date. This redemption fee will equal 2% of the amount redeemed and shares held the longest will be treated as being redeemed first and shares held the shortest as being redeemed last. For the period from inception through April 30, 2006, the Fund received $1 in redemption fees.
Dividend distributions: Distributions to shareholders are recorded on the ex-dividend date and are determined in accordance with Federal income tax regulations which may differ from GAAP.
NOTE 2. RELATED PARTY TRANSACTIONS
Transamerica Fund Advisors, Inc. ("TFAI") is the Fund's investment adviser. Transamerica Fund Services, Inc. ("TFS") is the Fund's administrator and transfer agent. AFSG Securities Corp. ("AFSG") is the Fund's distributor/principal underwriter. TFAI, TFS, and AFSG are affiliates of AEGON, NV, a Netherlands corporation.
Certain officers and trustees of the Fund are also officers and/or directors of TFAI, TFS and AFSG.
Investment advisory fees: The Fund pays management fees to TFAI based on average daily net assets ("ANA") at the following rate:
0.10% of ANA
TFAI has contractually agreed to waive its advisory fee and will reimburse the Fund to the extent that operating expenses, excluding 12b-1 fees, exceed the following stated annual limit:
0.45% Expense Limit
Distribution and service fees: The Fund has a 12b-1 distribution plan under the 1940 Act pursuant to which an annual fee, based on average daily net assets, is paid to the distributor for various disbursements such as broker-dealer account servicing fees and other promotional expenses of the Fund. The Fund is authorized under the 12b-1 plan to pay fees on each class up to the following limits:
| Class A | 0.35 | % | |||||
| Class B | 1.00 | % | |||||
| Class C | 1.00 | % | |||||
In the case the Fund or a class of shares of the Fund is closed to new investors or investments, the Fund is authorized to pay 12b-1 fees for past sales and distribution efforts and present and past investor services.
Underwriter commissions relate to front-end sales charges imposed for Class A shares and contingent deferred sales charges from Classes B, C
Transamerica IDEX Mutual Funds
Semi-Annual Report 2006
6
TA IDEX Multi-Manager International Fund
NOTES TO FINANCIAL STATEMENTS (continued)
At April 30, 2006
(all amounts in thousands)
(unaudited)
NOTE 2.–(continued)
and certain A share redemptions. For the period from inception through April 30, 2006, the underwriter commissions were less than $1.
Administrative services: The Fund has entered into an agreement with TFS for financial and legal fund administration services. The Fund pays TFS an annual fee of 0.0125% of ANA. The Legal fees on the Statement of Operations are fees paid to external legal counsel.
Transfer agent fees: The Fund pays TFS an annual per-account charge for each open and closed account. The Fund paid TFS $15 for the period from inception through April 30, 2006.
NOTE 3. INVESTMENT TRANSACTIONS
The cost of securities purchased and proceeds from securities sold (excluding short-term securities) for the period from inception through April 30, 2006 were as follows:
| Purchases of securities: | |||||||
| Long-Term | $ | 38,619 | |||||
| U.S. Government | – | ||||||
| Proceeds from maturities and sales of securities: | |||||||
| Long-Term | – | ||||||
| U.S. Government | – | ||||||
NOTE 4. FEDERAL INCOME TAX MATTERS
The Fund has not made any provision for federal income or excise taxes due to its policy to distribute all of its taxable income and capital gains to its shareholders and otherwise qualify as a regulated investment company under Subchapter M of the Internal Revenue Code. Income and capital gain distributions are determined in accordance with income tax regulations, which may differ from GAAP. These differences are primarily due to differing treatment for items including, but not limited to, wash sales.
NOTE 5. REGULATORY PROCEEDINGS
There continues to be significant federal and state regulatory activity relating to financial services companies, particularly mutual fund companies and their investment advisers. As part of an ongoing investigation regarding potential market timing, recordkeeping and trading compliance issues and matters affecting the Fund's investment adviser, TFAI, and certain affiliates and former employees of TFAI, the SEC staff has indicated that it is likely to take some action against TFAI and certain of its affiliates at the conclusion of the investigation. The potential timing and the scope of any such action is difficult to predict. Although the impact of any action brought against TFAI and/or its affiliates is difficult to assess at the present time, the Fund currently believes that the likelihood that any such action will have a material adverse impact on it is remote. It is important to note that the Fund is not aware of any allegation of wrongdoing against it and its Board at the time this semi-annual report is printed. Although it is not anticipated that these developments will have an adverse impact on the Fund, there can be no assurance at this time. TFAI and its affiliates are actively working with the SEC in regard to this matter; however, the exact resolution cannot be determined at this time. TFAI will take such actions that it deems necessary or appropriate to continue providing management services to the Fund and to bring all matters to an appropriate conclusion.
TFAI and/or its affiliates, and not the Fund, will bear the costs regarding these regulatory matters.
Transamerica IDEX Mutual Funds
Semi-Annual Report 2006
7
TA IDEX Multi-Manager International Fund
INVESTMENT ADVISORY AND ASSET ALLOCATION MANAGEMENT AGREEMENTS – REVIEW AND APPROVAL (unaudited)
At a meeting of the Board of Trustees of Transamerica IDEX Mutual Funds ("TA IDEX") held on November 2, 2005, the Board reviewed and considered the proposed Investment Advisory Agreement between TA IDEX Multi-Manager International Fund (the "Fund") and Transamerica Fund Advisors, Inc. ("TFAI"), as well as the proposed Asset Allocation Management Agreement of the Fund between TFAI and Morningstar Associates, LLC (the "Portfolio Construction Manager"), to determine whether the agreements should be approved for an initial two-year period. Following their review and consideration, the Trustees determined that the proposed Investment Advisory Agreement and the Asset Allocation Management Agreement will enable shareholders of the Fund to obtain high quality services at a cost that is appropriate, reasonable, and in the best interests of its shareholders. The Board, including the independent members of the Board, unanimously approved t he proposed Investment Advisory Agreement and the Asset Allocation Management Agreement. In reaching their decision, the Trustees requested and obtained from TFAI and the Portfolio Construction Manager such information as they deemed reasonably necessary to evaluate the proposed agreements. The Trustees also carefully considered the anticipated fee and expense information and profitability data prepared by TFAI. In considering the approval of the proposed Investment Advisory Agreement and the Asset Allocation Management Agreement, the Board considered its prior discussion of the Fund during the September meeting, during which the Board reached a number of conclusions about the management program proposed by TFAI and the Portfolio Construction Manager. In addition, the Trustees evaluated a number of considerations that they believe, in light of the legal advice furnished to them by TA IDEX counsel and independent legal counsel and their own business judgment, to be relevant. They based their decisions on the following considerations, among others, although they did not identify any consideration or particular information that was controlling of their decisions:
The nature, extent and quality of the advisory service to be provided. The Board considered the nature and quality of the services expected to be provided by TFAI and the Portfolio Construction Manager to the Fund. The Board concluded that TFAI and the Portfolio Construction Manager are capable of providing high quality services to the Fund, as indicated by the nature and quality of services provided to other TA IDEX funds in the past, TFAI's and the Portfolio Construction Manager's management capabilities demonstrated with respect to the funds they manage, and the experience, capability and integrity of TFAI's senior management, the financial resources of TFAI and the Portfolio Construction Manager, TFAI's management oversight process and the professional qualifications and experience of the Portfolio Construction Manager's portfolio management team. The Trustees also concluded that TFAI and the Portfolio Construction Manager proposed to provide investment and related services that are appropriate in scope and extent in light of the Fund's operations and the competitive landscape of the investment company business and investor needs.
The investment performance of the Fund. The Board noted that no performance information is available for the Fund, but determined that most other funds managed by the Portfolio Construction Manager have generally performed well and generated considerable investor interest. On the basis of the Trustees' assessment of the nature, extent and quality of advisory services expected to be provided or procured by TFAI and the Portfolio Construction Manager, the Trustees concluded that TFAI and the Portfolio Construction Manager are capable of generating a level of investment performance that is appropriate in light of the Fund's investment objective, policies and strategies and competitive with many other investment companies, and also determined that TFAI's and the Portfolio Construction Manager's performance records indicate that their management is likely to benefit the Fund and its shareholders.
The cost of advisory services provided and the level of profitability. The Board reviewed estimated profitability information regarding TFAI's costs of procuring portfolio management services, as well as the costs of provision of administration, transfer agency, fund accounting and other services, to the Fund and to TA IDEX as a whole by TFAI and its affiliates. Based on such information, the Trustees concluded that the proposed management fees of the Fund are competitive compared to other international large-cap mutual funds. In addition, on the basis of the Board's review of the management fees to be charged by TFAI for investment advisory and related services, TFAI profitability information (derived from TFAI's audited financial statements), TFAI's estimated management income resulting from its management of the Fund, the estimated margin of the Po rtfolio Construction Manager, as well as the entirety of TFAI's and its affiliates' service relationship with TA IDEX, the Board concluded that the anticipated investment management fees and other service fees, as well as TFAI's and the Portfolio Construction Manager's profitability, are appropriate in light of the nature and quality of services proposed to be provided, the management fees and overall expense ratios of comparable investment companies and the anticipated profitability of the relationship between the Fund, TFAI and its affiliates, and the Portfolio Construction Manager.
Whether fee levels reflect economies of scale and the extent to which economies of scale would be realized as the Fund grows. The Board considered the anticipated levels of assets in the Fund and noted that the management fee of the Fund will not contain asset-based breakpoints. However, the Board also noted that, based on the information provided by TFAI, the Fund's investments in underlying funds likely will permit the realization of breakpoints (or lower breakpoints) at the underlying fund level which, indirectly, benefit the Fund and its shareholders, as well as the underlying
Transamerica IDEX Mutual Funds
Semi-Annual Report 2006
8
TA IDEX Multi-Manager International Fund (continued)
funds. The Board concluded that the Fund's anticipated management fee appropriately reflects the Fund's anticipated size, the current economic environment for TFAI, the competitive nature of the investment company market, and TFAI's pricing strategy. The Trustees also concluded that they will have the opportunity to periodically reexamine whether the Fund has achieved economies of scale, and the appropriateness of management fees payable to TFAI and fees payable to the Portfolio Construction Manager, in the future.
Benefits (such as soft dollars) to TFAI, its affiliates, or the Portfolio Construction Manager from their relationship with the Fund. The Board concluded that other benefits expected to be derived by TFAI (including any benefits derived from investment advisory fees payable to TFAI with respect to the underlying funds in which the Fund will invest) or the Portfolio Construction Manager from its relationship with the Fund should be reasonable and fair, and consistent with industry practice and the best interests of the Fund and its shareholders. In this regard, the Board noted that neither TFAI nor the Portfolio Construction Manager will realize "soft dollar" benefits from its relationship with the Fund. In addition, the Trustees determined that the administration, transfer agency, fund accounting and other fees to be paid by the Fund to affiliates of TFAI will be reasonable, fair and in the best interests of shareholders in light of the nature and quality of the services provided, the associated costs to these affiliates of providing the services, the impact of the costs of such services on the Fund's overall operating expenses, and the necessity of the services for the Fund's operations.
Other considerations. The Board determined that TFAI had made a substantial commitment to the recruitment and retention of high quality personnel, and maintained the financial, compliance and operational resources reasonably necessary to manage the TA IDEX funds in a professional manner that is consistent with the best interests of the funds and their shareholders. In this regard, the Trustees favorably considered the procedures and policies in place by TFAI to enforce compliance with applicable laws and regulations and oversee the portfolio management activities of the Portfolio Construction Manager. The Trustees also determined that TFAI had made a significant entrepreneurial commitment to the management and success of the TA IDEX funds, reflected by TFAI's expense limitation and fee waiver arrangements with the TA IDEX funds, including the Fund, wh ich may result in TFAI waiving advisory fees for the benefit of shareholders.
Transamerica IDEX Mutual Funds
Semi-Annual Report 2006
9
TA IDEX PIMCO Real Return TIPS
UNDERSTANDING YOUR FUND'S EXPENSES
(unaudited)
SHAREHOLDER EXPENSES
Fund shareholders may incur two types of costs: (1) transaction costs, including sales charges (loads) on purchases, contingent deferred sales charges on redemptions and redemption fees; and (2) ongoing costs, including management fees, 12b-1 distribution and service fees, and other fund expenses.
The following Example is intended to help you understand your ongoing costs (in dollars and cents) of investing in the Fund and to compare these costs with the ongoing costs of investing in other funds.
The Example is based on an investment of $1,000 invested at November 1, 2005 and held for the entire period until April 30, 2006.
ACTUAL EXPENSES
The first line in the table below provides information about actual account values and actual expenses. You may use the information in this line, together with the amount you invested, to estimate the expenses that you paid over the period. Simply divide your account value by $1,000 (for example, an $8,600 account value divided by $1,000 = 8.6), then multiply the result by the number in the first line of your Fund under the heading entitled "Expenses Paid During Period" to estimate the expenses you paid on your account during this period. If your account is an IRA, your expenses could have included a $15 annual fee. The amount of any fee paid through your account would increase the estimate of expenses you paid during the period and decrease your ending account value.
HYPOTHETICAL EXAMPLE FOR COMPARISON PURPOSES
The second line in the table below provides information about hypothetical account values and hypothetical expenses based on the Fund's actual expense ratio and an assumed rate of return of 5% per year before expenses, which is not the Fund's actual return. The hypothetical account values and expenses may not be used to estimate the actual ending account balance or expenses you paid for the period. You may use this information to compare the ongoing costs of investing in your Fund and other funds. To do so, compare this 5% hypothetical example with the 5% hypothetical examples that appear in the shareholder reports of the other funds. As in the case of the actual expense example, if your account is subject to an IRA fee, the amount of the fee paid through your account would increase the hypothetical expenses you would have paid during the period and decrease the hypothetical ending account value.
Please note that the expenses shown in the table are meant to highlight your ongoing costs only and do not reflect any transactional costs, such as sales charges, redemption fees, brokerage commissions paid on purchases and sales of fund shares. Therefore, the second line under the Fund in the table is useful in comparing ongoing costs only, and will not help you determine the relative total costs of owning different funds. If any of these transaction costs were included, your costs would be higher. The expenses shown in the table do not reflect any fees that may be charged to you by brokers, financial intermediaries or other financial institutions.
| Beginning Account Value | Ending Account Value | Annualized Expense Ratio | Expenses Paid During Period (a) | ||||||||||||||||
| Class A | |||||||||||||||||||
| Actual | $ | 1,000.00 | $ | 987.60 | 1.09 | % | $ | 5.37 | |||||||||||
| Hypothetical (b) | 1,000.00 | 1,019.39 | 1.09 | 5.46 | |||||||||||||||
| Class B | |||||||||||||||||||
| Actual | 1,000.00 | 985.30 | 1.59 | 7.83 | |||||||||||||||
| Hypothetical (b) | 1,000.00 | 1,016.91 | 1.59 | 7.95 | |||||||||||||||
| Class C | |||||||||||||||||||
| Actual | 1,000.00 | 985.30 | 1.58 | 7.78 | |||||||||||||||
| Hypothetical (b) | 1,000.00 | 1,016.96 | 1.58 | 7.90 | |||||||||||||||
| Class I | |||||||||||||||||||
| Actual | 1,000.00 | 989.50 | 0.73 | 3.60 | |||||||||||||||
| Hypothetical (b) | 1,000.00 | 1,021.17 | 0.73 | 3.66 | |||||||||||||||
(a) Expenses are calculated using the Fund's annualized expense ratio (as disclosed in the table), multiplied by the average account value for the period, multiplied by number of days in the period (181 days), and divided by the number of days in the year (365 days).
(b) 5% return per year before expenses.
GRAPHICAL PRESENTATION OF SCHEDULE OF INVESTMENTS
By Asset Type
At April 30, 2006
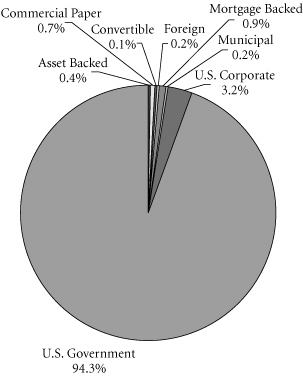
This chart shows the percentage breakdown by asset type of the Fund's total investment securities.
Transamerica IDEX Mutual Funds
Semi-Annual Report 2006
1
TA IDEX PIMCO Real Return TIPS
SCHEDULE OF INVESTMENTS
At April 30, 2006
(all amounts except share amounts in thousands)
(unaudited)
| Principal | Value | ||||||||||
| U.S. GOVERNMENT OBLIGATIONS (119.3%) | |||||||||||
| U.S. Treasury Bond 6.63%, due 02/15/2027 | $ | 900 | $ | 1,047 | |||||||
| U.S. Treasury Inflation Indexed Bond 3.38%, due 01/15/2007 | 26,332 | 26,642 | |||||||||
| 3.63%, due 01/15/2008 | 79,068 | 81,462 | |||||||||
| 3.88%, due 01/15/2009 | 37,915 | 39,799 | |||||||||
| 4.25%, due 01/15/2010 | 50,774 | 54,665 | |||||||||
| 0.88%, due 04/15/2010 | 19,714 | 18,749 | |||||||||
| 3.50%, due 01/15/2011 | 51,593 | 54,636 | |||||||||
| 2.00%, due 04/15/2011 | 1,701 | 1,712 | |||||||||
| 3.38%, due 01/15/2012 | 508 | 539 | |||||||||
| 3.00%, due 07/15/2012 | 43,091 | 44,914 | |||||||||
| 1.88%, due 07/15/2013 | 67,387 | 65,465 | |||||||||
| 2.00%, due 01/15/2014 | 38,060 | 37,140 | |||||||||
| 2.00%, due 07/15/2014 | 47,532 | 46,323 | |||||||||
| 1.88%, due 07/15/2015 | 25,125 | 24,121 | |||||||||
| 2.00%, due 01/15/2016 | 11,210 | 10,838 | |||||||||
| 2.38%, due 01/15/2025 | 44,370 | 43,836 | |||||||||
| 2.00%, due 01/15/2026 | 21,220 | 19,732 | |||||||||
| 3.63%, due 04/15/2028 | 36,602 | 44,046 | |||||||||
| 3.88%, due 04/15/2029 | 40,289 | 50,563 | |||||||||
| 3.38%, due 04/15/2032 | 1,119 | 1,344 | |||||||||
| U.S. Treasury Note 4.50%, due 02/15/2036 | 2,200 | 1,977 | |||||||||
| Total U.S. Government Obligations (cost: $681,549) | 669,550 | ||||||||||
| U.S. GOVERNMENT AGENCY OBLIGATIONS (7.2%) | |||||||||||
| Fannie Mae 4.73%, due 09/07/2006 * | 2,600 | 2,599 | |||||||||
| 4.81%, due 09/21/2006 * | 10,500 | 10,496 | |||||||||
| 4.95%, due 10/01/2044 * | 211 | 212 | |||||||||
| Fannie Mae TBA 5.00%, due 05/01/2036 | 9,000 | 8,511 | |||||||||
| 5.50%, due 05/01/2036 | 18,600 | 18,060 | |||||||||
| Fannie Mae, Series 2003-63, Class FA 5.11%, due 08/25/2034 * | 769 | 768 | |||||||||
| Total U.S. Government Agency Obligations (cost: $41,022) | 40,646 | ||||||||||
| FOREIGN GOVERNMENT OBLIGATIONS (0.2%) | |||||||||||
| Canada Government 3.00%, due 12/01/2036 | CAD | 420 | 487 | ||||||||
| Russian Federation 5.00%, due 03/31/2030 (a) | 500 | 541 | |||||||||
| Total Foreign Government Obligations (cost: $907) | 1,028 | ||||||||||
| Principal | Value | ||||||||||
| MORTGAGE-BACKED SECURITIES (1.3%) | |||||||||||
| Bank of America Mortgage Securities, Series 2004-1, Class 5A1 6.50%, due 09/25/2033 | $ | 131 | $ | 129 | |||||||
| Countrywide Home Loan Mortgage Pass Through Trust, Series 2005-3, Class 1A2 5.25%, due 04/25/2035 * | 3,264 | 3,275 | |||||||||
| Countrywide Home Loan Mortgage Pass Through Trust, Series 2005-R2, Class 1AF1–144A 5.30%, due 06/25/2035 * | 577 | 579 | |||||||||
| Greenpoint Mortgage Funding Trust, Series 2005-AR1, Class A2 5.18%, due 06/25/2045 * | 1,625 | 1,631 | |||||||||
| GSR Mortgage Loan Trust, Series 2005-AR6, Class 2A1 4.54%, due 09/25/2035 * | 1,529 | 1,494 | |||||||||
| Total Mortgage-Backed Securities (cost: $7,126) | 7,108 | ||||||||||
| ASSET-BACKED SECURITIES (0.5%) | |||||||||||
| Carrington Mortgage Loan Trust, Series 2005-NC3, Class A1A 5.04%, due 06/25/2035 * | 75 | 75 | |||||||||
| Citigroup Mortgage Loan Trust, Inc., Series 2005-1L, Class A1A 4.90%, due 12/25/2035 *m | 96 | 95 | |||||||||
| Equity One ABS, Inc., Series 2004-1, Class AV2 5.26%, due 04/25/2034 * | 161 | 162 | |||||||||
| GSAMP Trust, Series 2004-SEA2, Class A2A 5.25%, due 03/25/2034 * | 274 | 274 | |||||||||
| Merrill Lynch Mortgage Investors, Inc., Series 2006-WMC1, Class A2A 5.04%, due 01/25/2037 * | 369 | 369 | |||||||||
| Residential Asset Mortgage Product, Inc., Series 2004-RS9, Class AII1 5.12%, due 09/25/2013 * | 245 | 245 | |||||||||
| Residential Asset Securities Corp., Series 2006-KS3, Class AI1 4.89%, due 04/25/2036 * | 96 | 96 | |||||||||
| Sequoia Mortgage Trust, Series 5, Class A 5.26%, due 10/19/2026 * | 404 | 405 | |||||||||
| Small Business Administration, Series 2004-P10, Class A 4.50%, due 02/10/2014 | 1,029 | 976 | |||||||||
| Soundview Home Equity Loan Trust, Series 2006-1, Class A1 5.03%, due 02/25/2036 * | 180 | 180 | |||||||||
The notes to the financial statements are an integral part of this report.
Transamerica IDEX Mutual Funds
Semi-Annual Report 2006
2
TA IDEX PIMCO Real Return TIPS
SCHEDULE OF INVESTMENTS (continued)
At April 30, 2006
(all amounts except share amounts in thousands)
(unaudited)
| Principal | Value | ||||||||||
| Soundview Home Equity Loan Trust, Series 2006-2, Class A1 5.03%, due 03/25/2036 * | $ | 95 | $ | 95 | |||||||
| Truman Capital Mortgage Loan Trust, Series 2004-1, Class A1–144A 5.30%, due 01/25/2034 * | 73 | 73 | |||||||||
| Total Asset-Backed Securities (cost: $3,098) | 3,045 | ||||||||||
| MUNICIPAL BONDS (0.2%) | |||||||||||
| Revenue-Miscellaneous (0.1%) | |||||||||||
| New Hampshire Municipal Bond Bank, Series B 5.00%, due 08/15/2013 | 500 | 534 | |||||||||
| Revenue-Tobacco (0.1%) | |||||||||||
| Tobacco Settlement Financing Corp., RI 6.00%, due 06/01/2023 | 600 | 628 | |||||||||
| Revenue-Utilities (0.0%) | |||||||||||
| New York, NY, City Municipal Water Finance Authority 4.75%, due 06/15/2038 | 200 | 197 | |||||||||
| Total Municipal Bonds (cost: $1,269) | 1,359 | ||||||||||
| CORPORATE DEBT SECURITIES (4.6%) | |||||||||||
| Automotive (0.5%) | |||||||||||
| DaimlerChrysler North America Holding Corp. 5.10%, due 03/07/2007 * | 2,800 | 2,801 | |||||||||
| Commercial Banks (0.3%) | |||||||||||
| Rabobank Nederland–144A 5.09%, due 01/15/2009 * | 400 | 400 | |||||||||
| Wachovia Bank NA 4.89%, due 12/02/2010 * | 1,200 | 1,200 | |||||||||
| Gas Production & Distribution (0.0%) | |||||||||||
| El Paso Corp. 7.63%, due 08/16/2007 | 100 | 101 | |||||||||
| Insurance (0.1%) | |||||||||||
| Residential Reinsurance, Ltd.–144A 9.77%, due 06/08/2006 *§ | 300 | 297 | |||||||||
| Mortgage Bankers & Brokers (0.3%) | |||||||||||
| Atlantic & Western Re, Ltd., Series A–144A 10.99%, due 01/09/2007 *§ | 1,100 | 1,088 | |||||||||
| Atlantic & Western Re, Ltd., Series B–144A 11.24%, due 01/09/2009 *§ | 700 | 674 | |||||||||
| Paper & Allied Products (0.2%) | |||||||||||
| Koch Forest Products, Inc. Loan Agreement, Series B 0.00%, due 12/20/2012 § | 1,000 | 1,005 | |||||||||
| Principal | Value | ||||||||||
| Personal Credit Institutions (2.2%) | |||||||||||
| Ford Motor Credit Co. 5.70%, due 11/16/2006 * | $ | 1,700 | $ | 1,692 | |||||||
| 5.88%, due 03/21/2007 * | 2,900 | 2,856 | |||||||||
| General Electric Capital Corp. 4.88%, due 03/04/2008 * | 2,300 | 2,301 | |||||||||
| 4.93%, due 12/12/2008 * | 500 | 500 | |||||||||
| General Motors Acceptance Corp. 5.65%, due 05/18/2006 * | 1,500 | 1,500 | |||||||||
| Toyota Motor Credit Corp. 4.84%, due 09/18/2006 * | 3,500 | 3,500 | |||||||||
| Security & Commodity Brokers (1.0%) | |||||||||||
| Citigroup, Inc. 5.17%, due 01/30/2009 * | 500 | 500 | |||||||||
| Goldman Sachs Group, Inc. 5.26%, due 06/28/2010 * | 3,000 | 3,014 | |||||||||
| Goldman Sachs Group, Inc., Series E 4.87%, due 08/01/2006 * | 2,100 | 2,100 | |||||||||
| Total Corporate Debt Securities (cost: $25,601) | 25,529 | ||||||||||
| SHORT-TERM U.S. GOVERNMENT OBLIGATIONS (0.2%) | |||||||||||
| U.S. Treasury Bill 4.51%, due 06/01/2006 d | 320 | 319 | |||||||||
| 4.50%, due 06/15/2006 v | 585 | 581 | |||||||||
| Total Short-Term U.S. Government Obligations (cost: $900) | 900 | ||||||||||
| COMMERCIAL PAPER (0.9%) | |||||||||||
| Commercial Banks (0.9%) | |||||||||||
| Skandinaviska Enskilda Banken AB–144A 5.00%, due 07/26/2006 | 1,600 | 1,581 | |||||||||
| Societe Generale North America, Inc. 5.00%, due 08/24/2006 | 3,000 | 2,951 | |||||||||
| UBS Finance Delaware LLC 4.99%, due 08/22/2006 | 500 | 492 | |||||||||
| Total Commercial Paper (cost: $5,024) | 5,024 | ||||||||||
| Contracts w | Value | ||||||||||
| PURCHASED SWAPTIONS (0.0%) | |||||||||||
| Put Swaptions (0.0%) | |||||||||||
| Libor Rate Swaption m§ Put Strike $4.25 Expires 06/12/2006 | 1,300,000 | $ | 121 | ||||||||
| Total Purchased Swaptions (cost: $38) | 121 | ||||||||||
| Total Investment Securities (cost: $766,534) | $ | 754,310 | |||||||||
The notes to the financial statements are an integral part of this report.
Transamerica IDEX Mutual Funds
Semi-Annual Report 2006
3
TA IDEX PIMCO Real Return TIPS
SCHEDULE OF INVESTMENTS (continued)
At April 30, 2006
(all amounts except share amounts in thousands)
(unaudited)
| Contracts w | Value | ||||||||||
| WRITTEN OPTIONS (0.0%) | |||||||||||
| Covered Call Options (0.0%) | |||||||||||
| 10 Year U.S. Treasury Note Futures | 20 | $ | (1 | ) | |||||||
| Call Strike $110.00 | |||||||||||
| Expires 05/26/2006 | |||||||||||
| Put Options (0.0%) | |||||||||||
| 10 Year U.S. Treasury Note Futures Put Strike $107.00 Expires 05/26/2006 | 20 | (30 | ) | ||||||||
| U.S. Treasury Long Bond Futures Put Strike $110.00 Expires 05/26/2006 | 33 | (106 | ) | ||||||||
| Total Written Options (premiums: $54) | (137 | ) | |||||||||
| SWAP AGREEMENTS: | |||||||||||
| Expiration Date | Notional Amount | Net Unrealized Appreciation (Depreciation) | |||||||||||||
| Receive a fixed rate equal to 5.00% and pay a floating rate based on 3-month United States Dollar–LIBOR. Counterparty: UBS AG | 06/21/06 | $ | 3,800 | $ | (24 | ) | |||||||||
| Receive a fixed rate equal to 5.00% and pay a floating rate based on 3-month United States Dollar–LIBOR. Counterparty: Goldman Sachs Capital Markets, LP | 06/21/06 | 3,100 | (20 | ) | |||||||||||
| Receive a floating rate based on 3-month United States Dollar–LIBOR and pay a fixed rate equal to 5.00%. Counterparty: Barclays Bank PLC § | 06/21/06 | 4,000 | 103 | ||||||||||||
| Receive a fixed rate equal to 5.00% and pay a floating rate based on 3-month United States Dollar–LIBOR. Counterparty: Goldman Sachs Capital Markets, LP § | 06/21/06 | 15,800 | (276 | ) | |||||||||||
| Receive a floating rate based on 3-month United States Dollar–LIBOR and pay a fixed rate equal to 5.00%. Counterparty: Morgan Stanley Capital, Inc. § | 06/21/06 | 100 | 3 | ||||||||||||
| Expiration Date | Notional Amount | Net Unrealized Appreciation (Depreciation) | |||||||||||||
| Receive a floating rate based on 3-month United States Dollar–LIBOR and pay a fixed rate equal to 5.00%. Counterparty: JP Morgan & Chase § | 06/21/06 | $ | 8,400 | $ | 282 | ||||||||||
| Receive a floating rate based on 3-month United States Dollar–LIBOR and pay a fixed rate equal to 5.00%. Counterparty: Goldman Sachs Capital Markets, LP § | 06/21/06 | 8,100 | 272 | ||||||||||||
| Receive a floating rate based on 3-month United States Dollar–LIBOR and pay a fixed rate equal to 5.00%. Counterparty: Bank of America, N.A. § | 06/21/06 | 16,800 | 564 | ||||||||||||
| Receive a floating rate based on 3-month United States Dollar–LIBOR and pay a fixed rate equal to 5.00%. Counterparty: Barclays Bank PLC § | 06/21/06 | 5,000 | 199 | ||||||||||||
| Receive a floating rate based on 6-month EURIBOR and pay a fixed rate equal to 4.50%. Counterparty: Goldman Sachs Capital Markets, LP | 06/17/15 | 8,400 | 646 | ||||||||||||
| Receive a fixed rate equal to 2.1025% and the Fund will pay a floating rate based on FRC- Excluding Tobacco-Non-Revised Consumer Price Index. Counterparty: Barclays Bank PLC § | 10/15/10 | 5,000 | 5 | ||||||||||||
| Receive a fixed rate equal to 2.04% and the Fund will pay a floating rate based on FRC–Excluding Tobacco- Non-Revised Consumer Price Index. Counterparty: BNP Paribas | 02/21/11 | 5,500 | (30 | ) | |||||||||||
| Receive a floating rate based on 3-month United States Dollar–LIBOR and pay a fixed rate equal to 5.00%. Counterparty: UBS AG rate § | 06/21/16 | 5,300 | 135 | ||||||||||||
| Receive a fixed rate equal to 3.65% and the Fund will pay to the counterparty at the notional amount in the event of default of General Motors Acceptance Corp., 6.875, due 08/28/2012. Counterparty: Deutsche Bank AG § | 06/20/11 | 200 | 3 | ||||||||||||
The notes to the financial statements are an integral part of this report.
Transamerica IDEX Mutual Funds
Semi-Annual Report 2006
4
TA IDEX PIMCO Real Return TIPS
SCHEDULE OF INVESTMENTS (continued)
At April 30, 2006
(all amounts except share amounts in thousands)
(unaudited)
| Expiration Date | Notional Amount | Net Unrealized Appreciation (Depreciation) | |||||||||||||
| Receive a fixed rate equal to 3.40% and the Fund will pay to the counterparty at the notional amount in the event of default of General Motors Acceptance Corp., 6.875, due 08/28/2012. Counterparty: Lehman Securities, Inc. § | 06/20/11 | $ | 1,900 | $ | 9 | ||||||||||
| Total Swap Agreements (premium $480) | $ | 91,400 | $ | 1,871 | |||||||||||
| FORWARD FOREIGN CURRENCY CONTRACTS: | |||||||||||||||
| Currency | Bought (Sold) | Settlement Date | Amount in U.S. Dollars Bought (Sold) | Net Unrealized Appreciation (Depreciation) | |||||||||||||||
| British Pound Sterling | 135 | 05/03/2006 | $ | 235 | $ | 10 | |||||||||||||
| British Pound Sterling | (135 | ) | 05/03/2006 | (236 | ) | (9 | ) | ||||||||||||
| Canadian Dollar | (487 | ) | 05/03/2006 | (418 | ) | (17 | ) | ||||||||||||
| Canadian Dollar | (487 | ) | 06/15/2006 | (434 | ) | (1 | ) | ||||||||||||
| Euro Dollar | 367 | 05/25/2006 | 453 | 10 | |||||||||||||||
| Euro Dollar | (100 | ) | 05/25/2006 | (125 | ) | (1 | ) | ||||||||||||
| $ | (525 | ) | $ | (8 | ) | ||||||||||||||
| FUTURES CONTRACTS: | |||||||||||||||||||
| Contracts | Settlement Date | Amount | Net Unrealized Appreciation (Depreciation) | ||||||||||||||||
| 10 Year U.S. Treasury Note | 70 | 06/30/2006 | $ | 7,391 | $ | (63 | ) | ||||||||||||
| 5 Year U.S. Treasury Note | 110 | 07/06/2006 | 11,457 | (114 | ) | ||||||||||||||
| 90-Day Euro Dollar | 45 | 03/19/2007 | 10,664 | (49 | ) | ||||||||||||||
| 90-Day Euro Dollar | 85 | 06/18/2007 | 20,147 | (72 | ) | ||||||||||||||
| 90-Day Euro Dollar | 85 | 09/17/2007 | 20,148 | (75 | ) | ||||||||||||||
| 90-Day Euro Dollar | 85 | 12/17/2007 | 20,146 | (75 | ) | ||||||||||||||
| 90-Day Euro Dollar | 39 | 03/17/2008 | 9,242 | (24 | ) | ||||||||||||||
| U.S. Treasury Long Bond | (103 | ) | 06/30/2006 | (11,005 | ) | 196 | |||||||||||||
| $ | 88,190 | $ | (276 | ) | |||||||||||||||
NOTES TO SCHEDULE OF INVESTMENTS:
* Floating or variable rate note. Rate is listed as of April 30, 2006.
(a) Russian Federation has a coupon rate of 5.00% until 03/31/2007, thereafter the coupon rate will become 7.50%.
v At April 30, 2006, all or a portion of this security is segregated with the custodian to cover margin requirements for open option contracts. The value of all securities segregated at April 30, 2006, is $581.
w Contract amounts are not in thousands.
§ Security is deemed to be illiquid.
m Securities valued as determined in good faith in accordance with procedure established by the Fund's Board of Trustees.
d At April 30, 2006, all or a portion of this security is segregated with the custodian to cover margin requirements for open future contracts. The value of all securities segregated at April 30, 2006, is $319.
# Aggregate cost for Federal income tax purposes is $770,006. Aggregate gross unrealized appreciation for all securities in which there is an excess of value over tax cost and aggregate gross unrealized depreciation for all securities in which there is an excess of tax cost over value were $1,360 and $17,056, respectively. Net unrealized depreciation for tax purposes is $15,696.
DEFINITIONS:
144A 144A Securities are registered pursuant to Rule 144A of the Securities Act of 1933. These securities are deemed to be liquid for purposes of compliance limitations on holdings of illiquid securities and may be resold as transactions exempt from registration, normally to qualified institutional buyers. At April 30, 2006, these securities aggregated $4,692 or 0.8% of the net assets of the Fund.
CAD Canadian dollar
EURIBOR Euro Interbank Offer Rate
LIBOR London Interbank Offer Rate
TBA Mortgage-backed securities traded under delayed delivery commitments. Income on TBA's are not earned until settlement date.
The notes to the financial statements are an integral part of this report.
Transamerica IDEX Mutual Funds
Semi-Annual Report 2006
5
TA IDEX PIMCO Real Return TIPS
STATEMENT OF ASSETS AND LIABILITIES
At April 30, 2006
(all amounts except per share amounts in thousands)
(unaudited)
| Assets: | |||||||
| Investment securities, at value (cost: $766,534) | $ | 754,310 | |||||
| Cash | 2,472 | ||||||
| Foreign currency (cost: $55) | 57 | ||||||
| Receivables: | |||||||
| Investment securities sold | 4 | ||||||
| Interest | 5,683 | ||||||
| Variation margin | 44 | ||||||
| Swap agreements at value (premium $480) | 1,391 | ||||||
| Unrealized appreciation on forward foreign currency contracts | 20 | ||||||
| Other | 11 | ||||||
| 763,992 | |||||||
| Liabilities: | |||||||
| Investment securities purchased | 200,977 | ||||||
| Accounts payable and accrued liabilities: | |||||||
| Shares of beneficial interest redeemed | 738 | ||||||
| Management and advisory fees | 309 | ||||||
| Swap contract interest | 452 | ||||||
| Transfer agent fees | 3 | ||||||
| Administration fees | 9 | ||||||
| Unrealized depreciation on forward foreign currency contracts | 28 | ||||||
| Written options (premiums $54) | 137 | ||||||
| Other | 46 | ||||||
| 202,699 | |||||||
| Net Assets | $ | 561,293 | |||||
| Net Assets Consist of: | |||||||
| Shares of beneficial interest, unlimited shares authorized, no par value | $ | 582,635 | |||||
| Distributable net investment income (loss) | 994 | ||||||
| Accumulated net realized gain (loss) from investment securities , futures contracts, written options, swaps and foreign currency transactions | (11,620 | ) | |||||
| Net unrealized appreciation (depreciation) on: Investment securities | (12,224 | ) | |||||
| Futures contracts | (276 | ) | |||||
| Written option contracts | (83 | ) | |||||
| Swap agreements | 1,871 | ||||||
| Translation of assets and liabilities denominated in foreign currencies | (4 | ) | |||||
| Net Assets | $ | 561,293 | |||||
| Net Assets by Class: | |||||||
| Class A | $ | 5,164 | |||||
| Class B | 6,541 | ||||||
| Class C | 4,682 | ||||||
| Class I | 544,906 | ||||||
| Shares Outstanding: | |||||||
| Class A | 518 | ||||||
| Class B | 662 | ||||||
| Class C | 476 | ||||||
| Class I | 54,608 | ||||||
| Net Asset Value Per Share: | |||||||
| Class A | $ | 9.97 | |||||
| Class B | 9.88 | ||||||
| Class C | 9.84 | ||||||
| Class I | 9.98 | ||||||
| Maximum Offering Price Per Share (a): | |||||||
| Class A | $ | 10.47 | |||||
(a) Includes the maximum selling commission (represented as a percentage of offering price) which is reduced on certain levels of sales as set forth in the Prospectus. Net asset value per share for Classes B, C and I shares represents offering price. The redemption price for Classes B and C shares equals net asset value less any applicable contingent deferred sales charge.
STATEMENT OF OPERATIONS
For the period ended April 30, 2006
(all amounts in thousands)
(unaudited)
| Investment Income: | |||||||
| Interest | $ | 11,537 | |||||
| Dividends | 10 | ||||||
| 11,547 | |||||||
| Expenses: | |||||||
| Management and advisory fees | 1,849 | ||||||
| Distribution and service fees: | |||||||
| Class A | 48 | ||||||
| Class B | 29 | ||||||
| Class C | 24 | ||||||
| Transfer agent fees: | |||||||
| Class A | 5 | ||||||
| Class B | 6 | ||||||
| Class C | 4 | ||||||
| Class I | – | (b) | |||||
| Printing and shareholder reports | 2 | ||||||
| Custody fees | 46 | ||||||
| Administration fees | 55 | ||||||
| Legal fees | 14 | ||||||
| Audit fees | 9 | ||||||
| Trustees fees | 11 | ||||||
| Registration fees | 10 | ||||||
| Other | 5 | ||||||
| Total expenses | 2,117 | ||||||
| Net Investment Income (Loss) | 9,430 | ||||||
| Net Realized Gain (Loss) from: | |||||||
| Investment securities | (11,051 | ) | |||||
| Futures contracts | 200 | ||||||
| Written option contracts | 283 | ||||||
| Swap agreements | 2,772 | ||||||
| Foreign currency transactions | (361 | ) | |||||
| (8,157 | ) | ||||||
| Net Increase (Decrease) in Unrealized Appreciation (Depreciation) on: | |||||||
| Investment securities | (5,923 | ) | |||||
| Futures contracts | (533 | ) | |||||
| Written option contracts | 19 | ||||||
| Swap agreements | (843 | ) | |||||
| Translation of assets and liabilities denominated in foreign currencies | (33 | ) | |||||
| (7,313 | ) | ||||||
| Net Realized and Unrealized Gain (Loss) on Investment Securities, Futures Contracts, Written Options, Swaps and Foreign Currency Transactions | (15,470 | ) | |||||
| Net Increase (Decrease) in Net Assets Resulting from Operations | $ | (6,040 | ) | ||||
(b) Rounds to less than $1.
The notes to the financial statements are an integral part of this report.
Transamerica IDEX Mutual Funds
Semi-Annual Report 2006
6
TA IDEX PIMCO Real Return TIPS
STATEMENTS OF CHANGES IN NET ASSETS
For the period or year ended
(all amounts in thousands)
| April 30, 2006 (unaudited) | October 31, 2005 (a) | ||||||||||
| Increase (Decrease) In Net Assets From: | |||||||||||
| Operations: | |||||||||||
| Net investment income (loss) | $ | 9,430 | $ | 18,206 | |||||||
| Net realized gain (loss) from investment securities, futures contracts, written options, swaps and foreign currency transactions | (8,157 | ) | (1,266 | ) | |||||||
| Change in unrealized appreciation (depreciation) on investment securities, futures contracts, written options, swaps and foreign currency translation | (7,313 | ) | (4,057 | ) | |||||||
| (6,040 | ) | 12,883 | |||||||||
| Distributions to Shareholders: | |||||||||||
| From net investment income: | |||||||||||
| Class A | (865 | ) | (8,833 | ) | |||||||
| Class B | (119 | ) | (210 | ) | |||||||
| Class C | (100 | ) | (186 | ) | |||||||
| Class I | (7,468 | ) | (9,545 | ) | |||||||
| (8,552 | ) | (18,774 | ) | ||||||||
| From net realized gains: | |||||||||||
| Class A | (4 | ) | (5,455 | ) | |||||||
| Class B | (5 | ) | (127 | ) | |||||||
| Class C | (4 | ) | (109 | ) | |||||||
| Class I | (266 | ) | (3,816 | ) | |||||||
| (279 | ) | (9,507 | ) | ||||||||
| Capital Share Transactions: | |||||||||||
| Proceeds from shares sold: | |||||||||||
| Class A | 111 | 18,211 | |||||||||
| Class B | 21 | 5,708 | |||||||||
| Class C | 282 | 4,853 | |||||||||
| Class I | 317,381 | 289,761 | |||||||||
| 317,795 | 318,533 | ||||||||||
| Dividends and distributions reinvested: | |||||||||||
| Class A | 848 | 14,233 | |||||||||
| Class B | 95 | 255 | |||||||||
| Class C | 62 | 178 | |||||||||
| Class I | 7,734 | 13,361 | |||||||||
| 8,739 | 28,027 | ||||||||||
| Cost of shares redeemed: | |||||||||||
| Class A | (270,891 | ) | (77,637 | ) | |||||||
| Class B | (3,247 | ) | (3,323 | ) | |||||||
| Class C | (3,649 | ) | (3,263 | ) | |||||||
| Class I | (63,901 | ) | – | ||||||||
| (341,688 | ) | (84,223 | ) | ||||||||
(a) Class I was offered for investment on November 8, 2004.
| April 30, 2006 (unaudited) | October 31, 2005 (a) | ||||||||||
| Automatic conversions: | |||||||||||
| Class A | $ | 1 | $ | 1 | |||||||
| Class B | (1 | ) | (1 | ) | |||||||
| – | – | ||||||||||
| (15,154 | ) | 262,337 | |||||||||
| Net increase (decrease) in net assets | (30,025 | ) | 246,939 | ||||||||
| Net Assets: | |||||||||||
| Beginning of period | 591,318 | 344,379 | |||||||||
| End of period | $ | 561,293 | $ | 591,318 | |||||||
| Distributable Net Investment Income (Loss) | $ | 994 | $ | 116 | |||||||
| Share Activity: | |||||||||||
| Shares issued: | |||||||||||
| Class A | 11 | 1,743 | |||||||||
| Class B | 2 | 550 | |||||||||
| Class C | 28 | 471 | |||||||||
| Class I | 31,234 | 27,591 | |||||||||
| 31,275 | 30,355 | ||||||||||
| Shares issued–reinvested from distributions: | |||||||||||
| Class A | 84 | 1,368 | |||||||||
| Class B | 10 | 24 | |||||||||
| Class C | 6 | 18 | |||||||||
| Class I | 765 | 1,284 | |||||||||
| 865 | 2,694 | ||||||||||
| Shares redeemed: | |||||||||||
| Class A | (26,690 | ) | (7,502 | ) | |||||||
| Class B | (323 | ) | (321 | ) | |||||||
| Class C | (365 | ) | (317 | ) | |||||||
| Class I | (6,266 | ) | – | ||||||||
| (33,644 | ) | (8,140 | ) | ||||||||
| Net increase (decrease) in shares outstanding: | |||||||||||
| Class A | (26,595 | ) | (4,391 | ) | |||||||
| Class B | (311 | ) | 253 | ||||||||
| Class C | (331 | ) | 172 | ||||||||
| Class I | 25,733 | 28,875 | |||||||||
| (1,504 | ) | 24,909 | |||||||||
The notes to the financial statements are an integral part of this report.
Transamerica IDEX Mutual Funds
Semi-Annual Report 2006
7
TA IDEX PIMCO Real Return TIPS
FINANCIAL HIGHLIGHTS
(unaudited for the period ended April 30, 2006)
| For a share of beneficial interest outstanding throughout each period | |||||||||||||||||||||||||||||||||||||||
| Net Asset | Investment Operations | Distributions | Net Asset | ||||||||||||||||||||||||||||||||||||
| For the Period Ended (d)(g) | Value, Beginning of Period | Net Investment Income (Loss) | Net Realized and Unrealized Gain (Loss) | Total Operations | From Net Investment Income | From Net Realized Gains | Total Distributions | Value, End of Period | |||||||||||||||||||||||||||||||
| Class A | 4/30/2006 | $ | 10.23 | $ | 0.48 | $ | (0.60 | ) | $ | (0.12 | ) | $ | (0.13 | ) | $ | (0.01 | ) | $ | (0.14 | ) | $ | 9.97 | |||||||||||||||||
| 10/31/2005 | 10.48 | 0.30 | (0.06 | ) | 0.24 | (0.32 | ) | (0.17 | ) | (0.49 | ) | 10.23 | |||||||||||||||||||||||||||
| 10/31/2004 | 10.10 | 0.02 | 0.76 | 0.78 | (0.02 | ) | (0.38 | ) | (0.40 | ) | 10.48 | ||||||||||||||||||||||||||||
| 10/31/2003 | 10.00 | 0.14 | 0.07 | 0.21 | (0.11 | ) | – | (0.11 | ) | 10.10 | |||||||||||||||||||||||||||||
| Class B | 4/30/2006 | 10.17 | 0.13 | (0.28 | ) | (0.15 | ) | (0.13 | ) | (0.01 | ) | (0.14 | ) | 9.88 | |||||||||||||||||||||||||
| 10/31/2005 | 10.42 | 0.23 | (0.09 | ) | 0.14 | (0.22 | ) | (0.17 | ) | (0.39 | ) | 10.17 | |||||||||||||||||||||||||||
| 10/31/2004 | 10.08 | (0.02 | ) | 0.75 | 0.73 | (0.01 | ) | (0.38 | ) | (0.39 | ) | 10.42 | |||||||||||||||||||||||||||
| 10/31/2003 | 10.00 | 0.09 | 0.08 | 0.17 | (0.09 | ) | – | (0.09 | ) | 10.08 | |||||||||||||||||||||||||||||
| Class C | 4/30/2006 | 10.13 | 0.13 | (0.28 | ) | (0.15 | ) | (0.13 | ) | (0.01 | ) | (0.14 | ) | 9.84 | |||||||||||||||||||||||||
| 10/31/2005 | 10.39 | 0.23 | (0.09 | ) | 0.14 | (0.23 | ) | (0.17 | ) | (0.40 | ) | 10.13 | |||||||||||||||||||||||||||
| 10/31/2004 | 10.08 | (0.06 | ) | 0.76 | 0.70 | (0.01 | ) | (0.38 | ) | (0.39 | ) | 10.39 | |||||||||||||||||||||||||||
| 10/31/2003 | 10.00 | 0.09 | 0.08 | 0.17 | (0.09 | ) | – | (0.09 | ) | 10.08 | |||||||||||||||||||||||||||||
| Class I | 4/30/2006 | 10.25 | 0.16 | (0.27 | ) | (0.11 | ) | (0.15 | ) | (0.01 | ) | (0.16 | ) | 9.98 | |||||||||||||||||||||||||
| 10/31/2005 | 10.45 | 0.37 | (0.04 | ) | 0.33 | (0.36 | ) | (0.17 | ) | (0.53 | ) | 10.25 | |||||||||||||||||||||||||||
| Ratios/Supplemental Data | |||||||||||||||||||||||||||||||
| For the Period | Total | Net Assets, End of Period | Ratio of Expenses to Average Net Assets (a) | Net Investment Income (Loss) to Average | Portfolio Turnover | ||||||||||||||||||||||||||
| Ended (g) | Return (c) | (000's) | Net (e) | Total (f) | Net Assets (a) | Rate (b) | |||||||||||||||||||||||||
| Class A | 4/30/2006 | (1.24 | )% | $ | 5,164 | 1.09 | % | 1.09 | % | 9.49 | % | 194 | % | ||||||||||||||||||
| 10/31/2005 | 2.35 | 277,289 | 1.10 | 1.10 | 2.89 | 662 | |||||||||||||||||||||||||
| 10/31/2004 | 7.94 | 330,282 | 1.15 | 1.15 | 0.20 | 1,438 | |||||||||||||||||||||||||
| 10/31/2003 | 2.09 | 36,531 | 1.65 | 2.03 | 2.07 | 480 | |||||||||||||||||||||||||
| Class B | 4/30/2006 | (1.47 | ) | 6,541 | 1.59 | 1.59 | 2.59 | 194 | |||||||||||||||||||||||
| 10/31/2005 | 1.39 | 9,896 | 2.00 | 2.00 | 2.26 | 662 | |||||||||||||||||||||||||
| 10/31/2004 | 7.51 | 7,496 | 1.51 | 1.51 | (0.20 | ) | 1,438 | ||||||||||||||||||||||||
| 10/31/2003 | 1.72 | 3,194 | 2.30 | 2.68 | 1.42 | 480 | |||||||||||||||||||||||||
| Class C | 4/30/2006 | (1.47 | ) | 4,682 | 1.58 | 1.58 | 2.52 | 194 | |||||||||||||||||||||||
| 10/31/2005 | 1.35 | 8,167 | 2.04 | 2.04 | 2.22 | 662 | |||||||||||||||||||||||||
| 10/31/2004 | 7.20 | 6,601 | 1.87 | 1.87 | (0.52 | ) | 1,438 | ||||||||||||||||||||||||
| 10/31/2003 | 1.72 | 3,148 | 2.30 | 2.68 | 1.42 | 480 | |||||||||||||||||||||||||
| Class I | 4/30/2006 | (1.05 | ) | 544,906 | 0.73 | 0.73 | 3.10 | 194 | |||||||||||||||||||||||
| 10/31/2005 | 3.20 | 295,966 | 0.73 | 0.73 | 3.60 | 662 | |||||||||||||||||||||||||
NOTES TO FINANCIAL HIGHLIGHTS
(a) Annualized.
(b) Not annualized.
(c) Total Return has been calculated for the applicable period without deduction of a sales load, if any, on an initial purchase. Not annualized.
(d) Per share information is calculated based on average number of shares outstanding,
(e) Ratio of Net Expenses to Average Net Assets is net of fee waivers and reimbursements by the investment adviser, if any (see note 2).
(f) Ratio of Total Expenses to Average Net Assets includes all expenses before fee waivers and reimbursements by the investment adviser.
(g) TA IDEX PIMCO Real Return TIPS (the "Fund") commenced operations on March 1, 2003. The inception date of the Fund's offering of share Class I was November 8, 2004.
The notes to the financial statements are an integral part of this report.
Transamerica IDEX Mutual Funds
Semi-Annual Report 2006
8
TA IDEX PIMCO Real Return TIPS
NOTES TO FINANCIAL STATEMENTS
At April 30, 2006
(all amounts in thousands)
(unaudited)
NOTE 1. ORGANIZATION AND SIGNIFICANT ACCOUNTING POLICIES
Transamerica IDEX Mutual Funds is an open-end management investment company registered under the Investment Company Act of 1940, as amended (the "1940 Act").
In the normal course of business, TA IDEX PIMCO Real Return TIPS (the "Fund") enters into contracts that contain a variety of representations that provide general indemnifications. The Fund's maximum exposure under these arrangements is unknown, as this would involve future claims that may be made against the Fund and/or its affiliates that have not yet occurred. However, based on experience, the Fund expects the risk of loss to be remote.
The Fund is "non-diversified" under the 1940 Act.
This report should be read in conjunction with the current Fund prospectus, which contains more complete information about the Fund.
In preparing the Fund's financial statements in accordance with accounting principles generally accepted in the United States of America ("GAAP"), estimates or assumptions (which could differ from actual results) may be used that affect reported amounts and disclosures. The following is a summary of significant accounting policies followed by the Fund.
Multiple class operations, income and expenses: The Fund currently has four classes of shares, Class A, Class B, Class C and Class I, each with different expense levels. Classes A, B, and C are closed to new investors. Class I is only available for investment to certain affiliated asset allocation funds. Class B shares will convert to Class A shares eight years after purchase. Income, non-class specific expenses and realized and unrealized gains and losses, are allocated daily to each class, based upon the value of shares outstanding method as permitted under Rule 18f-3 of the 1940 Act. Each class bears its own specific expenses as well as a portion of general, common expenses.
Security valuations: The Fund values its investments at the close of the New York Stock Exchange ("NYSE"), normally 4 p.m. ET, each day the NYSE is open for business. Fund investments are valued at the last sale price or closing price on the day of valuation taken from the primary exchange where the security is principally traded.
Securities traded in the over-the-counter market and listed securities for which no sale was reported on that date are valued at the last quoted bid price.
Debt securities are valued based on a price quotation or other equivalent indication of value supplied by an exchange, a pricing service or a major market maker; however, those that mature in sixty days or less are valued at amortized cost, which approximates market.
Foreign securities generally are valued based on quotations from the primary market in which they are traded. Because many foreign securities markets and exchanges close prior to the close of the NYSE, closing prices for foreign securities in those markets or on those exchanges do not reflect the events that occur after that close. If a significant market event impacting the value of a portfolio security (e.g., natural disaster, company announcement, market volatility) occurs subsequent to the close of trading in the security, but prior to the calculation of the Fund's net asset value per share, market quotations for that security may be determined to be unreliable and, accordingly, not "readily available." As a result, foreign equity securities held by the Fund may be valued at fair market value as determined in good faith by the Fund's Administrative Valuation Committee, under the supervision of the Board's Valuation Committee , using guidelines adopted by the Board of Trustees.
Other securities for which quotations are not readily available or whose values have been determined to be unreliable are valued at fair market value as determined in good faith by the Fund's Administrative Valuation Committee, under the supervision of the Board's Valuation Committee, using guidelines adopted by the Board of Trustees.
Cash: The Fund may leave cash overnight in its cash account with the custodian, Investors Bank & Trust Company ("IBT"). IBT has been contracted on behalf of the Fund to invest the excess cash into a savings account, which at April 30, 2006, was paying an interest rate of 3.24%.
Security transactions and investment income: Security transactions are recorded on the trade date. Security gains and losses are calculated on the specific identification basis. Dividend income, if any, is recorded on the ex-dividend date or, in the case of foreign securities, as soon as the Fund is informed of the ex-dividend date. Interest income, including accretion of discounts and amortization of premiums, is recorded on the accrual basis commencing on the settlement date.
Foreign currency denominated investments: The accounting records of the Fund are maintained in U.S. dollars. Securities and other assets and liabilities denominated in foreign currencies are translated into U.S. dollars at the closing exchange rate each day. The cost of foreign securities is translated at the exchange rate in effect when the investment was acquired. The Fund combines fluctuations from currency exchange rates and fluctuations in value when computing net realized and unrealized gains or losses from investments.
Net foreign currency gains and losses resulting from changes in exchange rates include: 1) foreign currency fluctuations between trade date and settlement date of investment security transactions; 2) gains and losses on forward foreign currency contracts; and 3) the difference between the receivable amounts of interest and dividends recorded in the accounting records in U.S. dollars and the amounts actually received.
Foreign currency denominated assets may involve risks not typically associated with domestic transactions. These risks include revaluation of currencies, adverse fluctuations in foreign currency values and possible adverse political, social and economic developments, including those particular to a specific industry, country or region.
Transamerica IDEX Mutual Funds
Semi-Annual Report 2006
9
TA IDEX PIMCO Real Return TIPS
NOTES TO FINANCIAL STATEMENTS (continued)
At April 30, 2006
(all amounts in thousands)
(unaudited)
NOTE 1.–(continued)
Forward foreign currency contracts: The Fund may enter into forward foreign currency contracts to hedge against exchange rate risk arising from investments in securities denominated in foreign currencies. Contracts are valued at the contractual forward rate and are marked to market daily, with the change in value recorded as an unrealized gain or loss. When the contracts are settled a realized gain or loss is incurred. Risks may arise from changes in market value of the underlying currencies and from the possible inability of counterparties to meet the terms of their contracts.
Open forward foreign currency contracts at April 30, 2006, are listed in the Schedule of Investments.
Swap agreements: The Fund may enter into swap agreements to manage its exposure to interest rates and credit risk. Interest rate swap agreements involve commitments to pay/receive interest in exchange for a market-linked return, both based on notional amounts. In a credit default swap, one party makes a stream of payments to another party in exchange for the right to receive a specified return in the event of a default by a third party, typically corporate issues or sovereign issues of an emerging country, on its obligation. The portfolio may use credit default swaps to provide a measure of protection against defaults of sovereign issuers (i.e., to reduce risk where the portfolio owns or has exposure to the sovereign issuer) or to take an active long or short position with respect to the likelihood of a particular issuer's default.
Entering into these agreements involves elements of credit, market and documentation risk in excess of the amounts recognized on the Statement of Assets and Liabilities. Such risks involve the possibility that there will be no liquid market for these agreements, that the counterparty to the agreements may default on its obligation to perform or disagree as to the meaning of contractual terms in the agreements, and that there may be unfavorable changes in interest rates.
Swaps are marked to market daily based upon quotations from market makers and vendors and the change in value, if any, is recorded as unrealized gain or loss in the Statement of Operations. Payments received or made at the beginning of the measurement period are reflected as such on the Statement of Assets and Liabilities. A liquidation payment received or made at the termination of the swap is recorded as realized gain or loss in the Statement of Operations. Net periodic payments are included as part of realized gain or loss on the Statement of Operations.
Open swap agreements at April 30, 2006, are listed in the Schedule of Investments.
Futures contracts: The Fund may enter into futures contracts to manage exposure to market, interest rate or currency fluctuations. Futures contracts are valued at the settlement price established each day by the board of trade or exchange on which they are traded. The primary risks associated with futures contracts are imperfect correlation between the change in market value of the securities held and the prices of futures contracts; the possibility of an illiquid market and inability of the counterparty to meet the contract terms.
The underlying face amount of open futures contracts at April 30, 2006, are listed in the Schedule of Investments. The variation margin receivable or payable, as applicable, is included in the accompanying Statement of Assets and Liabilities. Variation margin represents the additional payment due or excess deposits made in order to maintain the equity account at the required margin level.
Option contracts: The Fund may enter into options contracts to manage exposure to market fluctuations. Options are valued at the average of the bid and ask ("Mean Quote") established each day at the close of the board of trade or exchange on which they are traded. The primary risks associated with options are imperfect correlation between the change in value of the securities held and the prices of the options contracts; the possibility of an illiquid market and inability of the counterparty to meet the contracts terms. When the Fund writes a covered call or put option, an amount equal to the premium received by the Fund is included in the Fund's Statement of Assets and Liabilities as an asset and as an equivalent liability. Options are marked-to-market daily to reflect the current value of the option written.
Transactions in written options were as follows:
| Premium | Contracts* | ||||||||||
| Beginning Balance October 31, 2005 | $ | 91 | 403 | ||||||||
| Sales | 245 | 901 | |||||||||
| Closing Buys | (117 | ) | (552 | ) | |||||||
| Expirations | (166 | ) | (679 | ) | |||||||
| Exercised | – | – | |||||||||
| Balance at April 30, 2006 | $ | 53 | 73 | ||||||||
* Contracts not in thousands
Swaptions contracts: The Fund is authorized to write swaption contracts to manage exposure to fluctuations in interest rates and to enhance fund yield. Swaption contracts written by the Fund represent an option that gives the purchaser the right, but not the obligation, to enter into a previously agreed upon swap contract on a future date. If a written call option is exercised, the writer will enter a swap and is obligated to pay the fixed rate and receive a variable rate in exchange. Swaptions are marked-to-market daily based upon quotations from market makers.
When the Fund writes a swaption, the premium received is recorded as a liability and is subsequently adjusted to the current value of the swaption. Changes in the value of the swaption are reported as Unrealized gains or losses in written options in the Statement of Assets and Liabilities. Gain or loss is recognized when the swaption contract expires or is closed. Premiums received from writing swaptions that expire or are exercised are treated by the Fund as realized gains from
Transamerica IDEX Mutual Funds
Semi-Annual Report 2006
10
TA IDEX PIMCO Real Return TIPS
NOTES TO FINANCIAL STATEMENTS (continued)
At April 30, 2006
(all amounts in thousands)
(unaudited)
NOTE 1.–(continued)
written options. The difference between the premium and the amount paid on affecting a closing purchase transaction is treated as a realized gain or loss.
Redemption fees: A short-term trading redemption fee may be assessed on any Fund shares in a fund account that are sold during the first five (5) NYSE trading days following their purchase date. This redemption fee will equal 2% of the amount redeemed and shares held the longest will be treated as being redeemed first and shares held the shortest as being redeemed last. For the six months ended April 30, 2006, the Fund received less than $1 in redemption fees.
Dividend distributions: Distributions to shareholders are recorded on the ex-dividend date and are determined in accordance with Federal income tax regulations which may differ from GAAP.
NOTE 2. RELATED PARTY TRANSACTIONS
Transamerica Fund Advisors, Inc. ("TFAI") is the Fund's investment adviser. Transamerica Fund Services, Inc. ("TFS") is the Fund's administrator and transfer agent. AFSG Securities Corp. ("AFSG") is the Fund's distributor/principal underwriter. TFAI, TFS, and AFSG are affiliates of AEGON, NV, a Netherlands corporation.
Certain officers and trustees of the Fund are also officers and/or directors of TFAI, TFS and AFSG.
The following schedule reflects the percentage of Fund assets owned by affiliated investment companies at April 30, 2006:
| Net Assets | % of Net Assets | ||||||||||
| TA IDEX Asset Allocation– Conservative Portfolio | $ | 41,539 | 7.40 | % | |||||||
| TA IDEX Asset Allocation– Moderate Portfolio | 86,127 | 15.34 | % | ||||||||
| TA IDEX Asset Allocation– Moderate Growth Portfolio | 124,470 | 22.18 | % | ||||||||
| Asset Allocation– Conservative Portfolio | 61,010 | 10.87 | % | ||||||||
| Asset Allocation– Moderate Growth Portfolio | 101,400 | 18.07 | % | ||||||||
| Asset Allocation– Moderate Portfolio | 130,437 | 23.24 | % | ||||||||
| Total | $ | 544,983 | 97.10 | % | |||||||
Investment advisory fees: The Fund pays management fees to TFAI based on average daily net assets ("ANA") at the following breakpoints:
0.70% of the first $250 million of ANA
0.65% of the next $500 million of ANA
0.60% of ANA over $750 million
TFAI has contractually agreed to waive its advisory fee and will reimburse the Fund to the extent that operating expenses, excluding 12b-1 fees, exceed the following stated annual limit:
From November 1, 2005 to November 6, 2005:
1.30% Expense Limit-Classes A, B and C
1.00% Expense Limit-Class I
From November 7, 2005 on:
1.30% Expense Limit
If total Fund expenses fall below the annual expense limitation agreement agreed to by the adviser within the succeeding three years, the Fund may be required to pay the adviser a portion or all of the reimbursed class expenses.
There are no amounts available for recapture at April 30, 2006.
Distribution and service fees: The Fund has a 12b-1 distribution plan under the 1940 Act pursuant to which an annual fee, based on average daily net assets, is paid to the distributor for various disbursements such as broker-dealer account servicing fees and other promotional expenses of the Fund. The Fund is authorized under the 12b-1 plan to pay fees on each class up to the following limits:
| Class A | 0.35 | % | |||||
| Class B | 1.00 | % | |||||
| Class C | 1.00 | % | |||||
| Class I | N/A | ||||||
From February 28, 2006 through March 1, 2007, the Fund will not pay 12b-1 fees under these plans.
Underwriter commissions relate to front-end sales charges imposed for Class A shares and contingent deferred sales charges from Classes B, C, and certain A share redemptions. For the six months ended April 30, 2006, the underwriter commissions were as follows:
| Received by Underwriter | $ | 2 | |||||
| Retained by Underwriter | – | ||||||
| Contingent Deferred Sales Charge | – | ||||||
Administrative services: The Fund has entered into an agreement with TFS for financial and legal fund administration services. The Fund pays TFS an annual fee of 0.02% of ANA. The Legal fees on the Statement of Operations are fees paid to external legal counsel.
Transamerica IDEX Mutual Funds
Semi-Annual Report 2006
11
TA IDEX PIMCO Real Return TIPS
NOTES TO FINANCIAL STATEMENTS (continued)
At April 30, 2006
(all amounts in thousands)
(unaudited)
NOTE 2.–(continued)
Transfer agent fees: The Fund pays TFS an annual per-account charge for each open and closed account. The Fund paid TFS $15 for the six months ended April 30, 2006.
Deferred compensation plan: Each eligible independent Fund Trustee may elect to participate in a non-qualified deferred compensation plan maintained by Transamerica IDEX Mutual Funds (the "Plan"). Under the Plan, such Trustees may defer payment of all or a portion of their total fees earned as a Fund Trustee. Each Trustee who is a participant in the Plan may elect that the earnings, losses or gains credited to his or her deferred fee amounts be determined based on a deemed investment in any series of Transamerica IDEX Mutual Funds, including the Fund. The right of a participant to receive a distribution from the Plan of the deferred fees is an unsecured claim against the general assets of all series of Transamerica IDEX Mutual Funds. The pro rata liability to the Fund of all deferred fees in the Plan amounted, as of April 30, 2006, to $11.
NOTE 3. INVESTMENT TRANSACTIONS
The cost of securities purchased and proceeds from securities sold (excluding short-term securities) for the six months ended April 30, 2006 were as follows:
| Purchases of securities: | |||||||
| Long-Term | $ | 30,347 | |||||
| U.S. Government | 1,362,199 | ||||||
| Proceeds from maturities and sales of securities: | |||||||
| Long-Term | 50,402 | ||||||
| U.S. Government | 1,320,493 | ||||||
NOTE 4. FEDERAL INCOME TAX MATTERS
The Fund has not made any provision for federal income or excise taxes due to its policy to distribute all of its taxable income and capital gains to its shareholders and otherwise qualify as a regulated investment company under Subchapter M of the Internal Revenue Code. Income and capital gain distributions are determined in accordance with income tax regulations, which may differ from GAAP. These differences are primarily due to differing treatment for items including, but not limited to, wash sales, swap reclass, futures, options and foreign currency transactions.
NOTE 5. REGULATORY PROCEEDINGS
There continues to be significant federal and state regulatory activity relating to financial services companies, particularly mutual fund companies and their investment advisers. As part of an ongoing investigation regarding potential market timing, recordkeeping and trading compliance issues and matters affecting the Fund's investment adviser, TFAI, and certain affiliates and former employees of TFAI, the SEC staff has indicated that it is likely to take some action against TFAI and certain of its affiliates at the conclusion of the investigation. The potential timing and the scope of any such action is difficult to predict. Although the impact of any action brought against TFAI and/or its affiliates is difficult to assess at the present time, the Fund currently believes that the likelihood that any such action will have a material adverse impact on it is remote. It is important to note that the Fund is not aware of any allega tion of wrongdoing against it and its Board at the time this semi-annual report is printed. Although it is not anticipated that these developments will have an adverse impact on the Fund, there can be no assurance at this time. TFAI and its affiliates are actively working with the SEC in regard to this matter; however, the exact resolution cannot be determined at this time. TFAI will take such actions that it deems necessary or appropriate to continue providing management services to the Fund and to bring all matters to an appropriate conclusion.
TFAI and/or its affiliates, and not the Fund, will bear the costs regarding these regulatory matters.
Transamerica IDEX Mutual Funds
Semi-Annual Report 2006
12
TA IDEX PIMCO Real Return TIPS
INVESTMENT ADVISORY AND SUB-ADVISORY AGREEMENTS – REVIEW AND RENEWAL (unaudited)
At a meeting of the Board of Trustees of Transamerica IDEX Mutual Funds ("TA IDEX") held on November 2, 2005, the Board reviewed and considered the Investment Advisory Agreement between TA IDEX PIMCO Real Return TIPS (the "Fund") and Transamerica Fund Advisors, Inc. ("TFAI"), as well as the Investment Sub-Advisory Agreement of the Fund between TFAI and Pacific Investment Management Company LLC (the "Sub-Adviser"), to determine whether the agreements should be renewed for a one-year period. Following their review and consideration, the Trustees determined that the Investment Advisory Agreement and the Investment Sub-Advisory Agreement will enable shareholders of the Fund to obtain high quality services at a cost that is appropriate, reasonable, and in the best interests of its shareholders. The Board, including the independent members of the Board, unanimously approved the renewal of the Investment Advisory Agreement and the Inve stment Sub-Advisory Agreement. In reaching their decision, the Trustees requested and obtained from TFAI and the Sub-Adviser such information as they deemed reasonably necessary to evaluate the proposed agreements. The Trustees also carefully considered the information that they had received throughout the year from TFAI and the Sub-Adviser (such as in-person presentations by the Sub-Adviser) as part of their regular oversight of the Fund, as well as: comparative fee, transfer agency, expense and performance information prepared by Lipper Inc. ("Lipper"), independent providers of mutual fund performance, fee and expense information, and profitability data. In considering the proposed continuation of the Investment Advisory Agreement and the Investment Sub-Advisory Agreement, the Trustees evaluated a number of considerations that they believe, in light of the legal advice furnished to them by TA IDEX counsel and independent legal counsel and their own business judgment, to be relevant. They based their decisi ons on the following considerations, among others, although they did not identify any consideration or particular information that was controlling of their decisions:
The nature, extent and quality of the advisory service to be provided. The Board considered the nature and quality of the services provided by TFAI and the Sub-Adviser to the Fund in the past, as well as the services anticipated to be provided in the future. The Board concluded that TFAI and the Sub-Adviser are capable of providing high quality services to the Fund, as indicated by the nature and quality of services provided in the past, TFAI's and the Sub-Adviser's management capabilities demonstrated with respect to the funds they manage, including the Fund, and the experience, capability and integrity of TFAI's senior management, the financial resources of TFAI and the Sub-Adviser, TFAI's management oversight process, the professional qualifications and experience of the Sub-Adviser's portfolio management team, and the Fund's investment performance . The Trustees also concluded that TFAI and the Sub-Adviser proposed to provide investment and related services that were of the same quality and quantity as services provided to the Fund in the past, and that these services are appropriate in scope and extent in light of the Fund's operations, the competitive landscape of the investment company business and investor needs, and that TFAI's and the Sub-Adviser's obligations will remain substantially the same.
The investment performance of the Fund. The Board examined both the short-term and longer-term performance of the Fund, including relative performance against a benchmark securities index and a peer group of comparable mutual funds as prepared by Lipper, for various trailing periods ended June 30, 2005. The Trustees concluded that TFAI and the Sub-Adviser generally had achieved competitive investment performance, noting that the performance of the Fund has been at or above median relative to its peers over the past one- and two-year periods and superior to the benchmark index over the past one- and two-year periods. On the basis of the Trustees' assessment of the nature, extent and quality of advisory services to be provided or procured by TFAI and the Sub-Adviser, the Trustees concluded that TFAI and the Sub-Adviser are capable of generating a level of investment performance that is appropriate in light of the Fund's investment objective, policies and strategies and competitive with many other investment companies, and also determined that TFAI's and the Sub-Adviser's performance records indicate that their continued management is likely to benefit the Fund and its shareholders.
The cost of advisory services provided and the level of profitability. The Board reviewed profitability information regarding TFAI's costs of procuring portfolio management services, as well as the costs of provision of administration, transfer agency, fund accounting and other services, to the Fund and to TA IDEX as a whole by TFAI and its affiliates. The Trustees reviewed data from Lipper that compared the Fund's management fees (including management fees at various asset levels), other fees and expenses (including total expenses including and excluding 12b-1 distribution and service fees) and portfolio turnover rate against a peer group of comparable mutual funds. Based on such information, the Trustees determined that the management fees and overall expense ratio of the Fund generally are consistent with industry averages. In addition, on the basi s of the Board's review of the management fees to be charged by TFAI for investment advisory and related services, TFAI profitability information (derived from TFAI's audited financial statements), TFAI's estimated management income resulting from its management of the Fund, the estimated margin of the Sub-Adviser, as well as the entirety of TFAI's and its affiliates' service relationship with TA IDEX, the Board concluded that the level of investment management fees and other service fees, as well as TFAI's and the Sub-Adviser's profitability, are appropriate in light of the services provided,
Transamerica IDEX Mutual Funds
Semi-Annual Report 2006
13
TA IDEX PIMCO Real Return TIPS (continued)
the management fees and overall expense ratios of comparable investment companies and the anticipated profitability of the relationship between the Fund, TFAI and its affiliates, and the Sub-Adviser.
Whether fee levels reflect economies of scale and the extent to which economies of scale would be realized as the Fund grows. The Board concluded that the inclusion of asset-based breakpoints in the Fund's advisory fee schedule appropriately benefits investors by realizing economies of scale in the form of lower management fees as the level of assets grows, notwithstanding the absence of asset-based breakpoints in the Fund's sub-advisory fees. The Board noted that the Fund is closed to new investors and will be closed to new investments in the near future, except that the Fund may continue selling shares to other TA IDEX funds and other investment companies in the same group of investment companies as TA IDEX, which may limit, to an extent, the ability of the Fund to realize economies of scale. In addition, the Board assessed the current asset levels of the Fund and the long-term development strategy for the Fund, including continued investments by the TA IDEX asset allocation funds, and concluded that the Fund's current management fees appropriately reflect the Fund's current size, the current economic environment for TFAI, the competitive nature of the investment company market, and TFAI's pricing strategy. The Trustees also concluded that they will have the opportunity to periodically reexamine whether the Fund has achieved economies of scale, and the appropriateness of management fees payable to TFAI and fees payable by TFAI to the Sub-Adviser, in the future.
Benefits (such as soft dollars) to TFAI, its affiliates, or the Sub-Adviser from their relationship with the Fund. The Board concluded that other benefits derived by TFAI, its affiliates, and the Sub-Adviser from their relationship with the Fund are reasonable and fair, and are consistent with industry practice and the best interests of the Fund and its shareholders. In this regard, the Board noted that neither TFAI nor the Sub-Adviser realizes "soft dollar" benefits from its relationship with the Fund. In addition, the Trustees determined that the administration, transfer agency, fund accounting and other fees paid by the Fund to affiliates of TFAI are reasonable, fair and in the best interests of shareholders in light of the nature and quality of the services provided, the associated costs to these affiliates of providing the services, the impact of the costs of such services on the Fund's overall operating expenses, and the necessity of the services for the Fund's operations.
Other considerations. The Board determined that TFAI had made a substantial commitment to the recruitment and retention of high quality personnel, and maintained the financial, compliance and operational resources reasonably necessary to manage the Fund in a professional manner that is consistent with the best interests of the Fund and its shareholders. In this regard, the Trustees favorably considered the procedures and policies in place by TFAI to enforce compliance with applicable laws and regulations and oversee the portfolio management activities of the Sub-Adviser. The Trustees also determined that TFAI had made a significant entrepreneurial commitment to the management and success of the Fund, reflected by TFAI's expense limitation and fee waiver arrangement with the Fund, which may result in TFAI waiving advisory fees for the benefit of shareh olders.
Transamerica IDEX Mutual Funds
Semi-Annual Report 2006
14
TA IDEX PIMCO Total Return
UNDERSTANDING YOUR FUND'S EXPENSES
(unaudited)
SHAREHOLDER EXPENSES
Fund shareholders may incur two types of costs: (1) transaction costs, including sales charges (loads) on purchases, contingent deferred sales charges on redemptions and redemption fees; and (2) ongoing costs, including management fees, 12b-1 distribution and service fees, and other fund expenses.
The following Example is intended to help you understand your ongoing costs (in dollars and cents) of investing in the Fund and to compare these costs with the ongoing costs of investing in other funds.
The Example is based on an investment of $1,000 invested at November 1, 2005 and held for the entire period until April 30, 2006.
ACTUAL EXPENSES
The first line in the table below provides information about actual account values and actual expenses. You may use the information in this line, together with the amount you invested, to estimate the expenses that you paid over the period. Simply divide your account value by $1,000 (for example, an $8,600 account value divided by $1,000 = 8.6), then multiply the result by the number in the first line of your Fund under the heading entitled "Expenses Paid During Period" to estimate the expenses you paid on your account during this period. If your account is an IRA, your expenses could have included a $15 annual fee. The amount of any fee paid through your account would increase the estimate of expenses you paid during the period and decrease your ending account value.
HYPOTHETICAL EXAMPLE FOR COMPARISON PURPOSES
The second line in the table below provides information about hypothetical account values and hypothetical expenses based on the Fund's actual expense ratio and an assumed rate of return of 5% per year before expenses, which is not the Fund's actual return. The hypothetical account values and expenses may not be used to estimate the actual ending account balance or expenses you paid for the period. You may use this information to compare the ongoing costs of investing in your Fund and other funds. To do so, compare this 5% hypothetical example with the 5% hypothetical examples that appear in the shareholder reports of the other funds. As in the case of the actual expense example, if your account is subject to an IRA fee, the amount of the fee paid through your account would increase the hypothetical expenses you would have paid during the period and decrease the hypothetical ending account value.
Please note that the expenses shown in the table are meant to highlight your ongoing costs only and do not reflect any transactional costs, such as sales charges, redemption fees, brokerage commissions paid on purchases and sales of fund shares. Therefore, the second line under the Fund in the table is useful in comparing ongoing costs only, and will not help you determine the relative total costs of owning different funds. If any of these transaction costs were included, your costs would be higher. The expenses shown in the table do not reflect any fees that may be charged to you by brokers, financial intermediaries or other financial institutions.
| Beginning Account Value | Ending Account Value | Annualized Expense Ratio | Expenses Paid During Period (a) | ||||||||||||||||
| Class A | |||||||||||||||||||
| Actual | $ | 1,000.00 | $ | 1,006.00 | 1.26 | % | $ | 6.27 | |||||||||||
| Hypothetical (b) | 1,000.00 | 1,018.55 | 1.26 | 6.31 | |||||||||||||||
| Class B | |||||||||||||||||||
| Actual | 1,000.00 | 1,003.90 | 1.73 | 8.60 | |||||||||||||||
| Hypothetical (b) | 1,000.00 | 1,016.22 | 1.73 | 8.65 | |||||||||||||||
| Class C | |||||||||||||||||||
| Actual | 1,000.00 | 1,004.10 | 1.69 | 8.40 | |||||||||||||||
| Hypothetical (b) | 1,000.00 | 1,016.41 | 1.69 | 8.45 | |||||||||||||||
| Class I | |||||||||||||||||||
| Actual | 1,000.00 | 1,011.30 | 0.79 | 3.61 | |||||||||||||||
| Hypothetical (b) | 1,000.00 | 1,019.15 | 0.79 | 3.63 | |||||||||||||||
(a) Expenses are calculated using the Fund's annualized expense ratio (as disclosed in the table), multiplied by the average account value for the period, multiplied by number of days in the period (181 days for Classes A, B and C, and 166 days for Class I), and divided by the number of days in the year (365 days).
(b) 5% return per year before expenses.
GRAPHICAL PRESENTATION OF SCHEDULE OF INVESTMENTS
By Asset Type
At April 30, 2006
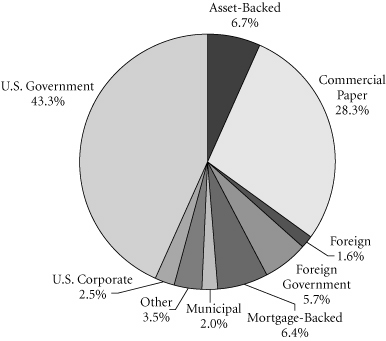
This chart shows the percentage breakdown by asset type of the Fund's total investment securities.
Transamerica IDEX Mutual Funds
Semi-Annual Report 2006
1
TA IDEX PIMCO Total Return
SCHEDULE OF INVESTMENTS
At April 30, 2006
(all amounts except share amounts in thousands)
(unaudited)
| Principal | Value | ||||||||||
| U.S. GOVERNMENT OBLIGATIONS (4.6%) | |||||||||||
| U.S. Treasury Bond | |||||||||||
| 8.75%, due 05/15/2017 † | $ | 1,313 | $ | 1,705 | |||||||
| 7.88%, due 02/15/2021 † | 200 | 253 | |||||||||
| 8.13%, due 05/15/2021 | 600 | 775 | |||||||||
| U.S. Treasury Inflation Indexed Bond | |||||||||||
| 1.88%, due 07/15/2013 | 162 | 158 | |||||||||
| 2.00%, due 07/15/2014 | 527 | 513 | |||||||||
| 1.88%, due 07/15/2015 | 2,451 | 2,353 | |||||||||
| 2.00%, due 01/15/2016 | 2,502 | 2,419 | |||||||||
| 2.38%, due 01/15/2025 | 379 | 375 | |||||||||
| U.S. Treasury Note | |||||||||||
| 3.50%, due 02/15/2010 | 2,000 | 1,904 | |||||||||
| Total U.S. Government Obligations (cost: $10,832) | 10,455 | ||||||||||
| U.S. GOVERNMENT AGENCY OBLIGATIONS (44.9%) | |||||||||||
| Fannie Mae | |||||||||||
| 3.00%, due 08/25/2009 | 33 | 33 | |||||||||
| 5.50%, due 07/01/2016 | 255 | 254 | |||||||||
| 5.50%, due 12/01/2016 | 84 | 83 | |||||||||
| 5.50%, due 01/01/2017 | 106 | 106 | |||||||||
| 5.50%, due 02/01/2017 | 112 | 111 | |||||||||
| 5.50%, due 05/01/2017 | 123 | 122 | |||||||||
| 5.00%, due 11/01/2017 | 723 | 706 | |||||||||
| 5.00%, due 02/01/2018 | 222 | 217 | |||||||||
| 5.00%, due 03/01/2018 | 716 | 698 | |||||||||
| 5.00%, due 05/01/2018 | 43 | 42 | |||||||||
| 5.00%, due 06/01/2018 | 996 | 972 | |||||||||
| 5.00%, due 08/01/2018 | 194 | 189 | |||||||||
| 5.00%, due 05/01/2019 | 294 | 287 | |||||||||
| 5.00%, due 09/01/2019 | 243 | 237 | |||||||||
| 5.00%, due 10/01/2019 | 482 | 470 | |||||||||
| 5.00%, due 11/01/2019 | 869 | 848 | |||||||||
| 5.00%, due 12/01/2019 | 302 | 294 | |||||||||
| 5.88%, due 01/01/2028 * | 120 | 122 | |||||||||
| 5.50%, due 11/01/2032 | 2,467 | 2,403 | |||||||||
| 5.50%, due 01/01/2033 | 731 | 712 | |||||||||
| 5.50%, due 04/01/2033 | 5,325 | 5,186 | |||||||||
| 5.50%, due 07/01/2033 | 217 | 211 | |||||||||
| 5.50%, due 08/01/2033 | 245 | 238 | |||||||||
| 5.50%, due 11/01/2033 | 49 | 48 | |||||||||
| 5.50%, due 01/01/2034 | 525 | 511 | |||||||||
| 5.50%, due 04/01/2034 | 4,892 | 4,769 | |||||||||
| 5.50%, due 05/01/2034 | 2,738 | 2,667 | |||||||||
| 5.50%, due 06/01/2034 | 38 | 37 | |||||||||
| 5.50%, due 09/01/2034 | 354 | 344 | |||||||||
| 5.50%, due 11/01/2034 | 2,578 | 2,508 | |||||||||
| 5.50%, due 01/01/2035 | 3,956 | 3,846 | |||||||||
| Principal | Value | ||||||||||
| 5.50%, due 02/01/2035 | $ | 13,243 | $ | 12,884 | |||||||
| 5.50%, due 03/01/2035 | 1,125 | 1,093 | |||||||||
| 5.50%, due 04/01/2035 | 1,722 | 1,673 | |||||||||
| 5.50%, due 05/01/2035 | 1,791 | 1,739 | |||||||||
| 5.50%, due 06/01/2035 | 1,533 | 1,490 | |||||||||
| 5.50%, due 07/01/2035 | 756 | 734 | |||||||||
| 5.50%, due 08/01/2035 | 156 | 151 | |||||||||
| 5.50%, due 09/01/2035 | 630 | 612 | |||||||||
| 5.00%, due 10/01/2035 | 3,145 | 3,032 | |||||||||
| 5.50%, due 11/01/2035 | 302 | 293 | |||||||||
| 5.31%, due 09/25/2042 * | 1,055 | 1,060 | |||||||||
| 4.95%, due 10/01/2044 * | 2,668 | 2,683 | |||||||||
| Fannie Mae TBA | |||||||||||
| 5.00%, due 06/01/2021 | 22,000 | 21,402 | |||||||||
| 5.50%, due 05/01/2036 | 18,300 | 17,768 | |||||||||
| Freddie Mac | |||||||||||
| 5.00%, due 06/15/2013 | 29 | 29 | |||||||||
| 6.50%, due 03/15/2029 | 3 | 3 | |||||||||
| 6.50%, due 04/15/2029 | 17 | 18 | |||||||||
| 6.50%, due 07/25/2043 | 49 | 50 | |||||||||
| 4.95%, due 10/25/2044 * | 1,725 | 1,737 | |||||||||
| Ginnie Mae | |||||||||||
| 6.50%, due 07/15/2023 | 5 | 5 | |||||||||
| 6.50%, due 02/15/2028 | 188 | 194 | |||||||||
| 6.50%, due 06/15/2029 | 247 | 255 | |||||||||
| 6.50%, due 01/15/2030 | 9 | 9 | |||||||||
| 5.50%, due 03/15/2032 | 72 | 70 | |||||||||
| 6.50%, due 06/20/2032 | 51 | 53 | |||||||||
| 5.50%, due 12/15/2032 | 174 | 171 | |||||||||
| 5.50%, due 12/15/2033 | 286 | 281 | |||||||||
| 5.50%, due 02/15/2034 | 1,351 | 1,328 | |||||||||
| Ginnie Mae - May TBA | |||||||||||
| 5.50%, due 05/01/2036 | 1,500 | 1,472 | |||||||||
| Total U.S. Government Agency Obligations (cost: $103,428) | 101,560 | ||||||||||
| FOREIGN GOVERNMENT OBLIGATIONS (6.7%) | |||||||||||
| French Republic | |||||||||||
| Zero Coupon, due 05/24/2006 | EUR | 2,390 | 3,005 | ||||||||
| Zero Coupon, due 07/20/2006 | EUR | 2,330 | 2,918 | ||||||||
| Hong Kong Government–144A 5.13%, due 08/01/2014 | 400 | 386 | |||||||||
| Italian Republic | |||||||||||
| 0.38%, due 10/10/2006 | JPY | 80,000 | 702 | ||||||||
| Kingdom of Belgium | |||||||||||
| Zero Coupon, due 07/13/2006 | EUR | 1,970 | 2,468 | ||||||||
| Kingdom of Spain 3.10%, due 09/20/2006 | JPY | 134,000 | 1,187 | ||||||||
The notes to the financial statements are an integral part of this report.
Transamerica IDEX Mutual Funds
Semi-Annual Report 2006
2
TA IDEX PIMCO Total Return
SCHEDULE OF INVESTMENTS (continued)
At April 30, 2006
(all amounts except share amounts in thousands)
(unaudited)
| Principal | Value | ||||||||||
| Korea Highway Corp.–144A 5.13%, due 05/20/2015 | $ | 200 | $ | 188 | |||||||
| Malaysia Government 7.50%, due 07/15/2011 | 10 | 11 | |||||||||
| Republic of Brazil | |||||||||||
| 8.00%, due 01/15/2018 11.00%, due 01/11/2012 | 200 263 | 245 285 | |||||||||
| 11.00%, due 08/17/2040 | 150 | 193 | |||||||||
| Republic of Finland 2.75%, due 07/04/2006 | EUR | 2,500 | 3,150 | ||||||||
| Republic of Germany | |||||||||||
| Zero Coupon, due 09/13/2006 | EUR | 100 | 125 | ||||||||
| Republic of South Africa 5.25%, due 05/16/2013 | EUR | 90 | 117 | ||||||||
| United Mexican States 5.75%, due 01/13/2009 * | 65 | 66 | |||||||||
| Total Foreign Government Obligations (cost: $14,512) | 15,046 | ||||||||||
| MORTGAGE-BACKED SECURITIES (7.1%) | |||||||||||
| Bank of America Mortgage Securities, Series 2002-K, Class 2A1 5.45%, due 10/20/2032 * | 53 | 53 | |||||||||
| Bear Stearns Adjustable Rate Mortgage Trust, Series 2003-8, Class 1A1 4.22%, due 01/25/2034 * | 204 | 203 | |||||||||
| Bear Stearns Adjustable Rate Mortgage Trust, Series 2003-8, Class 2A1 4.81%, due 01/25/2034 * | 67 | 66 | |||||||||
| Bear Stearns Adjustable Rate Mortgage Trust, Series 2003-8, Class 4A1 4.68%, due 01/25/2034 * | 115 | 113 | |||||||||
| Bear Stearns Adjustable Rate Mortgage Trust, Series 2005-9, Class A1 4.63%, due 10/25/2035 * | 1,044 | 1,015 | |||||||||
| Citigroup Mortgage Loan Trust, Inc., Series 2006-AR1, Class IA1 4.90%, due 10/25/2035 *m | 2,150 | 2,114 | |||||||||
| Citigroup Mortgage Loan Trust, Inc., Series 2006-WMC1, Class A2A 5.04%, due 12/25/2035 * | 912 | 912 | |||||||||
| Countrywide Alternative Loan Trust, Series 2003-J11, Class 4A1 6.00%, due 10/25/2032 | 18 | 18 | |||||||||
| Countrywide Alternative Loan Trust, Series 2005-11CB, Class 2A8 4.50%, due 06/25/2035 | 904 | 887 | |||||||||
| Countrywide Alternative Loan Trust, Series 2005-81, Class A1 5.24%, due 02/25/2037 * | 1,088 | 1,092 | |||||||||
| Principal | Value | ||||||||||
| Countrywide Home Loan Mortgage Pass Through Trust, Series 2002-30, Class M 3.86%, due 10/19/2032 * | $ | 101 | $ | 100 | |||||||
| Countrywide Home Loan Mortgage Pass Through Trust, Series 2004-7, Class 1A2 5.23%, due 05/25/2034 * | 18 | 18 | |||||||||
| Credit Suisse First Boston Mortgage Securities Corp., Series 2002, Class P-3 –144A 5.51%, due 08/25/2033 *m | 108 | 109 | |||||||||
| Credit Suisse First Boston Mortgage Securities Corp., Series 2002-P1, Class A1 4.93%, due 03/25/2032 m | 5 | 5 | |||||||||
| Credit Suisse First Boston Mortgage Securities Corp., Series 2002-P2A, Class A2 5.29%, due 03/25/2032 m | 43 | 43 | |||||||||
| First Horizon Asset Securities, Inc., Series 2000-H, Class IA 7.00%, due 09/25/2030 | –o | –o | |||||||||
| GSR Mortgage Loan Trust, Series 2005-AR6, Class 2A1 4.54%, due 09/25/2035 * | 315 | 308 | |||||||||
| Harborview Mortgage Loan Trust, Series 2006-1, Class 2A1A 5.15%, due 03/19/2037 * | 1,094 | 1,094 | |||||||||
| Mellon Residential Funding Corp., Series 2000-TBC3, Class A1 5.34%, due 12/15/2030 * | 1,049 | 1,049 | |||||||||
| Residential Accredit Loans, Inc., Series 2006-QO3, Class A1 5.17%, due 04/25/2046 *m | 1,098 | 1,098 | |||||||||
| Residential Funding Mortgage Securities I, Series 2003-S9, Class A1 6.50%, due 03/25/2032 | 17 | 17 | |||||||||
| Sequoia Mortgage Trust, Series 10, Class 2A1 5.30%, due 10/20/2027 * | 165 | 166 | |||||||||
| Small Business Administration Participation, Series 2003-201 5.13%, due 09/01/2023 | 85 | 82 | |||||||||
| Small Business Administration, Series 2004-20C 4.34%, due 03/01/2024 | 526 | 484 | |||||||||
| Structured Adjustable Rate Mortgage Loan Trust, Series 2004-19, Class 2A1 5.41%, due 01/25/2035 *m | 869 | 876 | |||||||||
| Structured Asset Mortgage Investments, Inc., Series 2002-AR3, Class A-1 5.24%, due 09/19/2032 * | 88 | 88 | |||||||||
The notes to the financial statements are an integral part of this report.
Transamerica IDEX Mutual Funds
Semi-Annual Report 2006
3
TA IDEX PIMCO Total Return
SCHEDULE OF INVESTMENTS (continued)
At April 30, 2006
(all amounts except share amounts in thousands)
(unaudited)
| Principal | Value | ||||||||||
| Structured Asset Mortgage Investments, Inc., Series 2005-AR8, Class A1 5.24%, due 02/25/2036 * | $ | 1,090 | $ | 1,089 | |||||||
| Structured Asset Mortgage Investments, Inc., Series 2006-AR3, Class 2A1 5.22%, due 09/25/2035 *m | 1,100 | 1,100 | |||||||||
| Washington Mutual, Series 2002-AR10, Class A6 4.82%, due 10/25/2032 * | 15 | 15 | |||||||||
| Washington Mutual, Series 2002-AR2, Class A 4.60%, due 02/27/2034 * | 44 | 43 | |||||||||
| Washington Mutual, Series 2003-R1, Class A1 5.23%, due 12/25/2027 * | 1,780 | 1,779 | |||||||||
| Total Mortgage-Backed Securities (cost: $16,112) | 16,036 | ||||||||||
| ASSET-BACKED SECURITIES (8.3%) | |||||||||||
| ACE Securities Corp., Series 2006-NC1, Class A2B 5.03%, due 12/25/2035 * 5.11%, due 12/25/2035 * | 955 1,100 | 955 1,100 | |||||||||
| Amortizing Residential Collateral Trust, Series 2002-BC4, Class A 5.25%, due 07/25/2032 * | 4 | 4 | |||||||||
| Argent Securities, Inc., Series 2006-W1, Class A2A 5.04%, due 03/25/2036 * | 1,008 | 1,008 | |||||||||
| Bear Stearns Asset Backed Securities, Inc., Series 2002-2, Class A1 5.29%, due 10/25/2032 * | 33 | 33 | |||||||||
| Centex Home Equity, Series 2005-D, Class AV1 5.07%, due 10/25/2035 * | 407 | 407 | |||||||||
| Countrywide Asset-Backed Certificates, Series 2005-SD1, Class A1A–144A 5.11%, due 05/25/2035 * | 29 | 29 | |||||||||
| Countrywide Asset-Backed Certificates, Series 2006-1, Class AF1 5.09%, due 07/25/2036 * | 676 | 676 | |||||||||
| Countrywide Asset-Backed Certificates, Series 2006-SD1, Class A1 4.98%, due 02/25/2036 * | 1,000 | 1,000 | |||||||||
| GSAMP Trust, Series 2006-S2, Class A1A 5.03%, due 01/25/2036 * | 1,024 | 1,023 | |||||||||
| Home Equity Asset Trust, Series 2002-1, Class A4 5.26%, due 11/25/2032 * | 1 | 1 | |||||||||
| Principal | Value | ||||||||||
| HSI Asset Securitization Corp. Trust, Series 2006-OPT1, Class 2A1 5.04%, due 12/25/2035 * | $ | 639 | $ | 639 | |||||||
| Indymac Residential Asset Backed Trust, Series 2006-A, Class A1 5.05%, due 03/25/2036 * | 1,022 | 1,022 | |||||||||
| JP Morgan Mortgage Acquisition Corp., Series 2006-FRE1, Class A2 5.03%, due 05/25/2035 * | 949 | 950 | |||||||||
| Long Beach Mortgage Loan Trust, Series 2006-WL1, Class IIA1 5.05%, due 01/25/2036 * | 1,902 | 1,902 | |||||||||
| MASTR Asset Backed Securities Trust, Series 2005-NC2, Class A1 5.07%, due 11/25/2035 * | 983 | 983 | |||||||||
| MBNA Credit Card Master Note Trust, Series 2002-4B, Class B 5.40%, due 03/15/2010 * | 1,100 | 1,106 | |||||||||
| Metris Master Trust, Series 2001-2, Class A 5.24%, due 11/20/2009 * | 1,100 | 1,100 | |||||||||
| Morgan Stanley ABS Capital I, Series 2003-HE2, Class A2 5.30%, due 08/25/2033 * | 20 | 20 | |||||||||
| Park Place Securities, Inc., Series 2005-WHQ4, Class A2A 5.07%, due 09/25/2035 * | 226 | 226 | |||||||||
| Quest Trust, Series 2004-X2, Class A–144A 5.52%, due 06/25/2034 * | 46 | 46 | |||||||||
| RACERS Series 1997-R-8-3–144A 5.05%, due 08/15/2007 * §m | 300 | 290 | |||||||||
| Residential Asset Mortgage Products, Inc., Series 2006-NC1, Class A1 5.04%, due 01/25/2036 * | 1,000 | 1,000 | |||||||||
| Residential Asset Mortgage Products, Inc., Series 2006-RS1, Class AI1 5.04%, due 01/25/2036 * | 1,036 | 1,036 | |||||||||
| Residential Asset Securities Corp., Series 2006-EMX1, Class A1 5.04%, due 01/25/2036 * | 1,028 | 1,028 | |||||||||
| SLM Student Loan Trust, Series 2004-8, Class A2 5.12%, due 07/25/2013 * | 537 | 537 | |||||||||
| Small Business Administration, Series 2004-P10, Class A 4.50%, due 02/10/2014 | 257 | 244 | |||||||||
The notes to the financial statements are an integral part of this report.
Transamerica IDEX Mutual Funds
Semi-Annual Report 2006
4
TA IDEX PIMCO Total Return
SCHEDULE OF INVESTMENTS (continued)
At April 30, 2006
(all amounts except share amounts in thousands)
(unaudited)
| Principal | Value | ||||||||||
| Soundview Home Equity Loan Trust, Series 2005-B, Class A1 5.07%, due 05/25/2035 * | $ | 341 | $ | 341 | |||||||
| Structured Asset Securities Corp., Series 2002-HF1, Class A 5.25%, due 01/25/2033 * | 4 | 4 | |||||||||
| Total Asset-Backed Securities (cost: $18,731) | 18,710 | ||||||||||
| MUNICIPAL BONDS (0.9%) | |||||||||||
| Revenue-Education (0.1%) | |||||||||||
| Michigan State Building Authority 5.25%, due 10/15/2013 | 180 | 194 | |||||||||
| Revenue-Tobacco (0.6%) | |||||||||||
| Golden State Tobacco Securitization Corp. 6.75%, due 06/01/2039 | 80 | 89 | |||||||||
| Golden State Tobacco Securitization Corp., CA 7.90%, due 06/01/2042 | 35 | 42 | |||||||||
| Tobacco Settlement Financing Corp., LA 5.88%, due 05/15/2039 | 40 | 42 | |||||||||
| Tobacco Settlement Financing Corp., NJ 6.38%, due 06/01/2032 6.00%, due 06/01/2037 | 420 730 | 456 763 | |||||||||
| Revenue-Utilities (0.2%) | |||||||||||
| New York, NY, City Municipal Water Finance Authority 5.00%, due 06/15/2035 | 90 | 92 | |||||||||
| San Antonio, Texas, Texas Water Utility Improvements, Revenue Bonds, Series A 5.00%, due 05/15/2032 | 450 | 459 | |||||||||
| Total Municipal Bonds (cost: $1,898) | 2,137 | ||||||||||
| CORPORATE DEBT SECURITIES (6.1%) | |||||||||||
| Air Transportation (0.2%) | |||||||||||
| Continental Airlines, Inc. 7.06%, due 09/15/2009 | 200 | 205 | |||||||||
| UAL Corp. 6.20%, due 09/01/2008 † 6.60%, due 09/01/2013 | 236 103 | 236 103 | |||||||||
| Commercial Banks (1.5%) | |||||||||||
| China Development Bank 5.00%, due 10/15/2015 | 100 | 93 | |||||||||
| Export-Import Bank of China–144A 5.25%, due 07/29/2014 | 250 | 240 | |||||||||
| HSBC Capital Funding LP–144A 10.18%, due 06/30/2030 (a)(d) | 150 | 211 | |||||||||
| KBC Bank Fund Trust III Preferred–144A 9.86%, due 11/02/2009 (a)(d) | 15 | 17 | |||||||||
| Principal | Value | ||||||||||
| Rabobank Capital Funding II–144A | |||||||||||
| 5.26%, due 12/31/2013 (a)(d) | $ | 210 | $ | 199 | |||||||
| Rabobank Capital Funding Trust III–144A 5.25%, due 10/21/2016 (a)(d) | 280 | 260 | |||||||||
| Rabobank Nederland–144A 5.09%, due 01/15/2009 * | 1,100 | 1,100 | |||||||||
| Santander US Debt SA Unipersonal–144A 4.77%, due 02/06/2009 * | 1,100 | 1,100 | |||||||||
| Sumitomo Mitsui Banking–144A 5.63%, due 10/15/2015 (a)(d) | 150 | 143 | |||||||||
| Communication (0.0%) | |||||||||||
| Continental Cablevision, Inc. 8.30%, due 05/15/2006 | 100 | 100 | |||||||||
| Electric Services (0.5%) | |||||||||||
| Florida Power Corp. 4.80%, due 03/01/2013 | 450 | 424 | |||||||||
| NRG Energy, Inc. 7.25%, due 02/01/2014 | 600 | 603 | |||||||||
| PSEG Power LLC 6.95%, due 06/01/2012 | 210 | 220 | |||||||||
| Electric, Gas & Sanitary Services (0.2%) | |||||||||||
| Entergy Gulf States, Inc. 5.70%, due 06/01/2015 | 200 | 189 | |||||||||
| Niagara Mohawk Power Corp. 7.75%, due 10/01/2008 | 250 | 262 | |||||||||
| Waste Management, Inc. 6.38%, due 11/15/2012 | 75 | 77 | |||||||||
| Gas Production & Distribution (0.3%) | |||||||||||
| El Paso Energy Corp. 7.75%, due 01/15/2032 † | 125 | 124 | |||||||||
| Ras Laffan Liquefied Natural Gas Co., Ltd.–144A 3.44%, due 09/15/2009 | 66 | 64 | |||||||||
| Sonat, Inc. 7.63%, due 07/15/2011 | 370 | 379 | |||||||||
| Southern Natural Gas Co. 8.00%, due 03/01/2032 | 100 | 107 | |||||||||
| General Obligation-City (0.1%) | |||||||||||
| Chicago, IL, Board of Education 5.00%, due 12/01/2012 | 255 | 270 | |||||||||
| Hotels & Other Lodging Places (0.3%) | |||||||||||
| Harrah's Operating Co., Inc. 7.50%, due 01/15/2009 | 10 | 10 | |||||||||
| Park Place Entertainment Corp. 7.50%, due 09/01/2009 | 350 | 369 | |||||||||
| Starwood Hotels & Resorts Worldwide, Inc. 7.88%, due 05/01/2012 | 200 | 215 | |||||||||
The notes to the financial statements are an integral part of this report.
Transamerica IDEX Mutual Funds
Semi-Annual Report 2006
5
TA IDEX PIMCO Total Return
SCHEDULE OF INVESTMENTS (continued)
At April 30, 2006
(all amounts except share amounts in thousands)
(unaudited)
| Principal | Value | ||||||||||
| Mortgage Bankers & Brokers (0.1%) | |||||||||||
| Petroleum Export/Cayman–144A | |||||||||||
| 5.27%, due 06/15/2011 | $ | 172 | $ | 168 | |||||||
| Motion Pictures (0.1%) | |||||||||||
| Time Warner, Inc. 8.11%, due 08/15/2006 6.88%, due 05/01/2012 | 200 20 | 201 21 | |||||||||
| Municipal Obligations (1.2%) | |||||||||||
| Chicago, IL 6.12%, due 01/01/2014 * | 2,430 | 2,407 | |||||||||
| Tobacco Settlement Financing Corp., VA 5.25%, due 06/01/2019 5.50%, due 06/01/2026 | 200 200 | 203 205 | |||||||||
| Oil & Gas Extraction (0.3%) | |||||||||||
| Gaz Capital for Gazprom 8.63%, due 04/28/2034 | 500 | 604 | |||||||||
| Paper & Allied Products (0.3%) | |||||||||||
| Bowater Canada Finance Corp. 7.95%, due 11/15/2011 | 10 | 10 | |||||||||
| Smurfit-Stone Container Corp. 8.38%, due 07/01/2012 | 600 | 585 | |||||||||
| Personal Credit Institutions (0.3%) | |||||||||||
| General Electric Capital Corp. | |||||||||||
| 1.40%, due 11/02/2006 | JPY | 60,000 | 529 | ||||||||
| General Motors Acceptance Corp. 5.65%, due 05/18/2006 * 5.97%, due 01/16/2007 * | 10 40 | 10 39 | |||||||||
| Petroleum Refining (0.0%) | |||||||||||
| Enterprise Products Operating, LP 4.95%, due 06/01/2010 | 100 | 97 | |||||||||
| Telecommunications (0.7%) | |||||||||||
| Cingular Wireless LLC 6.50%, due 12/15/2011 | 180 | 188 | |||||||||
| Deutsche Telekom International | |||||||||||
| Finance BV | |||||||||||
| 8.13%, due 05/29/2012 (b) | EUR | 124 | 187 | ||||||||
| France Telecom SA | |||||||||||
| 6.75%, due 03/14/2008 (c) | EUR | 307 | 407 | ||||||||
| KT Corp.–144A 4.88%, due 07/15/2015 | 200 | 183 | |||||||||
| SBC Communications, Inc. 4.13%, due 09/15/2009 | 575 | 550 | |||||||||
| Total Corporate Debt Securities (cost: $13,753) | 13,914 | ||||||||||
| Principal | Value | ||||||||||
| SHORT-TERM U.S. GOVERNMENT OBLIGATIONS (1.1%) | |||||||||||
| Fannie Mae | |||||||||||
| 4.74%, due 06/21/2006 | $ | 2,000 | $ | 1,986 | |||||||
| U.S. Treasury Bill 4.51%, due 06/01/2006 d 4.50%, due 06/15/2006 dv 4.53%, due 06/15/2006 d | 200 195 90 | 199 194 90 | |||||||||
| Total Short-Term U.S. Government Obligations (cost: $2,469) | 2,469 | ||||||||||
| COMMERCIAL PAPER (35.2%) | |||||||||||
| Commercial Banks (28.8%) | |||||||||||
| ASB Bank, Ltd., 144A 4.63%, due 05/10/2006 | 5,300 | 5,293 | |||||||||
| BNP Paribas Finance, Inc. 4.48%, due 05/10/2006 5.00%, due 08/28/2006 | 700 6,000 | 699 5,899 | |||||||||
| CBA (Delaware) Finance, Inc. 4.81%, due 06/20/2006 | 1,400 | 1,390 | |||||||||
| Danske Corp. 4.83%, due 06/26/2006 | 5,800 | 5,755 | |||||||||
| Dexia Delaware LLC 4.64%, due 05/15/2006 4.84%, due 06/27/2006 | 1,400 4,900 | 1,397 4,861 | |||||||||
| DNB NOR Bank ASA 4.96%, due 07/20/2006 4.99%, due 08/18/2006 | 4,100 1,400 | 4,054 1,378 | |||||||||
| General Electric Capital Corp. 4.87%, due 06/29/2006 4.98%, due 07/24/2006 | 1,400 1,700 | 1,388 1,680 | |||||||||
| HBOS Treasury Services 4.78%, due 06/09/2006 4.94%, due 07/13/2006 | 5,900 800 | 5,868 792 | |||||||||
| Nordea North America, Inc. 4.74%, due 06/02/2006 | 700 | 697 | |||||||||
| Skandinaviska Enskilda Banken AB–144A 4.78%, due 06/09/2006 4.83%, due 06/22/2006 5.00%, due 07/26/2006 | 1,600 800 4,300 | 1,591 794 4,247 | |||||||||
| Societe Generale North America, Inc. 4.94%, due 07/11/2006 | 5,900 | 5,841 | |||||||||
| Svenska Handelsbanken, Inc. 4.89%, due 07/06/2006 | 4,400 | 4,359 | |||||||||
| UBS Finance Delaware LLC 4.93%, due 07/10/2006 | 6,700 | 6,634 | |||||||||
| Westpac Trust Securities NZ, Ltd., London 4.66%, due 05/22/2006 | 500 | 499 | |||||||||
The notes to the financial statements are an integral part of this report.
Transamerica IDEX Mutual Funds
Semi-Annual Report 2006
6
TA IDEX PIMCO Total Return
SCHEDULE OF INVESTMENTS (continued)
At April 30, 2006
(all amounts except share amounts in thousands)
(unaudited)
| Principal | Value | ||||||||||
| Holding & Other Investment Offices (2.3%) | |||||||||||
| Rabobank USA Finance Corp. | |||||||||||
| 4.82%, due 05/01/2006 | $ | 5,100 | $ | 5,099 | |||||||
| Mortgage Bankers & Brokers (0.3%) | |||||||||||
| Spintab AB 4.70%, due 05/26/2006 | 700 | 698 | |||||||||
| Oil & Gas Extraction (1.2%) | |||||||||||
| Total Capital SA, 144A 4.83%, due 05/01/2006 | 2,800 | 2,799 | |||||||||
| Security & Commodity Brokers (2.6%) | |||||||||||
| ING US Funding LLC 4.81%, due 06/19/2006 | 5,900 | 5,860 | |||||||||
| Total Commercial Paper (cost: $79,572) | 79,572 | ||||||||||
| CERTIFICATES OF DEPOSIT (1.0%) | |||||||||||
| Countrywide Bank NA 4.91%, due 10/18/2006 | 2,200 | 2,200 | |||||||||
| Total Certificates Of Deposit (cost: $2,200) | 2,200 | ||||||||||
| Contracts w | Value | ||||||||||
| PURCHASED OPTIONS (0.0%) | |||||||||||
| Covered Call Options (0.0%) | |||||||||||
| U.S. Treasury Long Bond Futures | 27 | $ | — | o | |||||||
| Call Strike $114.00 | |||||||||||
| Expires 05/26/2006 | |||||||||||
| Put Options (0.0%) | |||||||||||
| 90-Day Euro Dollar Futures Put Strike $91.75 Expires 12/18/2006 | 96 | 1 | |||||||||
| Total Purchased Options (cost: $40) | 1 | ||||||||||
| Notional Amount | Value | ||||||||||
| PURCHASED SWAPTIONS (0.0%) | |||||||||||
| Covered Call Swaptions (0.0%) | |||||||||||
| LIBOR Rate Swaption §m | $ | 4,900 | 1 | ||||||||
| Call Strike $5.35 | |||||||||||
| Expires 06/01/2006 | |||||||||||
| LIBOR Rate Swaption §m Call Strike $4.50 Expires 10/04/2006 | 24,000 | 2 | |||||||||
| LIBOR Rate Swaption §m Call Strike $4.73 Expires 02/01/2007 | 7,900 | 7 | |||||||||
| Total Purchased Swaptions (cost: $180) | 10 | ||||||||||
| Principal | Value | ||||||||||
| SECURITY LENDING COLLATERAL (1.1%) | |||||||||||
| Debt (1.0%) | |||||||||||
| Bank Notes (0.1%) | |||||||||||
| Bank of America | |||||||||||
| 4.81%, due 06/07/2006 * | $ | 83 | $ | 83 | |||||||
| 4.81%, due 08/10/2006 * | 81 | 81 | |||||||||
| Bear Stearns & Co. 5.01%, due 06/06/2006 * 5.01%, due 09/07/2006 * | 32 97 | 32 97 | |||||||||
| Certificates Of Deposit (0.1%) | |||||||||||
| Halifax Bank of Scotland 4.78%, due 06/06/2006 * | 81 | 81 | |||||||||
| Rabobank Nederland 4.87%, due 05/31/2006 * | 81 | 81 | |||||||||
| Commercial Paper (0.0%) | |||||||||||
| Banco Santander Central Hispano SA 4.77%, due 05/02/2006 | 48 | 48 | |||||||||
| Sheffield Receivables Corp.–144A 4.81%, due 05/03/2006 | 80 | 80 | |||||||||
| Euro Dollar Overnight (0.2%) | |||||||||||
| Bank of Montreal 4.77%, due 05/02/2006 | 64 | 64 | |||||||||
| Dexia Group 4.78%, due 05/04/2006 | 81 | 81 | |||||||||
| Fortis Bank 4.77%, due 05/01/2006 | 32 | 32 | |||||||||
| Royal Bank of Canada 4.77%, due 05/01/2006 | 113 | 113 | |||||||||
| Royal Bank of Scotland 4.75%, due 05/03/2006 | 81 | 81 | |||||||||
| Svenska Handlesbanken 4.82%, due 05/01/2006 | 62 | 62 | |||||||||
| Euro Dollar Terms (0.3%) | |||||||||||
| BancoBilbao Vizcaya Argentaria SA 4.95%, due 06/20/2006 | 64 | 64 | |||||||||
| Bank of the West 4.94%, due 06/16/2006 | 64 | 64 | |||||||||
| Barclays 4.79%, due 05/10/2006 4.77%, due 05/16/2006 | 97 32 | 97 32 | |||||||||
| Canadian Imperial Bank of Commerce 4.97%, due 06/23/2006 | 48 | 48 | |||||||||
| Credit Suisse First Boston Corp. 4.73%, due 05/08/2006 | 48 | 48 | |||||||||
The notes to the financial statements are an integral part of this report.
Transamerica IDEX Mutual Funds
Semi-Annual Report 2006
7
TA IDEX PIMCO Total Return
SCHEDULE OF INVESTMENTS (continued)
At April 30, 2006
(all amounts except share amounts in thousands)
(unaudited)
| Principal | Value | ||||||||||
| Fortis Bank | |||||||||||
| 4.83%, due 05/08/2006 | $ | 32 | $ | 32 | |||||||
| Lloyds TSB Bank 4.81%, due 05/11/2006 | 48 | 48 | |||||||||
| Royal Bank of Scotland 4.87%, due 05/12/2006 | 64 | 64 | |||||||||
| Societe Generale 4.79%, due 05/10/2006 | 80 | 80 | |||||||||
| UBS AG 4.95%, due 06/20/2006 | 80 | 80 | |||||||||
| Repurchase Agreements (0.3%) †† | |||||||||||
| Credit Suisse First Boston Corp. 4.92%, dated 04/28/2006 to be repurchased at $109 on 05/01/2006 | 109 | 109 | |||||||||
| Goldman Sachs Group, Inc. (The) 4.92%, dated 04/28/2006 to be repurchased at $236 on 05/01/2006 | 236 | 236 | |||||||||
| Lehman Brothers, Inc. 4.92%, dated 04/28/2006 to be repurchased at $4 on 05/01/2006 | 4 | 4 | |||||||||
| Merrill Lynch & Co. 4.87%, dated 04/28/2006 to be repurchased at $241 on 05/01/2006 | 241 | 241 | |||||||||
| Morgan Stanley Dean Witter & Co. 4.93%, dated 04/28/2006 to be repurchased at $113 on 05/01/2006 | 113 | 113 | |||||||||
| Shares | Value | ||||||||||
| Investment Companies (0.1%) | |||||||||||
| Barclays Global Investors Institutional Money Market Fund 1-day yield of 4.78% | 128,657 | $ | 129 | ||||||||
| Merrimac Cash Fund, Premium Class 1-day yield of 4.61% @ | 34,231 | 34 | |||||||||
| Total Security Lending Collateral (cost: $2,539) | 2,539 | ||||||||||
| Total Investment Securities (cost: $266,266) | $ | 264,649 | |||||||||
| Contracts w | Value | ||||||||||
| WRITTEN OPTIONS (0.0%) | |||||||||||
| Covered Call Options (0.0%) | |||||||||||
| 10 Year U.S. Treasury Note Futures | 38 | $ | (1 | ) | |||||||
| Call Strike $109.00 Expires 05/26/2006 | |||||||||||
| Total Written Options (premiums: $27) | (1 | ) | |||||||||
| Notional Amount | Value | ||||||||||
| WRITTEN SWAPTIONS (0.0%) | |||||||||||
| Covered Call Swaptions (0.0%) | |||||||||||
| LIBOR Rate Swaption m | $ | 8,900 | $ | (2 | ) | ||||||
| Call Strike $5.25 | |||||||||||
| Expires 06/01/2006 | |||||||||||
| LIBOR Rate Swaption m Call Strike $4.54 Expires 10/04/2006 | 11,000 | (2 | ) | ||||||||
| LIBOR Rate Swaption m Call Strike $4.78 Expires 02/01/2007 | 3,400 | (7 | ) | ||||||||
| Total Written Swaptions (premiums: $190) | (11 | ) | |||||||||
| SWAP AGREEMENTS: | |||||||||||
| Expiration Date | Notional Amount | Net Unrealized Appreciation (Depreciation) | |||||||||||||
| Receive a fixed rate equal to 0.58% and the Fund will pay to the counterparty at the notional amount in the event of default of Russian Federation Government Bond, 5.00%, due 03/31/2030. Counterparty: Morgan Stanley Capital Services, Inc. § | 06/20/2006 | $ | 500 | $ | 1 | ||||||||||
| Receive a fixed rate equal to 3.20% and the Fund will pay to the counterparty at the notional amount in the event of default of General Motors Acceptance Corp, 6.875%, due 8/28/2012 Counterparty: Lehman Brothers Special Financing, Inc. | 06/20/2007 | 300 | (1 | ) | |||||||||||
| Receive a fixed rate equal to 2.80% and the Fund will pay to the counterparty at the notional amount in the event of default of General Motors Acceptance Corp, 6.875%, due 8/28/2012. Counterparty: JP Morgan Chase Bank § | 06/20/2006 | 800 | 1 | ||||||||||||
| Receive a fixed rate equal to 0.61% and the Fund will pay to the counterparty at the notional amount in the event of default of Russian Federation Government Bond, 5.00%, due 03/312030. Counterparty: Goldman Sachs International § | 03/20/2007 | 425 | 1 | ||||||||||||
The notes to the financial statements are an integral part of this report.
Transamerica IDEX Mutual Funds
Semi-Annual Report 2006
8
TA IDEX PIMCO Total Return
SCHEDULE OF INVESTMENTS (continued)
At April 30, 2006
(all amounts except share amounts in thousands)
(unaudited)
| Expiration Date | Notional Amount | Net Unrealized Appreciation (Depreciation) | |||||||||||||
| Receive a fixed rate equal to 0.70% and the Fund will pay to the counterparty at the notional amount in the event of default of Russian Federation Government Bond, 5.00%, due 03/31/2030. Counterparty: Goldman Sachs International § | 03/20/2007 | $ | 175 | $ | 1 | ||||||||||
| Receive a fixed rate equal to 0.77% and the Fund will pay to the counterparty at the notional amount in the event of default of Russian Federation Government Bond, 5.00%, due 03/31/2030. Counterparty: JP Morgan Chase bank § | 05/20/2007 | 300 | 1 | ||||||||||||
| Receive a fixed rate equal to 2.1455% and the Fund will pay a floating rate based on FRC–Excluding Tobacco-Non-Revised Consumer Price Index. Counterparty: UBS AG § | 10/15/2010 | 2,100 | 1 | ||||||||||||
| Receive a fixed rate equal to 2.09% and the Fund will pay a floating rate based on FRC–Excluding Tobacco-Non-Revised Consumer Price Index. Counterparty: BNP Paribas §m | 10/15/2010 | 2,000 | 1 | ||||||||||||
| Receive a fixed rate equal to 2.1025% and the Fund will pay a floating rate based on FRC - Excluding Tobacco-Non-Revised Consumer Price Index. Counterparty: Barlcays Bank PLC §m | 10/15/2010 | 1,000 | — | o | |||||||||||
| Receive a fixed rate equal to 5.00% and pay a floating rate based on 3-month United States Dollar–LIBOR. Counterparty: Goldman Sachs Capital Markets, LP | 06/21/2011 | 800 | (14 | ) | |||||||||||
| Receive a floating rate based on 3-month U.S. Dollar–LIBOR and pay a fixed rate equal to 5.00%. Counterparty: Goldman Sachs Capital Markets, LP § | 06/21/2016 | 2,200 | 74 | ||||||||||||
| Expiration Date | Notional Amount | Net Unrealized Appreciation (Depreciation) | |||||||||||||
| Receive a floating rate based on 3-month U.S. Dollar–LIBOR and pay a fixed rate equal to 5.00%. Counterparty: Morgan Stanley Capital Services, Inc. § | 06/21/2016 | $ | 8,200 | $ | 275 | ||||||||||
| Receive a floating rate based on 6-month British Pound–LIBOR and pay a fixed rate equal to 4.00%. Counterparty: Barlcays Bank PLC §m | 12/15/2035 | 400 | 26 | ||||||||||||
| Receive a floating rate based on 6-month British Pound–LIBOR and pay a fixed rate equal to 4.00%. Counterparty: Deutsche Bank AG § | 12/15/2035 | 1,000 | 62 | ||||||||||||
| Receive a floating rate based on 6-month Japanese Yen–LIBOR and pay a fixed rate equal to 2.00%. Counterparty: Morgan Stanley Capital Services, Inc. | 12/20/2013 | 140,000 | 28 | ||||||||||||
| Receive a floating rate based on 6-month British Pound–LIBOR and pay a fixed rate equal to 4.00%. Counterparty: Deutsche Bank AG § | 06/21/2036 | 400 | 60 | ||||||||||||
| Receive a fixed rate equal to 5.00% and pay a floating rate based on 3-month United States Dollar–LIBOR. Counterparty: Citibank | 06/21/2011 | 11,300 | (115 | ) | |||||||||||
| Receive a fixed rate equal to 5.00% and pay a floating rate based on 3-month United States Dollar–LIBOR. Counterparty: Deutsche Bank AG | 06/21/2013 | 100 | (3 | ) | |||||||||||
| Receive a fixed rate equal to 5.00% and pay a floating rate based on 3-month United States Dollar–LIBOR. Counterparty: Morgan Stanley Capital Services, Inc. | 06/21/2011 | 19,500 | (489 | ) | |||||||||||
| Receive a fixed rate equal to 5.00% and pay a floating rate based on 3-month United States Dollar–LIBOR. Counterparty: UBS AG | 06/21/2011 | 6,000 | (151 | ) | |||||||||||
| Receive a fixed rate equal to 5.00% and pay a floating rate based on 3-month United States Dollar–LIBOR. Counterparty: Deutsche Bank AG | 12/15/2035 | 5,900 | (237 | ) | |||||||||||
The notes to the financial statements are an integral part of this report.
Transamerica IDEX Mutual Funds
Semi-Annual Report 2006
9
TA IDEX PIMCO Total Return
SCHEDULE OF INVESTMENTS (continued)
At April 30, 2006
(all amounts except share amounts in thousands)
(unaudited)
| Expiration Date | Notional Amount | Net Unrealized Appreciation (Depreciation) | |||||||||||||
| Receive a fixed rate equal to 5.00% and pay a floating rate based on 3-month United States Dollar–LIBOR. Counterparty: Deutsche Bank AG | 06/21/2011 | $ | 5,600 | $ | (42 | ) | |||||||||
| Receive a fixed rate equal to 5.00% and pay a floating rate based on 3-month British Pound–LIBOR. Counterparty: HSBC Bank USA, N.A. | 09/18/2010 | 1,500 | (28 | ) | |||||||||||
| Receive a fixed rate equal to 5.00% and pay a floating rate based on 3-month United States Dollar–LIBOR. Counterparty: Lehman Brothers Special Financing, Inc. | 06/21/2011 | 10,500 | (55 | ) | |||||||||||
| Total Swap Agreements (premium $165) | $ | 221,000 | $ | (603 | ) | ||||||||||
| FUTURES CONTRACTS: | |||||||||||||||
| Contracts | Settlement Date | Amount | Net Unrealized Appreciation (Depreciation) | ||||||||||||||||
| 10 Year Japan Government Bond | 1 | 06/20/2006 | $ | 1,161 | $ | (19 | ) | ||||||||||||
| 10 Year U.S. Treasury Note | 270 | 06/30/2006 | 28,506 | (517 | ) | ||||||||||||||
| 2 Year U.S. Treasury Note | (85 | ) | 06/30/2006 | (17,317 | ) | 40 | |||||||||||||
| 5 Year U.S. Treasury Note | 196 | 07/06/2006 | 20,415 | (178 | ) | ||||||||||||||
| 90-Day Euro Dollar | 97 | 06/19/2006 | 22,991 | (213 | ) | ||||||||||||||
| 90-Day Euro Dollar | 80 | 12/18/2006 | 18,951 | (102 | ) | ||||||||||||||
| 90-Day Euro Dollar | 176 | 06/18/2007 | 41,716 | (8 | ) | ||||||||||||||
| Euro-BOBL | (19 | ) | 06/12/2006 | (2,619 | ) | 12 | |||||||||||||
| U.S. Treasury Long Bond | (62 | ) | 06/30/2006 | (6,624 | ) | 288 | |||||||||||||
| $ | 107,180 | $ | (697 | ) | |||||||||||||||
| FORWARD FOREIGN CURRENCY CONTRACTS: | |||||||||||||||||||
| Currency | Bought (Sold) | Settlement Date | Amount in U.S. Dollars Bought (Sold) | Net Unrealized Appreciation (Depreciation) | |||||||||||||||
| Euro Dollar | (9,594 | ) | 07/31/2006 | $ | (11,968 | ) | $ | (183 | ) | ||||||||||
| Japanese Yen | 18,000 | 05/08/2006 | 158 | — | o | ||||||||||||||
| Japanese Yen | 17,504 | 05/15/2006 | 151 | 3 | |||||||||||||||
| Japanese Yen | (18,000 | ) | 05/15/2006 | (158 | ) | — | o | ||||||||||||
| $ | (11,817 | ) | $ | (180 | ) | ||||||||||||||
The notes to the financial statements are an integral part of this report.
Transamerica IDEX Mutual Funds
Semi-Annual Report 2006
10
TA IDEX PIMCO Total Return
SCHEDULE OF INVESTMENTS (continued)
At April 30, 2006
(all amounts except share amounts in thousands)
(unaudited)
NOTES TO SCHEDULE OF INVESTMENTS:
† At April 30, 2006, all or a portion of this security is on loan (see Note 1). The value at April 30, 2006, of all securities on loan is $2,437.
* Floating or variable rate note. Rate is listed as of April 30, 2006.
o Value is less than $1.
§ Security is deemed to be illiquid.
(a) Coupon rate is fixed for a predetermined period of time and then converts to a floating rate until maturity date. Rate is listed as of April 30, 2006.
(b) Deutsche Telekom International Finance BV coupon steps up by 50 BP for each rating downgrade by Standard & Poor's or Moody's for each notch below BBB+/Baa1. Coupon steps down by 50 BP for each rating upgrade above Baa2/BBB.
(c) Coupon steps up or down by 25 BP for each rating upgrade or downgrade by Standard and Poor's or Moody's for each notch above or below A-/A3.
(d) The security has a perpetual maturity. The date shown is the next call date.
d At April 30, 2006, all or a portion of this security is segregated with the custodian to cover margin requirements for open future contracts. The value of all securities segregated at April 30, 2006, is $468.
v At April 30, 2006, all or a portion of this security is segregated with the custodian to cover margin requirements for open option contracts. The value of all securities segregated at April 30, 2006, is $15.
†† Cash collateral for the Repurchase Agreements, valued at $724, that serve as collateral for securities lending are invested in corporate bonds with interest rates and maturity dates ranging from 0.00%–9.05% and 05/02/2006–12/31/2049, respectively.
@ Regulated investment company advised by Investors Bank and Trust Co. ("IBT"). IBT is also the accounting, custody and lending agent for the Fund.
w Contract amounts are not in thousands.
m Securities valued as determined in good faith in accordance with procedure established by the Fund's Board of Trustees.
# Aggregate cost for Federal income tax purposes is $266,433. Aggregate gross unrealized appreciation for all securities in which there is an excess of value over tax cost and aggregate gross unrealized depreciation for all securities in which there is an excess of tax cost over value were $1,202 and $2,986, respectively. Net unrealized depreciation for tax purposes is $1,784.
DEFINITIONS:
144A 144A Securities are registered pursuant to Rule 144A of the Securities Act of 1933. These securities are deemed to be liquid for purposes of compliance limitations on holdings of illiquid securities and may be resold as transactions exempt from registration, normally to qualified institutional buyers. At April 30, 2006, these securities aggregated $19,537 or 8.6% of the net assets of the Fund.
EUR Euro
JPY Japanese Yen
LIBOR London Interbank Offer Rate
RACERS Restructured Asset Certificates with Enhanced Returns
TBA Mortgage-backed securities traded under delayed delivery commitments. Income on TBA's are not earned until settlement date.
The notes to the financial statements are an integral part of this report.
Transamerica IDEX Mutual Funds
Semi-Annual Report 2006
11
TA IDEX PIMCO Total Return
STATEMENT OF ASSETS AND LIABILITIES
At April 30, 2006
(all amounts except per share amounts in thousands)
(unaudited)
| Assets: | |||||||
| Investment securities, at value (cost: $266,266) (including securities loaned of $2,437) | $ | 264,649 | |||||
| Cash | 4,669 | ||||||
| Foreign currency (cost: $460) | 472 | ||||||
| Receivables: | |||||||
| Investment securities sold | 51,584 | ||||||
| Shares of beneficial interest sold | 576 | ||||||
| Interest | 963 | ||||||
| Variation margin | 89 | ||||||
| Unrealized appreciation on forward foreign currency contracts | 3 | ||||||
| Other | 6 | ||||||
| 323,011 | |||||||
| Liabilities: | |||||||
| Investment securities purchased | 92,943 | ||||||
| Accounts payable and accrued liabilities: | |||||||
| Shares of beneficial interest redeemed | 193 | ||||||
| Management and advisory fees | 129 | ||||||
| Swap contract interest | 36 | ||||||
| Transfer agent fees | 12 | ||||||
| Administration fees | 4 | ||||||
| Payable for collateral for securities on loan | 2,539 | ||||||
| Unrealized depreciation on forward foreign currency contracts | 183 | ||||||
| Written options and swaptions (premiums $217) | 12 | ||||||
| Swap agreements at value (premium $165) | 768 | ||||||
| Other | 32 | ||||||
| 96,851 | |||||||
| Net Assets | $ | 226,160 | |||||
| Net Assets Consist of: | |||||||
| Shares of beneficial interest, unlimited shares authorized, no par value | $ | 229,455 | |||||
| Distributable net investment income (loss) | 414 | ||||||
| Accumulated net realized gain (loss) from investment securities, futures contracts, written options and swaptions, swaps and foreign currency transactions | (833 | ) | |||||
| Net unrealized appreciation (depreciation) on: | |||||||
| Investment securities | (1,617 | ) | |||||
| Futures contracts | (697 | ) | |||||
| Written option and swaption contracts | 205 | ||||||
| Swap agreements | (603 | ) | |||||
| Translation of assets and liabilities denominated in foreign currencies | (164 | ) | |||||
| Net Assets | $ | 226,160 | |||||
| Net Assets by Class: | |||||||
| Class A | $ | 6,256 | |||||
| Class B | 16,725 | ||||||
| Class C | 6,975 | ||||||
| Class I | 196,204 | ||||||
| Shares Outstanding: | |||||||
| Class A | 620 | ||||||
| Class B | 1,657 | ||||||
| Class C | 693 | ||||||
| Class I | 19,466 | ||||||
| Net Asset Value Per Share: | |||||||
| Class A | $ | 10.09 | |||||
| Class B | 10.09 | ||||||
| Class C | 10.06 | ||||||
| Class I | 10.08 | ||||||
| Maximum Offering Price Per Share (a): | |||||||
| Class A | $ | 10.59 | |||||
(a) Includes the maximum selling commission (represented as a percentage of offering price) which is reduced on certain levels of sales as set forth in the Prospectus. Net asset value per share for Classes B, C, and I shares represents offering price. The redemption price for Classes B and C shares equals net asset value less any applicable contingent deferred sales charge.
STATEMENT OF OPERATIONS
For the period ended April 30, 2006 (b)
(all amounts in thousands)
(unaudited)
| Investment Income: | |||||||
| Interest | $ | 4,752 | |||||
| Expenses: | |||||||
| Management and advisory fees | 715 | ||||||
| Distribution and service fees: | |||||||
| Class A | 26 | ||||||
| Class B | 68 | ||||||
| Class C | 29 | ||||||
| Transfer agent fees: | |||||||
| Class A | 12 | ||||||
| Class B | 23 | ||||||
| Class C | 9 | ||||||
| Class I | – | (c) | |||||
| Printing and shareholder reports | 7 | ||||||
| Custody fees | 40 | ||||||
| Administration fees | 20 | ||||||
| Legal fees | 5 | ||||||
| Audit fees | 9 | ||||||
| Trustees fees | 4 | ||||||
| Registration fees | 5 | ||||||
| Other | 2 | ||||||
| Total expenses | 974 | ||||||
| Net Investment Income (Loss) | 3,778 | ||||||
| Net Realized Gain (Loss) from: | |||||||
| Investment securities | (387 | ) | |||||
| Futures contracts | (1,143 | ) | |||||
| Written option and swaption contracts | 110 | ||||||
| Swap agreements | 116 | ||||||
| Foreign currency transactions | (540 | ) | |||||
| (1,844 | ) | ||||||
| Net Increase (Decrease) in Unrealized Appreciation (Depreciation) on: | |||||||
| Investment securities | (383 | ) | |||||
| Futures contracts | 473 | ||||||
| Written option and swaption contracts | 134 | ||||||
| Swap agreements | (676 | ) | |||||
| Translation of assets and liabilities denominated in foreign currencies | (93 | ) | |||||
| (545 | ) | ||||||
| Net Realized and Unrealized Gain (Loss) on Investment Securities, Futures Contracts, Written Option and Swaption Contracts, Swaps and Foreign Currency Transactions | (2,389 | ) | |||||
| Net Increase (Decrease) in Net Assets Resulting from Operations | $ | 1,389 | |||||
(b) Class I was offered for investment on November 15, 2005.
(c) Rounds to less than $1.
The notes to the financial statements are an integral part of this report.
Transamerica IDEX Mutual Funds
Semi-Annual Report 2006
12
TA IDEX PIMCO Total Return
STATEMENTS OF CHANGES IN NET ASSETS
For the period or year ended
(all amounts in thousands)
| April 30, 2006 (unaudited) (a) | October 31, 2005 | ||||||||||
| Increase (Decrease) In Net Assets From: | |||||||||||
| Operations: | |||||||||||
| Net investment income (loss) | $ | 3,778 | $ | 3,671 | |||||||
| Net realized gain (loss) from investment securities, futures contracts, written options and swaptions, swaps and foreign currency transactions | (1,844 | ) | 1,558 | ||||||||
| Change in unrealized appreciation (depreciation) on investment securities, futures contracts, written options and swaptions, swaps and foreign currency translation | (545 | ) | (4,099 | ) | |||||||
| 1,389 | 1,130 | ||||||||||
| Distributions to Shareholders: | |||||||||||
| From net investment income: | |||||||||||
| Class A | (336 | ) | (3,336 | ) | |||||||
| Class B | (247 | ) | (430 | ) | |||||||
| Class C | (108 | ) | (197 | ) | |||||||
| Class I | (2,736 | ) | – | ||||||||
| (3,427 | ) | (3,963 | ) | ||||||||
| From net realized gains: | |||||||||||
| Class A | – | (1,399 | ) | ||||||||
| Class B | – | (337 | ) | ||||||||
| Class C | – | (149 | ) | ||||||||
| – | (1,885 | ) | |||||||||
| Capital Share Transactions: | |||||||||||
| Proceeds from shares sold: | |||||||||||
| Class A | 214 | 21,913 | |||||||||
| Class B | 128 | 2,672 | |||||||||
| Class C | 147 | 1,559 | |||||||||
| Class I | 194,792 | – | |||||||||
| 195,281 | 26,144 | ||||||||||
| Dividends and distributions reinvested: | |||||||||||
| Class A | 322 | 4,692 | |||||||||
| Class B | 179 | 567 | |||||||||
| Class C | 94 | 302 | |||||||||
| Class I | 2,736 | – | |||||||||
| 3,331 | 5,561 | ||||||||||
| Cost of shares redeemed: | |||||||||||
| Class A | (119,688 | ) | (3,417 | ) | |||||||
| Class B | (5,549 | ) | (8,606 | ) | |||||||
| Class C | (2,838 | ) | (4,738 | ) | |||||||
| (128,075 | ) | (16,761 | ) | ||||||||
(a) Class I was offered for investment on November 15, 2005.
| April 30, 2006 (unaudited) (a) | October 31, 2005 | ||||||||||
| Automatic conversions: | |||||||||||
| Class A | $ | 18 | $ | – | |||||||
| Class B | (18 | ) | – | ||||||||
| – | – | ||||||||||
| 70,537 | 14,944 | ||||||||||
| Net increase (decrease) in net assets | 68,499 | 10,226 | |||||||||
| Net Assets: | |||||||||||
| Beginning of period | 157,661 | 147,435 | |||||||||
| End of period | $ | 226,160 | $ | 157,661 | |||||||
| Distributable Net Investment Income (Loss) | $ | 414 | $ | 63 | |||||||
| Share Activity: | |||||||||||
| Shares issued: | |||||||||||
| Class A | 21 | 2,110 | |||||||||
| Class B | 12 | 257 | |||||||||
| Class C | 15 | 150 | |||||||||
| Class I | 19,196 | – | |||||||||
| 19,244 | 2,517 | ||||||||||
| Shares issued–reinvested from distributions: | |||||||||||
| Class A | 32 | 454 | |||||||||
| Class B | 18 | 55 | |||||||||
| Class C | 9 | 29 | |||||||||
| Class I | 270 | – | |||||||||
| 329 | 538 | ||||||||||
| Shares redeemed: | |||||||||||
| Class A | (11,823 | ) | (329 | ) | |||||||
| Class B | (544 | ) | (829 | ) | |||||||
| Class C | (280 | ) | (458 | ) | |||||||
| (12,647 | ) | (1,616 | ) | ||||||||
| Automatic conversions: | |||||||||||
| Class A | 2 | – | |||||||||
| Class B | (2 | ) | – | ||||||||
| – | – | ||||||||||
| Net increase (decrease) in shares outstanding: | |||||||||||
| Class A | (11,768 | ) | 2,235 | ||||||||
| Class B | (516 | ) | (517 | ) | |||||||
| Class C | (256 | ) | (279 | ) | |||||||
| Class I | 19,466 | – | |||||||||
| 6,926 | 1,439 | ||||||||||
The notes to the financial statements are an integral part of this report.
Transamerica IDEX Mutual Funds
Semi-Annual Report 2006
13
TA IDEX PIMCO Total Return
FINANCIAL HIGHLIGHTS
(unaudited for the period ended April 30, 2006)
| For a share of beneficial interest outstanding throughout each period | |||||||||||||||||||||||||||||||||||||||
| Net Asset | Investment Operations | Distributions | Net Asset | ||||||||||||||||||||||||||||||||||||
| For the Period Ended (d)(g) | Value, Beginning of Period | Net Investment Income (Loss) | Net Realized and Unrealized Gain (Loss) | Total Operations | From Net Investment Income | From Net Realized Gains | Total Distributions | Value, End of Period | |||||||||||||||||||||||||||||||
| Class A | 4/30/2006 | $ | 10.16 | $ | 0.18 | $ | (0.11 | ) | $ | 0.07 | $ | (0.14 | ) | $ | – | $ | (0.14 | ) | $ | 10.09 | |||||||||||||||||||
| 10/31/2005 | 10.48 | 0.26 | (0.17 | ) | 0.09 | (0.28 | ) | (0.13 | ) | (0.41 | ) | 10.16 | |||||||||||||||||||||||||||
| 10/31/2004 | 10.52 | 0.12 | 0.36 | 0.48 | (0.14 | ) | (0.38 | ) | (0.52 | ) | 10.48 | ||||||||||||||||||||||||||||
| 10/31/2003 | 10.32 | 0.20 | 0.39 | 0.59 | (0.25 | ) | (0.14 | ) | (0.39 | ) | 10.52 | ||||||||||||||||||||||||||||
| 10/31/2002 | 10.00 | 0.13 | 0.28 | 0.41 | (0.09 | ) | – | (0.09 | ) | 10.32 | |||||||||||||||||||||||||||||
| Class B | 4/30/2006 | 10.18 | 0.15 | (0.11 | ) | 0.04 | (0.13 | ) | – | (0.13 | ) | 10.09 | |||||||||||||||||||||||||||
| 10/31/2005 | 10.48 | 0.17 | (0.16 | ) | 0.01 | (0.18 | ) | (0.13 | ) | (0.31 | ) | 10.18 | |||||||||||||||||||||||||||
| 10/31/2004 | 10.51 | 0.07 | 0.36 | 0.43 | (0.08 | ) | (0.38 | ) | (0.46 | ) | 10.48 | ||||||||||||||||||||||||||||
| 10/31/2003 | 10.32 | 0.13 | 0.38 | 0.51 | (0.18 | ) | (0.14 | ) | (0.32 | ) | 10.51 | ||||||||||||||||||||||||||||
| 10/31/2002 | 10.00 | 0.09 | 0.29 | 0.38 | (0.06 | ) | – | (0.06 | ) | 10.32 | |||||||||||||||||||||||||||||
| Class C | 4/30/2006 | 10.15 | 0.15 | (0.11 | ) | 0.04 | (0.13 | ) | – | (0.13 | ) | 10.06 | |||||||||||||||||||||||||||
| 10/31/2005 | 10.47 | 0.16 | (0.16 | ) | – | (0.19 | ) | (0.13 | ) | (0.32 | ) | 10.15 | |||||||||||||||||||||||||||
| 10/31/2004 | 10.51 | 0.04 | 0.38 | 0.42 | (0.08 | ) | (0.38 | ) | (0.46 | ) | 10.47 | ||||||||||||||||||||||||||||
| 10/31/2003 | 10.38 | 0.13 | 0.32 | 0.45 | (0.18 | ) | (0.14 | ) | (0.32 | ) | 10.51 | ||||||||||||||||||||||||||||
| Class I | 4/30/2006 | 10.12 | 0.18 | (0.07 | ) | 0.11 | (0.15 | ) | – | (0.15 | ) | 10.08 | |||||||||||||||||||||||||||
| Ratios/Supplemental Data | |||||||||||||||||||||||||||||||
| For the Period | Total | Net Assets, End of Period | Ratio of Expenses to Average Net Assets (a) | Net Investment Income (Loss) to Average | Portfolio Turnover | ||||||||||||||||||||||||||
| Ended (g) | Return (c) | (000's) | Net (e) | Total (f) | Net Assets (a) | Rate (b) | |||||||||||||||||||||||||
| Class A | 4/30/2006 | 0.60 | % | $ | 6,256 | 1.26 | % | 1.26 | % | 3.51 | % | 295 | % | ||||||||||||||||||
| 10/31/2005 | 0.86 | 125,910 | 1.20 | 1.20 | 2.55 | 459 | |||||||||||||||||||||||||
| 10/31/2004 | 4.78 | 106,366 | 1.34 | 1.34 | 1.19 | 385 | |||||||||||||||||||||||||
| 10/31/2003 | 5.88 | 56,452 | 1.43 | 1.43 | 1.91 | 326 | |||||||||||||||||||||||||
| 10/31/2002 | 4.13 | 40,767 | 1.65 | 1.81 | 2.28 | 240 | |||||||||||||||||||||||||
| Class B | 4/30/2006 | 0.39 | 16,725 | 1.73 | 1.73 | 2.91 | 295 | ||||||||||||||||||||||||
| 10/31/2005 | 0.07 | 22,116 | 2.06 | 2.06 | 1.64 | 459 | |||||||||||||||||||||||||
| 10/31/2004 | 4.30 | 28,219 | 1.92 | 1.92 | 0.64 | 385 | |||||||||||||||||||||||||
| 10/31/2003 | 5.08 | 34,547 | 2.08 | 2.08 | 1.26 | 326 | |||||||||||||||||||||||||
| 10/31/2002 | 3.80 | 30,909 | 2.30 | 2.46 | 1.63 | 240 | |||||||||||||||||||||||||
| Class C | 4/30/2006 | 0.41 | 6,975 | 1.69 | 1.69 | 2.96 | 295 | ||||||||||||||||||||||||
| 10/31/2005 | – | (h) | 9,635 | 2.11 | 2.11 | 1.58 | 459 | ||||||||||||||||||||||||
| 10/31/2004 | 4.10 | 12,850 | 2.09 | 2.09 | 0.41 | 385 | |||||||||||||||||||||||||
| 10/31/2003 | 4.47 | 5,231 | 2.08 | 2.08 | 1.25 | 326 | |||||||||||||||||||||||||
| Class I | 4/30/2006 | 1.13 | 196,204 | 0.79 | 0.79 | 3.85 | 295 | ||||||||||||||||||||||||
The notes to the financial statements are an integral part of this report.
Transamerica IDEX Mutual Funds
Semi-Annual Report 2006
14
TA IDEX PIMCO Total Return
FINANCIAL HIGHLIGHTS (continued)
(unaudited)
NOTES TO FINANCIAL HIGHLIGHTS
(a) Annualized.
(b) Not annualized.
(c) Total Return has been calculated for the applicable period without deduction of a sales load, if any, on an initial purchase. Not annualized.
(d) Per share information is calculated based on average number of shares outstanding.
(e) Ratio of Net Expenses to Average Net Assets is net of fee waivers and reimbursements by the investment adviser, if any (see note 2).
(f) Ratio of Total Expenses to Average Net Assets includes all expenses before fee waivers and reimbursements by the investment adviser.
(g) TA IDEX PIMCO Total Return ("the Fund") commenced operations on March 1, 2002. The inception dates for the Fund's offering of share classes were as follows:
Class C was November 11, 2002.
Class I was November 15, 2005.
(h) Rounds to less than $0.01 per share.
The notes to the financial statements are an integral part of this report.
Transamerica IDEX Mutual Funds
Semi-Annual Report 2006
15
TA IDEX PIMCO Total Return
NOTES TO FINANCIAL STATEMENTS
At April 30, 2006
(all amounts in thousands)
(unaudited)
NOTE 1. ORGANIZATION AND SIGNIFICANT ACCOUNTING POLICIES
Transamerica IDEX Mutual Funds is an open-end management investment company registered under the Investment Company Act of 1940, as amended (the "1940 Act").
In the normal course of business, TA IDEX PIMCO Total Return (the "Fund") enters into contracts that contain a variety of representations that provide general indemnifications. The Fund's maximum exposure under these arrangements is unknown, as this would involve future claims that may be made against the Fund and/or its affiliates that have not yet occurred. However, based on experience, the Fund expects the risk of loss to be remote.
This report should be read in conjunction with the current Fund prospectus, which contains more complete information about the Fund.
In preparing the Fund's financial statements in accordance with accounting principles generally accepted in the United States of America ("GAAP"), estimates or assumptions (which could differ from actual results) may be used that affect reported amounts and disclosures. The following is a summary of significant accounting policies followed by the Fund.
Multiple class operations, income and expenses: The Fund currently offers four classes of shares, Class A, Class B, Class C and Class I, each with a public offering price that reflects different sales charges, if any, and expense levels. Classes A, B and C are closed to new investors. Class I shares commenced operations on November 15, 2005. Class I is only available for investment to certain affiliated asset allocation funds. Class B shares will convert to Class A shares eight years after purchase. Income, non-class specific expenses and realized and unrealized gains and losses, are allocated daily to each class, based upon the value of shares outstanding method as permitted under Rule 18f-3 of the 1940 Act. Each class bears its own specific expenses as well as a portion of general, common expenses.
Security valuations: The Fund values its investments at the close of the New York Stock Exchange ("NYSE"), normally 4 p.m. ET, each day the NYSE is open for business. Fund investments are valued at the last sale price or closing price on the day of valuation taken from the primary exchange where the security is principally traded.
Securities traded in the over-the-counter market and listed securities for which no sale was reported on that date are valued at the last quoted bid price.
Debt securities are valued based on a price quotation or other equivalent indication of value supplied by an exchange, a pricing service or a major market maker; however, those that mature in sixty days or less are valued at amortized cost, which approximates market.
Investment company securities are valued at the net asset value of the underlying portfolio.
Foreign securities generally are valued based on quotations from the primary market in which they are traded. Because many foreign securities markets and exchanges close prior to the close of the NYSE, closing prices for foreign securities in those markets or on those exchanges do not reflect the events that occur after that close. If a significant market event impacting the value of a portfolio security (e.g., natural disaster, company announcement, market volatility) occurs subsequent to the close of trading in the security, but prior to the calculation of the Fund's net asset value per share, market quotations for that security may be determined to be unreliable and, accordingly, not "readily available." As a result, foreign equity securities held by the Fund may be valued at fair market value as determined in good faith by the Fund's Administrative Valuation Committee, under the supervision of the Board's Valuation Committee , using guidelines adopted by the Board of Trustees.
Other securities for which quotations are not readily available or whose values have been determined to be unreliable are valued at fair market value as determined in good faith by the Fund's Administrative Valuation Committee, under the supervision of the Board's Valuation Committee, using guidelines adopted by the Board of Trustees.
Cash: The Fund may leave cash overnight in its cash account with the custodian, Investors Bank & Trust Company ("IBT"). IBT has been contracted on behalf of the Fund to invest the excess cash into a savings account, which at April 30, 2006, was paying an interest rate of 3.24%.
TBA purchase commitments: The Fund may enter into "TBA" (to be announced) purchase commitments to purchase securities for a fixed price at a future date, typically not to exceed 45 days. TBA purchase commitments are considered securities in themselves, and involve a risk of loss if the value of the security to be purchased declines prior to settlement date, in addition to the risk of decline in the value of the Fund's other assets. Unsettled TBA purchase commitments are valued at the current value of the underlying securities, according to the procedures described under Security Valuations.
Repurchase agreements: The Fund is authorized to enter into repurchase agreements. The Fund, through its custodian, IBT, receives delivery of the underlying securities, the value of which at the time of purchase is required to be an amount equal to at least 100% of the resale price. The Fund will bear the risk of value fluctuations until the security can be sold and may encounter delays and incur costs in liquidating the security. In the event of bankruptcy or insolvency of the seller, delays and costs may be incurred.
Transamerica IDEX Mutual Funds
Semi-Annual Report 2006
16
TA IDEX PIMCO Total Return
NOTES TO FINANCIAL STATEMENTS (continued)
At April 30, 2006
(all amounts in thousands)
(unaudited)
NOTE 1.–(continued)
Securities lending: The Fund may lend securities to qualified borrowers, with IBT acting as the Fund's lending agent. The Fund earns negotiated lenders' fees. The Fund receives cash and/or securities as collateral against the loaned securities. Cash collateral received is invested in short term, interest bearing securities. The Fund monitors the market value of securities loaned on a daily basis and requires collateral in an amount at least equal to the value of the securities loaned. Income from loaned securities on the Statement of Operations is net of fees, in the amount of $1, earned by IBT for its services.
Security transactions and investment income: Security transactions are recorded on the trade date. Security gains and losses are calculated on the specific identification basis. Dividend income, if any, is recorded on the ex-dividend date or, in the case of foreign securities, as soon as the Fund is informed of the ex-dividend date. Interest income, including accretion of discounts and amortization of premiums, is recorded on the accrual basis commencing on the settlement date.
Foreign currency denominated investments: The accounting records of the Fund are maintained in U.S. dollars. Securities and other assets and liabilities denominated in foreign currencies are translated into U.S. dollars at the closing exchange rate each day. The cost of foreign securities is translated at the exchange rate in effect when the investment was acquired. The Fund combines fluctuations from currency exchange rates and fluctuations in value when computing net realized and unrealized gains or losses from investments.
Net foreign currency gains and losses resulting from changes in exchange rates include: 1) foreign currency fluctuations between trade date and settlement date of investment security transactions; 2) gains and losses on forward foreign currency contracts; and 3) the difference between the receivable amounts of interest and dividends recorded in the accounting records in U.S. dollars and the amounts actually received.
Foreign currency denominated assets may involve risks not typically associated with domestic transactions. These risks include revaluation of currencies, adverse fluctuations in foreign currency values and possible adverse political, social and economic developments, including those particular to a specific industry, country or region.
Forward foreign currency contracts: The Fund may enter into forward foreign currency contracts to hedge against exchange rate risk arising from investments in securities denominated in foreign currencies. Contracts are valued at the contractual forward rate and are marked to market daily, with the change in value recorded as an unrealized gain or loss. When the contracts are settled a realized gain or loss is incurred. Risks may arise from changes in market value of the underlying currencies and from the possible inability of counterparties to meet the terms of their contracts.
Open forward foreign currency contracts at April 30, 2006, are listed in the Schedule of Investments.
Swap agreements: The Fund may enter into swap agreements to manage its exposure to interest rates and credit risk. Interest rate swap agreements involve commitments to pay/receive interest in exchange for a market-linked return, both based on notional amounts. In a credit default swap, one party makes a stream of payments to another party in exchange for the right to receive a specified return in the event of a default by a third party, typically corporate issues or sovereign issues of an emerging country, on its obligation. The portfolio may use credit default swaps to provide a measure of protection against defaults of sovereign issuers (i.e., to reduce risk where the portfolio owns or has exposure to the sovereign issuer) or to take an active long or short position with respect to the likelihood of a particular issuer's default.
Entering into these agreements involves elements of credit, market and documentation risk in excess of the amounts recognized on the Statement of Assets and Liabilities. Such risks involve the possibility that there will be no liquid market for these agreements, that the counterparty to the agreements may default on its obligation to perform or disagree as to the meaning of contractual terms in the agreements, and that there may be unfavorable changes in interest rates.
Swaps are marked to market daily based upon quotations from market makers and vendors and the change in value, if any, is recorded as unrealized gain or loss in the Statement of Operations. Payments received or made at the beginning of the measurement period are reflected as such on the Statement of Assets and Liabilities. A liquidation payment received or made at the termination of the swap is recorded as realized gain or loss in the Statement of Operations. Net periodic payments are included as part of realized gain or loss on the Statement of Operations.
Open swaps agreements at April 30, 2006, are listed in the Schedule of Investments.
Futures contracts: The Fund may enter into futures contracts to manage exposure to market, interest rate or currency fluctuations. Futures contracts are valued at the settlement price established each day by the board of trade or exchange on which they are traded. The primary risks associated with futures contracts are imperfect correlation between the change in market value of the securities held and the prices of futures contracts; the possibility of an illiquid market and inability of the counterparty to meet the contract terms.
The underlying face amounts of open futures contracts at April 30, 2006, are listed in the Schedule of Investments. The variation margin receivable or payable, as applicable, is included in the Statement of Assets and Liabilities. Variation margin represents the additional
Transamerica IDEX Mutual Funds
Semi-Annual Report 2006
17
TA IDEX PIMCO Total Return
NOTES TO FINANCIAL STATEMENTS (continued)
At April 30, 2006
(all amounts in thousands)
(unaudited)
NOTE 1.–(continued)
payment due or excess deposits made in order to maintain the equity account at the required margin level.
Option contracts: The Fund may enter into options contracts to manage exposure to market fluctuations. Options are valued at the average of the bid and ask ("Mean Quote") established each day at the close of the board of trade or exchange on which they are traded. The primary risks associated with options are imperfect correlation between the change in value of the securities held and the prices of the options contracts; the possibility of an illiquid market and inability of the counterparty to meet the contracts terms. When the Fund writes a covered call or put option, an amount equal to the premium received by the Fund is included in the Fund's Statement of Assets and Liabilities as an asset and as an equivalent liability. Options are marked-to-market daily to reflect the current value of the option written.
Transactions in written options were as follows:
| Premium | Contracts* | ||||||||||
| Beginning Balance October 31, 2005 | $ | 37 | 132 | ||||||||
| Sales | 33 | 62 | |||||||||
| Closing Buys | (24 | ) | (90 | ) | |||||||
| Expirations | (19 | ) | (66 | ) | |||||||
| Exercised | – | – | |||||||||
| Balance at April 30, 2006 | $ | 27 | 38 | ||||||||
* Contracts not in thousands
Swaptions contracts: The Fund is authorized to write swaption contracts to manage exposure to fluctuations in interest rates and to enhance fund yield. Swaption contracts written by the Fund represent an option that gives the purchaser the right, but not the obligation, to enter into a previously agreed upon swap contract on a future date. If a written call option is exercised, the writer will enter a swap and is obligated to pay the fixed rate and receive a variable rate in exchange. Swaptions are marked-to-market daily based upon quotations from market makers.
When the Fund writes a swaption, the premium received is recorded as a liability and is subsequently adjusted to the current value of the swaption. Changes in the value of the swaption are reported as Unrealized gains or losses in written options in the Statement of Assets and Liabilities. Gain or loss is recognized when the swaption contract expires or is closed. Premiums received from writing swaptions that expire or are exercised are treated by the Fund as realized gains from written options. The difference between the premium and the amount paid on affecting a closing purchase transaction is treated as a realized gain or loss.
Transactions in written swaptions were as follows:
| Premium | Notional Amount | ||||||||||
| Beginning Balance October 31, 2005 | $ | 196 | 20,000 | ||||||||
| Sales | 61 | 12,300 | |||||||||
| Closing Buys | (67 | ) | (9,000 | ) | |||||||
| Expirations | – | – | |||||||||
| Exercised | – | – | |||||||||
| Balance at April 30, 2006 | $ | 190 | 23,300 | ||||||||
Redemption fees: A short-term trading redemption fee may be assessed on any Fund shares in a fund account that are sold during the first five (5) NYSE trading days following their purchase date. This redemption fee will equal 2% of the amount redeemed and shares held the longest will be treated as being redeemed first and shares held the shortest as being redeemed last. For the six months ended April 30, 2006, the Fund received less than $1 in redemption fees.
Dividend distributions: Distributions to shareholders are recorded on the ex-dividend date and are determined in accordance with Federal income tax regulations which may differ from GAAP.
NOTE 2. RELATED PARTY TRANSACTIONS
Transamerica Fund Advisors, Inc. ("TFAI") is the Fund's investment adviser. Transamerica Fund Services, Inc. ("TFS") is the Fund's administrator and transfer agent. AFSG Securities Corp. ("AFSG") is the Fund's distributor/principal underwriter. TFAI, TFS, and AFSG are affiliates of AEGON, NV, a Netherlands corporation.
Certain officers and trustees of the Fund are also officers and/or directors of TFAI, TFS and AFSG.
The following schedule reflects the percentage of Fund assets owned by affiliated investment companies at April 30, 2006:
| Net Assets | % of Net Assets | ||||||||||
| TA IDEX Asset Allocation– Conservative Portfolio | $ | 30,852 | 13.64 | % | |||||||
| TA IDEX Asset Allocation– Moderate Portfolio | 103,235 | 45.65 | % | ||||||||
| TA IDEX Asset Allocation– Moderate Growth Portfolio | 62,126 | 27.47 | % | ||||||||
| Total | $ | 196,213 | 86.76 | % | |||||||
Transamerica IDEX Mutual Funds
Semi-Annual Report 2006
18
TA IDEX PIMCO Total Return
NOTES TO FINANCIAL STATEMENTS (continued)
At April 30, 2006
(all amounts in thousands)
(unaudited)
NOTE 2.–(continued)
Investment advisory fees: The Fund pays management fees to TFAI based on average daily net assets ("ANA") at the following breakpoints:
0.70% of the first $250 million of ANA
0.65% of the next $500 million of ANA
0.60% of ANA over $750 million
TFAI has contractually agreed to waive its advisory fee and will reimburse the Fund to the extent that operating expenses, excluding 12b-1 fees, exceed the following stated annual limit:
1.30% Expense Limit
If total Fund expenses fall below the annual expense limitation agreement agreed to by the adviser within the succeeding three years, the Fund may be required to pay the adviser a portion or all of the reimbursed class expenses.
There are no amounts available for recapture at April 30, 2006.
Distribution and service fees: The Fund has a 12b-1 distribution plan under the 1940 Act pursuant to which an annual fee, based on average daily net assets, is paid to the distributor for various disbursements such as broker-dealer account servicing fees and other promotional expenses of the Fund. The Fund is authorized under the 12b-1 plan to pay fees on each class up to the following limits:
| Class A | 0.35 | % | |||||
| Class B | 1.00 | % | |||||
| Class C | 1.00 | % | |||||
| Class I | N/A | ||||||
From February 28, 2006 through March 1, 2007, the Fund will not pay 12b-1 fees under these plans.
Underwriter commissions relate to front-end sales charges imposed for Class A shares and contingent deferred sales charges from Classes B, C, and certain A share redemptions. For the six months ended April 30, 2006, the underwriter commissions were as follows:
| Received by Underwriter | $ | 3 | |||||
| Retained by Underwriter | 1 | ||||||
| Contingent Deferred Sales Charge | 6 | ||||||
Administrative services: The Fund has entered into an agreement with TFS for financial and legal fund administration services. The Fund pays TFS an annual fee of 0.02% of ANA. The Legal fees on the Statement of Operations are fees paid to external legal counsel.
Transfer agent fees: The Fund pays TFS an annual per-account charge for each open and closed account. The Fund paid TFS $42 for the six months ended April 30, 2006.
Deferred compensation plan: Each eligible independent Fund Trustee may elect to participate in a non-qualified deferred compensation plan maintained by Transamerica IDEX Mutual Funds (the "Plan"). Under the Plan, such Trustees may defer payment of all or a portion of their total fees earned as a Fund Trustee. Each Trustee who is a participant in the Plan may elect that the earnings, losses or gains credited to his or her deferred fee amounts be determined based on a deemed investment in any series of Transamerica IDEX Mutual Funds, including the Fund. The right of a participant to receive a distribution from the Plan of the deferred fees is an unsecured claim against the general assets of all series of Transamerica IDEX Mutual Funds. The pro rata liability to the Fund of all deferred fees in the Plan amounted, as of April 30, 2006, to $6.
NOTE 3. INVESTMENT TRANSACTIONS
The cost of securities purchased and proceeds from securities sold (excluding short-term securities) for the six months ended April 30, 2006 were as follows:
| Purchases of securities: | |||||||
| Long-Term | $ | 70,793 | |||||
| U.S. Government | 465,913 | ||||||
| Proceeds from maturities and sales of securities: | |||||||
| Long-Term | 41,979 | ||||||
| U.S. Government | 441,507 | ||||||
NOTE 4. FEDERAL INCOME TAX MATTERS
The Fund has not made any provision for federal income or excise taxes due to its policy to distribute all of its taxable income and capital gains to its shareholders and otherwise qualify as a regulated investment company under Subchapter M of the Internal Revenue Code. Income and capital gain distributions are determined in accordance with income tax regulations, which may differ from GAAP. These differences are primarily due to differing treatment for items including, but not limited to, wash sales, capital loss carryforwards, swap contracts, distribution reclassifications, futures, options and foreign currency transactions.
The capital loss carryforward is available to offset future realized capital gains through the periods listed:
| Capital Loss Carryforward | Available through | ||||||
| $ | 203 | October 31, 2013 | |||||
Transamerica IDEX Mutual Funds
Semi-Annual Report 2006
19
TA IDEX PIMCO Total Return
NOTES TO FINANCIAL STATEMENTS (continued)
At April 30, 2006
(all amounts in thousands)
(unaudited)
NOTE 5. REGULATORY PROCEEDINGS
There continues to be significant federal and state regulatory activity relating to financial services companies, particularly mutual fund companies and their investment advisers. As part of an ongoing investigation regarding potential market timing, recordkeeping and trading compliance issues and matters affecting the Fund's investment adviser, TFAI, and certain affiliates and former employees of TFAI, the SEC staff has indicated that it is likely to take some action against TFAI and certain of its affiliates at the conclusion of the investigation. The potential timing and the scope of any such action is difficult to predict. Although the impact of any action brought against TFAI and/or its affiliates is difficult to assess at the present time, the Fund currently believes that the likelihood that any such action will have a material adverse impact on it is remote. It is important to note that the Fund is not aware of any allega tion of wrongdoing against it and its Board at the time this semi-annual report is printed. Although it is not anticipated that these developments will have an adverse impact on the Fund, there can be no assurance at this time. TFAI and its affiliates are actively working with the SEC in regard to this matter; however, the exact resolution cannot be determined at this time. TFAI will take such actions that it deems necessary or appropriate to continue providing management services to the Fund and to bring all matters to an appropriate conclusion.
TFAI and/or its affiliates, and not the Fund, will bear the costs regarding these regulatory matters.
Transamerica IDEX Mutual Funds
Semi-Annual Report 2006
20
TA IDEX PIMCO Total Return
INVESTMENT ADVISORY AND SUB-ADVISORY AGREEMENTS – REVIEW AND RENEWAL (unaudited)
At a meeting of the Board of Trustees of Transamerica IDEX Mutual Funds ("TA IDEX") held on November 2, 2005, the Board reviewed and considered the Investment Advisory Agreement between TA IDEX PIMCO Total Return (the "Fund") and Transamerica Fund Advisors, Inc. ("TFAI"), as well as the Investment Sub-Advisory Agreement of the Fund between TFAI and Pacific Investment Management Company LLC (the "Sub-Adviser"), to determine whether the agreements should be renewed for a one-year period. Following their review and consideration, the Trustees determined that the Investment Advisory Agreement and the Investment Sub-Advisory Agreement will enable shareholders of the Fund to obtain high quality services at a cost that is appropriate, reasonable, and in the best interests of its shareholders. The Board, including the independent members of the Board, unanimously approved the renewal of the Investment Advisory Agreement and the Investme nt Sub-Advisory Agreement. In reaching their decision, the Trustees requested and obtained from TFAI and the Sub-Adviser such information as they deemed reasonably necessary to evaluate the proposed agreements. The Trustees also carefully considered the information that they had received throughout the year from TFAI and the Sub-Adviser (such as in-person presentations by the Sub-Adviser) as part of their regular oversight of the Fund, as well as: comparative fee, transfer agency, expense and performance information prepared by Lipper Inc. ("Lipper"), independent providers of mutual fund performance, fee and expense information, and profitability data. In considering the proposed continuation of the Investment Advisory Agreement and the Investment Sub-Advisory Agreement, the Trustees evaluated a number of considerations that they believe, in light of the legal advice furnished to them by TA IDEX counsel and independent legal counsel and their own business judgment, to be relevant. They based their decisions on the following considerations, among others, although they did not identify any consideration or particular information that was controlling of their decisions:
The nature, extent and quality of the advisory service to be provided. The Board considered the nature and quality of the services provided by TFAI and the Sub-Adviser to the Fund in the past, as well as the services anticipated to be provided in the future. The Board concluded that TFAI and the Sub-Adviser are capable of providing high quality services to the Fund, as indicated by the nature and quality of services provided in the past, TFAI's and the Sub-Adviser's management capabilities demonstrated with respect to the funds they manage, including the Fund, and the experience, capability and integrity of TFAI's senior management, the financial resources of TFAI and the Sub-Adviser, TFAI's management oversight process and the professional qualifications and experience of the Sub-Adviser's portfolio management team. The Trustees also concluded that T FAI and the Sub-Adviser proposed to provide investment and related services that were of the same quality and quantity as services provided to the Fund in the past, and that these services are appropriate in scope and extent in light of the Fund's operations, the competitive landscape of the investment company business and investor needs, and that TFAI's and the Sub-Adviser's obligations will remain substantially the same.
The investment performance of the Fund. The Board examined both the short-term and longer-term performance of the Fund, including relative performance against a benchmark securities index and a peer group of comparable mutual funds as prepared by Lipper, for various trailing periods ended June 30, 2005. The Trustees concluded that TFAI and the Sub-Adviser generally had achieved acceptable investment performance, noting that although the performance of the Fund has been trailing the benchmark index over the past one-, two- and three-year periods, its performance has been at median relative to its peers over the past one-, two- and three-year periods. On the basis of the Trustees' assessment of the nature, extent and quality of advisory services to be provided or procured by TFAI and the Sub-Adviser, the Trustees concluded that TFAI and the Sub-Adviser are capable of generating a level of investment performance that is appropriate in light of the Fund's investment objective, policies and strategies and competitive with many other investment companies, and also determined that TFAI's and the Sub-Adviser's performance records indicate that their continued management is likely to benefit the Fund and its shareholders.
The cost of advisory services provided and the level of profitability. The Board reviewed profitability information regarding TFAI's costs of procuring portfolio management services, as well as the costs of provision of administration, transfer agency, fund accounting and other services, to the Fund and to TA IDEX as a whole by TFAI and its affiliates. The Trustees reviewed data from Lipper that compared the Fund's management fees (including management fees at various asset levels), other fees and expenses (including total expenses including and excluding 12b-1 distribution and service fees) and portfolio turnover rate against a peer group of comparable mutual funds. Based on such information, the Trustees determined that the management fees and overall expense ratio of the Fund generally are consistent with industry averages. In addition, on the basi s of the Board's review of the management fees to be charged by TFAI for investment advisory and related services, TFAI profitability information (derived from TFAI's audited financial statements), TFAI's estimated management income resulting from its management of the Fund, the estimated margin of the Sub-Adviser, as well as the entirety of TFAI's and its affiliates' service relationship with TA IDEX, the Board concluded that the level of investment management fees and other service fees, as well as TFAI's and the Sub-Adviser's profitability, are appropriate in light of the
Transamerica IDEX Mutual Funds
Semi-Annual Report 2006
21
TA IDEX PIMCO Total Return (continued)
services provided, the management fees and overall expense ratios of comparable investment companies and the anticipated profitability of the relationship between the Fund, TFAI and its affiliates, and the Sub-Adviser.
Whether fee levels reflect economies of scale and the extent to which economies of scale would be realized as the Fund grows. The Board concluded that the inclusion of asset-based breakpoints in the Fund's advisory fee schedule appropriately benefits investors by realizing economies of scale in the form of lower management fees as the level of assets grows, notwithstanding the absence of asset-based breakpoints in the Fund's sub-advisory fees. The Board noted that the Fund is closed to new investors and will be closed to new investments in the near future, except that the Fund may continue selling shares to other TA IDEX funds and other investment companies in the same group of investment companies as TA IDEX, which may limit, to an extent, the ability of the Fund to realize economies of scale. In addition, the Board assessed the current asset levels of the Fund and the long-term development strategy for the Fund, including continued investments by the TA IDEX asset allocation funds, and concluded that the Fund's current management fees appropriately reflect the Fund's current size, the current economic environment for TFAI, the competitive nature of the investment company market, and TFAI's pricing strategy. The Trustees also concluded that they will have the opportunity to periodically reexamine whether the Fund has achieved economies of scale, and the appropriateness of management fees payable to TFAI and fees payable by TFAI to the Sub-Adviser, in the future.
Benefits (such as soft dollars) to TFAI, its affiliates, or the Sub-Adviser from their relationship with the Fund. The Board concluded that other benefits derived by TFAI, its affiliates, and the Sub-Adviser from their relationship with the Fund are reasonable and fair, and are consistent with industry practice and the best interests of the Fund and its shareholders. In this regard, the Board noted that neither TFAI nor the Sub-Adviser realizes "soft dollar" benefits from its relationship with the Fund. In addition, the Trustees determined that the administration, transfer agency, fund accounting and other fees paid by the Fund to affiliates of TFAI are reasonable, fair and in the best interests of shareholders in light of the nature and quality of the services provided, the associated costs to these affiliates of providing the services, the impact of the costs of such services on the Fund's overall operating expenses, and the necessity of the services for the Fund's operations.
Other considerations. The Board determined that TFAI had made a substantial commitment to the recruitment and retention of high quality personnel, and maintained the financial, compliance and operational resources reasonably necessary to manage the Fund in a professional manner that is consistent with the best interests of the Fund and its shareholders. In this regard, the Trustees favorably considered the procedures and policies in place by TFAI to enforce compliance with applicable laws and regulations and oversee the portfolio management activities of the Sub-Adviser. The Trustees also determined that TFAI had made a significant entrepreneurial commitment to the management and success of the Fund, reflected by TFAI's expense limitation and fee waiver arrangement with the Fund, which may result in TFAI waiving advisory fees for the benefit of shareh olders.
Transamerica IDEX Mutual Funds
Semi-Annual Report 2006
22
TA IDEX Protected Principal Stock
UNDERSTANDING YOUR FUND'S EXPENSES
(unaudited)
SHAREHOLDER EXPENSES
Fund shareholders may incur two types of costs: (1) transaction costs, including sales charges (loads) on purchases, contingent deferred sales charges on redemptions and redemption fees; and (2) ongoing costs, including management fees, 12b-1 distribution and service fees, and other fund expenses.
The following Example is intended to help you understand your ongoing costs (in dollars and cents) of investing in the Fund and to compare these costs with the ongoing costs of investing in other funds.
The Example is based on an investment of $1,000 invested at November 1, 2005 and held for the entire period until April 30, 2006.
ACTUAL EXPENSES
The first line in the table below provides information about actual account values and actual expenses. You may use the information in this line, together with the amount you invested, to estimate the expenses that you paid over the period. Simply divide your account value by $1,000 (for example, an $8,600 account value divided by $1,000 = 8.6), then multiply the result by the number in the first line of your Fund under the heading entitled "Expenses Paid During Period" to estimate the expenses you paid on your account during this period. If your account is an IRA, your expenses could have included a $15 annual fee. The amount of any fee paid through your account would increase the estimate of expenses you paid during the period and decrease your ending account value.
HYPOTHETICAL EXAMPLE FOR COMPARISON PURPOSES
The second line in the table below provides information about hypothetical account values and hypothetical expenses based on the Fund's actual expense ratio and an assumed rate of return of 5% per year before expenses, which is not the Fund's actual return. The hypothetical account values and expenses may not be used to estimate the actual ending account balance or expenses you paid for the period. You may use this information to compare the ongoing costs of investing in your Fund and other funds. To do so, compare this 5% hypothetical example with the 5% hypothetical examples that appear in the shareholder reports of the other funds. As in the case of the actual expense example, if your account is subject to an IRA fee, the amount of the fee paid through your account would increase the hypothetical expenses you would have paid during the period and decrease the hypothetical ending account value.
Please note that the expenses shown in the table are meant to highlight your ongoing costs only and do not reflect any transactional costs, such as sales charges, redemption fees, brokerage commissions paid on purchases and sales of fund shares. Therefore, the second line under the Fund in the table is useful in comparing ongoing costs only, and will not help you determine the relative total costs of owning different funds. If any of these transaction costs were included, your costs would be higher. The expenses shown in the table do not reflect any fees that may be charged to you by brokers, financial intermediaries or other financial institutions.
| Beginning Account Value | Ending Account Value | Annualized Expense Ratio | Expenses Paid During Period (a) | ||||||||||||||||
| Class A | |||||||||||||||||||
| Actual | $ | 1,000.00 | $ | 1,049.80 | 1.95 | % | $ | 9.91 | |||||||||||
| Hypothetical (b) | 1,000.00 | 1,015.12 | 1.95 | 9.74 | |||||||||||||||
| Class B | |||||||||||||||||||
| Actual | 1,000.00 | 1,046.70 | 2.60 | 13.19 | |||||||||||||||
| Hypothetical (b) | 1,000.00 | 1,011.90 | 2.60 | 12.97 | |||||||||||||||
| Class C | |||||||||||||||||||
| Actual | 1,000.00 | 1,046.80 | 2.60 | 13.19 | |||||||||||||||
| Hypothetical (b) | 1,000.00 | 1,011.90 | 2.60 | 12.97 | |||||||||||||||
| Class M | |||||||||||||||||||
| Actual | 1,000.00 | 1,046.70 | 2.53 | 12.84 | |||||||||||||||
| Hypothetical (b) | 1,000.00 | 1,012.25 | 2.53 | 12.62 | |||||||||||||||
(a) Expenses are calculated using the Fund's annualized expense ratio (as disclosed in the table), multiplied by the average account value for the period, multiplied by number of days in the period (181 days), and divided by the number of days in the year (365 days).
(b) 5% return per year before expenses.
GRAPHICAL PRESENTATION OF SCHEDULE OF INVESTMENTS
By Sector
At April 30, 2006
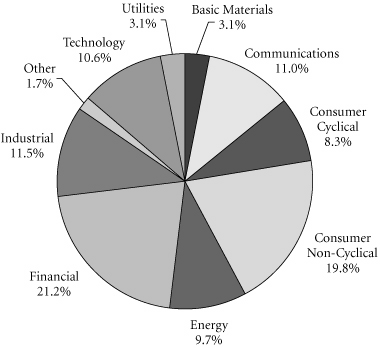
This chart shows the percentage breakdown by sector of the Fund's total investment securities.
Transamerica IDEX Mutual Funds
Semi-Annual Report 2006
1
TA IDEX Protected Principal Stock
SCHEDULE OF INVESTMENTS
At April 30, 2006
(all amounts except share amounts in thousands)
(unaudited)
| Shares | Value | ||||||||||
| COMMON STOCKS (98.8%) l | |||||||||||
| Aerospace (1.8%) | |||||||||||
| Boeing Co. (The) | 3,000 | $ | 250 | ||||||||
| General Dynamics Corp. | 1,400 | 92 | |||||||||
| Goodrich Corp. | 500 | 22 | |||||||||
| Lockheed Martin Corp. | 1,300 | 99 | |||||||||
| Northrop Grumman Corp. | 1,270 | 85 | |||||||||
| Textron, Inc. | 500 | 45 | |||||||||
| United Technologies Corp. | 3,600 | 226 | |||||||||
| Air Transportation (0.4%) | |||||||||||
| FedEx Corp. | 1,100 | 127 | |||||||||
| Southwest Airlines Co. | 2,500 | 41 | |||||||||
| Amusement & Recreation Services (0.6%) | |||||||||||
| Disney (Walt) Co. (The) | 7,400 | 207 | |||||||||
| Harrah's Entertainment, Inc. | 700 | 57 | |||||||||
| Apparel & Accessory Stores (0.4%) | |||||||||||
| Gap (The), Inc. | 2,000 | 36 | |||||||||
| Kohl's Corp. ‡ | 1,100 | 61 | |||||||||
| Limited Brands, Inc. | 1,100 | 28 | |||||||||
| Nordstrom, Inc. | 900 | 35 | |||||||||
| Apparel Products (0.2%) | |||||||||||
| Cintas Corp. | 500 | 21 | |||||||||
| Jones Apparel Group, Inc. | 500 | 17 | |||||||||
| Liz Claiborne, Inc. | 400 | 16 | |||||||||
| V.F. Corp. | 400 | 24 | |||||||||
| Auto Repair, Services & Parking (0.0%) | |||||||||||
| Ryder System, Inc. | 200 | 10 | |||||||||
| Automotive (0.6%) | |||||||||||
| Ford Motor Co. | 7,200 | 50 | |||||||||
| General Motors Corp. | 2,100 | 48 | |||||||||
| Genuine Parts Co. | 700 | 31 | |||||||||
| Harley-Davidson, Inc. | 1,000 | 51 | |||||||||
| ITT Industries, Inc. | 700 | 39 | |||||||||
| Navistar International Corp. ‡ | 200 | 5 | |||||||||
| PACCAR, Inc. | 700 | 50 | |||||||||
| Automotive Dealers & Service Stations (0.1%) | |||||||||||
| AutoNation, Inc. ‡ | 750 | 17 | |||||||||
| AutoZone, Inc. ‡ | 200 | 19 | |||||||||
| Beverages (2.0%) | |||||||||||
| Anheuser-Busch Cos., Inc. | 2,900 | 129 | |||||||||
| Brown-Forman Corp.–Class B | 300 | 22 | |||||||||
| Coca-Cola Co. (The) | 7,800 | 327 | |||||||||
| Coca-Cola Enterprises, Inc. | 1,100 | 21 | |||||||||
| Constellation Brands, Inc.–Class A ‡ | 800 | 20 | |||||||||
| Shares | Value | ||||||||||
| Beverages (continued) | |||||||||||
| Molson Coors Brewing Co.–Class B | 200 | $ | 15 | ||||||||
| Pepsi Bottling Group, Inc. | 500 | 16 | |||||||||
| PepsiCo, Inc. | 6,200 | 361 | |||||||||
| Business Credit Institutions (0.4%) | |||||||||||
| CIT Group, Inc. | 800 | 43 | |||||||||
| Freddie Mac | 2,600 | 159 | |||||||||
| Business Services (1.7%) | |||||||||||
| Cendant Corp. | 3,600 | 63 | |||||||||
| Clear Channel Communications, Inc. | 1,800 | 51 | |||||||||
| Convergys Corp. ‡ | 600 | 12 | |||||||||
| eBay, Inc. ‡ | 4,100 | 141 | |||||||||
| Equifax, Inc. | 500 | 19 | |||||||||
| Fannie Mae | 3,600 | 182 | |||||||||
| First Data Corp. | 2,795 | 133 | |||||||||
| Interpublic Group of Cos., Inc. ‡ | 1,400 | 13 | |||||||||
| Monster Worldwide, Inc. ‡ | 500 | 29 | |||||||||
| Moody's Corp. | 900 | 56 | |||||||||
| Omnicom Group, Inc. | 700 | 63 | |||||||||
| Robert Half International, Inc. | 700 | 30 | |||||||||
| Chemicals & Allied Products (3.5%) | |||||||||||
| Air Products & Chemicals, Inc. | 900 | 62 | |||||||||
| Alberto Culver Co.–Class B | 300 | 13 | |||||||||
| Avon Products, Inc. | 1,500 | 49 | |||||||||
| Clorox Co. | 600 | 39 | |||||||||
| Colgate-Palmolive Co. | 1,800 | 106 | |||||||||
| Dow Chemical Co. (The) | 3,600 | 146 | |||||||||
| du Pont (E.I.) de Nemours & Co. | 3,500 | 154 | |||||||||
| Eastman Chemical Co. | 300 | 16 | |||||||||
| Ecolab, Inc. | 700 | 26 | |||||||||
| International Flavors & Fragrances, Inc. | 300 | 11 | |||||||||
| Lauder (Estee) Cos., Inc. (The)–Class A | 450 | 17 | |||||||||
| Monsanto Co. | 971 | 81 | |||||||||
| PPG Industries, Inc. | 700 | 47 | |||||||||
| Praxair, Inc. | 1,200 | 67 | |||||||||
| Procter & Gamble Co. | 12,302 | 716 | |||||||||
| Rohm & Haas Co. | 600 | 30 | |||||||||
| Sherwin-Williams Co. (The) | 400 | 20 | |||||||||
| Commercial Banks (10.0%) | |||||||||||
| AmSouth Bancorp | 1,100 | 32 | |||||||||
| Bank of America Corp. | 17,522 | 875 | |||||||||
| Bank of New York Co., Inc. (The) | 2,900 | 102 | |||||||||
| BB&T Corp. | 1,900 | 82 | |||||||||
| Citigroup, Inc. | 18,800 | 939 | |||||||||
| Comerica, Inc. | 700 | 40 | |||||||||
| Compass Bancshares, Inc. | 500 | 27 | |||||||||
The notes to the financial statements are an integral part of this report.
Transamerica IDEX Mutual Funds
Semi-Annual Report 2006
2
TA IDEX Protected Principal Stock
SCHEDULE OF INVESTMENTS (continued)
At April 30, 2006
(all amounts except share amounts in thousands)
(unaudited)
| Shares | Value | ||||||||||
| Commercial Banks (continued) | |||||||||||
| Fifth Third Bancorp | 1,900 | $ | 77 | ||||||||
| First Horizon National Corp. | 500 | 21 | |||||||||
| Huntington Bancshares, Inc. | 900 | 22 | |||||||||
| JP Morgan Chase & Co. | 13,048 | 592 | |||||||||
| KeyCorp | 1,300 | 50 | |||||||||
| M&T Bank Corp. | 300 | 36 | |||||||||
| Marshall & IIsley Corp. | 800 | 37 | |||||||||
| Mellon Financial Corp. | 1,400 | 53 | |||||||||
| National City Corp. | 1,900 | 70 | |||||||||
| North Fork Bancorp, Inc. | 1,600 | 48 | |||||||||
| Northern Trust Corp. | 700 | 41 | |||||||||
| PNC Financial Services Group, Inc. | 1,100 | 79 | |||||||||
| Regions Financial Corp. | 1,681 | 61 | |||||||||
| State Street Corp. | 1,200 | 78 | |||||||||
| SunTrust Banks, Inc. | 1,300 | 101 | |||||||||
| Synovus Financial Corp. | 1,100 | 31 | |||||||||
| US Bancorp | 6,800 | 214 | |||||||||
| Wachovia Corp. | 6,202 | 371 | |||||||||
| Wells Fargo & Co. | 6,300 | 433 | |||||||||
| Zions Bancorp | 400 | 33 | |||||||||
| Communication (0.6%) | |||||||||||
| Comcast Corp.–Class A ‡ | 8,119 | 251 | |||||||||
| Communications Equipment (2.1%) | |||||||||||
| ADC Telecommunications, Inc. ‡ | 442 | 10 | |||||||||
| Andrew Corp. ‡ | 600 | 6 | |||||||||
| Avaya, Inc. ‡ | 1,400 | 17 | |||||||||
| CIENA Corp. ‡ | 2,000 | 8 | |||||||||
| Comverse Technology, Inc. ‡ | 800 | 18 | |||||||||
| Corning, Inc. ‡ | 5,900 | 163 | |||||||||
| L-3 Communications Holdings, Inc. | 500 | 41 | |||||||||
| Lucent Technologies, Inc. ‡ | 16,900 | 47 | |||||||||
| Motorola, Inc. | 9,300 | 199 | |||||||||
| Network Appliance, Inc. ‡ | 1,200 | 44 | |||||||||
| QUALCOMM, Inc. | 6,200 | 318 | |||||||||
| Rockwell Collins, Inc. | 700 | 40 | |||||||||
| Tellabs, Inc. ‡ | 1,500 | 24 | |||||||||
| Computer & Data Processing Services (5.1%) | |||||||||||
| Adobe Systems, Inc. ‡ | 2,100 | 82 | |||||||||
| Affiliated Computer Services, Inc.–Class A ‡ | 450 | 25 | |||||||||
| Autodesk, Inc. ‡ | 900 | 38 | |||||||||
| Automatic Data Processing, Inc. | 2,000 | 88 | |||||||||
| BMC Software, Inc. ‡ | 900 | 19 | |||||||||
| CA, Inc. | 1,500 | 38 | |||||||||
| Citrix Systems, Inc. ‡ | 700 | 28 | |||||||||
| Computer Sciences Corp. ‡ | 700 | 41 | |||||||||
| Shares | Value | ||||||||||
| Computer & Data Processing Services (continued) | |||||||||||
| Compuware Corp. ‡ | 1,200 | $ | 9 | ||||||||
| Electronic Arts, Inc. ‡ | 1,100 | 62 | |||||||||
| Electronic Data Systems Corp. | 1,800 | 49 | |||||||||
| Fiserv, Inc. ‡ | 700 | 32 | |||||||||
| Google, Inc.–Class A ‡ | 800 | 334 | |||||||||
| IMS Health, Inc. | 800 | 22 | |||||||||
| Intuit, Inc. ‡ | 700 | 38 | |||||||||
| Microsoft Corp. | 33,550 | 810 | |||||||||
| NCR Corp. ‡ | 700 | 28 | |||||||||
| Novell, Inc. ‡ | 1,400 | 12 | |||||||||
| Oracle Corp. ‡ | 14,356 | 209 | |||||||||
| Parametric Technology Corp. ‡ | 440 | 7 | |||||||||
| Sabre Holdings Corp. | 500 | 12 | |||||||||
| Sun Microsystems, Inc. ‡ | 12,900 | 65 | |||||||||
| Symantec Corp. ‡ | 3,623 | 59 | |||||||||
| Unisys Corp. ‡ | 1,100 | 7 | |||||||||
| VeriSign, Inc. ‡ | 1,000 | 24 | |||||||||
| Yahoo!, Inc. ‡ | 4,900 | 161 | |||||||||
| Computer & Office Equipment (4.5%) | |||||||||||
| Apple Computer, Inc. ‡ | 3,100 | 218 | |||||||||
| Cisco Systems, Inc. ‡ | 22,800 | 478 | |||||||||
| Dell, Inc. ‡ | 8,800 | 231 | |||||||||
| EMC Corp. ‡ | 9,000 | 122 | |||||||||
| Gateway, Inc. ‡ | 1,000 | 2 | |||||||||
| Hewlett-Packard Co. | 10,800 | 351 | |||||||||
| International Business Machines Corp. | 6,100 | 502 | |||||||||
| Jabil Circuit, Inc. ‡ | 700 | 27 | |||||||||
| Lexmark International, Inc. ‡ | 500 | 24 | |||||||||
| Pitney Bowes, Inc. | 900 | 38 | |||||||||
| Sandisk Corp. ‡ | 500 | 32 | |||||||||
| Symbol Technologies, Inc. | 1,005 | 11 | |||||||||
| Construction (0.2%) | |||||||||||
| Centex Corp. | 500 | 28 | |||||||||
| Fluor Corp. | 300 | 28 | |||||||||
| KB Home | 300 | 18 | |||||||||
| Pulte Homes, Inc. | 900 | 34 | |||||||||
| Department Stores (0.4%) | |||||||||||
| Dillard's, Inc.–Class A | 200 | 5 | |||||||||
| Federated Department Stores, Inc. | 1,142 | 89 | |||||||||
| JC Penney Co., Inc. | 900 | 59 | |||||||||
| TJX Cos., Inc. | 1,700 | 41 | |||||||||
| Diversified (0.3%) | |||||||||||
| Honeywell International, Inc. | 3,100 | 132 | |||||||||
The notes to the financial statements are an integral part of this report.
Transamerica IDEX Mutual Funds
Semi-Annual Report 2006
3
TA IDEX Protected Principal Stock
SCHEDULE OF INVESTMENTS (continued)
At April 30, 2006
(all amounts except share amounts in thousands)
(unaudited)
| Shares | Value | ||||||||||
| Drug Stores & Proprietary Stores (0.5%) | |||||||||||
| CVS Corp. | 3,000 | $ | 89 | ||||||||
| Walgreen Co. | 3,600 | 151 | |||||||||
| Educational Services (0.1%) | |||||||||||
| Apollo Group, Inc.–Class A ‡ | 600 | 33 | |||||||||
| Electric Services (2.1%) | |||||||||||
| AES Corp. (The) ‡ | 2,300 | 39 | |||||||||
| Allegheny Energy, Inc. ‡ | 600 | 21 | |||||||||
| American Electric Power Co., Inc. | 1,300 | 44 | |||||||||
| CenterPoint Energy, Inc. | 1,100 | 13 | |||||||||
| CMS Energy Corp. ‡ | 900 | 12 | |||||||||
| Consolidated Edison, Inc. | 1,000 | 43 | |||||||||
| Constellation Energy Group, Inc. | 700 | 38 | |||||||||
| Dominion Resources, Inc. | 1,100 | 82 | |||||||||
| DTE Energy Co. | 700 | 29 | |||||||||
| Duke Energy Corp. | 4,748 | 138 | |||||||||
| Edison International | 1,200 | 48 | |||||||||
| FirstEnergy Corp. | 1,200 | 61 | |||||||||
| FPL Group, Inc. | 1,300 | 51 | |||||||||
| Pinnacle West Capital Corp. | 400 | 16 | |||||||||
| PPL Corp. | 1,200 | 35 | |||||||||
| Progress Energy, Inc. | 1,000 | 43 | |||||||||
| Sempra Energy | 1,000 | 46 | |||||||||
| Southern Co. (The) | 2,800 | 90 | |||||||||
| TECO Energy, Inc. | 800 | 13 | |||||||||
| TXU Corp. | 1,600 | 79 | |||||||||
| Xcel Energy, Inc. | 1,300 | 25 | |||||||||
| Electric, Gas & Sanitary Services (1.0%) | |||||||||||
| Allied Waste Industries, Inc. ‡ | 900 | 13 | |||||||||
| Ameren Corp. | 800 | 40 | |||||||||
| Entergy Corp. | 800 | 56 | |||||||||
| Exelon Corp. | 2,500 | 135 | |||||||||
| NiSource, Inc. | 1,000 | 21 | |||||||||
| PG&E Corp. | 1,100 | 44 | |||||||||
| Public Service Enterprise Group, Inc. | 1,000 | 63 | |||||||||
| Waste Management, Inc. | 1,900 | 71 | |||||||||
| Electronic & Other Electric Equipment (3.5%) | |||||||||||
| Cooper Industries, Ltd.–Class A | 400 | 37 | |||||||||
| Emerson Electric Co. | 1,500 | 127 | |||||||||
| General Electric Co. | 39,250 | 1,358 | |||||||||
| Harman International Industries, Inc. | 200 | 18 | |||||||||
| Whirlpool Corp. | 335 | 30 | |||||||||
| Electronic Components & Accessories (3.2%) | |||||||||||
| Advanced Micro Devices, Inc. ‡ | 1,500 | 49 | |||||||||
| Altera Corp. ‡ | 1,300 | 28 | |||||||||
| Shares | Value | ||||||||||
| Electronic Components & Accessories (continued) | |||||||||||
| American Power Conversion Corp. | 700 | $ | 16 | ||||||||
| Analog Devices, Inc. | 1,200 | 46 | |||||||||
| Applied Micro Circuits Corp. ‡ | 1,100 | 4 | |||||||||
| Broadcom Corp.–Class A ‡ | 1,600 | 66 | |||||||||
| Freescale Semiconductor, Inc.–Class B ‡ | 1,358 | 43 | |||||||||
| Intel Corp. | 22,100 | 442 | |||||||||
| JDS Uniphase Corp. ‡ | 6,400 | 22 | |||||||||
| Linear Technology Corp. | 1,100 | 39 | |||||||||
| LSI Logic Corp. ‡ | 1,300 | 14 | |||||||||
| Maxim Integrated Products, Inc. | 1,200 | 42 | |||||||||
| Micron Technology, Inc. ‡ | 2,200 | 37 | |||||||||
| Molex, Inc. | 600 | 22 | |||||||||
| National Semiconductor Corp. | 1,100 | 33 | |||||||||
| Novellus Systems, Inc. ‡ | 500 | 12 | |||||||||
| NVIDIA Corp. ‡ | 1,400 | 41 | |||||||||
| PMC-Sierra, Inc. ‡ | 700 | 9 | |||||||||
| QLogic Corp. ‡ | 600 | 12 | |||||||||
| Sanmina-SCI Corp. ‡ | 1,800 | 9 | |||||||||
| Solectron Corp. ‡ | 3,500 | 14 | |||||||||
| Texas Instruments, Inc. | 6,100 | 212 | |||||||||
| Tyco International, Ltd. | 7,600 | 200 | |||||||||
| Xilinx, Inc. | 1,100 | 30 | |||||||||
| Entertainment (0.1%) | |||||||||||
| International Game Technology | 1,200 | 46 | |||||||||
| Fabricated Metal Products (0.2%) | |||||||||||
| Fortune Brands, Inc. | 600 | 48 | |||||||||
| Parker Hannifin Corp. | 500 | 41 | |||||||||
| Finance (1.6%) | |||||||||||
| SPDR Trust Series 1 | 5,465 | 718 | |||||||||
| Food & Kindred Products (2.3%) | |||||||||||
| Altria Group, Inc. | 7,900 | 578 | |||||||||
| Archer-Daniels-Midland Co. | 2,300 | 84 | |||||||||
| Campbell Soup Co. | 700 | 23 | |||||||||
| ConAgra Foods, Inc. | 1,800 | 41 | |||||||||
| General Mills, Inc. | 1,100 | 54 | |||||||||
| Hercules, Inc. ‡ | 400 | 6 | |||||||||
| Hershey Co. (The) | 700 | 37 | |||||||||
| HJ Heinz Co. | 1,200 | 50 | |||||||||
| Kellogg Co. | 1,000 | 46 | |||||||||
| McCormick & Co., Inc. | 500 | 17 | |||||||||
| Sara Lee Corp. | 2,800 | 50 | |||||||||
| Tyson Foods, Inc.–Class A | 1,000 | 15 | |||||||||
| WM Wrigley Jr. Co. | 700 | 33 | |||||||||
| WM Wrigley Jr. Co.–Class B | 175 | 8 | |||||||||
The notes to the financial statements are an integral part of this report.
Transamerica IDEX Mutual Funds
Semi-Annual Report 2006
4
TA IDEX Protected Principal Stock
SCHEDULE OF INVESTMENTS (continued)
At April 30, 2006
(all amounts except share amounts in thousands)
(unaudited)
| Shares | Value | ||||||||||
| Food Stores (0.3%) | |||||||||||
| Albertson's, Inc. | 1,200 | $ | 30 | ||||||||
| Kroger Co. ‡ | 2,700 | 55 | |||||||||
| Safeway, Inc. | 1,500 | 38 | |||||||||
| Whole Foods Market, Inc. | 550 | 34 | |||||||||
| Furniture & Fixtures (0.3%) | |||||||||||
| Johnson Controls, Inc. | 800 | 65 | |||||||||
| Leggett & Platt, Inc. | 700 | 19 | |||||||||
| Masco Corp. | 1,400 | 45 | |||||||||
| Furniture & Home Furnishings Stores (0.1%) | |||||||||||
| Bed Bath & Beyond, Inc. ‡ | 1,000 | 38 | |||||||||
| Gas Production & Distribution (0.4%) | |||||||||||
| Dynegy, Inc.–Class A ‡ | 1,100 | 5 | |||||||||
| El Paso Corp. | 2,300 | 30 | |||||||||
| KeySpan Corp. | 700 | 28 | |||||||||
| Kinder Morgan, Inc. | 400 | 35 | |||||||||
| Nicor, Inc. | 200 | 8 | |||||||||
| Peoples Energy Corp. | 200 | 7 | |||||||||
| Williams Cos., Inc. (The) | 2,200 | 48 | |||||||||
| Health Services (0.7%) | |||||||||||
| Caremark Rx, Inc. ‡ | 1,500 | 68 | |||||||||
| Coventry Health Care, Inc. ‡ | 600 | 30 | |||||||||
| Express Scripts, Inc. ‡ | 600 | 47 | |||||||||
| HCA, Inc. | 1,400 | 61 | |||||||||
| Health Management Associates, Inc.–Class A | 1,000 | 21 | |||||||||
| Laboratory Corp. of America Holdings ‡ | 500 | 29 | |||||||||
| Manor Care, Inc. | 300 | 13 | |||||||||
| Quest Diagnostics, Inc. | 700 | 39 | |||||||||
| Tenet Healthcare Corp. ‡ | 1,600 | 13 | |||||||||
| Holding & Other Investment Offices (0.5%) | |||||||||||
| Apartment Investment & Management Co.–Class A | 340 | 15 | |||||||||
| Archstone-Smith Trust REIT | 800 | 39 | |||||||||
| Equity Residential | 1,200 | 54 | |||||||||
| Kimco Realty Corp. REIT | 800 | 30 | |||||||||
| Plum Creek Timber Co., Inc. | 700 | 25 | |||||||||
| Public Storage, Inc. | 300 | 23 | |||||||||
| Vornado Realty Trust REIT | 500 | 48 | |||||||||
| Hotels & Other Lodging Places (0.3%) | |||||||||||
| Hilton Hotels Corp. | 1,200 | 32 | |||||||||
| Marriott International, Inc.–Class A | 700 | 51 | |||||||||
| Starwood Hotels & Resorts Worldwide, Inc. | 900 | 52 | |||||||||
| Industrial Machinery & Equipment (1.9%) | |||||||||||
| American Standard Cos., Inc. | 700 | 30 | |||||||||
| Applied Materials, Inc. | 6,100 | 110 | |||||||||
| Shares | Value | ||||||||||
| Industrial Machinery & Equipment (continued) | |||||||||||
| Baker Hughes, Inc. | 1,100 | $ | 89 | ||||||||
| Black & Decker Corp. | 300 | 28 | |||||||||
| Caterpillar, Inc. | 2,400 | 182 | |||||||||
| Cummins, Inc. | 200 | 21 | |||||||||
| Deere & Co. | 1,000 | 88 | |||||||||
| Dover Corp. | 800 | 40 | |||||||||
| Eaton Corp. | 600 | 46 | |||||||||
| Illinois Tool Works, Inc. | 800 | 82 | |||||||||
| Ingersoll-Rand Co.–Class A | 1,200 | 53 | |||||||||
| National Oilwell Varco, Inc. ‡ | 700 | 48 | |||||||||
| Pall Corp. | 500 | 15 | |||||||||
| Stanley Works (The) | 300 | 16 | |||||||||
| Instruments & Related Products (1.1%) | |||||||||||
| Agilent Technologies, Inc. ‡ | 1,500 | 58 | |||||||||
| Bausch & Lomb, Inc. | 200 | 10 | |||||||||
| Danaher Corp. | 900 | 58 | |||||||||
| Eastman Kodak Co. | 1,100 | 30 | |||||||||
| Fisher Scientific International ‡ | 500 | 35 | |||||||||
| KLA-Tencor Corp. | 800 | 39 | |||||||||
| PerkinElmer, Inc. | 500 | 11 | |||||||||
| Raytheon Co. | 1,500 | 66 | |||||||||
| Rockwell Automation, Inc. | 700 | 51 | |||||||||
| Snap-On, Inc. | 200 | 8 | |||||||||
| Tektronix, Inc. | 300 | 11 | |||||||||
| Teradyne, Inc. ‡ | 800 | 13 | |||||||||
| Thermo Electron Corp. ‡ | 600 | 23 | |||||||||
| Waters Corp. ‡ | 400 | 18 | |||||||||
| Xerox Corp. ‡ | 3,500 | 49 | |||||||||
| Insurance (4.5%) | |||||||||||
| ACE, Ltd. | 1,200 | 67 | |||||||||
| Aetna, Inc. | 2,000 | 77 | |||||||||
| AFLAC, Inc. | 1,700 | 81 | |||||||||
| Allstate Corp. (The) | 2,300 | 130 | |||||||||
| AMBAC Financial Group, Inc. | 400 | 33 | |||||||||
| American International Group, Inc. | 9,700 | 633 | |||||||||
| Chubb Corp. | 1,600 | 82 | |||||||||
| Cigna Corp. | 500 | 54 | |||||||||
| Cincinnati Financial Corp. | 682 | 29 | |||||||||
| Loews Corp. | 500 | 53 | |||||||||
| MBIA, Inc. | 500 | 30 | |||||||||
| MGIC Investment Corp. | 400 | 28 | |||||||||
| Principal Financial Group | 1,000 | 51 | |||||||||
| Progressive Corp. (The) | 800 | 87 | |||||||||
| SAFECO Corp. | 500 | 26 | |||||||||
| St. Paul Travelers Cos., Inc. (The) | 2,447 | 108 | |||||||||
| UnitedHealth Group, Inc. | 5,300 | 264 | |||||||||
The notes to the financial statements are an integral part of this report.
Transamerica IDEX Mutual Funds
Semi-Annual Report 2006
5
TA IDEX Protected Principal Stock
SCHEDULE OF INVESTMENTS (continued)
At April 30, 2006
(all amounts except share amounts in thousands)
(unaudited)
| Shares | Value | ||||||||||
| Insurance (continued) | |||||||||||
| UnumProvident Corp. | 1,100 | $ | 22 | ||||||||
| WellPoint, Inc. ‡ | 2,300 | 163 | |||||||||
| XL Capital, Ltd.–Class A | 700 | 46 | |||||||||
| Insurance Agents, Brokers & Service (0.5%) | |||||||||||
| AON Corp. | 1,200 | 50 | |||||||||
| Hartford Financial Services Group, Inc. (The) | 1,100 | 101 | |||||||||
| Humana, Inc. ‡ | 600 | 27 | |||||||||
| Marsh & McLennan Cos., Inc. | 1,900 | 58 | |||||||||
| Leather & Leather Products (0.1%) | |||||||||||
| Coach, Inc. ‡ | 1,400 | 46 | |||||||||
| Life Insurance (0.9%) | |||||||||||
| Genworth Financial, Inc.–Class A | 1,200 | 40 | |||||||||
| Lincoln National Corp. | 1,149 | 67 | |||||||||
| Metlife, Inc. | 2,800 | 146 | |||||||||
| Prudential Financial, Inc. | 1,700 | 133 | |||||||||
| Torchmark Corp. | 400 | 24 | |||||||||
| Lumber & Other Building Materials (1.1%) | |||||||||||
| Home Depot, Inc. (The) | 8,200 | 327 | |||||||||
| Lowe's Cos., Inc. | 2,900 | 183 | |||||||||
| Lumber & Wood Products (0.2%) | |||||||||||
| Louisiana-Pacific Corp. | 400 | 11 | |||||||||
| Weyerhaeuser Co. | 900 | 63 | |||||||||
| Management Services (0.1%) | |||||||||||
| Paychex, Inc. | 1,200 | 48 | |||||||||
| Medical Instruments & Supplies (1.6%) | |||||||||||
| Applera Corp.–Applied Biosystems Group | 700 | 20 | |||||||||
| Bard, (C.R.) Inc. | 400 | 30 | |||||||||
| Baxter International, Inc. | 2,300 | 87 | |||||||||
| Becton Dickinson & Co. | 1,000 | 63 | |||||||||
| Biomet, Inc. | 1,000 | 37 | |||||||||
| Boston Scientific Corp. ‡ | 4,215 | 98 | |||||||||
| Medtronic, Inc. | 4,300 | 216 | |||||||||
| Millipore Corp. ‡ | 200 | 15 | |||||||||
| St. Jude Medical, Inc. ‡ | 1,200 | 47 | |||||||||
| Stryker Corp. | 1,100 | 48 | |||||||||
| Zimmer Holdings, Inc. ‡ | 900 | 57 | |||||||||
| Metal Cans & Shipping Containers (0.0%) | |||||||||||
| Ball Corp. | 400 | 16 | |||||||||
| Metal Mining (0.4%) | |||||||||||
| Freeport-McMoRan Copper & Gold, Inc.–Class B | 700 | 45 | |||||||||
| Newmont Mining Corp. | 1,500 | 88 | |||||||||
| Phelps Dodge Corp. | 800 | 69 | |||||||||
| Shares | Value | ||||||||||
| Mining (0.1%) | |||||||||||
| Vulcan Materials Co. | 400 | $ | 34 | ||||||||
| Mortgage Bankers & Brokers (0.2%) | |||||||||||
| Countrywide Financial Corp. | 2,100 | 85 | |||||||||
| Motion Pictures (1.0%) | |||||||||||
| News Corp., Inc.–Class A | 9,000 | 154 | |||||||||
| Time Warner, Inc. | 17,000 | 296 | |||||||||
| Office Property (0.1%) | |||||||||||
| Boston Properties, Inc. REIT | 300 | 26 | |||||||||
| Equity Office Properties Trust | 1,300 | 42 | |||||||||
| Oil & Gas Extraction (3.0%) | |||||||||||
| Anadarko Petroleum Corp. | 900 | 94 | |||||||||
| Apache Corp. | 1,210 | 86 | |||||||||
| BJ Services Co. | 1,200 | 46 | |||||||||
| Chesapeake Energy Corp. | 1,250 | 40 | |||||||||
| Devon Energy Corp. | 1,500 | 90 | |||||||||
| EOG Resources, Inc. | 1,000 | 70 | |||||||||
| Halliburton Co. | 1,900 | 148 | |||||||||
| Kerr-McGee Corp. | 500 | 50 | |||||||||
| Nabors Industries, Ltd. ‡ | 1,200 | 45 | |||||||||
| Noble Corp. | 500 | 39 | |||||||||
| Occidental Petroleum Corp. | 1,400 | 144 | |||||||||
| Rowan Cos., Inc. | 400 | 18 | |||||||||
| Schlumberger, Ltd. | 4,300 | 297 | |||||||||
| Transocean, Inc. ‡ | 1,200 | 97 | |||||||||
| Weatherford International, Ltd. ‡ | 1,100 | 58 | |||||||||
| XTO Energy, Inc. | 1,133 | 48 | |||||||||
| Paper & Allied Products (1.1%) | |||||||||||
| 3M Co. | 2,700 | 231 | |||||||||
| Avery Dennison Corp. | 400 | 25 | |||||||||
| Bemis Co. | 400 | 13 | |||||||||
| International Paper Co. | 1,800 | 65 | |||||||||
| Kimberly-Clark Corp. | 1,600 | 94 | |||||||||
| MeadWestvaco Corp. | 700 | 20 | |||||||||
| OfficeMax, Inc. | 300 | 12 | |||||||||
| Pactiv Corp. ‡ | 600 | 15 | |||||||||
| Temple-Inland, Inc. | 400 | 19 | |||||||||
| Personal Credit Institutions (0.4%) | |||||||||||
| Capital One Financial Corp. | 1,100 | 95 | |||||||||
| SLM Corp. | 1,400 | 74 | |||||||||
| Personal Services (0.1%) | |||||||||||
| H&R Block, Inc. | 1,200 | 27 | |||||||||
| Petroleum Refining (6.0%) | |||||||||||
| Amerada Hess Corp. | 300 | 43 | |||||||||
| Ashland, Inc. | 300 | 20 | |||||||||
The notes to the financial statements are an integral part of this report.
Transamerica IDEX Mutual Funds
Semi-Annual Report 2006
6
TA IDEX Protected Principal Stock
SCHEDULE OF INVESTMENTS (continued)
At April 30, 2006
(all amounts except share amounts in thousands)
(unaudited)
| Shares | Value | ||||||||||
| Petroleum Refining (continued) | |||||||||||
| Chevron Corp. | 8,341 | $ | 509 | ||||||||
| ConocoPhillips | 6,217 | 416 | |||||||||
| Exxon Mobil Corp. | 22,700 | 1,432 | |||||||||
| Marathon Oil Corp. | 1,170 | 93 | |||||||||
| Murphy Oil Corp. | 700 | 35 | |||||||||
| Sunoco, Inc. | 500 | 41 | |||||||||
| Valero Energy Corp. | 2,300 | 149 | |||||||||
| Pharmaceuticals (8.0%) | |||||||||||
| Abbott Laboratories | 6,000 | 256 | |||||||||
| Allergan, Inc. | 500 | 51 | |||||||||
| AmerisourceBergen Corp. | 800 | 35 | |||||||||
| Amgen, Inc. ‡ | 4,172 | 282 | |||||||||
| Barr Pharmaceuticals, Inc. ‡ | 250 | 15 | |||||||||
| Biogen Idec, Inc. ‡ | 1,200 | 54 | |||||||||
| Bristol-Myers Squibb Co. | 7,400 | 188 | |||||||||
| Cardinal Health, Inc. | 1,400 | 94 | |||||||||
| Forest Laboratories, Inc. ‡ | 1,200 | 48 | |||||||||
| Genzyme Corp. ‡ | 1,000 | 61 | |||||||||
| Gilead Sciences, Inc. ‡ | 1,700 | 98 | |||||||||
| Hospira, Inc. ‡ | 620 | 24 | |||||||||
| Johnson & Johnson | 11,100 | 651 | |||||||||
| King Pharmaceuticals, Inc. ‡ | 1,000 | 17 | |||||||||
| Lilly (Eli) & Co. | 4,000 | 212 | |||||||||
| McKesson Corp. | 1,100 | 53 | |||||||||
| Medco Health Solutions, Inc. ‡ | 1,153 | 61 | |||||||||
| MedImmune, Inc. ‡ | 1,000 | 31 | |||||||||
| Merck & Co., Inc. | 8,400 | 289 | |||||||||
| Mylan Laboratories | 900 | 20 | |||||||||
| Pfizer, Inc. | 27,540 | 698 | |||||||||
| Schering-Plough Corp. | 5,800 | 112 | |||||||||
| Sigma-Aldrich Corp. | 300 | 21 | |||||||||
| Watson Pharmaceuticals, Inc. ‡ | 400 | 11 | |||||||||
| Wyeth | 5,200 | 253 | |||||||||
| Primary Metal Industries (0.5%) | |||||||||||
| Alcoa, Inc. | 3,300 | 111 | |||||||||
| Allegheny Technologies, Inc. | 300 | 21 | |||||||||
| Engelhard Corp. | 500 | 19 | |||||||||
| Nucor Corp. | 600 | 65 | |||||||||
| United States Steel Corp. | 400 | 27 | |||||||||
| Printing & Publishing (0.7%) | |||||||||||
| CBS Corp.–Class B | 2,850 | 73 | |||||||||
| Dow Jones & Co., Inc. | 200 | 7 | |||||||||
| Gannett Co., Inc. | 1,000 | 55 | |||||||||
| Knight-Ridder, Inc. | 300 | 19 | |||||||||
| McGraw-Hill Cos., Inc. (The) | 1,200 | 67 | |||||||||
| Meredith Corp. | 200 | 10 | |||||||||
| New York Times Co.–Class A | 600 | 15 | |||||||||
| RR Donnelley & Sons Co. | 900 | 30 | |||||||||
| Scripps (E.W.) Co. (The) | 300 | 14 | |||||||||
| Tribune Co. | 1,000 | 29 | |||||||||
| Shares | Value | ||||||||||
| Radio & Television Broadcasting (0.3%) | |||||||||||
| Univision Communications, Inc.–Class A ‡ | 900 | $ | 32 | ||||||||
| Viacom, Inc.–Class B ‡ | 2,850 | 114 | |||||||||
| Radio, Television & Computer Stores (0.2%) | |||||||||||
| Best Buy Co., Inc. | 1,350 | 76 | |||||||||
| Circuit City Stores, Inc. | 600 | 17 | |||||||||
| RadioShack Corp. | 500 | 9 | |||||||||
| Railroads (0.7%) | |||||||||||
| Burlington Northern Santa Fe Corp. | 1,200 | 95 | |||||||||
| CSX Corp. | 900 | 62 | |||||||||
| Norfolk Southern Corp. | 1,500 | 81 | |||||||||
| Union Pacific Corp. | 1,000 | 91 | |||||||||
| Regional Mall (0.1%) | |||||||||||
| Simon Property Group, Inc. | 700 | 57 | |||||||||
| Residential Building Construction (0.1%) | |||||||||||
| DR Horton, Inc. | 1,000 | 30 | |||||||||
| Lennar Corp.–Class A | 500 | 27 | |||||||||
| Restaurants (0.8%) | |||||||||||
| Darden Restaurants, Inc. | 500 | 20 | |||||||||
| McDonald's Corp. | 4,900 | 169 | |||||||||
| Starbucks Corp. ‡ | 2,700 | 101 | |||||||||
| Wendy's International, Inc. | 500 | 31 | |||||||||
| Yum! Brands, Inc. | 1,000 | 52 | |||||||||
| Retail Trade (2.1%) | |||||||||||
| Amazon.com, Inc. ‡ | 1,100 | 39 | |||||||||
| Big Lots, Inc. ‡ | 500 | 7 | |||||||||
| Costco Wholesale Corp. | 1,600 | 87 | |||||||||
| Dollar General Corp. | 1,200 | 21 | |||||||||
| Family Dollar Stores, Inc. | 600 | 15 | |||||||||
| Office Depot, Inc. ‡ | 1,100 | 45 | |||||||||
| Sears Holdings Corp. ‡ | 383 | 55 | |||||||||
| Staples, Inc. | 2,750 | 73 | |||||||||
| Target Corp. | 3,500 | 186 | |||||||||
| Tiffany & Co. | 600 | 21 | |||||||||
| Wal-Mart Stores, Inc. | 9,400 | 423 | |||||||||
| Rubber & Misc. Plastic Products (0.3%) | |||||||||||
| Cooper Tire & Rubber Co. | 200 | 3 | |||||||||
| Goodyear Tire & Rubber Co. (The) ‡ | 700 | 10 | |||||||||
| Newell Rubbermaid, Inc. | 1,000 | 27 | |||||||||
| NIKE, Inc.–Class B | 800 | 65 | |||||||||
| Sealed Air Corp. | 300 | 16 | |||||||||
| Savings Institutions (0.5%) | |||||||||||
| Golden West Financial Corp. | 1,100 | 79 | |||||||||
| Sovereign Bancorp, Inc. | 1,100 | 24 | |||||||||
| Washington Mutual, Inc. | 3,240 | 146 | |||||||||
The notes to the financial statements are an integral part of this report.
Transamerica IDEX Mutual Funds
Semi-Annual Report 2006
7
TA IDEX Protected Principal Stock
SCHEDULE OF INVESTMENTS (continued)
At April 30, 2006
(all amounts except share amounts in thousands)
(unaudited)
| Shares | Value | ||||||||||
| Security & Commodity Brokers (3.4%) | |||||||||||
| American Express Co. | 4,400 | $ | 237 | ||||||||
| Ameriprise Financial, Inc. | 920 | 45 | |||||||||
| Bear Stearns Cos. Inc. (The) | 500 | 71 | |||||||||
| Charles Schwab Corp. (The) | 3,600 | 64 | |||||||||
| E*TRADE Financial Corp. ‡ | 1,350 | 34 | |||||||||
| Federated Investors, Inc.–Class B | 350 | 12 | |||||||||
| Franklin Resources, Inc. | 600 | 56 | |||||||||
| Goldman Sachs Group, Inc. (The) | 1,500 | 240 | |||||||||
| Janus Capital Group, Inc. | 900 | 18 | |||||||||
| Legg Mason, Inc. | 400 | 47 | |||||||||
| Lehman Brothers Holdings, Inc. | 1,000 | 151 | |||||||||
| Merrill Lynch & Co., Inc. | 3,500 | 267 | |||||||||
| Morgan Stanley | 3,800 | 244 | |||||||||
| T. Rowe Price Group, Inc. | 500 | 42 | |||||||||
| Telecommunications (3.1%) | |||||||||||
| ALLTEL Corp. | 1,400 | 90 | |||||||||
| AT&T, Inc. | 14,872 | 390 | |||||||||
| BellSouth Corp. | 6,900 | 233 | |||||||||
| CenturyTel, Inc. | 500 | 19 | |||||||||
| Citizens Communications Co. | 1,200 | 16 | |||||||||
| Qwest Communications International ‡ | 6,000 | 40 | |||||||||
| Sprint Nextel Corp. | 11,034 | 274 | |||||||||
| Verizon Communications, Inc. | 10,800 | 357 | |||||||||
| Tobacco Products (0.1%) | |||||||||||
| Reynolds American, Inc. | 300 | 33 | |||||||||
| UST, Inc. | 600 | 26 | |||||||||
| Toys, Games & Hobbies (0.1%) | |||||||||||
| Hasbro, Inc. | 700 | 14 | |||||||||
| Mattel, Inc. | 1,300 | 21 | |||||||||
| Transportation Equipment (0.0%) | |||||||||||
| Brunswick Corp. | 400 | 16 | |||||||||
| Trucking & Warehousing (0.7%) | |||||||||||
| United Parcel Service, Inc.–Class B | 3,900 | 316 | |||||||||
| Warehouse (0.1%) | |||||||||||
| Prologis | 950 | 48 | |||||||||
| Water Transportation (0.2%) | |||||||||||
| Carnival Corp. | 1,600 | 75 | |||||||||
| Wholesale Trade Durable Goods (0.1%) | |||||||||||
| Grainger (W.W.), Inc. | 300 | 23 | |||||||||
| Patterson Cos., Inc. ‡ | 500 | 16 | |||||||||
| Wholesale Trade Nondurable Goods (0.2%) | |||||||||||
| Dean Foods Co. ‡ | 500 | 20 | |||||||||
| SUPERVALU, Inc. | 500 | 15 | |||||||||
| SYSCO Corp. | 2,200 | 66 | |||||||||
| Total Common Stocks (cost: $32,854) | 44,904 | ||||||||||
| Contractst | Value | ||||||||||
| PURCHASED OPTIONS (0.1%) | |||||||||||
| Put Options (0.1%) | |||||||||||
| S&P 500 Index Put Strike $1,200.00 Expires 06/17/2006 | 103 | $ | 19 | ||||||||
| S&P 500 Index Put Strike $1,200.00 Expires 05/20/2006 | 89 | 7 | |||||||||
| S&P 500 Index Put Strike $1,175.00 Expires 05/20/2006 | 54 | 3 | |||||||||
| S&P 500 Index Put Strike $1,175.00 Expires 06/17/2006 | 38 | 4 | |||||||||
| S&P 500 Index Put Strike $1,225.00 Expires 06/17/2006 | 56 | 16 | |||||||||
| Total Purchased Options (cost: $137) | 49 | ||||||||||
| Total Investment Securities (cost: $32,991) # | $ | 44,953 | |||||||||
| WRITTEN OPTIONS (-2.7%) | |||||||||||
| Covered Call Options (-2.7%) | |||||||||||
| S&P 500 Index Call Strike $1,300.00 Expires 06/17/2006 | 41 | (129 | ) | ||||||||
| S&P 500 Index Call Strike $1,300.00 Expires 05/20/2006 | 89 | (199 | ) | ||||||||
| S&P 500 Index Call Strike $1,250.00 Expires 05/20/2006 | 35 | (234 | ) | ||||||||
| S&P 500 Index Call Strike $1,275.00 Expires 05/20/2006 | 78 | (339 | ) | ||||||||
| S&P 500 Index Call Strike $1,325.00 Expires 06/17/2006 | 49 | (77 | ) | ||||||||
| S&P 500 Index Call Strike $1,275.00 Expires 06/17/2006 | 48 | (244 | ) | ||||||||
| Total Written Options (premiums: $1,085) | (1,222 | ) | |||||||||
The notes to the financial statements are an integral part of this report.
Transamerica IDEX Mutual Funds
Semi-Annual Report 2006
8
TA IDEX Protected Principal Stock
SCHEDULE OF INVESTMENTS (continued)
At April 30, 2006
(all amounts except share amounts in thousands)
(unaudited)
NOTES TO SCHEDULE OF INVESTMENTS:
l Substantially all of the Fund's securities are memo pledged as collateral by the custodian for the listed short index option contracts written by the Fund (see Note 1).
‡ Non-income producing.
t Contract amounts are not in thousands.
# Aggregate cost for Federal income tax purposes is $32,988. Aggregate gross unrealized appreciation for all securities in which there is an excess of value over tax cost and aggregate gross unrealized depreciation for all securities in which there is an excess of tax cost over value were $13,216 and $1,251, respectively. Net unrealized appreciation for tax purposes is $11,965.
DEFINITIONS:
REIT Real Estate Investment Trust
SPDR Standard & Poor's Depository Receipts
The notes to the financial statements are an integral part of this report.
Transamerica IDEX Mutual Funds
Semi-Annual Report 2006
9
TA IDEX Protected Principal Stock
STATEMENT OF ASSETS AND LIABILITIES
At April 30, 2006
(all amounts except per share amounts in thousands)
(unaudited)
| Assets: | |||||||
| Investment securities, at value (cost: $32,991) | $ | 44,953 | |||||
| Cash | 1,891 | ||||||
| Receivables: | |||||||
| Interest | 5 | ||||||
| Dividends | 60 | ||||||
| Other | 3 | ||||||
| 46,912 | |||||||
| Liabilities: | |||||||
| Accounts payable and accrued liabilities: | |||||||
| Shares of beneficial interest redeemed | 115 | ||||||
| Management and advisory fees | 49 | ||||||
| Distribution and service fees | 34 | ||||||
| Transfer agent fees | 5 | ||||||
| Administration fees | 1 | ||||||
| Written options (premiums $1,085) | 1,222 | ||||||
| Other | 16 | ||||||
| 1,442 | |||||||
| Net Assets | $ | 45,470 | |||||
| Net Assets Consist of: | |||||||
| Shares of beneficial interest, unlimited shares authorized, no par value | $ | 35,329 | |||||
| Distributable net investment income (loss) | (99 | ) | |||||
| Accumulated net realized gain (loss) from investment securities and written options | (1,585 | ) | |||||
| Net unrealized appreciation (depreciation) on: | |||||||
| Investment securities | 11,962 | ||||||
| Written option contracts | (137 | ) | |||||
| Net Assets | $ | 45,470 | |||||
| Net Assets by Class: | |||||||
| Class A | $ | 6,651 | |||||
| Class B | 32,654 | ||||||
| Class C | 4,549 | ||||||
| Class M | 1,616 | ||||||
| Shares Outstanding: | |||||||
| Class A | 564 | ||||||
| Class B | 2,802 | ||||||
| Class C | 391 | ||||||
| Class M | 139 | ||||||
| Net Asset Value Per Share: | |||||||
| Class A | $ | 11.80 | |||||
| Class B | 11.65 | ||||||
| Class C | 11.63 | ||||||
| Class M | 11.66 | ||||||
| Maximum Offering Price Per Share (a): | |||||||
| Class A | $ | 12.49 | |||||
| Class M | 11.78 | ||||||
(a) Includes the maximum selling commission (represented as a percentage of offering price) which is reduced on certain levels of sales as set forth in the Prospectus. Net asset value per share for Classes B and C shares represents offering price. The redemption price for Classes B and C shares equals net asset value less any applicable contingent deferred sales charge.
STATEMENT OF OPERATIONS
For the period ended April 30, 2006
(all amounts in thousands)
(unaudited)
| Investment Income: | |||||||
| Dividends | $ | 460 | |||||
| Interest | 24 | ||||||
| 484 | |||||||
| Expenses: | |||||||
| Management and advisory fees | 303 | ||||||
| Distribution and service fees: | |||||||
| Class A | 12 | ||||||
| Class B | 167 | ||||||
| Class C | 24 | ||||||
| Class M | 8 | ||||||
| Transfer agent fees: | |||||||
| Class A | 3 | ||||||
| Class B | 15 | ||||||
| Class C | 2 | ||||||
| Class M | 1 | ||||||
| Printing and shareholder reports | 3 | ||||||
| Custody fees | 14 | ||||||
| Administration fees | 5 | ||||||
| Legal fees | 1 | ||||||
| Audit fees | 9 | ||||||
| Trustees fees | 1 | ||||||
| Registration fees | 14 | ||||||
| Other | 1 | ||||||
| Total expenses | 583 | ||||||
| Net Investment Income (Loss) | (99 | ) | |||||
| Net Realized Gain (Loss) from: | |||||||
| Investment securities | 1,398 | ||||||
| Written option contracts | (549 | ) | |||||
| 849 | |||||||
| Net Increase (Decrease) in Unrealized Appreciation (Depreciation) on: | |||||||
| Investment securities | 2,000 | ||||||
| Written option contracts | (582 | ) | |||||
| 1,418 | |||||||
| Net Realized and Unrealized Gain (Loss) on Investment Securities and Written Options | 2,267 | ||||||
| Net Increase (Decrease) in Net Assets Resulting from Operations | $ | 2,168 | |||||
The notes to the financial statements are an integral part of this report.
Transamerica IDEX Mutual Funds
Semi-Annual Report 2006
10
TA IDEX Protected Principal Stock
STATEMENTS OF CHANGES IN NET ASSETS
For the period or year ended
(all amounts in thousands)
| April 30, 2006 (unaudited) | October 31, 2005 | ||||||||||
| Increase (Decrease) In Net Assets From: | |||||||||||
| Operations: | |||||||||||
| Net investment income (loss) | $ | (99 | ) | $ | (223 | ) | |||||
| Net realized gain (loss) from investment securities and written options | 849 | 1,515 | |||||||||
| Change in unrealized appreciation (depreciation) on investment securities and written options | 1,418 | 1,359 | |||||||||
| 2,168 | 2,651 | ||||||||||
| Capital Share Transactions: | |||||||||||
| Proceeds from shares sold: | |||||||||||
| Class A | 39 | – | |||||||||
| 39 | – | ||||||||||
| Cost of shares redeemed: | |||||||||||
| Class A | (624 | ) | (1,511 | ) | |||||||
| Class B | (3,374 | ) | (8,122 | ) | |||||||
| Class C | (592 | ) | (1,783 | ) | |||||||
| Class M | (182 | ) | (701 | ) | |||||||
| (4,772 | ) | (12,117 | ) | ||||||||
| (4,733 | ) | (12,117 | ) | ||||||||
| Net increase (decrease) in net assets | (2,565 | ) | (9,466 | ) | |||||||
| Net Assets: | |||||||||||
| Beginning of period | 48,035 | 57,501 | |||||||||
| End of period | $ | 45,470 | $ | 48,035 | |||||||
| Distributable Net Investment Income (Loss) | $ | (99 | ) | $ | – | ||||||
| April 30, 2006 (unaudited) | October 31, 2005 | ||||||||||
| Share Activity: | |||||||||||
| Shares issued: | |||||||||||
| Class A | 3 | – | |||||||||
| 3 | – | ||||||||||
| Shares redeemed: | |||||||||||
| Class A | (53 | ) | (138 | ) | |||||||
| Class B | (296 | ) | (746 | ) | |||||||
| Class C | (52 | ) | (164 | ) | |||||||
| Class M | (15 | ) | (65 | ) | |||||||
| (416 | ) | (1,113 | ) | ||||||||
| Net increase (decrease) in shares outstanding: | |||||||||||
| Class A | (50 | ) | (138 | ) | |||||||
| Class B | (296 | ) | (746 | ) | |||||||
| Class C | (52 | ) | (164 | ) | |||||||
| Class M | (15 | ) | (65 | ) | |||||||
| (413 | ) | (1,113 | ) | ||||||||
The notes to the financial statements are an integral part of this report.
Transamerica IDEX Mutual Funds
Semi-Annual Report 2006
11
TA IDEX Protected Principal Stock
FINANCIAL HIGHLIGHTS
(unaudited for the period ended April 30, 2006)
| For a share of beneficial interest outstanding throughout each period | |||||||||||||||||||||||||||||||||||||||
| Net Asset | Investment Operations | Distributions | Net Asset | ||||||||||||||||||||||||||||||||||||
| For the Period Ended (d)(g) | Value, Beginning of Period | Net Investment Income (Loss) | Net Realized and Unrealized Gain (Loss) | Total Operations | From Net Investment Income | From Net Realized Gains | Total Distributions | Value, End of Period | |||||||||||||||||||||||||||||||
| Class A | 4/30/2006 | $ | 11.24 | $ | 0.01 | $ | 0.55 | $ | 0.56 | $ | – | $ | – | $ | – | $ | 11.80 | ||||||||||||||||||||||
| 10/31/2005 | 10.64 | 0.01 | 0.59 | 0.60 | – | – | – | 11.24 | |||||||||||||||||||||||||||||||
| 10/31/2004 | 10.15 | (0.05 | ) | 0.54 | 0.49 | – | – | – | 10.64 | ||||||||||||||||||||||||||||||
| 10/31/2003 | 10.01 | (0.04 | ) | 0.92 | 0.88 | – | (0.74 | ) | (0.74 | ) | 10.15 | ||||||||||||||||||||||||||||
| 10/31/2002 | 10.00 | (0.02 | ) | 0.03 | 0.01 | – | – | – | 10.01 | ||||||||||||||||||||||||||||||
| Class B | 4/30/2006 | 11.13 | (0.03 | ) | 0.55 | 0.52 | – | – | – | 11.65 | |||||||||||||||||||||||||||||
| 10/31/2005 | 10.60 | (0.06 | ) | 0.59 | 0.53 | – | – | – | 11.13 | ||||||||||||||||||||||||||||||
| 10/31/2004 | 10.15 | (0.10 | ) | 0.55 | 0.45 | – | – | – | 10.60 | ||||||||||||||||||||||||||||||
| 10/31/2003 | 10.01 | (0.11 | ) | 0.99 | 0.88 | – | (0.74 | ) | (0.74 | ) | 10.15 | ||||||||||||||||||||||||||||
| 10/31/2002 | 10.00 | (0.04 | ) | 0.05 | 0.01 | – | – | – | 10.01 | ||||||||||||||||||||||||||||||
| Class C | 4/30/2006 | 11.12 | (0.03 | ) | 0.54 | 0.51 | – | – | – | 11.63 | |||||||||||||||||||||||||||||
| 10/31/2005 | 10.58 | (0.05 | ) | 0.59 | 0.54 | – | – | – | 11.12 | ||||||||||||||||||||||||||||||
| 10/31/2004 | 10.15 | (0.12 | ) | 0.55 | 0.43 | – | – | – | 10.58 | ||||||||||||||||||||||||||||||
| 10/31/2003 | 10.01 | (0.11 | ) | 0.99 | 0.88 | – | (0.74 | ) | (0.74 | ) | 10.15 | ||||||||||||||||||||||||||||
| 10/31/2002 | 10.00 | (0.04 | ) | 0.05 | 0.01 | – | – | – | 10.01 | ||||||||||||||||||||||||||||||
| Class M | 4/30/2006 | 11.14 | (0.03 | ) | 0.55 | 0.52 | – | – | – | 11.66 | |||||||||||||||||||||||||||||
| 10/31/2005 | 10.59 | (0.04 | ) | 0.59 | 0.55 | – | – | – | 11.14 | ||||||||||||||||||||||||||||||
| 10/31/2004 | 10.14 | (0.10 | ) | 0.55 | 0.45 | – | – | – | 10.59 | ||||||||||||||||||||||||||||||
| 10/31/2003 | 10.01 | (0.10 | ) | 0.97 | 0.87 | – | (0.74 | ) | (0.74 | ) | 10.14 | ||||||||||||||||||||||||||||
| 10/31/2002 | 10.00 | (0.04 | ) | 0.05 | 0.01 | – | – | – | 10.01 | ||||||||||||||||||||||||||||||
| Ratios/Supplemental Data | |||||||||||||||||||||||||||||||
| For the Period | Total | Net Assets, End of Period | Ratio of Expenses to Average Net Assets (a) | Net Investment Income (Loss) to Average | Portfolio Turnover | ||||||||||||||||||||||||||
| Ended (g) | Return (c) | (000's) | Net (e) | Total (f) | Net Assets (a) | Rate (b) | |||||||||||||||||||||||||
| Class A | 4/30/2006 | 4.98 | % | $ | 6,651 | 1.95 | % | 1.95 | % | 0.13 | % | 3 | % | ||||||||||||||||||
| 10/31/2005 | 5.64 | 6,906 | 2.12 | (h) | 2.12 | (h) | 0.05 | 3 | |||||||||||||||||||||||
| 10/31/2004 | 4.82 | 8,006 | 2.22 | (i) | 2.22 | (i) | (0.53 | ) | 1 | ||||||||||||||||||||||
| 10/31/2003 | 9.44 | 9,320 | 2.25 | 2.25 | (0.46 | ) | 3 | ||||||||||||||||||||||||
| 10/31/2002 | 0.10 | 10,381 | 2.25 | 2.62 | (0.70 | ) | 14 | ||||||||||||||||||||||||
| Class B | 4/30/2006 | 4.67 | 32,654 | 2.60 | 2.60 | (0.52 | ) | 3 | |||||||||||||||||||||||
| 10/31/2005 | 5.00 | 34,487 | 2.69 | (h) | 2.69 | (h) | (0.51 | ) | 3 | ||||||||||||||||||||||
| 10/31/2004 | 4.43 | 40,756 | 2.69 | (i) | 2.69 | (i) | (0.97 | ) | 1 | ||||||||||||||||||||||
| 10/31/2003 | 9.44 | 46,709 | 2.90 | 2.90 | (1.11 | ) | 3 | ||||||||||||||||||||||||
| 10/31/2002 | 0.10 | 47,170 | 2.90 | 3.28 | (1.35 | ) | 14 | ||||||||||||||||||||||||
| Class C | 4/30/2006 | 4.68 | 4,549 | 2.60 | 2.60 | (0.52 | ) | 3 | |||||||||||||||||||||||
| 10/31/2005 | 5.10 | 4,924 | 2.69 | (h) | 2.69 | (h) | (0.50 | ) | 3 | ||||||||||||||||||||||
| 10/31/2004 | 4.24 | 6,423 | 2.82 | (i) | 2.82 | (i) | (1.12 | ) | 1 | ||||||||||||||||||||||
| 10/31/2003 | 9.44 | 7,041 | 2.90 | 2.90 | (1.11 | ) | 3 | ||||||||||||||||||||||||
| 10/31/2002 | 0.10 | 6,969 | 2.90 | 3.28 | (1.35 | ) | 14 | ||||||||||||||||||||||||
| Class M | 4/30/2006 | 4.67 | 1,616 | 2.53 | 2.53 | (0.45 | ) | 3 | |||||||||||||||||||||||
| 10/31/2005 | 5.19 | 1,718 | 2.59 | (h) | 2.59 | (h) | (0.39 | ) | 3 | ||||||||||||||||||||||
| 10/31/2004 | 4.44 | 2,316 | 2.80 | (i) | 2.80 | (i) | (1.01 | ) | 1 | ||||||||||||||||||||||
| 10/31/2003 | 9.33 | 3,576 | 2.80 | 2.80 | (1.01 | ) | 3 | ||||||||||||||||||||||||
| 10/31/2002 | 0.10 | 4,076 | 2.80 | 3.18 | (1.25 | ) | 14 | ||||||||||||||||||||||||
The notes to the financial statements are an integral part of this report.
Transamerica IDEX Mutual Funds
Semi-Annual Report 2006
12
TA IDEX Protected Principal Stock
FINANCIAL HIGHLIGHTS (continued)
(unaudited)
NOTES TO FINANCIAL HIGHLIGHTS
(a) Annualized.
(b) Not annualized.
(c) Total Return has been calculated for the applicable period without deduction of a sales load, if any, on an initial purchase. Not annualized.
(d) Per share information is calculated based on average number of shares outstanding.
(e) Ratio of Net Expenses to Average Net Assets is net of fee waivers and reimbursements by the investment adviser, if any (see note 2).
(f) Ratio of Total Expenses to Average Net Assets includes all expenses before fee waivers and reimbursements by the investment adviser.
(g) TA IDEX Protected Principal Stock commenced operations on July 1, 2002.
(h) Ratios of Total Expenses to Average Net Assets and net Expenses to Average Net Assets are inclusive of recaptured expenses by the investment advisor. The impact of recaptured expenses was 0.10%, 0.10%, 0.10% and 0.10% for Class A, Class B, Class C and Class M, respectively (see Note 2).
(i) Ratios of Total Expenses to Average Net Assets and net Expenses to Average Net Assets are inclusive of recaptured expenses by the investment advisor. The impact of recaptured expenses was 0.06%, 0.06%, 0.06% and 0.07% for Class A, Class B, Class C and Class M, respectively (see Note 2).
The notes to the financial statements are an integral part of this report.
Transamerica IDEX Mutual Funds
Semi-Annual Report 2006
13
TA IDEX Protected Principal Stock
NOTES TO FINANCIAL STATEMENTS
At April 30, 2006
(all amounts in thousands)
(unaudited)
NOTE 1. ORGANIZATION AND SIGNIFICANT ACCOUNTING POLICIES
Transamerica IDEX Mutual Funds is an open-end management investment company registered under the Investment Company Act of 1940, as amended (the "1940 Act").
In the normal course of business, TA IDEX Protected Principal Stock (the "Fund") enters into contracts that contain a variety of representations that provide general indemnifications. The Fund's maximum exposure under these arrangements is unknown, as this would involve future claims that may be made against the Fund and/or its affiliates that have not yet occurred. However, based on experience, the Fund expects the risk of loss to be remote.
This report should be read in conjunction with the current Fund prospectus, which contains more complete information about the Fund.
In preparing the Fund's financial statements in accordance with accounting principles generally accepted in the United States of America ("GAAP"), estimates or assumptions (which could differ from actual results) may be used that affect reported amounts and disclosures. The following is a summary of significant accounting policies followed by the Fund.
Multiple class operations, income and expenses: The Fund currently has four classes of shares, Class A, Class B, Class C and Class M, each with different expense levels. Class B shares will convert to Class A shares eight years after purchase. Income, non-class specific expenses and realized and unrealized gains and losses, are allocated daily to each class, based upon the value of shares outstanding method as permitted under Rule 18f-3 of the 1940 Act. Each class bears its own specific expenses as well as a portion of general, common expenses.
Security valuations: The Fund values its investments at the close of the New York Stock Exchange ("NYSE"), normally 4 p.m. ET, each day the NYSE is open for business. Fund investments are valued at the last sale price or closing price on the day of valuation taken from the primary exchange where the security is principally traded.
Securities traded in the over-the-counter market and listed securities for which no sale was reported on that date are valued at the last quoted bid price.
Other securities for which quotations are not readily available or whose values have been determined to be unreliable are valued at fair market value as determined in good faith by the Fund's Administrative Valuation Committee, under the supervision of the Board's Valuation Committee, using guidelines adopted by the Board of Trustees.
Cash: The Fund may leave cash overnight in its cash account with the custodian, Investors Bank & Trust Company ("IBT"). IBT has been contracted on behalf of the Fund to invest the excess cash into a savings account, which at April 30, 2006, was paying an interest rate of 3.24%.
Real Estate Investment Trusts ("REITs"): There are certain additional risks involved in investing in REITs. These include, but are not limited to, economic conditions, changes in zoning laws, real estate values, property taxes and interest rates.
Security transactions and investment income: Security transactions are recorded on the trade date. Security gains and losses are calculated on the specific identification basis. Dividend income, if any, is recorded on the ex-dividend date or, in the case of foreign securities, as soon as the Fund is informed of the ex-dividend date. Interest income, including accretion of discounts and amortization of premiums, is recorded on the accrual basis commencing on the settlement date.
Option contracts: The Fund may enter into options contracts to manage exposure to market fluctuations. Options are valued at the average of the bid and ask ("Mean Quote") established each day at the close of the board of trade or exchange on which they are traded. The primary risks associated with options are imperfect correlation between the change in value of the securities held and the prices of the options contracts; the possibility of an illiquid market and inability of the counterparty to meet the contracts terms. When the Fund writes a covered call or put option, an amount equal to the premium received by the Fund is included in the Fund's Statement of Assets and Liabilities as an asset and as an equivalent liability. Options are marked-to-market daily to reflect the current value of the option written.
The underlying face amounts of open contracts at April 30, 2006, are listed in the Schedule of Investments.
Transactions in written call and put options were as follows:
| Premium | Contracts* | ||||||||||
| Beginning Balance October 31, 2005 | $ | 1,161 | 388 | ||||||||
| Sales | 4,228 | 1,296 | |||||||||
| Closing Buys | – | – | |||||||||
| Expirations | (4,304 | ) | (1,344 | ) | |||||||
| Exercised | – | – | |||||||||
| Balance at April 30, 2006 | $ | 1,085 | 340 | ||||||||
* Contracts not in thousands
Redemption fees: A short-term trading redemption fee may be assessed on any Fund shares in a fund account that are sold during the first five (5) NYSE trading days following their purchase date. This redemption fee will equal 2% of the amount redeemed and shares held
Transamerica IDEX Mutual Funds
Semi-Annual Report 2006
14
TA IDEX Protected Principal Stock
NOTES TO FINANCIAL STATEMENTS (continued)
At April 30, 2006
(all amounts in thousands)
(unaudited)
NOTE 1.–(continued)
the longest will be treated as being redeemed first and shares held the shortest as being redeemed last. For the six months ended April 30, 2006, the Fund received no redemption fees.
Dividend distributions: Distributions to shareholders are recorded on the ex-dividend date and are determined in accordance with Federal income tax regulations which may differ from GAAP.
NOTE 2. RELATED PARTY TRANSACTIONS
Transamerica Fund Advisors, Inc. ("TFAI") is the Fund's investment adviser. Transamerica Fund Services, Inc. ("TFS") is the Fund's administrator and transfer agent. AFSG Securities Corp. ("AFSG") is the Fund's distributor/principal underwriter. TFAI, TFS, and AFSG are affiliates of AEGON, NV, a Netherlands corporation.
Certain officers and trustees of the Fund are also officers and/or directors of TFAI, TFS and AFSG.
TA IDEX Protected Principal Stock Guarantee: The Fund's investment adviser, TFAI, guarantees shareholders a Guaranteed Amount five years after the end of the Offering Period. The Guaranteed Amount will be no less than the value of the shareholders' accounts on their Investment Date, less extraordinary charges, provided that shareholders have reinvested all dividends and distributions in additional shares and have redeemed no shares ("Guarantee"). Please see the Prospectus and Statement of Additional Information for further information on the Guarantee.
Investment advisory fee: The Fund pays management fees to TFAI based on average daily net assets ("ANA") at the following breakpoints:
1.30% of the first $100 million of ANA
1.25% of ANA over $100 million
TFAI has contractually agreed to waive its advisory fee and will reimburse the Fund to the extent that operating expenses, excluding 12b-1 fees, exceed the following stated annual limit:
1.90% Expense Limit
If total Fund expenses fall below the annual expense limitation agreement agreed to by the adviser within the succeeding three years, the Fund may be required to pay the adviser a portion or all of the waived advisory fees.
There are no amounts available for recapture at April 30, 2006.
Distribution and service fees: The Fund has a 12b-1 distribution plan under the 1940 Act pursuant to which an annual fee, based on average daily net assets, is paid to the distributor for various disbursements such as broker-dealer account servicing fees and other promotional expenses of the Fund. The Fund is authorized under the 12b-1 plan to pay fees on each class up to the following limits:
| Class A | 0.35 | % | |||||
| Class B | 1.00 | % | |||||
| Class C | 1.00 | % | |||||
| Class M | 0.90 | % | |||||
In the case the Fund or a class of shares of the Fund is closed to new investors or investments, the Fund is authorized to pay 12b-1 fees for past sales and distribution efforts and present and past investor services.
Underwriter commissions relate to front-end sales charges imposed for Class A and M shares and contingent deferred sales charges from Classes B, M, and certain A share redemptions. For the six months ended April 30, 2006, the underwriter commissions were as follows:
| Received by Underwriter | $ | – | |||||
| Retained by Underwriter | – | ||||||
| Contingent Deferred Sales Charge | 75 | ||||||
Administrative services: The Fund has entered into an agreement with TFS for financial and legal fund administration services. The Fund pays TFS an annual fee of 0.02% of ANA. The Legal fees on the Statement of Operations are fees paid to external legal counsel.
Transfer agent fees: The Fund pays TFS an annual per-account charge for each open and closed account. The Fund paid TFS $21 for the six months ended April 30, 2006.
Deferred compensation plan: Each eligible independent Fund Trustee may elect to participate in a non-qualified deferred compensation plan maintained by Transamerica IDEX Mutual Funds (the "Plan"). Under the Plan, such Trustees may defer payment of all or a portion of their total fees earned as a Fund Trustee. Each Trustee who is a participant in the Plan may elect that the earnings, losses or gains credited to his or her deferred fee amounts be determined based on a deemed investment in any series of Transamerica IDEX Mutual Funds, including the Fund. The right of a participant to receive a distribution from the Plan of the deferred fees is an unsecured claim against the general assets of all series of Transamerica IDEX Mutual Funds. The pro rata liability to the Fund of all deferred fees in the Plan amounted, as of April 30, 2006, to $3.
Transamerica IDEX Mutual Funds
Semi-Annual Report 2006
15
TA IDEX Protected Principal Stock
NOTES TO FINANCIAL STATEMENTS (continued)
At April 30, 2006
(all amounts in thousands)
(unaudited)
NOTE 3. INVESTMENT TRANSACTIONS
The cost of securities purchased and proceeds from securities sold (excluding short-term securities) for the six months ended April 30, 2006 were as follows:
| Purchases of securities: | |||||||
| Long-Term | $ | 1,483 | |||||
| U.S. Government | – | ||||||
| Proceeds from maturities and sales of securities: | |||||||
| Long-Term | 8,036 | ||||||
| U.S. Government | – | ||||||
NOTE 4. FEDERAL INCOME TAX MATTERS
The Fund has not made any provision for federal income or excise taxes due to its policy to distribute all of its taxable income and capital gains to its shareholders and otherwise qualify as a regulated investment company under Subchapter M of the Internal Revenue Code. Income and capital gain distributions are determined in accordance with income tax regulations, which may differ from GAAP. These differences are primarily due to differing treatment for items including, but not limited to, capital loss carryforwards, net operating losses, options and REITS.
The capital loss carryforward is available to offset future realized capital gains through the period listed:
| Capital Loss Carryforward | Available through | ||||||
| $ | 2,138 | October 31, 2011 | |||||
NOTE 5. REGULATORY PROCEEDINGS
There continues to be significant federal and state regulatory activity relating to financial services companies, particularly mutual fund companies and their investment advisers. As part of an ongoing investigation regarding potential market timing, recordkeeping and trading compliance issues and matters affecting the Fund's investment adviser, TFAI, and certain affiliates and former employees of TFAI, the SEC staff has indicated that it is likely to take some action against TFAI and certain of its affiliates at the conclusion of the investigation. The potential timing and the scope of any such action is difficult to predict. Although the impact of any action brought against TFAI and/or its affiliates is difficult to assess at the present time, the Fund currently believes that the likelihood that any such action will have a material adverse impact on it is remote. It is important to note that the Fund is not aware of any allega tion of wrongdoing against it and its Board at the time this semi-annual report is printed. Although it is not anticipated that these developments will have an adverse impact on the Fund, there can be no assurance at this time. TFAI and its affiliates are actively working with the SEC in regard to this matter; however, the exact resolution cannot be determined at this time. TFAI will take such actions that it deems necessary or appropriate to continue providing management services to the Fund and to bring all matters to an appropriate conclusion.
TFAI and/or its affiliates, and not the Fund, will bear the costs regarding these regulatory matters.
Transamerica IDEX Mutual Funds
Semi-Annual Report 2006
16
TA IDEX Protected Principal Stock
INVESTMENT ADVISORY AND SUB-ADVISORY AGREEMENTS – REVIEW AND RENEWAL (unaudited)
At a meeting of the Board of Trustees of Transamerica IDEX Mutual Funds ("TA IDEX") held on November 2, 2005, the Board reviewed and considered the Investment Advisory Agreement between TA IDEX Protected Principal Stock (the "Fund") and Transamerica Fund Advisors, Inc. ("TFAI"), as well as the Investment Sub-Advisory Agreement of the Fund between TFAI and Gateway Investment Advisers, L.P. (the "Sub-Adviser"), to determine whether the agreements should be renewed for a one-year period. In light of the upcoming change-of-control of the Sub-Adviser, the Board also considered the successor agreement to the Investment Sub-Advisory Agreement. Following their review and consideration, the Trustees determined that the Investment Advisory Agreement and the Investment Sub-Advisory Agreement (as well as its successor agreement) will enable shareholders of the Fund to obtain high quality services at a cost that is appropriate, reasonable, a nd in the best interests of its shareholders. The Board, including the independent members of the Board, unanimously approved the renewal of the Investment Advisory Agreement, the Investment Sub-Advisory Agreement, as well as a successor agreement to the Investment Sub-Advisory Agreement, to take effect following an impending change of control with respect to the Sub-Adviser. In reaching their decision, the Trustees requested and obtained from TFAI and the Sub-Adviser such information as they deemed reasonably necessary to evaluate the proposed agreements. The Trustees also carefully considered the information that they had received throughout the year from TFAI and the Sub-Adviser (such as in-person presentations by the Sub-Adviser) as part of their regular oversight of the Fund, as well as: comparative fee, expense and performance information prepared by Lipper Inc. ("Lipper"), independent providers of mutual fund performance, fee and expense information, and profitability data. In considering the proposed continuation of the Investment Advisory Agreement and the Investment Sub-Advisory Agreement, the Trustees evaluated a number of considerations that they believe, in light of the legal advice furnished to them by TA IDEX counsel and independent legal counsel and their own business judgment, to be relevant. They based their decisions on the following considerations, among others, although they did not identify any consideration or particular information that was controlling of their decisions:
The nature, extent and quality of the advisory service to be provided. The Board considered the nature and quality of the services provided by TFAI and the Sub-Adviser to the Fund in the past, as well as the services anticipated to be provided in the future. The Board concluded that TFAI and the Sub-Adviser are capable of providing high quality services to the Fund, as indicated by the nature and quality of services provided in the past, TFAI's and the Sub-Adviser's management capabilities demonstrated with respect to the funds they manage, and the experience, capability and integrity of TFAI's senior management, the financial resources of TFAI and the Sub-Adviser, TFAI's management oversight process, the professional qualifications and experience of the Sub-Adviser's portfolio management team, and the Fund's investment performance. The Trustees also concluded that TFAI and the Sub-Adviser proposed to provide investment and related services that were of the same quality and quantity as services provided to the Fund in the past, and that these services are appropriate in scope and extent in light of the Fund's operations, the competitive landscape of the investment company business and investor needs, and that TFAI's and the Sub-Adviser's obligations will remain substantially the same.
The investment performance of the Fund. The Board examined both the short-term and longer-term performance of the Fund, including relative performance against a benchmark securities index and a peer group of comparable mutual funds as prepared by Lipper, for various trailing periods ended June 30, 2005. The Trustees conclude that TFAI and the Sub-Adviser generally had achieved acceptable investment performance, noting that although the Fund's performance has been below median relative to its peers and trailed the benchmark index over the past two-year period, its performance has been at median relative to its peers and approximated the benchmark index over the past one-year period. In addition, the Board noted that the Fund's principal protection goal lessened the relevance of a comparison of the Fund's performance against a benchmark index. On the ba sis of the Trustees' assessment of the nature, extent and quality of advisory services to be provided or procured by TFAI and the Sub-Adviser, the Trustees concluded that TFAI and the Sub-Adviser are capable of generating a level of investment performance that is appropriate in light of the Fund's investment objective, policies and strategies and competitive with many other investment companies, and also determined that TFAI's and the Sub-Adviser's continued management is likely to benefit the Fund and its shareholders.
The cost of advisory services provided and the level of profitability. The Board reviewed profitability information regarding TFAI's costs of procuring portfolio management services, as well as the costs of provision of administration, transfer agency, fund accounting and other services, to the Fund and to TA IDEX as a whole by TFAI and its affiliates. The Trustees reviewed data from Lipper that compared the Fund's management fees (including management fees at various asset levels), other fees and expenses (including total expenses including and excluding 12b-1 distribution and service fees) and portfolio turnover rate against a peer group of comparable mutual funds. Based on such information, the Trustees determined that the management fees and overall expense ratio of the Fund generally are consistent with industry averages for principal protected f unds. In addition, on the basis of the Board's review of the management fees to be charged by TFAI for investment advisory and related services,
Transamerica IDEX Mutual Funds
Semi-Annual Report 2006
17
TA IDEX Protected Principal Stock (continued)
the effect of the unique guarantee feature of the Fund on the level of management fees, TFAI profitability information (derived from TFAI's audited financial statements), TFAI's estimated management income resulting from its management of the Fund, the estimated margin of the Sub-Adviser, as well as the entirety of TFAI's and its affiliates' service relationship with TA IDEX, the Board concluded that the level of investment management fees and other service fees, as well as TFAI's and the Sub-Adviser's profitability, are appropriate in light of the services provided, the management fees and overall expense ratios of comparable investment companies and the anticipated profitability of the relationship between the Fund, TFAI and its affiliates, and the Sub-Adviser.
Whether fee levels reflect economies of scale and the extent to which economies of scale would be realized as the Fund grows. The Board concluded that the inclusion of asset-based breakpoints in the Fund's advisory fee schedule appropriately benefits investors by realizing economies of scale in the form of lower management fees as the level of assets grows. The Board noted that Fund is closed to new investors and will be closed to new investments in the near future, which may limit, to an extent, the ability of the Fund to realize economies of scale. In addition, the Board assessed the current asset levels of the Fund and the long-term development strategy for the Fund, and concluded that the Fund's current management fees appropriately reflect the Fund's current size, the current economic environment for TFAI, the competitive nature of the investment company market, and TFAI's pricing strategy. The Trustees also concluded that they will have the opportunity to periodically reexamine whether the Fund has achieved economies of scale, and the appropriateness of management fees payable to TFAI and fees payable by TFAI to the Sub-Adviser, in the future.
Benefits (such as soft dollars) to TFAI, its affiliates, or the Sub-Adviser from their relationship with the Fund. The Board concluded that other benefits derived by TFAI, its affiliates, and the Sub-Adviser from their relationship with the Fund are reasonable and fair, and are consistent with industry practice and the best interests of the Fund and its shareholders. In this regard, the Board noted that neither TFAI nor the Sub-Adviser realizes "soft dollar" benefits from its relationship with the Fund. In addition, the Trustees determined that the administration, transfer agency, fund accounting and other fees paid by the Fund to affiliates of TFAI are reasonable, fair and in the best interests of shareholders in light of the nature and quality of the services provided, the associated costs to these affiliates of providing the services, the impact of the costs of such services on the Fund's overall operating expenses, and the necessity of the services for the Fund's operations.
Other considerations. In considering the successor agreement to the Investment Sub-Advisory Agreement, the Board concluded that the successor agreement would provide continuity of portfolio management services, as the terms of the successor agreement would be substantially identical to those of the current Investment Sub-Advisory Agreement (including the sub-advisory fees) and it was contemplated that all of the current personnel associated with managing the Fund will be retained and continue to serve in their current capacity. Additionally, the Board also determined that TFAI had made a substantial commitment to the recruitment and retention of high quality personnel, and maintained the financial, compliance and operational resources reasonably necessary to manage the Fund in a professional manner that is consistent with the best interests of the Fun d and its shareholders. In this regard, the Trustees favorably considered the procedures and policies in place by TFAI to enforce compliance with applicable laws and regulations and oversee the portfolio management activities of the Sub-Adviser. The Trustees also determined that TFAI had made a significant entrepreneurial commitment to the management and success of the Fund, reflected by TFAI's expense limitation and fee waiver arrangement with the Fund, which may result in TFAI waiving advisory fees for the benefit of shareholders.
Transamerica IDEX Mutual Funds
Semi-Annual Report 2006
18
TA IDEX Salomon All Cap
UNDERSTANDING YOUR FUND'S EXPENSES
(unaudited)
SHAREHOLDER EXPENSES
Fund shareholders may incur two types of costs: (1) transaction costs, including sales charges (loads) on purchases, contingent deferred sales charges on redemptions and redemption fees; and (2) ongoing costs, including management fees, 12b-1 distribution and service fees, and other fund expenses.
The following Example is intended to help you understand your ongoing costs (in dollars and cents) of investing in the Fund and to compare these costs with the ongoing costs of investing in other funds.
The Example is based on an investment of $1,000 invested at November 1, 2005 and held for the entire period until April 30, 2006.
ACTUAL EXPENSES
The first line in the table below provides information about actual account values and actual expenses. You may use the information in this line, together with the amount you invested, to estimate the expenses that you paid over the period. Simply divide your account value by $1,000 (for example, an $8,600 account value divided by $1,000 = 8.6), then multiply the result by the number in the first line of your Fund under the heading entitled "Expenses Paid During Period" to estimate the expenses you paid on your account during this period. If your account is an IRA, your expenses could have included a $15 annual fee. The amount of any fee paid through your account would increase the estimate of expenses you paid during the period and decrease your ending account value.
HYPOTHETICAL EXAMPLE FOR COMPARISON PURPOSES
The second line in the table below provides information about hypothetical account values and hypothetical expenses based on the Fund's actual expense ratio and an assumed rate of return of 5% per year before expenses, which is not the Fund's actual return. The hypothetical account values and expenses may not be used to estimate the actual ending account balance or expenses you paid for the period. You may use this information to compare the ongoing costs of investing in your Fund and other funds. To do so, compare this 5% hypothetical example with the 5% hypothetical examples that appear in the shareholder reports of the other funds. As in the case of the actual expense example, if your account is subject to an IRA fee, the amount of the fee paid through your account would increase the hypothetical expenses you would have paid during the period and decrease the hypothetical ending account value.
Please note that the expenses shown in the table are meant to highlight your ongoing costs only and do not reflect any transactional costs, such as sales charges, redemption fees, brokerage commissions paid on purchases and sales of fund shares. Therefore, the second line under the Fund in the table is useful in comparing ongoing costs only, and will not help you determine the relative total costs of owning different funds. If any of these transaction costs were included, your costs would be higher. The expenses shown in the table do not reflect any fees that may be charged to you by brokers, financial intermediaries or other financial institutions.
| Beginning Account Value | Ending Account Value | Annualized Expense Ratio | Expenses Paid During Period (a) | ||||||||||||||||
| Class A | |||||||||||||||||||
| Actual | $ | 1,000.00 | $ | 1,127.60 | 1.55 | % | $ | 8.18 | |||||||||||
| Hypothetical (b) | 1,000.00 | 1,017.11 | 1.55 | 7.75 | |||||||||||||||
| Class B | |||||||||||||||||||
| Actual | 1,000.00 | 1,124.10 | 2.20 | 11.59 | |||||||||||||||
| Hypothetical (b) | 1,000.00 | 1,013.88 | 2.20 | 10.99 | |||||||||||||||
| Class C | |||||||||||||||||||
| Actual | 1,000.00 | 1,124.10 | 2.20 | 11.59 | |||||||||||||||
| Hypothetical (b) | 1,000.00 | 1,013.88 | 2.20 | 10.99 | |||||||||||||||
(a) Expenses are calculated using the Fund's annualized expense ratio (as disclosed in the table), multiplied by the average account value for the period, multiplied by number of days in the period (181 days), and divided by the number of days in the year (365 days).
(b) 5% return per year before expenses.
GRAPHICAL PRESENTATION OF SCHEDULE OF INVESTMENTS By Sector
At April 30, 2006
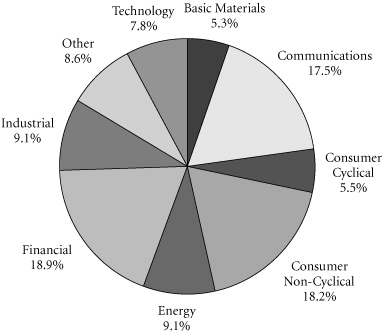
This chart shows the percentage breakdown by sector of the Fund's total investment securities.
Transamerica IDEX Mutual Funds
Semi-Annual Report 2006
1
TA IDEX Salomon All Cap
SCHEDULE OF INVESTMENTS
At April 30, 2006
(all amounts except share amounts in thousands)
(unaudited)
| Shares | Value | ||||||||||
| COMMON STOCKS (99.1%) | |||||||||||
| Aerospace (1.3%) | |||||||||||
| Boeing Co. (The) | 34,700 | $ | 2,896 | ||||||||
| Air Transportation (1.5%) | |||||||||||
| Southwest Airlines Co. | 205,700 | 3,336 | |||||||||
| Amusement & Recreation Services (2.0%) | |||||||||||
| Disney (Walt) Co. (The) | 161,200 | 4,507 | |||||||||
| Automotive (0.8%) | |||||||||||
| Lear Corp. † | 78,800 | 1,858 | |||||||||
| Beverages (0.6%) | |||||||||||
| Molson Coors Brewing Co.–Class B | 18,900 | 1,396 | |||||||||
| Business Services (2.5%) | |||||||||||
| Clear Channel Communications, Inc. | 95,700 | 2,730 | |||||||||
| Interpublic Group of Cos., Inc. †‡ | 303,000 | 2,903 | |||||||||
| Chemicals & Allied Products (2.4%) | |||||||||||
| Dow Chemical Co. (The) | 52,000 | 2,112 | |||||||||
| du Pont (E.I.) de Nemours & Co. | 71,600 | 3,158 | |||||||||
| Commercial Banks (9.1%) | |||||||||||
| Bank of America Corp. | 100,133 | 4,999 | |||||||||
| JP Morgan Chase & Co. | 125,600 | 5,700 | |||||||||
| Mitsubishi Tokyo Financial Group, Inc. | 420 | 6,583 | |||||||||
| State Street Corp. | 44,500 | 2,907 | |||||||||
| Communications Equipment (2.7%) | |||||||||||
| Motorola, Inc. | 131,000 | 2,797 | |||||||||
| Nokia Corp., ADR | 139,800 | 3,168 | |||||||||
| Computer & Data Processing Services (1.9%) | |||||||||||
| Microsoft Corp. | 168,600 | 4,072 | |||||||||
| VeriSign, Inc. ‡ | 9,500 | 223 | |||||||||
| Computer & Office Equipment (2.5%) | |||||||||||
| Cisco Systems, Inc. ‡ | 268,500 | 5,625 | |||||||||
| Diversified (2.2%) | |||||||||||
| Honeywell International, Inc. | 117,400 | 4,990 | |||||||||
| Electronic & Other Electric Equipment (2.0%) | |||||||||||
| Samsung Electronics Co., Ltd., GDR–144A | 13,300 | 4,535 | |||||||||
| Electronic Components & Accessories (3.3%) | |||||||||||
| Intel Corp. | 11,500 | 230 | |||||||||
| Novellus Systems, Inc. ‡ | 73,900 | 1,825 | |||||||||
| Taiwan Semiconductor Manufacturing Co., Ltd., ADR † | 288,955 | 3,028 | |||||||||
| Texas Instruments, Inc. | 68,100 | 2,364 | |||||||||
| Shares | Value | ||||||||||
| Food & Kindred Products (2.2%) | |||||||||||
| Kraft Foods, Inc.–Class A † | 70,400 | $ | 2,199 | ||||||||
| Unilever PLC, Sponsored ADR | 65,400 | 2,795 | |||||||||
| Food Stores (1.4%) | |||||||||||
| Safeway, Inc. | 124,400 | 3,126 | |||||||||
| Gas Production & Distribution (0.9%) | |||||||||||
| Williams Cos., Inc. (The) | 96,400 | 2,114 | |||||||||
| Health Services (1.0%) | |||||||||||
| Enzo Biochemical, Inc. †‡ | 177,299 | 2,177 | |||||||||
| Industrial Machinery & Equipment (5.5%) | |||||||||||
| Applied Materials, Inc. | 153,900 | 2,763 | |||||||||
| Baker Hughes, Inc. | 26,400 | 2,134 | |||||||||
| Caterpillar, Inc. | 60,200 | 4,560 | |||||||||
| Deere & Co. | 31,600 | 2,774 | |||||||||
| Instruments & Related Products (3.1%) | |||||||||||
| Agilent Technologies, Inc. ‡ | 73,100 | 2,809 | |||||||||
| Raytheon Co. | 91,300 | 4,042 | |||||||||
| Insurance (6.3%) | |||||||||||
| American International Group, Inc. | 41,200 | 2,688 | |||||||||
| Chubb Corp. | 67,960 | 3,503 | |||||||||
| MGIC Investment Corp. | 35,800 | 2,531 | |||||||||
| PMI Group, Inc. (The) | 113,900 | 5,256 | |||||||||
| Insurance Agents, Brokers & Service (1.2%) | |||||||||||
| Hartford Financial Services Group, Inc. (The) | 28,100 | 2,583 | |||||||||
| Lumber & Other Building Materials (1.2%) | |||||||||||
| Home Depot, Inc. (The) | 64,500 | 2,575 | |||||||||
| Lumber & Wood Products (1.2%) | |||||||||||
| Weyerhaeuser Co. | 36,800 | 2,593 | |||||||||
| Mining (0.1%) | |||||||||||
| WGI Heavy Minerals, Inc. ‡ | 127,600 | 116 | |||||||||
| Motion Pictures (5.1%) | |||||||||||
| News Corp., Inc.–Class A | 81,200 | 1,393 | |||||||||
| News Corp., Inc.–Class B † | 328,800 | 5,994 | |||||||||
| Time Warner, Inc. | 224,000 | 3,898 | |||||||||
| Oil & Gas Extraction (3.9%) | |||||||||||
| Anadarko Petroleum Corp. | 20,600 | 2,159 | |||||||||
| GlobalSantaFe Corp. | 28,500 | 1,744 | |||||||||
| Halliburton Co. | 32,800 | 2,563 | |||||||||
| Schlumberger, Ltd. | 33,400 | 2,309 | |||||||||
| Paper & Allied Products (0.2%) | |||||||||||
| Kimberly-Clark Corp. | 9,400 | 550 | |||||||||
The notes to the financial statements are an integral part of this report.
Transamerica IDEX Mutual Funds
Semi-Annual Report 2006
2
TA IDEX Salomon All Cap
SCHEDULE OF INVESTMENTS (continued)
At April 30, 2006
(all amounts except share amounts in thousands)
(unaudited)
| Shares | Value | ||||||||||
| Petroleum Refining (4.0%) | |||||||||||
| BP PLC, ADR | 9,500 | $ | 700 | ||||||||
| Chevron Corp. | 20,700 | 1,263 | |||||||||
| ConocoPhillips | 21,700 | 1,452 | |||||||||
| Exxon Mobil Corp. | 30,300 | 1,911 | |||||||||
| Murphy Oil Corp. | 71,600 | 3,593 | |||||||||
| Pharmaceuticals (13.0%) | |||||||||||
| Abbott Laboratories | 107,900 | 4,612 | |||||||||
| Amgen, Inc. ‡ | 29,400 | 1,990 | |||||||||
| Aphton Corp. †‡ | 553,200 | 91 | |||||||||
| GlaxoSmithKline PLC, ADR † | 57,900 | 3,293 | |||||||||
| Johnson & Johnson | 59,000 | 3,458 | |||||||||
| Lilly (Eli) & Co. | 39,900 | 2,112 | |||||||||
| Novartis AG, ADR | 70,200 | 4,037 | |||||||||
| Pfizer, Inc. | 180,600 | 4,575 | |||||||||
| Wyeth | 101,100 | 4,921 | |||||||||
| Primary Metal Industries (2.2%) | |||||||||||
| Alcoa, Inc. | 77,700 | 2,625 | |||||||||
| RTI International Metals, Inc. ‡ | 37,100 | 2,231 | |||||||||
| Radio & Television Broadcasting (2.0%) | |||||||||||
| Pearson PLC | 329,200 | 4,548 | |||||||||
| Retail Trade (1.5%) | |||||||||||
| Wal-Mart Stores, Inc. | 74,100 | 3,337 | |||||||||
| Security & Commodity Brokers (4.0%) | |||||||||||
| American Express Co. | 51,400 | 2,766 | |||||||||
| Ameriprise Financial, Inc. | 10,500 | 515 | |||||||||
| Goldman Sachs Group, Inc. (The) | 4,400 | 705 | |||||||||
| Merrill Lynch & Co., Inc. | 66,100 | 5,041 | |||||||||
| Telecommunications (2.1%) | |||||||||||
| Vodafone Group PLC, ADR | 193,000 | 4,574 | |||||||||
| Toys, Games & Hobbies (1.0%) | |||||||||||
| Hasbro, Inc. | 112,900 | 2,225 | |||||||||
| Wholesale Trade Nondurable Goods (1.2%) | |||||||||||
| Unilever PLC | 243,500 | 2,578 | |||||||||
| Total Common Stocks (cost: $187,043) | 221,043 | ||||||||||
| Principal | Value | ||||||||||
| SECURITY LENDING COLLATERAL (9.3%) | |||||||||||
| Debt (8.7%) | |||||||||||
| Bank Notes (1.0%) | |||||||||||
| Bank of America 4.81%, due 06/07/2006 * $680 $680 4.81%, due 08/10/2006 * | 656 | 656 | |||||||||
| Principal | Value | ||||||||||
| Bank Notes (continued) | |||||||||||
| Bear Stearns & Co. 5.01%, due 06/06/2006 * $262 $262 5.01%, due 09/07/2006 * | 788 | 788 | |||||||||
| Certificates Of Deposit (0.6%) | |||||||||||
| Halifax Bank of Scotland 4.78%, due 06/06/2006 * | 656 | 656 | |||||||||
| Rabobank Nederland 4.87%, due 05/31/2006 * | 656 | 656 | |||||||||
| Commercial Paper (0.5%) | |||||||||||
| Banco Santander Central Hispano SA 4.77%, due 05/02/2006 | 394 | 394 | |||||||||
| Sheffield Receivables Corp.–144A 4.81%, due 05/03/2006 | 655 | 655 | |||||||||
| Euro Dollar Overnight (1.6%) | |||||||||||
| Bank of Montreal 4.77%, due 05/02/2006 | 525 | 525 | |||||||||
| Dexia Group 4.78%, due 05/04/2006 | 656 | 656 | |||||||||
| Fortis Bank 4.77%, due 05/01/2006 | 263 | 263 | |||||||||
| Royal Bank of Canada 4.77%, due 05/01/2006 | 919 | 919 | |||||||||
| Royal Bank of Scotland 4.75%, due 05/03/2006 | 656 | 656 | |||||||||
| Svenska Handlesbanken 4.82%, due 05/01/2006 | 501 | 501 | |||||||||
| Euro Dollar Terms (2.4%) | |||||||||||
| BancoBilbao Vizcaya Argentaria SA 4.95%, due 06/20/2006 | 525 | 525 | |||||||||
| Bank of the West 4.94%, due 06/16/2006 | 525 | 525 | |||||||||
| Barclays 4.79%, due 05/10/2006 788 788 4.77%, due 05/16/2006 | 263 | 263 | |||||||||
| Canadian Imperial Bank of Commerce 4.97%, due 06/23/2006 | 394 | 394 | |||||||||
| Credit Suisse First Boston Corp. 4.73%, due 05/08/2006 | 394 | 394 | |||||||||
| Fortis Bank 4.83%, due 05/08/2006 | 263 | 263 | |||||||||
| Lloyds TSB Bank 4.81%, due 05/11/2006 | 394 | 394 | |||||||||
| Royal Bank of Scotland 4.87%, due 05/12/2006 | 525 | 525 | |||||||||
The notes to the financial statements are an integral part of this report.
Transamerica IDEX Mutual Funds
Semi-Annual Report 2006
3
TA IDEX Salomon All Cap
SCHEDULE OF INVESTMENTS (continued)
At April 30, 2006
(all amounts except share amounts in thousands)
(unaudited)
| Principal | Value | ||||||||||
| Euro Dollar Terms (continued) | |||||||||||
| Societe Generale 4.79%, due 05/10/2006 | $ | 656 | $ | 656 | |||||||
| UBS AG 4.95%, due 06/20/2006 | 656 | 656 | |||||||||
| Repurchase Agreements (2.6%) †† | |||||||||||
| Credit Suisse First Boston Corp. 4.92%, dated 04/28/2006 to be repurchased at $892 on 05/01/2006 | 891 | 891 | |||||||||
| Goldman Sachs Group, Inc. (The) 4.92%, dated 04/28/2006 to be repurchased at $1,929 on 05/01/2006 | 1,928 | 1,928 | |||||||||
| Lehman Brothers, Inc. 4.92%, dated 04/28/2006 to be repurchased at $33 on 05/01/2006 | 33 | 33 | |||||||||
| Merrill Lynch & Co. 4.87%, dated 04/28/2006 to be repurchased at $1,970 on 05/01/2006 | 1,969 | 1,969 | |||||||||
| Morgan Stanley Dean Witter & Co. 4.93%, dated 04/28/2006 to be repurchased at $919 on 05/01/2006 | 919 | 919 | |||||||||
| Shares | Value | ||||||||||
| Investment Companies (0.6%) | |||||||||||
| Barclays Global Investors Institutional Money Market Fund 1-day yield of 4.78% | 1,050,072 | $ | 1,050 | ||||||||
| Merrimac Cash Fund, Premium Class 1-day yield of 4.61% @ | 279,388 | 279 | |||||||||
| Total Security Lending Collateral (cost: $20,719) | 20,719 | ||||||||||
| Total Investment Securities (cost: $207,762) # | $ | 241,762 | |||||||||
NOTES TO SCHEDULE OF INVESTMENTS:
† At April 30, 2006, all or a portion of this security is on loan (see Note 1). The value at April 30, 2006, of all securities on loan is $19,510.
‡ Non-income producing.
* Floating or variable rate note. Rate is listed as of April 30, 2006.
†† Cash collateral for the Repurchase Agreements, valued at $5,909, that serve as collateral for securities lending are invested in corporate bonds with interest rates and maturity dates ranging from 0.00%–9.05% and 05/02/2006–12/31/2049, respectively.
@ Regulated investment company advised by Investors Bank and Trust Co. ("IBT"). IBT is also the accounting, custody and lending agent for the Fund.
# Aggregate cost for Federal income tax purposes is $208,467. Aggregate gross unrealized appreciation for all securities in which there is an excess of value over tax cost and aggregate gross unrealized depreciation for all securities in which there is an excess of tax cost over value were $40,701 and $7,406, respectively. Net unrealized appreciation for tax purposes is $33,295.
DEFINITIONS:
144A 144A Securities are registered pursuant to Rule 144A of the Securities Act of 1933. These securities are deemed to be liquid for purposes of compliance limitations on holdings of illiquid securities and may be resold as transactions exempt from registration, normally to qualified institutional buyers. At April 30, 2006, these securities aggregated $5,190 or 2.3% of the net assets of the Fund.
ADR American Depositary Receipt
GDR Global Depositary Receipt
The notes to the financial statements are an integral part of this report.
Transamerica IDEX Mutual Funds
Semi-Annual Report 2006
4
TA IDEX Salomon All Cap
STATEMENT OF ASSETS AND LIABILITIES
At April 30, 2006
(all amounts except per share amounts in thousands)
(unaudited)
| Assets: | |||||||
| Investment securities, at value (cost: $207,762) (including securities loaned of $19,510) | $ | 241,762 | |||||
| Cash | 2,366 | ||||||
| Receivables: | |||||||
| Investment securities sold | 158 | ||||||
| Shares of beneficial interest sold | 62 | ||||||
| Interest | 18 | ||||||
| Income from loaned securities | 1 | ||||||
| Dividends | 277 | ||||||
| Dividend reclaims receivable | 13 | ||||||
| Other | 26 | ||||||
| 244,683 | |||||||
| Liabilities: | |||||||
| Accounts payable and accrued liabilities: | |||||||
| Shares of beneficial interest redeemed | 424 | ||||||
| Management and advisory fees | 146 | ||||||
| Distribution and service fees | 152 | ||||||
| Transfer agent fees | 101 | ||||||
| Administration fees | 4 | ||||||
| Payable for collateral for securities on loan | 20,719 | ||||||
| Other | 82 | ||||||
| 21,628 | |||||||
| Net Assets | $ | 223,055 | |||||
| Net Assets Consist of: | |||||||
| Shares of beneficial interest, unlimited shares authorized, no par value | $ | 163,617 | |||||
| Distributable net investment income (loss) | (280 | ) | |||||
| Accumulated net realized gain (loss) from investment securities and foreign currency transactions | 25,715 | ||||||
| Net unrealized appreciation (depreciation) on: Investment securities | 33,999 | ||||||
| Translation of assets and liabilities denominated in foreign currencies | 4 | ||||||
| Net Assets | $ | 223,055 | |||||
| Net Assets by Class: | |||||||
| Class A | $ | 58,561 | |||||
| Class B | 119,710 | ||||||
| Class C | 44,784 | ||||||
| Shares Outstanding: | |||||||
| Class A | 3,336 | ||||||
| Class B | 7,165 | ||||||
| Class C | 2,680 | ||||||
| Net Asset Value Per Share: | |||||||
| Class A | $ | 17.56 | |||||
| Class B | 16.71 | ||||||
| Class C | 16.71 | ||||||
| Maximum Offering Price Per Share (a): | |||||||
| Class A | $ | 18.58 | |||||
(a) Includes the maximum selling commission (represented as a percentage of offering price) which is reduced on certain levels of sales as set forth in the Prospectus. Net asset value per share for Classes B and C shares represents offering price. The redemption price for Classes B and C shares equals net asset value less any applicable contingent deferred sales charge.
STATEMENT OF OPERATIONS
For the period ended April 30, 2006 (b)
(all amounts in thousands)
(unaudited)
| Investment Income: | |||||||
| Dividends (net of withholding taxes on foreign dividends of $14) | $ | 2,132 | |||||
| Interest | 148 | ||||||
| Income from loaned securities–net | 32 | ||||||
| 2,312 | |||||||
| Expenses: | |||||||
| Management and advisory fees | 1,024 | ||||||
| Distribution and service fees: | |||||||
| Class A | 120 | ||||||
| Class B | 609 | ||||||
| Class C | 235 | ||||||
| Transfer agent fees: | |||||||
| Class A | 105 | ||||||
| Class B | 196 | ||||||
| Class C | 63 | ||||||
| Class I | – | (c) | |||||
| Printing and shareholder reports | 50 | ||||||
| Custody fees | 22 | ||||||
| Administration fees | 26 | ||||||
| Legal fees | 7 | ||||||
| Audit fees | 9 | ||||||
| Trustees fees | 6 | ||||||
| Registration fees | 34 | ||||||
| Other | 4 | ||||||
| Total expenses | 2,510 | ||||||
| Less: | |||||||
| Reimbursement of class expenses: | |||||||
| Class A | (11 | ) | |||||
| Class B | (30 | ) | |||||
| Total reimbursed expenses | (41 | ) | |||||
| Net expenses | 2,469 | ||||||
| Net Investment Income (Loss) | (157 | ) | |||||
| Net Realized Gain (Loss) from: | |||||||
| Investment securities | 26,084 | ||||||
| Foreign currency transactions | (28 | ) | |||||
| 26,056 | |||||||
| Net Increase (Decrease) in Unrealized Appreciation (Depreciation) on: | |||||||
| Investment securities | 6,211 | ||||||
| Translation of assets and liabilities denominated in foreign currencies | 4 | ||||||
| 6,215 | |||||||
| Net Realized and Unrealized Gain (Loss) on Investment Securities and Foreign Currency Transactions | 32,271 | ||||||
| Net Increase (Decrease) in Net Assets Resulting from Operations | $ | 32,114 | |||||
(b) Class I was offered for investment on November 15, 2005.
(c) Rounds to less than $1.
The notes to the financial statements are an integral part of this report.
Transamerica IDEX Mutual Funds
Semi-Annual Report 2006
5
TA IDEX Salomon All Cap
STATEMENTS OF CHANGES IN NET ASSETS
For the period or year ended
(all amounts in thousands)
| April 30, 2006 (unaudited) (a) | October 31, 2005 | ||||||||||
| Increase (Decrease) In Net Assets From: | |||||||||||
| Operations: | |||||||||||
| Net investment income (loss) | $ | (157 | ) | $ | (166 | ) | |||||
| Net realized gain (loss) from investment securities and foreign currency transactions | 26,056 | 58,878 | |||||||||
| Change in unrealized appreciation (depreciation) on investment securities and foreign currency translation | 6,215 | (15,198 | ) | ||||||||
| 32,114 | 43,514 | ||||||||||
| Distributions to Shareholders: | |||||||||||
| From net investment income: | |||||||||||
| Class A | (74 | ) | (19 | ) | |||||||
| Class B | (30 | ) | – | ||||||||
| Class C | (12 | ) | – | ||||||||
| (116 | ) | (19 | ) | ||||||||
| From net realized gains: | |||||||||||
| Class A | (1,963 | ) | – | ||||||||
| Class B | (4,251 | ) | – | ||||||||
| Class C | (1,665 | ) | – | ||||||||
| Class I | (1,431 | ) | – | ||||||||
| (9,310 | ) | – | |||||||||
| Capital Share Transactions: | |||||||||||
| Proceeds from shares sold: | |||||||||||
| Class A | 2,690 | 4,851 | |||||||||
| Class B | 2,841 | 6,793 | |||||||||
| Class C | 1,645 | 2,933 | |||||||||
| Class I | 115,961 | – | |||||||||
| 123,137 | 14,577 | ||||||||||
| Dividends and distributions reinvested: | |||||||||||
| Class A | 1,945 | 19 | |||||||||
| Class B | 3,947 | – | |||||||||
| Class C | 1,557 | – | |||||||||
| Class I | 1,431 | – | |||||||||
| 8,880 | 19 | ||||||||||
| Cost of shares redeemed: | |||||||||||
| Class A | (127,032 | ) | (297,064 | ) | |||||||
| Class B | (20,451 | ) | (44,894 | ) | |||||||
| Class C | (12,199 | ) | (23,071 | ) | |||||||
| Class I | (119,300 | ) | – | ||||||||
| (278,982 | ) | (365,029 | ) | ||||||||
| Redemption fees: | |||||||||||
| Class B | – | 3 | |||||||||
| – | 3 | ||||||||||
| April 30, 2006 (unaudited) (a) | October 31, 2005 | ||||||||||
| Automatic conversions: | |||||||||||
| Class A | $ | 200 | $ | 294 | |||||||
| Class B | (200 | ) | (294 | ) | |||||||
| – | – | ||||||||||
| (146,965 | ) | (350,430 | ) | ||||||||
| Net increase (decrease) in net assets | (124,277 | ) | (306,935 | ) | |||||||
| Net Assets: | |||||||||||
| Beginning of period | 347,332 | 654,267 | |||||||||
| End of period | $ | 223,055 | $ | 347,332 | |||||||
| Distributable Net Investment Income (Loss) | $ | (280 | ) | $ | (7 | ) | |||||
| Share Activity: | |||||||||||
| Shares issued: | |||||||||||
| Class A | 160 | 309 | |||||||||
| Class B | 177 | 452 | |||||||||
| Class C | 103 | 195 | |||||||||
| Class I | 7,081 | – | |||||||||
| 7,521 | 956 | ||||||||||
| Shares issued–reinvested from distributions: | |||||||||||
| Class A | 119 | 1 | |||||||||
| Class B | 253 | – | |||||||||
| Class C | 100 | – | |||||||||
| Class I | 87 | – | |||||||||
| 559 | 1 | ||||||||||
| Shares redeemed: | |||||||||||
| Class A | (7,757 | ) | (19,117 | ) | |||||||
| Class B | (1,275 | ) | (2,978 | ) | |||||||
| Class C | (765 | ) | (1,537 | ) | |||||||
| Class I | (7,168 | ) | – | ||||||||
| (16,965 | ) | (23,632 | ) | ||||||||
| Automatic conversions: | |||||||||||
| Class A | 12 | 19 | |||||||||
| Class B | (13 | ) | (19 | ) | |||||||
| (1 | ) | – | |||||||||
| Net increase (decrease) in shares outstanding: | |||||||||||
| Class A | (7,466 | ) | (18,788 | ) | |||||||
| Class B | (858 | ) | (2,545 | ) | |||||||
| Class C | (562 | ) | (1,342 | ) | |||||||
| Class I | (0 | ) | – | ||||||||
| (8,886 | ) | (22,675 | ) | ||||||||
(a) Class I was offered for investment on November 15, 2005.
The notes to the financial statements are an integral part of this report.
Transamerica IDEX Mutual Funds
Semi-Annual Report 2006
6
TA IDEX Salomon All Cap
FINANCIAL HIGHLIGHTS
(unaudited for the period ended April 30, 2006)
| For a share of beneficial interest outstanding throughout each period | |||||||||||||||||||||||||||||||||||||||
| Net Asset | Investment Operations | Distributions | Net Asset | ||||||||||||||||||||||||||||||||||||
| For the Period Ended (d)(g) | Value, Beginning of Period | Net Investment Income (Loss) | Net Realized and Unrealized Gain (Loss) | Total Operations | From Net Investment Income | From Net Realized Gains | Total Distributions | Value, End of Period | |||||||||||||||||||||||||||||||
| Class A | 4/30/2006 | $ | 16.10 | $ | 0.03 | $ | 1.98 | $ | 2.01 | $ | – | (h) | $ | (0.55 | ) | $ | (0.55 | ) | $ | 17.56 | |||||||||||||||||||
| 10/31/2005 | 14.80 | 0.06 | 1.24 | 1.30 | – | (h) | – | – | 16.10 | ||||||||||||||||||||||||||||||
| 10/31/2004 | 13.95 | (0.03 | ) | 0.88 | 0.85 | – | – | – | 14.80 | ||||||||||||||||||||||||||||||
| 10/31/2003 | 10.34 | (0.04 | ) | 3.65 | 3.61 | – | – | – | 13.95 | ||||||||||||||||||||||||||||||
| 10/31/2002 | 13.63 | – | (3.15 | ) | (3.15 | ) | – | (0.14 | ) | (0.14 | ) | 10.34 | |||||||||||||||||||||||||||
| 10/31/2001 | 15.51 | 0.12 | (1.58 | ) | (1.46 | ) | – | (0.42 | ) | (0.42 | ) | 13.63 | |||||||||||||||||||||||||||
| Class B | 4/30/2006 | 15.39 | (0.04 | ) | 1.91 | 1.87 | – | (h) | (0.55 | ) | (0.55 | ) | 16.71 | ||||||||||||||||||||||||||
| 10/31/2005 | 14.27 | (0.09 | ) | 1.21 | 1.12 | – | – | – | 15.39 | ||||||||||||||||||||||||||||||
| 10/31/2004 | 13.53 | (0.11 | ) | 0.85 | 0.74 | – | – | – | 14.27 | ||||||||||||||||||||||||||||||
| 10/31/2003 | 10.08 | (0.12 | ) | 3.57 | 3.45 | – | – | – | 13.53 | ||||||||||||||||||||||||||||||
| 10/31/2002 | 13.41 | (0.10 | ) | (3.09 | ) | (3.19 | ) | – | (0.14 | ) | (0.14 | ) | 10.08 | ||||||||||||||||||||||||||
| 10/31/2001 | 15.36 | 0.02 | (1.55 | ) | (1.53 | ) | – | (0.42 | ) | (0.42 | ) | 13.41 | |||||||||||||||||||||||||||
| Class C | 4/30/2006 | 15.39 | (0.03 | ) | 1.90 | 1.87 | – | (h) | (0.55 | ) | (0.55 | ) | 16.71 | ||||||||||||||||||||||||||
| 10/31/2005 | 14.26 | (0.08 | ) | 1.21 | 1.13 | – | – | – | 15.39 | ||||||||||||||||||||||||||||||
| 10/31/2004 | 13.53 | (0.12 | ) | 0.85 | 0.73 | – | – | – | 14.26 | ||||||||||||||||||||||||||||||
| 10/31/2003 | 10.26 | (0.12 | ) | 3.39 | 3.27 | – | – | – | 13.53 | ||||||||||||||||||||||||||||||
| Ratios/Supplemental Data | |||||||||||||||||||||||||||||||
| For the Period | Total | Net Assets, End of Period | Ratio of Expenses to Average Net Assets (a) | Net Investment Income (Loss) to Average | Portfolio Turnover | ||||||||||||||||||||||||||
| Ended (g) | Return (c) | (000's) | Net (e) | Total (f) | Net Assets (a) | Rate (b) | |||||||||||||||||||||||||
| Class A | 4/30/2006 | 12.76 | % | $ | 58,561 | 1.55 | % | 1.58 | % | 0.33 | % | 18 | % | ||||||||||||||||||
| 10/31/2005 | 8.79 | 173,929 | 1.32 | 1.32 | 0.36 | 27 | |||||||||||||||||||||||||
| 10/31/2004 | 6.09 | 438,047 | 1.33 | 1.33 | (0.17 | ) | 25 | ||||||||||||||||||||||||
| 10/31/2003 | 34.91 | 271,958 | 1.55 | 1.64 | (0.36 | ) | 30 | ||||||||||||||||||||||||
| 10/31/2002 | (23.44 | ) | 57,528 | 1.55 | 1.65 | (0.03 | ) | 162 | |||||||||||||||||||||||
| 10/31/2001 | (9.49 | ) | 77,791 | 1.58 | 1.68 | 0.75 | 82 | ||||||||||||||||||||||||
| Class B | 4/30/2006 | 12.41 | 119,710 | 2.20 | 2.25 | (0.45 | ) | 18 | |||||||||||||||||||||||
| 10/31/2005 | 7.84 | 123,494 | 2.19 | 2.19 | (0.58 | ) | 27 | ||||||||||||||||||||||||
| 10/31/2004 | 5.48 | 150,829 | 1.97 | 1.97 | (0.80 | ) | 25 | ||||||||||||||||||||||||
| 10/31/2003 | 34.23 | 158,147 | 2.20 | 2.29 | (1.01 | ) | 30 | ||||||||||||||||||||||||
| 10/31/2002 | (24.11 | ) | 130,709 | 2.20 | 2.30 | (0.68 | ) | 162 | |||||||||||||||||||||||
| 10/31/2001 | (10.09 | ) | 167,214 | 2.23 | 2.33 | 0.10 | 82 | ||||||||||||||||||||||||
| Class C | 4/30/2006 | 12.41 | 44,784 | 2.20 | 2.20 | (0.44 | ) | 18 | |||||||||||||||||||||||
| 10/31/2005 | 7.89 | 49,909 | 2.15 | 2.15 | (0.53 | ) | 27 | ||||||||||||||||||||||||
| 10/31/2004 | 5.43 | 65,391 | 1.99 | 1.99 | (0.83 | ) | 25 | ||||||||||||||||||||||||
| 10/31/2003 | 31.87 | 2,547 | 2.20 | 2.29 | (1.01 | ) | 30 | ||||||||||||||||||||||||
The notes to the financial statements are an integral part of this report.
Transamerica IDEX Mutual Funds
Semi-Annual Report 2006
7
TA IDEX Salomon All Cap
FINANCIAL HIGHLIGHTS (continued)
(unaudited)
NOTES TO FINANCIAL HIGHLIGHTS
(a) Annualized.
(b) Not annualized.
(c) Total Return has been calculated for the applicable period without deduction of a sales load, if any, on an initial purchase. Not annualized.
(d) Per share information is calculated based on average number of shares outstanding.
(e) Ratio of Net Expenses to Average Net Assets is net of fee waivers and reimbursements by the investment adviser, if any (see note 2).
(f) Ratio of Total Expenses to Average Net Assets includes all expenses before fee waivers and reimbursements by the investment adviser.
(g) The inception date for the Fund's offering of share Class C was November 11, 2002.
(h) Rounds to less than $(0.01) per share.
The notes to the financial statements are an integral part of this report.
Transamerica IDEX Mutual Funds
Semi-Annual Report 2006
8
TA IDEX Salomon All Cap
NOTES TO FINANCIAL STATEMENTS
At April 30, 2006
(all amounts in thousands)
(unaudited)
NOTE 1. ORGANIZATION AND SIGNIFICANT ACCOUNTING POLICIES
Transamerica IDEX Mutual Funds is an open-end management investment company registered under the Investment Company Act of 1940, as amended (the "1940 Act").
The TA IDEX Salomon All Cap (the "Fund") is "non-diversified" under the 1940 act.
In the normal course of business, the Fund enters into contracts that contain a variety of representations that provide general indemnifications. The Fund's maximum exposure under these arrangements is unknown, as this would involve future claims that may be made against the Fund and/or its affiliates that have not yet occurred. However, based on experience, the Fund expects the risk of loss to be remote.
This report should be read in conjunction with the current Fund prospectus, which contains more complete information about the Fund.
In preparing the Fund's financial statements in accordance with accounting principles generally accepted in the United States of America ("GAAP"), estimates or assumptions (which could differ from actual results) may be used that affect reported amounts and disclosures. The following is a summary of significant accounting policies followed by the Fund.
Multiple class operations, income and expenses: The Fund currently has four classes of shares, Class A, Class B, Class C and Class I, each with different expense levels. Class I commenced operations on November 15, 2005. Class I is only available for investment to certain affiliated asset allocation funds. Class I is currently uninvested. Class B shares will convert to Class A shares eight years after purchase. Income, non-class specific expenses and realized and unrealized gains and losses, are allocated daily to each class, based upon the value of shares outstanding method as permitted under Rule 18f-3 of the 1940 Act. Each class bears its own specific expenses as well as a portion of general, common expenses.
Security valuations: The Fund values its investments at the close of the New York Stock Exchange ("NYSE"), normally 4 p.m. ET, each day the NYSE is open for business. Fund investments are valued at the last sale price or closing price on the day of valuation taken from the primary exchange where the security is principally traded.
Securities traded in the over-the-counter market and listed securities for which no sale was reported on that date are valued at the last quoted bid price.
Debt securities are valued based on a price quotation or other equivalent indication of value supplied by an exchange, a pricing service or a major market maker; however, those that mature in sixty days or less are valued at amortized cost, which approximates market.
Investment company securities are valued at the net asset value of the underlying portfolio.
Foreign securities generally are valued based on quotations from the primary market in which they are traded. Because many foreign securities markets and exchanges close prior to the close of the NYSE, closing prices for foreign securities in those markets or on those exchanges do not reflect the events that occur after that close. If a significant market event impacting the value of a portfolio security (e.g., natural disaster, company announcement, market volatility) occurs subsequent to the close of trading in the security, but prior to the calculation of the Fund's net asset value per share, market quotations for that security may be determined to be unreliable and, accordingly, not "readily available." As a result, foreign equity securities held by the Fund may be valued at fair market value as determined in good faith by the Fund's Administrative Valuation Committee, under the supervision of the Board's Valuation Committee , using guidelines adopted by the Board of Trustees.
Other securities for which quotations are not readily available or whose values have been determined to be unreliable are valued at fair market value as determined in good faith by the Fund's Administrative Valuation Committee, under the supervision of the Board's Valuation Committee, using guidelines adopted by the Board of Trustees.
Cash: The Fund may leave cash overnight in its cash account with the custodian, Investors Bank & Trust Company ("IBT"). IBT has been contracted on behalf of the Fund to invest the excess cash into a savings account, which at April 30, 2006, was paying an interest rate of 3.24%.
Repurchase agreements: The Fund is authorized to enter into repurchase agreements. The Fund, through its custodian, IBT, receives delivery of the underlying securities, the value of which at the time of purchase is required to be an amount equal to at least 100% of the resale price. The Fund will bear the risk of value fluctuations until the security can be sold and may encounter delays and incur costs in liquidating the security. In the event of bankruptcy or insolvency of the seller, delays and costs may be incurred.
Commission recapture: The sub-adviser, to the extent consistent with the best execution and usual commission rate policies and practices, may place security transactions of the Fund with broker/dealers with which Transamerica IDEX Mutual Funds has established a Commission Recapture Program. A Commission Recapture Program is any arrangement under which a broker/dealer applies a portion of the commissions received by such broker/dealer on the security transactions to the Fund. In no event will commissions paid by the Fund be used to pay expenses that would otherwise be borne by any other funds within Transamerica IDEX Mutual Funds, or by any other party.
Transamerica IDEX Mutual Funds
Semi-Annual Report 2006
9
TA IDEX Salomon All Cap
NOTES TO FINANCIAL STATEMENTS (continued)
At April 30, 2006
(all amounts in thousands)
(unaudited)
NOTE 1.–(continued)
Recaptured commissions during the six months ended April 30, 2006, of $28 are included in net realized gains on the Statement of Operations.
Securities lending: The Fund may lend securities to qualified borrowers, with IBT acting as the Fund's lending agent. The Fund earns negotiated lenders' fees. The Fund receives cash and/or securities as collateral against the loaned securities. Cash collateral received is invested in short term, interest bearing securities. The Fund monitors the market value of securities loaned on a daily basis and requires collateral in an amount at least equal to the value of the securities loaned. Income from loaned securities on the Statement of Operations is net of fees, in the amount of $14, earned by IBT for its services.
Security transactions and investment income: Security transactions are recorded on the trade date. Security gains and losses are calculated on the specific identification basis. Dividend income, if any, is recorded on the ex-dividend date or, in the case of foreign securities, as soon as the Fund is informed of the ex-dividend date. Interest income, including accretion of discounts and amortization of premiums, is recorded on the accrual basis commencing on the settlement date.
Foreign currency denominated investments: The accounting records of the Fund are maintained in U.S. dollars. Securities and other assets and liabilities denominated in foreign currencies are translated into U.S. dollars at the closing exchange rate each day. The cost of foreign securities is translated at the exchange rate in effect when the investment was acquired. The Fund combines fluctuations from currency exchange rates and fluctuations in value when computing net realized and unrealized gains or losses from investments.
Net foreign currency gains and losses resulting from changes in exchange rates include: 1) foreign currency fluctuations between trade date and settlement date of investment security transactions; 2) gains and losses on forward foreign currency contracts; and 3) the difference between the receivable amounts of interest and dividends recorded in the accounting records in U.S. dollars and the amounts actually received.
Foreign currency denominated assets may involve risks not typically associated with domestic transactions. These risks include revaluation of currencies, adverse fluctuations in foreign currency values and possible adverse political, social and economic developments, including those particular to a specific industry, country or region.
Redemption fees: A short-term trading redemption fee may be assessed on any Fund shares in a fund account that are sold during the first five (5) NYSE trading days following their purchase date. This redemption fee will equal 2% of the amount redeemed and shares held the longest will be treated as being redeemed first and shares held the shortest as being redeemed last. For the six months ended April 30, 2006, the Fund received less than $1 in redemption fees.
Dividend distributions: Distributions to shareholders are recorded on the ex-dividend date and are determined in accordance with Federal income tax regulations which may differ from GAAP.
NOTE 2. RELATED PARTY TRANSACTIONS
Transamerica Fund Advisors, Inc. ("TFAI") is the Fund's investment adviser. Transamerica Fund Services, Inc. ("TFS") is the Fund's administrator and transfer agent. AFSG Securities Corp. ("AFSG") is the Fund's distributor/principal underwriter. TFAI, TFS, and AFSG are affiliates of AEGON, NV, a Netherlands corporation.
Certain officers and trustees of the Fund are also officers and/or directors of TFAI, TFS and AFSG.
Investment advisory fees: The Fund pays management fees to TFAI based on average daily net assets ("ANA") at the following breakpoints:
0.80% of the first $500 million of ANA
0.70% of ANA over $500 million
TFAI has contractually agreed to waive its advisory fee and will reimburse the Fund to the extent that operating expenses, excluding 12b-1 fees, exceed the following stated annual limit:
1.20% Expense Limit
Distribution and service fees: The Fund has a 12b-1 distribution plan under the 1940 Act pursuant to which an annual fee, based on average daily net assets, is paid to the distributor for various disbursements such as broker-dealer account servicing fees and other promotional expenses of the Fund. The Fund is authorized under the 12b-1 plan to pay fees on each class up to the following limits:
| Class A | 0.35 | % | |||||
| Class B | 1.00 | % | |||||
| Class C | 1.00 | % | |||||
| Class I | N/A | ||||||
In the case the Fund or a class of shares of the Fund is closed to new investors or investments, the Fund is authorized to pay 12b-1 fees for past sales and distribution efforts and present and past investor services.
Underwriter commissions relate to front-end sales charges imposed for Class A shares and contingent deferred sales charges from Classes B, C, and certain A share redemptions. For the six months ended April 30, 2006, the underwriter commissions were as follows:
| Received by Underwriter | $ | 52 | |||||
| Retained by Underwriter | 8 | ||||||
| Contingent Deferred Sales Charge | 126 | ||||||
Transamerica IDEX Mutual Funds
Semi-Annual Report 2006
10
TA IDEX Salomon All Cap
NOTES TO FINANCIAL STATEMENTS (continued)
At April 30, 2006
(all amounts in thousands)
(unaudited)
NOTE 2.–(continued)
Administrative services: The Fund has entered into an agreement with TFS for financial and legal fund administration services. The Fund pays TFS an annual fee of 0.02% of ANA. The Legal fees on the Statement of Operations are fees paid to external legal counsel.
Transfer agent fees: The Fund pays TFS an annual per-account charge for each open and closed account. The Fund paid TFS $349 for the six months ended April 30, 2006.
Deferred compensation plan: Each eligible independent Fund Trustee may elect to participate in a non-qualified deferred compensation plan maintained by Transamerica IDEX Mutual Funds (the "Plan"). Under the Plan, such Trustees may defer payment of all or a portion of their total fees earned as a Fund Trustee. Each Trustee who is a participant in the Plan may elect that the earnings, losses or gains credited to his or her deferred fee amounts be determined based on a deemed investment in any series of Transamerica IDEX Mutual Funds, including the Fund. The right of a participant to receive a distribution from the Plan of the deferred fees is an unsecured claim against the general assets of all series of Transamerica IDEX Mutual Funds. The pro rata liability to the Fund of all deferred fees in the Plan amounted, as of April 30, 2006, to $26.
NOTE 3. INVESTMENT TRANSACTIONS
The cost of securities purchased and proceeds from securities sold (excluding short-term securities) for the six months ended April 30, 2006 were as follows:
| Purchases of securities: | |||||||
| Long-Term | $ | 44,103 | |||||
| U.S. Government | — | ||||||
| Proceeds from maturities and sales of securities: | |||||||
| Long-Term | 172,818 | ||||||
| U.S. Government | — | ||||||
NOTE 4. FEDERAL INCOME TAX MATTERS
The Fund has not made any provision for federal income or excise taxes due to its policy to distribute all of its taxable income and capital gains to its shareholders and otherwise qualify as a regulated investment company under Subchapter M of the Internal Revenue Code. Income and capital gain distributions are determined in accordance with income tax regulations, which may differ from GAAP. These differences are primarily due to differing treatment for items including, but not limited to, wash sales, net operating losses, excess distributions and foreign currency transactions.
NOTE 5. REGULATORY PROCEEDINGS
There continues to be significant federal and state regulatory activity relating to financial services companies, particularly mutual fund companies and their investment advisers. As part of an ongoing investigation regarding potential market timing, recordkeeping and trading compliance issues and matters affecting the Fund's investment adviser, TFAI, and certain affiliates and former employees of TFAI, the SEC staff has indicated that it is likely to take some action against TFAI and certain of its affiliates at the conclusion of the investigation. The potential timing and the scope of any such action is difficult to predict. Although the impact of any action brought against TFAI and/or its affiliates is difficult to assess at the present time, the Fund currently believes that the likelihood that any such action will have a material adverse impact on it is remote. It is important to note that the Fund is not aware of any allega tion of wrongdoing against it and its Board at the time this semi-annual report is printed. Although it is not anticipated that these developments will have an adverse impact on the Fund, there can be no assurance at this time. TFAI and its affiliates are actively working with the SEC in regard to this matter; however, the exact resolution cannot be determined at this time. TFAI will take such actions that it deems necessary or appropriate to continue providing management services to the Fund and to bring all matters to an appropriate conclusion.
TFAI and/or its affiliates, and not the Fund, will bear the costs regarding these regulatory matters.
Transamerica IDEX Mutual Funds
Semi-Annual Report 2006
11
TA IDEX Salomon All Cap
INVESTMENT ADVISORY AND SUB-ADVISORY AGREEMENTS – REVIEW AND RENEWAL (unaudited)
At a meeting of the Board of Transamerica IDEX Mutual Funds ("TA IDEX") held on November 2, 2005, the Board reviewed and considered the Investment Advisory Agreement between TA IDEX Salomon All Cap (the "Fund") and Transamerica Fund Advisors, Inc. ("TFAI"), as well as the Investment Sub-Advisory Agreement of the Fund between TFAI and Salomon Brothers Asset Management Inc. (the "Sub-Adviser"), to determine whether the agreements should be renewed for a one-year period. In light of the upcoming change-of-control of the Sub-Adviser, the Board also considered the successor agreement to the Investment Sub-Advisory Agreement. Following their review and consideration, a majority of the Trustees determined that the Investment Advisory Agreement and the Investment Sub-Advisory Agreement (as well as its successor agreement) will enable shareholders of the Fund to obtain high quality services at a cost that is appropriate, reasonable, and in the best interests of its shareholders. The Board, including a majority of the independent members of the Board, approved the renewal of the Investment Advisory Agreement, the Investment Sub-Advisory Agreement, as well as a successor agreement to the Investment Sub-Advisory Agreement, to take effect following an impending change of control with respect to the Sub-Adviser. In reaching their decision, the Trustees requested and obtained from TFAI and the Sub-Adviser such information as they deemed reasonably necessary to evaluate the proposed agreements. The Trustees also carefully considered the information that they had received throughout the year from TFAI and the Sub-Adviser (such as in-person presentations by the Sub-Adviser) as part of their regular oversight of the Fund, as well as: comparative fee, expense and performance information prepared by Lipper Inc. ("Lipper"), independent providers of mutual fund performance, fee and expense information, and profitability data. In considering the proposed continuation of the Investment Advisory Agreement and Investment Sub-Advisory Agreement, the Trustees evaluated a number of considerations that they believed, in light of the legal advice furnished to them by TA IDEX counsel and independent legal counsel and their own business judgment, to be relevant. They based their decisions on the following considerations, among others, although they did not identify any consideration or particular information that was controlling of their decisions:
The nature, extent and quality of the advisory service to be provided. The Board considered the nature and quality of the services provided by TFAI and the Sub-Adviser to the Fund in the past, as well as the services anticipated to be provided in the future. The Board concluded that TFAI and the Sub-Adviser are capable of providing high quality services to the Fund, as indicated by the nature and quality of services provided in the past, TFAI's and the Sub-Adviser's management capabilities demonstrated with respect to the funds they manage, including the Fund, and the experience, capability and integrity of TFAI's senior management, the financial resources of TFAI and the Sub-Adviser, TFAI's management oversight process, and the professional qualifications and experience of the Sub-Adviser's portfolio management team. The Trustees also concluded that TFAI and the Sub-Adviser proposed to provide investment and related services that were of the same quality and quantity as services provided to the Fund in the past, and that these services are appropriate in scope and extent in light of the Fund's operations, the competitive landscape of the investment company business and investor needs, and that TFAI's and the Sub-Adviser's obligations will remain substantially the same.
The investment performance of the Fund. The Board examined both the short-term and longer-term performance of the Fund, including relative performance against a benchmark securities index and a peer group of comparable mutual funds as prepared by Lipper for various trailing periods ended June 30, 2005. The Board expressed concerns about the Fund's performance and carefully considered whether to renew the Investment Sub-Advisory Agreement. The Board noted that although the Fund had underperformed comparable investment companies and its benchmark index, the Sub-Adviser had recently made progress on improving performance. After careful consideration of the materials presented and their discussions at prior Board meetings with representatives of the Sub-Adviser, the Board decided to continue the Investment Sub-Advisory Agreement following the Board's prio r discussion with the Sub-Adviser concerning performance and undertook to carefully monitor the Fund's future performance. On the basis of the Trustees' assessment of the nature, extent and quality of advisory services to be provided or procured by TFAI and the Sub-Adviser, the Trustees concluded that TFAI and the Sub-Adviser are capable of generating a level of investment performance that is appropriate in light of the Fund's investment objective, policies and strategies and competitive with many other investment companies, and also determined that TFAI's and the Sub-Adviser's continued management is likely to benefit the Fund and its shareholders.
The cost of advisory services provided and the level of profitability. The Board reviewed profitability information regarding TFAI's costs of procuring portfolio management services, as well as the costs of provision of administration, transfer agency, fund accounting and other services, to the Fund and to TA IDEX as a whole by TFAI and its affiliates. The Trustees reviewed data from Lipper that compared the Fund's management fees (including management fees at various asset levels), other fees and expenses (including total expenses including and excluding 12b-1 distribution and service fees) and portfolio turnover rate against peer groups of comparable mutual funds. Based on such information, the Trustees determined that the management fees and overall expense ratio of the Fund generally are consistent with industry averages. In addition, on the basis of the Board's review of the management fees to be charged by TFAI for investment advisory and related services, TFAI profitability information
Transamerica IDEX Mutual Funds
Semi-Annual Report 2006
12
TA IDEX Salomon All Cap (continued)
(derived from TFAI's audited financial statements), TFAI's estimated management income resulting from its management of the Fund, the estimated margin of the Sub-Adviser, as well as the entirety of TFAI's and its affiliates' service relationship with TA IDEX, the Board concluded that the level of investment management fees and other service fees, as well as TFAI's and the Sub-Adviser's profitability, are appropriate in light of the services provided, the management fees and overall expense ratios of comparable investment companies and the anticipated profitability of the relationship between the Fund, TFAI and its affiliates, and the Sub-Adviser.
Whether fee levels reflect economies of scale and the extent to which economies of scale would be realized as the Fund grows. The Board concluded that the inclusion of asset-based breakpoints in the Fund's advisory fee schedule appropriately benefits investors by realizing economies of scale in the form of lower management fees as the level of assets grows. In addition, the Board concluded that the Fund's management fees appropriately reflect the Fund's current size, the current economic environment for TFAI, the competitive nature of the investment company market, and TFAI's pricing strategy. The Trustees also concluded that they will have the opportunity to periodically reexamine whether the Fund has achieved economies of scale, and the appropriateness of management fees payable to TFAI and fees payable by TFAI to the Sub-Adviser, in the future.
Benefits (such as soft dollars) to TFAI, its affiliates, or the Sub-Adviser from their relationship with the Fund. The Board concluded that other benefits derived by TFAI, its affiliates, and the Sub-Adviser from their relationship with the Fund, including "soft dollar" benefits (if any) in connection with brokerage transactions, sales charges and distribution/service fees (to the extent applicable) are reasonable and fair, and are consistent with industry practice and the best interests of the Fund and its shareholders. In this regard, the Board noted that TFAI does not realize "soft dollar" benefits from its relationship with the Fund, and that the Sub-Adviser is participating in a brokerage program pursuant to which a portion of brokerage commissions paid by the Fund is recaptured for the benefit of the Fund and its shareholders, thus limiting the amount of "soft-dollar" arrangements the Sub-Adviser may engage in with respect to the Fund's brokerage transactions. In addition, the Trustees determined that the administration, transfer agency, fund accounting, and other fees paid by the Fund to affiliates of TFAI are reasonable, fair and in the best interests of shareholders in light of the nature and quality of the services provided, the associated costs to these affiliates of providing the services, the impact of the costs of such services on the Fund's overall operating expenses, and the necessity of the services for the Fund's operations.
Other considerations. In considering the successor agreement to the Investment Sub-Advisory Agreement, the Board concluded that the successor agreement would provide continuity of portfolio management services, as the terms of the successor agreement would be substantially similar to those of the current agreement (including the sub-advisory fees) and it was contemplated that all of the current personnel associated with managing the Fund will be retained and continue to serve in their current capacity. Additionally, the Board also determined that TFAI had made a substantial commitment to the recruitment and retention of high quality personnel, and maintained the financial, compliance and operational resources reasonably necessary to manage the Fund in a professional manner that is consistent with the best interests of the Fund and its shareholders. In this regard, the Trustees favorably considered the procedures and policies in place by TFAI to enforce compliance with applicable laws and regulations and oversee the portfolio management activities of the Sub-Adviser. The Trustees also determined that TFAI had made a significant entrepreneurial commitment to the management and success of the Fund, reflected by TFAI's expense limitation and fee waiver arrangement with the Fund, which may result in TFAI waiving advisory fees for the benefit of shareholders.
Transamerica IDEX Mutual Funds
Semi-Annual Report 2006
13
TA IDEX Salomon Investors Value
UNDERSTANDING YOUR FUND'S EXPENSES
(unaudited)
SHAREHOLDER EXPENSES
Fund shareholders may incur two types of costs: (1) transaction costs, including sales charges (loads) on purchases, contingent deferred sales charges on redemptions and redemption fees; and (2) ongoing costs, including management fees, 12b-1 distribution and service fees, and other fund expenses.
The following Example is intended to help you understand your ongoing costs (in dollars and cents) of investing in the Fund and to compare these costs with the ongoing costs of investing in other funds.
The Example is based on an investment of $1,000 invested at November 1, 2005 and held for the entire period until April 30, 2006.
ACTUAL EXPENSES
The first line in the table below provides information about actual account values and actual expenses. You may use the information in this line, together with the amount you invested, to estimate the expenses that you paid over the period. Simply divide your account value by $1,000 (for example, an $8,600 account value divided by $1,000 = 8.6), then multiply the result by the number in the first line of your Fund under the heading entitled "Expenses Paid During Period" to estimate the expenses you paid on your account during this period. If your account is an IRA, your expenses could have included a $15 annual fee. The amount of any fee paid through your account would increase the estimate of expenses you paid during the period and decrease your ending account value.
HYPOTHETICAL EXAMPLE FOR COMPARISON PURPOSES
The second line in the table below provides information about hypothetical account values and hypothetical expenses based on the Fund's actual expense ratio and an assumed rate of return of 5% per year before expenses, which is not the Fund's actual return. The hypothetical account values and expenses may not be used to estimate the actual ending account balance or expenses you paid for the period. You may use this information to compare the ongoing costs of investing in your Fund and other funds. To do so, compare this 5% hypothetical example with the 5% hypothetical examples that appear in the shareholder reports of the other funds. As in the case of the actual expense example, if your account is subject to an IRA fee, the amount of the fee paid through your account would increase the hypothetical expenses you would have paid during the period and decrease the hypothetical ending account value.
Please note that the expenses shown in the table are meant to highlight your ongoing costs only and do not reflect any transactional costs, such as sales charges, redemption fees, brokerage commissions paid on purchases and sales of fund shares. Therefore, the second line under the Fund in the table is useful in comparing ongoing costs only, and will not help you determine the relative total costs of owning different funds. If any of these transaction costs were included, your costs would be higher. The expenses shown in the table do not reflect any fees that may be charged to you by brokers, financial intermediaries or other financial institutions.
| Beginning Account Value | Ending Account Value | Annualized Expense Ratio | Expenses Paid During Period (a) | ||||||||||||||||
| Class A | |||||||||||||||||||
| Actual | $ | 1,000.00 | $ | 1,108.20 | 1.37 | % | $ | 7.16 | |||||||||||
| Hypothetical (b) | 1,000.00 | 1,018.00 | 1.37 | 6.85 | |||||||||||||||
| Class B | |||||||||||||||||||
| Actual | 1,000.00 | 1,106.60 | 1.88 | 9.82 | |||||||||||||||
| Hypothetical (b) | 1,000.00 | 1,015.47 | 1.88 | 9.39 | |||||||||||||||
| Class C | |||||||||||||||||||
| Actual | 1,000.00 | 1,105.90 | 1.89 | 9.87 | |||||||||||||||
| Hypothetical (b) | 1,000.00 | 1,015.24 | 1.89 | 9.47 | |||||||||||||||
| Class I | |||||||||||||||||||
| Actual | 1,000.00 | 1,096.60 | 0.88 | 4.20 | |||||||||||||||
| Hypothetical (b) | 1,000.00 | 1,018.74 | 0.88 | 4.04 | |||||||||||||||
(a) Expenses are calculated using the Fund's annualized expense ratio (as disclosed in the table), multiplied by the average account value for the period, multiplied by number of days in the period (181 days for Classes A, B and C, and 166 days for Class I), and divided by the number of days in the year (365 days).
(b) 5% return per year before expenses.
GRAPHICAL PRESENTATION OF SCHEDULE OF INVESTMENTS
By Sector
At April 30, 2006
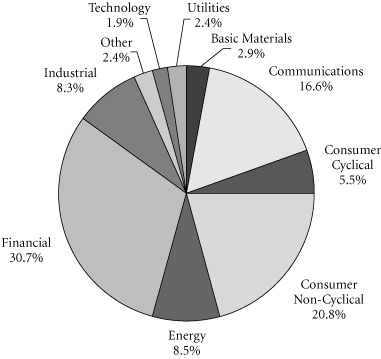
This chart shows the percentage breakdown by sector of the Fund's total investment securities.
Transamerica IDEX Mutual Funds
Semi-Annual Report 2006
1
TA IDEX Salomon Investors Value
SCHEDULE OF INVESTMENTS
At April 30, 2006
(all amounts except share amounts in thousands)
(unaudited)
| Shares | Value | ||||||||||
| COMMON STOCKS (96.2%) | |||||||||||
| Aerospace (5.1%) | |||||||||||
| Boeing Co. (The) | 22,100 | $ | 1,844 | ||||||||
| Textron, Inc. | 16,900 | 1,520 | |||||||||
| United Technologies Corp. | 23,000 | 1,445 | |||||||||
| Business Credit Institutions (1.3%) | |||||||||||
| Freddie Mac | 20,800 | 1,270 | |||||||||
| Chemicals & Allied Products (2.9%) | |||||||||||
| Air Products & Chemicals, Inc. | 16,800 | 1,151 | |||||||||
| du Pont (E.I.) de Nemours & Co. | 34,800 | 1,535 | |||||||||
| Commercial Banks (10.1%) | |||||||||||
| Bank of America Corp. | 55,300 | 2,761 | |||||||||
| Bank of New York Co., Inc. (The) | 26,000 | 914 | |||||||||
| JP Morgan Chase & Co. | 46,900 | 2,128 | |||||||||
| Wachovia Corp. | 26,100 | 1,562 | |||||||||
| Wells Fargo & Co. | 30,300 | 2,081 | |||||||||
| Communication (2.2%) | |||||||||||
| EchoStar Communications Corp.–Class A ‡ | 29,900 | 924 | |||||||||
| Liberty Global, Inc.–Class A ‡ | 8,500 | 176 | |||||||||
| Liberty Media Corp.–Class A ‡ | 115,600 | 965 | |||||||||
| Communications Equipment (2.9%) | |||||||||||
| Nokia Corp., ADR | 68,400 | 1,550 | |||||||||
| SES GLOBAL | 71,100 | 1,163 | |||||||||
| Computer & Data Processing Services (0.9%) | |||||||||||
| Microsoft Corp. | 35,000 | 845 | |||||||||
| Computer & Office Equipment (0.9%) | |||||||||||
| International Business Machines Corp. | 10,800 | 889 | |||||||||
| Electric Services (2.3%) | |||||||||||
| Sempra Energy | 47,900 | 2,204 | |||||||||
| Fabricated Metal Products (1.0%) | |||||||||||
| Parker Hannifin Corp. | 11,700 | 948 | |||||||||
| Food & Kindred Products (4.1%) | |||||||||||
| Altria Group, Inc. | 39,200 | 2,868 | |||||||||
| Sara Lee Corp. | 53,400 | 954 | |||||||||
| Food Stores (3.3%) | |||||||||||
| Kroger Co. ‡ | 151,800 | 3,076 | |||||||||
| Furniture & Fixtures (1.1%) | |||||||||||
| Masco Corp. | 31,200 | 995 | |||||||||
| Instruments & Related Products (1.0%) | |||||||||||
| Raytheon Co. | 20,900 | 925 | |||||||||
| Shares | Value | ||||||||||
| Insurance (11.2%) | |||||||||||
| AFLAC, Inc. | 23,600 | $ | 1,122 | ||||||||
| American International Group, Inc. | 31,300 | 2,042 | |||||||||
| Chubb Corp. | 28,800 | 1,484 | |||||||||
| Loews Corp. | 15,700 | 1,667 | |||||||||
| St. Paul Travelers Cos., Inc. (The) | 28,200 | 1,242 | |||||||||
| UnitedHealth Group, Inc. | 28,900 | 1,438 | |||||||||
| WellPoint, Inc. ‡ | 20,900 | 1,484 | |||||||||
| Insurance Agents, Brokers & Service (0.5%) | |||||||||||
| Marsh & McLennan Cos., Inc. | 15,900 | 488 | |||||||||
| Manufacturing Industries (0.3%) | |||||||||||
| Liberty Global, Inc.–Series C ‡ | 12,520 | 250 | |||||||||
| Motion Pictures (4.1%) | |||||||||||
| News Corp., Inc.–Class B † | 131,700 | 2,401 | |||||||||
| Time Warner, Inc. | 82,600 | 1,437 | |||||||||
| Oil & Gas Extraction (6.2%) | |||||||||||
| GlobalSantaFe Corp. | 23,500 | 1,438 | |||||||||
| Halliburton Co. | 9,600 | 750 | |||||||||
| Royal Dutch Shell PLC–Class A, ADR | 15,000 | 1,022 | |||||||||
| Total SA, ADR | 18,600 | 2,567 | |||||||||
| Paper & Allied Products (2.7%) | |||||||||||
| Avery Dennison Corp. | 16,900 | 1,056 | |||||||||
| Kimberly-Clark Corp. | 24,500 | 1,434 | |||||||||
| Personal Credit Institutions (2.3%) | |||||||||||
| Capital One Financial Corp. | 25,200 | 2,183 | |||||||||
| Petroleum Refining (2.2%) | |||||||||||
| Marathon Oil Corp. | 11,300 | 897 | |||||||||
| Suncor Energy, Inc. | 13,600 | 1,166 | |||||||||
| Pharmaceuticals (7.4%) | |||||||||||
| Abbott Laboratories | 27,100 | 1,158 | |||||||||
| Johnson & Johnson | 16,000 | 938 | |||||||||
| Novartis AG, ADR | 24,600 | 1,415 | |||||||||
| Pfizer, Inc. | 78,900 | 1,999 | |||||||||
| Sanofi-Aventis, ADR | 30,200 | 1,421 | |||||||||
| Restaurants (1.8%) | |||||||||||
| McDonald's Corp. | 48,300 | 1,670 | |||||||||
| Retail Trade (2.5%) | |||||||||||
| Target Corp. | 15,000 | 797 | |||||||||
| Wal-Mart Stores, Inc. | 34,600 | 1,558 | |||||||||
| Rubber & Misc. Plastic Products (1.1%) | |||||||||||
| Newell Rubbermaid, Inc. | 38,500 | 1,056 | |||||||||
The notes to the financial statements are an integral part of this report.
Transamerica IDEX Mutual Funds
Semi-Annual Report 2006
2
TA IDEX Salomon Investors Value
SCHEDULE OF INVESTMENTS (continued)
At April 30, 2006
(all amounts except share amounts in thousands)
(unaudited)
| Shares | Value | ||||||||||
| Savings Institutions (1.7%) | |||||||||||
| Golden West Financial Corp. | 22,200 | $ | 1,596 | ||||||||
| Security & Commodity Brokers (6.2%) | |||||||||||
| American Express Co. | 35,000 | 1,883 | |||||||||
| Goldman Sachs Group, Inc. (The) | 9,400 | 1,507 | |||||||||
| Merrill Lynch & Co., Inc. | 32,100 | 2,448 | |||||||||
| Telecommunications (6.9%) | |||||||||||
| ALLTEL Corp. | 27,100 | 1,744 | |||||||||
| AT&T, Inc. | 69,984 | 1,834 | |||||||||
| Sprint Nextel Corp. | 114,913 | 2,850 | |||||||||
| Total Common Stocks (cost: $79,970) | 90,135 | ||||||||||
| Principal | Value | ||||||||||
| SECURITY LENDING COLLATERAL (2.4%) | |||||||||||
| Debt (2.2%) | |||||||||||
| Bank Notes (0.3%) | |||||||||||
| Bank of America | |||||||||||
| 4.81%, due 06/07/2006 * | $ | 74 | $ | 74 | |||||||
| 4.81%, due 08/10/2006 * | 71 | 71 | |||||||||
| Bear Stearns & Co. 5.01%, due 06/06/2006 * 5.01%, due 09/07/2006 * | 29 85 | 29 85 | |||||||||
| Certificates Of Deposit (0.1%) | |||||||||||
| Halifax Bank of Scotland 4.78%, due 06/06/2006 * | 71 | 71 | |||||||||
| Rabobank Nederland 4.87%, due 05/31/2006 * | 71 | 71 | |||||||||
| Commercial Paper (0.1%) | |||||||||||
| Banco Santander Central Hispano SA 4.77%, due 05/02/2006 | 43 | 43 | |||||||||
| Sheffield Receivables Corp.–144A 4.81%, due 05/03/2006 | 71 | 71 | |||||||||
| Euro Dollar Overnight (0.4%) | |||||||||||
| Bank of Montreal 4.77%, due 05/02/2006 | 57 | 57 | |||||||||
| Dexia Group 4.78%, due 05/04/2006 | 71 | 71 | |||||||||
| Fortis Bank 4.77%, due 05/01/2006 | 29 | 29 | |||||||||
| Royal Bank of Canada 4.77%, due 05/01/2006 | 100 | 100 | |||||||||
| Royal Bank of Scotland 4.75%, due 05/03/2006 | 71 | 71 | |||||||||
| Svenska Handlesbanken 4.82%, due 05/01/2006 | 54 | 54 | |||||||||
| Principal | Value | ||||||||||
| Euro Dollar Terms (0.6%) | |||||||||||
| BancoBilbao Vizcaya Argentaria SA | |||||||||||
| 4.95%, due 06/20/2006 | $ | 57 | $ | 57 | |||||||
| Bank of the West 4.94%, due 06/16/2006 | 57 | 57 | |||||||||
| Barclays 4.79%, due 05/10/2006 4.77%, due 05/16/2006 | 85 28 | 85 28 | |||||||||
| Canadian Imperial Bank of Commerce 4.97%, due 06/23/2006 | 43 | 43 | |||||||||
| Credit Suisse First Boston Corp. 4.73%, due 05/08/2006 | 43 | 43 | |||||||||
| Fortis Bank 4.83%, due 05/08/2006 | 28 | 28 | |||||||||
| Lloyds TSB Bank 4.81%, due 05/11/2006 | 43 | 43 | |||||||||
| Royal Bank of Scotland 4.87%, due 05/12/2006 | 57 | 57 | |||||||||
| Societe Generale 4.79%, due 05/10/2006 | 71 | 71 | |||||||||
| UBS AG 4.95%, due 06/20/2006 | 71 | 71 | |||||||||
| Repurchase Agreements (0.7%) †† | |||||||||||
| Credit Suisse First Boston Corp. 4.92%, dated 04/28/2006 to be repurchased at $97 on 05/01/2006 | 97 | 97 | |||||||||
| Goldman Sachs Group, Inc. (The) 4.92%, dated 04/28/2006 to be repurchased at $209 on 05/01/2006 | 209 | 209 | |||||||||
| Lehman Brothers, Inc. 4.92%, dated 04/28/2006 to be repurchased at $4 on 05/01/2006 | 4 | 4 | |||||||||
| Merrill Lynch & Co. 4.87%, dated 04/28/2006 to be repurchased at $214 on 05/01/2006 | 214 | 214 | |||||||||
| Morgan Stanley Dean Witter & Co. 4.93%, dated 04/28/2006 to be repurchased at $100 on 05/01/2006 | 100 | 100 | |||||||||
| Shares | Value | ||||||||||
| Investment Companies (0.2%) | |||||||||||
| Barclays Global Investors Institutional Money Market Fund 1-day yield of 4.78% | 113,916 | $ | 114 | ||||||||
| Merrimac Cash Fund, Premium Class 1-day yield of 4.61% @ | 30,309 | 30 | |||||||||
| Total Security Lending Collateral (cost: $2,248) | 2,248 | ||||||||||
| Total Investment Securities (cost: $82,218) # | $ | 92,383 | |||||||||
The notes to the financial statements are an integral part of this report.
Transamerica IDEX Mutual Funds
Semi-Annual Report 2006
3
TA IDEX Salomon Investors Value
SCHEDULE OF INVESTMENTS (continued)
At April 30, 2006
(all amounts except share amounts in thousands)
(unaudited)
NOTES TO SCHEDULE OF INVESTMENTS:
‡ Non-income producing.
† At April 30, 2006, all or a portion of this security is on loan (see Note 1). The value at April 30, 2006, of all securities on loan is $2,155.
* Floating or variable rate note. Rate is listed as of April 30, 2006.
†† Cash collateral for the Repurchase Agreements, valued at $641, that serve as collateral for securities lending are invested in corporate bonds with interest rates and maturity dates ranging from 0.00%–9.05% and 05/02/2006–12/31/2049, respectively.
@ Regulated investment company advised by Investors Bank and Trust Co. ("IBT"). IBT is also the accounting, custody and lending agent for the Fund.
# Aggregate cost for Federal income tax purposes is $82,793. Aggregate gross unrealized appreciation for all securities in which there is an excess of value over tax cost and aggregate gross unrealized depreciation for all securities in which there is an excess of tax cost over value were $10,561 and $971, respectively. Net unrealized appreciation for tax purposes is $9,590.
DEFINITIONS:
144A 144A Securities are registered pursuant to Rule 144A of the Securities Act of 1933. These securities are deemed to be liquid for purposes of compliance limitations on holdings of illiquid securities and may be resold as transactions exempt from registration, normally to qualified institutional buyers. At April 30, 2006, these securities aggregated $71 or 0.1% of the net assets of the Fund.
ADR American Depositary Receipt
The notes to the financial statements are an integral part of this report.
Transamerica IDEX Mutual Funds
Semi-Annual Report 2006
4
TA IDEX Salomon Investors Value
STATEMENT OF ASSETS AND LIABILITIES
At April 30, 2006
(all amounts except per share amounts in thousands)
(unaudited)
| Assets: | |||||||
| Investment securities, at value (cost: $82,218) (including securities loaned of $2,155) | $ | 92,383 | |||||
| Cash | 3,586 | ||||||
| Receivables: | |||||||
| Interest | 8 | ||||||
| Dividends | 82 | ||||||
| Dividend reclaims receivable | 11 | ||||||
| Other | 10 | ||||||
| 96,080 | |||||||
| Liabilities: | |||||||
| Accounts payable and accrued liabilities: | |||||||
| Shares of beneficial interest redeemed | 33 | ||||||
| Management and advisory fees | 65 | ||||||
| Transfer agent fees | 16 | ||||||
| Administration fees | 2 | ||||||
| Payable for collateral for securities on loan | 2,248 | ||||||
| Other | 24 | ||||||
| 2,388 | |||||||
| Net Assets | $ | 93,692 | |||||
| Net Assets Consist of: | |||||||
| Shares of beneficial interest, unlimited shares authorized, no par value | 68,563 | ||||||
| Distributable net investment income (loss) | 243 | ||||||
| Accumulated net realized gain (loss) from investment securities and foreign currency transactions | 14,724 | ||||||
| Net unrealized appreciation (depreciation) on: Investment securities | 10,165 | ||||||
| Translation of assets and liabilities denominated in foreign currencies | (3 | ) | |||||
| Net Assets | $ | 93,692 | |||||
| Net Assets by Class: | |||||||
| Class A | $ | 11,217 | |||||
| Class B | 16,049 | ||||||
| Class C | 3,604 | ||||||
| Class I | 62,822 | ||||||
| Shares Outstanding: | |||||||
| Class A | 1,066 | ||||||
| Class B | 1,648 | ||||||
| Class C | 372 | ||||||
| Class I | 5,970 | ||||||
| Net Asset Value Per Share: | |||||||
| Class A | $ | 10.52 | |||||
| Class B | 9.74 | ||||||
| Class C | 9.68 | ||||||
| Class I | 10.52 | ||||||
| Maximum Offering Price Per Share (a): | |||||||
| Class A | $ | 11.13 | |||||
(a) Includes the maximum selling commission (represented as a percentage of offering price) which is reduced on certain levels of sales as set forth in the Prospectus. Net asset value per share for Classes B, C and I shares represents offering price. The redemption price for Classes B and C shares equals net asset value less any applicable contingent deferred sales charge.
STATEMENT OF OPERATIONS
For the period ended April 30, 2006 (b)
(all amounts in thousands)
(unaudited)
| Investment Income: | |||||||
| Dividends (net of withholding taxes on foreign dividends of $21) | $ | 1,295 | |||||
| Interest | 62 | ||||||
| Income from loaned securities–net | 4 | ||||||
| 1,361 | |||||||
| Expenses: | |||||||
| Management and advisory fees | 477 | ||||||
| Distribution and service fees: | |||||||
| Class A | 38 | ||||||
| Class B | 58 | ||||||
| Class C | 15 | ||||||
| Transfer agent fees: | |||||||
| Class A | 23 | ||||||
| Class B | 28 | ||||||
| Class C | 9 | ||||||
| Class I | – | (c) | |||||
| Printing and shareholder reports | 8 | ||||||
| Custody fees | 13 | ||||||
| Administration fees | 12 | ||||||
| Legal fees | 4 | ||||||
| Audit fees | 9 | ||||||
| Trustees fees | 3 | ||||||
| Other | 1 | ||||||
| Total expenses | 698 | ||||||
| Less: | |||||||
| Reimbursement of class expenses: | |||||||
| Class B | (3 | ) | |||||
| Class C | (2 | ) | |||||
| Total reimbursed expenses | (5 | ) | |||||
| Net expenses | 693 | ||||||
| Net Investment Income (Loss) | 668 | ||||||
| Net Realized Gain (Loss) | |||||||
| Realized gain (loss) from investment securities | 15,741 | ||||||
| Net Increase (Decrease) in Unrealized Appreciation (Depreciation) on: | |||||||
| Investment securities | (2,324 | ) | |||||
| Translation of assets and liabilities denominated in foreign currencies | (1 | ) | |||||
| (2,325 | ) | ||||||
| Net Realized and Unrealized Gain (Loss) on Investment Securities and Foreign Currency Transactions | 13,416 | ||||||
| Net Increase (Decrease) in Net Assets Resulting from Operations | $ | 14,084 | |||||
(b) Class I was offered for investment on November 15, 2005.
(c) Rounds to less than $1.
The notes to the financial statements are an integral part of this report.
Transamerica IDEX Mutual Funds
Semi-Annual Report 2006
5
TA IDEX Salomon Investors Value
STATEMENTS OF CHANGES IN NET ASSETS
For the period or year ended
(all amounts in thousands)
| April 30, 2006 (unaudited) (a) | October 31, 2005 | ||||||||||
| Increase (Decrease) In Net Assets From: | |||||||||||
| Operations: | |||||||||||
| Net investment income (loss) | $ | 668 | $ | 3,118 | |||||||
| Net realized gain (loss) from investment securities and foreign currency transactions | 15,741 | 44,096 | |||||||||
| Change in unrealized appreciation (depreciation) on investment securities and foreign currency translation | (2,325 | ) | (14,133 | ) | |||||||
| 14,084 | 33,081 | ||||||||||
| Distributions to Shareholders: | |||||||||||
| From net investment income: | |||||||||||
| Class A | (62 | ) | (3,927 | ) | |||||||
| Class B | (32 | ) | (57 | ) | |||||||
| Class C | (8 | ) | (29 | ) | |||||||
| Class I | (321 | ) | – | ||||||||
| (423 | ) | (4,013 | ) | ||||||||
| From net realized gains: | |||||||||||
| Class A | (4,033 | ) | (6,313 | ) | |||||||
| Class B | (6,300 | ) | (331 | ) | |||||||
| Class C | (1,640 | ) | (97 | ) | |||||||
| Class I | (32,188 | ) | – | ||||||||
| (44,161 | ) | (6,741 | ) | ||||||||
| Capital Share Transactions: | |||||||||||
| Proceeds from shares sold: | |||||||||||
| Class A | 290 | 1,445 | |||||||||
| Class B | 1,890 | 1,578 | |||||||||
| Class C | 120 | 559 | |||||||||
| Class I | 226,209 | – | |||||||||
| 228,509 | 3,582 | ||||||||||
| Dividends and distributions reinvested: | |||||||||||
| Class A | 4,016 | 10,228 | |||||||||
| Class B | 6,142 | 370 | |||||||||
| Class C | 1,518 | 116 | |||||||||
| Class I | 32,509 | – | |||||||||
| 44,185 | 10,714 | ||||||||||
| Cost of shares redeemed: | |||||||||||
| Class A | (173,621 | ) | (257,683 | ) | |||||||
| Class B | (4,864 | ) | (5,210 | ) | |||||||
| Class C | (1,736 | ) | (2,104 | ) | |||||||
| Class I | (171,806 | ) | – | ||||||||
| (352,027 | ) | (264,997 | ) | ||||||||
(a) Class I was offered for investment on November 15, 2005.
| April 30, 2006 (unaudited) (a) | October 31, 2005 | ||||||||||
| Automatic conversions: | |||||||||||
| Class A | $ | 220 | $ | 790 | |||||||
| Class B | (220 | ) | (790 | ) | |||||||
| – | – | ||||||||||
| (79,333 | ) | (250,701 | ) | ||||||||
| Net increase (decrease) in net assets | (109,833 | ) | (228,374 | ) | |||||||
| Net Assets: | |||||||||||
| Beginning of period | 203,525 | 431,899 | |||||||||
| End of period | $ | 93,692 | $ | 203,525 | |||||||
| Distributable Net Investment Income (Loss) | $ | 243 | $ | (2 | ) | ||||||
| Share Activity: | |||||||||||
| Shares issued: | |||||||||||
| Class A | 26 | 104 | |||||||||
| Class B | 181 | 120 | |||||||||
| Class C | 12 | 43 | |||||||||
| Class I | 17,522 | – | |||||||||
| 17,741 | 267 | ||||||||||
| Shares issued–reinvested from distributions: | |||||||||||
| Class A | 403 | 733 | |||||||||
| Class B | 668 | 28 | |||||||||
| Class C | 166 | 9 | |||||||||
| Class I | 3,284 | – | |||||||||
| 4,521 | 770 | ||||||||||
| Shares redeemed: | |||||||||||
| Class A | (12,155 | ) | (18,606 | ) | |||||||
| Class B | (492 | ) | (394 | ) | |||||||
| Class C | (172 | ) | (160 | ) | |||||||
| Class I | (14,836 | ) | – | ||||||||
| (27,655 | ) | (19,160 | ) | ||||||||
| Automatic conversions: | |||||||||||
| Class A | 20 | 57 | |||||||||
| Class B | (21 | ) | (60 | ) | |||||||
| (1 | ) | (3 | ) | ||||||||
| Net increase (decrease) in shares outstanding: | |||||||||||
| Class A | (11,706 | ) | (17,712 | ) | |||||||
| Class B | 336 | (306 | ) | ||||||||
| Class C | 6 | (108 | ) | ||||||||
| Class I | 5,970 | – | |||||||||
| (5,394 | ) | (18,126 | ) | ||||||||
The notes to the financial statements are an integral part of this report.
Transamerica IDEX Mutual Funds
Semi-Annual Report 2006
6
TA IDEX Salomon Investors Value
FINANCIAL HIGHLIGHTS
(unaudited for the period ended April 30, 2006)
| For a share of beneficial interest outstanding throughout each period | |||||||||||||||||||||||||||||||||||||||
| Net Asset | Investment Operations | Distributions | Net Asset | ||||||||||||||||||||||||||||||||||||
| For the Period Ended (d)(g) | Value, Beginning of Period | Net Investment Income (Loss) | Net Realized and Unrealized Gain (Loss) | Total Operations | From Net Investment Income | From Net Realized Gains | Total Distributions | Value, End of Period | |||||||||||||||||||||||||||||||
| Class A | 4/30/2006 | $ | 14.17 | $ | 0.07 | $ | 1.17 | $ | 1.24 | $ | (0.03 | ) | $ | (4.86 | ) | $ | (4.89 | ) | $ | 10.52 | |||||||||||||||||||
| 10/31/2005 | 13.30 | 0.16 | 1.11 | 1.27 | (0.19 | ) | (0.21 | ) | (0.40 | ) | 14.17 | ||||||||||||||||||||||||||||
| 10/31/2004 | 12.51 | 0.10 | 1.09 | 1.19 | (0.10 | ) | (0.30 | ) | (0.40 | ) | 13.30 | ||||||||||||||||||||||||||||
| 10/31/2003 | 10.21 | 0.08 | 2.31 | 2.39 | (0.02 | ) | (0.07 | ) | (0.09 | ) | 12.51 | ||||||||||||||||||||||||||||
| 10/31/2002 | 12.55 | 0.04 | (2.10 | ) | (2.06 | ) | – | (0.28 | ) | (0.28 | ) | 10.21 | |||||||||||||||||||||||||||
| 10/31/2001 | 12.91 | 0.07 | (0.42 | ) | (0.35 | ) | – | (0.01 | ) | (0.01 | ) | 12.55 | |||||||||||||||||||||||||||
| Class B | 4/30/2006 | 13.48 | 0.01 | 1.13 | 1.14 | (0.02 | ) | (4.86 | ) | (4.88 | ) | 9.74 | |||||||||||||||||||||||||||
| 10/31/2005 | 12.65 | – | (h) | 1.08 | 1.08 | (0.04 | ) | (0.21 | ) | (0.25 | ) | 13.48 | |||||||||||||||||||||||||||
| 10/31/2004 | 11.99 | 0.01 | 1.05 | 1.06 | (0.10 | ) | (0.30 | ) | (0.40 | ) | 12.65 | ||||||||||||||||||||||||||||
| 10/31/2003 | 9.84 | 0.01 | 2.23 | 2.24 | (0.02 | ) | (0.07 | ) | (0.09 | ) | 11.99 | ||||||||||||||||||||||||||||
| 10/31/2002 | 12.19 | (0.01 | ) | (2.06 | ) | (2.07 | ) | – | (0.28 | ) | (0.28 | ) | 9.84 | ||||||||||||||||||||||||||
| 10/31/2001 | 12.61 | (0.02 | ) | (0.39 | ) | (0.41 | ) | – | (0.01 | ) | (0.01 | ) | 12.19 | ||||||||||||||||||||||||||
| Class C | 4/30/2006 | 13.43 | 0.02 | 1.11 | 1.13 | (0.02 | ) | (4.86 | ) | (4.88 | ) | 9.68 | |||||||||||||||||||||||||||
| 10/31/2005 | 12.62 | – | (h) | 1.08 | 1.08 | (0.06 | ) | (0.21 | ) | (0.27 | ) | 13.43 | |||||||||||||||||||||||||||
| 10/31/2004 | 11.99 | (0.05 | ) | 1.08 | 1.03 | (0.10 | ) | (0.30 | ) | (0.40 | ) | 12.62 | |||||||||||||||||||||||||||
| 10/31/2003 | 9.77 | 0.01 | 2.30 | 2.31 | (0.02 | ) | (0.07 | ) | (0.09 | ) | 11.99 | ||||||||||||||||||||||||||||
| Class I | 4/30/2006 | 14.35 | 0.07 | 1.01 | 1.08 | (0.05 | ) | (4.86 | ) | (4.91 | ) | 10.52 | |||||||||||||||||||||||||||
| Ratios/Supplemental Data | |||||||||||||||||||||||||||||||
| For the Period | Total | Net Assets, End of Period | Ratio of Expenses to Average Net Assets (a) | Net Investment Income (Loss) to Average | Portfolio Turnover | ||||||||||||||||||||||||||
| Ended (g) | Return (c) | (000's) | Net (e) | Total (f) | Net Assets (a) | Rate (b) | |||||||||||||||||||||||||
| Class A | 4/30/2006 | 10.82 | % | $ | 11,217 | 1.37 | % | 1.37 | % | 1.10 | % | 15 | % | ||||||||||||||||||
| 10/31/2005 | 9.60 | 180,933 | 1.25 | 1.25 | 1.14 | 47 | |||||||||||||||||||||||||
| 10/31/2004 | 9.52 | 405,455 | 1.25 | 1.25 | 0.72 | 33 | |||||||||||||||||||||||||
| 10/31/2003 | 23.57 | 233,779 | 1.42 | 1.42 | 0.71 | 32 | |||||||||||||||||||||||||
| 10/31/2002 | (16.90 | ) | 46,960 | 1.55 | 1.91 | 0.56 | 101 | ||||||||||||||||||||||||
| 10/31/2001 | (2.68 | ) | 12,176 | 1.55 | 1.93 | 0.48 | 29 | ||||||||||||||||||||||||
| Class B | 4/30/2006 | 10.66 | 16,049 | 1.88 | 1.91 | 0.29 | 15 | ||||||||||||||||||||||||
| 10/31/2005 | 8.53 | 17,684 | 2.20 | 2.24 | 0.02 | 47 | |||||||||||||||||||||||||
| 10/31/2004 | 8.82 | 20,463 | 1.86 | 1.86 | 0.11 | 33 | |||||||||||||||||||||||||
| 10/31/2003 | 22.93 | 20,102 | 2.07 | 2.07 | 0.06 | 32 | |||||||||||||||||||||||||
| 10/31/2002 | (17.47 | ) | 16,980 | 2.20 | 2.56 | (0.09 | ) | 101 | |||||||||||||||||||||||
| 10/31/2001 | (3.31 | ) | 20,034 | 2.20 | 2.58 | (0.17 | ) | 29 | |||||||||||||||||||||||
| Class C | 4/30/2006 | 10.59 | 3,604 | 1.89 | 2.00 | 0.30 | 15 | ||||||||||||||||||||||||
| 10/31/2005 | 8.57 | 4,908 | 2.20 | 2.38 | 0.03 | 47 | |||||||||||||||||||||||||
| 10/31/2004 | 8.62 | 5,981 | 2.20 | 2.30 | (0.37 | ) | 33 | ||||||||||||||||||||||||
| 10/31/2003 | 23.81 | 797 | 2.07 | 2.07 | 0.05 | 32 | |||||||||||||||||||||||||
| Class I | 4/30/2006 | 9.66 | 62,822 | 0.88 | 0.88 | 1.37 | 15 | ||||||||||||||||||||||||
The notes to the financial statements are an integral part of this report.
Transamerica IDEX Mutual Funds
Semi–Annual Report 2006
7
TA IDEX Salomon Investors Value
FINANCIAL HIGHLIGHTS (continued)
(unaudited)
NOTES TO FINANCIAL HIGHLIGHTS
(a) Annualized.
(b) Not annualized.
(c) Total Return has been calculated for the applicable period without deduction of a sales load, if any, on an initial purchase. Not annualized.
(d) Per share information is calculated based on average number of shares outstanding.
(e) Ratio of Net Expenses to Average Net Assets is net of fee waivers and reimbursements by the investment adviser, if any (see note 2).
(f) Ratio of Total Expenses to Average Net Assets includes all expenses before fee waivers and reimbursements by the investment adviser.
(g) The inception dates for the Fund's offering of share classes were as follows:
Class C was November 11, 2002.
Class I was November 15, 2005.
(h) Rounds to less than $0.01.
The notes to the financial statements are an integral part of this report.
Transamerica IDEX Mutual Funds
Semi-Annual Report 2006
8
TA IDEX Salomon Investors Value
NOTES TO FINANCIAL STATEMENTS
At April 30, 2006
(all amounts in thousands)
(unaudited)
NOTE 1. ORGANIZATION AND SIGNIFICANT ACCOUNTING POLICIES
Transamerica IDEX Mutual Funds is an open-end management investment company registered under the Investment Company Act of 1940, as amended (the "1940 Act").
In the normal course of business, TA IDEX Salomon Investors Value (the "Fund") enters into contracts that contain a variety of representations that provide general indemnifications. The Fund's maximum exposure under these arrangements is unknown, as this would involve future claims that may be made against the Fund and/or its affiliates that have not yet occurred. However, based on experience, the Fund expects the risk of loss to be remote.
This report should be read in conjunction with the current Fund prospectus, which contains more complete information about the Fund.
In preparing the Fund's financial statements in accordance with accounting principles generally accepted in the United States of America ("GAAP"), estimates or assumptions (which could differ from actual results) may be used that affect reported amounts and disclosures. The following is a summary of significant accounting policies followed by the Fund.
Multiple class operations, income and expenses: The Fund currently has four classes of shares, Class A, Class B, Class C and Class I, each with different expense levels. Classes A, B, and C are closed to new investors. Class I commenced operations on November 15, 2005. Class I is only available for investment to certain affiliated asset allocation funds. Class B shares will convert to Class A shares eight years after purchase. Income, non-class specific expenses and realized and unrealized gains and losses, are allocated daily to each class, based upon the value of shares outstanding method as permitted under Rule 18f-3 of the 1940 Act. Each class bears its own specific expenses as well as a portion of general, common expenses.
Security valuations: The Fund values its investments at the close of the New York Stock Exchange ("NYSE"), normally 4 p.m. ET, each day the NYSE is open for business. Fund investments are valued at the last sale price or closing price on the day of valuation taken from the primary exchange where the security is principally traded.
Securities traded in the over-the-counter market and listed securities for which no sale was reported on that date are valued at the last quoted bid price.
Debt securities are valued based on a price quotation or other equivalent indication of value supplied by an exchange, a pricing service or a major market maker; however, those that mature in sixty days or less are valued at amortized cost, which approximates market.
Investment company securities are valued at the net asset value of the underlying portfolio.
Foreign securities generally are valued based on quotations from the primary market in which they are traded. Because many foreign securities markets and exchanges close prior to the close of the NYSE, closing prices for foreign securities in those markets or on those exchanges do not reflect the events that occur after that close. If a significant market event impacting the value of a portfolio security (e.g., natural disaster, company announcement, market volatility) occurs subsequent to the close of trading in the security, but prior to the calculation of the Fund's net asset value per share, market quotations for that security may be determined to be unreliable and, accordingly, not "readily available." As a result, foreign equity securities held by the Fund may be valued at fair market value as determined in good faith by the Fund's Administrative Valuation Committee, under the supervision of the Board's Valuation Committee , using guidelines adopted by the Board of Trustees.
Other securities for which quotations are not readily available or whose values have been determined to be unreliable are valued at fair market value as determined in good faith by the Fund's Administrative Valuation Committee, under the supervision of the Board's Valuation Committee, using guidelines adopted by the Board of Trustees.
Cash: The Fund may leave cash overnight in its cash account with the custodian, Investors Bank & Trust Company ("IBT"). IBT has been contracted on behalf of the Fund to invest the excess cash into a savings account, which at April 30, 2006, was paying an interest rate of 3.24%.
Repurchase agreements: The Fund is authorized to enter into repurchase agreements. The Fund, through its custodian, IBT, receives delivery of the underlying securities, the value of which at the time of purchase is required to be an amount equal to at least 100% of the resale price. The Fund will bear the risk of value fluctuations until the security can be sold and may encounter delays and incur costs in liquidating the security. In the event of bankruptcy or insolvency of the seller, delays and costs may be incurred.
Commission recapture: The sub-adviser, to the extent consistent with the best execution and usual commission rate policies and practices, may place security transactions of the Fund with broker/dealers with which Transamerica IDEX Mutual Funds has established a Commission Recapture Program. A Commission Recapture Program is any arrangement under which a broker/dealer applies a portion of the commissions received by such broker/dealer on the security transactions to the Fund. In no event will commissions paid by the Fund be used to pay expenses that would otherwise be borne by any other funds within Transamerica IDEX Mutual Funds, or by any other party.
Transamerica IDEX Mutual Funds
Semi-Annual Report 2006
9
TA IDEX Salomon Investors Value
NOTES TO FINANCIAL STATEMENTS (continued)
At April 30, 2006
(all amounts in thousands)
(unaudited)
NOTE 1.–(continued)
For the period ended April 30, 2006 there were no recaptured commissions.
Securities lending: The Fund may lend securities to qualified borrowers, with IBT acting as the Fund's lending agent. The Fund earns negotiated lenders' fees. The Fund receives cash and/or securities as collateral against the loaned securities. Cash collateral received is invested in short term, interest bearing securities. The Fund monitors the market value of securities loaned on a daily basis and requires collateral in an amount at least equal to the value of the securities loaned. Income from loaned securities on the Statement of Operations is net of fees, in the amount of $2, earned by IBT for its services.
Real Estate Investment Trusts ("REITs"): There are certain additional risks involved in investing in REITs. These include, but are not limited to, economic conditions, changes in zoning laws, real estate values, property taxes and interest rates.
Dividend income is recorded at management's estimate of the income included in distributions from the REIT investments. Distributions received in excess of the estimated amount are recorded as a reduction of the cost of investments. The actual amounts of income, return of capital and capital gains are only determined by each REIT after the fiscal year end and may differ from the estimated amounts.
Security transactions and investment income: Security transactions are recorded on the trade date. Security gains and losses are calculated on the specific identification basis. Dividend income, if any, is recorded on the ex-dividend date or, in the case of foreign securities, as soon as the Fund is informed of the ex-dividend date. Interest income, including accretion of discounts and amortization of premiums, is recorded on the accrual basis commencing on the settlement date.
Foreign currency denominated investments: The accounting records of the Fund are maintained in U.S. dollars. Securities and other assets and liabilities denominated in foreign currencies are translated into U.S. dollars at the closing exchange rate each day. The cost of foreign securities is translated at the exchange rate in effect when the investment was acquired. The Fund combines fluctuations from currency exchange rates and fluctuations in value when computing net realized and unrealized gains or losses from investments.
Net foreign currency gains and losses resulting from changes in exchange rates include: 1) foreign currency fluctuations between trade date and settlement date of investment security transactions; 2) gains and losses on forward foreign currency contracts; and 3) the difference between the receivable amounts of interest and dividends recorded in the accounting records in U.S. dollars and the amounts actually received.
Foreign currency denominated assets may involve risks not typically associated with domestic transactions. These risks include revaluation of currencies, adverse fluctuations in foreign currency values and possible adverse political, social and economic developments, including those particular to a specific industry, country or region.
Redemption fees: A short-term trading redemption fee may be assessed on any Fund shares in a fund account that are sold during the first five (5) NYSE trading days following their purchase date. This redemption fee will equal 2% of the amount redeemed and shares held the longest will be treated as being redeemed first and shares held the shortest as being redeemed last. For the six months ended April 30, 2006, the Fund received less than $1 in redemption fees.
Dividend distributions: Distributions to shareholders are recorded on the ex-dividend date and are determined in accordance with Federal income tax regulations which may differ from GAAP.
NOTE 2. RELATED PARTY TRANSACTIONS
Transamerica Fund Advisors, Inc. ("TFAI") is the Fund's investment adviser. Transamerica Fund Services, Inc. ("TFS") is the Fund's administrator and transfer agent. AFSG Securities Corp. ("AFSG") is the Fund's distributor/principal underwriter. TFAI, TFS, and AFSG are affiliates of AEGON, NV, a Netherlands corporation.
Certain officers and trustees of the Fund are also officers and/or directors of TFAI, TFS and AFSG.
The following schedule represents the percentage of Fund assets owned by affiliated investment companies at April 30, 2006:
| Net Assets | % of Net Assets | ||||||||||
| TA IDEX Asset Allocation– Moderate Portfolio | $ | 3,232 | 3.45 | % | |||||||
| TA IDEX Asset Allocation– Moderate Growth Portfolio | 59,567 | 63.58 | % | ||||||||
| Total | $ | 62,799 | 67.03 | % | |||||||
Investment advisory fees: The Fund pays management fees to TFAI based on average daily net assets ("ANA") at the following breakpoints:
0.80% of the first $500 million of ANA
0.70% of ANA over $500 million
TFAI has contractually agreed to waive its advisory fee and will reimburse the Fund to the extent that operating expenses, excluding 12b-1 fees, exceed the following stated annual limit:
1.20% Expense Limit
If total Fund expenses fall below the annual expense limitation agreement agreed to by the adviser within the succeeding three years, the
Transamerica IDEX Mutual Funds
Semi-Annual Report 2006
10
TA IDEX Salomon Investors Value
NOTES TO FINANCIAL STATEMENTS (continued)
At April 30, 2006
(all amounts in thousands)
(unaudited)
NOTE 2.–(continued)
Fund may be required to pay the adviser a portion or all of the reimbursed class expenses.
| Reimbursement of Class Expenses | Available for Recapture Through | ||||||||||
| Fiscal Year 2005 | |||||||||||
| Class B | $ | 8 | 10/31/2008 | ||||||||
| Class C | 10 | 10/31/2008 | |||||||||
Distribution and service fees: The Fund has a 12b-1 distribution plan under the 1940 Act pursuant to which an annual fee, based on average daily net assets, is paid to the distributor for various disbursements such as broker-dealer account servicing fees and other promotional expenses of the Fund. The Fund is authorized under the 12b-1 plan to pay fees on each class up to the following limits:
| Class A | 0.35 | % | |||||
| Class B | 1.00 | % | |||||
| Class C | 1.00 | % | |||||
| Class I | N/A | ||||||
From February 28, 2006 through March 1, 2007, the Fund will not pay 12b-1 fees under these plans.
Underwriter commissions relate to front-end sales charges imposed for Class A shares and contingent deferred sales charges from Classes B, C, and certain A share redemptions. For the six months ended April 30, 2006, the underwriter commissions were as follows:
| Received by Underwriter | $ | 4 | |||||
| Retained by Underwriter | 1 | ||||||
| Contingent Deferred Sales Charge | 2 | ||||||
Administrative services: The Fund has entered into an agreement with TFS for financial and legal fund administration services. The Fund pays TFS an annual fee of 0.02% of ANA. The Legal fees on the Statement of Operations are fees paid to external legal counsel.
Transfer agent fees: The Fund pays TFS an annual per-account charge for each open and closed account. The Fund paid TFS $58 for the six months ended April 30, 2006.
Deferred compensation plan: Each eligible independent Fund Trustee may elect to participate in a non-qualified deferred compensation plan maintained by Transamerica IDEX Mutual Funds (the "Plan"). Under the Plan, such Trustees may defer payment of all or a portion of their total fees earned as a Fund Trustee. Each Trustee who is a participant in the Plan may elect that the earnings, losses or gains credited to his or her deferred fee amounts be determined based on a deemed investment in any series of Transamerica IDEX Mutual Funds, including the Fund. The right of a participant to receive a distribution from the Plan of the deferred fees is an unsecured claim against the general assets of all series of Transamerica IDEX Mutual Funds. The pro rata liability to the Fund of all defer red fees in the Plan amounted, as of April 30, 2006, to $10.
NOTE 3. INVESTMENT TRANSACTIONS
The cost of securities purchased and proceeds from securities sold (excluding short-term securities) for the six months ended April 30, 2006 were as follows:
| Purchases of securities: | |||||||
| Long-Term | $ | 17,503 | |||||
| U.S. Government | — | ||||||
| Proceeds from maturities and sales of securities: | |||||||
| Long-Term | 138,336 | ||||||
| U.S. Government | — | ||||||
NOTE 4. FEDERAL INCOME TAX MATTERS
The Fund has not made any provision for federal income or excise taxes due to its policy to distribute all of its taxable income and capital gains to its shareholders and otherwise qualify as a regulated investment company under Subchapter M of the Internal Revenue Code. Income and capital gain distributions are determined in accordance with income tax regulations, which may differ from GAAP. These differences are primarily due to differing treatment for items including, but not limited to, wash sales, distribution reclassifications and foreign currency transactions.
NOTE 5. REGULATORY PROCEEDINGS
There continues to be significant federal and state regulatory activity relating to financial services companies, particularly mutual fund companies and their investment advisers. As part of an ongoing investigation regarding potential market timing, recordkeeping and trading compliance issues and matters affecting the Fund's investment adviser, TFAI, and certain affiliates and former employees of TFAI, the SEC staff has indicated that it is likely to take some action against TFAI and certain of its affiliates at the conclusion of the investigation. The potential timing and the scope of any such action is difficult to predict. Although the impact of any action brought against TFAI and/or its affiliates is difficult to assess at the present time, the Fund currently believes that the likelihood that any such action will have a material adverse impact on it is remote. It is important to note that the Fund is not aware of any allega tion of wrongdoing against it and its Board at the time this semi-annual report is printed. Although it is not anticipated that these developments will have an adverse impact on the Fund, there can be no assurance at this time. TFAI and its affiliates are actively working with the SEC in regard to this matter; however, the exact resolution cannot be determined at this time. TFAI will take such actions that it deems necessary or appropriate to continue providing management services to the Fund and to bring all matters to an appropriate conclusion.
TFAI and/or its affiliates, and not the Fund, will bear the costs regarding these regulatory matters.
Transamerica IDEX Mutual Funds
Semi-Annual Report 2006
11
TA IDEX Salomon Investors Value
INVESTMENT ADVISORY AND SUB-ADVISORY AGREEMENTS – REVIEW AND RENEWAL (unaudited)
At a meeting of the Board of Transamerica IDEX Mutual Funds ("TA IDEX") held on November 2, 2005, the Board reviewed and considered the Investment Advisory Agreement between TA IDEX Salomon Investors Value (the "Fund") and Transamerica Fund Advisors, Inc. ("TFAI"), as well as the Investment Sub-Advisory Agreement of the Fund between TFAI and Salomon Brothers Asset Management Inc. (the "Sub-Adviser"), to determine whether the agreements should be renewed for a one-year period. In light of the upcoming change-of-control of the Sub-Adviser, the Board also considered the successor agreement to the Investment Sub-Advisory Agreement. Following their review and consideration, a majority of the Trustees determined that the Investment Advisory Agreement and the Investment Sub-Advisory Agreement (as well as its successor agreement) will enable shareholders of the Fund to obtain high quality services at a cost that is appropriate, reasonab le, and in the best interests of its shareholders. The Board, including a majority of the independent members of the Board, approved the renewal of the Investment Advisory Agreement, the Investment Sub-Advisory Agreement, as well as a successor agreement to the Investment Sub-Advisory Agreement, to take effect following an impending change of control with respect to the Sub-Adviser. In reaching their decision, the Trustees requested and obtained from TFAI and the Sub-Adviser such information as they deemed reasonably necessary to evaluate the proposed agreements. The Trustees also carefully considered the information that they had received throughout the year from TFAI and the Sub-Adviser (such as in-person presentations by the Sub-Adviser) as part of their regular oversight of the Fund, as well as: comparative fee, expense and performance information prepared by Lipper Inc. ("Lipper"), independent providers of mutual fund performance, fee and expense information, and profitability data. In considering the p roposed continuation of the Investment Advisory Agreement and Investment Sub-Advisory Agreement, the Trustees evaluated a number of considerations that they believed, in light of the legal advice furnished to them by TA IDEX counsel and independent legal counsel and their own business judgment, to be relevant. They based their decisions on the following considerations, among others, although they did not identify any consideration or particular information that was controlling of their decisions:
The nature, extent and quality of the advisory service to be provided. The Board considered the nature and quality of the services provided by TFAI and the Sub-Adviser to the Fund in the past, as well as the services anticipated to be provided in the future. The Board concluded that TFAI and the Sub-Adviser are capable of providing high quality services to the Fund, as indicated by the nature and quality of services provided in the past, TFAI's and the Sub-Adviser's management capabilities demonstrated with respect to the funds they manage, including the Fund, and the experience, capability and integrity of TFAI's senior management, the financial resources of TFAI and the Sub-Adviser, TFAI's management oversight process, and the professional qualifications and experience of the Sub-Adviser's portfolio management team. The Trustees also concluded that TFAI and the Sub-Adviser proposed to provide investment and related services that were of the same quality and quantity as services provided to the Fund in the past, and that these services are appropriate in scope and extent in light of the Fund's operations, the competitive landscape of the investment company business and investor needs, and that TFAI's and the Sub-Adviser's obligations will remain substantially the same.
The investment performance of the Fund. The Board examined both the short-term and longer-term performance of the Fund, including relative performance against a benchmark securities index and a peer group of comparable mutual funds as prepared by Lipper for various trailing periods ended June 30, 2005. The Board expressed concerns about the Fund's performance and carefully considered whether to renew the Investment Sub-Advisory Agreement. The Board noted that although the Fund had underperformed comparable investment companies and its benchmark index, the Sub-Adviser had recently made progress on improving performance. After careful consideration of the materials presented and their discussions at prior Board meetings with representatives of the Sub-Adviser, the Board decided to continue the Investment Sub-Advisory Agreement following the Board's prio r discussion with the Sub-Adviser concerning performance and undertook to carefully monitor the Fund's future performance. On the basis of the Trustees' assessment of the nature, extent and quality of advisory services to be provided or procured by TFAI and the Sub-Adviser, the Trustees concluded that TFAI and the Sub-Adviser are capable of generating a level of investment performance that is appropriate in light of the Fund's investment objective, policies and strategies and competitive with many other investment companies, and also determined that TFAI's and the Sub-Adviser's continued management is likely to benefit the Fund and its shareholders.
The cost of advisory services provided and the level of profitability. The Board reviewed profitability information regarding TFAI's costs of procuring portfolio management services, as well as the costs of provision of administration, transfer agency, fund accounting and other services, to the Fund and to TA IDEX as a whole by TFAI and its affiliates. The Trustees reviewed data from Lipper that compared the Fund's management fees (including management fees at various asset levels), other fees and expenses (including total expenses including and excluding 12b-1 distribution and service fees) and portfolio turnover rate against peer groups of comparable mutual funds. Based on such information, the Trustees determined that the management fees and overall expense ratio of the Fund generally are consistent with industry averages. In addition, on the basis of the Board's review of the management fees to be charged by TFAI for investment advisory and related services, TFAI profitability information (derived
Transamerica IDEX Mutual Funds
Semi-Annual Report 2006
12
TA IDEX Salomon Investors Value (continued)
from TFAI's audited financial statements), TFAI's estimated management income resulting from its management of the Fund, the estimated margin of the Sub-Adviser, as well as the entirety of TFAI's and its affiliates' service relationship with TA IDEX, the Board concluded that the level of investment management fees and other service fees, as well as TFAI's and the Sub-Adviser's profitability, are appropriate in light of the services provided, the management fees and overall expense ratios of comparable investment companies and the anticipated profitability of the relationship between the Fund, TFAI and its affiliates, and the Sub-Adviser.
Whether fee levels reflect economies of scale and the extent to which economies of scale would be realized as the Fund grows. The Board concluded that the inclusion of asset-based breakpoints in the Fund's advisory fee schedule appropriately benefits investors by realizing economies of scale in the form of lower management fees as the level of assets grows. The Board noted that the Fund is closed to new investors and will be closed to new investments in the near future, except that the Fund may continue selling shares to other TA IDEX funds and other investment companies in the same group of investment companies as TA IDEX, which may limit, to an extent, the ability of the Fund to realize economies of scale. In addition, the Board assessed the current asset levels of the Fund and the long-term development strategy for the Fund, including continued inv estments by the TA IDEX asset allocation funds, and concluded that the Fund's current management fees appropriately reflect the Fund's current size, the current economic environment for TFAI, the competitive nature of the investment company market, and TFAI's pricing strategy. The Trustees also concluded that they will have the opportunity to periodically reexamine whether the Fund has achieved economies of scale, and the appropriateness of management fees payable to TFAI and fees payable by TFAI to the Sub-Adviser, in the future.
Benefits (such as soft dollars) to TFAI, its affiliates, or the Sub-Adviser from their relationship with the Fund. The Board concluded that other benefits derived by TFAI, its affiliates, and the Sub-Adviser from their relationship with the Fund, including "soft dollar" benefits (if any) in connection with brokerage transactions, sales charges and distribution/service fees (to the extent applicable) are reasonable and fair, and are consistent with industry practice and the best interests of the Fund and its shareholders. In this regard, the Board noted that TFAI does not realize "soft dollar" benefits from its relationship with the Fund, and that the Sub-Adviser is participating in a brokerage program pursuant to which a portion of brokerage commissions paid by the Fund is recaptured for the benefit of the Fund and its shareholders, thus limiting the amount of "soft-dollar" arrangements the Sub-Adviser may engage in with respect to the Fund's brokerage transactions. In addition, the Trustees determined that the administration, transfer agency, fund accounting, and other fees paid by the Fund to affiliates of TFAI are reasonable, fair and in the best interests of shareholders in light of the nature and quality of the services provided, the associated costs to these affiliates of providing the services, the impact of the costs of such services on the Fund's overall operating expenses, and the necessity of the services for the Fund's operations.
Other considerations. In considering the successor agreement to the Investment Sub-Advisory Agreement, the Board concluded that the successor agreement would provide continuity of portfolio management services, as the terms of the successor agreement would be substantially similar to those of the current agreement (including the sub-advisory fees) and it was contemplated that all of the current personnel associated with managing the Fund will be retained and continue to serve in their current capacity. Additionally, the Board also determined that TFAI had made a substantial commitment to the recruitment and retention of high quality personnel, and maintained the financial, compliance and operational resources reasonably necessary to manage the Fund in a professional manner that is consistent with the best interests of the Fund and its shareholders. In this regard, the Trustees favorably considered the procedures and policies in place by TFAI to enforce compliance with applicable laws and regulations and oversee the portfolio management activities of the Sub-Adviser. The Trustees also determined that TFAI had made a significant entrepreneurial commitment to the management and success of the Fund, reflected by TFAI's expense limitation and fee waiver arrangement with the Fund, which may result in TFAI waiving advisory fees for the benefit of shareholders.
Transamerica IDEX Mutual Funds
Semi-Annual Report 2006
13
TA IDEX T. Rowe Price Small Cap
UNDERSTANDING YOUR FUND'S EXPENSES
(unaudited)
SHAREHOLDER EXPENSES
Fund shareholders may incur two types of costs: (1) transaction costs, including sales charges (loads) on purchases, contingent deferred sales charges on redemptions and redemption fees; and (2) ongoing costs, including management fees, 12b-1 distribution and service fees, and other fund expenses.
The following Example is intended to help you understand your ongoing costs (in dollars and cents) of investing in the Fund and to compare these costs with the ongoing costs of investing in other funds.
The Example is based on an investment of $1,000 invested at November 1, 2005 and held for the entire period until April 30, 2006.
ACTUAL EXPENSES
The first line in the table below provides information about actual account values and actual expenses. You may use the information in this line, together with the amount you invested, to estimate the expenses that you paid over the period. Simply divide your account value by $1,000 (for example, an $8,600 account value divided by $1,000 = 8.6), then multiply the result by the number in the first line of your Fund under the heading entitled "Expenses Paid During Period" to estimate the expenses you paid on your account during this period. If your account is an IRA, your expenses could have included a $15 annual fee. The amount of any fee paid through your account would increase the estimate of expenses you paid during the period and decrease your ending account value.
HYPOTHETICAL EXAMPLE FOR COMPARISON PURPOSES
The second line in the table below provides information about hypothetical account values and hypothetical expenses based on the Fund's actual expense ratio and an assumed rate of return of 5% per year before expenses, which is not the Fund's actual return. The hypothetical account values and expenses may not be used to estimate the actual ending account balance or expenses you paid for the period. You may use this information to compare the ongoing costs of investing in your Fund and other funds. To do so, compare this 5% hypothetical example with the 5% hypothetical examples that appear in the shareholder reports of the other funds. As in the case of the actual expense example, if your account is subject to an IRA fee, the amount of the fee paid through your account would increase the hypothetical expenses you would have paid during the period and decrease the hypothetical ending account value.
Please note that the expenses shown in the table are meant to highlight your ongoing costs only and do not reflect any transactional costs, such as sales charges, redemption fees, brokerage commissions paid on purchases and sales of fund shares. Therefore, the second line under the Fund in the table is useful in comparing ongoing costs only, and will not help you determine the relative total costs of owning different funds. If any of these transaction costs were included, your costs would be higher. The expenses shown in the table do not reflect any fees that may be charged to you by brokers, financial intermediaries or other financial institutions.
| Beginning Account Value | Ending Account Value | Annualized Expense Ratio | Expenses Paid During Period (a) | ||||||||||||||||
| Class A | |||||||||||||||||||
| Actual | $ | 1,000.00 | $ | 1,142.10 | 1.61 | % | $ | 8.55 | |||||||||||
| Hypothetical (b) | 1,000.00 | 1,016.81 | 1.61 | 8.05 | |||||||||||||||
| Class B | |||||||||||||||||||
| Actual | 1,000.00 | 1,139.60 | 2.03 | 10.77 | |||||||||||||||
| Hypothetical (b) | 1,000.00 | 1,014.73 | 2.03 | 10.14 | |||||||||||||||
| Class C | |||||||||||||||||||
| Actual | 1,000.00 | 1,139.50 | 2.05 | 10.87 | |||||||||||||||
| Hypothetical (b) | 1,000.00 | 1,014.63 | 2.05 | 10.24 | |||||||||||||||
| Class I | |||||||||||||||||||
| Actual | 1,000.00 | 1,114.20 | 0.97 | 4.66 | |||||||||||||||
| Hypothetical (b) | 1,000.00 | 1,018.33 | 0.97 | 4.45 | |||||||||||||||
(a) Expenses are calculated using the Fund's annualized expense ratio (as disclosed in the table), multiplied by the average account value for the period, multiplied by number of days in the period (181 days for Classes A, B and C and 166 days for Class I), and divided by the number of days in the year (365 days).
(b) 5% return per year before expenses.
GRAPHICAL PRESENTATION OF SCHEDULE OF INVESTMENTS
By Sector
At April 30, 2006
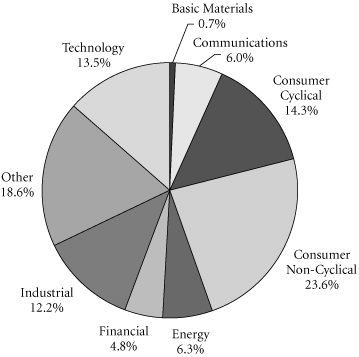
This chart shows the percentage breakdown by sector of the Fund's total investment securities.
Transamerica IDEX Mutual Funds
Semi-Annual Report 2006
1
TA IDEX T. Rowe Price Small Cap
SCHEDULE OF INVESTMENTS
At April 30, 2006
(all amounts except share amounts in thousands)
(unaudited)
| Shares | Value | ||||||||||
| COMMON STOCKS (97.6%) | |||||||||||
| Air Transportation (1.5%) | |||||||||||
| Airtran Holdings, Inc. ‡† | 1,900 | $ | 27 | ||||||||
| Republic Airways Holdings, Inc. ‡ | 10,200 | 173 | |||||||||
| Skywest, Inc. | 9,200 | 217 | |||||||||
| Amusement & Recreation Services (1.2%) | |||||||||||
| International Speedway Corp.–Class A | 400 | 20 | |||||||||
| Station Casinos, Inc. † | 2,900 | 224 | |||||||||
| WMS Industries, Inc. ‡† | 3,100 | 97 | |||||||||
| Apparel & Accessory Stores (1.6%) | |||||||||||
| Charlotte Russe Holding, Inc. ‡ | 800 | 17 | |||||||||
| Christopher & Banks Corp. | 2,400 | 63 | |||||||||
| Citi Trends, Inc. ‡† | 1,600 | 78 | |||||||||
| Pacific Sunwear of California, Inc. ‡† | 5,250 | 122 | |||||||||
| Ross Stores, Inc. | 1,700 | 52 | |||||||||
| Urban Outfitters, Inc. ‡ | 4,200 | 97 | |||||||||
| Apparel Products (0.8%) | |||||||||||
| Gymboree Corp. ‡ | 3,200 | 96 | |||||||||
| Quiksilver, Inc. ‡† | 8,900 | 122 | |||||||||
| Auto Repair, Services & Parking (0.2%) | |||||||||||
| Dollar Thrifty Automotive Group ‡ | 1,400 | 68 | |||||||||
| Automotive (1.1%) | |||||||||||
| LKQ Corp. ‡ | 1,400 | 29 | |||||||||
| Oshkosh Truck Corp. | 4,500 | 275 | |||||||||
| Automotive Dealers & Service Stations (1.1%) | |||||||||||
| MarineMax, Inc. ‡† | 3,300 | 108 | |||||||||
| O'Reilly Automotive, Inc. ‡ | 6,000 | 203 | |||||||||
| Beverages (0.1%) | |||||||||||
| Boston Beer Co., Inc.–Class A ‡ | 600 | 16 | |||||||||
| Business Services (3.7%) | |||||||||||
| Administaff, Inc. | 800 | 46 | |||||||||
| Aptimus, Inc. ‡† | 4,800 | 27 | |||||||||
| ChoicePoint, Inc. ‡ | 3,100 | 137 | |||||||||
| Computer Programs & Systems, Inc. | 7,200 | 340 | |||||||||
| Getty Images, Inc. ‡† | 1,500 | 96 | |||||||||
| Heartland Payment Systems, Inc. ‡† | 1,000 | 26 | |||||||||
| Iron Mountain, Inc. ‡† | 2,425 | 95 | |||||||||
| Jupitermedia Corp. ‡† | 5,400 | 95 | |||||||||
| MoneyGram International, Inc. | 3,300 | 112 | |||||||||
| WebSideStory, Inc. ‡ | 2,500 | 43 | |||||||||
| Chemicals & Allied Products (0.0%) | |||||||||||
| Parlux Fragrances, Inc. ‡† | 500 | 14 | |||||||||
| Shares | Value | ||||||||||
| Commercial Banks (2.2%) | |||||||||||
| Boston Private Financial Holdings, Inc. | 2,400 | $ | 80 | ||||||||
| CapitalSource, Inc. † | 1,134 | 27 | |||||||||
| East-West Bancorp, Inc. | 4,100 | 163 | |||||||||
| Investors Financial Services Corp. l | 1,400 | 67 | |||||||||
| Pinnacle Financial Partners, Inc. ‡ | 1,100 | 32 | |||||||||
| PrivateBancorp, Inc. † | 800 | 35 | |||||||||
| SVB Financial Group ‡† | 1,600 | 81 | |||||||||
| UCBH Holdings, Inc. | 6,000 | 106 | |||||||||
| Virginia Commerce Bancorp ‡† | 500 | 18 | |||||||||
| Communication (0.5%) | |||||||||||
| Global Payments, Inc. | 2,660 | 126 | |||||||||
| Syniverse Holdings, Inc. ‡ | 1,400 | 25 | |||||||||
| Communications Equipment (0.9%) | |||||||||||
| Inter-Tel, Inc. | 5,100 | 117 | |||||||||
| Plantronics, Inc. | 2,900 | 109 | |||||||||
| Polycom, Inc. ‡ | 1,406 | 31 | |||||||||
| Computer & Data Processing Services (12.4%) | |||||||||||
| Activision, Inc. ‡ | 7,999 | 114 | |||||||||
| Actuate Corp. ‡ | 13,000 | 55 | |||||||||
| Agile Software Corp. ‡ | 5,700 | 40 | |||||||||
| Avocent Corp. ‡ | 1,200 | 32 | |||||||||
| CACI International, Inc.–Class A ‡ | 2,200 | 138 | |||||||||
| CNET Networks, Inc. ‡† | 7,900 | 85 | |||||||||
| Cognex Corp. | 4,000 | 107 | |||||||||
| Cognizant Technology Solutions Corp. ‡ | 2,200 | 140 | |||||||||
| Cybersource Corp. ‡ | 8,700 | 81 | |||||||||
| Digital Insight Corp. ‡ | 3,200 | 110 | |||||||||
| Digital River, Inc. ‡† | 1,500 | 65 | |||||||||
| Epicor Software Corp. ‡ | 3,200 | 39 | |||||||||
| F5 Networks, Inc. ‡† | 2,700 | 158 | |||||||||
| Factset Research Systems, Inc. | 2,050 | 90 | |||||||||
| Fair Isaac Corp. | 4,005 | 149 | |||||||||
| Filenet Corp. ‡ | 1,800 | 50 | |||||||||
| Global Cash Access, Inc. ‡ | 2,200 | 43 | |||||||||
| Hyperion Solutions Corp. ‡ | 4,900 | 150 | |||||||||
| Informatica Corp. ‡ | 8,100 | 125 | |||||||||
| Inforte Corp. ‡ | 24,300 | 115 | |||||||||
| Jack Henry & Associates, Inc. | 2,700 | 61 | |||||||||
| Kenexa Corp. ‡ | 5,600 | 186 | |||||||||
| MatrixOne, Inc. ‡ | 13,900 | 100 | |||||||||
| MTC Technologies, Inc. ‡ | 3,400 | 97 | |||||||||
| NAVTEQ Corp. ‡ | 1,700 | 71 | |||||||||
| NCI, Inc.–Class A ‡ | 9,100 | 128 | |||||||||
| Ninetowns Digital World Trade Holdings, Ltd., ADR ‡ | 5,400 | 27 | |||||||||
The notes to the financial statements are an integral part of this report.
Transamerica IDEX Mutual Funds
Semi-Annual Report 2006
2
TA IDEX T. Rowe Price Small Cap
SCHEDULE OF INVESTMENTS (continued)
At April 30, 2006
(all amounts except share amounts in thousands)
(unaudited)
| Shares | Value | ||||||||||
| Computer & Data Processing Services (continued) | |||||||||||
| Open Solutions, Inc. ‡† | 1,800 | $ | 49 | ||||||||
| Quest Software, Inc. ‡ | 3,100 | 53 | |||||||||
| Radiant Systems, Inc. ‡ | 9,250 | 120 | |||||||||
| Red Hat, Inc. ‡† | 4,300 | 126 | |||||||||
| RightNow Technologies, Inc. ‡† | 6,400 | 118 | |||||||||
| SI International, Inc. ‡ | 600 | 20 | |||||||||
| SRA International, Inc.–Class A ‡ | 5,000 | 160 | |||||||||
| Taleo Corp.–Class A ‡ | 5,600 | 74 | |||||||||
| Websense, Inc. ‡ | 3,600 | 90 | |||||||||
| Witness Systems, Inc. ‡† | 1,200 | 28 | |||||||||
| Computer & Office Equipment (1.2%) | |||||||||||
| Rackable Systems, Inc. ‡ | 800 | 41 | |||||||||
| ScanSource, Inc. ‡ | 2,000 | 125 | |||||||||
| Symbol Technologies, Inc. | 2,400 | 26 | |||||||||
| Zebra Technologies Corp.–Class A ‡ | 3,300 | 131 | |||||||||
| Construction (0.5%) | |||||||||||
| Insituform Technologies, Inc.–Class A ‡ | 2,000 | 51 | |||||||||
| MDC Holdings, Inc. | 1,464 | 85 | |||||||||
| Drug Stores & Proprietary Stores (0.2%) | |||||||||||
| Drugstore.Com, Inc. ‡ | 14,400 | 51 | |||||||||
| Educational Services (1.7%) | |||||||||||
| Corinthian Colleges, Inc. ‡ | 2,400 | 36 | |||||||||
| Education Management Corp. ‡ | 5,200 | 221 | |||||||||
| ITT Educational Services, Inc. ‡ | 3,200 | 203 | |||||||||
| Electric, Gas & Sanitary Services (0.9%) | |||||||||||
| Stericycle, Inc. ‡ | 2,000 | 132 | |||||||||
| Waste Connections, Inc. ‡ | 2,700 | 104 | |||||||||
| Electronic & Other Electric Equipment (0.7%) | |||||||||||
| Aeroflex, Inc. ‡ | 12,900 | 163 | |||||||||
| Harman International Industries, Inc. | 500 | 44 | |||||||||
| Electronic Components & Accessories (8.2%) | |||||||||||
| Advanced Energy Industries, Inc. ‡ | 8,800 | 138 | |||||||||
| ATMI, Inc. ‡† | 2,900 | 82 | |||||||||
| Ceradyne, Inc. ‡† | 4,100 | 217 | |||||||||
| Color Kinetics, Inc. ‡† | 8,300 | 176 | |||||||||
| Cymer, Inc. ‡† | 3,000 | 155 | |||||||||
| Dolby Laboratories, Inc.–Class A ‡ | 2,700 | 64 | |||||||||
| Exar Corp. ‡ | 3,000 | 43 | |||||||||
| Integrated Device Technology, Inc. ‡ | 5,180 | 79 | |||||||||
| Integrated Silicon Solutions, Inc. ‡ | 5,900 | 39 | |||||||||
| Intersil Corp.–Class A | 4,796 | 142 | |||||||||
| Micrel, Inc. ‡ | 4,000 | 51 | |||||||||
| Microchip Technology, Inc. | 575 | 21 | |||||||||
| Microsemi Corp. ‡ | 4,400 | 120 | |||||||||
| Shares | Value | ||||||||||
| Electronic Components & Accessories (continued) | |||||||||||
| Omnivision Technologies, Inc. ‡† | 2,600 | $ | 76 | ||||||||
| ON Semiconductor Corp. ‡† | 17,400 | 125 | |||||||||
| Pericom Semiconductor Corp. ‡ | 3,000 | 29 | |||||||||
| Semtech Corp. ‡† | 6,000 | 113 | |||||||||
| Spansion LLC–Class A ‡ | 1,900 | 33 | |||||||||
| Triquint Semiconductor, Inc. ‡ | 2,526 | 14 | |||||||||
| TTM Technologies, Inc. ‡ | 10,900 | 177 | |||||||||
| Varian Semiconductor Equipment Associates, Inc. ‡ | 4,850 | 159 | |||||||||
| Virage Logic Corp. ‡ | 5,600 | 70 | |||||||||
| Zoran Corp. ‡ | 4,497 | 123 | |||||||||
| Fabricated Metal Products (0.2%) | |||||||||||
| Simpson Manufacturing Co., Inc. | 1,500 | 60 | |||||||||
| Furniture & Home Furnishings Stores (0.3%) | |||||||||||
| Williams-Sonoma, Inc. | 1,700 | 71 | |||||||||
| Health Services (4.5%) | |||||||||||
| Amedisys, Inc. ‡† | 2,300 | 76 | |||||||||
| Amsurg Corp. ‡† | 1,100 | 28 | |||||||||
| Community Health Systems, Inc. ‡ | 1,700 | 62 | |||||||||
| Coventry Health Care, Inc. ‡ | 2,850 | 142 | |||||||||
| DaVita, Inc. ‡ | 3,700 | 208 | |||||||||
| Gentiva Health Services, Inc. ‡ | 2,600 | 44 | |||||||||
| Human Genome Sciences, Inc. ‡ | 2,600 | 30 | |||||||||
| LCA-Vision, Inc. † | 700 | 39 | |||||||||
| LifePoint Hospitals, Inc. ‡ | 2,100 | 67 | |||||||||
| Manor Care, Inc. | 1,600 | 70 | |||||||||
| Matria Healthcare, Inc. ‡† | 2,750 | 84 | |||||||||
| Omnicare, Inc. | 2,700 | 153 | |||||||||
| Option Care, Inc. | 1,200 | 17 | |||||||||
| Symbion, Inc. ‡ | 3,500 | 81 | |||||||||
| Triad Hospitals, Inc. ‡ | 1,100 | 45 | |||||||||
| United Surgical Partners International, Inc. ‡ | 2,950 | 97 | |||||||||
| Holding & Other Investment Offices (0.9%) | |||||||||||
| Affiliated Managers Group ‡† | 2,400 | 243 | |||||||||
| Harris & Harris Group, Inc. ‡ | 1,100 | 14 | |||||||||
| Hotels & Other Lodging Places (0.2%) | |||||||||||
| Orient-Express Hotels, Ltd. | 1,400 | 57 | |||||||||
| Industrial Machinery & Equipment (2.1%) | |||||||||||
| Actuant Corp.–Class A | 3,800 | 243 | |||||||||
| Entegris, Inc. ‡ | 5,500 | 56 | |||||||||
| FMC Technologies, Inc. ‡ | 1,500 | 82 | |||||||||
| Kaydon Corp. † | 1,100 | 47 | |||||||||
| Kennametal, Inc. | 400 | 25 | |||||||||
| Oil States International, Inc. ‡† | 3,400 | 137 | |||||||||
The notes to the financial statements are an integral part of this report.
Transamerica IDEX Mutual Funds
Semi-Annual Report 2006
3
TA IDEX T. Rowe Price Small Cap
SCHEDULE OF INVESTMENTS (continued)
At April 30, 2006
(all amounts except share amounts in thousands)
(unaudited)
| Shares | Value | ||||||||||
| Instruments & Related Products (3.1%) | |||||||||||
| Anaren, Inc. ‡ | 1,300 | $ | 27 | ||||||||
| Cohu, Inc. | 2,700 | 52 | |||||||||
| Dionex Corp. ‡ | 550 | 33 | |||||||||
| DRS Technologies, Inc. | 808 | 45 | |||||||||
| FLIR Systems, Inc. ‡† | 5,300 | 130 | |||||||||
| Fossil, Inc. ‡† | 3,830 | 62 | |||||||||
| Herley Industries, Inc. ‡† | 1,300 | 28 | |||||||||
| II-VI, Inc. ‡ | 2,200 | 48 | |||||||||
| Input/Output, Inc. ‡† | 3,500 | 35 | |||||||||
| Itron, Inc. ‡† | 2,100 | 141 | |||||||||
| Mine Safety Appliances Co. | 3,000 | 125 | |||||||||
| Sonic Solutions, Inc. ‡† | 900 | 16 | |||||||||
| Teledyne Technologies, Inc. ‡ | 1,500 | 55 | |||||||||
| United Industrial Corp./New York | 300 | 20 | |||||||||
| Varian, Inc. ‡ | 1,000 | 43 | |||||||||
| Insurance (0.8%) | |||||||||||
| Healthspring, Inc. ‡ | 500 | 9 | |||||||||
| Max Reinsurance Capital, Ltd. | 1,900 | 47 | |||||||||
| Stancorp Financial Group, Inc. | 2,800 | 138 | |||||||||
| Triad Guaranty, Inc. ‡ | 700 | 38 | |||||||||
| Insurance Agents, Brokers & Service (0.3%) | |||||||||||
| Brown & Brown, Inc. | 2,400 | 75 | |||||||||
| Leather & Leather Products (0.2%) | |||||||||||
| Timberland Co.–Class A ‡ | 1,300 | 44 | |||||||||
| Lumber & Other Building Materials (0.2%) | |||||||||||
| Beacon Roofing Supply, Inc. ‡ | 800 | 30 | |||||||||
| Drew Industries, Inc. ‡ | 400 | 14 | |||||||||
| Management Services (2.6%) | |||||||||||
| Corporate Executive Board Co. | 3,400 | 364 | |||||||||
| Digitas, Inc. ‡ | 3,500 | 49 | |||||||||
| Navigant Consulting, Inc. ‡ | 5,000 | 105 | |||||||||
| Resources Connection, Inc. ‡ | 7,200 | 194 | |||||||||
| Manufacturing Industries (0.7%) | |||||||||||
| Daktronics, Inc. | 800 | 31 | |||||||||
| Shuffle Master, Inc. ‡† | 4,400 | 163 | |||||||||
| Medical Instruments & Supplies (7.1%) | |||||||||||
| American Medical Systems Holdings, Inc. ‡† | 4,200 | 93 | |||||||||
| Armor Holdings, Inc. ‡† | 1,900 | 116 | |||||||||
| Arthocare Corp. ‡† | 2,900 | 131 | |||||||||
| Aspect Medical Systems, Inc. ‡ | 5,400 | 154 | |||||||||
| Cyberoptics Corp. ‡ | 14,900 | 228 | |||||||||
| DENTSPLY International, Inc. | 1,150 | 69 | |||||||||
| Hologic, Inc. ‡ | 4,400 | 210 | |||||||||
| ICU Medical, Inc. ‡ | 2,600 | 107 | |||||||||
| Shares | Value | ||||||||||
| Medical Instruments & Supplies (continued) | |||||||||||
| Integra LifeSciences Holdings Corp. ‡ | 1,000 | $ | 42 | ||||||||
| Kyphon, Inc. ‡† | 3,900 | 162 | |||||||||
| Mentor Corp. † | 800 | 35 | |||||||||
| Merit Medical Systems, Inc. ‡ | 3,100 | 36 | |||||||||
| Orbotech, Ltd. ‡ | 2,200 | 56 | |||||||||
| Respironics, Inc. ‡ | 5,200 | 190 | |||||||||
| SonoSite, Inc. ‡† | 400 | 15 | |||||||||
| Steris Corp. | 4,700 | 108 | |||||||||
| Techne Corp. ‡ | 1,300 | 74 | |||||||||
| Thoratec Corp. ‡ | 5,000 | 90 | |||||||||
| Wright Medical Group, Inc. ‡ | 1,600 | 38 | |||||||||
| Mining (0.2%) | |||||||||||
| Florida Rock Industries, Inc. † | 300 | 19 | |||||||||
| Foundation Coal Holdings, Inc. | 600 | 30 | |||||||||
| Motion Pictures (1.0%) | |||||||||||
| Avid Technology, Inc. ‡ | 5,377 | 207 | |||||||||
| Macrovision Corp. ‡ | 2,500 | 57 | |||||||||
| Oil & Gas Extraction (6.5%) | |||||||||||
| Acergy SA, Sponsored ADR ‡ | 2,400 | 39 | |||||||||
| Atwood Oceanics, Inc. ‡ | 800 | 43 | |||||||||
| Bill Barrett Corp. ‡ | 4,800 | 144 | |||||||||
| Bois d'Arc Energy, Inc. ‡ | 4,400 | 75 | |||||||||
| Bronco Drilling Co., Inc. ‡ | 1,400 | 38 | |||||||||
| Cabot Oil & Gas Corp. | 3,500 | 172 | |||||||||
| Comstock Resources, Inc. ‡ | 7,200 | 224 | |||||||||
| Forest Oil Corp. ‡ | 1,900 | 69 | |||||||||
| Global Industries, Ltd. ‡ | 4,900 | 78 | |||||||||
| Grey Wolf, Inc. ‡ | 4,800 | 37 | |||||||||
| Helix Energy Solutions Group, Inc. ‡† | 5,100 | 198 | |||||||||
| Helmerich & Payne, Inc. | 900 | 65 | |||||||||
| KCS Energy, Inc. ‡ | 500 | 15 | |||||||||
| Mariner Energy, Inc. ‡ | 1,860 | 36 | |||||||||
| Patterson-UTI Energy, Inc. | 3,600 | 117 | |||||||||
| Petroleum Development Corp. ‡ | 1,100 | 44 | |||||||||
| SEACOR Holdings, Inc. ‡ | 500 | 44 | |||||||||
| Stone Energy Corp. ‡ | 1,700 | 80 | |||||||||
| Tetra Technologies, Inc. ‡ | 1,900 | 93 | |||||||||
| Todco–Class A ‡ | 500 | 23 | |||||||||
| Unit Corp. ‡ | 2,500 | 144 | |||||||||
| Personal Services (0.5%) | |||||||||||
| Jackson Hewitt Tax Service, Inc. | 4,300 | 128 | |||||||||
| Pharmaceuticals (6.2%) | |||||||||||
| Alkermes, Inc. ‡† | 3,400 | 73 | |||||||||
| BioMarin Pharmaceuticals, Inc. ‡ | 2,600 | 32 | |||||||||
The notes to the financial statements are an integral part of this report.
Transamerica IDEX Mutual Funds
Semi-Annual Report 2006
4
TA IDEX T. Rowe Price Small Cap
SCHEDULE OF INVESTMENTS (continued)
At April 30, 2006
(all amounts except share amounts in thousands)
(unaudited)
| Shares | Value | ||||||||||
| Pharmaceuticals (continued) | |||||||||||
| Cephalon, Inc. ‡† | 724 | $ | 48 | ||||||||
| Charles River Laboratories International, Inc. ‡ | 1,000 | 47 | |||||||||
| Digene Corp. ‡ | 4,100 | 169 | |||||||||
| Henry Schein, Inc. ‡ | 700 | 33 | |||||||||
| Idexx Laboratories, Inc. ‡† | 800 | 67 | |||||||||
| Immucor, Inc. ‡ | 1,800 | 52 | |||||||||
| InterMune, Inc. ‡† | 1,700 | 27 | |||||||||
| Invitrogen Corp. ‡ | 1,700 | 112 | |||||||||
| Martek Biosciences Corp. ‡† | 800 | 24 | |||||||||
| Medicines Co. ‡ | 5,600 | 108 | |||||||||
| Medicis Pharmaceutical Corp.–Class A † | 4,700 | 155 | |||||||||
| Meridian Bioscience, Inc. | 1,200 | 31 | |||||||||
| Myogen, Inc. ‡ | 3,000 | 99 | |||||||||
| Neurocrine Biosciences, Inc. ‡ | 2,000 | 115 | |||||||||
| Noven Pharmaceuticals, Inc. ‡ | 5,300 | 100 | |||||||||
| Onyx Pharmaceuticals, Inc. ‡† | 500 | 12 | |||||||||
| Panacos Pharmaceuticals, Inc. ‡ | 8,100 | 57 | |||||||||
| PDL BioPharma, Inc. ‡ | 5,600 | 161 | |||||||||
| Rigel Pharmaceuticals, Inc. ‡ | 500 | 5 | |||||||||
| Salix Pharmaceuticals, Ltd. ‡ | 6,069 | 83 | |||||||||
| Valeant Pharmaceuticals International † | 1,600 | 29 | |||||||||
| Vertex Pharmaceuticals, Inc. ‡† | 1,494 | 54 | |||||||||
| Vion Pharmaceuticals, Inc. ‡ | 8,400 | 16 | |||||||||
| Primary Metal Industries (0.5%) | |||||||||||
| Lone Star Technologies, Inc. ‡ | 400 | 21 | |||||||||
| NS Group, Inc. ‡ | 600 | 30 | |||||||||
| Steel Dynamics, Inc. † | 1,300 | 81 | |||||||||
| Radio & Television Broadcasting (0.1%) | |||||||||||
| Gray Television, Inc. | 3,400 | 26 | |||||||||
| Triple Crown Media, Inc. ‡ | 340 | 2 | |||||||||
| Radio, Television & Computer Stores (0.2%) | |||||||||||
| GameStop Corp.–Class A ‡† | 1,000 | 47 | |||||||||
| Research & Testing Services (2.6%) | |||||||||||
| Advisory Board Co. (The) ‡ | 5,300 | 297 | |||||||||
| DeCODE Genetics, Inc. ‡† | 3,400 | 27 | |||||||||
| Exelixis, Inc. ‡ | 1,200 | 13 | |||||||||
| Gen-Probe, Inc. ‡ | 2,600 | 139 | |||||||||
| iRobot Corp. ‡† | 1,600 | 35 | |||||||||
| Pharmaceutical Product Development, Inc. | 4,400 | 158 | |||||||||
| Senomyx, Inc. ‡ | 3,300 | 47 | |||||||||
| Residential Building Construction (0.2%) | |||||||||||
| Toll Brothers, Inc. ‡† | 1,600 | 51 | |||||||||
| Shares | Value | ||||||||||
| Restaurants (1.9%) | |||||||||||
| BJ's Restaurants, Inc. ‡ | 4,600 | $ | 121 | ||||||||
| CEC Entertainment, Inc. ‡ | 1,250 | 44 | |||||||||
| Cheesecake Factory (The) ‡ | 1,900 | 60 | |||||||||
| PF Chang's China Bistro, Inc. ‡† | 1,200 | 51 | |||||||||
| Rare Hospitality International, Inc. ‡ | 4,500 | 140 | |||||||||
| Sonic Corp. ‡ | 2,975 | 101 | |||||||||
| Retail Trade (3.4%) | |||||||||||
| AC Moore Arts & Crafts, Inc. ‡ | 8,000 | 149 | |||||||||
| Coldwater Creek, Inc. ‡ | 7,600 | 213 | |||||||||
| Fred's, Inc. | 2,150 | 31 | |||||||||
| Hibbett Sporting Goods, Inc. ‡ | 5,250 | 159 | |||||||||
| Michaels Stores, Inc. | 2,200 | 83 | |||||||||
| Nutri/System, Inc. ‡† | 600 | 41 | |||||||||
| Sportsman's Guide (The), Inc. ‡ | 5,000 | 132 | |||||||||
| Zumiez, Inc. ‡ | 4,200 | 137 | |||||||||
| Rubber & Misc. Plastic Products (0.3%) | |||||||||||
| Applied Films Corp. ‡ | 1,200 | 26 | |||||||||
| Trex Co., Inc. ‡† | 1,500 | 45 | |||||||||
| Security & Commodity Brokers (1.5%) | |||||||||||
| Eaton Vance Corp. | 2,900 | 83 | |||||||||
| Greenhill & Co., Inc. † | 1,400 | 99 | |||||||||
| IntercontinentalExchange, Inc. ‡ | 1,400 | 100 | |||||||||
| optionsXpress Holdings, Inc. | 500 | 16 | |||||||||
| Raymond James Financial, Inc. | 4,100 | 124 | |||||||||
| Social Services (0.6%) | |||||||||||
| Bright Horizons Family Solutions, Inc. ‡ | 3,900 | 155 | |||||||||
| Stone, Clay & Glass Products (0.3%) | |||||||||||
| Gentex Corp. | 6,100 | 89 | |||||||||
| Telecommunications (1.2%) | |||||||||||
| Adtran, Inc. | 4,500 | 113 | |||||||||
| NII Holdings, Inc.–Class B ‡† | 2,300 | 138 | |||||||||
| Wireless Facilities, Inc. ‡ | 16,800 | 73 | |||||||||
| Transportation & Public Utilities (0.9%) | |||||||||||
| UTI Worldwide, Inc. | 8,300 | 259 | |||||||||
| Transportation Equipment (0.4%) | |||||||||||
| Thor Industries, Inc. | 2,200 | 111 | |||||||||
| Trucking & Warehousing (1.5%) | |||||||||||
| Forward Air Corp. | 2,550 | 102 | |||||||||
| Old Dominion Freight Line, Inc. ‡ | 5,900 | 190 | |||||||||
| US Xpress Enterprises, Inc.–Class A ‡ | 2,800 | 55 | |||||||||
| Werner Enterprises, Inc. | 3,400 | 65 | |||||||||
The notes to the financial statements are an integral part of this report.
Transamerica IDEX Mutual Funds
Semi-Annual Report 2006
5
TA IDEX T. Rowe Price Small Cap
SCHEDULE OF INVESTMENTS (continued)
At April 30, 2006
(all amounts except share amounts in thousands)
(unaudited)
| Shares | Value | ||||||||||
| Wholesale Trade Durable Goods (2.0%) | |||||||||||
| Cytyc Corp. ‡ | 4,200 | $ | 109 | ||||||||
| Insight Enterprises, Inc. ‡ | 2,700 | 53 | |||||||||
| Interline Brands, Inc. ‡ | 700 | 19 | |||||||||
| Patterson Cos., Inc. ‡† | 2,300 | 75 | |||||||||
| Reliance Steel & Aluminum Co. | 300 | 27 | |||||||||
| SCP Pool Corp. † | 3,130 | 146 | |||||||||
| Symyx Technologies, Inc. ‡ | 3,800 | 111 | |||||||||
| Wholesale Trade Nondurable Goods (1.7%) | |||||||||||
| SunOpta, Inc. ‡† | 15,300 | 156 | |||||||||
| Tractor Supply Co. ‡† | 2,700 | 175 | |||||||||
| United Natural Foods, Inc. ‡† | 4,200 | 134 | |||||||||
| Total Common Stocks (cost: $20,925) | 26,810 | ||||||||||
| Principal | Value | ||||||||||
| SECURITY LENDING COLLATERAL (22.4%) | |||||||||||
| Debt (20.9%) | |||||||||||
| Bank Notes (2.6%) | |||||||||||
| Bank of America | |||||||||||
| 4.81%, due 06/07/2006 * | $ | 201 | $ | 201 | |||||||
| 4.81%, due 08/10/2006 * | 194 | 194 | |||||||||
| Bear Stearns & Co. 5.01%, due 06/06/2006 * | 78 | 78 | |||||||||
| 5.01%, due 09/07/2006 * | 233 | 233 | |||||||||
| Certificates Of Deposit (1.4%) | |||||||||||
| Halifax Bank of Scotland 4.78%, due 06/06/2006 * | 194 | 194 | |||||||||
| Rabobank Nederland 4.87%, due 05/31/2006 * | 194 | 194 | |||||||||
| Commercial Paper (1.1%) | |||||||||||
| Banco Santander Central Hispano SA 4.77%, due 05/02/2006 | 117 | 117 | |||||||||
| Sheffield Receivables Corp.–144A 4.81%, due 05/03/2006 | 194 | 194 | |||||||||
| Euro Dollar Overnight (3.8%) | |||||||||||
| Bank of Montreal 4.77%, due 05/02/2006 | 156 | 156 | |||||||||
| Dexia Group 4.78%, due 05/04/2006 | 194 | 194 | |||||||||
| Fortis Bank 4.77%, due 05/01/2006 | 78 | 78 | |||||||||
| Royal Bank of Canada 4.77%, due 05/01/2006 | 272 | 272 | |||||||||
| Royal Bank of Scotland 4.75%, due 05/03/2006 | 194 | 194 | |||||||||
| Principal | Value | ||||||||||
| Euro Dollar Overnight (continued) | |||||||||||
| Svenska Handlesbanken | |||||||||||
| 4.82%, due 05/01/2006 | $ | 149 | $ | 149 | |||||||
| Euro Dollar Terms (5.8%) | |||||||||||
| BancoBilbao Vizcaya Argentaria SA 4.95%, due 06/20/2006 | 156 | 156 | |||||||||
| Bank of the West 4.94%, due 06/16/2006 | 156 | 156 | |||||||||
| Barclays 4.79%, due 05/10/2006 | 233 | 233 | |||||||||
| 4.77%, due 05/16/2006 | 78 | 78 | |||||||||
| Canadian Imperial Bank of Commerce 4.97%, due 06/23/2006 | 117 | 117 | |||||||||
| Credit Suisse First Boston Corp. 4.73%, due 05/08/2006 | 117 | 117 | |||||||||
| Fortis Bank 4.83%, due 05/08/2006 | 78 | 78 | |||||||||
| Lloyds TSB Bank 4.81%, due 05/11/2006 | 117 | 117 | |||||||||
| Royal Bank of Scotland 4.87%, due 05/12/2006 | 156 | 156 | |||||||||
| Societe Generale 4.79%, due 05/10/2006 | 194 | 194 | |||||||||
| UBS AG 4.95%, due 06/20/2006 | 194 | 194 | |||||||||
| Repurchase Agreements (6.2%) †† | |||||||||||
| Credit Suisse First Boston Corp. 4.92%, dated 04/28/2006 to be repurchased at $264 on 05/01/2006 | 264 | 264 | |||||||||
| Goldman Sachs Group, Inc. (The) 4.92%, dated 04/28/2006 to be repurchased at $571 on 05/01/2006 | 571 | 571 | |||||||||
| Lehman Brothers, Inc. 4.92%, dated 04/28/2006 to be repurchased at $10 on 05/01/2006 | 10 | 10 | |||||||||
| Merrill Lynch & Co. 4.87%, dated 04/28/2006 to be repurchased at $583 on 05/01/2006 | 583 | 583 | |||||||||
| Morgan Stanley Dean Witter & Co. 4.93%, dated 04/28/2006 to be repurchased at $272 on 05/01/2006 | 272 | 272 | |||||||||
The notes to the financial statements are an integral part of this report.
Transamerica IDEX Mutual Funds
Semi-Annual Report 2006
6
TA IDEX T. Rowe Price Small Cap
SCHEDULE OF INVESTMENTS (continued)
At April 30, 2006
(all amounts except share amounts in thousands)
(unaudited)
| Shares | Value | ||||||||||
| Investment Companies (1.5%) | |||||||||||
| Barclays Global Investors Institutional Money Market Fund 1-day yield of 4.78% | 311,066 | $ | 311 | ||||||||
| Merrimac Cash Fund, Premium Class 1-day yield of 4.61% @ | 82,764 | 83 | |||||||||
| Total Security Lending Collateral (cost: $6,138) | 6,138 | ||||||||||
| Total Investment Securities (cost: $27,063) # | $ | 32,948 | |||||||||
NOTES TO SCHEDULE OF INVESTMENTS:
‡ Non-income producing.
† At April 30, 2006, all or a portion of this security is on loan (see Note 1). The value at April 30, 2006, of all securities on loan is $5,912.
* Floating or variable rate note. Rate is listed as of April 30, 2006.
†† Cash collateral for the Repurchase Agreements, valued at $1,750, that serve as collateral for securities lending are invested in corporate bonds with interest rates and maturity dates ranging from 0.00%–9.05% and 05/02/2006–12/31/2049, respectively.
@ Regulated investment company advised by Investors Bank and Trust Co. ("IBT"). IBT is also the accounting, custody and lending agent for the Fund.
l Investors Bank and Trust Co., a wholly-owned subsidiary of Investors Financial Services Corp., serves as the accounting, custody and lending agent for the Fund.
# Aggregate cost for Federal income tax purposes is $27,151. Aggregate gross unrealized appreciation for all securities in which there is an excess of value over tax cost and aggregate gross unrealized depreciation for all securities in which there is an excess of tax cost over value were $6,491 and $694, respectively. Net unrealized appreciation for tax purposes is $5,797.
DEFINITIONS:
144A 144A Securities are registered pursuant to Rule 144A of the Securities Act of 1933. These securities are deemed to be liquid for purposes of compliance limitations on holdings of illiquid securities and may be resold as transactions exempt from registration, normally to qualified institutional buyers. At April 30, 2006, these securities aggregated $194 or 0.7% of the net assets of the Fund.
ADR�� American Depositary Receipt
The notes to the financial statements are an integral part of this report.
Transamerica IDEX Mutual Funds
Semi-Annual Report 2006
7
TA IDEX T. Rowe Price Small Cap
STATEMENT OF ASSETS AND LIABILITIES
At April 30, 2006
(all amounts except per share amounts in thousands)
(unaudited)
| Assets: | |||||||
| Investment securities, at value (cost: $27,063) (including securities loaned of $5,912) | $ | 32,948 | |||||
| Cash | 708 | ||||||
| Receivables: | |||||||
| Investment securities sold | 100 | ||||||
| Interest | 2 | ||||||
| Dividends | 2 | ||||||
| Other | 4 | ||||||
| 33,764 | |||||||
| Liabilities: | |||||||
| Investment securities purchased | 74 | ||||||
| Accounts payable and accrued liabilities: | |||||||
| Shares of beneficial interest redeemed | 24 | ||||||
| Management and advisory fees | 25 | ||||||
| Transfer agent fees | 16 | ||||||
| Payable for collateral for securities on loan | 6,138 | ||||||
| Other | 21 | ||||||
| 6,298 | |||||||
| Net Assets | $ | 27,466 | |||||
| Net Assets Consist of: | |||||||
| Shares of beneficial interest, unlimited shares authorized, no par value | $ | 14,469 | |||||
| Distributable net investment income (loss) | (228 | ) | |||||
| Accumulated net realized gain (loss) from investment securities | 7,340 | ||||||
| Net unrealized appreciation (depreciation) on investment securities | 5,885 | ||||||
| Net Assets | $ | 27,466 | |||||
| Net Assets by Class: | |||||||
| Class A | $ | 9,489 | |||||
| Class B | 10,010 | ||||||
| Class C | 3,259 | ||||||
| Class I | 4,708 | ||||||
| Shares Outstanding: | |||||||
| Class A | 1,083 | ||||||
| Class B | 1,241 | ||||||
| Class C | 405 | ||||||
| Class I | 536 | ||||||
| Net Asset Value Per Share: | |||||||
| Class A | $ | 8.76 | |||||
| Class B | 8.07 | ||||||
| Class C | 8.04 | ||||||
| Class I | 8.79 | ||||||
| Maximum Offering Price Per Share (a): | |||||||
| Class A | $ | 9.27 | |||||
(a) Includes the maximum selling commission (represented as a percentage of offering price) which is reduced on certain levels of sales as set forth in the Prospectus. Net asset value per share for Classes B, C and I shares represents offering price. The redemption price for Classes B and C shares equals net asset value less any applicable contingent deferred sales charge.
STATEMENT OF OPERATIONS
For the period ended April 30, 2006 (b)
(all amounts in thousands)
(unaudited)
| Investment Income: | |||||||
| Dividends | $ | 51 | |||||
| Interest | 6 | ||||||
| Income from loaned securities–net | 9 | ||||||
| 66 | |||||||
| Expenses: | |||||||
| Management and advisory fees | 132 | ||||||
| Distribution and service fees: | |||||||
| Class A | 16 | ||||||
| Class B | 37 | ||||||
| Class C | 14 | ||||||
| Transfer agent fees: | |||||||
| Class A | 25 | ||||||
| Class B | 28 | ||||||
| Class C | 9 | ||||||
| Class I | – | (c) | |||||
| Printing and shareholder reports | 10 | ||||||
| Custody fees | 13 | ||||||
| Administration fees | 4 | ||||||
| Legal fees | 1 | ||||||
| Audit fees | 9 | ||||||
| Trustees fees | 1 | ||||||
| Registration fees | 8 | ||||||
| Other | 1 | ||||||
| Total expenses | 308 | ||||||
| Less: | |||||||
| Reimbursement of class expenses: | |||||||
| Class A | (2 | ) | |||||
| Class B | (9 | ) | |||||
| Class C | (3 | ) | |||||
| Total reimbursed expenses | (14 | ) | |||||
| Net expenses | 294 | ||||||
| Net Investment Income (Loss) | (228 | ) | |||||
| Net Realized and Unrealized Gain (Loss): | |||||||
| Realized gain (loss) from investment securities | 7,575 | ||||||
| Increase (decrease) in unrealized appreciation (depreciation) on investment securities | (1,897 | ) | |||||
| Net Realized and Unrealized Gain (Loss) on Investment Securities | 5,678 | ||||||
| Net Increase (Decrease) in Net Assets Resulting from Operations | $ | 5,450 | |||||
(b) Class I was offered for investment on November 15, 2005.
(c) Rounds to less than $1.
The notes to the financial statements are an integral part of this report.
Transamerica IDEX Mutual Funds
Semi-Annual Report 2006
8
TA IDEX T. Rowe Price Small Cap
STATEMENTS OF CHANGES IN NET ASSETS
For the period or year ended
(all amounts in thousands)
| April 30, 2006 (unaudited) (a) | October 31, 2005 | ||||||||||
| Increase (Decrease) In Net Assets From: | |||||||||||
| Operations: | |||||||||||
| Net investment income (loss) | $ | (228 | ) | $ | (740 | ) | |||||
| Net realized gain (loss) from investment securities and futures contracts | 7,575 | 17,086 | |||||||||
| Change in unrealized appreciation (depreciation) on investment securities | (1,897 | ) | (2,325 | ) | |||||||
| 5,450 | 14,021 | ||||||||||
| Distributions to Shareholders: | |||||||||||
| From net realized gains: | |||||||||||
| Class A | (4,216 | ) | – | ||||||||
| Class B | (4,768 | ) | – | ||||||||
| Class C | (1,959 | ) | – | ||||||||
| Class I | (5,025 | ) | – | ||||||||
| (15,968 | ) | – | |||||||||
| Capital Share Transactions: | |||||||||||
| Proceeds from shares sold: | |||||||||||
| Class A | 578 | 2,848 | |||||||||
| Class B | 294 | 1,312 | |||||||||
| Class C | 117 | 977 | |||||||||
| Class I | 28,376 | – | |||||||||
| 29,365 | 5,137 | ||||||||||
| Dividends and distributions reinvested: | |||||||||||
| Class A | 4,149 | – | |||||||||
| Class B | 4,493 | – | |||||||||
| Class C | 1,638 | – | |||||||||
| Class I | 5,025 | – | |||||||||
| 15,305 | – | ||||||||||
| Cost of shares redeemed: | |||||||||||
| Class A | (31,220 | ) | (106,299 | ) | |||||||
| Class B | (2,798 | ) | (3,417 | ) | |||||||
| Class C | (1,913 | ) | (1,843 | ) | |||||||
| Class I | (24,900 | ) | – | ||||||||
| (60,831 | ) | (111,559 | ) | ||||||||
| Automatic conversions: | |||||||||||
| Class A | 17 | 31 | |||||||||
| Class B | (17 | ) | (31 | ) | |||||||
| – | – | ||||||||||
| (16,161 | ) | (106,422 | ) | ||||||||
| Net increase (decrease) in net assets | (26,679 | ) | (92,401 | ) | |||||||
| Net Assets: | |||||||||||
| Beginning of period | 54,145 | 146,546 | |||||||||
| End of period | $ | 27,466 | $ | 54,145 | |||||||
| Distributable Net Investment Income (Loss) | $ | (228 | ) | $ | – | ||||||
(a) Class I was offered for investment on November 15, 2005.
| April 30, 2006 (unaudited) (a) | October 31, 2005 | ||||||||||
| Share Activity: | |||||||||||
| Shares issued: | |||||||||||
| Class A | 61 | 236 | |||||||||
| Class B | 34 | 115 | |||||||||
| Class C | 13 | 86 | |||||||||
| Class I | 2,188 | – | |||||||||
| 2,296 | 437 | ||||||||||
| Shares issued–reinvested from distributions: | |||||||||||
| Class A | 508 | – | |||||||||
| Class B | 598 | – | |||||||||
| Class C | 218 | – | |||||||||
| Class I | 616 | – | |||||||||
| 1,940 | – | ||||||||||
| Shares redeemed: | |||||||||||
| Class A | (2,502 | ) | (9,203 | ) | |||||||
| Class B | (331 | ) | (298 | ) | |||||||
| Class C | (227 | ) | (161 | ) | |||||||
| Class I | (2,268 | ) | – | ||||||||
| (5,328 | ) | (9,662 | ) | ||||||||
| Automatic conversions: | |||||||||||
| Class A | 2 | 3 | |||||||||
| Class B | (2 | ) | (3 | ) | |||||||
| – | – | ||||||||||
| Net increase (decrease) in shares outstanding: | |||||||||||
| Class A | (1,931 | ) | (8,964 | ) | |||||||
| Class B | 299 | (186 | ) | ||||||||
| Class C | 4 | (75 | ) | ||||||||
| Class I | 536 | – | |||||||||
| (1,092 | ) | (9,225 | ) | ||||||||
The notes to the financial statements are an integral part of this report.
Transamerica IDEX Mutual Funds
Semi-Annual Report 2006
9
TA IDEX T. Rowe Price Small Cap
FINANCIAL HIGHLIGHTS
(unaudited for the period ended April 30, 2006)
| For a share of beneficial interest outstanding throughout each period | |||||||||||||||||||||||||||||||||||||||
| Net Asset | Investment Operations | Distributions | Net Asset | ||||||||||||||||||||||||||||||||||||
| For the Period Ended (d)(g) | Value, Beginning of Period | Net Investment Income (Loss) | Net Realized and Unrealized Gain (Loss) | Total Operations | From Net Investment Income | From Net Realized Gains | Total Distributions | Value, End of Period | |||||||||||||||||||||||||||||||
| Class A | 4/30/2006 | $ | 12.61 | $ | (0.06 | ) | $ | 1.47 | $ | 1.41 | $ | – | $ | (5.26 | ) | $ | (5.26 | ) | $ | 8.76 | |||||||||||||||||||
| 10/31/2005 | 10.84 | (0.11 | ) | 1.88 | 1.77 | – | – | – | 12.61 | ||||||||||||||||||||||||||||||
| 10/31/2004 | 10.61 | (0.12 | ) | 0.35 | 0.23 | – | – | – | 10.84 | ||||||||||||||||||||||||||||||
| 10/31/2003 | 7.83 | (0.15 | ) | 2.93 | 2.78 | – | – | – | 10.61 | ||||||||||||||||||||||||||||||
| 10/31/2002 | 9.46 | (0.16 | ) | (1.47 | ) | (1.63 | ) | – | – | – | 7.83 | ||||||||||||||||||||||||||||
| 10/31/2001 | 13.17 | (0.14 | ) | (3.56 | ) | (3.70 | ) | – | (0.01 | ) | (0.01 | ) | 9.46 | ||||||||||||||||||||||||||
| Class B | 4/30/2006 | 12.03 | (0.07 | ) | 1.37 | 1.30 | – | (5.26 | ) | (5.26 | ) | 8.07 | |||||||||||||||||||||||||||
| 10/31/2005 | 10.44 | (0.22 | ) | 1.81 | 1.59 | – | – | – | 12.03 | ||||||||||||||||||||||||||||||
| 10/31/2004 | 10.28 | (0.18 | ) | 0.34 | 0.16 | – | – | – | 10.44 | ||||||||||||||||||||||||||||||
| 10/31/2003 | 7.63 | (0.19 | ) | 2.84 | 2.65 | – | – | – | 10.28 | ||||||||||||||||||||||||||||||
| 10/31/2002 | 9.29 | (0.22 | ) | (1.44 | ) | (1.66 | ) | – | – | – | 7.63 | ||||||||||||||||||||||||||||
| 10/31/2001 | 13.05 | (0.21 | ) | (3.54 | ) | (3.75 | ) | – | (0.01 | ) | (0.01 | ) | 9.29 | ||||||||||||||||||||||||||
| Class C | 4/30/2006 | 12.00 | (0.07 | ) | 1.37 | 1.30 | – | (5.26 | ) | (5.26 | ) | 8.04 | |||||||||||||||||||||||||||
| 10/31/2005 | 10.42 | (0.22 | ) | 1.80 | 1.58 | – | – | – | 12.00 | ||||||||||||||||||||||||||||||
| 10/31/2004 | 10.28 | (0.22 | ) | 0.36 | 0.14 | – | – | – | 10.42 | ||||||||||||||||||||||||||||||
| 10/31/2003 | 7.52 | (0.20 | ) | 2.96 | 2.76 | – | – | – | 10.28 | ||||||||||||||||||||||||||||||
| Class I | 4/30/2006 | 12.97 | (0.03 | ) | 1.11 | 1.08 | – | (5.26 | ) | (5.26 | ) | 8.79 | |||||||||||||||||||||||||||
| Ratios/Supplemental Data | |||||||||||||||||||||||||||||||
| For the Period | Total | Net Assets, End of Period | Ratio of Expenses to Average Net Assets (a) | Net Investment Income (Loss) to Average | Portfolio Turnover | ||||||||||||||||||||||||||
| Ended (g) | Return (c) | (000's) | Net (e) | Total (f) | Net Assets (a) | Rate (b) | |||||||||||||||||||||||||
| Class A | 4/30/2006 | 14.21 | % | $ | 9,489 | 1.61 | % | 1.65 | % | (1.19 | )% | 14 | % | ||||||||||||||||||
| 10/31/2005 | 16.33 | 38,007 | 1.42 | 1.42 | (0.95 | ) | 22 | ||||||||||||||||||||||||
| 10/31/2004 | 2.17 | 129,809 | 1.36 | 1.36 | (1.08 | ) | 29 | ||||||||||||||||||||||||
| 10/31/2003 | 35.50 | 95,018 | 1.75 | 1.93 | (1.55 | ) | 25 | ||||||||||||||||||||||||
| 10/31/2002 | (17.22 | ) | 6,487 | 1.74 | 2.67 | (1.52 | ) | 55 | |||||||||||||||||||||||
| 10/31/2001 | (28.11 | ) | 7,067 | 1.55 | 2.56 | (1.30 | ) | 49 | |||||||||||||||||||||||
| Class B | 4/30/2006 | 13.96 | 10,010 | 2.03 | 2.19 | (1.69 | ) | 14 | |||||||||||||||||||||||
| 10/31/2005 | 15.22 | 11,328 | 2.36 | 2.50 | (1.92 | ) | 22 | ||||||||||||||||||||||||
| 10/31/2004 | 1.56 | 11,776 | 1.94 | 1.94 | (1.67 | ) | 29 | ||||||||||||||||||||||||
| 10/31/2003 | 34.73 | 12,227 | 2.40 | 2.58 | (2.20 | ) | 25 | ||||||||||||||||||||||||
| 10/31/2002 | (17.85 | ) | 8,860 | 2.39 | 3.32 | (2.17 | ) | 55 | |||||||||||||||||||||||
| 10/31/2001 | (28.73 | ) | 9,496 | 2.20 | 3.21 | (1.95 | ) | 49 | |||||||||||||||||||||||
| Class C | 4/30/2006 | 13.95 | 3,259 | 2.05 | 2.18 | (1.71 | ) | 14 | |||||||||||||||||||||||
| 10/31/2005 | 15.21 | 4,810 | 2.36 | 2.51 | (1.91 | ) | 22 | ||||||||||||||||||||||||
| 10/31/2004 | 1.32 | 4,961 | 2.40 | 2.40 | (2.13 | ) | 29 | ||||||||||||||||||||||||
| 10/31/2003 | 36.70 | 628 | 2.40 | 2.58 | (2.20 | ) | 25 | ||||||||||||||||||||||||
| Class I | 4/30/2006 | 11.42 | 4,708 | 0.97 | 0.97 | (0.64 | ) | 14 | |||||||||||||||||||||||
The notes to the financial statements are an integral part of this report.
Transamerica IDEX Mutual Funds
Semi-Annual Report 2006
10
TA IDEX T. Rowe Price Small Cap
FINANCIAL HIGHLIGHTS (continued)
(unaudited)
NOTES TO FINANCIAL HIGHLIGHTS
(a) Annualized.
(b) Not annualized.
(c) Total Return has been calculated for the applicable period without deduction of a sales load, if any, on an initial purchase. Not annualized.
(d) Per share information is calculated based on average number of shares outstanding.
(e) Ratio of Net Expenses to Average Net Assets is net of fee waivers and reimbursements by the investment adviser, if any (see note 2).
(f) Ratio of Total Expenses to Average Net Assets includes all expenses before fee waivers and reimbursements by the investment adviser.
(g) The inception dates for the Fund's offering of share classes were as follows:
Class C was November 11, 2002.
Class I was November 15, 2005.
The notes to the financial statements are an integral part of this report.
Transamerica IDEX Mutual Funds
Semi-Annual Report 2006
11
TA IDEX T. Rowe Price Small Cap
NOTES TO FINANCIAL STATEMENTS
At April 30, 2006
(all amounts in thousands)
(unaudited)
NOTE 1. ORGANIZATION AND SIGNIFICANT ACCOUNTING POLICIES
Transamerica IDEX Mutual Funds is an open-end management investment company registered under the Investment Company Act of 1940, as amended (the "1940 Act").
In the normal course of business, TA IDEX T. Rowe Price Small Cap (the "Fund") enters into contracts that contain a variety of representations that provide general indemnifications. The Fund's maximum exposure under these arrangements is unknown, as this would involve future claims that may be made against the Fund and/or its affiliates that have not yet occurred. However, based on experience, the Fund expects the risk of loss to be remote.
This report should be read in conjunction with the current Fund prospectus, which contains more complete information about the Fund.
In preparing the Fund's financial statements in accordance with accounting principles generally accepted in the United States of America ("GAAP"), estimates or assumptions (which could differ from actual results) may be used that affect reported amounts and disclosures. The following is a summary of significant accounting policies followed by the Fund.
Multiple class operations, income and expenses: The Fund currently has four classes of shares, Class A, Class B, Class C and Class I, each with different expense levels. Classes A, B, and C are closed to new investors. Class I commenced operations on November 15, 2005. Class I is only available for investment to certain affiliated asset allocation funds. Class B shares will convert to Class A shares eight years after purchase. Income, non-class specific expenses and realized and unrealized gains and losses, are allocated daily to each class, based upon the value of shares outstanding method as permitted under Rule 18f-3 of the 1940 Act. Each class bears its own specific expenses as well as a portion of general, common expenses.
Security valuations: The Fund values its investments at the close of the New York Stock Exchange ("NYSE"), normally 4 p.m. ET, each day the NYSE is open for business. Fund investments are valued at the last sale price or closing price on the day of valuation taken from the primary exchange where the security is principally traded.
Securities traded in the over-the-counter market and listed securities for which no sale was reported on that date are valued at the last quoted bid price.
Debt securities are valued based on a price quotation or other equivalent indication of value supplied by an exchange, a pricing service or a major market maker; however, those that mature in sixty days or less are valued at amortized cost, which approximates market.
Investment company securities are valued at the net asset value of the underlying portfolio.
Other securities for which quotations are not readily available or whose values have been determined to be unreliable are valued at fair market value as determined in good faith by the Fund's Administrative Valuation Committee, under the supervision of the Board's Valuation Committee, using guidelines adopted by the Board of Trustees.
Cash: The Fund may leave cash overnight in its cash account with the custodian, Investors Bank & Trust Company ("IBT"). IBT has been contracted on behalf of the Fund to invest the excess cash into a savings account, which at April 30, 2006, was paying an interest rate of 3.24%.
Repurchase agreements: The Fund is authorized to enter into repurchase agreements. The Fund, through its custodian, IBT, receives delivery of the underlying securities, the value of which at the time of purchase is required to be an amount equal to at least 100% of the resale price. The Fund will bear the risk of value fluctuations until the security can be sold and may encounter delays and incur costs in liquidating the security. In the event of bankruptcy or insolvency of the seller, delays and costs may be incurred.
Commission recapture: The sub-adviser, to the extent consistent with the best execution and usual commission rate policies and practices, may place security transactions of the Fund with broker/dealers with which Transamerica IDEX Mutual Funds has established a Commission Recapture Program. A Commission Recapture Program is any arrangement under which a broker/dealer applies a portion of the commissions received by such broker/dealer on the security transactions to the Fund. In no event will commissions paid by the Fund be used to pay expenses that would otherwise be borne by any other funds within Transamerica IDEX Mutual Funds, or by any other party.
Recaptured commissions during the six months ended April 30, 2006, of less than $1 are included in net realized gains in the Statement of Operations.
Securities lending: The Fund may lend securities to qualified borrowers, with IBT acting as the Fund's lending agent. The Fund earns negotiated lenders' fees. The Fund receives cash and/or securities as collateral against the loaned securities. Cash collateral received is invested in short term, interest bearing securities. The Fund monitors the market value of securities loaned on a daily basis and requires collateral in an amount at least equal to the value of the securities loaned. Income from loaned securities on the Statement of Operations is net of fees, in the amount of $4, earned by IBT for its services.
Security transactions and investment income: Security transactions are recorded on the trade date. Security gains and losses are calculated on the specific identification basis. Dividend income, if any, is recorded
Transamerica IDEX Mutual Funds
Semi-Annual Report 2006
12
TA IDEX T. Rowe Price Small Cap
NOTES TO FINANCIAL STATEMENTS (continued)
At April 30, 2006
(all amounts in thousands)
(unaudited)
NOTE 1.–(continued)
on the ex-dividend date or, in the case of foreign securities, as soon as the Fund is informed of the ex-dividend date. Interest income, including accretion of discounts and amortization of premiums, is recorded on the accrual basis commencing on the settlement date.
Redemption fees: A short-term trading redemption fee may be assessed on any Fund shares in a fund account that are sold during the first five (5) NYSE trading days following their purchase date. This redemption fee will equal 2% of the amount redeemed and shares held the longest will be treated as being redeemed first and shares held the shortest as being redeemed last. For the six months ended April 30, 2006, the Fund received less than $1 in redemption fees.
Dividend distributions: Distributions to shareholders are recorded on the ex-dividend date and are determined in accordance with Federal income tax regulations which may differ from GAAP.
NOTE 2. RELATED PARTY TRANSACTIONS
Transamerica Fund Advisors, Inc. ("TFAI") is the Fund's investment adviser. Transamerica Fund Services, Inc. ("TFS") is the Fund's administrator and transfer agent. AFSG Securities Corp. ("AFSG") is the Fund's distributor/principal underwriter. TFAI, TFS, and AFSG are affiliates of AEGON, NV, a Netherlands corporation.
Certain officers and trustees of the Fund are also officers and/or directors of TFAI, TFS and AFSG.
The following schedule reflects the percentage of Fund assets owned by affiliated investment companies at April 30, 2006:
| Net Assets | % of Net Assets | ||||||||||
| TA IDEX Asset Allocation– Conservative Portfolio | $ | 2,399 | 8.73 | % | |||||||
| TA IDEX Asset Allocation– Moderate Portfolio | 2,311 | 8.41 | % | ||||||||
| Total | $ | 4,710 | 17.14 | % | |||||||
Investment advisory fees: The Fund pays management fees to TFAI based on average daily net assets ("ANA") at the following breakpoints:
0.75% of the first $500 million of ANA
0.70% of ANA over $500 million
TFAI has contractually agreed to waive its advisory fee and will reimburse the Fund to the extent that operating expenses, excluding 12b-1 fees, exceed the following stated annual limit:
1.35% Expense Limit
The sub-adviser, T. Rowe Price, has agreed to a pricing discount based on the aggregate assets that they manage in the Transamerica IDEX Mutual Funds. The amount of the discount received by the Fund at April 30, 2006 was $1.
Distribution and service fees: The Fund has a 12b-1 distribution plan under the 1940 Act pursuant to which an annual fee, based on average daily net assets, is paid to the distributor for various disbursements such as broker-dealer account servicing fees and other promotional expenses of the Fund. The Fund is authorized under the 12b-1 plan to pay fees on each class up to the following limits:
| Class A | 0.35 | % | |||||
| Class B | 1.00 | % | |||||
| Class C | 1.00 | % | |||||
| Class I | N/A | ||||||
From February 28, 2006 through March 1, 2007, the Fund will not pay 12b-1 fees under these plans.
Underwriter commissions relate to front-end sales charges imposed for Class A shares and contingent deferred sales charges from Classes B, C, and certain A share redemptions. For the six months ended April 30, 2006, the underwriter commissions were as follows:
| Received by Underwriter | $ | 7 | |||||
| Retained by Underwriter | 1 | ||||||
| Contingent Deferred Sales Charge | 2 | ||||||
Administrative services: The Fund has entered into an agreement with TFS for financial and legal fund administration services. The Fund pays TFS an annual fee of 0.02% of ANA. The Legal fees on the Statement of Operations are fees paid to external legal counsel.
Transfer agent fees: The Fund pays TFS an annual per-account charge for each open and closed account. The Fund paid TFS $60 for the six months ended April 30, 2006.
Deferred compensation plan: Each eligible independent Fund Trustee may elect to participate in a non-qualified deferred compensation plan maintained by Transamerica IDEX Mutual Funds (the "Plan"). Under the Plan, such Trustees may defer payment of all or a portion of their total fees earned as a Fund Trustee. Each Trustee who is a participant in the Plan may elect that the earnings, losses or gains credited to his or her deferred fee amounts be determined based on a deemed investment in any series of Transamerica IDEX Mutual Funds, including the Fund. The right of a participant to receive a distribution from the Plan of the deferred fees is an unsecured claim against the general assets of all series of Transamerica IDEX Mutual Funds. The pro rata liability to
Transamerica IDEX Mutual Funds
Semi-Annual Report 2006
13
TA IDEX T. Rowe Price Small Cap
NOTES TO FINANCIAL STATEMENTS (continued)
At April 30, 2006
(all amounts in thousands)
(unaudited)
NOTE 2.–(continued)
the Fund of all deferred fees in the Plan amounted, as of April 30, 2006, to $4.
NOTE 3. INVESTMENT TRANSACTIONS
The cost of securities purchased and proceeds from securities sold (excluding short-term securities) for the six months ended April 30, 2006, were as follows:
| Purchases of securities: | |||||||
| Long-Term | $ | 5,110 | |||||
| U.S. Government | – | ||||||
| Proceeds from maturities and sales of securities: | |||||||
| Long-Term | 37,436 | ||||||
| U.S. Government | – | ||||||
NOTE 4. FEDERAL INCOME TAX MATTERS
The Fund has not made any provision for federal income or excise taxes due to its policy to distribute all of its taxable income and capital gains to its shareholders and otherwise qualify as a regulated investment company under Subchapter M of the Internal Revenue Code. Income and capital gain distributions are determined in accordance with income tax regulations, which may differ from GAAP. These differences are primarily due to differing treatment for items including, but not limited to, wash sales and net operating losses.
NOTE 5. REGULATORY PROCEEDINGS
There continues to be significant federal and state regulatory activity relating to financial services companies, particularly mutual fund companies and their investment advisers. As part of an ongoing investigation regarding potential market timing, recordkeeping and trading compliance issues and matters affecting the Fund's investment adviser, TFAI, and certain affiliates and former employees of TFAI, the SEC staff has indicated that it is likely to take some action against TFAI and certain of its affiliates at the conclusion of the investigation. The potential timing and the scope of any such action is difficult to predict. Although the impact of any action brought against TFAI and/or its affiliates is difficult to assess at the present time, the Fund currently believes that the likelihood that any such action will have a material adverse impact on it is remote. It is important to note that the Fund is not aware of any allega tion of wrongdoing against it and its Board at the time this semi-annual report is printed. Although it is not anticipated that these developments will have an adverse impact on the Fund, there can be no assurance at this time. TFAI and its affiliates are actively working with the SEC in regard to this matter; however, the exact resolution cannot be determined at this time. TFAI will take such actions that it deems necessary or appropriate to continue providing management services to the Fund and to bring all matters to an appropriate conclusion.
TFAI and/or its affiliates, and not the Fund, will bear the costs regarding these regulatory matters.
Transamerica IDEX Mutual Funds
Semi-Annual Report 2006
14
TA IDEX T. Rowe Price Small Cap
INVESTMENT ADVISORY AND SUB-ADVISORY AGREEMENTS – REVIEW AND RENEWAL (unaudited)
At a meeting of the Board of Trustees of Transamerica IDEX Mutual Funds ("TA IDEX") held on November 2, 2005, the Board reviewed and considered the Investment Advisory Agreement between TA IDEX T. Rowe Price Small Cap (the "Fund") and Transamerica Fund Advisors, Inc. ("TFAI"), as well as the Investment Sub-Advisory Agreement of the Fund between TFAI and T. Rowe Price Associates, Inc. (the "Sub-Adviser"), to determine whether the agreements should be renewed for a one-year period. Following their review and consideration, the Trustees determined that the Investment Advisory Agreement and the Investment Sub-Advisory Agreement will enable shareholders of the Fund to obtain high quality services at a cost that is appropriate, reasonable, and in the best interests of its shareholders. The Board, including the independent members of the Board, unanimously approved the renewal of the Investment Advisory Agreement and the Investment Sub - -Advisory Agreement. In reaching their decision, the Trustees requested and obtained from TFAI and the Sub-Adviser such information as they deemed reasonably necessary to evaluate the proposed agreements. The Trustees also carefully considered the information that they had received throughout the year from TFAI and the Sub-Adviser (such as in-person presentations by the Sub-Adviser) as part of their regular oversight of the Fund, as well as: comparative fee, expense and performance information prepared by Lipper Inc. ("Lipper"), independent providers of mutual fund performance, fee and expense information, and profitability data. In considering the proposed continuation of the Investment Advisory Agreement and the Investment Sub-Advisory Agreement, the Trustees evaluated a number of considerations that they believe, in light of the legal advice furnished to them by TA IDEX counsel and independent legal counsel and their own business judgment, to be relevant. They based their decisions on the following consid erations, among others, although they did not identify any consideration or particular information that was controlling of their decisions:
The nature, extent and quality of the advisory service to be provided. The Board considered the nature and quality of the services provided by TFAI and the Sub-Adviser to the Fund in the past, as well as the services anticipated to be provided in the future. The Board concluded that TFAI and the Sub-Adviser are capable of providing high quality services to the Fund, as indicated by the nature and quality of services provided in the past, TFAI's and the Sub-Adviser's management capabilities demonstrated with respect to the funds they manage, including the Fund, and the experience, capability and integrity of TFAI's senior management, the financial resources of TFAI and the Sub-Adviser, TFAI's management oversight process, and the professional qualifications and experience of the Sub-Adviser's portfolio management team. The Trustees also concluded that TFAI and the Sub-Adviser proposed to provide investment and related services that were of the same quality and quantity as services provided to the Fund in the past, and that these services are appropriate in scope and extent in light of the Fund's operations, the competitive landscape of the investment company business and investor needs, and that TFAI's and the Sub-Adviser's obligations will remain substantially the same.
The investment performance of the Fund. The Board examined both the short-term and longer-term performance of the Fund, including relative performance against a benchmark securities index and a peer group of comparable mutual funds as prepared by Lipper, for various trailing periods ended June 30, 2005. The Trustees concluded that TFAI and the Sub-Adviser generally had achieved competitive investment performance, noting that the performance of the Fund has been at median relative to its peers over the past one-, two-, three- and five-year periods and competitive or superior to the benchmark index over the past one-, two-, three- and five-year periods. On the basis of the Trustees' assessment of the nature, extent and quality of advisory services to be provided or procured by TFAI and the Sub-Adviser, the Trustees concluded that TFAI and the Sub-Advise r are capable of generating a level of investment performance that is appropriate in light of the Fund's investment objective, policies and strategies and competitive with many other investment companies, and also determined that TFAI's and the Sub-Adviser's performance records indicate that their continued management is likely to benefit the Fund and its shareholders.
The cost of advisory services provided and the level of profitability. The Board reviewed profitability information regarding TFAI's costs of procuring portfolio management services, as well as the costs of provision of administration, transfer agency, fund accounting and other services, to the Fund and to TA IDEX as a whole by TFAI and its affiliates. The Trustees reviewed data from Lipper that compared the Fund's management fees (including management fees at various asset levels), other fees and expenses (including total expenses including and excluding 12b-1 distribution and service fees) and portfolio turnover rate against a peer group of comparable mutual funds. Based on such information, the Trustees determined that the management fees and overall expense ratio of the Fund generally are consistent with industry averages. In addition, on the basi s of the Board's review of the management fees to be charged by TFAI for investment advisory and related services, and TFAI profitability information (derived from TFAI's audited financial statements), TFAI's estimated management income resulting from its management of the Fund, the estimated margin of the Sub-Adviser, as well as the entirety of TFAI's and its affiliates' service relationship with TA IDEX, the Board concluded that the level of investment management fees and other service fees, as well as TFAI's and the Sub-Adviser's profitability, are appropriate in light of the services provided, the management fees and overall expense ratios of comparable investment companies and the anticipated profitability of the relationship between the Fund, TFAI and its affiliates, and the Sub-Adviser.
Transamerica IDEX Mutual Funds
Semi-Annual Report 2006
15
TA IDEX T. Rowe Price Small Cap (continued)
Whether fee levels reflect economies of scale and the extent to which economies of scale would be realized as the Fund grows. The Board concluded that the inclusion of asset-based breakpoints in the Fund's advisory fee schedule appropriately benefits investors by realizing economies of scale in the form of lower management fees as the level of assets grows. The Board noted that the Fund is closed to new investors and will be closed to new investments in the near future, except that the Fund may continue selling shares to other TA IDEX funds and other investment companies in the same group of investment companies as TA IDEX, which may limit, to an extent, the ability of the Fund to realize economies of scale. In addition, the Board assessed the current asset levels of the Fund and the long-term development strategy for the Fund, including continued inv estments by the TA IDEX asset allocation funds, and concluded that the Fund's current management fees appropriately reflect the Fund's current size, the current economic environment for TFAI, the competitive nature of the investment company market, and TFAI's pricing strategy. The Trustees also concluded that they will have the opportunity to periodically reexamine whether the Fund has achieved economies of scale, and the appropriateness of management fees payable to TFAI and fees payable by TFAI to the Sub-Adviser, in the future.
Benefits (such as soft dollars) to TFAI, its affiliates, or the Sub-Adviser from their relationship with the Fund. The Board concluded that other benefits derived by TFAI, its affiliates, and the Sub-Adviser from their relationship with the Fund, including "soft dollar" benefits (if any) in connection with brokerage transactions, sales charges and distribution/service fees (to the extent applicable) are reasonable and fair, and are consistent with industry practice and the best interests of the Fund and its shareholders. In this regard, the Board noted that TFAI does not realize "soft dollar" benefits from its relationship with the Fund, and that the Sub-Adviser is participating in a brokerage program pursuant to which a portion of brokerage commissions paid by the Fund is recaptured for the benefit of the Fund and its shareholders, thus limiting the amount of "soft-dollar" arrangements the Sub-Adviser may engage in with respect to the Fund's brokerage transactions. In addition, the Trustees determined that the administration, transfer agency, fund accounting and other fees paid by the Fund to affiliates of TFAI are reasonable, fair and in the best interests of shareholders in light of the nature and quality of the services provided, the associated costs to these affiliates of providing the services, the impact of the costs of such services on the Fund's overall operating expenses, and the necessity of the services for the Fund's operations.
Other considerations. The Board determined that TFAI had made a substantial commitment to the recruitment and retention of high quality personnel, and maintained the financial, compliance and operational resources reasonably necessary to manage the Fund in a professional manner that is consistent with the best interests of the Fund and its shareholders. In this regard, the Trustees favorably considered the procedures and policies in place by TFAI to enforce compliance with applicable laws and regulations and oversee the portfolio management activities of the Sub-Adviser. The Trustees also determined that TFAI had made a significant entrepreneurial commitment to the management and success of the Fund, reflected by TFAI's expense limitation and fee waiver arrangement with the Fund, which may result in TFAI waiving advisory fees for the benefit of shareh olders.
Transamerica IDEX Mutual Funds
Semi-Annual Report 2006
16
TA IDEX T. Rowe Price Tax-Efficient Growth
UNDERSTANDING YOUR FUND'S EXPENSES
(unaudited)
SHAREHOLDER EXPENSES
Fund shareholders may incur two types of costs: (1) transaction costs, including sales charges (loads) on purchases, contingent deferred sales charges on redemptions and redemption fees; and (2) ongoing costs, including management fees, 12b-1 distribution and service fees, and other fund expenses.
The following Example is intended to help you understand your ongoing costs (in dollars and cents) of investing in the Fund and to compare these costs with the ongoing costs of investing in other funds.
The Example is based on an investment of $1,000 invested at November 1, 2005 and held for the entire period until April 30, 2006.
ACTUAL EXPENSES
The first line in the table below provides information about actual account values and actual expenses. You may use the information in this line, together with the amount you invested, to estimate the expenses that you paid over the period. Simply divide your account value by $1,000 (for example, an $8,600 account value divided by $1,000 = 8.6), then multiply the result by the number in the first line of your Fund under the heading entitled "Expenses Paid During Period" to estimate the expenses you paid on your account during this period. If your account is an IRA, your expenses could have included a $15 annual fee. The amount of any fee paid through your account would increase the estimate of expenses you paid during the period and decrease your ending account value.
HYPOTHETICAL EXAMPLE FOR COMPARISON PURPOSES
The second line in the table below provides information about hypothetical account values and hypothetical expenses based on the Fund's actual expense ratio and an assumed rate of return of 5% per year before expenses, which is not the Fund's actual return. The hypothetical account values and expenses may not be used to estimate the actual ending account balance or expenses you paid for the period. You may use this information to compare the ongoing costs of investing in your Fund and other funds. To do so, compare this 5% hypothetical example with the 5% hypothetical examples that appear in the shareholder reports of the other funds. As in the case of the actual expense example, if your account is subject to an IRA fee, the amount of the fee paid through your account would increase the hypothetical expenses you would have paid during the period and decrease the hypothetical ending account value.
Please note that the expenses shown in the table are meant to highlight your ongoing costs only and do not reflect any transactional costs, such as sales charges, redemption fees, brokerage commissions paid on purchases and sales of fund shares. Therefore, the second line under the Fund in the table is useful in comparing ongoing costs only, and will not help you determine the relative total costs of owning different funds. If any of these transaction costs were included, your costs would be higher. The expenses shown in the table do not reflect any fees that may be charged to you by brokers, financial intermediaries or other financial institutions.
| Beginning Account Value | Ending Account Value | Annualized Expense Ratio | Expenses Paid During Period (a) | ||||||||||||||||
| Class A | |||||||||||||||||||
| Actual | $ | 1,000.00 | $ | 1,054.40 | 1.60 | % | $ | 8.15 | |||||||||||
| Hypothetical (b) | 1,000.00 | 1,016.86 | 1.60 | 8.00 | |||||||||||||||
| Class B | |||||||||||||||||||
| Actual | 1,000.00 | 1,052.00 | 2.04 | 10.38 | |||||||||||||||
| Hypothetical (b) | 1,000.00 | 1,014.68 | 2.04 | 10.19 | |||||||||||||||
| Class C | |||||||||||||||||||
| Actual | 1,000.00 | 1,052.00 | 2.04 | 10.38 | |||||||||||||||
| Hypothetical (b) | 1,000.00 | 1,014.68 | 2.04 | 10.19 | |||||||||||||||
(a) Expenses are calculated using the Fund's annualized expense ratio (as disclosed in the table), multiplied by the average account value for the period, multiplied by number of days in the period (181 days), and divided by the number of days in the year (365 days).
(b) 5% return per year before expenses.
GRAPHICAL PRESENTATION OF SCHEDULE OF INVESTMENTS
By Sector
At April 30, 2006
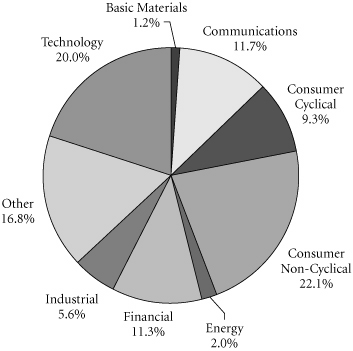
This chart shows the percentage breakdown by sector of the Fund's total investment securities.
Transamerica IDEX Mutual Funds
Semi-Annual Report 2006
1
TA IDEX T. Rowe Price Tax-Efficient Growth
SCHEDULE OF INVESTMENTS
At April 30, 2006
(all amounts except share amounts in thousands)
(unaudited)
| Shares | Value | ||||||||||
| COMMON STOCKS (100.0%) | |||||||||||
| Aerospace (1.2%) | |||||||||||
| Boeing Co. (The) | 2,100 | $ | 175 | ||||||||
| Amusement & Recreation Services (0.8%) | |||||||||||
| Disney (Walt) Co. (The) | 2,500 | 70 | |||||||||
| Station Casinos, Inc. † | 600 | 46 | |||||||||
| Apparel Products (0.4%) | |||||||||||
| Cintas Corp. | 1,600 | 67 | |||||||||
| Automotive (0.6%) | |||||||||||
| Harley-Davidson, Inc. | 1,700 | 86 | |||||||||
| Beverages (2.4%) | |||||||||||
| Anheuser-Busch Cos., Inc. | 1,200 | 53 | |||||||||
| Coca-Cola Co. (The) | 3,100 | 130 | |||||||||
| PepsiCo, Inc. | 2,870 | 167 | |||||||||
| Business Credit Institutions (0.3%) | |||||||||||
| Freddie Mac | 800 | 49 | |||||||||
| Business Services (8.2%) | |||||||||||
| ChoicePoint, Inc. ‡ | 1,400 | 62 | |||||||||
| Clear Channel Communications, Inc. | 1,800 | 51 | |||||||||
| eBay, Inc. ‡ | 7,800 | 268 | |||||||||
| First Data Corp. | 1,700 | 81 | |||||||||
| Getty Images, Inc. †‡ | 1,000 | 64 | |||||||||
| Monster Worldwide, Inc. †‡ | 1,700 | 98 | |||||||||
| Moody's Corp. | 2,100 | 130 | |||||||||
| Omnicom Group, Inc. | 2,000 | 180 | |||||||||
| Ritchie Bros. Auctioneers, Inc. | 700 | 38 | |||||||||
| Robert Half International, Inc. | 2,200 | 93 | |||||||||
| WPP Group PLC, Sponsored ADR † | 2,500 | 154 | |||||||||
| Chemicals & Allied Products (4.8%) | |||||||||||
| Avon Products, Inc. | 3,200 | 104 | |||||||||
| Colgate-Palmolive Co. | 2,200 | 130 | |||||||||
| Ecolab, Inc. | 2,200 | 83 | |||||||||
| Monsanto Co. | 1,000 | 83 | |||||||||
| Procter & Gamble Co. | 4,587 | 267 | |||||||||
| Valspar Corp. | 1,800 | 51 | |||||||||
| Commercial Banks (5.4%) | |||||||||||
| Bank of New York Co., Inc. (The) | 1,600 | 56 | |||||||||
| Citigroup, Inc. | 3,459 | 173 | |||||||||
| Mellon Financial Corp. | 1,500 | 56 | |||||||||
| Northern Trust Corp. | 3,100 | 183 | |||||||||
| State Street Corp. | 3,800 | 248 | |||||||||
| Wells Fargo & Co. | 1,300 | 89 | |||||||||
| Shares | Value | ||||||||||
| Communications Equipment (1.1%) | |||||||||||
| Nokia Corp., ADR | 3,400 | $ | 77 | ||||||||
| Rockwell Collins, Inc. | 1,500 | 86 | |||||||||
| Computer & Data Processing Services (8.9%) | |||||||||||
| Adobe Systems, Inc. ‡ | 1,600 | 63 | |||||||||
| Automatic Data Processing, Inc. | 3,700 | 163 | |||||||||
| Cognizant Technology Solutions Corp. ‡ | 600 | 38 | |||||||||
| Electronic Arts, Inc. ‡ | 500 | 28 | |||||||||
| Intuit, Inc. ‡ | 900 | 49 | |||||||||
| Microsoft Corp. | 13,200 | 319 | |||||||||
| NAVTEQ Corp. †‡ | 1,400 | 58 | |||||||||
| Oracle Corp. †‡ | 10,800 | 158 | |||||||||
| SAP AG, ADR † | 2,700 | 147 | |||||||||
| Yahoo!, Inc. †‡ | 9,200 | 302 | |||||||||
| Computer & Office Equipment (4.3%) | |||||||||||
| Cisco Systems, Inc. ‡ | 13,900 | 291 | |||||||||
| Dell, Inc. ‡ | 9,200 | 241 | |||||||||
| EMC Corp. ‡ | 7,700 | 104 | |||||||||
| Construction (0.2%) | |||||||||||
| Fluor Corp. | 300 | 28 | |||||||||
| Drug Stores & Proprietary Stores (1.1%) | |||||||||||
| CVS Corp. | 1,600 | 48 | |||||||||
| Walgreen Co. | 2,900 | 122 | |||||||||
| Educational Services (0.4%) | |||||||||||
| Apollo Group, Inc.–Class A ‡ | 1,050 | 57 | |||||||||
| Electronic & Other Electric Equipment (3.4%) | |||||||||||
| General Electric Co. | 14,550 | 503 | |||||||||
| Electronic Components & Accessories (14.3%) | |||||||||||
| Altera Corp. †‡ | 12,100 | 264 | |||||||||
| Analog Devices, Inc. † | 6,800 | 258 | |||||||||
| Broadcom Corp.–Class A ‡ | 1,500 | 62 | |||||||||
| Intel Corp. | 14,700 | 294 | |||||||||
| Linear Technology Corp. | 8,500 | 302 | |||||||||
| Maxim Integrated Products, Inc. † | 7,800 | 275 | |||||||||
| Microchip Technology, Inc. | 5,500 | 205 | |||||||||
| Texas Instruments, Inc. | 4,000 | 139 | |||||||||
| Xilinx, Inc. | 11,400 | 315 | |||||||||
| Entertainment (0.5%) | |||||||||||
| International Game Technology | 2,100 | 80 | |||||||||
| Food & Kindred Products (1.0%) | |||||||||||
| General Mills, Inc. | 1,100 | 54 | |||||||||
| Hershey Co. (The) | 600 | 32 | |||||||||
| WM Wrigley Jr. Co. | 1,100 | 52 | |||||||||
| WM Wrigley Jr. Co.–Class B | 275 | 13 | |||||||||
The notes to the financial statements are an integral part of this report.
Transamerica IDEX Mutual Funds
Semi-Annual Report 2006
2
TA IDEX T. Rowe Price Tax-Efficient Growth
SCHEDULE OF INVESTMENTS (continued)
At April 30, 2006
(all amounts except share amounts in thousands)
(unaudited)
| Shares | Value | ||||||||||
| Furniture & Home Furnishings Stores (0.9%) | |||||||||||
| Bed Bath & Beyond, Inc. ‡ | 1,900 | $ | 73 | ||||||||
| Williams-Sonoma, Inc. | 1,600 | 67 | |||||||||
| Hotels & Other Lodging Places (2.1%) | |||||||||||
| Choice Hotels International, Inc. | 1,300 | 70 | |||||||||
| Las Vegas Sands Corp. † ‡ | 1,400 | 91 | |||||||||
| Marriott International, Inc.–Class A | 2,100 | 153 | |||||||||
| Industrial Machinery & Equipment (1.1%) | |||||||||||
| Baker Hughes, Inc. | 1,200 | 97 | |||||||||
| Illinois Tool Works, Inc. | 600 | 62 | |||||||||
| Insurance (4.7%) | |||||||||||
| AMBAC Financial Group, Inc. | 800 | 66 | |||||||||
| American International Group, Inc. | 1,363 | 89 | |||||||||
| UnitedHealth Group, Inc. | 5,400 | 269 | |||||||||
| WellPoint, Inc. ‡ | 3,800 | 270 | |||||||||
| Insurance Agents, Brokers & Service (0.4%) | |||||||||||
| Marsh & McLennan Cos., Inc. | 1,800 | 55 | |||||||||
| Lumber & Other Building Materials (1.1%) | |||||||||||
| Home Depot, Inc. (The) | 4,200 | 168 | |||||||||
| Management Services (1.0%) | |||||||||||
| Corporate Executive Board Co. | 200 | 21 | |||||||||
| Paychex, Inc. | 3,000 | 121 | |||||||||
| Medical Instruments & Supplies (3.4%) | |||||||||||
| Baxter International, Inc. | 1,800 | 68 | |||||||||
| Medtronic, Inc. | 5,900 | 296 | |||||||||
| Stryker Corp. † | 1,800 | 79 | |||||||||
| Zimmer Holdings, Inc. ‡ | 1,000 | 63 | |||||||||
| Motion Pictures (0.5%) | |||||||||||
| Time Warner, Inc. | 4,000 | 70 | |||||||||
| Oil & Gas Extraction (1.8%) | |||||||||||
| Schlumberger, Ltd. † | 3,800 | 263 | |||||||||
| Paper & Allied Products (0.7%) | |||||||||||
| 3M Co. | 600 | 51 | |||||||||
| Kimberly-Clark Corp. | 900 | 53 | |||||||||
| Personal Credit Institutions (0.5%) | |||||||||||
| SLM Corp. | 1,300 | 69 | |||||||||
| Pharmaceuticals (7.6%) | |||||||||||
| Abbott Laboratories | 2,300 | 98 | |||||||||
| Amgen, Inc. ‡ | 2,900 | 196 | |||||||||
| AstraZeneca PLC, ADR | 1,100 | 61 | |||||||||
| Gilead Sciences, Inc. †‡ | 800 | 46 | |||||||||
| GlaxoSmithKline PLC, ADR | 1,000 | 57 | |||||||||
| Johnson & Johnson | 4,300 | 252 | |||||||||
| Shares | Value | ||||||||||
| Pharmaceuticals (continued) | |||||||||||
| Lilly (Eli) & Co. | 2,000 | $ | 106 | ||||||||
| Merck & Co., Inc. | 1,800 | 62 | |||||||||
| Pfizer, Inc. | 5,685 | 144 | |||||||||
| Wyeth | 2,000 | 97 | |||||||||
| Printing & Publishing (1.4%) | |||||||||||
| CBS Corp.–Class B † | 1,550 | 39 | |||||||||
| McGraw-Hill Cos., Inc. (The) | 3,000 | 167 | |||||||||
| Radio & Television Broadcasting (1.1%) | |||||||||||
| IAC/InterActiveCorp. †‡ | 1,550 | 45 | |||||||||
| Univision Communications, Inc.–Class A ‡ | 1,600 | 57 | |||||||||
| Viacom, Inc.–Class B ‡ | 1,350 | 54 | |||||||||
| Residential Building Construction (0.2%) | |||||||||||
| Lennar Corp.–Class A | 500 | 27 | |||||||||
| Restaurants (0.3%) | |||||||||||
| Starbucks Corp. ‡ | 1,400 | 52 | |||||||||
| Retail Trade (3.7%) | |||||||||||
| Amazon.com, Inc. †‡ | 5,500 | 194 | |||||||||
| Dollar General Corp. | 3,400 | 59 | |||||||||
| Family Dollar Stores, Inc. † | 2,300 | 57 | |||||||||
| Tiffany & Co. | 2,000 | 70 | |||||||||
| Wal-Mart Stores, Inc. † | 3,700 | 167 | |||||||||
| Rubber & Misc. Plastic Products (0.7%) | |||||||||||
| NIKE, Inc.–Class B | 1,300 | 106 | |||||||||
| Security & Commodity Brokers (6.0%) | |||||||||||
| American Express Co. | 1,900 | 102 | |||||||||
| BlackRock, Inc.–Class A † | 400 | 61 | |||||||||
| Cbot Holdings, Inc.–Class A †‡ | 700 | 74 | |||||||||
| Charles Schwab Corp. (The) | 4,800 | 86 | |||||||||
| Chicago Mercantile Exchange † | 400 | 183 | |||||||||
| Eaton Vance Corp. | 3,300 | 94 | |||||||||
| Franklin Resources, Inc. | 2,200 | 205 | |||||||||
| Goldman Sachs Group, Inc. (The) | 500 | 80 | |||||||||
| Transportation & Public Utilities (0.6%) | |||||||||||
| Expeditors International of Washington, Inc. | 1,000 | 86 | |||||||||
| Water Transportation (0.3%) | |||||||||||
| Carnival Corp. † | 900 | 42 | |||||||||
| Wholesale Trade Nondurable Goods (0.6%) | |||||||||||
| SYSCO Corp. | 2,800 | 84 | |||||||||
| Total Common Stocks (cost: $10,317) | 14,806 | ||||||||||
The notes to the financial statements are an integral part of this report.
Transamerica IDEX Mutual Funds
Semi-Annual Report 2006
3
TA IDEX T. Rowe Price Tax-Efficient Growth
SCHEDULE OF INVESTMENTS (continued)
At April 30, 2006
(all amounts except share amounts in thousands)
(unaudited)
| Principal | Value | ||||||||||
| SECURITY LENDING COLLATERAL (20.1%) | |||||||||||
| Debt (18.8%) | |||||||||||
| Bank Notes (2.3%) | |||||||||||
| Bank of America | |||||||||||
| 4.81%, due 06/07/2006 * | $ | 98 | $ | 98 | |||||||
| 4.81%, due 08/10/2006 * | 95 | 95 | |||||||||
| Bear Stearns & Co. 5.01%, due 06/06/2006 * 5.01%, due 09/07/2006 * | 38 113 | 38 113 | |||||||||
| Certificates Of Deposit (1.3%) | |||||||||||
| Halifax Bank of Scotland 4.78%, due 06/06/2006 * | 94 | 94 | |||||||||
| Rabobank Nederland 4.87%, due 05/31/2006 * | 94 | 94 | |||||||||
| Commercial Paper (1.0%) | |||||||||||
| Banco Santander Central Hispano SA 4.77%, due 05/02/2006 | 57 | 57 | |||||||||
| Sheffield Receivables Corp.–144A 4.81%, due 05/03/2006 | 94 | 94 | |||||||||
| Euro Dollar Overnight (3.4%) | |||||||||||
| Bank of Montreal 4.77%, due 05/02/2006 | 76 | 76 | |||||||||
| Dexia Group 4.78%, due 05/04/2006 | 94 | 94 | |||||||||
| Fortis Bank 4.77%, due 05/01/2006 | 38 | 38 | |||||||||
| Royal Bank of Canada 4.77%, due 05/01/2006 | 132 | 132 | |||||||||
| Royal Bank of Scotland 4.75%, due 05/03/2006 | 94 | 94 | |||||||||
| Svenska Handlesbanken 4.82%, due 05/01/2006 | 72 | 72 | |||||||||
| Euro Dollar Terms (5.2%) | |||||||||||
| BancoBilbao Vizcaya Argentaria SA 4.95%, due 06/20/2006 | 76 | 76 | |||||||||
| Bank of the West 4.94%, due 06/16/2006 | 76 | 76 | |||||||||
| Barclays 4.79%, due 05/10/2006 4.77%, due 05/16/2006 | 113 38 | 113 38 | |||||||||
| Canadian Imperial Bank of Commerce 4.97%, due 06/23/2006 | 57 | 57 | |||||||||
| Credit Suisse First Boston Corp. 4.73%, due 05/08/2006 | 57 | 57 | |||||||||
| Fortis Bank 4.83%, due 05/08/2006 | 38 | 38 | |||||||||
| Principal | Value | ||||||||||
| Euro Dollar Terms (continued) | |||||||||||
| Lloyds TSB Bank | |||||||||||
| 4.81%, due 05/11/2006 | $ | 57 | $ | 57 | |||||||
| Royal Bank of Scotland 4.87%, due 05/12/2006 | 76 | 76 | |||||||||
| Societe Generale 4.79%, due 05/10/2006 | 94 | 94 | |||||||||
| UBS AG 4.95%, due 06/20/2006 | 94 | 94 | |||||||||
| Repurchase Agreements (5.6%) †† | |||||||||||
| Credit Suisse First Boston Corp. 4.92%, dated 04/28/2006 to be repurchased at $128 on 05/01/2006 | 128 | 128 | |||||||||
| Goldman Sachs Group, Inc. (The) 4.92%, dated 04/28/2006 to be repurchased at $278 on 05/01/2006 | 277 | 277 | |||||||||
| Lehman Brothers, Inc. 4.92%, dated 04/28/2006 to be repurchased at $5 on 05/01/2006 | 5 | 5 | |||||||||
| Merrill Lynch & Co. 4.87%, dated 04/28/2006 to be repurchased at $283 on 05/01/2006 | 283 | 283 | |||||||||
| Morgan Stanley Dean Witter & Co. 4.93%, dated 04/28/2006 to be repurchased at $132 on 05/01/2006 | 132 | 132 | |||||||||
| Shares | Value | ||||||||||
| Investment Companies (1.3%) | |||||||||||
| Barclays Global Investors Institutional Money Market Fund 1-day yield of 4.78% | 151,065 | $ | 151 | ||||||||
| Merrimac Cash Fund, Premium Class 1-day yield of 4.61% @ | 40,193 | 40 | |||||||||
| Total Security Lending Collateral (cost: $2,981) | 2,981 | ||||||||||
| Total Investment Securities (cost: $13,298) # | $ | 17,787 | |||||||||
The notes to the financial statements are an integral part of this report.
Transamerica IDEX Mutual Funds
Semi-Annual Report 2006
4
TA IDEX T. Rowe Price Tax-Efficient Growth
SCHEDULE OF INVESTMENTS (continued)
At April 30, 2006
(all amounts except share amounts in thousands)
(unaudited)
NOTES TO SCHEDULE OF INVESTMENTS:
† At April 30, 2006, all or a portion of this security is on loan (see Note 1). The value at April 30, 2006, of all securities on loan is $2,885.
‡ Non-income producing.
* Floating or variable rate note. Rate is listed as of April 30, 2006.
†† Cash collateral for the Repurchase Agreements, valued at $850, that serve as collateral for securities lending are invested in corporate bonds with interest rates and maturity dates ranging from 0.00%–9.05% and 05/02/2006–12/31/2049, respectively.
@ Regulated investment company advised by Investors Bank and Trust Co. ("IBT"). IBT is also the accounting, custody and lending agent for the Fund.
# Aggregate cost for Federal income tax purposes is $13,405. Aggregate gross unrealized appreciation for all securities in which there is an excess of value over tax cost and aggregate gross unrealized depreciation for all securities in which there is an excess of tax cost over value were $4,526 and $144, respectively. Net unrealized appreciation for tax purposes is $4,382 .
DEFINITIONS:
144A 144A Securities are registered pursuant to Rule 144A of the Securities Act of 1933. These securities are deemed to be liquid for purposes of compliance limitations on holdings of illiquid securities and may be resold as transactions exempt from registration, normally to qualified institutional buyers. At April 30, 2006, these securities aggregated $94 or 0.6% of the net assets of the Fund.
ADR American Depositary Receipt
The notes to the financial statements are an integral part of this report.
Transamerica IDEX Mutual Funds
Semi-Annual Report 2006
5
TA IDEX T. Rowe Price Tax-Efficient Growth
STATEMENT OF ASSETS AND LIABILITIES
At April 30, 2006
(all amounts except per share amounts in thousands)
(unaudited)
| Assets: | |||||||
| Investment securities, at value (cost: $13,298) (including securities loaned of $2,885) | $ | 17,787 | |||||
| Cash | 25 | ||||||
| Receivables: | |||||||
| Investment securities sold | 146 | ||||||
| Shares of beneficial interest sold | 1 | ||||||
| Dividends | 10 | ||||||
| Other | 2 | ||||||
| 17,971 | |||||||
| Liabilities: | |||||||
| Investment securities purchased | 90 | ||||||
| Accounts payable and accrued liabilities: | |||||||
| Shares of beneficial interest redeemed | 43 | ||||||
| Management and advisory fees | 19 | ||||||
| Transfer agent fees | 12 | ||||||
| Payable for collateral for securities on loan | 2,981 | ||||||
| Other | 14 | ||||||
| 3,159 | |||||||
| Net Assets | $ | 14,812 | |||||
| Net Assets Consist of: | |||||||
| Shares of beneficial interest, unlimited shares authorized, no par value | $ | 10,996 | |||||
| Distributable net investment income (loss) | (59 | ) | |||||
| Accumulated net realized gain (loss) from investment securities | (614 | ) | |||||
| Net unrealized appreciation (depreciation) on investment securities | 4,489 | ||||||
| Net Assets | $ | 14,812 | |||||
| Net Assets by Class: | |||||||
| Class A | $ | 4,422 | |||||
| Class B | 7,927 | ||||||
| Class C | 2,463 | ||||||
| Shares Outstanding: | |||||||
| Class A | 405 | ||||||
| Class B | 751 | ||||||
| Class C | 234 | ||||||
| Net Asset Value Per Share: | |||||||
| Class A | $ | 10.92 | |||||
| Class B | 10.55 | ||||||
| Class C | 10.55 | ||||||
| Maximum Offering Price Per Share (a): | |||||||
| Class A | $ | 11.56 | |||||
(a) Includes the maximum selling commission (represented as a percentage of offering price) which is reduced on certain levels of sales as set forth in the Prospectus. Net asset value per share for Classes B and C shares represents offering price. The redemption price for Classes B and C shares equals net asset value less any applicable contingent deferred sales charge.
STATEMENT OF OPERATIONS
For the period ended April 30, 2006 (b)
(all amounts in thousands)
(unaudited)
| Investment Income: | |||||||
| Dividends | $ | 116 | |||||
| Income from loaned securities–net | 1 | ||||||
| 117 | |||||||
| Expenses: | |||||||
| Management and advisory fees | 67 | ||||||
| Distribution and service fees: | |||||||
| Class A | 7 | ||||||
| Class B | 31 | ||||||
| Class C | 10 | ||||||
| Transfer agent fees: | |||||||
| Class A | 13 | ||||||
| Class B | 19 | ||||||
| Class C | 6 | ||||||
| Class I | – | (c) | |||||
| Printing and shareholder reports | 5 | ||||||
| Custody fees | 5 | ||||||
| Administration fees | 2 | ||||||
| Legal fees | 1 | ||||||
| Audit fees | 9 | ||||||
| Registration fees | 8 | ||||||
| Total expenses | 183 | ||||||
| Less: | |||||||
| Reimbursement of class expenses: | |||||||
| Class A | (5 | ) | |||||
| Class B | (7 | ) | |||||
| Class C | (2 | ) | |||||
| Total reimbursed expenses | (14 | ) | |||||
| Net expenses | 169 | ||||||
| Net Investment Income (Loss) | (52 | ) | |||||
| Net Realized and Unrealized Gain (Loss): | |||||||
| Realized gain (loss) from investment securities | 2,965 | ||||||
| Increase (decrease) in unrealized appreciation (depreciation) on investment securities | (1,734 | ) | |||||
| Net Realized and Unrealized Gain (Loss) on Investment Securities | 1,231 | ||||||
| Net Increase (Decrease) in Net Assets Resulting from Operations | $ | 1,179 | |||||
(b) Class I was offered for investment on November 15, 2005.
(c) Rounds to less than $1.
The notes to the financial statements are an integral part of this report.
Transamerica IDEX Mutual Funds
Semi-Annual Report 2006
6
TA IDEX T. Rowe Price Tax-Efficient Growth
STATEMENTS OF CHANGES IN NET ASSETS
For the period or year ended
(all amounts in thousands)
| April 30, 2006 (unaudited) (a) | October 31, 2005 | ||||||||||
| Increase (Decrease) In Net Assets From: | |||||||||||
| Operations: | |||||||||||
| Net investment income (loss) | $ | (52 | ) | $ | (120 | ) | |||||
| Net realized gain (loss) from investment securities | 2,965 | 2,259 | |||||||||
| Change in unrealized appreciation (depreciation) on investment securities | (1,734 | ) | (980 | ) | |||||||
| 1,179 | 1,159 | ||||||||||
| Distributions to Shareholders: | |||||||||||
| From net investment income: | |||||||||||
| Class A | (3 | ) | – | ||||||||
| Class B | (2 | ) | – | ||||||||
| Class C | (1 | ) | – | ||||||||
| (6 | ) | – | |||||||||
| Capital Share Transactions: | |||||||||||
| Proceeds from shares sold: | |||||||||||
| Class A | 79 | 618 | |||||||||
| Class B | 75 | 435 | |||||||||
| Class C | 75 | 216 | |||||||||
| Class I | 4,227 | – | |||||||||
| 4,456 | 1,269 | ||||||||||
| Dividends and distributions reinvested: | |||||||||||
| Class A | 3 | – | |||||||||
| Class B | 2 | – | |||||||||
| Class C | 1 | – | |||||||||
| 6 | – | ||||||||||
| Cost of shares redeemed: | |||||||||||
| Class A | (5,809 | ) | (2,655 | ) | |||||||
| Class B | (2,348 | ) | (4,256 | ) | |||||||
| Class C | (700 | ) | (1,718 | ) | |||||||
| Class I | (4,354 | ) | – | ||||||||
| (13,211 | ) | (8,629 | ) | ||||||||
| Automatic conversions: | |||||||||||
| Class A | 5 | 3 | |||||||||
| Class B | (5 | ) | (3 | ) | |||||||
| – | – | ||||||||||
| (8,749 | ) | (7,360 | ) | ||||||||
| Net increase (decrease) in net assets | (7,576 | ) | (6,201 | ) | |||||||
| Net Assets: | |||||||||||
| Beginning of period | 22,388 | 28,589 | |||||||||
| End of period | $ | 14,812 | $ | 22,388 | |||||||
| Distributable Net Investment Income (Loss) | $ | (59 | ) | $ | (1 | ) | |||||
(a) Class I was offered for investment on November 15, 2005.
| April 30, 2006 (unaudited) (a) | October 31, 2005 | ||||||||||
| Share Activity: | |||||||||||
| Shares issued: | |||||||||||
| Class A | 7 | 60 | |||||||||
| Class B | 7 | 43 | |||||||||
| Class C | 7 | 22 | |||||||||
| Class I | 397 | – | |||||||||
| 418 | 125 | ||||||||||
| Shares redeemed: | |||||||||||
| Class A | (542 | ) | (256 | ) | |||||||
| Class B | (223 | ) | (423 | ) | |||||||
| Class C | (66 | ) | (170 | ) | |||||||
| Class I | (397 | ) | – | ||||||||
| (1,228 | ) | (849 | ) | ||||||||
| Net increase (decrease) in shares outstanding: | |||||||||||
| Class A | (535 | ) | (196 | ) | |||||||
| Class B | (216 | ) | (380 | ) | |||||||
| Class C | (59 | ) | (148 | ) | |||||||
| Class I | – | – | |||||||||
| (810 | ) | (724 | ) | ||||||||
The notes to the financial statements are an integral part of this report.
Transamerica IDEX Mutual Funds
Semi-Annual Report 2006
7
TA IDEX T. Rowe Price Tax-Efficient Growth
FINANCIAL HIGHLIGHTS
(unaudited for the period ended April 30, 2006)
| For a share of beneficial interest outstanding throughout each period | |||||||||||||||||||||||||||||||||||||||
| Net Asset | Investment Operations | Distributions | Net Asset | ||||||||||||||||||||||||||||||||||||
| For the Period Ended (d)(g) | Value, Beginning of Period | Net Investment Income (Loss) | Net Realized and Unrealized Gain (Loss) | Total Operations | From Net Investment Income | From Net Realized Gains | Total Distributions | Value, End of Period | |||||||||||||||||||||||||||||||
| Class A | 4/30/2006 | $ | 10.36 | $ | (0.01 | ) | $ | 0.57 | $ | 0.56 | $ | – | (h) | $ | – | $ | – | (h) | $ | 10.92 | |||||||||||||||||||
| 10/31/2005 | 9.93 | (0.01 | ) | 0.44 | 0.43 | – | – | – | 10.36 | ||||||||||||||||||||||||||||||
| 10/31/2004 | 9.85 | (0.06 | ) | 0.14 | 0.08 | – | – | – | 9.93 | ||||||||||||||||||||||||||||||
| 10/31/2003 | 8.09 | (0.05 | ) | 1.81 | 1.76 | – | – | – | 9.85 | ||||||||||||||||||||||||||||||
| 10/31/2002 | 9.54 | (0.02 | ) | (1.43 | ) | (1.45 | ) | – | – | – | 8.09 | ||||||||||||||||||||||||||||
| 10/31/2001 | 10.64 | 0.05 | (1.13 | ) | (1.08 | ) | (0.02 | ) | – | (0.02 | ) | 9.54 | |||||||||||||||||||||||||||
| Class B | 4/30/2006 | 10.03 | (0.04 | ) | 0.56 | 0.52 | – | (h) | – | – | (h) | 10.55 | |||||||||||||||||||||||||||
| 10/31/2005 | 9.68 | (0.07 | ) | 0.42 | 0.35 | – | – | – | 10.03 | ||||||||||||||||||||||||||||||
| 10/31/2004 | 9.66 | (0.12 | ) | 0.14 | 0.02 | – | – | – | 9.68 | ||||||||||||||||||||||||||||||
| 10/31/2003 | 7.99 | (0.10 | ) | 1.77 | 1.67 | – | – | – | 9.66 | ||||||||||||||||||||||||||||||
| 10/31/2002 | 9.49 | (0.09 | ) | (1.41 | ) | (1.50 | ) | – | – | – | 7.99 | ||||||||||||||||||||||||||||
| 10/31/2001 | 10.63 | (0.02 | ) | (1.12 | ) | (1.14 | ) | – | – | – | 9.49 | ||||||||||||||||||||||||||||
| Class C | 4/30/2006 | 10.03 | (0.04 | ) | 0.56 | 0.52 | – | (h) | – | – | (h) | 10.55 | |||||||||||||||||||||||||||
| 10/31/2005 | 9.68 | (0.07 | ) | 0.42 | 0.35 | – | – | – | 10.03 | ||||||||||||||||||||||||||||||
| 10/31/2004 | 9.66 | (0.12 | ) | 0.14 | 0.02 | – | – | – | 9.68 | ||||||||||||||||||||||||||||||
| 10/31/2003 | 7.91 | (0.11 | ) | 1.86 | 1.75 | – | – | – | 9.66 | ||||||||||||||||||||||||||||||
| Ratios/Supplemental Data | |||||||||||||||||||||||||||||||
| For the Period | Total | Net Assets, End of Period | Ratio of Expenses to Average Net Assets (a) | Net Investment Income (Loss) to Average | Portfolio Turnover | ||||||||||||||||||||||||||
| Ended (g) | Return (c) | (000's) | Net (e) | Total (f) | Net Assets (a) | Rate (b) | |||||||||||||||||||||||||
| Class A | 4/30/2006 | 5.44 | % | $ | 4,422 | 1.60 | % | 1.78 | % | (0.25 | )% | 6 | % | ||||||||||||||||||
| 10/31/2005 | 4.31 | 9,740 | 1.70 | 1.70 | (0.10 | ) | 6 | ||||||||||||||||||||||||
| 10/31/2004 | 0.83 | 11,281 | 1.70 | 1.78 | (0.56 | ) | 5 | ||||||||||||||||||||||||
| 10/31/2003 | 21.76 | 13,057 | 1.70 | 1.85 | (0.56 | ) | 50 | ||||||||||||||||||||||||
| 10/31/2002 | (15.20 | ) | 21,389 | 1.68 | 1.95 | (0.27 | ) | 76 | |||||||||||||||||||||||
| 10/31/2001 | (10.14 | ) | 8,552 | 1.55 | 2.07 | 0.47 | 30 | ||||||||||||||||||||||||
| Class B | 4/30/2006 | 5.20 | 7,927 | 2.04 | 2.18 | (0.76 | ) | 6 | |||||||||||||||||||||||
| 10/31/2005 | 3.62 | 9,708 | 2.35 | 2.46 | (0.72 | ) | 6 | ||||||||||||||||||||||||
| 10/31/2004 | 0.20 | 13,038 | 2.31 | 2.31 | (1.18 | ) | 5 | ||||||||||||||||||||||||
| 10/31/2003 | 21.05 | 14,181 | 2.35 | 2.50 | (1.21 | ) | 50 | ||||||||||||||||||||||||
| 10/31/2002 | (15.84 | ) | 11,897 | 2.33 | 2.60 | (0.92 | ) | 76 | |||||||||||||||||||||||
| 10/31/2001 | (10.75 | ) | 15,500 | 2.20 | 2.72 | (0.18 | ) | 30 | |||||||||||||||||||||||
| Class C | 4/30/2006 | 5.20 | 2,463 | 2.04 | 2.19 | (0.76 | ) | 6 | |||||||||||||||||||||||
| 10/31/2005 | 3.65 | 2,940 | 2.35 | 2.67 | (0.70 | ) | 6 | ||||||||||||||||||||||||
| 10/31/2004 | 0.17 | 4,270 | 2.35 | 3.00 | (1.21 | ) | 5 | ||||||||||||||||||||||||
| 10/31/2003 | 22.12 | 473 | 2.35 | 2.50 | (1.21 | ) | 50 | ||||||||||||||||||||||||
The notes to the financial statements are an integral part of this report.
Transamerica IDEX Mutual Funds
Semi-Annual Report 2006
8
TA IDEX T. Rowe Price Tax-Efficient Growth
FINANCIAL HIGHLIGHTS (continued)
(unaudited)
NOTES TO FINANCIAL HIGHLIGHTS
(a) Annualized.
(b) Not annualized.
(c) Total Return has been calculated for the applicable period without deduction of a sales load, if any, on an initial purchase. Not annualized.
(d) Per share information is calculated based on average number of shares outstanding.
(e) Ratio of Net Expenses to Average Net Assets is net of fee waivers and reimbursements by the investment adviser, if any (see note 2).
(f) Ratio of Total Expenses to Average Net Assets includes all expenses before fee waivers and reimbursements by the investment adviser.
(g) The inception date for the Fund's offering of share Class C was November 11, 2002.
(h) Amount rounds to less than $(0.01).
The notes to the financial statements are an integral part of this report.
Transamerica IDEX Mutual Funds
Semi-Annual Report 2006
9
TA IDEX T. Rowe Price Tax-Efficient Growth
NOTES TO FINANCIAL STATEMENTS
At April 30, 2006
(all amounts in thousands)
(unaudited)
NOTE 1. ORGANIZATION AND SIGNIFICANT ACCOUNTING POLICIES
Transamerica IDEX Mutual Funds is an open-end management investment company registered under the Investment Company Act of 1940, as amended (the "1940 Act").
In the normal course of business, TA IDEX T. Rowe Price Tax-Efficient Growth (the "Fund") enters into contracts that contain a variety of representations that provide general indemnifications. The Fund's maximum exposure under these arrangements is unknown, as this would involve future claims that may be made against the Fund and/or its affiliates that have not yet occurred. However, based on experience, the Fund expects the risk of loss to be remote.
This report should be read in conjunction with the current Fund prospectus, which contains more complete information about the Fund.
In preparing the Fund's financial statements in accordance with accounting principles generally accepted in the United States of America ("GAAP"), estimates or assumptions (which could differ from actual results) may be used that affect reported amounts and disclosures. The following is a summary of significant accounting policies followed by the Fund.
Multiple class operations, income and expenses: The Fund currently has four classes of shares, Class A, Class B, Class C and Class I, each with different expense levels. Currently all share classes are closed to new investors. Class I commenced operations on November 15, 2005. Class I is only available for investment to certain affiliated asset allocation funds. Class I is currently uninvested. Class B shares will convert to Class A shares eight years after purchase. Income, non-class specific expenses and realized and unrealized gains and losses, are allocated daily to each class, based upon the value of shares outstanding method as permitted under Rule 18f-3 of the 1940 Act. Each class bears its own specific expenses as well as a portion of general, common expenses.
Security valuations: The Fund values its investments at the close of the New York Stock Exchange ("NYSE"), normally 4 p.m. ET, each day the NYSE is open for business. Fund investments are valued at the last sale price or closing price on the day of valuation taken from the primary exchange where the security is principally traded.
Securities traded in the over-the-counter market and listed securities for which no sale was reported on that date are valued at the last quoted bid price.
Debt securities are valued based on a price quotation or other equivalent indication of value supplied by an exchange, a pricing service or a major market maker; however, those that mature in sixty days or less are valued at amortized cost, which approximates market.
Investment company securities are valued at the net asset value of the underlying portfolio.
Other securities for which quotations are not readily available or whose values have been determined to be unreliable are valued at fair market value as determined in good faith by the Fund's Administrative Valuation Committee, under the supervision of the Board's Valuation Committee, using guidelines adopted by the Board of Trustees.
Cash: The Fund may leave cash overnight in its cash account with the custodian, Investors Bank & Trust Company ("IBT"). IBT has been contracted on behalf of the Fund to invest the excess cash into a savings account, which at April 30, 2006, was paying an interest rate of 3.24%.
Repurchase agreements: The Fund is authorized to enter into repurchase agreements. The Fund, through its custodian, IBT, receives delivery of the underlying securities, the value of which at the time of purchase is required to be an amount equal to at least 100% of the resale price. The Fund will bear the risk of value fluctuations until the security can be sold and may encounter delays and incur costs in liquidating the security. In the event of bankruptcy or insolvency of the seller, delays and costs may be incurred.
Securities lending: The Fund may lend securities to qualified borrowers, with IBT acting as the Fund's lending agent. The Fund earns negotiated lenders' fees. The Fund receives cash and/or securities as collateral against the loaned securities. Cash collateral received is invested in short term, interest bearing securities. The Fund monitors the market value of securities loaned on a daily basis and requires collateral in an amount at least equal to the value of the securities loaned. Income from loaned securities on the Statement of Operations is net of fees, in the amount of $1, earned by IBT for its services.
Security transactions and investment income: Security transactions are recorded on the trade date. Security gains and losses are calculated on the specific identification basis. Dividend income, if any, is recorded on the ex-dividend date or, in the case of foreign securities, as soon as the Fund is informed of the ex-dividend date. Interest income, including accretion of discounts and amortization of premiums, is recorded on the accrual basis commencing on the settlement date.
Redemption fees: A short-term trading redemption fee may be assessed on any Fund shares in a fund account that are sold during the first five (5) NYSE trading days following their purchase date. This redemption fee will equal 2% of the amount redeemed and shares held the longest will be treated as being redeemed first and shares held the shortest as being redeemed last. For the six months ended April 30, 2006, the Fund received less than $1 in redemption fees.
Transamerica IDEX Mutual Funds
Semi-Annual Report 2006
10
TA IDEX T. Rowe Price Tax-Efficient Growth
NOTES TO FINANCIAL STATEMENTS (continued)
At April 30, 2006
(all amounts in thousands)
(unaudited)
NOTE 1.–(continued)
Dividend distributions: Distributions to shareholders are recorded on the ex-dividend date and are determined in accordance with Federal income tax regulations which may differ from GAAP.
NOTE 2. RELATED PARTY TRANSACTIONS
Transamerica Fund Advisors, Inc. ("TFAI") is the Fund's investment adviser. Transamerica Fund Services, Inc. ("TFS") is the Fund's administrator and transfer agent. AFSG Securities Corp. ("AFSG") is the Fund's distributor/principal underwriter. TFAI, TFS, and AFSG are affiliates of AEGON, NV, a Netherlands corporation.
Certain officers and trustees of the Fund are also officers and/or directors of TFAI, TFS and AFSG.
Investment advisory fees: The Fund pays management fees to TFAI based on average daily net assets ("ANA") at the following breakpoints:
0.75% of the first $500 million of ANA
0.65% of ANA over $500 million
TFAI has contractually agreed to waive its advisory fee and will reimburse the Fund to the extent that operating expenses, excluding 12b-1 fees, exceed the following stated annual limit:
1.35% Expense Limit
The sub-adviser, T. Rowe Price, has agreed to a pricing discount based on the aggregate assets that they manage in the Transamerica IDEX Mutual Funds. The amount of the discount received by the Fund for the six months ended April 30, 2006 was $1.
Distribution and service fees: The Fund has a 12b-1 distribution plan under the 1940 Act pursuant to which an annual fee, based on average daily net assets, is paid to the distributor for various disbursements such as broker-dealer account servicing fees and other promotional expenses of the Fund. The Fund is authorized under the 12b-1 plan to pay fees on each class up to the following limits:
| Class A | 0.35 | % | |||||
| Class B | 1.00 | % | |||||
| Class C | 1.00 | % | |||||
| Class I | N/A | ||||||
From February 28, 2006 through March 1, 2007, the Fund will not pay 12b-1 fees under these plans.
Underwriter commissions relate to front-end sales charges imposed for Class A shares and contingent deferred sales charges from Classes B, C, and certain A share redemptions. For the six months ended April 30, 2006, the underwriter commissions were as follows:
| Received by Underwriter | $ | 2 | |||||
| Retained by Underwriter | – | ||||||
| Contingent Deferred Sales Charge | 1 | ||||||
Administrative services: The Fund has entered into an agreement with TFS for financial and legal fund administration services. The Fund pays TFS an annual fee of 0.02% of ANA. The Legal fees on the Statement of Operations are fees paid to external legal counsel.
Transfer agent fees: The Fund pays TFS an annual per-account charge for each open and closed account. The Fund paid TFS $36 for the six months ended April 30, 2006.
Deferred compensation plan: Each eligible independent Fund Trustee may elect to participate in a non-qualified deferred compensation plan maintained by Transamerica IDEX Mutual Funds (the "Plan"). Under the Plan, such Trustees may defer payment of all or a portion of their total fees earned as a Fund Trustee. Each Trustee who is a participant in the Plan may elect that the earnings, losses or gains credited to his or her deferred fee amounts be determined based on a deemed investment in any series of Transamerica IDEX Mutual Funds, including the Fund. The right of a participant to receive a distribution from the Plan of the deferred fees is an unsecured claim against the general assets of all series of Transamerica IDEX Mutual Funds. The pro rata liability to the Fund of all deferred fees in the Plan amounted, as of April 30, 2006, to $2.
NOTE 3. INVESTMENT TRANSACTIONS
The cost of securities purchased and proceeds from securities sold (excluding short-term securities) for the six months ended April 30, 2006 were as follows:
| Purchases of securities: | |||||||
| Long-Term | $ | 1,086 | |||||
| U.S. Government | – | ||||||
| Proceeds from maturities and sales of securities: | |||||||
| Long-Term | 9,831 | ||||||
| U.S. Government | – | ||||||
NOTE 4. FEDERAL INCOME TAX MATTERS
The Fund has not made any provision for federal income or excise taxes due to its policy to distribute all of its taxable income and capital gains to its shareholders and otherwise qualify as a regulated investment company under Subchapter M of the Internal Revenue Code. Income and capital gain distributions are determined in accordance with income tax regulations, which may differ from GAAP. These differences are primarily due to differing treatment for items including, but not limited to, wash sales and capital loss carryforwards.
Transamerica IDEX Mutual Funds
Semi-Annual Report 2006
11
TA IDEX T. Rowe Price Tax-Efficient Growth
NOTES TO FINANCIAL STATEMENTS (continued)
At April 30, 2006
(all amounts in thousands)
(unaudited)
NOTE 4.–(continued)
The capital loss carryforwards are available to offset future realized capital gains through the periods listed:
| Capital Loss Carryforwards | Available through | ||||||
| $ | 238 | October 31, 2010 | |||||
| 3,180 | October 31, 2011 | ||||||
NOTE 5. REGULATORY PROCEEDINGS
There continues to be significant federal and state regulatory activity relating to financial services companies, particularly mutual fund companies and their investment advisers. As part of an ongoing investigation regarding potential market timing, recordkeeping and trading compliance issues and matters affecting the Fund's investment adviser, TFAI, and certain affiliates and former employees of TFAI, the SEC staff has indicated that it is likely to take some action against TFAI and certain of its affiliates at the conclusion of the investigation. The potential timing and the scope of any such action is difficult to predict. Although the impact of any action brought against TFAI and/or its affiliates is difficult to assess at the present time, the Fund currently believes that the likelihood that any such action will have a material adverse impact on it is remote. It is important to note that the Fund is not aware of any allega tion of wrongdoing against it and its Board at the time this semi-annual report is printed. Although it is not anticipated that these developments will have an adverse impact on the Fund, there can be no assurance at this time. TFAI and its affiliates are actively working with the SEC in regard to this matter; however, the exact resolution cannot be determined at this time. TFAI will take such actions that it deems necessary or appropriate to continue providing management services to the Fund and to bring all matters to an appropriate conclusion.
TFAI and/or its affiliates, and not the Fund, will bear the costs regarding these regulatory matters.
Transamerica IDEX Mutual Funds
Semi-Annual Report 2006
12
TA IDEX T. Rowe Price Tax-Efficient Growth
INVESTMENT ADVISORY AND SUB-ADVISORY AGREEMENTS – REVIEW AND RENEWAL (unaudited)
At a meeting of the Board of Trustees of Transamerica IDEX Mutual Funds ("TA IDEX") held on November 2, 2005, the Board reviewed and considered the Investment Advisory Agreement between TA IDEX T. Rowe Price Tax-Efficient Growth (the "Fund") and Transamerica Fund Advisors, Inc. ("TFAI"), as well as the Investment Sub-Advisory Agreement of the Fund between TFAI and T. Rowe Price Associates, Inc. (the "Sub-Adviser"), to determine whether the agreements should be renewed for a one-year period. Following their review and consideration, the Trustees determined that the Investment Advisory Agreement and the Investment Sub-Advisory Agreement will enable shareholders of the Fund to obtain high quality services at a cost that is appropriate, reasonable, and in the best interests of its shareholders. The Board, including the independent members of the Board, unanimously approved the renewal of the Investment Advisory Agreement and the Inv estment Sub-Advisory Agreement. In reaching their decision, the Trustees requested and obtained from TFAI and the Sub-Adviser such information as they deemed reasonably necessary to evaluate the proposed agreements. The Trustees also carefully considered the information that they had received throughout the year from TFAI and the Sub-Adviser (such as in-person presentations by the Sub-Adviser) as part of their regular oversight of the Fund, as well as: comparative fee, expense and performance information prepared by Lipper Inc. ("Lipper"), independent providers of mutual fund performance, fee and expense information, and profitability data. In considering the proposed continuation of the Investment Advisory Agreement and the Investment Sub-Advisory Agreement, the Trustees evaluated a number of considerations that they believe, in light of the legal advice furnished to them by TA IDEX counsel and independent legal counsel and their own business judgment, to be relevant. They based their decisions on the follo wing considerations, among others, although they did not identify any consideration or particular information that was controlling of their decisions:
The nature, extent and quality of the advisory service to be provided. The Board considered the nature and quality of the services provided by TFAI and the Sub-Adviser to the Fund in the past, as well as the services anticipated to be provided in the future. The Board concluded that TFAI and the Sub-Adviser are capable of providing high quality services to the Fund, as indicated by the nature and quality of services provided in the past, TFAI's and the Sub-Adviser's management capabilities demonstrated with respect to the funds they manage, including the Fund, and the experience, capability and integrity of TFAI's senior management, the financial resources of TFAI and the Sub-Adviser, TFAI's management oversight process and the professional qualifications and experience of the Sub-Adviser's portfolio management team. The Trustees also concluded that T FAI and the Sub-Adviser proposed to provide investment and related services that were of the same quality and quantity as services provided to the Fund in the past, and that these services are appropriate in scope and extent in light of the Fund's operations, the competitive landscape of the investment company business and investor needs, and that TFAI's and the Sub-Adviser's obligations will remain substantially the same.
The investment performance of the Fund. The Board examined both the short-term and longer-term performance of the Fund, including relative performance against a benchmark securities index and a peer group of comparable mutual funds as prepared by Lipper, for various trailing periods ended June 30, 2005. The Trustees concluded that TFAI and the Sub-Adviser generally had achieved acceptable investment performance, noting that although the performance of the Fund has been below median relative to its peers and the benchmark index over the past one- and two-year periods, its performance has been at or above median relative to its peers and the benchmark index over the past three- and five-year periods. On the basis of the Trustees' assessment of the nature, extent and quality of advisory services to be provided or procured by TFAI and the Sub-Adviser, the Trustees concluded that TFAI and the Sub-Adviser are capable of generating a level of investment performance that is appropriate in light of the Fund's investment objective, policies and strategies and competitive with many other investment companies, and also determined that TFAI's and the Sub-Adviser's performance records indicate that their continued management is likely to benefit the Fund and its shareholders.
The cost of advisory services provided and the level of profitability. The Board reviewed profitability information regarding TFAI's costs of procuring portfolio management services, as well as the costs of provision of administration, transfer agency, fund accounting and other services, to the Fund and to TA IDEX as a whole by TFAI and its affiliates. The Trustees reviewed data from Lipper that compared the Fund's management fees (including management fees at various asset levels), other fees and expenses (including total expenses including and excluding 12b-1 distribution and service fees) and portfolio turnover rate against a peer group of comparable mutual funds. Based on such information, the Trustees determined that the management fees and overall expense ratio of the Fund generally are consistent with industry averages. In addition, on the basi s of the Board's review of the management fees to be charged by TFAI for investment advisory and related services, and TFAI profitability information (derived from TFAI's audited financial statements), TFAI's estimated management income resulting from its management of the Fund, the estimated margin of the Sub-Adviser, as well as the entirety of TFAI's and its affiliates' service relationship with TA IDEX, the Board concluded that the level of investment management fees and other service fees, as well as TFAI's and the Sub-Adviser's profitability, are appropriate in light of the services provided, the management fees and overall expense ratios of comparable investment companies and the anticipated profitability of the relationship between the Fund, TFAI and its affiliates, and the Sub-Adviser.
Transamerica IDEX Mutual Funds
Semi-Annual Report 2006
13
TA IDEX T. Rowe Price Tax-Efficient Growth (continued)
Whether fee levels reflect economies of scale and the extent to which economies of scale would be realized as the Fund grows. The Board concluded that the inclusion of asset-based breakpoints in the Fund's advisory fee schedule appropriately benefits investors by realizing economies of scale in the form of lower management fees as the level of assets grows. The Board noted that the Fund is closed to new investors and will be closed to new investments in the near future, except that the Fund may continue selling shares to other TA IDEX funds and other investment companies in the same group of investment companies as TA IDEX, which may limit, to an extent, the ability of the Fund to realize economies of scale. In addition, the Board assessed the current asset levels of the Fund and the long-term development strategy for the Fund, including continued inv estments by the TA IDEX asset allocation funds, and concluded that the Fund's current management fees appropriately reflect the Fund's current size, the current economic environment for TFAI, the competitive nature of the investment company market, and TFAI's pricing strategy. The Trustees also concluded that they will have the opportunity to periodically reexamine whether the Fund has achieved economies of scale, and the appropriateness of management fees payable to TFAI and fees payable by TFAI to the Sub-Adviser, in the future.
Benefits (such as soft dollars) to TFAI, its affiliates, or the Sub-Adviser from their relationship with the Fund. The Board concluded that other benefits derived by TFAI, its affiliates, and the Sub-Adviser from their relationship with the Fund are reasonable and fair, and are consistent with industry practice and the best interests of the Fund and its shareholders. In this regard, the Board noted that neither TFAI nor the Sub-Adviser realizes "soft dollar" benefits from its relationship with the Fund. In addition, the Trustees determined that the administration, transfer agency, fund accounting and other fees paid by the Fund to affiliates of TFAI are reasonable, fair and in the best interests of shareholders in light of the nature and quality of the services provided, the associated costs to these affiliates of providing the services, the impact of the costs of such services on the Fund's overall operating expenses, and the necessity of the services for the Fund's operations.
Other considerations. The Board determined that TFAI had made a substantial commitment to the recruitment and retention of high quality personnel, and maintained the financial, compliance and operational resources reasonably necessary to manage the Fund in a professional manner that is consistent with the best interests of the Fund and its shareholders. In this regard, the Trustees favorably considered the procedures and policies in place by TFAI to enforce compliance with applicable laws and regulations and oversee the portfolio management activities of the Sub-Adviser. The Trustees also determined that TFAI had made a significant entrepreneurial commitment to the management and success of the Fund, reflected by TFAI's expense limitation and fee waiver arrangement with the Fund, which may result in TFAI waiving advisory fees for the benefit of shareh olders.
Transamerica IDEX Mutual Funds
Semi-Annual Report 2006
14
TA IDEX Templeton Great Companies Global
UNDERSTANDING YOUR FUND'S EXPENSES
(unaudited)
SHAREHOLDER EXPENSES
Fund shareholders may incur two types of costs: (1) transaction costs, including sales charges (loads) on purchases, contingent deferred sales charges on redemptions and redemption fees; and (2) ongoing costs, including management fees, 12b-1 distribution and service fees, and other fund expenses.
The following Example is intended to help you understand your ongoing costs (in dollars and cents) of investing in the Fund and to compare these costs with the ongoing costs of investing in other funds.
The Example is based on an investment of $1,000 invested at November 1, 2005 and held for the entire period until April 30, 2006.
ACTUAL EXPENSES
The first line in the table below provides information about actual account values and actual expenses. You may use the information in this line, together with the amount you invested, to estimate the expenses that you paid over the period. Simply divide your account value by $1,000 (for example, an $8,600 account value divided by $1,000 = 8.6), then multiply the result by the number in the first line of your Fund under the heading entitled "Expenses Paid During Period" to estimate the expenses you paid on your account during this period. If your account is an IRA, your expenses could have included a $15 annual fee. The amount of any fee paid through your account would increase the estimate of expenses you paid during the period and decrease your ending account value.
HYPOTHETICAL EXAMPLE FOR COMPARISON PURPOSES
The second line in the table below provides information about hypothetical account values and hypothetical expenses based on the Fund's actual expense ratio and an assumed rate of return of 5% per year before expenses, which is not the Fund's actual return. The hypothetical account values and expenses may not be used to estimate the actual ending account balance or expenses you paid for the period. You may use this information to compare the ongoing costs of investing in your Fund and other funds. To do so, compare this 5% hypothetical example with the 5% hypothetical examples that appear in the shareholder reports of the other funds. As in the case of the actual expense example, if your account is subject to an IRA fee, the amount of the fee paid through your account would increase the hypothetical expenses you would have paid during the period and decrease the hypothetical ending account value.
Please note that the expenses shown in the table are meant to highlight your ongoing costs only and do not reflect any transactional costs, such as sales charges, redemption fees, brokerage commissions paid on purchases and sales of fund shares. Therefore, the second line under the Fund in the table is useful in comparing ongoing costs only, and will not help you determine the relative total costs of owning different funds. If any of these transaction costs were included, your costs would be higher. The expenses shown in the table do not reflect any fees that may be charged to you by brokers, financial intermediaries or other financial institutions.
| Beginning Account Value | Ending Account Value | Annualized Expense Ratio | Expenses Paid During Period (a) | ||||||||||||||||
| Class A | |||||||||||||||||||
| Actual | $ | 1,000.00 | $ | 1,136.20 | 1.55 | % | $ | 8.21 | |||||||||||
| Hypothetical (b) | 1,000.00 | 1,017.11 | 1.55 | 7.75 | |||||||||||||||
| Class B | |||||||||||||||||||
| Actual | 1,000.00 | 1,133.00 | 2.20 | 11.64 | |||||||||||||||
| Hypothetical (b) | 1,000.00 | 1,013.88 | 2.20 | 10.99 | |||||||||||||||
| Class C | |||||||||||||||||||
| Actual | 1,000.00 | 1,132.60 | 2.20 | 11.63 | |||||||||||||||
| Hypothetical (b) | 1,000.00 | 1,013.88 | 2.20 | 10.99 | |||||||||||||||
| Class I | |||||||||||||||||||
| Actual | 1,000.00 | 1,123.00 | 0.92 | 4.44 | |||||||||||||||
| Hypothetical (b) | 1,000.00 | 1,018.56 | 0.92 | 4.22 | |||||||||||||||
(a) Expenses are calculated using the Fund's annualized expense ratio (as disclosed in the table), multiplied by the average account value for the period, multiplied by number of days in the period (181 days for Classes A, B and C, and 166 days for Class I), and divided by the number of days in the year (365 days).
(b) 5% return per year before expenses.
GRAPHICAL PRESENTATION OF SCHEDULE OF INVESTMENTS
By Region
At April 30, 2006
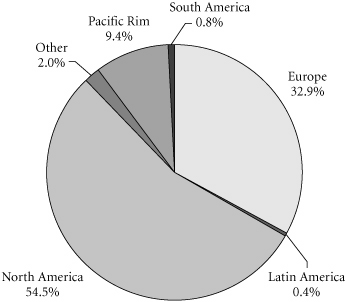
This chart shows the percentage breakdown by region of the Fund's total investment securities.
Transamerica IDEX Mutual Funds
Semi-Annual Report 2006
1
TA IDEX Templeton Great Companies Global
SCHEDULE OF INVESTMENTS
At April 30, 2006
(all amounts except share amounts in thousands)
(unaudited)
| Shares | Value | ||||||||||
| COMMON STOCKS ( 97.5%) | |||||||||||
| Australia (0.6%) | |||||||||||
| National Australia Bank, Ltd. | 61,872 | $ | 1,766 | ||||||||
| Bermuda (0.6%) | |||||||||||
| Weatherford International, Ltd. ‡ | 34,000 | 1,800 | |||||||||
| Brazil (0.8%) | |||||||||||
| Cia Vale do Rio Doce, ADR | 12,750 | 657 | |||||||||
| Empresa Brasileira de Aeronautica SA, ADR † | 17,350 | 674 | |||||||||
| Tele Norte Leste Participacoes SA, ADR † | 55,130 | 1,002 | |||||||||
| Canada (0.7%) | |||||||||||
| Alcan, Inc. | 12,570 | 655 | |||||||||
| BCE, Inc. | 51,530 | 1,274 | |||||||||
| Cayman Islands (1.1%) | |||||||||||
| ACE, Ltd. | 34,600 | 1,922 | |||||||||
| XL Capital, Ltd.–Class A | 19,340 | 1,274 | |||||||||
| Denmark (0.4%) | |||||||||||
| Vestas Wind Systems A/S ‡ | 47,410 | 1,285 | |||||||||
| Finland (1.2%) | |||||||||||
| Stora Enso Oyj–Class R | 110,430 | 1,728 | |||||||||
| UPM-Kymmene Oyj | 75,180 | 1,761 | |||||||||
| France (4.0%) | |||||||||||
| Accor SA | 22,260 | 1,399 | |||||||||
| AXA ‡ | 49,270 | 1,805 | |||||||||
| France Telecom SA | 58,460 | 1,363 | |||||||||
| Michelin (C.G.D.E.)–Class B | 21,817 | 1,572 | |||||||||
| Sanofi-Aventis | 17,689 | 1,666 | |||||||||
| Suez SA, ADR | 30,540 | 1,164 | |||||||||
| Thomson Multimedia SA | 18,150 | 375 | |||||||||
| Total SA | 4,763 | 1,315 | |||||||||
| Valeo SA | 20,322 | 869 | |||||||||
| Germany (3.5%) | |||||||||||
| BASF AG, ADR ‡ | 12,820 | 1,097 | |||||||||
| Bayerische Motoren Werke AG | 25,160 | 1,366 | |||||||||
| Deutsche Post AG | 82,870 | 2,206 | |||||||||
| E.ON AG, ADR ‡ | 35,200 | 1,429 | |||||||||
| Infineon Technologies AG ‡ | 55,500 | 677 | |||||||||
| Muenchener Rueckversicherungs AG | 6,850 | 969 | |||||||||
| Siemens AG | 25,070 | 2,368 | |||||||||
| Hong Kong (0.8%) | |||||||||||
| Cheung Kong Holdings, Ltd. (a) | 119,000 | 1,341 | |||||||||
| Hutchison Whampoa, Ltd. | 88,000 | 864 | |||||||||
| Israel (0.4%) | |||||||||||
| Check Point Software Technologies, Ltd. ‡ | 51,740 | 1,001 | |||||||||
| Italy (1.2%) | |||||||||||
| ENI SpA, ADR † | 27,885 | 1,707 | |||||||||
| UniCredito Italiano SpA (a) | 217,031 | 1,633 | |||||||||
| Shares | Value | ||||||||||
| Japan (5.1%) | |||||||||||
| East Japan Railway Co. | 130 | $ | 1,012 | ||||||||
| Fuji Photo Film Co., Ltd. | 24,100 | 817 | |||||||||
| Hitachi, Ltd. | 93,000 | 690 | |||||||||
| KDDI Corp. | 168 | 1,033 | |||||||||
| Konica Minolta Holdings, Inc. ‡ | 104,000 | 1,366 | |||||||||
| Mabuchi Motor Co., Ltd. | 17,100 | 961 | |||||||||
| Nintendo Co., Ltd. | 10,700 | 1,593 | |||||||||
| Nippon Telegraph & Telephone Corp. | 227 | 1,014 | |||||||||
| Nomura Holdings, Inc. | 49,600 | 1,118 | |||||||||
| Olympus Corp. | 42,800 | 1,222 | |||||||||
| Sompo Japan Insurance, Inc. | 90,000 | 1,300 | |||||||||
| Sony Corp., ADR | 22,320 | 1,092 | |||||||||
| Takeda Pharmaceutical Co., Ltd. | 24,100 | 1,469 | |||||||||
| Mexico (0.4%) | |||||||||||
| Telefonos de Mexico SA de CV–Class L, ADR | 53,890 | 1,185 | |||||||||
| Netherlands (2.5%) | |||||||||||
| Akzo Nobel NV, ADR | 20,600 | 1,183 | |||||||||
| ING Groep NV | 38,940 | 1,582 | |||||||||
| ING Groep NV, ADR | 11,170 | 453 | |||||||||
| Koninklijke Philips Electronics NV | 47,000 | 1,619 | |||||||||
| Reed Elsevier NV | 109,560 | 1,622 | |||||||||
| VNU NV | 19,750 | 677 | |||||||||
| Norway (0.8%) | |||||||||||
| Telenor ASA | 194,560 | 2,252 | |||||||||
| Portugal (0.7%) | |||||||||||
| Portugal Telecom SGPS SA | 149,220 | 1,897 | |||||||||
| Singapore (0.6%) | |||||||||||
| DBS Group Holdings, Ltd. | 125,600 | 1,414 | |||||||||
| DBS Group Holdings, Ltd., ADR | 5,910 | 266 | |||||||||
| South Korea (2.2%) | |||||||||||
| Kookmin Bank, ADR | 11,550 | 1,029 | |||||||||
| Korea Electric Power Corp., ADR † | 30,270 | 690 | |||||||||
| KT Corp., ADR † | 45,775 | 1,065 | |||||||||
| Samsung Electronics Co., Ltd., GDR–144A | 8,730 | 2,977 | |||||||||
| SK Telecom Co., Ltd., ADR † | 25,820 | 689 | |||||||||
| Spain (1.8%) | |||||||||||
| Banco Santander Central Hispano SA | 120,384 | 1,864 | |||||||||
| Iberdrola SA | 22,667 | 737 | |||||||||
| Repsol YPF SA | 50,821 | 1,516 | |||||||||
| Telefonica SA | 71,266 | 1,140 | |||||||||
| Sweden (2.8%) | |||||||||||
| Atlas Copco AB–Class A | 70,390 | 2,073 | |||||||||
| Electrolux AB–Class B | 37,980 | 1,134 | |||||||||
| Nordic Baltic Holding, FDR | 141,760 | 1,827 | |||||||||
| Securitas AB–Class B | 49,410 | 1,027 | |||||||||
| Svenska Cellulosa AB–Class B | 26,540 | 1,198 | |||||||||
| Volvo AB–Class B | 13,870 | 695 | |||||||||
The notes to the financial statements are an integral part of this report.
Transamerica IDEX Mutual Funds
Semi-Annual Report 2006
2
TA IDEX Templeton Great Companies Global
SCHEDULE OF INVESTMENTS (continued)
At April 30, 2006
(all amounts except share amounts in thousands)
(unaudited)
| Shares | Value | ||||||||||
| Switzerland (2.7%) | |||||||||||
| Lonza Group AG | 22,090 | $ | 1,563 | ||||||||
| Nestle SA, ADR | 17,610 | 1,339 | |||||||||
| Novartis AG, ADR | 27,240 | 1,567 | |||||||||
| Swiss Reinsurance (a) | 21,380 | 1,556 | |||||||||
| Swiss Reinsurance Rights, Expires 5/9/2006 m | 21,380 | — | o | ||||||||
| UBS AG | 11,080 | 1,310 | |||||||||
| UBS AG-Registered | 3,230 | 377 | |||||||||
| Taiwan (0.4%) | |||||||||||
| Chunghwa Telecom Co., Ltd., ADR | 51,130 | 1,053 | |||||||||
| United Kingdom (10.5%) | |||||||||||
| Alliance Unichem PLC | 70,270 | 1,135 | |||||||||
| BAE Systems PLC | 286,320 | 2,173 | |||||||||
| Boots Group PLC | 78,524 | 1,004 | |||||||||
| BP PLC, ADR | 24,780 | 1,827 | |||||||||
| British Sky Broadcasting PLC | 133,130 | 1,272 | |||||||||
| Cadbury Schweppes PLC | 139,320 | 1,378 | |||||||||
| Compass Group PLC | 450,250 | 1,935 | |||||||||
| GlaxoSmithKline PLC | 66,309 | 1,875 | |||||||||
| Group 4 Securicor PLC | 390,000 | 1,347 | |||||||||
| HSBC Holdings PLC | 46,099 | 794 | |||||||||
| HSBC Holdings PLC, ADR † | 7,650 | 663 | |||||||||
| National Grid PLC | 100,017 | 1,046 | |||||||||
| Pearson PLC | 83,360 | 1,152 | |||||||||
| Rentokil Initial PLC | 371,770 | 1,079 | |||||||||
| Rolls-Royce Group PLC ‡ | 213,540 | 1,849 | |||||||||
| Royal Bank of Scotland Group PLC | 59,310 | 1,931 | |||||||||
| Royal Dutch Shell PLC–Class B | 48,440 | 1,727 | |||||||||
| Smiths Group PLC | 70,620 | 1,309 | |||||||||
| Standard Chartered PLC | 37,120 | 982 | |||||||||
| Unilever PLC | 107,950 | 1,143 | |||||||||
| Vodafone Group PLC | 1,111,051 | 2,615 | |||||||||
| United States (51.7%) | |||||||||||
| 3M Co. | 41,000 | 3,503 | |||||||||
| Adobe Systems, Inc. ‡ | 55,700 | 2,183 | |||||||||
| Akamai Technologies, Inc. ‡† | 38,000 | 1,280 | |||||||||
| American Tower Corp.–Class A ‡ | 100,000 | 3,414 | |||||||||
| Apple Computer, Inc. ‡† | 41,680 | 2,934 | |||||||||
| Applebees International, Inc. † | 63,000 | 1,462 | |||||||||
| BJ Services Co. | 86,750 | 3,301 | |||||||||
| Chesapeake Energy Corp. † | 48,000 | 1,521 | |||||||||
| Clorox Co. | 58,620 | 3,762 | |||||||||
| Coach, Inc. ‡ | 93,950 | 3,102 | |||||||||
| Corning, Inc. ‡ | 137,000 | 3,785 | |||||||||
| Danaher Corp. | 70,810 | 4,540 | |||||||||
| Disney (Walt) Co. (The) | 87,000 | 2,432 | |||||||||
| E*TRADE Financial Corp. ‡ | 122,000 | 3,035 | |||||||||
| Shares | Value | ||||||||||
| United States (continued) | |||||||||||
| Emerson Electric Co. | 26,450 | $ | 2,247 | ||||||||
| Fortune Brands, Inc. | 29,000 | 2,329 | |||||||||
| Genzyme Corp. ‡ | 45,000 | 2,752 | |||||||||
| Goldman Sachs Group, Inc. (The) | 18,580 | 2,978 | |||||||||
| Harman International Industries, Inc. | 17,000 | 1,496 | |||||||||
| IMS Health, Inc. | 90,000 | 2,446 | |||||||||
| Intel Corp. | 121,520 | 2,428 | |||||||||
| International Game Technology | 126,000 | 4,779 | |||||||||
| ITT Industries, Inc. | 32,000 | 1,799 | |||||||||
| Johnson Controls, Inc. | 33,200 | 2,707 | |||||||||
| JP Morgan Chase & Co. | 122,210 | 5,546 | |||||||||
| Kellogg Co. | 73,160 | 3,388 | |||||||||
| Linear Technology Corp. | 86,340 | 3,065 | |||||||||
| Marathon Oil Corp. | 73,000 | 5,793 | |||||||||
| Medtronic, Inc. | 56,590 | 2,836 | |||||||||
| Microsoft Corp. | 130,975 | 3,163 | |||||||||
| Morgan Stanley | 59,440 | 3,822 | |||||||||
| National Oilwell Varco, Inc. ‡ | 59,000 | 4,069 | |||||||||
| Newell Rubbermaid, Inc. | 52,980 | 1,453 | |||||||||
| PepsiCo, Inc. | 52,530 | 3,059 | |||||||||
| Procter & Gamble Co. | 67,420 | 3,924 | |||||||||
| Prudential Financial, Inc. | 30,800 | 2,406 | |||||||||
| Quest Diagnostics, Inc. | 31,000 | 1,728 | |||||||||
| Sirf Technology Holdings, Inc. ‡ | 25,000 | 854 | |||||||||
| Sprint Nextel Corp. | 67,000 | 1,662 | |||||||||
| St. Jude Medical, Inc. ‡ | 49,210 | 1,943 | |||||||||
| Sun Microsystems, Inc. ‡ | 500,000 | 2,500 | |||||||||
| T. Rowe Price Group, Inc. | 47,000 | 3,957 | |||||||||
| United Technologies Corp. | 76,220 | 4,787 | |||||||||
| UnitedHealth Group, Inc. | 40,000 | 1,990 | |||||||||
| Valero Energy Corp. | 26,000 | 1,683 | |||||||||
| Verizon Communications, Inc. | 47,000 | 1,552 | |||||||||
| Vertex Pharmaceuticals, Inc. ‡† | 31,210 | 1,135 | |||||||||
| Viacom, Inc.–Class B ‡ | 67,340 | 2,682 | |||||||||
| Vulcan Materials Co. | 24,000 | 2,039 | |||||||||
| W.R. Berkley Corp. | 100,365 | 3,756 | |||||||||
| WM Wrigley Jr. Co. | 30,000 | 1,412 | |||||||||
| WM Wrigley Jr. Co.–Class B | 7,500 | 354 | |||||||||
| Wyeth | 65,000 | 3,164 | |||||||||
| Yahoo!, Inc. ‡† | 78,300 | 2,567 | |||||||||
| Total Common Stocks (cost: $241,649) | 279,987 | ||||||||||
The notes to the financial statements are an integral part of this report.
Transamerica IDEX Mutual Funds
Semi-Annual Report 2006
3
TA IDEX Templeton Great Companies Global
SCHEDULE OF INVESTMENTS (continued)
At April 30, 2006
(all amounts except share amounts in thousands)
(unaudited)
| Principal | Value | ||||||||||
| SECURITY LENDING COLLATERAL ( 5.5%) | |||||||||||
| Debt (5.1%) | |||||||||||
| Bank Notes (0.6%) | |||||||||||
| Bank of America | |||||||||||
| 4.81%, due 06/07/2006 * | $ | 519 | $ | 519 | |||||||
| 4.81%, due 08/10/2006 * | 501 | 501 | |||||||||
| Bear Stearns & Co. 5.01%, due 06/06/2006 * 5.01%, due 09/07/2006 * | 200 601 | 200 601 | |||||||||
| Certificates of Deposit (0.4%) | |||||||||||
| Halifax Bank of Scotland 4.78%, due 06/06/2006 * | 501 | 501 | |||||||||
| Rabobank Nederland 4.87%, due 05/31/2006 * | 501 | 501 | |||||||||
| Commercial Paper (0.3%) | |||||||||||
| Banco Santander Central Hispano SA 4.77%, due 05/02/2006 | 301 | 301 | |||||||||
| Sheffield Receivables Corp.–144A 4.81%, due 05/03/2006 | 500 | 500 | |||||||||
| Euro Dollar Overnight (0.9%) | |||||||||||
| Bank of Montreal 4.77%, due 05/02/2006 | 401 | 401 | |||||||||
| Dexia Group 4.78%, due 05/04/2006 | 501 | 501 | |||||||||
| Fortis Bank 4.77%, due 05/01/2006 | 200 | 200 | |||||||||
| Royal Bank of Canada 4.77%, due 05/01/2006 | 701 | 701 | |||||||||
| Royal Bank of Scotland 4.75%, due 05/03/2006 | 501 | 501 | |||||||||
| Svenska Handlesbanken 4.82%, due 05/01/2006 | 383 | 383 | |||||||||
| Euro Dollar Terms (1.4%) | |||||||||||
| BancoBilbao Vizcaya Argentaria SA 4.95%, due 06/20/2006 | 401 | 401 | |||||||||
| Bank of the West 4.94%, due 06/16/2006 | 401 | 401 | |||||||||
| Barclays 4.79%, due 05/10/2006 4.77%, due 05/16/2006 | 601 200 | 601 200 | |||||||||
| Canadian Imperial Bank of Commerce 4.97%, due 06/23/2006 | 301 | 301 | |||||||||
| Credit Suisse First Boston Corp. 4.73%, due 05/08/2006 | 301 | 301 | |||||||||
| Fortis Bank 4.83%, due 05/08/2006 | 200 | 200 | |||||||||
| Principal | Value | ||||||||||
| Euro Dollar Terms ( continued) | |||||||||||
| Lloyds TSB Bank | |||||||||||
| 4.81%, due 05/11/2006 | $ | 301 | $ | 301 | |||||||
| Royal Bank of Scotland 4.87%, due 05/12/2006 | 401 | 401 | |||||||||
| Societe Generale 4.79%, due 05/10/2006 | 501 | 501 | |||||||||
| UBS AG 4.95%, due 06/20/2006 | 501 | 501 | |||||||||
| Repurchase Agreements (1.5%) †† | |||||||||||
| Credit Suisse First Boston Corp. 4.92%, dated 04/28/2006 to be repurchased at $681 on 05/01/2006 | 680 | 680 | |||||||||
| Goldman Sachs Group, Inc. (The) 4.92%, dated 04/28/2006 to be repurchased at $1,472 on 05/01/2006 | 1,472 | 1,472 | |||||||||
| Lehman Brothers, Inc. 4.92%, dated 04/28/2006 to be repurchased at $25 on 05/01/2006 | 25 | 25 | |||||||||
| Merrill Lynch & Co. 4.87%, dated 04/28/2006 to be repurchased at $1,504 on 05/01/2006 | 1,503 | 1,503 | |||||||||
| Morgan Stanley Dean Witter & Co. 4.93%, dated 04/28/2006 to be repurchased at $702 on 05/01/2006 | 701 | 701 | |||||||||
| Shares | Value | ||||||||||
| Investment Companies (0.4%) | |||||||||||
| Barclays Global Investors Institutional Money Market Fund 1-day yield of 4.78% | 801,574 | $ | 802 | ||||||||
| Merrimac Cash Fund, Premium Class 1-day yield of 4.61% @ | 213,271 | 213 | |||||||||
| Total Security Lending Collateral (cost: $15,816) | 15,816 | ||||||||||
| Total Investment Securities (cost: $257,465) # | $ | 295,803 | |||||||||
The notes to the financial statements are an integral part of this report.
Transamerica IDEX Mutual Funds
Semi-Annual Report 2006
4
TA IDEX Templeton Great Companies Global
SCHEDULE OF INVESTMENTS (continued)
At April 30, 2006
(all amounts except share amounts in thousands)
(unaudited)
NOTES TO SCHEDULE OF INVESTMENTS:
‡ Non-income producing.
† At April 30, 2006, all or a portion of this security is on loan (see Note 1). The value at April 30, 2006, of all securities on loan is $15,324.
(a) Passive Foreign Investment Company.
o Value is less than $1.
* Floating or variable rate note. Rate is listed as of April 30, 2006.
†† Cash collateral for the Repurchase Agreements, valued at $4,510, that serve as collateral for securities lending are invested in corporate bonds with interest rates and maturity dates ranging from 0.00% - 9.05% and 05/02/2006 - 12/31/2049, respectively.
@ Regulated investment company advised by Investors Bank and Trust Co. ("IBT"). IBT is also the accounting, custody and lending agent for the Fund.
m Securities valued as determined in good faith in accordance with procedure established by the Fund's Board of Trustees.
# Aggregate cost for Federal income tax purposes is $258,233. Aggregate gross unrealized appreciation for all securities in which there is an excess of value over tax cost and aggregate gross unrealized depreciation for all securities in which there is an excess of tax cost over value were $42,239 and $4,669, respectively. Net unrealized appreciation for tax purposes is $37,570.
DEFINITIONS:
144A 144A Securities are registered pursuant to Rule 144A of the Securities Act of 1933. These securities are deemed to be liquid for purposes of compliance limitations on holdings of illiquid securities and may be resold as transactions exempt from registration, normally to qualified institutional buyers. At April 30, 2006, these securities aggregated $3,477 or 1.2% of the net assets of the Fund.
ADR American Depositary Receipt
FDR Finnish Depositary Receipt
GDR Global Depositary Receipt
SGPS Sociedade Gestora de Participações Socialis (Holding Enterprise)
The notes to the financial statements are an integral part of this report.
Transamerica IDEX Mutual Funds
Semi-Annual Report 2006
5
TA IDEX Templeton Great Companies Global
SCHEDULE OF INVESTMENTS (continued)
At April 30, 2006
(all amounts except share amounts in thousands)
(unaudited)
| Percentage of Net Assets | Value | ||||||||||
| INVESTMENTS BY INDUSTRY: | |||||||||||
| Commercial Banks | 7.5 | % | $ | 21,400 | |||||||
| Telecommunications | 6.6 | % | 18,900 | ||||||||
| Security & Commodity Brokers | 5.2 | % | 14,911 | ||||||||
| Pharmaceuticals | 5.1 | % | 14,762 | ||||||||
| Computer & Data Processing Services | 4.8 | % | 13,861 | ||||||||
| Insurance | 4.4 | % | 12,766 | ||||||||
| Petroleum Refining | 4.3 | % | 12,345 | ||||||||
| Chemicals & Allied Products | 4.0 | % | 11,530 | ||||||||
| Oil & Gas Extraction | 3.4 | % | 9,844 | ||||||||
| Electronic & Other Electric Equipment | 3.3 | % | 9,513 | ||||||||
| Aerospace | 3.3 | % | 9,483 | ||||||||
| Instruments & Related Products | 3.1 | % | 8,798 | ||||||||
| Electronic Components & Accessories | 3.0 | % | 8,751 | ||||||||
| Business Services | 2.9 | % | 8,411 | ||||||||
| Paper & Allied Products | 2.8 | % | 8,190 | ||||||||
| Food & Kindred Products | 2.7 | % | 7,870 | ||||||||
| Communications Equipment | 2.4 | % | 6,774 | ||||||||
| Life Insurance | 2.2 | % | 6,247 | ||||||||
| Industrial Machinery & Equipment | 2.1 | % | 6,142 | ||||||||
| Entertainment | 1.7 | % | 4,779 | ||||||||
| Medical Instruments & Supplies | 1.7 | % | 4,779 | ||||||||
| Communication | 1.6 | % | 4,686 | ||||||||
| Radio & Television Broadcasting | 1.6 | % | 4,511 | ||||||||
| Electric Services | 1.4 | % | 3,902 | ||||||||
| Automotive | 1.3 | % | 3,860 | ||||||||
| Computer & Office Equipment | 1.3 | % | 3,624 | ||||||||
| Percentage of Net Assets | Value | ||||||||||
| Restaurants | 1.2 | % | 3,398 | ||||||||
| Leather & Leather Products | 1.1 | % | 3,102 | ||||||||
| Beverages | 1.1 | % | 3,059 | ||||||||
| Rubber & Misc. Plastic Products | 1.1 | % | 3,025 | ||||||||
| Furniture & Fixtures | 0.9 | % | 2,707 | ||||||||
| Amusement & Recreation Services | 0.8 | % | 2,432 | ||||||||
| Fabricated Metal Products | 0.8 | % | 2,329 | ||||||||
| Transportation & Public Utilities | 0.8 | % | 2,206 | ||||||||
| Mining | 0.7 | % | 2,039 | ||||||||
| Health Services | 0.6 | % | 1,728 | ||||||||
| Printing & Publishing | 0.6 | % | 1,622 | ||||||||
| Manufacturing Industries | 0.6 | % | 1,593 | ||||||||
| Hotels & Other Lodging Places | 0.5 | % | 1,399 | ||||||||
| Specialty- Real Estate | 0.5 | % | 1,341 | ||||||||
| Electric, Gas & Sanitary Services | 0.4 | % | 1,164 | ||||||||
| Wholesale Trade Nondurable Goods | 0.4 | % | 1,143 | ||||||||
| Railroads | 0.4 | % | 1,012 | ||||||||
| Drug Stores & Proprietary Stores | 0.3 | % | 1,004 | ||||||||
| Motor Vehicles, Parts & Supplies | 0.3 | % | 869 | ||||||||
| Holding & Other Investment Offices | 0.3 | % | 864 | ||||||||
| Metal Mining | 0.2 | % | 657 | ||||||||
| Primary Metal Industries | 0.2 | % | 655 | ||||||||
| Investment Securities, at value | 97.5 | % | 279,987 | ||||||||
| Short-Term Investments | 5.5 | % | 15,816 | ||||||||
| Total Investment Securities | 103.0 | % | $ | 295,803 | |||||||
The notes to the financial statements are an integral part of this report.
Transamerica IDEX Mutual Funds
Semi-Annual Report 2006
6
TA IDEX Templeton Great Companies Global
STATEMENT OF ASSETS AND LIABILITIES
At April 30, 2006
(all amounts except per share amounts in thousands)
(unaudited)
| Assets: | |||||||
| Investment securities, at value (cost: $257,465) (including securities loaned of $15,324) | $ | 295,803 | |||||
| Cash | 4,378 | ||||||
| Receivables: | |||||||
| Investment securities sold | 4,802 | ||||||
| Shares of beneficial interest sold | 35 | ||||||
| Interest | 11 | ||||||
| Dividends | 725 | ||||||
| Dividend reclaims receivable | 573 | ||||||
| Other | 228 | ||||||
| 306,555 | |||||||
| Liabilities: | |||||||
| Foreign currency at value (identified cost $732) | 737 | ||||||
| Investment securities purchased | 1,462 | ||||||
| Accounts payable and accrued liabilities: | |||||||
| Shares of beneficial interest redeemed | 574 | ||||||
| Management and advisory fees | 170 | ||||||
| Distribution and service fees | 135 | ||||||
| Transfer agent fees | 165 | ||||||
| Administration fees | 5 | ||||||
| Payable for collateral for securities on loan | 15,816 | ||||||
| Other | 175 | ||||||
| 19,239 | |||||||
| Net Assets | $ | 287,316 | |||||
| Net Assets Consist of: | |||||||
| Shares of beneficial interest, unlimited shares authorized, no par value | $ | 586,260 | |||||
| Distributable net investment income (loss) | (318 | ) | |||||
| Accumulated net realized gain (loss) from investment securities and foreign currency transactions | (337,057 | ) | |||||
| Net unrealized appreciation (depreciation) on: Investment securities | 38,334 | ||||||
| Translation of assets and liabilities denominated in foreign currencies | 97 | ||||||
| Net Assets | $ | 287,316 | |||||
| Net Assets by Class: | |||||||
| Class A | $ | 124,332 | |||||
| Class B | 86,329 | ||||||
| Class C | 35,792 | ||||||
| Class I | 40,863 | ||||||
| Shares Outstanding: | |||||||
| Class A | 4,434 | ||||||
| Class B | 3,279 | ||||||
| Class C | 1,361 | ||||||
| Class I | 1,453 | ||||||
| Net Asset Value Per Share: | |||||||
| Class A | $ | 28.04 | |||||
| Class B | 26.33 | ||||||
| Class C | 26.29 | ||||||
| Class I | 28.12 | ||||||
| Maximum Offering Price Per Share (a): | |||||||
| Class A | $ | 29.67 | |||||
(a) Includes the maximum selling commission (represented as a percentage of offering price) which is reduced on certain levels of sales as set forth in the Prospectus. Net asset value per share for Classes B, C and I shares represents offering price. The redemption price for Classes B and C shares equals net asset value less any applicable contingent deferred sales charge.
STATEMENT OF OPERATIONS
For the period ended April 30, 2006 (b)
(all amounts in thousands)
(unaudited)
| Investment Income: | |||||||
| Dividends (net of withholding taxes on foreign dividends of $152) | $ | 3,240 | |||||
| Interest | 151 | ||||||
| Income from loaned securities–net | 20 | ||||||
| 3,411 | |||||||
| Expenses: | |||||||
| Management and advisory fees | 1,365 | ||||||
| Distribution and service fees: | |||||||
| Class A | 255 | ||||||
| Class B | 441 | ||||||
| Class C | 182 | ||||||
| Transfer agent fees: | |||||||
| Class A | 240 | ||||||
| Class B | 239 | ||||||
| Class C | 85 | ||||||
| Class I | – | (c) | |||||
| Printing and shareholder reports | 84 | ||||||
| Custody fees | 69 | ||||||
| Administration fees | 34 | ||||||
| Legal fees | 10 | ||||||
| Audit fees | 9 | ||||||
| Trustees fees | 8 | ||||||
| Registration fees | 20 | ||||||
| Other | 8 | ||||||
| Total expenses | 3,049 | ||||||
| Less: | |||||||
| Reimbursement of class expenses: | |||||||
| Class A | (51 | ) | |||||
| Class B | (127 | ) | |||||
| Class C | (39 | ) | |||||
| Total reimbursed expenses | (217 | ) | |||||
| Net expenses | 2,832 | ||||||
| Net Investment Income (Loss) | 579 | ||||||
| Net Realized Gain (Loss) from: | |||||||
| Investment securities | 36,792 | ||||||
| Foreign currency transactions | (342 | ) | |||||
| 36,450 | |||||||
| Net Increase (Decrease) in Unrealized Appreciation (Depreciation) on: | |||||||
| Investment securities | 10,164 | ||||||
| Translation of assets and liabilities denominated in foreign currencies | 30 | ||||||
| 10,194 | |||||||
| Net Realized and Unrealized Gain (Loss) on Investment Securities and Foreign Currency Transactions | 46,644 | ||||||
| Net Increase (Decrease) in Net Assets Resulting from Operations | $ | 47,223 | |||||
(b) Class I was offered for investment on November 15, 2005.
(c) Rounds to less than $1.
The notes to the financial statements are an integral part of this report.
Transamerica IDEX Mutual Funds
Semi-Annual Report 2006
7
TA IDEX Templeton Great Companies Global
STATEMENTS OF CHANGES IN NET ASSETS
For the period or year ended
(all amounts in thousands)
| April 30, 2006 (unaudited) (a) | October 31, 2005 | ||||||||||
| Increase (Decrease) In Net Assets From: | |||||||||||
| Operations: | |||||||||||
| Net investment income (loss) | $ | 579 | $ | 3,111 | |||||||
| Net realized gain (loss) from investment securities and foreign currency transactions | 36,450 | 20,242 | |||||||||
| Change in unrealized appreciation (depreciation) on investment securities and foreign currency translation | 10,194 | 19,691 | |||||||||
| 47,223 | 43,044 | ||||||||||
| Distributions to Shareholders: | |||||||||||
| From net investment income: | |||||||||||
| Class A | (31 | ) | (3,664 | ) | |||||||
| Class B | – | (5 | ) | ||||||||
| Class C | – | (8 | ) | ||||||||
| (31 | ) | (3,677 | ) | ||||||||
| Capital Share Transactions: | |||||||||||
| Proceeds from shares sold: | |||||||||||
| Class A | 2,405 | 174,981 | |||||||||
| Class B | 1,413 | 2,689 | |||||||||
| Class C | 1,021 | 1,105 | |||||||||
| Class I | 265,295 | – | |||||||||
| 270,134 | 178,775 | ||||||||||
| Dividends and distributions reinvested: | |||||||||||
| Class A | 31 | 3,598 | |||||||||
| Class B | – | 4 | |||||||||
| Class C | – | 8 | |||||||||
| 31 | 3,610 | ||||||||||
| Cost of shares redeemed: | |||||||||||
| Class A | (285,933 | ) | (47,814 | ) | |||||||
| Class B | (14,623 | ) | (36,203 | ) | |||||||
| Class C | (6,758 | ) | (16,720 | ) | |||||||
| Class I | (236,047 | ) | – | ||||||||
| (543,361 | ) | (100,737 | ) | ||||||||
| Redemption fees: | |||||||||||
| Class C | 1 | – | |||||||||
| 1 | – | ||||||||||
| Automatic conversions: | |||||||||||
| Class A | 2,439 | 3,265 | |||||||||
| Class B | (2,439 | ) | (3,265 | ) | |||||||
| – | – | ||||||||||
| (273,195 | ) | 81,648 | |||||||||
| Net increase (decrease) in net assets | (226,003 | ) | 121,015 | ||||||||
| Net Assets: | |||||||||||
| Beginning of period | 513,319 | 392,304 | |||||||||
| End of period | $ | 287,316 | $ | 513,319 | |||||||
| Distributable Net Investment Income (Loss) | $ | (318 | ) | $ | (866 | ) | |||||
| April 30, 2006 (unaudited) (a) | October 31, 2005 | ||||||||||
| Share Activity: | |||||||||||
| Shares issued: | |||||||||||
| Class A | 90 | 7,281 | |||||||||
| Class B | 56 | 118 | |||||||||
| Class C | 41 | 49 | |||||||||
| Class I | 10,591 | – | |||||||||
| 10,778 | 7,448 | ||||||||||
| Shares issued–reinvested from distributions: | |||||||||||
| Class A | 1 | 147 | |||||||||
| 1 | 147 | ||||||||||
| Shares redeemed: | |||||||||||
| Class A | (11,373 | ) | (1,977 | ) | |||||||
| Class B | (587 | ) | (1,596 | ) | |||||||
| Class C | (271 | ) | (739 | ) | |||||||
| Class I | (9,138 | ) | – | ||||||||
| (21,369 | ) | (4,312 | ) | ||||||||
| Automatic conversions: | |||||||||||
| Class A | 94 | 134 | |||||||||
| Class B | (100 | ) | (143 | ) | |||||||
| (6 | ) | (9 | ) | ||||||||
| Net increase (decrease) in shares outstanding: | |||||||||||
| Class A | (11,188 | ) | 5,585 | ||||||||
| Class B | (631 | ) | (1,621 | ) | |||||||
| Class C | (230 | ) | (690 | ) | |||||||
| Class I | 1,453 | – | |||||||||
| (10,596 | ) | 3,274 | |||||||||
(a) Class I was offered for investment on November 15, 2005.
The notes to the financial statements are an integral part of this report.
Transamerica IDEX Mutual Funds
Semi-Annual Report 2006
8
TA IDEX Templeton Great Companies Global
FINANCIAL HIGHLIGHTS
(unaudited for the period ended April 30, 2006)
| For a share of beneficial interest outstanding throughout each period | |||||||||||||||||||||||||||||||||||||||
| Net Asset | Investment Operations | Distributions | Net Asset | ||||||||||||||||||||||||||||||||||||
| For the Period Ended (d)(g) | Value, Beginning of Period | Net Investment Income (Loss) | Net Realized and Unrealized Gain (Loss) | Total Operations | From Net Investment Income | From Net Realized Gains | Total Distributions | Value, End of Period | |||||||||||||||||||||||||||||||
| Class A | 4/30/2006 | $ | 24.68 | $ | 0.06 | $ | 3.30 | $ | 3.36 | $ | – | (h) | $ | – | $ | – | $ | 28.04 | |||||||||||||||||||||
| 10/31/2005 | 22.57 | 0.21 | 2.14 | 2.35 | (0.24 | ) | – | (0.24 | ) | 24.68 | |||||||||||||||||||||||||||||
| 10/31/2004 | 21.41 | (0.07 | ) | 1.23 | 1.16 | – | – | – | 22.57 | ||||||||||||||||||||||||||||||
| 10/31/2003 | 19.06 | (0.05 | ) | 2.40 | 2.35 | – | – | – | 21.41 | ||||||||||||||||||||||||||||||
| 10/31/2002 | 23.67 | (0.08 | ) | (4.53 | ) | (4.61 | ) | – | – | – | 19.06 | ||||||||||||||||||||||||||||
| 10/31/2001 | 40.20 | (0.07 | ) | (13.99 | ) | (14.06 | ) | – | (2.47 | ) | (2.47 | ) | 23.67 | ||||||||||||||||||||||||||
| Class B | 4/30/2006 | 23.24 | (0.01 | ) | 3.10 | 3.09 | – | – | – | 26.33 | |||||||||||||||||||||||||||||
| 10/31/2005 | 21.23 | 0.02 | 1.99 | 2.01 | – | (h) | – | – | 23.24 | ||||||||||||||||||||||||||||||
| 10/31/2004 | 20.25 | (0.20 | ) | 1.18 | 0.98 | – | – | – | 21.23 | ||||||||||||||||||||||||||||||
| 10/31/2003 | 18.14 | (0.17 | ) | 2.28 | 2.11 | – | – | – | 20.25 | ||||||||||||||||||||||||||||||
| 10/31/2002 | 22.71 | (0.22 | ) | (4.35 | ) | (4.57 | ) | – | – | – | 18.14 | ||||||||||||||||||||||||||||
| 10/31/2001 | 38.97 | (0.27 | ) | (13.52 | ) | (13.79 | ) | – | (2.47 | ) | (2.47 | ) | 22.71 | ||||||||||||||||||||||||||
| Class C | 4/30/2006 | 23.21 | (0.01 | ) | 3.09 | 3.08 | – | – | – | 26.29 | |||||||||||||||||||||||||||||
| 10/31/2005 | 21.21 | 0.02 | 1.99 | 2.01 | (0.01 | ) | – | (0.01 | ) | 23.21 | |||||||||||||||||||||||||||||
| 10/31/2004 | 20.25 | (0.15 | ) | 1.11 | 0.96 | – | – | – | 21.21 | ||||||||||||||||||||||||||||||
| 10/31/2003 | 18.00 | (0.17 | ) | 2.42 | 2.25 | – | – | – | 20.25 | ||||||||||||||||||||||||||||||
| Class I | 4/30/2006 | 25.05 | 0.10 | 2.97 | 3.07 | – | – | – | 28.12 | ||||||||||||||||||||||||||||||
| Ratios/Supplemental Data | |||||||||||||||||||||||||||||||
| For the Period | Total | Net Assets, End of Period | Ratio of Expenses to Average Net Assets (a) | Net Investment Income (Loss) to Average | Portfolio Turnover | ||||||||||||||||||||||||||
| Ended (g) | Return (c) | (000's) | Net (e) | Total (f) | Net Assets (a) | Rate (b) | |||||||||||||||||||||||||
| Class A | 4/30/2006 | 13.62 | % | $ | 124,332 | 1.55 | % | 1.62 | % | 0.47 | % | 22 | % | ||||||||||||||||||
| 10/31/2005 | 10.41 | 385,504 | 1.42 | 1.42 | 0.85 | 79 | |||||||||||||||||||||||||
| 10/31/2004 | 5.41 | 226,517 | 1.85 | 1.85 | (0.31 | ) | 140 | ||||||||||||||||||||||||
| 10/31/2003 | 12.33 | 189,046 | 2.07 | 2.07 | (0.26 | ) | 103 | ||||||||||||||||||||||||
| 10/31/2002 | (19.46 | ) | 225,722 | 1.88 | 1.88 | (0.34 | ) | 72 | |||||||||||||||||||||||
| 10/31/2001 | (37.08 | ) | 374,626 | 1.63 | 1.63 | (0.24 | ) | 79 | |||||||||||||||||||||||
| Class B | 4/30/2006 | 13.30 | 86,329 | 2.20 | 2.49 | (0.12 | ) | 22 | |||||||||||||||||||||||
| 10/31/2005 | 9.48 | 90,877 | 2.20 | 2.41 | 0.07 | 79 | |||||||||||||||||||||||||
| 10/31/2004 | 4.83 | 117,409 | 2.49 | 2.49 | (0.93 | ) | 140 | ||||||||||||||||||||||||
| 10/31/2003 | 11.57 | 153,046 | 2.72 | 2.72 | (0.91 | ) | 103 | ||||||||||||||||||||||||
| 10/31/2002 | (20.09 | ) | 193,259 | 2.53 | 2.53 | (0.99 | ) | 72 | |||||||||||||||||||||||
| 10/31/2001 | (37.58 | ) | 320,693 | 2.28 | 2.28 | (0.89 | ) | 79 | |||||||||||||||||||||||
| Class C | 4/30/2006 | 13.26 | 35,792 | 2.20 | 2.42 | (0.12 | ) | 22 | |||||||||||||||||||||||
| 10/31/2005 | 9.52 | 36,938 | 2.20 | 2.38 | 0.07 | 79 | |||||||||||||||||||||||||
| 10/31/2004 | 4.74 | 48,378 | 2.18 | 2.18 | (0.72 | ) | 140 | ||||||||||||||||||||||||
| 10/31/2003 | 12.50 | 163 | 2.72 | 2.72 | (0.92 | ) | 103 | ||||||||||||||||||||||||
| Class I | 4/30/2006 | 12.30 | 40,863 | 0.92 | 0.92 | 0.86 | 22 | ||||||||||||||||||||||||
The notes to the financial statements are an integral part of this report.
Transamerica IDEX Mutual Funds
Semi-Annual Report 2006
9
TA IDEX Templeton Great Companies Global
FINANCIAL HIGHLIGHTS (continued)
(unaudited)
NOTES TO FINANCIAL HIGHLIGHTS
(a) Annualized.
(b) Not annualized.
(c) Total Return has been calculated for the applicable period without deduction of a sales load, if any, on an initial purchase. Not annualized.
(d) Per share information is calculated based on average number of shares outstanding.
(e) Ratio of Net Expenses to Average Net Assets is net of fee waivers and reimbursements by the investment adviser, if any (see note 2).
(f) Ratio of Total Expenses to Average Net Assets includes all expenses before fee waivers and reimbursements by the investment adviser.
(g) The inception dates for the Fund's offering of share classes were as follows:
Class C was November 11, 2002.
Class I was November 15, 2005.
(h) Rounds to less than $(0.01) per share.
The notes to the financial statements are an integral part of this report.
Transamerica IDEX Mutual Funds
Semi-Annual Report 2006
10
TA IDEX Templeton Great Companies Global
NOTES TO FINANCIAL STATEMENTS
At April 30, 2006
(all amounts in thousands)
(unaudited)
NOTE 1. ORGANIZATION AND SIGNIFICANT ACCOUNTING POLICIES
Transamerica IDEX Mutual Funds is an open-end management investment company registered under the Investment Company Act of 1940, as amended (the "1940 Act").
In the normal course of business, TA IDEX Templeton Great Companies Global (the "Fund") enters into contracts that contain a variety of representations that provide general indemnifications. The Fund's maximum exposure under these arrangements is unknown, as this would involve future claims that may be made against the Fund and/or its affiliates that have not yet occurred. However, based on experience, the Fund expects the risk of loss to be remote.
This report should be read in conjunction with the current Fund prospectus, which contains more complete information about the Fund.
In preparing the Fund's financial statements in accordance with accounting principles generally accepted in the United States of America ("GAAP"), estimates or assumptions (which could differ from actual results) may be used that affect reported amounts and disclosures. The following is a summary of significant accounting policies followed by the Fund.
Multiple class operations, income and expenses: The Fund currently offers four classes of shares, Class A, Class B, Class C and Class I, each with a public offering price that reflects different sales charges, if any, and expense levels. Class I shares commenced operations on November 15, 2005. Class I is only available for investment to certain affiliated asset allocation funds. Class B shares will convert to Class A shares eight years after purchase. Income, non-class specific expenses and realized and unrealized gains and losses, are allocated daily to each class, based upon the value of shares outstanding method as permitted under Rule 18f-3 of the 1940 Act. Each class bears its own specific expenses as well as a portion of general, common expenses.
Security valuations: The Fund values its investments at the close of the New York Stock Exchange ("NYSE"), normally 4 p.m. ET, each day the NYSE is open for business. Fund investments are valued at the last sale price or closing price on the day of valuation taken from the primary exchange where the security is principally traded.
Securities traded in the over-the-counter market and listed securities for which no sale was reported on that date are valued at the last quoted bid price.
Debt securities are valued based on a price quotation or other equivalent indication of value supplied by an exchange, a pricing service or a major market maker; however, those that mature in sixty days or less are valued at amortized cost, which approximates market.
Investment company securities are valued at the net asset value of the underlying portfolio.
Foreign securities generally are valued based on quotations from the primary market in which they are traded. Because many foreign securities markets and exchanges close prior to the close of the NYSE, closing prices for foreign securities in those markets or on those exchanges do not reflect the events that occur after that close. If a significant market event impacting the value of a portfolio security (e.g., natural disaster, company announcement, market volatility) occurs subsequent to the close of trading in the security, but prior to the calculation of the Fund's net asset value per share, market quotations for that security may be determined to be unreliable and, accordingly, not "readily available." As a result, foreign equity securities held by the Fund may be valued at fair market value as determined in good faith by the Fund's Administrative Valuation Committee, under the supervision of the Board's Valuation Committee , using guidelines adopted by the Board of Trustees.
Other securities for which quotations are not readily available or whose values have been determined to be unreliable are valued at fair market value as determined in good faith by the Fund's Administrative Valuation Committee, under the supervision of the Board's Valuation Committee, using guidelines adopted by the Board of Trustees.
Cash: The Fund may leave cash overnight in its cash account with the custodian, Investors Bank & Trust Company ("IBT"). IBT has been contracted on behalf of the Fund to invest the excess cash into a savings account, which at April 30, 2006, was paying an interest rate of 3.24%.
Repurchase agreements: The Fund is authorized to enter into repurchase agreements. The Fund, through its custodian, IBT, receives delivery of the underlying securities, the value of which at the time of purchase is required to be an amount equal to at least 100% of the resale price. The Fund will bear the risk of value fluctuations until the security can be sold and may encounter delays and incur costs in liquidating the security. In the event of bankruptcy or insolvency of the seller, delays and costs may be incurred.
Commission recapture: The sub-adviser, to the extent consistent with the best execution and usual commission rate policies and practices, may place security transactions of the Fund with broker/dealers with which Transamerica IDEX Mutual Funds has established a Commission Recapture Program. A Commission Recapture Program is any arrangement under which a broker/dealer applies a portion of the commissions received by such broker/dealer on the security transactions to the Fund. In no event will commissions paid by the Fund be used to pay expenses that would otherwise be borne by any other funds within Transamerica IDEX Mutual Funds, or by any other party.
Recaptured commissions during the six months ended April 30, 2006, of $56 are included in net realized gains in the Statement of Operations.
Securities lending: The Fund may lend securities to qualified borrowers, with IBT acting as the Fund's lending agent. The Fund earns negotiated lenders' fees. The Fund receives cash and/or securities as collateral against the loaned securities. Cash collateral received is invested in short term, interest bearing securities. The Fund monitors the market value of securities loaned on a daily basis and requires collateral in an amount at least equal to the value of the securities loaned.
Transamerica IDEX Mutual Funds
Semi-Annual Report 2006
11
TA IDEX Templeton Great Companies Global
NOTES TO FINANCIAL STATEMENTS (continued)
At April 30, 2006
(all amounts in thousands)
(unaudited)
NOTE 1.–(continued)
Income from loaned securities on the Statement of Operations is net of fees, in the amount of $8, earned by IBT for its services.
Security transactions and investment income: Security transactions are recorded on the trade date. Security gains and losses are calculated on the specific identification basis. Dividend income, if any, is recorded on the ex-dividend date or, in the case of foreign securities, as soon as the Fund is informed of the ex-dividend date. Interest income, including accretion of discounts and amortization of premiums, is recorded on the accrual basis commencing on the settlement date.
Foreign currency denominated investments: The accounting records of the Fund are maintained in U.S. dollars. Securities and other assets and liabilities denominated in foreign currencies are translated into U.S. dollars at the closing exchange rate each day. The cost of foreign securities is translated at the exchange rate in effect when the investment was acquired. The Fund combines fluctuations from currency exchange rates and fluctuations in value when computing net realized and unrealized gains or losses from investments.
Net foreign currency gains and losses resulting from changes in exchange rates include: 1) foreign currency fluctuations between trade date and settlement date of investment security transactions; 2) gains and losses on forward foreign currency contracts; and 3) the difference between the receivable amounts of interest and dividends recorded in the accounting records in U.S. dollars and the amounts actually received.
Foreign currency denominated assets may involve risks not typically associated with domestic transactions. These risks include revaluation of currencies, adverse fluctuations in foreign currency values and possible adverse political, social and economic developments, including those particular to a specific industry, country or region.
Redemption fees: A short-term trading redemption fee may be assessed on any Fund shares in a fund account that are sold during the first five (5) NYSE trading days following their purchase date. This redemption fee will equal 2% of the amount redeemed and shares held the longest will be treated as being redeemed first and shares held the shortest as being redeemed last. For the six months ended April 30, 2006, the Fund received $1 in redemption fees.
Dividend distributions: Distributions to shareholders are recorded on the ex-dividend date and are determined in accordance with Federal income tax regulations which may differ from GAAP.
NOTE 2. RELATED PARTY TRANSACTIONS
Transamerica Fund Advisors, Inc. ("TFAI") is the Fund's investment adviser. Transamerica Fund Services, Inc. ("TFS") is the Fund's administrator and transfer agent. AFSG Securities Corp. ("AFSG") is the Fund's distributor/principal underwriter. TFAI, TFS, and AFSG are affiliates of AEGON, NV, a Netherlands corporation.
Great Companies, L.L.C. is both an affiliate of the Fund and a sub-adviser to the Fund.
Certain officers and trustees of the Fund are also officers and/or directors of TFAI, TFS and AFSG.
The following schedule reflects the percentage of Fund assets owned by affiliated investment companies at April 30, 2006:
| Net Assets | % of Net Assets | ||||||||||
| TA IDEX Asset Allocation - Conservative Portfolio | $ | 2,634 | 0.92 | % | |||||||
| TA IDEX Asset Allocation - Growth Portfolio | 6,209 | 2.16 | % | ||||||||
| TA IDEX Asset Allocation - Moderate Portfolio | 23,951 | 8.34 | % | ||||||||
| TA IDEX Asset Allocation - Moderate Growth Portfolio | 8,077 | 2.81 | % | ||||||||
| Total | $ | 40,871 | 14.23 | % | |||||||
Investment advisory fee: The Fund pays management fees to TFAI based on average daily net assets ("ANA") at the following breakpoints:
0.80% of the first $500 million of ANA
0.70% of ANA over $500 million
TFAI has contractually agreed to waive its advisory fee and will reimburse the Fund to the extent that operating expenses, excluding 12b-1 fees, exceed the following stated annual limit:
1.20% Expense Limit
If total Fund expenses fall below the annual expense limitation agreement agreed to by the adviser within the succeeding three years, the Fund may be required to pay the adviser a portion or all of the reimbursed class expenses.
| Reimbusement of Class Expenses | Available for Recapture Through | ||||||||||
| Fiscal Year 2005 | |||||||||||
| Class B | $ | 226 | 10/31/2008 | ||||||||
| Class C | 77 | 10/31/2008 | |||||||||
Distribution and service fees: The Fund has a 12b-1 distribution plan under the 1940 Act pursuant to which an annual fee, based on average daily net assets, is paid to the distributor for various disbursements such as broker-dealer account servicing fees and other promotional expenses of the Fund. The Fund is authorized under the 12b-1 plan to pay fees on each class up to the following limits:
| Class A | 0.35 | % | |||||
| Class B | 1.00 | % | |||||
| Class C | 1.00 | % | |||||
| Class I | N/A | ||||||
Transamerica IDEX Mutual Funds
Semi-Annual Report 2006
12
TA IDEX Templeton Great Companies Global
NOTES TO FINANCIAL STATEMENTS (continued)
At April 30, 2006
(all amounts in thousands)
(unaudited)
NOTE 2.–(continued)
In the case the Fund or a class of shares of the Fund is closed to new investors or investments, the Fund is authorized to pay 12b-1 fees for past sales and distribution efforts and present and past investor services.
Underwriter commissions relate to front-end sales charges imposed for Class A shares and contingent deferred sales charges from Classes B, C, and certain A share redemptions. For the six months ended April 30, 2006, the underwriter commissions were as follows:
| Received by Underwriter | $ | 49 | |||||
| Retained by Underwriter | 8 | ||||||
| Contingent Deferred Sales Charge | 60 | ||||||
Administrative services: The Fund has entered into an agreement with TFS for financial and legal fund administration services. The Fund pays TFS an annual fee of 0.02% of ANA. The Legal fees on the Statement of Operations are fees paid to external legal counsel.
Transfer agent fees: The Fund pays TFS an annual per-account charge for each open and closed account. The Fund paid TFS $544 for the six months ended April 30, 2006.
Deferred compensation plan: Each eligible independent Fund Trustee may elect to participate in a non-qualified deferred compensation plan maintained by Transamerica IDEX Mutual Funds (the "Plan"). Under the Plan, such Trustees may defer payment of all or a portion of their total fees earned as a Fund Trustee. Each Trustee who is a participant in the Plan may elect that the earnings, losses or gains credited to his or her deferred fee amounts be determined based on a deemed investment in any series of Transamerica IDEX Mutual Funds, including the Fund. The right of a participant to receive a distribution from the Plan of the deferred fees is an unsecured claim against the general assets of all series of Transamerica IDEX Mutual Funds. The pro rata liability to the Fund of all deferred fees in the Plan amounted, as of April 30, 2006, to $111.
NOTE 3. INVESTMENT TRANSACTIONS
The cost of securities purchased and proceeds from securities sold (excluding short-term securities) for the six months ended April 30, 2006 were as follows:
| Purchases of securities: | |||||||
| Long-Term | $ | 73,442 | |||||
| U.S. Government | – | ||||||
| Proceeds from maturities and sales of securities: | |||||||
| Long-Term | 326,792 | ||||||
| U.S. Government | – | ||||||
NOTE 4. FEDERAL INCOME TAX MATTERS
The Fund has not made any provision for federal income or excise taxes due to its policy to distribute all of its taxable income and capital gains to its shareholders and otherwise qualify as a regulated investment company under Subchapter M of the Internal Revenue Code. Income and capital gain distributions are determined in accordance with income tax regulations, which may differ from GAAP. These differences are primarily due to differing treatment for items including, but not limited to, wash sales, net operating losses, foreign currency transactions, excess distribution, return of capital from underlying investments, passive foreign investment companies, deferred compensation and capital loss carryforwards.
The capital loss carryforwards are available to offset future realized capital gains through the periods listed:
| Capital Loss Carryforwards | Available through | ||||||
| $ | 110,307 | October 31, 2009 | |||||
| 205,203 | October 31, 2010 | ||||||
| 57,944 | October 31, 2011 | ||||||
NOTE 5. REGULATORY PROCEEDINGS
There continues to be significant federal and state regulatory activity relating to financial services companies, particularly mutual fund companies and their investment advisers. As part of an ongoing investigation regarding potential market timing, recordkeeping and trading compliance issues and matters affecting the Fund's investment adviser, TFAI, and certain affiliates and former employees of TFAI, the SEC staff has indicated that it is likely to take some action against TFAI and certain of its affiliates at the conclusion of the investigation. The potential timing and the scope of any such action is difficult to predict. Although the impact of any action brought against TFAI and/or its affiliates is difficult to assess at the present time, the Fund currently believes that the likelihood that any such action will have a material adverse impact on it is remote. It is important to note that the Fund is not aware of any allega tion of wrongdoing against it and its Board at the time this semi-annual report is printed. Although it is not anticipated that these developments will have an adverse impact on the Fund, there can be no assurance at this time. TFAI and its affiliates are actively working with the SEC in regard to this matter; however, the exact resolution cannot be determined at this time. TFAI will take such actions that it deems necessary or appropriate to continue providing management services to the Fund and to bring all matters to an appropriate conclusion.
TFAI and/or its affiliates, and not the Fund, will bear the costs regarding these regulatory matters.
Transamerica IDEX Mutual Funds
Semi-Annual Report 2006
13
TA IDEX Templeton Great Companies Global
INVESTMENT ADVISORY AND SUB-ADVISORY AGREEMENTS – REVIEW AND RENEWAL (unaudited)
At a meeting of the Board of Trustees of Transamerica IDEX Mutual Funds ("TA IDEX") held on November 2, 2005, the Board reviewed and considered the Investment Advisory Agreement between TA IDEX Templeton Great Companies Global (the "Fund") and Transamerica Fund Advisors, Inc. ("TFAI"), as well as Investment Sub-Advisory Agreements of the Fund between TFAI and each of the sub-advisers, Great Companies, LLC and Templeton Investment Counsel, LLC (the "Sub-Advisers"), to determine whether the agreements should be renewed for a one-year period. Following their review and consideration, the Trustees determined that the Investment Advisory Agreement and the Investment Sub-Advisory Agreements will enable shareholders of the Fund to obtain high quality services at a cost that is appropriate, reasonable, and in the best interests of its shareholders. The Board, including the independent members of the Board, unanimously approved the renew al of the Investment Advisory Agreement and the Investment Sub-Advisory Agreements. In reaching their decision, the Trustees requested and obtained from TFAI and the Sub-Advisers such information as they deemed reasonably necessary to evaluate the proposed agreements. The Trustees also carefully considered the information that they had received throughout the year from TFAI and the Sub-Advisers (such as in-person presentations by the Sub-Advisers) as part of their regular oversight of the Fund, as well as: comparative fee, expense and performance information prepared by Lipper Inc. ("Lipper"), independent providers of mutual fund performance, fee and expense information, and profitability data. In considering the proposed continuation of the Investment Advisory Agreement and Investment Sub-Advisory Agreements, the Trustees evaluated a number of considerations that they believed, in light of the legal advice furnished to them by TA IDEX counsel and independent legal counsel and their own business judgment, to be relevant. They based their decisions on the following considerations, among others, although they did not identify any consideration or particular information that was controlling of their decisions:
The nature, extent and quality of the advisory service to be provided. The Board considered the nature and quality of the services provided by TFAI and the Sub-Advisers to the Fund in the past, as well as the services anticipated to be provided in the future. The Board concluded that TFAI and the Sub-Advisers are capable of providing high quality services to the Fund, as indicated by the nature and quality of services provided in the past, TFAI's and the Sub-Advisers' management capabilities demonstrated with respect to the Funds they manage, including the Fund, and the experience, capability and integrity of TFAI's senior management, the financial resources of TFAI and the Sub-Advisers, TFAI's management oversight process, and the professional qualifications and experience of the Sub-Advisers' portfolio management teams. The Trustees also concluded t hat TFAI and the Sub-Advisers proposed to provide investment and related services that were of the same quality and quantity as services provided to the Fund in the past, and that these services are appropriate in scope and extent in light of the Fund's operations, the competitive landscape of the investment company business and investor needs, and that TFAI's and the Sub-Advisers' obligations will remain substantially the same.
The investment performance of the Fund. The Board examined both the short-term and longer-term performance of the Fund, including relative performance against a benchmark securities index and a peer group of comparable mutual funds as prepared by Lipper for various trailing periods ended June 30, 2005. The Trustees concluded that TFAI and the Sub-Advisers generally had achieved acceptable investment performance, although they noted that the domestic portion of the Fund had underperformed while the international portion of the Fund had generally outperformed the benchmark. The Board decided to monitor closely the future performance of the domestic portion of the Fund, and also asked TFAI to take necessary steps to improve the Fund's performance, including consideration of alternative sub-advisers for the domestic portion of the Fund. However, on the ba sis of the Trustees' assessment of the nature, extent and quality of advisory services to be provided or procured by TFAI and the Sub-Advisers, the Trustees concluded that TFAI and the Sub-Advisers are capable of generating a level of investment performance that is appropriate in light of the Fund's investment objective, policies and strategies and competitive with many other investment companies, and also determined that TFAI's and the Sub-Advisers' performance records indicate that their continued management is likely to benefit the Fund and its shareholders.
The cost of advisory services provided and the level of profitability. The Board reviewed profitability information regarding TFAI's costs of procuring portfolio management services, as well as the costs of provision of administration, transfer agency, fund accounting and other services, to the Fund and to TA IDEX as a whole by TFAI and its affiliates. The Trustees reviewed data from Lipper that compared the Fund's management fees (including management fees at various asset levels), other fees and expenses (including total expenses including and excluding 12b-1 distribution and service fees) and portfolio turnover rate against peer groups of comparable mutual funds. Based on such information, the Trustees determined that the management fees and overall expense ratio of the Fund generally are consistent with industry averages. In addition, on the basis of the Board's review of the management fees to be charged by TFAI for investment advisory and related services, TFAI profitability information (derived from TFAI's audited financial statements), TFAI's estimated management income resulting from its management of the Fund, the estimated margin of each Sub-Adviser, as well as the entirety of TFAI's and its affiliates' service relationship with TA IDEX, the Board concluded that the level of investment management fees and other service fees, as well as TFAI's and the Sub-Advisers' profitability, are appropriate in light of the
Transamerica IDEX Mutual Funds
Semi-Annual Report 2006
14
TA IDEX Templeton Great Companies Global (continued)
services provided, the management fees and overall expense ratios of comparable investment companies and the anticipated profitability of the relationship between the Fund, TFAI and its affiliates, and the Sub-Advisers.
Whether fee levels reflect economies of scale and the extent to which economies of scale would be realized as the Fund grows. The Board concluded that the inclusion of asset-based breakpoints in the Fund's advisory fee schedule appropriately benefits investors by realizing economies of scale in the form of lower management fees as the level of assets grows. In addition, the Board concluded that the Fund's management fees appropriately reflect the Fund's current size, the current economic environment for TFAI, the competitive nature of the investment company market, and TFAI's pricing strategy. The Trustees also concluded that they will have the opportunity to periodically reexamine whether the Fund has achieved economies of scale, and the appropriateness of management fees payable to TFAI and fees payable by TFAI to the Sub-Advisers, in the future.
Benefits (such as soft dollars) to TFAI, its affiliates, or the Sub-Advisers from their relationship with the Fund. The Board concluded that other benefits derived by TFAI, its affiliates, and the Sub-Advisers from their relationship with the Fund, including "soft dollar" benefits (if any) in connection with brokerage transactions, sales charges and distribution/service fees (to the extent applicable) are reasonable and fair, and are consistent with industry practice and the best interests of the Fund and its shareholders. In this regard, the Board noted that TFAI does not realize "soft dollar" benefits from its relationship with the Fund, and that the Sub-Advisers are participating in brokerage programs pursuant to which a portion of brokerage commissions paid by the Fund is recaptured for the benefit of the Fund and its shareholders, thus limiting t he amount of "soft-dollar" arrangements the Sub-Advisers may engage in with respect to the Fund's brokerage transactions. In addition, the Trustees determined that the administration, transfer agency, fund accounting and other fees paid by the Fund to affiliates of TFAI are reasonable, fair and in the best interests of shareholders in light of the nature and quality of the services provided, the associated costs to these affiliates of providing the services, the impact of the costs of such services on the Fund's overall operating expenses, and the necessity of the services for the Fund's operations.
Other considerations. The Board also determined that TFAI had made a substantial commitment to the recruitment and retention of high quality personnel, and maintained the financial, compliance and operational resources reasonably necessary to manage the Fund in a professional manner that is consistent with the best interests of the Fund and its shareholders. In this regard, the Trustees favorably considered the procedures and policies in place by TFAI to enforce compliance with applicable laws and regulations and oversee the portfolio management activities of the Sub-Advisers. The Trustees also determined that TFAI had made a significant entrepreneurial commitment to the management and success of the Fund, reflected by TFAI's expense limitation and fee waiver arrangement with the Fund, which may result in TFAI waiving advisory fees for the benefit of shareholders.
Transamerica IDEX Mutual Funds
Semi-Annual Report 2006
15
TA IDEX Transamerica Balanced
UNDERSTANDING YOUR FUND'S EXPENSES
(unaudited)
SHAREHOLDER EXPENSES
Fund shareholders may incur two types of costs: (1) transaction costs, including sales charges (loads) on purchases, contingent deferred sales charges on redemptions and redemption fees; and (2) ongoing costs, including management fees, 12b-1 distribution and service fees, and other fund expenses.
The following Example is intended to help you understand your ongoing costs (in dollars and cents) of investing in the Fund and to compare these costs with the ongoing costs of investing in other funds.
The Example is based on an investment of $1,000 invested at November 1, 2005 and held for the entire period until April 30, 2006.
ACTUAL EXPENSES
The first line in the table below provides information about actual account values and actual expenses. You may use the information in this line, together with the amount you invested, to estimate the expenses that you paid over the period. Simply divide your account value by $1,000 (for example, an $8,600 account value divided by $1,000 = 8.6), then multiply the result by the number in the first line of your Fund under the heading entitled "Expenses Paid During Period" to estimate the expenses you paid on your account during this period. If your account is an IRA, your expenses could have included a $15 annual fee. The amount of any fee paid through your account would increase the estimate of expenses you paid during the period and decrease your ending account value.
HYPOTHETICAL EXAMPLE FOR COMPARISON PURPOSES
The second line in the table below provides information about hypothetical account values and hypothetical expenses based on the Fund's actual expense ratio and an assumed rate of return of 5% per year before expenses, which is not the Fund's actual return. The hypothetical account values and expenses may not be used to estimate the actual ending account balance or expenses you paid for the period. You may use this information to compare the ongoing costs of investing in your Fund and other funds. To do so, compare this 5% hypothetical example with the 5% hypothetical examples that appear in the shareholder reports of the other funds. As in the case of the actual expense example, if your account is subject to an IRA fee, the amount of the fee paid through your account would increase the hypothetical expenses you would have paid during the period and decrease the hypothetical ending account value.
Please note that the expenses shown in the table are meant to highlight your ongoing costs only and do not reflect any transactional costs, such as sales charges, redemption fees, brokerage commissions paid on purchases and sales of fund shares. Therefore, the second line under the Fund in the table is useful in comparing ongoing costs only, and will not help you determine the relative total costs of owning different funds. If any of these transaction costs were included, your costs would be higher. The expenses shown in the table do not reflect any fees that may be charged to you by brokers, financial intermediaries or other financial institutions.
| Beginning Account Value | Ending Account Value | Annualized Expense Ratio | Expenses Paid During Period (a) | ||||||||||||||||
| Class A | |||||||||||||||||||
| Actual | $ | 1,000.00 | $ | 1,093.00 | 1.60 | % | $ | 8.30 | |||||||||||
| Hypothetical (b) | 1,000.00 | 1,016.86 | 1.60 | 8.00 | |||||||||||||||
| Class B | |||||||||||||||||||
| Actual | 1,000.00 | 1,089.40 | 2.16 | 11.19 | |||||||||||||||
| Hypothetical (b) | 1,000.00 | 1,014.08 | 2.16 | 10.79 | |||||||||||||||
| Class C | |||||||||||||||||||
| Actual | 1,000.00 | 1,089.20 | 2.15 | 11.14 | |||||||||||||||
| Hypothetical (b) | 1,000.00 | 1,014.13 | 2.15 | 10.74 | |||||||||||||||
(a) Expenses are calculated using the Fund's annualized expense ratio (as disclosed in the table), multiplied by the average account value for the period, multiplied by number of days in the period (181 days), and divided by the number of days in the year (365 days).
(b) 5% return per year before expenses.
GRAPHICAL PRESENTATION OF SCHEDULE OF INVESTMENTS
By Asset Type
At April 30, 2006
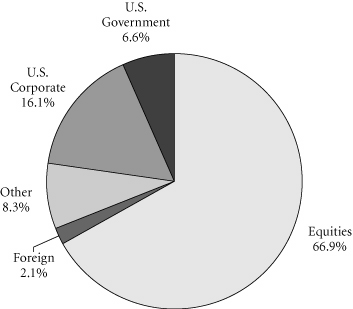
This chart shows the percentage breakdown by asset type of the Fund's total investment securities.
Transamerica IDEX Mutual Funds
Semi-Annual Report 2006
1
TA IDEX Transamerica Balanced
SCHEDULE OF INVESTMENTS
At April 30, 2006
(all amounts except share amounts in thousands)
(unaudited)
| Principal | Value | ||||||||||
| U.S. GOVERNMENT OBLIGATIONS (7.1%) | |||||||||||
| U.S. Treasury Bond 8.00%, due 11/15/2021 | $ | 1,450 | $ | 1,861 | |||||||
| 5.38%, due 02/15/2031 † | 2,080 | 2,111 | |||||||||
| U.S. Treasury Note | |||||||||||
| 4.50%, due 02/28/2011 † | 835 | 820 | |||||||||
| 4.75%, due 03/31/2011 | 3,000 | 2,976 | |||||||||
| 4.00%, due 02/15/2015 | 280 | 259 | |||||||||
| 4.13%, due 05/15/2015 | 1,450 | 1,353 | |||||||||
| 4.50%, due 11/15/2015 † | 4,411 | 4,222 | |||||||||
| 4.50%, due 02/15/2016 † | 3,200 | 3,061 | |||||||||
| Total U.S. Government Obligations (cost: $17,241) | 16,663 | ||||||||||
| CORPORATE DEBT SECURITIES (19.6%) | |||||||||||
| Aerospace (0.3%) | |||||||||||
| Honeywell International, Inc. | |||||||||||
| 6.13%, due 11/01/2011 | 660 | 677 | |||||||||
| Agriculture (0.3%) | |||||||||||
| Dole Food Co., Inc. | |||||||||||
| 8.63%, due 05/01/2009 | 400 | 395 | |||||||||
| Michael Foods, Inc. | |||||||||||
| 8.00%, due 11/15/2013 | 320 | 321 | |||||||||
| Air Transportation (0.2%) | |||||||||||
| FedEx Corp., Note | |||||||||||
| 9.65%, due 06/15/2012 | 515 | 614 | |||||||||
| Amusement & Recreation Services (0.7%) | |||||||||||
| Harrah's Operating Co., Inc. | |||||||||||
| 5.50%, due 07/01/2010 | 1,750 | 1,729 | |||||||||
| Beverages (0.4%) | |||||||||||
| Coca-Cola Enterprises, Inc. | |||||||||||
| 5.38%, due 08/15/2006 | 950 | 950 | |||||||||
| Business Credit Institutions (0.4%) | |||||||||||
| Pemex Finance, Ltd. | |||||||||||
| 9.03%, due 02/15/2011 | 850 | 917 | |||||||||
| Business Services (0.6%) | |||||||||||
| Clear Channel Communications, Inc. | |||||||||||
| 6.00%, due 11/01/2006 | 555 | 556 | |||||||||
| 4.63%, due 01/15/2008 | 545 | 536 | |||||||||
| Hertz Corp.–144A | |||||||||||
| 8.88%, due 01/01/2014 | 300 | 319 | |||||||||
| Chemicals & Allied Products (1.5%) | |||||||||||
| ICI Wilmington, Inc. | |||||||||||
| 4.38%, due 12/01/2008 | 791 | 762 | |||||||||
| Lubrizol Corp. | |||||||||||
| 4.63%, due 10/01/2009 | 1,350 | 1,308 | |||||||||
| Principal | Value | ||||||||||
| Chemicals & Allied Products (continued) | |||||||||||
| Monsanto Co. | |||||||||||
| 5.50%, due 07/30/2035 | $ | 800 | $ | 703 | |||||||
| Potash Corp. of Saskatchewan | |||||||||||
| 7.13%, due 06/15/2007 | 830 | 844 | |||||||||
| Commercial Banks (1.6%) | |||||||||||
| Barclays Bank PLC | |||||||||||
| 6.28%, due 12/15/2034 (a)(b) | 660 | 603 | |||||||||
| HBOS PLC–144A | |||||||||||
| 5.92%, due 10/01/2015 (a)(b) | 700 | 666 | |||||||||
| Sumitomo Mitsui Banking–144A | |||||||||||
| 5.63%, due 10/15/2015 (a)(b) | 200 | 191 | |||||||||
| US Bank NA | |||||||||||
| 3.75%, due 02/06/2009 | 1,400 | 1,343 | |||||||||
| Wachovia Capital Trust III | |||||||||||
| 5.80%, due 03/15/2011 (a)(b) | 260 | 255 | |||||||||
| ZFS Finance USA Trust I–144A | |||||||||||
| 6.45%, due 06/15/2065 (b) | 765 | 721 | |||||||||
| Communication (0.1%) | |||||||||||
| Comcast Corp. | |||||||||||
| 7.05%, due 03/15/2033 | 325 | 332 | |||||||||
| Computer & Office Equipment (0.3%) | |||||||||||
| Hewlett-Packard Co. | |||||||||||
| 3.63%, due 03/15/2008 | 765 | 741 | |||||||||
| Department Stores (0.1%) | |||||||||||
| Neiman-Marcus Group, Inc.–144A | |||||||||||
| 9.00%, due 10/15/2015 | 200 | 213 | |||||||||
| Electric Services (0.4%) | |||||||||||
| PSEG Funding Trust | |||||||||||
| 5.38%, due 11/16/2007 | 875 | 872 | |||||||||
| Electric, Gas & Sanitary Services (0.3%) | |||||||||||
| NiSource Finance Corp. | |||||||||||
| 7.88%, due 11/15/2010 | 745 | 805 | |||||||||
| Food & Kindred Products (0.8%) | |||||||||||
| Archer-Daniels-Midland Co. | |||||||||||
| 5.38%, due 09/15/2035 | 500 | 440 | |||||||||
| Bunge Ltd Finance Corp. | |||||||||||
| 4.38%, due 12/15/2008 | 930 | 903 | |||||||||
| Tyson Foods, Inc. | |||||||||||
| 6.60%, due 04/01/2016 | 525 | 515 | |||||||||
| Gas Production & Distribution (1.3%) | |||||||||||
| Oneok, Inc. | |||||||||||
| 5.51%, due 02/16/2008 | 1,730 | 1,728 | |||||||||
| Sempra Energy, Senior Note | |||||||||||
| 4.62%, due 05/17/2007 | 1,280 | 1,270 | |||||||||
The notes to the financial statements are an integral part of this report.
Transamerica IDEX Mutual Funds
Semi-Annual Report 2006
2
TA IDEX Transamerica Balanced
SCHEDULE OF INVESTMENTS (continued)
At April 30, 2006
(all amounts except share amounts in thousands)
(unaudited)
| Principal | Value | ||||||||||
| Holding & Other Investment Offices (1.5%) | |||||||||||
| BRE Properties, Inc. | |||||||||||
| 5.75%, due 09/01/2009 | $ | 935 | $ | 940 | |||||||
| Hutchison Whampoa International, Ltd.–144A | |||||||||||
| 7.45%, due 11/24/2033 | 560 | 602 | |||||||||
| iStar Financial, Inc. REIT | |||||||||||
| 4.88%, due 01/15/2009 | 875 | 857 | |||||||||
| Plum Creek Timberlands, LP | |||||||||||
| 5.88%, due 11/15/2015 | 460 | 446 | |||||||||
| Tanger Factory Outlet Centers REIT | |||||||||||
| 6.15%, due 11/15/2015 | 620 | 606 | |||||||||
| Hotels & Other Lodging Places (0.2%) | |||||||||||
| Starwood Hotels & Resorts Worldwide, Inc. | |||||||||||
| 7.38%, due 05/01/2007 | 400 | 407 | |||||||||
| Wynn Las Vegas LLC/Wynn Las Vegas Capital Corp. | |||||||||||
| 6.63%, due 12/01/2014 | 100 | 97 | |||||||||
| Industrial Machinery & Equipment (0.1%) | |||||||||||
| Cummins, Inc. | |||||||||||
| 7.13%, due 03/01/2028 | 215 | 217 | |||||||||
| Insurance (0.1%) | |||||||||||
| Reinsurance Group of America | |||||||||||
| 6.75%, due 12/15/2065 (b) | 335 | 315 | |||||||||
| Metal Mining (0.4%) | |||||||||||
| Phelps Dodge Corp. | |||||||||||
| 9.50%, due 06/01/2031 | 478 | 607 | |||||||||
| Teck Cominco, Ltd. | |||||||||||
| 6.13%, due 10/01/2035 | 325 | 299 | |||||||||
| Mortgage Bankers & Brokers (1.1%) | |||||||||||
| Countrywide Home Loans, Inc. | |||||||||||
| 5.50%, due 08/01/2006 | 800 | 801 | |||||||||
| Countrywide Home Loans, Inc., Series L | |||||||||||
| 2.88%, due 02/15/2007 | 865 | 848 | |||||||||
| ILFC E-Capital Trust II–144A | |||||||||||
| 6.25%, due 12/21/2065 (b) | 360 | 345 | |||||||||
| Kinder Morgan Finance Co., ULC | |||||||||||
| 6.40%, due 01/05/2036 | 335 | 321 | |||||||||
| MUFG Capital Finance 1, Ltd. | |||||||||||
| 6.35%, due 07/25/2016 (a)(b) | 325 | 319 | |||||||||
| Motion Pictures (0.2%) | |||||||||||
| Time Warner, Inc. | |||||||||||
| 9.13%, due 01/15/2013 | 530 | 610 | |||||||||
| Oil & Gas Extraction (0.5%) | |||||||||||
| Chesapeake Energy Corp. | |||||||||||
| 7.00%, due 08/15/2014 | 180 | 180 | |||||||||
| Principal | Value | ||||||||||
| Oil & Gas Extraction (continued) | |||||||||||
| Husky Oil, Ltd. | |||||||||||
| 8.90%, due 08/15/2028 (b) | $ | 570 | $ | 603 | |||||||
| Nexen, Inc. | |||||||||||
| 5.88%, due 03/10/2035 | 340 | 309 | |||||||||
| Personal Credit Institutions (0.1%) | |||||||||||
| HSBC Finance Capital Trust IX | |||||||||||
| 5.91%, due 11/30/2035 (b) | 200 | 193 | |||||||||
| Petroleum Refining (0.2%) | |||||||||||
| Valero Energy Corp. | |||||||||||
| 7.50%, due 04/15/2032 | 375 | 420 | |||||||||
| Primary Metal Industries (0.8%) | |||||||||||
| Alcoa, Inc. | |||||||||||
| 4.25%, due 08/15/2007 | 1,825 | 1,797 | |||||||||
| Printing & Publishing (0.6%) | |||||||||||
| Media General, Inc. | |||||||||||
| 6.95%, due 09/01/2006 | 1,090 | 1,093 | |||||||||
| News America Holdings, Inc. | |||||||||||
| 7.75%, due 12/01/2045 | 392 | 419 | |||||||||
| Radio & Television Broadcasting (0.3%) | |||||||||||
| Univision Communications, Inc. | |||||||||||
| 7.85%, due 07/15/2011 | 610 | 637 | |||||||||
| Real Estate (0.4%) | |||||||||||
| Colonial Realty, LP | |||||||||||
| 7.00%, due 07/14/2007 | 849 | 860 | |||||||||
| Retail Trade (0.2%) | |||||||||||
| Target Corp. | |||||||||||
| 5.50%, due 04/01/2007 | 435 | 436 | |||||||||
| Security & Commodity Brokers (1.5%) | |||||||||||
| E*Trade Financial Corp. | |||||||||||
| 8.00%, due 06/15/2011 | 500 | 516 | |||||||||
| Goldman Sachs Group, Inc., Subordinated Note | |||||||||||
| 6.45%, due 05/01/2036 | 250 | 247 | |||||||||
| Merrill Lynch & Co., Inc. | |||||||||||
| 6.13%, due 05/16/2006 | 1,900 | 1,901 | |||||||||
| Nuveen Investments, Inc. | |||||||||||
| 5.00%, due 09/15/2010 | 875 | 842 | |||||||||
| Telecommunications (1.5%) | |||||||||||
| SBC Communications, Inc. | |||||||||||
| 5.75%, due 05/02/2006 | 1,900 | 1,900 | |||||||||
| Sprint Capital Corp. | |||||||||||
| 8.75%, due 03/15/2032 | 265 | 329 | |||||||||
| Verizon Global Funding Corp. | |||||||||||
| 4.00%, due 01/15/2008 | 955 | 933 | |||||||||
| 7.75%, due 12/01/2030 | 305 | 336 | |||||||||
The notes to the financial statements are an integral part of this report.
Transamerica IDEX Mutual Funds
Semi-Annual Report 2006
3
TA IDEX Transamerica Balanced
SCHEDULE OF INVESTMENTS (continued)
At April 30, 2006
(all amounts except share amounts in thousands)
(unaudited)
| Principal | Value | ||||||||||
| Water Transportation (0.4%) | |||||||||||
| Royal Caribbean Cruises, Ltd. | |||||||||||
| 8.75%, due 02/02/2011 | $ | 815 | $ | 897 | |||||||
| Wholesale Trade Nondurable Goods (0.2%) | |||||||||||
| Domino's, Inc. | |||||||||||
| 8.25%, due 07/01/2011 | 410 | 424 | |||||||||
| Total Corporate Debt Securities (cost: $47,355) | 46,138 | ||||||||||
| Shares | Value | ||||||||||
| COMMON STOCKS (72.2%) | |||||||||||
| Air Transportation (0.7%) | |||||||||||
| FedEx Corp. | 15,000 | $ | 1,727 | ||||||||
| Automotive (3.7%) | |||||||||||
| Harley-Davidson, Inc. † | 100,000 | 5,084 | |||||||||
| PACCAR, Inc. | 50,000 | 3,596 | |||||||||
| Business Services (1.0%) | |||||||||||
| eBay, Inc. ‡ | 70,000 | 2,409 | |||||||||
| Chemicals & Allied Products (1.2%) | |||||||||||
| Procter & Gamble Co. | 50,000 | 2,911 | |||||||||
| Communication (1.1%) | |||||||||||
| XM Satellite Radio Holdings, Inc.–Class A †‡ | 125,000 | 2,527 | |||||||||
| Communications Equipment (3.9%) | |||||||||||
| QUALCOMM, Inc. | 180,000 | 9,241 | |||||||||
| Computer & Data Processing Services (2.4%) | |||||||||||
| Microsoft Corp. | 153,465 | 3,706 | |||||||||
| Yahoo!, Inc. ‡ | 60,000 | 1,967 | |||||||||
| Computer & Office Equipment (3.7%) | |||||||||||
| Apple Computer, Inc. ‡ | 70,000 | 4,927 | |||||||||
| Sandisk Corp. †‡ | 60,000 | 3,830 | |||||||||
| Drug Stores & Proprietary Stores (1.4%) | |||||||||||
| Walgreen Co. | 80,000 | 3,354 | |||||||||
| Electronic & Other Electric Equipment (1.2%) | |||||||||||
| General Electric Co. | 80,000 | 2,767 | |||||||||
| Engineering & Management Services (4.6%) | |||||||||||
| Jacobs Engineering Group, Inc. ‡ | 130,000 | 10,751 | |||||||||
| Hotels & Other Lodging Places (4.9%) | |||||||||||
| Marriott International, Inc.–Class A | 130,000 | 9,499 | |||||||||
| MGM Mirage, Inc. ‡ | 43,000 | 1,931 | |||||||||
| Industrial Machinery & Equipment (10.0%) | |||||||||||
| Caterpillar, Inc. | 180,000 | 13,633 | |||||||||
| Donaldson Co., Inc. | 90,000 | 2,992 | |||||||||
| Kennametal, Inc. | 110,000 | 6,803 | |||||||||
| Insurance (1.8%) | |||||||||||
| WellPoint, Inc. ‡ | 60,000 | 4,260 | |||||||||
| Shares | Value | ||||||||||
| Medical Instruments & Supplies (1.3%) | |||||||||||
| Zimmer Holdings, Inc. ‡ | 50,000 | $ | 3,145 | ||||||||
| Oil & Gas Extraction (6.6%) | |||||||||||
| Anadarko Petroleum Corp. | 50,000 | 5,241 | |||||||||
| Apache Corp. | 70,000 | 4,974 | |||||||||
| Schlumberger, Ltd. | 76,360 | 5,280 | |||||||||
| Petroleum Refining (2.2%) | |||||||||||
| Suncor Energy, Inc. | 60,000 | 5,144 | |||||||||
| Pharmaceuticals (7.8%) | |||||||||||
| Amgen, Inc. ‡ | 62,995 | 4,265 | |||||||||
| Genentech, Inc. ‡ | 30,000 | 2,391 | |||||||||
| Roche Holding AG–Genusschein | 75,698 | 11,607 | |||||||||
| Printing & Publishing (3.5%) | |||||||||||
| McGraw-Hill Cos., Inc. (The) | 150,000 | 8,349 | |||||||||
| Security & Commodity Brokers (4.5%) | |||||||||||
| American Express Co. | 90,000 | 4,843 | |||||||||
| Ameriprise Financial, Inc. | 70,000 | 3,433 | |||||||||
| Chicago Mercantile Exchange | 5,000 | 2,290 | |||||||||
| Telecommunications (0.6%) | |||||||||||
| Verizon Communications, Inc. | 40,000 | 1,321 | |||||||||
| Transportation & Public Utilities (1.8%) | |||||||||||
| Expeditors International of Washington, Inc. † | 50,000 | 4,281 | |||||||||
| Wholesale Trade Durable Goods (2.3%) | |||||||||||
| Grainger (W.W.), Inc. | 70,000 | 5,384 | |||||||||
| Total Common Stocks (cost: $125,432) | 169,863 | ||||||||||
| Principal | Value | ||||||||||
| SECURITY LENDING COLLATERAL (9.1%) | |||||||||||
| Debt (8.5%) | |||||||||||
| Bank Notes (1.0%) | |||||||||||
| Bank of America | |||||||||||
| 4.81%, due 06/07/2006 * | $ | 699 | $ | 699 | |||||||
| 4.81%, due 08/10/2006 * | 674 | 674 | |||||||||
| Bear Stearns & Co. | |||||||||||
| 5.01%, due 06/06/2006 * | 270 | 270 | |||||||||
| 5.01%, due 09/07/2006 * | 809 | 809 | |||||||||
| Certificates Of Deposit (0.6%) | |||||||||||
| Halifax Bank of Scotland | |||||||||||
| 4.78%, due 06/06/2006 * | 674 | 674 | |||||||||
| Rabobank Nederland | |||||||||||
| 4.87%, due 05/31/2006 * | 674 | 674 | |||||||||
| Commercial Paper (0.5%) | |||||||||||
| Banco Santander Central Hispano SA | |||||||||||
| 4.77%, due 05/02/2006 | 405 | 405 | |||||||||
| Sheffield Receivables Corp.–144A | |||||||||||
| 4.81%, due 05/03/2006 | 673 | 673 | |||||||||
The notes to the financial statements are an integral part of this report.
Transamerica IDEX Mutual Funds
Semi-Annual Report 2006
4
TA IDEX Transamerica Balanced
SCHEDULE OF INVESTMENTS (continued)
At April 30, 2006
(all amounts except share amounts in thousands)
(unaudited)
| Principal | Value | ||||||||||
| Euro Dollar Overnight (1.5%) | |||||||||||
| Bank of Montreal | |||||||||||
| 4.77%, due 05/02/2006 | $ | 540 | $ | 540 | |||||||
| Dexia Group | |||||||||||
| 4.78%, due 05/04/2006 | 674 | 674 | |||||||||
| Fortis Bank | |||||||||||
| 4.77%, due 05/01/2006 | 270 | 270 | |||||||||
| Royal Bank of Canada | |||||||||||
| 4.77%, due 05/01/2006 | 944 | 944 | |||||||||
| Royal Bank of Scotland | |||||||||||
| 4.75%, due 05/03/2006 | 674 | 674 | |||||||||
| Svenska Handlesbanken | |||||||||||
| 4.82%, due 05/01/2006 | 515 | 515 | |||||||||
| Euro Dollar Terms (2.4%) | |||||||||||
| BancoBilbao Vizcaya Argentaria SA | |||||||||||
| 4.95%, due 06/20/2006 | 540 | 540 | |||||||||
| Bank of the West | |||||||||||
| 4.94%, due 06/16/2006 | 539 | 539 | |||||||||
| Barclays | |||||||||||
| 4.79%, due 05/10/2006 | 809 | 809 | |||||||||
| 4.77%, due 05/16/2006 | 270 | 270 | |||||||||
| Canadian Imperial Bank of Commerce | |||||||||||
| 4.97%, due 06/23/2006 | 405 | 405 | |||||||||
| Credit Suisse First Boston Corp. | |||||||||||
| 4.73%, due 05/08/2006 | 405 | 405 | |||||||||
| Fortis Bank | |||||||||||
| 4.83%, due 05/08/2006 | 270 | 270 | |||||||||
| Lloyds TSB Bank | |||||||||||
| 4.81%, due 05/11/2006 | 405 | 405 | |||||||||
| Royal Bank of Scotland | |||||||||||
| 4.87%, due 05/12/2006 | 539 | 539 | |||||||||
| Principal | Value | ||||||||||
| Euro Dollar Terms (continued) | |||||||||||
| Societe Generale | |||||||||||
| 4.79%, due 05/10/2006 | $ | 674 | $ | 674 | |||||||
| UBS AG | |||||||||||
| 4.95%, due 06/20/2006 | 674 | 674 | |||||||||
| Repurchase Agreements (2.5%) †† | |||||||||||
| Credit Suisse First Boston Corp. 4.92%, dated 04/28/2006 to be repurchased at $916 on 05/01/2006 | 916 | 916 | |||||||||
| Goldman Sachs Group, Inc. (The) 4.92%, dated 04/28/2006 to be repurchased at $1,981 on 05/01/2006 | 1,981 | 1,981 | |||||||||
| Lehman Brothers, Inc. 4.92%, dated 04/28/2006 to be repurchased at $33 on 05/01/2006 | 33 | 33 | |||||||||
| Merrill Lynch & Co. 4.87%, dated 04/28/2006 to be repurchased at $2,024 on 05/01/2006 | 2,023 | 2,023 | |||||||||
| Morgan Stanley Dean Witter & Co. 4.93%, dated 04/28/2006 to be repurchased at $944 on 05/01/2006 | 944 | 944 | |||||||||
| Shares | Value | ||||||||||
| Investment Companies (0.6%) | |||||||||||
| Barclays Global Investors Institutional Money Market Fund 1-day yield of 4.78% | 1,078,894 | $ | 1,079 | ||||||||
| Merrimac Cash Fund, Premium Class 1-day yield of 4.61% @ | 287,057 | 287 | |||||||||
| Total Security Lending Collateral (cost: $21,288) | 21,288 | ||||||||||
| Total Investment Securities (cost: $211,316) # | $ | 253,952 | |||||||||
NOTES TO SCHEDULE OF INVESTMENTS:
† At April 30, 2006, all or a portion of this security is on loan (see Note 1). The value at April 30, 2006, of all securities on loan is $20,719.
(a) The security has a perpetual maturity. The date shown is the next call date.
(b) Coupon rate is fixed for a predetermined period of time and then converts to a floating rate until maturity date. Rate is listed as of April 30, 2006.
‡ Non-income producing.
* Floating or variable rate note. Rate is listed as of April 30, 2006.
†† Cash collateral for the Repurchase Agreements, valued at $6,071, that serve as collateral for securities lending are invested in corporate bonds with interest rates and maturity dates ranging from 0.00%–9.05% and 05/02/2006–12/31/2049, respectively.
@ Regulated investment company advised by Investors Bank and Trust Co. ("IBT"). IBT is also the accounting, custody and lending agent for the Fund.
# Aggregate cost for Federal income tax purposes is $211,654. Aggregate gross unrealized appreciation for all securities in which there is an excess of value over tax cost and aggregate gross unrealized depreciation for all securities in which there is an excess of tax cost over value were $48,418 and $6,120, respectively. Net unrealized appreciation for tax purposes is $42,298.
DEFINITIONS:
144A 144A Securities are registered pursuant to Rule 144A of the Securities Act of 1933. These securities are deemed to be liquid for purposes of compliance limitations on holdings of illiquid securities and may be resold as transactions exempt from registration, normally to qualified institutional buyers. At April 30, 2006, these securities aggregated $3,730 or 1.6% of the net assets of the Fund.
REIT Real Estate Investment Trust
The notes to the financial statements are an integral part of this report.
Transamerica IDEX Mutual Funds
Semi-Annual Report 2006
5
TA IDEX Transamerica Balanced
STATEMENT OF ASSETS AND LIABILITIES
At April 30, 2006
(all amounts except per share amounts in thousands)
(unaudited)
| Assets: | |||||||
| Investment securities, at value (cost: $211,316) (including securities loaned of $20,719) | $ | 253,952 | |||||
| Cash | 1,885 | ||||||
| Foreign currency (cost: $94) | 99 | ||||||
| Receivables: | |||||||
| Shares of beneficial interest sold | 127 | ||||||
| Interest | 1,079 | ||||||
| Dividends | 108 | ||||||
| Dividend reclaims receivable | 77 | ||||||
| Other | 38 | ||||||
| 257,365 | |||||||
| Liabilities: | |||||||
| Accounts payable and accrued liabilities: | |||||||
| Shares of beneficial interest redeemed | 407 | ||||||
| Management and advisory fees | 157 | ||||||
| Distribution and service fees | 164 | ||||||
| Transfer agent fees | 96 | ||||||
| Administration fees | 4 | ||||||
| Payable for collateral for securities on loan | 21,288 | ||||||
| Other | 76 | ||||||
| 22,192 | |||||||
| Net Assets | $ | 235,173 | |||||
| Net Assets Consist of: | |||||||
| Shares of beneficial interest, unlimited shares authorized, no par value | $ | 216,782 | |||||
| Distributable net investment income (loss) | (132 | ) | |||||
| Accumulated net realized gain (loss) from investment securities and foreign currency transactions | (24,117 | ) | |||||
| Net unrealized appreciation (depreciation) on: | |||||||
| Investment securities | 42,635 | ||||||
| Translation of assets and liabilities denominated in foreign currencies | 5 | ||||||
| Net Assets | $ | 235,173 | |||||
| Net Assets by Class: | |||||||
| Class A | $ | 60,463 | |||||
| Class B | 133,946 | ||||||
| Class C | 40,764 | ||||||
| Shares Outstanding: | |||||||
| Class A | 2,788 | ||||||
| Class B | 6,189 | ||||||
| Class C | 1,890 | ||||||
| Net Asset Value Per Share: | |||||||
| Class A | $ | 21.68 | |||||
| Class B | 21.64 | ||||||
| Class C | 21.57 | ||||||
| Maximum Offering Price Per Share (a): | |||||||
| Class A | $ | 22.94 | |||||
(a) Includes the maximum selling commission (represented as a percentage of offering price) which is reduced on certain levels of sales as set forth in the Prospectus. Net asset value per share for Classes B and C shares represents offering price. The redemption price for Classes B and C shares equals net asset value less any applicable contingent deferred sales charge.
STATEMENT OF OPERATIONS
For the period ended April 30, 2006 (b)
(all amounts in thousands)
(unaudited)
| Investment Income: | |||||||
| Interest | $ | 1,647 | |||||
| Dividends (net of withholding taxes on foreign dividends of $23) | 993 | ||||||
| Income from loaned securities–net | 35 | ||||||
| 2,675 | |||||||
| Expenses: | |||||||
| Management and advisory fees | 977 | ||||||
| Distribution and service fees: | |||||||
| Class A | 109 | ||||||
| Class B | 699 | ||||||
| Class C | 213 | ||||||
| Transfer agent fees: | |||||||
| Class A | 107 | ||||||
| Class B | 176 | ||||||
| Class C | 50 | ||||||
| Printing and shareholder reports | 49 | ||||||
| Custody fees | 19 | ||||||
| Administration fees | 24 | ||||||
| Legal fees | 6 | ||||||
| Audit fees | 9 | ||||||
| Trustees fees | 5 | ||||||
| Registration fees | 16 | ||||||
| Other | 4 | ||||||
| Total expenses | 2,463 | ||||||
| Net Investment Income (Loss) | 212 | ||||||
| Net Realized Gain (Loss): | |||||||
| Realized gain (loss) from investment securities | 12,114 | ||||||
| Net Increase (Decrease) in Unrealized Appreciation (Depreciation) on: | |||||||
| Investment securities | 9,251 | ||||||
| Translation of assets and liabilities denominated in foreign currencies | 7 | ||||||
| 9,258 | |||||||
| Net Realized and Unrealized Gain (Loss) on Investment Securities and Foreign Currency Transactions | 21,372 | ||||||
| Net Increase (Decrease) in Net Assets Resulting from Operations | $ | 21,584 | |||||
(b) Class I was offered for investment on November 15, 2005.
The notes to the financial statements are an integral part of this report.
Transamerica IDEX Mutual Funds
Semi-Annual Report 2006
6
TA IDEX Transamerica Balanced
STATEMENTS OF CHANGES IN NET ASSETS
For the period or year ended
(all amounts in thousands)
| April 30, 2006 (unaudited) (a) | October 31, 2005 | ||||||||||
| Increase (Decrease) In Net Assets From: | |||||||||||
| Operations: | |||||||||||
| Net investment income (loss) | $ | 212 | $ | 928 | |||||||
| Net realized gain (loss) from investment securities and foreign currency transactions | 12,114 | 8,075 | |||||||||
| Change in unrealized appreciation (depreciation) on investment securities and foreign currency translation | 9,258 | 13,242 | |||||||||
| 21,584 | 22,245 | ||||||||||
| Distributions to Shareholders: | |||||||||||
| From net investment income: | |||||||||||
| Class A | (173 | ) | (674 | ) | |||||||
| Class B | (110 | ) | (257 | ) | |||||||
| Class C | (35 | ) | (207 | ) | |||||||
| (318 | ) | (1,138 | ) | ||||||||
| Capital Share Transactions: | |||||||||||
| Proceeds from shares sold: | |||||||||||
| Class A | 2,487 | 5,253 | |||||||||
| Class B | 2,272 | 5,269 | |||||||||
| Class C | 858 | 2,629 | |||||||||
| 5,617 | 13,151 | ||||||||||
| Dividends and distributions reinvested: | |||||||||||
| Class A | 166 | 648 | |||||||||
| Class B | 102 | 237 | |||||||||
| Class C | 32 | 189 | |||||||||
| 300 | 1,074 | ||||||||||
| Cost of shares redeemed: | |||||||||||
| Class A | (10,262 | ) | (22,047 | ) | |||||||
| Class B | (22,841 | ) | (45,442 | ) | |||||||
| Class C | (7,102 | ) | (17,265 | ) | |||||||
| (40,205 | ) | (84,754 | ) | ||||||||
| Automatic conversions: | |||||||||||
| Class A | 225 | 509 | |||||||||
| Class B | (225 | ) | (509 | ) | |||||||
| — | — | ||||||||||
| (34,288 | ) | (70,529 | ) | ||||||||
| Net increase (decrease) in net assets | (13,022 | ) | (49,422 | ) | |||||||
| Net Assets: | |||||||||||
| Beginning of period | 248,195 | 297,617 | |||||||||
| End of period | $ | 235,173 | $ | 248,195 | |||||||
| Distributable Net Investment Income (Loss) | $ | (132 | ) | $ | (26 | ) | |||||
(a) Class I was offered for investment on November 15, 2005.
| April 30, 2006 (unaudited) (a) | October 31, 2005 | ||||||||||
| Share Activity: | |||||||||||
| Shares issued: | |||||||||||
| Class A | 116 | 270 | |||||||||
| Class B | 108 | 270 | |||||||||
| Class C | 40 | 135 | |||||||||
| 264 | 675 | ||||||||||
| Shares issued–reinvested from distributions: | |||||||||||
| Class A | 8 | 33 | |||||||||
| Class B | 5 | 12 | |||||||||
| Class C | 2 | 10 | |||||||||
| 15 | 55 | ||||||||||
| Shares redeemed: | |||||||||||
| Class A | (484 | ) | (1,130 | ) | |||||||
| Class B | (1,079 | ) | (2,329 | ) | |||||||
| Class C | (336 | ) | (887 | ) | |||||||
| (1,899 | ) | (4,346 | ) | ||||||||
| Automatic conversions: | |||||||||||
| Class A | 11 | 26 | |||||||||
| Class B | (11 | ) | (26 | ) | |||||||
| — | — | ||||||||||
| Net increase (decrease) in shares outstanding: | |||||||||||
| Class A | (349 | ) | (801 | ) | |||||||
| Class B | (977 | ) | (2,073 | ) | |||||||
| Class C | (294 | ) | (742 | ) | |||||||
| (1,620 | ) | (3,616 | ) | ||||||||
The notes to the financial statements are an integral part of this report.
Transamerica IDEX Mutual Funds
Semi-Annual Report 2006
7
TA IDEX Transamerica Balanced
FINANCIAL HIGHLIGHTS
(unaudited for the period ended April 30, 2006)
| For a share of beneficial interest outstanding throughout each period | |||||||||||||||||||||||||||||||||||||||
| Net Asset | Investment Operations | Distributions | Net Asset | ||||||||||||||||||||||||||||||||||||
| For the Period Ended (d)(g) | Value, Beginning of Period | Net Investment Income (Loss) | Net Realized and Unrealized Gain (Loss) | Total Operations | From Net Investment Income | From Net Realized Gains | Total Distributions | Value, End of Period | |||||||||||||||||||||||||||||||
| Class A | 4/30/2006 | $ | 19.90 | $ | 0.06 | $ | 1.78 | $ | 1.84 | $ | (0.06 | ) | $ | – | $ | (0.06 | ) | $ | 21.68 | ||||||||||||||||||||
| 10/31/2005 | 18.53 | 0.15 | 1.41 | 1.56 | (0.19 | ) | – | (0.19 | ) | 19.90 | |||||||||||||||||||||||||||||
| 10/31/2004 | 17.43 | 0.14 | 1.08 | 1.22 | (0.12 | ) | – | (0.12 | ) | 18.53 | |||||||||||||||||||||||||||||
| 10/31/2003 | 16.23 | 0.19 | 1.21 | 1.40 | (0.20 | ) | – | (0.20 | ) | 17.43 | |||||||||||||||||||||||||||||
| 10/31/2002 | 17.31 | 0.29 | (1.09 | ) | (0.80 | ) | (0.28 | ) | – | (0.28 | ) | 16.23 | |||||||||||||||||||||||||||
| 10/31/2001 | 19.75 | 0.37 | (2.18 | ) | (1.81 | ) | (0.35 | ) | (0.28 | ) | (0.63 | ) | 17.31 | ||||||||||||||||||||||||||
| Class B | 4/30/2006 | 19.88 | – | (h) | 1.78 | 1.78 | (0.02 | ) | – | (0.02 | ) | 21.64 | |||||||||||||||||||||||||||
| 10/31/2005 | 18.47 | 0.04 | 1.40 | 1.44 | (0.03 | ) | – | (0.03 | ) | 19.88 | |||||||||||||||||||||||||||||
| 10/31/2004 | 17.39 | 0.04 | 1.08 | 1.12 | (0.04 | ) | – | (0.04 | ) | 18.47 | |||||||||||||||||||||||||||||
| 10/31/2003 | 16.22 | 0.08 | 1.18 | 1.26 | (0.09 | ) | – | (0.09 | ) | 17.39 | |||||||||||||||||||||||||||||
| 10/31/2002 | 17.30 | 0.18 | (1.09 | ) | (0.91 | ) | (0.17 | ) | – | (0.17 | ) | 16.22 | |||||||||||||||||||||||||||
| 10/31/2001 | 19.73 | 0.25 | (2.17 | ) | (1.92 | ) | (0.23 | ) | (0.28 | ) | (0.51 | ) | 17.30 | ||||||||||||||||||||||||||
| Class C | 4/30/2006 | 19.82 | – | (h) | 1.77 | 1.77 | (0.02 | ) | – | (0.02 | ) | 21.57 | |||||||||||||||||||||||||||
| 10/31/2005 | 18.45 | 0.04 | 1.41 | 1.45 | (0.08 | ) | – | (0.08 | ) | 19.82 | |||||||||||||||||||||||||||||
| 10/31/2004 | 17.39 | (0.01 | ) | 1.11 | 1.10 | (0.04 | ) | – | (0.04 | ) | 18.45 | ||||||||||||||||||||||||||||
| 10/31/2003 | 16.22 | 0.08 | 1.18 | 1.26 | (0.09 | ) | – | (0.09 | ) | 17.39 | |||||||||||||||||||||||||||||
| Ratios/Supplemental Data | |||||||||||||||||||||||||||||||
| For the Period | Total | Net Assets, End of Period | Ratio of Expenses to Average Net Assets (a) | Net Investment Income (Loss) to Average | Portfolio Turnover | ||||||||||||||||||||||||||
| Ended (g) | Return (c) | (000's) | Net (e) | Total (f) | Net Assets (a) | Rate (b) | |||||||||||||||||||||||||
| Class A | 4/30/2006 | 9.30 | % | $ | 60,463 | 1.60 | % | 1.60 | % | 0.58 | % | 29 | % | ||||||||||||||||||
| 10/31/2005 | 8.41 | 62,440 | 1.59 | 1.59 | 0.75 | 27 | |||||||||||||||||||||||||
| 10/31/2004 | 7.03 | 72,997 | 1.70 | 1.70 | 0.76 | 107 | |||||||||||||||||||||||||
| 10/31/2003 | 8.71 | 89,335 | 1.73 | 1.73 | 1.13 | 69 | |||||||||||||||||||||||||
| 10/31/2002 | (4.72 | ) | 100,923 | 1.68 | 1.70 | 1.70 | 87 | ||||||||||||||||||||||||
| 10/31/2001 | (9.35 | ) | 126,369 | 1.64 | 1.66 | 1.96 | 114 | ||||||||||||||||||||||||
| Class B | 4/30/2006 | 8.94 | 133,946 | 2.16 | 2.16 | 0.03 | 29 | ||||||||||||||||||||||||
| 10/31/2005 | 7.80 | 142,479 | 2.14 | 2.14 | 0.20 | 27 | |||||||||||||||||||||||||
| 10/31/2004 | 6.44 | 170,630 | 2.26 | 2.26 | 0.19 | 107 | |||||||||||||||||||||||||
| 10/31/2003 | 7.84 | 199,472 | 2.37 | 2.37 | 0.48 | 69 | |||||||||||||||||||||||||
| 10/31/2002 | (5.31 | ) | 214,019 | 2.33 | 2.35 | 1.05 | 87 | ||||||||||||||||||||||||
| 10/31/2001 | (9.93 | ) | 243,387 | 2.29 | 2.31 | 1.31 | 114 | ||||||||||||||||||||||||
| Class C | 4/30/2006 | 8.92 | 40,764 | 2.15 | 2.15 | 0.04 | 29 | ||||||||||||||||||||||||
| 10/31/2005 | 7.85 | 43,276 | 2.13 | 2.13 | 0.21 | 27 | |||||||||||||||||||||||||
| 10/31/2004 | 6.33 | 53,990 | 2.28 | 2.28 | (0.08 | ) | 107 | ||||||||||||||||||||||||
| 10/31/2003 | 7.84 | 4,354 | 2.38 | 2.39 | 0.48 | 69 | |||||||||||||||||||||||||
The notes to the financial statements are an integral part of this report.
Transamerica IDEX Mutual Funds
Semi-Annual Report 2006
8
TA IDEX Transamerica Balanced
FINANCIAL HIGHLIGHTS (continued)
(unaudited)
NOTES TO FINANCIAL HIGHLIGHTS
(a) Annualized.
(b) Not annualized.
(c) Total Return has been calculated for the applicable period without deduction of a sales load, if any, on an initial purchase. Not annualized.
(d) Per share information is calculated based on average number of shares outstanding.
(e) Ratio of Net Expenses to Average Net Assets is net of fee waivers and reimbursements by the investment adviser, if any (see note 2).
(f) Ratio of Total Expenses to Average Net Assets includes all expenses before fee waivers and reimbursements by the investment adviser.
(g) The inception date for the Fund's offering of share Class C was November 11, 2002.
(h) Rounds less than $0.01 per share.
The notes to the financial statements are an integral part of this report.
Transamerica IDEX Mutual Funds
Semi-Annual Report 2006
9
TA IDEX Transamerica Balanced
NOTES TO FINANCIAL STATEMENTS
At April 30, 2006
(all amounts in thousands)
(unaudited)
NOTE 1. ORGANIZATION AND SIGNIFICANT ACCOUNTING POLICIES
Transamerica IDEX Mutual Funds is an open-end management investment company registered under the Investment Company Act of 1940, as amended (the "1940 Act").
In the normal course of business, TA IDEX Transamerica Balanced (the "Fund") enters into contracts that contain a variety of representations that provide general indemnifications. The Fund's maximum exposure under these arrangements is unknown, as this would involve future claims that may be made against the Fund and/or its affiliates that have not yet occurred. However, based on experience, the Fund expects the risk of loss to be remote.
This report should be read in conjunction with the current Fund prospectus, which contains more complete information about the Fund.
In preparing the Fund's financial statements in accordance with accounting principles generally accepted in the United States of America ("GAAP"), estimates or assumptions (which could differ from actual results) may be used that affect reported amounts and disclosures. The following is a summary of significant accounting policies followed by the Fund.
Multiple class operations, income and expenses: The Fund currently offers four classes of shares, Class A, Class B, Class C and Class I, each with a public offering price that reflects different sales charges, if any, and expense levels. Class I shares commenced operations on November 15, 2005. Class I is only available for investment to certain affiliated asset allocation funds. Class I is currently uninvested. Class B shares will convert to Class A shares eight years after purchase. Income, non-class specific expenses and realized and unrealized gains and losses, are allocated daily to each class, based upon the value of shares outstanding method as permitted under Rule 18f-3 of the 1940 Act. Each class bears its own specific expenses as well as a portion o f general, common expenses.
Security valuations: The Fund values its investments at the close of the New York Stock Exchange ("NYSE"), normally 4 p.m. ET, each day the NYSE is open for business. Fund investments are valued at the last sale price or closing price on the day of valuation taken from the primary exchange where the security is principally traded.
Securities traded in the over-the-counter market and listed securities for which no sale was reported on that date are valued at the last quoted bid price.
Debt securities are valued based on a price quotation or other equivalent indication of value supplied by an exchange, a pricing service or a major market maker; however, those that mature in sixty days or less are valued at amortized cost, which approximates market.
Investment company securities are valued at the net asset value of the underlying portfolio.
Foreign securities generally are valued based on quotations from the primary market in which they are traded. Because many foreign securities markets and exchanges close prior to the close of the NYSE, closing prices for foreign securities in those markets or on those exchanges do not reflect the events that occur after that close. If a significant market event impacting the value of a portfolio security (e.g., natural disaster, company announcement, market volatility) occurs subsequent to the close of trading in the security, but prior to the calculation of the Fund's net asset value per share, market quotations for that security may be determined to be unreliable and, accordingly, not "readily available." As a result, foreign equity securities held by the Fund may be valued at fair market value as determined in good faith by the Fund's Administrative Valuation Committee, under the supervision of the Board's Valuation Committee , using guidelines adopted by the Board of Trustees.
Other securities for which quotations are not readily available or whose values have been determined to be unreliable are valued at fair market value as determined in good faith by the Fund's Administrative Valuation Committee, under the supervision of the Board's Valuation Committee, using guidelines adopted by the Board of Trustees.
Cash: The Fund may leave cash overnight in its cash account with the custodian, Investors Bank & Trust Company ("IBT"). IBT has been contracted on behalf of the Fund to invest the excess cash into a savings account, which at April 30, 2006, was paying an interest rate of 3.24%.
Repurchase agreements: The Fund is authorized to enter into repurchase agreements. The Fund, through its custodian, IBT, receives delivery of the underlying securities, the value of which at the time of purchase is required to be an amount equal to at least 100% of the resale price. The Fund will bear the risk of value fluctuations until the security can be sold and may encounter delays and incur costs in liquidating the security. In the event of bankruptcy or insolvency of the seller, delays and costs may be incurred.
Commission recapture: The sub-adviser, to the extent consistent with the best execution and usual commission rate policies and practices, may place security transactions of the Fund with broker/dealers with which Transamerica IDEX Mutual Funds has established a Commission Recapture Program. A Commission Recapture Program is any arrangement under which a broker/dealer applies a portion of the commissions received by such broker/dealer on the security transactions to the Fund. In no event will commissions paid by the Fund be used to pay expenses that would otherwise be borne by any other funds within Transamerica IDEX Mutual Funds, or by any other party.
For the period ended April 30, 2006 there were no recaptured commissions.
Transamerica IDEX Mutual Funds
Semi-Annual Report 2006
10
TA IDEX Transamerica Balanced
NOTES TO FINANCIAL STATEMENTS (continued)
At April 30, 2006
(all amounts in thousands)
(unaudited)
NOTE 1.–(continued)
Securities lending: The Fund may lend securities to qualified borrowers, with IBT acting as the Fund's lending agent. The Fund earns negotiated lenders' fees. The Fund receives cash and/or securities as collateral against the loaned securities. Cash collateral received is invested in short term, interest bearing securities. The Fund monitors the market value of securities loaned on a daily basis and requires collateral in an amount at least equal to the value of the securities loaned. Income from loaned securities on the Statement of Operations is net of fees, in the amount of $15, earned by IBT for its services.
Real Estate Investment Trusts ("REITs"): There are certain additional risks involved in investing in REITs. These include, but are not limited to, economic conditions, changes in zoning laws, real estate values, property taxes and interest rates.
Security transactions and investment income: Security transactions are recorded on the trade date. Security gains and losses are calculated on the specific identification basis. Dividend income, if any, is recorded on the ex-dividend date or, in the case of foreign securities, as soon as the Fund is informed of the ex-dividend date. Interest income, including accretion of discounts and amortization of premiums, is recorded on the accrual basis commencing on the settlement date.
Foreign currency denominated investments: The accounting records of the Fund are maintained in U.S. dollars. Securities and other assets and liabilities denominated in foreign currencies are translated into U.S. dollars at the closing exchange rate each day. The cost of foreign securities is translated at the exchange rate in effect when the investment was acquired. The Fund combines fluctuations from currency exchange rates and fluctuations in value when computing net realized and unrealized gains or losses from investments.
Net foreign currency gains and losses resulting from changes in exchange rates include: 1) foreign currency fluctuations between trade date and settlement date of investment security transactions; 2) gains and losses on forward foreign currency contracts; and 3) the difference between the receivable amounts of interest and dividends recorded in the accounting records in U.S. dollars and the amounts actually received.
Foreign currency denominated assets may involve risks not typically associated with domestic transactions. These risks include revaluation of currencies, adverse fluctuations in foreign currency values and possible adverse political, social and economic developments, including those particular to a specific industry, country or region.
Redemption fees: A short-term trading redemption fee may be assessed on any Fund shares in a fund account that are sold during the first five (5) NYSE trading days following their purchase date. This redemption fee will equal 2% of the amount redeemed and shares held the longest will be treated as being redeemed first and shares held the shortest as being redeemed last. For the six months ended April 30, 2006, the Fund received less than $1 in redemption fees.
Dividend distributions: Distributions to shareholders are recorded on the ex-dividend date and are determined in accordance with Federal income tax regulations which may differ from GAAP.
NOTE 2. RELATED PARTY TRANSACTIONS
Transamerica Fund Advisors, Inc. ("TFAI") is the Fund's investment adviser. Transamerica Fund Services, Inc. ("TFS") is the Fund's administrator and transfer agent. AFSG Securities Corp. ("AFSG") is the Fund's distributor/principal underwriter. TFAI, TFS, and AFSG are affiliates of AEGON, NV, a Netherlands corporation.
Transamerica Investment Management, LLC is both an affiliate of the Fund and a sub-adviser to the Fund.
Certain officers and trustees of the Fund are also officers and/or directors of TFAI, TFS and AFSG.
Investment advisory fees: The Fund pays management fees to TFAI based on average daily net assets ("ANA") at the following breakpoints:
0.80% of the first $250 million of ANA
0.75% of the next $250 million of ANA
0.70% of the next $1 billion of ANA
0.625% of ANA over $1.5 billion
TFAI has contractually agreed to waive its advisory fee and will reimburse the Fund to the extent that operating expenses, excluding 12b-1 fees, exceed the following stated annual limit:
1.45% Expense Limit
If total Fund expenses fall below the annual expense limitation agreement agreed to by the adviser within the succeeding three years, the Fund may be required to pay the adviser a portion or all of the reimbursed class expenses.
There are no amounts available for recapture at April 30, 2006.
Distribution and service fees: The Fund has a 12b-1 distribution plan under the 1940 Act pursuant to which an annual fee, based on average daily net assets, is paid to the distributor for various disbursements such as broker-dealer account servicing fees and other promotional expenses of the Fund. The Fund is authorized under the 12b-1 plan to pay fees on each class up to the following limits:
| Class A | 0.35 | % | |||||
| Class B | 1.00 | % | |||||
| Class C | 1.00 | % | |||||
| Class I | N/A | ||||||
Transamerica IDEX Mutual Funds
Semi-Annual Report 2006
11
TA IDEX Transamerica Balanced
NOTES TO FINANCIAL STATEMENTS (continued)
At April 30, 2006
(all amounts in thousands)
(unaudited)
NOTE 2.–(continued)
In the case the Fund or a class of shares of the Fund is closed to new investors or investments, the Fund is authorized to pay 12b-1 fees for past sales and distribution efforts and present and past investor services.
Underwriter commissions relate to front-end sales charges imposed for Class A shares and contingent deferred sales charges from Classes B, C, and certain A share redemptions. For the six months ended April 30, 2006, the underwriter commissions were as follows:
| Received by Underwriter | $ | 55 | |||||
| Retained by Underwriter | 8 | ||||||
| Contingent Deferred Sales Charge | 111 | ||||||
Administrative services: The Fund has entered into an agreement with TFS for financial and legal fund administration services. The Fund pays TFS an annual fee of 0.02% of ANA. The Legal fees on the Statement of Operations are fees paid to external legal counsel.
Transfer agent fees: The Fund pays TFS an annual per-account charge for each open and closed account. The Fund paid TFS $321 for the six months ended April 30, 2006.
Deferred compensation plan: Each eligible independent Fund Trustee may elect to participate in a non-qualified deferred compensation plan maintained by Transamerica IDEX Mutual Funds (the "Plan"). Under the Plan, such Trustees may defer payment of all or a portion of their total fees earned as a Fund Trustee. Each Trustee who is a participant in the Plan may elect that the earnings, losses or gains credited to his or her deferred fee amounts be determined based on a deemed investment in any series of Transamerica IDEX Mutual Funds, including the Fund. The right of a participant to receive a distribution from the Plan of the deferred fees is an unsecured claim against the general assets of all series of Transamerica IDEX Mutual Funds. The pro rata liability to the Fund of all deferred fees in the Plan amounted, as of April 30, 2006, to $38.
NOTE 3. INVESTMENT TRANSACTIONS
The cost of securities purchased and proceeds from securities sold (excluding short-term securities) for the six months ended April 30, 2006 were as follows:
| Purchases of securities: | |||||||
| Long-Term | $ | 43,968 | |||||
| U.S. Government | 24,092 | ||||||
| Proceeds from maturities and sales of securities: | |||||||
| Long-Term | 61,418 | ||||||
| U.S. Government | 23,112 | ||||||
NOTE 4. FEDERAL INCOME TAX MATTERS
The Fund has not made any provision for federal income or excise taxes due to its policy to distribute all of its taxable income and capital gains to its shareholders and otherwise qualify as a regulated investment company under Subchapter M of the Internal Revenue Code. Income and capital gain distributions are determined in accordance with income tax regulations, which may differ from GAAP. These differences are primarily due to differing treatment for items including, but not limited to, wash sales and capital loss carryforwards.
The capital loss carryforwards are available to offset future realized capital gains through the periods listed:
| Capital Loss Carryforwards | Available through | ||||||
| $ | 520 | October 31, 2009 | |||||
| 26,030 | October 31, 2010 | ||||||
| 9,071 | October 31, 2011 | ||||||
NOTE 5. REGULATORY PROCEEDINGS
There continues to be significant federal and state regulatory activity relating to financial services companies, particularly mutual fund companies and their investment advisers. As part of an ongoing investigation regarding potential market timing, recordkeeping and trading compliance issues and matters affecting the Fund's investment adviser, TFAI, and certain affiliates and former employees of TFAI, the SEC staff has indicated that it is likely to take some action against TFAI and certain of its affiliates at the conclusion of the investigation. The potential timing and the scope of any such action is difficult to predict. Although the impact of any action brought against TFAI and/or its affiliates is difficult to assess at the present time, the Fund currently believes that the likelihood that any such action will have a material adverse impact on it is remote. It is important to note that the Fund is not aware of any allega tion of wrongdoing against it and its Board at the time this semi-annual report is printed. Although it is not anticipated that these developments will have an adverse impact on the Fund, there can be no assurance at this time. TFAI and its affiliates are actively working with the SEC in regard to this matter; however, the exact resolution cannot be determined at this time. TFAI will take such actions that it deems necessary or appropriate to continue providing management services to the Fund and to bring all matters to an appropriate conclusion.
TFAI and/or its affiliates, and not the Fund, will bear the costs regarding these regulatory matters.
Transamerica IDEX Mutual Funds
Semi-Annual Report 2006
12
TA IDEX Transamerica Balanced
INVESTMENT ADVISORY AND SUB-ADVISORY AGREEMENTS – REVIEW AND RENEWAL (unaudited)
At a meeting of the Board of Trustees of Transamerica IDEX Mutual Funds ("TA IDEX") held on November 2, 2005, the Board reviewed and considered the Investment Advisory Agreement between TA IDEX Transamerica Balanced (the "Fund") and Transamerica Fund Advisors, Inc. ("TFAI"), as well as the Investment Sub-Advisory Agreement of the Fund between TFAI and Transamerica Investment Management, LLC (the "Sub-Adviser"), to determine whether the agreements should be renewed for a one-year period. Following their review and consideration, the Trustees determined that the Investment Advisory Agreement and the Investment Sub-Advisory Agreement will enable shareholders of the Fund to obtain high quality services at a cost that is appropriate, reasonable, and in the best interests of its shareholders. The Board, including the independent members of the Board, unanimously approved the renewal of the Investment Advisory Agreement and the Investm ent Sub-Advisory Agreement. In reaching their decision, the Trustees requested and obtained from TFAI and the Sub-Adviser such information as they deemed reasonably necessary to evaluate the proposed agreements. The Trustees also carefully considered the information that they had received throughout the year from TFAI and the Sub-Adviser (such as in-person presentations by the Sub-Adviser) as part of their regular oversight of the Fund, as well as: comparative fee, expense and performance information prepared by Lipper Inc. ("Lipper"), independent providers of mutual fund performance, fee and expense information, and profitability data. In considering the proposed continuation of the Investment Advisory Agreement and the Investment Sub-Advisory Agreement, the Trustees evaluated a number of considerations that they believe, in light of the legal advice furnished to them by TA IDEX counsel and independent legal counsel and their own business judgment, to be relevant. They based their decisions on the following considerations, among others, although they did not identify any consideration or particular information that was controlling of their decisions:
The nature, extent and quality of the advisory service to be provided. The Board considered the nature and quality of the services provided by TFAI and the Sub-Adviser to the Fund in the past, as well as the services anticipated to be provided in the future. The Board concluded that TFAI and the Sub-Adviser are capable of providing high quality services to the Fund, as indicated by the nature and quality of services provided in the past, TFAI's and the Sub-Adviser's management capabilities demonstrated with respect to the funds they manage, including the Fund, and the experience, capability and integrity of TFAI's senior management, the financial resources of TFAI and the Sub-Adviser, TFAI's management oversight process, and the professional qualifications and experience of the Sub-Adviser's portfolio management team. The Trustees also concluded that TFAI and the Sub-Adviser proposed to provide investment and related services that were of the same quality and quantity as services provided to the Fund in the past, and that these services are appropriate in scope and extent in light of the Fund's operations, the competitive landscape of the investment company business and investor needs, and that TFAI's and the Sub-Adviser's obligations will remain substantially the same.
The investment performance of the Fund. The Board examined both the short-term and longer-term performance of the Fund, including relative performance against a benchmark securities index and a peer group of comparable mutual funds as prepared by Lipper, for various trailing periods ended June 30, 2005. The Board expressed concerns about the Fund's median or below median performance, and requested that the Sub-Adviser be informed about these concerns and be asked to work with TFAI to formulate a plan to address them. However, the Board noted that the Fund was previously managed by another sub-adviser, and that the Fund's long-term performance cannot be attributed to the Sub-Adviser. On the basis of the Trustees' assessment of the nature, extent and quality of advisory services to be provided or procured by TFAI and the Sub-Adviser, the Trustees conclu ded that TFAI and the Sub-Adviser have achieved an acceptable level of investment performance and are capable of generating a level of investment performance that is appropriate in light of the Fund's investment objective, policies and strategies and competitive with many other investment companies, and also determined that TFAI's and the Sub-Adviser's performance records with respect to the Fund and other mutual funds indicate that their continued management is likely to benefit the Fund and its shareholders.
The cost of advisory services provided and the level of profitability. The Board reviewed profitability information regarding TFAI's costs of procuring portfolio management services, as well as the costs of provision of administration, transfer agency, fund accounting and other services, to the Fund and to TA IDEX as a whole by TFAI and its affiliates. The Trustees reviewed data from Lipper that compared the Fund's management fees (including management fees at various asset levels), other fees and expenses (including total expenses including and excluding 12b-1 distribution and service fees) and portfolio turnover rate against a peer group of comparable mutual funds. Based on such information, the Trustees determined that the management fees of the Fund generally are consistent with industry averages. In addition, on the basis of the Board's review of the management fees to be charged by TFAI for investment advisory and related services, TFAI profitability information (derived from TFAI's audited financial statements), TFAI's estimated management income resulting from its management of the Fund, the estimated margin of the Sub-Adviser, as well as the entirety of TFAI's and its affiliates' service relationship with TA IDEX, the Board concluded that the level of investment management fees and other service fees, as well as TFAI's and the Sub-Adviser's profitability, are appropriate in light of the services provided, the management fees and overall expense ratios of comparable investment companies and the anticipated profitability of the relationship between the Fund, TFAI and its affiliates, and the Sub-Adviser.
Transamerica IDEX Mutual Funds
Semi-Annual Report 2006
13
TA IDEX Transamerica Balanced (continued)
Whether fee levels reflect economies of scale and the extent to which economies of scale would be realized as the Fund grows. The Board concluded that the inclusion of asset-based breakpoints in the Fund's advisory fee schedule appropriately benefits investors by realizing economies of scale in the form of lower management fees as the level of assets grows. In addition, the Board concluded that the Fund's management fees appropriately reflect the Fund's current size, the current economic environment for TFAI, the competitive nature of the investment company market, and TFAI's pricing strategy. The Trustees also concluded that they will have the opportunity to periodically reexamine whether the Fund has achieved economies of scale, and the appropriateness of management fees payable to TFAI and fees payable by TFAI to the Sub-Adviser, in the future.
Benefits (such as soft dollars) to TFAI, its affiliates, or the Sub-Adviser from their relationship with the Fund. The Board concluded that other benefits derived by TFAI, its affiliates, and the Sub-Adviser from their relationship with the Fund, including "soft dollar" benefits (if any) in connection with brokerage transactions, sales charges and distribution/service fees (to the extent applicable) are reasonable and fair, and are consistent with industry practice and the best interests of the Fund and its shareholders. In this regard, the Board noted that TFAI does not realize "soft dollar" benefits from its relationship with the Fund, and that the Sub-Adviser is participating in a brokerage program pursuant to which a portion of brokerage commissions paid by the Fund is recaptured for the benefit of the Fund and its shareholders, thus limiting the amount of "soft-dollar" arrangements the Sub-Adviser may engage in with respect to the Fund's brokerage transactions. In addition, the Trustees determined that the administration, transfer agency, fund accounting and other fees paid by the Fund to affiliates of TFAI are reasonable, fair and in the best interests of shareholders in light of the nature and quality of the services provided, the associated costs to these affiliates of providing the services, the impact of the costs of such services on the Fund's overall operating expenses, and the necessity of the services for the Fund's operations.
Other considerations. The Board determined that TFAI had made a substantial commitment to the recruitment and retention of high quality personnel, and maintained the financial, compliance and operational resources reasonably necessary to manage the Fund in a professional manner that is consistent with the best interests of the Fund and its shareholders. In this regard, the Trustees favorably considered the procedures and policies in place by TFAI to enforce compliance with applicable laws and regulations and oversee the portfolio management activities of the Sub-Adviser. The Trustees also determined that TFAI had made a significant entrepreneurial commitment to the management and success of the Fund, reflected by TFAI's expense limitation and fee waiver arrangement with the Fund, which may result in TFAI waiving advisory fees for the benefit of shareh olders.
Transamerica IDEX Mutual Funds
Semi-Annual Report 2006
14
TA IDEX Transamerica Convertible Securities
UNDERSTANDING YOUR FUND'S EXPENSES
(unaudited)
SHAREHOLDER EXPENSES
Fund shareholders may incur two types of costs: (1) transaction costs, including sales charges (loads) on purchases, contingent deferred sales charges on redemptions and redemption fees; and (2) ongoing costs, including management fees, 12b-1 distribution and service fees, and other fund expenses.
The following Example is intended to help you understand your ongoing costs (in dollars and cents) of investing in the Fund and to compare these costs with the ongoing costs of investing in other funds.
The Example is based on an investment of $1,000 invested at November 1, 2005 and held for the entire period until April 30, 2006.
ACTUAL EXPENSES
The first line in the table below provides information about actual account values and actual expenses. You may use the information in this line, together with the amount you invested, to estimate the expenses that you paid over the period. Simply divide your account value by $1,000 (for example, an $8,600 account value divided by $1,000 = 8.6), then multiply the result by the number in the first line of your Fund under the heading entitled "Expenses Paid During Period" to estimate the expenses you paid on your account during this period. If your account is an IRA, your expenses could have included a $15 annual fee. The amount of any fee paid through your account would increase the estimate of expenses you paid during the period and decrease your ending account value.
HYPOTHETICAL EXAMPLE FOR COMPARISON PURPOSES
The second line in the table below provides information about hypothetical account values and hypothetical expenses based on the Fund's actual expense ratio and an assumed rate of return of 5% per year before expenses, which is not the Fund's actual return. The hypothetical account values and expenses may not be used to estimate the actual ending account balance or expenses you paid for the period. You may use this information to compare the ongoing costs of investing in your Fund and other funds. To do so, compare this 5% hypothetical example with the 5% hypothetical examples that appear in the shareholder reports of the other funds. As in the case of the actual expense example, if your account is subject to an IRA fee, the amount of the fee paid through your account would increase the hypothetical expenses you would have paid during the period and decrease the hypothetical ending account value.
Please note that the expenses shown in the table are meant to highlight your ongoing costs only and do not reflect any transactional costs, such as sales charges, redemption fees, brokerage commissions paid on purchases and sales of fund shares. Therefore, the second line under the Fund in the table is useful in comparing ongoing costs only, and will not help you determine the relative total costs of owning different funds. If any of these transaction costs were included, your costs would be higher. The expenses shown in the table do not reflect any fees that may be charged to you by brokers, financial intermediaries or other financial institutions.
| Beginning Account Value | Ending Account Value | Annualized Expense Ratio | Expenses Paid During Period (a) | ||||||||||||||||
| Class A | |||||||||||||||||||
| Actual | $ | 1,000.00 | $ | 1,153.20 | 1.22 | % | $ | 6.51 | |||||||||||
| Hypothetical (b) | 1,000.00 | 1,018.74 | 1.22 | 6.11 | |||||||||||||||
| Class B | |||||||||||||||||||
| Actual | 1,000.00 | 1,148.60 | 2.01 | 10.71 | |||||||||||||||
| Hypothetical (b) | 1,000.00 | 1,014.83 | 2.01 | 10.04 | |||||||||||||||
| Class C | |||||||||||||||||||
| Actual | 1,000.00 | 1,149.10 | 1.94 | 10.34 | |||||||||||||||
| Hypothetical (b) | 1,000.00 | 1,015.17 | 1.94 | 9.69 | |||||||||||||||
| Class I | |||||||||||||||||||
| Actual | 1,000.00 | 1,140.20 | 0.83 | 4.04 | |||||||||||||||
| Hypothetical (b) | 1,000.00 | 1,018.96 | 0.83 | 3.81 | |||||||||||||||
(a) Expenses are calculated using the Fund's annualized expense ratio (as disclosed in the table), multiplied by the average account value for the period, multiplied by number of days in the period (181 days for Classes A, B and C, and 166 days for Class I), and divided by the number of days in the year (365 days).
(b) 5% return per year before expenses.
GRAPHICAL PRESENTATION OF SCHEDULE OF INVESTMENTS
By Sector
At April 30, 2006
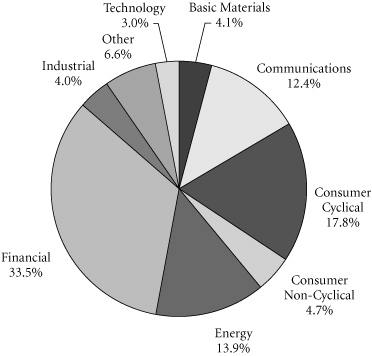
This chart shows the percentage breakdown by bond sector of the Fund's total investment securities.
Transamerica IDEX Mutual Funds
Semi-Annual Report 2006
1
TA IDEX Transamerica Convertible Securities
SCHEDULE OF INVESTMENTS
At April 30, 2006
(all amounts except share amounts in thousands)
(unaudited)
| Principal | Value | ||||||||||
| CONVERTIBLE BOND (84.7%) | |||||||||||
| Amusement & Recreation Services (1.1%) | |||||||||||
| Virgin River Casino Corp./RBG LLC/B&BB, Inc. 0.00%, due 01/15/2013 (a) | $ | 4,000 | $ | 2,700 | |||||||
| Automotive Dealers & Service Stations (2.1%) | |||||||||||
| United Auto Group, Inc., Subordinated Note–144A 3.50%, due 04/01/2026 | 4,750 | 5,059 | |||||||||
| Commercial Banks (19.1%) | |||||||||||
| Deutsche Bank AG London 0.25%, due 04/11/2013 | 9,000 | 9,392 | |||||||||
| Euronet Worldwide, Inc., Senior Note 3.50%, due 10/15/2025 † | 5,000 | 5,687 | |||||||||
| SG Structured Products, Inc. 0.25%, due 11/07/2012 | 7,000 | 6,192 | |||||||||
| Tiers Trust, United States–144A 0.25%, due 10/22/2012 § | 7,425 | 8,412 | |||||||||
| Wachovia Corp.–144A 0.25%, due 03/01/2013 | 7,500 | 9,554 | |||||||||
| Wells Fargo & Co. 0.25%, due 04/29/2014 | 5,000 | 6,800 | |||||||||
| Communication (5.0%) | |||||||||||
| American Tower Corp. 3.00%, due 08/15/2012 | 2,150 | 3,765 | |||||||||
| XM Satellite Radio Holdings, Inc. 1.75%, due 12/01/2009 | 6,000 | 4,965 | |||||||||
| XM Satellite Radio, Inc.–144A 1.75%, due 12/01/2009 † | 4,000 | 3,310 | |||||||||
| Computer & Data Processing Services (4.2%) | |||||||||||
| Openwave Systems, Inc. 2.75%, due 09/09/2008 | 3,000 | 3,533 | |||||||||
| Yahoo! Inc. Zero Coupon, due 04/01/2008 | 4,000 | 6,480 | |||||||||
| Computer & Office Equipment (2.3%) | |||||||||||
| Scientific Games Corp. 0.75%, due 12/01/2024 † | 4,000 | 5,485 | |||||||||
| Electronic Components & Accessories (3.1%) | |||||||||||
| Cypress Semiconductor Corp. 1.25%, due 06/15/2008 | 2,150 | 2,690 | |||||||||
| Intel Corp.–144A 2.95%, due 12/15/2035 | 5,500 | 4,696 | |||||||||
| Hotels & Other Lodging Places (1.8%) | |||||||||||
| Hilton Hotels Corp., Senior Note 3.38%, due 04/15/2023 | 3,500 | 4,414 | |||||||||
| Principal | Value | ||||||||||
| Industrial Machinery & Equipment (2.2%) | |||||||||||
| Cooper Cameron Corp., Senior Note 1.50%, due 05/15/2024 | $ | 3,500 | $ | 5,346 | |||||||
| Instruments & Related Products (1.6%) | |||||||||||
| Allergan Inc.–144A 1.50%, due 04/01/2026 | 4,000 | 3,905 | |||||||||
| Management Services (2.5%) | |||||||||||
| Fluor Corp. 1.50%, due 02/15/2024 | 3,600 | 6,057 | |||||||||
| Manufacturing Industries (4.3%) | |||||||||||
| Shuffle Master, Inc. 1.25%, due 04/15/2024 | 4,850 | 6,687 | |||||||||
| Tyco International Group SA, Series B 3.13%, due 01/15/2023 | 3,000 | 3,761 | |||||||||
| Medical Instruments & Supplies (0.8%) | |||||||||||
| St. Jude Medical, Inc., Senior Note 2.80%, due 12/15/2035 | 2,000 | 1,970 | |||||||||
| Mortgage Bankers & Brokers (3.9%) | |||||||||||
| WMT Debt Exchangeable Trust–144A 0.25%, due 05/02/2013 § | 800 | 9,450 | |||||||||
| Motion Pictures (2.3%) | |||||||||||
| Lions Gate Entertainment Corp. 4.88%, due 12/15/2010 † 2.94%, due 10/15/2024 | 1,000 3,750 | 1,806 3,717 | |||||||||
| Oil & Gas Extraction (7.4%) | |||||||||||
| Halliburton Co. 3.13%, due 07/15/2023 | 2,750 | 5,792 | |||||||||
| Quicksilver Resources, Inc., Senior Note 1.88%, due 11/01/2024 † | 2,400 | 3,672 | |||||||||
| Schlumberger, Ltd., Series B 2.13%, due 06/01/2023 † | 4,700 | 8,313 | |||||||||
| Personal Credit Institutions (1.5%) | |||||||||||
| American Express Co. 1.85%, due 12/01/2033 (b) | 3,500 | 3,623 | |||||||||
| Primary Metal Industries (2.2%) | |||||||||||
| Inco, Ltd. Zero Coupon, due 03/29/2021 | 3,500 | 5,241 | |||||||||
| Retail Trade (2.5%) | |||||||||||
| Guitar Center, Inc. 4.00%, due 07/15/2013 | 3,900 | 6,084 | |||||||||
| Security & Commodity Brokers (8.2%) | |||||||||||
| BlackRock, Inc./New York 2.63%, due 02/15/2035 † | 3,750 | 5,686 | |||||||||
The notes to the financial statements are an integral part of this report.
Transamerica IDEX Mutual Funds
Semi-Annual Report 2006
2
TA IDEX Transamerica Convertible Securities
SCHEDULE OF INVESTMENTS (continued)
At April 30, 2006
(all amounts except share amounts in thousands)
(unaudited)
| Principal | Value | ||||||||||
| Security & Commodity Brokers (continued) | |||||||||||
| Morgan Stanley Group, Inc.–144A 0.25%, due 07/30/2014 § | $ | 4,800 | $ | 6,240 | |||||||
| Svensk Exportkredit AB 0.25%, due 01/31/2015 § | 4,800 | 7,716 | |||||||||
| Telecommunications (3.4%) | |||||||||||
| NII Holdings, Inc., Senior Note 2.75%, due 08/15/2025 | 6,000 | 8,093 | |||||||||
| Water Transportation (1.2%) | |||||||||||
| Carnival Corp. 1.13%, due 04/29/2033 (c) | 4,000 | 2,755 | |||||||||
| Wholesale Trade Durable Goods (2.0%) | |||||||||||
| WESCO International, Inc.–144A 2.63%, due 10/15/2025 | 2,500 | 4,716 | |||||||||
| Total Convertible Bond (cost: $174,081) | 203,764 | ||||||||||
| Shares | Value | ||||||||||
| CONVERTIBLE PREFERRED STOCKS (9.9%) | |||||||||||
| Chemicals & Allied Products (2.0%) | |||||||||||
| Celanese Corp. † | 155,000 | $ | 4,747 | ||||||||
| Insurance (1.7%) | |||||||||||
| Fortis Insurance NV–144A | 3,080 | 4,027 | |||||||||
| Life Insurance (1.8%) | |||||||||||
| Metlife, Inc. ‡ | 160,000 | 4,480 | |||||||||
| Mining (2.1%) | |||||||||||
| Arch Coal, Inc. | 22,000 | 5,038 | |||||||||
| Oil & Gas Extraction (2.3%) | |||||||||||
| Chesapeake Energy Corp. † | 41,000 | 5,663 | |||||||||
| Total Convertible Preferred Stocks (cost: $20,277) | 23,955 | ||||||||||
| Principal | Value | ||||||||||
| SECURITY LENDING COLLATERAL (6.6%) | |||||||||||
| Debt (6.2%) | |||||||||||
| Bank Notes (0.8%) | |||||||||||
| Bank of America 4.81%, due 06/07/2006 * | $ | 519 | $ | 519 | |||||||
| 4.81%, due 08/10/2006 * | 501 | 501 | |||||||||
| Bear Stearns & Co. 5.01%, due 06/06/2006 * 5.01%, due 09/07/2006 * | 200 601 | 200 601 | |||||||||
| Certificates Of Deposit (0.4%) | |||||||||||
| Halifax Bank of Scotland 4.78%, due 06/06/2006 * | 501 | 501 | |||||||||
| Rabobank Nederland 4.87%, due 05/31/2006 * | 501 | 501 | |||||||||
| Principal | Value | ||||||||||
| Commercial Paper (0.4%) | |||||||||||
| Banco Santander Central Hispano SA 4.77%, due 05/02/2006 | $ | 300 | $ | 300 | |||||||
| Sheffield Receivables Corp.–144A 4.81%, due 05/03/2006 | 500 | 500 | |||||||||
| Euro Dollar Overnight (1.1%) | |||||||||||
| Bank of Montreal 4.77%, due 05/02/2006 | 401 | 401 | |||||||||
| Dexia Group 4.78%, due 05/04/2006 | 501 | 501 | |||||||||
| Fortis Bank 4.77%, due 05/01/2006 | 200 | 200 | |||||||||
| Royal Bank of Canada 4.77%, due 05/01/2006 | 701 | 701 | |||||||||
| Royal Bank of Scotland 4.75%, due 05/03/2006 | 501 | 501 | |||||||||
| Svenska Handlesbanken 4.82%, due 05/01/2006 | 383 | 383 | |||||||||
| Euro Dollar Terms (1.7%) | |||||||||||
| BancoBilbao Vizcaya Argentaria SA 4.95%, due 06/20/2006 | 401 | 401 | |||||||||
| Bank of the West 4.94%, due 06/16/2006 | 401 | 401 | |||||||||
| Barclays 4.79%, due 05/10/2006 4.77%, due 05/16/2006 | 601 200 | 601 200 | |||||||||
| Canadian Imperial Bank of Commerce 4.97%, due 06/23/2006 | 301 | 301 | |||||||||
| Credit Suisse First Boston Corp. 4.73%, due 05/08/2006 | 301 | 301 | |||||||||
| Fortis Bank 4.83%, due 05/08/2006 | 200 | 200 | |||||||||
| Lloyds TSB Bank 4.81%, due 05/11/2006 | 301 | 301 | |||||||||
| Royal Bank of Scotland 4.87%, due 05/12/2006 | 401 | 401 | |||||||||
| Societe Generale 4.79%, due 05/10/2006 | 501 | 501 | |||||||||
| UBS AG 4.95%, due 06/20/2006 | 501 | 501 | |||||||||
The notes to the financial statements are an integral part of this report.
Transamerica IDEX Mutual Funds
Semi-Annual Report 2006
3
TA IDEX Transamerica Convertible Securities
SCHEDULE OF INVESTMENTS (continued)
At April 30, 2006
(all amounts except share amounts in thousands)
(unaudited)
| Principal | Value | ||||||||||
| Repurchase Agreements (1.8%) †† | |||||||||||
| Credit Suisse First Boston Corp. 4.92%, dated 04/28/2006 to be repurchased at $681 on 05/01/2006 | $ | 680 | $ | 680 | |||||||
| Goldman Sachs Group, Inc. (The) 4.92%, dated 04/28/2006 to be repurchased at $1,472 on 05/01/2006 | 1,472 | 1,472 | |||||||||
| Lehman Brothers, Inc. 4.92%, dated 04/28/2006 to be repurchased at $25 on 05/01/2006 | 25 | 25 | |||||||||
| Merrill Lynch & Co. 4.87%, dated 04/28/2006 to be repurchased at $1,503 on 05/01/2006 | 1,503 | 1,503 | |||||||||
| Morgan Stanley Dean Witter & Co. 4.93%, dated 04/28/2006 to be repurchased at $702 on 05/01/2006 | 701 | 701 | |||||||||
| Shares | Value | ||||||||||
| Investment Companies (0.4%) | |||||||||||
| Barclays Global Investors Institutional Money Market Fund 1-day yield of 4.78% | 801,498 | $ | 801 | ||||||||
| Merrimac Cash Fund, Premium Class 1-day yield of 4.61% @ | 213,251 | 213 | |||||||||
| Total Security Lending Collateral (cost: $15,814) | 15,814 | ||||||||||
| Total Investment Securities (cost: $210,172) # | $ | 243,533 | |||||||||
NOTES TO SCHEDULE OF INVESTMENTS:
(a) Virgin River Casino Corp./RBG LLC/B&BB, Inc. has a coupon rate of 0.00% until 01/15/2009, thereafter the coupon rate will be 12.75%.
† At April 30, 2006, all or a portion of this security is on loan. The value at April 30, 2006, of all securities on loan is $15,419.
§ Security is deemed to be illiquid.
(b) American Express Co. has a coupon rate of 1.85% until 12/01/2006, thereafter the coupon rate will be 0.00%.
(c) Carnival Corp. has a coupon rate of 1.13% until 04/29/2008, thereafter the coupon rate will be 0.00%.
‡ Non-income producing.
* Floating or variable rate note. Rate is listed as of April 30, 2006.
†† Cash collateral for the Repurchase Agreements, valued at $4,510, that serve as collateral for securities lending are invested in corporate bonds with interest rates and maturity dates ranging from 0.00%–9.05% and 05/02/2006–12/31/2049, respectively.
@ Regulated investment company advised by Investors Bank and Trust Co. ("IBT"). IBT is also the accounting, custody and lending agent for the Fund.
# Aggregate cost for Federal income tax purposes is $210,207. Aggregate gross unrealized appreciation for all securities in which there is an excess of value over tax cost and aggregate gross unrealized depreciation for all securities in which there is an excess of tax cost over value were $38,244 and $4,918, respectively. Net unrealized appreciation for tax purposes is $33,326.
DEFINITIONS:
144A Securities are registered pursuant to Rule 144A of the Securities Act of 1933. These securities are deemed to be liquid for purposes of compliance limitations on holdings of illiquid securities and may be resold as transactions exempt from registration, normally to qualified institutional buyers. At April 30, 2006, these securities aggregated $59,869 or 24.9% of the net assets of the Fund.
The notes to the financial statements are an integral part of this report.
Transamerica IDEX Mutual Funds
Semi-Annual Report 2006
4
TA IDEX Transamerica Convertible Securities
STATEMENT OF ASSETS AND LIABILITIES
At April 30, 2006
(all amounts except per share amounts in thousands)
(unaudited)
| Assets: | |||||||
| Investment securities, at value (cost: $210,172) (including securities loaned of $15,419) | $ | 243,533 | |||||
| Cash | 11,270 | ||||||
| Receivables: | |||||||
| Investment securities sold | 5,614 | ||||||
| Shares of beneficial interest sold | 1,144 | ||||||
| Interest | 653 | ||||||
| Income from loaned securities | 5 | ||||||
| Dividends | 178 | ||||||
| Other | 7 | ||||||
| 262,404 | |||||||
| Liabilities: | |||||||
| Investment securities purchased | 5,716 | ||||||
| Accounts payable and accrued liabilities: | |||||||
| Shares of beneficial interest redeemed | 32 | ||||||
| Management and advisory fees | 140 | ||||||
| Distribution and service fees | 11 | ||||||
| Transfer agent fees | 3 | ||||||
| Administration fees | 4 | ||||||
| Payable for collateral for securities on loan | 15,814 | ||||||
| Other | 34 | ||||||
| 21,754 | |||||||
| Net Assets | $ | 240,650 | |||||
| Net Assets Consist of: | |||||||
| Shares of beneficial interest, unlimited shares authorized, no par value | $ | 192,723 | |||||
| Distributable net investment income (loss) | 262 | ||||||
| Accumulated net realized gain (loss) from investment securities | 14,304 | ||||||
| Net unrealized appreciation (depreciation) on investment securities | 33,361 | ||||||
| Net Assets | $ | 240,650 | |||||
| Net Assets by Class: | |||||||
| Class A | $ | 7,114 | |||||
| Class B | 7,126 | ||||||
| Class C | 3,643 | ||||||
| Class I | 222,767 | ||||||
| Shares Outstanding: | |||||||
| Class A | 540 | ||||||
| Class B | 543 | ||||||
| Class C | 279 | ||||||
| Class I | 16,917 | ||||||
| Net Asset Value Per Share: | |||||||
| Class A | $ | 13.17 | |||||
| Class B | 13.12 | ||||||
| Class C | 13.07 | ||||||
| Class I | 13.17 | ||||||
| Maximum Offering Price Per Share (a): | |||||||
| Class A | $ | 13.83 | |||||
(a) Includes the maximum selling commission (represented as a percentage of offering price) which is reduced on certain levels of sales as set forth in the Prospectus. Net asset value per share for Classes B, C and I shares represents offering price. The redemption price for Classes B and C shares equals net asset value less any applicable contingent deferred sales charge.
STATEMENT OF OPERATIONS
For the period ended April 30, 2006 (b)
(all amounts in thousands)
(unaudited)
| Investment Income: | |||||||
| Interest | $ | 1,565 | |||||
| Dividends | 399 | ||||||
| Income from loaned securities–net | 58 | ||||||
| 2,022 | |||||||
| Expenses: | |||||||
| Management and advisory fees | 792 | ||||||
| Distribution and service fees: | |||||||
| Class A | 42 | ||||||
| Class B | 34 | ||||||
| Class C | 20 | ||||||
| Transfer agent fees: | |||||||
| Class A | 5 | ||||||
| Class B | 6 | ||||||
| Class C | 2 | ||||||
| Class I | – | (c) | |||||
| Printing and shareholder reports | 2 | ||||||
| Custody fees | 14 | ||||||
| Administration fees | 21 | ||||||
| Legal fees | 5 | ||||||
| Audit fees | 9 | ||||||
| Trustees fees | 4 | ||||||
| Registration fees | 31 | ||||||
| Other | 3 | ||||||
| Total expenses | 990 | ||||||
| Net Investment Income (Loss) | 1,032 | ||||||
| Net Realized and Unrealized Gain (Loss) | |||||||
| Realized gain (loss) from investment securities | 14,341 | ||||||
| Increase (decrease) in unrealized appreciation (depreciation) on investment securities | 15,667 | ||||||
| Net Realized and Unrealized Gain (Loss) on Investment Securities | 30,008 | ||||||
| Net Increase (Decrease) in Net Assets Resulting from Operations | $ | 31,040 | |||||
(b) Class I was offered for investment on November 15, 2005.
(c) Rounds to less than $1.
The notes to the financial statements are an integral part of this report.
Transamerica IDEX Mutual Funds
Semi-Annual Report 2006
5
TA IDEX Transamerica Convertible Securities
STATEMENTS OF CHANGES IN NET ASSETS
For the period or year ended
(all amounts in thousands)
| April 30, 2006 (unaudited) (a) | October 31, 2005 | ||||||||||
| Increase (Decrease) in Net Assets From: | |||||||||||
| Operations: | |||||||||||
| Net investment income (loss) | $ | 1,032 | $ | 3,742 | |||||||
| Net realized gain (loss) from investment securities | 14,341 | 2,181 | |||||||||
| Change in unrealized appreciation (depreciation) on investment securities | 15,667 | 12,365 | |||||||||
| 31,040 | 18,288 | ||||||||||
| Distributions to Shareholders: | |||||||||||
| From net investment income: | |||||||||||
| Class A | (40 | ) | (3,735 | ) | |||||||
| Class B | (3 | ) | (60 | ) | |||||||
| Class C | (1 | ) | (50 | ) | |||||||
| Class I | (726 | ) | – | ||||||||
| (770 | ) | (3,845 | ) | ||||||||
| From net realized gains: | |||||||||||
| Class A | (69 | ) | (4,356 | ) | |||||||
| Class B | (74 | ) | (142 | ) | |||||||
| Class C | (51 | ) | (113 | ) | |||||||
| Class I | (1,987 | ) | – | ||||||||
| (2,181 | ) | (4,611 | ) | ||||||||
| Capital Share Transactions: | |||||||||||
| Proceeds from shares sold: | |||||||||||
| Class A | 2,618 | 28,320 | |||||||||
| Class B | 507 | 1,221 | |||||||||
| Class C | 217 | 563 | |||||||||
| Class I | 237,133 | – | |||||||||
| 240,475 | 30,104 | ||||||||||
| Dividends and distributions reinvested: | |||||||||||
| Class A | 88 | 8,026 | |||||||||
| Class B | 61 | 151 | |||||||||
| Class C | 43 | 128 | |||||||||
| Class I | 2,713 | – | |||||||||
| 2,905 | 8,305 | ||||||||||
| Cost of shares redeemed: | |||||||||||
| Class A | (208,368 | ) | (24,313 | ) | |||||||
| Class B | (979 | ) | (1,407 | ) | |||||||
| Class C | (1,626 | ) | (1,658 | ) | |||||||
| Class I | (40,341 | ) | – | ||||||||
| (251,314 | ) | (27,378 | ) | ||||||||
| Automatic conversions: | |||||||||||
| Class A | 2 | 1 | |||||||||
| Class B | (2 | ) | (1 | ) | |||||||
| – | – | ||||||||||
| (7,934 | ) | 11,031 | |||||||||
| Net increase (decrease) in net assets | 20,155 | 20,863 | |||||||||
| Net Assets: | |||||||||||
| Beginning of period | 220,495 | 199,632 | |||||||||
| End of period | $ | 240,650 | $ | 220,495 | |||||||
| Distributable Net Investment Income (Loss) | $ | 262 | $ | – | |||||||
| April 30, 2006 (unaudited) (a) | October 31, 2005 | ||||||||||
| Share Activity: | |||||||||||
| Shares issued: | |||||||||||
| Class A | 210 | 2,466 | |||||||||
| Class B | 41 | 108 | |||||||||
| Class C | 18 | 49 | |||||||||
| Class I | 20,040 | – | |||||||||
| 20,309 | 2,623 | ||||||||||
| Shares issued–reinvested from distributions: | |||||||||||
| Class A | 7 | 697 | |||||||||
| Class B | 5 | 13 | |||||||||
| Class C | 4 | 11 | |||||||||
| Class I | 224 | – | |||||||||
| 240 | 721 | ||||||||||
| Shares redeemed: | |||||||||||
| Class A | (17,789 | ) | (2,139 | ) | |||||||
| Class B | (80 | ) | (124 | ) | |||||||
| Class C | (131 | ) | (147 | ) | |||||||
| Class I | (3,347 | ) | – | ||||||||
| (21,347 | ) | (2,410 | ) | ||||||||
| Net increase (decrease) in shares outstanding: | |||||||||||
| Class A | (17,572 | ) | 1,024 | ||||||||
| Class B | (34 | ) | (3 | ) | |||||||
| Class C | (109 | ) | (87 | ) | |||||||
| Class I | 16,917 | – | |||||||||
| (798 | ) | 934 | |||||||||
(a) Class I was offered for investment on November 15, 2005.
The notes to the financial statements are an integral part of this report.
Transamerica IDEX Mutual Funds
Semi-Annual Report 2006
6
TA IDEX Transamerica Convertible Securities
FINANCIAL HIGHLIGHTS
(unaudited for the period ended April 30, 2006)
| For a share of beneficial interest outstanding throughout each period | |||||||||||||||||||||||||||||||||||||||
| Net Asset | Investment Operations | Distributions | Net Asset | ||||||||||||||||||||||||||||||||||||
| For the Period Ended (d)(g) | Value, Beginning of Period | Net Investment Income (Loss) | Net Realized and Unrealized Gain (Loss) | Total Operations | From Net Investment Income | From Net Realized Gains | Total Distributions | Value, End of Period | |||||||||||||||||||||||||||||||
| Class A | 4/30/2006 | $ | 11.56 | $ | 0.03 | $ | 1.73 | $ | 1.76 | $ | (0.02 | ) | $ | (0.13 | ) | $ | (0.15 | ) | $ | 13.17 | |||||||||||||||||||
| 10/31/2005 | 11.00 | 0.20 | 0.81 | 1.01 | (0.20 | ) | (0.25 | ) | (0.45 | ) | 11.56 | ||||||||||||||||||||||||||||
| 10/31/2004 | 11.32 | 0.21 | 0.56 | 0.77 | (0.22 | ) | (0.87 | ) | (1.09 | ) | 11.00 | ||||||||||||||||||||||||||||
| 10/31/2003 | 9.39 | 0.24 | 1.92 | 2.16 | (0.23 | ) | – | (0.23 | ) | 11.32 | |||||||||||||||||||||||||||||
| 10/31/2002 | 10.00 | 0.14 | (0.67 | ) | (0.53 | ) | (0.08 | ) | – | (0.08 | ) | 9.39 | |||||||||||||||||||||||||||
| Class B | 4/30/2006 | 11.54 | (0.01 | ) | 1.72 | 1.71 | – | (h) | (0.13 | ) | (0.13 | ) | 13.12 | ||||||||||||||||||||||||||
| 10/31/2005 | 11.00 | 0.09 | 0.80 | 0.89 | (0.10 | ) | (0.25 | ) | (0.35 | ) | 11.54 | ||||||||||||||||||||||||||||
| 10/31/2004 | 11.31 | 0.14 | 0.57 | 0.71 | (0.15 | ) | (0.87 | ) | (1.02 | ) | 11.00 | ||||||||||||||||||||||||||||
| 10/31/2003 | 9.38 | 0.17 | 1.93 | 2.10 | (0.17 | ) | – | (0.17 | ) | 11.31 | |||||||||||||||||||||||||||||
| 10/31/2002 | 10.00 | 0.11 | (0.68 | ) | (0.57 | ) | (0.05 | ) | – | (0.05 | ) | 9.38 | |||||||||||||||||||||||||||
| Class C | 4/30/2006 | 11.50 | – | (h) | 1.70 | 1.70 | – | (h) | (0.13 | ) | (0.13 | ) | 13.07 | ||||||||||||||||||||||||||
| 10/31/2005 | 10.97 | 0.08 | 0.82 | 0.90 | (0.12 | ) | (0.25 | ) | (0.37 | ) | 11.50 | ||||||||||||||||||||||||||||
| 10/31/2004 | 11.31 | 0.11 | 0.57 | 0.68 | (0.15 | ) | (0.87 | ) | (1.02 | ) | 10.97 | ||||||||||||||||||||||||||||
| 10/31/2003 | 9.36 | 0.17 | 1.95 | 2.12 | (0.17 | ) | – | (0.17 | ) | 11.31 | |||||||||||||||||||||||||||||
| Class I | 4/30/2006 | 11.71 | 0.06 | 1.58 | 1.64 | (0.05 | ) | (0.13 | ) | (0.18 | ) | 13.17 | |||||||||||||||||||||||||||
| Ratios/Supplemental Data | |||||||||||||||||||||||||||||||
| For the Period | Total | Net Assets, End of Period | Ratio of Expenses to Average Net Assets (a) | Net Investment Income (Loss) to Average | Portfolio Turnover | ||||||||||||||||||||||||||
| Ended (g) | Return (c) | (000's) | Net (e) | Total (f) | Net Assets (a) | Rate (b) | |||||||||||||||||||||||||
| Class A | 4/30/2006 | 15.32 | % | $ | 7,114 | 1.22 | % | 1.22 | % | 0.53 | % | 33 | % | ||||||||||||||||||
| 10/31/2005 | 9.24 | 209,374 | 1.17 | 1.17 | 1.74 | 87 | |||||||||||||||||||||||||
| 10/31/2004 | 7.06 | 188,049 | 1.20 | 1.20 | 1.83 | 157 | |||||||||||||||||||||||||
| 10/31/2003 | 23.49 | 175,175 | 1.33 | 1.33 | 2.27 | 119 | |||||||||||||||||||||||||
| 10/31/2002 | (5.42 | ) | 10,205 | 1.73 | 3.85 | 2.59 | 170 | ||||||||||||||||||||||||
| Class B | 4/30/2006 | 14.86 | 7,126 | 2.01 | 2.01 | (0.10 | ) | 33 | |||||||||||||||||||||||
| 10/31/2005 | 8.09 | 6,656 | 2.15 | 2.15 | 0.76 | 87 | |||||||||||||||||||||||||
| 10/31/2004 | 6.52 | 6,379 | 1.79 | 1.79 | 1.24 | 157 | |||||||||||||||||||||||||
| 10/31/2003 | 22.58 | 6,508 | 1.98 | 1.98 | 1.62 | 119 | |||||||||||||||||||||||||
| 10/31/2002 | (5.68 | ) | 1,138 | 2.38 | 4.50 | 1.94 | 170 | ||||||||||||||||||||||||
| Class C | 4/30/2006 | 14.91 | 3,643 | 1.94 | 1.94 | (0.07 | ) | 33 | |||||||||||||||||||||||
| 10/31/2005 | 8.17 | 4,465 | 2.16 | 2.16 | 0.73 | 87 | |||||||||||||||||||||||||
| 10/31/2004 | 6.33 | 5,204 | 2.05 | 2.05 | 0.98 | 157 | |||||||||||||||||||||||||
| 10/31/2003 | 22.84 | 5,048 | 1.98 | 1.98 | 1.62 | 119 | |||||||||||||||||||||||||
| Class I | 4/30/2006 | 14.02 | 222,767 | 0.83 | 0.83 | 1.10 | 33 | ||||||||||||||||||||||||
The notes to the financial statements are an integral part of this report.
Transamerica IDEX Mutual Funds
Semi-Annual Report 2006
7
TA IDEX Transamerica Convertible Securities
FINANCIAL HIGHLIGHTS (continued)
(unaudited)
NOTES TO FINANCIAL HIGHLIGHTS
(a) Annualized.
(b) Not annualized.
(c) Total Return has been calculated for the applicable period without deduction of a sales load, if any, on an initial purchase. Not annualized.
(d) Per share information is calculated based on average number of shares outstanding.
(e) Ratio of Net Expenses to Average Net Assets is net of fee waivers and reimbursements by the investment adviser, if any (see note 2).
(f) Ratio of Total Expenses to Average Net Assets includes all expenses before fee waivers and reimbursements by the investment adviser.
(g) TA IDEX Transamerica Convertible Securities ("the Fund") commenced operations on March 1, 2002. The inception dates for the Fund's offering of share classes were as follows:
Class C was November 11, 2002.
Class I was November 15, 2005.
(h) Rounds to less than $(0.01).
The notes to the financial statements are an integral part of this report.
Transamerica IDEX Mutual Funds
Semi-Annual Report 2006
8
TA IDEX Transamerica Convertible Securities
NOTES TO FINANCIAL STATEMENTS
At April 30, 2006
(all amounts in thousands)
(unaudited)
NOTE 1. ORGANIZATION AND SIGNIFICANT ACCOUNTING POLICIES
Transamerica IDEX Mutual Funds is an open-end management investment company registered under the Investment Company Act of 1940, as amended (the "1940 Act").
In the normal course of business, TA IDEX Transamerica Convertible Securities (the "Fund") enters into contracts that contain a variety of representations that provide general indemnifications. The Fund's maximum exposure under these arrangements is unknown, as this would involve future claims that may be made against the Fund and/or its affiliates that have not yet occurred. However, based on experience, the Fund expects the risk of loss to be remote.
This report should be read in conjunction with the current Fund prospectus, which contains more complete information about the Fund.
In preparing the Fund's financial statements in accordance with accounting principles generally accepted in the United States of America ("GAAP"), estimates or assumptions (which could differ from actual results) may be used that affect reported amounts and disclosures. The following is a summary of significant accounting policies followed by the Fund.
Multiple class operations, income and expenses: The Fund currently offers four classes of shares, Class A, Class B, Class C and Class I, each with a public offering price that reflects different sales charges, if any, and expense levels. Class I shares commenced operations on November 15, 2005. Class I is only available for investment to certain affiliated asset allocation funds. Class B shares will convert to Class A shares eight years after purchase. Income, non-class specific expenses and realized and unrealized gains and losses, are allocated daily to each class, based upon the value of shares outstanding method as permitted under Rule 18f-3 of the 1940 Act. Each class bears its own specific expenses as well as a portion of general, common expenses.
Security valuations: The Fund values its investments at the close of the New York Stock Exchange ("NYSE"), normally 4 p.m. ET, each day the NYSE is open for business. Fund investments are valued at the last sale price or closing price on the day of valuation taken from the primary exchange where the security is principally traded.
Securities traded in the over-the-counter market and listed securities for which no sale was reported on that date are valued at the last quoted bid price.
Debt securities are valued based on a price quotation or other equivalent indication of value supplied by an exchange, a pricing service or a major market maker; however, those that mature in sixty days or less are valued at amortized cost, which approximates market.
Investment company securities are valued at the net asset value of the underlying portfolio.
Other securities for which quotations are not readily available or whose values have been determined to be unreliable are valued at fair market value as determined in good faith by the Fund's Administrative Valuation Committee, under the supervision of the Board's Valuation Committee, using guidelines adopted by the Board of Trustees.
Cash: The Fund may leave cash overnight in its cash account with the custodian, Investors Bank & Trust Company ("IBT"). IBT has been contracted on behalf of the Fund to invest the excess cash into a savings account, which at April 30, 2006, was paying an interest rate of 3.24%.
Repurchase agreements: The Fund is authorized to enter into repurchase agreements. The Fund, through its custodian, IBT, receives delivery of the underlying securities, the value of which at the time of purchase is required to be an amount equal to at least 100% of the resale price. The Fund will bear the risk of value fluctuations until the security can be sold and may encounter delays and incur costs in liquidating the security. In the event of bankruptcy or insolvency of the seller, delays and costs may be incurred.
Securities lending: The Fund may lend securities to qualified borrowers, with IBT acting as the Fund's lending agent. The Fund earns negotiated lenders' fees. The Fund receives cash and/or securities as collateral against the loaned securities. Cash collateral received is invested in short term, interest bearing securities. The Fund monitors the market value of securities loaned on a daily basis and requires collateral in an amount at least equal to the value of the securities loaned. Income from loaned securities on the Statement of Operations is net of fees, in the amount of $25, earned by IBT for its services.
Security transactions and investment income: Security transactions are recorded on the trade date. Security gains and losses are calculated on the specific identification basis. Dividend income, if any, is recorded on the ex-dividend date or, in the case of foreign securities, as soon as the Fund is informed of the ex-dividend date. Interest income, including accretion of discounts and amortization of premiums, is recorded on the accrual basis commencing on the settlement date.
Redemption fees: A short-term trading redemption fee may be assessed on any Fund shares in a fund account that are sold during the first five (5) NYSE trading days following their purchase date. This redemption fee will equal 2% of the amount redeemed and shares held the longest will be treated as being redeemed first and shares held the shortest as being redeemed last. For the six months ended April 30, 2006, the Fund received less than $1 in redemption fees.
Dividend distributions: Distributions to shareholders are recorded on the ex-dividend date and are determined in accordance with Federal income tax regulations which may differ from GAAP.
Transamerica IDEX Mutual Funds
Semi-Annual Report 2006
9
TA IDEX Transamerica Convertible Securities
NOTES TO FINANCIAL STATEMENTS (continued)
At April 30, 2006
(all amounts in thousands)
(unaudited)
NOTE 2. RELATED PARTY TRANSACTIONS
Transamerica Fund Advisors, Inc. ("TFAI") is the Fund's investment adviser. Transamerica Fund Services, Inc. ("TFS") is the Fund's administrator and transfer agent. AFSG Securities Corp. ("AFSG") is the Fund's distributor/principal underwriter. TFAI, TFS, and AFSG are affiliates of AEGON, NV, a Netherlands corporation.
Transamerica Investment Management, LLC is both an affiliate of the Fund and a sub-adviser to the Fund.
Certain officers and trustees of the Fund are also officers and/or directors of TFAI, TFS and AFSG.
The following schedule represents the percentage of Fund assets owned by affiliated investment companies at April 30, 2006:
| Net Assets | % of Net Assets | ||||||||||
| TA IDEX Asset Allocation – Conservative Portfolio | $ | 19,155 | 7.96 | % | |||||||
| TA IDEX Asset Allocation – Moderate Portfolio | 93,961 | 39.04 | % | ||||||||
| TA IDEX Asset Allocation – Moderate Growth Portfolio | 109,517 | 45.51 | % | ||||||||
| Total | $ | 222,633 | 92.51 | % | |||||||
Investment advisory fees: The Fund pays management fees to TFAI based on average daily net assets ("ANA") at the following breakpoints:
0.75% of the first $250 million of ANA
0.70% of ANA over $250 million
TFAI has contractually agreed to waive its advisory fee and will reimburse the Fund to the extent that operating expenses, excluding 12b-1 fees, exceed the following stated annual limit:
1.35% Expense Limit
If total Fund expenses fall below the annual expense limitation agreement agreed to by the adviser within the succeeding three years, the Fund may be required to pay the adviser a portion or all of the reimbursed class expenses.
There are no amounts available for recapture at April 30, 2006.
Distribution and service fees: The Fund has a 12b-1 distribution plan under the 1940 Act pursuant to which an annual fee, based on average daily net assets, is paid to the distributor for various disbursements such as broker-dealer account servicing fees and other promotional expenses of the Fund. The Fund is authorized under the 12b-1 plan to pay fees on each class up to the following limits:
| Class A | 0.35 | % | |||||
| Class B | 1.00 | % | |||||
| Class C | 1.00 | % | |||||
| Class I | N/A | ||||||
In the case the Fund or a class of shares of the Fund is closed to new investors or investments, the Fund is authorized to pay 12b-1 fees for past sales and distribution efforts and present and past investor services.
Underwriter commissions relate to front-end sales charges imposed for Class A shares and contingent deferred sales charges from Classes B, C, and certain A share redemptions. For the six months ended April 30, 2006, the underwriter commissions were as follows:
| Received by Underwriter | $ | 6 | |||||
| Retained by Underwriter | 1 | ||||||
| Contingent Deferred Sales Charge | 11 | ||||||
Administrative services: The Fund has entered into an agreement with TFS for financial and legal fund administration services. The Fund pays TFS an annual fee of 0.02% of ANA. The Legal fees on the Statement of Operations are fees paid to external legal counsel.
Transfer agent fees: The Fund pays TFS an annual per-account charge for each open and closed account. The Fund paid TFS $13 for the six months ended April 30, 2006.
Deferred compensation plan: Each eligible independent Fund Trustee may elect to participate in a non-qualified deferred compensation plan maintained by Transamerica IDEX Mutual Funds (the "Plan"). Under the Plan, such Trustees may defer payment of all or a portion of their total fees earned as a Fund Trustee. Each Trustee who is a participant in the Plan may elect that the earnings, losses or gains credited to his or her deferred fee amounts be determined based on a deemed investment in any series of Transamerica IDEX Mutual Funds, including the Fund. The right of a participant to receive a distribution from the Plan of the deferred fees is an unsecured claim against the general assets of all series of Transamerica IDEX Mutual Funds. The pro rata liability to the Fund of all deferred fees in the Plan amounted, as of April 30, 2006, to $7.
NOTE 3. INVESTMENT TRANSACTIONS
The cost of securities purchased and proceeds from securities sold (excluding short-term securities) for the six months ended April 30, 2006 were as follows:
| Purchases of securities: | |||||||
| Long-Term | $ | 69,955 | |||||
| U.S. Government | – | ||||||
| Proceeds from maturities and sales of securities: | |||||||
| Long-Term | 89,320 | ||||||
| U.S. Government | – | ||||||
Transamerica IDEX Mutual Funds
Semi-Annual Report 2006
10
TA IDEX Transamerica Convertible Securities
NOTES TO FINANCIAL STATEMENTS (continued)
At April 30, 2006
(all amounts in thousands)
(unaudited)
NOTE 4. FEDERAL INCOME TAX MATTERS
The Fund has not made any provision for federal income or excise taxes due to its policy to distribute all of its taxable income and capital gains to its shareholders and otherwise qualify as a regulated investment company under Subchapter M of the Internal Revenue Code. Income and capital gain distributions are determined in accordance with income tax regulations, which may differ from GAAP. These differences are primarily due to differing treatment for items including, but not limited to, wash sales.
NOTE 5. REGULATORY PROCEEDINGS
There continues to be significant federal and state regulatory activity relating to financial services companies, particularly mutual fund companies and their investment advisers. As part of an ongoing investigation regarding potential market timing, recordkeeping and trading compliance issues and matters affecting the Fund's investment adviser, TFAI, and certain affiliates and former employees of TFAI, the SEC staff has indicated that it is likely to take some action against TFAI and certain of its affiliates at the conclusion of the investigation. The potential timing and the scope of any such action is difficult to predict. Although the impact of any action brought against TFAI and/or its affiliates is difficult to assess at the present time, the Fund currently believes that the likelihood that any such action will have a material adverse impact on it is remote. It is important to note that the Fund is not aware of any allega tion of wrongdoing against it and its Board at the time this semi-annual report is printed. Although it is not anticipated that these developments will have an adverse impact on the Fund, there can be no assurance at this time. TFAI and its affiliates are actively working with the SEC in regard to this matter; however, the exact resolution cannot be determined at this time. TFAI will take such actions that it deems necessary or appropriate to continue providing management services to the Fund and to bring all matters to an appropriate conclusion.
TFAI and/or its affiliates, and not the Fund, will bear the costs regarding these regulatory matters.
Transamerica IDEX Mutual Funds
Semi-Annual Report 2006
11
TA IDEX Transamerica Convertible Securities
INVESTMENT ADVISORY AND SUB-ADVISORY AGREEMENTS – REVIEW AND RENEWAL (unaudited)
At a meeting of the Board of Trustees of Transamerica IDEX Mutual Funds ("TA IDEX") held on November 2, 2005, the Board reviewed and considered the Investment Advisory Agreement between TA IDEX Transamerica Convertible Securities (the "Fund") and Transamerica Fund Advisors, Inc. ("TFAI"), as well as the Investment Sub-Advisory Agreement of the Fund between TFAI and Transamerica Investment Management, LLC (the "Sub-Adviser"), to determine whether the agreements should be renewed for a one-year period. Following their review and consideration, the Trustees determined that the Investment Advisory Agreement and the Investment Sub-Advisory Agreement will enable shareholders of the Fund to obtain high quality services at a cost that is appropriate, reasonable, and in the best interests of its shareholders. The Board, including the independent members of the Board, unanimously approved the renewal of the Investment Advisory Agreement a nd the Investment Sub-Advisory Agreement. In reaching their decision, the Trustees requested and obtained from TFAI and the Sub-Adviser such information as they deemed reasonably necessary to evaluate the proposed agreements. The Trustees also carefully considered the information that they had received throughout the year from TFAI and the Sub-Adviser (such as in-person presentations by the Sub-Adviser) as part of their regular oversight of the Fund, as well as: comparative fee, expense and performance information prepared by Lipper Inc. ("Lipper"), independent providers of mutual fund performance, fee and expense information, and profitability data. In considering the proposed continuation of the Investment Advisory Agreement and the Investment Sub-Advisory Agreement, the Trustees evaluated a number of considerations that they believe, in light of the legal advice furnished to them by TA IDEX counsel and independent legal counsel and their own business judgment, to be relevant. They based their decisions on the following considerations, among others, although they did not identify any consideration or particular information that was controlling of their decisions:
The nature, extent and quality of the advisory service to be provided. The Board considered the nature and quality of the services provided by TFAI and the Sub-Adviser to the Fund in the past, as well as the services anticipated to be provided in the future. The Board concluded that TFAI and the Sub-Adviser are capable of providing high quality services to the Fund, as indicated by the nature and quality of services provided in the past, TFAI's and the Sub-Adviser's management capabilities demonstrated with respect to the funds they manage, including the Fund, and the experience, capability and integrity of TFAI's senior management, the financial resources of TFAI and the Sub-Adviser, TFAI's management oversight process, and the professional qualifications and experience of the Sub-Adviser's portfolio management team. The Trustees also concluded that TFAI and the Sub-Adviser proposed to provide investment and related services that were of the same quality and quantity as services provided to the Fund in the past, and that these services are appropriate in scope and extent in light of the Fund's operations, the competitive landscape of the investment company business and investor needs, and that TFAI's and the Sub-Adviser's obligations will remain substantially the same.
The investment performance of the Fund. The Board examined both the short-term and longer-term performance of the Fund, including relative performance against a benchmark securities index and a peer group of comparable mutual funds as prepared by Lipper, for various trailing periods ended June 30, 2005. The Trustees concluded that TFAI and the Sub-Adviser generally had achieved competitive investment performance, noting that although the performance of the Fund was below median relative to its peers over the three-year period, its performance has been above median relative to its peers over the past one- and two-year periods and superior to or competitive with the benchmark index. On the basis of the Trustees' assessment of the nature, extent and quality of advisory services to be provided or procured by TFAI and the Sub-Adviser, the Trustees conclude d that TFAI and the Sub-Adviser are capable of generating a level of investment performance that is appropriate in light of the Fund's investment objective, policies and strategies and competitive with many other investment companies, and also determined that TFAI's and the Sub-Adviser's performance records indicate that their continued management is likely to benefit the Fund and its shareholders.
The cost of advisory services provided and the level of profitability. The Board reviewed profitability information regarding TFAI's costs of procuring portfolio management services, as well as the costs of provision of administration, transfer agency, fund accounting and other services, to the Fund and to TA IDEX as a whole by TFAI and its affiliates. The Trustees reviewed data from Lipper that compared the Fund's management fees (including management fees at various asset levels), other fees and expenses (including total expenses including and excluding 12b-1 distribution and service fees) and portfolio turnover rate against a peer group of comparable mutual funds. Based on such information, the Trustees determined that the management fees and overall expense ratio of the Fund generally are consistent with industry averages. In addition, on the basi s of the Board's review of the management fees to be charged by TFAI for investment advisory and related services, TFAI profitability information (derived from TFAI's audited financial statements), TFAI's estimated management income resulting from its management of the Fund, the estimated margin of the Sub-Adviser, as well as the entirety of TFAI's and its affiliates' service relationship with TA IDEX, the Board concluded that the level of investment management fees and other service fees, as well as TFAI's and the Sub-Adviser's profitability, are appropriate in light of the services provided, the management fees and overall expense ratios of comparable investment companies and the anticipated profitability of the relationship between the Fund, TFAI and its affiliates, and the Sub-Adviser.
Transamerica IDEX Mutual Funds
Semi-Annual Report 2006
12
TA IDEX Transamerica Convertible Securities (continued)
Whether fee levels reflect economies of scale and the extent to which economies of scale would be realized as the Fund grows. The Board concluded that the inclusion of asset-based breakpoints in the Fund's advisory fee schedule appropriately benefits investors by realizing economies of scale in the form of lower management fees as the level of assets grows. In addition, the Board concluded that the Fund's management fees appropriately reflect the Fund's current size, the current economic environment for TFAI, the competitive nature of the investment company market, and TFAI's pricing strategy. The Trustees also concluded that they will have the opportunity to periodically reexamine whether the Fund has achieved economies of scale, and the appropriateness of management fees payable to TFAI and fees payable by TFAI to the Sub-Adviser, in the future.
Benefits (such as soft dollars) to TFAI, its affiliates, or the Sub-Adviser from their relationship with the Fund. The Board concluded that other benefits derived by TFAI, its affiliates, and the Sub-Adviser from their relationship with the Fund are reasonable and fair, and are consistent with industry practice and the best interests of the Fund and its shareholders. In this regard, the Board noted that neither TFAI nor the Sub-Adviser realizes "soft dollar" benefits from its relationship with the Fund. In addition, the Trustees determined that the administration, transfer agency, fund accounting and other fees paid by the Fund to affiliates of TFAI are reasonable, fair and in the best interests of shareholders in light of the nature and quality of the services provided, the associated costs to these affiliates of providing the services, the impact of the costs of such services on the Fund's overall operating expenses, and the necessity of the services for the Fund's operations.
Other considerations. The Board determined that TFAI had made a substantial commitment to the recruitment and retention of high quality personnel, and maintained the financial, compliance and operational resources reasonably necessary to manage the Fund in a professional manner that is consistent with the best interests of the Fund and its shareholders. In this regard, the Trustees favorably considered the procedures and policies in place by TFAI to enforce compliance with applicable laws and regulations and oversee the portfolio management activities of the Sub-Adviser. The Trustees also determined that TFAI had made a significant entrepreneurial commitment to the management and success of the Fund, reflected by TFAI's expense limitation and fee waiver arrangement with the Fund, which may result in TFAI waiving advisory fees for the benefit of shareh olders.
Transamerica IDEX Mutual Funds
Semi-Annual Report 2006
13
TA IDEX Transamerica Equity
UNDERSTANDING YOUR FUND'S EXPENSES
(unaudited)
SHAREHOLDER EXPENSES
Fund shareholders may incur two types of costs: (1) transaction costs, including sales charges (loads) on purchases, contingent deferred sales charges on redemptions and redemption fees; and (2) ongoing costs, including management fees, 12b-1 distribution and service fees, and other fund expenses.
The following Example is intended to help you understand your ongoing costs (in dollars and cents) of investing in the Fund and to compare these costs with the ongoing costs of investing in other funds.
The Example is based on an investment of $1,000 invested at November 1, 2005 and held for the entire period until April 30, 2006.
ACTUAL EXPENSES
The first line in the table below provides information about actual account values and actual expenses. You may use the information in this line, together with the amount you invested, to estimate the expenses that you paid over the period. Simply divide your account value by $1,000 (for example, an $8,600 account value divided by $1,000 = 8.6), then multiply the result by the number in the first line of your Fund under the heading entitled "Expenses Paid During Period" to estimate the expenses you paid on your account during this period. If your account is an IRA, your expenses could have included a $15 annual fee. The amount of any fee paid through your account would increase the estimate of expenses you paid during the period and decrease your ending account value.
HYPOTHETICAL EXAMPLE FOR COMPARISON PURPOSES
The second line in the table below provides information about hypothetical account values and hypothetical expenses based on the Fund's actual expense ratio and an assumed rate of return of 5% per year before expenses, which is not the Fund's actual return. The hypothetical account values and expenses may not be used to estimate the actual ending account balance or expenses you paid for the period. You may use this information to compare the ongoing costs of investing in your Fund and other funds. To do so, compare this 5% hypothetical example with the 5% hypothetical examples that appear in the shareholder reports of the other funds. As in the case of the actual expense example, if your account is subject to an IRA fee, the amount of the fee paid through your account would increase the hypothetical expenses you would have paid during the period and decrease the hypothetical ending account value.
Please note that the expenses shown in the table are meant to highlight your ongoing costs only and do not reflect any transactional costs, such as sales charges, redemption fees, brokerage commissions paid on purchases and sales of fund shares. Therefore, the second line under the Fund in the table is useful in comparing ongoing costs only, and will not help you determine the relative total costs of owning different funds. If any of these transaction costs were included, your costs would be higher. The expenses shown in the table do not reflect any fees that may be charged to you by brokers, financial intermediaries or other financial institutions.
| Beginning Account Value | Ending Account Value | Annualized Expense Ratio | Expenses Paid During Period (a) | ||||||||||||||||
| Class A | |||||||||||||||||||
| Actual | $ | 1,000.00 | $ | 1,118.30 | 1.52 | % | $ | 7.98 | |||||||||||
| Hypothetical (b) | 1,000.00 | 1,017.26 | 1.52 | 7.60 | |||||||||||||||
| Class B | |||||||||||||||||||
| Actual | 1,000.00 | 1,115.30 | 2.17 | 11.38 | |||||||||||||||
| Hypothetical (b) | 1,000.00 | 1,014.03 | 2.17 | 10.84 | |||||||||||||||
| Class C | |||||||||||||||||||
| Actual | 1,000.00 | 1,114.00 | 2.16 | 11.32 | |||||||||||||||
| Hypothetical (b) | 1,000.00 | 1,014.08 | 2.16 | 10.79 | |||||||||||||||
| Class I | |||||||||||||||||||
| Actual | 1,000.00 | 1,085.00 | 0.81 | 3.84 | |||||||||||||||
| Hypothetical (b) | 1,000.00 | 1,019.06 | 0.81 | 3.72 | |||||||||||||||
(a) Expenses are calculated using the Fund's annualized expense ratio (as disclosed in the table), multiplied by the average account value for the period, multiplied by number of days in the period (181 days for Classes A, B and C, and 166 days for Class I), and divided by the number of days in the year (365 days).
(b) 5% return per year before expenses.
GRAPHICAL PRESENTATION OF SCHEDULE OF INVESTMENTS
By Sector
At April 30, 2006
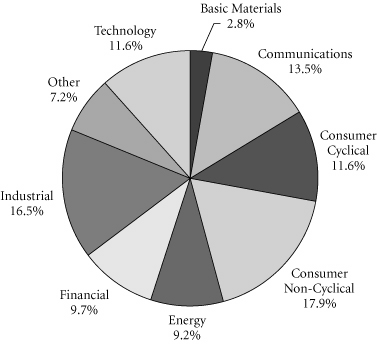
This chart shows the percentage breakdown by sector of the Fund's total investment securities.
Transamerica IDEX Mutual Funds
Semi-Annual Report 2006
1
TA IDEX Transamerica Equity
SCHEDULE OF INVESTMENTS
At April 30, 2006
(all amounts except share amounts in thousands)
(unaudited)
| Shares | Value | ||||||||||
| COMMON STOCKS (96.2%) | |||||||||||
| Business Services (4.2%) | |||||||||||
| eBay, Inc. ‡ | 440,000 | $ | 15,140 | ||||||||
| Moody's Corp. | 220,000 | 13,642 | |||||||||
| Chemicals & Allied Products (5.6%) | |||||||||||
| Praxair, Inc. | 350,000 | 19,646 | |||||||||
| Procter & Gamble Co. | 320,000 | 18,627 | |||||||||
| Communication (1.4%) | |||||||||||
| XM Satellite Radio Holdings, Inc.–Class A ‡† | 480,000 | 9,706 | |||||||||
| Communications Equipment (5.3%) | |||||||||||
| QUALCOMM, Inc. | 700,000 | 35,938 | |||||||||
| Computer & Data Processing Services (6.1%) | |||||||||||
| Intuit, Inc. ‡ | 370,000 | 20,043 | |||||||||
| Microsoft Corp. | 900,000 | 21,735 | |||||||||
| Computer & Office Equipment (5.9%) | |||||||||||
| Apple Computer, Inc. ‡ | 270,000 | 19,005 | |||||||||
| Sandisk Corp. ‡† | 335,000 | 21,383 | |||||||||
| Drug Stores & Proprietary Stores (2.6%) | |||||||||||
| Walgreen Co. | 430,000 | 18,030 | |||||||||
| Electronic & Other Electric Equipment (2.4%) | |||||||||||
| General Electric Co. | 475,000 | 16,430 | |||||||||
| Engineering & Management Services (3.3%) | |||||||||||
| Jacobs Engineering Group, Inc. ‡ | 270,000 | 22,329 | |||||||||
| Hotels & Other Lodging Places (6.2%) | |||||||||||
| Marriott International, Inc.–Class A | 300,000 | 21,921 | |||||||||
| MGM Mirage, Inc. ‡ | 450,000 | 20,205 | |||||||||
| Industrial Machinery & Equipment (3.9%) | |||||||||||
| Caterpillar, Inc. | 350,000 | 26,509 | |||||||||
| Insurance (2.9%) | |||||||||||
| WellPoint, Inc. ‡ | 275,000 | 19,525 | |||||||||
| Management Services (2.4%) | |||||||||||
| Paychex, Inc. | 400,000 | 16,156 | |||||||||
| Medical Instruments & Supplies (2.3%) | |||||||||||
| Zimmer Holdings, Inc. ‡ | 250,000 | 15,725 | |||||||||
| Oil & Gas Extraction (6.4%) | |||||||||||
| Anadarko Petroleum Corp. | 150,000 | 15,723 | |||||||||
| Schlumberger, Ltd. | 400,000 | 27,656 | |||||||||
| Petroleum Refining (3.1%) | |||||||||||
| Suncor Energy, Inc. | 250,000 | 21,435 | |||||||||
| Pharmaceuticals (6.3%) | |||||||||||
| Allergan, Inc. † | 200,000 | 20,544 | |||||||||
| Genentech, Inc. ‡ | 280,000 | 22,319 | |||||||||
| Shares | Value | ||||||||||
| Printing & Publishing (3.4%) | |||||||||||
| McGraw-Hill Cos., Inc. (The) | 420,000 | $ | 23,377 | ||||||||
| Retail Trade (3.2%) | |||||||||||
| Staples, Inc. | 820,000 | 21,656 | |||||||||
| Security & Commodity Brokers (10.1%) | |||||||||||
| American Express Co. | 400,000 | 21,524 | |||||||||
| Ameriprise Financial, Inc. | 350,000 | 17,164 | |||||||||
| Chicago Mercantile Exchange † | 65,000 | 29,770 | |||||||||
| Telecommunications (1.6%) | |||||||||||
| Sprint Nextel Corp. | 440,000 | 10,912 | |||||||||
| Transportation & Public Utilities (3.5%) | |||||||||||
| Expeditors International of Washington, Inc. | 280,000 | 23,971 | |||||||||
| Trucking & Warehousing (4.1%) | |||||||||||
| United Parcel Service, Inc.–Class B † | 340,000 | 27,564 | |||||||||
| Total Common Stocks (cost: $529,543) | 655,310 | ||||||||||
| Principal | Value | ||||||||||
| SECURITY LENDING COLLATERAL (7.5%) | |||||||||||
| Debt (7.0%) | |||||||||||
| Bank Notes (0.8%) | |||||||||||
| Bank of America | |||||||||||
| 4.81%, due 06/07/2006 * | $ | 1,670 | $ | 1,670 | |||||||
| 4.81%, due 08/10/2006 * | 1,612 | 1,612 | |||||||||
| Bear Stearns & Co. 5.01%, due 06/06/2006 * 5.01%, due 09/07/2006 * | 645 1,934 | 645 1,934 | |||||||||
| Certificates Of Deposit (0.5%) | |||||||||||
| Halifax Bank of Scotland 4.78%, due 06/06/2006 * | 1,612 | 1,612 | |||||||||
| Rabobank Nederland 4.87%, due 05/31/2006 * | 1,612 | 1,612 | |||||||||
| Commercial Paper (0.4%) | |||||||||||
| Banco Santander Central Hispano SA 4.77%, due 05/02/2006 | 967 | 967 | |||||||||
| Sheffield Receivables Corp.–144A 4.81%, due 05/03/2006 | 1,609 | 1,609 | |||||||||
| Euro Dollar Overnight (1.3%) Bank of Montreal 4.77%, due 05/02/2006 | 1,289 | 1,289 | |||||||||
| Dexia Group 4.78%, due 05/04/2006 | 1,612 | 1,612 | |||||||||
| Fortis Bank 4.77%, due 05/01/2006 | 645 | 645 | |||||||||
| Royal Bank of Canada 4.77%, due 05/01/2006 | 2,256 | 2,256 | |||||||||
The notes to the financial statements are an integral part of this report.
Transamerica IDEX Mutual Funds
Semi-Annual Report 2006
2
TA IDEX Transamerica Equity
SCHEDULE OF INVESTMENTS (continued)
At April 30, 2006
(all amounts except share amounts in thousands)
(unaudited)
| Principal | Value | ||||||||||
| Commercial Paper (continued) | |||||||||||
| Royal Bank of Scotland | |||||||||||
| 4.75%, due 05/03/2006 | $ | 1,612 | $ | 1,612 | |||||||
| Svenska Handlesbanken 4.82%, due 05/01/2006 | 1,231 | 1,231 | |||||||||
| Euro Dollar Terms (1.9%) | |||||||||||
| BancoBilbao Vizcaya Argentaria SA 4.95%, due 06/20/2006 | 1,289 | 1,289 | |||||||||
| Bank of the West 4.94%, due 06/16/2006 | 1,289 | 1,289 | |||||||||
| Barclays 4.79%, due 05/10/2006 4.77%, due 05/16/2006 | 1,934 645 | 1,934 645 | |||||||||
| Canadian Imperial Bank of Commerce 4.97%, due 06/23/2006 | 967 | 967 | |||||||||
| Credit Suisse First Boston Corp. 4.73%, due 05/08/2006 | 967 | 967 | |||||||||
| Fortis Bank 4.83%, due 05/08/2006 | 645 | 645 | |||||||||
| Lloyds TSB Bank 4.81%, due 05/11/2006 | 967 | 967 | |||||||||
| Royal Bank of Scotland 4.87%, due 05/12/2006 | 1,289 | 1,289 | |||||||||
| Societe Generale 4.79%, due 05/10/2006 | 1,612 | 1,612 | |||||||||
| UBS AG 4.95%, due 06/20/2006 | 1,612 | 1,612 | |||||||||
| Principal | Value | ||||||||||
| Repurchase Agreements (2.1%) †† | |||||||||||
| Credit Suisse First Boston Corp. | |||||||||||
| 4.92%, dated 04/28/2006 to be repurchased | |||||||||||
| at $2,190 on 05/01/2006 | $ | 2,188 | $ | 2,188 | |||||||
| Goldman Sachs Group, Inc. (The) 4.92%, dated 04/28/2006 to be repurchased at $4,737 on 05/01/2006 | 4,735 | 4,735 | |||||||||
| Lehman Brothers, Inc. 4.92%, dated 04/28/2006 to be repurchased at $80 on 05/01/2006 | 80 | 80 | |||||||||
| Merrill Lynch & Co. 4.87%, dated 04/28/2006 to be repurchased at $4,837 on 05/01/2006 | 4,835 | 4,835 | |||||||||
| Morgan Stanley Dean Witter & Co. 4.93%, dated 04/28/2006 to be repurchased at $2,257 on 05/01/2006 | 2,256 | 2,256 | |||||||||
| Shares | Value | ||||||||||
| Investment Companies (0.5%) | |||||||||||
| Barclays Global Investors Institutional Money Market Fund 1-day yield of 4.78% | 2,578,693 | $ | 2,579 | ||||||||
| Merrimac Cash Fund, Premium Class 1-day yield of 4.61% @ | 686,102 | 686 | |||||||||
| Total Security Lending Collateral (cost: $50,881) | 50,881 | ||||||||||
| Total Investment Securities (cost: $580,424) # | $ | 706,191 | |||||||||
NOTES TO SCHEDULE OF INVESTMENTS:
‡ Non-income producing.
† At April 30, 2006, all or a portion of this security is on loan (see Note 1). The value at April 30, 2006, of all securities on loan is $49,385.
* Floating or variable rate note. Rate is listed as of April 30, 2006.
†† Cash collateral for the Repurchase Agreements, valued at $14,510, that serve as collateral for securities lending are invested in corporate bonds with interest rates and maturity dates ranging from 0.00%–9.05% and 05/02/2006–12/31/2049, respectively.
@ Regulated investment company advised by Investors Bank and Trust Co. ("IBT"). IBT is also the accounting, custody and lending agent for the Fund.
# Aggregate cost for Federal income tax purposes is $580,404. Aggregate gross unrealized appreciation for all securities in which there is an excess of value over tax cost and aggregate gross unrealized depreciation for all securities in which there is an excess of tax cost over value were $136,899 and $11,112, respectively. Net unrealized appreciation for tax purposes is $125,787.
DEFINITIONS:
144A 144A Securities are registered pursuant to Rule 144A of the Securities Act of 1933. These securities are deemed to be liquid for purposes of compliance limitations on holdings of illiquid securities and may be resold as transactions exempt from registration, normally to qualified institutional buyers. At April 30, 2006, these securities aggregated $1,609 or 0.2% of the net assets of the Fund.
The notes to the financial statements are an integral part of this report.
Transamerica IDEX Mutual Funds
Semi-Annual Report 2006
3
TA IDEX Transamerica Equity
STATEMENT OF ASSETS AND LIABILITIES
At April 30, 2006
(all amounts except per share amounts in thousands)
(unaudited)
| Assets: | |||||||
| Investment securities, at value (cost: $580,424) (including securities loaned of $49,385) | $ | 706,191 | |||||
| Cash | 24,475 | ||||||
| Receivables: | |||||||
| Shares of beneficial interest sold | 1,515 | ||||||
| Interest | 45 | ||||||
| Dividends | 330 | ||||||
| Other | 28 | ||||||
| 732,584 | |||||||
| Liabilities: | |||||||
| Accounts payable and accrued liabilities: | |||||||
| Shares of beneficial interest redeemed | 331 | ||||||
| Management and advisory fees | 404 | ||||||
| Distribution and service fees | 93 | ||||||
| Transfer agent fees | 101 | ||||||
| Administration fees | 11 | ||||||
| Payable for collateral for securities on loan | 50,881 | ||||||
| Other | 82 | ||||||
| 51,903 | |||||||
| Net Assets | $ | 680,681 | |||||
| Net Assets Consist of: | |||||||
| Shares of beneficial interest, unlimited shares authorized, no par value | $ | 669,138 | |||||
| Distributable net investment income (loss) | (826 | ) | |||||
| Accumulated net realized gain (loss) from investment securities | (113,397 | ) | |||||
| Net unrealized appreciation (depreciation) on investment securities | 125,766 | ||||||
| Net Assets | $ | 680,681 | |||||
| Net Assets by Class: | |||||||
| Class A | $ | 86,366 | |||||
| Class B | 54,678 | ||||||
| Class C | 26,775 | ||||||
| Class I | 512,862 | ||||||
| Shares Outstanding: | |||||||
| Class A | 8,780 | ||||||
| Class B | 5,826 | ||||||
| Class C | 2,850 | ||||||
| Class I | 51,972 | ||||||
| Net Asset Value Per Share: | |||||||
| Class A | $ | 9.84 | |||||
| Class B | 9.39 | ||||||
| Class C | 9.39 | ||||||
| Class I | 9.87 | ||||||
| Maximum Offering Price Per Share (a): | |||||||
| Class A | $ | 10.41 | |||||
(a) Includes the maximum selling commission (represented as a percentage of offering price) which is reduced on certain levels of sales as set forth in the Prospectus. Net asset value per share for Classes B, C and I shares represents offering price. The redemption price for Classes B and C shares equals net asset value less any applicable contingent deferred sales charge.
STATEMENT OF OPERATIONS
For the period ended April 30, 2006 (b)
(all amounts in thousands)
(unaudited)
| Investment Income: | |||||||
| Dividends (net of withholding taxes on foreign dividends of $3) | $ | 2,126 | |||||
| Interest | 279 | ||||||
| Income from loaned securities–net | 19 | ||||||
| 2,424 | |||||||
| Expenses: | |||||||
| Management and advisory fees | 2,177 | ||||||
| Distribution and service fees: | |||||||
| Class A | 175 | ||||||
| Class B | 267 | ||||||
| Class C | 129 | ||||||
| Transfer agent fees: | |||||||
| Class A | 185 | ||||||
| Class B | 164 | ||||||
| Class C | 46 | ||||||
| Class I | – | (c) | |||||
| Printing and shareholder reports | 54 | ||||||
| Custody fees | 22 | ||||||
| Administration fees | 59 | ||||||
| Legal fees | 12 | ||||||
| Audit fees | 9 | ||||||
| Trustees fees | 10 | ||||||
| Registration fees | 32 | ||||||
| Other | 6 | ||||||
| Total expenses | 3,347 | ||||||
| Less: | |||||||
| Reimbursement of class expenses: | |||||||
| Class A | (8 | ) | |||||
| Class B | (67 | ) | |||||
| Total reimbursed expenses | (75 | ) | |||||
| Net expenses | 3,272 | ||||||
| Net Investment Income (Loss) | (848 | ) | |||||
| Net Realized and Unrealized Gain (Loss): | |||||||
| Realized gain (loss) from investment securities | 3,349 | ||||||
| Increase (decrease) in unrealized appreciation (depreciation) on investment securities | 55,941 | ||||||
| Net Realized and Unrealized Gain (Loss) on Investment Securities | 59,290 | ||||||
| Net Increase (Decrease) in Net Assets Resulting from Operations | $ | 58,442 | |||||
(b) Class I was offered for investment on November 15, 2005.
(c) Rounds to less than $1.
The notes to the financial statements are an integral part of this report.
Transamerica IDEX Mutual Funds
Semi-Annual Report 2006
4
TA IDEX Transamerica Equity
STATEMENTS OF CHANGES IN NET ASSETS
For the period or year ended
(all amounts in thousands)
| April 30, 2006 (unaudited) (a) | October 31, 2005 | ||||||||||
| Increase (Decrease) In Net Assets From: | |||||||||||
| Operations: | |||||||||||
| Net investment income (loss) | $ | (848 | ) | $ | (1,350 | ) | |||||
| Net realized gain (loss) from investment securities | 3,349 | 12,626 | |||||||||
| Change in unrealized appreciation (depreciation) on investment securities | 55,941 | 45,449 | |||||||||
| 58,442 | 56,725 | ||||||||||
| Distributions to Shareholders: | |||||||||||
| From net realized gains: | |||||||||||
| Class A | (623 | ) | (3,512 | ) | |||||||
| Class B | (446 | ) | (861 | ) | |||||||
| Class C | (214 | ) | (391 | ) | |||||||
| Class I | (3,129 | ) | – | ||||||||
| (4,412 | ) | (4,764 | ) | ||||||||
| Capital Share Transactions: | |||||||||||
| Proceeds from shares sold: | |||||||||||
| Class A | 26,209 | 100,539 | |||||||||
| Class B | 5,886 | 5,207 | |||||||||
| Class C | 3,548 | 3,999 | |||||||||
| Class I | 479,445 | – | |||||||||
| 515,088 | 109,745 | ||||||||||
| Dividends and distributions reinvested: | |||||||||||
| Class A | 613 | 3,494 | |||||||||
| Class B | 434 | 840 | |||||||||
| Class C | 198 | 363 | |||||||||
| Class I | 3,129 | – | |||||||||
| 4,374 | 4,697 | ||||||||||
| Cost of shares redeemed: | |||||||||||
| Class A | (258,638 | ) | (20,013 | ) | |||||||
| Class B | (6,178 | ) | (11,503 | ) | |||||||
| Class C | (3,151 | ) | (6,318 | ) | |||||||
| (267,967 | ) | (37,834 | ) | ||||||||
| Automatic conversions: | |||||||||||
| Class A | 594 | 644 | |||||||||
| Class B | (594 | ) | (644 | ) | |||||||
| – | – | ||||||||||
| 251,495 | 76,608 | ||||||||||
| Net increase (decrease) in net assets | 305,525 | 128,569 | |||||||||
| Net Assets: | |||||||||||
| Beginning of period | 375,156 | 246,587 | |||||||||
| End of period | $ | 680,681 | $ | 375,156 | |||||||
| Distributable Net Investment Income (Loss) | $ | (826 | ) | $ | 22 | ||||||
| April 30, 2006 (unaudited) (a) | October 31, 2005 | ||||||||||
| Share Activity: | |||||||||||
| Shares issued: | |||||||||||
| Class A | 2,781 | 12,215 | |||||||||
| Class B | 644 | 665 | |||||||||
| Class C | 389 | 517 | |||||||||
| Class I | 51,640 | – | |||||||||
| 55,454 | 13,397 | ||||||||||
| Shares issued–reinvested from distributions: | |||||||||||
| Class A | 65 | 434 | |||||||||
| Class B | 48 | 108 | |||||||||
| Class C | 22 | 46 | |||||||||
| Class I | 332 | – | |||||||||
| 467 | 588 | ||||||||||
| Shares redeemed: | |||||||||||
| Class A | (28,141 | ) | (2,485 | ) | |||||||
| Class B | (674 | ) | (1,484 | ) | |||||||
| Class C | (344 | ) | (811 | ) | |||||||
| (29,159 | ) | (4,780 | ) | ||||||||
| Automatic conversions: | |||||||||||
| Class A | 62 | 80 | |||||||||
| Class B | (65 | ) | (83 | ) | |||||||
| (3 | ) | (3 | ) | ||||||||
| Net increase (decrease) in shares outstanding: | |||||||||||
| Class A | (25,233 | ) | 10,244 | ||||||||
| Class B | (47 | ) | (794 | ) | |||||||
| Class C | 67 | (248 | ) | ||||||||
| Class I | 51,972 | – | |||||||||
| 26,759 | 9,202 | ||||||||||
(a) Class I was offered for investment on November 15, 2005.
The notes to the financial statements are an integral part of this report.
Transamerica IDEX Mutual Funds
Semi-Annual Report 2006
5
TA IDEX Transamerica Equity
FINANCIAL HIGHLIGHTS
(unaudited for the period ended April 30, 2006)
| For a share of beneficial interest outstanding throughout each period | |||||||||||||||||||||||||||||||||||||||
| Net Asset | Investment Operations | Distributions | Net Asset | ||||||||||||||||||||||||||||||||||||
| For the Period Ended (d)(g) | Value, Beginning of Period | Net Investment Income (Loss) | Net Realized and Unrealized Gain (Loss) | Total Operations | From Net Investment Income | From Net Realized Gains | Total Distributions | Value, End of Period | |||||||||||||||||||||||||||||||
| Class A | 4/30/2006 | $ | 8.87 | $ | (0.03 | ) | $ | 1.08 | $ | 1.05 | $ | – | $ | (0.08 | ) | $ | (0.08 | ) | $ | 9.84 | |||||||||||||||||||
| 10/31/2005 | 7.44 | (0.02 | ) | 1.58 | 1.56 | – | (0.13 | ) | (0.13 | ) | 8.87 | ||||||||||||||||||||||||||||
| 10/31/2004 | 6.86 | (0.07 | ) | 0.65 | 0.58 | – | – | – | 7.44 | ||||||||||||||||||||||||||||||
| 10/31/2003 | 5.52 | (0.05 | ) | 1.39 | 1.34 | – | – | – | 6.86 | ||||||||||||||||||||||||||||||
| 10/31/2002 | 6.38 | (0.07 | ) | (0.79 | ) | (0.86 | ) | – | – | – | 5.52 | ||||||||||||||||||||||||||||
| 10/31/2001 | 10.16 | (0.10 | ) | (3.68 | ) | (3.78 | ) | – | – | – | 6.38 | ||||||||||||||||||||||||||||
| Class B | 4/30/2006 | 8.49 | (0.06 | ) | 1.04 | 0.98 | – | (0.08 | ) | (0.08 | ) | 9.39 | |||||||||||||||||||||||||||
| 10/31/2005 | 7.19 | (0.08 | ) | 1.51 | 1.43 | – | (0.13 | ) | (0.13 | ) | 8.49 | ||||||||||||||||||||||||||||
| 10/31/2004 | 6.68 | (0.11 | ) | 0.62 | 0.51 | – | – | – | 7.19 | ||||||||||||||||||||||||||||||
| 10/31/2003 | 5.40 | (0.09 | ) | 1.37 | 1.28 | – | – | – | 6.68 | ||||||||||||||||||||||||||||||
| 10/31/2002 | 6.29 | (0.12 | ) | (0.77 | ) | (0.89 | ) | – | – | – | 5.40 | ||||||||||||||||||||||||||||
| 10/31/2001 | 10.12 | (0.16 | ) | (3.67 | ) | (3.83 | ) | – | – | – | 6.29 | ||||||||||||||||||||||||||||
| Class C | 4/30/2006 | 8.50 | (0.06 | ) | 1.03 | 0.97 | – | (0.08 | ) | (0.08 | ) | 9.39 | |||||||||||||||||||||||||||
| 10/31/2005 | 7.20 | (0.08 | ) | 1.51 | 1.43 | – | (0.13 | ) | (0.13 | ) | 8.50 | ||||||||||||||||||||||||||||
| 10/31/2004 | 6.68 | (0.11 | ) | 0.63 | 0.52 | – | – | – | 7.20 | ||||||||||||||||||||||||||||||
| 10/31/2003 | 5.30 | (0.09 | ) | 1.47 | 1.38 | – | – | – | 6.68 | ||||||||||||||||||||||||||||||
| Class I | 4/30/2006 | 9.17 | – | (h) | 0.78 | 0.78 | – | (0.08 | ) | (0.08 | ) | 9.87 | |||||||||||||||||||||||||||
| Ratios/Supplemental Data | |||||||||||||||||||||||||||||||
| For the Period | Total | Net Assets, End of Period | Ratio of Expenses to Average Net Assets (a) | Net Investment Income (Loss) to Average | Portfolio Turnover | ||||||||||||||||||||||||||
| Ended (g) | Return (c) | (000's) | Net (e) | Total (f) | Net Assets (a) | Rate (b) | |||||||||||||||||||||||||
| Class A | 4/30/2006 | 11.83 | % | $ | 86,366 | 1.52 | % | 1.53 | % | (0.72 | )% | 3 | % | ||||||||||||||||||
| 10/31/2005 | 21.16 | 301,635 | 1.36 | 1.36 | (0.27 | ) | 39 | ||||||||||||||||||||||||
| 10/31/2004 | 8.45 | 176,851 | 1.50 | 1.50 | (0.90 | ) | 97 | ||||||||||||||||||||||||
| 10/31/2003 | 24.28 | 56,618 | 1.56 | 1.56 | (0.87 | ) | 55 | ||||||||||||||||||||||||
| 10/31/2002 | (13.50 | ) | 25,127 | 1.74 | 2.32 | (1.19 | ) | 19 | |||||||||||||||||||||||
| 10/31/2001 | (37.20 | ) | 2,750 | 1.55 | 2.75 | (1.15 | ) | 42 | |||||||||||||||||||||||
| Class B | 4/30/2006 | 11.53 | 54,678 | 2.17 | 2.42 | (1.34 | ) | 3 | |||||||||||||||||||||||
| 10/31/2005 | 20.03 | 49,865 | 2.18 | 2.61 | (0.99 | ) | 39 | ||||||||||||||||||||||||
| 10/31/2004 | 7.68 | 47,928 | 2.20 | 2.72 | (1.62 | ) | 97 | ||||||||||||||||||||||||
| 10/31/2003 | 23.70 | 4,613 | 2.21 | 2.21 | (1.52 | ) | 55 | ||||||||||||||||||||||||
| 10/31/2002 | (14.22 | ) | 2,732 | 2.39 | 2.98 | (1.84 | ) | 19 | |||||||||||||||||||||||
| 10/31/2001 | (37.78 | ) | 3,070 | 2.20 | 3.40 | (1.80 | ) | 42 | |||||||||||||||||||||||
| Class C | 4/30/2006 | 11.40 | 26,775 | 2.16 | 2.16 | (1.34 | ) | 3 | |||||||||||||||||||||||
| 10/31/2005 | 20.05 | 23,656 | 2.18 | 2.31 | (1.00 | ) | 39 | ||||||||||||||||||||||||
| 10/31/2004 | 7.78 | 21,808 | 2.20 | 2.55 | (1.63 | ) | 97 | ||||||||||||||||||||||||
| 10/31/2003 | 26.04 | 1,435 | 2.21 | 2.21 | (1.52 | ) | 55 | ||||||||||||||||||||||||
| Class I | 4/30/2006 | 8.50 | 512,862 | 0.81 | 0.81 | 0.02 | 3 | ||||||||||||||||||||||||
The notes to the financial statements are an integral part of this report.
Transamerica IDEX Mutual Funds
Semi-Annual Report 2006
6
TA IDEX Transamerica Equity
FINANCIAL HIGHLIGHTS (continued)
(unaudited)
NOTES TO FINANCIAL HIGHLIGHTS
(a) Annualized.
(b) Not annualized.
(c) Total Return has been calculated for the applicable period without deduction of a sales load, if any, on an initial purchase. Not annualized.
(d) Per share information is calculated based on average number of shares outstanding.
(e) Ratio of Net Expenses to Average Net Assets is net of fee waivers and reimbursements by the investment adviser, if any (see note 2).
(f) Ratio of Total Expenses to Average Net Assets includes all expenses before fee waivers and reimbursements by the investment adviser.
(g) The inception dates for the Fund's offering of share classes were as follows:
Class C was November 11, 2002.
Class I was November 15, 2005.
(h) Amount rounds to less than $0.01.
The notes to the financial statements are an integral part of this report.
Transamerica IDEX Mutual Funds
Semi-Annual Report 2006
7
TA IDEX Transamerica Equity
NOTES TO FINANCIAL STATEMENTS
At April 30, 2006
(all amounts in thousands)
(unaudited)
NOTE 1. ORGANIZATION AND SIGNIFICANT ACCOUNTING POLICIES
Transamerica IDEX Mutual Funds is an open-end management investment company registered under the Investment Company Act of 1940, as amended (the "1940 Act").
In the normal course of business, TA IDEX Transamerica Equity (the "Fund") enters into contracts that contain a variety of representations that provide general indemnifications. The Fund's maximum exposure under these arrangements is unknown, as this would involve future claims that may be made against the Fund and/or its affiliates that have not yet occurred. However, based on experience, the Fund expects the risk of loss to be remote.
This report should be read in conjunction with the current Fund prospectus, which contains more complete information about the Fund.
In preparing the Fund's financial statements in accordance with accounting principles generally accepted in the United States of America ("GAAP"), estimates or assumptions (which could differ from actual results) may be used that affect reported amounts and disclosures. The following is a summary of significant accounting policies followed by the Fund.
Multiple class operations, income and expenses: The Fund currently offers four classes of shares, Class A, Class B, Class C and Class I, each with a public offering price that reflects different sales charges, if any, and expense levels. Class I shares commenced operations on November 15, 2005. Class I is only available for investment to certain affiliated asset allocation funds. Class B shares will convert to Class A shares eight years after purchase. Income, non-class specific expenses and realized and unrealized gains and losses, are allocated daily to each class, based upon the value of shares outstanding method as permitted under Rule 18f-3 of the 1940 Act. Each class bears its own specific expenses as well as a portion of general, common expenses.
Security valuations: The Fund values its investments at the close of the New York Stock Exchange ("NYSE"), normally 4 p.m. ET, each day the NYSE is open for business. Fund investments are valued at the last sale price or closing price on the day of valuation taken from the primary exchange where the security is principally traded.
Securities traded in the over-the-counter market and listed securities for which no sale was reported on that date are valued at the last quoted bid price.
Debt securities are valued based on a price quotation or other equivalent indication of value supplied by an exchange, a pricing service or a major market maker; however, those that mature in sixty days or less are valued at amortized cost, which approximates market.
Investment company securities are valued at the net asset value of the underlying portfolio.
Other securities for which quotations are not readily available or whose values have been determined to be unreliable are valued at fair market value as determined in good faith by the Fund's Administrative Valuation Committee, under the supervision of the Board's Valuation Committee, using guidelines adopted by the Board of Trustees.
Cash: The Fund may leave cash overnight in its cash account with the custodian, Investors Bank & Trust Company ("IBT"). IBT has been contracted on behalf of the Fund to invest the excess cash into a savings account, which at April 30, 2006, was paying an interest rate of 3.24%.
Repurchase agreements: The Fund is authorized to enter into repurchase agreements. The Fund, through its custodian, IBT, receives delivery of the underlying securities, the value of which at the time of purchase is required to be an amount equal to at least 100% of the resale price. The Fund will bear the risk of value fluctuations until the security can be sold and may encounter delays and incur costs in liquidating the security. In the event of bankruptcy or insolvency of the seller, delays and costs may be incurred.
Commission recapture: The sub-adviser, to the extent consistent with the best execution and usual commission rate policies and practices, may place security transactions of the Fund with broker/dealers with which Transamerica IDEX Mutual Funds has established a Commission Recapture Program. A Commission Recapture Program is any arrangement under which a broker/dealer applies a portion of the commissions received by such broker/dealer on the security transactions to the Fund. In no event will commissions paid by the Fund be used to pay expenses that would otherwise be borne by any other funds within Transamerica IDEX Mutual Funds, or by any other party.
Recaptured commissions during the six months ended April 30, 2006, of $3 are included in net realized gains in the Statement of Operations.
Securities lending: The Fund may lend securities to qualified borrowers, with IBT acting as the Fund's lending agent. The Fund earns negotiated lenders' fees. The Fund receives cash and/or securities as collateral against the loaned securities. Cash collateral received is invested in short term, interest bearing securities. The Fund monitors the market value of securities loaned on a daily basis and requires collateral in an amount at least equal to the value of the securities loaned. Income from loaned securities on the Statement of Operations is net of fees, in the amount of $8, earned by IBT for its services.
Security transactions and investment income: Security transactions are recorded on the trade date. Security gains and losses are calculated on the specific identification basis. Dividend income, if any, is recorded on the ex-dividend date or, in the case of foreign securities, as soon
Transamerica IDEX Mutual Funds
Semi-Annual Report 2006
8
TA IDEX Transamerica Equity
NOTES TO FINANCIAL STATEMENTS (continued)
At April 30, 2006
(all amounts in thousands)
(unaudited)
NOTE 1.–(continued)
as the Fund is informed of the ex-dividend date. Interest income, including accretion of discounts and amortization of premiums, is recorded on the accrual basis commencing on the settlement date.
Redemption fees: A short-term trading redemption fee may be assessed on any Fund shares in a fund account that are sold during the first five (5) NYSE trading days following their purchase date. This redemption fee will equal 2% of the amount redeemed and shares held the longest will be treated as being redeemed first and shares held the shortest as being redeemed last. For the six months ended April 30, 2006, the Fund received less than $1 in redemption fees.
Dividend distributions: Distributions to shareholders are recorded on the ex-dividend date and are determined in accordance with Federal income tax regulations which may differ from GAAP.
NOTE 2. RELATED PARTY TRANSACTIONS
Transamerica Fund Advisors, Inc. ("TFAI") is the Fund's investment adviser. Transamerica Fund Services, Inc. ("TFS") is the Fund's administrator and transfer agent. AFSG Securities Corp. ("AFSG") is the Fund's distributor/principal underwriter. TFAI, TFS, and AFSG are affiliates of AEGON, NV, a Netherlands corporation.
Transamerica Investment Management, LLC is both an affiliate of the Fund and a sub-adviser to the Fund.
Certain officers and trustees of the Fund are also officers and/or directors of TFAI, TFS and AFSG.
The following schedule represents the percentage of Fund assets owned by affiliated investment companies at April 30, 2006:
| Net Assets | % of Net Assets | ||||||||||
| TA IDEX Asset Allocation– Conservative Portfolio | $ | 27,460 | 4.03 | % | |||||||
| TA IDEX Asset Allocation– Growth Portfolio | 176,820 | 25.98 | % | ||||||||
| TA IDEX Asset Allocation– Moderate Portfolio | 104,156 | 15.30 | % | ||||||||
| TA IDEX Asset Allocation– Moderate Growth Portfolio | 204,531 | 30.05 | % | ||||||||
| Total | $ | 512,967 | 75.36 | % | |||||||
Investment advisory fees: The Fund pays management fees to TFAI based on average daily net assets ("ANA") at the following breakpoints:
0.75% of the first $500 million of ANA
0.70% of ANA over $500 million
TFAI has contractually agreed to waive its advisory fee and will reimburse the Fund to the extent that operating expenses, excluding 12b-1 fees, exceed the following stated annual limit:
1.17% Expense Limit
Distribution and service fees: The Fund has a 12b-1 distribution plan under the 1940 Act pursuant to which an annual fee, based on average daily net assets, is paid to the distributor for various disbursements such as broker-dealer account servicing fees and other promotional expenses of the Fund. The Fund is authorized under the 12b-1 plan to pay fees on each class up to the following limits:
| Class A | 0.35 | % | |||||
| Class B | 1.00 | % | |||||
| Class C | 1.00 | % | |||||
| Class I | N/A | ||||||
In the case the Fund or a class of shares of the Fund is closed to new investors or investments, the Fund is authorized to pay 12b-1 fees for past sales and distribution efforts and present and past investor services.
Underwriter commissions relate to front-end sales charges imposed for Class A shares and contingent deferred sales charges from Classes B, C, and certain A share redemptions. For the six months ended April 30, 2006, the underwriter commissions were as follows:
| Received by Underwriter | $ | 116 | |||||
| Retained by Underwriter | 18 | ||||||
| Contingent Deferred Sales Charge | 38 | ||||||
Administrative services: The Fund has entered into an agreement with TFS for financial and legal fund administration services. The Fund pays TFS an annual fee of 0.02% of ANA. The Legal fees on the Statement of Operations are fees paid to external legal counsel.
Transfer agent fees: The Fund pays TFS an annual per-account charge for each open and closed account. The Fund paid TFS $380 for the six months ended April 30, 2006.
Deferred compensation plan: Each eligible independent Fund Trustee may elect to participate in a non-qualified deferred compensation plan maintained by Transamerica IDEX Mutual Funds (the "Plan"). Under the Plan, such Trustees may defer payment of all or a portion of their total fees earned as a Fund Trustee. Each Trustee who is a participant in the Plan may elect that the earnings, losses or gains credited to his or her deferred fee amounts be determined based on a deemed investment in any series of Transamerica IDEX Mutual Funds, including the Fund. The right of a participant to receive a distribution from the Plan
Transamerica IDEX Mutual Funds
Semi-Annual Report 2006
9
TA IDEX Transamerica Equity
NOTES TO FINANCIAL STATEMENTS (continued)
At April 30, 2006
(all amounts in thousands)
(unaudited)
NOTE 2.–(continued)
of the deferred fees is an unsecured claim against the general assets of all series of Transamerica IDEX Mutual Funds. The pro rata liability to the Fund of all deferred fees in the Plan amounted, as of April 30, 2006, to $28.
NOTE 3. INVESTMENT TRANSACTIONS
The cost of securities purchased and proceeds from securities sold (excluding short-term securities) for the six months ended April 30, 2006 were as follows:
| Purchases of securities: | |||||||
| Long-Term | $ | 256,416 | |||||
| U.S. Government | – | ||||||
| Proceeds from maturities and sales of securities: | |||||||
| Long-Term | 19,457 | ||||||
| U.S. Government | – | ||||||
NOTE 4. FEDERAL INCOME TAX MATTERS
The Fund has not made any provision for federal income or excise taxes due to its policy to distribute all of its taxable income and capital gains to its shareholders and otherwise qualify as a regulated investment company under Subchapter M of the Internal Revenue Code. Income and capital gain distributions are determined in accordance with income tax regulations, which may differ from GAAP. These differences are primarily due to differing treatment for items including, but not limited to, wash sales, net operating losses and capital loss carryforwards.
The capital loss carryforwards are available to offset future realized capital gains through the periods listed:
| Capital Loss Carryforwards | Available through | ||||||
| $ | 67,350 | October 31, 2008 | |||||
| 48,961 | October 31, 2009 | ||||||
NOTE 5. REGULATORY PROCEEDINGS
There continues to be significant federal and state regulatory activity relating to financial services companies, particularly mutual fund companies and their investment advisers. As part of an ongoing investigation regarding potential market timing, recordkeeping and trading compliance issues and matters affecting the Fund's investment adviser, TFAI, and certain affiliates and former employees of TFAI, the SEC staff has indicated that it is likely to take some action against TFAI and certain of its affiliates at the conclusion of the investigation. The potential timing and the scope of any such action is difficult to predict. Although the impact of any action brought against TFAI and/or its affiliates is difficult to assess at the present time, the Fund currently believes that the likelihood that any such action will have a material adverse impact on it is remote. It is important to note that the Fund is not aware of any allegation of wrongdoing against it and its Board at the time this semi-annual report is printed. Although it is not anticipated that these developments will have an adverse impact on the Fund, there can be no assurance at this time. TFAI and its affiliates are actively working with the SEC in regard to this matter; however, the exact resolution cannot be determined at this time. TFAI will take such actions that it deems necessary or appropriate to continue providing management services to the Fund and to bring all matters to an appropriate conclusion.
TFAI and/or its affiliates, and not the Fund, will bear the costs regarding these regulatory matters.
Transamerica IDEX Mutual Funds
Semi-Annual Report 2006
10
TA IDEX Transamerica Equity
INVESTMENT ADVISORY AND SUB-ADVISORY AGREEMENTS – REVIEW AND RENEWAL (unaudited)
At a meeting of the Board of Trustees of Transamerica IDEX Mutual Funds ("TA IDEX") held on November 2, 2005, the Board reviewed and considered the Investment Advisory Agreement between TA IDEX Transamerica Equity (the "Fund") and Transamerica Fund Advisors, Inc. ("TFAI"), as well as the Investment Sub-Advisory Agreement of the Fund between TFAI and Transamerica Investment Management, LLC (the "Sub-Adviser"), to determine whether the agreements should be renewed for a one-year period. Following their review and consideration, the Trustees determined that the Investment Advisory Agreement and the Investment Sub-Advisory Agreement will enable shareholders of the Fund to obtain high quality services at a cost that is appropriate, reasonable, and in the best interests of its shareholders. The Board, including the independent members of the Board, unanimously approved the renewal of the Investment Advisory Agreement and the Investmen t Sub-Advisory Agreement. In reaching their decision, the Trustees requested and obtained from TFAI and the Sub-Adviser such information as they deemed reasonably necessary to evaluate the proposed agreements. The Trustees also carefully considered the information that they had received throughout the year from TFAI and the Sub-Adviser (such as in-person presentations by the Sub-Adviser) as part of their regular oversight of the Fund, as well as: comparative fee, expense and performance information prepared by Lipper Inc. ("Lipper"), independent providers of mutual fund performance, fee and expense information, and profitability data. In considering the proposed continuation of the Investment Advisory Agreement and the Investment Sub-Advisory Agreement, the Trustees evaluated a number of considerations that they believe, in light of the legal advice furnished to them by TA IDEX counsel and independent legal counsel and their own business judgment, to be relevant. They based their decisions on the following c onsiderations, among others, although they did not identify any consideration or particular information that was controlling of their decisions:
The nature, extent and quality of the advisory service to be provided. The Board considered the nature and quality of the services provided by TFAI and the Sub-Adviser to the Fund in the past, as well as the services anticipated to be provided in the future. The Board concluded that TFAI and the Sub-Adviser are capable of providing high quality services to the Fund, as indicated by the nature and quality of services provided in the past, TFAI's and the Sub-Adviser's management capabilities demonstrated with respect to the funds they manage, including the Fund, and the experience, capability and integrity of TFAI's senior management, the financial resources of TFAI and the Sub-Adviser, TFAI's management oversight process, the professional qualifications and experience of the Sub-Adviser's portfolio management team, and the Fund's investment performance . The Trustees also concluded that TFAI and the Sub-Adviser proposed to provide investment and related services that were of the same quality and quantity as services provided to the Fund in the past, and that these services are appropriate in scope and extent in light of the Fund's operations, the competitive landscape of the investment company business and investor needs, and that TFAI's and the Sub-Adviser's obligations will remain substantially the same.
The investment performance of the Fund. The Board examined both the short-term and longer-term performance of the Fund, including relative performance against a benchmark securities index and a peer group of comparable mutual funds as prepared by Lipper, for various trailing periods ended June 30, 2005. The Trustees concluded that TFAI and the Sub-Adviser generally had achieved superior investment performance, noting that the performance of the Fund has been above median relative to its peers over the past one-, two-, three-, and five-year periods and superior to the benchmark index over the past one-, two-, three- and five-year periods. On the basis of the Trustees' assessment of the nature, extent and quality of advisory services to be provided or procured by TFAI and the Sub-Adviser, the Trustees concluded that TFAI and the Sub-Adviser are capable of generating a level of investment performance that is appropriate in light of the Fund's investment objective, policies and strategies and competitive with many other investment companies, and also determined that TFAI's and the Sub-Adviser's performance records indicate that their continued management is likely to benefit the Fund and its shareholders.
The cost of advisory services provided and the level of profitability. The Board reviewed profitability information regarding TFAI's costs of procuring portfolio management services, as well as the costs of provision of administration, transfer agency, fund accounting and other services, to the Fund and to TA IDEX as a whole by TFAI and its affiliates. The Trustees reviewed data from Lipper that compared the Fund's management fees (including management fees at various asset levels), other fees and expenses (including total expenses including and excluding 12b-1 distribution and service fees) and portfolio turnover rate against a peer group of comparable mutual funds. Based on such information, the Trustees determined that the management fees and overall expense ratio of the Fund generally are consistent with industry averages. In addition, on the basi s of the Board's review of the management fees to be charged by TFAI for investment advisory and related services, TFAI profitability information (derived from TFAI's audited financial statements), TFAI's estimated management income resulting from its management of the Fund, the estimated margin of the Sub-Adviser, as well as the entirety of TFAI's and its affiliates' service relationship with TA IDEX, the Board concluded that the level of investment management fees and other service fees, as well as TFAI's and the Sub-Adviser's profitability, are appropriate in light of the services provided, the management fees and overall expense ratios of comparable investment companies and the anticipated profitability of the relationship between the Fund, TFAI and its affiliates, and the Sub-Adviser.
Transamerica IDEX Mutual Funds
Semi-Annual Report 2006
11
TA IDEX Transamerica Equity (continued)
Whether fee levels reflect economies of scale and the extent to which economies of scale would be realized as the Fund grows. The Board concluded that the inclusion of asset-based breakpoints in the Fund's advisory fee schedule appropriately benefits investors by realizing economies of scale in the form of lower management fees as the level of assets grows. In addition, the Board concluded that the Fund's management fees appropriately reflect the Fund's current size, the current economic environment for TFAI, the competitive nature of the investment company market, and TFAI's pricing strategy. The Trustees also concluded that they will have the opportunity to periodically reexamine whether the Fund has achieved economies of scale, and the appropriateness of management fees payable to TFAI and fees payable by TFAI to the Sub-Adviser, in the future.
Benefits (such as soft dollars) to TFAI, its affiliates, or the Sub-Adviser from their relationship with the Fund. The Board concluded that other benefits derived by TFAI, its affiliates, and the Sub-Adviser from their relationship with the Fund, including "soft dollar" benefits (if any) in connection with brokerage transactions, sales charges and distribution/service fees (to the extent applicable) are reasonable and fair, and are consistent with industry practice and the best interests of the Fund and its shareholders. In this regard, the Board noted that TFAI does not realize "soft dollar" benefits from its relationship with the Fund, and that the Sub-Adviser is participating in a brokerage program pursuant to which a portion of brokerage commissions paid by the Fund is recaptured for the benefit of the Fund and its shareholders, thus limiting the amount of "soft-dollar" arrangements the Sub-Adviser may engage in with respect to the Fund's brokerage transactions. In addition, the Trustees determined that the administration, transfer agency, fund accounting and other fees paid by the Fund to affiliates of TFAI are reasonable, fair and in the best interests of shareholders in light of the nature and quality of the services provided, the associated costs to these affiliates of providing the services, the impact of the costs of such services on the Fund's overall operating expenses, and the necessity of the services for the Fund's operations.
Other considerations. The Board determined that TFAI had made a substantial commitment to the recruitment and retention of high quality personnel, and maintained the financial, compliance and operational resources reasonably necessary to manage the Fund in a professional manner that is consistent with the best interests of the Fund and its shareholders. In this regard, the Trustees favorably considered the procedures and policies in place by TFAI to enforce compliance with applicable laws and regulations and oversee the portfolio management activities of the Sub-Adviser. The Trustees also determined that TFAI had made a significant entrepreneurial commitment to the management and success of the Fund, reflected by TFAI's expense limitation and fee waiver arrangement with the Fund, which may result in TFAI waiving advisory fees for the benefit of shareh olders.
Transamerica IDEX Mutual Funds
Semi-Annual Report 2006
12
TA IDEX Transamerica Flexible Income
UNDERSTANDING YOUR FUND'S EXPENSES
(unaudited)
SHAREHOLDER EXPENSES
Fund shareholders may incur two types of costs: (1) transaction costs, including sales charges (loads) on purchases, contingent deferred sales charges on redemptions and redemption fees; and (2) ongoing costs, including management fees, 12b-1 distribution and service fees, and other fund expenses.
The following Example is intended to help you understand your ongoing costs (in dollars and cents) of investing in the Fund and to compare these costs with the ongoing costs of investing in other funds.
The Example is based on an investment of $1,000 invested at November 1, 2005 and held for the entire period until April 30, 2006.
ACTUAL EXPENSES
The first line in the table below provides information about actual account values and actual expenses. You may use the information in this line, together with the amount you invested, to estimate the expenses that you paid over the period. Simply divide your account value by $1,000 (for example, an $8,600 account value divided by $1,000 = 8.6), then multiply the result by the number in the first line of your Fund under the heading entitled "Expenses Paid During Period" to estimate the expenses you paid on your account during this period. If your account is an IRA, your expenses could have included a $15 annual fee. The amount of any fee paid through your account would increase the estimate of expenses you paid during the period and decrease your ending account value.
HYPOTHETICAL EXAMPLE FOR COMPARISON PURPOSES
The second line in the table below provides information about hypothetical account values and hypothetical expenses based on the Fund's actual expense ratio and an assumed rate of return of 5% per year before expenses, which is not the Fund's actual return. The hypothetical account values and expenses may not be used to estimate the actual ending account balance or expenses you paid for the period. You may use this information to compare the ongoing costs of investing in your Fund and other funds. To do so, compare this 5% hypothetical example with the 5% hypothetical examples that appear in the shareholder reports of the other funds. As in the case of the actual expense example, if your account is subject to an IRA fee, the amount of the fee paid through your account would increase the hypothetical expenses you would have paid during the period and decrease the hypothetical ending account value.
Please note that the expenses shown in the table are meant to highlight your ongoing costs only and do not reflect any transactional costs, such as sales charges, redemption fees, brokerage commissions paid on purchases and sales of fund shares. Therefore, the second line under the Fund in the table is useful in comparing ongoing costs only, and will not help you determine the relative total costs of owning different funds. If any of these transaction costs were included, your costs would be higher. The expenses shown in the table do not reflect any fees that may be charged to you by brokers, financial intermediaries or other financial institutions.
| Beginning Account Value | Ending Account Value | Annualized Expense Ratio | Expenses Paid During Period (a) | ||||||||||||||||
| Class A | |||||||||||||||||||
| Actual | $ | 1,000.00 | $ | 1,010.80 | 1.39 | % | $ | 6.93 | |||||||||||
| Hypothetical (b) | 1,000.00 | 1,017.90 | 1.39 | 6.95 | |||||||||||||||
| Class B | |||||||||||||||||||
| Actual | 1,000.00 | 1,008.30 | 2.10 | 10.46 | |||||||||||||||
| Hypothetical (b) | 1,000.00 | 1,014.38 | 2.10 | 10.49 | |||||||||||||||
| Class C | |||||||||||||||||||
| Actual | 1,000.00 | 1,008.30 | 2.11 | 10.51 | |||||||||||||||
| Hypothetical (b) | 1,000.00 | 1,014.33 | 2.11 | 10.54 | |||||||||||||||
| Class I | |||||||||||||||||||
| Actual | 1,000.00 | 1,013.90 | 0.85 | 4.24 | |||||||||||||||
| Hypothetical (b) | 1,000.00 | 1,020.58 | 0.85 | 4.26 | |||||||||||||||
(a) Expenses are calculated using the Fund's annualized expense ratio (as disclosed in the table), multiplied by the average account value for the period, multiplied by number of days in the period (181 days), and divided by the number of days in the year (365 days).
(b) 5% return per year before expenses.
GRAPHIC PRESENTATION OF SCHEDULE OF INVESTMENTS
By Asset Type
At April 30, 2006
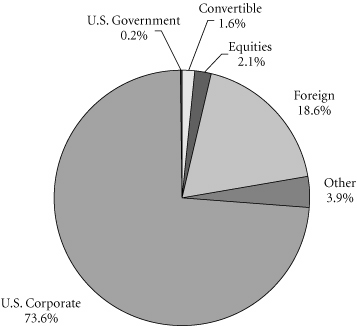
This chart shows the percentage breakdown by asset type of the Fund's total investment securities.
Transamerica IDEX Mutual Funds
Semi-Annual Report 2006
1
TA IDEX Transamerica Flexible Income
SCHEDULE OF INVESTMENTS
At April 30, 2006
(all amounts except share amounts in thousands)
(unaudited)
| Principal | Value | ||||||||||
| U.S. GOVERNMENT OBLIGATIONS (0.2%) | |||||||||||
| U.S. Treasury Note | |||||||||||
| 4.50%, due 02/15/2016 † | $ | 567 | $ | 542 | |||||||
| Total U.S. Government Obligations (cost: $555) | 542 | ||||||||||
| CORPORATE DEBT SECURITIES (94.1%) | |||||||||||
| Aerospace (1.4%) | |||||||||||
| Boeing Co. (The) 8.75%, due 08/15/2021 | 2,500 | 3,205 | |||||||||
| Vought Aircraft Industries, Inc. 8.00%, due 07/15/2011 | 500 | 474 | |||||||||
| Agriculture (2.4%) | |||||||||||
| Cargill, Inc.–144A 5.00%, due 11/15/2013 | 2,920 | 2,782 | |||||||||
| Dole Food Co., Inc. 8.63%, due 05/01/2009 | 1,200 | 1,185 | |||||||||
| Michael Foods, Inc. 8.00%, due 11/15/2013 | 2,575 | 2,581 | |||||||||
| Air Transportation (1.0%) | |||||||||||
| FedEx Corp., Note 9.65%, due 06/15/2012 | 2,250 | 2,682 | |||||||||
| Amusement & Recreation Services (2.6%) | |||||||||||
| Harrah's Operating Co., Inc. 5.50%, due 07/01/2010 | 5,450 | 5,386 | |||||||||
| Speedway Motorsports, Inc. 6.75%, due 06/01/2013 | 500 | 494 | |||||||||
| Virgin River Casino Corp./RBG LLC/B&BB, Inc. 9.00%, due 01/15/2012 | 1,000 | 1,015 | |||||||||
| Automotive (1.3%) | |||||||||||
| DaimlerChrysler NA Holding Corp. 8.50%, due 01/18/2031 † | 2,000 | 2,318 | |||||||||
| General Motors Corp. 7.13%, due 07/15/2013 | 1,500 | 1,129 | |||||||||
| Automotive Dealers & Service Stations (0.7%) | |||||||||||
| Petro Stopping Centers, LP / Petro Financial Corp. 9.00%, due 02/15/2012 | 2,000 | 2,022 | |||||||||
| Beverages (0.9%) | |||||||||||
| Cia Brasileira de Bebidas 8.75%, due 09/15/2013 | 750 | 853 | |||||||||
| Foster's Finance Corp.–144A 5.88%, due 06/15/2035 | 1,725 | 1,545 | |||||||||
| Business Credit Institutions (2.7%) | |||||||||||
| Pemex Finance, Ltd. 9.03%, due 02/15/2011 | 6,850 | 7,392 | |||||||||
| Principal | Value | ||||||||||
| Business Services (1.2%) | |||||||||||
| Hertz Corp.–144A | |||||||||||
| 8.88%, due 01/01/2014 | $ | 3,000 | $ | 3,187 | |||||||
| Chemicals & Allied Products (4.9%) | |||||||||||
| Cytec Industries, Inc. 6.00%, due 10/01/2015 | 1,340 | 1,287 | |||||||||
| ICI Wilmington, Inc. 4.38%, due 12/01/2008 | 3,000 | 2,889 | |||||||||
| IMC Global, Inc. 10.88%, due 06/01/2008 | 400 | 432 | |||||||||
| Ineos Group Holdings PLC–144A 8.50%, due 02/15/2016 | 2,000 | 1,900 | |||||||||
| Lubrizol Corp. 4.63%, due 10/01/2009 5.50%, due 10/01/2014 | 2,000 2,500 | 1,938 2,394 | |||||||||
| Potash Corp. of Saskatchewan 7.13%, due 06/15/2007 | 2,410 | 2,451 | |||||||||
| Commercial Banks (8.3%) | |||||||||||
| Barclays Bank PLC 6.28%, due 12/15/2034 (a)(b) | 3,000 | 2,742 | |||||||||
| Royal Bank of Scotland Group PLC 7.65%, due 09/30/2031 (a)(b) | 2,000 | 2,231 | |||||||||
| Shinsei Finance Cayman, Ltd.–144A 6.42%, due 07/20/2016 (a)(b) | 3,000 | 2,913 | |||||||||
| Sumitomo Mitsui Banking–144A 5.63%, due 10/15/2015 (a)(b) | 3,965 | 3,788 | |||||||||
| US Bank NA 3.75%, due 02/06/2009 | 3,000 | 2,879 | |||||||||
| Wachovia Capital Trust III 5.80%, due 03/15/2011 (a)(b) | 5,510 | 5,402 | |||||||||
| ZFS Finance USA Trust I–144A 6.45%, due 06/15/2065 (b) | 2,500 | 2,355 | |||||||||
| Communication (4.3%) | |||||||||||
| Comcast Cable Communications 6.88%, due 06/15/2009 | 3,760 | 3,896 | |||||||||
| Comcast Corp. 7.05%, due 03/15/2033 | 2,605 | 2,663 | |||||||||
| COX Communications, Inc. 6.75%, due 03/15/2011 | 714 | 736 | |||||||||
| Echostar DBS Corp.–144A 7.13%, due 02/01/2016 | 2,500 | 2,441 | |||||||||
| Kabel Deutschland GmbH–144A 10.63%, due 07/01/2014 | 750 | 810 | |||||||||
| XM Satellite Radio, Inc., Senior Note–144A 9.75%, due 05/01/2014 § | 950 | 955 | |||||||||
The notes to the financial statements are an integral part of this report.
Transamerica IDEX Mutual Funds
Semi-Annual Report 2006
2
TA IDEX Transamerica Flexible Income
SCHEDULE OF INVESTMENTS (continued)
At April 30, 2006
(all amounts except share amounts in thousands)
(unaudited)
| Principal | Value | ||||||||||
| Communications Equipment (0.3%) | |||||||||||
| Inmarsat Finance PLC | |||||||||||
| 0.00%, due 11/15/2012 (c) | $ | 1,000 | $ | 860 | |||||||
| Department Stores (3.0%) | |||||||||||
| Bon-Ton Stores (The), Inc.–144A 10.25%, due 03/15/2014 † | 2,000 | 1,910 | |||||||||
| May Department Stores Co. (The) 8.50%, due 06/01/2019 | 2,500 | 2,943 | |||||||||
| Neiman-Marcus Group, Inc.–144A 9.00%, due 10/15/2015 10.38%, due 10/15/2015 | 2,150 1,000 | 2,284 1,070 | |||||||||
| Electric Services (3.2%) | |||||||||||
| AES Gener SA 7.50%, due 03/25/2014 † | 2,000 | 2,046 | |||||||||
| PSEG Funding Trust 5.38%, due 11/16/2007 | 6,250 | 6,227 | |||||||||
| Southwestern Public Service Co., Series B 5.13%, due 11/01/2006 | 500 | 499 | |||||||||
| Electric, Gas & Sanitary Services (2.0%) | |||||||||||
| NiSource Finance Corp. 7.88%, due 11/15/2010 | 5,000 | 5,401 | |||||||||
| Finance (0.8%) | |||||||||||
| American Real Estate Partners, LP 8.13%, due 06/01/2012 | 1,000 | 1,032 | |||||||||
| American Real Estate Partners, LP/American Real Estate Finance Corp. 7.13%, due 02/15/2013 | 1,000 | 992 | |||||||||
| Food & Kindred Products (2.0%) | |||||||||||
| ConAgra Foods, Inc. 9.75%, due 03/01/2021 | 1,900 | 2,363 | |||||||||
| Tyson Foods, Inc. 6.60%, due 04/01/2016 | 3,090 | 3,031 | |||||||||
| Food Stores (2.9%) | |||||||||||
| Safeway, Inc. 6.50%, due 03/01/2011 | 5,590 | 5,734 | |||||||||
| Stater Brothers Holdings, Inc. 8.13%, due 06/15/2012 | 2,000 | 2,000 | |||||||||
| Gas Production & Distribution (1.3%) | |||||||||||
| El Paso Corp.–144A 7.63%, due 09/01/2008 | 2,000 | 2,035 | |||||||||
| Pacific Energy Partners, LP / Pacific Energy Finance Corp. 7.13%, due 06/15/2014 | 1,500 | 1,515 | |||||||||
| Principal | Value | ||||||||||
| Holding & Other Investment Offices (6.0%) | |||||||||||
| Hutchison Whampoa International, Ltd.–144A | |||||||||||
| 5.45%, due 11/24/2010 | $ | 475 | $ | 469 | |||||||
| 7.45%, due 11/24/2033 | 2,500 | 2,689 | |||||||||
| iStar Financial, Inc. 4.88%, due 01/15/2009 | 6,000 | 5,873 | |||||||||
| Kimco Realty Corp., Series C 3.95%, due 08/05/2008 | 2,825 | 2,744 | |||||||||
| Noble Group, Ltd.–144A 6.63%, due 03/17/2015 | 2,000 | 1,766 | |||||||||
| Raytheon Co. 7.00%, due 05/15/2006 (d) | 5,500 | 2,752 | |||||||||
| Hotels & Other Lodging Places (3.5%) | |||||||||||
| 155 East Tropicana LLC/155 East Tropicana Finance Corp. 8.75%, due 04/01/2012 † | 900 | 889 | |||||||||
| Host Marriott, LP 7.13%, due 11/01/2013 | 2,000 | 2,030 | |||||||||
| Intrawest Corp. 7.50%, due 10/15/2013 | 2,200 | 2,227 | |||||||||
| Station Casinos, Inc. 6.88%, due 03/01/2016 | 2,000 | 1,965 | |||||||||
| Station Casinos, Inc.–144A 6.63%, due 03/15/2018 | 500 | 476 | |||||||||
| Wynn Las Vegas LLC/Wynn Las Vegas Capital Corp. 6.63%, due 12/01/2014 | 2,000 | 1,945 | |||||||||
| Industrial Machinery & Equipment (1.3%) | |||||||||||
| Cummins Engine Co., Inc. 5.65%, due 03/01/2098 | 2,000 | 1,440 | |||||||||
| Douglas Dynamics LLC–144A 7.75%, due 01/15/2012 | 915 | 890 | |||||||||
| Gardner Denver, Inc. 8.00%, due 05/01/2013 | 1,000 | 1,050 | |||||||||
| Insurance (1.4%) | |||||||||||
| Reinsurance Group of America 6.75%, due 12/15/2065 (b) | 2,730 | 2,570 | |||||||||
| Wellpoint Health Networks, Inc. 6.38%, due 06/15/2006 | 1,185 | 1,187 | |||||||||
| Metal Mining (2.1%) | |||||||||||
| Barrick Gold Finance, Inc. 7.50%, due 05/01/2007 | 2,000 | 2,040 | |||||||||
| Phelps Dodge Corp. 9.50%, due 06/01/2031 | 847 | 1,075 | |||||||||
| Teck Cominco, Ltd. 6.13%, due 10/01/2035 | 2,880 | 2,653 | |||||||||
The notes to the financial statements are an integral part of this report.
Transamerica IDEX Mutual Funds
Semi-Annual Report 2006
3
TA IDEX Transamerica Flexible Income
SCHEDULE OF INVESTMENTS (continued)
At April 30, 2006
(all amounts except share amounts in thousands)
(unaudited)
| Principal | Value | ||||||||||
| Mortgage Bankers & Brokers (4.9%) | |||||||||||
| Crystal US Holdings 3 LLC/Crystal | |||||||||||
| US Sub 3 Corp. | |||||||||||
| 9.63%, due 06/15/2014 | $ | 1,300 | $ | 1,430 | |||||||
| Glencore Funding LLC–144A 6.00%, due 04/15/2014 | 1,950 | 1,839 | |||||||||
| ILFC E-Capital Trust II–144A 6.25%, due 12/21/2065 (b) | 2,500 | 2,394 | |||||||||
| Innophos Investments Holdings, Inc. 12.75%, due 02/15/2015 * | 2,221 | 2,277 | |||||||||
| Kinder Morgan Finance Co., ULC 6.40%, due 01/05/2036 | 1,925 | 1,842 | |||||||||
| MUFG Capital Finance 1, Ltd. 6.35%, due 07/25/2016 (a)(b) | 1,460 | 1,431 | |||||||||
| Stripes Acquisition LLC/Susser Finance Corp.–144A 10.63%, due 12/15/2013 | 2,000 | 2,125 | |||||||||
| Motion Pictures (2.1%) | |||||||||||
| Time Warner, Inc. 9.13%, due 01/15/2013 7.63%, due 04/15/2031 | 2,000 3,000 | 2,302 3,248 | |||||||||
| Oil & Gas Extraction (2.1%) | |||||||||||
| Chesapeake Energy Corp. 6.38%, due 06/15/2015 | 1,000 | 958 | |||||||||
| Delta Petroleum Corp. 7.00%, due 04/01/2015 | 600 | 555 | |||||||||
| Gazprom International SA–144A 7.20%, due 02/01/2020 | 3,100 | 3,236 | |||||||||
| Mariner Energy, Inc., Senior Note–144A 7.50%, due 04/15/2013 § | 1,050 | 1,040 | |||||||||
| Paper & Allied Products (0.2%) | |||||||||||
| Graphic Packaging International Corp. 9.50%, due 08/15/2013 † | 500 | 485 | |||||||||
| Paperboard Containers & Boxes (0.5%) | |||||||||||
| Graham Packaging Co., Inc. 9.88%, due 10/15/2014 † | 1,250 | 1,284 | |||||||||
| Personal Credit Institutions (0.4%) | |||||||||||
| Ford Motor Credit Co. 9.47%, due 04/15/2012 * | 1,100 | 1,101 | |||||||||
| Petroleum Refining (2.2%) | |||||||||||
| Premcor Refining Group (The), Inc. 9.25%, due 02/01/2010 | 2,500 | 2,681 | |||||||||
| Valero Energy Corp. 7.50%, due 04/15/2032 | 3,000 | 3,361 | |||||||||
| Principal | Value | ||||||||||
| Primary Metal Industries (0.7%) | |||||||||||
| Noranda, Inc. | |||||||||||
| 6.00%, due 10/15/2015 | $ | 2,000 | $ | 1,944 | |||||||
| Printing & Publishing (3.2%) | |||||||||||
| Media General, Inc. 6.95%, due 09/01/2006 | 4,200 | 4,210 | |||||||||
| News America Holdings, Inc. 7.75%, due 12/01/2045 | 2,700 | 2,888 | |||||||||
| RH Donnelley Corp.–144A 8.88%, due 01/15/2016 | 1,400 | 1,440 | |||||||||
| Radio & Television Broadcasting (4.7%) | |||||||||||
| Chancellor Media Corp. 8.00%, due 11/01/2008 | 3,695 | 3,887 | |||||||||
| Grupo Televisa SA 6.63%, due 03/18/2025 | 2,000 | 1,920 | |||||||||
| Univision Communications, Inc. 7.85%, due 07/15/2011 | 3,900 | 4,070 | |||||||||
| Viacom, Inc., Senior Note–144A 6.25%, due 04/30/2016 | 2,900 | 2,874 | |||||||||
| Real Estate (1.9%) | |||||||||||
| Colonial Realty, LP 7.00%, due 07/14/2007 | 5,075 | 5,139 | |||||||||
| Restaurants (0.8%) | |||||||||||
| Carrols Corp. 9.00%, due 01/15/2013 † | 1,000 | 1,015 | |||||||||
| NPC International, Inc.–144A 9.50%, due 05/01/2014 § | 1,000 | 1,010 | |||||||||
| Rubber & Misc. Plastic Products (0.4%) | |||||||||||
| NTK Holdings, Inc. 0.00%, due 03/01/2014 (e) | 1,500 | 1,142 | |||||||||
| Security & Commodity Brokers (1.5%) | |||||||||||
| E*Trade Financial Corp. 8.00%, due 06/15/2011 | 1,500 | 1,549 | |||||||||
| Goldman Sachs Group, Inc., Subordinated Note 6.45%, due 05/01/2036 | 2,655 | 2,624 | |||||||||
| Stone, Clay & Glass Products (0.4%) | |||||||||||
| Owens Brockway Glass Container, Inc. 6.75%, due 12/01/2014 | 1,000 | 960 | |||||||||
| Telecommunications (3.9%) | |||||||||||
| America Movil SA de CV 5.50%, due 03/01/2014 | 3,000 | 2,829 | |||||||||
| Mountain States Telephone & Telegraph 7.38%, due 05/01/2030 | 1,000 | 993 | |||||||||
The notes to the financial statements are an integral part of this report.
Transamerica IDEX Mutual Funds
Semi-Annual Report 2006
4
TA IDEX Transamerica Flexible Income
SCHEDULE OF INVESTMENTS (continued)
At April 30, 2006
(all amounts except share amounts in thousands)
(unaudited)
| Principal | Value | ||||||||||
| Telecommunications (continued) | |||||||||||
| Northwestern Bell Telephone | |||||||||||
| 7.75%, due 05/01/2030 | $ | 1,235 | $ | 1,244 | |||||||
| Sprint Capital Corp. 8.75%, due 03/15/2032 | 2,150 | 2,668 | |||||||||
| Verizon Global Funding Corp. 7.75%, due 12/01/2030 | 2,455 | 2,708 | |||||||||
| Water Transportation (2.0%) | |||||||||||
| Royal Caribbean Cruises, Ltd. 8.75%, due 02/02/2011 | 5,000 | 5,504 | |||||||||
| Wholesale Trade Nondurable Goods (0.7%) | |||||||||||
| Domino's, Inc. 8.25%, due 07/01/2011 | 1,750 | 1,811 | |||||||||
| Total Corporate Debt Securities (cost: $259,642) | 254,042 | ||||||||||
| CONVERTIBLE BOND (1.6%) | |||||||||||
| Aerospace (0.5%) | |||||||||||
| Armor Holdings, Inc. 2.00%, due 11/01/2024 (f) | 1,000 | 1,263 | |||||||||
| Computer & Office Equipment (0.5%) | |||||||||||
| Scientific Games Corp. 0.75%, due 12/01/2024 | 1,000 | 1,371 | |||||||||
| Electronic Components & Accessories (0.3%) | |||||||||||
| Intel Corp.–144A 2.95%, due 12/15/2035 | 1,000 | 854 | |||||||||
| Retail Trade (0.3%) | |||||||||||
| Guitar Center, Inc. 4.00%, due 07/15/2013 | 600 | 936 | |||||||||
| Total Convertible Bond (cost: $3,909) | 4,424 | ||||||||||
| Shares | Value | ||||||||||
| CONVERTIBLE PREFERRED STOCKS (0.5%) | |||||||||||
| Business Credit Institutions (0.1%) | |||||||||||
| Sovereign Capital Trust II ‡ | 9,500 | $ | 437 | ||||||||
| Electric Services (0.4%) | |||||||||||
| NRG Energy, Inc. | 4,000 | 990 | |||||||||
| Total Convertible Preferred Stocks (cost: $1,475) | 1,427 | ||||||||||
| PREFERRED STOCKS (1.6%) | |||||||||||
| Holding & Other Investment Offices (0.6%) | |||||||||||
| Saul Centers, Inc. | 1,850 | 49 | |||||||||
| Tanger Factory Outlet Centers REIT | 66,666 | 1,624 | |||||||||
| Telecommunications (1.0%) | |||||||||||
| Centaur Funding Corp.–144A ‡ | 2,275 | 2,699 | |||||||||
| Total Preferred Stocks (cost: $4,662) | 4,372 | ||||||||||
| Shares | Value | ||||||||||
| COMMON STOCKS (0.0%) | |||||||||||
| Telecommunications (0.0%) | |||||||||||
| Versatel Telecom International NV Warrants, Expires 5/15/2008 ‡m | 75 | $ | – | o | |||||||
| Total Common Stocks (cost: $1) | – | o | |||||||||
| Principal | Value | ||||||||||
| SECURITY LENDING COLLATERAL (4.1%) | |||||||||||
| Debt (3.8%) | |||||||||||
| Bank Notes (0.5%) | |||||||||||
| Bank of America | |||||||||||
| 4.81%, due 06/07/2006 * | $ | 358 | $ | 358 | |||||||
| 4.81%, due 08/10/2006 * | 346 | 346 | |||||||||
| Bear Stearns & Co. 5.01%, due 06/06/2006 * 5.01%, due 09/07/2006 * | 138 415 | 138 415 | |||||||||
| Certificates Of Deposit (0.3%) | |||||||||||
| Halifax Bank of Scotland 4.78%, due 06/06/2006 * | 346 | 346 | |||||||||
| Rabobank Nederland 4.87%, due 05/31/2006 * | 346 | 346 | |||||||||
| Commercial Paper (0.2%) | |||||||||||
| Banco Santander Central Hispano SA 4.77%, due 05/02/2006 | 207 | 207 | |||||||||
| Sheffield Receivables Corp.–144A 4.81%, due 05/03/2006 | 345 | 345 | |||||||||
| Euro Dollar Overnight (0.7%) | |||||||||||
| Bank of Montreal 4.77%, due 05/02/2006 | 276 | 276 | |||||||||
| Dexia Group 4.78%, due 05/04/2006 | 346 | 346 | |||||||||
| Fortis Bank 4.77%, due 05/01/2006 | 138 | 138 | |||||||||
| Royal Bank of Canada 4.77%, due 05/01/2006 | 484 | 484 | |||||||||
| Royal Bank of Scotland 4.75%, due 05/03/2006 | 345 | 345 | |||||||||
| Svenska Handlesbanken 4.82%, due 05/01/2006 | 264 | 264 | |||||||||
| Euro Dollar Terms (1.0%) | |||||||||||
| BancoBilbao Vizcaya Argentaria SA 4.95%, due 06/20/2006 | 276 | 276 | |||||||||
| Bank of the West 4.94%, due 06/16/2006 | 276 | 276 | |||||||||
| Barclays 4.79%, due 05/10/2006 4.77%, due 05/16/2006 | 415 138 | 415 138 | |||||||||
The notes to the financial statements are an integral part of this report.
Transamerica IDEX Mutual Funds
Semi-Annual Report 2006
5
TA IDEX Transamerica Flexible Income
SCHEDULE OF INVESTMENTS (continued)
At April 30, 2006
(all amounts except share amounts in thousands)
(unaudited)
| Principal | Value | ||||||||||
| Euro Dollar Terms (continued) | |||||||||||
| Canadian Imperial Bank of Commerce | |||||||||||
| 4.97%, due 06/23/2006 | $ | 207 | $ | 207 | |||||||
| Credit Suisse First Boston Corp. 4.73%, due 05/08/2006 | 207 | 207 | |||||||||
| Fortis Bank 4.83%, due 05/08/2006 | 138 | 138 | |||||||||
| Lloyds TSB Bank 4.81%, due 05/11/2006 | 207 | 207 | |||||||||
| Royal Bank of Scotland 4.87%, due 05/12/2006 | 276 | 276 | |||||||||
| Societe Generale 4.79%, due 05/10/2006 | 345 | 345 | |||||||||
| UBS AG 4.95%, due 06/20/2006 | 345 | 345 | |||||||||
| Repurchase Agreements (1.1%) †† | |||||||||||
| Credit Suisse First Boston Corp. 4.92%, dated 04/28/2006 to be repurchased at $469 on 05/01/2006 | 469 | 469 | |||||||||
| Goldman Sachs Group, Inc. (The) 4.92%, dated 04/28/2006 to be repurchased at $1,015 on 05/01/2006 | 1,015 | 1,015 | |||||||||
| Principal | Value | ||||||||||
| Repurchase Agreements (continued) | |||||||||||
| Lehman Brothers, Inc. 4.92%, dated 04/28/2006 to be repurchased at $17 on 05/01/2006 | $ | 17 | $ | 17 | |||||||
| Merrill Lynch & Co. 4.87%, dated 04/28/2006 to be repurchased at $1,037 on 05/01/2006 | 1,036 | 1,036 | |||||||||
| Morgan Stanley Dean Witter & Co. 4.93%, dated 04/28/2006 to be repurchased at $484 on 05/01/2006 | 484 | 484 | |||||||||
| Shares | Value | ||||||||||
| Investment Companies (0.3%) | |||||||||||
| Barclays Global Investors Institutional Money Market Fund 1-day yield of 4.78% | 552,698 | $ | 553 | ||||||||
| Merrimac Cash Fund, Premium Class 1-day yield of 4.61% @ | 147,054 | 147 | |||||||||
| Total Security Lending Collateral (cost: $10,905) | 10,905 | ||||||||||
| Total Investment Securities (cost: $281,149) # | $ | 275,712 | |||||||||
NOTES TO SCHEDULE OF INVESTMENTS:
† At April 30, 2006, all or a portion of this security is on loan (see Note 1). The value at April 30, 2006, of all securities on loan is $10,621.
(a) The security has a perpetual maturity. The date shown is the next call date.
(b) Coupon rate is fixed for a predetermined period of time and then converts to a floating rate until maturity date. Rate is listed as of April 30, 2006.
(c) Inmarsat Finance PLC has a coupon rate of 0.00% until 11/15/2008, thereafter the coupon rate will be 10.38%.
(d) Raytheon Co. has a stated liquidation amount of $50 (not in thousands) per trust preferred security. The expected maturity value of the security is $2,750. The interest rate was previously reported as 3.5%.
* Floating or variable rate note. Rate is listed as of April 30, 2006.
(e) NTK Holding, Inc. has a coupon rate of 0.00% until 09/01/2009, thereafter the coupon rate will be 10.75%.
(f) Armor Holding, Inc. has a coupon rate of 2.00% until 11/01/2011, thereafter the coupon rate will be 0.00%.
‡ Non-income producing.
o Value is less than $1.
†† Cash collateral for the Repurchase Agreements, valued at $3,110, that serve as collateral for securities lending are invested in corporate bonds with interest rates and maturity dates ranging from 0.00%–9.05% and 05/02/2006–12/31/2049, respectively.
§ Security is deemed to be illiquid.
@ Regulated investment company advised by Investors Bank and Trust Co. ("IBT"). IBT is also the accounting, custody and lending agent for the Fund.
m Securities valued as determined in good faith in accordance with procedure established by the Fund's Board of Trustees.
# Aggregate cost for Federal income tax purposes is $281,168. Aggregate gross unrealized appreciation for all securities in which there is an excess of value over tax cost and aggregate gross unrealized depreciation for all securities in which there is an excess of tax cost over value were $2,072 and $7,528, respectively. Net unrealized depreciation for tax purposes is $5,456.
DEFINITIONS:
144A 144A Securities are registered pursuant to Rule 144A of the Securities Act of 1933. These securities are deemed to be liquid for purposes of compliance limitations on holdings of illiquid securities and may be resold as transactions exempt from registration, normally to qualified institutional buyers. At April 30, 2006, these securities aggregated $56,121 or 20.8% of the net assets of the Fund.
REIT Real Estate Investment Trust
The notes to the financial statements are an integral part of this report.
Transamerica IDEX Mutual Funds
Semi-Annual Report 2006
6
TA IDEX Transamerica Flexible Income
STATEMENT OF ASSETS AND LIABILITIES
At April 30, 2006
(all amounts except per share amounts in thousands)
(unaudited)
| Assets: | |||||||
| Investment securities, at value (cost: $281,149) (including securities loaned of $10,621) | $ | 275,712 | |||||
| Cash | 934 | ||||||
| Receivables: | |||||||
| Investment securities sold | 6,620 | ||||||
| Shares of beneficial interest sold | 19 | ||||||
| Interest | 4,659 | ||||||
| Dividends | 31 | ||||||
| Dividend reclaims receivable | 3 | ||||||
| Other | 15 | ||||||
| 287,993 | |||||||
| Liabilities: | |||||||
| Investment securities purchased | 6,659 | ||||||
| Accounts payable and accrued liabilities: | |||||||
| Shares of beneficial interest redeemed | 144 | ||||||
| Management and advisory fees | 173 | ||||||
| Distribution and service fees | 36 | ||||||
| Transfer agent fees | 24 | ||||||
| Administration fees | 5 | ||||||
| Payable for collateral for securities on loan | 10,905 | ||||||
| Other | 40 | ||||||
| 17,986 | |||||||
| Net Assets | $ | 270,007 | |||||
| Net Assets Consist of: | |||||||
| Shares of beneficial interest, unlimited shares authorized, no par value | $ | 278,771 | |||||
| Distributable net investment income (loss) | 1,021 | ||||||
| Accumulated net realized gain (loss) from investment securities | (4,348 | ) | |||||
| Net unrealized appreciation (depreciation) on investment securities | (5,437 | ) | |||||
| Net Assets | $ | 270,007 | |||||
| Net Assets by Class: | |||||||
| Class A | $ | 18,521 | |||||
| Class B | 27,127 | ||||||
| Class C | 10,243 | ||||||
| Class I | 214,116 | ||||||
| Shares Outstanding: | |||||||
| Class A | 2,003 | ||||||
| Class B | 2,933 | ||||||
| Class C | 1,110 | ||||||
| Class I | 23,064 | ||||||
| Net Asset Value Per Share: | |||||||
| Class A | $ | 9.25 | |||||
| Class B | 9.25 | ||||||
| Class C | 9.23 | ||||||
| Class I | 9.28 | ||||||
| Maximum Offering Price Per Share (a): | |||||||
| Class A | $ | 9.71 | |||||
(a) Includes the maximum selling commission (represented as a percentage of offering price) which is reduced on certain levels of sales as set forth in the Prospectus. Net asset value per share for Classes B, C and I shares represents offering price. The redemption price for Classes B and C shares equals net
asset value less any applicable contingent deferred sales charge.
STATEMENT OF OPERATIONS
For the period ended April 30, 2006
(all amounts in thousands)
(unaudited)
| Investment Income: | |||||||
| Interest | $ | 7,943 | |||||
| Dividends | 207 | ||||||
| Income from loaned securities–net | 47 | ||||||
| 8,197 | |||||||
| Expenses: | |||||||
| Management and advisory fees | 1,076 | ||||||
| Distribution and service fees: | |||||||
| Class A | 53 | ||||||
| Class B | 150 | ||||||
| Class C | 57 | ||||||
| Transfer agent fees: | |||||||
| Class A | 30 | ||||||
| Class B | 38 | ||||||
| Class C | 15 | ||||||
| Class I | – | (b) | |||||
| Printing and shareholder reports | 12 | ||||||
| Custody fees | 20 | ||||||
| Administration fees | 28 | ||||||
| Legal fees | 7 | ||||||
| Audit fees | 9 | ||||||
| Trustees fees | 6 | ||||||
| Registration fees | 19 | ||||||
| Other | 3 | ||||||
| Total expenses | 1,523 | ||||||
| Net Investment Income (Loss) | 6,674 | ||||||
| Net Realized and Unrealized Gain (Loss): | |||||||
| Realized gain (loss) from investment securities | (3,334 | ) | |||||
| Increase (decrease) in unrealized appreciation (depreciation) on investment securities | 657 | ||||||
| Net Realized and Unrealized Gain (Loss) on Investment Securities | (2,677 | ) | |||||
| Net Increase (Decrease) in Net Assets Resulting from Operations | $ | 3,997 | |||||
(b) Rounds to less than $1.
The notes to the financial statements are an integral part of this report.
Transamerica IDEX Mutual Funds
Semi-Annual Report 2006
7
TA IDEX Transamerica Flexible Income
STATEMENTS OF CHANGES IN NET ASSETS
For the period or year ended
(all amounts in thousands)
| April 30, 2006 (unaudited) | October 31, 2005 (a)(b) | ||||||||||
| Increase (Decrease) In Net Assets From: | |||||||||||
| Operations: | |||||||||||
| Net investment income (loss) | $ | 6,674 | $ | 10,147 | |||||||
| Net realized gain (loss) from investment securities | (3,334 | ) | (1,014 | ) | |||||||
| Change in unrealized appreciation (depreciation) on investment securities | 657 | (8,115 | ) | ||||||||
| 3,997 | 1,018 | ||||||||||
| Distributions to Shareholders: | |||||||||||
| From net investment income: | |||||||||||
| Class A | (510 | ) | (4,870 | ) | |||||||
| Class B | (478 | ) | (1,177 | ) | |||||||
| Class C | (182 | ) | (490 | ) | |||||||
| Class I | (4,477 | ) | (3,611 | ) | |||||||
| (5,647 | ) | (10,148 | ) | ||||||||
| Return of capital | |||||||||||
| Class A | – | (619 | ) | ||||||||
| Class B | – | (150 | ) | ||||||||
| Class C | – | (62 | ) | ||||||||
| Class I | – | (459 | ) | ||||||||
| – | (1,290 | ) | |||||||||
| Capital Share Transactions: | |||||||||||
| Proceeds from shares sold: | |||||||||||
| Class A | 1,113 | 67,541 | |||||||||
| Class B | 979 | 1,674 | |||||||||
| Class C | 796 | 1,976 | |||||||||
| Class I | 118,332 | 110,068 | |||||||||
| 121,220 | 181,259 | ||||||||||
| Dividends and distributions reinvested: | |||||||||||
| Class A | 457 | 5,355 | |||||||||
| Class B | 379 | 1,061 | |||||||||
| Class C | 159 | �� | 455 | ||||||||
| Class I | 4,477 | 4,070 | |||||||||
| 5,472 | 10,941 | ||||||||||
| Cost of shares redeemed: | |||||||||||
| Class A | (123,271 | ) | (7,985 | ) | |||||||
| Class B | (6,581 | ) | (14,023 | ) | |||||||
| Class C | (4,094 | ) | (8,075 | ) | |||||||
| Class I | (18,001 | ) | – | ||||||||
| (151,947 | ) | (30,083 | ) | ||||||||
| Redemption fees: | |||||||||||
| Class B | 1 | – | |||||||||
| 1 | – | ||||||||||
(a) Statement of Changes in Net Assets has been restated. See Note 6.
(b) Class I was offered for investment on November 8, 2004.
| April 30, 2006 (unaudited) | October 31, 2005 (a)(b) | ||||||||||
| Automatic conversions: | |||||||||||
| Class A | 36 | 82 | |||||||||
| Class B | (36 | ) | (82 | ) | |||||||
| – | – | ||||||||||
| (25,254 | ) | 162,117 | |||||||||
| Net increase (decrease) in net assets | (26,904 | ) | 151,697 | ||||||||
| Net Assets: | |||||||||||
| Beginning of period | 296,911 | 145,214 | |||||||||
| End of period | $ | 270,007 | $ | 296,911 | |||||||
| Distributable Net Investment Income (Loss) | $ | 1,021 | $ | (6 | ) | ||||||
| Share Activity: | |||||||||||
| Shares issued: | |||||||||||
| Class A | 119 | 7,039 | |||||||||
| Class B | 105 | 175 | |||||||||
| Class C | 85 | 207 | |||||||||
| Class I | 12,656 | 11,417 | |||||||||
| 12,965 | 18,838 | ||||||||||
| Shares issued–reinvested from distributions: | |||||||||||
| Class A | 49 | 563 | |||||||||
| Class B | 41 | 111 | |||||||||
| Class C | 17 | 48 | |||||||||
| Class I | 478 | 427 | |||||||||
| 585 | 1,149 | ||||||||||
| Shares redeemed: | |||||||||||
| Class A | (13,231 | ) | (835 | ) | |||||||
| Class B | (703 | ) | (1,467 | ) | |||||||
| Class C | (438 | ) | (845 | ) | |||||||
| Class I | (1,914 | ) | – | ||||||||
| (16,286 | ) | (3,147 | ) | ||||||||
| Automatic conversions: | |||||||||||
| Class A | 4 | 9 | |||||||||
| Class B | (4 | ) | (9 | ) | |||||||
| – | – | ||||||||||
| Net increase (decrease) in shares outstanding: | |||||||||||
| Class A | (13,059 | ) | 6,776 | ||||||||
| Class B | (561 | ) | (1,190 | ) | |||||||
| Class C | (336 | ) | (590 | ) | |||||||
| Class I | 11,220 | 11,844 | |||||||||
| (2,736 | ) | 16,840 | |||||||||
The notes to the financial statements are an integral part of this report.
Transamerica IDEX Mutual Funds
Semi-Annual Report 2006
8
TA IDEX Transamerica Flexible Income
FINANCIAL HIGHLIGHTS
(unaudited for the period ended April 30, 2006 and the years ended December 31, 2005 and December 31, 2004)
| For a share of beneficial interest outstanding throughout each period | |||||||||||||||||||||||||||||||||||||||||||
| Net Asset | Investment Operations | Distributions | Net Asset | ||||||||||||||||||||||||||||||||||||||||
| For the Period Ended (d)(g) | Value, Beginning of Period | Net Investment Income (Loss) | Net Realized and Unrealized Gain (Loss) | Total Operations | From Net Investment Income | From Net Realized Gains | Return of Capital | Total Distributions | Value, End of Period | ||||||||||||||||||||||||||||||||||
| Class A | 4/30/2006 | $ | 9.31 | $ | 0.21 | $ | (0.10 | ) | $ | 0.11 | $ | (0.17 | ) | $ | – | $ | – | $ | (0.17 | ) | $ | 9.25 | |||||||||||||||||||||
| 10/31/2005 | 9.68 | 0.37 | (h) | (0.32 | ) (h) | 0.05 | (0.38 | ) (h) | – | (0.04 | ) (h) | (0.42 | ) | 9.31 | |||||||||||||||||||||||||||||
| 10/31/2004 | 10.21 | 0.38 | (h) | 0.14 | (h) | 0.52 | (0.38 | ) (h) | (0.63 | ) | (0.04 | ) (h) | (1.05 | ) | 9.68 | ||||||||||||||||||||||||||||
| 10/31/2003 | 9.94 | 0.36 | 0.27 | 0.63 | (0.36 | ) | – | – | (0.36 | ) | 10.21 | ||||||||||||||||||||||||||||||||
| 10/31/2002 | 9.99 | 0.40 | 0.02 | 0.42 | (0.41 | ) | (0.06 | ) | – | (0.47 | ) | 9.94 | |||||||||||||||||||||||||||||||
| 10/31/2001 | 9.26 | 0.47 | 0.71 | 1.18 | (0.45 | ) | – | – | (0.45 | ) | 9.99 | ||||||||||||||||||||||||||||||||
| Class B | 4/30/2006 | 9.32 | 0.18 | (0.10 | ) | 0.08 | (0.15 | ) | – | – | (0.15 | ) | 9.25 | ||||||||||||||||||||||||||||||
| 10/31/2005 | 9.68 | 0.29 | (h) | (0.32 | ) (h) | (0.03 | ) | (0.29 | ) (h) | – | (0.04 | ) (h) | (0.33 | ) | 9.32 | ||||||||||||||||||||||||||||
| 10/31/2004 | 10.20 | 0.32 | (h) | 0.15 | (h) | 0.47 | (0.32 | ) (h) | (0.63 | ) | (0.04 | ) (h) | (0.99 | ) | 9.68 | ||||||||||||||||||||||||||||
| 10/31/2003 | 9.94 | 0.30 | 0.25 | 0.55 | (0.29 | ) | – | – | (0.29 | ) | 10.20 | ||||||||||||||||||||||||||||||||
| 10/31/2002 | 9.99 | 0.34 | 0.02 | 0.36 | (0.35 | ) | (0.06 | ) | – | (0.41 | ) | 9.94 | |||||||||||||||||||||||||||||||
| 10/31/2001 | 9.26 | 0.37 | 0.74 | 1.11 | (0.38 | ) | – | – | (0.38 | ) | 9.99 | ||||||||||||||||||||||||||||||||
| Class C | 4/30/2006 | 9.30 | 0.18 | (0.10 | ) | 0.08 | (0.15 | ) | – | – | (0.15 | ) | 9.23 | ||||||||||||||||||||||||||||||
| 10/31/2005 | 9.67 | 0.29 | (h) | (0.33 | ) (h) | (0.04 | ) | (0.29 | ) (h) | – | (0.04 | ) (h) | (0.33 | ) | 9.30 | ||||||||||||||||||||||||||||
| 10/31/2004 | 10.20 | 0.33 | (h) | 0.13 | (h) | 0.46 | (0.32 | ) (h) | (0.63 | ) | (0.04 | ) (h) | (0.99 | ) | 9.67 | ||||||||||||||||||||||||||||
| 10/31/2003 | 9.98 | 0.29 | 0.22 | 0.51 | (0.29 | ) | – | – | (0.29 | ) | 10.20 | ||||||||||||||||||||||||||||||||
| Class I | 4/30/2006 | 9.35 | 0.23 | (0.10 | ) | 0.13 | (0.20 | ) | – | – | (0.20 | ) | 9.28 | ||||||||||||||||||||||||||||||
| 10/31/2005 | 9.68 | 0.40 | (h) | (0.32 | ) (h) | 0.08 | (0.37 | ) (h) | – | (0.04 | ) (h) | (0.41 | ) | 9.35 | |||||||||||||||||||||||||||||
| Ratios/Supplemental Data | |||||||||||||||||||||||||||||||
| For the Period | Total | Net Assets, End of Period | Ratio of Expenses to Average Net Assets (a) | Net Investment Income (Loss) to Average | Portfolio Turnover | ||||||||||||||||||||||||||
| Ended (g) | Return (c) | (000's) | Net (e) | Total (f) | Net Assets (a) | Rate (b) | |||||||||||||||||||||||||
| Class A | 4/30/2006 | 1.08 | % | $ | 18,521 | 1.39 | % | 1.39 | % | 4.52 | % | 74 | % | ||||||||||||||||||
| 10/31/2005 | 0.47 | 140,203 | 1.25 | 1.25 | 3.85 | (h) | 58 | ||||||||||||||||||||||||
| 10/31/2004 | 5.72 | 80,201 | 1.43 | 1.43 | 3.89 | (h) | 169 | ||||||||||||||||||||||||
| 10/31/2003 | 6.39 | 87,898 | 1.49 | 1.50 | 3.56 | 164 | |||||||||||||||||||||||||
| 10/31/2002 | 4.45 | 61,815 | 1.62 | 1.65 | 4.23 | 245 | |||||||||||||||||||||||||
| 10/31/2001 | 13.14 | 29,600 | 1.68 | 1.70 | 4.84 | 315 | |||||||||||||||||||||||||
| Class B | 4/30/2006 | 0.83 | 27,127 | 2.10 | 2.10 | 3.78 | 74 | ||||||||||||||||||||||||
| 10/31/2005 | (0.36 | ) | 32,560 | 2.08 | 2.08 | 3.02 | (h) | 58 | |||||||||||||||||||||||
| 10/31/2004 | 5.13 | 45,338 | 2.03 | 2.03 | 3.25 | (h) | 169 | ||||||||||||||||||||||||
| 10/31/2003 | 5.59 | 69,502 | 2.14 | 2.15 | 2.91 | 164 | |||||||||||||||||||||||||
| 10/31/2002 | 3.83 | 67,220 | 2.27 | 2.30 | 3.58 | 245 | |||||||||||||||||||||||||
| 10/31/2001 | 12.28 | 40,435 | 2.33 | 2.35 | 4.19 | 315 | |||||||||||||||||||||||||
| Class C | 4/30/2006 | 0.83 | 10,243 | 2.11 | 2.11 | 3.79 | 74 | ||||||||||||||||||||||||
| 10/31/2005 | (0.40 | ) | 13,439 | 2.11 | 2.11 | 2.99 | (h) | 58 | |||||||||||||||||||||||
| 10/31/2004 | 5.02 | 19,675 | 2.10 | 2.10 | 3.37 | (h) | 169 | ||||||||||||||||||||||||
| 10/31/2003 | 5.16 | 8,178 | 2.14 | 2.15 | 2.91 | 164 | |||||||||||||||||||||||||
| Class I | 4/30/2006 | 1.39 | 214,116 | 0.85 | 0.85 | 5.04 | 74 | ||||||||||||||||||||||||
| 10/31/2005 | 0.85 | 110,709 | 0.85 | 0.85 | 4.25 | (h) | 58 | ||||||||||||||||||||||||
The notes to the financial statements are an integral part of this report.
Transamerica IDEX Mutual Funds
Semi-Annual Report 2006
9
TA IDEX Transamerica Flexible Income
FINANCIAL HIGHLIGHTS (continued)
(unaudited)
NOTES TO FINANCIAL HIGHLIGHTS
(a) Annualized.
(b) Not annualized.
(c) Total Return has been calculated for the applicable period without deduction of a sales load, if any, on an initial purchase. Not annualized.
(d) Per share information is calculated based on average number of shares outstanding.
(e) Ratio of Net Expenses to Average Net Assets is net of fee waivers and reimbursements by the investment adviser, if any (see note 2).
(f) Ratio of Total Expenses to Average Net Assets includes all expenses before waivers and reimbursements by the investment adviser.
(g) The inception dates for the Fund's offering of share classes were as follows:
Class C was November 11, 2002.
Class I was November 8, 2004.
(h) The Fund has restated its financial highlights. (See Note 6)
The notes to the financial statements are an integral part of this report.
Transamerica IDEX Mutual Funds
Semi-Annual Report 2006
10
TA IDEX Transamerica Flexible Income
NOTES TO FINANCIAL STATEMENTS
At April 30, 2006
(all amounts in thousands)
(unaudited)
NOTE 1. ORGANIZATION AND SIGNIFICANT ACCOUNTING POLICIES
Transamerica IDEX Mutual Funds is an open-end management investment company registered under the Investment Company Act of 1940, as amended (the "1940 Act").
In the normal course of business, TA IDEX Transamerica Flexible Income (the "Fund") enters into contracts that contain a variety of representations that provide general indemnifications. The Fund's maximum exposure under these arrangements is unknown, as this would involve future claims that may be made against the Fund and/or its affiliates that have not yet occurred. However, based on experience, the Fund expects the risk of loss to be remote.
This report should be read in conjunction with the current Fund prospectus, which contains more complete information about the Fund.
In preparing the Fund's financial statements in accordance with accounting principles generally accepted in the United States of America ("GAAP"), estimates or assumptions (which could differ from actual results) may be used that affect reported amounts and disclosures. The following is a summary of significant accounting policies followed by the Fund.
Multiple class operations, income and expenses: The Fund currently offers four classes of shares, Class A, Class B, Class C and Class I, each with a public offering price that reflects different sales charges, if any, and expense levels. Class I is only available for investment to certain affiliated asset allocation funds. Class B shares will convert to Class A shares eight years after purchase. Income, non-class specific expenses and realized and unrealized gains and losses, are allocated daily to each class, based upon the value of shares outstanding method as permitted under Rule 18f-3 of the 1940 Act. Each class bears its own specific expenses as well as a portion of general common expenses.
Security valuations: The Fund values its investments at the close of the New York Stock Exchange ("NYSE"), normally 4 p.m. ET, each day the NYSE is open for business. Fund investments are valued at the last sale price or closing price on the day of valuation taken from the primary exchange where the security is principally traded.
Securities traded in the over-the-counter market and listed securities for which no sale was reported on that date are valued at the last quoted bid price.
Debt securities are valued based on a price quotation or other equivalent indication of value supplied by an exchange, a pricing service or a major market maker; however, those that mature in sixty days or less are valued at amortized cost, which approximates market.
Investment company securities are valued at the net asset value of the underlying portfolio.
Other securities for which quotations are not readily available or whose values have been determined to be unreliable are valued at fair market value as determined in good faith by the Fund's Administrative Valuation Committee, under the supervision of the Board's Valuation Committee, using guidelines adopted by the Board of Trustees.
Cash: The Fund may leave cash overnight in its cash account with the custodian, Investors Bank & Trust Company ("IBT"). IBT has been contracted on behalf of the Fund to invest the excess cash into a savings account, which at April 30, 2006, was paying an interest rate of 3.24%.
Repurchase agreements: The Fund is authorized to enter into repurchase agreements. The Fund, through its custodian, IBT, receives delivery of the underlying securities, the value of which at the time of purchase is required to be an amount equal to at least 100% of the resale price. The Fund will bear the risk of value fluctuations until the security can be sold and may encounter delays and incur costs in liquidating the security. In the event of bankruptcy or insolvency of the seller, delays and costs may be incurred.
Securities lending: The Fund may lend securities to qualified borrowers, with IBT acting as the Fund's lending agent. The Fund earns negotiated lenders' fees. The Fund receives cash and/or securities as collateral against the loaned securities. Cash collateral received is invested in short term, interest bearing securities. The Fund monitors the market value of securities loaned on a daily basis and requires collateral in an amount at least equal to the value of the securities loaned. Income from loaned securities on the Statement of Operations is net of fees, in the amount of $20, earned by IBT for its services.
Real Estate Investment Trusts ("REITs"): There are certain additional risks involved in investing in REITs. These include, but are not limited to, economic conditions, changes in zoning laws, real estate values, property taxes and interest rates.
Security transactions and investment income: Security transactions are recorded on the trade date. Security gains and losses are calculated on the specific identification basis. Dividend income, if any, is recorded on the ex-dividend date or, in the case of foreign securities, as soon as the Fund is informed of the ex-dividend date. Interest income, including accretion of discounts and amortization of premiums, is recorded on the accrual basis commencing on the settlement date.
Redemption fees: A short-term trading redemption fee may be assessed on any Fund shares in a fund account that are sold during the first five (5) NYSE trading days following their purchase date. This redemption fee will equal 2% of the amount redeemed and shares held the longest will be treated as being redeemed first and shares held the shortest as being redeemed last. For the six months ended April 30, 2006, the Fund received less than $1 in redemption fees.
Transamerica IDEX Mutual Funds
Semi-Annual Report 2006
11
TA IDEX Transamerica Flexible Income
NOTES TO FINANCIAL STATEMENTS (continued)
At April 30, 2006
(all amounts in thousands)
(unaudited)
NOTE 1.–(continued)
Dividend distributions: Distributions to shareholders are recorded on the ex-dividend date and are determined in accordance with Federal income tax regulations which may differ from GAAP.
NOTE 2. RELATED PARTY TRANSACTIONS
Transamerica Fund Advisors, Inc. ("TFAI") is the Fund's investment adviser. Transamerica Fund Services, Inc. ("TFS") is the Fund's administrator and transfer agent. AFSG Securities Corp. ("AFSG") is the Fund's distributor/principal underwriter. TFAI, TFS, and AFSG are affiliates of AEGON, NV, a Netherlands corporation.
Transamerica Investment Management, LLC is both an affiliate of the Fund and a sub-adviser to the Fund.
Certain officers and trustees of the Fund are also officers and/or directors of TFAI, TFS and AFSG.
The following schedule reflects the percentage of Fund assets owned by affiliated investment companies at April 30, 2006:
| Net Assets | % of Net Assets | ||||||||||
| TA IDEX Asset Allocation– Conservative Portfolio | $ | 25,442 | 9.42 | % | |||||||
| TA IDEX Asset Allocation– Moderate Portfolio | 49,241 | 18.24 | % | ||||||||
| TA IDEX Asset Allocation– Moderate Growth Portfolio | 45,146 | 16.72 | % | ||||||||
| Asset Allocation– Conservative Portfolio | 32,918 | 12.19 | % | ||||||||
| Asset Allocation– Moderate Growth Portfolio | 39,509 | 14.63 | % | ||||||||
| Asset Allocation– Moderate Portfolio | 21,781 | 8.07 | % | ||||||||
| Total | $ | 214,037 | 79.27 | % | |||||||
Investment advisory fees: The Fund pays management fees to TFAI based on average daily net assets ("ANA") at the following breakpoints:
0.80% of the first $100 million of ANA
0.775% of the next $150 million of ANA
0.675% of ANA over $250 million
TFAI has contractually agreed to waive its advisory fee and will reimburse the Fund to the extent that operating expenses, excluding 12b-1 fees, exceed the following stated annual limit:
1.50% Expense Limit
If total Fund expenses fall below the annual expense limitation agreement agreed to by the adviser within the succeeding three years, the Fund may be required to pay the adviser a portion or all of the reimbursed class expenses.
There are no amounts available for recapture at April 30, 2006.
Distribution and service fees: The Fund has a 12b-1 distribution plan under the 1940 Act pursuant to which an annual fee, based on average daily net assets, is paid to the distributor for various disbursements such as broker-dealer account servicing fees and other promotional expenses of the Fund. The Fund is authorized under the 12b-1 plan to pay fees on each class up to the following limits:
| Class A | 0.35 | % | |||||
| Class B | 1.00 | % | |||||
| Class C | 1.00 | % | |||||
| Class I | N/A | ||||||
In the case the Fund or a class of shares of the Fund is closed to new investors or investments, the Fund is authorized to pay 12b-1 fees for past sales and distribution efforts and present and past investor services.
Underwriter commissions relate to front-end sales charges imposed for Class A shares and contingent deferred sales charges from Classes B, C, and certain A share redemptions. For the six months ended April 30, 2006, the underwriter commissions were as follows:
| Received by Underwriter | $ | 20 | |||||
| Retained by Underwriter | 4 | ||||||
| Contingent Deferred Sales Charge | 59 | ||||||
Administrative services: The Fund has entered into an agreement with TFS for financial and legal fund administration services. The Fund pays TFS an annual fee of 0.02% of ANA. The Legal fees on the Statement of Operations are fees paid to external legal counsel.
Transfer agent fees: The Fund pays TFS an annual per-account charge for each open and closed account. The Fund paid TFS $80 for the six months ended April 30, 2006.
Deferred compensation plan: Each eligible independent Fund Trustee may elect to participate in a non-qualified deferred compensation plan maintained by Transamerica IDEX Mutual Funds (the "Plan"). Under the Plan, such Trustees may defer payment of all or a portion of their total fees earned as a Fund Trustee. Each Trustee who is a participant in the Plan may elect that the earnings, losses or gains credited to his or her deferred fee amounts be determined based on a deemed investment in any series of Transamerica IDEX Mutual Funds, including the Fund.
Transamerica IDEX Mutual Funds
Semi-Annual Report 2006
12
TA IDEX Transamerica Flexible Income
NOTES TO FINANCIAL STATEMENTS (continued)
At April 30, 2006
(all amounts in thousands)
(unaudited)
NOTE 2.–(continued)
The right of a participant to receive a distribution from the Plan of the deferred fees is an unsecured claim against the general assets of all series of Transamerica IDEX Mutual Funds. The pro rata liability to the Fund of all deferred fees in the Plan amounted, as of April 30, 2006, to $15.
NOTE 3. INVESTMENT TRANSACTIONS
The cost of securities purchased and proceeds from securities sold (excluding short-term securities) for the six months ended April 30, 2006 were as follows:
| Purchases of securities: | |||||||
| Long-Term | $ | 159,683 | |||||
| U.S. Government | 39,597 | ||||||
| Proceeds from maturities and sales of securities: | |||||||
| Long-Term | 112,385 | ||||||
| U.S. Government | 111,657 | ||||||
NOTE 4. FEDERAL INCOME TAX MATTERS
The Fund has not made any provision for federal income or excise taxes due to its policy to distribute all of its taxable income and capital gains to its shareholders and otherwise qualify as a regulated investment company under Subchapter M of the Internal Revenue Code. Income and capital gain distributions are determined in accordance with income tax regulations, which may differ from GAAP. These differences are primarily due to differing treatment for items including, but not limited to, wash sales, and capital loss carryforwards.
The capital loss carryforward is available to offset future realized capital gains through the period listed:
| Capital Loss Carryforward | Available through | ||||||
| $ | 890 | October 31, 2013 | |||||
NOTE 5. REGULATORY PROCEEDINGS
There continues to be significant federal and state regulatory activity relating to financial services companies, particularly mutual fund companies and their investment advisers. As part of an ongoing investigation regarding potential market timing, recordkeeping and trading compliance issues and matters affecting the Fund's investment adviser, TFAI, and certain affiliates and former employees of TFAI, the SEC staff has indicated that it is likely to take some action against TFAI and certain of its affiliates at the conclusion of the investigation. The potential timing and the scope of any such action is difficult to predict. Although the impact of any action brought against TFAI and/or its affiliates is difficult to assess at the present time, the Fund currently believes that the likelihood that any such action will have a material adverse impact on it is remote. It is important to note that the Fund is not aware of any allegation of wrongdoing against it and its Board at the time this semi-annual report is printed. Although it is not anticipated that these developments will have an adverse impact on the Fund, there can be no assurance at this time. TFAI and its affiliates are actively working with the SEC in regard to this matter; however, the exact resolution cannot be determined at this time. TFAI will take such actions that it deems necessary or appropriate to continue providing management services to the Fund and to bring all matters to an appropriate conclusion.
TFAI and/or its affiliates, and not the Fund, will bear the costs regarding these regulatory matters.
NOTE 6. RESTATEMENT
The Fund's previously issued financial statements presented accretion of discount incorrectly for the years ended October 31, 2005 and October 31, 2004. This was due to the security Raytheon Co. accreting discount based on an incorrect maturity value. The impact of correcting the maturity value of Raytheon Co. was to reduce interest income on the Statement of Operations with an offsetting adjustment to unrealized gain (loss). The financial highlights have also been restated accordingly. This restatement had no effect on the Fund's net assets, net asset value per share or total increase (decrease) in net assets from operations during the periods.
This restatement changed the financial statements as follows:
| Statement of Changes in Net Assets For the year ended October 31, 2005 | (As previously reported) | (As restated) | |||||||||
| Net Investment Income (Loss) | 11,432 | 10,147 | |||||||||
| Change in unrealized appreciation (depreciation) on investment securities | (9,400 | ) | (8,115 | ) | |||||||
| Distributions to Shareholders: | |||||||||||
| From net investment income: | |||||||||||
| Class A | (5,489 | ) | (4,870 | ) | |||||||
| Class B | (1,327 | ) | (1,177 | ) | |||||||
| Class C | (552 | ) | (490 | ) | |||||||
| Class I | (4,070 | ) | (3,611 | ) | |||||||
| Return of capital: | |||||||||||
| Class A | – | (619 | ) | ||||||||
| Class B | – | (150 | ) | ||||||||
| Class C | – | (62 | ) | ||||||||
| Class I | – | (459 | ) | ||||||||
Transamerica IDEX Mutual Funds
Semi-Annual Report 2006
13
TA IDEX Transamerica Flexible Income
NOTES TO FINANCIAL STATEMENTS (continued)
At April 30, 2006
(all amounts in thousands)
(unaudited)
NOTE 6.–(continued)
| Financial Highlights For the year ended October 31, 2005 | (As previously reported) | (As restated) | |||||||||
| Net investment income (loss) per share: | |||||||||||
| Class A | 0.41 | 0.37 | |||||||||
| Class B | 0.34 | 0.29 | |||||||||
| Class C | 0.33 | 0.29 | |||||||||
| Class I | 0.44 | 0.40 | |||||||||
| Net realized and unrealized gain (loss) per share: | |||||||||||
| Class A | (0.36 | ) | (0.32 | ) | |||||||
| Class B | (0.37 | ) | (0.32 | ) | |||||||
| Class C | (0.37 | ) | (0.33 | ) | |||||||
| Class I | (0.36 | ) | (0.32 | ) | |||||||
| Distributions from net investment income per share: | |||||||||||
| Class A | (0.42 | ) | (0.38 | ) | |||||||
| Class B | (0.33 | ) | (0.29 | ) | |||||||
| Class C | (0.33 | ) | (0.29 | ) | |||||||
| Class I | (0.41 | ) | (0.37 | ) | |||||||
| Distributions of return of capital per share: | |||||||||||
| Class A | – | (0.04 | ) | ||||||||
| Class B | – | (0.04 | ) | ||||||||
| Class C | – | (0.04 | ) | ||||||||
| Class I | – | (0.04 | ) | ||||||||
| Ratio of Net Investment Income (Loss) to Average Net Assets | |||||||||||
| Class A | 4.33 | % | 3.85 | % | |||||||
| Class B | 3.50 | % | 3.02 | % | |||||||
| Class C | 3.47 | % | 2.99 | % | |||||||
| Class I | 4.73 | % | 4.25 | % | |||||||
| Financial Highlights For the year ended October 31, 2004 | (As previously reported) | (As restated) | |||||||||
| Net investment income (loss) per share: | |||||||||||
| Class A | 0.41 | 0.38 | |||||||||
| Class B | 0.35 | 0.32 | |||||||||
| Class C | 0.36 | 0.33 | |||||||||
| Net realized and unrealized gain (loss) per share: | |||||||||||
| Class A | 0.11 | 0.14 | |||||||||
| Class B | 0.12 | 0.15 | |||||||||
| Class C | 0.10 | 0.13 | |||||||||
| Distributions from net investment income per share: | |||||||||||
| Class A | (0.42 | ) | (0.38 | ) | |||||||
| Class B | (0.36 | ) | (0.32 | ) | |||||||
| Class C | (0.36 | ) | (0.32 | ) | |||||||
| Distributions return of capital per share: | |||||||||||
| Class A | – | (0.04 | ) | ||||||||
| Class B | – | (0.04 | ) | ||||||||
| Class C | – | (0.04 | ) | ||||||||
| Ratio of Net Investment Income (Loss) to Average Net Assets | |||||||||||
| Class A | 4.25 | % | 3.89 | % | |||||||
| Class B | 3.61 | % | 3.25 | % | |||||||
| Class C | 3.74 | % | 3.37 | % | |||||||
Transamerica IDEX Mutual Funds
Semi-Annual Report 2006
14
TA IDEX Transamerica Flexible Income
INVESTMENT ADVISORY AND SUB-ADVISORY AGREEMENTS – REVIEW AND RENEWAL (unaudited)
At a meeting of the Board of Trustees of Transamerica IDEX Mutual Funds ("TA IDEX") held on November 2, 2005, the Board reviewed and considered the Investment Advisory Agreement between TA IDEX Transamerica Flexible Income (the "Fund") and Transamerica Fund Advisors, Inc. ("TFAI"), as well as the Investment Sub-Advisory Agreement of the Fund between TFAI and Transamerica Investment Management, LLC (the "Sub-Adviser"), to determine whether the agreements should be renewed for a one-year period. Following their review and consideration, the Trustees determined that the Investment Advisory Agreement and the Investment Sub-Advisory Agreement will enable shareholders of the Fund to obtain high quality services at a cost that is appropriate, reasonable, and in the best interests of its shareholders. The Board, including the independent members of the Board, unanimously approved the renewal of the Investment Advisory Agreement and the Investment Sub-Advisory Agreement. In reaching their decision, the Trustees requested and obtained from TFAI and the Sub-Adviser such information as they deemed reasonably necessary to evaluate the proposed agreements. The Trustees also carefully considered the information that they had received throughout the year from TFAI and the Sub-Adviser (such as in-person presentations by the Sub-Adviser) as part of their regular oversight of the Fund, as well as: comparative fee, expense and performance information prepared by Lipper Inc. ("Lipper"), independent providers of mutual fund performance, fee and expense information, and profitability data. In considering the proposed continuation of the Investment Advisory Agreement and the Investment Sub-Advisory Agreement, the Trustees evaluated a number of considerations that they believe, in light of the legal advice furnished to them by TA IDEX counsel and independent legal counsel and their own business judgment, to be relevant. They based their decisions on the fo llowing considerations, among others, although they did not identify any consideration or particular information that was controlling of their decisions:
The nature, extent and quality of the advisory service to be provided. The Board considered the nature and quality of the services provided by TFAI and the Sub-Adviser to the Fund in the past, as well as the services anticipated to be provided in the future. The Board concluded that TFAI and the Sub-Adviser are capable of providing high quality services to the Fund, as indicated by the nature and quality of services provided in the past, TFAI's and the Sub-Adviser's management capabilities demonstrated with respect to the funds they manage, including the Fund, and the experience, capability and integrity of TFAI's senior management, the financial resources of TFAI and the Sub-Adviser, TFAI's management oversight process, and the professional qualifications and experience of the Sub-Adviser's portfolio management team. The Trustees also concluded that TFAI and the Sub-Adviser proposed to provide investment and related services that were of the same quality and quantity as services provided to the Fund in the past, and that these services are appropriate in scope and extent in light of the Fund's operations, the competitive landscape of the investment company business and investor needs, and that TFAI's and the Sub-Adviser's obligations will remain substantially the same.
The investment performance of the Fund. The Board examined both the short-term and longer-term performance of the Fund, including relative performance against a benchmark securities index and a peer group of comparable mutual funds as prepared by Lipper, for various trailing periods ended June 30, 2005. The Trustees concluded that TFAI and the Sub-Adviser generally had achieved competitive investment performance, noting that although the performance of the Fund has been below or at median relative to its peers and approximated the benchmark index over the past two-, three-, and five-year periods, its performance has been above median relative to its peers and better than the benchmark index over the past one-year period. On the basis of the Trustees' assessment of the nature, extent and quality of advisory services to be provided or procured by TFAI a nd the Sub-Adviser, the Trustees concluded that TFAI and the Sub-Adviser are capable of generating a level of investment performance that is appropriate in light of the Fund's investment objective, policies and strategies and competitive with many other investment companies, and also determined that TFAI's and the Sub-Adviser's performance records indicate that their continued management is likely to benefit the Fund and its shareholders.
The cost of advisory services provided and the level of profitability. The Board reviewed profitability information regarding TFAI's costs of procuring portfolio management services, as well as the costs of provision of administration, transfer agency, fund accounting and other services, to the Fund and to TA IDEX as a whole by TFAI and its affiliates. The Trustees reviewed data from Lipper that compared the Fund's management fees (including management fees at various asset levels), other fees and expenses (including total expenses including and excluding 12b-1 distribution and service fees) and portfolio turnover rate against a peer group of comparable mutual funds. The Board expressed concerns about the relatively high level of fees and expenses paid by the Fund, while noting that the Fund's performance was competitive (and very competitive over the past year), and concluded that the relatively high level of fees and expenses may be attributable, at least in part, to the small asset size of the Fund. Based on such information, the Trustees determined that the management fees and overall expense ratio of the Fund are acceptable, although the Board requested that TFAI and the Sub-Adviser consider ways to reduce expenses. In addition, on the basis of the Board's review of the management fees to be charged by TFAI for investment advisory and related services, TFAI profitability information (derived from TFAI's audited financial statements), TFAI's estimated management income resulting from its management of the Fund, the estimated margin of the Sub-Adviser, as well as the entirety of TFAI's and its affiliates' service relationship with TA IDEX, the Board concluded that the level of investment management fees and other service fees, as well as TFAI's and the Sub-Adviser's profitability, are appropriate in light of the services provided, the management fees and overall
Transamerica IDEX Mutual Funds
Semi-Annual Report 2006
15
TA IDEX Transamerica Flexible Income (continued)
expense ratios of comparable investment companies and the anticipated profitability of the relationship between the Fund, TFAI and its affiliates, and the Sub-Adviser.
Whether fee levels reflect economies of scale and the extent to which economies of scale would be realized as the Fund grows. The Board concluded that the inclusion of asset-based breakpoints in the Fund's advisory fee schedule appropriately benefits investors by realizing economies of scale in the form of lower management fees as the level of assets grows. In addition, the Board concluded that the Fund's management fees appropriately reflect the Fund's current size, the current economic environment for TFAI, the competitive nature of the investment company market, and TFAI's pricing strategy. The Trustees also concluded that they will have the opportunity to periodically reexamine whether the Fund has achieved economies of scale, and the appropriateness of management fees payable to TFAI and fees payable by TFAI to the Sub-Adviser, in the future.
Benefits (such as soft dollars) to TFAI, its affiliates, or the Sub-Adviser from their relationship with the Fund. The Board concluded that other benefits derived by TFAI, its affiliates, and the Sub-Adviser from their relationship with the Fund are reasonable and fair, and are consistent with industry practice and the best interests of the Fund and its shareholders. In this regard, the Board noted that neither TFAI nor the Sub-Adviser realizes "soft dollar" benefits from its relationship with the Fund. In addition, the Trustees determined that the administration, transfer agency, fund accounting and other fees paid by the Fund to affiliates of TFAI are reasonable, fair and in the best interests of shareholders in light of the nature and quality of the services provided, the associated costs to these affiliates of providing the services, the impact of the costs of such services on the Fund's overall operating expenses, and the necessity of the services for the Fund's operations.
Other considerations. The Board determined that TFAI had made a substantial commitment to the recruitment and retention of high quality personnel, and maintained the financial, compliance and operational resources reasonably necessary to manage the Fund in a professional manner that is consistent with the best interests of the Fund and its shareholders. In this regard, the Trustees favorably considered the procedures and policies in place by TFAI to enforce compliance with applicable laws and regulations and oversee the portfolio management activities of the Sub-Adviser. The Trustees also determined that TFAI had made a significant entrepreneurial commitment to the management and success of the Fund, reflected by TFAI's expense limitation and fee waiver arrangement with the Fund, which may result in TFAI waiving advisory fees for the benefit of shareh olders.
Transamerica IDEX Mutual Funds
Semi-Annual Report 2006
16
TA IDEX Transamerica Growth Opportunities
UNDERSTANDING YOUR FUND'S EXPENSES
(unaudited)
SHAREHOLDER EXPENSES
Fund shareholders may incur two types of costs: (1) transaction costs, including sales charges (loads) on purchases, contingent deferred sales charges on redemptions and redemption fees; and (2) ongoing costs, including management fees, 12b-1 distribution and service fees, and other fund expenses.
The following Example is intended to help you understand your ongoing costs (in dollars and cents) of investing in the Fund and to compare these costs with the ongoing costs of investing in other funds.
The Example is based on an investment of $1,000 invested at November 1, 2005 and held for the entire period until April 30, 2006.
ACTUAL EXPENSES
The first line in the table below provides information about actual account values and actual expenses. You may use the information in this line, together with the amount you invested, to estimate the expenses that you paid over the period. Simply divide your account value by $1,000 (for example, an $8,600 account value divided by $1,000 = 8.6), then multiply the result by the number in the first line of your Fund under the heading entitled "Expenses Paid During Period" to estimate the expenses you paid on your account during this period. If your account is an IRA, your expenses could have included a $15 annual fee. The amount of any fee paid through your account would increase the estimate of expenses you paid during the period and decrease your ending account value.
HYPOTHETICAL EXAMPLE FOR COMPARISON PURPOSES
The second line in the table below provides information about hypothetical account values and hypothetical expenses based on the Fund's actual expense ratio and an assumed rate of return of 5% per year before expenses, which is not the Fund's actual return. The hypothetical account values and expenses may not be used to estimate the actual ending account balance or expenses you paid for the period. You may use this information to compare the ongoing costs of investing in your Fund and other funds. To do so, compare this 5% hypothetical example with the 5% hypothetical examples that appear in the shareholder reports of the other funds. As in the case of the actual expense example, if your account is subject to an IRA fee, the amount of the fee paid through your account would increase the hypothetical expenses you would have paid during the period and decrease the hypothetical ending account value.
Please note that the expenses shown in the table are meant to highlight your ongoing costs only and do not reflect any transactional costs, such as sales charges, redemption fees, brokerage commissions paid on purchases and sales of fund shares. Therefore, the second line under the Fund in the table is useful in comparing ongoing costs only, and will not help you determine the relative total costs of owning different funds. If any of these transaction costs were included, your costs would be higher. The expenses shown in the table do not reflect any fees that may be charged to you by brokers, financial intermediaries or other financial institutions.
| Beginning Account Value | Ending Account Value | Annualized Expense Ratio | Expenses Paid During Period(a) | ||||||||||||||||
| Class A | |||||||||||||||||||
| Actual | $ | 1,000.00 | $ | 1,143.90 | 1.71 | % | $ | 9.09 | |||||||||||
| Hypothetical (b) | 1,000.00 | 1,016.31 | 1.71 | 8.55 | |||||||||||||||
| Class B | |||||||||||||||||||
| Actual | 1,000.00 | 1,140.40 | 2.40 | 12.74 | |||||||||||||||
| Hypothetical (b) | 1,000.00 | 1,012.89 | 2.40 | 11.98 | |||||||||||||||
| Class C | |||||||||||||||||||
| Actual | 1,000.00 | 1,140.20 | 2.40 | 12.74 | |||||||||||||||
| Hypothetical (b) | 1,000.00 | 1,012.89 | 2.40 | 11.98 | |||||||||||||||
| Class I | |||||||||||||||||||
| Actual | 1,000.00 | 1,127.70 | 0.88 | 4.26 | |||||||||||||||
| Hypothetical (b) | 1,000.00 | 1,018.74 | 0.88 | 4.04 | |||||||||||||||
(a) Expenses are calculated using the Fund's annualized expense ratio (as disclosed in the table), multiplied by the average account value for the period, multiplied by number of days in the period (181 days for Classes A, B and C, and 166 days for Class I), and divided by the number of days in the year (365 days).
(b) 5% return per year before expenses.
GRAPHICAL PRESENTATION OF SCHEDULE OF INVESTMENTS
By Sector
At April 30, 2006
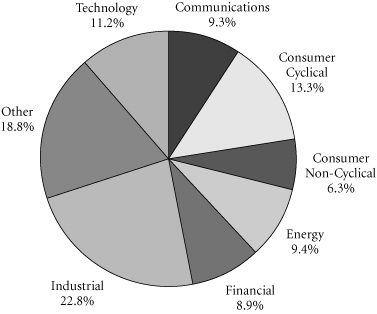
This chart shows the percentage breakdown by sector of the Fund's total investment securities.
Transamerica IDEX Mutual Funds
Semi-Annual Report 2006
1
TA IDEX Transamerica Growth Opportunities
SCHEDULE OF INVESTMENTS
At April 30, 2006
(all amounts except share amounts in thousands)
(unaudited)
| Shares | Value | ||||||||||
| COMMON STOCKS (94.6%) | |||||||||||
| Amusement & Recreation Services (3.0%) | |||||||||||
| Station Casinos, Inc. † | 158,940 | $ | 12,251 | ||||||||
| Automotive (1.2%) | |||||||||||
| ITT Industries, Inc. | 82,000 | 4,611 | |||||||||
| Commercial Banks (2.6%) | |||||||||||
| Wintrust Financial Corp. | 199,410 | 10,319 | |||||||||
| Communication (6.3%) | |||||||||||
| Global Payments, Inc. | 334,074 | 15,845 | |||||||||
| XM Satellite Radio Holdings, Inc.–Class A †‡ | 463,460 | 9,371 | |||||||||
| Computer & Data Processing Services (6.4%) | |||||||||||
| Digital Insight Corp. ‡ | 244,660 | 8,438 | |||||||||
| Intuit, Inc. ‡ | 56,320 | 3,051 | |||||||||
| NAVTEQ Corp. †‡ | 230,454 | 9,568 | |||||||||
| THQ, Inc. †‡ | 189,770 | 4,864 | |||||||||
| Computer & Office Equipment (3.8%) | |||||||||||
| Sandisk Corp. †‡ | 237,310 | 15,147 | |||||||||
| Educational Services (1.2%) | |||||||||||
| Strayer Education, Inc. † | 47,800 | 4,971 | |||||||||
| Electronic Components & Accessories (1.0%) | |||||||||||
| Microchip Technology, Inc. | 109,430 | 4,077 | |||||||||
| Engineering & Management Services (4.7%) | |||||||||||
| Jacobs Engineering Group, Inc. ‡ | 229,116 | 18,948 | |||||||||
| Hardware Stores (4.6%) | |||||||||||
| Fastenal Co. † | 395,750 | 18,525 | |||||||||
| Hotels & Other Lodging Places (4.6%) | |||||||||||
| Hilton Hotels Corp. | 393,210 | 10,593 | |||||||||
| Las Vegas Sands Corp. †‡ | 122,850 | 7,962 | |||||||||
| Industrial Machinery & Equipment (17.3%) | |||||||||||
| Cooper Cameron Corp. ‡ | 385,190 | 19,352 | |||||||||
| Graco, Inc. | 383,890 | 17,947 | |||||||||
| Grant Prideco, Inc. ‡ | 371,670 | 19,030 | |||||||||
| Kennametal, Inc. | 211,965 | 13,110 | |||||||||
| Medical Instruments & Supplies (2.8%) | |||||||||||
| Techne Corp. ‡ | 194,700 | 11,032 | |||||||||
| Varian Medical Systems, Inc. ‡ | 5,500 | 288 | |||||||||
| Motion Pictures (1.3%) | |||||||||||
| Macrovision Corp. ‡ | 231,560 | 5,303 | |||||||||
| Oil & Gas Extraction (1.5%) | |||||||||||
| Forest Oil Corp. ‡ | 159,040 | 5,816 | |||||||||
| Shares | Value | ||||||||||
| Paperboard Containers & Boxes (3.1%) | |||||||||||
| Packaging Corp. of America | 551,780 | $ | 12,404 | ||||||||
| Personal Credit Institutions (0.7%) | |||||||||||
| Financial Federal Corp. | 91,830 | 2,608 | |||||||||
| Personal Services (2.2%) | |||||||||||
| Weight Watchers International, Inc. | 180,305 | 8,898 | |||||||||
| Pharmaceuticals (0.9%) | |||||||||||
| Endo Pharmaceuticals Holdings, Inc. ‡ | 118,320 | 3,721 | |||||||||
| Research & Testing Services (0.2%) | |||||||||||
| Affymetrix, Inc. ‡ | 27,549 | 789 | |||||||||
| Restaurants (1.9%) | |||||||||||
| PF Chang's China Bistro, Inc. †‡ | 181,920 | 7,752 | |||||||||
| Retail Trade (2.5%) | |||||||||||
| Blue Nile, Inc. †‡ | 294,180 | 10,237 | |||||||||
| Security & Commodity Brokers (7.1%) | |||||||||||
| BlackRock, Inc.–Class A † | 189,420 | 28,705 | |||||||||
| Telecommunications (3.8%) | |||||||||||
| NeuStar, Inc.–Class A †‡ | 438,450 | 15,390 | |||||||||
| Transportation & Public Utilities (9.9%) | |||||||||||
| CH Robinson Worldwide, Inc. | 351,670 | 15,597 | |||||||||
| Expeditors International of Washington, Inc. | 282,160 | 24,156 | |||||||||
| Total Common Stocks (cost: $272,206) | 380,676 | ||||||||||
| Principal | Value | ||||||||||
| SECURITY LENDING COLLATERAL (21.8%) | |||||||||||
| Debt (20.4%) | |||||||||||
| Bank Notes (2.5%) | |||||||||||
| Bank of America 4.81%, due 06/07/2006 * $2,880 $2,880 4.81%, due 08/10/2006 * | 2,779 | 2,779 | |||||||||
| Bear Stearns & Co. 5.01%, due 06/06/2006 * 5.01%, due 09/07/2006 * | 1,112 3,335 | 1,112 3,335 | |||||||||
| Certificates Of Deposit (1.4%) | |||||||||||
| Halifax Bank of Scotland 4.78%, due 06/06/2006 * | 2,780 | 2,780 | |||||||||
| Rabobank Nederland 4.87%, due 05/31/2006 * | 2,780 | 2,780 | |||||||||
| Commercial Paper (1.1%) | |||||||||||
| Banco Santander Central Hispano SA 4.77%, due 05/02/2006 | 1,668 | 1,668 | |||||||||
| Sheffield Receivables Corp.–144A 4.81%, due 05/03/2006 | 2,775 | 2,775 | |||||||||
The notes to the financial statements are an integral part of this report.
Transamerica IDEX Mutual Funds
Semi-Annual Report 2006
2
TA IDEX Transamerica Growth Opportunities
SCHEDULE OF INVESTMENTS (continued)
At April 30, 2006
(all amounts except share amounts in thousands)
(unaudited)
| Principal | Value | ||||||||||
| Euro Dollar Overnight (3.7%) | |||||||||||
| Bank of Montreal 4.77%, due 05/02/2006 | $ | 2,224 | $ | 2,224 | |||||||
| Dexia Group 4.78%, due 05/04/2006 | 2,780 | 2,780 | |||||||||
| Fortis Bank 4.77%, due 05/01/2006 | 1,112 | 1,112 | |||||||||
| Royal Bank of Canada 4.77%, due 05/01/2006 | 3,891 | 3,891 | |||||||||
| Royal Bank of Scotland 4.75%, due 05/03/2006 | 2,780 | 2,780 | |||||||||
| Svenska Handlesbanken 4.82%, due 05/01/2006 | 2,123 | 2,123 | |||||||||
| Euro Dollar Terms (5.7%) | |||||||||||
| BancoBilbao Vizcaya Argentaria SA 4.95%, due 06/20/2006 | 2,224 | 2,224 | |||||||||
| Bank of the West 4.94%, due 06/16/2006 | 2,224 | 2,224 | |||||||||
| Barclays 4.79%, due 05/10/2006 3,335 3,335 4.77%, due 05/16/2006 | 1,112 | 1,112 | |||||||||
| Canadian Imperial Bank of Commerce 4.97%, due 06/23/2006 | 1,668 | 1,668 | |||||||||
| Credit Suisse First Boston Corp. 4.73%, due 05/08/2006 | 1,668 | 1,668 | |||||||||
| Fortis Bank 4.83%, due 05/08/2006 | 1,112 | 1,112 | |||||||||
| Lloyds TSB Bank 4.81%, due 05/11/2006 | 1,668 | 1,668 | |||||||||
| Principal | Value | ||||||||||
| Euro Dollar Terms (continued) | |||||||||||
| Royal Bank of Scotland 4.87%, due 05/12/2006 | $ | 2,224 | $ | 2,224 | |||||||
| Societe Generale 4.79%, due 05/10/2006 | 2,780 | 2,780 | |||||||||
| UBS AG 4.95%, due 06/20/2006 | 2,780 | 2,780 | |||||||||
| Repurchase Agreements (6.0%)†† | |||||||||||
| Credit Suisse First Boston Corp. 4.92%, dated 04/28/2006 to be repurchased at $3,776 on 05/01/2006 | 3,775 | 3,775 | |||||||||
| Goldman Sachs Group, Inc. (The) 4.92%, dated 04/28/2006 to be repurchased at $8,170 on 05/01/2006 | 8,166 | 8,166 | |||||||||
| Lehman Brothers, Inc. 4.92%, dated 04/28/2006 to be repurchased at $138 on 05/01/2006 | 138 | 138 | |||||||||
| Merrill Lynch & Co. 4.87%, dated 04/28/2006 to be repurchased at $8,342 on 05/01/2006 | 8,339 | 8,339 | |||||||||
| Morgan Stanley Dean Witter & Co. 4.93%, dated 04/28/2006 to be repurchased at $3,893 on 05/01/2006 | 3,891 | 3,891 | |||||||||
| Shares | Value | ||||||||||
| Investment Companies (1.4%) | |||||||||||
| Barclays Global Investors Institutional Money Market Fund 1-day yield of 4.78% | 4,447,455 | $ | 4,447 | ||||||||
| Merrimac Cash Fund, Premium Class 1-day yield of 4.61% @ | 1,183,316 | 1,183 | |||||||||
| Total Security Lending Collateral (cost: $87,753) | 87,753 | ||||||||||
| Total Investment Securities (cost: $359,959) # | $ | 468,429 | |||||||||
NOTES TO SCHEDULE OF INVESTMENTS:
† At April 30, 2006, all or a portion of this security is on loan (see Note 1). The value at April 30, 2006, of all securities on loan is $85,089.
‡ Non-income producing.
* Floating or variable rate note. Rate is listed as of April 30, 2006.
†† Cash collateral for the Repurchase Agreements, valued at $25,026, that serve as collateral for securities lending are invested in corporate bonds with interest rates and maturity dates ranging from 0.00%–9.05% and 05/02/2006–12/31/2049, respectively.
@ Regulated investment company advised by Investors Bank and Trust Co. ("IBT"). IBT is also the accounting, custody and lending agent for the Fund.
# Aggregate cost for Federal income tax purposes is $359,959. Aggregate gross unrealized appreciation for all securities in which there is an excess of value over tax cost and aggregate gross unrealized depreciation for all securities in which there is an excess of tax cost over value were $112,966 and $4,496, respectively. Net unrealized appreciation for tax purposes is $108,470.
DEFINITIONS:
144A 144A Securities are registered pursuant to Rule 144A of the Securities Act of 1933. These securities are deemed to be liquid for purposes of compliance limitations on holdings of illiquid securities and may be resold as transactions exempt from registration, normally to qualified institutional buyers. At April 30, 2006, these securities aggregated $2,775 or 0.7% of the net assets of the Fund.
The notes to the financial statements are an integral part of this report.
Transamerica IDEX Mutual Funds
Semi-Annual Report 2006
3
TA IDEX Transamerica Growth Opportunities
STATEMENT OF ASSETS AND LIABILITIES
At April 30, 2006
(all amounts except per share amounts in thousands)
(unaudited)
| Assets: | |||||||
| Investment securities, at value (cost: $359,959) (including securities loaned of $85,089) | $ | 468,429 | |||||
| Cash | 24,993 | ||||||
| Receivables: | |||||||
| Investment securities sold | 963 | ||||||
| Shares of beneficial interest sold | 170 | ||||||
| Interest | 62 | ||||||
| Dividends | 72 | ||||||
| Other | 16 | ||||||
| 494,705 | |||||||
| Liabilities: | |||||||
| Investment securities purchased | 3,676 | ||||||
| Accounts payable and accrued liabilities: | |||||||
| Shares of beneficial interest redeemed | 240 | ||||||
| Management and advisory fees | 264 | ||||||
| Distribution and service fees | 108 | ||||||
| Transfer agent fees | 149 | ||||||
| Administration fees | 7 | ||||||
| Payable for collateral for securities on loan | 87,753 | ||||||
| Other | 78 | ||||||
| 92,275 | |||||||
| Net Assets | $ | 402,430 | |||||
| Net Assets Consist of: | |||||||
| Shares of beneficial interest, unlimited shares authorized, no par value | $ | 568,272 | |||||
| Distributable net investment income (loss) | (1,206 | ) | |||||
| Accumulated net realized gain (loss) from investment securities | (273,105 | ) | |||||
| Net unrealized appreciation (depreciation) on investment securities | 108,469 | ||||||
| Net Assets | $ | 402,430 | |||||
| Net Assets by Class: | |||||||
| Class A | $ | 65,285 | |||||
| Class B | 78,337 | ||||||
| Class C | 27,718 | ||||||
| Class I | 231,090 | ||||||
| Shares Outstanding: | |||||||
| Class A | 7,272 | ||||||
| Class B | 9,184 | ||||||
| Class C | 3,245 | ||||||
| Class I | 25,641 | ||||||
| Net Asset Value Per Share: | |||||||
| Class A | $ | 8.98 | |||||
| Class B | 8.53 | ||||||
| Class C | 8.54 | ||||||
| Class I | 9.01 | ||||||
| Maximum Offering Price Per Share (a): | |||||||
| Class A | $ | 9.50 | |||||
(a) Includes the maximum selling commission (represented as a percentage of offering price) which is reduced on certain levels of sales as set forth in the Prospectus. Net asset value per share for Classes B, C and I shares represents offering price. The redemption price for Classes B and C shares equals net asset value less any applicable contingent deferred sales charge.
STATEMENT OF OPERATIONS
For the period ended April 30, 2006 (b)
(all amounts in thousands)
(unaudited)
| Investment Income: | |||||||
| Dividends | $ | 1,184 | |||||
| Interest | 244 | ||||||
| Income from loaned securities–net | 195 | ||||||
| 1,623 | |||||||
| Expenses: | |||||||
| Management and advisory fees | 1,500 | ||||||
| Distribution and service fees: | |||||||
| Class A | 140 | ||||||
| Class B | 384 | ||||||
| Class C | 136 | ||||||
| Transfer agent fees: | |||||||
| Class A | 195 | ||||||
| Class B | 249 | ||||||
| Class C | 76 | ||||||
| Class I | – | (c) | |||||
| Printing and shareholder reports | 70 | ||||||
| Custody fees | 20 | ||||||
| Administration fees | 38 | ||||||
| Legal fees | 9 | ||||||
| Audit fees | 9 | ||||||
| Trustees fees | 7 | ||||||
| Registration fees | 29 | ||||||
| Other | 4 | ||||||
| Total expenses | 2,866 | ||||||
| Less: | |||||||
| Reimbursement of class expenses: | |||||||
| Class B | (49 | ) | |||||
| Class C | (5 | ) | |||||
| Total reimbursed expenses | (54 | ) | |||||
| Net expenses | 2,812 | ||||||
| Net Investment Income (Loss) | (1,189 | ) | |||||
| Net Realized and Unrealized Gain (Loss) | |||||||
| Realized gain (loss) from investment securities | 32,974 | ||||||
| Increase (decrease) in unrealized appreciation (depreciation) on investment securities | 19,946 | ||||||
| Net Realized and Unrealized Gain (Loss) on Investment Securities | 52,920 | ||||||
| Net Increase (Decrease) in Net Assets Resulting from Operations | $ | 51,731 | |||||
(b) Class I was offered for investment on November 15, 2005.
(c) Rounds to less than $1.
The notes to the financial statements are an integral part of this report.
Transamerica IDEX Mutual Funds
Semi-Annual Report 2006
4
TA IDEX Transamerica Growth Opportunities
STATEMENTS OF CHANGES IN NET ASSETS
For the period or year ended
(all amounts in thousands)
| April 30, 2006 (unaudited) (a) | October 31, 2005 | ||||||||||
| Increase (Decrease) In Net Assets From: | |||||||||||
| Operations: | |||||||||||
| Net investment income (loss) | $ | (1,189 | ) | $ | (2,033 | ) | |||||
| Net realized gain (loss) from investment securities | 32,974 | 19,909 | |||||||||
| Change in unrealized appreciation (depreciation) on investment securities | 19,946 | 39,287 | |||||||||
| 51,731 | 57,163 | ||||||||||
| Capital Share Transactions: | |||||||||||
| Proceeds from shares sold: | |||||||||||
| Class A | 7,929 | 7,177 | |||||||||
| Class B | 3,319 | 4,534 | |||||||||
| Class C | 3,753 | 2,511 | |||||||||
| Class I | 205,074 | – | |||||||||
| 220,075 | 14,222 | ||||||||||
| Cost of shares redeemed: | |||||||||||
| Class A | (211,412 | ) | (22,648 | ) | |||||||
| Class B | (9,453 | ) | (19,401 | ) | |||||||
| Class C | (5,000 | ) | (9,361 | ) | |||||||
| Class I | (91 | ) | – | ||||||||
| (225,956 | ) | (51,410 | ) | ||||||||
| Automatic conversions: | |||||||||||
| Class A | 202 | 383 | |||||||||
| Class B | (202 | ) | (383 | ) | |||||||
| – | – | ||||||||||
| (5,881 | ) | (37,188 | ) | ||||||||
| Net increase (decrease) in net assets | 45,850 | 19,975 | |||||||||
| Net Assets: | |||||||||||
| Beginning of period | 356,580 | 336,605 | |||||||||
| End of period | $ | 402,430 | $ | 356,580 | |||||||
| Distributable Net Investment Income (Loss) | $ | (1,206 | ) | $ | (17 | ) | |||||
(a) Class I was offered for investment on November 15, 2005.
| April 30, 2006 (unaudited) (a) | October 31, 2005 | ||||||||||
| Share Activity: | |||||||||||
| Shares issued: | |||||||||||
| Class A | 929 | 993 | |||||||||
| Class B | 404 | 676 | |||||||||
| Class C | 465 | 372 | |||||||||
| Class I | 25,652 | – | |||||||||
| 27,450 | 2,041 | ||||||||||
| Shares redeemed: | |||||||||||
| Class A | (26,372 | ) | (3,228 | ) | |||||||
| Class B | (1,166 | ) | (2,876 | ) | |||||||
| Class C | (614 | ) | (1,384 | ) | |||||||
| Class I | (11 | ) | – | ||||||||
| (28,163 | ) | (7,488 | ) | ||||||||
| Automatic conversions: | |||||||||||
| Class A | 24 | 55 | |||||||||
| Class B | (25 | ) | (57 | ) | |||||||
| (1 | ) | (2 | ) | ||||||||
| Net increase (decrease) in shares outstanding: | |||||||||||
| Class A | (25,419 | ) | (2,180 | ) | |||||||
| Class B | (787 | ) | (2,257 | ) | |||||||
| Class C | (149 | ) | (1,012 | ) | |||||||
| Class I | 25,641 | – | |||||||||
| (714 | ) | (5,449 | ) | ||||||||
The notes to the financial statements are an integral part of this report.
Transamerica IDEX Mutual Funds
Semi-Annual Report 2006
5
TA IDEX Transamerica Growth Opportunities
FINANCIAL HIGHLIGHTS
(unaudited for the period ended April 30, 2006)
| For a share of beneficial interest outstanding throughout each period | |||||||||||||||||||||||||||||||||||||||
| Net Asset | Investment Operations | Distributions | Net Asset | ||||||||||||||||||||||||||||||||||||
| For the Period Ended (d)(g) | Value, Beginning of Period | Net Investment Income (Loss) | Net Realized and Unrealized Gain (Loss) | Total Operations | From Net Investment Income | From Net Realized Gains | Total Distributions | Value, End of Period | |||||||||||||||||||||||||||||||
| Class A | 4/30/2006 | $ | 7.85 | $ | (0.04 | ) | $ | 1.17 | $ | 1.13 | $ | – | $ | – | $ | – | $ | 8.98 | |||||||||||||||||||||
| 10/31/2005 | 6.61 | (0.02 | ) | 1.26 | 1.24 | – | – | – | 7.85 | ||||||||||||||||||||||||||||||
| 10/31/2004 | 5.95 | (0.03 | ) | 0.69 | 0.66 | – | – | – | 6.61 | ||||||||||||||||||||||||||||||
| 10/31/2003 | 4.81 | (0.06 | ) | 1.20 | 1.14 | – | – | – | 5.95 | ||||||||||||||||||||||||||||||
| 10/31/2002 | 4.81 | (0.06 | ) | 0.06 | – | – | – | – | 4.81 | ||||||||||||||||||||||||||||||
| 10/31/2001 | 8.70 | (0.07 | ) | (3.82 | ) | (3.89 | ) | – | – | – | 4.81 | ||||||||||||||||||||||||||||
| Class B | 4/30/2006 | 7.48 | (0.06 | ) | 1.11 | 1.05 | – | – | – | 8.53 | |||||||||||||||||||||||||||||
| 10/31/2005 | 6.37 | (0.09 | ) | 1.20 | 1.11 | – | – | – | 7.48 | ||||||||||||||||||||||||||||||
| 10/31/2004 | 5.79 | (0.09 | ) | 0.67 | 0.58 | – | – | – | 6.37 | ||||||||||||||||||||||||||||||
| 10/31/2003 | 4.70 | (0.09 | ) | 1.18 | 1.09 | – | – | – | 5.79 | ||||||||||||||||||||||||||||||
| 10/31/2002 | 4.73 | (0.11 | ) | 0.08 | (0.03 | ) | – | – | – | 4.70 | |||||||||||||||||||||||||||||
| 10/31/2001 | 8.66 | (0.10 | ) | (3.83 | ) | (3.93 | ) | – | – | – | 4.73 | ||||||||||||||||||||||||||||
| Class C | 4/30/2006 | 7.49 | (0.06 | ) | 1.11 | 1.05 | – | – | – | 8.54 | |||||||||||||||||||||||||||||
| 10/31/2005 | 6.38 | (0.09 | ) | 1.20 | 1.11 | – | – | – | 7.49 | ||||||||||||||||||||||||||||||
| 10/31/2004 | 5.79 | (0.10 | ) | 0.69 | 0.59 | – | – | – | 6.38 | ||||||||||||||||||||||||||||||
| 10/31/2003 | 4.62 | (0.09 | ) | 1.26 | 1.17 | – | – | – | 5.79 | ||||||||||||||||||||||||||||||
| Class I | 4/30/2006 | 7.99 | – | (h) | 1.02 | 1.02 | – | – | – | 9.01 | |||||||||||||||||||||||||||||
| Ratios/Supplemental Data | |||||||||||||||||||||||||||||||
| For the Period | Total | Net Assets, End of Period | Ratio of Expenses to Average Net Assets (a) | Net Investment Income (Loss) to Average | Portfolio Turnover | ||||||||||||||||||||||||||
| Ended (g) | Return (c) | (000's) | Net (e) | Total (f) | Net Assets (a) | Rate (b) | |||||||||||||||||||||||||
| Class A | 4/30/2006 | 14.39 | % | $ | 65,285 | 1.71 | % | 1.71 | % | (0.87 | )% | 35 | % | ||||||||||||||||||
| 10/31/2005 | 18.76 | 256,559 | 1.41 | 1.41 | (0.30 | ) | 34 | ||||||||||||||||||||||||
| 10/31/2004 | 11.09 | 230,633 | 1.43 | 1.43 | (0.47 | ) | 43 | ||||||||||||||||||||||||
| 10/31/2003 | 23.70 | 147,340 | 1.75 | 2.21 | (1.11 | ) | 97 | ||||||||||||||||||||||||
| 10/31/2002 | 0.05 | 12,687 | 1.74 | 2.53 | (1.35 | ) | 32 | ||||||||||||||||||||||||
| 10/31/2001 | (44.76 | ) | 3,807 | 1.55 | 2.83 | (1.11 | ) | 59 | |||||||||||||||||||||||
| Class B | 4/30/2006 | 14.04 | 78,337 | 2.40 | 2.53 | (1.55 | ) | 35 | |||||||||||||||||||||||
| 10/31/2005 | 17.43 | 74,589 | 2.40 | 2.61 | (1.29 | ) | 34 | ||||||||||||||||||||||||
| 10/31/2004 | 10.02 | 77,869 | 2.40 | 2.64 | (1.44 | ) | 43 | ||||||||||||||||||||||||
| 10/31/2003 | 23.19 | 52,492 | 2.41 | 2.87 | (1.76 | ) | 97 | ||||||||||||||||||||||||
| 10/31/2002 | (0.70 | ) | 5,897 | 2.39 | 3.18 | (2.00 | ) | 32 | |||||||||||||||||||||||
| 10/31/2001 | (45.35 | ) | 4,513 | 2.20 | 3.48 | (1.76 | ) | 59 | |||||||||||||||||||||||
| Class C | 4/30/2006 | 14.02 | 27,718 | 2.40 | 2.44 | (1.55 | ) | 35 | |||||||||||||||||||||||
| 10/31/2005 | 17.40 | 25,432 | 2.40 | 2.54 | (1.29 | ) | 34 | ||||||||||||||||||||||||
| 10/31/2004 | 10.19 | 28,103 | 2.40 | 2.65 | (1.58 | ) | 43 | ||||||||||||||||||||||||
| 10/31/2003 | 25.32 | 483 | 2.42 | 2.89 | (1.78 | ) | 97 | ||||||||||||||||||||||||
| Class I | 4/30/2006 | 12.77 | 231,090 | 0.88 | 0.88 | (0.04 | ) | 35 | |||||||||||||||||||||||
The notes to the financial statements are an integral part of this report.
Transamerica IDEX Mutual Funds
Semi-Annual Report 2006
6
TA IDEX Transamerica Growth Opportunities
FINANCIAL HIGHLIGHTS (continued)
(unaudited)
NOTES TO FINANCIAL HIGHLIGHTS
(a) Annualized.
(b) Not annualized.
(c) Total Return has been calculated for the applicable period without deduction of a sales load, if any, on an initial purchase. Not annualized.
(d) Per share information is calculated based on average number of shares outstanding.
(e) Ratio of Net Expenses to Average Net Assets is net of fee waivers and reimbursements by the investment adviser, if any (see note 2).
(f) Ratio of Total Expenses to Average Net Assets includes all expenses before fee waivers and reimbursements by the investment adviser.
(g) The inception dates for the Fund's offering of share classes were as follows:
Class C was November 11, 2002.
Class I was November 15, 2005.
(h) Rounds to less than (0.01).
The notes to the financial statements are an integral part of this report.
Transamerica IDEX Mutual Funds
Semi-Annual Report 2006
7
TA IDEX Transamerica Growth Opportunities
NOTES TO FINANCIAL STATEMENTS
At April 30, 2006
(all amounts in thousands)
(unaudited)
NOTE 1. ORGANIZATION AND SIGNIFICANT ACCOUNTING POLICIES
Transamerica IDEX Mutual Funds is an open-end management investment company registered under the Investment Company Act of 1940, as amended (the "1940 Act").
In the normal course of business, TA IDEX Transamerica Growth Opportunities (the "Fund") enters into contracts that contain a variety of representations that provide general indemnifications. The Fund's maximum exposure under these arrangements is unknown, as this would involve future claims that may be made against the Fund and/or its affiliates that have not yet occurred. However, based on experience, the Fund expects the risk of loss to be remote.
This report should be read in conjunction with the current Fund prospectus, which contains more complete information about the Fund.
In preparing the Fund's financial statements in accordance with accounting principles generally accepted in the United States of America ("GAAP"), estimates or assumptions (which could differ from actual results) may be used that affect reported amounts and disclosures. The following is a summary of significant accounting policies followed by the Fund.
Multiple class operations, income and expenses: The Fund currently offers four classes of shares, Class A, Class B, Class C and Class I, each with a public offering price that reflects different sales charges, if any, and expense levels. Class I shares commenced operations on November 15, 2005. Class I is only available for investment to certain affiliated asset allocation funds. Class B shares will convert to Class A shares eight years after purchase. Income, non-class specific expenses and realized and unrealized gains and losses, are allocated daily to each class, based upon the value of shares outstanding method as permitted under Rule 18f-3 of the 1940 Act. Each class bears its own specific expenses as well as a portion of general, common expenses.
Security valuations: The Fund values its investments at the close of the New York Stock Exchange ("NYSE"), normally 4 p.m. ET, each day the NYSE is open for business. Fund investments are valued at the last sale price or closing price on the day of valuation taken from the primary exchange where the security is principally traded.
Securities traded in the over-the-counter market and listed securities for which no sale was reported on that date are valued at the last quoted bid price.
Debt securities are valued based on a price quotation or other equivalent indication of value supplied by an exchange, a pricing service or a major market maker; however, those that mature in sixty days or less are valued at amortized cost, which approximates market.
Investment company securities are valued at the net asset value of the underlying portfolio.
Other securities for which quotations are not readily available or whose values have been determined to be unreliable are valued at fair market value as determined in good faith by the Fund's Administrative Valuation Committee, under the supervision of the Board's Valuation Committee, using guidelines adopted by the Board of Trustees.
Cash: The Fund may leave cash overnight in its cash account with the custodian, Investors Bank & Trust Company ("IBT"). IBT has been contracted on behalf of the Fund to invest the excess cash into a savings account, which at April 30, 2006, was paying an interest rate of 3.24%.
Repurchase agreements: The Fund is authorized to enter into repurchase agreements. The Fund, through its custodian, IBT, receives delivery of the underlying securities, the value of which at the time of purchase is required to be an amount equal to at least 100% of the resale price. The Fund will bear the risk of value fluctuations until the security can be sold and may encounter delays and incur costs in liquidating the security. In the event of bankruptcy or insolvency of the seller, delays and costs may be incurred.
Commission recapture: The sub-adviser, to the extent consistent with the best execution and usual commission rate policies and practices, may place security transactions of the Fund with broker/dealers with which Transamerica IDEX Mutual Funds has established a Commission Recapture Program. A Commission Recapture Program is any arrangement under which a broker/dealer applies a portion of the commissions received by such broker/dealer on the security transactions to the Fund. In no event will commissions paid by the Fund be used to pay expenses that would otherwise be borne by any other funds within Transamerica IDEX Mutual Funds, or by any other party.
Recaptured commissions during the six months ended April 30, 2006, of $11 are included in net realized gains in the Statement of Operations.
Securities lending: The Fund may lend securities to qualified borrowers, with IBT acting as the Fund's lending agent. The Fund earns negotiated lenders' fees. The Fund receives cash and/or securities as collateral against the loaned securities. Cash collateral received is invested in short term, interest bearing securities. The Fund monitors the market value of securities loaned on a daily basis and requires collateral in an amount at least equal to the value of the securities loaned. Income from loaned securities on the Statement of Operations is net of fees, in the amount of $84, earned by IBT for its services.
Security transactions and investment income: Security transactions are recorded on the trade date. Security gains and losses are calculated on the specific identification basis. Dividend income, if any, is recorded
Transamerica IDEX Mutual Funds
Semi-Annual Report 2006
8
TA IDEX Transamerica Growth Opportunities
NOTES TO FINANCIAL STATEMENTS (continued)
At April 30, 2006
(all amounts in thousands)
(unaudited)
NOTE 1.–(continued)
on the ex-dividend date or, in the case of foreign securities, as soon as the Fund is informed of the ex-dividend date. Interest income, including accretion of discounts and amortization of premiums, is recorded on the accrual basis commencing on the settlement date.
Redemption fees: A short-term trading redemption fee may be assessed on any Fund shares in a fund account that are sold during the first five (5) NYSE trading days following their purchase date. This redemption fee will equal 2% of the amount redeemed and shares held the longest will be treated as being redeemed first and shares held the shortest as being redeemed last. For the six months ended April 30, 2006, the Fund received less than $1 in redemption fees.
Dividend distributions: Distributions to shareholders are recorded on the ex-dividend date and are determined in accordance with Federal income tax regulations which may differ from GAAP.
NOTE 2. RELATED PARTY TRANSACTIONS
Transamerica Fund Advisors, Inc. ("TFAI") is the Fund's investment adviser. Transamerica Fund Services, Inc. ("TFS") is the Fund's administrator and transfer agent. AFSG Securities Corp. ("AFSG") is the Fund's distributor/principal underwriter. TFAI, TFS, and AFSG are affiliates of AEGON, NV, a Netherlands corporation.
Transamerica Investment Management, LLC is both an affiliate of the Fund and a sub-adviser to the Fund.
Certain officers and trustees of the Fund are also officers and/or directors of TFAI, TFS and AFSG.
The following schedule reflects the percentage of Fund assets owned by affiliated investment companies at April 30, 2006:
| Net Assets | % of Net Assets | ||||||||||
| TA IDEX Asset Allocation– Conservative Portfolio | $ | 9,258 | 2.30 | % | |||||||
| TA IDEX Asset Allocation– Growth Portfolio | 65,757 | 16.34 | % | ||||||||
| TA IDEX Asset Allocation– Moderate Portfolio | 47,038 | 11.69 | % | ||||||||
| TA IDEX Asset Allocation– Moderate Growth Portfolio | 108,969 | 27.08 | % | ||||||||
| Total | $ | 231,022 | 57.41 | % | |||||||
Investment advisory fees: The Fund pays management fees to TFAI based on average daily net assets ("ANA") at the following breakpoints:
0.80% of the first $250 million of ANA
0.75% of the next $250 million of ANA
0.70% of ANA over $500 million
TFAI has contractually agreed to waive its advisory fee and will reimburse the Fund to the extent that operating expenses, excluding 12b-1 fees, exceed the following stated annual limit:
1.40% Expense Limit
Distribution and service fees: The Fund has a 12b-1 distribution plan under the 1940 Act pursuant to which an annual fee, based on average daily net assets, is paid to the distributor for various disbursements such as broker-dealer account servicing fees and other promotional expenses of the Fund. The Fund is authorized under the 12b-1 plan to pay fees on each class up to the following limits:
| Class A | 0.35 | % | |||||
| Class B | 1.00 | % | |||||
| Class C | 1.00 | % | |||||
| Class I | N/A | ||||||
In the case the Fund or a class of shares of the Fund is closed to new investors or investments, the Fund is authorized to pay 12b-1 fees for past sales and distribution efforts and present and past investor services.
Underwriter commissions relate to front-end sales charges imposed for Class A shares and contingent deferred sales charges from Classes B, C, and certain A share redemptions. For the six months ended April 30, 2006, the underwriter commissions were as follows:
| Received by Underwriter | $ | 76 | |||||
| Retained by Underwriter | 12 | ||||||
| Contingent Deferred Sales Charge | 69 | ||||||
Administrative services: The Fund has entered into an agreement with TFS for financial and legal fund administration services. The Fund pays TFS an annual fee of 0.02% of ANA. The Legal fees on the Statement of Operations are fees paid to external legal counsel.
Transfer agent fees: The Fund pays TFS an annual per-account charge for each open and closed account. The Fund paid TFS $502 for the six months ended April 30, 2006.
Deferred compensation plan: Each eligible independent Fund Trustee may elect to participate in a non-qualified deferred compensation plan maintained by Transamerica IDEX Mutual Funds (the "Plan"). Under the Plan, such Trustees may defer payment of all or a portion of their total fees earned as a Fund Trustee. Each Trustee who is a participant in the Plan may elect that the earnings, losses or gains credited to his or her deferred fee amounts be determined based on a deemed investment in any series of Transamerica IDEX Mutual Funds, including the
Transamerica IDEX Mutual Funds
Semi-Annual Report 2006
9
TA IDEX Transamerica Growth Opportunities
NOTES TO FINANCIAL STATEMENTS (continued)
At April 30, 2006
(all amounts in thousands)
(unaudited)
NOTE 2.–(continued)
Fund. The right of a participant to receive a distribution from the Plan of the deferred fees is an unsecured claim against the general assets of all series of Transamerica IDEX Mutual Funds. The pro rata liability to the Fund of all deferred fees in the Plan amounted, as of April 30, 2006, to $16.
NOTE 3. INVESTMENT TRANSACTIONS
The cost of securities purchased and proceeds from securities sold (excluding short-term securities) for the six months ended April 30, 2006 were as follows:
| Purchases of securities: | |||||||
| Long-Term | $ | 128,091 | |||||
| U.S. Government | – | ||||||
| Proceeds from maturities and sales of securities: | |||||||
| Long-Term | 131,331 | ||||||
| U.S. Government | – | ||||||
NOTE 4. FEDERAL INCOME TAX MATTERS
The Fund has not made any provision for federal income or excise taxes due to its policy to distribute all of its taxable income and capital gains to its shareholders and otherwise qualify as a regulated investment company under Subchapter M of the Internal Revenue Code. Income and capital gain distributions are determined in accordance with income tax regulations, which may differ from GAAP. These differences are primarily due to differing treatment for items including, but not limited to, wash sales, net operating losses and capital loss carryforwards.
The capital loss carryforwards are available to offset future realized capital gains through the periods listed:
| Capital Loss Carryforwards | Available through | ||||||
| $ | 194,799 | October 31, 2008 | |||||
| 99,199 | October 31, 2009 | ||||||
| 4,618 | October 31, 2010 | ||||||
| 7,437 | October 31, 2011 | ||||||
NOTE 5. REGULATORY PROCEEDINGS
There continues to be significant federal and state regulatory activity relating to financial services companies, particularly mutual fund companies and their investment advisers. As part of an ongoing investigation regarding potential market timing, recordkeeping and trading compliance issues and matters affecting the Fund's investment adviser, TFAI, and certain affiliates and former employees of TFAI, the SEC staff has indicated that it is likely to take some action against TFAI and certain of its affiliates at the conclusion of the investigation. The potential timing and the scope of any such action is difficult to predict. Although the impact of any action brought against TFAI and/or its affiliates is difficult to assess at the present time, the Fund currently believes that the likelihood that any such action will have a material adverse impact on it is remote. It is important to note that the Fund is not aware of any allegation of wrongdoing against it and its Board at the time this semi-annual report is printed. Although it is not anticipated that these developments will have an adverse impact on the Fund, there can be no assurance at this time. TFAI and its affiliates are actively working with the SEC in regard to this matter; however, the exact resolution cannot be determined at this time. TFAI will take such actions that it deems necessary or appropriate to continue providing management services to the Fund and to bring all matters to an appropriate conclusion.
TFAI and/or its affiliates, and not the Fund, will bear the costs regarding these regulatory matters.
Transamerica IDEX Mutual Funds
Semi-Annual Report 2006
10
TA IDEX Transamerica Growth Opportunities
INVESTMENT ADVISORY AND SUB-ADVISORY AGREEMENTS – REVIEW AND RENEWAL (unaudited)
At a meeting of the Board of Trustees of Transamerica IDEX Mutual Funds ("TA IDEX") held on November 2, 2005, the Board reviewed and considered the Investment Advisory Agreement between TA IDEX Transamerica Growth Opportunities (the "Fund") and Transamerica Fund Advisors, Inc. ("TFAI"), as well as the Investment Sub-Advisory Agreement of the Fund between TFAI and Transamerica Investment Management, LLC (the "Sub-Adviser"), to determine whether the agreements should be renewed for a one-year period. Following their review and consideration, the Trustees determined that the Investment Advisory Agreement and the Investment Sub-Advisory Agreement will enable shareholders of the Fund to obtain high quality services at a cost that is appropriate, reasonable, and in the best interests of its shareholders. The Board, including the independent members of the Board, unanimously approved the renewal of the Investment Advisory Agreement and the Investment Sub-Advisory Agreement. In reaching their decision, the Trustees requested and obtained from TFAI and the Sub-Adviser such information as they deemed reasonably necessary to evaluate the proposed agreements. The Trustees also carefully considered the information that they had received throughout the year from TFAI and the Sub-Adviser (such as in-person presentations by the Sub-Adviser) as part of their regular oversight of the Fund, as well as: comparative fee, expense and performance information prepared by Lipper Inc. ("Lipper"), independent providers of mutual fund performance, fee and expense information, and profitability data. In considering the proposed continuation of the Investment Advisory Agreement and the Investment Sub-Advisory Agreement, the Trustees evaluated a number of considerations that they believe, in light of the legal advice furnished to them by TA IDEX counsel and independent legal counsel and their own business judgment, to be relevant. They based their decisions on t he following considerations, among others, although they did not identify any consideration or particular information that was controlling of their decisions:
The nature, extent and quality of the advisory service to be provided. The Board considered the nature and quality of the services provided by TFAI and the Sub-Adviser to the Fund in the past, as well as the services anticipated to be provided in the future. The Board concluded that TFAI and the Sub-Adviser are capable of providing high quality services to the Fund, as indicated by the nature and quality of services provided in the past, TFAI's and the Sub-Adviser's management capabilities demonstrated with respect to the funds they manage, including the Fund, and the experience, capability and integrity of TFAI's senior management, the financial resources of TFAI and the Sub-Adviser, and TFAI's management oversight process, and the professional qualifications and experience of the Sub-Adviser's portfolio management team. The Trustees also concluded t hat TFAI and the Sub-Adviser proposed to provide investment and related services that were of the same quality and quantity as services provided to the Fund in the past, and that these services are appropriate in scope and extent in light of the Fund's operations, the competitive landscape of the investment company business and investor needs, and that TFAI's and the Sub-Adviser's obligations will remain substantially the same.
The investment performance of the Fund. The Board examined both the short-term and longer-term performance of the Fund, including relative performance against a benchmark securities index and a peer group of comparable mutual funds as prepared by Lipper, for various trailing periods ended June 30, 2005. The Trustees concluded that TFAI and the Sub-Adviser generally had achieved acceptable investment performance, noting that although the performance of the Fund has been below median relative to its peers and trailed the benchmark index over the past one- and three-year periods, it has been at median relative to its peers and competitive with the benchmark index over the past two- and five-year periods. The Board noted that while the Fund's performance could be improved, the performance record largely was attributable to the Sub-Adviser's prior equity i nvestment team, and the Board determined that the results of the new team would be carefully monitored on a going-forward basis. On the basis of the Trustees' assessment of the nature, extent and quality of advisory services to be provided or procured by TFAI and the Sub-Adviser, the Trustees concluded that TFAI and the Sub-Adviser are capable of generating a level of investment performance that is appropriate in light of the Fund's investment objective, policies and strategies and competitive with many other investment companies, and also determined that TFAI's and the Sub-Adviser's performance records indicate that their continued management is likely to benefit the Fund and its shareholders.
The cost of advisory services provided and the level of profitability. The Board reviewed profitability information regarding TFAI's costs of procuring portfolio management services, as well as the costs of provision of administration, transfer agency, fund accounting and other services, to the Fund and to TA IDEX as a whole by TFAI and its affiliates. The Trustees reviewed data from Lipper that compared the Fund's management fees (including management fees at various asset levels), other fees and expenses (including total expenses including and excluding 12b-1 distribution and service fees) and portfolio turnover rate against a peer group of comparable mutual funds. Based on such information, the Trustees determined that the management fees and overall expense ratio of the Fund generally are consistent with industry averages. In addition, on the basi s of the Board's review of the management fees to be charged by TFAI for investment advisory and related services, TFAI profitability information (derived from TFAI's audited financial statements), TFAI's estimated management income resulting from its management of the Fund, the estimated margin of the Sub-Adviser, as well as the entirety of TFAI's and its affiliates' service relationship with TA IDEX, the Board concluded that
Transamerica IDEX Mutual Funds
Semi-Annual Report 2006
11
TA IDEX Transamerica Growth Opportunities (continued)
the level of investment management fees and other service fees, as well as TFAI's and the Sub-Adviser's profitability, are appropriate in light of the services provided, the management fees and overall expense ratios of comparable investment companies and the anticipated profitability of the relationship between the Fund, TFAI and its affiliates, and the Sub-Adviser.
Whether fee levels reflect economies of scale and the extent to which economies of scale would be realized as the Fund grows. The Board concluded that the inclusion of asset-based breakpoints in the Fund's advisory fee schedule appropriately benefits investors by realizing economies of scale in the form of lower management fees as the level of assets grows. In addition, the Board concluded that the Fund's management fees appropriately reflect the Fund's current size, the current economic environment for TFAI, the competitive nature of the investment company market, and TFAI's pricing strategy. The Trustees also concluded that they will have the opportunity to periodically reexamine whether the Fund has achieved economies of scale, and the appropriateness of management fees payable to TFAI and fees payable by TFAI to the Sub-Adviser, in the future.
Benefits (such as soft dollars) to TFAI, its affiliates, or the Sub-Adviser from their relationship with the Fund. The Board concluded that other benefits derived by TFAI, its affiliates, and the Sub-Adviser from their relationship with the Fund, including "soft dollar" benefits (if any) in connection with brokerage transactions, sales charges and distribution/service fees (to the extent applicable) are reasonable and fair, and are consistent with industry practice and the best interests of the Fund and its shareholders. In this regard, the Board noted that TFAI does not realize "soft dollar" benefits from its relationship with the Fund, and that the Sub-Adviser is participating in a brokerage program pursuant to which a portion of brokerage commissions paid by the Fund is recaptured for the benefit of the Fund and its shareholders, thus limiting the amount of "soft-dollar" arrangements the Sub-Adviser may engage in with respect to the Fund's brokerage transactions. In addition, the Trustees determined that the administration, transfer agency, fund accounting and other fees paid by the Fund to affiliates of TFAI are reasonable, fair and in the best interests of shareholders in light of the nature and quality of the services provided, the associated costs to these affiliates of providing the services, the impact of the costs of such services on the Fund's overall operating expenses, and the necessity of the services for the Fund's operations.
Other considerations. The Board determined that TFAI had made a substantial commitment to the recruitment and retention of high quality personnel, and maintained the financial, compliance and operational resources reasonably necessary to manage the Fund in a professional manner that is consistent with the best interests of the Fund and its shareholders. In this regard, the Trustees favorably considered the procedures and policies in place by TFAI to enforce compliance with applicable laws and regulations and oversee the portfolio management activities of the Sub-Adviser. The Trustees also determined that TFAI had made a significant entrepreneurial commitment to the management and success of the Fund, reflected by TFAI's expense limitation and fee waiver arrangement with the Fund, which may result in TFAI waiving advisory fees for the benefit of shareh olders.
Transamerica IDEX Mutual Funds
Semi-Annual Report 2006
12
TA IDEX Transamerica High-Yield Bond
UNDERSTANDING YOUR FUND'S EXPENSES
(unaudited)
SHAREHOLDER EXPENSES
Fund shareholders may incur two types of costs: (1) transaction costs, including sales charges (loads) on purchases, contingent deferred sales charges on redemptions and redemption fees; and (2) ongoing costs, including management fees, 12b-1 distribution and service fees, and other fund expenses.
The following Example is intended to help you understand your ongoing costs (in dollars and cents) of investing in the Fund and to compare these costs with the ongoing costs of investing in other funds.
The Example is based on an investment of $1,000 invested at November 1, 2005 and held for the entire period until April 30, 2006.
ACTUAL EXPENSES
The first line in the table below provides information about actual account values and actual expenses. You may use the information in this line, together with the amount you invested, to estimate the expenses that you paid over the period. Simply divide your account value by $1,000 (for example, an $8,600 account value divided by $1,000 = 8.6), then multiply the result by the number in the first line of your Fund under the heading entitled "Expenses Paid During Period" to estimate the expenses you paid on your account during this period. If your account is an IRA, your expenses could have included a $15 annual fee. The amount of any fee paid through your account would increase the estimate of expenses you paid during the period and decrease your ending account value.
HYPOTHETICAL EXAMPLE FOR COMPARISON PURPOSES
The second line in the table below provides information about hypothetical account values and hypothetical expenses based on the Fund's actual expense ratio and an assumed rate of return of 5% per year before expenses, which is not the Fund's actual return. The hypothetical account values and expenses may not be used to estimate the actual ending account balance or expenses you paid for the period. You may use this information to compare the ongoing costs of investing in your Fund and other funds. To do so, compare this 5% hypothetical example with the 5% hypothetical examples that appear in the shareholder reports of the other funds. As in the case of the actual expense example, if your account is subject to an IRA fee, the amount of the fee paid through your account would increase the hypothetical expenses you would have paid during the period and decrease the hypothetical ending account value.
Please note that the expenses shown in the table are meant to highlight your ongoing costs only and do not reflect any transactional costs, such as sales charges, redemption fees, brokerage commissions paid on purchases and sales of fund shares. Therefore, the second line under the Fund in the table is useful in comparing ongoing costs only, and will not help you determine the relative total costs of owning different funds. If any of these transaction costs were included, your costs would be higher. The expenses shown in the table do not reflect any fees that may be charged to you by brokers, financial intermediaries or other financial institutions.
| Beginning Account Value | Ending Account Value | Annualized Expense Ratio | Expenses Paid During Period (a) | ||||||||||||||||
| Class A | |||||||||||||||||||
| Actual | $ | 1,000.00 | $ | 1,048.80 | 1.14 | % | $ | 5.79 | |||||||||||
| Hypothetical (b) | 1,000.00 | 1,019.14 | 1.14 | 5.71 | |||||||||||||||
| Class B | |||||||||||||||||||
| Actual | 1,000.00 | 1,045.10 | 1.85 | 9.38 | |||||||||||||||
| Hypothetical (b) | 1,000.00 | 1,015.62 | 1.85 | 9.25 | |||||||||||||||
| Class C | |||||||||||||||||||
| Actual | 1,000.00 | 1,046.20 | 1.87 | 9.49 | |||||||||||||||
| Hypothetical (b) | 1,000.00 | 1,015.52 | 1.87 | 9.35 | |||||||||||||||
| Class I | |||||||||||||||||||
| Actual | 1,000.00 | 1,051.40 | 0.67 | 3.41 | |||||||||||||||
| Hypothetical (b) | 1,000.00 | 1,021.47 | 0.67 | 3.36 | |||||||||||||||
(a) Expenses are calculated using the Fund's annualized expense ratio (as disclosed in the table), multiplied by the average account value for the period, multiplied by number of days in the period (181 days), and divided by the number of days in the year (365 days).
(b) 5% return per year before expenses.
GRAPHICAL PRESENTATION OF SCHEDULE OF INVESTMENTS
By Bond Credit Quality (Moody Ratings)
At April 30, 2006
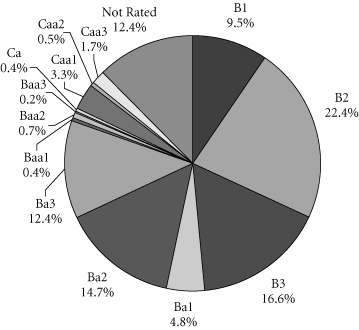
This chart shows the percentage breakdown by Bond Credit Quality of the Fund's total investment securities.
Transamerica IDEX Mutual Funds
Semi-Annual Report 2006
1
TA IDEX Transamerica High-Yield Bond
GRAPHICAL PRESENTATION OF SCHEDULE OF INVESTMENTS
(continued)
| Credit Rating | Description | ||||||
| B1 | Moderate vulnerability to adverse business, financial and economic conditions but currently has the capacity to meet financial commitments. | ||||||
| B2 | More vulnerable to adverse business, financial and economic conditions but currently has the capacity to meet financial commitments. | ||||||
| B3 | Assurance of interest and principal payments or of maintenance of other terms of the contract over any long period of time may be small. | ||||||
| Ba1 | Moderate vulnerability in the near-term but faces major ongoing uncertainties in the event of adverse business, financial and economic conditions. | ||||||
| Ba2 | Vulnerable in the near-term but faces major ongoing uncertainties in the event of adverse business, financial and economic conditions. | ||||||
| Ba3 | More vulnerable in the near-term but faces major ongoing uncertainties in the event of adverse business, financial and economic conditions. | ||||||
| Baa1 | Medium grade obligations. Interest payments and principal security are adequate for the present but certain protective elements may be lacking or may be characteristically unreliable over great length of time. | ||||||
| Baa2 | Medium grade obligations. Interest payments and principal security appear adequate for the present but certain protective elements may be lacking or may be characteristically unreliable over great length of time. | ||||||
| Baa3 | Medium grade obligations. Interest payments and principal security are not as adequate for the present but certain protective elements may be lacking or may be characteristically unreliable over great length of time. | ||||||
| Ca | Extremely speculative, may be in default on their policyholder obligations or have other marked shortcomings. | ||||||
| Caa1 | Highly vulnerable may be in default on their policyholder obligations or there may be present elements of danger with respect to payment of policyholder obligations and claims. | ||||||
| Caa2 | Extremely vulnerable may be in default on their policyholder obligations or there may be present elements of danger with respect to payment of policyholder obligations and claims. | ||||||
| Caa3 | Speculative, may be in default on their policyholder obligations or have other marked shortcomings. | ||||||
Transamerica IDEX Mutual Funds
Semi-Annual Report 2006
2
TA IDEX Transamerica High-Yield Bond
SCHEDULE OF INVESTMENTS
At April 30, 2006
(all amounts except share amounts in thousands)
(unaudited)
| Principal | Value | ||||||||||
| CORPORATE DEBT SECURITIES (96.2%) | |||||||||||
| Amusement & Recreation Services (1.8%) | |||||||||||
| Isle of Capri Casinos, Inc. | |||||||||||
| 7.00%, due 03/01/2014 | $ | 3,000 | $ | 2,947 | |||||||
| Mohegan Tribal Gaming Authority 6.38%, due 07/15/2009 6.13%, due 02/15/2013 | 1,000 2,000 | 992 1,942 | |||||||||
| Speedway Motorsports, Inc. 6.75%, due 06/01/2013 | 1,200 | 1,185 | |||||||||
| Apparel Products (0.9%) | |||||||||||
| Levi Strauss & Co. 9.75%, due 01/15/2015 | 3,500 | 3,692 | |||||||||
| Automotive (4.4%) | |||||||||||
| ArvinMeritor, Inc. 8.75%, due 03/01/2012 | 452 | 464 | |||||||||
| Ford Motor Co. 7.45%, due 07/16/2031 † | 2,000 | 1,460 | |||||||||
| General Motors Acceptance Corp. 6.75%, due 12/01/2014 † | 8,000 | 7,291 | |||||||||
| General Motors Corp. 7.13%, due 07/15/2013 † | 2,000 | 1,505 | |||||||||
| Lear Corp. 8.11%, due 05/15/2009 † | 2,000 | 1,955 | |||||||||
| Lear Corp., Series B 5.75%, due 08/01/2014 | 2,000 | 1,680 | |||||||||
| Tenneco Automotive, Inc. 10.25%, due 07/15/2013 | 2,500 | 2,769 | |||||||||
| Business Services (4.1%) | |||||||||||
| Avis Budget Car Rental LLC/Avis Budget Finance, Inc.–144A 7.63%, due 05/15/2014 | 3,030 | 3,083 | |||||||||
| Hertz Corp.–144A 10.50%, due 01/01/2016 † | 3,500 | 3,872 | |||||||||
| Lamar Media Corp. 6.63%, due 08/15/2015 | 2,800 | 2,723 | |||||||||
| R.H. Donnelley Finance Corp I–144A 10.88%, due 12/15/2012 | 2,000 | 2,220 | |||||||||
| Universal Compression, Inc. 7.25%, due 05/15/2010 | 2,000 | 2,020 | |||||||||
| Universal Hospital Services, Inc. 10.13%, due 11/01/2011 | 2,000 | 2,065 | |||||||||
| Chemicals & Allied Products (5.3%) | |||||||||||
| Airgas, Inc. 6.25%, due 07/15/2014 | 1,500 | 1,455 | |||||||||
| Equistar Chemicals, LP/Equistar Funding Corp. 10.13%, due 09/01/2008 10.63%, due 05/01/2011 | 1,000 2,000 | 1,071 2,180 | |||||||||
| Principal | Value | ||||||||||
| Chemicals & Allied Products (continued) | |||||||||||
| Huntsman International LLC | |||||||||||
| 9.88%, due 03/01/2009 | $ | 1,000 | $ | 1,045 | |||||||
| 10.13%, due 07/01/2009 | 2,000 | 2,035 | |||||||||
| 11.63%, due 10/15/2010 | 965 | 1,086 | |||||||||
| Huntsman International LLC–144A 8.13%, due 01/01/2015 † | 2,000 | 2,005 | |||||||||
| IMC Global, Inc. 6.88%, due 07/15/2007 | 3,000 | 3,015 | |||||||||
| Ineos Group Holdings PLC–144A 8.50%, due 02/15/2016 | 2,750 | 2,612 | |||||||||
| Lyondell Chemical Co. 10.50%, due 06/01/2013 | 1,000 | 1,119 | |||||||||
| Nalco Co. 7.75%, due 11/15/2011 | 2,000 | 2,010 | |||||||||
| NOVA Chemicals Corp. 6.50%, due 01/15/2012 | 1,000 | 935 | |||||||||
| Communication (6.5%) | |||||||||||
| Adelphia Communications Corp. 0.00%, due 11/01/2006 f | 1,000 | 467 | |||||||||
| Cablevision Systems Corp., Series B 8.00%, due 04/15/2012 † | 6,000 | 5,985 | |||||||||
| CCH I Holdings LLC 9.92%, due 04/01/2014 † | 493 | 306 | |||||||||
| CCH I LLC 11.00%, due 10/01/2015 | 8,274 | 7,364 | |||||||||
| Charter Communications Operating LLC/ Charter Communications Operating Capital Corp.–144A 8.38%, due 04/30/2014 | 2,000 | 2,010 | |||||||||
| Echostar DBS Corp. 6.63%, due 10/01/2014 | 2,840 | 2,737 | |||||||||
| Intelsat Subsidiary Holding Co., Ltd. 8.25%, due 01/15/2013 8.63%, due 01/15/2015 | 1,500 3,500 | 1,528 3,640 | |||||||||
| PanAmSat Corp. 9.00%, due 08/15/2014 | 1,300 | 1,367 | |||||||||
| Communications Equipment (1.0%) | |||||||||||
| L-3 Communications Corp. 7.63%, due 06/15/2012 6.13%, due 07/15/2013 6.13%, due 01/15/2014 | 1,000 2,000 1,000 | 1,030 1,920 960 | |||||||||
| Computer & Data Processing Services (0.7%) | |||||||||||
| Unisys Corp. 8.00%, due 10/15/2012 † 8.50%, due 10/15/2015 † | 2,000 1,000 | 1,922 964 | |||||||||
The notes to the financial statements are an integral part of this report.
Transamerica IDEX Mutual Funds
Semi-Annual Report 2006
3
TA IDEX Transamerica High-Yield Bond
SCHEDULE OF INVESTMENTS (continued)
At April 30, 2006
(all amounts except share amounts in thousands)
(unaudited)
| Principal | Value | ||||||||||
| Computer & Office Equipment (0.3%) | |||||||||||
| Seagate Technology Holdings Corp. | |||||||||||
| 8.00%, due 05/15/2009 | $ | 1,000 | $ | 1,030 | |||||||
| Construction (0.2%) | |||||||||||
| Centex Corp. 5.80%, due 09/15/2009 | 750 | 751 | |||||||||
| Department Stores (0.3%) | |||||||||||
| Neiman-Marcus Group, Inc.–144A 9.00%, due 10/15/2015 | 1,000 | 1,062 | |||||||||
| Saks, Inc. 8.25%, due 11/15/2008 | —o | —o | |||||||||
| Drug Stores & Proprietary Stores (1.1%) | |||||||||||
| Medco Health Solutions, Inc. 7.25%, due 08/15/2013 | 1,000 | 1,066 | |||||||||
| Rite Aid Corp. 12.50%, due 09/15/2006 9.50%, due 02/15/2011 | 2,000 1,000 | 2,045 1,055 | |||||||||
| Electric Services (6.3%) | |||||||||||
| AES Corp. (The)–144A 8.75%, due 05/15/2013 | 5,000 | 5,412 | |||||||||
| Elwood Energy LLC 8.16%, due 07/05/2026 | 1,665 | 1,770 | |||||||||
| NRG Energy, Inc. 7.25%, due 02/01/2014 7.38%, due 02/01/2016 | 7,000 2,000 | 7,035 2,017 | |||||||||
| Reliant Energy, Inc. 6.75%, due 12/15/2014 | 2,000 | 1,820 | |||||||||
| TXU Corp., Series O 4.80%, due 11/15/2009 | 3,000 | 2,891 | |||||||||
| TXU Corp., Series P 5.55%, due 11/15/2014 | 4,000 | 3,717 | |||||||||
| Electric, Gas & Sanitary Services (2.1%) | |||||||||||
| Allied Waste North America, Inc. 8.50%, due 12/01/2008 6.50%, due 11/15/2010 † 7.88%, due 04/15/2013 † | 5,775 1,000 1,000 | 6,078 987 1,040 | |||||||||
| Electronic Components & Accessories (1.9%) | |||||||||||
| Celestica, Inc. 7.63%, due 07/01/2013 | 1,450 | 1,450 | |||||||||
| Spansion LLC–144A 11.25%, due 01/15/2016 | 3,000 | 3,090 | |||||||||
| STATS ChipPAC, Ltd. 6.75%, due 11/15/2011 | 2,750 | 2,688 | |||||||||
| Fabricated Metal Products (1.2%) | |||||||||||
| Alliant Techsystems, Inc. 6.75%, due 04/01/2016 | 4,590 | 4,533 | |||||||||
| Principal | Value | ||||||||||
| Food & Kindred Products (0.8%) | |||||||||||
| Del Monte Corp. | |||||||||||
| 8.63%, due 12/15/2012 | $ | 3,000 | $ | 3,150 | |||||||
| Gas Production & Distribution (5.0%) | |||||||||||
| Colorado Interstate Gas Co. 5.95%, due 03/15/2015 | 3,125 | 2,956 | |||||||||
| Colorado Interstate Gas Co.–144A 6.80%, due 11/15/2015 | 5,900 | 5,904 | |||||||||
| Dynegy-Roseton/Danskammer, Series 2001, Class B 7.67%, due 11/08/2016 | 2,000 | 2,046 | |||||||||
| Northwest Pipeline Corp. 8.13%, due 03/01/2010 | 2,000 | 2,107 | |||||||||
| Transcontinental Gas Pipe Line Corp. 8.88%, due 07/15/2012 | 4,000 | 4,535 | |||||||||
| Williams Cos., Inc. 7.13%, due 09/01/2011 | 2,000 | 2,055 | |||||||||
| Health Services (4.3%) | |||||||||||
| Ameripath, Inc. 10.50%, due 04/01/2013 | 1,590 | 1,689 | |||||||||
| Extendicare Health Services, Inc. 6.88%, due 05/01/2014 | 3,000 | 3,075 | |||||||||
| HCA, Inc. 6.95%, due 05/01/2012 6.30%, due 10/01/2012 6.25%, due 02/15/2013 | 1,000 2,275 3,000 | 1,003 2,209 2,894 | |||||||||
| Manor Care, Inc. 6.25%, due 05/01/2013 | 1,000 | 989 | |||||||||
| Tenet Healthcare Corp. 9.88%, due 07/01/2014 | 1,250 | 1,297 | |||||||||
| Tenet Healthcare Corp.–144A 9.50%, due 02/01/2015 | 3,500 | 3,570 | |||||||||
| Holding & Other Investment Offices (2.4%) | |||||||||||
| Nell AF Sarl–144A 8.38%, due 08/15/2015 † | 2,000 | 1,982 | |||||||||
| Sungard Data Systems Inc.–144A 9.13%, due 08/15/2013 10.25%, due 08/15/2015 | 4,000 3,000 | 4,270 3,225 | |||||||||
| Hotels & Other Lodging Places (5.8%) | |||||||||||
| Kerzner International, Ltd. 6.75%, due 10/01/2015 | 3,000 | 3,112 | |||||||||
| Las Vegas Sands Corp. 6.38%, due 02/15/2015 | 4,750 | 4,560 | |||||||||
| Mandalay Resort Group 6.38%, due 12/15/2011 | 1,000 | 976 | |||||||||
The notes to the financial statements are an integral part of this report.
Transamerica IDEX Mutual Funds
Semi-Annual Report 2006
4
TA IDEX Transamerica High-Yield Bond
SCHEDULE OF INVESTMENTS (continued)
At April 30, 2006
(all amounts except share amounts in thousands)
(unaudited)
| Principal | Value | ||||||||||
| Hotels & Other Lodging Places (continued) | |||||||||||
| MGM Mirage 6.00%, due 10/01/2009 6.75%, due 09/01/2012 5.88%, due 02/27/2014 | $2,500 1,000 2,500 | $2,466 990 2,322 | |||||||||
| Station Casinos, Inc. 6.00%, due 04/01/2012 6.50%, due 02/01/2014 6.88%, due 03/01/2016 | 1,000 2,000 2,000 | 972 1,945 1,965 | |||||||||
| Wynn Las Vegas LLC/Wynn Las Vegas Capital Corp. 6.63%, due 12/01/2014 | 3,450 | 3,355 | |||||||||
| Industrial Machinery & Equipment (0.9%) | |||||||||||
| Case New Holland, Inc. 9.25%, due 08/01/2011 | 3,250 | 3,453 | |||||||||
| Instruments & Related Products (2.3%) | |||||||||||
| DirecTV Holdings LLC/DirecTV Financing Co. 8.38%, due 03/15/2013 | 5,750 | 6,145 | |||||||||
| DRS Technologies, Inc. 6.88%, due 11/01/2013 | 3,000 | 2,974 | |||||||||
| Management Services (0.8%) | |||||||||||
| Corrections Corp. of America 7.50%, due 05/01/2011 | 1,000 | 1,013 | |||||||||
| US Oncology, Inc. 10.75%, due 08/15/2014 | 2,000 | 2,238 | |||||||||
| Manufacturing Industries (1.0%) | |||||||||||
| Indalex Holding Corp.–144A 11.50%, due 02/01/2014 | 4,000 | 3,910 | |||||||||
| Medical Instruments & Supplies (0.4%) | |||||||||||
| Bard (C.R.), Inc. 6.70%, due 12/01/2026 | 1,500 | 1,582 | |||||||||
| Metal Cans & Shipping Containers (1.6%) | |||||||||||
| Ball Corp. 6.88%, due 12/15/2012 6.63%, due 03/15/2018 | 3,775 2,400 | 3,813 2,331 | |||||||||
| Mining (0.3%) | |||||||||||
| Peabody Energy Corp. 6.88%, due 03/15/2013 | 1,000 | 1,008 | |||||||||
| Mortgage Bankers & Brokers (0.8%) | |||||||||||
| CCM Merger, Inc.–144A 8.00%, due 08/01/2013 | 1,988 | 1,928 | |||||||||
| Crystal US Holdings 3 LLC/ Crystal US Sub 3 Corp., Series A 0.00%, due 10/01/2014 (a) | 1,300 | 1,040 | |||||||||
| Motion Pictures (1.5%) | |||||||||||
| Liberty Media Corp. 8.25%, due 02/01/2030 † | 6,000 | 5,750 | |||||||||
| Principal | Value | ||||||||||
| Motor Vehicles, Parts & Supplies (0.5%) | |||||||||||
| ArvinMeritor, Inc. | |||||||||||
| 8.13%, due 09/15/2015 | $ | 452 | $ | 443 | |||||||
| TRW Automotive, Inc. 11.00%, due 02/15/2013 | 1,300 | 1,437 | |||||||||
| Oil & Gas Extraction (3.1%) | |||||||||||
| Chesapeake Energy Corp. 7.50%, due 09/15/2013 6.38%, due 06/15/2015 6.88%, due 01/15/2016 | 1,000 3,000 1,000 | 1,028 2,873 985 | |||||||||
| Forest Oil Corp. 8.00%, due 12/15/2011 7.75%, due 05/01/2014 | 500 1,000 | 532 1,033 | |||||||||
| Newfield Exploration Co. 6.63%, due 09/01/2014 | 2,500 | 2,463 | |||||||||
| Whiting Petroleum Corp. 7.00%, due 02/01/2014 | 3,000 | 2,970 | |||||||||
| Paper & Allied Products (4.3%) | |||||||||||
| Abitibi-Consolidated, Inc. 6.00%, due 06/20/2013 † | 1,950 | 1,745 | |||||||||
| Boise Cascade LLC 7.13%, due 10/15/2014 | 2,000 | 1,900 | |||||||||
| Georgia-Pacific Corp. 7.70%, due 06/15/2015 7.75%, due 11/15/2029 | 3,000 2,000 | 3,000 1,950 | |||||||||
| Graphic Packaging International Corp. 8.50%, due 08/15/2011 † | 4,900 | 4,900 | |||||||||
| MDP Acquisitions PLC 9.63%, due 10/01/2012 | 2,000 | 2,110 | |||||||||
| Smurfit-Stone Container Corp. 8.38%, due 07/01/2012 | 1,000 | 975 | |||||||||
| Paperboard Containers & Boxes (1.0%) | |||||||||||
| Jefferson Smurfit Corp. 7.50%, due 06/01/2013 | 2,000 | 1,865 | |||||||||
| Jefferson Smurfit-Stone Container Corp. 8.25%, due 10/01/2012 | 1,900 | 1,843 | |||||||||
| Personal Credit Institutions (1.8%) | |||||||||||
| Ford Motor Credit Co. 6.50%, due 01/25/2007 5.80%, due 01/12/2009 7.38%, due 10/28/2009 7.25%, due 10/25/2011 | 500 1,000 3,000 3,000 | 497 905 2,772 2,692 | |||||||||
| Personal Services (0.5%) | |||||||||||
| Service Corp. International 7.70%, due 04/15/2009 | 2,000 | 2,050 | |||||||||
| Pharmaceuticals (0.5%) | |||||||||||
| Leiner Health Products, Inc. 11.00%, due 06/01/2012 † | 2,000 | 1,950 | |||||||||
The notes to the financial statements are an integral part of this report.
Transamerica IDEX Mutual Funds
Semi-Annual Report 2006
5
TA IDEX Transamerica High-Yield Bond
SCHEDULE OF INVESTMENTS (continued)
At April 30, 2006
(all amounts except share amounts in thousands)
(unaudited)
| Principal | Value | ||||||||||
| Primary Metal Industries (0.9%) | |||||||||||
| Novelis, Inc.–144A | |||||||||||
| 7.75%, due 02/15/2015 † | $ | 3,500 | $ | 3,395 | |||||||
| Printing & Publishing (4.0%) | |||||||||||
| American Color Graphics, Inc. 10.00%, due 06/15/2010 | 2,000 | 1,340 | |||||||||
| Dex Media East LLC/Dex Media East Finance Co. 9.88%, due 11/15/2009 | 1,000 | 1,065 | |||||||||
| Dex Media West LLC/Dex Media Finance Co., Series B 8.50%, due 08/15/2010 | 2,000 | 2,110 | |||||||||
| Dex Media, Inc. 8.00%, due 11/15/2013 | 1,000 | 1,026 | |||||||||
| Primedia, Inc. 8.88%, due 05/15/2011 8.00%, due 05/15/2013 | 2,000 3,750 | 1,925 3,394 | |||||||||
| RH Donnelley Corp.–144A 8.88%, due 01/15/2016 | 3,750 | 3,858 | |||||||||
| Vertis, Inc. 10.88%, due 06/15/2009 † | 1,000 | 955 | |||||||||
| Radio & Television Broadcasting (1.6%) | |||||||||||
| Quebecor Media, Inc.–144A 7.75%, due 03/15/2016 | 4,750 | 4,869 | |||||||||
| Videotron Ltee 6.88%, due 01/15/2014 | 1,500 | 1,485 | |||||||||
| Railroads (1.0%) | |||||||||||
| Progress Rail Services Corp./Progress Metal Reclamation Co.–144A 7.75%, due 04/01/2012 | 3,650 | 3,801 | |||||||||
| Restaurants (1.7%) | |||||||||||
| NPC International, Inc.–144A 9.50%, due 05/01/2014 | 2,000 | 2,020 | |||||||||
| Restaurant Co. (The) 10.00%, due 10/01/2013 † | 5,000 | 4,700 | |||||||||
| Stone, Clay & Glass Products (1.6%) | |||||||||||
| Owens Brockway Glass Container, Inc. 7.75%, due 05/15/2011 8.75%, due 11/15/2012 6.75%, due 12/01/2014 | 1,000 1,000 2,000 | 1,030 1,068 1,920 | |||||||||
| Owens-Illinois, Inc. 7.35%, due 05/15/2008 | 2,000 | 2,010 | |||||||||
| Telecommunications (6.6%) | |||||||||||
| Cincinnati Bell, Inc. 8.38%, due 01/15/2014 | 2,800 | 2,863 | |||||||||
| Citizens Communications Co. 9.00%, due 08/15/2031 | 3,725 | 3,995 | |||||||||
| Hawaiian Telcom Communications, Inc.–144A 9.75%, due 05/01/2013 † | 4,500 | 4,658 | |||||||||
| Principal | Value | ||||||||||
| Telecommunications (continued) | |||||||||||
| Qwest Capital Funding, Inc. 7.00%, due 08/03/2009 7.90%, due 08/15/2010 † | $2,000 5,000 | $2,008 5,131 | |||||||||
| Qwest Corp. 7.50%, due 06/15/2023 | 2,000 | 1,985 | |||||||||
| Rogers Wireless Communications, Inc. 8.00%, due 12/15/2012 6.38%, due 03/01/2014 | 1,500 3,500 | 1,575 3,448 | |||||||||
| Tobacco Products (0.5%) | |||||||||||
| RJ Reynolds Tobacco Holdings, Inc. 6.50%, due 07/15/2010 | 2,000 | 1,998 | |||||||||
| Transportation Equipment (0.6%) | |||||||||||
| Trinity Industries, Inc. 6.50%, due 03/15/2014 | 2,500 | 2,405 | |||||||||
| Total Corporate Debt Securities (cost: $373,410) | 373,929 | ||||||||||
| Shares | Value | ||||||||||
| PREFERRED STOCKS (0.5%) | |||||||||||
| Holding & Other Investment Offices (0.5%) | |||||||||||
| Duke Realty Corp. REIT (b) | 40,000 | $ | 2,069 | ||||||||
| Total Preferred Stocks (cost: $2,008) | 2,069 | ||||||||||
| COMMON STOCKS (0.0%) | |||||||||||
| Printing & Publishing (0.0%) | |||||||||||
| Golden Books Family Entertainment, Inc. ‡ | 63,750 | — | o | ||||||||
| Total Common Stocks (cost: $168) | — | o | |||||||||
| Principal | Value | ||||||||||
| SECURITY LENDING COLLATERAL (13.6%) | |||||||||||
| Debt (12.7%) | |||||||||||
| Bank Notes (1.6%) | |||||||||||
| Bank of America 4.81%, due 06/07/2006 * 4.81%, due 08/10/2006 * | $1,740 1,680 | $1,740 1,680 | |||||||||
| Bear Stearns & Co. 5.01%, due 06/06/2006 * 5.01%, due 09/07/2006 * | 672 2,016 | 672 2,016 | |||||||||
| Certificates Of Deposit (0.8%) | |||||||||||
| Halifax Bank of Scotland 4.78%, due 06/06/2006 * | 1,680 | 1,680 | |||||||||
| Rabobank Nederland 4.87%, due 05/31/2006 * | 1,680 | 1,680 | |||||||||
| Commercial Paper (0.7%) | |||||||||||
| Banco Santander Central Hispano SA 4.77%, due 05/02/2006 | 1,008 | 1,008 | |||||||||
| Sheffield Receivables Corp.–144A 4.81%, due 05/03/2006 | 1,677 | 1,677 | |||||||||
| Euro Dollar Overnight (2.3%) | |||||||||||
| Bank of Montreal 4.77%, due 05/02/2006 | 1,344 | 1,344 | |||||||||
The notes to the financial statements are an integral part of this report.
Transamerica IDEX Mutual Funds
Semi-Annual Report 2006
6
TA IDEX Transamerica High-Yield Bond
SCHEDULE OF INVESTMENTS (continued)
At April 30, 2006
(all amounts except share amounts in thousands)
(unaudited)
| Principal | Value | ||||||||||
| Euro Dollar Overnight (continued) | |||||||||||
| Dexia Group | |||||||||||
| 4.78%, due 05/04/2006 | $ | 1,680 | $ | 1,680 | |||||||
| Fortis Bank 4.77%, due 05/01/2006 | 672 | 672 | |||||||||
| Royal Bank of Canada 4.77%, due 05/01/2006 | 2,352 | 2,352 | |||||||||
| Royal Bank of Scotland 4.75%, due 05/03/2006 | 1,680 | 1,680 | |||||||||
| Svenska Handlesbanken 4.82%, due 05/01/2006 | 1,283 | 1,283 | |||||||||
| Euro Dollar Terms (3.5%) | |||||||||||
| BancoBilbao Vizcaya Argentaria SA 4.95%, due 06/20/2006 | 1,344 | 1,344 | |||||||||
| Bank of the West 4.94%, due 06/16/2006 | 1,344 | 1,344 | |||||||||
| Barclays 4.79%, due 05/10/2006 4.77%, due 05/16/2006 | 2,016 672 | 2,016 672 | |||||||||
| Canadian Imperial Bank of Commerce 4.97%, due 06/23/2006 | 1,008 | 1,008 | |||||||||
| Credit Suisse First Boston Corp. 4.73%, due 05/08/2006 | 1,008 | 1,008 | |||||||||
| Fortis Bank 4.83%, due 05/08/2006 | 672 | 672 | |||||||||
| Lloyds TSB Bank 4.81%, due 05/11/2006 | 1,008 | 1,008 | |||||||||
| Royal Bank of Scotland 4.87%, due 05/12/2006 | 1,344 | 1,344 | |||||||||
| Societe Generale 4.79%, due 05/10/2006 | 1,680 | 1,680 | |||||||||
| Principal | Value | ||||||||||
| Euro Dollar Terms (continued) | |||||||||||
| UBS AG | |||||||||||
| 4.95%, due 06/20/2006 | $ | 1,680 | $ | 1,680 | |||||||
| Repurchase Agreements (3.8%) †† | |||||||||||
| Credit Suisse First Boston Corp. 4.92%, dated 04/28/2006 to be repurchased at $2,282 on 05/01/2006 | 2,281 | 2,281 | |||||||||
| Goldman Sachs Group, Inc. (The) 4.92%, dated 04/28/2006 to be repurchased at $4,937 on 05/01/2006 | 4,935 | 4,935 | |||||||||
| Lehman Brothers, Inc. 4.92%, dated 04/28/2006 to be repurchased at $83 on 05/01/2006 | 83 | 83 | |||||||||
| Merrill Lynch & Co. 4.87%, dated 04/28/2006 to be repurchased at $5,042 on 05/01/2006 | 5,040 | 5,040 | |||||||||
| Morgan Stanley Dean Witter & Co. 4.93%, dated 04/28/2006 to be repurchased at $2,353 on 05/01/2006 | 2,352 | 2,352 | |||||||||
| Shares | Value | ||||||||||
| Investment Companies (0.9%) | |||||||||||
| Barclays Global Investors Institutional | |||||||||||
| Money Market Fund | |||||||||||
| 1-day yield of 4.78% | 2,687,811 | $ | 2,688 | ||||||||
| Merrimac Cash Fund, Premium Class 1-day yield of 4.61% @ | 715,135 | 715 | |||||||||
| Total Security Lending Collateral (cost: $53,034) | 53,034 | ||||||||||
| Total Investment Securities (cost: $428,620) # | $ | 429,032 | |||||||||
NOTES TO SCHEDULE OF INVESTMENTS:
† At April 30, 2006, all or a portion of this security is on loan (see Note 1). The value at April 30, 2006, of all securities on loan is $51,786.
o Value is less than $1.
‡ Non-income producing.
* Floating or variable rate note. Rate is listed as of April 30, 2006.
†† Cash collateral for the Repurchase Agreements, valued at $15,124, that serve as collateral for securities lending are invested in corporate bonds with interest rates and maturity dates ranging from 0.00%–9.05% and 05/02/2006–12/31/2049, respectively.
@ Regulated investment company advised by Investors Bank and Trust Co. ("IBT"). IBT is also the accounting, custody and lending agent for the Fund.
(a) Crystal US Holdings LLC/Crystal US Sub 3 Corp., Series A has a coupon rate of 0.00% until 10/01/2009, thereafter a coupon rate 10.00%.
(b) Duke Realty Corp. REIT has a coupon rate of 7.99% until 9/30/2012, thereafter the coupon rate will be 9.99%.
f Security is currently in default on interest payments.
# Aggregate cost for Federal income tax purposes is $429,409. Aggregate gross unrealized appreciation for all securities in which there is an excess of value over tax cost and aggregate gross unrealized depreciation for all securities in which there is an excess of tax cost over value were $6,969 and $7,346, respectively. Net unrealized depreciation for tax purposes is $377.
DEFINITIONS:
144A 144A Securities are registered pursuant to Rule 144A of the Securities Act of 1933. These securities are deemed to be liquid for purposes of compliance limitations on holdings of illiquid securities and may be resold as transactions exempt from registration, normally to qualified institutional buyers. At April 30, 2006, these securities aggregated $74,433 or 19.1% of the net assets of the Fund.
REIT Real Estate Investment Trust
The notes to the financial statements are an integral part of this report.
Transamerica IDEX Mutual Funds
Semi-Annual Report 2006
7
TA IDEX Transamerica High-Yield Bond
STATEMENT OF ASSETS AND LIABILITIES
At April 30, 2006
(all amounts except per share amounts in thousands)
(unaudited)
| Assets: | |||||||
| Investment securities, at value (cost: $428,620) (including securities loaned of $51,786) | $ | 429,032 | |||||
| Cash | 9,795 | ||||||
| Receivables: | |||||||
| Shares of beneficial interest sold | 251 | ||||||
| Interest | 8,136 | ||||||
| Income from loaned securities | 19 | ||||||
| Other | 25 | ||||||
| 447,258 | |||||||
| Liabilities: | |||||||
| Investment securities purchased | 4,785 | ||||||
| Accounts payable and accrued liabilities: | |||||||
| Shares of beneficial interest redeemed | 268 | ||||||
| Management and advisory fees | 187 | ||||||
| Distribution and service fees | 46 | ||||||
| Transfer agent fees | 22 | ||||||
| Administration fees | 6 | ||||||
| Payable for collateral for securities on loan | 53,034 | ||||||
| Other | 67 | ||||||
| 58,415 | |||||||
| Net Assets | $ | 388,843 | |||||
| Net Assets Consist of: | |||||||
| Shares of beneficial interest, unlimited shares authorized, no par value | $ | 392,426 | |||||
| Distributable net investment income (loss) | 893 | ||||||
| Accumulated net realized gain (loss) from investment securities | (4,887 | ) | |||||
| Net unrealized appreciation (depreciation) on investment securities | 411 | ||||||
| Net Assets | $ | 388,843 | |||||
| Net Assets by Class: | |||||||
| Class A | $ | 37,273 | |||||
| Class B | 31,544 | ||||||
| Class C | 12,501 | ||||||
| Class I | 307,525 | ||||||
| Shares Outstanding: | |||||||
| Class A | 4,079 | ||||||
| Class B | 3,456 | ||||||
| Class C | 1,371 | ||||||
| Class I | 33,466 | ||||||
| Net Asset Value Per Share: | |||||||
| Class A | $ | 9.14 | |||||
| Class B | 9.13 | ||||||
| Class C | 9.12 | ||||||
| Class I | 9.19 | ||||||
| Maximum Offering Price Per Share (a): | |||||||
| Class A | $ | 9.60 | |||||
(a) Includes the maximum selling commission (represented as a percentage of offering price) which is reduced on certain levels of sales as set forth in the Prospectus. Net asset value per share for Classes B, C and I shares represents offering price. The redemption price for Classes B and C shares equals net asset value less any applicable contingent deferred sales charge.
STATEMENT OF OPERATIONS
For the period ended April 30, 2006
(all amounts in thousands)
(unaudited)
| Investment Income: | |||||||
| Interest | $ | 15,553 | |||||
| Dividends | 80 | ||||||
| Income from loaned securities–net | 215 | ||||||
| 15,848 | |||||||
| Expenses: | |||||||
| Management and advisory fees | 1,169 | ||||||
| Distribution and service fees: | |||||||
| Class A | 109 | ||||||
| Class B | 170 | ||||||
| Class C | 70 | ||||||
| Transfer agent fees: | |||||||
| Class A | 37 | ||||||
| Class B | 32 | ||||||
| Class C | 14 | ||||||
| Class I | – | (b) | |||||
| Printing and shareholder reports | 14 | ||||||
| Custody fees | 32 | ||||||
| Administration fees | 39 | ||||||
| Legal fees | 10 | ||||||
| Audit fees | 9 | ||||||
| Trustees fees | 8 | ||||||
| Registration fees | 28 | ||||||
| Other | 5 | ||||||
| Total expenses | 1,746 | ||||||
| Net Investment Income (Loss) | 14,102 | ||||||
| Net Realized and Unrealized Gain (Loss): | |||||||
| Realized gain (loss) from investment securities | 2,102 | ||||||
| Increase (decrease) in unrealized appreciation (depreciation) on investment securities | 3,619 | ||||||
| Net Realized and Unrealized Gain (Loss) on Investment Securities | 5,721 | ||||||
| Net Increase (Decrease) in Net Assets Resulting from Operations | $ | 19,823 | |||||
(b) Rounds to less than $1.
The notes to the financial statements are an integral part of this report.
Transamerica IDEX Mutual Funds
Semi-Annual Report 2006
8
TA IDEX Transamerica High-Yield Bond
STATEMENTS OF CHANGES IN NET ASSETS
For the period or year ended
(all amounts in thousands)
| April 30, 2006 (unaudited) | October 31, 2005 (a) | ||||||||||
| Increase (Decrease) In Net Assets From: | |||||||||||
| Operations: | |||||||||||
| Net investment income (loss) | $ | 14,102 | $ | 25,616 | |||||||
| Net realized gain (loss) from investment securities | 2,102 | 5,533 | |||||||||
| Change in unrealized appreciation (depreciation) on investment securities | 3,619 | (23,007 | ) | ||||||||
| 19,823 | 8,142 | ||||||||||
| Distributions to Shareholders: | |||||||||||
| From net investment income: | |||||||||||
| Class A | (1,603 | ) | (21,465 | ) | |||||||
| Class B | (939 | ) | (2,372 | ) | |||||||
| Class C | (384 | ) | (1,112 | ) | |||||||
| Class I | (9,480 | ) | (2,175 | ) | |||||||
| (12,406 | ) | (27,124 | ) | ||||||||
| Capital Share Transactions: | |||||||||||
| Proceeds from shares sold: | |||||||||||
| Class A | 5,643 | 37,109 | |||||||||
| Class B | 695 | 3,673 | |||||||||
| Class C | 1,289 | 3,394 | |||||||||
| Class I | 325,152 | 40,302 | |||||||||
| 332,779 | 84,478 | ||||||||||
| Dividends and distributions reinvested: | |||||||||||
| Class A | 1,241 | 20,851 | |||||||||
| Class B | 628 | 1,477 | |||||||||
| Class C | 228 | 630 | |||||||||
| Class I | 9,480 | 2,175 | |||||||||
| 11,577 | 25,133 | ||||||||||
| Cost of shares redeemed: | |||||||||||
| Class A | (306,433 | ) | (16,220 | ) | |||||||
| Class B | (7,299 | ) | (15,678 | ) | |||||||
| Class C | (5,154 | ) | (12,670 | ) | |||||||
| Class I | (74,130 | ) | – | ||||||||
| (393,016 | ) | (44,568 | ) | ||||||||
| Redemption fees: | |||||||||||
| Class B | – | 1 | |||||||||
| – | 1 | ||||||||||
| Automatic conversions: | |||||||||||
| Class A | 122 | 74 | |||||||||
| Class B | (122 | ) | (74 | ) | |||||||
| – | – | ||||||||||
| (48,660 | ) | 65,044 | |||||||||
| Net increase (decrease) in net assets | (41,243 | ) | 46,062 | ||||||||
| Net Assets: | |||||||||||
| Beginning of period | 430,086 | 384,024 | |||||||||
| End of period | $ | 388,843 | $ | 430,086 | |||||||
| Distributable Net Investment Income (Loss) | $ | 893 | $ | (803 | ) | ||||||
| April 30, 2006 (unaudited) | October 31, 2005 (a) | ||||||||||
| Share Activity: | |||||||||||
| Shares issued: | |||||||||||
| Class A | 621 | 3,986 | |||||||||
| Class B | 76 | 397 | |||||||||
| Class C | 142 | 366 | |||||||||
| Class I | 36,061 | 4,293 | |||||||||
| 36,900 | 9,042 | ||||||||||
| Shares issued–reinvested from distributions: | |||||||||||
| Class A | 138 | 2,266 | |||||||||
| Class B | 69 | 161 | |||||||||
| Class C | 25 | 70 | |||||||||
| Class I | 1,040 | 236 | |||||||||
| 1,272 | 2,733 | ||||||||||
| Shares redeemed: | |||||||||||
| Class A | (34,195 | ) | (1,761 | ) | |||||||
| Class B | (803 | ) | (1,700 | ) | |||||||
| Class C | (569 | ) | (1,373 | ) | |||||||
| Class I | (8,164 | ) | – | ||||||||
| (43,731 | ) | (4,834 | ) | ||||||||
| Automatic conversions: | |||||||||||
| Class A | 13 | 8 | |||||||||
| Class B | (13 | ) | (8 | ) | |||||||
| – | – | ||||||||||
| Net increase (decrease) in shares outstanding: | |||||||||||
| Class A | (33,423 | ) | 4,499 | ||||||||
| Class B | (671 | ) | (1,150 | ) | |||||||
| Class C | (402 | ) | (937 | ) | |||||||
| Class I | 28,937 | 4,529 | |||||||||
| (5,559 | ) | 6,941 | |||||||||
(a) Class I was offered for investment on November 8, 2004.
The notes to the financial statements are an integral part of this report.
Transamerica IDEX Mutual Funds
Semi-Annual Report 2006
9
TA IDEX Transamerica High-Yield Bond
FINANCIAL HIGHLIGHTS
(unaudited for the period ended April 30, 2006)
| For a share of beneficial interest outstanding throughout each period | |||||||||||||||||||||||||||||||||||||||
| Net Asset | Investment Operations | Distributions | Net Asset | ||||||||||||||||||||||||||||||||||||
| For the Period Ended (d)(e) | Value, Beginning of Period | Net Investment Income (Loss) | Net Realized and Unrealized Gain (Loss) | Total Operations | From Net Investment Income | From Net Realized Gains | Total Distributions | Value, End of Period | |||||||||||||||||||||||||||||||
| Class A | 4/30/2006 | $ | 8.97 | $ | 0.31 | $ | 0.13 | $ | 0.44 | $ | (0.27 | ) | $ | – | $ | (0.27 | ) | $ | 9.14 | ||||||||||||||||||||
| 10/31/2005 | 9.37 | 0.56 | (0.37 | ) | 0.19 | (0.59 | ) | – | (0.59 | ) | 8.97 | ||||||||||||||||||||||||||||
| 10/31/2004 | 9.08 | 0.52 | 0.29 | 0.81 | (0.52 | ) | – | (0.52 | ) | 9.37 | |||||||||||||||||||||||||||||
| 10/31/2003 | 7.93 | 0.57 | 1.16 | 1.73 | (0.58 | ) | – | (0.58 | ) | 9.08 | |||||||||||||||||||||||||||||
| 10/31/2002 | 9.26 | 0.57 | (1.31 | ) | (0.74 | ) | (0.59 | ) | – | (0.59 | ) | 7.93 | |||||||||||||||||||||||||||
| 10/31/2001 | 9.24 | 0.72 | 0.01 | 0.73 | (0.71 | ) | – | (0.71 | ) | 9.26 | |||||||||||||||||||||||||||||
| Class B | 4/30/2006 | 8.97 | 0.28 | 0.13 | 0.41 | (0.25 | ) | – | (0.25 | ) | 9.13 | ||||||||||||||||||||||||||||
| 10/31/2005 | 9.37 | 0.48 | (0.37 | ) | 0.11 | (0.51 | ) | – | (0.51 | ) | 8.97 | ||||||||||||||||||||||||||||
| 10/31/2004 | 9.08 | 0.46 | 0.29 | 0.75 | (0.46 | ) | – | (0.46 | ) | 9.37 | |||||||||||||||||||||||||||||
| 10/31/2003 | 7.93 | 0.51 | 1.17 | 1.68 | (0.53 | ) | – | (0.53 | ) | 9.08 | |||||||||||||||||||||||||||||
| 10/31/2002 | 9.26 | 0.52 | (1.32 | ) | (0.80 | ) | (0.53 | ) | – | (0.53 | ) | 7.93 | |||||||||||||||||||||||||||
| 10/31/2001 | 9.24 | 0.57 | 0.10 | 0.67 | (0.65 | ) | – | (0.65 | ) | 9.26 | |||||||||||||||||||||||||||||
| Class C | 4/30/2006 | 8.96 | 0.28 | 0.13 | 0.41 | (0.25 | ) | – | (0.25 | ) | 9.12 | ||||||||||||||||||||||||||||
| 10/31/2005 | 9.36 | 0.47 | (0.36 | ) | 0.11 | (0.51 | ) | – | (0.51 | ) | 8.96 | ||||||||||||||||||||||||||||
| 10/31/2004 | 9.08 | 0.46 | 0.28 | 0.74 | (0.46 | ) | – | (0.46 | ) | 9.36 | |||||||||||||||||||||||||||||
| 10/31/2003 | 8.08 | 0.51 | 1.02 | 1.53 | (0.53 | ) | – | (0.53 | ) | 9.08 | |||||||||||||||||||||||||||||
| Class I | 4/30/2006 | 9.02 | 0.34 | 0.13 | 0.47 | (0.30 | ) | – | (0.30 | ) | 9.19 | ||||||||||||||||||||||||||||
| 10/31/2005 | 9.39 | 0.59 | (0.37 | ) | 0.22 | (0.59 | ) | – | (0.59 | ) | 9.02 | ||||||||||||||||||||||||||||
| Ratios/Supplemental Data | |||||||||||||||||||||||||||
| For the Period Ended (e) | Total Return (c) | Net Assets, End of Period (000's) | Ratio of Expenses to Average Net Assets (a) | Net Investment Income (Loss) to Average Net Assets (a) | Portfolio Turnover Rate (b) | ||||||||||||||||||||||
| Class A | 4/30/2006 | 4.88 | % | $ | 37,273 | 1.14 | % | 6.82 | % | 40 | % | ||||||||||||||||
| 10/31/2005 | 2.06 | 336,340 | 1.05 | 6.04 | 71 | ||||||||||||||||||||||
| 10/31/2004 | 9.23 | 309,223 | 1.08 | 5.67 | 49 | ||||||||||||||||||||||
| 10/31/2003 | 22.74 | 193,708 | 1.22 | 6.57 | 46 | ||||||||||||||||||||||
| 10/31/2002 | (8.48 | ) | 60,332 | 1.35 | 6.61 | 64 | |||||||||||||||||||||
| 10/31/2001 | 8.12 | 50,755 | 1.41 | 7.35 | 16 | ||||||||||||||||||||||
| Class B | 4/30/2006 | 4.51 | 31,544 | 1.85 | 6.19 | 40 | |||||||||||||||||||||
| 10/31/2005 | 1.21 | 37,006 | 1.85 | 5.18 | 71 | ||||||||||||||||||||||
| 10/31/2004 | 8.52 | 49,422 | 1.72 | 5.05 | 49 | ||||||||||||||||||||||
| 10/31/2003 | 21.94 | 51,511 | 1.87 | 5.92 | 46 | ||||||||||||||||||||||
| 10/31/2002 | (9.03 | ) | 31,336 | 2.00 | 5.96 | 64 | |||||||||||||||||||||
| 10/31/2001 | 7.45 | 35,471 | 2.06 | 6.70 | 16 | ||||||||||||||||||||||
| Class C | 4/30/2006 | 4.62 | 12,501 | 1.87 | 6.16 | 40 | |||||||||||||||||||||
| 10/31/2005 | 1.21 | 15,880 | 1.88 | 5.11 | 71 | ||||||||||||||||||||||
| 10/31/2004 | 8.41 | 25,379 | 1.78 | 4.95 | 49 | ||||||||||||||||||||||
| 10/31/2003 | 19.52 | 8,403 | 1.87 | 5.92 | 46 | ||||||||||||||||||||||
| Class I | 4/30/2006 | 5.14 | 307,525 | 0.67 | 7.40 | 40 | |||||||||||||||||||||
| 10/31/2005 | 2.33 | 40,860 | 0.66 | 6.60 | 71 | ||||||||||||||||||||||
The notes to the financial statements are an integral part of this report.
Transamerica IDEX Mutual Funds
Semi-Annual Report 2006
10
TA IDEX Transamerica High-Yield Bond
FINANCIAL HIGHLIGHTS (continued)
(unaudited)
NOTES TO FINANCIAL HIGHLIGHTS
(a) Annualized.
(b) Not annualized.
(c) Total Return has been calculated for the applicable period without deduction of a sales load, if any, on an initial purchase. Not annualized.
(d) Per share information is calculated based on average number of shares outstanding.
(e) The inception dates for the Fund's offering of share classes were as follows:
Class C was November 11, 2002.
Class I was November 8, 2004.
The notes to the financial statements are an integral part of this report.
Transamerica IDEX Mutual Funds
Semi-Annual Report 2006
11
TA IDEX Transamerica High-Yield Bond
NOTES TO FINANCIAL STATEMENTS
At April 30, 2006
(all amounts in thousands)
(unaudited)
NOTE 1. ORGANIZATION AND SIGNIFICANT ACCOUNTING POLICIES
Transamerica IDEX Mutual Funds is an open-end management investment company registered under the Investment Company Act of 1940, as amended (the "1940 Act").
In the normal course of business, the Fund enters into contracts that contain a variety of representations that provide general indemnifications. The Fund's maximum exposure under these arrangements is unknown, as this would involve future claims that may be made against the Fund and/or its affiliates that have not yet occurred. However, based on experience, the Fund expects the risk of loss to be remote.
This report should be read in conjunction with the current Fund prospectus, which contains more complete information about the Fund.
In preparing the Fund's financial statements in accordance with accounting principles generally accepted in the United States of America ("GAAP"), estimates or assumptions (which could differ from actual results) may be used that affect reported amounts and disclosures. The following is a summary of significant accounting policies followed by the Fund.
Multiple class operations, income and expenses: The Fund currently offers four classes of shares, Class A, Class B, Class C and Class I, each with a public offering price that reflects different sales charges, if any, and expense levels. Class I is only available for investment to certain affiliated asset allocation funds. Class B shares will convert to Class A shares eight years after purchase. Income, non-class specific expenses and realized and unrealized gains and losses, are allocated daily to each class, based upon the value of shares outstanding method as permitted under Rule 18f-3 of the 1940 Act. Each class bears its own specific expenses as well as a portion of general common expenses.
Security valuations: The Fund values its investments at the close of the New York Stock Exchange ("NYSE"), normally 4 p.m. ET, each day the NYSE is open for business. Fund investments are valued at the last sale price or closing price on the day of valuation taken from the primary exchange where the security is principally traded.
Securities traded in the over-the-counter market and listed securities for which no sale was reported on that date are valued at the last quoted bid price.
Debt securities are valued based on a price quotation or other equivalent indication of value supplied by an exchange, a pricing service or a major market maker; however, those that mature in sixty days or less are valued at amortized cost, which approximates market.
Investment company securities are valued at the net asset value of the underlying portfolio.
Other securities for which quotations are not readily available or whose values have been determined to be unreliable are valued at fair market value as determined in good faith by the Fund's Administrative Valuation Committee, under the supervision of the Board's Valuation Committee, using guidelines adopted by the Board of Trustees.
Cash: The Fund may leave cash overnight in its cash account with the custodian, Investors Bank & Trust Company ("IBT"). IBT has been contracted on behalf of the Fund to invest the excess cash into a savings account, which at April 30, 2006, was paying an interest rate of 3.24%.
Repurchase agreements: The Fund is authorized to enter into repurchase agreements. The Fund, through its custodian, IBT, receives delivery of the underlying securities, the value of which at the time of purchase is required to be an amount equal to at least 100% of the resale price. The Fund will bear the risk of value fluctuations until the security can be sold and may encounter delays and incur costs in liquidating the security. In the event of bankruptcy or insolvency of the seller, delays and costs may be incurred.
Securities lending: The Fund may lend securities to qualified borrowers, with IBT acting as the Fund's lending agent. The Fund earns negotiated lenders' fees. The Fund receives cash and/or securities as collateral against the loaned securities. Cash collateral received is invested in short term, interest bearing securities. The Fund monitors the market value of securities loaned on a daily basis and requires collateral in an amount at least equal to the value of the securities loaned. Income from loaned securities on the Statement of Operations is net of fees, in the amount of $92, earned by IBT for its services.
Real Estate Investment Trusts ("REITs"): There are certain additional risks involved in investing in REITs. These include, but are not limited to, economic conditions, changes in zoning laws, real estate values, property taxes and interest rates.
Security transactions and investment income: Security transactions are recorded on the trade date. Security gains and losses are calculated on the specific identification basis. Dividend income, if any, is recorded on the ex-dividend date or, in the case of foreign securities, as soon as the Fund is informed of the ex-dividend date. Interest income, including accretion of discounts and amortization of premiums, is recorded on the accrual basis commencing on the settlement date.
Redemption fees: A short-term trading redemption fee may be assessed on any Fund shares in a fund account that are sold during the first five (5) NYSE trading days following their purchase date. This redemption fee will equal 2% of the amount redeemed and shares held the longest will be treated as being redeemed first and shares held the shortest as being redeemed last. For the six months ended April 30, 2006, the Fund received less than $1 in redemption fees.
Transamerica IDEX Mutual Funds
Semi-Annual Report 2006
12
TA IDEX Transamerica High-Yield Bond
NOTES TO FINANCIAL STATEMENTS (continued)
At April 30, 2006
(all amounts in thousands)
(unaudited)
NOTE 1.–(continued)
Dividend distributions: Distributions to shareholders are recorded on the ex-dividend date and are determined in accordance with Federal income tax regulations which may differ from GAAP.
NOTE 2. RELATED PARTY TRANSACTIONS
Transamerica Fund Advisors, Inc. ("TFAI") is the Fund's investment adviser. Transamerica Fund Services, Inc. ("TFS") is the Fund's administrator and transfer agent. AFSG Securities Corp. ("AFSG") is the Fund's distributor/principal underwriter. TFAI, TFS, and AFSG are affiliates of AEGON, NV, a Netherlands corporation.
AEGON USA Investment Management, LLC is both the sub-adviser to the Fund and an affiliate of the Fund.
Certain officers and trustees of the Fund are also officers and/or directors of TFAI, TFS and AFSG.
The following schedule reflects the percentage of Fund assets owned by affiliated investment companies at April 30, 2006:
| Net Assets | % of Net Assets | ||||||||||
| TA IDEX Asset Allocation– Conservative Portfolio | $ | 39,122 | 10.06 | % | |||||||
| TA IDEX Asset Allocation– Moderate Portfolio | 98,096 | 25.23 | % | ||||||||
| TA IDEX Asset Allocation– Moderate Growth Portfolio | 100,858 | 25.94 | % | ||||||||
| Asset Allocation– Conservative Portfolio | 23,567 | 6.06 | % | ||||||||
| Asset Allocation– Moderate Growth Portfolio | 27,569 | 7.09 | % | ||||||||
| Asset Allocation– Moderate Portfolio | 17,860 | 4.59 | % | ||||||||
| Total | $ | 307,072 | 78.97 | % | |||||||
Investment advisory fees: The Fund pays management fees to TFAI based on average daily net assets ("ANA") at the following breakpoints:
From November 1, 2005 to December 31, 2005:
0.60% of the first $400 million of ANA
0.575% of the next $350 million of ANA
0.55% of ANA over $750 million
From January 1, 2006 on:
0.59% of the first $400 million of ANA
0.575% of the next $350 million of ANA
0.55% of ANA over $750 million
TFAI has contractually agreed to waive its advisory fee and will reimburse the Fund to the extent that operating expenses, excluding 12b-1 fees, exceed the following stated annual limit:
From November 1, 2005 to December 31, 2005:
1.25% Expense Limit–Classes A, B and C
0.80% Expense Limit–Class I
From January 1, 2006 on:
1.24% Expense Limit
Distribution and service fees: The Fund has a 12b-1 distribution plan under the 1940 Act pursuant to which an annual fee, based on average daily net assets, is paid to the distributor for various disbursements such as broker-dealer account servicing fees and other promotional expenses of the Fund. The Fund is authorized under the 12b-1 plan to pay fees on each class up to the following limits:
| Class A | 0.35 | % | |||||
| Class B | 1.00 | % | |||||
| Class C | 1.00 | % | |||||
| Class I | N/A | ||||||
In the case the Fund or a class of shares of the Fund is closed to new investors or investments, the Fund is authorized to pay 12b-1 fees for past sales and distribution efforts and present and past investor services.
Underwriter commissions relate to front-end sales charges imposed for Class A shares and contingent deferred sales charges from Classes B, C, and certain A share redemptions. For the six months ended April 30, 2006, the underwriter commissions were as follows:
| Received by Underwriter | $ | 45 | |||||
| Retained by Underwriter | 9 | ||||||
| Contingent Deferred Sales Charge | 70 | ||||||
Administrative services: The Fund has entered into an agreement with TFS for financial and legal fund administration services. The Fund pays TFS an annual fee of 0.02% of ANA. The Legal fees on the Statement of Operations are fees paid to external legal counsel.
Transfer agent fees: The Fund pays TFS an annual per-account charge for each open and closed account. The Fund paid TFS $80 for the six months ended April 30, 2006.
Deferred compensation plan: Each eligible independent Fund Trustee may elect to participate in a non-qualified deferred compensation plan
Transamerica IDEX Mutual Funds
Semi-Annual Report 2006
13
TA IDEX Transamerica High-Yield Bond
NOTES TO FINANCIAL STATEMENTS (continued)
At April 30, 2006
(all amounts in thousands)
(unaudited)
NOTE 2.–(continued)
maintained by Transamerica IDEX Mutual Funds (the "Plan"). Under the Plan, such Trustees may defer payment of all or a portion of their total fees earned as a Fund Trustee. Each Trustee who is a participant in the Plan may elect that the earnings, losses or gains credited to his or her deferred fee amounts be determined based on a deemed investment in any series of Transamerica IDEX Mutual Funds, including the Fund. The right of a participant to receive a distribution from the Plan of the deferred fees is an unsecured claim against the general assets of all series of Transamerica IDEX Mutual Funds. The pro rata liability to the Fund of all deferred fees in the Plan amounted, as of April 30, 2006, to $25.
NOTE 3. INVESTMENT TRANSACTIONS
The cost of securities purchased and proceeds from securities sold (excluding short-term securities) for the six months ended April 30, 2006 were as follows:
| Purchases of securities: | |||||||
| Long-Term | $ | 152,217 | |||||
| U.S. Government | – | ||||||
| Proceeds from maturities and sales of securities: | |||||||
| Long-Term | 190,564 | ||||||
| U.S. Government | 1,794 | ||||||
NOTE 4. FEDERAL INCOME TAX MATTERS
The Fund has not made any provision for federal income or excise taxes due to its policy to distribute all of its taxable income and capital gains to its shareholders and otherwise qualify as a regulated investment company under Subchapter M of the Internal Revenue Code. Income and capital gain distributions are determined in accordance with income tax regulations, which may differ from GAAP. These differences are primarily due to differing treatment for items including, but not limited to, wash sales and capital loss carryforwards.
The capital loss carryforwards are available to offset future realized capital gains through the periods listed:
| Capital Loss Carryforwards | Available through | ||||||
| $ | 1,624 | October 31, 2010 | |||||
| 5,283 | October 31, 2011 | ||||||
NOTE 5. REGULATORY PROCEEDINGS
There continues to be significant federal and state regulatory activity relating to financial services companies, particularly mutual fund companies and their investment advisers. As part of an ongoing investigation regarding potential market timing, recordkeeping and trading compliance issues and matters affecting the Fund's investment adviser, TFAI, and certain affiliates and former employees of TFAI, the SEC staff has indicated that it is likely to take some action against TFAI and certain of its affiliates at the conclusion of the investigation. The potential timing and the scope of any such action is difficult to predict. Although the impact of any action brought against TFAI and/or its affiliates is difficult to assess at the present time, the Fund currently believes that the likelihood that any such action will have a material adverse impact on it is remote. It is important to note that the Fund is not aware of any allega tion of wrongdoing against it and its Board at the time this semi-annual report is printed. Although it is not anticipated that these developments will have an adverse impact on the Fund, there can be no assurance at this time. TFAI and its affiliates are actively working with the SEC in regard to this matter; however, the exact resolution cannot be determined at this time. TFAI will take such actions that it deems necessary or appropriate to continue providing management services to the Fund and to bring all matters to an appropriate conclusion.
TFAI and/or its affiliates, and not the Fund, will bear the costs regarding these regulatory matters.
Transamerica IDEX Mutual Funds
Semi-Annual Report 2006
14
TA IDEX Transamerica High-Yield Bond
INVESTMENT ADVISORY AND SUB-ADVISORY AGREEMENTS – REVIEW AND RENEWAL (unaudited)
At a meeting of the Board of Trustees of Transamerica IDEX Mutual Funds ("TA IDEX") held on November 2, 2005, the Board reviewed and considered the Investment Advisory Agreement between TA IDEX Transamerica High-Yield Bond (the "Fund") and Transamerica Fund Advisors, Inc. ("TFAI"), as well as the Investment Sub-Advisory Agreement of the Fund between TFAI and AEGON USA Investment Management, LLC (the "Sub-Adviser"), to determine whether the agreements should be renewed for a one-year period. Following their review and consideration, the Trustees determined that the Investment Advisory Agreement and the Investment Sub-Advisory Agreement will enable shareholders of the Fund to obtain high quality services at a cost that is appropriate, reasonable, and in the best interests of its shareholders. The Board, including the independent members of the Board, unanimously approved the renewal of the Investment Advisory Agreement and the Inv estment Sub-Advisory Agreement. In reaching their decision, the Trustees requested and obtained from TFAI and the Sub-Adviser such information as they deemed reasonably necessary to evaluate the proposed agreements. The Trustees also carefully considered the information that they had received throughout the year from TFAI and the Sub-Adviser (such as in-person presentations by the Sub-Adviser) as part of their regular oversight of the Fund, as well as: comparative fee, expense and performance information prepared by Lipper Inc. ("Lipper"), independent providers of mutual fund performance, fee and expense information, and profitability data. In considering the proposed continuation of the Investment Advisory Agreement and Investment Sub-Advisory Agreement, the Trustees evaluated a number of considerations that they believed, in light of the legal advice furnished to them by TA IDEX counsel and independent legal counsel and their own business judgment, to be relevant. They based their decisions on the followin g considerations, among others, although they did not identify any consideration or particular information that was controlling of their decisions:
The nature, extent and quality of the advisory service to be provided. The Board considered the nature and quality of the services provided by TFAI and the Sub-Adviser to the Fund in the past, as well as the services anticipated to be provided in the future. The Board concluded that TFAI and the Sub-Adviser are capable of providing high quality services to the Fund, as indicated by the nature and quality of services provided in the past, TFAI's and the Sub-Adviser's management capabilities demonstrated with respect to the funds they manage, including the Fund, and the experience, capability and integrity of TFAI's senior management, the financial resources of TFAI and the Sub-Adviser, TFAI's management oversight process, the professional qualifications and experience of the Sub-Adviser's portfolio management team, and the Fund's investment performance . The Trustees also concluded that TFAI and the Sub-Adviser proposed to provide investment and related services that were of the same quality and quantity as services provided to the Fund in the past, and that these services are appropriate in scope and extent in light of the Fund's operations, the competitive landscape of the investment company business and investor needs, and that TFAI's and the Sub-Adviser's obligations will remain substantially the same.
The investment performance of the Fund. The Board examined both the short-term and longer-term performance of the Fund, including relative performance against a benchmark securities index and a peer group of comparable mutual funds as prepared by Lipper for various trailing periods ended June 30, 2005. The Trustees concluded that TFAI and the Sub-Adviser generally had achieved competitive investment performance, noting that the Fund performance has been above median relative to its peers and superior to the benchmark index over the past one-, five- and ten-year periods. The Board expressed disappointment with the below-median performance over the past three-year period, but noted that this may result, in part, from the Fund's traditional investment focus on higher-quality high-yield issues because of the restrictions in investing in lower-quality issu es that existed until recently. On the basis of the Trustees' assessment of the nature, extent and quality of advisory services to be provided or procured by TFAI and the Sub-Adviser, the Trustees concluded that TFAI and the Sub-Adviser are capable of generating a level of investment performance that is appropriate in light of the Fund's investment objective, policies and strategies and competitive with many other investment companies, and also determined that TFAI's and the Sub-Adviser's performance records indicate that their continued management is likely to benefit the Fund and its shareholders.
The cost of advisory services provided and the level of profitability. The Board reviewed profitability information regarding TFAI's costs of procuring portfolio management services, as well as the costs of provision of administration, transfer agency, fund accounting and other services, to the Fund and to TA IDEX as a whole by TFAI and its affiliates. The Board favorably noted the Fund's new pricing schedule, which results in lower management and sub-advisory fees to the benefit of the Fund and its shareholders, and also reviewed data from Lipper that compared the Fund's new pricing schedule (including management fees at various asset levels), other fees and expenses (including total expenses including and excluding 12b-1 distribution and service fees) and portfolio turnover rate against peer groups of comparable mutual funds. Based on such informati on, the Trustees determined that the management fees and overall expense ratio of the Fund generally are consistent with industry averages. In addition, on the basis of the Board's review of the management fees to be charged by TFAI for investment advisory and related services, TFAI
Transamerica IDEX Mutual Funds
Semi-Annual Report 2006
15
TA IDEX Transamerica High-Yield Bond (continued)
profitability information (derived from TFAI's audited financial statements), TFAI's estimated management income resulting from its management of the Fund, the estimated margin of the Sub-Adviser, as well as the entirety of TFAI's and its affiliates' service relationship with TA IDEX, the Board concluded that the level of investment management fees and other service fees, as well as TFAI's and the Sub-Adviser's profitability, are appropriate in light of the services provided, the management fees and overall expense ratios of comparable investment companies and the anticipated profitability of the relationship between the Fund, TFAI and its affiliates, and the Sub-Adviser.
Whether fee levels reflect economies of scale and the extent to which economies of scale would be realized as the Fund grows. The Board noted that the Fund is closed to new investors and will be closed to new investments in the near future, except that the Fund may continue selling shares to other TA IDEX funds and other investment companies in the same group of investment companies as TA IDEX, which may limit, to an extent, the ability of the Fund to realize economies of scale. The Board then noted and went on to conclude that the inclusion of asset-based breakpoints in the Fund's advisory fee schedule appropriately benefits investors by realizing economies of scale in the form of lower management fees as the level of assets grows. In addition, the Board concluded that the Fund's management fees appropriately reflect the Fund's current size, the curr ent economic environment for TFAI, the competitive nature of the investment company market, and TFAI's pricing strategy. The Trustees also concluded that they will have the opportunity to periodically reexamine whether the Fund has achieved economies of scale, and the appropriateness of management fees payable to TFAI and fees payable by TFAI to the Sub-Adviser, in the future.
Benefits (such as soft dollars) to TFAI, its affiliates, or the Sub-Adviser from their relationship with the Fund. The Board concluded that other benefits derived by TFAI, its affiliates, and the Sub-Adviser from their relationship with the Fund are reasonable and fair, and are consistent with industry practice and the best interests of the Fund and its shareholders. In this regard, the Board noted that neither TFAI nor the Sub-Adviser realizes "soft dollar" benefits from its relationship with the Fund. In addition, the Trustees determined that the administration, transfer agency, fund accounting, and other fees paid by the Fund to affiliates of TFAI are reasonable, fair and in the best interests of shareholders in light of the nature and quality of the services provided, the associated costs to these affiliates of providing the services, the impact o f the costs of such services on the Fund's overall operating expenses, and the necessity of the services for the Fund's operations.
Other considerations. The Board also determined that TFAI had made a substantial commitment to the recruitment and retention of high quality personnel, and maintained the financial, compliance and operational resources reasonably necessary to manage the Fund in a professional manner that is consistent with the best interests of the Fund and its shareholders. In this regard, the Trustees favorably considered the procedures and policies in place by TFAI to enforce compliance with applicable laws and regulations and oversee the portfolio management activities of the Sub-Adviser. The Trustees also determined that TFAI had made a significant entrepreneurial commitment to the management and success of the Fund, reflected by TFAI's expense limitation and fee waiver arrangement with the Fund, which may result in TFAI waiving advisory fees for the benefit of s hareholders.
Transamerica IDEX Mutual Funds
Semi-Annual Report 2006
16
TA IDEX Transamerica Money Market
UNDERSTANDING YOUR FUND'S EXPENSES
(unaudited)
SHAREHOLDER EXPENSES
Fund shareholders may incur two types of costs: (1) transaction costs, including sales charges (loads) on purchases, contingent deferred sales charges on redemptions and redemption fees; and (2) ongoing costs, including management fees, 12b-1 distribution and service fees, and other fund expenses.
The following Example is intended to help you understand your ongoing costs (in dollars and cents) of investing in the Fund and to compare these costs with the ongoing costs of investing in other funds.
The Example is based on an investment of $1,000 invested at November 1, 2005 and held for the entire period until April 30, 2006.
ACTUAL EXPENSES
The first line in the table below provides information about actual account values and actual expenses. You may use the information in this line, together with the amount you invested, to estimate the expenses that you paid over the period. Simply divide your account value by $1,000 (for example, an $8,600 account value divided by $1,000 = 8.6), then multiply the result by the number in the first line of your Fund under the heading entitled "Expenses Paid During Period" to estimate the expenses you paid on your account during this period. If your account is an IRA, your expenses could have included a $15 annual fee. The amount of any fee paid through your account would increase the estimate of expenses you paid during the period and decrease your ending account value.
HYPOTHETICAL EXAMPLE FOR COMPARISON PURPOSES
The second line in the table below provides information about hypothetical account values and hypothetical expenses based on the Fund's actual expense ratio and an assumed rate of return of 5% per year before expenses, which is not the Fund's actual return. The hypothetical account values and expenses may not be used to estimate the actual ending account balance or expenses you paid for the period. You may use this information to compare the ongoing costs of investing in your Fund and other funds. To do so, compare this 5% hypothetical example with the 5% hypothetical examples that appear in the shareholder reports of the other funds. As in the case of the actual expense example, if your account is subject to an IRA fee, the amount of the fee paid through your account would increase the hypothetical expenses you would have paid during the period and decrease the hypothetical ending account value.
Please note that the expenses shown in the table are meant to highlight your ongoing costs only and do not reflect any transactional costs, such as sales charges, redemption fees, brokerage commissions paid on purchases and sales of fund shares. Therefore, the second line under the Fund in the table is useful in comparing ongoing costs only, and will not help you determine the relative total costs of owning different funds. If any of these transaction costs were included, your costs would be higher. The expenses shown in the table do not reflect any fees that may be charged to you by brokers, financial intermediaries or other financial institutions.
| Beginning Account Value | Ending Account Value | Annualized Expense Ratio | Expenses Paid During Period (a) | ||||||||||||||||
| Class A | |||||||||||||||||||
| Actual | $ | 1,000.00 | $ | 1,018.00 | 0.83 | % | $ | 4.15 | |||||||||||
| Hypothetical (b) | 1,000.00 | 1,020.68 | 0.83 | 4.16 | |||||||||||||||
| Class B | |||||||||||||||||||
| Actual | 1,000.00 | $ | 1,014.70 | 1.48 | 7.39 | ||||||||||||||
| Hypothetical (b) | 1,000.00 | 1,017.46 | 1.48 | 7.40 | |||||||||||||||
| Class C | |||||||||||||||||||
| Actual | 1,000.00 | $ | 1,014.70 | 1.48 | 7.39 | ||||||||||||||
| Hypothetical (b) | 1,000.00 | 1,017.46 | 1.48 | 7.40 | |||||||||||||||
| Class I | |||||||||||||||||||
| Actual | 1,000.00 | $ | 1,018.00 | 0.48 | 2.20 | ||||||||||||||
| Hypothetical (b) | 1,000.00 | 1,020.56 | 0.48 | 2.21 | |||||||||||||||
(a) Expenses are calculated using the Fund's annualized expense ratio (as disclosed in the table), multiplied by the average account value for the period, multiplied by number of days in the period (181 days for Classes A, B and C, and 166 days for Class I), and divided by the number of days in the year (365 days).
(b) 5% return per year before expenses.
GRAPHICAL PRESENTATION OF SCHEDULE OF INVESTMENTS
By Maturity Distribution
At April 30, 2006
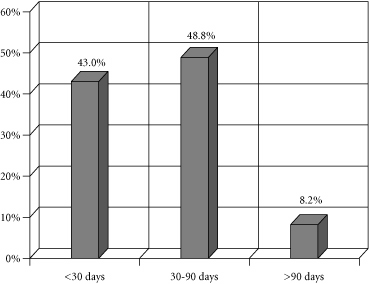
This chart shows the percentage breakdown by maturity distribution of the Fund's total investment securities.
Transamerica IDEX Mutual Funds
Semi-Annual Report 2006
1
TA IDEX Transamerica Money Market
SCHEDULE OF INVESTMENTS
At April 30, 2006
(all amounts except share amounts in thousands)
(unaudited)
| Principal | Value | ||||||||||
| COMMERCIAL PAPER (79.4%) | |||||||||||
| Automotive (2.9%) | |||||||||||
| BMW US Capital LLC–144A 4.79%, due 05/17/2006 | $ | 3,400 | $ | 3,392 | |||||||
| Chemicals & Allied Products (3.1%) | |||||||||||
| Procter & Gamble Co.–144A 4.75%, due 05/02/2006 | 3,585 | 3,584 | |||||||||
| Commercial Banks (24.9%) | |||||||||||
| Bank of America Corp. 4.95%, due 06/27/2006 | 4,700 | 4,662 | |||||||||
| HBOS Treasury Services 4.77%, due 05/23/2006 | 2,100 | 2,093 | |||||||||
| 4.82%, due 06/16/2006 | 2,400 | 2,385 | |||||||||
| 4.83%, due 06/16/2006 | 1,150 | 1,143 | |||||||||
| Quebec Province 4.92%, due 07/05/2006 | 5,600 | 5,549 | |||||||||
| Royal Bank of Scotland 4.75%, due 05/02/2006 | 1,650 | 1,649 | |||||||||
| 4.75%, due 05/03/2006 | 1,500 | 1,499 | |||||||||
| 4.89%, due 06/20/2006 | 2,400 | 2,383 | |||||||||
| UBS Finance Delaware LLC 4.78%, due 05/08/2006 | 1,900 | 1,898 | |||||||||
| 4.88%, due 06/09/2006 | 2,000 | 1,989 | |||||||||
| 4.93%, due 07/06/2006 | 1,300 | 1,288 | |||||||||
| Wells Fargo & Co. 4.87%, due 05/22/2006 | 2,300 | 2,293 | |||||||||
| Food & Kindred Products (2.2%) | |||||||||||
| Nestle Capital Corp.–144A 4.74%, due 05/04/2006 | 1,500 | 1,499 | |||||||||
| 4.73%, due 05/05/2006 | 1,000 | 999 | |||||||||
| Insurance (0.7%) | |||||||||||
| Metlife Funding, Inc. 4.62%, due 05/18/2006 | 850 | 848 | |||||||||
| Metal Mining (4.8%) | |||||||||||
| BHP Billiton Finance USA, Ltd.–144A 4.91%, due 06/07/2006 | 5,600 | 5,570 | |||||||||
| Mortgage Bankers & Brokers (14.5%) | |||||||||||
| Barclays U.S. Funding Corp. 4.90%, due 07/06/2006 | 1,500 | 1,486 | |||||||||
| 4.95%, due 07/11/2006 | 4,200 | 4,158 | |||||||||
| CAFCO LLC-144A 4.72%, due 05/12/2006 | 2,900 | 2,895 | |||||||||
| 4.91%, due 06/15/2006 | 1,900 | 1,888 | |||||||||
| Old Line Funding Corp.–144A 4.83%, due 05/15/2006 | 500 | 499 | |||||||||
| 4.84%, due 06/01/2006 | 3,500 | 3,484 | |||||||||
| 4.90%, due 06/05/2006 | 1,550 | 1,542 | |||||||||
| Principal | Value | ||||||||||
| Mortgage Bankers & Brokers (continued) | |||||||||||
| Ranger Funding Co. LLC–144A 4.76%, due 05/10/2006 | $ | 900 | $ | 899 | |||||||
| Oil & Gas Extraction (2.3%) | |||||||||||
| Total Capital SA–144A 4.57%, due 05/01/2006 | 2,700 | 2,699 | |||||||||
| Paper & Allied Products (0.8%) | |||||||||||
| Kimberly-Clark Worldwide–144A 4.89%, due 05/26/2006 | 900 | 897 | |||||||||
| Personal Credit Institutions (22.4%) | |||||||||||
| American Honda Finance Corp. 4.74%, due 05/09/2006 | 1,725 | 1,724 | |||||||||
| 4.75%, due 05/10/2006 | 3,275 | 3,270 | |||||||||
| 4.84%, due 06/05/2006 | 600 | 597 | |||||||||
| General Electric Capital Corp. 4.83%, due 05/25/2006 | 2,200 | 2,192 | |||||||||
| 4.82%, due 06/02/2006 | 1,200 | 1,195 | |||||||||
| 4.90%, due 06/19/2006 | 1,400 | 1,390 | |||||||||
| 4.90%, due 07/06/2006 | 750 | 743 | |||||||||
| International Lease Finance Corp. 4.73%, due 05/15/2006 | 3,150 | 3,143 | |||||||||
| 4.73%, due 05/16/2006 | 2,500 | 2,494 | |||||||||
| Paccar Financial Corp. 4.78%, due 05/04/2006 | 1,830 | 1,829 | |||||||||
| 4.59%, due 05/09/2006 | 900 | 899 | |||||||||
| 4.97%, due 07/19/2006 | 2,700 | 2,670 | |||||||||
| Toyota Motor Credit Corp. 4.75%, due 05/11/2006 | 3,800 | 3,794 | |||||||||
| Savings Institutions (0.8%) | |||||||||||
| Ciesco LLC–144A 4.92%, due 06/13/2006 | 900 | 894 | |||||||||
| Total Commercial Paper (cost: $92,004) | 92,004 | ||||||||||
| SHORT-TERM OBLIGATIONS (14.6%) | |||||||||||
| Computer & Data Processing Services (4.3%) | |||||||||||
| International Business Machines Corp. 4.88%, due 10/01/2006 | 5,000 | 4,993 | |||||||||
| Department Stores (0.9%) | |||||||||||
| Wal-Mart Stores, Inc. 5.45%, due 08/01/2006 | 1,041 | 1,042 | |||||||||
| Oil & Gas Extraction (4.9%) | |||||||||||
| BP Capital Markets PLC 2.35%, due 06/15/2006 | 5,700 | 5,683 | |||||||||
| Personal Credit Institutions (1.6%) | |||||||||||
| Toyota Motor Credit Corp. 3.00%, due 06/09/2006 | 1,800 | 1,797 | |||||||||
The notes to the financial statements are an integral part of this report.
Transamerica IDEX Mutual Funds
Semi-Annual Report 2006
2
TA IDEX Transamerica Money Market
SCHEDULE OF INVESTMENTS (continued)
At April 30, 2006
(all amounts except share amounts in thousands)
(unaudited)
| Principal | Value | ||||||||||
| Security & Commodity Brokers (2.9%) | |||||||||||
| Goldman Sachs Group, Inc., Series B 4.87%, due 08/01/2006* | $ | 3,400 | $ | 3,401 | |||||||
| Total Short-Term Obligations (cost: $16,916) | 16,916 | ||||||||||
| CERTIFICATES OF DEPOSIT (6.0%) | |||||||||||
| Wells Fargo Bank NA 4.89%, due 05/30/2006 | 2,400 | 2,400 | |||||||||
| Toronto Dominion Bank, Ltd. 4.71%, due 05/24/2006 | 2,900 | 2,900 | |||||||||
| 4.91%, due 06/29/2006 | 1,700 | 1,700 | |||||||||
| Total Certificates Of Deposit (cost: $7,000) | 7,000 | ||||||||||
| Total Investment Securities (cost: $115,920) | $ | 115,920 | |||||||||
NOTES TO SCHEDULE OF INVESTMENTS:
* Floating or variable rate note. Rate is listed as of April 30, 2006.
DEFINITIONS:
144A 144A Securities are registered pursuant to Rule 144A of the Securities Act of 1933. These securities are deemed to be liquid for purposes of compliance limitations on holdings of illiquid securities and may be resold as transactions exempt from registration, normally to qualified institutional buyers. At April 30, 2006, these securities aggregated $30,741 or 26.5% of the net assets of the Fund.
The notes to the financial statements are an integral part of this report.
Transamerica IDEX Mutual Funds
Semi-Annual Report 2006
3
TA IDEX Transamerica Money Market
STATEMENT OF ASSETS AND LIABILITIES
At April 30, 2006
(all amounts except per share amounts in thousands)
(unaudited)
| Assets: | |||||||
| Investment securities, at value (cost: $115,920) | $ | 115,920 | |||||
| Cash | 62 | ||||||
| Receivables: | |||||||
| Shares of beneficial interest sold | 364 | ||||||
| Interest | 180 | ||||||
| Due from investment advisor | 9 | ||||||
| Other | 12 | ||||||
| 116,547 | |||||||
| Liabilities: | |||||||
| Accounts payable and accrued liabilities: | |||||||
| Shares of beneficial interest redeemed | 393 | ||||||
| Distribution and service fees | 53 | ||||||
| Transfer agent fees | 45 | ||||||
| Administration fees | 2 | ||||||
| Dividends to shareholders | 156 | ||||||
| Other | 47 | ||||||
| 696 | |||||||
| Net Assets | $ | 115,851 | |||||
| Net Assets Consist of: | |||||||
| Shares of beneficial interest, unlimited shares authorized, no par value | $ | 115,761 | |||||
| Distributable net investment income (loss) | 90 | ||||||
| Net Assets | $ | 115,851 | |||||
| Net Assets by Class: | |||||||
| Class A | $ | 72,781 | |||||
| Class B | 26,439 | ||||||
| Class C | 11,265 | ||||||
| Class I | 5,366 | ||||||
| Shares Outstanding: | |||||||
| Class A | 72,782 | ||||||
| Class B | 26,438 | ||||||
| Class C | 11,260 | ||||||
| Class I | 5,365 | ||||||
| Net Asset Value Per Share: | |||||||
| Class A | $ | 1.00 | |||||
| Class B | 1.00 | ||||||
| Class C | 1.00 | ||||||
| Class I | 1.00 | ||||||
(a) Class I was offered for investment on November 15, 2005.
STATEMENT OF OPERATIONS
For the period ended April 30, 2006 (a)
(all amounts in thousands)
(unaudited)
| Investment Income: | |||||||
| Interest | $ | 2,932 | |||||
| Expenses: | |||||||
| Management and advisory fees | 269 | ||||||
| Distribution and service fees: | |||||||
| Class A | 140 | ||||||
| Class B | 141 | ||||||
| Class C | 65 | ||||||
| Transfer agent fees: | |||||||
| Class A | 150 | ||||||
| Class B | 36 | ||||||
| Class C | 23 | ||||||
| Class I | – | (b) | |||||
| Printing and shareholder reports | 24 | ||||||
| Custody fees | 9 | ||||||
| Administration fees | 13 | ||||||
| Legal fees | 4 | ||||||
| Audit fees | 9 | ||||||
| Trustees fees | 3 | ||||||
| Registration fees | 47 | ||||||
| Other | 2 | ||||||
| Total expenses | 935 | ||||||
| Less: | |||||||
| Advisory fee waiver | (21 | ) | |||||
| Reimbursement of class expenses: | |||||||
| Class A | (174 | ) | |||||
| Class B | (45 | ) | |||||
| Class C | (27 | ) | |||||
| Total advisory fee waivers and reimbursed expenses | (267 | ) | |||||
| Net expenses | 668 | ||||||
| Net Investment Income (Loss) | 2,264 | ||||||
| Net Increase (Decrease) in Net Assets Resulting from Operations | $ | 2,264 | |||||
(b) Rounds to less than $1.
The notes to the financial statements are an integral part of this report.
Transamerica IDEX Mutual Funds
Semi-Annual Report 2006
4
TA IDEX Transamerica Money Market
STATEMENTS OF CHANGES IN NET ASSETS
For the period or year ended
(all amounts in thousands)
| April 30, 2006 (unaudited) (a) | October 31, 2005 | ||||||||||
| Increase (Decrease) in Net Assets From: | |||||||||||
| Operations: | |||||||||||
| Net investment income (loss) | $ | 2,264 | $ | 3,878 | |||||||
| 2,264 | 3,878 | ||||||||||
| Distributions to Shareholders: | |||||||||||
| From net investment income: | |||||||||||
| Class A | (1,427 | ) | (3,112 | ) | |||||||
| Class B | (413 | ) | (511 | ) | |||||||
| Class C | (189 | ) | (255 | ) | |||||||
| Class I | (235 | ) | – | ||||||||
| (2,264 | ) | (3,878 | ) | ||||||||
| Capital Share Transactions: | |||||||||||
| Proceeds from shares sold: | |||||||||||
| Class A | 39,043 | 105,852 | |||||||||
| Class B | 5,564 | 19,649 | |||||||||
| Class C | 4,260 | 18,006 | |||||||||
| Class I | 76,282 | – | |||||||||
| 125,149 | 143,507 | ||||||||||
| Dividends and distributions reinvested: | |||||||||||
| Class A | 1,469 | 2,933 | |||||||||
| Class B | 381 | 434 | |||||||||
| Class C | 209 | 246 | |||||||||
| Class I | 227 | – | |||||||||
| 2,286 | 3,613 | ||||||||||
| Cost of shares redeemed: | |||||||||||
| Class A | (118,627 | ) | (143,409 | ) | |||||||
| Class B | (11,061 | ) | (28,522 | ) | |||||||
| Class C | (9,201 | ) | (24,532 | ) | |||||||
| Class I | (71,144 | ) | – | ||||||||
| (210,033 | ) | (196,463 | ) | ||||||||
| Redemption fees: | |||||||||||
| Class C | 1 | – | |||||||||
| 1 | – | ||||||||||
| Automatic conversions: | |||||||||||
| Class A | 93 | 117 | |||||||||
| Class B | (93 | ) | (117 | ) | |||||||
| – | – | ||||||||||
| (82,597 | ) | (49,343 | ) | ||||||||
| Net increase (decrease) in net assets | (82,597 | ) | (49,343 | ) | |||||||
| Net Assets: | |||||||||||
| Beginning of period | 198,448 | 247,791 | |||||||||
| End of period | $ | 115,851 | $ | 198,448 | |||||||
| Distributable Net Investment Income (Loss) | $ | 90 | $ | 90 | |||||||
(a) Class I was offered for investment on November 15, 2005.
| April 30, 2006 (unaudited) (a) | October 31, 2005 | ||||||||||
| Share Activity: | |||||||||||
| Shares issued: | |||||||||||
| Class A | 39,043 | 105,853 | |||||||||
| Class B | 5,564 | 19,649 | |||||||||
| Class C | 4,259 | 18,005 | |||||||||
| Class I | 76,282 | – | |||||||||
| 125,148 | 143,507 | ||||||||||
| Shares issued-reinvested from distributions: | |||||||||||
| Class A | 1,469 | 2,932 | |||||||||
| Class B | 381 | 434 | |||||||||
| Class C | 209 | 245 | |||||||||
| Class I | 227 | – | |||||||||
| 2,286 | 3,611 | ||||||||||
| Shares redeemed: | |||||||||||
| Class A | (118,627 | ) | (143,409 | ) | |||||||
| Class B | (11,061 | ) | (28,522 | ) | |||||||
| Class C | (9,201 | ) | (24,534 | ) | |||||||
| Class I | (71,144 | ) | – | ||||||||
| (210,033 | ) | (196,465 | ) | ||||||||
| Automatic conversions: | |||||||||||
| Class A | 93 | 117 | |||||||||
| Class B | (93 | ) | (117 | ) | |||||||
| – | – | ||||||||||
| Net increase (decrease) in shares outstanding: | |||||||||||
| Class A | (78,022 | ) | (34,507 | ) | |||||||
| Class B | (5,209 | ) | (8,556 | ) | |||||||
| Class C | (4,733 | ) | (6,284 | ) | |||||||
| Class I | 5,365 | – | |||||||||
| (82,599 | ) | (49,347 | ) | ||||||||
The notes to the financial statements are an integral part of this report.
Transamerica IDEX Mutual Funds
Semi-Annual Report 2006
5
TA IDEX Transamerica Money Market
FINANCIAL HIGHLIGHTS
(unaudited for the period ended April 30, 2006)
| For a share of beneficial interest outstanding throughout each period | |||||||||||||||||||||||||||||||||||||||
| Net Asset | Investment Operations | Distributions | Net Asset | ||||||||||||||||||||||||||||||||||||
| For the Period Ended (c)(f) | Value, Beginning of Period | Net Investment Income (Loss) | Net Realized and Unrealized Gain (Loss) | Total Operations | From Net Investment Income | From Net Realized Gains | Total Distributions | Value, End of Period | |||||||||||||||||||||||||||||||
| Class A | 4/30/2006 | $ | 1.00 | 0.020 | $ | – | 0.020 | (0.020 | ) | $ | – | (0.020 | ) | $ | 1.00 | ||||||||||||||||||||||||
| 10/31/2005 | 1.00 | 0.020 | – | (g) | 0.020 | (0.020 | ) | – | (0.020 | ) | 1.00 | ||||||||||||||||||||||||||||
| 10/31/2004 | 1.00 | 0.004 | – | 0.004 | (0.004 | ) | – | (0.004 | ) | 1.00 | |||||||||||||||||||||||||||||
| 10/31/2003 | 1.00 | 0.004 | – | 0.004 | (0.004 | ) | – | (0.004 | ) | 1.00 | |||||||||||||||||||||||||||||
| 10/31/2002 | 1.00 | 0.008 | – | 0.008 | (0.008 | ) | – | (0.008 | ) | 1.00 | |||||||||||||||||||||||||||||
| Class B | 4/30/2006 | 1.00 | 0.010 | – | 0.010 | (0.010 | ) | – | (0.010 | ) | 1.00 | ||||||||||||||||||||||||||||
| 10/31/2005 | 1.00 | 0.020 | – | (g) | 0.020 | (0.020 | ) | – | (0.020 | ) | 1.00 | ||||||||||||||||||||||||||||
| 10/31/2004 | 1.00 | 0.001 | – | 0.001 | (0.001 | ) | – | (0.001 | ) | 1.00 | |||||||||||||||||||||||||||||
| 10/31/2003 | 1.00 | 0.001 | – | 0.001 | (0.001 | ) | – | (0.001 | ) | 1.00 | |||||||||||||||||||||||||||||
| 10/31/2002 | 1.00 | – | – | – | – | – | – | 1.00 | |||||||||||||||||||||||||||||||
| Class C | 4/30/2006 | 1.00 | 0.010 | – | 0.010 | (0.010 | ) | – | (0.010 | ) | 1.00 | ||||||||||||||||||||||||||||
| 10/31/2005 | 1.00 | 0.020 | – | (g) | 0.020 | (0.020 | ) | – | (0.020 | ) | 1.00 | ||||||||||||||||||||||||||||
| 10/31/2004 | 1.00 | 0.001 | – | 0.001 | (0.001 | ) | – | (0.001 | ) | 1.00 | |||||||||||||||||||||||||||||
| 10/31/2003 | 1.00 | 0.002 | – | 0.002 | (0.002 | ) | – | (0.002 | ) | 1.00 | |||||||||||||||||||||||||||||
| Class I | 4/30/2006 | 1.00 | 0.020 | – | 0.020 | (0.020 | ) | – | (0.020 | ) | 1.00 | ||||||||||||||||||||||||||||
| Ratios/Supplemental Data | |||||||||||||||||||||||||||
| For the Period | Total | Net Assets, End of Period | Ratio of Expenses to Average Net Assets (a) | Net Investment Income (Loss) to Average | |||||||||||||||||||||||
| Ended (f) | Return (b) | (000's) | Net (d) | Total (e) | Net Assets (a) | ||||||||||||||||||||||
| Class A | 4/30/2006 | 1.80 | % | $ | 72,781 | 0.83 | % | 1.30 | % | 3.57 | % | ||||||||||||||||
| 10/31/2005 | 2.10 | 150,804 | 0.83 | 1.05 | 2.08 | ||||||||||||||||||||||
| 10/31/2004 | 0.42 | 185,311 | 0.83 | 1.19 | 0.45 | ||||||||||||||||||||||
| 10/31/2003 | 0.39 | 109,794 | 0.83 | 1.22 | 0.42 | ||||||||||||||||||||||
| 10/31/2002 | 0.56 | 131,949 | 0.83 | 1.36 | 0.93 | ||||||||||||||||||||||
| Class B | 4/30/2006 | 1.47 | 26,439 | 1.48 | 1.83 | 2.93 | |||||||||||||||||||||
| 10/31/2005 | 1.60 | 31,647 | 1.32 | 1.79 | 1.57 | ||||||||||||||||||||||
| 10/31/2004 | 0.14 | 40,203 | 1.10 | 1.81 | 0.13 | ||||||||||||||||||||||
| 10/31/2003 | 0.12 | 54,324 | 1.16 | 1.87 | 0.08 | ||||||||||||||||||||||
| 10/31/2002 | 0.28 | 81,683 | 1.48 | 2.01 | 0.28 | ||||||||||||||||||||||
| Class C | 4/30/2006 | 1.47 | 11,265 | 1.48 | 1.93 | 2.91 | |||||||||||||||||||||
| 10/31/2005 | 1.87 | 15,997 | 1.26 | 1.89 | 1.61 | ||||||||||||||||||||||
| 10/31/2004 | 0.14 | 22,277 | 0.98 | 1.96 | 0.43 | ||||||||||||||||||||||
| 10/31/2003 | 0.12 | 3,542 | 1.04 | 1.87 | 0.21 | ||||||||||||||||||||||
| Class I | 4/30/2006 | 1.80 | 5,366 | 0.48 | 0.51 | 3.60 | |||||||||||||||||||||
NOTES TO FINANCIAL HIGHLIGHTS
(a) Annualized.
(b) Total Return has been calculated for the applicable period without deduction of a sales load, if any, on an initial purchase. Not annualized.
(c) Per share information is calculated based on average number of shares outstanding.
(d) Ratio of Net Expenses to Average Net Assets is net of fee waivers and reimbursements by the investment adviser, if any (see note 2).
(e) Ratio of Total Expenses to Average Net Assets includes all expenses before fee waivers and reimbursements by the investment adviser.
(f) TA IDEX Transamerica Money Market (the "Fund") commenced opeations on March 1, 2002. The inception dates for the Fund's offering of share classes were as follows:
Class C was November 11, 2002.
Class I was November 15, 2005.
(g) Rounds to less than $0.01 per share.
The notes to the financial statements are an integral part of this report.
Transamerica IDEX Mutual Funds
Semi-Annual Report 2006
6
TA IDEX Transamerica Money Market
NOTES TO FINANCIAL STATEMENTS
At April 30, 2006
(all amounts in thousands)
(unaudited)
NOTE 1. ORGANIZATION AND SIGNIFICANT ACCOUNTING POLICIES
Transamerica IDEX Mutual Funds is an open-end management investment company registered under the Investment Company Act of 1940, as amended (the "1940 Act").
In the normal course of business, TA IDEX Transamerica Money Market (the "Fund") enters into contracts that contain a variety of representations that provide general indemnifications. The Fund's maximum exposure under these arrangements is unknown, as this would involve future claims that may be made against the Fund and/or its affiliates that have not yet occurred. However, based on experience, the Fund expects the risk of loss to be remote.
This report should be read in conjunction with the current Fund prospectus, which contains more complete information about the Fund.
In preparing the Fund's financial statements in accordance with accounting principles generally accepted in the United States of America ("GAAP"), estimates or assumptions (which could differ from actual results) may be used that affect reported amounts and disclosures. The following is a summary of significant accounting policies followed by the Fund.
Multiple class operations, income and expenses: The Fund currently offers four classes of shares, Class A, Class B, Class C and Class I, each with a public offering price that reflects different sales charges, if any, and expense levels. Class I shares commenced operations on November 15, 2005. Class I is only available for investment to certain affiliated asset allocation funds. Class B shares will convert to Class A shares eight years after purchase. Income, non-class specific expenses and realized and unrealized gains and losses, are allocated daily to each class, based upon the value of shares outstanding method as permitted under Rule 18f-3 of the 1940 Act. Each class bears its own specific expenses as well as a portion of general, common expenses.
Security valuations: As permitted under Rule 2a-7 of the 1940 Act, the securities held by the Fund are valued on the basis of amortized cost, which approximates market value.
Other securities for which quotations are not readily available or whose values have been determined to be unreliable are valued at fair market value as determined in good faith by the Fund's Administrative Valuation Committee, under the supervision of the Board's Valuation Committee, using guidelines adopted by the Board of Trustees.
Cash: The Fund may leave cash overnight in its cash account with the custodian, Investors Bank & Trust Company ("IBT"). IBT has been contracted on behalf of the Fund to invest the excess cash into a savings account, which at April 30, 2006, was paying an interest rate of 3.24%.
Security transactions and investment income: Security transactions are recorded on the trade date. Security gains and losses are calculated on the specific identification basis. Dividend income, if any, is recorded on the ex-dividend date or, in the case of foreign securities, as soon as the Fund is informed of the ex-dividend date. Interest income, including accretion of discounts and amortization of premiums, is recorded on the accrual basis commencing on the settlement date.
Redemption fees: A short-term trading redemption fee may be assessed on any Fund shares in a fund account that are sold during the first five (5) NYSE trading days following their purchase date. This redemption fee will equal 2% of the amount redeemed and shares held the longest will be treated as being redeemed first and shares held the shortest as being redeemed last. For six months ended April 30, 2006, the Fund received $1 in redemption fees.
Dividend distributions: Distributions to shareholders are recorded on the ex-dividend date and are determined in accordance with Federal income tax regulations which may differ from GAAP.
NOTE 2. RELATED PARTY TRANSACTIONS
Transamerica Fund Advisors, Inc. ("TFAI") is the Fund's investment adviser. Transamerica Fund Services, Inc. ("TFS") is the Fund's administrator and transfer agent. AFSG Securities Corp. ("AFSG") is the Fund's distributor/principal underwriter. TFAI, TFS, and AFSG are affiliates of AEGON, NV, a Netherlands corporation.
Transamerica Investment Management, LLC is both an affiliate of the Fund and a sub-adviser to the Fund.
Certain officers and trustees of the Fund are also officers and/or directors of TFAI, TFS and AFSG.
Investment advisory fees: The Fund pays management fees to TFAI based on average daily net assets ("ANA") at the following rate:
0.40% of ANA
TFAI has contractually agreed to waive its advisory fee and will reimburse the Fund to the extent that operating expenses, excluding 12b-1 fees, exceed the following stated annual limit:
0.48% Expense Limit
If total Fund expenses fall below the annual expense limitation agreement agreed to by the adviser within the succeeding three years, the Fund may be required to pay the adviser a portion or all of the waived advisory fees.
Transamerica IDEX Mutual Funds
Semi-Annual Report 2006
7
TA IDEX Transamerica Money Market
NOTES TO FINANCIAL STATEMENTS (continued)
At April 30, 2006
(all amounts in thousands)
(unaudited)
NOTE 2.–(continued)
| Advisory Fee Waived | Available for Recapture Through | ||||||||||
| Fiscal Year 2003 | $ | 869 | 10/31/2006 | ||||||||
If total Fund expenses fall below the annual expense limitation agreement agreed to by the adviser within the succeeding three years. The Fund may be required to pay the adviser a portion or all of the reimbursed class expenses.
| Reimbursement of Class Expenses | Available for Recapture Through | ||||||||||
| Fiscal Year 2005-Class A | $ | 334 | 10/31/2008 | ||||||||
| Fiscal Year 2005-Class B | 101 | 10/31/2008 | |||||||||
| Fiscal Year 2005-Class C | 66 | 10/31/2008 | |||||||||
| Fiscal Year 2004-Class A | 47 | 10/31/2007 | |||||||||
| Fiscal Year 2004-Class B | 145 | 10/31/2007 | |||||||||
| Fiscal Year 2004-Class C | 71 | 10/31/2007 | |||||||||
Distribution and service fees: The Fund has a 12b-1 distribution plan under the 1940 Act pursuant to which an annual fee, based on average daily net assets, is paid to the distributor for various disbursements such as broker-dealer account servicing fees and other promotional expenses of the Fund. The Fund is authorized under the 12b-1 plan to pay fees on each class up to the following limits:
| Class A | 0.35 | % | |||||
| Class B | 1.00 | % | |||||
| Class C | 1.00 | % | |||||
| Class I | N/A | ||||||
In the case the Fund or a class of shares of the Fund is closed to new investors or investments, the Fund is authorized to pay 12b-1 fees for past sales and distribution efforts and present and past investor services.
Underwriter commissions relate to front-end sales charges imposed for Class A shares and contingent deferred sales charges from Classes B, C, and certain A share redemptions. For the six months ended April 30, 2006, the underwriter commissions were as follows:
| Received by Underwriter | $ | – | |||||
| Retained by Underwriter | – | ||||||
| Contingent Deferred Sales Charge | 50 | ||||||
Administrative services: The Fund has entered into an agreement with TFS for financial and legal fund administration services. The Fund pays TFS an annual fee of 0.02% of ANA. The Legal fees on the Statement of Operations are fees paid to external legal counsel.
Transfer agent fees: The Fund pays TFS an annual per-account charge for each open and closed account. The Fund paid TFS $182 for the six months ended April 30, 2006.
Deferred compensation plan: Each eligible independent Fund Trustee may elect to participate in a non-qualified deferred compensation plan maintained by Transamerica IDEX Mutual Funds (the "Plan"). Under the Plan, such Trustees may defer payment of all or a portion of their total fees earned as a Fund Trustee. Each Trustee who is a participant in the Plan may elect that the earnings, losses or gains credited to his or her deferred fee amounts be determined based on a deemed investment in any series of Transamerica IDEX Mutual Funds, including the Fund. The right of a participant to receive a distribution from the Plan of the deferred fees is an unsecured claim against the general assets of all series of Transamerica IDEX Mutual Funds. The pro rata liability to the Fund of all deferred fees in the Plan amounted, as of April 30, 2006, to $12.
NOTE 3. FEDERAL INCOME TAX MATTERS
The Fund has not made any provision for federal income or excise taxes due to its policy to distribute all of its taxable income and capital gains to its shareholders and otherwise qualify as a regulated investment company under Subchapter M of the Internal Revenue Code. Income and capital gain distributions are determined in accordance with income tax regulations, which may differ from GAAP. These differences are primarily due to differing treatment for items including, but not limited to, capital loss carry forwards and dividends payable.
NOTE 4. REGULATORY PROCEEDINGS
There continues to be significant federal and state regulatory activity relating to financial services companies, particularly mutual fund companies and their investment advisers. As part of an ongoing investigation regarding potential market timing, recordkeeping and trading compliance issues and matters affecting the Fund's investment adviser, TFAI, and certain affiliates and former employees of TFAI, the SEC staff has indicated that it is likely to take some action against TFAI and certain of its affiliates at the conclusion of the investigation. The potential timing and the scope of any such action is difficult to predict. Although the impact of any action brought against TFAI and/or its affiliates is difficult to assess at the present time, the Fund currently believes that the likelihood that any such action will have a material adverse impact on it is remote. It is important to note that the Fund is not aware of any allega tion of wrongdoing against it and its Board at the time this semi-annual report is printed. Although it is not anticipated that these developments will have an adverse impact on the Fund, there can be no assurance at this time. TFAI and its affiliates are actively working with the SEC in regard to this matter; however, the exact resolution cannot be determined at this time. TFAI will take such actions that it deems necessary or appropriate to continue providing management services to the Fund and to bring all matters to an appropriate conclusion.
TFAI and/or its affiliates, and not the Fund, will bear the costs regarding these regulatory matters.
Transamerica IDEX Mutual Funds
Semi-Annual Report 2006
8
TA IDEX Transamerica Money Market
INVESTMENT ADVISORY AND SUB-ADVISORY AGREEMENTS – REVIEW AND RENEWAL (unaudited)
At a meeting of the Board of Trustees of Transamerica IDEX Mutual Funds ("TA IDEX") held on November 2, 2005, the Board reviewed and considered the Investment Advisory Agreement between TA IDEX Transamerica Money Market (the "Fund") and Transamerica Fund Advisors, Inc. ("TFAI"), as well as the Investment Sub-Advisory Agreement of the Fund between TFAI and Transamerica Investment Management, LLC (the "Sub-Adviser"), to determine whether the agreements should be renewed for a one-year period. Following their review and consideration, the Trustees determined that the Investment Advisory Agreement and the Investment Sub-Advisory Agreement will enable shareholders of the Fund to obtain high quality services at a cost that is appropriate, reasonable, and in the best interests of its shareholders. The Board, including the independent members of the Board, unanimously approved the renewal of the Investment Advisory Agreement and the Inv estment Sub-Advisory Agreement. In reaching their decision, the Trustees requested and obtained from TFAI and the Sub-Adviser such information as they deemed reasonably necessary to evaluate the proposed agreements. The Trustees also carefully considered the information that they had received throughout the year from TFAI and the Sub-Adviser (such as in-person presentations by the Sub-Adviser) as part of their regular oversight of the Fund, as well as: comparative fee, expense and performance information prepared by Lipper Inc. ("Lipper"), independent providers of mutual fund performance, fee and expense information, and profitability data. In considering the proposed continuation of the Investment Advisory Agreement and the Investment Sub-Advisory Agreement, the Trustees evaluated a number of considerations that they believe, in light of the legal advice furnished to them by TA IDEX counsel and independent legal counsel and their own business judgment, to be relevant. They based their decisions on the follo wing considerations, among others, although they did not identify any consideration or particular information that was controlling of their decisions:
The nature, extent and quality of the advisory service to be provided. The Board considered the nature and quality of the services provided by TFAI and the Sub-Adviser to the Fund in the past, as well as the services anticipated to be provided in the future. The Board concluded that TFAI and the Sub-Adviser are capable of providing high quality services to the Fund, as indicated by the nature and quality of services provided in the past, TFAI's and the Sub-Adviser's management capabilities demonstrated with respect to the funds they manage, including the Fund, and the experience, capability and integrity of TFAI's senior management, the financial resources of TFAI and the Sub-Adviser, TFAI's management oversight process, and the professional qualifications and experience of the Sub-Adviser's portfolio management team. The Trustees also concluded that TFAI and the Sub-Adviser proposed to provide investment and related services that were of the same quality and quantity as services provided to the Fund in the past, and that these services are appropriate in scope and extent in light of the Fund's operations, the competitive landscape of the investment company business and investor needs, and that TFAI's and the Sub-Adviser's obligations will remain substantially the same.
The investment performance of the Fund. The Board examined both the short-term and longer-term performance of the Fund, including relative performance against a benchmark securities index and a peer group of comparable mutual funds as prepared by Lipper, for various trailing periods ended June 30, 2005. The Trustees concluded that TFAI and the Sub-Adviser generally had achieved acceptable investment performance, noting that the performance of the Fund has been at median relative to its peers over the past one-, two-, and three-year periods although its performance trailed the benchmark index over the past one-, two- and three-year periods. On the basis of the Trustees' assessment of the nature, extent and quality of advisory services to be provided or procured by TFAI and the Sub-Adviser, the Trustees concluded that TFAI and the Sub-Adviser are capabl e of generating a level of investment performance that is appropriate in light of the Fund's investment objective, policies and strategies and competitive with many other investment companies, and also determined that TFAI's and the Sub-Adviser's performance records indicate that their continued management is likely to benefit the Fund and its shareholders.
The cost of advisory services provided and the level of profitability. The Board reviewed profitability information regarding TFAI's costs of procuring portfolio management services, as well as the costs of provision of administration, transfer agency, fund accounting and other services, to the Fund and to TA IDEX as a whole by TFAI and its affiliates. The Trustees reviewed data from Lipper that compared the Fund's management fees (including management fees at various asset levels), and other fees and expenses (including total expenses including and excluding 12b-1 distribution and service fees). Based on such information, the Trustees determined that the management fees and overall expense ratio of the Fund generally are consistent with industry averages. In addition, on the basis of the Board's review of the management fees to be charged by TFAI for investment advisory and related services, and TFAI profitability information (derived from TFAI's audited financial statements), TFAI's estimated management income resulting from its management of the Fund, the estimated margin of the Sub-Adviser, as well as the entirety of TFAI's and its affiliates' service relationship with TA IDEX, the Board concluded that the level of investment management fees and other service fees, as well as TFAI's and the Sub-Adviser's profitability, are appropriate in light of the services provided, the management fees and overall expense ratios of comparable investment companies and the anticipated profitability of the relationship between the Fund, TFAI and its affiliates, and the Sub-Adviser.
Transamerica IDEX Mutual Funds
Semi-Annual Report 2006
9
TA IDEX Transamerica Money Market (continued)
Whether fee levels reflect economies of scale and the extent to which economies of scale would be realized as the Fund grows. Although the investment advisory fees do not reduce should Fund assets grow meaningfully, the Board determined that the investment advisory fees already reflect potential economies of scale to some extent by virtue of their competitive levels determined with reference to industry standards as reported by Lipper and the estimated profitability at current or foreseeable asset levels. In addition, the Board concluded that the Fund's management fees appropriately reflect the Fund's current size, the current economic environment for TFAI, the competitive nature of the investment company market, and TFAI's pricing strategy. The Trustees also concluded that they will have the opportunity to periodically reexamine whether the Fund has achieved economies of scale, and the appropriateness of management fees payable to TFAI and fees payable by TFAI to the Sub-Adviser, in the future.
Benefits (such as soft dollars) to TFAI, its affiliates, or the Sub-Adviser from their relationship with the Fund. The Board concluded that other benefits derived by TFAI, its affiliates, and the Sub-Adviser from their relationship with the Fund are reasonable and fair, and are consistent with industry practice and the best interests of the Fund and its shareholders. In this regard, the Board noted that neither TFAI nor the Sub-Adviser realizes "soft dollar" benefits from its relationship with the Fund. In addition, the Trustees determined that the administration, transfer agency, fund accounting and other fees paid by the Fund to affiliates of TFAI are reasonable, fair and in the best interests of shareholders in light of the nature and quality of the services provided, the associated costs to these affiliates of providing the services, the impact of the costs of such services on the Fund's overall operating expenses, and the necessity of the services for the Fund's operations.
Other considerations. The Board determined that TFAI had made a substantial commitment to the recruitment and retention of high quality personnel, and maintained the financial, compliance and operational resources reasonably necessary to manage the Fund in a professional manner that is consistent with the best interests of the Fund and its shareholders. In this regard, the Trustees favorably considered the procedures and policies in place by TFAI to enforce compliance with applicable laws and regulations and oversee the portfolio management activities of the Sub-Adviser. The Trustees also determined that TFAI had made a significant entrepreneurial commitment to the management and success of the Fund, reflected by TFAI's expense limitation and fee waiver arrangement with the Fund, which has resulted, and may continue to result, in TFAI waiving a substa ntial amount of advisory fees for the benefit of shareholders.
Transamerica IDEX Mutual Funds
Semi-Annual Report 2006
10
TA IDEX Transamerica Small/Mid Cap Value
UNDERSTANDING YOUR FUND'S EXPENSES
(unaudited)
SHAREHOLDER EXPENSES
Fund shareholders may incur two types of costs: (1) transaction costs, including sales charges (loads) on purchases, contingent deferred sales charges on redemptions and redemption fees; and (2) ongoing costs, including management fees, 12b-1 distribution and service fees, and other fund expenses.
The following Example is intended to help you understand your ongoing costs (in dollars and cents) of investing in the Fund and to compare these costs with the ongoing costs of investing in other funds.
The Example is based on an investment of $1,000 invested at November 1, 2005 and held for the entire period until April 30, 2006.
ACTUAL EXPENSES
The first line in the table below provides information about actual account values and actual expenses. You may use the information in this line, together with the amount you invested, to estimate the expenses that you paid over the period. Simply divide your account value by $1,000 (for example, an $8,600 account value divided by $1,000 = 8.6), then multiply the result by the number in the first line of your Fund under the heading entitled "Expenses Paid During Period" to estimate the expenses you paid on your account during this period. If your account is an IRA, your expenses could have included a $15 annual fee. The amount of any fee paid through your account would increase the estimate of expenses you paid during the period and decrease your ending account value.
HYPOTHETICAL EXAMPLE FOR COMPARISON PURPOSES
The second line in the table below provides information about hypothetical account values and hypothetical expenses based on the Fund's actual expense ratio and an assumed rate of return of 5% per year before expenses, which is not the Fund's actual return. The hypothetical account values and expenses may not be used to estimate the actual ending account balance or expenses you paid for the period. You may use this information to compare the ongoing costs of investing in your Fund and other funds. To do so, compare this 5% hypothetical example with the 5% hypothetical examples that appear in the shareholder reports of the other funds. As in the case of the actual expense example, if your account is subject to an IRA fee, the amount of the fee paid through your account would increase the hypothetical expenses you would have paid during the period and decrease the hypothetical ending account value.
Please note that the expenses shown in the table are meant to highlight your ongoing costs only and do not reflect any transactional costs, such as sales charges, redemption fees, brokerage commissions paid on purchases and sales of fund shares. Therefore, the second line under the Fund in the table is useful in comparing ongoing costs only, and will not help you determine the relative total costs of owning different funds. If any of these transaction costs were included, your costs would be higher. The expenses shown in the table do not reflect any fees that may be charged to you by brokers, financial intermediaries or other financial institutions.
| Beginning Account Value | Ending Account Value | Annualized Expense Ratio | Expenses Paid During Period (a) | ||||||||||||||||
| Class A | |||||||||||||||||||
| Actual | $ | 1,000.00 | $ | 1,164.70 | 1.35 | % | $ | 7.25 | |||||||||||
| Hypothetical (b) | 1,000.00 | 1,018.10 | 1.35 | 6.76 | |||||||||||||||
| Class B | |||||||||||||||||||
| Actual | 1,000.00 | 1,161.20 | 2.10 | 11.25 | |||||||||||||||
| Hypothetical (b) | 1,000.00 | 1,014.38 | 2.10 | 10.49 | |||||||||||||||
| Class C | |||||||||||||||||||
| Actual | 1,000.00 | 1,160.80 | 2.09 | 11.20 | |||||||||||||||
| Hypothetical (b) | 1,000.00 | 1,014.43 | 2.09 | 10.44 | |||||||||||||||
| Class I | |||||||||||||||||||
| Actual | 1,000.00 | 1,155.20 | 0.87 | 4.26 | |||||||||||||||
| Hypothetical (b) | 1,000.00 | 1,018.78 | 0.87 | 3.99 | |||||||||||||||
(a) Expenses are calculated using the Fund's annualized expense ratio (as disclosed in the table), multiplied by the average account value for the period, multiplied by number of days in the period (181 days for Classes A, B and C, and 166 days for Class I), and divided by the number of days in the year (365 days).
(b) 5% return per year before expenses.
GRAPHICAL PRESENTATION OF SCHEDULE OF INVESTMENTS
By Sector
At April 30, 2006
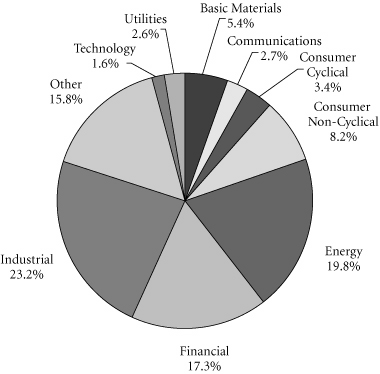
This chart shows the percentage breakdown by sector of the Fund's total investment securities.
Transamerica IDEX Mutual Funds
Semi-Annual Report 2006
1
TA IDEX Transamerica Small/Mid Cap Value
SCHEDULE OF INVESTMENTS
At April 30, 2006
(all amounts except share amounts in thousands)
(unaudited)
| Shares | Value | ||||||||||
| COMMON STOCKS (92.8%) | |||||||||||
| Apparel Products (0.6%) | |||||||||||
| True Religion Apparel, Inc. ‡† | 175,000 | $ | 3,404 | ||||||||
| Automotive (1.5%) | |||||||||||
| Gencorp, Inc. ‡† | 355,900 | 6,954 | |||||||||
| National R.V. Holdings, Inc. ‡ | 272,300 | 1,650 | |||||||||
| Chemicals & Allied Products (4.8%) | |||||||||||
| Olin Corp. | 504,900 | 10,376 | |||||||||
| PolyOne Corp. ‡ | 1,265,500 | 11,238 | |||||||||
| Terra Nitrogen Co., L.P. † | 280,900 | 5,346 | |||||||||
| Commercial Banks (4.4%) | |||||||||||
| Corus Bankshares, Inc. † | 160,000 | 10,710 | |||||||||
| North Fork Bancorp, Inc. | 352,710 | 10,627 | |||||||||
| Provident Bankshares Corp. | 95,500 | 3,320 | |||||||||
| Computer & Data Processing Services (1.7%) | |||||||||||
| Fair Isaac Corp. | 265,000 | 9,834 | |||||||||
| SoftBrands, Inc. ‡ | 2,576 | 3 | |||||||||
| Computer & Office Equipment (1.3%) | |||||||||||
| Hypercom Corp. ‡ | 804,700 | 7,307 | |||||||||
| Construction (5.5%) | |||||||||||
| Chemed Corp. | 240,000 | 13,078 | |||||||||
| McDermott International, Inc. ‡ | 290,000 | 17,632 | |||||||||
| Electric Services (1.6%) | |||||||||||
| CMS Energy Corp. ‡ | 670,000 | 8,924 | |||||||||
| Electric, Gas & Sanitary Services (1.7%) | |||||||||||
| ALLETE, Inc. | 66,666 | 3,118 | |||||||||
| Republic Services, Inc. | 150,000 | 6,601 | |||||||||
| Electronic & Other Electric Equipment (5.6%) | |||||||||||
| Acuity Brands, Inc. | 310,000 | 12,797 | |||||||||
| Genlyte Group, Inc. ‡ | 270,000 | 18,606 | |||||||||
| Electronic Components & Accessories (1.3%) | |||||||||||
| Advanced Energy Industries, Inc. ‡ | 165,000 | 2,589 | |||||||||
| OSI Systems, Inc. ‡† | 240,000 | 4,574 | |||||||||
| Fabricated Metal Products (0.9%) | |||||||||||
| Gulf Island Fabrication, Inc. | 200,000 | 4,872 | |||||||||
| Food & Kindred Products (0.2%) | |||||||||||
| TreeHouse Foods, Inc. ‡† | 48,000 | 1,258 | |||||||||
| Gas Production & Distribution (0.7%) | |||||||||||
| KeySpan Corp. | 100,000 | 4,038 | |||||||||
| Holding & Other Investment Offices (6.9%) | |||||||||||
| Annaly Mortgage Management, Inc. REIT † | 670,000 | 9,025 | |||||||||
| Education Realty Trust, Inc. REIT † | 372,100 | 5,552 | |||||||||
| Shares | Value | ||||||||||
| Holding & Other Investment Offices (continued) | |||||||||||
| Host Hotels & Resorts, Inc. REIT † | 620,000 | $ | 13,032 | ||||||||
| Omega Healthcare Investors, Inc. REIT | 875,000 | 11,191 | |||||||||
| Industrial Machinery & Equipment (3.6%) | |||||||||||
| Allis-Chalmers Corp. ‡† | 325,000 | 5,054 | |||||||||
| EnPro Industries, Inc. ‡† | 75,400 | 2,781 | |||||||||
| Grant Prideco, Inc. ‡ | 243,000 | 12,442 | |||||||||
| Instruments & Related Products (2.9%) | |||||||||||
| Analogic Corp. | 83,900 | 5,293 | |||||||||
| Fisher Scientific International ‡ | 155,000 | 10,935 | |||||||||
| Insurance (6.5%) | |||||||||||
| AMBAC Financial Group, Inc. | 140,000 | 11,530 | |||||||||
| HCC Insurance Holdings, Inc. † | 382,500 | 12,810 | |||||||||
| PartnerRe, Ltd. | 160,000 | 10,008 | |||||||||
| Triad Guaranty, Inc. ‡† | 40,000 | 2,181 | |||||||||
| Management Services (2.0%) | |||||||||||
| FTI Consulting, Inc. ‡† | 400,000 | 11,496 | |||||||||
| Medical Instruments & Supplies (1.6%) | |||||||||||
| Orthofix International NV ‡ | 225,000 | 9,133 | |||||||||
| Metal Mining (1.2%) | |||||||||||
| Western Silver Corp. ‡ | 238,100 | 6,741 | |||||||||
| Oil & Gas Extraction (17.8%) | |||||||||||
| Bronco Drilling Co., Inc. ‡ | 275,825 | 7,450 | |||||||||
| Chesapeake Energy Corp. † | 412,500 | 13,068 | |||||||||
| Edge Petroleum Corp. ‡ | 500,000 | 11,555 | |||||||||
| GlobalSantaFe Corp. † | 233,000 | 14,262 | |||||||||
| Patterson-UTI Energy, Inc. | 233,750 | 7,564 | |||||||||
| Pioneer Drilling Co. ‡ | 425,000 | 6,889 | |||||||||
| Superior Energy Services, Inc. ‡ | 855,000 | 27,488 | |||||||||
| Todco–Class A ‡ | 255,150 | 11,704 | |||||||||
| Paper & Allied Products (0.3%) | |||||||||||
| Graphic Packaging Corp. ‡ | 570,100 | 1,516 | |||||||||
| Pharmaceuticals (1.2%) | |||||||||||
| ARIAD Pharmaceuticals, Inc. ‡ | 975,500 | 5,707 | |||||||||
| NeoPharm, Inc. ‡† | 99,300 | 793 | |||||||||
| Primary Metal Industries (3.2%) | |||||||||||
| Aleris International, Inc. ‡ | 394,827 | 18,261 | |||||||||
| Restaurants (0.9%) | |||||||||||
| O'Charley's, Inc. ‡ | 300,000 | 5,085 | |||||||||
| Retail Trade (2.0%) | |||||||||||
| Sports Authority, Inc. (The) ‡† | 300,000 | 11,148 | |||||||||
The notes to the financial statements are an integral part of this report.
Transamerica IDEX Mutual Funds
Semi-Annual Report 2006
2
TA IDEX Transamerica Small/Mid Cap Value
SCHEDULE OF INVESTMENTS (continued)
At April 30, 2006
(all amounts except share amounts in thousands)
(unaudited)
| Shares | Value | ||||||||||
| Savings Institutions (1.3%) | |||||||||||
| Brookline Bancorp, Inc. | 160,000 | $ | 2,368 | ||||||||
| Partners Trust Financial Group, Inc. † | 400,000 | 4,720 | |||||||||
| Telecommunications (1.6%) | |||||||||||
| Citizens Communications Co. | 700,000 | 9,296 | |||||||||
| Water Transportation (6.3%) | |||||||||||
| Aries Maritime Transport, Ltd. † | 1,007,000 | 13,343 | |||||||||
| DryShips, Inc. † | 280,000 | 2,657 | |||||||||
| Genco Shipping & Trading, Ltd. † | 499,700 | 8,625 | |||||||||
| Omega Navigation Enterprises, Inc.–Class A ‡† | 394,700 | 6,335 | |||||||||
| StealthGas, Inc. | 321,500 | 4,340 | |||||||||
| Wholesale Trade Nondurable Goods (1.7%) | |||||||||||
| Dean Foods Co. ‡ | 240,000 | 9,506 | |||||||||
| Total Common Stocks (cost: $378,957) | 521,740 | ||||||||||
| Principal | Value | ||||||||||
| SECURITY LENDING COLLATERAL (17.3%) | |||||||||||
| Debt (16.2%) | |||||||||||
| Bank Notes (2.0%) | |||||||||||
| Bank of America 4.81%, due 06/07/2006 * 4.81%, due 08/10/2006 * | $3,185 3,073 | $3,185 3,073 | |||||||||
| Bear Stearns & Co. 5.01%, due 06/06/2006 * 5.01%, due 09/07/2006 * | 1,229 3,688 | 1,229 3,688 | |||||||||
| Certificates Of Deposit (1.1%) | |||||||||||
| Halifax Bank of Scotland 4.78%, due 06/06/2006 * | 3,074 | 3,074 | |||||||||
| Rabobank Nederland 4.87%, due 05/31/2006 * | 3,074 | 3,074 | |||||||||
| Commercial Paper (0.9%) | |||||||||||
| Banco Santander Central Hispano SA 4.77%, due 05/02/2006 | 1,844 | 1,844 | |||||||||
| Sheffield Receivables Corp.–144A 4.81%, due 05/03/2006 | 3,069 | 3,069 | |||||||||
| Euro Dollar Overnight (2.9%) | |||||||||||
| Bank of Montreal 4.77%, due 05/02/2006 | 2,459 | 2,459 | |||||||||
| Dexia Group 4.78%, due 05/04/2006 | 3,074 | 3,074 | |||||||||
| Fortis Bank 4.77%, due 05/01/2006 | 1,229 | 1,229 | |||||||||
| Royal Bank of Canada 4.77%, due 05/01/2006 | 4,303 | 4,303 | |||||||||
| Principal | Value | ||||||||||
| Euro Dollar Overnight (continued) | |||||||||||
| Royal Bank of Scotland 4.75%, due 05/03/2006 | $ | 3,074 | $ | 3,074 | |||||||
| Svenska Handlesbanken 4.82%, due 05/01/2006 | 2,348 | 2,348 | |||||||||
| Euro Dollar Terms (4.5%) | |||||||||||
| BancoBilbao Vizcaya Argentaria SA 4.95%, due 06/20/2006 | 2,459 | 2,459 | |||||||||
| Bank of the West 4.94%, due 06/16/2006 | 2,459 | 2,459 | |||||||||
| Barclays 4.79%, due 05/10/2006 4.77%, due 05/16/2006 | 3,688 1,229 | 3,688 1,229 | |||||||||
| Canadian Imperial Bank of Commerce 4.97%, due 06/23/2006 | 1,844 | 1,844 | |||||||||
| Credit Suisse First Boston Corp. 4.73%, due 05/08/2006 | 1,844 | 1,844 | |||||||||
| Fortis Bank 4.83%, due 05/08/2006 | 1,229 | 1,229 | |||||||||
| Lloyds TSB Bank 4.81%, due 05/11/2006 | 1,844 | 1,844 | |||||||||
| Royal Bank of Scotland 4.87%, due 05/12/2006 | 2,459 | 2,459 | |||||||||
| Societe Generale 4.79%, due 05/10/2006 | 3,074 | 3,074 | |||||||||
| UBS AG 4.95%, due 06/20/2006 | 3,074 | 3,074 | |||||||||
| Repurchase Agreements (4.8%) †† | |||||||||||
| Credit Suisse First Boston Corp. 4.92%, dated 04/28/2006 to be repurchased at $4,176 on 05/01/2006 | 4,174 | 4,174 | |||||||||
| Goldman Sachs Group, Inc. (The) 4.92%, dated 04/28/2006 to be repurchased at $9,034 on 05/01/2006 | 9,030 | 9,030 | |||||||||
| Lehman Brothers, Inc. 4.92%, dated 04/28/2006 to be repurchased at $152 on 05/01/2006 | 152 | 152 | |||||||||
| Merrill Lynch & Co. 4.87%, dated 04/28/2006 to be repurchased at $9,224 on 05/01/2006 | 9,221 | 9,221 | |||||||||
| Morgan Stanley Dean Witter & Co. 4.93%, dated 04/28/2006 to be repurchased at $4,305 on 05/01/2006 | 4,303 | 4,303 | |||||||||
The notes to the financial statements are an integral part of this report.
Transamerica IDEX Mutual Funds
Semi-Annual Report 2006
3
TA IDEX Transamerica Small/Mid Cap Value
SCHEDULE OF INVESTMENTS (continued)
At April 30, 2006
(all amounts except share amounts in thousands)
(unaudited)
| Shares | Value | ||||||||||
| Investment Companies (1.1%) | |||||||||||
| Barclays Global Investors Institutional Money Market Fund 1-day yield of 4.78% | 4,917,727 | $ | 4,918 | ||||||||
| Merrimac Cash Fund, Premium Class 1-day yield of 4.61% @ | 1,308,439 | 1,308 | |||||||||
| Total Security Lending Collateral (cost: $97,032) | 97,032 | ||||||||||
| Total Investment Securities (cost: $475,989) # | $ | 618,772 | |||||||||
NOTES TO SCHEDULE OF INVESTMENTS:
‡ Non-income producing.
† At April 30, 2006, all or a portion of this security is on loan (see Note 1). The value at April 30, 2006, of all securities on loan is $93,273.
* Floating or variable rate note. Rate is listed as of April 30, 2006.
†† Cash collateral for the Repurchase Agreements, valued at $27,672, that serve as collateral for securities lending are invested in corporate bonds with interest rates and maturity dates ranging from 0.00%–9.05% and 05/02/2006–12/31/2049, respectively.
@ Regulated investment company advised by Investors Bank and Trust Co. ("IBT"). IBT is also the accounting, custody and lending agent for the Fund.
# Aggregate cost for Federal income tax purposes is $475,490. Aggregate gross unrealized appreciation for all securities in which there is an excess of value over tax cost and aggregate gross unrealized depreciation for all securities in which there is an excess of tax cost over value were $156,746 and $13,464, respectively. Net unrealized appreciation for tax purposes is $143,282.
DEFINITIONS:
144A 144A Securities are registered pursuant to Rule 144A of the Securities Act of 1933. These securities are deemed to be liquid for purposes of compliance limitations on holdings of illiquid securities and may be resold as transactions exempt from registration, normally to qualified institutional buyers. At April 30, 2006, these securities aggregated $3,069 or 0.5% of the net assets of the Fund.
REIT Real Estate Investment Trust
The notes to the financial statements are an integral part of this report.
Transamerica IDEX Mutual Funds
Semi-Annual Report 2006
4
TA IDEX Transamerica Small/Mid Cap Value
STATEMENT OF ASSETS AND LIABILITIES
At April 30, 2006
(all amounts except per share amounts in thousands)
(unaudited)
| Assets: | |||||||
| Investment securities, at value (cost: $475,989) (including securities loaned of $93,273) | $ | 618,772 | |||||
| Cash | 38,511 | ||||||
| Receivables: | |||||||
| Shares of beneficial interest sold | 1,736 | ||||||
| Interest | 115 | ||||||
| Dividends | 599 | ||||||
| Other | 14 | ||||||
| 659,747 | |||||||
| Liabilities: | |||||||
| Accounts payable and accrued liabilities: | |||||||
| Shares of beneficial interest redeemed | 140 | ||||||
| Management and advisory fees | 357 | ||||||
| Distribution and service fees | 78 | ||||||
| Transfer agent fees | 23 | ||||||
| Administration fees | 9 | ||||||
| Dividends to shareholders | 2 | ||||||
| Payable for collateral for securities on loan | 97,032 | ||||||
| Other | 69 | ||||||
| 97,710 | |||||||
| Net Assets | $ | 562,037 | |||||
| Net Assets Consist of: | |||||||
| Shares of beneficial interest, unlimited shares authorized, no par value | $ | 410,403 | |||||
| Distributable net investment income (loss) | 1,346 | ||||||
| Accumulated net realized gain (loss) from investment securities | 7,506 | ||||||
| Net unrealized appreciation (depreciation) on investment securities | 142,782 | ||||||
| Net Assets | $ | 562,037 | |||||
| Net Assets by Class: | |||||||
| Class A | $ | 47,525 | |||||
| Class B | 52,698 | ||||||
| Class C | 27,033 | ||||||
| Class I | 434,781 | ||||||
| Shares Outstanding: | |||||||
| Class A | 2,616 | ||||||
| Class B | 3,001 | ||||||
| Class C | 1,543 | ||||||
| Class I | 23,870 | ||||||
| Net Asset Value Per Share: | |||||||
| Class A | $ | 18.17 | |||||
| Class B | 17.56 | ||||||
| Class C | 17.52 | ||||||
| Class I | 18.21 | ||||||
| Maximum Offering Price Per Share (a): | |||||||
| Class A | $ | 19.23 | |||||
(a) Includes the maximum selling commission (represented as a percentage of offering price) which is reduced on certain levels of sales as set forth in the Prospectus. Net asset value per share for Classes B, C and I shares represents offering price. The redemption price for Classes B and C shares equals net asset value less any applicable contingent deferred sales charge.
STATEMENT OF OPERATIONS
For the period ended April 30, 2006 (b)
(all amounts in thousands)
(unaudited)
| Investment Income: | |||||||
| Dividends | $ | 4,394 | |||||
| Interest | 469 | ||||||
| Income from loaned securities–net | 192 | ||||||
| 5,055 | |||||||
| Expenses: | |||||||
| Management and advisory fees | 2,008 | ||||||
| Distribution and service fees: | |||||||
| Class A | 125 | ||||||
| Class B | 250 | ||||||
| Class C | 116 | ||||||
| Transfer agent fees: | |||||||
| Class A | 46 | ||||||
| Class B | 58 | ||||||
| Class C | 27 | ||||||
| Class I | – | (c) | |||||
| Printing and shareholder reports | 18 | ||||||
| Custody fees | 29 | ||||||
| Administration fees | 50 | ||||||
| Legal fees | 12 | ||||||
| Audit fees | 9 | ||||||
| Trustees fees | 10 | ||||||
| Registration fees | 36 | ||||||
| Other | 5 | ||||||
| Total expenses | 2,799 | ||||||
| Net Investment Income (Loss) | 2,256 | ||||||
| Net Realized and Unrealized Gain (Loss): | |||||||
| Realized gain (loss) from investment securities | 8,752 | ||||||
| Increase (decrease) in unrealized appreciation (depreciation) on investment securities | 65,941 | ||||||
| Net Realized and Unrealized Gain (Loss) on Investment Securities | 74,693 | ||||||
| Net Increase (Decrease) in Net Assets Resulting from Operations | $ | 76,949 | |||||
(b) Class I was offered for investment on November 15, 2005.
(c) Rounds to less than $1.
The notes to the financial statements are an integral part of this report.
Transamerica IDEX Mutual Funds
Semi-Annual Report 2006
5
TA IDEX Transamerica Small/Mid Cap Value
STATEMENTS OF CHANGES IN NET ASSETS
For the period or year ended
(all amounts in thousands)
| April 30, 2006 (unaudited) (a) | October 31, 2005 | ||||||||||
| Increase (Decrease) In Net Assets From: | |||||||||||
| Operations: | |||||||||||
| Net investment income (loss) | $ | 2,256 | $ | 246 | |||||||
| Net realized gain (loss) from investment securities | 8,752 | 32,191 | |||||||||
| Change in unrealized appreciation (depreciation) on investment securities | 65,941 | 45,152 | |||||||||
| 76,949 | 77,589 | ||||||||||
| Distributions to Shareholders: | |||||||||||
| From net investment income: | |||||||||||
| Class A | (783 | ) | (1,974 | ) | |||||||
| Class B | (86 | ) | – | ||||||||
| Class C | (40 | ) | (12 | ) | |||||||
| (909 | ) | (1,986 | ) | ||||||||
| From net realized gains: | |||||||||||
| Class A | (2,553 | ) | (9,811 | ) | |||||||
| Class B | (3,216 | ) | (1,261 | ) | |||||||
| Class C | (1,477 | ) | (591 | ) | |||||||
| Class I | (24,100 | ) | – | ||||||||
| (31,346 | ) | (11,663 | ) | ||||||||
| Capital Share Transactions: | |||||||||||
| Proceeds from shares sold: | |||||||||||
| Class A | 13,119 | 23,515 | |||||||||
| Class B | 7,095 | 10,917 | |||||||||
| Class C | 6,288 | 8,364 | |||||||||
| Class I | 384,867 | – | |||||||||
| 411,369 | 42,796 | ||||||||||
| Dividends and distributions reinvested: | |||||||||||
| Class A | 3,204 | 11,734 | |||||||||
| Class B | 3,023 | 1,149 | |||||||||
| Class C | 1,204 | 542 | |||||||||
| Class I | 24,100 | – | |||||||||
| 31,531 | 13,425 | ||||||||||
| Cost of shares redeemed: | |||||||||||
| Class A | (362,193 | ) | (38,305 | ) | |||||||
| Class B | (7,837 | ) | (12,564 | ) | |||||||
| Class C | (3,931 | ) | (9,922 | ) | |||||||
| Class I | (5,884 | ) | – | ||||||||
| (379,845 | ) | (60,791 | ) | ||||||||
(a) Class I was offered for investment on November 15, 2005.
| April 30, 2006 (unaudited) (a) | October 31, 2005 | ||||||||||
| Automatic conversions: | |||||||||||
| Class A | $ | 140 | $ | 231 | |||||||
| Class B | (140 | ) | (231 | ) | |||||||
| – | – | ||||||||||
| 63,055 | (4,570 | ) | |||||||||
| Net increase (decrease) in net assets | 107,749 | 59,370 | |||||||||
| Net Assets: | |||||||||||
| Beginning of period | 454,288 | 394,918 | |||||||||
| End of period | $ | 562,037 | $ | 454,288 | |||||||
| Distributable Net Investment Income (Loss) | $ | 1,346 | $ | (1 | ) | ||||||
| Share Activity: | |||||||||||
| Shares issued: | |||||||||||
| Class A | 759 | 1,437 | |||||||||
| Class B | 424 | 713 | |||||||||
| Class C | 373 | 527 | |||||||||
| Class I | 22,766 | – | |||||||||
| 24,322 | 2,677 | ||||||||||
| Shares issued–reinvested from distributions: | |||||||||||
| Class A | 193 | 760 | |||||||||
| Class B | 189 | 77 | |||||||||
| Class C | 76 | 36 | |||||||||
| Class I | 1,462 | – | |||||||||
| 1,920 | 873 | ||||||||||
| Shares redeemed: | |||||||||||
| Class A | (21,497 | ) | (2,433 | ) | |||||||
| Class B | (467 | ) | (809 | ) | |||||||
| Class C | (237 | ) | (641 | ) | |||||||
| Class I | (358 | ) | – | ||||||||
| (22,559 | ) | (3,883 | ) | ||||||||
| Automatic conversions: | |||||||||||
| Class A | 8 | 15 | |||||||||
| Class B | (8 | ) | (15 | ) | |||||||
| – | – | ||||||||||
| Net increase (decrease) in shares outstanding: | |||||||||||
| Class A | (20,537 | ) | (221 | ) | |||||||
| Class B | 138 | (34 | ) | ||||||||
| Class C | 212 | (78 | ) | ||||||||
| Class I | 23,870 | – | |||||||||
| 3,683 | (333 | ) | |||||||||
The notes to the financial statements are an integral part of this report.
Transamerica IDEX Mutual Funds
Semi-Annual Report 2006
6
TA IDEX Transamerica Small/Mid Cap Value
FINANCIAL HIGHLIGHTS
(unaudited for the period ended April 30, 2006)
| For a share of beneficial interest outstanding throughout each period | |||||||||||||||||||||||||||||||||||||||
| Net Asset | Investment Operations | Distributions | Net Asset | ||||||||||||||||||||||||||||||||||||
| For the Period Ended (d)(g) | Value, Beginning of Period | Net Investment Income (Loss) | Net Realized and Unrealized Gain (Loss) | Total Operations | From Net Investment Income | From Net Realized Gains | Total Distributions | Value, End of Period | |||||||||||||||||||||||||||||||
| Class A | 4/30/2006 | $ | 16.69 | $ | 0.19 | $ | 2.44 | $ | 2.63 | $ | (0.03 | ) | $ | (1.12 | ) | $ | (1.15 | ) | $ | 18.17 | |||||||||||||||||||
| 10/31/2005 | 14.32 | 0.03 | 2.85 | 2.88 | (0.09 | ) | (0.42 | ) | (0.51 | ) | 16.69 | ||||||||||||||||||||||||||||
| 10/31/2004 | 12.94 | 0.04 | 2.56 | 2.60 | – | (1.22 | ) | (1.22 | ) | 14.32 | |||||||||||||||||||||||||||||
| 10/31/2003 | 9.09 | (0.11 | ) | 3.96 | 3.85 | – | – | – | 12.94 | ||||||||||||||||||||||||||||||
| 10/31/2002 | 10.12 | (0.07 | ) | (0.96 | ) | (1.03 | ) | – | – | – | 9.09 | ||||||||||||||||||||||||||||
| 10/31/2001 | 10.00 | (0.02 | ) | 0.14 | 0.12 | – | – | – | 10.12 | ||||||||||||||||||||||||||||||
| Class B | 4/30/2006 | 16.21 | (0.01 | ) | 2.51 | 2.50 | (0.03 | ) | (1.12 | ) | (1.15 | ) | 17.56 | ||||||||||||||||||||||||||
| 10/31/2005 | 13.97 | (0.11 | ) | 2.77 | 2.66 | – | (0.42 | ) | (0.42 | ) | 16.21 | ||||||||||||||||||||||||||||
| 10/31/2004 | 12.73 | (0.06 | ) | 2.52 | 2.46 | – | (1.22 | ) | (1.22 | ) | 13.97 | ||||||||||||||||||||||||||||
| 10/31/2003 | 8.98 | (0.17 | ) | 3.92 | 3.75 | – | – | – | 12.73 | ||||||||||||||||||||||||||||||
| 10/31/2002 | 10.08 | (0.19 | ) | (0.91 | ) | (1.10 | ) | – | – | – | 8.98 | ||||||||||||||||||||||||||||
| 10/31/2001 | 10.00 | (0.05 | ) | 0.13 | 0.08 | – | – | – | 10.08 | ||||||||||||||||||||||||||||||
| Class C | 4/30/2006 | 16.18 | (0.01 | ) | 2.50 | 2.49 | (0.03 | ) | (1.12 | ) | (1.15 | ) | 17.52 | ||||||||||||||||||||||||||
| 10/31/2005 | 13.96 | (0.12 | ) | 2.77 | 2.65 | (0.01 | ) | (0.42 | ) | (0.43 | ) | 16.18 | |||||||||||||||||||||||||||
| 10/31/2004 | 12.73 | (0.01 | ) | 2.46 | 2.45 | – | (1.22 | ) | (1.22 | ) | 13.96 | ||||||||||||||||||||||||||||
| 10/31/2003 | 9.01 | (0.18 | ) | 3.90 | 3.72 | – | – | – | 12.73 | ||||||||||||||||||||||||||||||
| Class I | 4/30/2006 | 16.84 | 0.07 | 2.42 | 2.49 | – | (1.12 | ) | (1.12 | ) | 18.21 | ||||||||||||||||||||||||||||
| Ratios/Supplemental Data | |||||||||||||||||||||||||||||||
| For the Period | Total | Net Assets, End of Period | Ratio of Expenses to Average Net Assets (a) | Net Investment Income (Loss) to Average | Portfolio Turnover | ||||||||||||||||||||||||||
| Ended (g) | Return (c) | (000's) | Net (e) | Total (f) | Net Assets (a) | Rate (b) | |||||||||||||||||||||||||
| Class A | 4/30/2006 | 16.47 | % | $ | 47,525 | 1.35 | % | 1.35 | % | 2.27 | % | 10 | % | ||||||||||||||||||
| 10/31/2005 | 20.41 | 386,346 | 1.24 | 1.24 | 0.20 | 42 | |||||||||||||||||||||||||
| 10/31/2004 | 20.61 | 334,763 | 1.32 | 1.32 | 0.31 | 81 | |||||||||||||||||||||||||
| 10/31/2003 | 42.35 | 149,557 | 1.73 | 1.73 | (1.04 | ) | 55 | ||||||||||||||||||||||||
| 10/31/2002 | (10.18 | ) | 45,500 | 1.85 | 1.98 | (0.88 | ) | 22 | |||||||||||||||||||||||
| 10/31/2001 | 1.20 | 6,536 | 1.85 | 3.56 | (0.32 | ) | 8 | ||||||||||||||||||||||||
| Class B | 4/30/2006 | 16.12 | 52,698 | 2.10 | 2.10 | (0.08 | ) | 10 | |||||||||||||||||||||||
| 10/31/2005 | 19.30 | 46,410 | 2.14 | 2.14 | (0.70 | ) | 42 | ||||||||||||||||||||||||
| 10/31/2004 | 19.85 | 40,477 | 1.97 | 1.97 | (0.43 | ) | 81 | ||||||||||||||||||||||||
| 10/31/2003 | 41.76 | 33,196 | 2.38 | 2.38 | (1.69 | ) | 55 | ||||||||||||||||||||||||
| 10/31/2002 | (10.91 | ) | 24,391 | 2.50 | 2.63 | (1.53 | ) | 22 | |||||||||||||||||||||||
| 10/31/2001 | 0.80 | 7,604 | 2.50 | 4.21 | (0.97 | ) | 8 | ||||||||||||||||||||||||
| Class C | 4/30/2006 | 16.08 | 27,033 | 2.09 | 2.09 | (0.08 | ) | 10 | |||||||||||||||||||||||
| 10/31/2005 | 19.22 | 21,532 | 2.20 | 2.20 | (0.76 | ) | 42 | ||||||||||||||||||||||||
| 10/31/2004 | 19.78 | 19,678 | 2.07 | 2.07 | (0.02 | ) | 81 | ||||||||||||||||||||||||
| 10/31/2003 | 41.29 | 1,995 | 2.38 | 2.38 | (1.69 | ) | 55 | ||||||||||||||||||||||||
| Class I | 4/30/2006 | 15.52 | 434,781 | 0.87 | 0.87 | 0.82 | 10 | ||||||||||||||||||||||||
The notes to the financial statements are an integral part of this report.
Transamerica IDEX Mutual Funds
Semi-Annual Report 2006
7
TA IDEX Transamerica Small/Mid Cap Value
FINANCIAL HIGHLIGHTS (continued)
(unaudited)
NOTES TO FINANCIAL HIGHLIGHTS
(a) Annualized.
(b) Not annualized.
(c) Total Return has been calculated for the applicable period without deduction of a sales load, if any, on an initial purchase. Not annualized.
(d) Per share information is calculated based on average number of shares outstanding.
(e) Ratio of Net Expenses to Average Net Assets is net of fee waivers and reimbursements by the investment adviser, if any (see note 2).
(f) Ratio of Total Expenses to Average Net Assets includes all expenses before fee waivers and reimbursements by the investment adviser.
(g) TA IDEX Transamerica Small/Mid Cap Value ("the Fund") commenced operations on April 2, 2001. The inception dates for the Fund's offering of share classes were as follows:
Class C was November 11, 2002.
Class I was November 15, 2005.
The notes to the financial statements are an integral part of this report.
Transamerica IDEX Mutual Funds
Semi-Annual Report 2006
8
TA IDEX Transamerica Small/Mid Cap Value
NOTES TO FINANCIAL STATEMENTS
At April 30, 2006
(all amounts in thousands)
(unaudited)
NOTE 1. ORGANIZATION AND SIGNIFICANT ACCOUNTING POLICIES
Transamerica IDEX Mutual Funds is an open-end management investment company registered under the Investment Company Act of 1940, as amended (the "1940 Act").
In the normal course of business, TA IDEX Transamerica Small/Mid Cap Value (the "Fund") enters into contracts that contain a variety of representations that provide general indemnifications. The Fund's maximum exposure under these arrangements is unknown, as this would involve future claims that may be made against the Fund and/or its affiliates that have not yet occurred. However, based on experience, the Fund expects the risk of loss to be remote.
This report should be read in conjunction with the current Fund prospectus, which contains more complete information about the Fund.
In preparing the Fund's financial statements in accordance with accounting principles generally accepted in the United States of America ("GAAP"), estimates or assumptions (which could differ from actual results) may be used that affect reported amounts and disclosures. The following is a summary of significant accounting policies followed by the Fund.
Multiple class operations, income and expenses: The Fund currently offers four classes of shares, Class A, Class B, Class C and Class I, each with a public offering price that reflects different sales charges, if any, and expense levels. Class I shares commenced operations on November 15, 2005. Class I is only available for investment to certain affiliated asset allocation funds. Class B shares will convert to Class A shares eight years after purchase. Income, non-class specific expenses and realized and unrealized gains and losses, are allocated daily to each class, based upon the value of shares outstanding method as permitted under Rule 18f-3 of the 1940 Act. Each class bears its own specific expenses as well as a portion of general, common expenses.
Security valuations: The Fund values its investments at the close of the New York Stock Exchange ("NYSE"), normally 4 p.m. ET, each day the NYSE is open for business. Fund investments are valued at the last sale price or closing price on the day of valuation taken from the primary exchange where the security is principally traded.
Securities traded in the over-the-counter market and listed securities for which no sale was reported on that date are valued at the last quoted bid price.
Debt securities are valued based on a price quotation or other equivalent indication of value supplied by an exchange, a pricing service or a major market maker; however, those that mature in sixty days or less are valued at amortized cost, which approximates market.
Investment company securities are valued at the net asset value of the underlying portfolio.
Other securities for which quotations are not readily available or whose values have been determined to be unreliable are valued at fair market value as determined in good faith by the Fund's Administrative Valuation Committee, under the supervision of the Board's Valuation Committee, using guidelines adopted by the Board of Trustees.
Cash: The Fund may leave cash overnight in its cash account with the custodian, Investors Bank & Trust Company ("IBT"). IBT has been contracted on behalf of the Fund to invest the excess cash into a savings account, which at April 30, 2006, was paying an interest rate of 3.24%.
Repurchase agreements: The Fund is authorized to enter into repurchase agreements. The Fund, through its custodian, IBT, receives delivery of the underlying securities, the value of which at the time of purchase is required to be an amount equal to at least 100% of the resale price. The Fund will bear the risk of value fluctuations until the security can be sold and may encounter delays and incur costs in liquidating the security. In the event of bankruptcy or insolvency of the seller, delays and costs may be incurred.
Commission recapture: The sub-adviser, to the extent consistent with the best execution and usual commission rate policies and practices, may place security transactions of the Fund with broker/dealers with which Transamerica IDEX Mutual Funds has established a Commission Recapture Program. A Commission Recapture Program is any arrangement under which a broker/dealer applies a portion of the commissions received by such broker/dealer on the security transactions to the Fund. In no event will commissions paid by the Fund be used to pay expenses that would otherwise be borne by any other funds within Transamerica IDEX Mutual Funds, or by any other party.
Recaptured commissions during the six months ended April 30, 2006, of $29 are included in net realized gains in the Statement of Operations.
Securities lending: The Fund may lend securities to qualified borrowers, with IBT acting as the Fund's lending agent. The Fund earns negotiated lenders' fees. The Fund receives cash and/or securities as collateral against the loaned securities. Cash collateral received is invested in short term, interest bearing securities. The Fund monitors the market value of securities loaned on a daily basis and requires collateral in an amount at least equal to the value of the securities loaned. Income from loaned securities on the Statement of Operations is net of fees, in the amount of $82, earned by IBT for its services.
Real Estate Investment Trusts ("REITs"): There are certain additional risks involved in investing in REITs. These include, but are not limited to, economic conditions, changes in zoning laws, real estate values, property taxes and interest rates.
Transamerica IDEX Mutual Funds
Semi-Annual Report 2006
9
TA IDEX Transamerica Small/Mid Cap Value
NOTES TO FINANCIAL STATEMENTS (continued)
At April 30, 2006
(all amounts in thousands)
(unaudited)
NOTE 1.–(continued)
Dividend income is recorded at management's estimate of the income included in distributions from the REIT investments. Distributions received in excess of the estimated amount are recorded as a reduction of the cost of investments. The actual amounts of income, return of capital and capital gains are only determined by each REIT after the fiscal year end and may differ from the estimated amounts.
Security transactions and investment income: Security transactions are recorded on the trade date. Security gains and losses are calculated on the specific identification basis. Dividend income, if any, is recorded on the ex-dividend date or, in the case of foreign securities, as soon as the Fund is informed of the ex-dividend date. Interest income, including accretion of discounts and amortization of premiums, is recorded on the accrual basis commencing on the settlement date.
Redemption fees: A short-term trading redemption fee may be assessed on any Fund shares in a fund account that are sold during the first five (5) NYSE trading days following their purchase date. This redemption fee will equal 2% of the amount redeemed and shares held the longest will be treated as being redeemed first and shares held the shortest as being redeemed last. For the six months ended April 30, 2006, the Fund received less than $1 in redemption fees.
Dividend distributions: Distributions to shareholders are recorded on the ex-dividend date and are determined in accordance with Federal income tax regulations which may differ from GAAP.
NOTE 2. RELATED PARTY TRANSACTIONS
Transamerica Fund Advisors, Inc. ("TFAI") is the Fund's investment adviser. Transamerica Fund Services, Inc. ("TFS") is the Fund's administrator and transfer agent. AFSG Securities Corp. ("AFSG") is the Fund's distributor/principal underwriter. TFAI, TFS, and AFSG are affiliates of AEGON, NV, a Netherlands corporation.
Transamerica Investment Management, LLC is both an affiliate of the Fund and a sub-adviser to the Fund.
Certain officers and trustees of the Fund are also officers and/or directors of TFAI, TFS and AFSG.
The following schedule reflects the percentage of Fund assets owned by affiliated investment companies at April 30, 2006:
| Net Assets | % of Net Assets | ||||||||||
| TA IDEX Asset Allocation– Conservative Portfolio | $ | 18,821 | 3.35 | % | |||||||
| TA IDEX Asset Allocation– Growth Portfolio | 140,250 | 24.95 | % | ||||||||
| TA IDEX Asset Allocation– Moderate Portfolio | 96,730 | 17.21 | % | ||||||||
| TA IDEX Asset Allocation– Moderate Growth Portfolio | 179,101 | 31.87 | % | ||||||||
| Total | $ | 434,902 | 77.38 | % | |||||||
Investment advisory fees: The Fund pays management fees to TFAI based on average daily net assets ("ANA") at the following breakpoints:
0.80% of the first $500 million of ANA
0.75% of ANA over $500 million
TFAI has contractually agreed to waive its advisory fee and will reimburse the Fund to the extent that operating expenses, excluding 12b-1 fees, exceed the following stated annual limit:
1.40% Expense Limit
If total Fund expenses fall below the annual expense limitation agreement agreed to by the adviser within the succeeding three years, the Fund may be required to pay the adviser a portion or all of the reimbursed class expenses.
There are no amounts available for recapture at April 30, 2006.
Distribution and service fees: The Fund has a 12b-1 distribution plan under the 1940 Act pursuant to which an annual fee, based on average daily net assets, is paid to the distributor for various disbursements such as broker-dealer account servicing fees and other promotional expenses of the Fund. The Fund is authorized under the 12b-1 plan to pay fees on each class up to the following limits:
| Class A | 0.35 | % | |||||
| Class B | 1.00 | % | |||||
| Class C | 1.00 | % | |||||
| Class I | N/A | ||||||
In the case the Fund or a class of shares of the Fund is closed to new investors or investments, the Fund is authorized to pay 12b-1 fees for past sales and distribution efforts and present and past investor services.
Transamerica IDEX Mutual Funds
Semi-Annual Report 2006
10
TA IDEX Transamerica Small/Mid Cap Value
NOTES TO FINANCIAL STATEMENTS (continued)
At April 30, 2006
(all amounts in thousands)
(unaudited)
NOTE 2.–(continued)
Underwriter commissions relate to front-end sales charges imposed for Class A shares and contingent deferred sales charges from Classes B, C, and certain A share redemptions. For the six months ended April 30, 2006, the underwriter commissions were as follows:
| Received by Underwriter | $ | 148 | |||||
| Retained by Underwriter | 22 | ||||||
| Contingent Deferred Sales Charge | 43 | ||||||
Administrative services: The Fund has entered into an agreement with TFS for financial and legal fund administration services. The Fund pays TFS an annual fee of 0.02% of ANA. The Legal fees on the Statement of Operations are fees paid to external legal counsel.
Transfer agent fees: The Fund pays TFS an annual per-account charge for each open and closed account. The Fund paid TFS $126 for the six months ended April 30, 2006.
Deferred compensation plan: Each eligible independent Fund Trustee may elect to participate in a non-qualified deferred compensation plan maintained by Transamerica IDEX Mutual Funds (the "Plan"). Under the Plan, such Trustees may defer payment of all or a portion of their total fees earned as a Fund Trustee. Each Trustee who is a participant in the Plan may elect that the earnings, losses or gains credited to his or her deferred fee amounts be determined based on a deemed investment in any series of Transamerica IDEX Mutual Funds, including the Fund. The right of a participant to receive a distribution from the Plan of the deferred fees is an unsecured claim against the general assets of all series of Transamerica IDEX Mutual Funds. The pro rata liability to the Fund of all deferred fees in the Plan amounted, as of April 30, 2006, to $14.
NOTE 3. INVESTMENT TRANSACTIONS
The cost of securities purchased and proceeds from securities sold (excluding short-term securities) for the six months ended April 30, 2006 were as follows:
| Purchases of securities: | |||||||
| Long-Term | $ | 62,877 | |||||
| U.S. Government | – | ||||||
| Proceeds from maturities and sales of securities: | |||||||
| Long-Term | 48,796 | ||||||
| U.S. Government | – | ||||||
NOTE 4. FEDERAL INCOME TAX MATTERS
The Fund has not made any provision for federal income or excise taxes due to its policy to distribute all of its taxable income and capital gains to its shareholders and otherwise qualify as a regulated investment company under Subchapter M of the Internal Revenue Code. Income and capital gain distributions are determined in accordance with income tax regulations, which may differ from GAAP. These differences are primarily due to differing treatment for items including, but not limited to, wash sales and distribution reclassifications.
NOTE 5. REGULATORY PROCEEDINGS
There continues to be significant federal and state regulatory activity relating to financial services companies, particularly mutual fund companies and their investment advisers. As part of an ongoing investigation regarding potential market timing, recordkeeping and trading compliance issues and matters affecting the Fund's investment adviser, TFAI, and certain affiliates and former employees of TFAI, the SEC staff has indicated that it is likely to take some action against TFAI and certain of its affiliates at the conclusion of the investigation. The potential timing and the scope of any such action is difficult to predict. Although the impact of any action brought against TFAI and/or its affiliates is difficult to assess at the present time, the Fund currently believes that the likelihood that any such action will have a material adverse impact on it is remote. It is important to note that the Fund is not aware of any allega tion of wrongdoing against it and its Board at the time this semi-annual report is printed. Although it is not anticipated that these developments will have an adverse impact on the Fund, there can be no assurance at this time. TFAI and its affiliates are actively working with the SEC in regard to this matter; however, the exact resolution cannot be determined at this time. TFAI will take such actions that it deems necessary or appropriate to continue providing management services to the Fund and to bring all matters to an appropriate conclusion.
TFAI and/or its affiliates, and not the Fund, will bear the costs regarding these regulatory matters.
Transamerica IDEX Mutual Funds
Semi-Annual Report 2006
11
TA IDEX Transamerica Small/Mid Cap Value
INVESTMENT ADVISORY AND SUB-ADVISORY AGREEMENTS – REVIEW AND RENEWAL (unaudited)
At a meeting of the Board of Trustees of Transamerica IDEX Mutual Funds ("TA IDEX") held on November 2, 2005, the Board reviewed and considered the Investment Advisory Agreement between TA IDEX Transamerica Small/Mid Cap Value (the "Fund") and Transamerica Fund Advisors, Inc. ("TFAI"), as well as the Investment Sub-Advisory Agreement of the Fund between TFAI and Transamerica Investment Management, LLC (the "Sub-Adviser"), to determine whether the agreements should be renewed for a one-year period. Following their review and consideration, the Trustees determined that the Investment Advisory Agreement and the Investment Sub-Advisory Agreement will enable shareholders of the Fund to obtain high quality services at a cost that is appropriate, reasonable, and in the best interests of its shareholders. The Board, including the independent members of the Board, unanimously approved the renewal of the Investment Advisory Agreement and the Investment Sub-Advisory Agreement. In reaching their decision, the Trustees requested and obtained from TFAI and the Sub-Adviser such information as they deemed reasonably necessary to evaluate the proposed agreements. The Trustees also carefully considered the information that they had received throughout the year from TFAI and the Sub-Adviser (such as in-person presentations by the Sub-Adviser) as part of their regular oversight of the Fund, as well as: comparative fee, expense and performance information prepared by Lipper Inc. ("Lipper"), independent providers of mutual fund performance, fee and expense information, and profitability data. In considering the proposed continuation of the Investment Advisory Agreement and the Investment Sub-Advisory Agreement, the Trustees evaluated a number of considerations that they believe, in light of the legal advice furnished to them by TA IDEX counsel and independent legal counsel and their own business judgment, to be relevant. They based their decisions on th e following considerations, among others, although they did not identify any consideration or particular information that was controlling of their decisions:
The nature, extent and quality of the advisory service to be provided. The Board considered the nature and quality of the services provided by TFAI and the Sub-Adviser to the Fund in the past, as well as the services anticipated to be provided in the future. The Board concluded that TFAI and the Sub-Adviser are capable of providing high quality services to the Fund, as indicated by the nature and quality of services provided in the past, TFAI's and the Sub-Adviser's management capabilities demonstrated with respect to the funds they manage, including the Fund, and the experience, capability and integrity of TFAI's senior management, the financial resources of TFAI and the Sub-Adviser, TFAI's management oversight process, the professional qualifications and experience of the Sub-Adviser's portfolio management team, and the Fund's investment performance . The Trustees also concluded that TFAI and the Sub-Adviser proposed to provide investment and related services that were of the same quality and quantity as services provided to the Fund in the past, and that these services are appropriate in scope and extent in light of the Fund's operations, the competitive landscape of the investment company business and investor needs, and that TFAI's and the Sub-Adviser's obligations will remain substantially the same.
The investment performance of the Fund. The Board examined both the short-term and longer-term performance of the Fund, including relative performance against a benchmark securities index and a peer group of comparable mutual funds as prepared by Lipper, for various trailing periods ended June 30, 2005. The Board favorably noted the Fund's competitive performance compared to its peers and benchmark. The Trustees concluded that TFAI and the Sub-Adviser generally had achieved superior investment performance, noting that the performance of the Fund has been above median relative to its peers over the past one-, two- and three-year periods, and superior to the benchmark index over the past one-, two- and three-year periods (although some of the prior performance was attributable, in part, to another sub-advisor). On the basis of the Trustees' assessment o f the nature, extent and quality of advisory services to be provided or procured by TFAI and the Sub-Adviser, the Trustees concluded that TFAI and the Sub-Adviser are capable of generating a level of investment performance that is appropriate in light of the Fund's investment objective, policies and strategies and competitive with many other investment companies, and also determined that TFAI's and the Sub-Adviser's performance records indicate that their continued management is likely to benefit the Fund and its shareholders.
The cost of advisory services provided and the level of profitability. The Board reviewed profitability information regarding TFAI's costs of procuring portfolio management services, as well as the costs of provision of administration, transfer agency, fund accounting and other services, to the Fund and to TA IDEX as a whole by TFAI and its affiliates. The Trustees reviewed data from Lipper that compared the Fund's management fees (including management fees at various asset levels), other fees and expenses (including total expenses including and excluding 12b-1 distribution and service fees) and portfolio turnover rate against a peer group of comparable mutual funds. Based on such information, the Trustees determined that the management fees and overall expense ratio of the Fund generally are consistent with industry averages. In addition, on the basi s of the Board's review of the management fees to be charged by TFAI for investment advisory and related services, TFAI profitability information (derived from TFAI's audited financial statements), TFAI's estimated management income resulting from its management of the Fund, the estimated margin of the Sub-Adviser, as well as the entirety of TFAI's and its affiliates' service relationship with TA IDEX, the Board concluded that
Transamerica IDEX Mutual Funds
Semi-Annual Report 2006
12
TA IDEX Transamerica Small/Mid Cap Value (continued)
the level of investment management fees and other service fees, as well as TFAI's and the Sub-Adviser's profitability, are appropriate in light of the services provided, the management fees and overall expense ratios of comparable investment companies and the anticipated profitability of the relationship between the Fund, TFAI and its affiliates, and the Sub-Adviser.
Whether fee levels reflect economies of scale and the extent to which economies of scale would be realized as the Fund grows. The Board concluded that the inclusion of asset-based breakpoints in the Fund's advisory fee schedule appropriately benefits investors by realizing economies of scale in the form of lower management fees as the level of assets grows. In addition, the Board concluded that the Fund's management fees appropriately reflect the Fund's current size, the current economic environment for TFAI, the competitive nature of the investment company market, and TFAI's pricing strategy. The Trustees also concluded that they will have the opportunity to periodically reexamine whether the Fund has achieved economies of scale, and the appropriateness of management fees payable to TFAI and fees payable by TFAI to the Sub-Adviser, in the future.
Benefits (such as soft dollars) to TFAI, its affiliates, or the Sub-Adviser from their relationship with the Fund. The Board concluded that other benefits derived by TFAI, its affiliates, and the Sub-Adviser from their relationship with the Fund, including "soft dollar" benefits (if any) in connection with brokerage transactions, sales charges and distribution/service fees (to the extent applicable) are reasonable and fair, and are consistent with industry practice and the best interests of the Fund and its shareholders. In this regard, the Board noted that TFAI does not realize "soft dollar" benefits from its relationship with the Fund, and that the Sub-Adviser is participating in a brokerage program pursuant to which a portion of brokerage commissions paid by the Fund is recaptured for the benefit of the Fund and its shareholders, thus limiting the amount of "soft-dollar" arrangements the Sub-Adviser may engage in with respect to the Fund's brokerage transactions. In addition, the Trustees determined that the administration, transfer agency, fund accounting and other fees paid by the Fund to affiliates of TFAI are reasonable, fair and in the best interests of shareholders in light of the nature and quality of the services provided, the associated costs to these affiliates of providing the services, the impact of the costs of such services on the Fund's overall operating expenses, and the necessity of the services for the Fund's operations.
Other considerations. The Board determined that TFAI had made a substantial commitment to the recruitment and retention of high quality personnel, and maintained the financial, compliance and operational resources reasonably necessary to manage the Fund in a professional manner that is consistent with the best interests of the Fund and its shareholders. In this regard, the Trustees favorably considered the procedures and policies in place by TFAI to enforce compliance with applicable laws and regulations and oversee the portfolio management activities of the Sub-Adviser. The Trustees also determined that TFAI had made a significant entrepreneurial commitment to the management and success of the Fund, reflected by TFAI's expense limitation and fee waiver arrangement with the Fund, which may result in TFAI waiving advisory fees for the benefit of shareh olders.
Transamerica IDEX Mutual Funds
Semi-Annual Report 2006
13
TA IDEX Transamerica Value Balanced
UNDERSTANDING YOUR FUND'S EXPENSES
(unaudited)
SHAREHOLDER EXPENSES
Fund shareholders may incur two types of costs: (1) transaction costs, including sales charges (loads) on purchases, contingent deferred sales charges on redemptions and redemption fees; and (2) ongoing costs, including management fees, 12b-1 distribution and service fees, and other fund expenses.
The following Example is intended to help you understand your ongoing costs (in dollars and cents) of investing in the Fund and to compare these costs with the ongoing costs of investing in other funds.
The Example is based on an investment of $1,000 invested at November 1, 2005 and held for the entire period until April 30, 2006.
ACTUAL EXPENSES
The first line in the table below provides information about actual account values and actual expenses. You may use the information in this line, together with the amount you invested, to estimate the expenses that you paid over the period. Simply divide your account value by $1,000 (for example, an $8,600 account value divided by $1,000 = 8.6), then multiply the result by the number in the first line of your Fund under the heading entitled "Expenses Paid During Period" to estimate the expenses you paid on your account during this period. If your account is an IRA, your expenses could have included a $15 annual fee. The amount of any fee paid through your account would increase the estimate of expenses you paid during the period and decrease your ending account value.
HYPOTHETICAL EXAMPLE FOR COMPARISON PURPOSES
The second line in the table below provides information about hypothetical account values and hypothetical expenses based on the Fund's actual expense ratio and an assumed rate of return of 5% per year before expenses, which is not the Fund's actual return. The hypothetical account values and expenses may not be used to estimate the actual ending account balance or expenses you paid for the period. You may use this information to compare the ongoing costs of investing in your Fund and other funds. To do so, compare this 5% hypothetical example with the 5% hypothetical examples that appear in the shareholder reports of the other funds. As in the case of the actual expense example, if your account is subject to an IRA fee, the amount of the fee paid through your account would increase the hypothetical expenses you would have paid during the period and decrease the hypothetical ending account value.
Please note that the expenses shown in the table are meant to highlight your ongoing costs only and do not reflect any transactional costs, such as sales charges, redemption fees, brokerage commissions paid on purchases and sales of fund shares.
Therefore, the second line under the Fund in the table is useful in comparing ongoing costs only, and will not help you determine the relative total costs of owning different funds. If any of these transaction costs were included, your costs would be higher. The expenses shown in the table do not reflect any fees that may be charged to you by brokers, financial intermediaries or other financial institutions.
| Beginning Account Value | Ending Account Value | Annualized Expense Ratio | Expenses Paid During Period (a) | ||||||||||||||||
| Class A | |||||||||||||||||||
| Actual | $ | 1,000.00 | $ | 1,083.20 | 1.55 | % | $ | 8.01 | |||||||||||
| Hypothetical (b) | 1,000.00 | 1,017.11 | 1.55 | 7.75 | |||||||||||||||
| Class B | |||||||||||||||||||
| Actual | 1,000.00 | 1,080.10 | 2.20 | 11.35 | |||||||||||||||
| Hypothetical (b) | 1,000.00 | 1,013.88 | 2.20 | 10.99 | |||||||||||||||
| Class C | |||||||||||||||||||
| Actual | 1,000.00 | 1,080.30 | 2.20 | 11.35 | |||||||||||||||
| Hypothetical (b) | 1,000.00 | 1,013.88 | 2.20 | 10.99 | |||||||||||||||
(a) Expenses are calculated using the Fund's annualized expense ratio (as disclosed in the table), multiplied by the average account value for the period, multiplied by number of days in the period (181 days), and divided by the number of days in the year (365 days).
(b) 5% return per year before expenses.
GRAPHICAL PRESENTATION OF SCHEDULE OF INVESTMENTS
By Asset Type
At April 30, 2006
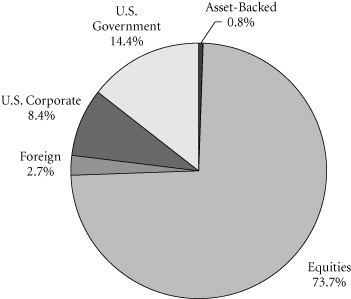
This chart shows the percentage breakdown by asset type of the Fund's total investment securities.
Transamerica IDEX Mutual Funds
Semi-Annual Report 2006
1
TA IDEX Transamerica Value Balanced
SCHEDULE OF INVESTMENTS l
At April 30, 2006
(all amounts except share amounts in thousands)
(unaudited)
| Principal | Value | ||||||||||
| U.S. GOVERNMENT OBLIGATIONS (5.5%) | |||||||||||
| U.S. Treasury Bond | |||||||||||
| 8.00%, due 11/15/2021 | $ | 65 | $ | 83 | |||||||
| 5.38%, due 02/15/2031 | 210 | 213 | |||||||||
| U.S. Treasury Note 4.50%, due 11/15/2010 4.75%, due 03/31/2011 4.50%, due 11/15/2015 4.50%, due 02/15/2016 | 430 1,063 1,218 760 | 423 1,054 1,166 727 | |||||||||
| Total U.S. Government Obligations (cost: $3,759) | 3,666 | ||||||||||
| U.S. GOVERNMENT AGENCY OBLIGATIONS (8.7%) | |||||||||||
| Fannie Mae 5.50%, due 05/01/2035 5.50%, due 05/01/2035 5.00%, due 07/01/2035 | 656 647 672 | 637 629 636 | |||||||||
| Fannie Mae-Conventional Pool 5.00%, due 05/01/2018 5.50%, due 07/01/2019 5.50%, due 07/01/2019 6.00%, due 04/01/2033 6.00%, due 10/01/2034 | 131 121 623 334 186 | 127 121 619 334 185 | |||||||||
| Freddie Mac-Gold Pool 5.00%, due 04/01/2018 5.50%, due 09/01/2018 5.50%, due 11/01/2018 6.00%, due 12/01/2033 5.50%, due 02/01/2035 5.50%, due 06/01/2035 5.00%, due 07/01/2035 | 241 77 151 401 550 570 250 | 235 76 150 400 535 554 237 | |||||||||
| Ginnie Mae-FHA/VA Pool 6.50%, due 10/15/2027 6.00%, due 06/15/2034 | 89 225 | 92 226 | |||||||||
| Total U.S. Government Agency Obligations (cost: $6,012) | 5,793 | ||||||||||
| ASSET-BACKED SECURITIES (0.8%) | |||||||||||
| Harley-Davidson Motorcycle Trust, Series 2005-4, Class A1 4.78%, due 11/15/2010 | 159 | 158 | |||||||||
| USAA Auto Owner Trust, Series 2005-3, Class A2 4.52%, due 06/16/2008 | 373 | 372 | |||||||||
| Total Asset-Backed Securities (cost: $532) | 530 | ||||||||||
| CORPORATE DEBT SECURITIES (11.0%) | |||||||||||
| Agriculture (0.3%) | |||||||||||
| Dole Food Co., Inc. 8.63%, due 05/01/2009 | 100 | 99 | |||||||||
| Principal | Value | ||||||||||
| Agriculture (continued) | |||||||||||
| Michael Foods, Inc. 8.00%, due 11/15/2013 | $ | 90 | $ | 90 | |||||||
| Air Transportation (0.3%) | |||||||||||
| FedEx Corp., Note 9.65%, due 06/15/2012 | 150 | 179 | |||||||||
| Amusement & Recreation Services (0.3%) | |||||||||||
| Harrah's Operating Co., Inc. 5.50%, due 07/01/2010 | 175 | 173 | |||||||||
| Beverages (0.1%) | |||||||||||
| Cia Brasileira de Bebidas 8.75%, due 09/15/2013 | 85 | 97 | |||||||||
| Business Credit Institutions (0.8%) | |||||||||||
| Pemex Finance, Ltd. 9.03%, due 02/15/2011 | 250 | 270 | |||||||||
| Textron Financial Corp. 2.69%, due 10/03/2006 | 250 | 247 | |||||||||
| Business Services (0.1%) | |||||||||||
| Hertz Corp.–144A 8.88%, due 01/01/2014 | 100 | 106 | |||||||||
| Chemicals & Allied Products (0.7%) | |||||||||||
| IMC Global, Inc. 10.88%, due 06/01/2008 | 75 | 81 | |||||||||
| Monsanto Co. 5.50%, due 07/30/2035 | 100 | 88 | |||||||||
| Nalco Co. 7.75%, due 11/15/2011 | 50 | 50 | |||||||||
| Potash Corp. of Saskatchewan 7.13%, due 06/15/2007 | 235 | 239 | |||||||||
| Commercial Banks (0.5%) | |||||||||||
| Shinsei Finance Cayman, Ltd.–144A 6.42%, due 07/20/2016 (a)(b) | 240 | 233 | |||||||||
| Wachovia Capital Trust III 5.80%, due 03/15/2011 (a)(b) | 75 | 74 | |||||||||
| Communication (0.1%) | |||||||||||
| Comcast Corp. 7.05%, due 03/15/2033 | 95 | 97 | |||||||||
| Department Stores (0.1%) | |||||||||||
| Neiman-Marcus Group, Inc.–144A 9.00%, due 10/15/2015 | 100 | 106 | |||||||||
| Electric Services (0.5%) | |||||||||||
| DPL, Inc. 8.25%, due 03/01/2007 | 112 | 114 | |||||||||
The notes to the financial statements are an integral part of this report.
Transamerica IDEX Mutual Funds
Semi-Annual Report 2006
2
TA IDEX Transamerica Value Balanced
SCHEDULE OF INVESTMENTS (continued)
At April 30, 2006
(all amounts except share amounts in thousands)
(unaudited)
| Principal | Value | ||||||||||
| Electric Services (continued) | |||||||||||
| PSEG Funding Trust 5.38%, due 11/16/2007 | $ | 250 | $ | 249 | |||||||
| Food & Kindred Products (0.7%) | |||||||||||
| Archer-Daniels-Midland Co. 5.38%, due 09/15/2035 | 100 | 88 | |||||||||
| Bunge Ltd Finance Corp. 4.38%, due 12/15/2008 | 270 | 262 | |||||||||
| Tyson Foods, Inc. 6.60%, due 04/01/2016 | 95 | 93 | |||||||||
| Food Stores (0.1%) | |||||||||||
| Stater Brothers Holdings, Inc. 8.13%, due 06/15/2012 | 100 | 100 | |||||||||
| Holding & Other Investment Offices (0.9%) | |||||||||||
| Hutchison Whampoa International, Ltd.–144A 7.45%, due 11/24/2033 | 80 | 86 | |||||||||
| iStar Financial, Inc. REIT 4.88%, due 01/15/2009 | 375 | 367 | |||||||||
| Plum Creek Timberlands, LP 5.88%, due 11/15/2015 | 130 | 126 | |||||||||
| Hotels & Other Lodging Places (0.2%) | |||||||||||
| Starwood Hotels & Resorts Worldwide, Inc. 7.38%, due 05/01/2007 | 100 | 102 | |||||||||
| Wynn Las Vegas LLC/Wynn Las Vegas Capital Corp. 6.63%, due 12/01/2014 | 55 | 53 | |||||||||
| Industrial Machinery & Equipment (0.1%) | |||||||||||
| Cummins, Inc. 7.13%, due 03/01/2028 | 45 | 45 | |||||||||
| Metal Mining (0.4%) | |||||||||||
| Phelps Dodge Corp. 9.50%, due 06/01/2031 | 137 | 174 | |||||||||
| Teck Cominco, Ltd. 6.13%, due 10/01/2035 | 90 | 83 | |||||||||
| Mortgage Bankers & Brokers (0.4%) | |||||||||||
| Glencore Funding LLC–144A 6.00%, due 04/15/2014 | 62 | 58 | |||||||||
| ILFC E-Capital Trust II–144A 6.25%, due 12/21/2065 (a) | 105 | 101 | |||||||||
| Kinder Morgan Finance Co., ULC 6.40%, due 01/05/2036 | 95 | 91 | |||||||||
| Motion Pictures (0.2%) | |||||||||||
| Time Warner, Inc. 9.13%, due 01/15/2013 | 125 | 144 | |||||||||
| Principal | Value | ||||||||||
| Oil & Gas Extraction (0.3%) | |||||||||||
| Husky Oil, Ltd. 8.90%, due 08/15/2028 (a) | $ | 100 | $ | 106 | |||||||
| Nexen, Inc. 5.88%, due 03/10/2035 | 100 | 91 | |||||||||
| Petroleum Refining (0.1%) | |||||||||||
| Valero Energy Corp. 7.50%, due 04/15/2032 | 80 | 90 | |||||||||
| Primary Metal Industries (0.1%) | |||||||||||
| Noranda, Inc. 6.00%, due 10/15/2015 | 63 | 61 | |||||||||
| Printing & Publishing (0.6%) | |||||||||||
| Media General, Inc. 6.95%, due 09/01/2006 | 320 | 321 | |||||||||
| News America Holdings, Inc. 7.75%, due 12/01/2045 | 65 | 70 | |||||||||
| Radio & Television Broadcasting (0.4%) | |||||||||||
| Chancellor Media Corp. 8.00%, due 11/01/2008 | 100 | 105 | |||||||||
| Univision Communications, Inc. 7.85%, due 07/15/2011 | 160 | 167 | |||||||||
| Real Estate (0.4%) | |||||||||||
| Colonial Realty, LP 7.00%, due 07/14/2007 | 244 | 247 | |||||||||
| Security & Commodity Brokers (1.2%) | |||||||||||
| BNP U.S. Funding LLC–144A 7.74%, due 12/05/2007 (a)(b) | 250 | 258 | |||||||||
| Credit Suisse First Boston (London), Inc.–144A 7.90%, due 05/01/2007 (a)(b) | 125 | 128 | |||||||||
| E*Trade Financial Corp. 8.00%, due 06/15/2011 | 50 | 52 | |||||||||
| Nuveen Investments, Inc. 5.00%, due 09/15/2010 | 375 | 361 | |||||||||
| Telecommunications (0.3%) | |||||||||||
| Sprint Capital Corp. 8.75%, due 03/15/2032 | 75 | 93 | |||||||||
| Verizon Global Funding Corp. 7.75%, due 12/01/2030 | 90 | 99 | |||||||||
| Water Transportation (0.8%) | |||||||||||
| Carnival Corp. 3.75%, due 11/15/2007 | 380 | 370 | |||||||||
| Royal Caribbean Cruises, Ltd. 8.75%, due 02/02/2011 | 135 | 149 | |||||||||
| Total Corporate Debt Securities (cost: $7,550) | 7,333 | ||||||||||
The notes to the financial statements are an integral part of this report.
Transamerica IDEX Mutual Funds
Semi-Annual Report 2006
3
TA IDEX Transamerica Value Balanced
SCHEDULE OF INVESTMENTS (continued)
At April 30, 2006
(all amounts except share amounts in thousands)
(unaudited)
| Shares | Value | ||||||||||
| COMMON STOCKS (72.8%) | |||||||||||
| Amusement & Recreation Services (2.2%) | |||||||||||
| Disney (Walt) Co. (The) | 52,200 | $ | 1,459 | ||||||||
| Business Credit Institutions (0.3%) | |||||||||||
| Fannie Mae | 4,500 | 228 | |||||||||
| Chemicals & Allied Products (1.7%) | |||||||||||
| Colgate-Palmolive Co. | 7,000 | 414 | |||||||||
| Praxair, Inc. | 13,000 | 730 | |||||||||
| Commercial Banks (7.9%) | |||||||||||
| Bank of America Corp. | 31,256 | 1,560 | |||||||||
| Citigroup, Inc. | 32,540 | 1,625 | |||||||||
| PNC Financial Services Group, Inc. | 10,000 | 715 | |||||||||
| Wachovia Corp. | 16,700 | 999 | |||||||||
| Wells Fargo & Co. | 5,000 | 343 | |||||||||
| Computer & Data Processing Services (5.4%) | |||||||||||
| Microsoft Corp. | 150,000 | 3,622 | |||||||||
| Electric Services (0.3%) | |||||||||||
| Dominion Resources, Inc. | 3,000 | 225 | |||||||||
| Electronic & Other Electric Equipment (2.2%) | |||||||||||
| Cooper Industries, Ltd.–Class A | 2,500 | 229 | |||||||||
| General Electric Co. | 35,500 | 1,228 | |||||||||
| Food & Kindred Products (4.6%) | |||||||||||
| Altria Group, Inc. | 30,400 | 2,224 | |||||||||
| HJ Heinz Co. | 10,000 | 415 | |||||||||
| Sara Lee Corp. | 23,000 | 411 | |||||||||
| Gas Production & Distribution (2.4%) | |||||||||||
| KeySpan Corp. | 40,000 | 1,615 | |||||||||
| Holding & Other Investment Offices (2.7%) | |||||||||||
| Plum Creek Timber Co., Inc. | 23,000 | 835 | |||||||||
| Rayonier, Inc. | 24,000 | 988 | |||||||||
| Life Insurance (0.8%) | |||||||||||
| Genworth Financial, Inc.–Class A | 17,000 | 564 | |||||||||
| Lumber & Wood Products (0.7%) | |||||||||||
| Louisiana-Pacific Corp. | 17,000 | 469 | |||||||||
| Motion Pictures (4.8%) | |||||||||||
| Time Warner, Inc. | 183,000 | 3,184 | |||||||||
| Oil & Gas Extraction (4.9%) | |||||||||||
| Anadarko Petroleum Corp. | 7,000 | 734 | |||||||||
| Chesapeake Energy Corp. | 7,500 | 238 | |||||||||
| EOG Resources, Inc. | 7,000 | 492 | |||||||||
| Schlumberger, Ltd. | 26,000 | 1,798 | |||||||||
| Shares | Value | ||||||||||
| Paper & Allied Products (0.4%) | |||||||||||
| Kimberly-Clark Corp. | 5,000 | $ | 293 | ||||||||
| Petroleum Refining (6.8%) | |||||||||||
| BP PLC, ADR | 25,050 | 1,847 | |||||||||
| Exxon Mobil Corp. | 14,000 | 883 | |||||||||
| Marathon Oil Corp. | 13,750 | 1,091 | |||||||||
| Murphy Oil Corp. | 14,000 | 703 | |||||||||
| Pharmaceuticals (8.4%) | |||||||||||
| Bristol-Myers Squibb Co. | 85,000 | 2,157 | |||||||||
| Merck & Co., Inc. | 79,500 | 2,736 | |||||||||
| Schering-Plough Corp. | 35,000 | 676 | |||||||||
| Railroads (1.4%) | |||||||||||
| Union Pacific Corp. | 10,000 | 912 | |||||||||
| Savings Institutions (3.4%) | |||||||||||
| Washington Mutual, Inc. | 49,890 | 2,248 | |||||||||
| Security & Commodity Brokers (7.0%) | |||||||||||
| AllianceBernstein Holding, LP | 45,000 | 2,900 | |||||||||
| Jefferies Group, Inc. | 9,500 | 631 | |||||||||
| Raymond James Financial, Inc. | 21,450 | 651 | |||||||||
| T. Rowe Price Group, Inc. | 5,800 | 488 | |||||||||
| Telecommunications (3.0%) | |||||||||||
| Sprint Nextel Corp. | 81,600 | 2,024 | |||||||||
| Tobacco Products (1.5%) | |||||||||||
| Loews Corp.–Carolina Group | 20,000 | 1,025 | |||||||||
| Total Common Stocks (cost: $38,167) | 48,609 | ||||||||||
| Total Investment Securities (cost: $56,020) | $ | 65,931 | |||||||||
| Contractst | Value | ||||||||||
| WRITTEN OPTIONS (-1.2%) | |||||||||||
| Covered Call Options (-0.9%) | |||||||||||
| Alliancebernstein Call Strike $75.00 Expires 10/21/2006 | 125 | $ | (5 | ) | |||||||
| Eog Resources Inc. Call Strike $80.00 Expires 10/21/2006 | 30 | (16 | ) | ||||||||
| HJ Heinz Co. Call Strike $40.00 Expires 01/20/2007 | 100 | (35 | ) | ||||||||
| Jefferies Group Inc. Call Strike $70.00 Expires 07/22/2006 | 45 | (11 | ) | ||||||||
| Loews Corp.–Carolina Group Call Strike $50.00 Expires 06/17/2006 | 40 | (11 | ) | ||||||||
The notes to the financial statements are an integral part of this report.
Transamerica IDEX Mutual Funds
Semi-Annual Report 2006
4
TA IDEX Transamerica Value Balanced
SCHEDULE OF INVESTMENTS (continued)
At April 30, 2006
(all amounts except share amounts in thousands)
(unaudited)
| Contractst | Value | ||||||||||
| Covered Call Options (continued) | |||||||||||
| Louisiana-Pacific Corp. | 80 | $ | (1 | ) | |||||||
| Call Strike $30.00 | |||||||||||
| Expires 05/20/2006 | |||||||||||
| Lousiana-Pacific Corp. Call Strike $30.00 Expires 08/19/2006 | 90 | (7 | ) | ||||||||
| Merck & Co., Inc. Call Strike $37.50 Expires 10/21/2006 | 305 | (21 | ) | ||||||||
| PNC Financial Service Group Call Strike $75.00 Expires 08/19/2006 | 40 | (6 | ) | ||||||||
| PNC Financial Services Group Call Strike $80.00 Expires 01/20/2007 | 40 | (6 | ) | ||||||||
| Praxair Inc. Call Strike $60.00 Expires 10/21/2006 | 70 | (12 | ) | ||||||||
| Schering-Plough Corp. Call Strike $20.00 Expires 08/19/2006 | 350 | (25 | ) | ||||||||
| Schlumberger Call Strike $55.00 Expires 05/20/2006 | 260 | (373 | ) | ||||||||
| Sprint Nextel Corp. Call Strike $27.50 Expires 11/18/2006 | 410 | (29 | ) | ||||||||
| Union Pacific Corp. Call Strike $95.00 Expires 08/19/2006 | 50 | (17 | ) | ||||||||
| Put Options (-0.3%) | |||||||||||
| American International Group, Inc. Put Strike $65.00 Expires 08/19/2006 | 130 | (25 | ) | ||||||||
| American International Group, Inc. Put Strike $55.00 Expires 01/19/2008 | 190 | (36 | ) | ||||||||
| Chesapeake Energy Corp. Put Strike $27.50 Expires 07/22/2006 | 313 | (17 | ) | ||||||||
| Cia Vale Do Rio Doce Put Strike $35.00 Expires 01/20/2007 | 170 | (7 | ) | ||||||||
| Colgate-Palmolive Co. Put Strike $55.00 Expires 11/18/2006 | 70 | (7 | ) | ||||||||
| Contractst | Value | ||||||||||
| Put Options (continued) | |||||||||||
| Colgate-Palmolive Co. | 70 | $ | (3 | ) | |||||||
| Put Strike $50.00 | |||||||||||
| Expires 01/20/2007 | |||||||||||
| Dominion Resources Put Strike $70.00 Expires 01/20/2007 | 60 | (15 | ) | ||||||||
| Duke Emergy Corp. Put Strike $27.50 Expires 01/20/2007 | 20 | (2 | ) | ||||||||
| Duke Energy Corp. Put Strike $25.00 Expires 01/20/2007 | 35 | (2 | ) | ||||||||
| Fannie Mae Put Strike $45.00 Expires 01/20/2007 | 170 | (32 | ) | ||||||||
| General Electric Put Strike $32.50 Expires 01/20/2007 | 100 | (8 | ) | ||||||||
| Kimberly-Clark Corp. Put Strike $55.00 Expires 10/21/2006 | 100 | (10 | ) | ||||||||
| Kimberly-Clark Corp. Put Strike $55.00 Expires 01/20/2007 | 50 | (7 | ) | ||||||||
| Morgan Stanley Put Strike $50.00 Expires 10/21/2006 | 186 | (5 | ) | ||||||||
| Pfizer, Inc. Put Strike $20.00 Expires 01/19/2008 | 313 | (26 | ) | ||||||||
| Schering-Plough Corp. Put Strike $15.00 Expires 01/20/2007 | 500 | (10 | ) | ||||||||
| Washington Mutual Inc. Put Strike $40.00 Expires 01/20/2007 | 80 | (8 | ) | ||||||||
| Total Written Options (premiums: $532) | (795 | ) | |||||||||
The notes to the financial statements are an integral part of this report.
Transamerica IDEX Mutual Funds
Semi-Annual Report 2006
5
TA IDEX Transamerica Value Balanced
SCHEDULE OF INVESTMENTS (continued)
At April 30, 2006
(all amounts except share amounts in thousands)
(unaudited)
NOTES TO SCHEDULE OF INVESTMENTS:
l Substantially all of the Fund's securities are memo pledged as collateral by the custodian for the listed short index option contracts written by the Fund.
(a) Coupon rate is fixed for a predetermined period of time and then converts to a floating rate until maturity date. Rate is listed as of April 30, 2006.
(b) The security has a perpetual maturity. The date shown is the next call date.
t Contract amounts are not in thousands.
# Aggregate cost for Federal income tax purposes is $56,236. Aggregate gross unrealized appreciation for all securities in which there is an excess of value over tax cost and aggregate gross unrealized depreciation for all securities in which there is an excess of tax cost over value were $11,127 and $1,432, respectively. Net unrealized appreciation for tax purposes is $9,695.
DEFINITIONS:
144A 144A Securities are registered pursuant to Rule 144A of the Securities Act of 1933. These securities are deemed to be liquid for purposes of compliance limitations on holdings of illiquid securities and may be resold as transactions exempt from registration, normally to qualified institutional buyers. At April 30, 2006, these securities aggregated $1,076 or 1.6% of the net assets of the Fund.
ADR American Depositary Receipt
FHA Federal Housing Administration
REIT Real Estate Investment Trust
VA Veterans Affairs
The notes to the financial statements are an integral part of this report.
Transamerica IDEX Mutual Funds
Semi-Annual Report 2006
6
TA IDEX Transamerica Value Balanced
STATEMENT OF ASSETS AND LIABILITIES
At April 30, 2006
(all amounts except per share amounts in thousands)
(unaudited)
| Assets: | |||||||
| Investment securities, at value (cost: $56,020) | $ | 65,931 | |||||
| Cash | 1,336 | ||||||
| Receivables: | |||||||
| Shares of beneficial interest sold | 11 | ||||||
| Interest | 226 | ||||||
| Dividends | 88 | ||||||
| Receivable from premiums on written options | 120 | ||||||
| Other | 15 | ||||||
| 67,727 | |||||||
| Liabilities: | |||||||
| Accounts payable and accrued liabilities: | |||||||
| Shares of beneficial interest redeemed | 78 | ||||||
| Management and advisory fees | 42 | ||||||
| Distribution and service fees | 38 | ||||||
| Transfer agent fees | 33 | ||||||
| Administration fees | 1 | ||||||
| Written options (premiums $532) | 795 | ||||||
| Other | 24 | ||||||
| 1,011 | |||||||
| Net Assets | $ | 66,716 | |||||
| Net Assets Consist of: | |||||||
| Shares of beneficial interest, unlimited shares authorized, no par value | $ | 58,310 | |||||
| Distributable net investment income (loss) | 66 | ||||||
| Accumulated net realized gain (loss) from investment securities and written options | (1,307 | ) | |||||
| Net unrealized appreciation (depreciation) on: | |||||||
| Investment securities | 9,910 | ||||||
| Written option contracts | (263 | ) | |||||
| Net Assets | $ | 66,716 | |||||
| Net Assets by Class: | |||||||
| Class A | $ | 32,293 | |||||
| Class B | 22,725 | ||||||
| Class C | 11,698 | ||||||
| Shares Outstanding: | |||||||
| Class A | 2,553 | ||||||
| Class B | 1,802 | ||||||
| Class C | 928 | ||||||
| Net Asset Value Per Share: | |||||||
| Class A | $ | 12.65 | |||||
| Class B | 12.61 | ||||||
| Class C | 12.60 | ||||||
| Maximum Offering Price Per Share (a): | |||||||
| Class A | $ | 13.39 | |||||
(a) Includes the maximum selling commission (represented as a percentage of offering price) which is reduced on certain levels of sales as set forth in the Prospectus. Net asset value per share for Classes B and C shares represents offering price. The redemption price for Classes B and C shares equals net asset value less any applicable contingent deferred sales charge.
STATEMENT OF OPERATIONS
For the period ended April 30, 2006 (b)
(all amounts in thousands)
(unaudited)
| Investment Income: | |||||||
| Dividends | $ | 696 | |||||
| Interest | 504 | ||||||
| 1,200 | |||||||
| Expenses: | |||||||
| Management and advisory fees | 255 | ||||||
| Distribution and service fees: | |||||||
| Class A | 57 | ||||||
| Class B | 118 | ||||||
| Class C | 59 | ||||||
| Transfer agent fees: | |||||||
| Class A | 54 | ||||||
| Class B | 43 | ||||||
| Class C | 16 | ||||||
| Printing and shareholder reports | 17 | ||||||
| Custody fees | 10 | ||||||
| Administration fees | 7 | ||||||
| Legal fees | 2 | ||||||
| Audit fees | 9 | ||||||
| Trustees fees | 1 | ||||||
| Registration fees | 14 | ||||||
| Other | 1 | ||||||
| Total expenses | 663 | ||||||
| Less: | |||||||
| Reimbursement of class expenses: | |||||||
| Class A | (11 | ) | |||||
| Class B | (11 | ) | |||||
| Total reimbursed expenses | (22 | ) | |||||
| Net expenses | 641 | ||||||
| Net Investment Income (Loss) | 559 | ||||||
| Net Realized Gain (Loss) from: | |||||||
| Investment securities | 1,255 | ||||||
| Written option contracts | 343 | ||||||
| 1,598 | |||||||
| Net Increase (Decrease) in Unrealized Appreciation (Depreciation) on: | |||||||
| Investment securities | 3,499 | ||||||
| Written option contracts | (245 | ) | |||||
| 3,254 | |||||||
| Net Realized and Unrealized Gain (Loss) on Investment Securities and Written Options | 4,852 | ||||||
| Net Increase (Decrease) in Net Assets Resulting from Operations | $ | 5,411 | |||||
(b) Class I was offered for investment on November 15, 2005.
The notes to the financial statements are an integral part of this report.
Transamerica IDEX Mutual Funds
Semi-Annual Report 2006
7
TA IDEX Transamerica Value Balanced
STATEMENTS OF CHANGES IN NET ASSETS
For the period or year ended
(all amounts in thousands)
| April 30, 2006 (unaudited) (a) | October 31, 2005 | ||||||||||
| Increase (Decrease) in Net Assets From: | |||||||||||
| Operations: | |||||||||||
| Net investment income (loss) | $ | 559 | $ | 1,287 | |||||||
| Net realized gain (loss) from investment securities and written options | 1,598 | 2,362 | |||||||||
| Change in unrealized appreciation (depreciation) on investment securities and written options | 3,254 | 1,991 | |||||||||
| 5,411 | 5,640 | ||||||||||
| Distributions to Shareholders: | |||||||||||
| From net investment income: | |||||||||||
| Class A | (283 | ) | (738 | ) | |||||||
| Class B | (129 | ) | (383 | ) | |||||||
| Class C | (69 | ) | (199 | ) | |||||||
| (481 | ) | (1,320 | ) | ||||||||
| From net realized gains: | |||||||||||
| Class A | (474 | ) | (2,499 | ) | |||||||
| Class B | (346 | ) | (1,957 | ) | |||||||
| Class C | (175 | ) | (975 | ) | |||||||
| (995 | ) | (5,431 | ) | ||||||||
| Capital Share Transactions: | |||||||||||
| Proceeds from shares sold: | |||||||||||
| Class A | 1,078 | 2,804 | |||||||||
| Class B | 596 | 1,800 | |||||||||
| Class C | 513 | 820 | |||||||||
| 2,187 | 5,424 | ||||||||||
| Dividends and distributions reinvested: | |||||||||||
| Class A | 741 | 3,170 | |||||||||
| Class B | 455 | 2,252 | |||||||||
| Class C | 235 | 1,130 | |||||||||
| 1,431 | 6,552 | ||||||||||
| Cost of shares redeemed: | |||||||||||
| Class A | (4,896 | ) | (11,118 | ) | |||||||
| Class B | (3,214 | ) | (7,807 | ) | |||||||
| Class C | (1,659 | ) | (4,095 | ) | |||||||
| (9,769 | ) | (23,020 | ) | ||||||||
(a) Class I was offered for investment on November 15, 2005.
| April 30, 2006 (unaudited) (a) | October 31, 2005 | ||||||||||
| Automatic conversions: | |||||||||||
| Class A | $ | 556 | $ | 1,188 | |||||||
| Class B | (556 | ) | (1,188 | ) | |||||||
| – | – | ||||||||||
| (6,151 | ) | (11,044 | ) | ||||||||
| Net increase (decrease) in net assets | (2,216 | ) | (12,155 | ) | |||||||
| Net Assets: | |||||||||||
| Beginning of period | 68,932 | 81,087 | |||||||||
| End of period | $ | 66,716 | $ | 68,932 | |||||||
| Distributable Net Investment Income (Loss) | $ | 66 | $ | (12 | ) | ||||||
| Share Activity: | |||||||||||
| Shares issued: | |||||||||||
| Class A | 86 | 236 | |||||||||
| Class B | 48 | 152 | |||||||||
| Class C | 42 | 69 | |||||||||
| 176 | 457 | ||||||||||
| Shares issued-reinvested from distributions: | |||||||||||
| Class A | 60 | 267 | |||||||||
| Class B | 37 | 191 | |||||||||
| Class C | 19 | 96 | |||||||||
| 116 | 554 | ||||||||||
| Shares redeemed: | |||||||||||
| Class A | (395 | ) | (934 | ) | |||||||
| Class B | (259 | ) | (658 | ) | |||||||
| Class C | (134 | ) | (347 | ) | |||||||
| (788 | ) | (1,939 | ) | ||||||||
| Automatic conversions: | |||||||||||
| Class A | 45 | 100 | |||||||||
| Class B | (45 | ) | (100 | ) | |||||||
| – | – | ||||||||||
| Net increase (decrease) in shares outstanding: | |||||||||||
| Class A | (204 | ) | (331 | ) | |||||||
| Class B | (219 | ) | (415 | ) | |||||||
| Class C | (73 | ) | (182 | ) | |||||||
| (496 | ) | (928 | ) | ||||||||
The notes to the financial statements are an integral part of this report.
Transamerica IDEX Mutual Funds
Semi-Annual Report 2006
8
TA IDEX Transamerica Value Balanced
FINANCIAL HIGHLIGHTS
(unaudited for the period ended April 30, 2006)
| For a share of beneficial interest outstanding throughout each period | |||||||||||||||||||||||||||||||||||||||
| Net Asset | Investment Operations | Distributions | Net Asset | ||||||||||||||||||||||||||||||||||||
| For the Period Ended (d)(g) | Value, Beginning of Period | Net Investment Income (Loss) | Net Realized and Unrealized Gain (Loss) | Total Operations | From Net Investment Income | From Net Realized Gains | Total Distributions | Value, End of Period | |||||||||||||||||||||||||||||||
| Class A | 4/30/2006 | $ | 11.95 | $ | 0.12 | $ | 0.87 | $ | 0.99 | $ | (0.11 | ) | $ | (0.18 | ) | $ | (0.29 | ) | $ | 12.65 | |||||||||||||||||||
| 10/31/2005 | 12.11 | 0.24 | 0.69 | 0.93 | (0.25 | ) | (0.84 | ) | (1.09 | ) | 11.95 | ||||||||||||||||||||||||||||
| 10/31/2004 | 11.49 | 0.18 | 0.61 | 0.79 | (0.17 | ) | – | (0.17 | ) | 12.11 | |||||||||||||||||||||||||||||
| 10/31/2003 | 9.69 | 0.18 | 1.83 | 2.01 | (0.21 | ) | – | (0.21 | ) | 11.49 | |||||||||||||||||||||||||||||
| 10/31/2002 | 11.67 | 0.18 | (1.65 | ) | (1.47 | ) | (0.16 | ) | (0.35 | ) | (0.51 | ) | 9.69 | ||||||||||||||||||||||||||
| 10/31/2001 | 12.75 | 0.26 | (0.51 | ) | (0.25 | ) | (0.26 | ) | (0.57 | ) | (0.83 | ) | 11.67 | ||||||||||||||||||||||||||
| Class B | 4/30/2006 | 11.91 | 0.08 | 0.87 | 0.95 | (0.07 | ) | (0.18 | ) | (0.25 | ) | 12.61 | |||||||||||||||||||||||||||
| 10/31/2005 | 12.07 | 0.17 | 0.68 | 0.85 | (0.17 | ) | (0.84 | ) | (1.01 | ) | 11.91 | ||||||||||||||||||||||||||||
| 10/31/2004 | 11.46 | 0.10 | 0.61 | 0.71 | (0.10 | ) | – | (0.10 | ) | 12.07 | |||||||||||||||||||||||||||||
| 10/31/2003 | 9.69 | 0.11 | 1.80 | 1.91 | (0.14 | ) | – | (0.14 | ) | 11.46 | |||||||||||||||||||||||||||||
| 10/31/2002 | 11.66 | 0.11 | (1.65 | ) | (1.54 | ) | (0.08 | ) | (0.35 | ) | (0.43 | ) | 9.69 | ||||||||||||||||||||||||||
| 10/31/2001 | 12.74 | 0.18 | (0.50 | ) | (0.32 | ) | (0.19 | ) | (0.57 | ) | (0.76 | ) | 11.66 | ||||||||||||||||||||||||||
| Class C | 4/30/2006 | 11.91 | 0.08 | 0.86 | 0.94 | (0.07 | ) | (0.18 | ) | (0.25 | ) | 12.60 | |||||||||||||||||||||||||||
| 10/31/2005 | 12.07 | 0.17 | 0.69 | 0.86 | (0.18 | ) | (0.84 | ) | (1.02 | ) | 11.91 | ||||||||||||||||||||||||||||
| 10/31/2004 | 11.46 | 0.11 | 0.60 | 0.71 | (0.10 | ) | – | (0.10 | ) | 12.07 | |||||||||||||||||||||||||||||
| 10/31/2003 | 9.71 | 0.12 | 1.77 | 1.89 | (0.14 | ) | – | (0.14 | ) | 11.46 | |||||||||||||||||||||||||||||
| Ratios/Supplemental Data | |||||||||||||||||||||||||||||||
| For the Period | Total | Net Assets, End of Period | Ratio of Expenses to Average Net Assets (a) | Net Investment Income (Loss) to Average | Portfolio Turnover | ||||||||||||||||||||||||||
| Ended (g) | Return (c) | (000's) | Net (e) | Total (f) | Net Assets (a) | Rate (b) | |||||||||||||||||||||||||
| Class A | 4/30/2006 | 8.32 | % | $ | 32,293 | 1.55 | % | 1.62 | % | 1.98 | % | 21 | % | ||||||||||||||||||
| 10/31/2005 | 7.79 | 32,934 | 1.55 | 1.59 | 2.03 | 57 | |||||||||||||||||||||||||
| 10/31/2004 | 6.99 | 37,393 | 1.55 | 1.63 | 1.50 | 122 | |||||||||||||||||||||||||
| 10/31/2003 | 21.04 | 11,832 | 1.55 | 2.20 | 1.75 | 50 | |||||||||||||||||||||||||
| 10/31/2002 | (13.20 | ) | 11,020 | 1.55 | 1.89 | 1.56 | 82 | ||||||||||||||||||||||||
| 10/31/2001 | (2.13 | ) | 13,880 | 1.55 | 1.95 | 2.04 | 50 | ||||||||||||||||||||||||
| Class B | 4/30/2006 | 8.01 | 22,725 | 2.20 | 2.30 | 1.33 | 21 | ||||||||||||||||||||||||
| 10/31/2005 | 7.13 | 24,072 | 2.20 | 2.27 | 1.39 | 57 | |||||||||||||||||||||||||
| 10/31/2004 | 6.23 | 29,409 | 2.20 | 2.30 | 0.81 | 122 | |||||||||||||||||||||||||
| 10/31/2003 | 19.98 | 13,744 | 2.20 | 2.85 | 1.10 | 50 | |||||||||||||||||||||||||
| 10/31/2002 | (13.72 | ) | 12,038 | 2.20 | 2.54 | 0.91 | 82 | ||||||||||||||||||||||||
| 10/31/2001 | (2.74 | ) | 16,180 | 2.20 | 2.60 | 1.39 | 50 | ||||||||||||||||||||||||
| Class C | 4/30/2006 | 8.03 | 11,698 | 2.20 | 2.20 | 1.33 | 21 | ||||||||||||||||||||||||
| 10/31/2005 | 7.18 | 11,926 | 2.16 | 2.16 | 1.43 | 57 | |||||||||||||||||||||||||
| 10/31/2004 | 6.31 | 14,285 | 2.20 | 2.39 | 0.78 | 122 | |||||||||||||||||||||||||
| 10/31/2003 | 19.73 | 530 | 2.20 | 2.86 | 1.10 | 50 | |||||||||||||||||||||||||
NOTES TO FINANCIAL HIGHLIGHTS
(a) Annualized.
(b) Not annualized.
(c) Total Return has been calculated for the applicable period without deduction of a sales load, if any, on an initial purchase. Not annualized.
(d) Per share information is calculated based on average number of shares outstanding.
(e) Ratio of Net Expenses to Average Net Assets is net of fee waivers and reimbursements by the investment adviser, if any (see note 2).
(f) Ratio of Total Expenses to Average Net Assets includes all expenses before fee waivers and reimbursements by the investment adviser.
(g) The inception date for the Fund's offering of share Class C was November 11, 2002.
The notes to the financial statements are an integral part of this report.
Transamerica IDEX Mutual Funds
Semi-Annual Report 2006
9
TA IDEX Transamerica Value Balanced
NOTES TO FINANCIAL STATEMENTS
At April 30, 2006
(all amounts in thousands)
(unaudited)
NOTE 1. ORGANIZATION AND SIGNIFICANT ACCOUNTING POLICIES
Transamerica IDEX Mutual Funds is an open-end management investment company registered under the Investment Company Act of 1940, as amended (the "1940 Act").
In the normal course of business, TA IDEX Transamerica Value Balanced (the "Fund") enters into contracts that contain a variety of representations that provide general indemnifications. The Fund's maximum exposure under these arrangements is unknown, as this would involve future claims that may be made against the Fund and/or its affiliates that have not yet occurred. However, based on experience, the Fund expects the risk of loss to be remote.
This report should be read in conjunction with the current Fund prospectus, which contains more complete information about the Fund.
In preparing the Fund's financial statements in accordance with accounting principles generally accepted in the United States of America ("GAAP"), estimates or assumptions (which could differ from actual results) may be used that affect reported amounts and disclosures. The following is a summary of significant accounting policies followed by the Fund.
Multiple class operations, income and expenses: The Fund currently offers four classes of shares, Class A, Class B, Class C, and Class I, each with a public offering price that reflects different sales charges, if any, and expense levels. Class I shares commenced operations on November 15, 2005. Class I is only available for investment to certain affiliated asset allocation funds. Class I is currently un-invested. Class B shares will convert to Class A shares eight years after purchase. Income, non-class specific expenses and realized and unrealized gains and losses, are allocated daily to each class, based upon the value of shares outstanding method as permitted under Rule 18f-3 of the 1940 Act. Each class bears its own specific expenses as well as a portion of general, common expenses.
Security valuations: The Fund values its investments at the close of the New York Stock Exchange ("NYSE"), normally 4 p.m. ET, each day the NYSE is open for business. Fund investments are valued at the last sale price or closing price on the day of valuation taken from the primary exchange where the security is principally traded.
Securities traded in the over-the-counter market and listed securities for which no sale was reported on that date are valued at the last quoted bid price.
Debt securities are valued based on a price quotation or other equivalent indication of value supplied by an exchange, a pricing service or a major market maker; however, those that mature in sixty days or less are valued at amortized cost, which approximates market.
Other securities for which quotations are not readily available or whose values have been determined to be unreliable are valued at fair market value as determined in good faith by the Fund's Administrative Valuation Committee, under the supervision of the Board's Valuation Committee, using guidelines adopted by the Board of Trustees.
Cash: The Fund may leave cash overnight in its cash account with the custodian, Investors Bank & Trust Company ("IBT"). IBT has been contracted on behalf of the Fund to invest the excess cash into a savings account, which at April 30, 2006, was paying an interest rate of 3.24%.
Commission recapture: The sub-adviser, to the extent consistent with the best execution and usual commission rate policies and practices, may place security transactions of the Fund with broker/dealers with which Transamerica IDEX Mutual Funds has established a Commission Recapture Program. A Commission Recapture Program is any arrangement under which a broker/dealer applies a portion of the commissions received by such broker/dealer on the security transactions to the Fund. In no event will commissions paid by the Fund be used to pay expenses that would otherwise be borne by any other funds within Transamerica IDEX Mutual Funds, or by any other party.
Recaptured commissions during the six months ended April 30, 2006, of $5 are included in net realized gains in the Statement of Operations.
Real Estate Investment Trusts ("REITs"): There are certain additional risks involved in investing in REITs. These include, but are not limited to, economic conditions, changes in zoning laws, real estate values, property taxes and interest rates.
Dividend income is recorded at management's estimate of the income included in distributions from the REIT investments. Distributions received in excess of the estimated amount are recorded as a reduction of the cost of investments. The actual amounts of income, return of capital and capital gains are only determined by each REIT after the fiscal year end and may differ from the estimated amounts.
Security transactions and investment income: Security transactions are recorded on the trade date. Security gains and losses are calculated on the specific identification basis. Dividend income, if any, is recorded on the ex-dividend date or, in the case of foreign securities, as soon as the Fund is informed of the ex-dividend date. Interest income, including accretion of discounts and amortization of premiums, is recorded on the accrual basis commencing on the settlement date.
Option contracts: The Fund may enter into options contracts to manage exposure to market fluctuations. Options are valued at the average of the bid and ask ("Mean Quote") established each day at the close of the board of trade or exchange on which they are traded. The primary risks associated with options are imperfect correlation between the change in value of the securities held and the prices of the
Transamerica IDEX Mutual Funds
Semi-Annual Report 2006
10
TA IDEX Transamerica Value Balanced
NOTES TO FINANCIAL STATEMENTS (continued)
At April 30, 2006
(all amounts in thousands)
(unaudited)
NOTE 1.–(continued)
options contracts; the possibility of an illiquid market and inability of the counterparty to meet the contracts terms. When the Fund writes a covered call or put option, an amount equal to the premium received by the Fund is included in the Fund's Statement of Assets and Liabilities as an asset and as an equivalent liability. Options are marked-to-market daily to reflect the current value of the option written.
The underlying face amounts of open option contracts at April 30, 2006 are listed in the Schedule of Investments.
Transactions in written call and put options were as follows:
| Premium | Contracts* | ||||||||||
| Beginning Balance October 31, 2005 | $ | 442 | 2,716 | ||||||||
| Sales | 580 | 4,872 | |||||||||
| Closing Buys | (33 | ) | �� | (130 | ) | ||||||
| Expirations | (343 | ) | (2,191 | ) | |||||||
| Exercised | (114 | ) | (675 | ) | |||||||
| Balance at April 30, 2006 | $ | 532 | 4,592 | ||||||||
* Contracts not in thousands
Redemption fees: A short-term trading redemption fee may be assessed on any Fund shares in a fund account that are sold during the first five (5) NYSE trading days following their purchase date. This redemption fee will equal 2% of the amount redeemed and shares held the longest will be treated as being redeemed first and shares held the shortest as being redeemed last. For the six months ended April 30, 2006, the Fund received less than $1 in redemption fees.
Dividend distributions: Distributions to shareholders are recorded on the ex-dividend date and are determined in accordance with Federal income tax regulations which may differ from GAAP.
NOTE 2. RELATED PARTY TRANSACTIONS
Transamerica Fund Advisors, Inc. ("TFAI") is the Fund's investment adviser. Transamerica Fund Services, Inc. ("TFS") is the Fund's administrator and transfer agent. AFSG Securities Corp. ("AFSG") is the Fund's distributor/principal underwriter. TFAI, TFS, and AFSG are affiliates of AEGON, NV, a Netherlands corporation.
Transamerica Investment Management, LLC is both an affiliate of the Fund and a sub-adviser to the Fund.
Certain officers and trustees of the Fund are also officers and/or directors of TFAI, TFS and AFSG.
Investment advisory fees: The Fund pays management fees to TFAI based on average daily net assets ("ANA") at the following breakpoints:
0.75% of the first $500 million of ANA
0.65% of the next $500 million of ANA
0.60% of ANA over $1 billion
TFAI has contractually agreed to waive its advisory fee and will reimburse the Fund to the extent that operating expenses, excluding 12b-1 fees, exceed the following stated annual limit:
1.20% Expense Limit
Distribution and service fees: The Fund has a 12b-1 distribution plan under the 1940 Act pursuant to which an annual fee, based on average daily net assets, is paid to the distributor for various disbursements such as broker-dealer account servicing fees and other promotional expenses of the Fund. The Fund is authorized under the 12b-1 plan to pay fees on each class up to the following limits:
| Class A | 0.35 | % | |||||
| Class B | 1.00 | % | |||||
| Class C | 1.00 | % | |||||
| Class I | N/A | ||||||
In the case the Fund or a class of shares of the Fund is closed to new investors or investments, the Fund is authorized to pay 12b-1 fees for past sales and distribution efforts and present and past investor services.
Underwriter commissions relate to front-end sales charges imposed for Class A shares and contingent deferred sales charges from Classes B, C, and certain A share redemptions. For the six months ended April 30, 2006, the underwriter commissions were as follows:
| Received by Underwriter | $ | 17 | |||||
| Retained by Underwriter | 3 | ||||||
| Contingent Deferred Sales Charge | 17 | ||||||
Administrative services: The Fund has entered into an agreement with TFS for financial and legal fund administration services. The Fund pays TFS an annual fee of 0.02% of ANA. The Legal fees on the Statement of Operations are fees paid to external legal counsel.
Transfer agent fees: The Fund pays TFS an annual per-account charge for each open and closed account. The Fund paid TFS $108 for the six months ended April 30, 2006.
Deferred compensation plan: Each eligible independent Fund Trustee may elect to participate in a non-qualified deferred compensation plan maintained by Transamerica IDEX Mutual Funds (the "Plan"). Under the Plan, such Trustees may defer payment of all or a portion of their total fees earned as a Fund Trustee. Each Trustee who is a participant in the Plan may elect that the earnings, losses or gains credited to his or her
Transamerica IDEX Mutual Funds
Semi-Annual Report 2006
11
TA IDEX Transamerica Value Balanced
NOTES TO FINANCIAL STATEMENTS (continued)
At April 30, 2006
(all amounts in thousands)
(unaudited)
NOTE 2.–(continued)
deferred fee amounts be determined based on a deemed investment in any series of Transamerica IDEX Mutual Funds, including the Fund. The right of a participant to receive a distribution from the Plan of the deferred fees is an unsecured claim against the general assets of all series of Transamerica IDEX Mutual Funds. The pro rata liability to the Fund of all deferred fees in the Plan amounted, as of April 30, 2006, to $15.
NOTE 3. INVESTMENT TRANSACTIONS
The cost of securities purchased and proceeds from securities sold (excluding short-term securities) for the six months ended April 30, 2006 were as follows:
| Purchases of securities: | |||||||
| Long-Term | $ | 5,511 | |||||
| U.S. Government | 8,101 | ||||||
| Proceeds from maturities and sales of securities: | |||||||
| Long-Term | 11,173 | ||||||
| U.S. Government | 7,507 | ||||||
NOTE 4. FEDERAL INCOME TAX MATTERS
The Fund has not made any provision for federal income or excise taxes due to its policy to distribute all of its taxable income and capital gains to its shareholders and otherwise qualify as a regulated investment company under Subchapter M of the Internal Revenue Code. Income and capital gain distributions are determined in accordance with income tax regulations, which may differ from GAAP. These differences are primarily due to differing treatment for items including, but not limited to, wash sales, excess distributions and capital loss carryforwards.
The capital loss carryforward is available to offset future realized capital gains through the period listed:
| Capital Loss Carryforward | Available through | ||||||
| $ | 2,658 | October 31, 2010 | |||||
NOTE 5. REGULATORY PROCEEDINGS
There continues to be significant federal and state regulatory activity relating to financial services companies, particularly mutual fund companies and their investment advisers. As part of an ongoing investigation regarding potential market timing, recordkeeping and trading compliance issues and matters affecting the Fund's investment adviser, TFAI, and certain affiliates and former employees of TFAI, the SEC staff has indicated that it is likely to take some action against TFAI and certain of its affiliates at the conclusion of the investigation. The potential timing and the scope of any such action is difficult to predict. Although the impact of any action brought against TFAI and/or its affiliates is difficult to assess at the present time, the Fund currently believes that the likelihood that any such action will have a material adverse impact on it is remote. It is important to note that the Fund is not aware of any allegation of wrongdoing against it and its Board at the time this semi-annual report is printed. Although it is not anticipated that these developments will have an adverse impact on the Fund, there can be no assurance at this time. TFAI and its affiliates are actively working with the SEC in regard to this matter; however, the exact resolution cannot be determined at this time. TFAI will take such actions that it deems necessary or appropriate to continue providing management services to the Fund and to bring all matters to an appropriate conclusion.
TFAI and/or its affiliates, and not the Fund, will bear the costs regarding these regulatory matters.
Transamerica IDEX Mutual Funds
Semi-Annual Report 2006
12
TA IDEX Transamerica Value Balanced
INVESTMENT ADVISORY AND SUB-ADVISORY AGREEMENTS – REVIEW AND RENEWAL (unaudited)
At a meeting of the Board of Trustees of Transamerica IDEX Mutual Funds ("TA IDEX") held on November 2, 2005, the Board reviewed and considered the Investment Advisory Agreement between TA IDEX Transamerica Value Balanced (the "Fund") and Transamerica Fund Advisors, Inc. ("TFAI"), as well as the Investment Sub-Advisory Agreement of the Fund between TFAI and Transamerica Investment Management, LLC (the "Sub-Adviser"), to determine whether the agreements should be renewed for a one-year period. Following their review and consideration, the Trustees determined that the Investment Advisory Agreement and the Investment Sub-Advisory Agreement will enable shareholders of the Fund to obtain high quality services at a cost that is appropriate, reasonable, and in the best interests of its shareholders. The Board, including the independent members of the Board, unanimously approved the renewal of the Investment Advisory Agreement and the I nvestment Sub-Advisory Agreement. In reaching their decision, the Trustees requested and obtained from TFAI and the Sub-Adviser such information as they deemed reasonably necessary to evaluate the proposed agreements. The Trustees also carefully considered the information that they had received throughout the year from TFAI and the Sub-Adviser (such as in-person presentations by the Sub-Adviser) as part of their regular oversight of the Fund, as well as: comparative fee, expense and performance information prepared by Lipper Inc. ("Lipper"), independent providers of mutual fund performance, fee and expense information, and profitability data. In considering the proposed continuation of the Investment Advisory Agreement and the Investment Sub-Advisory Agreement, the Trustees evaluated a number of considerations that they believe, in light of the legal advice furnished to them by TA IDEX counsel and independent legal counsel and their own business judgment, to be relevant. They based their decisions on the fol lowing considerations, among others, although they did not identify any consideration or particular information that was controlling of their decisions:
The nature, extent and quality of the advisory service to be provided. The Board considered the nature and quality of the services provided by TFAI and the Sub-Adviser to the Fund in the past, as well as the services anticipated to be provided in the future. The Board concluded that TFAI and the Sub-Adviser are capable of providing high quality services to the Fund, as indicated by the nature and quality of services provided in the past, TFAI's and the Sub-Adviser's management capabilities demonstrated with respect to the funds they manage, including the Fund, and the experience, capability and integrity of TFAI's senior management, the financial resources of TFAI and the Sub-Adviser, TFAI's management oversight process and the professional qualifications and experience of the Sub-Adviser's portfolio management team. The Trustees also concluded that T FAI and the Sub-Adviser proposed to provide investment and related services that were of the same quality and quantity as services provided to the Fund in the past, and that these services are appropriate in scope and extent in light of the Fund's operations, the competitive landscape of the investment company business and investor needs, and that TFAI's and the Sub-Adviser's obligations will remain substantially the same.
The investment performance of the Fund. The Board examined both the short-term and longer-term performance of the Fund, including relative performance against a benchmark securities index and a peer group of comparable mutual funds as prepared by Lipper, for various trailing periods ended June 30, 2005. The Trustees concluded that TFAI and the Sub-Adviser had generally achieved competitive investment performance, noting that although the performance of the Fund has been at median relative to its peers over the past one- and two-year periods, its performance has been above median relative to its peers over the past three- and five-year periods, and superior or competitive to the benchmark index over the past one-, two-, three- and five-year periods. On the basis of the Trustees' assessment of the nature, extent and quality of advisory services to be pr ovided or procured by TFAI and the Sub-Adviser, the Trustees concluded that TFAI and the Sub-Adviser are capable of generating a level of investment performance that is appropriate in light of the Fund's investment objective, policies and strategies and competitive with many other investment companies, and also determined that TFAI's and the Sub-Adviser's performance records indicate that their continued management is likely to benefit the Fund and its shareholders.
The cost of advisory services provided and the level of profitability. The Board reviewed profitability information regarding TFAI's costs of procuring portfolio management services, as well as the costs of provision of administration, transfer agency, fund accounting and other services, to the Fund and to TA IDEX as a whole by TFAI and its affiliates. The Trustees reviewed data from Lipper that compared the Fund's management fees (including management fees at various asset levels), other fees and expenses (including total expenses including and excluding 12b-1 distribution and service fees) and portfolio turnover rate against a peer group of comparable mutual funds. Based on such information, the Trustees determined that the management fees were higher than many peer funds, although the overall expense ratio of the Fund generally was consistent with industry averages. In addition, on the basis of the Board's review of the management fees to be charged by TFAI for investment advisory and related services, TFAI profitability information (derived from TFAI's audited financial statements), TFAI's estimated management income resulting from its management of the Fund, the estimated margin of the Sub-Adviser, as well as the entirety of TFAI's and its affiliates' service relationship with TA IDEX, the Board concluded that the level of investment management fees and other service fees, as well as TFAI's and the Sub-Adviser's
Transamerica IDEX Mutual Funds
Semi-Annual Report 2006
13
TA IDEX Transamerica Value Balanced (continued)
profitability, are appropriate in light of the services provided, the management fees and overall expense ratios of comparable investment companies and the anticipated profitability of the relationship between the Fund, TFAI and its affiliates, and the Sub-Adviser.
Whether fee levels reflect economies of scale and the extent to which economies of scale would be realized as the Fund grows. The Board concluded that the inclusion of asset-based breakpoints in the Fund's advisory fee schedule appropriately benefits investors by realizing economies of scale in the form of lower management fees as the level of assets grows. In addition, the Board concluded that the Fund's management fees appropriately reflect the Fund's current size, the current economic environment for TFAI, the competitive nature of the investment company market, and TFAI's pricing strategy. The Trustees also concluded that they will have the opportunity to periodically reexamine whether the Fund has achieved economies of scale, and the appropriateness of management fees payable to TFAI and fees payable by TFAI to the Sub-Adviser, in the future.
Benefits (such as soft dollars) to TFAI, its affiliates, or the Sub-Adviser from their relationship with the Fund. The Board concluded that other benefits derived by TFAI, its affiliates, and the Sub-Adviser from their relationship with the Fund, including "soft dollar" benefits (if any) in connection with brokerage transactions, sales charges and distribution/service fees (to the extent applicable) are reasonable and fair, and are consistent with industry practice and the best interests of the Fund and its shareholders. In this regard, the Board noted that TFAI does not realize "soft dollar" benefits from its relationship with the Fund, and that the Sub-Adviser is participating in a brokerage program pursuant to which a portion of brokerage commissions paid by the Fund is recaptured for the benefit of the Fund and its shareholders, thus limiting the amount of "soft-dollar" arrangements the Sub-Adviser may engage in with respect to the Fund's brokerage transactions. In addition, the Trustees determined that the administration, transfer agency, fund accounting and other fees paid by the Fund to affiliates of TFAI are reasonable, fair and in the best interests of shareholders in light of the nature and quality of the services provided, the associated costs to these affiliates of providing the services, the impact of the costs of such services on the Fund's overall operating expenses, and the necessity of the services for the Fund's operations.
Other considerations. The Board determined that TFAI had made a substantial commitment to the recruitment and retention of high quality personnel, and maintained the financial, compliance and operational resources reasonably necessary to manage the Fund in a professional manner that is consistent with the best interests of the Fund and its shareholders. In this regard, the Trustees favorably considered the procedures and policies in place by TFAI to enforce compliance with applicable laws and regulations and oversee the portfolio management activities of the Sub-Adviser. The Trustees also determined that TFAI had made a significant entrepreneurial commitment to the management and success of the Fund, reflected by TFAI's expense limitation and fee waiver arrangement with the Fund, which has resulted, and may continue to result, in TFAI waiving advisory fees for the benefit of shareholders.
Transamerica IDEX Mutual Funds
Semi-Annual Report 2006
14

Class I Funds
Semi-Annual Report
April 30, 2006
TA IDEX AllianceBernstein International Value
UNDERSTANDING YOUR FUND’S EXPENSES
(unaudited)
SHAREHOLDER EXPENSES
Fund shareholders may incur ongoing costs, including management fees, 12b-1 distribution and service fees, and other fund expenses. Shares of the Fund currently are sold only to certain Transamerica IDEX Mutual Funds and AEGON/Transamerica Series Trust (an affiliate of Transamerica IDEX Mutual Funds) asset allocation funds at net asset value, without any transaction costs.
The following Example is intended to help you understand your ongoing costs (in dollars and cents) of investing in the Fund and to compare these costs with the ongoing costs of investing in other funds.
The Example is based on an investment of $1,000 invested at December 6, 2005 and held for the entire period until April 30, 2006.
ACTUAL EXPENSES
The first line in the table below provides information about actual account values and actual expenses. You may use the information in this line, together with the amount you invested, to estimate the expenses that you paid over the period. Simply divide your account value by $1,000 (for example, an $8,600 account value divided by $1,000 = 8.6), then multiply the result by the number in the first line of your Fund under the heading entitled “Expenses Paid During Period” to estimate the expenses you paid on your account during this period.
HYPOTHETICAL EXAMPLE FOR COMPARISON PURPOSES
The second line in the table below provides information about hypothetical account values and hypothetical expenses based on the Fund’s actual expense ratio and an assumed rate of return of 5% per year before expenses, which is not the Fund’s actual return. The hypothetical account values and expenses may not be used to estimate the actual ending account balance or expenses you paid for the period. You may use this information to compare the ongoing costs of investing in your Fund and other funds. To do so, compare this 5% hypothetical example with the 5% hypothetical examples that appear in the shareholder reports of the other funds.
|
| Beginning |
| Ending |
| Annualized |
| Expenses Paid |
| |||
Class I |
|
|
|
|
|
|
|
|
| |||
Actual |
| $ | 1,000.00 |
| $ | 1,191.60 |
| 1.01 | % | $ | 4.40 |
|
Hypothetical(b) |
| 1,000.00 |
| 1,015.85 |
| 1.01 | % | 4.04 |
| |||
(a) Expenses are calculated using the Fund’s annualized expense ratio (as disclosed in the table), multiplied by the average account value for the period, multiplied by number of days in the period (145 days), and divided by the number of days in the year (365 days).
(b) 5% return per year before expenses.
2
TA IDEX AllianceBernstein International Value
TABULAR PRESENTATION OF SCHEDULE OF INVESTMENTS
By Region
At April 30, 2006
Europe |
| 61.8 | % |
North America |
| 4.5 | % |
Other |
| 0.5 | % |
Pacific Rim |
| 33.2 | % |
|
| 100.0 | % |
This chart shows the percentage breakdown by region of the Fund’s total investment securities.
3
TA IDEX AllianceBernstein International Value
SCHEDULE OF INVESTMENTS
At April 30, 2006
(all amounts except share amounts in thousands)
(unaudited)
|
|
|
| Shares |
| Value |
|
COMMON STOCKS (95.7%) |
|
|
|
|
|
|
|
Australia (0.7%) |
|
|
|
|
|
|
|
Macquarie Airports |
|
|
| 601,300 |
| 1,496 |
|
Austria (1.5%) |
|
|
|
|
|
|
|
OMV AG |
|
|
| 22,900 |
| 1,590 |
|
Voestalpine AG |
|
|
| 12,200 |
| 1,778 |
|
Belgium (0.8%) |
|
|
|
|
|
|
|
KBC Groupe |
| (a) |
| 15,400 |
| 1,784 |
|
Bermuda (0.5%) |
|
|
|
|
|
|
|
Kerry Properties, Ltd. |
|
|
| 148,500 |
| 526 |
|
Orient Overseas International, Ltd. |
|
|
| 126,000 |
| 474 |
|
Canada (3.6%) |
|
|
|
|
|
|
|
Celestica, Inc. |
| ‡ |
| 1,600 |
| 18 |
|
Husky Energy, Inc. |
|
|
| 22,800 |
| 1,339 |
|
ING Canada, Inc. |
|
|
| 8,400 |
| 451 |
|
IPSCO, Inc. |
|
|
| 15,400 |
| 1,586 |
|
Metro, Inc.-Class A |
|
|
| 45,600 |
| 1,329 |
|
Nexen, Inc. |
|
|
| 23,900 |
| 1,393 |
|
Teck CominCo, Ltd.-Class B |
|
|
| 23,400 |
| 1,610 |
|
Finland (0.7%) |
|
|
|
|
|
|
|
Sampo Oyj |
|
|
| 71,900 |
| 1,482 |
|
France (11.7%) |
|
|
|
|
|
|
|
Assurances Generales de France |
|
|
| 22,200 |
| 2,802 |
|
BNP Paribas |
|
|
| 22,100 |
| 2,085 |
|
BNP Paribas Rights |
|
|
| 620 |
| 56 |
|
Cap Gemini SA |
| ‡ |
| 17,400 |
| 930 |
|
Credit Agricole SA |
|
|
| 58,060 |
| 2,336 |
|
Michelin (C.G.D.E.)-Class B |
|
|
| 18,800 |
| 1,355 |
|
Renault SA |
|
|
| 41,600 |
| 4,821 |
|
Sanofi-Aventis |
|
|
| 35,600 |
| 3,352 |
|
Societe Generale-Class A |
|
|
| 20,200 |
| 3,081 |
|
Total SA |
|
|
| 16,100 |
| 4,445 |
|
Germany (8.6%) |
|
|
|
|
|
|
|
Allianz AG |
|
|
| 11,200 |
| 1,872 |
|
Continental AG |
|
|
| 31,300 |
| 3,721 |
|
E.ON AG |
| ‡ |
| 24,500 |
| 2,979 |
|
Epcos AG |
| ‡ |
| 30,200 |
| 406 |
|
Fresenius Medical Care AG |
|
|
| 6,500 |
| 779 |
|
Man AG |
|
|
| 32,400 |
| 2,452 |
|
Muenchener Rueckversicherungs AG |
|
|
| 21,600 |
| 3,056 |
|
RWE AG |
| † |
| 27,350 |
| 2,367 |
|
TUI AG |
|
|
| 52,300 |
| 1,112 |
|
Hong Kong (0.3%) |
|
|
|
|
|
|
|
Sino Land Co. |
|
|
| 350,400 |
| 583 |
|
Italy (2.9%) |
|
|
|
|
|
|
|
Banco Popolare di Verona e Novara SCRL |
|
|
| 47,900 |
| 1,346 |
|
Buzzi Unicem SpA |
|
|
| 50,500 |
| 1,291 |
|
ENI-Ente Nazionale Idrocarburi SpA |
|
|
| 111,100 |
| 3,390 |
|
Recordati SpA |
|
|
| 25,100 |
| 195 |
|
Japan (29.2%) |
|
|
|
|
|
|
|
Canon, Inc. |
|
|
| 48,800 |
| 3,722 |
|
Cosmo Oil Co., Ltd. |
|
|
| 84,000 |
| 482 |
|
East Japan Railway Co. |
|
|
| 263 |
| 2,047 |
|
EDION Corp. |
|
|
| 69,500 |
| 1,677 |
|
Hitachi, Ltd. |
|
|
| 146,000 |
| 1,083 |
|
Honda Motor Co., Ltd. |
|
|
| 24,300 |
| 1,721 |
|
Isuzu Motors, Ltd. |
|
|
| 395,000 |
| 1,422 |
|
Itochu Corp. |
|
|
| 198,000 |
| 1,793 |
|
Japan Tobacco, Inc. |
|
|
| 755 |
| 3,028 |
|
JFE Holdings, Inc. |
|
|
| 82,600 |
| 3,197 |
|
Kobe Steel, Ltd. |
|
|
| 387,000 |
| 1,311 |
|
Kyocera Corp. |
|
|
| 15,000 |
| 1,396 |
|
Leopalace21 Corp. |
|
|
| 36,300 |
| 1,411 |
|
4
TA IDEX AllianceBernstein International Value
SCHEDULE OF INVESTMENTS
At April 30, 2006
(all amounts except share amounts in thousands)
(unaudited)
Mitsubishi Corp. |
|
|
| 83,200 |
| 2,007 |
|
Mitsubishi Tokyo Financial Group, Inc. |
|
|
| 224 |
| 3,511 |
|
Mitsui & Co., Ltd. |
|
|
| 131,000 |
| 1,974 |
|
Mitsui Chemicals, Inc. |
|
|
| 228,000 |
| 1,645 |
|
Mitsui O.S.K. Lines, Ltd. |
|
|
| 320,000 |
| 2,284 |
|
Nippon Mining Holdings, Inc. |
|
|
| 156,500 |
| 1,443 |
|
Nippon Telegraph & Telephone Corp. |
|
|
| 433 |
| 1,934 |
|
Nissan Motor Co., Ltd. |
|
|
| 164,100 |
| 2,151 |
|
Oki Electric Industry Co., Ltd. |
|
|
| 309,000 |
| 952 |
|
ORIX Corp. |
| (a) |
| 11,960 |
| 3,582 |
|
Rengo Co., Ltd. |
|
|
| 69,000 |
| 543 |
|
Sega Sammy Holdings, Inc. |
|
|
| 29,500 |
| 1,173 |
|
Sumitomo Heavy Industries, Ltd. |
|
|
| 199,000 |
| 2,091 |
|
Sumitomo Metal Industries, Ltd. |
|
|
| 279,000 |
| 1,173 |
|
Sumitomo Mitsui Financial Group, Inc. |
|
|
| 348 |
| 3,809 |
|
Tokyo Electric Power Co. (The), Inc. |
|
|
| 82,900 |
| 2,123 |
|
Tokyo Gas Co., Ltd. |
|
|
| 297,000 |
| 1,433 |
|
Toyota Motor Corp. |
|
|
| 87,600 |
| 5,109 |
|
Luxembourg (1.2%) |
|
|
|
|
|
|
|
Arcelor |
|
|
| 34,200 |
| 1,404 |
|
SES GLOBAL |
|
|
| 74,000 |
| 1,211 |
|
Netherlands (7.1%) |
|
|
|
|
|
|
|
ABN AMRO Holding NV |
|
|
| 76,900 |
| 2,295 |
|
European Aeronautic Defense and Space Co. |
|
|
| 54,450 |
| 2,145 |
|
ING Groep NV |
|
|
| 130,100 |
| 5,287 |
|
Koninklijke Philips Electronics NV |
|
|
| 50,590 |
| 1,743 |
|
Royal Dutch Shell PLC -Class A |
|
|
| 75,600 |
| 2,588 |
|
Royal KPN NV |
|
|
| 107,100 |
| 1,256 |
|
Singapore (2.0%) |
|
|
|
|
|
|
|
Flextronics International, Ltd. |
| ‡ |
| 143,500 |
| 1,630 |
|
Neptune Orient Lines, Ltd. |
|
|
| 212,000 |
| 306 |
|
Singapore Telecommunications, Ltd. |
|
|
| 1,403,000 |
| 2,422 |
|
Spain (1.4%) |
|
|
|
|
|
|
|
Altadis SA |
|
|
| 4,400 |
| 208 |
|
Repsol YPF SA |
|
|
| 94,400 |
| 2,816 |
|
Switzerland (3.1%) |
|
|
|
|
|
|
|
Credit Suisse Group |
|
|
| 55,100 |
| 3,451 |
|
Novartis AG |
|
|
| 14,240 |
| 815 |
|
Xstrata PLC |
|
|
| 70,370 |
| 2,538 |
|
United Kingdom (20.4%) |
|
|
|
|
|
|
|
AstraZeneca PLC |
|
|
| 60,000 |
| 3,304 |
|
Aviva PLC |
|
|
| 206,800 |
| 3,011 |
|
BAE Systems PLC |
|
|
| 301,600 |
| 2,289 |
|
Barclays PLC |
|
|
| 277,800 |
| 3,459 |
|
BHP Billiton PLC |
|
|
| 112,500 |
| 2,309 |
|
BP PLC |
|
|
| 204,700 |
| 2,517 |
|
British American Tobacco PLC |
|
|
| 147,400 |
| 3,756 |
|
Corus Group PLC |
|
|
| 726,300 |
| 1,116 |
|
Greene King PLC |
|
|
| 60,200 |
| 795 |
|
HBOS PLC |
|
|
| 174,930 |
| 3,060 |
|
International Power PLC |
| ‡ |
| 292,300 |
| 1,582 |
|
J Sainsbury PLC |
|
|
| 304,800 |
| 1,852 |
|
Lloyds TSB Group PLC |
|
|
| 193,600 |
| 1,877 |
|
Mitchells & Butlers PLC |
|
|
| 170,600 |
| 1,526 |
|
Royal & Sun Alliance Insurance Group PLC |
|
|
| 415,200 |
| 1,041 |
|
Royal Bank of Scotland Group PLC |
|
|
| 130,000 |
| 4,232 |
|
SABMiller PLC |
|
|
| 52,300 |
| 1,100 |
|
Vodafone Group PLC |
|
|
| 1,949,000 |
| 4,588 |
|
Wolverhampton & Dudley Brew PLC |
|
|
| 35,900 |
| 848 |
|
Total Common Stocks (cost: $180,870) |
|
|
|
|
| 207,272 |
|
5
TA IDEX AllianceBernstein International Value
SCHEDULE OF INVESTMENTS
At April 30, 2006
(all amounts except share amounts in thousands)
(unaudited)
|
|
|
| Principal |
| Value |
|
SECURITY LENDING COLLATERAL (1.2%) |
|
|
|
|
|
|
|
Debt (1.1%) |
|
|
|
|
|
|
|
Bank Notes (0.1%) |
|
|
|
|
|
|
|
Bank of America |
|
|
|
|
|
|
|
4.81%, due 06/07/2006 |
| * |
| 81 |
| 81 |
|
4.81%, due 08/10/2006 |
| * |
| 79 |
| 79 |
|
Bear Stearns & Co. |
|
|
|
|
|
|
|
5.01%, due 06/06/2006 |
| * |
| 31 |
| 31 |
|
5.01%, due 09/07/2006 |
| * |
| 94 |
| 94 |
|
Certificates of Deposit (0.1%) |
|
|
|
|
|
|
|
Halifax Bank of Scotland |
|
|
|
|
|
|
|
4.78%, due 06/06/2006 |
| * |
| 79 |
| 79 |
|
Rabobank Nederland |
|
|
|
|
|
|
|
4.87%, due 05/31/2006 |
| * |
| 79 |
| 79 |
|
Commercial Paper (0.1%) |
|
|
|
|
|
|
|
Banco Santander Central Hispano SA |
|
|
|
|
|
|
|
4.77%, due 05/02/2006 |
|
|
| 47 |
| 47 |
|
Sheffield Receivables Corp.-144A |
|
|
|
|
|
|
|
4.81%, due 05/03/2006 |
|
|
| 79 |
| 79 |
|
Euro Dollar Overnight (0.2%) |
|
|
|
|
|
|
|
Bank of Montreal |
|
|
|
|
|
|
|
4.77%, due 05/02/2006 |
|
|
| 63 |
| 63 |
|
Dexia Group |
|
|
|
|
|
|
|
4.78%, due 05/04/2006 |
|
|
| 79 |
| 79 |
|
Fortis Bank |
|
|
|
|
|
|
|
4.77%, due 05/01/2006 |
|
|
| 31 |
| 31 |
|
Royal Bank of Canada |
|
|
|
|
|
|
|
4.77%, due 05/01/2006 |
|
|
| 110 |
| 110 |
|
Royal Bank of Scotland |
|
|
|
|
|
|
|
4.75%, due 05/03/2006 |
|
|
| 79 |
| 79 |
|
Svenska Handlesbanken |
|
|
|
|
|
|
|
4.82%, due 05/01/2006 |
|
|
| 60 |
| 60 |
|
Euro Dollar Terms (0.3%) |
|
|
|
|
|
|
|
BancoBilbao Vizcaya Argentaria SA |
|
|
|
|
|
|
|
4.95%, due 06/20/2006 |
|
|
| 63 |
| 63 |
|
Bank of the West |
|
|
|
|
|
|
|
4.94%, due 06/16/2006 |
|
|
| 63 |
| 63 |
|
Barclays |
|
|
|
|
|
|
|
4.79%, due 05/10/2006 |
|
|
| 94 |
| 94 |
|
4.77%, due 05/16/2006 |
|
|
| 31 |
| 31 |
|
Canadian Imperial Bank of Commerce |
|
|
|
|
|
|
|
4.97%, due 06/23/2006 |
|
|
| 47 |
| 47 |
|
Credit Suisse First Boston Corp. |
|
|
|
|
|
|
|
4.73%, due 05/08/2006 |
|
|
| 47 |
| 47 |
|
Fortis Bank |
|
|
|
|
|
|
|
4.83%, due 05/08/2006 |
|
|
| 31 |
| 31 |
|
Lloyds TSB Bank |
|
|
|
|
|
|
|
4.81%, due 05/11/2006 |
|
|
| 47 |
| 47 |
|
Royal Bank of Scotland |
|
|
|
|
|
|
|
4.87%, due 05/12/2006 |
|
|
| 63 |
| 63 |
|
Societe Generale |
|
|
|
|
|
|
|
4.79%, due 05/10/2006 |
|
|
| 79 |
| 79 |
|
UBS AG |
|
|
|
|
|
|
|
4.95%, due 06/20/2006 |
|
|
| 79 |
| 79 |
|
Repurchase Agreements (0.3%) |
| †† |
|
|
|
|
|
Credit Suisse First Boston Corp. 4.92%, dated 04/28/2006 to be repurchased at $107 on 05/01/2006 |
|
|
| 107 |
| 107 |
|
Goldman Sachs Group, Inc. (The) 4.92%, dated 04/28/2006 to be repurchased at $231 on 05/01/2006 |
|
|
| 231 |
| 231 |
|
Lehman Brothers, Inc. 4.92%, dated 04/28/2006 to be repurchased at $4 on 05/01/2006 |
|
|
| 4 |
| 4 |
|
6
TA IDEX AllianceBernstein International Value
SCHEDULE OF INVESTMENTS
At April 30, 2006
(all amounts except share amounts in thousands)
(unaudited)
Merrill Lynch & Co. 4.87%, dated 04/28/2006 to be repurchased at $236 on 05/01/2006 |
|
|
| 236 |
| 236 |
|
Morgan Stanley Dean Witter & Co. 4.93%, dated 04/28/2006 to be repurchased at $110 on 05/01/2006 |
|
|
| 110 |
| 110 |
|
|
|
|
| Shares |
| Value |
| |
Investment Companies (0.1%) |
|
|
|
|
|
|
| |
|
|
|
|
|
|
|
| |
Barclays Global Investors Institutional Money Market Fund |
|
|
|
|
|
|
| |
1-day yield of 4.78% |
|
|
| 125,792 |
| 126 |
| |
Merrimac Cash Fund, Premium Class |
|
|
|
|
|
|
| |
1-day yield of 4.61% |
| @ |
| 33,469 |
| 33 |
| |
Total Security Lending Collateral (cost: $2,482) |
|
|
|
|
| 2,482 |
| |
Total Investment Securities (cost: $183,352) |
| # |
|
|
| $ | 209,754 |
|
NOTES TO SCHEDULE OF INVESTMENTS:
(a) Passive Foreign Investment Company.
‡ Non-income producing.
† �� At April 30, 2006, all or a portion of this security is on loan (see Note 1). The value at April 30, 2006, of all securities on loan is $2,360.
* Floating or variable rate note. Rate is listed as of April 30, 2006.
†† Cash collateral for the Repurchase Agreements, valued at $708, that serve as collateral for securities lending are invested in corporate bonds with interest rates and maturity dates ranging from 0.00% - 9.05% and 05/02/2006 - 12/31/2049, respectively.
@ Regulated investment company advised by Investors Bank and Trust Co. (“IBT”). IBT is also the accounting, custody and lending agent for the Fund.
# Aggregate cost for Federal income tax purposes is $183,352. Aggregate gross unrealized appreciation for all securities in which there is an excess of value over tax cost and aggregate gross unrealized depreciation for all securities in which there is an excess of tax cost over value were $26,996 and $594, respectively. Net unrealized appreciation for tax purposes is $26,402.
DEFINITIONS:
144A 144A Securities are registered pursuant to Rule 144A of the Securities Act of 1933. These securities are deemed to be liquid for purposes of compliance limitations on holdings of illiquid securities and may be resold as transactions exempt from registration, normally to qualified institutional buyers. At April 30, 2006, these securities aggregated $79 or 0.0% of the net assets of the Fund.
SCRL Società Cooperativa a Responsabilità Limitata (Limited Liability Co-operative)
The notes to the financial statements are an integral part of this report.
7
TA IDEX AllianceBernstein International Value
SCHEDULE OF INVESTMENTS
At April 30, 2006
(all amounts in thousands)
(unaudited)
FORWARD FOREIGN CURRENCY CONTRACTS:
|
|
|
|
|
| Amount in |
| Net Unrealized |
| ||||
|
| Bought |
| Settlement |
| U.S. Dollars |
| Appreciation |
| ||||
Currency |
|
|
| (Sold) |
| Date |
| Bought (Sold) |
| (Depreciation) |
| ||
Swiss Franc |
| (4,450 | ) | 06/15/2006 |
| $ | (3,434 | ) | $ | (160 | ) | ||
|
|
|
|
|
| $ | (3,434 | ) | $ | (160 | ) | ||
The notes to the financial statements are an integral part of this report.
8
TA IDEX AllianceBernstein International Value |
|
SCHEDULE OF INVESTMENTS
April 30, 2006
(all amounts except share amounts in thousands)
(unaudited)
|
| Percentage of |
| Value |
| |
|
|
|
|
|
| |
INVESTMENTS BY INDUSTRY: |
|
|
|
|
| |
Commercial Banks |
| 16.1 | % | $ | 34,805 |
|
Oil & Gas Extraction |
| 7.1 | % | 15,424 |
| |
Automotive |
| 7.0 | % | 15,224 |
| |
Primary Metal Industries |
| 5.3 | % | 11,565 |
| |
Insurance |
| 5.2 | % | 11,192 |
| |
Telecommunications |
| 4.7 | % | 10,199 |
| |
Electric Services |
| 4.2 | % | 9,052 |
| |
Pharmaceuticals |
| 3.5 | % | 7,666 |
| |
Petroleum Refining |
| 3.4 | % | 7,444 |
| |
Tobacco Products |
| 3.2 | % | 6,993 |
| |
Business Credit Institutions |
| 3.1 | % | 6,642 |
| |
Life Insurance |
| 2.9 | % | 6,328 |
| |
Wholesale Trade Durable Goods |
| 2.7 | % | 5,774 |
| |
Rubber & Misc. Plastic Products |
| 2.3 | % | 5,075 |
| |
Computer & Office Equipment |
| 2.2 | % | 4,805 |
| |
Industrial Machinery & Equipment |
| 2.1 | % | 4,544 |
| |
Aerospace |
| 2.0 | % | 4,434 |
| |
Metal Mining |
| 1.9 | % | 4,147 |
| |
Electronic Components & Accessories |
| 1.8 | % | 3,797 |
| |
Water Transportation |
| 1.4 | % | 3,063 |
| |
Beverages |
| 1.3 | % | 2,744 |
| |
Real Estate |
| 1.2 | % | 2,520 |
| |
Communications Equipment |
| 1.0 | % | 2,163 |
| |
Railroads |
| 0.9 | % | 2,047 |
| |
Food Stores |
| 0.9 | % | 1,852 |
| |
Radio, Television & Computer Stores |
| 0.8 | % | 1,677 |
| |
Chemicals & Allied Products |
| 0.8 | % | 1,645 |
| |
Restaurants |
| 0.7 | % | 1,526 |
| |
Mortgage Bankers & Brokers |
| 0.7 | % | 1,496 |
| |
Food & Kindred Products |
| 0.7 | % | 1,443 |
| |
Gas Production & Distribution |
| 0.7 | % | 1,433 |
| |
Electrical Goods |
| 0.6 | % | 1,396 |
| |
Wholesale Trade Nondurable Goods |
| 0.6 | % | 1,329 |
| |
Stone, Clay & Glass Products |
| 0.6 | % | 1,291 |
| |
Manufacturing Industries |
| 0.5 | % | 1,173 |
| |
Holding & Other Investment Offices |
| 0.5 | % | 1,112 |
| |
Computer & Data Processing Services |
| 0.4 | % | 930 |
| |
Medical Instruments & Supplies |
| 0.4 | % | 779 |
| |
Paper & Allied Products |
| 0.3 | % | 543 |
| |
Investment Securities, at value |
| 95.7 | % | 207,272 |
| |
Short-Term Investments |
| 1.2 | % | 2,482 |
| |
Total Investment Securities |
| 96.9 | % | 209,754 |
| |
The notes to the financial statements are an integral part of this report.
9
TA IDEX Evergreen International Small Cap
UNDERSTANDING YOUR FUND’S EXPENSES
(unaudited)
SHAREHOLDER EXPENSES
Fund shareholders may incur ongoing costs, including management fees, 12b-1 distribution and service fees, and other fund expenses. Shares of the Fund currently are sold only to certain Transamerica IDEX Mutual Funds and AEGON/Transamerica Series Trust (an affiliate of Transamerica IDEX Mutual Funds) asset allocation funds at net asset value, without any transaction costs.
The following Example is intended to help you understand your ongoing costs (in dollars and cents) of investing in the Fund and to compare these costs with the ongoing costs of investing in other funds.
ACTUAL EXPENSES
The first line in the table below provides information about actual account values and actual expenses. You may use the information in this line, together with the amount you invested, to estimate the expenses that you paid over the period. Simply divide your account value by $1,000 (for example, an $8,600 account value divided by $1,000 = 8.6), then multiply the result by the number in the first line of your Fund under the heading entitled “Expenses Paid During Period” to estimate the expenses you paid on your account during this period.
HYPOTHETICAL EXAMPLE FOR COMPARISON PURPOSES
The second line in the table below provides information about hypothetical account values and hypothetical expenses based on the Fund’s actual expense ratio and an assumed rate of return of 5% per year before expenses, which is not the Fund’s actual return. The hypothetical account values and expenses may not be used to estimate the actual ending account balance or expenses you paid for the period. You may use this information to compare the ongoing costs of investing in your Fund and other funds. To do so, compare this 5% hypothetical example with the 5% hypothetical examples that appear in the shareholder reports of the other funds.
|
| Beginning |
| Ending |
| Annualized |
| Expenses Paid |
| |||
Class I |
|
|
|
|
|
|
|
|
| |||
Actual |
| $ | 1,000.00 |
| $ | 1,355.80 |
| 1.15 | % | $ | 6.72 |
|
Hypothetical(b) |
| 1,000.00 |
| 1,019.09 |
| 1.15 | % | 5.76 |
| |||
(a) Expenses are calculated using the Fund’s annualized expense ratio (as disclosed in the table), multiplied by the average account value for the period, multiplied by number of days in the period (181 days), and divided by the number of days in the year (365 days).
(b) 5% return per year before expenses.
10
TA IDEX Evergreen International Small Cap
TABULAR PRESENTATION OF SCHEDULE OF INVESTMENTS
By Region
At April 30, 2006
Africa |
| 0.2 | % |
Europe |
| 74.3 | % |
North America |
| 5.1 | % |
Other |
| 0.4 | % |
Pacific Rim |
| 19.1 | % |
South America |
| 0.9 | % |
|
| 100.0 | % |
This chart shows the percentage breakdown by region of the Fund’s total investment securities.
11
TA IDEX Evergreen International Small Cap
SCHEDULE OF INVESTMENTS
At April 30, 2006
(all amounts except share amounts in thousands)
(unaudited)
|
|
|
| Shares |
| Value |
|
PREFERRED STOCKS (1.3%) |
|
|
|
|
|
|
|
Italy (1.3%) |
|
|
|
|
|
|
|
Unipol SpA |
|
|
| 2,038,171 |
| 6,028 |
|
Total Preferred Stocks (cost: $5,398) |
|
|
|
|
| 6,028 |
|
|
|
|
|
|
|
|
|
COMMON STOCKS (95.6%) |
|
|
|
|
|
|
|
Australia (0.3%) |
|
|
|
|
|
|
|
QBE Insurance Group, Ltd. |
|
|
| 71,387 |
| 1,212 |
|
Belgium (1.9%) |
|
|
|
|
|
|
|
Option NV |
| ‡† |
| 165,208 |
| 4,724 |
|
Umicore |
|
|
| 23,921 |
| 3,809 |
|
Bermuda (0.4%) |
|
|
|
|
|
|
|
China Gas Holdings, Ltd. |
| ‡ |
| 11,960,000 |
| 2,067 |
|
Brazil (0.9%) |
|
|
|
|
|
|
|
Aracruz Celulose SA, Sponsored ADR |
|
|
| 16,993 |
| 936 |
|
Empresa Brasileira de Aeronautica SA, ADR |
| † |
| 87,174 |
| 3,385 |
|
Canada (0.5%) |
|
|
|
|
|
|
|
Gabriel Resources, Ltd. Warrants |
| ‡ |
| 23,380 |
| 27 |
|
Sierra Wireless |
| ‡ |
| 125,500 |
| 2,259 |
|
Finland (0.3%) |
|
|
|
|
|
|
|
Amer Group |
|
|
| 78,300 |
| 1,604 |
|
France (6.6%) |
|
|
|
|
|
|
|
Altran Technologies SA |
| ‡† |
| 383,371 |
| 5,549 |
|
Bull SA |
| ‡ |
| 604,208 |
| 6,918 |
|
Carbone Lorraine SA |
|
|
| 32,184 |
| 1,854 |
|
Eurofins Scientific |
| ‡ |
| 95,038 |
| 5,976 |
|
Flo Groupe |
| ‡ |
| 133,212 |
| 1,307 |
|
Neopost SA |
|
|
| 78,805 |
| 8,899 |
|
Germany (8.1%) |
|
|
|
|
|
|
|
Adidas-Salomon AG |
|
|
| 48,739 |
| 10,274 |
|
Bilfinger Berger AG |
|
|
| 32,697 |
| 2,080 |
|
Continental AG |
|
|
| 65,447 |
| 7,780 |
|
Deutz AG |
| ‡† |
| 462,162 |
| 4,238 |
|
IWKA AG |
|
|
| 72,752 |
| 2,111 |
|
Leoni AG |
|
|
| 83,600 |
| 3,442 |
|
Man AG |
|
|
| 46,352 |
| 3,508 |
|
Patrizia Immobilien AG |
| ‡ |
| 46,864 |
| 1,261 |
|
Puma AG Rudolf Dassler Sport |
|
|
| 5,947 |
| 2,394 |
|
Ireland (2.3%) |
|
|
|
|
|
|
|
Anglo Irish Bank Corp. PLC |
|
|
| 399,649 |
| 6,580 |
|
C&C Group PLC |
|
|
| 503,140 |
| 3,917 |
|
Italy (3.5%) |
|
|
|
|
|
|
|
Davide Campari-Milano SpA |
|
|
| 580,454 |
| 5,666 |
|
Geox SpA |
|
|
| 381,744 |
| 5,438 |
|
Gruppo Coin SpA |
| ‡ |
| 903,382 |
| 4,889 |
|
Japan (19.6%) |
|
|
|
|
|
|
|
Advan Co., Ltd. |
| † |
| 239,600 |
| 4,395 |
|
Arrk Corp. |
|
|
| 156,600 |
| 5,609 |
|
Bank of Yokohama, Ltd. (The) |
|
|
| 572,000 |
| 4,473 |
|
Creed Corp. |
|
|
| 429 |
| 2,314 |
|
Diamond Lease Co., Ltd. |
|
|
| 91,800 |
| 4,904 |
|
Isetan Co., Ltd. |
|
|
| 96,400 |
| 1,971 |
|
Ishikawajima-Harima Heavy Industries Co., Ltd. |
|
|
| 1,913,000 |
| 6,801 |
|
Kawasaki Heavy Industries, Ltd. |
|
|
| 667,000 |
| 2,412 |
|
KK DaVinci Advisors |
| ‡ |
| 3,911 |
| 4,349 |
|
Mitsubishi Gas Chemical Co., Inc. |
|
|
| 347,000 |
| 4,597 |
|
Nidec Corp. |
|
|
| 52,000 |
| 3,998 |
|
Nipponkoa Insurance Co., Ltd. |
|
|
| 690,000 |
| 6,145 |
|
Nissin Co., Ltd. |
|
|
| 940,000 |
| 897 |
|
Okumura Corp. |
|
|
| 813,000 |
| 4,499 |
|
Showa Aircraft Industry Co., Ltd. |
|
|
| 150,000 |
| 2,535 |
|
Sumitomo Bakelite Co., Ltd. |
|
|
| 512,000 |
| 4,766 |
|
THK Co., Ltd. |
|
|
| 100,900 |
| 3,287 |
|
12
TA IDEX Evergreen International Small Cap
SCHEDULE OF INVESTMENTS
At April 30, 2006
(all amounts except share amounts in thousands)
(unaudited)
Toho Co., Ltd. |
|
|
| 102,600 |
| 1,981 |
|
Tokuyama Corp. |
|
|
| 418,000 |
| 6,878 |
|
Tokyo Tatemono Co., Ltd. |
|
|
| 423,000 |
| 4,871 |
|
Toray Industries, Inc. |
|
|
| 547,000 |
| 5,111 |
|
Trend Micro, Inc. |
|
|
| 78,000 |
| 3,012 |
|
Netherlands (20.6%) |
|
|
|
|
|
|
|
Boskalis Westminster |
|
|
| 156,694 |
| 12,198 |
|
Brunel International |
|
|
| 121,469 |
| 4,590 |
|
Buhrmann NV |
|
|
| 497,623 |
| 9,634 |
|
Fugro NV |
|
|
| 53,549 |
| 2,245 |
|
Getronics NV |
| † |
| 129,323 |
| 1,562 |
|
Grolsch NV |
|
|
| 29,903 |
| 1,107 |
|
Hagemeyer NV |
| ‡† |
| 995,938 |
| 5,407 |
|
IHC Caland NV |
|
|
| 30,346 |
| 3,251 |
|
Koninklijke BAM NBM NV |
|
|
| 61,039 |
| 6,547 |
|
Macintosh Retail Group NV |
|
|
| 36,295 |
| 3,795 |
|
Randstad Holdings NV |
|
|
| 189,514 |
| 12,581 |
|
USG People NV |
|
|
| 282,896 |
| 24,339 |
|
Vedior NV |
|
|
| 82,767 |
| 1,927 |
|
Wegener NV |
|
|
| 293,688 |
| 5,549 |
|
Norway (1.2%) |
|
|
|
|
|
|
|
Aker Yards AS |
|
|
| 66,900 |
| 5,350 |
|
Spain (3.8%) |
|
|
|
|
|
|
|
Cintra Concesiones de Infraestructuras de Transporte SA |
|
|
| 297,119 |
| 4,023 |
|
Gestevision Telecinco SA |
|
|
| 61,091 |
| 1,558 |
|
Miquel y Costas |
|
|
| 3,656 |
| 113 |
|
NH Hoteles SA |
| † |
| 202,151 |
| 3,639 |
|
Promotora de Informaciones SA |
| † |
| 155,699 |
| 2,848 |
|
Sociedad General de Aguas de Barcelona SA-Class B |
|
|
| 196,607 |
| 5,486 |
|
Switzerland (2.0%) |
|
|
|
|
|
|
|
Lindt & Spruengli AG |
|
|
| 2,356 |
| 4,793 |
|
Logitech International SA |
| ‡ |
| 103,763 |
| 4,297 |
|
United Kingdom (23.3%) |
|
|
|
|
|
|
|
Aberdeen Asset Management PLC |
|
|
| 447,171 |
| 1,603 |
|
Ashtead Group PLC |
|
|
| 3,850,323 |
| 16,447 |
|
AWG PLC |
|
|
| 419,509 |
| 8,845 |
|
BAE Systems PLC |
|
|
| 598,213 |
| 4,540 |
|
Business Post Group PLC |
|
|
| 260,453 |
| 1,948 |
|
Carphone Warehouse Group PLC |
|
|
| 579,309 |
| 3,535 |
|
Charter PLC |
| ‡ |
| 795,040 |
| 11,546 |
|
Corporate Services Group PLC |
| ‡ |
| 5,311,673 |
| 965 |
|
Danka Business Systems PLC, ADR |
| ‡ |
| 945,012 |
| 1,162 |
|
Electronics Boutique PLC |
|
|
| 5,968,139 |
| 8,678 |
|
Enterprise Inns PLC |
|
|
| 208,996 |
| 3,544 |
|
Homestyle Group PLC |
| ‡ |
| 518,039 |
| 1,118 |
|
ICAP PLC |
|
|
| 300,873 |
| 2,849 |
|
ITV PLC |
|
|
| 1,649,646 |
| 3,448 |
|
Ladbrokes PLC |
|
|
| 0 |
| — | o |
Man Group PLC |
|
|
| 54,407 |
| 2,499 |
|
Photo-Me International PLC |
|
|
| 5,704,459 |
| 9,928 |
|
Premier Oil PLC |
| ‡ |
| 223,790 |
| 4,178 |
|
Regent Inns PLC |
| ‡ |
| 1,158,707 |
| 2,464 |
|
Rentokil Initial PLC |
|
|
| 322,406 |
| 936 |
|
Schroders PLC |
|
|
| 224,329 |
| 4,604 |
|
Star Energy Group PLC |
| ‡ |
| 387,522 |
| 2,409 |
|
Trinity Mirror PLC |
|
|
| 308,765 |
| 3,081 |
|
Tullow Oil PLC |
|
|
| 510,402 |
| 3,818 |
|
Umbro |
|
|
| 1,003,680 |
| 2,946 |
|
United States (0.3%) |
|
|
|
|
|
|
|
Randgold Resources, Ltd., ADR |
| ‡ |
| 47,395 |
| 1,154 |
|
Total Common Stocks (cost: $326,422) |
|
|
|
|
| 438,993 |
|
13
TA IDEX Evergreen International Small Cap
SCHEDULE OF INVESTMENTS
At April 30, 2006
(all amounts except share amounts in thousands)
(unaudited)
|
|
|
| Principal |
| Value |
|
SECURITY LENDING COLLATERAL (7.1%) |
|
|
|
|
|
|
|
Debt (6.6%) |
|
|
|
|
|
|
|
Bank Notes (0.8%) |
|
|
|
|
|
|
|
Bank of America |
|
|
|
|
|
|
|
4.81%, due 06/07/2006 |
| * |
| 1,065 |
| 1,065 |
|
4.81%, due 08/10/2006 |
| * |
| 1,027 |
| 1,027 |
|
Bear Stearns & Co. |
|
|
|
|
|
|
|
5.01%, due 06/06/2006 |
| * |
| 411 |
| 411 |
|
5.01%, due 09/07/2006 |
| * |
| 1,233 |
| 1,233 |
|
Certificates of Deposit (0.4%) |
|
|
|
|
|
|
|
Halifax Bank of Scotland |
|
|
|
|
|
|
|
4.78%, due 06/06/2006 |
| * |
| 1,027 |
| 1,027 |
|
Rabobank Nederland |
|
|
|
|
|
|
|
4.87%, due 05/31/2006 |
| * |
| 1,027 |
| 1,027 |
|
Commercial Paper (0.4%) |
|
|
|
|
|
|
|
Banco Santander Central Hispano SA |
|
|
|
|
|
|
|
4.77%, due 05/02/2006 |
|
|
| 616 |
| 616 |
|
Sheffield Receivables Corp.-144A |
|
|
|
|
|
|
|
4.81%, due 05/03/2006 |
|
|
| 1,026 |
| 1,026 |
|
Euro Dollar Overnight (1.2%) |
|
|
|
|
|
|
|
Bank of Montreal |
|
|
|
|
|
|
|
4.77%, due 05/02/2006 |
|
|
| 822 |
| 822 |
|
Dexia Group |
|
|
|
|
|
|
|
4.78%, due 05/04/2006 |
|
|
| 1,028 |
| 1,028 |
|
Fortis Bank |
|
|
|
|
|
|
|
4.77%, due 05/01/2006 |
|
|
| 411 |
| 411 |
|
Royal Bank of Canada |
|
|
|
|
|
|
|
4.77%, due 05/01/2006 |
|
|
| 1,439 |
| 1,439 |
|
Royal Bank of Scotland |
|
|
|
|
|
|
|
4.75%, due 05/03/2006 |
|
|
| 1,028 |
| 1,028 |
|
Svenska Handlesbanken |
|
|
|
|
|
|
|
4.82%, due 05/01/2006 |
|
|
| 785 |
| 785 |
|
Euro Dollar Terms (1.8%) |
|
|
|
|
|
|
|
BancoBilbao Vizcaya Argentaria SA |
|
|
|
|
|
|
|
4.95%, due 06/20/2006 |
|
|
| 822 |
| 822 |
|
Bank of the West |
|
|
|
|
|
|
|
4.94%, due 06/16/2006 |
|
|
| 822 |
| 822 |
|
Barclays |
|
|
|
|
|
|
|
4.79%, due 05/10/2006 |
|
|
| 1,233 |
| 1,233 |
|
4.77%, due 05/16/2006 |
|
|
| 411 |
| 411 |
|
Canadian Imperial Bank of Commerce |
|
|
|
|
|
|
|
4.97%, due 06/23/2006 |
|
|
| 616 |
| 616 |
|
Credit Suisse First Boston Corp. |
|
|
|
|
|
|
|
4.73%, due 05/08/2006 |
|
|
| 616 |
| 616 |
|
Fortis Bank |
|
|
|
|
|
|
|
4.83%, due 05/08/2006 |
|
|
| 411 |
| 411 |
|
Lloyds TSB Bank |
|
|
|
|
|
|
|
4.81%, due 05/11/2006 |
|
|
| 616 |
| 616 |
|
Royal Bank of Scotland |
|
|
|
|
|
|
|
4.87%, due 05/12/2006 |
|
|
| 822 |
| 822 |
|
Societe Generale |
|
|
|
|
|
|
|
4.79%, due 05/10/2006 |
|
|
| 1,028 |
| 1,028 |
|
UBS AG |
|
|
|
|
|
|
|
4.95%, due 06/20/2006 |
|
|
| 1,028 |
| 1,028 |
|
Repurchase Agreements (2.0%) |
| †† |
|
|
|
|
|
Credit Suisse First Boston Corp. 4.92%, dated 04/28/2006 to be repurchased at $1,396 on 05/01/2006 |
|
|
| 1,395 |
| 1,395 |
|
|
|
|
|
|
|
|
|
Goldman Sachs Group, Inc. (The) 4.92%, dated 04/28/2006 to be repurchased at $3,020 on 05/01/2006 |
|
|
| 3,019 |
| 3,019 |
|
|
|
|
|
|
|
|
|
Lehman Brothers, Inc. 4.92%, dated 04/28/2006 to be repurchased at $51 on 05/01/2006 |
|
|
|
|
|
|
|
|
|
|
| 51 |
| 51 |
|
14
TA IDEX Evergreen International Small Cap
SCHEDULE OF INVESTMENTS
At April 30, 2006
(all amounts except share amounts in thousands)
(unaudited)
Merrill Lynch & Co. 4.87%, dated 04/28/2006 to be repurchased at $3,084 on 05/01/2006 |
|
|
| 3,083 |
| 3,083 |
|
Morgan Stanley Dean Witter & Co. 4.93%, dated 04/28/2006 to be repurchased at $1,439 on 05/01/2006 |
|
|
| 1,439 |
| 1,439 |
|
|
|
|
| Shares |
| Value |
| |
Investment Companies (0.5%) |
|
|
|
|
|
|
| |
Barclays Global Investors Institutional Money Market Fund |
|
|
| 1,644,016 |
| 1,644 |
| |
Merrimac Cash Fund, Premium Class |
| @ |
| 437,416 |
| 437 |
| |
Total Security Lending Collateral (cost: $32,438) |
|
|
|
|
| 32,438 |
| |
Total Investment Securities (cost: $364,258) |
| # |
|
|
| $ | 477,459 |
|
NOTES TO SCHEDULE OF INVESTMENTS:
‡ Non-income producing.
† At April 30, 2006, all or a portion of this security is on loan (see Note 1). The value at April 30, 2006, of all securities on loan is $30,548.
* Floating or variable rate note. Rate is listed as of April 30, 2006.
†† Cash collateral for the Repurchase Agreements, valued at $9,251, that serve as collateral for securities lending are invested in corporate bonds with interest rates and maturity dates ranging from 0.00% - 9.05% and 05/02/2006 - 12/31/2049, respectively.
@ Regulated investment company advised by Investors Bank and Trust Co. (“IBT”). IBT is also the accounting, custody and lending agent for the Fund.
o Value is less than $1.
# Aggregate cost for Federal income tax purposes is $364,689. Aggregate gross unrealized appreciation for all securities in which there is an excess of value over tax cost and aggregate gross unrealized depreciation for all securities in which there is an excess of tax cost over value were $117,684 and $4,914, respectively. Net unrealized appreciation for tax purposes is $112,770.
DEFINITIONS:
144A 144A Securities are registered pursuant to Rule 144A of the Securities Act of 1933. These securities are deemed to be liquid for purposes of compliance limitations on holdings of illiquid securities and may be resold as transactions exempt from registration, normally to qualified institutional buyers. At April 30, 2006, these securities aggregated $1,026 or 0.2% of the net assets of the Fund.
ADR American Depositary Receipt
The notes to the financial statements are an integral part of this report.
15
TA IDEX Evergreen International Small Cap
SCHEDULE OF INVESTMENTS
April 30, 2006
(all amounts except share amounts in thousands)
(unaudited)
|
| Percentage of |
|
|
| |
|
| Net Assets |
| Value |
| |
|
|
|
|
|
| |
INVESTMENTS BY INDUSTRY: |
|
|
|
|
| |
Business Services |
| 19.2 | % | $ | 88,153 |
|
Engineering & Management Services |
| 6.7 | % | 30,872 |
| |
Computer & Office Equipment |
| 5.0 | % | 22,830 |
| |
Rubber & Misc. Plastic Products |
| 4.5 | % | 20,448 |
| |
Industrial Machinery & Equipment |
| 3.7 | % | 17,143 |
| |
Chemicals & Allied Products |
| 3.5 | % | 16,241 |
| |
Electric, Gas & Sanitary Services |
| 3.1 | % | 14,331 |
| |
Insurance |
| 2.9 | % | 13,385 |
| |
Wholesale Trade Durable Goods |
| 2.9 | % | 13,224 |
| |
Oil & Gas Extraction |
| 2.8 | % | 12,649 |
| |
Computer & Data Processing Services |
| 2.5 | % | 11,493 |
| |
Printing & Publishing |
| 2.5 | % | 11,478 |
| |
Commercial Banks |
| 2.4 | % | 11,052 |
| |
Beverages |
| 2.3 | % | 10,690 |
| |
Instruments & Related Products |
| 2.2 | % | 9,928 |
| |
Radio, Television & Computer Stores |
| 1.9 | % | 8,678 |
| |
Aerospace |
| 1.7 | % | 7,925 |
| |
Security & Commodity Brokers |
| 1.6 | % | 7,453 |
| |
Restaurants |
| 1.6 | % | 7,316 |
| |
Department Stores |
| 1.5 | % | 6,860 |
| |
Holding & Other Investment Offices |
| 1.3 | % | 6,169 |
| |
Specialty- Real Estate |
| 1.3 | % | 6,132 |
| |
Health Services |
| 1.3 | % | 5,976 |
| |
Manufacturing Industries |
| 1.2 | % | 5,447 |
| |
Leather & Leather Products |
| 1.2 | % | 5,438 |
| |
Transportation Equipment |
| 1.2 | % | 5,350 |
| |
Electronic Components & Accessories |
| 1.2 | % | 5,297 |
| |
Textile Mill Products |
| 1.1 | % | 5,111 |
| |
Radio & Television Broadcasting |
| 1.1 | % | 5,007 |
| |
Metal Mining |
| 1.1 | % | 4,989 |
| |
Personal Credit Institutions |
| 1.1 | % | 4,903 |
| |
Food & Kindred Products |
| 1.0 | % | 4,792 |
| |
Communications Equipment |
| 1.0 | % | 4,724 |
| |
Management Services |
| 1.0 | % | 4,349 |
| |
Public Administration |
| 0.9 | % | 4,023 |
| |
Retail Trade |
| 0.8 | % | 3,795 |
| |
Hotels & Other Lodging Places |
| 0.8 | % | 3,639 |
| |
Telecommunications |
| 0.8 | % | 3,535 |
| |
Water Transportation |
| 0.7 | % | 3,251 |
| |
Automotive |
| 0.6 | % | 2,535 |
| |
Real Estate |
| 0.5 | % | 2,314 |
| |
Motion Pictures |
| 0.4 | % | 1,981 |
| |
Transportation & Public Utilities |
| 0.4 | % | 1,948 |
| |
Furniture & Home Furnishings Stores |
| 0.2 | % | 1,118 |
| |
Paper & Allied Products |
| 0.2 | % | 1,049 |
| |
Investment Securities, at value |
| 96.9 | % | 445,021 |
| |
Short-Term Investments |
| 7.1 | % | 32,438 |
| |
Total Investment Securities |
| 104.0 | % | 477,459 |
| |
The notes to the financial statements are an integral part of this report.
16
TA IDEX Federated Market Opportunity
UNDERSTANDING YOUR FUND’S EXPENSES
(unaudited)
SHAREHOLDER EXPENSES
Fund shareholders may incur ongoing costs, including management fees, 12b-1 distribution and service fees, and other fund expenses. Shares of the Fund currently are sold only to certain Transamerica IDEX Mutual Funds and AEGON/Transamerica Series Trust (an affiliate of Transamerica IDEX Mutual Funds) asset allocation funds at net asset value, without any transaction costs.
The following Example is intended to help you understand your ongoing costs (in dollars and cents) of investing in the Fund and to compare these costs with the ongoing costs of investing in other funds.
The Example is based on an investment of $1,000 invested at December 6, 2005 and held for the entire period until April 30, 2006.
ACTUAL EXPENSES
The first line in the table below provides information about actual account values and actual expenses. You may use the information in this line, together with the amount you invested, to estimate the expenses that you paid over the period. Simply divide your account value by $1,000 (for example, an $8,600 account value divided by $1,000 = 8.6), then multiply the result by the number in the first line of your Fund under the heading entitled “Expenses Paid During Period” to estimate the expenses you paid on your account during this period.
HYPOTHETICAL EXAMPLE FOR COMPARISON PURPOSES
The second line in the table below provides information about hypothetical account values and hypothetical expenses based on the Fund’s actual expense ratio and an assumed rate of return of 5% per year before expenses, which is not the Fund’s actual return. The hypothetical account values and expenses may not be used to estimate the actual ending account balance or expenses you paid for the period. You may use this information to compare the ongoing costs of investing in your Fund and other funds. To do so, compare this 5% hypothetical example with the 5% hypothetical examples that appear in the shareholder reports of the other funds.
|
| Beginning |
| Ending |
| Annualized |
| Expenses Paid |
| |||
Class I |
|
|
|
|
|
|
|
|
| |||
Actual |
| $ | 1,000.00 |
| $ | 1,029.00 |
| 0.94 | % | $ | 3.79 |
|
Hypothetical(b) |
| 1,000.00 |
| 1,016.13 |
| 0.94 | % | 3.76 |
| |||
(a) Expenses are calculated using the Fund’s annualized expense ratio (as disclosed in the table), multiplied by the average account value for the period, multiplied by number of days in the period (145 days), and divided by the number of days in the year (365 days).
(b) 5% return per year before expenses.
17
TA IDEX Federated Market Opportunity
TABULAR PRESENTATION OF SCHEDULE OF INVESTMENTS
By Region
At April 30, 2006
Africa |
| 1.3% |
Europe |
| 13.8% |
North America |
| 68.6% |
Pacific Rim |
| 16.3% |
|
| 100.0% |
This chart shows the percentage breakdown by region of the Fund’s total investment securities.
18
TA IDEX Federated Market Opportunity
SCHEDULE OF INVESTMENTS
At April 30, 2006
(all amounts except share amounts in thousands)
(unaudited)
|
|
|
| Principal |
| Value |
|
U.S. GOVERNMENT OBLIGATIONS (50.7%) |
|
|
|
|
|
|
|
United States (50.7%) |
|
|
|
|
|
|
|
U.S. Treasury Bill |
|
|
|
|
|
|
|
4.63%, due 02/29/2008 |
|
|
| 8,000 |
| 7,964 |
|
U.S. Treasury Note |
|
|
|
|
|
|
|
3.13%, due 09/15/2008 |
|
|
| 8,000 |
| 7,689 |
|
4.50%, due 02/15/2009 |
|
|
| 8,000 |
| 7,921 |
|
3.50%, due 02/15/2010 |
|
|
| 8,000 |
| 7,614 |
|
4.50%, due 02/28/2011 |
|
|
| 8,000 |
| 7,854 |
|
Total U.S. Government Obligations (cost: $39,294) |
|
|
|
|
| 39,042 |
|
FOREIGN GOVERNMENT OBLIGATIONS (10.9%) |
|
|
|
|
|
|
|
Australia (5.2%) |
|
|
|
|
|
|
|
Commonwealth of Australia |
|
|
|
|
|
|
|
8.00%, due 03/01/2008 |
| AUD |
| 5,100 |
| 4,013 |
|
Sweden (5.7%) |
|
|
|
|
|
|
|
Kingdom of Sweden |
|
|
|
|
|
|
|
Zero Coupon, due 09/20/2006 |
| SEK |
| 32,250 |
| 4,330 |
|
Total Foreign Government Obligations (cost: $8,016) |
|
|
|
|
| 8,343 |
|
|
|
|
| Shares |
| Value |
| |
COMMON STOCKS (22.3%) |
|
|
|
|
|
|
| |
Belgium (0.9%) |
|
|
|
|
|
|
| |
Belgacom SA |
|
|
| 20,000 |
| 653 |
| |
Canada (3.7%) |
|
|
|
|
|
|
| |
Barrick Gold Corp. |
|
|
| 44,600 |
| 1,359 |
| |
EnCana Corp. |
|
|
| 17,800 |
| 891 |
| |
Loblaw Cos., Ltd. |
|
|
| 11,200 |
| 573 |
| |
Japan (8.5%) |
|
|
|
|
|
|
| |
Ajinomoto Co., Inc. |
|
|
| 80,000 |
| 993 |
| |
Astellas Pharma, Inc. |
|
|
| 20,100 |
| 836 |
| |
Daiichi Sanyko Co., Ltd. |
|
|
| 53,100 |
| 1,365 |
| |
Lawson, Inc. |
|
|
| 10,000 |
| 378 |
| |
NTT DoCoMo, Inc. |
|
|
| 693 |
| 1,032 |
| |
Ono Pharmaceutical Co., Ltd. |
|
|
| 21,400 |
| 1,059 |
| |
Taisho Pharmaceutical Co., Ltd. |
|
|
| 21,000 |
| 427 |
| |
Tanabe Seiyaku Co., Ltd. |
|
|
| 40,000 |
| 470 |
| |
Netherlands (1.2%) |
|
|
|
|
|
|
| |
Royal Dutch Shell PLC- Class A, ADR |
|
|
| 13,900 |
| 947 |
| |
South Africa (1.1%) |
|
|
|
|
|
|
| |
AngloGold Ashanti, Ltd., ADR |
|
|
| 15,000 |
| 820 |
| |
Switzerland (3.0%) |
|
|
|
|
|
|
| |
Serono SA-Class B |
|
|
| 1,800 |
| 1,178 |
| |
Swisscom AG |
|
|
| 3,500 |
| 1,164 |
| |
United Kingdom (0.8%) |
|
|
|
|
|
|
| |
Boots Group PLC |
|
|
| 49,421 |
| 632 |
| |
United States (3.1%) |
|
|
|
|
|
|
| |
Chevron Corp. |
|
|
| 13,500 |
| 824 |
| |
Newfield Exploration Co. |
| ‡ |
| 15,000 |
| 669 |
| |
Newmont Mining Corp. |
|
|
| 15,300 |
| 893 |
| |
Total Common Stocks (cost: $16,184) |
|
|
|
|
| 17,163 |
| |
Total Investment Securities (cost: $63,494) |
| # |
|
|
| $ | 64,548 |
|
19
TA IDEX Federated Market Opportunity
SCHEDULE OF INVESTMENTS
At April 30, 2006
(all amounts except share amounts in thousands)
(unaudited)
NOTES TO SCHEDULE OF INVESTMENTS:
‡ Non-income producing.
# Aggregate cost for Federal income tax purposes is $63,494. Aggregate gross unrealized appreciation for all securities in which there is an excess of value over tax cost and aggregate gross unrealized depreciation for all securities in which there is an excess of tax cost over value were $1,608 and $554, respectively. Net unrealized appreciation for tax purposes is $1,054.
DEFINITIONS:
ADR American Depositary Receipt
AUD Australian Dollar
SEK Swedish Krona
The notes to the financial statements are an integral part of this report.
20
TA IDEX Federated Market Opportunity
SCHEDULE OF INVESTMENTS
April 30, 2006
(all amounts except share amounts in thousands)
(unaudited)
|
| Percentage of |
| Value |
| |
|
|
|
|
|
| |
INVESTMENTS BY INDUSTRY: |
|
|
|
|
| |
U.S. Government & Agency |
| 50.7 | % | $ | 39,042 |
|
Sovereign Government |
| 10.8 | % | 8,343 |
| |
Pharmaceuticals |
| 5.2 | % | 3,969 |
| |
Metal Mining |
| 4.0 | % | 3,073 |
| |
Telecommunications |
| 3.7 | % | 2,849 |
| |
Oil & Gas Extraction |
| 3.3 | % | 2,507 |
| |
Holding & Other Investment Offices |
| 1.8 | % | 1,365 |
| |
Food & Kindred Products |
| 1.3 | % | 993 |
| |
Food Stores |
| 1.2 | % | 951 |
| |
Petroleum Refining |
| 1.1 | % | 824 |
| |
Drug Stores & Proprietary Stores |
| 0.8 | % | 632 |
| |
Investment Securities, at value |
| 83.9 | % | 64,548 |
| |
Total Investment Securities |
| 83.9 | % | 64,548 |
| |
The notes to the financial statements are an integral part of this report.
21
TA IDEX JPMorgan International Bond
UNDERSTANDING YOUR FUND’S EXPENSES
(unaudited)
SHAREHOLDER EXPENSES
Fund shareholders may incur ongoing costs, including management fees, 12b-1 distribution and service fees, and other fund expenses. Shares of the Fund currently are sold only to certain Transamerica IDEX Mutual Funds and AEGON/Transamerica Series Trust (an affiliate of Transamerica IDEX Mutual Funds) asset allocation funds at net asset value, without any transaction costs.
The following Example is intended to help you understand your ongoing costs (in dollars and cents) of investing in the Fund and to compare these costs with the ongoing costs of investing in other funds.
The Example is based on an investment of $1,000 invested at December 6, 2005 and held for the entire period until April 30, 2006.
ACTUAL EXPENSES
The first line in the table below provides information about actual account values and actual expenses. You may use the information in this line, together with the amount you invested, to estimate the expenses that you paid over the period. Simply divide your account value by $1,000 (for example, an $8,600 account value divided by $1,000 = 8.6), then multiply the result by the number in the first line of your Fund under the heading entitled “Expenses Paid During Period” to estimate the expenses you paid on your account during this period.
HYPOTHETICAL EXAMPLE FOR COMPARISON PURPOSES
The second line in the table below provides information about hypothetical account values and hypothetical expenses based on the Fund’s actual expense ratio and an assumed rate of return of 5% per year before expenses, which is not the Fund’s actual return. The hypothetical account values and expenses may not be used to estimate the actual ending account balance or expenses you paid for the period. You may use this information to compare the ongoing costs of investing in your Fund and other funds. To do so, compare this 5% hypothetical example with the 5% hypothetical examples that appear in the shareholder reports of the other funds.
|
| Beginning |
| Ending |
| Annualized |
| Expenses Paid |
| |||
Class I |
|
|
|
|
|
|
|
|
| |||
Actual |
| $ | 1,000.00 |
| $ | 1,043.30 |
| 0.68 | % | $ | 2.76 |
|
Hypothetical(b) |
| 1,000.00 |
| 1,017.16 |
| 0.68 | % | 2.72 |
| |||
(a) Expenses are calculated using the Fund’s annualized expense ratio (as disclosed in the table), multiplied by the average account value for the period, multiplied by number of days in the period (145 days), and divided by the number of days in the year (365 days).
(b) 5% return per year before expenses.
22
TA IDEX JPMorgan International Bond
TABULAR PRESENTATION OF SCHEDULE OF INVESTMENTS
By Region
At April 30, 2006
Europe |
| 74.4 | % |
|
North America |
| 8.3 | % |
|
Pacific Rim |
| 17.3 | % |
|
|
| 100.0 | % |
|
This chart shows the percentage breakdown by region of the Fund’s total investment securities.
23
TA IDEX JPMorgan International Bond
SCHEDULE OF INVESTMENTS
At April 30, 2006
(all amounts except share amounts in thousands)
(unaudited)
|
|
|
|
|
| Principal |
| Value |
|
FOREIGN GOVERNMENT OBLIGATIONS (58.1%) |
|
|
|
|
|
|
|
|
|
Australia (0.2%) |
|
|
|
|
|
|
|
|
|
Commonwealth of Australia |
|
|
|
|
|
|
|
|
|
7.50%, due 09/15/2009 |
|
|
| AUD |
| 750 |
| 601 |
|
Austria (1.9%) |
|
|
|
|
|
|
|
|
|
Republic of Austria |
|
|
|
|
|
|
|
|
|
5.00%, due 01/15/2008 |
|
|
| EUR |
| 6,000 |
| 7,756 |
|
Belgium (2.6%) |
|
|
|
|
|
|
|
|
|
Kingdom of Belgium |
|
|
|
|
|
|
|
|
|
3.00%, due 03/28/2010 |
|
|
| EUR |
| 6,330 |
| 7,788 |
|
8.00%, due 03/28/2015 |
|
|
| EUR |
| 1,700 |
| 2,782 |
|
Denmark (0.5%) |
|
|
|
|
|
|
|
|
|
Kingdom of Denmark |
|
|
|
|
|
|
|
|
|
6.00%, due 11/15/2009 |
|
|
| DKK |
| 10,920 |
| 1,985 |
|
France (14.0%) |
|
|
|
|
|
|
|
|
|
Caisse d’Amortissement de la Dette Sociale |
|
|
|
|
|
|
|
|
|
3.75%, due 10/25/2020 |
|
|
| EUR |
| 4,520 |
| 5,387 |
|
French Republic |
|
|
|
|
|
|
|
|
|
Zero Coupon, due 09/28/2006 |
| d |
| EUR |
| 260 |
| 324 |
|
3.13%, due 07/12/2010 |
|
|
| EUR |
| 8,900 |
| 10,962 |
|
3.00%, due 01/12/2011 |
|
|
| EUR |
| 8,700 |
| 10,633 |
|
5.00%, due 10/25/2016 |
|
|
| EUR |
| 4,580 |
| 6,254 |
|
4.75%, due 04/25/2035 |
|
|
| EUR |
| 16,642 |
| 22,801 |
|
Germany (10.4%) |
|
|
|
|
|
|
|
|
|
Republic of Germany |
|
|
|
|
|
|
|
|
|
2.50%, due 03/23/2007 |
|
|
| EUR |
| 24,580 |
| 30,797 |
|
4.75%, due 07/04/2034 |
|
|
| EUR |
| 2,570 |
| 3,528 |
|
4.00%, due 01/04/2037 |
|
|
| EUR |
| 6,200 |
| 7,555 |
|
Ireland (2.0%) |
|
|
|
|
|
|
|
|
|
Irish Government |
|
|
|
|
|
|
|
|
|
4.50%, due 04/18/2020 |
|
|
| EUR |
| 6,000 |
| 7,867 |
|
Italy (1.9%) |
|
|
|
|
|
|
|
|
|
Italian Republic |
|
|
|
|
|
|
|
|
|
7.25%, due 11/01/2026 |
|
|
| EUR |
| 4,440 |
| 7,670 |
|
Japan (16.9%) |
|
|
|
|
|
|
|
|
|
Development Bank of Japan |
|
|
|
|
|
|
|
|
|
1.60%, due 06/20/2014 |
|
|
| JPY |
| 510,000 |
| 4,381 |
|
Japan Finance Corp. for Municipal Enterprises |
|
|
|
|
|
|
|
|
|
1.55%, due 02/21/2012 |
|
|
| JPY |
| 1,656,000 |
| 14,527 |
|
Japan Government |
|
|
|
|
|
|
|
|
|
0.20%, due 09/20/2007 |
|
|
| JPY |
| 1,169,950 |
| 10,215 |
|
0.80%, due 06/20/2009 |
|
|
| JPY |
| 876,800 |
| 7,639 |
|
0.80%, due 09/20/2010 |
|
|
| JPY |
| 680,000 |
| 5,839 |
|
1.30%, due 03/20/2015 |
|
|
| JPY |
| 1,597,150 |
| 13,331 |
|
1.05%, due 06/20/2023 |
|
|
| JPY |
| 1,071,000 |
| 7,742 |
|
2.10%, due 09/20/2024 |
|
|
| JPY |
| 130,000 |
| 1,121 |
|
1.90%, due 06/20/2025 |
|
|
| JPY |
| 301,700 |
| 2,513 |
|
2.50%, due 09/20/2035 |
|
|
| JPY |
| 108,000 |
| 953 |
|
Netherlands (4.0%) |
|
|
|
|
|
|
|
|
|
Kingdom of the Netherlands |
|
|
|
|
|
|
|
|
|
3.00%, due 07/15/2007 |
|
|
| EUR |
| 4,600 |
| 5,778 |
|
7.50%, due 01/15/2023 |
|
|
| EUR |
| 3,600 |
| 6,349 |
|
4.00%, due 01/15/2037 |
|
|
| EUR |
| 3,450 |
| 4,182 |
|
Spain (1.8%) |
|
|
|
|
|
|
|
|
|
Kingdom of Spain |
|
|
|
|
|
|
|
|
|
3.00%, due 07/30/2007 |
|
|
| EUR |
| 5,900 |
| 7,411 |
|
United Kingdom (1.9%) |
|
|
|
|
|
|
|
|
|
United Kingdom |
|
|
|
|
|
|
|
|
|
5.00%, due 03/07/2012 |
|
|
| GBP |
| 1,150 |
| 2,126 |
|
4.75%, due 09/07/2015 |
|
|
| GBP |
| 1,750 |
| 3,206 |
|
8.00%, due 06/07/2021 |
|
|
| GBP |
| 960 |
| 2,386 |
|
Total Foreign Government Obligations (cost: $230,191) |
|
|
|
|
|
|
| 234,389 |
|
24
TA IDEX JPMorgan International Bond
SCHEDULE OF INVESTMENTS
At April 30, 2006
(all amounts except share amounts in thousands)
(unaudited)
CORPORATE DEBT SECURITIES (32.2%) |
|
|
|
|
|
|
|
|
| |
France (5.3%) |
|
|
|
|
|
|
|
|
| |
Cie Financement Foncier |
|
|
|
|
|
|
|
|
| |
3.63%, due 01/28/2008 |
|
|
| EUR |
| 7,000 |
| 8,842 |
| |
|
|
|
|
|
|
|
|
|
| |
Compagnie de Financement Foncier, Series E, Note, (MTN) |
|
|
|
|
|
|
|
|
| |
0.60%, due 03/23/2010 |
|
|
| JPY |
| 800,000 |
| 6,832 |
| |
Dexia Municipal Agency, Series E |
|
|
|
|
|
|
|
|
| |
3.50%, due 09/21/2009 |
|
|
| EUR |
| 4,530 |
| 5,667 |
| |
Germany (9.5%) |
|
|
|
|
|
|
|
|
| |
Bayerische Landesbank |
|
|
|
|
|
|
|
|
| |
1.40%, due 04/22/2013 |
|
|
| JPY |
| 1,158,000 |
| 9,877 |
| |
Bayerische Landesbank, Series E, Note, (MTN) |
|
|
|
|
|
|
|
|
| |
1.00%, due 09/20/2010 |
|
|
| JPY |
| 804,000 |
| 6,911 |
| |
Eurohypo AG |
|
|
|
|
|
|
|
|
| |
5.25%, due 09/21/2007 |
|
|
| EUR |
| 12,950 |
| 16,721 |
| |
Kreditanstalt fuer Wiederaufbau |
|
|
|
|
|
|
|
|
| |
5.50%, due 12/07/2015 |
|
|
| GBP |
| 500 |
| 947 |
| |
Kreditanstalt fuer Wiederaufbau, Series E |
|
|
|
|
|
|
|
|
| |
2.50%, due 11/17/2008 |
|
|
| EUR |
| 2,500 |
| 3,070 |
| |
Landwirtschaftliche Rentenbank, Series E |
|
|
|
|
|
|
|
|
| |
1.38%, due 04/25/2013 |
|
|
| JPY |
| 101,000 |
| 860 |
| |
Netherlands (2.1%) |
|
|
|
|
|
|
|
|
| |
Bank Nederlandse Gemeenten, Note |
|
|
|
|
|
|
|
|
| |
0.80%, due 09/22/2008 |
|
|
| JPY |
| 994,000 |
| 8,706 |
| |
Spain (5.9%) |
|
|
|
|
|
|
|
|
| |
Banco Bilbao Vizcaya Argentaria SA |
|
|
|
|
|
|
|
|
| |
4.25%, due 09/26/2007 |
|
|
| EUR |
| 13,500 |
| 17,199 |
| |
La Caja de Ahorros y Pensiones de Barcelona |
|
|
|
|
|
|
|
|
| |
3.25%, due 10/05/2015 |
|
|
| EUR |
| 2,300 |
| 2,679 |
| |
UCI, Series 15, Class A |
|
|
|
|
|
|
|
|
| |
3.05%, due 12/18/2045 |
| * |
| EUR |
| 3,000 |
| 3,779 |
| |
Supra National (4.5%) |
|
|
|
|
|
|
|
|
| |
European Investment Bank |
|
|
|
|
|
|
|
|
| |
1.40%, due 06/20/2017 |
|
|
| JPY |
| 896,000 |
| 7,349 |
| |
European Investment Bank, Note, (MTN) |
|
|
|
|
|
|
|
|
| |
5.63%, due 10/15/2010 |
|
|
| EUR |
| 7,900 |
| 10,693 |
| |
United Kingdom (4.9%) |
|
|
|
|
|
|
|
|
| |
Barclays Bank PLC |
|
|
|
|
|
|
|
|
| |
Zero Coupon, due 05/19/2006 |
|
|
| EUR |
| 5,000 |
| 6,036 |
| |
Network Rail Infra Finance |
|
|
|
|
|
|
|
|
| |
4.75%, due 11/29/2035 |
|
|
| GBP |
| 1,930 |
| 3,636 |
| |
Network Rail Infrastructure Finance PLC, Series E, Note, (MTN) |
|
|
|
|
|
|
|
|
| |
4.38%, due 01/18/2011 |
|
|
| GBP |
| 5,720 |
| 10,175 |
| |
Total Corporate Debt Securities (cost: $127,581) |
|
|
|
|
|
|
| 129,979 |
| |
SHORT-TERM OBLIGATIONS (8.2%) |
|
|
|
|
|
|
|
|
| |
Netherlands (8.2%) |
|
|
|
|
|
|
|
|
| |
ABN AMRO Holding NV Time Deposit |
|
|
|
|
|
|
|
|
| |
4.85%, due 05/02/2006 |
|
|
|
|
| 13,500 |
| 13,500 |
| |
Rabobank Nederland NV/London Time Deposit |
|
|
|
|
|
|
|
|
| |
4.87%, due 05/02/2006 |
|
|
|
|
| 19,500 |
| 19,500 |
| |
Total Short-Term Obligations (cost: $33,000) |
|
|
|
|
|
|
| 33,000 |
| |
Total Investment Securities (cost: $390,772) |
| # |
|
|
|
|
| $ | 397,368 |
|
NOTES TO SCHEDULE OF INVESTMENTS:
* Floating or variable rate note. Rate is listed as of April 30, 2006.
25
TA IDEX JPMorgan International Bond
SCHEDULE OF INVESTMENTS
At April 30, 2006
(all amounts except share amounts in thousands)
(unaudited)
d At April 30, 2006, all or a portion of this security is segregated with the custodian to cover margin requirements for open futures contracts. The value of all securities segregated at April 30, 2006 is $324.
# Aggregate cost for Federal income tax purposes is $390,995. Aggregate gross unrealized appreciation for all securities in which there is an excess of value over tax cost and aggregate gross unrealized depreciation for all securities in which there is an excess of tax cost over value were $6,787 and $414, respectively. Net unrealized appreciation for tax purposes is $6,373.
DEFINITIONS:
AUD Australian Dollar
DKK Danish Krone
EUR Euro
GBP Great British Pound
JPY Japanese Yen
MTN Medium-Term Note
The notes to the financial statements are an integral part of this report.
26
TA IDEX JPMorgan International Bond
SCHEDULE OF INVESTMENTS
At April 30, 2006
(all amounts except share amounts in thousands)
(unaudited)
FUTURES CONTRACTS:
|
|
|
|
|
|
|
| Net Unrealized |
| ||
|
|
|
| Settlement |
|
|
| Appreciation |
| ||
|
| Contracts |
| Date |
| Amount |
| (Depreciation) |
| ||
Euro-BUND |
| (69 | ) | 06/10/2006 |
| $ | (10,046 | ) | $ | 105 |
|
|
|
|
|
|
| $ | (10,046 | ) | $ | 105 |
|
The notes to the financial statements are an integral part of this report.
27
TA IDEX JPMorgan International Bond
SCHEDULE OF INVESTMENTS
At April 30, 2006
(all amounts except share amounts in thousands)
(unaudited)
FORWARD FOREIGN CURRENCY CONTRACTS:
|
|
|
|
|
| Amount in |
| Net Unrealized |
| ||||
|
| Bought |
| Settlement |
| U.S. Dollars |
| Appreciation |
| ||||
Currency |
|
|
| (Sold) |
| Date |
| Bought (Sold) |
| (Depreciation) |
| ||
Australian Dollar |
| 952 |
| 05/30/2006 |
| $ | 674 |
| $ | 48 |
| ||
Australian Dollar |
| (1,826 | ) | 05/30/2006 |
| (1,307 | ) | (78 | ) | ||||
British Pound Sterling |
| 14,033 |
| 05/30/2006 |
| 24,549 |
| 967 |
| ||||
British Pound Sterling |
| (5,500 | ) | 05/30/2006 |
| (9,572 | ) | (428 | ) | ||||
Canadian Dollar |
| 14,943 |
| 05/30/2006 |
| 13,134 |
| 212 |
| ||||
Canadian Dollar |
| (12,082 | ) | 05/30/2006 |
| (10,406 | ) | (385 | ) | ||||
Danish Krone |
| (11,135 | ) | 05/30/2006 |
| (1,792 | ) | (92 | ) | ||||
Euro Dollar |
| 59,352 |
| 05/30/2006 |
| 72,467 |
| 2,428 |
| ||||
Euro Dollar |
| (106,392 | ) | 05/30/2006 |
| (129,435 | ) | (4,818 | ) | ||||
Japanese Yen |
| 11,364,882 |
| 05/30/2006 |
| 97,850 |
| 2,053 |
| ||||
Japanese Yen |
| (7,681,592 | ) | 05/30/2006 |
| (65,889 | ) | (1,636 | ) | ||||
New Zealand Dollar |
| 1,927 |
| 05/30/2006 |
| 1,179 |
| 44 |
| ||||
Singapore Dollar |
| 3,078 |
| 05/30/2006 |
| 1,942 |
| 7 |
| ||||
Swedish Krona |
| 54,076 |
| 05/30/2006 |
| 7,011 |
| 327 |
| ||||
|
|
|
|
|
| $ | 405 |
| $ | (1,351 | ) | ||
FORWARD FOREIGN CROSS CURRENCY CONTRACTS:
|
|
|
|
|
|
|
|
|
| Net Unrealized |
| ||
|
|
|
|
|
|
|
| Settlement |
| Appreciation |
| ||
Currency Bought |
|
|
|
|
| Currency Sold |
|
|
| Date |
| (Depreciation) |
|
Australian Dollar |
| 1,396 |
| Euro Dollar |
| 820 |
| 5/30/2006 |
| 23 |
| ||
British Pound Sterling |
| 496 |
| Canadian Dollar |
| 1,000 |
| 5/30/2006 |
| 8 |
| ||
British Pound Sterling |
| 385 |
| Euro Dollar |
| 553 |
| 5/30/2006 |
| 3 |
| ||
Canadian Dollar |
| 569 |
| New Zealand Dollar |
| 805 |
| 5/30/2006 |
| (2 | ) | ||
Euro Dollar |
| 754 |
| Australian Dollar |
| 1,288 |
| 5/30/2006 |
| (27 | ) | ||
Euro Dollar |
| 1,006 |
| British Pound Sterling |
| 701 |
| 5/30/2006 |
| (5 | ) | ||
Euro Dollar |
| 446 |
| Canadian Dollar |
| 631 |
| 5/30/2006 |
| (1 | ) | ||
Euro Dollar |
| 1,568 |
| Japanese Yen |
| 223,147 |
| 5/30/2006 |
| 18 |
| ||
Euro Dollar |
| 180 |
| New Zealand Dollar |
| 351 |
| 5/30/2006 |
| 3 |
| ||
Euro Dollar |
| 1,042 |
| Norwegian Krone |
| 8,172 |
| 5/30/2006 |
| (10 | ) | ||
Japanese Yen |
| 56,632 |
| Euro Dollar |
| 403 |
| 5/30/2006 |
| (11 | ) | ||
New Zealand Dollar |
| 733 |
| Canadian Dollar |
| 533 |
| 5/30/2006 |
| (11 | ) | ||
New Zealand Dollar |
| 549 |
| Euro Dollar |
| 275 |
| 5/30/2006 |
| 2 |
| ||
Norwegian Krone |
| 11,708 |
| Euro Dollar |
| 1,492 |
| 5/30/2006 |
| 16 |
| ||
28
Norwegian Krone |
| 4,196 |
| Swedish Krona |
| 5,006 |
| 5/30/2006 |
| 1 |
|
Swedish Krona |
| 4,125 |
| Norwegian Krone |
| 3,464 |
| 5/30/2006 |
| (2 | ) |
|
|
|
|
|
|
|
|
|
| 5 |
|
The notes to the financial statements are an integral part of this report.
29
TA IDEX JPMorgan International Bond
SCHEDULE OF INVESTMENTS
April 30, 2006
(all amounts except share amounts in thousands)
(unaudited)
|
| Percentage of |
|
|
| |
|
| Net Assets |
| Value |
| |
INVESTMENTS BY INDUSTRY: |
|
|
|
|
| |
Sovereign Government |
| 58.1 | % | $ | 234,389 |
|
Commercial Banks |
| 31.3 | % | 126,200 |
| |
Mortgage-Backed |
| 0.9 | % | 3,779 |
| |
Investment Securities, at value |
| 90.3 | % | 364,368 |
| |
Short-Term Investments |
| 8.2 | % | 33,000 |
| |
Total Investment Securities |
| 98.5 | % | 397,368 |
| |
The notes to the financial statements are an integral part of this report.
30
TA IDEX J. P. Morgan Mid Cap Value
UNDERSTANDING YOUR FUND’S EXPENSES
(unaudited)
SHAREHOLDER EXPENSES
Fund shareholders may incur ongoing costs, including management fees, 12b-1 distribution and service fees, and other fund expenses. Shares of the Fund currently are sold only to certain Transamerica IDEX Mutual Funds and AEGON/Transamerica Series Trust (an affiliate of Transamerica IDEX Mutual Funds) asset allocation funds at net asset value, without any transaction costs.
The following Example is intended to help you understand your ongoing costs (in dollars and cents) of investing in the Fund and to compare these costs with the ongoing costs of investing in other funds.
The Example is based on an investment of $1,000 invested at November 15, 2005 and held for the entire period until April 30, 2006.
ACTUAL EXPENSES
The first line in the table below provides information about actual account values and actual expenses. You may use the information in this line, together with the amount you invested, to estimate the expenses that you paid over the period. Simply divide your account value by $1,000 (for example, an $8,600 account value divided by $1,000 = 8.6), then multiply the result by the number in the first line of your Fund under the heading entitled “Expenses Paid During Period” to estimate the expenses you paid on your account during this period.
HYPOTHETICAL EXAMPLE FOR COMPARISON PURPOSES
The second line in the table below provides information about hypothetical account values and hypothetical expenses based on the Fund’s actual expense ratio and an assumed rate of return of 5% per year before expenses, which is not the Fund’s actual return. The hypothetical account values and expenses may not be used to estimate the actual ending account balance or expenses you paid for the period. You may use this information to compare the ongoing costs of investing in your Fund and other funds. To do so, compare this 5% hypothetical example with the 5% hypothetical examples that appear in the shareholder reports of the other funds.
|
| Beginning |
| Ending Account |
| Annualized |
| Expenses Paid |
| |||
Class I |
|
|
|
|
|
|
|
|
| |||
Actual |
| $ | 1,000.00 |
| $ | 1,104.10 |
| 0.88 | % | $ | 4.21 |
|
Hypothetical(b) |
| 1,000.00 |
| 1,018.74 |
| 0.88 | % | 4.04 |
| |||
(a) Expenses are calculated using the Fund’s annualized expense ratio (as disclosed in the table), multiplied by the average account value for the period, multiplied by number of days in the period (166 days), and divided by the number of days in the year (365 days).
(b) 5% return per year before expenses.
31
TA IDEX J. P. Morgan Mid Cap Value
TABULAR PRESENTATION OF SCHEDULE OF INVESTMENTS
By Sector
At April 30, 2006
|
|
| |
Basic Materials |
| 6.7 | % |
Communications |
| 7.7 | % |
Consumer Cyclical |
| 14.5 | % |
Consumer Non-Cyclical |
| 10.6 | % |
Diversified |
| 1.0 | % |
Energy |
| 5.7 | % |
Financial |
| 22.5 | % |
Industrial |
| 8.6 | % |
Other |
| 12.1 | % |
Technology |
| 2.3 | % |
Utilities |
| 8.3 | % |
|
| 100.0 | % |
This chart shows the percentage breakdown by sector of the Fund’s total investment securities
32
TA IDEX J.P. Morgan Mid Cap Value
SCHEDULE OF INVESTMENTS
At April 30, 2006
(all amounts except share amounts in thousands)
(unaudited)
|
|
|
| Shares |
| Value |
| |
COMMON STOCKS (95.2%) |
|
|
|
|
|
|
| |
Apparel & Accessory Stores (1.1%) |
|
|
|
|
|
|
| |
Limited Brands, Inc. |
| † |
| 102,900 |
| $ | 2,638 |
|
Apparel Products (3.5%) |
|
|
|
|
|
|
| |
Columbia Sportswear Co. |
| †‡ |
| 46,500 |
| 2,366 |
| |
V.F. Corp. |
|
|
| 96,200 |
| 5,886 |
| |
Automotive (1.8%) |
|
|
|
|
|
|
| |
Genuine Parts Co. |
| † |
| 74,000 |
| 3,230 |
| |
Harsco Corp. |
|
|
| 12,400 |
| 1,034 |
| |
Automotive Dealers & Service Stations (2.3%) |
|
|
|
|
|
|
| |
AutoNation, Inc. |
| ‡ |
| 61,961 |
| 1,395 |
| |
AutoZone, Inc. |
| ‡ |
| 42,100 |
| 3,941 |
| |
Beverages (1.3%) |
|
|
|
|
|
|
| |
Brown-Forman Corp.-Class B |
|
|
| 13,600 |
| 1,013 |
| |
Constellation Brands, Inc.-Class A |
| ‡ |
| 84,500 |
| 2,087 |
| |
Business Services (1.6%) |
|
|
|
|
|
|
| |
Clear Channel Communications, Inc. |
| † |
| 77,000 |
| 2,197 |
| |
Clear Channel Outdoor Holdings, Inc.-Class A |
| ‡ |
| 63,900 |
| 1,508 |
| |
Chemicals & Allied Products (4.4%) |
|
|
|
|
|
|
| |
Albemarle Corp. |
|
|
| 56,036 |
| 2,680 |
| |
Clorox Co. |
|
|
| 42,500 |
| 2,728 |
| |
Lauder (Estee) Cos., Inc. (The)-Class A |
|
|
| 55,200 |
| 2,049 |
| |
PPG Industries, Inc. |
|
|
| 42,700 |
| 2,866 |
| |
Commercial Banks (7.9%) |
|
|
|
|
|
|
| |
Cullen/Frost Bankers, Inc. |
|
|
| 37,800 |
| 2,188 |
| |
M&T Bank Corp. |
|
|
| 39,000 |
| 4,657 |
| |
North Fork Bancorp, Inc. |
|
|
| 135,100 |
| 4,071 |
| |
Northern Trust Corp. |
|
|
| 27,900 |
| 1,643 |
| |
TCF Financial Corp. |
|
|
| 67,900 |
| 1,824 |
| |
Wilmington Trust Corp. |
|
|
| 49,800 |
| 2,206 |
| |
Zions Bancorp |
|
|
| 22,600 |
| 1,876 |
| |
Communication (0.5%) |
|
|
|
|
|
|
| |
Cablevision Systems Corp.-Class A |
| ‡ |
| 58,800 |
| 1,192 |
| |
Computer & Data Processing Services (2.9%) |
|
|
|
|
|
|
| |
Affiliated Computer Services, Inc.-Class A |
| ‡ |
| 35,600 |
| 1,985 |
| |
CA, Inc. |
| † |
| 84,100 |
| 2,133 |
| |
Interactive Data Corp. |
| ‡ |
| 43,100 |
| 960 |
| |
NCR Corp. |
| †‡ |
| 42,500 |
| 1,674 |
| |
Computer & Office Equipment (0.0%) |
|
|
|
|
|
|
| |
Pitney Bowes, Inc. |
|
|
| 600 |
| 25 |
| |
Department Stores (2.1%) |
|
|
|
|
|
|
| |
Federated Department Stores, Inc. |
|
|
| 32,571 |
| 2,536 |
| |
TJX Cos., Inc. |
|
|
| 100,500 |
| 2,425 |
| |
Electric Services (5.7%) |
|
|
|
|
|
|
| |
American Electric Power Co., Inc. |
|
|
| 56,100 |
| 1,877 |
| |
DPL, Inc. |
|
|
| 62,300 |
| 1,693 |
| |
Energy East Corp. |
|
|
| 68,300 |
| 1,650 |
| |
FirstEnergy Corp. |
|
|
| 28,900 |
| 1,466 |
| |
PPL Corp. |
|
|
| 85,900 |
| 2,495 |
| |
SCANA Corp. |
|
|
| 52,800 |
| 2,067 |
| |
Westar Energy, Inc. |
|
|
| 94,100 |
| 1,970 |
| |
Electric, Gas & Sanitary Services (1.9%) |
|
|
|
|
|
|
| |
PG&E Corp. |
|
|
| 52,100 |
| 2,076 |
| |
Republic Services, Inc. |
|
|
| 51,000 |
| 2,245 |
| |
Electrical Goods (1.2%) |
|
|
|
|
|
|
| |
Carlisle Cos., Inc. |
|
|
| 33,500 |
| 2,831 |
| |
Electronic & Other Electric Equipment (2.2%) |
|
|
|
|
|
|
| |
Ametek, Inc. |
|
|
| 52,800 |
| 2,601 |
| |
Cooper Industries, Ltd.-Class A |
|
|
| 28,800 |
| 2,634 |
| |
Electronic Components & Accessories (0.6%) |
|
|
|
|
|
|
| |
Amphenol Corp.-Class A |
|
|
| 25,800 |
| 1,491 |
| |
Fabricated Metal Products (2.2%) |
|
|
|
|
|
|
| |
Crane Co. |
|
|
| 52,500 |
| 2,218 |
| |
Fortune Brands, Inc. |
|
|
| 35,500 |
| 2,851 |
| |
33
TA IDEX J.P. Morgan Mid Cap Value
SCHEDULE OF INVESTMENTS
At April 30, 2006
(all amounts except share amounts in thousands)
(unaudited)
Food & Kindred Products (0.7%) |
|
|
|
|
|
|
|
Del Monte Foods Co. |
|
|
| 134,800 |
| 1,572 |
|
Furniture & Home Furnishings Stores (0.2%) |
|
|
|
|
|
|
|
Tuesday Morning Corp. |
| † |
| 19,076 |
| 361 |
|
Gas Production & Distribution (6.4%) |
|
|
|
|
|
|
|
AGL Resources, Inc. |
|
|
| 54,900 |
| 1,942 |
|
Energen Corp. |
|
|
| 58,800 |
| 2,074 |
|
Kinder Morgan, Inc. |
|
|
| 45,300 |
| 3,987 |
|
Questar Corp. |
|
|
| 34,700 |
| 2,778 |
|
UGI Corp. |
|
|
| 77,100 |
| 1,727 |
|
Williams Cos., Inc. (The) |
|
|
| 105,700 |
| 2,318 |
|
Health Services (4.2%) |
|
|
|
|
|
|
|
Community Health Systems, Inc. |
| ‡ |
| 42,900 |
| 1,555 |
|
Coventry Health Care, Inc. |
| ‡ |
| 82,650 |
| 4,105 |
|
Omnicare, Inc. |
|
|
| 29,100 |
| 1,650 |
|
Quest Diagnostics, Inc. |
|
|
| 44,300 |
| 2,469 |
|
Holding & Other Investment Offices (2.6%) |
|
|
|
|
|
|
|
Istar Financial Inc. REIT |
|
|
| 39,800 |
| 1,523 |
|
Rayonier, Inc. |
|
|
| 42,185 |
| 1,736 |
|
Vornado Realty Trust REIT |
| † |
| 28,900 |
| 2,764 |
|
Hotels & Other Lodging Places (1.2%) |
|
|
|
|
|
|
|
Hilton Hotels Corp. |
|
|
| 104,800 |
| 2,823 |
|
Industrial Machinery & Equipment (1.0%) |
|
|
|
|
|
|
|
American Standard Cos., Inc. |
|
|
| 53,400 |
| 2,325 |
|
Insurance (9.1%) |
|
|
|
|
|
|
|
Assurant, Inc. |
| † |
| 110,500 |
| 5,323 |
|
Cincinnati Financial Corp. |
|
|
| 66,055 |
| 2,817 |
|
IPC Holdings, Ltd. |
|
|
| 54,200 |
| 1,446 |
|
MGIC Investment Corp. |
|
|
| 38,500 |
| 2,722 |
|
Old Republic International Corp. |
|
|
| 160,550 |
| 3,572 |
|
Principal Financial Group |
|
|
| 45,100 |
| 2,314 |
|
SAFECO Corp. |
|
|
| 60,300 |
| 3,130 |
|
Metal Cans & Shipping Containers (1.0%) |
|
|
|
|
|
|
|
Ball Corp. |
|
|
| 61,400 |
| 2,455 |
|
Mining (1.3%) |
|
|
|
|
|
|
|
Vulcan Materials Co. |
|
|
| 35,900 |
| 3,050 |
|
Oil & Gas Extraction (1.7%) |
|
|
|
|
|
|
|
Devon Energy Corp. |
|
|
| 64,400 |
| 3,871 |
|
Paper & Allied Products (0.8%) |
|
|
|
|
|
|
|
MeadWestvaco Corp. |
|
|
| 67,500 |
| 1,924 |
|
Petroleum Refining (1.6%) |
|
|
|
|
|
|
|
Ashland, Inc. |
|
|
| 33,000 |
| 2,172 |
|
Marathon Oil Corp. |
| † |
| 18,679 |
| 1,482 |
|
Pharmaceuticals (1.9%) |
|
|
|
|
|
|
|
Henry Schein, Inc. |
| †‡ |
| 38,525 |
| 1,796 |
|
Sigma-Aldrich Corp. |
| † |
| 36,800 |
| 2,525 |
|
Printing & Publishing (2.1%) |
|
|
|
|
|
|
|
Gannett Co., Inc. |
|
|
| 24,300 |
| 1,336 |
|
McClatchy Co.-Class A |
| † |
| 26,800 |
| 1,211 |
|
Washington Post-Class B |
|
|
| 3,000 |
| 2,298 |
|
Railroads (0.8%) |
|
|
|
|
|
|
|
Norfolk Southern Corp. |
|
|
| 32,700 |
| 1,766 |
|
Real Estate (1.7%) |
|
|
|
|
|
|
|
Brookfield Properties Co. |
|
|
| 74,400 |
| 2,388 |
|
Forest City Enterprises, Inc.-Class A |
|
|
| 33,700 |
| 1,521 |
|
Residential Building Construction (1.0%) |
|
|
|
|
|
|
|
Walter Industries, Inc. |
| † |
| 36,400 |
| 2,414 |
|
Restaurants (2.1%) |
|
|
|
|
|
|
|
Applebees International, Inc. |
| † |
| 89,800 |
| 2,084 |
|
OSI Restaurant Partners, Inc. |
|
|
| 64,700 |
| 2,763 |
|
Retail Trade (1.8%) |
|
|
|
|
|
|
|
Family Dollar Stores, Inc. |
| † |
| 67,700 |
| 1,693 |
|
Tiffany & Co. |
| † |
| 70,600 |
| 2,463 |
|
Savings Institutions (2.6%) |
|
|
|
|
|
|
|
Golden West Financial Corp. |
| † |
| 58,600 |
| 4,212 |
|
34
TA IDEX J.P. Morgan Mid Cap Value
SCHEDULE OF INVESTMENTS
At April 30, 2006
(all amounts except share amounts in thousands)
(unaudited)
Webster Financial Corp. |
|
|
| 38,200 |
| 1,793 |
|
Security & Commodity Brokers (1.2%) |
|
|
|
|
|
|
|
E*TRADE Financial Corp. |
| ‡ |
| 45,700 |
| 1,137 |
|
T. Rowe Price Group, Inc. |
|
|
| 20,600 |
| 1,734 |
|
Telecommunications (4.2%) |
|
|
|
|
|
|
|
ALLTEL Corp. |
|
|
| 69,400 |
| 4,467 |
|
CenturyTel, Inc. |
|
|
| 86,800 |
| 3,272 |
|
Telephone & Data Systems, Inc. |
|
|
| 51,800 |
| 1,953 |
|
Wholesale Trade Nondurable Goods (0.8%) |
|
|
|
|
|
|
|
Dean Foods Co. |
| ‡ |
| 47,100 |
| 1,866 |
|
Total Common Stocks (cost: $204,975) |
|
|
|
|
| 221,857 |
|
|
|
|
| Principal |
| Value |
|
SECURITY LENDING COLLATERAL (13.1%) |
|
|
|
|
|
|
|
Debt (12.3%) |
|
|
|
|
|
|
|
Bank Notes (1.5%) |
|
|
|
|
|
|
|
Bank of America |
|
|
|
|
|
|
|
4.81%, due 06/07/2006 |
| * |
| 1,007 |
| 1,007 |
|
4.81%, due 08/10/2006 |
| * |
| 972 |
| 972 |
|
Bear Stearns & Co. |
|
|
|
|
|
|
|
5.01%, due 06/06/2006 |
| * |
| 389 |
| 389 |
|
5.01%, due 09/07/2006 |
| * |
| 1,166 |
| 1,166 |
|
Certificates Of Deposit (0.8%) |
|
|
|
|
|
|
|
Halifax Bank of Scotland |
|
|
|
|
|
|
|
4.78%, due 06/06/2006 |
| * |
| 972 |
| 972 |
|
Rabobank Nederland |
|
|
|
|
|
|
|
4.87%, due 05/31/2006 |
| * |
| 972 |
| 972 |
|
Commercial Paper (0.7%) |
|
|
|
|
|
|
|
Banco Santander Central Hispano SA |
|
|
|
|
|
|
|
4.77%, due 05/02/2006 |
|
|
| 583 |
| 583 |
|
Sheffield Receivables Corp.-144A |
|
|
|
|
|
|
|
4.81%, due 05/03/2006 |
|
|
| 970 |
| 970 |
|
Euro Dollar Overnight (2.2%) |
|
|
|
|
|
|
|
Bank of Montreal |
|
|
|
|
|
|
|
4.77%, due 05/02/2006 |
|
|
| 777 |
| 777 |
|
Dexia Group |
|
|
|
|
|
|
|
4.78%, due 05/04/2006 |
|
|
| 972 |
| 972 |
|
Fortis Bank |
|
|
|
|
|
|
|
4.77%, due 05/01/2006 |
|
|
| 389 |
| 389 |
|
Royal Bank of Canada |
|
|
|
|
|
|
|
4.77%, due 05/01/2006 |
|
|
| 1,361 |
| 1,361 |
|
Royal Bank of Scotland |
|
|
|
|
|
|
|
4.75%, due 05/03/2006 |
|
|
| 972 |
| 972 |
|
Svenska Handlesbanken |
|
|
|
|
|
|
|
4.82%, due 05/01/2006 |
|
|
| 742 |
| 742 |
|
Euro Dollar Terms (3.4%) |
|
|
|
|
|
|
|
BancoBilbao Vizcaya Argentaria SA |
|
|
|
|
|
|
|
4.95%, due 06/20/2006 |
|
|
| 777 |
| 777 |
|
Bank of the West |
|
|
|
|
|
|
|
4.94%, due 06/16/2006 |
|
|
| 777 |
| 777 |
|
Barclays |
|
|
|
|
|
|
|
4.79%, due 05/10/2006 |
|
|
| 1,166 |
| 1,166 |
|
4.77%, due 05/16/2006 |
|
|
| 389 |
| 389 |
|
Canadian Imperial Bank of Commerce |
|
|
|
|
|
|
|
4.97%, due 06/23/2006 |
|
|
| 583 |
| 583 |
|
Credit Suisse First Boston Corp. |
|
|
|
|
|
|
|
4.73%, due 05/08/2006 |
|
|
| 583 |
| 583 |
|
Fortis Bank |
|
|
|
|
|
|
|
4.83%, due 05/08/2006 |
|
|
| 389 |
| 389 |
|
Lloyds TSB Bank |
|
|
|
|
|
|
|
4.81%, due 05/11/2006 |
|
|
| 583 |
| 583 |
|
Royal Bank of Scotland |
|
|
|
|
|
|
|
35
TA IDEX J.P. Morgan Mid Cap Value
SCHEDULE OF INVESTMENTS
At April 30, 2006
(all amounts except share amounts in thousands)
(unaudited)
4.87%, due 05/12/2006 |
|
|
| 777 |
| 777 |
|
Societe Generale |
|
|
|
|
|
|
|
4.79%, due 05/10/2006 |
|
|
| 972 |
| 972 |
|
UBS AG |
|
|
|
|
|
|
|
4.95%, due 06/20/2006 |
|
|
| 972 |
| 972 |
|
Repurchase Agreements (3.7%) |
| †† |
|
|
|
|
|
Credit Suisse First Boston Corp. 4.92%, dated 04/28/2006 to be repurchased at $1,320 on 05/01/2006 |
|
|
| 1,320 |
| 1,320 |
|
Goldman Sachs Group, Inc. (The) 4.92%, dated 04/28/2006 to be repurchased at $2,856 on 05/01/2006 |
|
|
| 2,855 |
| 2,855 |
|
Lehman Brothers, Inc. 4.92%, dated 04/28/2006 to be repurchased at $48 on 05/01/2006 |
|
|
| 48 |
| 48 |
|
Merrill Lynch & Co. 4.87%, dated 04/28/2006 to be repurchased at $2,917 on 05/01/2006 |
|
|
| 2,915 |
| 2,915 |
|
Morgan Stanley Dean Witter & Co. 4.93%, dated 04/28/2006 to be repurchased at $1,361 on 05/01/2006 |
|
|
| 1,360 |
| 1,360 |
|
|
|
|
| Shares |
| Value |
| |
Investment Companies (0.8%) |
|
|
|
|
|
|
| |
Barclays Global Investors Institutional Money Market Fund |
|
|
|
|
|
|
| |
1-day yield of 4.78% |
|
|
| 1,554,849 |
| 1,555 |
| |
Merrimac Cash Fund, Premium Class |
|
|
|
|
|
|
| |
1-day yield of 4.61% |
| @ |
| 413,692 |
| 414 |
| |
Total Security Lending Collateral (cost: $30,679) |
|
|
|
|
| 30,679 |
| |
Total Investment Securities (cost: $235,654) |
| # |
|
|
| $ | 252,536 |
|
The notes to the financial statements are an integral part of this report.
NOTES TO SCHEDULE OF INVESTMENTS:
† At April 30, 2006, all or a portion of this security is on loan (see Note 1). The value at April 30, 2006, of all securities on loan is $29,716.
‡ Non-income producing.
* Floating or variable rate note. Rate is listed as of April 30, 2006.
†† Cash collateral for the Repurchase Agreements, valued at $8,749, that serve as collateral for securities lending are invested in corporate bonds with interest rates and maturity dates ranging from 0.00% - 9.05% and 05/02/2006 - 12/31/2049, respectively.
@ Regulated investment company advised by Investors Bank and Trust Co. (“IBT”). IBT is also the accounting, custody and lending agent for the Fund.
# Aggregate cost for Federal income tax purposes is $236,646. Aggregate gross unrealized appreciation for all securities in which there is an excess of value over tax cost and aggregate gross unrealized depreciation for all securities in which there is an excess of tax cost over value were $19,375 and $3,485, respectively. Net unrealized appreciation for tax purposes is $15,890.
36
TA IDEX J.P. Morgan Mid Cap Value
SCHEDULE OF INVESTMENTS
At April 30, 2006
(all amounts except share amounts in thousands)
(unaudited)
144A 144A Securities are registered pursuant to Rule 144A of the Securities Act of 1933. These securities are deemed to be liquid for purposes of compliance limitations on holdings of illiquid securities and may be resold as transactions exempt from registration, normally to qualified institutional buyers. At April 30, 2006, these securities aggregated $970 or 0.4% of the net assets of the Fund.
REIT Real Estate Investment Trust
37
TA IDEX Marsico International Growth
UNDERSTANDING YOUR FUND’S EXPENSES
(unaudited)
SHAREHOLDER EXPENSES
Fund shareholders may incur ongoing costs, including management fees, 12b-1 distribution and service fees, and other fund expenses. Shares of the Fund currently are sold only to certain Transamerica IDEX Mutual Funds and AEGON/Transamerica Series Trust (an affiliate of Transamerica IDEX Mutual Funds) asset allocation funds at net asset value, without any transaction costs.
The following Example is intended to help you understand your ongoing costs (in dollars and cents) of investing in the Fund and to compare these costs with the ongoing costs of investing in other funds.
ACTUAL EXPENSES
The first line in the table below provides information about actual account values and actual expenses. You may use the information in this line, together with the amount you invested, to estimate the expenses that you paid over the period. Simply divide your account value by $1,000 (for example, an $8,600 account value divided by $1,000 = 8.6), then multiply the result by the number in the first line of your Fund under the heading entitled “Expenses Paid During Period” to estimate the expenses you paid on your account during this period.
HYPOTHETICAL EXAMPLE FOR COMPARISON PURPOSES
The second line in the table below provides information about hypothetical account values and hypothetical expenses based on the Fund’s actual expense ratio and an assumed rate of return of 5% per year before expenses, which is not the Fund’s actual return. The hypothetical account values and expenses may not be used to estimate the actual ending account balance or expenses you paid for the period. You may use this information to compare the ongoing costs of investing in your Fund and other funds. To do so, compare this 5% hypothetical example with the 5% hypothetical examples that appear in the shareholder reports of the other funds.
|
| Beginning |
| Ending |
| Annualized |
| Expenses Paid |
| |||
Class I |
|
|
|
|
|
|
|
|
| |||
Actual |
| $ | 1,000.00 |
| $ | 1,291.70 |
| 1.16 | % | $ | 6.59 |
|
Hypothetical(b) |
| 1,000.00 |
| 1,019.04 |
| 1.16 | % | 5.81 |
| |||
(a) Expenses are calculated using the Fund’s annualized expense ratio (as disclosed in the table), multiplied by the average account value for the period, multiplied by number of days in the period (181 days), and divided by the number of days in the year (365 days).
(b) 5% return per year before expenses.
38
TA IDEX Marsico International Growth
TABULAR PRESENTATION OF SCHEDULE OF INVESTMENTS
By Region
At April 30, 2006
Asia |
| 1.5 | % |
Europe |
| 47.5 | % |
Latin America |
| 7.9 | % |
North America |
| 10.6 | % |
Other |
| 1.4 | % |
Pacific Rim |
| 27.6 | % |
South America |
| 3.5 | % |
|
| 100.0 | % |
This chart shows the percentage breakdown by region of the Fund’s total investment securities.
39
TA IDEX Marsico International Growth
SCHEDULE OF INVESTMENTS
At April 30, 2006
(all amounts except share amounts in thousands)
(unaudited)
|
|
|
| Shares |
| Value |
|
COMMON STOCKS (97.6%) |
|
|
|
|
|
|
|
Australia (1.2%) |
|
|
|
|
|
|
|
CSL, Ltd. |
|
|
| 116,327 |
| 5,093 |
|
Austria (2.0%) |
|
|
|
|
|
|
|
Erste Bank der Oesterreichischen Sparkassen AG |
|
|
| 108,431 |
| 6,570 |
|
Erste Bank der Oesterreichischen Sparkassen AG |
| ‡ |
| 26,847 |
| 1,608 |
|
Bermuda (1.4%) |
|
|
|
|
|
|
|
Esprit Holdings, Ltd. |
|
|
| 734,500 |
| 5,864 |
|
Brazil (3.5%) |
|
|
|
|
|
|
|
Gafisa SA |
| ‡ |
| 193,125 |
| 1,965 |
|
Petroleo Brasileiro SA, ADR |
|
|
| 66,560 |
| 6,578 |
|
Uniao de Bancos Brasileiros SA, GDR |
|
|
| 74,756 |
| 5,932 |
|
Canada (7.9%) |
|
|
|
|
|
|
|
Canadian National Railway Co. |
|
|
| 226,666 |
| 10,180 |
|
Shoppers Drug Mart Corp. |
|
|
| 238,205 |
| 9,417 |
|
Talisman Energy, Inc. |
|
|
| 226,816 |
| 12,780 |
|
France (9.0%) |
|
|
|
|
|
|
|
JC Decaux SA |
| ‡ |
| 144,192 |
| 4,305 |
|
LVMH Moet Hennessy Louis Vuitton SA |
|
|
| 87,896 |
| 9,239 |
|
Vallourec |
|
|
| 9,949 |
| 12,908 |
|
Veolia Environnement |
|
|
| 176,236 |
| 10,514 |
|
Germany (7.9%) |
|
|
|
|
|
|
|
Continental AG |
|
|
| 134,151 |
| 15,947 |
|
Hypo Real Estate Holding |
|
|
| 173,575 |
| 12,117 |
|
Metro AG |
|
|
| 76,309 |
| 4,316 |
|
Hong Kong (2.5%) |
|
|
|
|
|
|
|
CNOOC, Ltd., ADR |
| † |
| 49,632 |
| 4,104 |
|
Shangri-La Asia, Ltd. |
|
|
| 3,530,000 |
| 6,260 |
|
India (1.5%) |
|
|
|
|
|
|
|
ICICI Bank, Ltd., Sponsored ADR |
| † |
| 222,017 |
| 6,090 |
|
Ireland (1.0%) |
|
|
|
|
|
|
|
Anglo Irish Bank Corp. PLC |
|
|
| 244,074 |
| 4,018 |
|
Japan (20.8%) |
|
|
|
|
|
|
|
Credit Saison Co., Ltd. |
| (a) |
| 114,700 |
| 5,996 |
|
Fanuc, Ltd. |
|
|
| 39,726 |
| 3,746 |
|
Leopalace21 Corp. |
|
|
| 136,788 |
| 5,318 |
|
Marubeni Corp. |
|
|
| 1,798,000 |
| 10,328 |
|
Misawa Homes Holdings, Inc. |
| ‡ |
| 62,500 |
| 3,295 |
|
Mitsubishi Tokyo Financial Group, Inc. |
|
|
| 624 |
| 9,781 |
|
Murata Manufacturing Co., Ltd. |
|
|
| 73,500 |
| 5,336 |
|
Nippon Electric Glass Co., Ltd. |
|
|
| 311,000 |
| 6,999 |
|
Sega Sammy Holdings, Inc. |
|
|
| 196,604 |
| 7,816 |
|
Seiyu, Ltd. (The) |
| ‡† |
| 2,326,000 |
| 5,703 |
|
Sumitomo Realty & Development Co., Ltd. |
|
|
| 146,000 |
| 3,861 |
|
Toyota Motor Corp. |
|
|
| 172,000 |
| 10,031 |
|
Yamada Denki Co., Ltd. |
|
|
| 66,600 |
| 7,237 |
|
Luxembourg (1.4%) |
|
|
|
|
|
|
|
Acergy SA |
| ‡ |
| 362,608 |
| 5,899 |
|
Mexico (8.1%) |
|
|
|
|
|
|
|
America Movil SA de CV-Class L, ADR |
|
|
| 463,863 |
| 17,121 |
|
Cemex SA de CV, Sponsored ADR |
|
|
| 237,062 |
| 16,006 |
|
Singapore (1.5%) |
|
|
|
|
|
|
|
Capitaland, Ltd. |
|
|
| 1,938,000 |
| 6,004 |
|
South Korea (2.1%) |
|
|
|
|
|
|
|
Samsung Electronics Co., Ltd., GDR-144A |
|
|
| 25,074 |
| 8,550 |
|
Sweden (1.0%) |
|
|
|
|
|
|
|
Telefonaktiebolaget LM Ericsson, ADR |
| † |
| 115,028 |
| 4,080 |
|
Switzerland (14.1%) |
|
|
|
|
|
|
|
ABB, Ltd. |
| ‡ |
| 865,909 |
| 12,323 |
|
Lonza Group AG |
|
|
| 146,448 |
| 10,362 |
|
Roche Holding AG-Genusschein |
|
|
| 53,890 |
| 8,263 |
|
Syngenta AG |
| ‡ |
| 72,911 |
| 10,142 |
|
UBS AG |
|
|
| 142,179 |
| 16,804 |
|
40
TA IDEX Marsico International Growth
SCHEDULE OF INVESTMENTS
At April 30, 2006
(all amounts except share amounts in thousands)
(unaudited)
United Kingdom (10.7%) |
|
|
|
|
|
|
|
BAE Systems PLC |
|
|
| 540,621 |
| 4,103 |
|
BHP Billiton PLC |
|
|
| 201,937 |
| 4,144 |
|
BP PLC |
|
|
| 504,399 |
| 6,202 |
|
Carphone Warehouse Group PLC |
|
|
| 734,727 |
| 4,484 |
|
Diageo PLC |
|
|
| 511,830 |
| 8,419 |
|
Enterprise Inns PLC |
|
|
| 291,575 |
| 4,945 |
|
GlaxoSmithKline PLC |
|
|
| 72,457 |
| 2,049 |
|
Reckitt Benckiser PLC |
|
|
| 259,497 |
| 9,429 |
|
Total Common Stocks (cost: $328,118) |
|
|
|
|
| 400,581 |
|
|
|
|
| Principal |
| Value |
|
SECURITY LENDING COLLATERAL (4.3%) |
|
|
|
|
|
|
|
Debt (4.1%) |
|
|
|
|
|
|
|
Bank Notes (0.5%) |
|
|
|
|
|
|
|
Bank of America |
|
|
|
|
|
|
|
4.81%, due 06/07/2006 |
| * |
| 588 |
| 588 |
|
4.81%, due 08/10/2006 |
| * |
| 567 |
| 567 |
|
Bear Stearns & Co. |
|
|
|
|
|
|
|
5.01%, due 06/06/2006 |
| * |
| 227 |
| 227 |
|
5.01%, due 09/07/2006 |
| * |
| 681 |
| 681 |
|
Certificates of Deposit (0.3%) |
|
|
|
|
|
|
|
Halifax Bank of Scotland |
|
|
|
|
|
|
|
4.78%, due 06/06/2006 |
| * |
| 567 |
| 567 |
|
Rabobank Nederland |
|
|
|
|
|
|
|
4.87%, due 05/31/2006 |
| * |
| 567 |
| 567 |
|
Commercial Paper (0.2%) |
|
|
|
|
|
|
|
Banco Santander Central Hispano SA |
|
|
|
|
|
|
|
4.77%, due 05/02/2006 |
|
|
| 341 |
| 341 |
|
Sheffield Receivables Corp.-144A |
|
|
|
|
|
|
|
4.81%, due 05/03/2006 |
|
|
| 567 |
| 567 |
|
Euro Dollar Overnight (0.8%) |
|
|
|
|
|
|
|
Bank of Montreal |
|
|
|
|
|
|
|
4.77%, due 05/02/2006 |
|
|
| 454 |
| 454 |
|
Dexia Group |
|
|
|
|
|
|
|
4.78%, due 05/04/2006 |
|
|
| 567 |
| 567 |
|
Fortis Bank |
|
|
|
|
|
|
|
4.77%, due 05/01/2006 |
|
|
| 227 |
| 227 |
|
Royal Bank of Canada |
|
|
|
|
|
|
|
4.77%, due 05/01/2006 |
|
|
| 794 |
| 794 |
|
Royal Bank of Scotland |
|
|
|
|
|
|
|
4.75%, due 05/03/2006 |
|
|
| 567 |
| 567 |
|
Svenska Handlesbanken |
|
|
|
|
|
|
|
4.82%, due 05/01/2006 |
|
|
| 434 |
| 434 |
|
Euro Dollar Terms (1.1%) |
|
|
|
|
|
|
|
BancoBilbao Vizcaya Argentaria SA |
|
|
|
|
|
|
|
4.95%, due 06/20/2006 |
|
|
| 454 |
| 454 |
|
Bank of the West |
|
|
|
|
|
|
|
4.94%, due 06/16/2006 |
|
|
| 454 |
| 454 |
|
Barclays |
|
|
|
|
|
|
|
4.79%, due 05/10/2006 |
|
|
| 681 |
| 681 |
|
4.77%, due 05/16/2006 |
|
|
| 227 |
| 227 |
|
Canadian Imperial Bank of Commerce |
|
|
|
|
|
|
|
4.97%, due 06/23/2006 |
|
|
| 341 |
| 341 |
|
Credit Suisse First Boston Corp. |
|
|
|
|
|
|
|
4.73%, due 05/08/2006 |
|
|
| 341 |
| 341 |
|
Fortis Bank |
|
|
|
|
|
|
|
4.83%, due 05/08/2006 |
|
|
| 227 |
| 227 |
|
Lloyds TSB Bank |
|
|
|
|
|
|
|
4.81%, due 05/11/2006 |
|
|
| 340 |
| 340 |
|
Royal Bank of Scotland |
|
|
|
|
|
|
|
4.87%, due 05/12/2006 |
|
|
| 454 |
| 454 |
|
Societe Generale |
|
|
|
|
|
|
|
4.79%, due 05/10/2006 |
|
|
| 567 |
| 567 |
|
UBS AG |
|
|
|
|
|
|
|
41
TA IDEX Marsico International Growth
SCHEDULE OF INVESTMENTS
At April 30, 2006
(all amounts except share amounts in thousands)
(unaudited)
4.95%, due 06/20/2006 |
|
|
| 567 |
| 567 |
|
Repurchase Agreements (1.2%) |
| †† |
|
|
|
|
|
Credit Suisse First Boston Corp. 4.92%, dated 04/28/2006 to be repurchased at $771 on 05/01/2006 |
|
|
| 771 |
| 771 |
|
Goldman Sachs Group, Inc. (The) 4.92%, dated 04/28/2006 to be repurchased at $1,668 on 05/01/2006 |
|
|
| 1,667 |
| 1,667 |
|
Lehman Brothers, Inc. 4.92%, dated 04/28/2006 to be repurchased at $28 on 05/01/2006 |
|
|
| 28 |
| 28 |
|
Merrill Lynch & Co. 4.87%, dated 04/28/2006 to be repurchased at $1,703 on 05/01/2006 |
|
|
| 1,702 |
| 1,702 |
|
Morgan Stanley Dean Witter & Co. 4.93%, dated 04/28/2006 to be repurchased at $795 on 05/01/2006 |
|
|
| 794 |
| 794 |
|
|
|
|
| Shares |
| Value |
| |
Investment Companies (0.2%) |
|
|
|
|
|
|
| |
|
|
|
|
|
|
|
| |
Barclays Global Investors Institutional Money Market Fund |
|
|
|
|
|
|
| |
1-day yield of 4.78% |
|
|
| 907,844 |
| 908 |
| |
Merrimac Cash Fund, Premium Class |
|
|
|
|
|
|
| |
1-day yield of 4.61% |
| @ |
| 241,546 |
| 242 |
| |
Total Security Lending Collateral (cost: $17,913) |
|
|
|
|
| 17,913 |
| |
Total Investment Securities (cost: $346,031) |
| # |
|
|
| $ | 418,494 |
|
NOTES TO SCHEDULE OF INVESTMENTS:
‡ Non-income producing.
† At April 30, 2006, all or a portion of this security is on loan (see Note 1). The value at April 30, 2006, of all securities on loan is $16,796.
(a) Passive Foreign Investment Company.
* Floating or variable rate note. Rate is listed as of April 30, 2006.
†† Cash collateral for the Repurchase Agreements, valued at $5,108, that serve as collateral for securities lending are invested in corporate bonds with interest rates and maturity dates ranging from 0.00% - 9.05% and 05/02/2006 - 12/31/2049, respectively.
@ Regulated investment company advised by Investors Bank and Trust Co. (“IBT”). IBT is also the accounting, custody and lending agent for the Fund.
# Aggregate cost for Federal income tax purposes is $346,560. Aggregate gross unrealized appreciation for all securities in which there is an excess of value over tax cost and aggregate gross unrealized depreciation for all securities in which there is an excess of tax cost over value were $73,443 and $1,509, respectively. Net unrealized appreciation for tax purposes is $71,934.
DEFINITIONS:
144A 144A Securities are registered pursuant to Rule 144A of the Securities Act of 1933. These securities are deemed to be liquid for purposes of compliance limitations on holdings of illiquid securities and may be resold as transactions exempt from registration, normally to qualified institutional buyers. At April 30, 2006, these securities aggregated $9,117 or 2.2% of the net assets of the Fund.
42
TA IDEX Marsico International Growth
SCHEDULE OF INVESTMENTS
At April 30, 2006
(all amounts except share amounts in thousands)
(unaudited)
ADR American Depositary Receipt
GDR Global Depositary Receipt
The notes to the financial statements are an integral part of this report.
43
TA IDEX Marsico International Growth
SCHEDULE OF INVESTMENTS
April 30, 2006
(all amounts except share amounts in thousands)
(unaudited)
|
| Percentage of |
|
|
| |
|
| Net Assets |
| Value |
| |
INVESTMENTS BY INDUSTRY: |
|
|
|
|
| |
Commercial Banks |
| 15.4 | % | $ | 62,919 |
|
Oil & Gas Extraction |
| 8.2 | % | 33,505 |
| |
Chemicals & Allied Products |
| 7.3 | % | 29,932 |
| |
Telecommunications |
| 5.3 | % | 21,605 |
| |
Beverages |
| 4.3 | % | 17,659 |
| |
Real Estate |
| 4.2 | % | 17,149 |
| |
Wholesale Trade Durable Goods |
| 3.9 | % | 16,192 |
| |
Electronic Components & Accessories |
| 3.9 | % | 16,081 |
| |
Stone, Clay & Glass Products |
| 3.9 | % | 16,006 |
| |
Rubber & Misc. Plastic Products |
| 3.9 | % | 15,947 |
| |
Pharmaceuticals |
| 3.7 | % | 15,405 |
| |
Primary Metal Industries |
| 3.1 | % | 12,908 |
| |
Engineering & Management Services |
| 3.0 | % | 12,323 |
| |
Radio & Television Broadcasting |
| 2.6 | % | 10,514 |
| |
Railroads |
| 2.5 | % | 10,180 |
| |
Automotive |
| 2.4 | % | 10,031 |
| |
Drug Stores & Proprietary Stores |
| 2.3 | % | 9,417 |
| |
Electronic & Other Electric Equipment |
| 2.1 | % | 8,550 |
| |
Manufacturing Industries |
| 1.9 | % | 7,816 |
| |
Radio, Television & Computer Stores |
| 1.8 | % | 7,237 |
| |
Hotels & Other Lodging Places |
| 1.5 | % | 6,260 |
| |
Petroleum Refining |
| 1.5 | % | 6,202 |
| |
Personal Credit Institutions |
| 1.5 | % | 5,996 |
| |
Retail Trade |
| 1.4 | % | 5,703 |
| |
Restaurants |
| 1.2 | % | 4,945 |
| |
Department Stores |
| 1.0 | % | 4,316 |
| |
Business Services |
| 1.0 | % | 4,305 |
| |
Aerospace |
| 1.0 | % | 4,103 |
| |
Communications Equipment |
| 1.0 | % | 4,080 |
| |
Residential Building Construction |
| 0.8 | % | 3,295 |
| |
Investment Securities, at value |
| 97.6 | % | 400,581 |
| |
Short-Term Investments |
| 4.3 | % | 17,913 |
| |
Total Investment Securities |
| 101.9 | % | 418,494 |
| |
The notes to the financial statements are an integral part of this report.
44
TA IDEX Mercury Global Allocation
UNDERSTANDING YOUR FUND’S EXPENSES
(unaudited)
SHAREHOLDER EXPENSES
Fund shareholders may incur ongoing costs, including management fees, 12b-1 distribution and service fees, and other fund expenses. Shares of the Fund currently are sold only to certain Transamerica IDEX Mutual Funds and AEGON/Transamerica Series Trust (an affiliate of Transamerica IDEX Mutual Funds) asset allocation funds at net asset value, without any transaction costs.
The following Example is intended to help you understand your ongoing costs (in dollars and cents) of investing in the Fund and to compare these costs with the ongoing costs of investing in other funds.
The Example is based on an investment of $1,000 invested at December 6, 2005 and held for the entire period until April 30, 2006.
ACTUAL EXPENSES
The first line in the table below provides information about actual account values and actual expenses. You may use the information in this line, together with the amount you invested, to estimate the expenses that you paid over the period. Simply divide your account value by $1,000 (for example, an $8,600 account value divided by $1,000 = 8.6), then multiply the result by the number in the first line of your Fund under the heading entitled “Expenses Paid During Period” to estimate the expenses you paid on your account during this period.
HYPOTHETICAL EXAMPLE FOR COMPARISON PURPOSES
The second line in the table below provides information about hypothetical account values and hypothetical expenses based on the Fund’s actual expense ratio and an assumed rate of return of 5% per year before expenses, which is not the Fund’s actual return. The hypothetical account values and expenses may not be used to estimate the actual ending account balance or expenses you paid for the period. You may use this information to compare the ongoing costs of investing in your Fund and other funds. To do so, compare this 5% hypothetical example with the 5% hypothetical examples that appear in the shareholder reports of the other funds.
|
| Beginning |
| Ending |
| Annualized |
| Expenses Paid |
| |||
Class I |
|
|
|
|
|
|
|
|
| |||
Actual |
| $ | 1,000.00 |
| $ | 1,101.40 |
| 0.94 | % | $ | 3.92 |
|
Hypothetical(b) |
| 1,000.00 |
| 1,016.13 |
| 0.94 | % | 3.76 |
| |||
(a) Expenses are calculated using the Fund’s annualized expense ratio (as disclosed in the table), multiplied by the average account value for the period, multiplied by number of days in the period (145 days), and divided by the number of days in the year (365 days).
(b) 5% return per year before expenses.
45
TA IDEX Mercury Global Allocation
TABULAR PRESENTATION OF SCHEDULE OF INVESTMENTS
By Region
At April 30, 2006
Africa |
| 0.2 | % |
Asia |
| 3.0 | % |
Eastern Europe |
| 0.1 | % |
Europe |
| 26.7 | % |
Latin America |
| 1.5 | % |
North America |
| 44.4 | % |
Other |
| 3.1 | % |
Pacific Rim |
| 18.7 | % |
South America |
| 2.3 | % |
|
| 100.0 | % |
This chart shows the percentage breakdown by region of the Fund’s total investment securities.
46
TA IDEX Mercury Global Allocation
SCHEDULE OF INVESTMENTS
At April 30, 2006
(all amounts except share amounts in thousands)
(unaudited)
|
|
|
| Principal |
| Value |
|
U.S. GOVERNMENT OBLIGATIONS (14.3%) |
|
|
|
|
|
|
|
United States (14.3%) |
|
|
|
|
|
|
|
U.S. Treasury Inflation Indexed Bond |
|
|
|
|
|
|
|
0.88%, due 04/15/2010 |
|
|
| 15,966 |
| 15,183 |
|
2.00%, due 04/15/2011 |
|
|
| 1,952 |
| 1,964 |
|
1.88%, due 07/15/2015 |
| d |
| 9,575 |
| 9,192 |
|
2.00%, due 01/15/2016 |
|
|
| 12,476 |
| 12,062 |
|
U.S. Treasury Note |
|
|
|
|
|
|
|
3.50%, due 05/31/2007 |
|
|
| 1,000 |
| 985 |
|
4.38%, due 12/31/2007 |
|
|
| 700 |
| 694 |
|
4.88%, due 04/30/2008 |
|
|
| 600 |
| 600 |
|
4.25%, due 08/15/2014 |
|
|
| 400 |
| 379 |
|
4.25%, due 11/15/2014 |
| † |
| 2,750 |
| 2,600 |
|
Total U.S. Government Obligations (cost: $44,410) |
|
|
|
|
| 43,659 |
|
FOREIGN GOVERNMENT OBLIGATIONS (6.2%) |
|
|
|
|
|
|
|
Canada (0.3%) |
|
|
|
|
|
|
|
Canada Government |
|
|
|
|
|
|
|
4.00%, due 09/01/2010 |
| CAD |
| 1,000 |
| 881 |
|
Germany (1.0%) |
|
|
|
|
|
|
|
Republic of Germany |
|
|
|
|
|
|
|
4.25%, due 02/16/2007 |
| EUR |
| 2,500 |
| 3,173 |
|
Hong Kong (0.3%) |
|
|
|
|
|
|
|
Hong Kong Government |
|
|
|
|
|
|
|
4.23%, due 03/21/2011 |
| HKD |
| 6,500 |
| 826 |
|
Malaysia (0.5%) |
|
|
|
|
|
|
|
Malaysia Government |
|
|
|
|
|
|
|
8.60%, due 12/01/2007 |
| MYR |
| 3,500 |
| 1,038 |
|
3.76%, due 04/28/2011 |
| MYR |
| 2,250 |
| 609 |
|
New Zealand (0.1%) |
|
|
|
|
|
|
|
New Zealand Government |
|
|
|
|
|
|
|
4.50%, due 02/15/2016 |
| NZD |
| 400 |
| 344 |
|
Poland (0.3%) |
|
|
|
|
|
|
|
Republic of Poland |
|
|
|
|
|
|
|
3.00%, due 08/24/2016 |
| PLN |
| 2,550 |
| 846 |
|
Sweden (3.7%) |
|
|
|
|
|
|
|
Kingdom of Sweden |
|
|
|
|
|
|
|
4.00%, due 12/01/2008 |
| SEK |
| 66,441 |
| 11,137 |
|
Total Foreign Government Obligations (cost: $16,318) |
|
|
|
|
| 18,854 |
|
CORPORATE DEBT SECURITIES (6.6%) |
|
|
|
|
|
|
|
France (1.0%) |
|
|
|
|
|
|
|
ERAP, Series E |
|
|
|
|
|
|
|
3.38%, due 04/25/2008 |
| EUR |
| 1,250 |
| 1,573 |
|
Unedic |
|
|
|
|
|
|
|
3.50%, due 09/18/2008 |
| EUR |
| 1,250 |
| 1,572 |
|
Germany (1.3%) |
|
|
|
|
|
|
|
Kreditanstalt fuer Wiederaufbau, Series E |
|
|
|
|
|
|
|
4.50%, due 12/07/2008 |
| GBP |
| 2,000 |
| 3,604 |
|
Norddeutsche Landesbank Girozentrale, Series E |
|
|
|
|
|
|
|
0.45%, due 01/19/2009 |
| JPY |
| 60,000 |
| 520 |
|
India (0.5%) |
|
|
|
|
|
|
|
Tata Motors, Ltd. |
|
|
|
|
|
|
|
1.00%, due 04/27/2011 |
|
|
| 750 |
| 911 |
|
ZEE Telefilms, Ltd. |
|
|
|
|
|
|
|
0.50%, due 04/29/2009 |
|
|
| 590 |
| 690 |
|
Japan (0.3%) |
|
|
|
|
|
|
|
Bank of Kyoto Ltd. (The) |
|
|
|
|
|
|
|
1.90%, due 09/30/2009 |
| JPY |
| 44,000 |
| 803 |
|
Malaysia (0.0%) |
|
|
|
|
|
|
|
TNB Capital L, Ltd. |
|
|
|
|
|
|
|
2.63%, due 11/20/2007 |
|
|
| 80 |
| 89 |
|
Supra National (0.5%) |
|
|
|
|
|
|
|
European Investment Bank, Series E |
|
|
|
|
|
|
|
Zero Coupon, due 05/01/2008 |
| BRL |
| 4,000 |
| 1,442 |
|
47
TA IDEX Mercury Global Allocation
SCHEDULE OF INVESTMENTS
At April 30, 2006
(all amounts except share amounts in thousands)
(unaudited)
United States (3.0%) |
|
|
|
|
|
|
|
Anchor Glass Loan Agreement |
|
|
|
|
|
|
|
Zero Coupon, due 09/30/2006 |
|
|
| 489 |
| 499 |
|
Fannie Mae |
|
|
|
|
|
|
|
2.13%, due 10/09/2007 |
| JPY |
| 240,000 |
| 2,148 |
|
GS Group, Inc. |
|
|
|
|
|
|
|
Zero Coupon, due 10/19/2007 |
|
|
| 1,400 |
| 1,378 |
|
Zero Coupon, due 02/16/2008 |
|
|
| 1,600 |
| 1,605 |
|
JP Morgan Chase & Co. |
|
|
|
|
|
|
|
6.00%, due 08/15/2010 |
|
|
| 1,750 |
| 1,179 |
|
6.00%, due 08/15/2010 |
|
|
| 2,040 |
| 1,374 |
|
Zero Coupon, due 08/16/2010 |
|
|
| 800 |
| 539 |
|
McMoRan Exploration Co. |
|
|
|
|
|
|
|
5.25%, due 10/06/2011 |
|
|
| 280 |
| 329 |
|
Nabi Biopharmaceuticals |
|
|
|
|
|
|
|
2.88%, due 04/15/2025 |
|
|
| 80 |
| 70 |
|
Total Corporate Debt Securities (cost: $19,742) |
|
|
|
|
| 20,325 |
|
CONVERTIBLE BOND (0.6%) |
|
|
|
|
|
|
|
Bermuda (0.1%) |
|
|
|
|
|
|
|
Hongkong Land CB 2005, Ltd. |
|
|
|
|
|
|
|
2.75%, due 12/21/2012 |
|
|
| 200,000 |
| 228 |
|
Canada (0.0%) |
|
|
|
|
|
|
|
Bema Gold Corp. |
|
|
|
|
|
|
|
3.25%, due 02/25/2011 |
|
|
| 30,000 |
| 39 |
|
Cayman Islands (0.1%) |
|
|
|
|
|
|
|
YTL Power Finance Cayman, Ltd. |
|
|
|
|
|
|
|
Zero Coupon, due 05/09/2010 |
|
|
| 200,000 |
| 214 |
|
India (0.1%) |
|
|
|
|
|
|
|
Gujarat NRE Coke, Ltd. |
|
|
|
|
|
|
|
Zero Coupon, due 04/12/2011 |
|
|
| 100,000 |
| 98 |
|
Housing Development Finance Corp. |
|
|
|
|
|
|
|
Zero Coupon, due 09/27/2010 |
|
|
| 200,000 |
| 222 |
|
Malaysia (0.1%) |
|
|
|
|
|
|
|
Feringghi Capital, Ltd. |
|
|
|
|
|
|
|
Zero Coupon, due 12/22/2009 |
|
|
| 300,000 |
| 310 |
|
IOI Investment Berhad |
|
|
|
|
|
|
|
Zero Coupon, due 09/18/2009 |
|
|
| 40,000 |
| 53 |
|
Taiwan (0.1%) |
|
|
|
|
|
|
|
Taiwan Cement Corp. |
|
|
|
|
|
|
|
Zero Coupon, due 03/03/2009 |
|
|
| 325,000 |
| 424 |
|
Virgin Islands (Br) (0.1%) |
|
|
|
|
|
|
|
Beijing Enterprises Investment, Ltd. |
|
|
|
|
|
|
|
Zero Coupon, due 12/21/2010 |
|
|
| 265,000 |
| 315 |
|
Total Convertible Bond (cost: $1,777) |
|
|
|
|
| 1,903 |
|
|
|
|
| Shares |
| Value |
|
CONVERTIBLE PREFERRED STOCKS (0.2%) |
|
|
|
|
|
|
|
United States (0.2%) |
|
|
|
|
|
|
|
Fannie Mae |
|
|
| 8 |
| 762 |
|
Total Convertible Preferred Stocks (cost: $736) |
|
|
|
|
| 762 |
|
PREFERRED STOCKS (0.1%) |
|
|
|
|
|
|
|
Brazil (0.1%) |
|
|
|
|
|
|
|
All America Latina Logistica SA |
|
|
| 2,500 |
| 159 |
|
Cia Brasileira de Distribuicao Grupo Pao de Acucar |
|
|
| 2,500,000 |
| 98 |
|
Usinas Siderurgicas de Minas Gerais SA-Class A |
|
|
| 6,100 |
| 230 |
|
Total Preferred Stocks (cost: $355) |
|
|
|
|
| 487 |
|
COMMON STOCKS (59.2%) |
|
|
|
|
|
|
|
Australia (1.1%) |
|
|
|
|
|
|
|
BHP Billiton, Ltd. |
|
|
| 20,500 |
| 456 |
|
Coca-Cola Amatil, Ltd. |
|
|
| 21,900 |
| 121 |
|
Excel Coal, Ltd. |
|
|
| 19,100 |
| 124 |
|
Great Southern Plantations, Ltd. |
|
|
| 25,300 |
| 75 |
|
Macquarie Airports |
|
|
| 43,500 |
| 108 |
|
48
TA IDEX Mercury Global Allocation
SCHEDULE OF INVESTMENTS
At April 30, 2006
(all amounts except share amounts in thousands)
(unaudited)
Macquarie Bank, Ltd. |
|
|
| 9,000 |
| 488 |
|
Macquarie Infrastructure Group |
| (a) |
| 244,000 |
| 661 |
|
Newcrest Mining, Ltd. |
|
|
| 13,300 |
| 230 |
|
Rio Tinto, Ltd. |
|
|
| 7,000 |
| 418 |
|
Transurban Group |
|
|
| 52,500 |
| 263 |
|
Woodside Petroleum, Ltd. |
|
|
| 4,100 |
| 146 |
|
Zinifex, Ltd. |
|
|
| 20,800 |
| 163 |
|
Belgium (0.6%) |
|
|
|
|
|
|
|
AGFA-Gevaert NV |
|
|
| 13,638 |
| 276 |
|
RHJ International |
| ‡ |
| 38,000 |
| 943 |
|
RHJ International-144A |
|
|
| 26,600 |
| 660 |
|
Bermuda (1.3%) |
|
|
|
|
|
|
|
Accenture, Ltd.-Class A |
|
|
| 300 |
| 9 |
|
Cheung Kong Infrastructure Holdings, Ltd. |
|
|
| 92,000 |
| 300 |
|
Endurance Specialty Holdings, Ltd. |
|
|
| 13,300 |
| 412 |
|
Foster Wheeler, Ltd. |
| ‡ |
| 30,000 |
| 1,337 |
|
IPC Holdings, Ltd. |
|
|
| 7,000 |
| 187 |
|
Platinum Underwriters Holdings, Ltd. |
|
|
| 13,900 |
| 383 |
|
RenaissanceRe Holdings, Ltd. |
|
|
| 6,800 |
| 286 |
|
Tyco International, Ltd. |
|
|
| 25,300 |
| 667 |
|
Weatherford International, Ltd. |
| ‡ |
| 4,200 |
| 222 |
|
Brazil (1.2%) |
|
|
|
|
|
|
|
Aracruz Celulose SA, Sponsored ADR |
|
|
| 1,700 |
| 94 |
|
Braskem SA-Class A |
|
|
| 17,900 |
| 127 |
|
Cia Energetica de Minas Gerais, ADR |
|
|
| 2,200 |
| 104 |
|
Cia Vale do Rio Doce-Class A, ADR |
| † |
| 7,100 |
| 316 |
|
Companhia de Saneamento de Minas Gerais |
| ‡ |
| 10,400 |
| 104 |
|
Cosan SA Industria e Comercio |
| ‡ |
| 4,400 |
| 343 |
|
Gol Linhas Aereas Inteligentes SA, ADR |
|
|
| 3,100 |
| 115 |
|
Localiza Rent A CAR |
|
|
| 4,000 |
| 84 |
|
Obrascon Huarte Lain Brasil SA |
| ‡ |
| 10,500 |
| 128 |
|
Petroleo Brasileiro SA, ADR |
|
|
| 17,100 |
| 1,690 |
|
Submarino SA |
|
|
| 6,500 |
| 176 |
|
Totvs SA |
| ‡ |
| 10,300 |
| 198 |
|
Uniao de Bancos Brasileiros SA, GDR |
|
|
| 1,200 |
| 95 |
|
Vivo Participacoes SA, ADR |
| ‡ |
| 26,200 |
| 108 |
|
Canada (1.7%) |
|
|
|
|
|
|
|
Agrium, Inc. |
|
|
| 3,800 |
| 98 |
|
Alamos Gold, Inc. |
| ‡ |
| 37,000 |
| 348 |
|
Barrick Gold Corp. |
|
|
| 7,795 |
| 238 |
|
Bema Gold Corp. |
| ‡ |
| 171,200 |
| 966 |
|
Biovail Corp. |
|
|
| 400 |
| 10 |
|
Canadian Pacific Railway, Ltd. |
| † |
| 5,200 |
| 276 |
|
Canadian Pacific Railway, Ltd. |
|
|
| 18,400 |
| 976 |
|
Inco, Ltd. |
| † |
| 6,100 |
| 344 |
|
IPSCO, Inc. |
|
|
| 100 |
| 10 |
|
Kinross Gold Corp. |
| ‡ |
| 20,400 |
| 250 |
|
Nortel Networks Corp. |
| ‡ |
| 61,600 |
| 164 |
|
Petro-Canada |
|
|
| 5,600 |
| 275 |
|
Rogers Communications, Inc.-Class B |
| † |
| 14,200 |
| 603 |
|
Sun Life Financial, Inc. |
| † |
| 200 |
| 8 |
|
Suncor Energy, Inc. |
|
|
| 6,100 |
| 523 |
|
Suncor Energy, Inc. |
|
|
| 400 |
| 34 |
|
Talisman Energy, Inc. |
|
|
| 1,500 |
| 85 |
|
Cayman Islands (0.9%) |
|
|
|
|
|
|
|
ACE, Ltd. |
|
|
| 11,800 |
| 655 |
|
GlobalSantaFe Corp. |
|
|
| 12,600 |
| 771 |
|
Noble Corp. |
|
|
| 4,200 |
| 332 |
|
Seagate Technology |
| ‡ |
| 400 |
| 11 |
|
Transocean, Inc. |
| ‡ |
| 2,300 |
| 186 |
|
XL Capital, Ltd.-Class A |
| † |
| 13,500 |
| 890 |
|
Chile (0.0%) |
|
|
|
|
|
|
|
Enersis SA, Chile, Sponsored ADR |
|
|
| 8,100 |
| 99 |
|
China (0.4%) |
|
|
|
|
|
|
|
China Life Insurance Co., Ltd., ADR |
| ‡ |
| 2,600 |
| 140 |
|
49
TA IDEX Mercury Global Allocation
SCHEDULE OF INVESTMENTS
At April 30, 2006
(all amounts except share amounts in thousands)
(unaudited)
China Shenhua Energy Co., Ltd.-Class H |
|
|
| 218,000 |
| 395 |
|
Guangshen Railway Co., Ltd.-Class H |
|
|
| 698,900 |
| 268 |
|
Hainan Meilan International Airport Co., Ltd. |
|
|
| 112,000 |
| 64 |
|
Ping An Insurance Group Co. of China, Ltd. |
|
|
| 35,000 |
| 96 |
|
Shanghai Electric Group Corp.-Class H |
| ‡ |
| 508,000 |
| 197 |
|
Yanzhou Coal Mining Co., Ltd. |
|
|
| 164,900 |
| 140 |
|
Finland (0.2%) |
|
|
|
|
|
|
|
Fortum Oyj |
|
|
| 27,474 |
| 693 |
|
France (1.8%) |
|
|
|
|
|
|
|
Alcatel SA, Sponsored ADR |
| † ‡ |
| 6,000 |
| 87 |
|
BNP Paribas |
|
|
| 10,431 |
| 984 |
|
BNP Paribas Rights |
|
|
| 1,043 |
| 95 |
|
Carrefour SA |
| ‡ |
| 9,622 |
| 557 |
|
Credit Agricole SA |
|
|
| 19,774 |
| 796 |
|
Peugeot SA |
| † |
| 7,079 |
| 465 |
|
Renault SA |
|
|
| 5,607 |
| 650 |
|
Total SA |
|
|
| 4,485 |
| 1,238 |
|
Vinci SA |
|
|
| 4,591 |
| 455 |
|
Vinci SA |
| ‡ |
| 834 |
| 81 |
|
Germany (1.5%) |
|
|
|
|
|
|
|
Allianz AG |
|
|
| 2,294 |
| 383 |
|
BASF AG |
|
|
| 6,544 |
| 560 |
|
Deutsche Post AG |
|
|
| 23,566 |
| 627 |
|
Deutsche Postbank AG |
|
|
| 5,277 |
| 403 |
|
Hochtief AG |
|
|
| 7,107 |
| 485 |
|
RWE AG |
| † |
| 6,951 |
| 602 |
|
Siemens AG |
|
|
| 8,041 |
| 760 |
|
ThyssenKrupp AG |
|
|
| 22,309 |
| 734 |
|
Hong Kong (0.6%) |
|
|
|
|
|
|
|
Cheung Kong Holdings, Ltd. |
| (a) |
| 32,000 |
| 361 |
|
Denway Motors, Ltd. |
|
|
| 206,000 |
| 83 |
|
Hutchison Whampoa, Ltd. |
|
|
| 67,000 |
| 658 |
|
Sun Hung Kai Properties, Ltd. |
|
|
| 41,700 |
| 477 |
|
Wharf Holdings, Ltd. |
|
|
| 79,000 |
| 317 |
|
Hungary (0.1%) |
|
|
|
|
|
|
|
Mol Magyar Olaj- es Gazipari Rt. |
|
|
| 3,412 |
| 405 |
|
India (2.3%) |
|
|
|
|
|
|
|
Bajaj Auto, Ltd. |
|
|
| 8,300 |
| 544 |
|
Container Corp. of India |
|
|
| 9,600 |
| 347 |
|
Gujarat Ambuja Cements, Ltd. |
|
|
| 176,400 |
| 457 |
|
Hindustan Petroleum Corp. |
|
|
| 4,100 |
| 29 |
|
Housing Development Finance Corp. |
|
|
| 28,700 |
| 830 |
|
Infosys Technologies, Ltd. |
|
|
| 12,100 |
| 844 |
|
Reliance Capital Ventures, Ltd. |
| ‡ |
| 131,400 |
| 75 |
|
Reliance Communication Ventures, Ltd. |
| ‡ |
| 131,400 |
| 880 |
|
Reliance Energy Ventures, Ltd. |
| ‡ |
| 131,400 |
| 125 |
|
Reliance Industries, Ltd. |
|
|
| 118,000 |
| 2,648 |
|
Reliance Natural Resources, Ltd. |
| ‡ |
| 131,400 |
| 86 |
|
State Bank of India, Ltd. |
|
|
| 11,700 |
| 230 |
|
Wockhardt, Ltd. |
| ‡ |
| 3,100 |
| 30 |
|
Indonesia (0.0%) |
|
|
|
|
|
|
|
Bank Danamon Indonesia |
|
|
| 150,500 |
| 88 |
|
Ireland (0.2%) |
|
|
|
|
|
|
|
Allied Irish Banks PLC |
|
|
| 17,305 |
| 417 |
|
Allied Irish Banks PLC |
|
|
| 8,328 |
| 201 |
|
Israel (0.3%) |
|
|
|
|
|
|
|
ECI Telecom, Ltd. |
| ‡ |
| 65,600 |
| 701 |
|
Ectel, Ltd. |
| ‡ |
| 3,500 |
| 19 |
|
Teva Pharmaceutical Industries, Ltd., ADR |
|
|
| 5,223 |
| 212 |
|
Italy (1.0%) |
|
|
|
|
|
|
|
Assicurazioni Generali SpA |
|
|
| 10,734 |
| 402 |
|
Capitalia SpA |
|
|
| 48,118 |
| 417 |
|
Enel SpA |
|
|
| 46,233 |
| 399 |
|
ENI-Ente Nazionale Idrocarburi SpA |
|
|
| 32,496 |
| 991 |
|
UniCredito Italiano SpA |
| (a) |
| 92,669 |
| 697 |
|
50
TA IDEX Mercury Global Allocation
SCHEDULE OF INVESTMENTS
At April 30, 2006
(all amounts except share amounts in thousands)
(unaudited)
Japan (8.7%) |
|
|
|
|
|
|
|
Aioi Insurance Co., Ltd. |
|
|
| 159,000 |
| 1,147 |
|
Ajinomoto Co., Inc. |
|
|
| 29,500 |
| 366 |
|
Asahi Glass Co., Ltd. |
|
|
| 24,000 |
| 338 |
|
Bank of Fukuoka, Ltd. (The) |
|
|
| 55,000 |
| 472 |
|
Bank of Yokohama, Ltd. (The) |
|
|
| 43,000 |
| 336 |
|
Brother Industries, Ltd. |
|
|
| 15,000 |
| 167 |
|
Canon, Inc. |
|
|
| 9,800 |
| 747 |
|
Chubu Electric Power Co., Inc. |
|
|
| 8,100 |
| 212 |
|
Coca-Cola Central Japan Co., Ltd. |
|
|
| 31 |
| 293 |
|
Coca-Cola West Japan Co., Ltd. |
|
|
| 16,700 |
| 411 |
|
Credit Saison Co., Ltd. |
| (a) |
| 11,000 |
| 575 |
|
East Japan Railway Co. |
|
|
| 53 |
| 413 |
|
Fanuc, Ltd. |
|
|
| 3,100 |
| 292 |
|
Hitachi, Ltd. |
|
|
| 21,000 |
| 156 |
|
Hokkaido Coca-Cola Bottling Co., Ltd. |
|
|
| 15,000 |
| 102 |
|
Honda Motor Co., Ltd. |
|
|
| 3,700 |
| 262 |
|
House Foods Corp. |
|
|
| 5,100 |
| 85 |
|
Japan Tobacco, Inc. |
|
|
| 105 |
| 421 |
|
JGC Corp. |
|
|
| 35,000 |
| 611 |
|
Kinden Corp. |
|
|
| 30,000 |
| 282 |
|
Kinki Coca-Cola Bottling Co., Ltd. |
|
|
| 21,000 |
| 233 |
|
Kubota Corp. |
|
|
| 51,000 |
| 575 |
|
Mikuni Coca-Cola Bottling Co., Ltd. |
|
|
| 30,300 |
| 355 |
|
Millea Holdings, Inc. |
|
|
| 115 |
| 2,286 |
|
Ministop Co., Ltd. |
|
|
| 4,100 |
| 94 |
|
Mitsubishi Corp. |
|
|
| 38,500 |
| 929 |
|
Mitsubishi Tokyo Financial Group, Inc. |
|
|
| 40 |
| 627 |
|
Mitsui Sumitomo Insurance Co., Ltd. |
|
|
| 156,000 |
| 2,097 |
|
Murata Manufacturing Co., Ltd. |
|
|
| 8,200 |
| 595 |
|
Nipponkoa Insurance Co., Ltd. |
|
|
| 139,000 |
| 1,238 |
|
Nomura Holdings, Inc. |
|
|
| 37,000 |
| 834 |
|
NTT DoCoMo, Inc. |
|
|
| 379 |
| 564 |
|
NTT Urban Development Corp. |
|
|
| 51 |
| 418 |
|
Okumura Corp. |
|
|
| 63,000 |
| 349 |
|
Rinnai Corp. |
|
|
| 3,600 |
| 99 |
|
Rohto Pharmaceutical Co., Ltd. |
|
|
| 17,000 |
| 206 |
|
Seven & I Holdings Co., Ltd. |
|
|
| 20,500 |
| 792 |
|
Shin-Etsu Chemical Co., Ltd. |
|
|
| 11,100 |
| 640 |
|
Shinsei Bank, Ltd. |
|
|
| 56,000 |
| 391 |
|
Shionogi & Co., Ltd. |
|
|
| 18,000 |
| 303 |
|
Sumitomo Chemical Co., Ltd. |
|
|
| 69,000 |
| 603 |
|
Sumitomo Mitsui Financial Group, Inc. |
|
|
| 90 |
| 985 |
|
Suzuki Motor Corp. |
|
|
| 50,000 |
| 1,217 |
|
Takeda Pharmaceutical Co., Ltd. |
|
|
| 17,000 |
| 1,036 |
|
Tanabe Seiyaku Co., Ltd. |
|
|
| 20,000 |
| 235 |
|
Toho Co., Ltd. |
|
|
| 15,700 |
| 303 |
|
Tokyo Gas Co., Ltd. |
|
|
| 121,000 |
| 584 |
|
Toyota Industries Corp. |
|
|
| 9,200 |
| 409 |
|
Luxembourg (0.0%) |
|
|
|
|
|
|
|
Millicom International Cellular SA |
| † ‡ |
| 200 |
| 10 |
|
Malaysia (0.5%) |
|
|
|
|
|
|
|
British American Tobacco Malaysia Berhad |
|
|
| 22,600 |
| 260 |
|
IOI Corp. Berhad |
|
|
| 115,000 |
| 451 |
|
Malakoff Berhad |
|
|
| 20,500 |
| 55 |
|
Maxis Communications Berhad |
|
|
| 92,400 |
| 223 |
|
PLUS Expressways Berhad |
|
|
| 78,300 |
| 60 |
|
Telekom Malaysia Berhad |
|
|
| 51,000 |
| 137 |
|
Tenaga Nasional Berhad |
|
|
| 166,250 |
| 392 |
|
Mexico (0.3%) |
|
|
|
|
|
|
|
Fomento Economico Mexicano SA de CV, Sponsored ADR |
|
|
| 4,000 |
| 372 |
|
Grupo Televisa SA, Sponsored ADR |
|
|
| 28,400 |
| 602 |
|
Netherland Antilles (0.3%) |
|
|
|
|
|
|
|
Schlumberger, Ltd. |
| † |
| 11,600 |
| 802 |
|
51
TA IDEX Mercury Global Allocation
SCHEDULE OF INVESTMENTS
At April 30, 2006
(all amounts except share amounts in thousands)
(unaudited)
Netherlands (0.5%) |
|
|
|
|
|
|
|
Chicago Bridge & Iron Co. NV |
| † v |
| 6,100 |
| 146 |
|
ING Groep NV |
|
|
| 25,105 |
| 1,020 |
|
Koninklijke Ahold NV |
| ‡ |
| 6,763 |
| 56 |
|
Royal Dutch Shell PLC- Class A, ADR |
|
|
| 4,200 |
| 286 |
|
New Zealand (0.1%) |
|
|
|
|
|
|
|
Contact Energy, Ltd. |
|
|
| 23,500 |
| 119 |
|
Telecom Corp. of New Zealand, Ltd. |
|
|
| 41,100 |
| 150 |
|
Norway (0.2%) |
|
|
|
|
|
|
|
Statoil ASA |
|
|
| 18,148 |
| 596 |
|
Panama (1.1%) |
|
|
|
|
|
|
|
McDermott International, Inc. |
| ‡ v |
| 55,800 |
| 3,393 |
|
Peru (0.0%) |
|
|
|
|
|
|
|
Cia de Minas Buenaventura SA, ADR |
|
|
| 3,000 |
| 91 |
|
Puerto Rico (0.0%) |
|
|
|
|
|
|
|
Santander BanCorp |
|
|
| 1,300 |
| 30 |
|
Singapore (1.3%) |
|
|
|
|
|
|
|
Capitaland, Ltd. |
|
|
| 164,000 |
| 508 |
|
Fraser & Neave, Ltd. |
|
|
| 32,500 |
| 454 |
|
Keppel Corp., Ltd. |
|
|
| 102,000 |
| 987 |
|
Keppel Land, Ltd. |
|
|
| 146,000 |
| 438 |
|
K-REIT Asia REIT |
|
|
| 29,200 |
| 28 |
|
MobileOne, Ltd. |
|
|
| 246,000 |
| 334 |
|
Oversea-Chinese Banking Corp. |
|
|
| 62,000 |
| 267 |
|
Parkway Holdings, Ltd. |
|
|
| 177,000 |
| 292 |
|
Pearl Energy, Ltd. |
| ‡ |
| 46,800 |
| 58 |
|
Singapore Telecommunications, Ltd. |
|
|
| 400,800 |
| 692 |
|
South Africa (0.2%) |
|
|
|
|
|
|
|
Gold Fields, Ltd., Sponsored ADR |
|
|
| 10,300 |
| 262 |
|
Sappi, Ltd., Sponsored ADR |
|
|
| 6,100 |
| 86 |
|
Sasol, Ltd. |
|
|
| 2,800 |
| 117 |
|
South Korea (2.4%) |
|
|
|
|
|
|
|
Cheil Industries, Inc. |
|
|
| 4,700 |
| 171 |
|
CJ Corp. |
|
|
| 5,100 |
| 698 |
|
Korea Electric Power Corp. |
|
|
| 14,400 |
| 640 |
|
KT Corp., ADR |
| † |
| 45,200 |
| 1,052 |
|
KT&G Corp. |
|
|
| 18,600 |
| 1,041 |
|
Lotte Shopping Co., GDR-144A |
| † ‡ |
| 3,600 |
| 75 |
|
LS Cable, Ltd. |
|
|
| 11,300 |
| 467 |
|
Nong Shim Co., Ltd. |
|
|
| 500 |
| 140 |
|
POSCO |
|
|
| 3,300 |
| 920 |
|
POSCO, ADR |
| † |
| 11,200 |
| 789 |
|
Pusan Bank |
|
|
| 16,400 |
| 252 |
|
Samsung Fine Chemicals Co., Ltd. |
|
|
| 16,000 |
| 492 |
|
SK Telecom Co., Ltd. |
|
|
| 2,200 |
| 517 |
|
Spain (0.4%) |
|
|
|
|
|
|
|
Banco Bilbao Vizcaya Argentaria SA |
|
|
| 42,814 |
| 944 |
|
Cintra Concesiones de Infraestructuras de Transporte SA |
|
|
| 9,000 |
| 122 |
|
Telefonica SA, Sponsored ADR |
|
|
| 4,000 |
| 192 |
|
Sweden (0.4%) |
|
|
|
|
|
|
|
Investor AB-Class B |
|
|
| 29,748 |
| 580 |
|
Svenska Handelsbanken AB-Class A |
|
|
| 18,946 |
| 543 |
|
Switzerland (0.7%) |
|
|
|
|
|
|
|
Credit Suisse Group |
|
|
| 22,433 |
| 1,405 |
|
Swiss Reinsurance |
| (a) |
| 2,975 |
| 216 |
|
Swiss Reinsurance Rights, Expires 5/9/2006 |
| m |
| 2,975 |
| — | o |
Zurich Financial Services AG |
| ‡ |
| 2,119 |
| 514 |
|
Taiwan (0.6%) |
|
|
|
|
|
|
|
Cathay Financial Holding Co., Ltd. |
|
|
| 33,000 |
| 74 |
|
Chunghwa Telecom Co., Ltd. |
|
|
| 46,000 |
| 88 |
|
Chunghwa Telecom Co., Ltd., ADR |
|
|
| 41,500 |
| 855 |
|
Delta Electronics, Inc. |
|
|
| 129,000 |
| 402 |
|
Fubon Financial Holding Co., Ltd. |
|
|
| 77,000 |
| 75 |
|
SinoPac Financial Holdings Co., Ltd. |
|
|
| 236,000 |
| 131 |
|
Taishin Financial Holdings Co., Ltd. |
|
|
| 192,000 |
| 126 |
|
52
TA IDEX Mercury Global Allocation
SCHEDULE OF INVESTMENTS
At April 30, 2006
(all amounts except share amounts in thousands)
(unaudited)
Thailand (1.0%) |
|
|
|
|
|
|
|
Advanced Info Service PCL |
|
|
| 41,100 |
| 97 |
|
Bangkok Expressway PCL |
|
|
| 101,600 |
| 62 |
|
Hana Microelectronics PCL |
|
|
| 215,500 |
| 165 |
|
Kasikornbank PCL |
|
|
| 20,500 |
| 37 |
|
Land and Houses PCL |
|
|
| 780,100 |
| 183 |
|
PTT Exploration & Production PCL |
|
|
| 128,500 |
| 431 |
|
PTT PCL |
|
|
| 92,400 |
| 635 |
|
Siam Cement PCL |
|
|
| 61,600 |
| 416 |
|
Siam City Cement PCL |
|
|
| 13,200 |
| 95 |
|
Siam Commercial Bank PCL |
|
|
| 431,100 |
| 746 |
|
Thai Union Frozen Products PCL |
|
|
| 67,700 |
| 56 |
|
United Kingdom (3.6%) |
|
|
|
|
|
|
|
Aviva PLC |
|
|
| 51,294 |
| 747 |
|
BAA PLC |
|
|
| 33,425 |
| 515 |
|
BAE Systems PLC |
|
|
| 63,784 |
| 484 |
|
Barclays PLC |
|
|
| 77,787 |
| 969 |
|
BP PLC |
|
|
| 59,505 |
| 732 |
|
Cadbury Schweppes PLC, ADR |
|
|
| 13,100 |
| 523 |
|
Deutsche Bank AG Rights, Expires 9/15/2006 |
|
|
| 98,020 |
| 24 |
|
Diageo PLC, Sponsored ADR |
| † |
| 4,000 |
| 265 |
|
Guinness Peat Group PLC |
|
|
| 67,700 |
| 116 |
|
HBOS PLC |
|
|
| 58,547 |
| 1,024 |
|
HSBC Holdings PLC |
|
|
| 25,200 |
| 430 |
|
Kesa Electricals PLC |
|
|
| 76,475 |
| 441 |
|
Prudential PLC |
|
|
| 52,357 |
| 612 |
|
Royal Bank of Scotland Group PLC |
|
|
| 33,709 |
| 1,097 |
|
Royal Dutch Shell PLC-Class B |
|
|
| 23,654 |
| 843 |
|
Vodafone Group PLC |
|
|
| 597,642 |
| 1,407 |
|
Vodafone Group PLC, ADR |
| v |
| 27,800 |
| 659 |
|
United States (21.7%) |
|
|
|
|
|
|
|
3Com Corp. |
| ‡ v |
| 69,100 |
| 372 |
|
Aames Investment Corp. REIT |
|
|
| 4,100 |
| 22 |
|
Abbott Laboratories |
|
|
| 9,000 |
| 385 |
|
Adaptec, Inc. |
| ‡ |
| 32,300 |
| 179 |
|
Advanced Micro Devices, Inc. |
| † ‡ |
| 300 |
| 10 |
|
AES Corp. (The) |
| ‡ |
| 12,100 |
| 205 |
|
Aetna, Inc. |
|
|
| 5,050 |
| 194 |
|
Agere Systems, Inc. |
| ‡ |
| 5,600 |
| 88 |
|
AK Steel Holding Corp. |
| ‡ |
| 5,100 |
| 76 |
|
Albertson’s, Inc. |
| † |
| 400 |
| 10 |
|
Alcoa, Inc. |
|
|
| 33,100 |
| 1,118 |
|
Allegheny Technologies, Inc. |
|
|
| 200 |
| 14 |
|
Alliance One International, Inc. |
|
|
| 33,700 |
| 148 |
|
Alliant Energy Corp. |
|
|
| 300 |
| 10 |
|
Allstate Corp. (The) |
|
|
| 7,100 |
| 401 |
|
ALLTEL Corp. |
|
|
| 9,500 |
| 612 |
|
Alon USA Energy, Inc. |
|
|
| 1,600 |
| 43 |
|
Alpha Natural Resources, Inc. |
| ‡ |
| 6,300 |
| 158 |
|
Altria Group, Inc. |
|
|
| 8,600 |
| 629 |
|
Amerada Hess Corp. |
| † |
| 1,800 |
| 258 |
|
American International Group, Inc. |
|
|
| 30,400 |
| 1,984 |
|
AmerisourceBergen Corp. |
|
|
| 3,000 |
| 129 |
|
Amgen, Inc. |
| ‡ |
| 1,200 |
| 81 |
|
AMR Corp. |
| † ‡ |
| 400 |
| 10 |
|
Andrx Corp. |
| † ‡ |
| 5,700 |
| 133 |
|
Arch Coal, Inc. |
| † v |
| 3,800 |
| 361 |
|
Archer-Daniels-Midland Co. |
|
|
| 300 |
| 11 |
|
Assurant, Inc. |
|
|
| 4,400 |
| 212 |
|
AT&T, Inc. |
|
|
| 18,400 |
| 482 |
|
Autoliv, Inc. |
|
|
| 200 |
| 11 |
|
Automatic Data Processing, Inc. |
|
|
| 4,000 |
| 176 |
|
Avon Products, Inc. |
| † |
| 7,100 |
| 232 |
|
Baker Hughes, Inc. |
|
|
| 1,400 |
| 113 |
|
Bank of America Corp. |
|
|
| 16,100 |
| 804 |
|
53
TA IDEX Mercury Global Allocation
SCHEDULE OF INVESTMENTS
At April 30, 2006
(all amounts except share amounts in thousands)
(unaudited)
Bank of New York Co., Inc. (The) |
|
|
| 9,200 |
| 323 |
|
Bausch & Lomb, Inc. |
| † v |
| 4,400 |
| 215 |
|
Baxter International, Inc. |
|
|
| 5,000 |
| 188 |
|
Bear Stearns Cos. Inc. (The) |
|
|
| 100 |
| 14 |
|
BellSouth Corp. |
|
|
| 6,100 |
| 206 |
|
Borland Software Corp. |
| ‡ |
| 11,600 |
| 59 |
|
Boston Scientific Corp. |
| † ‡ |
| 4,100 |
| 95 |
|
Bowater, Inc. |
|
|
| 9,100 |
| 248 |
|
Bristol West Holdings, Inc. |
|
|
| 3,400 |
| 63 |
|
Bristol-Myers Squibb Co. |
|
|
| 18,200 |
| 462 |
|
Brocade Communications Systems, Inc. |
| ‡ |
| 25,300 |
| 156 |
|
CA, Inc. |
| † |
| 50,700 |
| 1,286 |
|
Cardinal Health, Inc. |
|
|
| 100 |
| 7 |
|
Career Education Corp. |
| † ‡ v |
| 14,600 |
| 538 |
|
Caterpillar, Inc. |
|
|
| 100 |
| 8 |
|
CBS Corp.-Class B |
| † v |
| 5,100 |
| 130 |
|
Ceridian Corp. |
| ‡ |
| 400 |
| 10 |
|
Chevron Corp. |
|
|
| 14,800 |
| 903 |
|
Cincinnati Bell, Inc. |
| ‡ |
| 8,100 |
| 34 |
|
Circuit City Stores, Inc. |
|
|
| 400 |
| 12 |
|
Cirrus Logic, Inc. |
| ‡ |
| 17,300 |
| 163 |
|
Cisco Systems, Inc. |
| ‡ |
| 87,700 |
| 1,837 |
|
CIT Group, Inc. |
|
|
| 200 |
| 11 |
|
Citigroup, Inc. |
|
|
| 30,800 |
| 1,538 |
|
Coca-Cola Co. (The) |
|
|
| 8,100 |
| 340 |
|
Comcast Corp.-Class A |
| ‡ |
| 17,100 |
| 529 |
|
Compuware Corp. |
| ‡ |
| 6,100 |
| 47 |
|
Comverse Technology, Inc. |
| ‡ |
| 3,100 |
| 70 |
|
ConAgra Foods, Inc. |
|
|
| 11,700 |
| 265 |
|
ConocoPhillips |
|
|
| 15,700 |
| 1,050 |
|
Consol Energy, Inc. |
|
|
| 1,600 |
| 136 |
|
Constellation Brands, Inc.-Class A |
| ‡ |
| 6,200 |
| 153 |
|
Corinthian Colleges, Inc. |
| ‡ v |
| 30,000 |
| 447 |
|
Corn Products International, Inc. |
|
|
| 8,500 |
| 238 |
|
Crown Holdings, Inc. |
| ‡ |
| 12,100 |
| 194 |
|
CSX Corp. |
|
|
| 27,000 |
| 1,849 |
|
Cummins, Inc. |
|
|
| 100 |
| 10 |
|
CVS Corp. |
|
|
| 8,100 |
| 241 |
|
Darden Restaurants, Inc. |
|
|
| 200 |
| 8 |
|
Devon Energy Corp. |
|
|
| 4,000 |
| 240 |
|
Discovery Holding Co.-Class A |
| † ‡ |
| 1,300 |
| 19 |
|
du Pont (E.I.) de Nemours & Co. |
|
|
| 6,100 |
| 269 |
|
El Paso Corp. |
|
|
| 105,000 |
| 1,356 |
|
ENSCO International, Inc. |
|
|
| 6,000 |
| 321 |
|
Extreme Networks |
| ‡ v |
| 15,000 |
| 68 |
|
Exxon Mobil Corp. |
|
|
| 31,400 |
| 1,981 |
|
Fannie Mae |
| v |
| 6,300 |
| 319 |
|
FedEx Corp. |
|
|
| 2,300 |
| 265 |
|
Fifth Third Bancorp |
| † |
| 8,100 |
| 327 |
|
Foundation Coal Holdings, Inc. |
|
|
| 8,100 |
| 411 |
|
Freeport-McMoRan Copper & Gold, Inc.-Class B |
|
|
| 4,000 |
| 258 |
|
Friedman Billings Ramsey Group, Inc.-Class A |
| † |
| 47,200 |
| 510 |
|
General Communication-Class A |
| ‡ |
| 14,500 |
| 174 |
|
General Dynamics Corp. |
|
|
| 2,000 |
| 131 |
|
General Electric Co. |
|
|
| 74,900 |
| 2,591 |
|
Global Payments, Inc. |
|
|
| 200 |
| 9 |
|
Goldman Sachs Group, Inc. (The) |
|
|
| 100 |
| 16 |
|
Halliburton Co. |
|
|
| 4,200 |
| 328 |
|
Harman International Industries, Inc. |
|
|
| 100 |
| 9 |
|
Hartford Financial Services Group, Inc. (The) |
|
|
| 1,400 |
| 129 |
|
HCA, Inc. |
|
|
| 8,100 |
| 356 |
|
Health Management Associates, Inc.-Class A |
|
|
| 2,100 |
| 43 |
|
Healthsouth Corp. |
| ‡ |
| 16,200 |
| 74 |
|
Hewlett-Packard Co. |
|
|
| 12,100 |
| 393 |
|
Home Depot, Inc. (The) |
|
|
| 5,000 |
| 200 |
|
54
TA IDEX Mercury Global Allocation
SCHEDULE OF INVESTMENTS
At April 30, 2006
(all amounts except share amounts in thousands)
(unaudited)
Humana, Inc. |
| ‡ |
| 5,175 |
| 234 |
|
Information Resources, Inc. Rights, Expires 12/31/2009 |
| ‡ |
| 16,800 |
| 11 |
|
Intel Corp. |
|
|
| 19,500 |
| 390 |
|
International Business Machines Corp. |
|
|
| 12,800 |
| 1,054 |
|
International Coal Group, Inc. |
| ‡ |
| 32,200 |
| 332 |
|
International Paper Co. |
|
|
| 12,100 |
| 440 |
|
Intersil Corp.-Class A |
|
|
| 300 |
| 9 |
|
James River Coal Co. |
| † ‡ |
| 1,400 |
| 49 |
|
JDS Uniphase Corp. |
| ‡ |
| 50,600 |
| 177 |
|
Johnson & Johnson |
|
|
| 18,200 |
| 1,067 |
|
JP Morgan Chase & Co. |
|
|
| 4,000 |
| 182 |
|
Kerr-McGee Corp. |
| v |
| 15,600 |
| 1,558 |
|
Key Energy Services, Inc. |
| ‡ |
| 12,600 |
| 215 |
|
King Pharmaceuticals, Inc. |
| ‡ |
| 800 |
| 14 |
|
Knight Capital Group, Inc.-Class A |
| ‡ |
| 34,300 |
| 575 |
|
Lehman Brothers Holdings, Inc. |
|
|
| 500 |
| 76 |
|
Leucadia National Corp. |
|
|
| 200 |
| 12 |
|
Lexmark International, Inc. |
| ‡ v |
| 9,200 |
| 448 |
|
Liberty Global, Inc.-Class A |
| ‡ |
| 2,100 |
| 43 |
|
Liberty Global, Inc.-Series C |
| ‡ |
| 2,100 |
| 42 |
|
Liberty Media Corp.-Class A |
| ‡ |
| 13,100 |
| 109 |
|
Lilly (Eli) & Co. |
|
|
| 6,300 |
| 333 |
|
Lincoln National Corp. |
|
|
| 200 |
| 12 |
|
Lucent Technologies, Inc. |
| ‡ |
| 16,200 |
| 45 |
|
Lyondell Chemical Co. |
|
|
| 5,300 |
| 128 |
|
Macquarie Infrastructure Co. Trust |
|
|
| 29,400 |
| 858 |
|
Manor Care, Inc. |
|
|
| 5,000 |
| 219 |
|
Marathon Oil Corp. |
|
|
| 10,100 |
| 802 |
|
Marsh & McLennan Cos., Inc. |
|
|
| 3,400 |
| 104 |
|
Mattel, Inc. |
|
|
| 8,100 |
| 131 |
|
Maverick Tube Corp. |
| † ‡ |
| 4,600 |
| 250 |
|
McDonald’s Corp. |
| v |
| 25,300 |
| 875 |
|
McGraw-Hill Cos., Inc. (The) |
|
|
| 200 |
| 11 |
|
Medco Health Solutions, Inc. |
| ‡ |
| 2,025 |
| 108 |
|
Mellon Financial Corp. |
|
|
| 700 |
| 26 |
|
Merck & Co., Inc. |
|
|
| 20,400 |
| 702 |
|
Microsoft Corp. |
|
|
| 79,700 |
| 1,925 |
|
Mirant Corp. |
| ‡ |
| 8,600 |
| 211 |
|
Molson Coors Brewing Co.-Class B |
|
|
| 3,800 |
| 281 |
|
Morgan Stanley |
|
|
| 11,100 |
| 714 |
|
Motorola, Inc. |
| v |
| 29,800 |
| 636 |
|
MSC Industrial Direct Co.-Class A |
|
|
| 200 |
| 10 |
|
Murphy Oil Corp. |
| v |
| 6,000 |
| 301 |
|
National Oilwell Varco, Inc. |
| ‡ |
| 2,000 |
| 138 |
|
Navistar International Corp. |
| ‡ |
| 8,300 |
| 219 |
|
Newfield Exploration Co. |
| ‡ |
| 3,400 |
| 152 |
|
Newmont Mining Corp. |
|
|
| 4,000 |
| 233 |
|
Noble Energy, Inc. |
|
|
| 3,400 |
| 153 |
|
Nordstrom, Inc. |
|
|
| 300 |
| 11 |
|
Norfolk Southern Corp. |
| v |
| 7,400 |
| 400 |
|
Novell, Inc. |
| † ‡ v |
| 90,300 |
| 742 |
|
NTL, Inc. |
| † ‡ |
| 10,000 |
| 275 |
|
Nucor Corp. |
| † |
| 100 |
| 11 |
|
NVIDIA Corp. |
| † ‡ |
| 400 |
| 12 |
|
Occidental Petroleum Corp. |
|
|
| 6,000 |
| 616 |
|
Office Depot, Inc. |
| ‡ |
| 300 |
| 12 |
|
Panera Bread Co.-Class A |
| † ‡ v |
| 2,100 |
| 156 |
|
Pfizer, Inc. |
| v |
| 45,900 |
| 1,163 |
|
Photronics, Inc. |
| ‡ |
| 6,100 |
| 110 |
|
Pier 1 Imports, Inc. |
|
|
| 12,500 |
| 151 |
|
Pogo Producing Co. |
| v |
| 9,600 |
| 477 |
|
Polo Ralph Lauren Corp. |
|
|
| 200 |
| 12 |
|
PPL Corp. |
|
|
| 12,200 |
| 354 |
|
Procter & Gamble Co. |
|
|
| 2,600 |
| 151 |
|
Prologis |
|
|
| 1,200 |
| 60 |
|
55
TA IDEX Mercury Global Allocation
SCHEDULE OF INVESTMENTS
At April 30, 2006
(all amounts except share amounts in thousands)
(unaudited)
Prudential Financial, Inc. |
|
|
| 1,400 |
| 109 |
|
Quanta Services, Inc. |
| † ‡ |
| 20,200 |
| 328 |
|
Qwest Communications International |
| † ‡ |
| 1,400 |
| 9 |
|
RadioShack Corp. |
|
|
| 4,500 |
| 77 |
|
Ralcorp Holdings, Inc. |
| ‡ |
| 4,000 |
| 149 |
|
Raytheon Co. |
|
|
| 2,600 |
| 115 |
|
Red Hat, Inc. |
| † ‡ |
| 400 |
| 12 |
|
Reynolds American, Inc. |
|
|
| 100 |
| 11 |
|
Rowan Cos., Inc. |
|
|
| 7,300 |
| 324 |
|
Sanmina-SCI Corp. |
| ‡ |
| 29,400 |
| 153 |
|
Sara Lee Corp. |
|
|
| 5,500 |
| 98 |
|
Schering-Plough Corp. |
|
|
| 14,000 |
| 270 |
|
Senomyx, Inc. |
| ‡ |
| 5,600 |
| 80 |
|
Smurfit-Stone Container Corp. |
| ‡ |
| 10,200 |
| 132 |
|
Solectron Corp. |
| ‡ |
| 23,700 |
| 95 |
|
Sprint Nextel Corp. |
|
|
| 19,300 |
| 479 |
|
St. Paul Travelers Cos., Inc. (The) |
|
|
| 15,600 |
| 687 |
|
Staples, Inc. |
|
|
| 400 |
| 11 |
|
Starbucks Corp. |
| ‡ |
| 300 |
| 11 |
|
Stone Energy Corp. |
| ‡ |
| 4,700 |
| 221 |
|
Sun Microsystems, Inc. |
| ‡ |
| 101,100 |
| 505 |
|
Symantec Corp. |
| ‡ |
| 10,000 |
| 164 |
|
Tellabs, Inc. |
| ‡ v |
| 5,300 |
| 84 |
|
Tenet Healthcare Corp. |
| ‡ |
| 22,300 |
| 186 |
|
TIBCO Software, Inc. |
| ‡ v |
| 23,100 |
| 199 |
|
Tidewater, Inc. |
|
|
| 2,100 |
| 122 |
|
Time Warner, Inc. |
|
|
| 11,100 |
| 193 |
|
Todco-Class A |
| ‡ |
| 3,200 |
| 147 |
|
Triad Hospitals, Inc. |
| ‡ |
| 3,500 |
| 144 |
|
Tribune Co. |
|
|
| 3,300 |
| 95 |
|
Tronox, Inc.-Class B |
| ‡ |
| 1,875 |
| 32 |
|
Unifi, Inc. |
| ‡ |
| 40,700 |
| 137 |
|
Union Pacific Corp. |
|
|
| 15,800 |
| 1,441 |
|
United States Steel Corp. |
|
|
| 1,300 |
| 89 |
|
UnitedHealth Group, Inc. |
|
|
| 5,025 |
| 250 |
|
Valeant Pharmaceuticals International |
| † v |
| 13,900 |
| 249 |
|
Ventas, Inc. REIT |
|
|
| 3,000 |
| 98 |
|
Verizon Communications, Inc. |
|
|
| 6,800 |
| 225 |
|
Viacom, Inc.-Class B |
| ‡ |
| 5,100 |
| 203 |
|
W.R. Berkley Corp. |
|
|
| 200 |
| 7 |
|
Wachovia Corp. |
|
|
| 4,600 |
| 275 |
|
Walgreen Co. |
|
|
| 4,000 |
| 168 |
|
Wal-Mart Stores, Inc. |
|
|
| 4,000 |
| 180 |
|
Washington Mutual, Inc. |
|
|
| 6,100 |
| 275 |
|
Waters Corp. |
| ‡ |
| 3,100 |
| 140 |
|
Watson Pharmaceuticals, Inc. |
| ‡ |
| 2,700 |
| 77 |
|
WellPoint, Inc. |
| ‡ |
| 4,050 |
| 288 |
|
Wells Fargo & Co. |
|
|
| 8,400 |
| 577 |
|
Wendy’s International, Inc. |
|
|
| 3,000 |
| 185 |
|
Western Digital Corp. |
| ‡ |
| 500 |
| 11 |
|
Whirlpool Corp. |
|
|
| 100 |
| 9 |
|
Williams Cos., Inc. (The) |
|
|
| 1,200 |
| 26 |
|
Wyeth |
|
|
| 9,500 |
| 462 |
|
Total Common Stocks (cost: $161,615) |
|
|
|
|
| 180,977 |
|
|
|
|
| Principal |
| Value |
|
SHORT-TERM OBLIGATIONS (5.9%) |
|
|
|
|
|
|
|
Europe (5.1%) |
|
|
|
|
|
|
|
Eurodollar Time Deposit |
|
|
|
|
|
|
|
2.57%, due 05/05/2006 |
| EUR |
| 4,102 |
| 5,166 |
|
2.62%, due 05/19/2006 |
| EUR |
| 4,106 |
| 5,172 |
|
2.64%, due 06/09/2006 |
| EUR |
| 4,116 |
| 5,185 |
|
Switzerland (0.8%) |
|
|
|
|
|
|
|
Swiss Franc Time Deposit |
|
|
|
|
|
|
|
1.10%, due 05/05/2006 |
| CHF |
| 3,030 |
| 2,436 |
|
Total Short-Term Obligations (cost: $17,357) |
|
|
|
|
| 17,959 |
|
56
TA IDEX Mercury Global Allocation
SCHEDULE OF INVESTMENTS
At April 30, 2006
(all amounts except share amounts in thousands)
(unaudited)
SECURITY LENDING COLLATERAL (4.1%) |
|
|
|
|
|
|
|
Debt (3.8%) |
|
|
|
|
|
|
|
Bank Notes (0.5%) |
|
|
|
|
|
|
|
Bank of America |
|
|
|
|
|
|
|
4.81%, due 06/07/2006 |
| * |
| 413 |
| 413 |
|
4.81%, due 08/10/2006 |
| * |
| 398 |
| 398 |
|
Bear Stearns & Co. |
|
|
|
|
|
|
|
5.01%, due 06/06/2006 |
| * |
| 159 |
| 159 |
|
5.01%, due 09/07/2006 |
| * |
| 478 |
| 478 |
|
Certificates of Deposit (0.2%) |
|
|
|
|
|
|
|
Halifax Bank of Scotland |
|
|
|
|
|
|
|
4.78%, due 06/06/2006 |
| * |
| 398 |
| 398 |
|
Rabobank Nederland |
|
|
|
|
|
|
|
4.87%, due 05/31/2006 |
| * |
| 399 |
| 399 |
|
Commercial Paper (0.2%) |
|
|
|
|
|
|
|
Banco Santander Central Hispano SA |
|
|
|
|
|
|
|
4.77%, due 05/02/2006 |
|
|
| 239 |
| 239 |
|
Sheffield Receivables Corp.-144A |
|
|
|
|
|
|
|
4.81%, due 05/03/2006 |
|
|
| 398 |
| 398 |
|
Euro Dollar Overnight (0.7%) |
|
|
|
|
|
|
|
Bank of Montreal |
|
|
|
|
|
|
|
4.77%, due 05/02/2006 |
|
|
| 319 |
| 319 |
|
Dexia Group |
|
|
|
|
|
|
|
4.78%, due 05/04/2006 |
|
|
| 399 |
| 399 |
|
Fortis Bank |
|
|
|
|
|
|
|
4.77%, due 05/01/2006 |
|
|
| 159 |
| 159 |
|
Royal Bank of Canada |
|
|
|
|
|
|
|
4.77%, due 05/01/2006 |
|
|
| 558 |
| 558 |
|
Royal Bank of Scotland |
|
|
|
|
|
|
|
4.75%, due 05/03/2006 |
|
|
| 399 |
| 399 |
|
Svenska Handlesbanken |
|
|
|
|
|
|
|
4.82%, due 05/01/2006 |
|
|
| 304 |
| 304 |
|
Euro Dollar Terms (1.1%) |
|
|
|
|
|
|
|
BancoBilbao Vizcaya Argentaria SA |
|
|
|
|
|
|
|
4.95%, due 06/20/2006 |
|
|
| 319 |
| 319 |
|
Bank of the West |
|
|
|
|
|
|
|
4.94%, due 06/16/2006 |
|
|
| 319 |
| 319 |
|
Barclays |
|
|
|
|
|
|
|
4.79%, due 05/10/2006 |
|
|
| 478 |
| 478 |
|
4.77%, due 05/16/2006 |
|
|
| 159 |
| 159 |
|
Canadian Imperial Bank of Commerce |
|
|
|
|
|
|
|
4.97%, due 06/23/2006 |
|
|
| 239 |
| 239 |
|
Credit Suisse First Boston Corp. |
|
|
|
|
|
|
|
4.73%, due 05/08/2006 |
|
|
| 239 |
| 239 |
|
Fortis Bank |
|
|
|
|
|
|
|
4.83%, due 05/08/2006 |
|
|
| 159 |
| 159 |
|
Lloyds TSB Bank |
|
|
|
|
|
|
|
4.81%, due 05/11/2006 |
|
|
| 239 |
| 239 |
|
Royal Bank of Scotland |
|
|
|
|
|
|
|
4.87%, due 05/12/2006 |
|
|
| 319 |
| 319 |
|
Societe Generale |
|
|
|
|
|
|
|
4.79%, due 05/10/2006 |
|
|
| 399 |
| 399 |
|
UBS AG |
|
|
|
|
|
|
|
4.95%, due 06/20/2006 |
|
|
| 399 |
| 399 |
|
Repurchase Agreements (1.1%) |
| †† |
|
|
|
|
|
Credit Suisse First Boston Corp. 4.92%, dated 04/28/2006 to be repurchased at $541 on 05/01/2006 |
|
|
| 541 |
| 541 |
|
Goldman Sachs Group, Inc. (The) 4.92%, dated 04/28/2006 to be repurchased at $1,171 on 05/01/2006 |
|
|
| 1,171 |
| 1,171 |
|
57
TA IDEX Mercury Global Allocation
SCHEDULE OF INVESTMENTS
At April 30, 2006
(all amounts except share amounts in thousands)
(unaudited)
Lehman Brothers, Inc. 4.92%, dated 04/28/2006 to be repurchased at $20 on 05/01/2006 |
|
|
| 20 |
| 20 |
|
Merrill Lynch & Co. 4.87%, dated 04/28/2006 to be repurchased at $1,196 on 05/01/2006 |
|
|
| 1,196 |
| 1,196 |
|
Morgan Stanley Dean Witter & Co. 4.93%, dated 04/28/2006 to be repurchased at $558 on 05/01/2006 |
|
|
| 558 |
| 558 |
|
|
|
|
| Shares |
| Value |
| |
Investment Companies (0.3%) |
|
|
|
|
|
|
| |
Barclays Global Investors Institutional Money Market Fund 1-day yield of 4.78% |
|
|
| 637,669 |
| 638 |
| |
Merrimac Cash Fund, Premium Class 1-day yield of 4.61% |
| @ |
| 169,662 |
| 170 |
| |
Total Security Lending Collateral (cost: $12,582) |
|
|
|
|
| 12,582 |
| |
Total Investment Securities (cost: $274,892) |
|
|
|
|
| $ | 297,508 |
|
|
|
|
| Contracts | w | Value |
|
WRITTEN OPTIONS (-0.3%) |
|
|
|
|
|
|
|
Covered Call Options (-0.3%) |
|
|
|
|
|
|
|
3Com Corp. |
|
|
| 197 |
| (20 | ) |
Call Strike $5.00 |
|
|
|
|
|
|
|
Expires 01/20/2007 |
|
|
|
|
|
|
|
Arch Coal, Inc. |
|
|
| 38 |
| (98 | ) |
Call Strike $75.00 |
|
|
|
|
|
|
|
Expires 01/20/2007 |
|
|
|
|
|
|
|
Bausch & Lomb, Inc. |
|
|
| 14 |
| (10 | ) |
Call Strike $45.00 |
|
|
|
|
|
|
|
Expires 10/21/2006 |
|
|
|
|
|
|
|
Bausch & Lomb, Inc. |
|
|
| 30 |
| (15 | ) |
Call Strike $50.00 |
|
|
|
|
|
|
|
Expires 01/20/2007 |
|
|
|
|
|
|
|
Career Education Corp. |
|
|
| 60 |
| (57 | ) |
Call Strike $30.00 |
|
|
|
|
|
|
|
Expires 01/20/2007 |
|
|
|
|
|
|
|
Career Education Corp. |
|
|
| 72 |
| (43 | ) |
Call Strike $35.00 |
|
|
|
|
|
|
|
Expires 01/20/2007 |
|
|
|
|
|
|
|
CBS Corp. |
|
|
| 32 |
| (4 | ) |
Call Strike $27.50 |
|
|
|
|
|
|
|
Expires 01/20/2007 |
|
|
|
|
|
|
|
Chicago Bridge & Iron Co. |
|
|
| 27 |
| (9 | ) |
Call Strike $25.00 |
|
|
|
|
|
|
|
Expires 01/20/2007 |
|
|
|
|
|
|
|
Corinthian Colleges, Inc. |
|
|
| 300 |
| (102 | ) |
Call Strike $12.50 |
|
|
|
|
|
|
|
Expires 01/20/2007 |
|
|
|
|
|
|
|
Extreme Networks |
|
|
| 150 |
| (7 | ) |
Call Strike $5.00 |
|
|
|
|
|
|
|
Expires 01/20/2007 |
|
|
|
|
|
|
|
Fannie Mae |
|
|
| 6 |
| (3 | ) |
Call Strike $50.00 |
|
|
|
|
|
|
|
Expires 01/20/2007 |
|
|
|
|
|
|
|
Kerr-McGee Corp. |
|
|
| 50 |
| (58 | ) |
Call Strike $100.00 |
|
|
|
|
|
|
|
Expires 01/20/2007 |
|
|
|
|
|
|
|
Lexmark International, Inc. |
|
|
| 71 |
| (35 | ) |
Call Strike $50.00 |
|
|
|
|
|
|
|
Expires 01/20/2007 |
|
|
|
|
|
|
|
McDermott International, Inc. |
|
|
| 21 |
| (25 | ) |
Call Strike $55.00 |
|
|
|
|
|
|
|
Expires 01/20/2007 |
|
|
|
|
|
|
|
McDonald’s Corp. |
|
|
| 147 |
| (40 | ) |
Call Strike $35.00 |
|
|
|
|
|
|
|
Expires 01/20/2007 |
|
|
|
|
|
|
|
58
TA IDEX Mercury Global Allocation
SCHEDULE OF INVESTMENTS
At April 30, 2006
(all amounts except share amounts in thousands)
(unaudited)
Motorola Inc. |
|
|
| 256 |
| (45 | ) |
Call Strike $22.50 |
|
|
|
|
|
|
|
Expires 01/20/2007 |
|
|
|
|
|
|
|
Murphy Oil Corp. |
|
|
| 30 |
| (17 | ) |
Call Strike $50.00 |
|
|
|
|
|
|
|
Expires 01/20/2007 |
|
|
|
|
|
|
|
Norfolk Southern Corp. |
|
|
| 74 |
| (115 | ) |
Call Strike $40.00 |
|
|
|
|
|
|
|
Expires 01/20/2007 |
|
|
|
|
|
|
|
Novell, Inc. |
|
|
| 813 |
| (118 | ) |
Call Strike $7.50 |
|
|
|
|
|
|
|
Expires 01/20/2007 |
|
|
|
|
|
|
|
Panera Bread Co. |
|
|
| 21 |
| (24 | ) |
Call Strike $65.00 |
|
|
|
|
|
|
|
Expires 08/19/2006 |
|
|
|
|
|
|
|
Pfizer, Inc. |
|
|
| 68 |
| (13 | ) |
Call Strike $25.00 |
|
|
|
|
|
|
|
Expires 01/20/2007 |
|
|
|
|
|
|
|
Pogo Producing Co. |
|
|
| 56 |
| (30 | ) |
Call Strike $50.00 |
|
|
|
|
|
|
|
Expires 01/20/2007 |
|
|
|
|
|
|
|
Tellabs, Inc. |
|
|
| 53 |
| (23 | ) |
Call Strike $12.50 |
|
|
|
|
|
|
|
Expires 01/20/2007 |
|
|
|
|
|
|
|
TIBCO Software, Inc. |
|
|
| 78 |
| (14 | ) |
Call Strike $7.50 |
|
|
|
|
|
|
|
Expires 01/20/2007 |
|
|
|
|
|
|
|
Valeant Pharmaceuticals International |
|
|
| 139 |
| (53 | ) |
Call Strike $15.00 |
|
|
|
|
|
|
|
Expires 01/20/2007 |
|
|
|
|
|
|
|
Vodafone Group PLC |
|
|
| 72 |
| (31 | ) |
Call Strike $20.00 |
|
|
|
|
|
|
|
Expires 01/20/2007 |
|
|
|
|
|
|
|
Total Written Options (premiums: $767) |
|
|
|
|
| (1,009 | ) |
NOTES TO SCHEDULE OF INVESTMENTS:
d At April 30, 2006, all or a portion of this security is segregated with the custodian to cover margin requirements for open futures contracts. The value of all securities segregated at April 30, 2006 is $960.
† At April 30, 2006, all or a portion of this security is on loan (see Note 1). The value at April 30, 2006, of all securities on loan is $12,191.
(a) Passive Foreign Investment Company.
‡ Non-income producing.
* Floating or variable rate note. Rate is listed as of April 30, 2006.
†† Cash collateral for the Repurchase Agreements, valued at $3,588, that serve as collateral for securities lending are invested in corporate bonds with interest rates and maturity dates ranging from 0.00% - 9.05% and 05/02/2006 - 12/31/2049, respectively.
@ Regulated investment company advised by Investors Bank and Trust Co. (“IBT”). IBT is also the accounting, custody and lending agent for the Fund.
w Contract amounts are not in thousands.
o Value is less than $1.
m Securities valued as determined in good faith in accordance with procedure established by the Fund’s Board of Trustees.
59
TA IDEX Mercury Global Allocation
SCHEDULE OF INVESTMENTS
At April 30, 2006
(all amounts except share amounts in thousands)
(unaudited)
v At April 30, 2006, all or a portion of this security is segregated with the custodian to cover margin requirements for open option contracts. The value of all securities segregated at April 30, 2006, is $6,283.
# Aggregate cost for Federal income tax purposes is $274,918. Aggregate gross unrealized appreciation for all securities in which there is an excess of value over tax cost and aggregate gross unrealized depreciation for all securities in which there is an excess of tax cost over value were $25,588 and $2,998, respectively. Net unrealized appreciation for tax purposes is $22,590.
144A 144A Securities are registered pursuant to Rule 144A of the Securities Act of 1933. These securities are deemed to be liquid for purposes of compliance limitations on holdings of illiquid securities and may be resold as transactions exempt from registration, normally to qualified institutional buyers. At April 30, 2006, these securities aggregated $1,133 or 0.4% of the net assets of the Fund.
ADR American Depositary Receipt
BRL Brazilian Real
CAD Canadian dollar
CHF Swiss Franc
EUR Euro
GBP Great British Pound
GDR Global Depositary Receipt
JPY Japanese Yen
MYR Malaysian Ringgit
NZD New Zealand dollar
PLN Polish Zloty
REIT Real Estate Investment Trust
SEK Swedish Krona
The notes to the financial statements are an integral part of this report.
60
TA IDEX Mercury Global Allocation
SCHEDULE OF INVESTMENTS
At April 30, 2006
(all amounts except share amounts in thousands)
(unaudited)
FUTURES CONTRACTS:
|
|
|
|
|
|
|
| Net Unrealized |
| ||
|
|
|
| Settlement |
|
|
| Appreciation |
| ||
|
| Contracts |
| Date |
| Amount |
| (Depreciation) |
| ||
10 Year Japan Government Bond |
| (4) |
| 06/20/2006 |
| $ | (4,644 | ) | $ | 69 |
|
Dax Index |
| 3 |
| 06/16/2006 |
| 569 |
| 19 |
| ||
DJ EURO STOXX 50 Index |
| 24 |
| 06/17/2006 |
| 1,145 |
| 20 |
| ||
FTSE 100 Index |
| (4) |
| 06/17/2006 |
| (438 | ) | (4 | ) | ||
S&P 500 Index |
| (19) |
| 06/17/2006 |
| (6,251 | ) | (61 | ) | ||
S&P/TSE 60 Index |
| 1 |
| 06/16/2006 |
| 123 |
| (2 | ) | ||
TOPIX Index |
| (5) |
| 06/09/2006 |
| (755 | ) | (10 | ) | ||
|
|
|
|
|
| $ | (10,251 | ) | $ | 31 |
|
The notes to the financial statements are an integral part of this report.
61
TA IDEX Mercury Global Allocation
SCHEDULE OF INVESTMENTS
At April 30, 2006
(all amounts except share amounts in thousands)
(unaudited)
|
| Percentage of |
|
|
| |
|
| Net Assets |
| Value |
| |
INVESTMENTS BY INDUSTRY: |
|
|
|
|
| |
U.S. Government & Agency |
| 14.3 | % | $ | 43,659 |
|
Commercial Banks |
| 10.1 | % | 30,825 |
| |
Sovereign Government |
| 6.2 | % | 18,854 |
| |
Insurance |
| 5.2 | % | 16,037 |
| |
Oil & Gas Extraction |
| 4.3 | % | 13,206 |
| |
Telecommunications |
| 3.5 | % | 10,799 |
| |
Petroleum Refining |
| 3.1 | % | 9,420 |
| |
Security & Commodity Brokers |
| 3.0 | % | 9,238 |
| |
Pharmaceuticals |
| 2.5 | % | 7,744 |
| |
Computer & Data Processing Services |
| 2.1 | % | 6,355 |
| |
Railroads |
| 2.0 | % | 6,129 |
| |
Chemicals & Allied Products |
| 2.0 | % | 6,116 |
| |
Construction |
| 2.0 | % | 6,040 |
| |
Computer & Office Equipment |
| 1.8 | % | 5,416 |
| |
Business Services |
| 1.6 | % | 4,931 |
| |
Automotive |
| 1.6 | % | 4,771 |
| |
Metal Mining |
| 1.5 | % | 4,612 |
| |
Primary Metal Industries |
| 1.4 | % | 4,242 |
| |
Food & Kindred Products |
| 1.2 | % | 3,601 |
| |
Electronic Components & Accessories |
| 1.2 | % | 3,574 |
| |
Beverages |
| 1.1 | % | 3,379 |
| |
Electric Services |
| 1.1 | % | 3,350 |
| |
Holding & Other Investment Offices |
| 1.0 | % | 3,129 |
| |
Electronic & Other Electric Equipment |
| 1.0 | % | 3,010 |
| |
Mining |
| 0.7 | % | 2,204 |
| |
Mortgage Bankers & Brokers |
| 0.7 | % | 2,132 |
| |
Engineering & Management Services |
| 0.7 | % | 2,083 |
| |
Gas Production & Distribution |
| 0.6 | % | 1,966 |
| |
Life Insurance |
| 0.6 | % | 1,902 |
| |
Tobacco Products |
| 0.6 | % | 1,881 |
| |
Communications Equipment |
| 0.6 | % | 1,796 |
| |
Industrial Machinery & Equipment |
| 0.5 | % | 1,625 |
| |
Radio & Television Broadcasting |
| 0.5 | % | 1,496 |
| |
Stone, Clay & Glass Products |
| 0.5 | % | 1,393 |
| |
Real Estate |
| 0.4 | % | 1,363 |
| |
Health Services |
| 0.4 | % | 1,314 |
| |
Restaurants |
| 0.4 | % | 1,079 |
| |
Paper & Allied Products |
| 0.4 | % | 1,074 |
| |
Business Credit Institutions |
| 0.3 | % | 1,035 |
| |
Retail Trade |
| 0.3 | % | 1,005 |
| |
Wholesale Trade Durable Goods |
| 0.3 | % | 1,004 |
| |
Educational Services |
| 0.3 | % | 985 |
| |
Food Stores |
| 0.3 | % | 972 |
| |
Instruments & Related Products |
| 0.2 | % | 747 |
| |
Communication |
| 0.2 | % | 692 |
| |
Residential Building Construction |
| 0.2 | % | 659 |
| |
Transportation & Public Utilities |
| 0.2 | % | 627 |
| |
Aerospace |
| 0.2 | % | 615 |
| |
Personal Credit Institutions |
| 0.2 | % | 575 |
| |
Lumber & Other Building Materials |
| 0.2 | % | 538 |
| |
Radio, Television & Computer Stores |
| 0.2 | % | 529 |
| |
Motion Pictures |
| 0.2 | % | 516 |
| |
Electric, Gas & Sanitary Services |
| 0.2 | % | 496 |
| |
Insurance Agents, Brokers & Service |
| 0.2 | % | 467 |
| |
62
Agriculture |
| 0.1 | % | 451 |
|
Drug Stores & Proprietary Stores |
| 0.1 | % | 408 |
|
Air Transportation |
| 0.1 | % | 390 |
|
Public Administration |
| 0.1 | % | 372 |
|
Specialty- Real Estate |
| 0.1 | % | 361 |
|
Medical Instruments & Supplies |
| 0.1 | % | 284 |
|
Savings Institutions |
| 0.1 | % | 275 |
|
Printing & Publishing |
| 0.1 | % | 236 |
|
Metal Cans & Shipping Containers |
| 0.1 | % | 194 |
|
Apparel Products |
| 0.1 | % | 183 |
|
Furniture & Home Furnishings Stores |
| 0.1 | % | 151 |
|
Toys, Games & Hobbies |
| 0.0 | % | 131 |
|
Water Transportation |
| 0.0 | % | 122 |
|
Research & Testing Services |
| 0.0 | % | 80 |
|
Warehouse |
| 0.0 | % | 60 |
|
Manufacturing Industries |
| 0.0 | % | 42 |
|
Apparel & Accessory Stores |
| 0.0 | % | 11 |
|
Management Services |
| 0.0 | % | 9 |
|
Covered Call Options |
| 0.0 | % | 0 |
|
Investment Securities, at value |
| 87.2 | % | 266,967 |
|
Short-Term Investments |
| 10.0 | % | 30,541 |
|
Total Investment Securities |
| 97.2 | % | 297,508 |
|
The notes to the financial statements are an integral part of this report.
63
TA IDEX Mercury Large Cap Value
UNDERSTANDING YOUR FUND’S EXPENSES
(unaudited)
SHAREHOLDER EXPENSES
Fund shareholders may incur ongoing costs, including management fees, 12b-1 distribution and service fees, and other fund expenses. Shares of the Fund currently are sold only to certain Transamerica IDEX Mutual Funds and AEGON/Transamerica Series Trust (an affiliate of Transamerica IDEX Mutual Funds) asset allocation funds at net asset value, without any transaction costs.
The following Example is intended to help you understand your ongoing costs (in dollars and cents) of investing in the Fund and to compare these costs with the ongoing costs of investing in other funds.
The Example is based on an investment of $1,000 invested at November 15, 2005 and held for the entire period until April 30, 2006.
ACTUAL EXPENSES
The first line in the table below provides information about actual account values and actual expenses. You may use the information in this line, together with the amount you invested, to estimate the expenses that you paid over the period. Simply divide your account value by $1,000 (for example, an $8,600 account value divided by $1,000 = 8.6), then multiply the result by the number in the first line of your Fund under the heading entitled “Expenses Paid During Period” to estimate the expenses you paid on your account during this period.
HYPOTHETICAL EXAMPLE FOR COMPARISON PURPOSES
The second line in the table below provides information about hypothetical account values and hypothetical expenses based on the Fund’s actual expense ratio and an assumed rate of return of 5% per year before expenses, which is not the Fund’s actual return. The hypothetical account values and expenses may not be used to estimate the actual ending account balance or expenses you paid for the period. You may use this information to compare the ongoing costs of investing in your Fund and other funds. To do so, compare this 5% hypothetical example with the 5% hypothetical examples that appear in the shareholder reports of the other funds.
|
| Beginning |
| Ending |
| Annualized |
| Expenses Paid |
| |||
Class I |
|
|
|
|
|
|
|
|
| |||
Actual |
| $ | 1,000.00 |
| $ | 1,123.40 |
| 0.84 | % | $ | 4.06 |
|
Hypothetical(b) |
| 1,000.00 |
| 1,018.92 |
| 0.84 | % | 3.86 |
| |||
(a) Expenses are calculated using the Fund’s annualized expense ratio (as disclosed in the table), multiplied by the average account value for the period, multiplied by number of days in the period (166 days), and divided by the number of days in the year (365 days).
(b) 5% return per year before expenses.
64
TA IDEX Mercury Large Cap Value
TABULAR PRESENTATION OF SCHEDULE OF INVESTMENTS
By Sector
At April 30, 2006
Basic Materials |
| 3.8 | % |
Communications |
| 5.7 | % |
Consumer Cyclical |
| 5.0 | % |
Consumer Non-Cyclical |
| 12.5 | % |
Energy |
| 21.4 | % |
Financial |
| 26.4 | % |
Industrial |
| 8.0 | % |
Other |
| 8.4 | % |
Technology |
| 8.8 | % |
|
| 100.0 | % |
This chart shows the percentage breakdown by sector of the Fund’s total investment securities.
65
TA IDEX Mercury Large Cap Value
SCHEDULE OF INVESTMENTS
At April 30, 2006
(all amounts except share amounts in thousands)
(unaudited)
|
|
|
| Shares |
| Value |
| |
COMMON STOCKS (99.9%) |
|
|
|
|
|
|
| |
Aerospace (1.9%) |
|
|
|
|
|
|
| |
Lockheed Martin Corp. |
|
|
| 50,000 |
| $ | 3,795 |
|
Northrop Grumman Corp. |
|
|
| 85,000 |
| 5,686 |
| |
Amusement & Recreation Services (1.7%) |
|
|
|
|
|
|
| |
Disney (Walt) Co. (The) |
|
|
| 293,000 |
| 8,192 |
| |
Apparel & Accessory Stores (0.7%) |
|
|
|
|
|
|
| |
Nordstrom, Inc. |
| † |
| 90,000 |
| 3,450 |
| |
Apparel Products (0.7%) |
|
|
|
|
|
|
| |
Polo Ralph Lauren Corp. |
|
|
| 56,000 |
| 3,400 |
| |
Automotive Dealers & Service Stations (0.7%) |
|
|
|
|
|
|
| |
AutoNation, Inc. |
| †‡ |
| 143,000 |
| 3,220 |
| |
Beverages (0.6%) |
|
|
|
|
|
|
| |
Pepsi Bottling Group, Inc. |
|
|
| 96,000 |
| 3,082 |
| |
Business Credit Institutions (0.7%) |
|
|
|
|
|
|
| |
CIT Group, Inc. |
|
|
| 68,000 |
| 3,673 |
| |
Business Services (0.6%) |
|
|
|
|
|
|
| |
Convergys Corp. |
| ‡ |
| 121,000 |
| 2,356 |
| |
Manpower, Inc. |
|
|
| 9,000 |
| 586 |
| |
Chemicals & Allied Products (0.8%) |
|
|
|
|
|
|
| |
Eastman Chemical Co. |
|
|
| 69,000 |
| 3,750 |
| |
Tronox, Inc.-Class B |
| ‡ |
| 2 |
| — | o | |
Commercial Banks (6.8%) |
|
|
|
|
|
|
| |
Bank of America Corp. |
|
|
| 136,000 |
| 6,789 |
| |
Citigroup, Inc. |
|
|
| 185,000 |
| 9,241 |
| |
JP Morgan Chase & Co. |
|
|
| 380,000 |
| 17,244 |
| |
Communications Equipment (1.4%) |
|
|
|
|
|
|
| |
Avaya, Inc. |
| ‡ |
| 107,000 |
| 1,284 |
| |
Motorola, Inc. |
|
|
| 262,000 |
| 5,594 |
| |
Computer & Data Processing Services (5.3%) |
|
|
|
|
|
|
| |
CA, Inc. |
|
|
| 67,000 |
| 1,699 |
| |
Checkfree Corp. |
| †‡ |
| 79,000 |
| 4,256 |
| |
Computer Sciences Corp. |
| ‡ |
| 91,000 |
| 5,328 |
| |
Compuware Corp. |
| ‡ |
| 450,000 |
| 3,456 |
| |
Electronic Data Systems Corp. |
|
|
| 66,000 |
| 1,787 |
| |
Fair Isaac Corp. |
|
|
| 76,000 |
| 2,820 |
| |
McAfee, Inc. |
| ‡ |
| 47,000 |
| 1,226 |
| |
NCR Corp. |
| ‡ |
| 26,000 |
| 1,024 |
| |
Sabre Holdings Corp. |
|
|
| 141,000 |
| 3,256 |
| |
Sybase, Inc. |
| ‡ |
| 53,000 |
| 1,154 |
| |
Computer & Office Equipment (3.4%) |
|
|
|
|
|
|
| |
Hewlett-Packard Co. |
|
|
| 367,000 |
| 11,916 |
| |
International Business Machines Corp. |
|
|
| 56,000 |
| 4,611 |
| |
Department Stores (1.1%) |
|
|
|
|
|
|
| |
JC Penney Co., Inc. |
|
|
| 79,000 |
| 5,171 |
| |
Electric Services (0.0%) |
|
|
|
|
|
|
| |
Edison International |
|
|
| 3,000 |
| 121 |
| |
Electronic & Other Electric Equipment (0.2%) |
|
|
|
|
|
|
| |
Whirlpool Corp. |
|
|
| 13,000 |
| 1,167 |
| |
Electronic Components & Accessories (3.3%) |
|
|
|
|
|
|
| |
Advanced Micro Devices, Inc. |
| †‡ |
| 174,000 |
| 5,629 |
| |
Intersil Corp.-Class A |
|
|
| 90,000 |
| 2,665 |
| |
Micron Technology, Inc. |
| ‡ |
| 73,000 |
| 1,239 |
| |
QLogic Corp. |
| ‡ |
| 184,000 |
| 3,829 |
| |
Solectron Corp. |
| ‡ |
| 662,000 |
| 2,648 |
| |
Food & Kindred Products (1.4%) |
|
|
|
|
|
|
| |
Archer-Daniels-Midland Co. |
|
|
| 186,000 |
| 6,759 |
| |
Health Services (1.1%) |
|
|
|
|
|
|
| |
Caremark Rx, Inc. |
| ‡ |
| 111,000 |
| 5,056 |
| |
HCA, Inc. |
|
|
| 11,000 |
| 483 |
| |
Industrial Machinery & Equipment (0.5%) |
|
|
|
|
|
|
| |
SPX Corp. |
|
|
| 47,000 |
| 2,573 |
| |
Instruments & Related Products (2.8%) |
|
|
|
|
|
|
| |
Agilent Technologies, Inc. |
| ‡ |
| 133,000 |
| 5,110 |
| |
66
TA IDEX Mercury Large Cap Value
SCHEDULE OF INVESTMENTS
At April 30, 2006
(all amounts except share amounts in thousands)
(unaudited)
Raytheon Co. |
|
|
| 118,000 |
| 5,224 |
|
Rockwell Automation, Inc. |
|
|
| 48,000 |
| 3,478 |
|
Insurance (9.0%) |
|
|
|
|
|
|
|
Aetna, Inc. |
|
|
| 92,000 |
| 3,542 |
|
AMBAC Financial Group, Inc. |
|
|
| 11,000 |
| 906 |
|
American Financial Group, Inc. |
|
|
| 53,000 |
| 2,347 |
|
Cigna Corp. |
|
|
| 41,000 |
| 4,387 |
|
MGIC Investment Corp. |
|
|
| 78,000 |
| 5,515 |
|
PMI Group, Inc. (The) |
|
|
| 97,000 |
| 4,477 |
|
Principal Financial Group |
|
|
| 115,000 |
| 5,901 |
|
SAFECO Corp. |
|
|
| 69,000 |
| 3,581 |
|
St. Paul Travelers Cos., Inc. (The) |
|
|
| 114,000 |
| 5,019 |
|
UnumProvident Corp. |
| † |
| 150,000 |
| 3,046 |
|
WellPoint, Inc. |
| ‡ |
| 77,000 |
| 5,467 |
|
Insurance Agents, Brokers & Service (2.5%) |
|
|
|
|
|
|
|
AON Corp. |
|
|
| 86,000 |
| 3,604 |
|
Hartford Financial Services Group, Inc. (The) |
|
|
| 57,000 |
| 5,240 |
|
Humana, Inc. |
| ‡ |
| 72,000 |
| 3,253 |
|
Iron & Steel Foundries (0.8%) |
|
|
|
|
|
|
|
Precision Castparts Corp. |
|
|
| 61,000 |
| 3,842 |
|
Life Insurance (3.7%) |
|
|
|
|
|
|
|
Lincoln National Corp. |
|
|
| 99,000 |
| 5,750 |
|
Metlife, Inc. |
| † |
| 96,000 |
| 5,002 |
|
Nationwide Financial Services-Class A |
|
|
| 14,000 |
| 614 |
|
Prudential Financial, Inc. |
| † |
| 88,000 |
| 6,875 |
|
Metal Mining (1.0%) |
|
|
|
|
|
|
|
Phelps Dodge Corp. |
|
|
| 54,000 |
| 4,654 |
|
Mortgage Bankers & Brokers (0.9%) |
|
|
|
|
|
|
|
Countrywide Financial Corp. |
| † |
| 110,000 |
| 4,473 |
|
Oil & Gas Extraction (6.7%) |
|
|
|
|
|
|
|
Anadarko Petroleum Corp. |
|
|
| 65,000 |
| 6,813 |
|
Apache Corp. |
|
|
| 76,000 |
| 5,400 |
|
Devon Energy Corp. |
|
|
| 114,000 |
| 6,853 |
|
Kerr-McGee Corp. |
|
|
| 58,000 |
| 5,792 |
|
Occidental Petroleum Corp. |
|
|
| 78,000 |
| 8,014 |
|
Paperboard Containers & Boxes (0.2%) |
|
|
|
|
|
|
|
Sonoco Products Co. |
|
|
| 29,000 |
| 908 |
|
Petroleum Refining (16.6%) |
|
|
|
|
|
|
|
Amerada Hess Corp. |
|
|
| 40,000 |
| 5,731 |
|
Chevron Corp. |
|
|
| 66,000 |
| 4,027 |
|
ConocoPhillips |
|
|
| 197,000 |
| 13,179 |
|
Exxon Mobil Corp. |
|
|
| 552,000 |
| 34,820 |
|
Marathon Oil Corp. |
|
|
| 85,000 |
| 6,746 |
|
Sunoco, Inc. |
|
|
| 63,000 |
| 5,106 |
|
Tesoro Corp. |
|
|
| 59,000 |
| 4,125 |
|
Valero Energy Corp. |
|
|
| 116,000 |
| 7,510 |
|
Pharmaceuticals (7.2%) |
|
|
|
|
|
|
|
AmerisourceBergen Corp. |
|
|
| 106,000 |
| 4,574 |
|
Cardinal Health, Inc. |
|
|
| 67,000 |
| 4,512 |
|
McKesson Corp. |
|
|
| 55,000 |
| 2,672 |
|
Merck & Co., Inc. |
|
|
| 270,000 |
| 9,293 |
|
Pfizer, Inc. |
|
|
| 559,000 |
| 14,159 |
|
Primary Metal Industries (2.5%) |
|
|
|
|
|
|
|
Nucor Corp. |
| † |
| 57,000 |
| 6,203 |
|
United States Steel Corp. |
| † |
| 85,000 |
| 5,823 |
|
Printing & Publishing (0.2%) |
|
|
|
|
|
|
|
American Greetings-Class A |
| † |
| 44,000 |
| 991 |
|
Radio & Television Broadcasting (0.3%) |
|
|
|
|
|
|
|
Univision Communications, Inc.-Class A |
| ‡ |
| 46,000 |
| 1,642 |
|
Radio, Television & Computer Stores (0.5%) |
|
|
|
|
|
|
|
Circuit City Stores, Inc. |
|
|
| 87,000 |
| 2,501 |
|
Railroads (2.0%) |
|
|
|
|
|
|
|
CSX Corp. |
|
|
| 50,000 |
| 3,425 |
|
Norfolk Southern Corp. |
|
|
| 115,000 |
| 6,210 |
|
Residential Building Construction (0.5%) |
|
|
|
|
|
|
|
67
TA IDEX Mercury Large Cap Value
SCHEDULE OF INVESTMENTS
At April 30, 2006
(all amounts except share amounts in thousands)
(unaudited)
Ryland Group, Inc. |
|
|
| 41,000 |
| 2,588 |
|
Retail Trade (0.4%) |
|
|
|
|
|
|
|
Dollar Tree Stores, Inc. |
| ‡ |
| 69,000 |
| 1,799 |
|
Security & Commodity Brokers (7.5%) |
|
|
|
|
|
|
|
Bear Stearns Cos. Inc. (The) |
| † |
| 45,000 |
| 6,413 |
|
E*TRADE Financial Corp. |
| ‡ |
| 137,000 |
| 3,409 |
|
Goldman Sachs Group, Inc. (The) |
|
|
| 57,000 |
| 9,137 |
|
Lehman Brothers Holdings, Inc. |
|
|
| 54,000 |
| 8,162 |
|
Morgan Stanley |
|
|
| 152,000 |
| 9,774 |
|
Telecommunications (1.7%) |
|
|
|
|
|
|
|
Citizens Communications Co. |
|
|
| 243,000 |
| 3,227 |
|
Qwest Communications International |
| †‡ |
| 723,000 |
| 4,851 |
|
Total Common Stocks (cost: $424,638) |
|
|
|
|
| 488,911 |
|
|
|
|
| Principal |
| Value |
|
SECURITY LENDING COLLATERAL (9.1%) |
|
|
|
|
|
|
|
Debt (8.5%) |
|
|
|
|
|
|
|
Bank Notes (1.0%) |
|
|
|
|
|
|
|
Bank of America |
|
|
|
|
|
|
|
4.81%, due 06/07/2006 |
| * |
| 1,464 |
| 1,464 |
|
4.81%, due 08/10/2006 |
| * |
| 1,412 |
| 1,412 |
|
Bear Stearns & Co. |
|
|
|
|
|
|
|
5.01%, due 06/06/2006 |
| * |
| 565 |
| 565 |
|
5.01%, due 09/07/2006 |
| * |
| 1,695 |
| 1,695 |
|
Certificates Of Deposit (0.6%) |
|
|
|
|
|
|
|
Halifax Bank of Scotland |
|
|
|
|
|
|
|
4.78%, due 06/06/2006 |
| * |
| 1,412 |
| 1,412 |
|
Rabobank Nederland |
|
|
|
|
|
|
|
4.87%, due 05/31/2006 |
| * |
| 1,412 |
| 1,412 |
|
Commercial Paper (0.5%) |
|
|
|
|
|
|
|
Banco Santander Central Hispano SA |
|
|
|
|
|
|
|
4.77%, due 05/02/2006 |
|
|
| 848 |
| 848 |
|
Sheffield Receivables Corp.-144A |
|
|
|
|
|
|
|
4.81%, due 05/03/2006 |
|
|
| 1,410 |
| 1,410 |
|
Euro Dollar Overnight (1.5%) |
|
|
|
|
|
|
|
Bank of Montreal |
|
|
|
|
|
|
|
4.77%, due 05/02/2006 |
|
|
| 1,130 |
| 1,130 |
|
Dexia Group |
|
|
|
|
|
|
|
4.78%, due 05/04/2006 |
|
|
| 1,412 |
| 1,412 |
|
Fortis Bank |
|
|
|
|
|
|
|
4.77%, due 05/01/2006 |
|
|
| 565 |
| 565 |
|
Royal Bank of Canada |
|
|
|
|
|
|
|
4.77%, due 05/01/2006 |
|
|
| 1,977 |
| 1,977 |
|
Royal Bank of Scotland |
|
|
|
|
|
|
|
4.75%, due 05/03/2006 |
|
|
| 1,412 |
| 1,412 |
|
Svenska Handlesbanken |
|
|
|
|
|
|
|
4.82%, due 05/01/2006 |
|
|
| 1,079 |
| 1,079 |
|
Euro Dollar Terms (2.4%) |
|
|
|
|
|
|
|
BancoBilbao Vizcaya Argentaria SA |
|
|
|
|
|
|
|
4.95%, due 06/20/2006 |
|
|
| 1,130 |
| 1,130 |
|
Bank of the West |
|
|
|
|
|
|
|
4.94%, due 06/16/2006 |
|
|
| 1,130 |
| 1,130 |
|
Barclays |
|
|
|
|
|
|
|
4.79%, due 05/10/2006 |
|
|
| 1,695 |
| 1,695 |
|
4.77%, due 05/16/2006 |
|
|
| 565 |
| 565 |
|
Canadian Imperial Bank of Commerce |
|
|
|
|
|
|
|
4.97%, due 06/23/2006 |
|
|
| 848 |
| 848 |
|
Credit Suisse First Boston Corp. |
|
|
|
|
|
|
|
4.73%, due 05/08/2006 |
|
|
| 848 |
| 848 |
|
Fortis Bank |
|
|
|
|
|
|
|
4.83%, due 05/08/2006 |
|
|
| 565 |
| 565 |
|
Lloyds TSB Bank |
|
|
|
|
|
|
|
68
TA IDEX Mercury Large Cap Value
SCHEDULE OF INVESTMENTS
At April 30, 2006
(all amounts except share amounts in thousands)
(unaudited)
4.81%, due 05/11/2006 |
|
|
| 847 |
| 847 |
|
Royal Bank of Scotland |
|
|
|
|
|
|
|
4.87%, due 05/12/2006 |
|
|
| 1,130 |
| 1,130 |
|
Societe Generale |
|
|
|
|
|
|
|
4.79%, due 05/10/2006 |
|
|
| 1,412 |
| 1,412 |
|
UBS AG |
|
|
|
|
|
|
|
4.95%, due 06/20/2006 |
|
|
| 1,412 |
| 1,412 |
|
Repurchase Agreements (2.5%) |
| †† |
|
|
|
|
|
Credit Suisse First Boston Corp. 4.92%, dated 04/28/2006 to be repurchased at $1,919 on 05/01/2006 |
|
|
| 1,918 |
| 1,918 |
|
Goldman Sachs Group, Inc. (The) 4.92%, dated 04/28/2006 to be repurchased at $4,151 on 05/01/2006 |
|
|
| 4,150 |
| 4,150 |
|
Lehman Brothers, Inc. 4.92%, dated 04/28/2006 to be repurchased at $70 on 05/01/2006 |
|
|
| 70 |
| 70 |
|
Merrill Lynch & Co. 4.87%, dated 04/28/2006 to be repurchased at $4,239 on 05/01/2006 |
|
|
| 4,237 |
| 4,237 |
|
Morgan Stanley Dean Witter & Co. 4.93%, dated 04/28/2006 to be repurchased at $1,978 on 05/01/2006 |
|
|
| 1,977 |
| 1,977 |
|
|
|
|
| Shares |
| Value |
| |
Investment Companies (0.6%) |
|
|
|
|
|
|
| |
Barclays Global Investors Institutional Money Market Fund |
|
|
|
|
|
|
| |
1-day yield of 4.78% |
|
|
| 2,259,776 |
| 2,260 |
| |
Merrimac Cash Fund, Premium Class |
|
|
|
|
|
|
| |
1-day yield of 4.61% |
| @ |
| 601,249 |
| 601 |
| |
Total Security Lending Collateral (cost: $44,588) |
|
|
|
|
| 44,588 |
| |
Total Investment Securities (cost: $469,226) |
| # |
|
|
| $ | 533,499 |
|
The notes to the financial statements are an integral part of this report.
NOTES TO SCHEDULE OF INVESTMENTS:
† At April 30, 2006, all or a portion of this security is on loan (see Note 1). The value at April 30, 2006, of all securities on loan is $43,288.
‡ Non-income producing.
* Floating or variable rate note. Rate is listed as of April 30, 2006.
†† Cash collateral for the Repurchase Agreements, valued at $12,716, that serve as collateral for securities lending are invested in corporate bonds with interest rates and maturity dates ranging from 0.00% - 9.05% and 05/02/2006 - 12/31/2049, respectively.
@ Regulated investment company advised by Investors Bank and Trust Co. (“IBT”). IBT is also the accounting, custody and lending agent for the Fund.
o Value is less than $1.
# Aggregate cost for Federal income tax purposes is $469,265. Aggregate gross unrealized appreciation for all securities in which there is an excess of value over tax cost and aggregate gross unrealized depreciation for all securities in which there is an excess of tax cost over value were $67,613 and $3,379, respectively. Net unrealized appreciation for tax purposes is $64,234.
69
TA IDEX Mercury Large Cap Value
SCHEDULE OF INVESTMENTS
At April 30, 2006
(all amounts except share amounts in thousands)
(unaudited)
DEFINITIONS:
144A 144A Securities are registered pursuant to Rule 144A of the Securities Act of 1933. These securities are deemed to be liquid for purposes of compliance limitations on holdings of illiquid securities and may be resold as transactions exempt from registration, normally to qualified institutional buyers. At April 30, 2006, these securities aggregated $1,410 or 0.3% of the net assets of the Fund.
70
TA IDEX Neuberger Berman International
UNDERSTANDING YOUR FUND’S EXPENSES
(unaudited)
SHAREHOLDER EXPENSES
Fund shareholders may incur ongoing costs, including management fees, 12b-1 distribution and service fees, and other fund expenses. Shares of the Fund currently are sold only to certain Transamerica IDEX Mutual Funds and AEGON/Transamerica Series Trust (an affiliate of Transamerica IDEX Mutual Funds) asset allocation funds at net asset value, without any transaction costs.
The following Example is intended to help you understand your ongoing costs (in dollars and cents) of investing in the Fund and to compare these costs with the ongoing costs of investing in other funds.
The Example is based on an investment of $1,000 invested at December 6, 2005 and held for the entire period until April 30, 2006.
ACTUAL EXPENSES
The first line in the table below provides information about actual account values and actual expenses. You may use the information in this line, together with the amount you invested, to estimate the expenses that you paid over the period. Simply divide your account value by $1,000 (for example, an $8,600 account value divided by $1,000 = 8.6), then multiply the result by the number in the first line of your Fund under the heading entitled “Expenses Paid During Period” to estimate the expenses you paid on your account during this period.
HYPOTHETICAL EXAMPLE FOR COMPARISON PURPOSES
The second line in the table below provides information about hypothetical account values and hypothetical expenses based on the Fund’s actual expense ratio and an assumed rate of return of 5% per year before expenses, which is not the Fund’s actual return. The hypothetical account values and expenses may not be used to estimate the actual ending account balance or expenses you paid for the period. You may use this information to compare the ongoing costs of investing in your Fund and other funds. To do so, compare this 5% hypothetical example with the 5% hypothetical examples that appear in the shareholder reports of the other funds.
|
| Beginning |
| Ending |
| Annualized |
| Expenses Paid |
| |||
Class I |
|
|
|
|
|
|
|
|
| |||
Actual |
| $ | 1,000.00 |
| $ | 1,210.23 |
| 1.05 | % | $ | 4.61 |
|
Hypothetical(b) |
| 1,000.00 |
| 1,015.69 |
| 1.05 | % | 4.20 |
| |||
(a) Expenses are calculated using the Fund’s annualized expense ratio (as disclosed in the table), multiplied by the average account value for the period, multiplied by number of days in the period (145 days), and divided by the number of days in the year (365 days).
(b) 5% return per year before expenses.
71
TA IDEX Neuberger Berman International
TABULAR PRESENTATION OF SCHEDULE OF INVESTMENTS
By Region
At April 30, 2006
Europe |
| 57.9 | % |
North America |
| 12.2 | % |
Other |
| 1.5 | % |
Pacific Rim |
| 23.3 | % |
South America |
| 5.1 | % |
|
| 100.0 | % |
This chart shows the percentage breakdown by region of the Fund’s total investment securities.
72
TA IDEX Neuberger Berman International
SCHEDULE OF INVESTMENTS
At April 30, 2006
(all amounts except share amounts in thousands)
(unaudited)
|
|
|
| Shares |
| Value |
|
PREFERRED STOCKS (3.4%) |
|
|
|
|
|
|
|
Brazil (1.2%) |
|
|
|
|
|
|
|
Universo Online SA |
| ‡ |
| 736,380 |
| 5,282 |
|
Germany (2.2%) |
|
|
|
|
|
|
|
Porsche AG |
|
|
| 10,180 |
| 10,136 |
|
Total Preferred Stocks (cost: $13,645) |
|
|
|
|
| 15,418 |
|
|
|
|
|
|
|
|
|
COMMON STOCKS (92.3%) |
|
|
|
|
|
|
|
Australia (5.5%) |
|
|
|
|
|
|
|
Hardman Resources, Ltd. |
| ‡ |
| 4,323,320 |
| 7,742 |
|
Paladin Resources, Ltd. |
| ‡ |
| 1,312,280 |
| 4,520 |
|
Timbercorp, Ltd. |
|
|
| 655,790 |
| 1,712 |
|
Woodside Petroleum, Ltd. |
|
|
| 321,290 |
| 11,409 |
|
Belgium (3.5%) |
|
|
|
|
|
|
|
Euronav NV |
|
|
| 167,430 |
| 4,804 |
|
Fortis |
|
|
| 46,760 |
| 1,750 |
|
InBev |
|
|
| 193,440 |
| 9,742 |
|
Bermuda (1.5%) |
|
|
|
|
|
|
|
TPV Technology, Ltd. |
|
|
| 6,505,000 |
| 7,047 |
|
Brazil (3.8%) |
|
|
|
|
|
|
|
Cia Vale do Rio Doce-Class A, ADR |
| † |
| 126,600 |
| 5,631 |
|
Petroleo Brasileiro SA, ADR |
|
|
| 99,700 |
| 9,853 |
|
Ultrapar Participacoes SA, Sponsored ADR |
|
|
| 125,600 |
| 2,207 |
|
Canada (10.2%) |
|
|
|
|
|
|
|
Addax Petroleum Corp. |
| ‡ |
| 42,300 |
| 1,129 |
|
Addax Petroleum Corp., 144A |
| ‡○ |
| 59,700 |
| 1,594 |
|
Canadian Natural Resources, Ltd. |
|
|
| 151,400 |
| 9,080 |
|
Centurion Energy International, Inc. |
| ‡ |
| 378,200 |
| 4,050 |
|
Corus Entertainment, Inc. |
|
|
| 224,300 |
| 7,432 |
|
Great Canadian Gaming Corp. |
| ‡ |
| 464,100 |
| 5,836 |
|
MacDonald Dettwiler & Associates, Ltd. |
| ‡ |
| 109,600 |
| 4,988 |
|
Suncor Energy, Inc. |
|
|
| 77,954 |
| 6,660 |
|
Talisman Energy, Inc. |
|
|
| 116,700 |
| 6,576 |
|
France (5.5%) |
|
|
|
|
|
|
|
BNP Paribas |
|
|
| 85,000 |
| 8,020 |
|
GameLoft |
| ‡ |
| 278,870 |
| 2,104 |
|
IPSOS |
|
|
| 23,241 |
| 3,416 |
|
Publicis Groupe |
|
|
| 49,880 |
| 2,070 |
|
Societe Generale-Class A |
| † |
| 25,040 |
| 3,820 |
|
Total SA, ADR |
|
|
| 42,600 |
| 5,880 |
|
Germany (3.7%) |
|
|
|
|
|
|
|
Continental AG |
|
|
| 45,670 |
| 5,429 |
|
Rhoen Klinikum AG |
|
|
| 43,390 |
| 2,017 |
|
Wacker Chemie AG |
| ‡ |
| 30,290 |
| 3,968 |
|
Wincor Nixdorf AG |
|
|
| 40,160 |
| 5,767 |
|
Gibraltar (1.2%) |
|
|
|
|
|
|
|
888 Holdings PLC |
| ‡ |
| 1,233,260 |
| 5,386 |
|
Greece (0.6%) |
|
|
|
|
|
|
|
Titan Cement Co. SA |
|
|
| 51,650 |
| 2,623 |
|
Ireland (8.7%) |
|
|
|
|
|
|
|
Allied Irish Banks PLC |
|
|
| 192,370 |
| 4,637 |
|
Anglo Irish Bank Corp. PLC |
|
|
| 809,590 |
| 13,329 |
|
C&C Group PLC |
|
|
| 930,227 |
| 7,242 |
|
CRH PLC |
|
|
| 266,500 |
| 9,753 |
|
DCC PLC |
|
|
| 75,690 |
| 1,835 |
|
Dragon Oil PLC |
| ‡ |
| 996,870 |
| 3,524 |
|
Italy (0.5%) |
|
|
|
|
|
|
|
Marazzi Group SpA |
| ‡ |
| 178,650 |
| 2,145 |
|
Japan (14.5%) |
|
|
|
|
|
|
|
Acom Co., Ltd. |
| (a | ) | 74,200 |
| 4,314 |
|
Aica Kogyo Co., Ltd. |
|
|
| 64,800 |
| 936 |
|
Brother Industries, Ltd. |
|
|
| 1,109,000 |
| 12,372 |
|
Chiyoda Corp. |
|
|
| 96,000 |
| 2,152 |
|
73
TA IDEX Neuberger Berman International
SCHEDULE OF INVESTMENTS
At April 30, 2006
(all amounts except share amounts in thousands)
(unaudited)
FCC Co, Ltd. |
|
|
| 231,400 |
| 5,116 |
|
Heiwa Corp. |
|
|
| 347,400 |
| 5,281 |
|
Hisamitsu Pharmaceutical Co., Inc. |
|
|
| 75,300 |
| 2,314 |
|
Mars Engineering Corp. |
|
|
| 238,500 |
| 6,432 |
|
Maruichi Steel Tube, Ltd. |
|
|
| 131,300 |
| 3,225 |
|
Namco Bandai Holdings, Inc. |
|
|
| 30,100 |
| 433 |
|
Nihon Kohden Corp. |
|
|
| 85,300 |
| 1,494 |
|
Nissan Motor Co., Ltd. |
|
|
| 606,600 |
| 7,952 |
|
Nissin Healthcare Food Service Co., Ltd. |
|
|
| 137,400 |
| 2,092 |
|
Plenus Co., Ltd. |
|
|
| 168,300 |
| 6,234 |
|
Takeda Pharmaceutical Co., Ltd. |
|
|
| 37,100 |
| 2,261 |
|
Takuma Co., Ltd. |
|
|
| 147,000 |
| 1,242 |
|
Tenma Corp. |
|
|
| 175,800 |
| 3,356 |
|
Luxembourg (1.2%) |
|
|
|
|
|
|
|
Tenaris SA, ADR |
|
|
| 124,500 |
| 5,715 |
|
Netherlands (0.8%) |
|
|
|
|
|
|
|
Aalberts Industries NV |
|
|
| 46,680 |
| 3,799 |
|
Norway (1.8%) |
|
|
|
|
|
|
|
ProSafe ASA |
|
|
| 140,570 |
| 8,328 |
|
South Korea (2.5%) |
|
|
|
|
|
|
|
Hyundai Mobis |
|
|
| 24,830 |
| 2,193 |
|
KT Corp. |
|
|
| 105,900 |
| 4,761 |
|
SK Telecom Co., Ltd. |
|
|
| 19,440 |
| 4,565 |
|
Spain (1.0%) |
|
|
|
|
|
|
|
Renta Corp. Real Estate SA |
| ‡ |
| 29,990 |
| 1,043 |
|
Telefonica SA, Sponsored ADR |
| † |
| 70,800 |
| 3,398 |
|
Sweden (2.6%) |
|
|
|
|
|
|
|
Intrum Justitia AB |
|
|
| 474,300 |
| 4,463 |
|
Lundin Petroleum AB |
| ‡† |
| 163,900 |
| 2,252 |
|
Nobia AB |
|
|
| 162,300 |
| 5,109 |
|
Switzerland (1.4%) |
|
|
|
|
|
|
|
Advanced Digital Broadcast Holdings SA |
| ‡ |
| 55,560 |
| 6,701 |
|
Taiwan (0.4%) |
|
|
|
|
|
|
|
Hsinchu International Bank |
|
|
| 3,797,000 |
| 1,964 |
|
United Kingdom (21.4%) |
|
|
|
|
|
|
|
Barclays PLC |
|
|
| 621,350 |
| 7,736 |
|
Barratt Developments PLC |
|
|
| 249,370 |
| 4,496 |
|
Burren Energy PLC |
|
|
| 597,360 |
| 10,652 |
|
GlaxoSmithKline PLC |
|
|
| 114,253 |
| 3,231 |
|
Kensington Group PLC |
|
|
| 302,803 |
| 6,230 |
|
MFI Furniture PLC |
|
|
| 2,947,610 |
| 5,894 |
|
NETeller PLC |
| ‡ |
| 389,880 |
| 5,492 |
|
Northern Rock PLC |
|
|
| 355,010 |
| 6,840 |
|
Punch Taverns PLC |
|
|
| 470,730 |
| 7,495 |
|
Redrow PLC |
|
|
| 766,820 |
| 7,408 |
|
RPS Group PLC |
|
|
| 1,436,791 |
| 5,171 |
|
Trinity Mirror PLC |
|
|
| 501,160 |
| 5,001 |
|
Tullow Oil PLC |
|
|
| 997,350 |
| 7,460 |
|
Vodafone Group PLC |
|
|
| 4,337,160 |
| 10,209 |
|
William Hill PLC |
|
|
| 515,860 |
| 5,949 |
|
Total Common Stocks (cost: $362,980) |
|
|
|
|
| 427,488 |
|
|
|
|
| Principal |
| Value |
|
SECURITY LENDING COLLATERAL (2.6%) |
|
|
|
|
|
|
|
Debt (2.4%) |
|
|
|
|
|
|
|
Bank Notes (0.3%) |
|
|
|
|
|
|
|
Bank of America |
|
|
|
|
|
|
|
4.81%, due 06/07/2006 |
| * |
| 399 |
| 399 |
|
4.81%, due 08/10/2006 |
| * |
| 385 |
| 385 |
|
Bear Stearns & Co. |
|
|
|
|
|
|
|
5.01%, due 06/06/2006 |
| * |
| 154 |
| 154 |
|
5.01%, due 09/07/2006 |
| * |
| 462 |
| 462 |
|
Certificates of Deposit (0.2%) |
|
|
|
|
|
|
|
Halifax Bank of Scotland |
|
|
|
|
|
|
|
4.78%, due 06/06/2006 |
| * |
| 385 |
| 385 |
|
74
TA IDEX Neuberger Berman International
SCHEDULE OF INVESTMENTS
At April 30, 2006
(all amounts except share amounts in thousands)
(unaudited)
Rabobank Nederland |
|
|
|
|
|
|
|
4.87%, due 05/31/2006 |
| * |
| 385 |
| 385 |
|
Commercial Paper (0.1%) |
|
|
|
|
|
|
|
Banco Santander Central Hispano SA |
|
|
|
|
|
|
|
4.77%, due 05/02/2006 |
|
|
| 231 |
| 231 |
|
Sheffield Receivables Corp.-144A |
|
|
|
|
|
|
|
4.81%, due 05/03/2006 |
|
|
| 385 |
| 385 |
|
Euro Dollar Overnight (0.4%) |
|
|
|
|
|
|
|
Bank of Montreal |
|
|
|
|
|
|
|
4.77%, due 05/02/2006 |
|
|
| 308 |
| 308 |
|
Dexia Group |
|
|
|
|
|
|
|
4.78%, due 05/04/2006 |
|
|
| 385 |
| 385 |
|
Fortis Bank |
|
|
|
|
|
|
|
4.77%, due 05/01/2006 |
|
|
| 154 |
| 154 |
|
Royal Bank of Canada |
|
|
|
|
|
|
|
4.77%, due 05/01/2006 |
|
|
| 540 |
| 540 |
|
Royal Bank of Scotland |
|
|
|
|
|
|
|
4.75%, due 05/03/2006 |
|
|
| 385 |
| 385 |
|
Svenska Handlesbanken |
|
|
|
|
|
|
|
4.82%, due 05/01/2006 |
|
|
| 294 |
| 294 |
|
Euro Dollar Terms (0.7%) |
|
|
|
|
|
|
|
BancoBilbao Vizcaya Argentaria SA |
|
|
|
|
|
|
|
4.95%, due 06/20/2006 |
|
|
| 308 |
| 308 |
|
Bank of the West |
|
|
|
|
|
|
|
4.94%, due 06/16/2006 |
|
|
| 308 |
| 308 |
|
Barclays |
|
|
|
|
|
|
|
4.79%, due 05/10/2006 |
|
|
| 462 |
| 462 |
|
4.77%, due 05/16/2006 |
|
|
| 154 |
| 154 |
|
Canadian Imperial Bank of Commerce |
|
|
|
|
|
|
|
4.97%, due 06/23/2006 |
|
|
| 231 |
| 231 |
|
Credit Suisse First Boston Corp. |
|
|
|
|
|
|
|
4.73%, due 05/08/2006 |
|
|
| 231 |
| 231 |
|
Fortis Bank |
|
|
|
|
|
|
|
4.83%, due 05/08/2006 |
|
|
| 154 |
| 154 |
|
Lloyds TSB Bank |
|
|
|
|
|
|
|
4.81%, due 05/11/2006 |
|
|
| 231 |
| 231 |
|
Royal Bank of Scotland |
|
|
|
|
|
|
|
4.87%, due 05/12/2006 |
|
|
| 308 |
| 308 |
|
Societe Generale |
|
|
|
|
|
|
|
4.79%, due 05/10/2006 |
|
|
| 385 |
| 385 |
|
UBS AG |
|
|
|
|
|
|
|
4.95%, due 06/20/2006 |
|
|
| 385 |
| 385 |
|
Repurchase Agreements (0.7%) |
| †† |
|
|
|
|
|
Credit Suisse First Boston Corp. 4.92%, dated 04/28/2006 to be repurchased at $523 on 05/01/2006 |
|
|
| 523 |
| 523 |
|
Goldman Sachs Group, Inc. (The) 4.92%, dated 04/28/2006 to be repurchased at $1,132 on 05/01/2006 |
|
|
| 1,132 |
| 1,132 |
|
Lehman Brothers, Inc. 4.92%, dated 04/28/2006 to be repurchased at $19 on 05/01/2006 |
|
|
| 19 |
| 19 |
|
Merrill Lynch & Co. 4.87%, dated 04/28/2006 to be repurchased at $1,156 on 05/01/2006 |
|
|
| 1,156 |
| 1,156 |
|
Morgan Stanley Dean Witter & Co. 4.93%, dated 04/28/2006 to be repurchased at $539 on 05/01/2006 |
|
|
| 540 |
| 540 |
|
75
TA IDEX Neuberger Berman International
SCHEDULE OF INVESTMENTS
At April 30, 2006
(all amounts except share amounts in thousands)
(unaudited)
|
|
|
| Shares |
| Value |
| |
Investment Companies (0.2%) |
|
|
|
|
|
|
| |
Barclays Global Investors Institutional Money Market Fund |
|
|
|
|
|
|
| |
1-day yield of 4.78% |
|
|
| 616,289 |
| 617 |
| |
Merrimac Cash Fund, Premium Class |
|
|
|
|
|
|
| |
1-day yield of 4.61% |
| @ |
| 163,974 |
| 164 |
| |
Total Security Lending Collateral (cost: $12,160) |
|
|
|
|
| 12,160 |
| |
Total Investment Securities (cost: $388,785) |
| # |
|
|
| $ | 455,066 |
|
NOTES TO SCHEDULE OF INVESTMENTS:
‡ Non-income producing.
† At April 30, 2006, all or a portion of this security is on loan (see Note 1). The value at April 30, 2006, of all securities on loan is $11,706.
(a) Passive Foreign Investment Company.
* Floating or variable rate note. Rate is listed as of April 30, 2006.
†† Cash collateral for the Repurchase Agreements, valued at $3,468, that serve as collateral for securities lending are invested in corporate bonds with interest rates and maturity dates ranging from 0.00% - 9.05% and 05/02/2006 - 12/31/2049, respectively.
@ Regulated investment company advised by Investors Bank and Trust Co. (“IBT”). IBT is also the accounting, custody and lending agent for the Fund.
○ Securities valued as determined in good faith in accordance with procedure established by the Fund’s Board of Trustees.
# Aggregate cost for Federal income tax purposes is $388,785. Aggregate gross unrealized appreciation for all securities in which there is an excess of value over tax cost and aggregate gross unrealized depreciation for all securities in which there is an excess of tax cost over value were $68,769 and $2,488, respectively. Net unrealized appreciation for tax purposes is $66,281.
DEFINITIONS:
144A 144A Securities are registered pursuant to Rule 144A of the Securities Act of 1933. These securities are deemed to be liquid for purposes of compliance limitations on holdings of illiquid securities and may be resold as transactions exempt from registration, normally to qualified institutional buyers. At April 30, 2006, these securities aggregated $1,979 or 0.4% of the net assets of the Fund.
ADR American Depositary Receipt
The notes to the financial statements are an integral part of this report.
76
TA IDEX Neuberger Berman International
SCHEDULE OF INVESTMENTS
April 30, 2006
(all amounts except share amounts in thousands)
(unaudited)
|
| Percentage of |
|
|
| |
|
| Net Assets |
| Value |
| |
INVESTMENTS BY INDUSTRY: |
|
|
|
|
| |
Oil & Gas Extraction |
| 20.6 | % | $ | 95,243 |
|
Commercial Banks |
| 8.9 | % | 41,255 |
| |
Telecommunications |
| 5.0 | % | 22,933 |
| |
Automotive |
| 3.9 | % | 18,088 |
| |
Amusement & Recreation Services |
| 3.8 | % | 17,603 |
| |
Beverages |
| 3.7 | % | 16,983 |
| |
Security & Commodity Brokers |
| 3.5 | % | 16,186 |
| |
Restaurants |
| 3.4 | % | 15,821 |
| |
Business Services |
| 3.1 | % | 14,274 |
| |
Computer & Data Processing Services |
| 2.8 | % | 13,153 |
| |
Electronic Components & Accessories |
| 2.7 | % | 12,372 |
| |
Residential Building Construction |
| 2.6 | % | 11,905 |
| |
Manufacturing Industries |
| 2.5 | % | 11,713 |
| |
Furniture & Fixtures |
| 2.4 | % | 11,003 |
| |
Metal Mining |
| 2.2 | % | 10,152 |
| |
Lumber & Other Building Materials |
| 2.1 | % | 9,753 |
| |
Electronic & Other Electric Equipment |
| 2.0 | % | 8,845 |
| |
Pharmaceuticals |
| 1.7 | % | 7,807 |
| |
Radio & Television Broadcasting |
| 1.6 | % | 7,432 |
| |
Motor Vehicles, Parts & Supplies |
| 1.6 | % | 7,309 |
| |
Chemicals & Allied Products |
| 1.5 | % | 7,111 |
| |
Computer & Office Equipment |
| 1.5 | % | 7,047 |
| |
Mortgage Bankers & Brokers |
| 1.5 | % | 6,840 |
| |
Petroleum Refining |
| 1.4 | % | 6,660 |
| |
Rubber & Misc. Plastic Products |
| 1.2 | % | 5,429 |
| |
Electric, Gas & Sanitary Services |
| 1.1 | % | 5,171 |
| |
Printing & Publishing |
| 1.1 | % | 5,001 |
| |
Water Transportation |
| 1.0 | % | 4,804 |
| |
Personal Credit Institutions |
| 0.9 | % | 4,314 |
| |
Holding & Other Investment Offices |
| 0.8 | % | 3,547 |
| |
Engineering & Management Services |
| 0.7 | % | 3,394 |
| |
Fabricated Metal Products |
| 0.7 | % | 3,356 |
| |
Primary Metal Industries |
| 0.7 | % | 3,225 |
| |
Stone, Clay & Glass Products |
| 0.6 | % | 2,623 |
| |
Health Services |
| 0.4 | % | 2,017 |
| |
Medical Instruments & Supplies |
| 0.3 | % | 1,494 |
| |
Real Estate |
| 0.2 | % | 1,043 |
| |
Investment Securities, at value |
| 95.7 | % | 442,906 |
| |
Short-Term Investments |
| 2.6 | % | 12,160 |
| |
Total Investment Securities |
| 98.3 | % | 455,066 |
| |
The notes to the financial statements are an integral part of this report.
77
TA IDEX Oppenheimer Developing Markets
UNDERSTANDING YOUR FUND’S EXPENSES
(unaudited)
SHAREHOLDER EXPENSES
Fund shareholders may incur ongoing costs, including management fees, 12b-1 distribution and service fees, and other fund expenses. Shares of the Fund currently are sold only to certain Transamerica IDEX Mutual Funds and AEGON/Transamerica Series Trust (an affiliate of Transamerica IDEX Mutual Funds) asset allocation funds at net asset value, without any transaction costs.
The following Example is intended to help you understand your ongoing costs (in dollars and cents) of investing in the Fund and to compare these costs with the ongoing costs of investing in other funds.
The Example is based on an investment of $1,000 invested at December 6, 2005 and held for the entire period until April 30, 2006.
ACTUAL EXPENSES
The first line in the table below provides information about actual account values and actual expenses. You may use the information in this line, together with the amount you invested, to estimate the expenses that you paid over the period. Simply divide your account value by $1,000 (for example, an $8,600 account value divided by $1,000 = 8.6), then multiply the result by the number in the first line of your Fund under the heading entitled “Expenses Paid During Period” to estimate the expenses you paid on your account during this period.
HYPOTHETICAL EXAMPLE FOR COMPARISON PURPOSES
The second line in the table below provides information about hypothetical account values and hypothetical expenses based on the Fund’s actual expense ratio and an assumed rate of return of 5% per year before expenses, which is not the Fund’s actual return. The hypothetical account values and expenses may not be used to estimate the actual ending account balance or expenses you paid for the period. You may use this information to compare the ongoing costs of investing in your Fund and other funds. To do so, compare this 5% hypothetical example with the 5% hypothetical examples that appear in the shareholder reports of the other funds.
|
| Beginning |
| Ending |
| Annualized |
| Expenses Paid |
| |||
Class I |
|
|
|
|
|
|
|
|
| |||
Actual |
| $ | 1,000.00 |
| $ | 1,183.60 |
| 1.45 | % | $ | 6.29 |
|
Hypothetical(b) |
| 1,000.00 |
| 1,014.10 |
| 1.45 | % | 5.80 |
| |||
(a) Expenses are calculated using the Fund’s annualized expense ratio (as disclosed in the table), multiplied by the average account value for the period, multiplied by number of days in the period (145 days), and divided by the number of days in the year (365 days).
(b) 5% return per year before expenses.
78
TA IDEX Oppenheimer Developing Markets
TABULAR PRESENTATION OF SCHEDULE OF INVESTMENTS
By Region
At April 30, 2006
Africa |
| 6.4 | % |
Asia |
| 15.0 | % |
Eastern Europe |
| 5.8 | % |
Europe |
| 1.8 | % |
Latin America |
| 8.5 | % |
Other |
| 7.7 | % |
Pacific Rim |
| 40.8 | % |
South America |
| 14.0 | % |
|
| 100.0 | % |
This chart shows the percentage breakdown by region of the Fund’s total investment securities.
79
TA IDEX Oppenheimer Developing Markets
SCHEDULE OF INVESTMENTS
At April 30, 2006
(all amounts except share amounts in thousands)
(unaudited)
|
|
|
| Shares |
| Value |
|
PREFERRED STOCKS (5.8%) |
|
|
|
|
|
|
|
Brazil (5.3%) |
|
|
|
|
|
|
|
All America Latina Logistica SA |
|
|
| 40,000 |
| 2,534 |
|
Banco Bradesco SA |
|
|
| 104,450 |
| 3,956 |
|
Cia de Bebidas das Americas, ADR |
|
|
| 30,900 |
| 1,431 |
|
Cia Energetica de Minas Gerais |
|
|
| 1,894,000 |
| 89 |
|
Eletropaulo Metropolitana de Sao Paulo SA |
| ‡ |
| 42,487,900 |
| 2,114 |
|
Empresa Brasileira de Aeronautica SA |
|
|
| 159,000 |
| 1,549 |
|
Lojas Americanas SA |
|
|
| 64,191,000 |
| 2,655 |
|
Sadia SA |
|
|
| 1,246,000 |
| 3,438 |
|
Suzano Bahia Sul Papel e Celulose SA |
|
|
| 2,000 |
| 14 |
|
Tele Norte Leste Participacoes SA |
|
|
| 28,000 |
| 508 |
|
South Korea (0.5%) |
|
|
|
|
|
|
|
Hyundai Motor Co. |
|
|
| 11,650 |
| 671 |
|
LG Electronics, Inc. |
|
|
| 13,520 |
| 695 |
|
S-Oil Corp. |
|
|
| 7,540 |
| 436 |
|
Total Preferred Stocks (cost: $17,732) |
|
|
|
|
| 20,090 |
|
|
|
|
|
|
|
|
|
COMMON STOCKS (91.6%) |
|
|
|
|
|
|
|
Bermuda (0.9%) |
|
|
|
|
|
|
|
Dairy Farm International Holdings, Ltd. |
|
|
| 9,000 |
| 31 |
|
Guoco Group, Ltd. |
|
|
| 85,000 |
| 1,056 |
|
Midland Holdings, Ltd. |
|
|
| 2,206,000 |
| 1,280 |
|
Varitronix International, Ltd. |
|
|
| 996,000 |
| 784 |
|
Brazil (8.5%) |
|
|
|
|
|
|
|
Banco Nossa Caixa SA |
|
|
| 47,000 |
| 1,056 |
|
|
|
|
|
|
|
|
|
Cia Brasileira de Distribuicao Grupo Pao de Acucar, ADR |
|
|
| 102,900 |
| 4,050 |
|
Cia de Bebidas das Americas, ADR |
|
|
| 10,000 |
| 409 |
|
Cia Vale do Rio Doce-Class A, ADR |
|
|
| 67,600 |
| 3,007 |
|
Cyrela Brazil Realty SA, GDR-144A |
| ठ|
| 15,200 |
| 2,580 |
|
Diagnosticos da America SA |
| ‡ |
| 161,300 |
| 4,088 |
|
Empresa Brasileira de Aeronautica SA |
|
|
| 122,000 |
| 1,185 |
|
Gafisa SA |
| ‡ |
| 75,400 |
| 767 |
|
Light SA |
| ‡ |
| 41,517,000 |
| 322 |
|
Natura Cosmeticos SA |
|
|
| 97,500 |
| 1,236 |
|
Petroleo Brasileiro SA, ADR |
|
|
| 8,900 |
| 791 |
|
Petroleo Brasileiro SA, ADR |
|
|
| 50,500 |
| 4,991 |
|
Rossi Residencial SA |
|
|
| 18,000 |
| 191 |
|
Tele Norte Leste Participacoes SA |
|
|
| 92,000 |
| 3,739 |
|
Vivo Participacoes SA, ADR |
| ‡ |
| 193,000 |
| 797 |
|
Cayman Islands (0.3%) |
|
|
|
|
|
|
|
Hutchison Telecommunications International, Ltd. |
| ‡ |
| 563,000 |
| 991 |
|
China (1.1%) |
|
|
|
|
|
|
|
China Petroleum & Chemical Corp.-Class H |
|
|
| 2,468,000 |
| 1,568 |
|
China Shenhua Energy Co., Ltd.-Class H |
|
|
| 740,000 |
| 1,341 |
|
Sinotrans, Ltd.-Class H |
|
|
| 3,002,000 |
| 1,036 |
|
Egypt (3.0%) |
|
|
|
|
|
|
|
Commercial International Bank, GDR |
|
|
| 92,300 |
| 1,131 |
|
Commercial International Bank, GDR-144A |
| ठ|
| 60,700 |
| 744 |
|
Eastern Tobacco |
|
|
| 13,288 |
| 845 |
|
Medinet Nasr Housing |
|
|
| 49,862 |
| 823 |
|
Orascom Construction Industries |
|
|
| 3,887 |
| 160 |
|
Orascom Telecom Holding SAE |
| ‡ |
| 66,475 |
| 3,507 |
|
Vodafone Egypt Telecommunications SAE |
|
|
| 200,652 |
| 2,999 |
|
Hong Kong (1.8%) |
|
|
|
|
|
|
|
Hang Lung Development Co. |
|
|
| 517,000 |
| 1,230 |
|
Henderson Land Development |
|
|
| 467,000 |
| 2,743 |
|
Link (The) REIT |
| ‡(a) |
| 656,000 |
| 1,447 |
|
Shaw Brothers (Hong Kong) |
|
|
| 80,000 |
| 109 |
|
Television Broadcasts, Ltd. |
|
|
| 128,000 |
| 800 |
|
Hungary (1.4%) |
|
|
|
|
|
|
|
Magyar Telekom Telecommunications PLC |
|
|
| 435,239 |
| 1,987 |
|
80
TA IDEX Oppenheimer Developing Markets
SCHEDULE OF INVESTMENTS
At April 30, 2006
(all amounts except share amounts in thousands)
(unaudited)
OTP Bank Rt |
|
|
| 72,100 |
| 2,792 |
|
India (14.6%) |
|
|
|
|
|
|
|
Amtek Auto, Ltd. |
|
|
| 311,300 |
| 2,385 |
|
Bajaj Auto, Ltd. |
|
|
| 16,900 |
| 1,107 |
|
Bharat Electronics, Ltd. |
|
|
| 21,300 |
| 629 |
|
Bharat Heavy Electricals |
|
|
| 33,823 |
| 1,767 |
|
Bharat Petroleum Corp., Ltd. |
|
|
| 184,300 |
| 1,819 |
|
Bharti Televentures |
| ‡ |
| 253,700 |
| 2,292 |
|
Cipla, Ltd. |
|
|
| 21,550 |
| 122 |
|
GAIL India, Ltd. |
|
|
| 319,230 |
| 2,064 |
|
Gateway Distriparks, Ltd., GDR-144A |
| § |
| 39,400 |
| 213 |
|
HCL Technologies, Ltd. |
|
|
| 212,400 |
| 2,721 |
|
Hindustan Petroleum Corp. |
|
|
| 195,500 |
| 1,402 |
|
Housing Development Finance Corp. |
|
|
| 123,700 |
| 3,576 |
|
ICICI Bank, Ltd., Sponsored ADR |
|
|
| 75,200 |
| 2,063 |
|
Infosys Technologies, Ltd. |
|
|
| 60,500 |
| 4,221 |
|
Infosys Technologies, Ltd., ADR |
|
|
| 23,400 |
| 1,840 |
|
ITC, Ltd. |
|
|
| 395,100 |
| 1,769 |
|
Larsen & Toubro, Ltd. |
|
|
| 60,600 |
| 3,637 |
|
Mahindra & Mahindra, Ltd. |
|
|
| 121,152 |
| 1,685 |
|
NTPC, Ltd. |
|
|
| 173,600 |
| 526 |
|
Oil & Natural Gas Corp., Ltd. |
|
|
| 37,970 |
| 1,094 |
|
Ranbaxy Laboratories, Ltd. |
|
|
| 186,683 |
| 1,963 |
|
Reliance Capital Ventures, Ltd. |
| ‡ |
| 203,500 |
| 117 |
|
Reliance Communication Ventures, Ltd. |
| ‡ |
| 203,500 |
| 1,362 |
|
Reliance Energy Ventures, Ltd. |
| ‡ |
| 203,500 |
| 194 |
|
Reliance Industries, Ltd. |
|
|
| 163,400 |
| 3,666 |
|
Reliance Natural Resources, Ltd. |
| ‡ |
| 197,500 |
| 130 |
|
Rico Auto Industries, Ltd. |
|
|
| 304,000 |
| 610 |
|
Sun Pharmaceuticals Industries, Ltd. |
|
|
| 50,900 |
| 988 |
|
Tata Consultancy Services, Ltd. |
|
|
| 95,409 |
| 4,210 |
|
Trent, Ltd. |
|
|
| 24,276 |
| 449 |
|
Indonesia (5.3%) |
|
|
|
|
|
|
|
Aneka Tambang Tbk PT |
|
|
| 4,833,500 |
| 3,161 |
|
Astra International Tbk PT |
|
|
| 2,161,500 |
| 2,962 |
|
Bank Mandiri Persero Tbk PT |
|
|
| 8,342,500 |
| 1,831 |
|
Gudang Garam Tbk PT |
|
|
| 1,741,500 |
| 2,090 |
|
Indosat Tbk PT |
|
|
| 5,805,000 |
| 3,532 |
|
Telekomunikasi Indonesia Tbk PT |
|
|
| 5,525,500 |
| 4,713 |
|
Israel (3.3%) |
|
|
|
|
|
|
|
Bank Hapoalim, Ltd. |
|
|
| 537,910 |
| 2,709 |
|
Bank Leumi Le-Israel |
|
|
| 857,800 |
| 3,358 |
|
Check Point Software Technologies, Ltd. |
| ‡ |
| 141,900 |
| 2,746 |
|
Elbit Systems, Ltd. |
|
|
| 5,117 |
| 131 |
|
Israel Discount Bank, Ltd.-Class A |
| ‡ |
| 354,500 |
| 735 |
|
Ormat Industries |
|
|
| 19,200 |
| 182 |
|
Teva Pharmaceutical Industries, Ltd., ADR |
|
|
| 40,500 |
| 1,640 |
|
Mexico (7.6%) |
|
|
|
|
|
|
|
America Movil SA de CV-Class L, ADR |
|
|
| 256,700 |
| 9,475 |
|
Cemex SA de CV, Sponsored ADR |
|
|
| 49,000 |
| 3,308 |
|
Consorcio ARA SA de CV |
|
|
| 257,400 |
| 1,360 |
|
Corp Interamericana de Entretenimiento SA-Class B |
| ‡ |
| 389,400 |
| 738 |
|
Corporacion Geo SA de CV- Class B |
| ‡ |
| 649,100 |
| 2,429 |
|
Empresas ICA Sociedad Controladora SA de CV |
| ‡ |
| 715,900 |
| 2,228 |
|
Fomento Economico Mexicano SA de CV, Sponsored ADR |
|
|
| 18,000 |
| 1,672 |
|
Grupo Financiero Banorte SA de CV- Class O |
|
|
| 127,200 |
| 331 |
|
Grupo Financiero Inbursa SA-Class O |
|
|
| 829,800 |
| 1,310 |
|
Impulsora Del Desarrollo Y El Empleo en America Latina SA de CV |
| ‡ |
| 1,292,400 |
| 1,279 |
|
Sare Holding SA de CV-Class B |
| ‡ |
| 1,752,229 |
| 2,047 |
|
Norway (0.5%) |
|
|
|
|
|
|
|
DET Norske Oljeselskap |
|
|
| 178,600 |
| 1,836 |
|
Panama (0.7%) |
|
|
|
|
|
|
|
Banco Latinoamericano de Exportaciones SA |
|
|
| 142,200 |
| 2,395 |
|
81
TA IDEX Oppenheimer Developing Markets
SCHEDULE OF INVESTMENTS
At April 30, 2006
(all amounts except share amounts in thousands)
(unaudited)
Philippine Islands (0.9%) |
|
|
|
|
|
|
|
Jollibee Foods Corp. |
|
|
| 1,367,700 |
| 938 |
|
SM Prime Holdings |
|
|
| 14,786,489 |
| 2,228 |
|
Singapore (0.3%) |
|
|
|
|
|
|
|
Keppel Corp., Ltd. |
|
|
| 1,000 |
| 10 |
|
Singapore Press Holdings, Ltd. |
|
|
| 348,000 |
| 942 |
|
South Africa (6.2%) |
|
|
|
|
|
|
|
Anglo Platinum, Ltd. |
|
|
| 40,400 |
| 3,876 |
|
AngloGold Ashanti, Ltd., ADR |
|
|
| 53,400 |
| 2,920 |
|
Aveng, Ltd. |
|
|
| 54,498 |
| 214 |
|
Harmony Gold Mining Co., Ltd., ADR |
| ‡ |
| 60,100 |
| 1,010 |
|
Impala Platinum Holdings, Ltd. |
|
|
| 14,600 |
| 2,749 |
|
JD Group, Ltd. |
|
|
| 53,500 |
| 821 |
|
Liberty Group, Ltd. |
|
|
| 75,300 |
| 1,032 |
|
Massmart Holdings, Ltd. |
|
|
| 125,500 |
| 1,219 |
|
Murray & Roberts Holdings, Ltd. |
|
|
| 264,470 |
| 1,188 |
|
Standard Bank Group, Ltd. |
|
|
| 238,100 |
| 3,374 |
|
Steinhoff International Holdings, Ltd. |
|
|
| 580,100 |
| 2,283 |
|
Tiger Brands, Ltd. |
|
|
| 29,982 |
| 829 |
|
South Korea (17.4%) |
|
|
|
|
|
|
|
Amorepacific Corp. |
|
|
| 4,260 |
| 1,565 |
|
Celrun Co., Ltd. |
| ‡ |
| 38,350 |
| 354 |
|
Daegu Bank |
|
|
| 54,930 |
| 1,031 |
|
FINETEC Corp. |
|
|
| 74,852 |
| 952 |
|
GS Engineering & Construction Corp. |
|
|
| 10,720 |
| 777 |
|
GS Home Shopping, Inc. |
|
|
| 14,327 |
| 1,376 |
|
Hana Financial Group, Inc. |
|
|
| 50,070 |
| 2,458 |
|
Humax Co., Ltd. |
|
|
| 108,872 |
| 2,736 |
|
Hynix Semiconductor, Inc. |
| ‡ |
| 66,110 |
| 2,309 |
|
Hyundai Development Co. |
|
|
| 18,130 |
| 1,051 |
|
Hyundai Engineering & Construction, Co., Inc. |
| ‡ |
| 44,534 |
| 2,772 |
|
Hyundai Heavy Industries Co., Ltd. |
|
|
| 14,557 |
| 1,395 |
|
Hyundai Mobis |
|
|
| 17,590 |
| 1,553 |
|
Hyundai Motor Co. |
|
|
| 60,694 |
| 5,335 |
|
Jeonbuk Bank |
|
|
| 88,181 |
| 875 |
|
Joongang Construction |
|
|
| 10,360 |
| 255 |
|
Kia Motors Corp. |
|
|
| 231,770 |
| 4,767 |
|
Kolon Engineering & Construction Co., Ltd. |
|
|
| 5,979 |
| 100 |
|
Kookmin Bank, ADR |
|
|
| 21,300 |
| 1,897 |
|
Korea Investment Holdings Co., Ltd. |
|
|
| 24,960 |
| 1,069 |
|
KT&G Corp. |
|
|
| 640 |
| 36 |
|
Kyeryong Construction Industrial Co., Ltd. |
|
|
| 19,920 |
| 938 |
|
LG Corp. |
|
|
| 23,232 |
| 809 |
|
LG Electronics, Inc. |
|
|
| 19,920 |
| 1,649 |
|
Mirae Asset Securities Co., Ltd. |
| ‡ |
| 17,401 |
| 1,118 |
|
Mobilians Co., Ltd. |
| ‡ |
| 13,090 |
| 149 |
|
Mobilians Co., Ltd. Rights, Expires 05/24/2006 |
|
|
| 1,978 |
| 5 |
|
MtekVision Co., Ltd. |
|
|
| 28,826 |
| 960 |
|
NHN Corp. |
| ‡ |
| 2,353 |
| 836 |
|
Samsung Electronics Co., Ltd. |
|
|
| 7,274 |
| 4,967 |
|
Shinhan Financial Group Co., Ltd. |
|
|
| 21,320 |
| 1,062 |
|
SK Telecom Co., Ltd. |
|
|
| 1,766 |
| 415 |
|
SK Telecom Co., Ltd., ADR |
|
|
| 131,700 |
| 3,516 |
|
S-Oil Corp. |
|
|
| 27,550 |
| 2,132 |
|
Ssangyong Motor Co. |
| ‡ |
| 402,904 |
| 2,713 |
|
Telechips, Inc. |
|
|
| 22,707 |
| 539 |
|
Woori Finance Holdings Co., Ltd. |
|
|
| 122,860 |
| 2,775 |
|
Yedang Entertainment Co., Ltd. |
| ‡ |
| 82,850 |
| 747 |
|
Taiwan (11.1%) |
|
|
|
|
|
|
|
AU Optronics Corp. |
|
|
| 822,000 |
| 1,347 |
|
Cathay Financial Holding Co., Ltd. |
|
|
| 1,020,000 |
| 2,286 |
|
China Motor Corp. |
|
|
| 662,000 |
| 705 |
|
Continental Engineering Corp. |
|
|
| 836,000 |
| 406 |
|
Far Eastern Textile Co., Ltd. |
|
|
| 522,000 |
| 479 |
|
Far EasTone Telecommunications Co., Ltd. |
|
|
| 581,000 |
| 723 |
|
82
TA IDEX Oppenheimer Developing Markets
SCHEDULE OF INVESTMENTS
At April 30, 2006
(all amounts except share amounts in thousands)
(unaudited)
Fubon Financial Holding Co., Ltd. |
|
|
| 2,868,000 |
| 2,778 |
| |
Fubon Financial Holding Co., Ltd., Sponsored GDR |
|
|
| 57,200 |
| 554 |
| |
High Tech Computer Corp. |
|
|
| 55,000 |
| 1,758 |
| |
Hon Hai Precision Industry Co., Ltd. |
|
|
| 462,000 |
| 3,135 |
| |
Inventec Appliances Corp. |
|
|
| 474,000 |
| 2,243 |
| |
Inventec Co., Ltd. |
|
|
| 2,129,000 |
| 1,535 |
| |
Lite-On Technology Corp. |
|
|
| 1,958,000 |
| 3,087 |
| |
Merry Electronics Co., Ltd. |
|
|
| 307,000 |
| 1,082 |
| |
Mitac International |
|
|
| 917,000 |
| 1,063 |
| |
Motech Industries, Inc. |
|
|
| 46,000 |
| 1,276 |
| |
Powerchip Semiconductor Corp. |
|
|
| 1,855,000 |
| 1,279 |
| |
President Chain Store Corp. |
|
|
| 417,000 |
| 1,043 |
| |
Quanta Computer, Inc. |
|
|
| 1,821,000 |
| 3,196 |
| |
Shin Kong Financial Holding Co., Ltd. |
|
|
| 247,000 |
| 263 |
| |
Sunplus Technology Co., Ltd. |
|
|
| 1,723,000 |
| 2,122 |
| |
Synnex Technology International Corp. |
|
|
| 936,000 |
| 1,157 |
| |
Taiwan Fertilizer Co., Ltd. |
|
|
| 84,000 |
| 155 |
| |
Uni-President Enterprises Corp. |
|
|
| 545,700 |
| 411 |
| |
United Microelectronics Corp. |
|
|
| 5,922,000 |
| 4,120 |
| |
Thailand (1.3%) |
|
|
|
|
|
|
| |
Advanced Info Service PCL |
|
|
| 508,100 |
| 1,204 |
| |
Kiatnakin Bank PCL |
|
|
| 801,900 |
| 736 |
| |
Tisco Bank PCL |
| ‡ |
| 972,600 |
| 744 |
| |
TMB Bank PCL |
| ‡ |
| 16,469,500 |
| 1,841 |
| |
TMB Bank PCL Rights, Expires 5/19/2006 |
| § |
| 3,572,989 |
| — | % | |
Turkey (4.2%) |
|
|
|
|
|
|
| |
Aksigorta AS |
|
|
| 423,000 |
| 2,129 |
| |
Anadolu Sigorta |
| ‡ |
| 41,300 |
| 139 |
| |
Ford Otomotiv Sanayi AS |
|
|
| 73,198 |
| 731 |
| |
Haci Omer Sabanci Holding |
|
|
| 615,900 |
| 2,914 |
| |
Haci Omer Sabanci Holding AS, ADR |
|
|
| 661,050 |
| 782 |
| |
KOC Holding AS |
|
|
| 511,050 |
| 2,805 |
| |
Petkim Petrokimya Holding |
| ‡ |
| 123,474 |
| 575 |
| |
Tupras-Turkiye Petrol Rafine |
|
|
| 82,800 |
| 1,755 |
| |
Turkiye Is Bankasi |
|
|
| 5,300 |
| 45 |
| |
Turkiye Vakiflar Bankasi Tao |
| ‡ |
| 433,438 |
| 2,740 |
| |
United Kingdom (1.2%) |
|
|
|
|
|
|
| |
Highland Gold Mining, Ltd. |
| ‡ |
| 249,214 |
| 1,291 |
| |
Old Mutual PLC |
|
|
| 596,610 |
| 2,085 |
| |
Standard Chartered PLC |
|
|
| 26,170 |
| 693 |
| |
Total Common Stocks (cost: $280,333) |
|
|
|
|
| 316,470 |
| |
Total Investment Securities (cost: $298,065) |
| # |
|
|
| $ | 336,560 |
|
NOTES TO SCHEDULE OF INVESTMENTS:
(‡) Non-income producing.
(§) Security is deemed to be illiquid.
(a) Passive Foreign Investment Company.
% Value is less than $1.
# Aggregate cost for Federal income tax purposes is $298,416. Aggregate gross unrealized appreciation for all securities in which there is an excess of value over tax cost and aggregate gross unrealized depreciation for all securities in which there is an excess of tax cost over value were $44,147 and $6,003, respectively. Net unrealized appreciation for tax purposes is $38,144.
83
TA IDEX Oppenheimer Developing Markets
SCHEDULE OF INVESTMENTS
At April 30, 2006
(all amounts except share amounts in thousands)
(unaudited)
DEFINITIONS:
144A 144A Securities are registered pursuant to Rule 144A of the Securities Act of 1933. These securities are deemed to be liquid for purposes of compliance limitations on holdings of illiquid securities and may be resold as transactions exempt from registration, normally to qualified institutional buyers. At April 30, 2006, these securities aggregated $3,537 or 1.0% of the net assets of the Fund.
ADR American Depositary Receipt
GDR Global Depositary Receipt
REIT Real Estate Investment Trust
The notes to the financial statements are an integral part of this report.
84
TA IDEX Oppenheimer Developing Markets
SCHEDULE OF INVESTMENTS
April 30, 2006
(all amounts except share amounts in thousands)
(unaudited)
|
| Percentage of Net Assets |
| Value |
| |
INVESTMENTS BY INDUSTRY: |
|
|
|
|
| |
Commercial Banks |
| 14.0 | % | $ | 48,440 |
|
Telecommunications |
| 12.1 | % | 41,762 |
| |
Computer & Data Processing Services |
| 5.6 | % | 19,316 |
| |
Electronic Components & Accessories |
| 5.4 | % | 18,663 |
| |
Metal Mining |
| 5.2 | % | 18,013 |
| |
Automotive |
| 5.1 | % | 17,713 |
| |
Holding & Other Investment Offices |
| 4.5 | % | 15,661 |
| |
Real Estate |
| 3.5 | % | 12,190 |
| |
Oil & Gas Extraction |
| 3.0 | % | 10,280 |
| |
Petroleum Refining |
| 2.2 | % | 7,674 |
| |
Chemicals & Allied Products |
| 2.1 | % | 7,197 |
| |
Electronic & Other Electric Equipment |
| 1.9 | % | 6,734 |
| |
Construction |
| 1.8 | % | 6,343 |
| |
Computer & Office Equipment |
| 1.8 | % | 6,222 |
| |
Communications Equipment |
| 1.8 | % | 6,062 |
| |
Security & Commodity Brokers |
| 1.7 | % | 6,004 |
| |
Pharmaceuticals |
| 1.6 | % | 5,522 |
| |
Food Stores |
| 1.5 | % | 5,124 |
| |
Tobacco Products |
| 1.4 | % | 4,740 |
| |
Food & Kindred Products |
| 1.4 | % | 4,679 |
| |
Management Services |
| 1.2 | % | 4,210 |
| |
Residential Building Construction |
| 1.2 | % | 4,112 |
| |
Health Services |
| 1.2 | % | 4,088 |
| |
Beverages |
| 1.0 | % | 3,512 |
| |
Life Insurance |
| 1.0 | % | 3,380 |
| |
Stone, Clay & Glass Products |
| 1.0 | % | 3,309 |
| |
Electric Services |
| 0.9 | % | 3,244 |
| |
Automotive Dealers & Service Stations |
| 0.9 | % | 2,962 |
| |
Aerospace |
| 0.8 | % | 2,865 |
| |
Engineering & Management Services |
| 0.8 | % | 2,694 |
| |
Department Stores |
| 0.8 | % | 2,655 |
| |
Retail Trade |
| 0.8 | % | 2,595 |
| |
Industrial Machinery & Equipment |
| 0.7 | % | 2,567 |
| |
Railroads |
| 0.7 | % | 2,534 |
| |
Specialty- Real Estate |
| 0.7 | % | 2,429 |
| |
Furniture & Fixtures |
| 0.7 | % | 2,283 |
| |
Insurance |
| 0.7 | % | 2,268 |
| |
Motor Vehicles, Parts & Supplies |
| 0.6 | % | 2,163 |
| |
Gas Production & Distribution |
| 0.6 | % | 2,064 |
| |
Business Services |
| 0.6 | % | 1,912 |
| |
Amusement & Recreation Services |
| 0.4 | % | 1,484 |
| |
Transportation Equipment |
| 0.4 | % | 1,395 |
| |
Mining |
| 0.4 | % | 1,341 |
| |
Transportation & Public Utilities |
| 0.4 | % | 1,249 |
| |
Printing & Publishing |
| 0.3 | % | 942 |
| |
Restaurants |
| 0.3 | % | 938 |
| |
Textile Mill Products |
| 0.2 | % | 833 |
| |
Furniture & Home Furnishings Stores |
| 0.2 | % | 821 |
| |
Radio & Television Broadcasting |
| 0.2 | % | 800 |
| |
Apparel & Accessory Stores |
| 0.1 | % | 449 |
| |
Motion Pictures |
| 0.0 | % | 109 |
| |
Paper & Allied Products |
| 0.0 | % | 14 |
| |
Investment Securities, at value |
| 97.4 | % | 336,560 |
| |
Total Investment Securities |
| 97.4 | % | 336,560 |
| |
The notes to the financial statements are an integral part of this report.
85
TA IDEX Transamerica Short-Term Bond
UNDERSTANDING YOUR FUND’S EXPENSES
(unaudited)
SHAREHOLDER EXPENSES
Fund shareholders may incur ongoing costs, including management fees, 12b-1 distribution and service fees, and other fund expenses. Shares of the Fund currently are sold only to certain Transamerica IDEX Mutual Funds and AEGON/Transamerica Series Trust (an affiliate of Transamerica IDEX Mutual Funds) asset allocation funds at net asset value, without any transaction costs.
The following Example is intended to help you understand your ongoing costs (in dollars and cents) of investing in the Fund and to compare these costs with the ongoing costs of investing in other funds.
ACTUAL EXPENSES
The first line in the table below provides information about actual account values and actual expenses. You may use the information in this line, together with the amount you invested, to estimate the expenses that you paid over the period. Simply divide your account value by $1,000 (for example, an $8,600 account value divided by $1,000 = 8.6), then multiply the result by the number in the first line of your Fund under the heading entitled “Expenses Paid During Period” to estimate the expenses you paid on your account during this period.
HYPOTHETICAL EXAMPLE FOR COMPARISON PURPOSES
The second line in the table below provides information about hypothetical account values and hypothetical expenses based on the Fund’s actual expense ratio and an assumed rate of return of 5% per year before expenses, which is not the Fund’s actual return. The hypothetical account values and expenses may not be used to estimate the actual ending account balance or expenses you paid for the period. You may use this information to compare the ongoing costs of investing in your Fund and other funds. To do so, compare this 5% hypothetical example with the 5% hypothetical examples that appear in the shareholder reports of the other funds.
|
| Beginning |
| Ending Account |
| Annualized |
| Expenses Paid |
| |||
Class I |
|
|
|
|
|
|
|
|
| |||
Actual |
| $ | 1,000.00 |
| $ | 1,015.50 |
| 0.69 | % | $ | 3.45 |
|
Hypothetical(b) |
| 1,000.00 |
| 1,021.37 |
| 0.69 | % | 3.46 |
| |||
(a) Expenses are calculated using the Fund’s annualized expense ratio (as disclosed in the table), multiplied by the average account value for the period, multiplied by number of days in the period (181 days), and divided by the number of days in the year (365 days).
(b) 5% return per year before expenses.
86
TA IDEX Transamerica Short-Term Bond
TABULAR PRESENTATION OF SCHEDULE OF INVESTMENTS
By Bond Credit Quality (Moody Ratings)
At April 30, 2006
A1 |
| 2.0 | % |
A2 |
| 16.4 | % |
A3 |
| 16.0 | % |
Aa3 |
| 3.7 | % |
Aaa |
| 3.2 | % |
B3 |
| 0.5 | % |
Ba1 |
| 3.1 | % |
Ba2 |
| 1.6 | % |
Ba3 |
| 1.0 | % |
Baa1 |
| 6.7 | % |
Baa2 |
| 25.6 | % |
Baa3 |
| 20.1 | % |
Not Rated |
| 0.1 | % |
|
| 100.0 | % |
This chart shows the percentage breakdown by Bond Credit
Quality of the Fund’s total investment securities.
Credit Rating Description
A1 Upper medium grade obligations. Interest payments and principal are considered adequate, but elements may be present which suggest a susceptibility to impairment some time in the future.
A2 Upper medium grade obligations. Interest payments and principal are considered adequate, but elements may be present which suggest a susceptibility to impairment some time in the future.
A3 Upper medium grade obligations. Interest payments and principal are considered adequate, but elements may be present which suggest a susceptibility to impairment some time in the future.
Aa3 High grade obligations. Strong capacity to pay interest and repay principal.
Aaa Prime grade obligations. Exceptional financial security and ability to meet senior financial obligations.
B3 Assurance of interest and principal payments or of maintenance of other terms of the contract over any long period of time may be small.
Ba1 Moderate vulnerability in the near-term but faces major ongoing uncertainties in the event of adverse business, financial and economic conditions.
Ba2 Vulnerable in the near-term but faces major ongoing uncertainties in the event of adverse business, financial and economic conditions.
Ba3 More vulnerable in the near-term but faces major ongoing uncertainties in the event of adverse business, financial and economic conditions.
Baa1 Medium grade obligations. Interest payments and principal security are adequate for the present but certain protective elements may be lacking or may be characteristically unreliable over great length of time.
Baa2 Medium grade obligations. Interest payments and principal security appear adequate for the present but certain protective elements may be lacking or may be characteristically unreliable over great length of time.
Baa3 Medium grade obligations. Interest payments and principal security are not as adequate for the present but certain protective elements may be lacking or may be characteristically unreliable over great length of time.
87
TA IDEX Transamerica Short-Term Bond
SCHEDULE OF INVESTMENTS
At April 30, 2006
(all amounts except share amounts in thousands)
(unaudited)
|
|
|
| Principal |
| Value |
| ||
ASSET-BACKED SECURITIES (1.9%) |
|
|
|
|
|
|
| ||
Honda Auto Receivables Owner Trust, Series 2005-A Class A3 |
|
|
| $ | 3,545 |
| $ | 3,507 |
|
USAA Auto Owner Trust, Series 2005-3, Class A2 |
|
|
| 2,000 |
| 1,992 |
| ||
Total Asset-Backed Securities (cost: $5,544) |
|
|
|
|
| 5,499 |
| ||
|
|
|
|
|
|
|
| ||
CORPORATE DEBT SECURITIES (96.6%) |
|
|
|
|
|
|
| ||
Aerospace (1.8%) |
|
|
|
|
|
|
| ||
Textron Financial Corp. |
|
|
| 5,200 |
| 5,230 |
| ||
Agriculture (0.5%) |
|
|
|
|
|
|
| ||
Dole Food Co., Inc. |
|
|
| 1,400 |
| 1,383 |
| ||
Amusement & Recreation Services (1.0%) |
|
|
|
|
|
|
| ||
Caesars Entertainment, Inc. |
|
|
| 1,400 |
| 1,484 |
| ||
Mirage Resorts, Inc. |
|
|
| 1,500 |
| 1,511 |
| ||
Automotive (2.0%) |
|
|
|
|
|
|
| ||
DaimlerChrysler North America Holding Corp. |
|
|
| 5,950 |
| 5,872 |
| ||
Beverages (3.0%) |
|
|
|
|
|
|
| ||
Bottling Group LLC |
|
|
| 3,965 |
| 3,913 |
| ||
Coca-Cola Enterprises, Inc. |
|
|
| 5,000 |
| 5,001 |
| ||
Business Credit Institutions (2.8%) |
|
|
|
|
|
|
| ||
CIT Group, Inc. |
|
|
| 2,600 |
| 2,576 |
| ||
Pemex Finance, Ltd. |
|
|
| 5,400 |
| 5,827 |
| ||
Chemicals & Allied Products (8.3%) |
|
|
|
|
|
|
| ||
Cytec Industries, Inc. |
|
|
| 1,440 |
| 1,407 |
| ||
Dow Chemical Co. (The) |
|
|
| 4,870 |
| 4,843 |
| ||
ICI Wilmington, Inc. |
|
|
| 6,202 |
| 5,972 |
| ||
IMC Global, Inc. |
|
|
| 1,400 |
| 1,512 |
| ||
Lubrizol Corp. |
|
|
| 800 |
| 775 |
| ||
Potash Corp. of Saskatchewan |
|
|
| 5,000 |
| 5,086 |
| ||
Praxair, Inc. |
|
|
| 5,000 |
| 4,968 |
| ||
Commercial Banks (3.2%) |
|
|
|
|
|
|
| ||
Popular North America, Inc. |
|
|
| 5,000 |
| 4,968 |
| ||
Wachovia Capital Trust III |
| (a) (b) |
| 4,522 |
| 4,433 |
| ||
Communication (4.1%) |
|
|
|
|
|
|
| ||
British Sky Broadcasting PLC |
|
|
| 6,000 |
| 6,440 |
| ||
Comcast Cable Communications |
|
|
| 5,500 |
| 5,699 |
| ||
Department Stores (1.8%) |
|
|
|
|
|
|
| ||
Meyer (Fred) Stores, Inc. |
|
|
| 5,100 |
| 5,261 |
| ||
88
TA IDEX Transamerica Short-Term Bond
SCHEDULE OF INVESTMENTS
At April 30, 2006
(all amounts except share amounts in thousands)
(unaudited)
|
|
|
| Principal |
| Value |
|
Electric Services (10.6%) |
|
|
|
|
|
|
|
Dominion Resources, Inc |
|
|
| 6,150 |
| 6,163 |
|
Duke Capital LLC |
|
|
| 6,000 |
| 5,970 |
|
FPL Group Capital, Inc. |
|
|
| 7,040 |
| 6,970 |
|
PSEG Funding Trust |
|
|
| 6,240 |
| 6,217 |
|
TXU Electric Delivery Co. |
|
|
| 6,000 |
| 5,959 |
|
Electric, Gas & Sanitary Services (1.0%) |
|
|
|
|
|
|
|
NiSource Finance Corp. |
|
|
| 2,700 |
| 2,917 |
|
Food & Kindred Products (2.0%) |
|
|
|
|
|
|
|
Tyson Foods, Inc. |
|
|
| 6,000 |
| 6,040 |
|
Gas Production & Distribution (4.1%) |
|
|
|
|
|
|
|
Kinder Morgan Finance Co. ULC |
|
|
| 5,815 |
| 5,713 |
|
Oneok, Inc. |
|
|
| 6,300 |
| 6,293 |
|
Holding & Other Investment Offices (4.0%) |
|
|
|
|
|
|
|
Berkshire Hathaway Finance Corp. |
|
|
| 4,000 |
| 3,909 |
|
Host Marriott, LP REIT |
|
|
| 1,500 |
| 1,560 |
|
iStar Financial, Inc. |
|
|
| 4,500 |
| 4,405 |
|
Rouse Co. (The) |
|
|
| 2,000 |
| 1,865 |
|
Hotels & Other Lodging Places (0.6%) |
|
|
|
|
|
|
|
Starwood Hotels & Resorts Worldwide, Inc. |
|
|
| 1,600 |
| 1,628 |
|
Industrial Machinery & Equipment (0.5%) |
|
|
|
|
|
|
|
John Deere Capital Corp. |
|
|
| 1,597 |
| 1,560 |
|
Insurance (2.8%) |
|
|
|
|
|
|
|
International Lease Finance Corp. |
| † |
| 5,790 |
| 5,805 |
|
Wellpoint Health Networks, Inc. |
|
|
| 2,500 |
| 2,503 |
|
Metal Mining (2.1%) |
|
|
|
|
|
|
|
Barrick Gold Finance, Inc. |
|
|
| 6,000 |
| 6,120 |
|
Mortgage Bankers & Brokers (3.9%) |
|
|
|
|
|
|
|
Countrywide Home Loans, Inc. |
|
|
| 5,500 |
| 5,505 |
|
Rio Tinto Finance USA, Ltd. |
|
|
| 5,961 |
| 5,970 |
|
Oil & Gas Extraction (2.0%) |
|
|
|
|
|
|
|
Devon Energy Corp. |
|
|
| 5,000 |
| 4,966 |
|
Husky Oil, Ltd. |
| (b) |
| 1,000 |
| 1,057 |
|
Personal Credit Institutions (0.5%) |
|
|
|
|
|
|
|
Ford Motor Credit Co. |
| * |
| 1,580 |
| 1,582 |
|
Petroleum Refining (4.4%) |
|
|
|
|
|
|
|
Enterprise Products Operating, LP, Series B |
|
|
| 8,500 |
| 8,306 |
|
Premcor Refining Group (The), Inc. |
|
|
| 4,500 |
| 4,677 |
|
89
TA IDEX Transamerica Short-Term Bond
SCHEDULE OF INVESTMENTS
At April 30, 2006
(all amounts except share amounts in thousands)
(unaudited)
|
|
|
| Principal |
| Value |
|
Primary Metal Industries (2.1%) |
|
|
|
|
|
|
|
Alcoa, Inc. |
|
|
| 6,200 |
| 6,105 |
|
Printing & Publishing (5.8%) |
|
|
|
|
|
|
|
Gannett Co., Inc. |
|
|
| 6,000 |
| 5,984 |
|
Media General, Inc. |
|
|
| 6,012 |
| 6,026 |
|
Viacom, Inc. |
|
|
| 5,000 |
| 4,994 |
|
Radio & Television Broadcasting (1.7%) |
|
|
|
|
|
|
|
Chancellor Media Corp. |
|
|
| 2,000 |
| 2,104 |
|
Univision Communications, Inc. |
|
|
| 3,000 |
| 2,964 |
|
Real Estate (5.0%) |
|
|
|
|
|
|
|
Colonial Realty, LP |
|
|
| 5,400 |
| 5,468 |
|
Tanger Properties LP |
|
|
| 3,229 |
| 3,401 |
|
Westfield Capital Corp., Ltd./WT Finance Aust Pty, Ltd./WEA Finance LLC-144A |
|
|
| 6,300 |
| 5,975 |
|
Retail Trade (1.8%) |
|
|
|
|
|
|
|
Target Corp. |
|
|
| 5,160 |
| 5,169 |
|
Security & Commodity Brokers (1.6%) |
|
|
|
|
|
|
|
Morgan Stanley |
|
|
| 5,000 |
| 4,846 |
|
Telecommunications (7.8%) |
|
|
|
|
|
|
|
Alltel Corp. |
|
|
| 5,400 |
| 5,363 |
|
Nextel Partners, Inc. |
|
|
| 1,290 |
| 1,351 |
|
Sprint Capital Corp. |
|
|
| 6,500 |
| 6,489 |
|
Telecom Italia Capital SA, Series A |
|
|
| 6,010 |
| 5,795 |
|
Verizon Global Funding Corp. |
|
|
| 4,000 |
| 4,031 |
|
Water Transportation (2.9%) |
|
|
|
|
|
|
|
Carnival PLC |
|
|
| 5,612 |
| 5,711 |
|
Royal Caribbean Cruises, Ltd. |
|
|
| 2,891 |
| 2,939 |
|
Wholesale Trade Nondurable Goods (0.9%) |
|
|
|
|
|
|
|
Safeway, Inc. |
|
|
| 2,610 |
| 2,514 |
|
Total Corporate Debt Securities (cost: $288,166) |
|
|
|
|
| 285,050 |
|
|
|
|
|
|
|
|
|
SECURITY LENDING COLLATERAL (0.0%) |
|
|
|
|
|
|
|
Debt (0.0%) |
|
|
|
|
|
|
|
Bank Notes (0.0%) |
|
|
|
|
|
|
|
Bank of America |
|
|
|
|
|
|
|
4.81%, due 06/07/2006 |
| * |
| 5 |
| 5 |
|
4.81%, due 08/10/2006 |
| * |
| 5 |
| 5 |
|
|
|
|
|
|
|
|
|
Bear Stearns & Co. |
|
|
|
|
|
|
|
5.01%, due 06/06/2006 |
| * |
| 2 |
| 2 |
|
5.01%, due 09/07/2006 |
| * |
| 6 |
| 6 |
|
Certificates Of Deposit (0.0%) |
|
|
|
|
|
|
|
Halifax Bank of Scotland |
|
|
|
|
|
|
|
90
TA IDEX Transamerica Short-Term Bond
SCHEDULE OF INVESTMENTS
At April 30, 2006
(all amounts except share amounts in thousands)
(unaudited)
|
|
|
| Principal |
| Value |
|
4.78%, due 06/06/2006 |
| * |
| 5 |
| 5 |
|
Rabobank Nederland |
|
|
|
|
|
|
|
4.87%, due 05/31/2006 |
| * |
| 5 |
| 5 |
|
Commercial Paper (0.0%) |
|
|
|
|
|
|
|
Banco Santander Central Hispano SA |
|
|
| 3 |
| 3 |
|
Sheffield Receivables Corp.-144A |
|
|
| 5 |
| 5 |
|
Euro Dollar Overnight (0.0%) |
|
|
|
|
|
|
|
Bank of Montreal |
|
|
| 4 |
| 4 |
|
Dexia Group |
|
|
| 5 |
| 5 |
|
Fortis Bank |
|
|
| 2 |
| 2 |
|
Royal Bank of Canada |
|
|
| 7 |
| 7 |
|
Royal Bank of Scotland |
|
|
| 5 |
| 5 |
|
Svenska Handlesbanken |
|
|
| 4 |
| 4 |
|
Euro Dollar Terms (0.0%) |
|
|
|
|
|
|
|
BancoBilbao Vizcaya Argentaria SA |
|
|
| 4 |
| 4 |
|
Bank of the West |
|
|
| 4 |
| 4 |
|
Barclays |
|
|
| 6 |
| 6 |
|
4.77%, due 05/16/2006 |
|
|
| 2 |
| 2 |
|
Canadian Imperial Bank of Commerce |
|
|
| 3 |
| 3 |
|
Credit Suisse First Boston Corp. |
|
|
| 3 |
| 3 |
|
Fortis Bank |
|
|
| 2 |
| 2 |
|
Lloyds TSB Bank |
|
|
| 3 |
| 3 |
|
Royal Bank of Scotland |
|
|
| 4 |
| 4 |
|
Societe Generale |
|
|
| 5 |
| 5 |
|
UBS AG |
|
|
| 5 |
| 5 |
|
Repurchase Agreements (0.0%) |
| †† |
|
|
|
|
|
Credit Suisse First Boston Corp. 4.92%, dated 04/28/2006 |
|
|
| 7 |
| 7 |
|
Goldman Sachs Group, Inc. (The) 4.92%, dated 04/28/2006 |
|
|
| 15 |
| 15 |
|
Lehman Brothers, Inc. 4.92%, dated 04/28/2006 |
|
|
| — | o | — | o |
Merrill Lynch & Co. 4.87%, dated 04/28/2006 |
|
|
| 15 |
| 15 |
|
Morgan Stanley Dean Witter & Co. 4.93%, dated 04/28/2006 |
|
|
| 7 |
| 7 |
|
91
TA IDEX Transamerica Short-Term Bond
SCHEDULE OF INVESTMENTS
At April 30, 2006
(all amounts except share amounts in thousands)
(unaudited)
|
|
|
| Shares |
| Value |
| |
Investment Companies (0.0%) |
|
|
|
|
|
|
| |
Barclays Global Investors Institutional Money Market Fund 1-day yield of 4.78% |
|
|
| 7,982 |
| 8 |
| |
Merrimac Cash Fund, Premium Class 1-day yield of 4.61% |
| @ |
| 2,124 |
| 2 |
| |
Total Security Lending Collateral (cost: $158) |
|
|
|
|
| 158 |
| |
|
|
|
|
|
|
|
| |
Total Investment Securities (cost: $293,868) |
| # |
|
|
| $ | 290,707 |
|
The notes to the financial statements are an integral part of this report.
NOTES TO SCHEDULE OF INVESTMENTS:
(a) The security has a perpetual maturity. The date shown is the next call date.
(b) Coupon rate is fixed for a predetermined period of time and then converts to a floating rate until maturity date. Rate is listed as of April 30, 2006.
† At April 30, 2006, all or a portion of this security is on loan (see Note 1). The value at April 30, 2006, of all securities on loan is $154.
* Floating or variable rate note. Rate is listed as of April 30, 2006.
†† Cash collateral for the Repurchase Agreements, valued at $45, that serve as collateral for securities lending are invested in corporate bonds with interest rates and maturity dates ranging from 0.00% - 9.05% and 05/02/2006 - 12/31/2049, respectively.
@ Regulated investment company advised by Investors Bank and Trust Co. (“IBT”). IBT is also the accounting, custody and lending agent for the Fund.
o Value is less than $1.
# Aggregate cost for Federal income tax purposes is $293,868. Aggregate gross unrealized appreciation for all securities in which there is an excess of value over tax cost and aggregate gross unrealized depreciation for all securities in which there is an excess of tax cost over value were $3 and $3,164, respectively. Net unrealized depreciation for tax purposes is $3,161.
144A 144A Securities are registered pursuant to Rule 144A of the Securities Act of 1933. These securities are deemed to be liquid for purposes of compliance limitations on holdings of illiquid securities and may be resold as transactions exempt from registration, normally to qualified institutional buyers. At April 30, 2006, these securities aggregated $5,980 or 2.0% of the net assets of the Fund.
REIT Real Estate Investment Trust
92
TA IDEX UBS Large Cap Value
UNDERSTANDING YOUR FUND’S EXPENSES
(unaudited)
SHAREHOLDER EXPENSES
Fund shareholders may incur ongoing costs, including management fees, 12b-1 distribution and service fees, and other fund expenses. Shares of the Fund currently are sold only to certain Transamerica IDEX Mutual Funds and AEGON/Transamerica Series Trust (an affiliate of Transamerica IDEX Mutual Funds) asset allocation funds at net asset value, without any transaction costs.
The following Example is intended to help you understand your ongoing costs (in dollars and cents) of investing in the Fund and to compare these costs with the ongoing costs of investing in other funds.
The first line in the table below provides information about actual account values and actual expenses. You may use the information in this line, together with the amount you invested, to estimate the expenses that you paid over the period. Simply divide your account value by $1,000 (for example, an $8,600 account value divided by $1,000 = 8.6), then multiply the result by the number in the first line of your Fund under the heading entitled “Expenses Paid During Period” to estimate the expenses you paid on your account during this period.
HYPOTHETICAL EXAMPLE FOR COMPARISON PURPOSES
The second line in the table below provides information about hypothetical account values and hypothetical expenses based on the Fund’s actual expense ratio and an assumed rate of return of 5% per year before expenses, which is not the Fund’s actual return. The hypothetical account values and expenses may not be used to estimate the actual ending account balance or expenses you paid for the period. You may use this information to compare the ongoing costs of investing in your Fund and other funds. To do so, compare this 5% hypothetical example with the 5% hypothetical examples that appear in the shareholder reports of the other funds.
|
| Beginning |
| Ending Account |
| Annualized |
| Expenses Paid |
| |||
Class I |
|
|
|
|
|
|
|
|
| |||
| $ | 1,000.00 |
| $ | 1,120.70 |
| 0.88 | % | $ | 4.63 |
| |
Hypothetical(b) |
| 1,000.00 |
| 1,020.43 |
| 0.88 | % | 4.41 |
| |||
(a) Expenses are calculated using the Fund’s annualized expense ratio (as disclosed in the table), multiplied by the average account value for the period, multiplied by number of days in the period (181 days), and divided by the number of days in the year (365 days).
(b) 5% return per year before expenses.
93
TABULAR PRESENTATION OF SCHEDULE OF INVESTMENTS
By Sector
At April 30, 2006
Communications |
| 10.9 | % |
Consumer Cyclical |
| 5.4 | % |
Consumer Non-Cyclical |
| 12.9 | % |
Energy |
| 9.4 | % |
Financial |
| 34.6 | % |
Industrial |
| 10.9 | % |
Other |
| 7.2 | % |
Technology |
| 1.7 | % |
Utilities |
| 7.0 | % |
|
| 100.0 | % |
This chart shows the percentage breakdown by sector of the Fund’s total investment securities.
94
TA IDEX UBS Large Cap Value
SCHEDULE OF INVESTMENTS
At April 30, 2006
(all amounts except share amounts in thousands)
(unaudited)
|
|
|
| Shares |
| Value |
| |
COMMON STOCKS (98.3%) |
|
|
|
|
|
|
| |
Aerospace (3.4%) |
|
|
|
|
|
|
| |
Lockheed Martin Corp. |
|
|
| 53,500 |
| $ | 4,061 |
|
Northrop Grumman Corp. |
|
|
| 38,200 |
| 2,556 |
| |
Air Transportation (1.8%) |
|
|
|
|
|
|
| |
FedEx Corp. |
|
|
| 31,100 |
| 3,581 |
| |
Automotive (0.7%) |
|
|
|
|
|
|
| |
Harley-Davidson, Inc. |
|
|
| 28,200 |
| 1,434 |
| |
Beverages (1.1%) |
|
|
|
|
|
|
| |
Anheuser-Busch Cos., Inc. |
|
|
| 50,600 |
| 2,256 |
| |
Business Credit Institutions (1.9%) |
|
|
|
|
|
|
| |
Freddie Mac |
|
|
| 61,400 |
| 3,749 |
| |
Business Services (2.9%) |
|
|
|
|
|
|
| |
Cendant Corp. |
|
|
| 99,200 |
| 1,729 |
| |
Omnicom Group, Inc. |
|
|
| 44,500 |
| 4,005 |
| |
Commercial Banks (23.6%) |
|
|
|
|
|
|
| |
Bank of America Corp. |
|
|
| 69,400 |
| 3,464 |
| |
Citigroup, Inc. |
|
|
| 180,300 |
| 9,006 |
| |
Fifth Third Bancorp |
| † |
| 126,800 |
| 5,125 |
| |
JP Morgan Chase & Co. |
|
|
| 189,600 |
| 8,604 |
| |
Mellon Financial Corp. |
|
|
| 125,900 |
| 4,738 |
| |
Northern Trust Corp. |
|
|
| 45,200 |
| 2,662 |
| |
PNC Financial Services Group, Inc. |
|
|
| 56,700 |
| 4,052 |
| |
Wells Fargo & Co. |
|
|
| 131,200 |
| 9,012 |
| |
Communication (1.5%) |
|
|
|
|
|
|
| |
DIRECTV Group (The), Inc. |
| † ‡ |
| 166,900 |
| 2,851 |
| |
Computer & Data Processing Services (3.3%) |
|
|
|
|
|
|
| |
Microsoft Corp. |
|
|
| 150,300 |
| 3,630 |
| |
Symantec Corp. |
| ‡ |
| 170,700 |
| 2,796 |
| |
Electric Services (4.6%) |
|
|
|
|
|
|
| |
American Electric Power Co., Inc. |
|
|
| 94,000 |
| 3,145 |
| |
FirstEnergy Corp. |
|
|
| 45,700 |
| 2,317 |
| |
Pepco Holdings, Inc. |
|
|
| 74,800 |
| 1,726 |
| |
Sempra Energy |
|
|
| 40,300 |
| 1,855 |
| |
Electric, Gas & Sanitary Services (2.9%) |
|
|
|
|
|
|
| |
Exelon Corp. |
| † |
| 85,400 |
| 4,612 |
| |
NiSource, Inc. |
|
|
| 48,100 |
| 1,015 |
| |
Food Stores (1.3%) |
|
|
|
|
|
|
| |
Kroger Co. |
| ‡ |
| 126,600 |
| 2,565 |
| |
Furniture & Fixtures (4.1%) |
|
|
|
|
|
|
| |
Johnson Controls, Inc. |
|
|
| 55,100 |
| 4,493 |
| |
Masco Corp. |
|
|
| 113,700 |
| 3,627 |
| |
Health Services (0.4%) |
|
|
|
|
|
|
| |
Caremark Rx, Inc. |
| ‡ |
| 17,400 |
| 793 |
| |
Industrial Machinery & Equipment (3.4%) |
|
|
|
|
|
|
| |
Baker Hughes, Inc. |
|
|
| 25,900 |
| 2,093 |
| |
Illinois Tool Works, Inc. |
|
|
| 44,900 |
| 4,611 |
| |
Insurance (6.4%) |
|
|
|
|
|
|
| |
Allstate Corp. (The) |
|
|
| 50,600 |
| 2,858 |
| |
American International Group, Inc. |
|
|
| 91,000 |
| 5,938 |
| |
UnitedHealth Group, Inc. |
|
|
| 77,700 |
| 3,865 |
| |
Insurance Agents, Brokers & Service (1.8%) |
|
|
|
|
|
|
| |
Hartford Financial Services Group, Inc. (The) |
|
|
| 39,100 |
| 3,594 |
| |
Management Services (1.1%) |
|
|
|
|
|
|
| |
Accenture, Ltd.-Class A |
|
|
| 75,700 |
| 2,201 |
| |
Motor Vehicles, Parts & Supplies (0.9%) |
|
|
|
|
|
|
| |
BorgWarner, Inc. |
|
|
| 28,000 |
| 1,700 |
| |
Oil & Gas Extraction (1.3%) |
|
|
|
|
|
|
| |
GlobalSantaFe Corp. |
|
|
| 42,700 |
| 2,614 |
| |
Petroleum Refining (7.6%) |
|
|
|
|
|
|
| |
Exxon Mobil Corp. |
|
|
| 114,500 |
| 7,223 |
| |
Marathon Oil Corp. |
|
|
| 98,600 |
| 7,825 |
| |
Pharmaceuticals (6.8%) |
|
|
|
|
|
|
| |
Bristol-Myers Squibb Co. |
|
|
| 70,600 |
| 1,792 |
| |
95
TA IDEX UBS Large Cap Value
SCHEDULE OF INVESTMENTS
At April 30, 2006
(all amounts except share amounts in thousands)
(unaudited)
|
|
|
| Shares |
| Value |
|
Cephalon, Inc. |
| †‡ |
| 22,400 |
| 1,471 |
|
Johnson & Johnson |
|
|
| 28,700 |
| 1,682 |
|
Medco Health Solutions, Inc. |
| ‡ |
| 48,100 |
| 2,560 |
|
Wyeth |
|
|
| 123,400 |
| 6,006 |
|
Radio & Television Broadcasting (0.6%) |
|
|
|
|
|
|
|
Univision Communications, Inc.-Class A |
| ‡ |
| 30,500 |
| 1,089 |
|
Railroads (2.2%) |
|
|
|
|
|
|
|
Burlington Northern Santa Fe Corp. |
|
|
| 54,400 |
| 4,326 |
|
Retail Trade (1.9%) |
|
|
|
|
|
|
|
Costco Wholesale Corp. |
|
|
| 67,500 |
| 3,674 |
|
Security & Commodity Brokers (4.8%) |
|
|
|
|
|
|
|
Morgan Stanley |
|
|
| 147,800 |
| 9,504 |
|
Telecommunications (4.7%) |
|
|
|
|
|
|
|
AT&T, Inc. |
|
|
| 137,300 |
| 3,599 |
|
Sprint Nextel Corp. |
|
|
| 232,063 |
| 5,755 |
|
Transportation & Public Utilities (1.3%) |
|
|
|
|
|
|
|
Expedia, Inc. |
| †‡ |
| 141,950 |
| 2,647 |
|
Total Common Stocks (cost: $169,885) |
|
|
|
|
| 194,086 |
|
|
|
|
|
|
|
|
|
|
|
|
| Principal |
| Value |
|
SECURITY LENDING COLLATERAL (7.6%) |
|
|
|
|
|
|
|
Debt (7.1%) |
|
|
|
|
|
|
|
Bank Notes (0.8%) |
|
|
|
|
|
|
|
Bank of America |
|
|
|
|
|
|
|
4.81%, due 06/07/2006 |
| * |
| 495 |
| 495 |
|
4.81%, due 08/10/2006 |
| * |
| 477 |
| 477 |
|
Bear Stearns & Co. |
|
|
|
|
|
|
|
5.01%, due 06/06/2006 |
| * |
| 191 |
| 191 |
|
5.01%, due 09/07/2006 |
| * |
| 573 |
| 573 |
|
Certificates Of Deposit (0.5%) |
|
|
|
|
|
|
|
Halifax Bank of Scotland |
|
|
|
|
|
|
|
4.78%, due 06/06/2006 |
| * |
| 477 |
| 477 |
|
Rabobank Nederland |
|
|
|
|
|
|
|
4.87%, due 05/31/2006 |
| * |
| 477 |
| 477 |
|
Commercial Paper (0.4%) |
|
|
|
|
|
|
|
Banco Santander Central Hispano SA |
|
|
|
|
|
|
|
4.77%, due 05/02/2006 |
|
|
| 287 |
| 287 |
|
Sheffield Receivables Corp.-144A |
|
|
|
|
|
|
|
4.81%, due 05/03/2006 |
|
|
| 477 |
| 477 |
|
Euro Dollar Overnight (1.3%) |
|
|
|
|
|
|
|
Bank of Montreal |
|
|
|
|
|
|
|
4.77%, due 05/02/2006 |
|
|
| 382 |
| 382 |
|
Dexia Group |
|
|
|
|
|
|
|
4.78%, due 05/04/2006 |
|
|
| 477 |
| 477 |
|
Fortis Bank |
|
|
|
|
|
|
|
4.77%, due 05/01/2006 |
|
|
| 191 |
| 191 |
|
Royal Bank of Canada |
|
|
|
|
|
|
|
4.77%, due 05/01/2006 |
|
|
| 668 |
| 668 |
|
Royal Bank of Scotland |
|
|
|
|
|
|
|
4.75%, due 05/03/2006 |
|
|
| 477 |
| 477 |
|
Svenska Handlesbanken |
|
|
|
|
|
|
|
4.82%, due 05/01/2006 |
|
|
| 365 |
| 365 |
|
Euro Dollar Terms (2.0%) |
|
|
|
|
|
|
|
BancoBilbao Vizcaya Argentaria SA |
|
|
|
|
|
|
|
4.95%, due 06/20/2006 |
|
|
| 382 |
| 382 |
|
Bank of the West |
|
|
|
|
|
|
|
4.94%, due 06/16/2006 |
|
|
| 382 |
| 382 |
|
Barclays |
|
|
|
|
|
|
|
4.79%, due 05/10/2006 |
|
|
| 573 |
| 573 |
|
4.77%, due 05/16/2006 |
|
|
| 191 |
| 191 |
|
Canadian Imperial Bank of Commerce |
|
|
|
|
|
|
|
4.97%, due 06/23/2006 |
|
|
| 287 |
| 287 |
|
96
TA IDEX UBS Large Cap Value
SCHEDULE OF INVESTMENTS
At April 30, 2006
(all amounts except share amounts in thousands)
(unaudited)
|
|
|
| Principal |
| Value |
| |
Credit Suisse First Boston Corp. |
|
|
| 287 |
| 287 |
| |
Fortis Bank |
|
|
| 191 |
| 191 |
| |
Lloyds TSB Bank |
|
|
| 286 |
| 286 |
| |
Royal Bank of Scotland |
|
|
| 382 |
| 382 |
| |
Societe Generale |
|
|
| 477 |
| 477 |
| |
UBS AG |
|
|
| 477 |
| 477 |
| |
Repurchase Agreements (2.1%) |
| †† |
|
|
|
|
| |
Credit Suisse First Boston Corp. |
|
|
| 648 |
| 648 |
| |
Goldman Sachs Group, Inc. (The) |
|
|
| 1,403 |
| 1,403 |
| |
Lehman Brothers, Inc. |
|
|
| 24 |
| 24 |
| |
Merrill Lynch & Co. |
|
|
| 1,432 |
| 1,432 |
| |
Morgan Stanley Dean Witter & Co. |
|
|
| 668 |
| 668 |
| |
|
|
|
|
|
|
|
| |
|
|
|
| Shares |
| Value |
| |
Investment Companies (0.5%) |
|
|
|
|
|
|
| |
Barclays Global Investors Institutional Money Market Fund |
|
|
| 763,842 |
| 764 |
| |
Merrimac Cash Fund, Premium Class |
| @ |
| 203,232 |
| 203 |
| |
Total Security Lending Collateral (cost: $15,071) |
|
|
|
|
| 15,071 |
| |
Total Investment Securities (cost: $184,956) |
| # |
|
|
| $ | 209,157 |
|
The notes to the financial statements are an integral part of this report.
NOTES TO SCHEDULE OF INVESTMENTS:
† At April 30, 2006, all or a portion of this security is on loan (see Note 1). The value at April 30, 2006, of all securities on loan is $14,536.
‡ Non-income producing.
* Floating or variable rate note. Rate is listed as of April 30, 2006.
†† Cash collateral for the Repurchase Agreements, valued at $4,225, that serve as collateral for securities lending are invested in corporate bonds with interest rates and maturity dates ranging from 0.00% - 9.05% and 05/02/2006 - 12/31/2049, respectively.
@ Regulated investment company advised by Investors Bank and Trust Co. (“IBT”). IBT is also the accounting, custody and lending agent for the Fund.
97
TA IDEX UBS Large Cap Value
SCHEDULE OF INVESTMENTS
At April 30, 2006
(all amounts except share amounts in thousands)
(unaudited)
# Aggregate cost for Federal income tax purposes is $184,961. Aggregate gross unrealized appreciation for all securities in which there is an excess of value over tax cost and aggregate gross unrealized depreciation for all securities in which there is an excess of tax cost over value were $26,455 and $2,259, respectively. Net unrealized appreciation for tax purposes is $24,196.
144A 144A Securities are registered pursuant to Rule 144A of the Securities Act of 1933. These securities are deemed to be liquid for purposes of compliance limitations on holdings of illiquid securities and may be resold as transactions exempt from registration, normally to qualified institutional buyers. At April 30, 2006, these securities aggregated $477 or 0.2% of the net assets of the Fund.
98
TA IDEX Van Kampen Emerging Markets Debt
UNDERSTANDING YOUR FUND’S EXPENSES
(unaudited)
SHAREHOLDER EXPENSES
Fund shareholders may incur ongoing costs, including management fees, 12b-1 distribution and service fees, and other fund expenses. Shares of the Fund currently are sold only to certain Transamerica IDEX Mutual Funds and AEGON/Transamerica Series Trust (an affiliate of Transamerica IDEX Mutual Funds) asset allocation funds at net asset value, without any transaction costs.
The following Example is intended to help you understand your ongoing costs (in dollars and cents) of investing in the Fund and to compare these costs with the ongoing costs of investing in other funds.
ACTUAL EXPENSES
The first line in the table below provides information about actual account values and actual expenses. You may use the information in this line, together with the amount you invested, to estimate the expenses that you paid over the period. Simply divide your account value by $1,000 (for example, an $8,600 account value divided by $1,000 = 8.6), then multiply the result by the number in the first line of your Fund under the heading entitled “Expenses Paid During Period” to estimate the expenses you paid on your account during this period.
HYPOTHETICAL EXAMPLE FOR COMPARISON PURPOSES
The second line in the table below provides information about hypothetical account values and hypothetical expenses based on the Fund’s actual expense ratio and an assumed rate of return of 5% per year before expenses, which is not the Fund’s actual return. The hypothetical account values and expenses may not be used to estimate the actual ending account balance or expenses you paid for the period. You may use this information to compare the ongoing costs of investing in your Fund and other funds. To do so, compare this 5% hypothetical example with the 5% hypothetical examples that appear in the shareholder reports of the other funds.
|
| Beginning |
| Ending Account |
| Annualized |
| Expenses Paid |
| |||
Class I |
|
|
|
|
|
|
|
|
| |||
Actual |
| $ | 1,000.00 |
| $ | 1,048.40 |
| 1.02 | % | $ | 5.18 |
|
Hypothetical(b) |
| 1,000.00 |
| 1,019.74 |
| 1.02 | % | 5.11 |
| |||
(a) Expenses are calculated using the Fund’s annualized expense ratio (as disclosed in the table), multiplied by the average account value for the period, multiplied by number of days in the period (181 days), and divided by the number of days in the year (365 days).
(b) 5% return per year before expenses.
99
TA IDEX Van Kampen Emerging Markets Debt
TABULAR PRESENTATION OF SCHEDULE OF INVESTMENTS
By Region
At April 30, 2006
Africa |
| 1.7 | % |
Eastern Europe |
| 4.5 | % |
Europe |
| 18.6 | % |
Latin America |
| 15.1 | % |
North America |
| 10.9 | % |
Other |
| 3.2 | % |
Pacific Rim |
| 14.6 | % |
South America |
| 31.4 | % |
|
| 100.0 | % |
This chart shows the percentage breakdown by region of the Fund’s total investment securities.
100
TA IDEX Van Kampen Emerging Markets Debt
SCHEDULE OF INVESTMENTS
At April 30, 2006
(all amounts except share amounts in thousands)
(unaudited)
|
|
|
| Principal |
| Value |
|
FOREIGN GOVERNMENT OBLIGATIONS (72.3%) |
|
|
|
|
|
|
|
Argentina (3.5%) |
|
|
|
|
|
|
|
Argentine Republic |
|
|
|
|
|
|
|
5.83%, due 12/31/2033 |
|
|
| 26,690 |
| 11,303 |
|
8.28%, due 12/31/2033 |
|
|
| 112 |
| 112 |
|
0.00%, due 12/15/2035 |
| * |
| 64,668 |
| 1,936 |
|
1.33%, due 12/31/2038 |
| (a | ) | — | o | — | o |
0.00%, due 04/10/2049 |
| *Ø |
| 2,310 |
| 924 |
|
Brazil (11.3%) |
|
|
|
|
|
|
|
Republic of Brazil |
|
|
|
|
|
|
|
14.50%, due 10/15/2009 |
|
|
| 9,800 |
| 12,573 |
|
10.50%, due 07/14/2014 |
|
|
| 2,580 |
| 3,199 |
|
8.00%, due 01/15/2018 |
|
|
| 8,600 |
| 9,335 |
|
8.00%, due 01/15/2018 |
|
|
| 2,381 |
| 2,585 |
|
8.88%, due 10/14/2019 |
|
|
| 14,873 |
| 17,141 |
|
8.88%, due 04/15/2024 |
|
|
| 1,210 |
| 1,379 |
|
Bulgaria (1.1%) |
| �� |
|
|
|
|
|
Republic of Bulgaria |
|
|
|
|
|
|
|
8.25%, due 01/15/2015 |
|
|
| 3,750 |
| 4,321 |
|
Colombia (2.6%) |
|
|
|
|
|
|
|
Republic of Colombia |
|
|
|
|
|
|
|
9.75%, due 04/09/2011 |
|
|
| 808 |
| 897 |
|
9.75%, due 04/09/2011 |
|
|
| 586 |
| 650 |
|
8.25%, due 12/22/2014 |
|
|
| 2,200 |
| 2,468 |
|
11.75%, due 02/25/2020 |
|
|
| 2,650 |
| 3,770 |
|
8.13%, due 05/21/2024 |
|
|
| 2,500 |
| 2,781 |
|
Ecuador (1.1%) |
|
|
|
|
|
|
|
Republic of Ecuador |
|
|
|
|
|
|
|
9.38%, due 12/15/2015 |
|
|
| 1,590 |
| 1,705 |
|
9.00%, due 08/15/2030 |
| (b | ) | 2,760 |
| 2,850 |
|
Ivory Coast (0.2%) |
|
|
|
|
|
|
|
Republic of Ivory Coast |
|
|
|
|
|
|
|
0.00%, due 03/29/2018 |
| Ø |
| 3,495 |
| 874 |
|
Malaysia (1.2%) |
|
|
|
|
|
|
|
Malaysia Government |
|
|
|
|
|
|
|
8.75%, due 06/01/2009 |
|
|
| 3,700 |
| 4,038 |
|
7.50%, due 07/15/2011 |
|
|
| 880 |
| 953 |
|
Mexico (11.2%) |
|
|
|
|
|
|
|
United Mexican States |
|
|
|
|
|
|
|
8.38%, due 01/14/2011 |
|
|
| 19,050 |
| 20,955 |
|
8.13%, due 12/30/2019 |
|
|
| 5,770 |
| 6,664 |
|
10.00%, due 12/05/2024 |
| MXN |
| 122,150 |
| 12,211 |
|
11.50%, due 05/15/2026 |
|
|
| 1,440 |
| 2,200 |
|
8.30%, due 08/15/2031 |
|
|
| 2,820 |
| 3,349 |
|
United Mexican States Warrants, Expires 9/1/2006 |
|
|
|
|
|
|
|
Zero Coupon, due 09/01/2006 |
|
|
| 2 |
| 163 |
|
Nigeria (1.4%) |
|
|
|
|
|
|
|
Republic of Nigeria |
|
|
|
|
|
|
|
6.25%, due 11/15/2020 |
|
|
| 5,500 |
| 5,459 |
|
Panama (2.0%) |
|
|
|
|
|
|
|
Republic of Panama |
|
|
|
|
|
|
|
9.63%, due 02/08/2011 |
|
|
| 1,476 |
| 1,683 |
|
7.13%, due 01/29/2026 |
|
|
| 3,720 |
| 3,757 |
|
9.38%, due 04/01/2029 |
|
|
| 2,300 |
| 2,871 |
|
Peru (2.6%) |
|
|
|
|
|
|
|
Republic of Peru |
|
|
|
|
|
|
|
9.88%, due 02/06/2015 |
|
|
| 2,180 |
| 2,589 |
|
8.38%, due 05/03/2016 |
|
|
| 2,200 |
| 2,396 |
|
8.75%, due 11/21/2033 |
|
|
| 4,940 |
| 5,557 |
|
Philippine Islands (12.3%) |
|
|
|
|
|
|
|
Republic of the Philippines |
|
|
|
|
|
|
|
8.88%, due 03/17/2015 |
|
|
| 17,770 |
| 20,080 |
|
10.63%, due 03/16/2025 |
|
|
| 4,950 |
| 6,398 |
|
101
TA IDEX Van Kampen Emerging Markets Debt
SCHEDULE OF INVESTMENTS
At April 30, 2006
(all amounts except share amounts in thousands)
(unaudited)
9.50%, due 02/02/2030 |
|
|
| 20,025 |
| 23,705 |
|
Qatar (0.4%) |
|
|
|
|
|
|
|
State of Qatar |
|
|
|
|
|
|
|
9.75%, due 06/15/2030 |
|
|
| 1,220 |
| 1,732 |
|
Russia (11.5%) |
|
|
|
|
|
|
|
Russian Federation |
|
|
|
|
|
|
|
8.25%, due 03/31/2010 |
|
|
| 4,058 |
| 4,261 |
|
11.00%, due 07/24/2018 |
|
|
| 7,350 |
| 10,404 |
|
12.75%, due 06/24/2028 |
|
|
| 9,970 |
| 17,417 |
|
5.00%, due 03/31/2030 |
| (c | ) | 13,611 |
| 14,747 |
|
Turkey (3.1%) |
|
|
|
|
|
|
|
Republic of Turkey |
|
|
|
|
|
|
|
11.50%, due 01/23/2012 |
|
|
| 4,190 |
| 5,206 |
|
11.00%, due 01/14/2013 |
|
|
| 3,630 |
| 4,515 |
|
11.88%, due 01/15/2030 |
|
|
| 2,000 |
| 3,050 |
|
Venezuela (6.8%) |
|
|
|
|
|
|
|
Republic of Venezuela |
|
|
|
|
|
|
|
10.75%, due 09/19/2013 |
|
|
| 7,500 |
| 9,319 |
|
8.50%, due 10/08/2014 |
|
|
| 2,100 |
| 2,352 |
|
5.75%, due 02/26/2016 |
|
|
| 1,640 |
| 1,523 |
|
9.38%, due 01/13/2034 |
|
|
| 11,412 |
| 14,476 |
|
Total Foreign Government Obligations (cost: $290,218) |
|
|
|
|
| 294,833 |
|
CORPORATE DEBT SECURITIES (20.6%) |
|
|
|
|
|
|
|
Cayman Islands (1.4%) |
|
|
|
|
|
|
|
Banco Abn Amro Real S.A.-144A |
|
|
|
|
|
|
|
Zero Coupon, due 07/21/2006 |
|
|
| 1,860 |
| 2,370 |
|
15.86%, due 12/13/2007 |
| BRL |
| 6,500 |
| 3,154 |
|
Chile (1.3%) |
|
|
|
|
|
|
|
Empresa Nacional de Petroleo |
|
|
|
|
|
|
|
6.75%, due 11/15/2012 |
|
|
| 4,100 |
| 4,271 |
|
Empresa Nacional de Petroleo-144A |
|
|
|
|
|
|
|
6.75%, due 11/15/2012 |
|
|
| 1,000 |
| 1,043 |
|
Germany (1.5%) |
|
|
|
|
|
|
|
Aries Vermoegensverwaltungs |
|
|
|
|
|
|
|
9.60%, due 10/25/2014 |
|
|
| 5,000 |
| 6,222 |
|
Luxembourg (1.3%) |
|
|
|
|
|
|
|
Gaz Capital for Gazprom |
|
|
|
|
|
|
|
8.63%, due 04/28/2034 |
|
|
| 4,230 |
| 5,105 |
|
Mexico (0.8%) |
|
|
|
|
|
|
|
Petroleos Mexicanos, Guaranteed Note |
|
|
|
|
|
|
|
8.63%, due 12/01/2023 |
|
|
| 1,750 |
| 2,017 |
|
9.50%, due 09/15/2027 |
|
|
| 1,000 |
| 1,251 |
|
Netherlands (3.0%) |
|
|
|
|
|
|
|
Pindo Deli Finance Mauritius |
|
|
|
|
|
|
|
4.68%, due 04/28/2015 |
| * |
| 906 |
| 743 |
|
4.68%, due 04/28/2018 |
| * |
| 1,500 |
| 855 |
|
0.00%, due 04/28/2025 |
| * |
| 1,500 |
| 375 |
|
Pindo Deli Finance Mauritius-144A |
|
|
|
|
|
|
|
4.68%, due 04/28/2015 |
| * |
| 336 |
| 276 |
|
4.68%, due 04/28/2018 |
| * |
| 950 |
| 541 |
|
0.00%, due 04/28/2025 |
| * |
| 1,915 |
| 479 |
|
Tjiwi Kimia Finance Mauritius, Ltd. |
|
|
|
|
|
|
|
4.68%, due 04/28/2015 |
| * |
| 5,382 |
| 4,413 |
|
5.25%, due 04/28/2018 |
| * |
| 1,000 |
| 630 |
|
0.00%, due 04/28/2027 |
| * |
| 1,500 |
| 375 |
|
Tjiwi Kimia Finance Mauritius, Ltd.-144A |
|
|
|
|
|
|
|
5.66%, due 04/28/2015 |
| * |
| 811 |
| 665 |
|
4.68%, due 04/28/2018 |
| * |
| 4,046 |
| 2,549 |
|
0.00%, due 04/28/2027 |
| * |
| 1,045 |
| 261 |
|
Trinidad (0.8%) |
|
|
|
|
|
|
|
National Gas Co., of Trinidad and Tobago, Ltd., Senior Note |
|
|
|
|
|
|
|
6.05%, due 01/15/2036 |
|
|
| 1,000 |
| 926 |
|
National Gas Co., of Trinidad and Tobago, Ltd.-144A |
|
|
|
|
|
|
|
6.05%, due 01/15/2036 |
|
|
| 2,656 |
| 2,414 |
|
102
TA IDEX Van Kampen Emerging Markets Debt
SCHEDULE OF INVESTMENTS
At April 30, 2006
(all amounts except share amounts in thousands)
(unaudited)
Tunisia (0.4%) |
|
|
|
|
|
|
|
Banque Centrale de Tunisie |
|
|
|
|
|
|
|
7.38%, due 04/25/2012 |
|
|
| 1,600 |
| 1,700 |
|
United States (10.1%) |
|
|
|
|
|
|
|
Citigroup Funding, Inc.-144A |
|
|
|
|
|
|
|
Zero Coupon, due 06/28/2007 |
|
|
| 2,400 |
| 2,458 |
|
Zero Coupon, due 06/28/2007 |
|
|
| 5,000 |
| 5,038 |
|
Zero Coupon, due 01/30/2009 |
|
|
| 2,590 |
| 2,823 |
|
Zero Coupon, due 05/18/2009 |
|
|
| 4,448 |
| 4,501 |
|
Citigroup Global Markets Holdings, Inc.-144A |
|
|
|
|
|
|
|
Zero Coupon, due 05/25/2006 |
|
|
| 2,500 |
| 2,948 |
|
JP Morgan Chase Bank NA |
|
|
|
|
|
|
|
Zero Coupon, due 06/27/2007 |
|
|
| 5,113 |
| 4,456 |
|
Pemex Project Funding Master Trust |
|
|
|
|
|
|
|
5.17%, due 06/15/2010 |
| * |
| 3,950 |
| 4,050 |
|
9.13%, due 10/13/2010 |
|
|
| 4,500 |
| 5,015 |
|
9.50%, due 09/15/2027 |
|
|
| 6,720 |
| 8,407 |
|
Pemex Project Funding Master Trust-144A |
|
|
|
|
|
|
|
6.21%, due 06/15/2010 |
| * |
| 1,500 |
| 1,538 |
|
Total Corporate Debt Securities (cost: $83,205) |
|
|
|
|
| 83,869 |
|
|
| Contracts |
| ♦ |
| Value |
| |
PURCHASED OPTIONS (0.0%) |
|
|
|
|
|
|
| |
Put Options (0.0%) |
|
|
|
|
|
|
| |
Brazil Real |
| 3,239,830 |
|
|
| 12 |
| |
Put Strike $2.16 |
|
|
|
|
|
|
| |
Expires 05/18/2006 |
|
|
|
|
|
|
| |
Total Purchased Options (cost: $97) |
|
|
|
|
| 12 |
| |
Total Investment Securities (cost: $373,520) |
|
|
|
|
| $ | 378,714 |
|
|
| Contracts |
| ♦ |
| Value |
|
WRITTEN OPTIONS (0.0%) |
|
|
|
|
|
|
|
Put Options (0.0%) |
|
|
|
|
|
|
|
Brazil Real |
| 8,773,450 |
|
|
| (4 | ) |
Put Strike $2.30 |
|
|
|
|
|
|
|
Expires 05/18/2006 |
|
|
|
|
|
|
|
Total Written Options (premiums: $96) |
|
|
|
|
| (4 | ) |
NOTES TO SCHEDULE OF INVESTMENTS:
* Floating or variable rate note. Rate is listed as of April 30, 2006.
(a) Argentine Republic has a coupon rate of 1.33% until 03/31/2009, a coupon rate of 2.50% until 03/31/2019, a coupon rate of 3.75% until 03/31/2029, and thereafter the coupon rate will be 5.25%.
(b) Republic of Ecuador has a coupon rate of 9.00% until 08/15/2006, thereafter the coupon rate will become 10.00%.
(c) Russian Federation has a coupon rate of 5.00% until 03/31/2007, thereafter the coupon rate will become 7.50%.
♦ Contract amounts are not in thousands.
o Value is less than $1.
Ø Security is currently in default on interest payments.
# Aggregate cost for Federal income tax purposes is $374,264. Aggregate gross unrealized appreciation for all securities in which there is an excess of value over tax cost and aggregate gross unrealized depreciation for all securities in which there is an excess of tax cost over value were $8,862 and $4,412, respectively. Net unrealized appreciation for tax purposes is $4,450.
103
TA IDEX Van Kampen Emerging Markets Debt
SCHEDULE OF INVESTMENTS
At April 30, 2006
(all amounts except share amounts in thousands)
(unaudited)
DEFINITIONS:
144A 144A Securities are registered pursuant to Rule 144A of the Securities Act of 1933. These securities are deemed to be liquid for purposes of compliance limitations on holdings of illiquid securities and may be resold as transactions exempt from registration, normally to qualified institutional buyers. At April 30, 2006, these securities aggregated $33,058 or 8.1% of the net assets of the Fund.
BRL Brazilian Real
MXN Mexican Peso
The notes to the financial statements are an integral part of this report.
104
TA IDEX Van Kampen Emerging Markets Debt
SCHEDULE OF INVESTMENTS
At April 30, 2006
(all amounts except share amounts in thousands)
(unaudited)
FUTURES CONTRACTS:
|
|
|
|
|
|
|
|
|
| Net Unrealized |
| ||
|
|
|
|
|
| Settlement |
|
|
| Appreciation |
| ||
|
|
|
| Contracts |
| Date |
| Amount |
| (Depreciation) |
| ||
2 Year U.S. Treasury Note |
| Ω |
| (155 | ) | 06/30/2006 |
| $ | (31,579 | ) | $ | 31 |
|
|
|
|
|
|
|
|
| $ | (31,579 | ) | $ | 31 |
|
Ω At April 30, 2006, the Fund has cash in the amount of $160, segregated with the custodian to cover margin requirements for open futures contracts.
The notes to the financial statements are an integral part of this report.
105
TA IDEX Van Kampen Emerging Markets Debt
SCHEDULE OF INVESTMENTS
April 30, 2006
(all amounts except share amounts in thousands)
(unaudited)
|
| Percentage of |
|
|
| |
|
| Net Assets |
| Value |
| |
INVESTMENTS BY INDUSTRY: |
|
|
|
|
| |
Sovereign Government |
| 72.3 | % | $ | 294,833 |
|
Oil & Gas Extraction |
| 8.6 | % | 35,110 |
| |
Commercial Banks |
| 6.5 | % | 26,501 |
| |
Paper & Allied Products |
| 3.0 | % | 12,162 |
| |
Mortgage Bankers & Brokers |
| 1.8 | % | 7,148 |
| |
Security & Commodity Brokers |
| 0.7 | % | 2,948 |
| |
Put Options |
| 0.0 | % | 12 |
| |
Investment Securities, at value |
| 92.9 | % | 378,714 |
| |
Total Investment Securities |
| 92.9 | % | 378,714 |
| |
The notes to the financial statements are an integral part of this report.
106
TA IDEX Van Kampen Mid-Cap Growth
UNDERSTANDING YOUR FUND’S EXPENSES
(unaudited)
SHAREHOLDER EXPENSES
Fund shareholders may incur ongoing costs, including management fees, 12b-1 distribution and service fees, and other fund expenses. Shares of the Fund currently are sold only to certain Transamerica IDEX Mutual Funds and AEGON/Transamerica Series Trust (an affiliate of Transamerica IDEX Mutual Funds) asset allocation funds at net asset value, without any transaction costs.
The following Example is intended to help you understand your ongoing costs (in dollars and cents) of investing in the Fund and to compare these costs with the ongoing costs of investing in other funds.
The Example is based on an investment of $1,000 invested at January 3, 2006 and held for the entire period until April 30, 2006.
ACTUAL EXPENSES
The first line in the table below provides information about actual account values and actual expenses. You may use the information in this line, together with the amount you invested, to estimate the expenses that you paid over the period. Simply divide your account value by $1,000 (for example, an $8,600 account value divided by $1,000 = 8.6), then multiply the result by the number in the first line of your Fund under the heading entitled “Expenses Paid During Period” to estimate the expenses you paid on your account during this period.
HYPOTHETICAL EXAMPLE FOR COMPARISON PURPOSES
The second line in the table below provides information about hypothetical account values and hypothetical expenses based on the Fund’s actual expense ratio and an assumed rate of return of 5% per year before expenses, which is not the Fund’s actual return. The hypothetical account values and expenses may not be used to estimate the actual ending account balance or expenses you paid for the period. You may use this information to compare the ongoing costs of investing in your Fund and other funds. To do so, compare this 5% hypothetical example with the 5% hypothetical examples that appear in the shareholder reports of the other funds.
|
| Beginning |
| Ending Account |
| Annualized |
| Expenses Paid |
| |||
Class I |
|
|
|
|
|
|
|
|
| |||
Actual |
| $ | 1,000.00 |
| $ | 1,079.00 |
| 0.98 | % | $ | 3.27 |
|
Hypothetical(b) |
| 1,000.00 |
| 1,012.89 |
| 0.98 | % | 3.16 |
| |||
(a) Expenses are calculated using the Fund’s annualized expense ratio (as disclosed in the table), multiplied by the average account value for the period, multiplied by number of days in the period (117 days), and divided by the number of days in the year (365 days).
(b) 5% return per year before expenses.
107
TA IDEX Van Kampen Mid-Cap Growth
TABULAR PRESENTATION OF SCHEDULE OF INVESTMENTS
By Sector
At April 30, 2006
Basic Materials |
| 1.0 | % |
Communications |
| 18.2 | % |
Consumer Cyclical |
| 18.4 | % |
Consumer Non-Cyclical |
| 23.7 | % |
Energy |
| 8.9 | % |
Financial |
| 11.3 | % |
Industrial |
| 11.1 | % |
Technology |
| 7.4 | % |
|
| 100.0 | % |
This chart shows the percentage breakdown by sector of the Fund’s total investment securities.
108
TA IDEX Van Kampen Mid-Cap Growth
SCHEDULE OF INVESTMENTS
At April 30, 2006
(all amounts except share amounts in thousands)
(unaudited)
|
|
|
| Shares |
| Value |
| |
COMMON STOCKS (97.1%) |
|
|
|
|
|
|
| |
Amusement & Recreation Services (2.8%) |
|
|
|
|
|
|
| |
Station Casinos, Inc. |
|
|
| 20,025 |
| $ | 1,544 |
|
Apparel & Accessory Stores (3.0%) |
|
|
|
|
|
|
| |
Abercrombie & Fitch Co.-Class A |
|
|
| 14,050 |
| 853 |
| |
American Eagle Outfitters |
|
|
| 26,455 |
| 857 |
| |
Automotive Dealers & Service Stations (2.7%) |
|
|
|
|
|
|
| |
AutoZone, Inc. |
| ‡ |
| 16,345 |
| 1,530 |
| |
Business Services (12.0%) |
|
|
|
|
|
|
| |
Akamai Technologies, Inc. |
| ‡ |
| 19,500 |
| 657 |
| |
ChoicePoint, Inc. |
| ‡ |
| 11,415 |
| 503 |
| |
Getty Images, Inc. |
| ‡ |
| 19,105 |
| 1,223 |
| |
Iron Mountain, Inc. |
| ‡ |
| 29,535 |
| 1,155 |
| |
Lamar Advertising Co. |
| ‡ |
| 15,435 |
| 849 |
| |
Monster Worldwide, Inc. |
| ‡ |
| 32,185 |
| 1,847 |
| |
NetEase.com, ADR |
| ‡ |
| 22,280 |
| 483 |
| |
Communication (3.4%) |
|
|
|
|
|
|
| |
Crown Castle International Corp. |
| ‡ |
| 43,105 |
| 1,451 |
| |
Global Payments, Inc. |
|
|
| 9,995 |
| 474 |
| |
Computer & Data Processing Services (6.3%) |
|
|
|
|
|
|
| |
Activision, Inc. |
| ‡ |
| 85,875 |
| 1,219 |
| |
Checkfree Corp. |
| ‡ |
| 10,440 |
| 562 |
| |
Red Hat, Inc. |
| ‡ |
| 31,870 |
| 937 |
| |
salesforce.com, Inc. |
| ‡ |
| 23,525 |
| 825 |
| |
Construction (0.9%) |
|
|
|
|
|
|
| |
MDC Holdings, Inc. |
|
|
| 8,500 |
| 491 |
| |
Educational Services (3.2%) |
|
|
|
|
|
|
| |
Apollo Group, Inc.-Class A |
| ‡ |
| 19,950 |
| 1,090 |
| |
ITT Educational Services, Inc. |
| ‡ |
| 11,420 |
| 726 |
| |
Electric, Gas & Sanitary Services (2.2%) |
|
|
|
|
|
|
| |
Stericycle, Inc. |
| ‡ |
| 19,110 |
| 1,258 |
| |
Electronic Components & Accessories (1.1%) |
|
|
|
|
|
|
| |
Tessera Technologies, Inc. |
| ‡ |
| 19,065 |
| 611 |
| |
Entertainment (1.5%) |
|
|
|
|
|
|
| |
International Game Technology |
|
|
| 21,890 |
| 830 |
| |
Gas Production & Distribution (2.9%) |
|
|
|
|
|
|
| |
Questar Corp. |
|
|
| 6,905 |
| 553 |
| |
Southwestern Energy Co. |
| ‡ |
| 29,510 |
| 1,063 |
| |
Health Services (0.9%) |
|
|
|
|
|
|
| |
DaVita, Inc. |
| ‡ |
| 9,045 |
| 509 |
| |
Holding & Other Investment Offices (2.3%) |
|
|
|
|
|
|
| |
Brookfield Asset Management, Inc. |
|
|
| 31,028 |
| 1,297 |
| |
Hotels & Other Lodging Places (2.4%) |
|
|
|
|
|
|
| |
Choice Hotels International, Inc. |
|
|
| 15,480 |
| 829 |
| |
Wynn Resorts, Ltd. |
| ‡ |
| 7,100 |
| 540 |
| |
Industrial Machinery & Equipment (1.9%) |
|
|
|
|
|
|
| |
Pentair, Inc. |
|
|
| 27,810 |
| 1,065 |
| |
Insurance Agents, Brokers & Service (0.9%) |
|
|
|
|
|
|
| |
Brown & Brown, Inc. |
|
|
| 16,765 |
| 524 |
| |
Management Services (4.2%) |
|
|
|
|
|
|
| |
Corporate Executive Board Co. |
|
|
| 21,750 |
| 2,330 |
| |
Medical Instruments & Supplies (1.0%) |
|
|
|
|
|
|
| |
Techne Corp. |
| ‡ |
| 9,425 |
| 534 |
| |
Mining (1.5%) |
|
|
|
|
|
|
| |
Florida Rock Industries, Inc. |
|
|
| 13,900 |
| 867 |
| |
Oil & Gas Extraction (5.8%) |
|
|
|
|
|
|
| |
Ultra Petroleum Corp. |
| ‡ |
| 51,085 |
| 3,267 |
| |
Paper & Allied Products (0.9%) |
|
|
|
|
|
|
| |
MeadWestvaco Corp. |
|
|
| 18,230 |
| 520 |
| |
Personal Services (0.9%) |
|
|
|
|
|
|
| |
Weight Watchers International, Inc. |
|
|
| 10,640 |
| 525 |
| |
Pharmaceuticals (3.0%) |
|
|
|
|
|
|
| |
Dade Behring Holdings, Inc. |
|
|
| 29,390 |
| 1,146 |
| |
Medicis Pharmaceutical Corp.-Class A |
|
|
| 17,100 |
| 562 |
| |
109
TA IDEX Van Kampen Mid-Cap Growth
SCHEDULE OF INVESTMENTS
At April 30, 2006
(all amounts except share amounts in thousands)
(unaudited)
|
|
|
| Shares |
| Value |
| |
Radio & Television Broadcasting (2.0%) |
|
|
|
|
|
|
| |
Grupo Televisa SA, Sponsored ADR |
|
|
| 52,851 |
| 1,120 |
| |
Real Estate (3.9%) |
|
|
|
|
|
|
| |
CB Richard Ellis Group, Inc.-Class A |
| ‡ |
| 10,090 |
| 887 |
| |
Desarrolladora Homex SA de CV, ADR |
| ‡ |
| 21,140 |
| 810 |
| |
St. Joe Co. (The) |
|
|
| 8,350 |
| 469 |
| |
Research & Testing Services (1.9%) |
|
|
|
|
|
|
| |
Gen-Probe, Inc. |
| ‡ |
| 19,599 |
| 1,048 |
| |
Residential Building Construction (1.4%) |
|
|
|
|
|
|
| |
NVR, Inc. |
| ‡ |
| 1,027 |
| 775 |
| |
Restaurants (1.8%) |
|
|
|
|
|
|
| |
Wendy’s International, Inc. |
|
|
| 16,175 |
| 999 |
| |
Retail Trade (1.8%) |
|
|
|
|
|
|
| |
Amazon.com, Inc. |
| ‡ |
| 29,400 |
| 1,035 |
| |
Security & Commodity Brokers (5.3%) |
|
|
|
|
|
|
| |
Ameritrade Holding Corp. |
| ‡ |
| 26,500 |
| 492 |
| |
Calamos Asset Management, Inc.-Class A |
|
|
| 30,740 |
| 1,192 |
| |
Chicago Mercantile Exchange |
|
|
| 1,845 |
| 845 |
| |
Janus Capital Group, Inc. |
|
|
| 23,700 |
| 461 |
| |
Telecommunications (3.5%) |
|
|
|
|
|
|
| |
NII Holdings, Inc.-Class B |
| ‡ |
| 32,870 |
| 1,969 |
| |
Tobacco Products (1.7%) |
|
|
|
|
|
|
| |
Loews Corp. - Carolina Group |
|
|
| 18,965 |
| 972 |
| |
Transportation & Public Utilities (6.1%) |
|
|
|
|
|
|
| |
CH Robinson Worldwide, Inc. |
|
|
| 30,400 |
| 1,348 |
| |
Expedia, Inc. |
| ‡ |
| 31,325 |
| 584 |
| |
Expeditors International of Washington, Inc. |
|
|
| 17,515 |
| 1,499 |
| |
Total Common Stocks (cost: $52,200) |
|
|
|
|
| 54,611 |
| |
Total Investment Securities (cost: $52,200) |
| # |
|
|
| $ | 54,611 |
|
The notes to the financial statements are an integral part of this report.
NOTES TO SCHEDULE OF INVESTMENTS:
‡ Non-income producing.
# Aggregate cost for Federal income tax purposes is $52,200. Aggregate gross unrealized appreciation for all securities in which there is an excess of value over tax cost and aggregate gross unrealized depreciation for all securities in which there is an excess of tax cost over value were $3,653 and $1,242, respectively. Net unrealized appreciation for tax purposes is $2,411.
ADR American Depositary Receipt
110
TA IDEX Van Kampen Small Cap Growth
UNDERSTANDING YOUR FUND’S EXPENSES
(unaudited)
SHAREHOLDER EXPENSES
Fund shareholders may incur ongoing costs, including management fees, 12b-1 distribution and service fees, and other fund expenses. Shares of the Fund currently are sold only to certain Transamerica IDEX Mutual Funds and AEGON/Transamerica Series Trust (an affiliate of Transamerica IDEX Mutual Funds) asset allocation funds at net asset value, without any transaction costs.
The following Example is intended to help you understand your ongoing costs (in dollars and cents) of investing in the Fund and to compare these costs with the ongoing costs of investing in other funds.
ACTUAL EXPENSES
The first line in the table below provides information about actual account values and actual expenses. You may use the information in this line, together with the amount you invested, to estimate the expenses that you paid over the period. Simply divide your account value by $1,000 (for example, an $8,600 account value divided by $1,000 = 8.6), then multiply the result by the number in the first line of your Fund under the heading entitled “Expenses Paid During Period” to estimate the expenses you paid on your account during this period.
HYPOTHETICAL EXAMPLE FOR COMPARISON PURPOSES
The second line in the table below provides information about hypothetical account values and hypothetical expenses based on the Fund’s actual expense ratio and an assumed rate of return of 5% per year before expenses, which is not the Fund’s actual return. The hypothetical account values and expenses may not be used to estimate the actual ending account balance or expenses you paid for the period. You may use this information to compare the ongoing costs of investing in your Fund and other funds. To do so, compare this 5% hypothetical example with the 5% hypothetical examples that appear in the shareholder reports of the other funds.
|
| Beginning |
| Ending |
| Annualized |
| Expenses Paid |
| |||
Class I |
|
|
|
|
|
|
|
|
| |||
Actual |
| $ | 1,000.00 |
| $ | 1,194.20 |
| 1.00 | % | $ | 5.44 |
|
Hypothetical(b) |
| 1,000.00 |
| 1,019.84 |
| 1.00 | % | 5.01 |
| |||
(a) Expenses are calculated using the Fund’s annualized expense ratio (as disclosed in the table), multiplied by the average account value for the period, multiplied by number of days in the period (181 days), and divided by the number of days in the year (365 days).
(b) 5% return per year before expenses.
111
TA IDEX Van Kampen Small Cap Growth
TABULAR PRESENTATION OF SCHEDULE OF INVESTMENTS
By Sector
At April 30, 2006
Communications |
| 11.9 | % |
|
Consumer Cyclical |
| 24.0 | % |
|
Consumer Non-Cyclical |
| 22.4 | % |
|
Diversified |
| 0.9 | % |
|
Energy |
| 4.4 | % |
|
Financial |
| 4.3 | % |
|
Industrial |
| 7.4 | % |
|
Other |
| 21.1 | % |
|
Technology |
| 3.6 | % |
|
|
| 100.0 | % |
|
This chart shows the percentage breakdown by sector of the Fund’s total investment securities.
112
TA IDEX Van Kampen Small Company Growth
SCHEDULE OF INVESTMENTS
At April 30, 2006
(all amounts except share amounts in thousands)
(unaudited)
|
|
|
| Shares |
| Value |
| |
COMMON STOCKS (95.4%) |
|
|
|
|
|
|
| |
Amusement & Recreation Services (2.9%) |
|
|
|
|
|
|
| |
Gaylord Entertainment Co. |
| ‡ |
| 125,340 |
| $ | 5,546 |
|
WMS Industries, Inc. |
| † |
| 104,435 |
| 3,264 |
| |
Apparel & Accessory Stores (2.3%) |
|
|
|
|
|
|
| |
Carter’s, Inc. |
| † |
| 42,395 |
| 2,856 |
| |
Citi Trends, Inc. |
| †‡ |
| 86,836 |
| 4,216 |
| |
Business Services (5.2%) |
|
|
|
|
|
|
| |
ACCO Brands Corp. |
| †‡ |
| 110,700 |
| 2,378 |
| |
Ctrip.com International, Ltd., ADR |
| †‡ |
| 67,400 |
| 3,033 |
| |
Focus Media Holding Ltd., ADR |
| † |
| 50,404 |
| 3,044 |
| |
Macquarie Infrastructure Co. Trust |
|
|
| 168,730 |
| 4,927 |
| |
NetEase.com, ADR |
| †‡ |
| 123,200 |
| 2,671 |
| |
Chemicals & Allied Products (1.0%) |
|
|
|
|
|
|
| |
Nuco2, Inc. |
| † |
| 103,335 |
| 2,960 |
| |
Communication (2.7%) |
|
|
|
|
|
|
| |
SBA Communications Corp. |
| † |
| 328,675 |
| 8,256 |
| |
Computer & Data Processing Services (7.6%) |
|
|
|
|
|
|
| |
Bankrate, Inc. |
| †‡ |
| 57,800 |
| 2,790 |
| |
CNET Networks, Inc. |
| † |
| 318,613 |
| 3,435 |
| |
Convera Corp. |
| †‡ |
| 125,300 |
| 990 |
| |
CoStar Group, Inc. |
| †‡ |
| 97,669 |
| 5,513 |
| |
IHS, Inc.-Class A |
| † |
| 212,038 |
| 6,005 |
| |
THQ, Inc. |
| † |
| 57,676 |
| 1,478 |
| |
Websense, Inc. |
| † |
| 124,700 |
| 3,100 |
| |
Computer & Office Equipment (1.0%) |
|
|
|
|
|
|
| |
3Com Corp. |
| † |
| 580,500 |
| 3,129 |
| |
Educational Services (4.2%) |
|
|
|
|
|
|
| |
Ambassadors Group, Inc. |
|
|
| 179,380 |
| 4,789 |
| |
Strayer Education, Inc. |
| ‡ |
| 76,410 |
| 7,946 |
| |
Electric, Gas & Sanitary Services (2.5%) |
|
|
|
|
|
|
| |
Stericycle, Inc. |
| † |
| 117,929 |
| 7,764 |
| |
Electronic & Other Electric Equipment (0.2%) |
|
|
|
|
|
|
| |
Spectrum Brands, Inc. |
| † |
| 38,218 |
| 633 |
| |
Electronic Components & Accessories (1.6%) |
|
|
|
|
|
|
| |
Tessera Technologies, Inc. |
| † |
| 153,505 |
| 4,923 |
| |
Engineering & Management Services (1.5%) |
|
|
|
|
|
|
| |
Grupo Aeroportuario del Pacifico SA de CV, ADR |
| † |
| 134,643 |
| 4,481 |
| |
Food & Kindred Products (1.1%) |
|
|
|
|
|
|
| |
Peet’s Coffee & Tea, Inc. |
| † ‡ |
| 111,425 |
| 3,470 |
| |
Food Stores (1.0%) |
|
|
|
|
|
|
| |
Pantry, Inc. (The) |
| † |
| 47,925 |
| 3,172 |
| |
Furniture & Fixtures (1.0%) |
|
|
|
|
|
|
| |
Select Comfort Corp. |
| †‡ |
| 79,400 |
| 3,173 |
| |
Industrial Machinery & Equipment (0.9%) |
|
|
|
|
|
|
| |
Middleby Corp. |
| † |
| 30,125 |
| 2,660 |
| |
Lumber & Other Building Materials (1.2%) |
|
|
|
|
|
|
| |
Beacon Roofing Supply, Inc. |
| † |
| 98,660 |
| 3,650 |
| |
Manufacturing Industries (1.0%) |
|
|
|
|
|
|
| |
Yankee Candle Co., Inc. |
|
|
| 101,410 |
| 3,056 |
| |
Medical Instruments & Supplies (4.0%) |
|
|
|
|
|
|
| |
American Medical Systems Holdings, Inc. |
| † |
| 133,310 |
| 2,961 |
| |
Hologic, Inc. |
| † |
| 42,100 |
| 2,007 |
| |
Techne Corp. |
| † |
| 126,858 |
| 7,188 |
| |
Oil & Gas Extraction (5.3%) |
|
|
|
|
|
|
| |
Cadence Resources Corp. |
| † |
| 274,400 |
| 1,624 |
| |
Delta Petroleum Corp. |
| †‡ |
| 105,900 |
| 2,121 |
| |
Gasco Energy, Inc. |
| †‡ |
| 501,795 |
| 2,810 |
| |
GMX Resources, Inc. |
| †‡ |
| 64,100 |
| 2,699 |
| |
Quicksilver Resources, Inc. |
| †‡ |
| 63,215 |
| 2,620 |
| |
Range Resources Corp. |
|
|
| 161,917 |
| 4,296 |
| |
Personal Services (1.8%) |
|
|
|
|
|
|
| |
Coinstar, Inc. |
| † |
| 84,885 |
| 2,315 |
| |
Steiner Leisure, Ltd. |
| † |
| 74,500 |
| 3,212 |
| |
113
TA IDEX Van Kampen Small Company Growth
SCHEDULE OF INVESTMENTS
At April 30, 2006
(all amounts except share amounts in thousands)
(unaudited)
Pharmaceuticals (5.9%) |
|
|
|
|
|
|
|
Adams Respiratory Therapeutics, Inc. |
| † |
| 62,237 |
| 2,669 |
|
Flamel Technologies, ADR |
| †‡ |
| 63,530 |
| 1,283 |
|
Idexx Laboratories, Inc. |
| † |
| 37,015 |
| 3,080 |
|
Medicis Pharmaceutical Corp.-Class A |
| ‡ |
| 235,000 |
| 7,727 |
|
Noven Pharmaceuticals, Inc. |
| † |
| 91,200 |
| 1,724 |
|
Visicu, Inc. |
| †‡ |
| 66,683 |
| 1,587 |
|
Primary Metal Industries (1.4%) |
|
|
|
|
|
|
|
Texas Industries, Inc. |
|
|
| 75,800 |
| 4,298 |
|
Printing & Publishing (0.7%) |
|
|
|
|
|
|
|
VistaPrint, Ltd. |
| † |
| 69,500 |
| 2,223 |
|
Real Estate (4.2%) |
|
|
|
|
|
|
|
Desarrolladora Homex SA de CV, ADR |
| † |
| 178,220 |
| 6,829 |
|
HouseValues, Inc. |
| †‡ |
| 172,360 |
| 1,587 |
|
Jones Lang Lasalle, Inc. |
|
|
| 53,370 |
| 4,524 |
|
Research & Testing Services (4.4%) |
|
|
|
|
|
|
|
Advisory Board Co. (The) |
| † |
| 161,880 |
| 9,085 |
|
Gen-Probe, Inc. |
| † |
| 79,814 |
| 4,268 |
|
Residential Building Construction (3.1%) |
|
|
|
|
|
|
|
Brookfield Homes Corp. |
| ‡ |
| 59,400 |
| 2,768 |
|
Meritage Homes Corp. |
| † |
| 53,600 |
| 3,515 |
|
Walter Industries, Inc. |
|
|
| 48,000 |
| 3,184 |
|
Restaurants (5.9%) |
|
|
|
|
|
|
|
AFC Enterprises |
| †‡ |
| 249,170 |
| 3,458 |
|
BJ’s Restaurants, Inc. |
| † |
| 166,870 |
| 4,394 |
|
Chipotle Mexican Grill, Inc.-Class A |
| †‡ |
| 86,400 |
| 4,509 |
|
PF Chang’s China Bistro, Inc. |
| †‡ |
| 132,955 |
| 5,665 |
|
Retail Trade (5.3%) |
|
|
|
|
|
|
|
Blue Nile, Inc. |
| †‡ |
| 183,300 |
| 6,379 |
|
Build-A-Bear Workshop, Inc. |
| †‡ |
| 144,285 |
| 4,660 |
|
CKX, Inc. |
| † |
| 183,585 |
| 2,590 |
|
Zumiez, Inc. |
| † |
| 81,000 |
| 2,632 |
|
Rubber & Misc. Plastic Products (1.1%) |
|
|
|
|
|
|
|
Deckers Outdoor Corp. |
| †‡ |
| 75,800 |
| 3,236 |
|
Security & Commodity Brokers (3.2%) |
|
|
|
|
|
|
|
Greenhill & Co., Inc. |
| ‡ |
| 135,953 |
| 9,642 |
|
Stone, Clay & Glass Products (1.0%) |
|
|
|
|
|
|
|
Eagle Materials, Inc. |
|
|
| 45,504 |
| 3,015 |
|
Telecommunications (2.8%) |
|
|
|
|
|
|
|
Equinix, Inc. |
| †‡ |
| 118,201 |
| 7,789 |
|
First Avenue Networks, Inc. |
| † |
| 67,004 |
| 701 |
|
Transportation Equipment (0.9%) |
|
|
|
|
|
|
|
Polaris Industries, Inc. |
|
|
| 54,300 |
| 2,601 |
|
Trucking & Warehousing (1.7%) |
|
|
|
|
|
|
|
Landstar System, Inc. |
|
|
| 125,625 |
| 5,338 |
|
Wholesale Trade Durable Goods (2.1%) |
|
|
|
|
|
|
|
SCP Pool Corp. |
|
|
| 138,510 |
| 6,471 |
|
Wholesale Trade Nondurable Goods (1.7%) |
|
|
|
|
|
|
|
Rocky Mountain Chocolate Factory, Inc. |
|
|
| 42,630 |
| 659 |
|
Tractor Supply Co. |
| † |
| 70,951 |
| 4,597 |
|
Total Common Stocks (cost: $256,034) |
|
|
|
|
| 291,848 |
|
|
|
|
| Principal |
| Value |
|
SECURITY LENDING COLLATERAL (25.6%) |
|
|
|
|
|
|
|
Debt (23.9%) |
|
|
|
|
|
|
|
Bank Notes (3.0%) |
|
|
|
|
|
|
|
Bank of America |
|
|
|
|
|
|
|
4.81%, due 06/07/2006 |
| * |
| 2,565 |
| 2,565 |
|
4.81%, due 08/10/2006 |
| * |
| 2,476 |
| 2,476 |
|
Bear Stearns & Co. |
|
|
|
|
|
|
|
5.01%, due 06/06/2006 |
| * |
| 990 |
| 990 |
|
5.01%, due 09/07/2006 |
| * |
| 2,971 |
| 2,971 |
|
Certificates Of Deposit (1.6%) |
|
|
|
|
|
|
|
Halifax Bank of Scotland |
|
|
|
|
|
|
|
114
TA IDEX Van Kampen Small Company Growth
SCHEDULE OF INVESTMENTS
At April 30, 2006
(all amounts except share amounts in thousands)
(unaudited)
4.78%, due 06/06/2006 |
| * |
| 2,476 |
| 2,476 |
|
Rabobank Nederland |
|
|
|
|
|
|
|
4.87%, due 05/31/2006 |
| * |
| 2,476 |
| 2,476 |
|
Commercial Paper (1.3%) |
|
|
|
|
|
|
|
Banco Santander Central Hispano SA |
|
|
|
|
|
|
|
4.77%, due 05/02/2006 |
|
|
| 1,485 |
| 1,485 |
|
Sheffield Receivables Corp.-144A |
|
|
|
|
|
|
|
4.81%, due 05/03/2006 |
|
|
| 2,472 |
| 2,472 |
|
Euro Dollar Overnight (4.3%) |
|
|
|
|
|
|
|
Bank of Montreal |
|
|
|
|
|
|
|
4.77%, due 05/02/2006 |
|
|
| 1,980 |
| 1,980 |
|
Dexia Group |
|
|
|
|
|
|
|
4.78%, due 05/04/2006 |
|
|
| 2,476 |
| 2,476 |
|
Fortis Bank |
|
|
|
|
|
|
|
4.77%, due 05/01/2006 |
|
|
| 990 |
| 990 |
|
Royal Bank of Canada |
|
|
|
|
|
|
|
4.77%, due 05/01/2006 |
|
|
| 3,466 |
| 3,466 |
|
Royal Bank of Scotland |
|
|
|
|
|
|
|
4.75%, due 05/03/2006 |
|
|
| 2,475 |
| 2,475 |
|
Svenska Handlesbanken |
|
|
|
|
|
|
|
4.82%, due 05/01/2006 |
|
|
| 1,891 |
| 1,891 |
|
Euro Dollar Terms (6.6%) |
|
|
|
|
|
|
|
BancoBilbao Vizcaya Argentaria SA |
|
|
|
|
|
|
|
4.95%, due 06/20/2006 |
|
|
| 1,980 |
| 1,980 |
|
Bank of the West |
|
|
|
|
|
|
|
4.94%, due 06/16/2006 |
|
|
| 1,980 |
| 1,980 |
|
Barclays |
|
|
|
|
|
|
|
4.79%, due 05/10/2006 |
|
|
| 2,971 |
| 2,971 |
|
4.77%, due 05/16/2006 |
|
|
| 990 |
| 990 |
|
Canadian Imperial Bank of Commerce |
|
|
|
|
|
|
|
4.97%, due 06/23/2006 |
|
|
| 1,485 |
| 1,485 |
|
Credit Suisse First Boston Corp. |
|
|
|
|
|
|
|
4.73%, due 05/08/2006 |
|
|
| 1,485 |
| 1,485 |
|
Fortis Bank |
|
|
|
|
|
|
|
4.83%, due 05/08/2006 |
|
|
| 990 |
| 990 |
|
Lloyds TSB Bank |
|
|
|
|
|
|
|
4.81%, due 05/11/2006 |
|
|
| 1,485 |
| 1,485 |
|
Royal Bank of Scotland |
|
|
|
|
|
|
|
4.87%, due 05/12/2006 |
|
|
| 1,980 |
| 1,980 |
|
Societe Generale |
|
|
|
|
|
|
|
4.79%, due 05/10/2006 |
|
|
| 2,475 |
| 2,475 |
|
UBS AG |
|
|
|
|
|
|
|
4.95%, due 06/20/2006 |
|
|
| 2,475 |
| 2,475 |
|
Repurchase Agreements (7.1%) |
| †† |
|
|
|
|
|
Credit Suisse First Boston Corp. 4.92%, dated 04/28/2006 to be repurchased at $3,363 on 05/01/2006 |
|
|
| 3,362 |
| 3,362 |
|
Goldman Sachs Group, Inc. (The) 4.92%, dated 04/28/2006 to be repurchased at $7,276 on 05/01/2006 |
|
|
| 7,273 |
| 7,273 |
|
Lehman Brothers, Inc. 4.92%, dated 04/28/2006 to be repurchased at $123 on 05/01/2006 |
|
|
| 123 |
| 123 |
|
Merrill Lynch & Co. 4.87%, dated 04/28/2006 to be repurchased at $7,429 on 05/01/2006 |
|
|
| 7,426 |
| 7,426 |
|
Morgan Stanley Dean Witter & Co. 4.93%, dated 04/28/2006 to be repurchased at $3,467 on 05/01/2006 |
|
|
| 3,466 |
| 3,466 |
|
115
TA IDEX Van Kampen Small Company Growth
SCHEDULE OF INVESTMENTS
At April 30, 2006
(all amounts except share amounts in thousands)
(unaudited)
|
|
|
| Shares |
| Value |
| |
Investment Companies (1.7%) |
|
|
|
|
|
|
| |
Barclays Global Investors Institutional Money Market Fund |
|
|
|
|
|
|
| |
1-day yield of 4.78% |
|
|
| 3,960,762 |
| 3,961 |
| |
Merrimac Cash Fund, Premium Class |
|
|
|
|
|
|
| |
1-day yield of 4.61% |
| @ |
| 1,053,823 |
| 1,054 |
| |
Total Security Lending Collateral (cost: $78,150) |
|
|
|
|
| 78,150 |
| |
Total Investment Securities (cost: $334,184) |
| # |
|
|
| $ | 369,998 |
|
The notes to the financial statements are an integral part of this report.
NOTES TO SCHEDULE OF INVESTMENTS:
† Non-income producing.
‡ At April 30, 2006, all or a portion of this security is on loan (see Note 1). The value at April 30, 2006, of all securities on loan is $75,351.
* Floating or variable rate note. Rate is listed as of April 30, 2006.
†† Cash collateral for the Repurchase Agreements, valued at $22,287, that serve as collateral for securities lending are invested in corporate bonds with interest rates and maturity dates ranging from 0.00% - 9.05% and 05/02/2006 - 12/31/2049, respectively.
@ Regulated investment company advised by Investors Bank and Trust Co. (“IBT”). IBT is also the accounting, custody and lending agent for the Fund.
# Aggregate cost for Federal income tax purposes is $334,475. Aggregate gross unrealized appreciation for all securities in which there is an excess of value over tax cost and aggregate gross unrealized depreciation for all securities in which there is an excess of tax cost over value were $40,007 and $4,484, respectively. Net unrealized appreciation for tax purposes is $35,523.
144A 144A Securities are registered pursuant to Rule 144A of the Securities Act of 1933. These securities are deemed to be liquid for purposes of compliance limitations on holdings of illiquid securities and may be resold as transactions exempt from registration, normally to qualified institutional buyers. At April 30, 2006, these securities aggregated $2,472 or 0.8% of the net assets of the Fund.
ADR American Depositary Receipt
116
TA IDEX AllianceBernstein International Value
STATEMENT OF ASSETS AND LIABILITIES
At April 30, 2006
(all amounts except per share amounts in thousands)
(unaudited)
Assets: |
|
|
| |
Investment securities, at value (cost: $183,352) (including securities loaned of $2,360) |
| $ | 209,754 |
|
Cash |
| 11,251 |
| |
Foreign currency (cost: $4,141) |
| 4,178 |
| |
Receivables: |
|
|
| |
Investment securities sold |
| 22 |
| |
Shares of beneficial interest sold |
| 1,375 |
| |
Interest |
| 18 |
| |
Dividends |
| 907 |
| |
Dividend reclaims receivable |
| 16 |
| |
|
| 227,521 |
| |
Liabilities: |
|
|
| |
Investment securities purchased |
| 8,169 |
| |
Accounts payable and accrued liabilities: |
|
|
| |
Management and advisory fees |
| 139 |
| |
Administration fees |
| 3 |
| |
Payable for collateral for securities on loan |
| 2,482 |
| |
Unrealized depreciation on forward foreign currency contracts |
| 160 |
| |
Other |
| 18 |
| |
|
| 10,971 |
| |
Net Assets |
| $ | 216,550 |
|
Net Assets Consist of: |
|
|
| |
|
|
|
| |
Shares of beneficial interest, unlimited shares authorized, no par value |
| 187,802 |
| |
Distributable net investment income (loss) |
| 837 |
| |
Accumulated net realized gain (loss) from investment securities and foreign currency transactions |
| 1,652 |
| |
Net unrealized appreciation (depreciation) on: |
|
|
| |
Investment securities |
| 26,402 |
| |
Translation of assets and liabilites denominated in foreign currencies |
| (143 | ) | |
Net Assets |
| $ | 216,550 |
|
|
|
|
| |
Shares Outstanding |
| 18,196 |
| |
|
|
|
| |
Net Asset Value and Offering Price Per Share |
| $ | 11.90 |
|
The notes to the financial statements are an integral part of this report.
117
TA IDEX AllianceBernstein International Value
STATEMENT OF OPERATIONS
For the period ended April 30, 2006 (a)
(all amounts in thousands)
(unaudited)
Investment Income: |
|
|
| |
Dividends (net of withholding taxes on foreign dividends of $100) |
| $ | 1,509 |
|
Interest |
| 126 |
| |
Income from loaned securities-net |
| 1 |
| |
|
| 1,636 |
| |
Expenses: |
|
|
| |
Management and advisory fees |
| 572 |
| |
Custody fees |
| 53 |
| |
Administration fees |
| 13 |
| |
Legal fees |
| 3 |
| |
Audit fees |
| 8 |
| |
Trustees fees |
| 2 |
| |
Registration fees |
| 2 |
| |
Other |
| 2 |
| |
|
|
|
| |
Total expenses |
| 655 |
| |
Net Investment Income (Loss) |
| 981 |
| |
Net Realized Gain (Loss) from: |
|
|
| |
Investment securities |
| 1,392 |
| |
Foreign currency transactions |
| 260 |
| |
|
| 1,652 |
| |
Net Increase (Decrease) in Unrealized Appreciation (Depreciation) on: |
|
|
| |
Investment securities |
| 26,402 |
| |
Translation of assets and liabilities denominated in foreign currencies |
| (143 | ) | |
|
| 26,259 |
| |
Net Realized and Unrealized Gain (Loss) on Investment Securities and Foreign Currency Transactions |
| 27,911 |
| |
|
|
|
| |
Net Increase (Decrease) in Net Assets Resulting from Operations |
| $ | 28,892 |
|
(a) Commenced operations on December 6, 2005.
The notes to the financial statements are an integral part of this report.
118
TA IDEX AllianceBernstein International Value
STATEMENT OF CHANGES IN NET ASSETS
For the period ended
(all amounts in thousands)
|
| April 30, |
| |
|
| 2006 |
| |
|
| (unaudited) (a) |
| |
Increase (Decrease) in Net Assets From: |
|
|
| |
Operations: |
|
|
| |
Net investment income (loss) |
| $ | 981 |
|
Net realized gain (loss) from investment securities and foreign currency transactions |
| 1,652 |
| |
Change in unrealized appreciation (depreciation) on investment securities and foreign currency translation |
| 26,259 |
| |
|
| 28,892 |
| |
Distributions to Shareholders: |
|
|
| |
From net investment income: |
|
|
| |
|
| (144 | ) | |
Capital Share Transactions: |
|
|
| |
Proceeds from shares sold: |
|
|
| |
|
| 187,658 |
| |
Dividends and distributions reinvested: |
|
|
| |
|
| 144 |
| |
|
| 187,802 |
| |
Net increase (decrease) in net assets |
| 216,550 |
| |
Net Assets: |
|
|
| |
Beginning of period |
| — |
| |
End of period |
| $ | 216,550 |
|
Distributable Net Investment Income (Loss) |
| $ | 837 |
|
Share Activity: |
|
|
| |
Shares issued: |
|
|
| |
|
| 18,182 |
| |
Shares issued-reinvested from distributions: |
|
|
| |
|
| 14 |
| |
Net increase (decrease) in shares outstanding: |
|
|
| |
|
| 18,196 |
| |
(a) Commenced operations on December 6, 2005.
The notes to the financial statements are an integral part of this report.
119
TA IDEX AllianceBernstein International Value
FINANCIAL HIGHLIGHTS
(unaudited)
|
| For a share of beneficial interest outstanding throughout each period |
| ||||||||||||||||||||||
|
| Net Asset |
| Investment Operations |
| Distributions |
| Net Asset |
| ||||||||||||||||
|
| Value, |
| Net |
| Net Realized |
|
|
| From Net |
| From Net |
|
|
| Value, |
| ||||||||
|
| Beginning |
| Investment |
| and Unrealized |
| Total |
| Investment |
| Realized |
| Total |
| End |
| ||||||||
For the Period Ended(d)(e) |
| of Period |
| Income (Loss) |
| Gain (Loss) |
| Operations |
| Income |
| Gains |
| Distributions |
| of Period |
| ||||||||
4/30/2006 |
| $ | 10.00 |
| $ | 0.07 |
| $ | 1.84 |
| $ | 1.91 |
| $ | (0.01 | ) | $ | — |
| $ | (0.01 | ) | $ | 11.90 |
|
|
|
|
| Ratios/Supplemental Data |
| |||||||
|
|
|
| Net Assets, |
|
|
| Net Investment |
|
|
| |
|
|
|
| End of |
| Ratio of Expenses |
| Income (Loss) |
| Portfolio |
| |
|
| Total |
| Period |
| to Average |
| to Average |
| Turnover |
| |
For the Period Ended(e) |
| Return(c) |
| (000’s) |
| Net Assets(a) |
| Net Assets(a) |
| Rate(b) |
| |
4/30/2006 |
| 19.16 | % | $ | — |
| 1.01 | % | 1.51 | % | 13 | % |
NOTES TO FINANCIAL HIGHLIGHTS
(a) Annualized.
(b) Not annualized.
(c) Total Return has been calculated for the applicable period without deduction of a sales load, if any, on an initial purchase. Not annualized.
(d) Per share information is calculated based on average number of shares outstanding.
(e) TA IDEX AllianceBernstein International Value (“the Fund”) commenced operations on December 6, 2005.
The notes to the financial statements are an integral part of this report.
120
TA IDEX Evergreen International Small Cap
STATEMENT OF ASSETS AND LIABILITIES
At April 30, 2006
(all amounts except per share amounts in thousands)
(unaudited)
Assets: |
|
|
| |
Investment securities, at value (cost: $364,258) |
| $ | 477,459 |
|
Cash |
| 15,575 |
| |
Foreign currency (cost: $1,272) |
| 1,270 |
| |
Receivables: |
|
|
| |
Investment securities sold |
| 11,183 |
| |
Shares of beneficial interest sold |
| 789 |
| |
Interest |
| 47 |
| |
Dividends |
| 1,019 |
| |
Dividend reclaims receivable |
| 78 |
| |
|
| 507,420 |
| |
|
|
|
| |
Liabilities: |
|
|
| |
Investment securities purchased |
| 15,437 |
| |
Accounts payable and accrued liabilities: |
|
|
| |
Shares of beneficial interest redeemed |
| 7 |
| |
Management and advisory fees |
| 362 |
| |
Administration fees |
| 7 |
| |
Payable for collateral for securities on loan |
| 32,438 |
| |
Other |
| 45 |
| |
|
| 48,296 |
| |
Net Assets |
| $ | 459,124 |
|
Net Assets Consist of: |
|
|
| |
|
|
|
| |
Shares of beneficial interest, unlimited shares authorized, no par value |
| 309,607 |
| |
Distributable net investment income (loss) |
| 1,065 |
| |
Accumulated net realized gain (loss) from investment securities and foreign currency transactions |
| 35,232 |
| |
Net unrealized appreciation (depreciation) on: |
|
|
| |
Investment securities |
| 113,201 |
| |
Translation of assets and liabilites denominated in foreign currencies |
| 19 |
| |
Net Assets |
| $ | 459,124 |
|
|
|
|
| |
Shares Outstanding |
| 27,558 |
| |
|
|
|
| |
Net Asset Value and Offering Price Per Share |
| $ | 16.66 |
|
The notes to the financial statements are an integral part of this report.
121
TA IDEX Evergreen International Small Cap
STATEMENT OF OPERATIONS
For the period ended April 30, 2006
(all amounts in thousands)
(unaudited)
Investment Income: |
|
|
| |
Dividends (net of withholding taxes on foreign dividends of $176) |
| 3,060 |
| |
Interest |
| $ | 120 |
|
Income from loaned securities-net |
| 83 |
| |
|
| 3,263 |
| |
|
|
|
| |
Expenses: |
|
|
| |
Management and advisory fees |
| 1,976 |
| |
Distribution and service fees: |
|
|
| |
Class A |
| 18 |
| |
Custody fees |
| 136 |
| |
Administration fees |
| 38 |
| |
Legal fees |
| 9 |
| |
Audit fees |
| 9 |
| |
Trustees fees |
| 7 |
| |
Registration fees |
| 1 |
| |
Other |
| 4 |
| |
Total expenses |
| 2,198 |
| |
Net Investment Income (Loss) |
| 1,065 |
| |
Net Realized Gain (Loss) from: |
|
|
| |
Investment securities |
| 35,552 |
| |
Foreign currency transactions |
| 19 |
| |
|
| 35,571 |
| |
Net Increase (Decrease) in Unrealized Appreciation (Depreciation) on: |
|
|
| |
Investment securities |
| 79,258 |
| |
Translation of assets and liabilities denominated in foreign currencies |
| 35 |
| |
|
| 79,293 |
| |
|
|
|
| |
Net Realized and Unrealized Gain (Loss) on Investment Securities and Foreign Currency Transactions |
| 114,864 |
| |
|
|
|
| |
Net Increase (Decrease) in Net Assets Resulting from Operations |
| $ | 115,929 |
|
The notes to the financial statements are an integral part of this report.
122
TA IDEX Evergreen International Small Cap
STATEMENTS OF CHANGES IN NET ASSETS
For the periods ended
(all amounts in thousands)
|
| April 30, |
|
|
| ||
|
| 2006 |
| October 31, |
| ||
|
| (unaudited) |
| 2005 (a) |
| ||
Increase (Decrease) in Net Assets From: |
|
|
|
|
| ||
Operations: |
|
|
|
|
| ||
Net investment income (loss) |
| $ | 1,065 |
| $ | 1,209 |
|
Net realized gain (loss) from investment securities and foreign currency transactions |
| 35,571 |
| 10,112 |
| ||
Change in unrealized appreciation (depreciation) on investment securities and foreign currency translation |
| 79,293 |
| 33,927 |
| ||
|
| 115,929 |
| 45,248 |
| ||
Distributions to Shareholders: |
|
|
|
|
| ||
From net investment income: |
|
|
|
|
| ||
Class I |
| (823 | ) | — |
| ||
|
| (823 | ) | — |
| ||
From net realized gains: |
|
|
|
|
| ||
Class I |
| (10,837 | ) | — |
| ||
|
| (10,837 | ) | — |
| ||
|
|
|
|
|
| ||
Capital Share Transactions: |
|
|
|
|
| ||
Proceeds from shares sold: |
|
|
|
|
| ||
Class A |
| — |
| 114,354 |
| ||
Class I |
| 159,886 |
| 170,953 |
| ||
|
| 159,886 |
| 285,307 |
| ||
Dividends and distributions reinvested: |
|
|
|
|
| ||
Class I |
| 11,660 |
| — |
| ||
|
| 11,660 |
| — |
| ||
Cost of shares redeemed: |
|
|
|
|
| ||
Class A |
| (127,067 | ) | — |
| ||
Class I |
| (20,179 | ) | — |
| ||
|
| (147,246 | ) | — |
| ||
|
| 24,300 |
| 285,307 |
| ||
Net increase (decrease) in net assets |
| 128,569 |
| 330,555 |
| ||
Net Assets: |
|
|
|
|
| ||
Beginning of period |
| 330,555 |
| — |
| ||
End of period |
| $ | 459,124 |
| $ | 330,555 |
|
Distributable Net Investment Income (Loss) |
| $ | 1,065 |
| $ | 823 |
|
|
|
|
|
|
| ||
Share Activity: |
|
|
|
|
| ||
Shares issued: |
|
|
|
|
| ||
Class A |
| — |
| 9,945 |
| ||
Class I |
| 12,083 |
| 16,080 |
| ||
|
| 12,083 |
| 26,025 |
| ||
Shares issued-reinvested from distributions: |
|
|
|
|
| ||
Class I |
| 865 |
| — |
| ||
|
| 865 |
| — |
| ||
Shares redeemed: |
|
|
|
|
| ||
Class A |
| (9,945 | ) | — |
| ||
Class I |
| (1,470 | ) | — |
| ||
|
| (11,415 | ) | — |
| ||
Net increase (decrease) in shares outstanding: |
|
|
|
|
| ||
Class A |
| (9,945 | ) | 9,945 |
| ||
Class I |
| 11,478 |
| 16,080 |
| ||
|
| 1,533 |
| 26,025 |
| ||
(a) Commenced operations on November 8, 2004. The inception date for the offering of share Class A was March 1, 2005.
The notes to the financial statements are an integral part of this report.
123
TA IDEX Evergreen International Small Cap
FINANCIAL HIGHLIGHTS
(unaudited for the period ended April 30, 2006)
|
| For a share of beneficial interest outstanding throughout each period |
| ||||||||||||||
|
| Net Asset |
| Investment Operations |
| Distributions |
| Net Asset |
| ||||||||
|
| Value, |
| Net |
| Net Realized |
|
|
| From Net |
| From Net |
|
|
| Value, |
|
|
| Beginning |
| Investment |
| and Unrealized |
| Total |
| Investment |
| Realized |
| Total |
| End |
|
For the Period Ended(d)(e) |
| of Period |
| Income (Loss) |
| Gain (Loss) |
| Operations |
| Income |
| Gains |
| Distributions |
| of Period |
|
4/30/2006 |
| 12.71 |
| 0.34 |
| 4.37 |
| 4.41 |
| (0.03 | ) | (0.43 | ) | (0.46 | ) | 16.66 |
|
10/31/2005 |
| 10.00 |
| 0.36 |
| 2.65 |
| 2.71 |
| — |
| — |
| — |
| 12.71 |
|
|
|
|
| Ratios/Supplemental Data |
| ||||||
|
|
|
| Net Assets, |
|
|
| Net Investment |
|
|
|
|
|
|
| End of |
| Ratio of Expenses |
| Income (Loss) |
| Portfolio |
|
|
| Total |
| Period |
| to Average |
| to Average |
| Turnover |
|
For the Period Ended(e) |
| Return(c) |
| (000’s) |
| Net Assets(a) |
| Net Assets(a) |
| Rate(b) |
|
4/30/2006 |
| 35.58 |
| 459,124 |
| 3.15 |
| 0.59 |
| 45 |
|
10/31/2005 |
| 27.10 |
| 204,413 |
| 3.22 |
| 0.56 |
| 65 |
|
NOTES TO FINANCIAL HIGHLIGHTS
(a) Annualized.
(b) Not annualized.
(c) Total Return has been calculated for the applicable period without deduction of a sales load, if any, on an initial purchase. Not annualized.
(d) Per share information is calculated based on average number of shares outstanding.
(e) TA IDEX AllianceBernstein International Value (“the Fund”) commenced operations on December 6, 2005.
The notes to the financial statements are an integral part of this report.
124
TA IDEX Federated Market Opportunity
STATEMENT OF ASSETS AND LIABILITIES
At April 30, 2006
(all amounts except per share amounts in thousands)
(unaudited)
Assets: |
|
|
| |
Investment securities, at value (cost: $63,494) |
| $ | 64,548 |
|
Cash |
| 11,159 |
| |
Foreign currency (cost: $291) |
| 290 |
| |
Receivables: |
|
|
| |
Investment securities sold |
| 742 |
| |
Interest |
| 375 |
| |
Dividends |
| 98 |
| |
Dividend reclaims receivable |
| 16 |
| |
|
| 77,228 |
| |
Liabilities: |
|
|
| |
Investment securities purchased |
| 202 |
| |
Accounts payable and accrued liabilities: |
|
|
| |
Management and advisory fees |
| 49 |
| |
Administration fees |
| 1 |
| |
Other |
| 32 |
| |
|
| 284 |
| |
Net Assets |
| $ | 76,944 |
|
Net Assets Consist of: |
|
|
| |
Shares of beneficial interest, unlimited shares authorized, no par value |
| 75,510 |
| |
Distributable net investment income (loss) |
| 187 |
| |
Accumulated net realized gain (loss) from investment securities and foreign currency transactions |
| 193 |
| |
Net unrealized appreciation (depreciation) on investment securities |
| 1,054 |
| |
Net Assets |
| $ | 76,944 |
|
|
|
|
| |
Shares Outstanding |
| 7,564 |
| |
|
|
|
| |
Net Asset Value and Offering Price Per Share |
| $ | 10.17 |
|
The notes to the financial statements are an integral part of this report.
125
TA IDEX Federated Market Opportunity
STATEMENT OF OPERATIONS
For the period ended April 30, 2006 (a)
(all amounts in thousands)
(unaudited)
Investment Income: |
|
|
| |
Interest |
| $ | 876 |
|
Dividends (net of withholding taxes on foreign dividends of $21) |
| 433 |
| |
|
| 1,309 |
| |
Expenses: |
|
|
| |
Management and advisory fees |
| 233 |
| |
Custody fees |
| 26 |
| |
Administration fees |
| 6 |
| |
Legal fees |
| 2 |
| |
Audit fees |
| 8 |
| |
Trustees fees |
| 1 |
| |
Registration fees |
| 1 |
| |
Other |
| 1 |
| |
Total expenses |
| 278 |
| |
Net Investment Income (Loss) |
| 1,031 |
| |
Net Realized Gain (Loss) from: |
|
|
| |
Investment securities |
| 291 |
| |
Foreign currency transactions |
| (98 | ) | |
|
| 193 |
| |
|
|
|
| |
Increase (decrease) in unrealized appreciation (depreciation) on investment securities |
| 1,054 |
| |
|
|
|
| |
Net Realized and Unrealized Gain (Loss) on Investment Securities and Foreign Currency Transactions |
| 1,247 |
| |
|
|
|
| |
Net Increase (Decrease) in Net Assets Resulting from Operations |
| $ | 2,278 |
|
(a) Commenced operations on December 6, 2005
The notes to the financial statements are an integral part of this report.
126
TA IDEX Federated Market Opportunity
STATEMENT OF CHANGES IN NET ASSETS
For the period ended
(all amounts in thousands)
|
| April 30, |
| |
|
| 2006 |
| |
|
| (unaudited) (a) |
| |
Increase (Decrease) in Net Assets From: |
|
|
| |
Operations: |
|
|
| |
Net investment income (loss) |
| $ | 1,031 |
|
Net realized gain (loss) from investment securities and foreign currency transactions |
| 193 |
| |
Change in unrealized appreciation (depreciation) on investment securities |
| 1,054 |
| |
|
| 2,278 |
| |
Distributions to Shareholders: |
|
|
| |
From net investment income: |
| (844) |
| |
|
|
|
| |
Capital Share Transactions: |
|
|
| |
Proceeds from shares sold: |
| 80,516 |
| |
|
|
|
| |
Dividends and distributions reinvested: |
| 844 |
| |
|
|
|
| |
Cost of shares redeemed: |
| (5,850) |
| |
|
| 75,510 |
| |
|
| 76,944 |
| |
Net increase (decrease) in net assets |
|
|
| |
Net Assets: |
| — |
| |
Beginning of period |
| $ | 76,944 |
|
End of period |
| $ | 187 |
|
Distributable Net Investment Income (Loss) |
|
|
| |
Share Activity: |
|
|
| |
Shares issued: |
| 8,062 |
| |
|
|
|
| |
Shares issued-reinvested from distributions: |
| 85 |
| |
|
|
|
| |
Shares redeemed: |
| (583) |
| |
|
|
|
| |
Net increase (decrease) in shares outstanding: |
| 7,564 |
| |
(a) Commenced operations on December 6, 2005
The notes to the financial statements are an integral part of this report.
127
TA IDEX Federated Market Opportunity
FINANCIAL HIGHLIGHTS
(unaudited)
|
| For a share of beneficial interest outstanding throughout each period |
| ||||||||||||||||||||||
|
| Net Asset |
| Investment Operations |
| Distributions |
| Net Asset |
| ||||||||||||||||
|
| Value, |
| Net |
| Net Realized |
|
|
| From Net |
| From Net |
|
|
| Value, |
| ||||||||
|
| Beginning |
| Investment |
| and Unrealized |
| Total |
| Investment |
| Realized |
| Total |
| End |
| ||||||||
For the Period Ended(d)(e) |
| of Period |
| Income (Loss) |
| Gain (Loss) |
| Operations |
| Income |
| Gains |
| Distributions |
| of Period |
| ||||||||
4/30/2006 |
| $ | 10.00 |
| $ | 0.14 |
| $ | 0.15 |
| $ | 0.29 |
| $ | (0.12 | ) | $ | — |
| $ | (0.12 | ) | $ | 10.17 |
|
|
|
|
| Ratios/Supplemental Data |
| |||||||
|
|
|
| Net Assets, |
|
|
| Net Investment |
|
|
| |
|
|
|
| End of |
| Ratio of Expenses |
| Income (Loss) |
| Portfolio |
| |
|
| Total |
| Period |
| to Average |
| to Average |
| Turnover |
| |
For the Period Ended(e) |
| Return(c) |
| (000’s) |
| Net Assets(a) |
| Net Assets(a) |
| Rate(b) |
| |
4/30/2006 |
| 2.90 | % | $ | 76,944 |
| 0.94 | % | 3.48 | % | 14 | % |
NOTES TO FINANCIAL HIGHLIGHTS
(a) Annualized.
(b) Not annualized.
(c) Total Return has been calculated for the applicable period without deduction of a sales load, if any, on an initial purchase. Not annualized.
(d) Per share information is calculated based on average number of shares outstanding.
(e) TA IDEX Federated Market Opportunity (“the Fund”) commenced operations on December 6, 2005.
The notes to the financial statements are an integral part of this report.
128
TA IDEX JPMorgan International Bond
STATEMENT OF ASSETS AND LIABILITIES
At April 30, 2006
(all amounts except per share amounts in thousands)
(unaudited)
Assets: |
|
|
| |
Investment securities, at value (cost: $390,772) |
| $ | 397,368 |
|
Cash |
| 3,658 |
| |
Foreign currency (cost: $1,617) |
| 1,642 |
| |
Receivables: |
|
|
| |
Investment securities sold |
| 49,476 |
| |
Shares of beneficial interest sold |
| 1,373 |
| |
Interest |
| 4,061 |
| |
Unrealized appreciation on forward foreign currency contracts |
| 6,160 |
| |
|
| 463,738 |
| |
|
|
|
| |
Liabilities: |
|
|
| |
Investment securities purchased |
| 52,619 |
| |
Accounts payable and accrued liabilities: |
|
|
| |
Management and advisory fees |
| 158 |
| |
Administration fees |
| 6 |
| |
Unrealized depreciation on forward foreign currency contracts |
| 7,506 |
| |
Variation margin |
| 20 |
| |
Other |
| 36 |
| |
|
| 60,345 |
| |
Net Assets |
| $ | 403,393 |
|
Net Assets Consist of: |
|
|
| |
|
|
|
| |
Shares of beneficial interest, unlimited shares authorized, no par value |
| 396,373 |
| |
Distributable net investment income (loss) |
| 380 |
| |
Accumulated net realized gain (loss) from investment securities, futures contracts and foreign currency transactions |
| 1,005 |
| |
Net unrealized appreciation (depreciation) on: |
|
|
| |
Investment securities |
| 6,596 |
| |
Futures contracts |
| 105 |
| |
Translation of assets and liabilites denominated in foreign currencies |
| (1,066 | ) | |
Net Assets |
| $ | 403,393 |
|
|
|
|
| |
Shares Outstanding |
| 38,958 |
| |
|
|
|
| |
Net Asset Value and Offering Price Per Share |
| $ | 10.35 |
|
The notes to the financial statements are an integral part of this report.
129
TA IDEX JPMorgan International Bond
STATEMENT OF OPERATIONS
For the period ended April 30, 2006(a)
(all amounts in thousands)
(unaudited)
Investment Income: |
|
|
| |
Interest |
| $ | 2,385 |
|
|
|
|
| |
Expenses: |
|
|
| |
Management and advisory fees |
| 429 |
| |
Custody fees |
| 87 |
| |
Administration fees |
| 16 |
| |
Legal fees |
| 2 |
| |
Audit fees |
| 8 |
| |
Trustees fees |
| 2 |
| |
Registration fees |
| 2 |
| |
Other |
| 2 |
| |
Total expenses |
| 548 |
| |
Net Investment Income (Loss) |
| 1,837 |
| |
Net Realized Gain (Loss) from: |
|
|
| |
Investment securities |
| 802 |
| |
Futures contracts |
| 326 |
| |
Foreign currency transactions |
| (123 | ) | |
|
| 1,005 |
| |
Net Increase (Decrease) in Unrealized Appreciation (Depreciation) on: |
|
|
| |
Investment securities |
| 6,596 |
| |
Futures contracts |
| 105 |
| |
Translation of assets and liabilities denominated in foreign currencies |
| (1,066 | ) | |
|
| 5,635 |
| |
|
|
|
| |
Net Realized and Unrealized Gain (Loss) on Investment Securities, Futures Contracts and Foreign Currency Transactions |
| 6,640 |
| |
|
|
|
| |
Net Increase (Decrease) in Net Assets Resulting from Operations |
| $ | 8,477 |
|
(a) Commenced operations on December 6, 2005.
The notes to the financial statements are an integral part of this report.
130
TA IDEX JPMorgan International Bond
STATEMENT OF CHANGES IN NET ASSETS
For the period ended
(all amounts in thousands)
|
| April 30, |
| |
|
|
|
| |
Increase (Decrease) in Net Assets From: |
|
|
| |
Operations: |
|
|
| |
Net investment income (loss) |
| $ | 1,837 |
|
|
|
|
| |
Net realized gain (loss) from investment securities, futures contracts and foreign currency transactions |
| 1,005 |
| |
|
|
|
| |
Change in unrealized appreciation (depreciation) on investment securities, futures contracts and foreign currency translation |
| 5,635 |
| |
|
| 8,477 |
| |
Distributions to Shareholders: |
|
|
| |
From net investment income: |
|
|
| |
|
| (1,457) |
| |
|
|
|
| |
Capital Share Transactions: |
|
|
| |
Proceeds from shares sold: |
|
|
| |
|
| 394,916 |
| |
Dividends and distributions reinvested: |
|
|
| |
|
| 1,457 |
| |
|
| 396,373 |
| |
Net increase (decrease) in net assets |
| 403,393 |
| |
Net Assets: |
|
|
| |
Beginning of period |
| — |
| |
End of period |
| $ | 403,393 |
|
Distributable Net Investment Income (Loss) |
| $ | 380 |
|
|
|
|
| |
Share Activity: |
|
|
| |
Shares issued: |
|
|
| |
|
| 38,814 |
| |
Shares issued-reinvested from distributions: |
|
|
| |
|
| 144 |
| |
Net increase (decrease) in shares outstanding: |
|
|
| |
|
| 38,958 |
| |
(a) Commenced operations on December 6, 2005.
The notes to the financial statements are an integral part of this report.
131
TA IDEX JPMorgan International Bond
FINANCIAL HIGHLIGHTS
(unaudited)
|
|
|
| For a share of beneficial interest outstanding throughout each period |
| ||||||||||||||||||||
|
|
|
| Investment Operations |
| Distributions |
|
|
| ||||||||||||||||
For the Period Ended(d)(e) |
| Net Asset |
| Net |
| Net Realized |
| From Net |
| From Net |
| Realized |
| Total |
| Net Asset |
| ||||||||
4/30/2006 |
| $ | 10.00 |
| $ | 0.09 |
| $ | 0.34 |
| $ | 0.43 |
| $ | (0.08 | ) | $ | — |
| $ | (0.08 | ) | $ | 10.35 |
|
|
|
|
| Ratios/Supplemental Data |
| |||||||
For the Period Ended(e) |
| Total |
| Net Assets, |
| Ratio of |
| Net Investment |
| Portfolio |
| |
4/30/2006 |
| 4.33 | % | $ | 403,393 |
| 0.68 | % | 2.28 | % | 123 | % |
(a) Annualized.
(b) Not annualized.
(c) Total Return has been calculated for the applicable period without deduction of a sales load, if any, on an initial purchase. Not annualized.
(d) Per share information is calculated based on average number of shares outstanding.
(e) TA IDEX JPMorgan International Bond (“the Fund”) commenced operations on December 6, 2005.
The notes to the financial statements are an integral part of this report.
132
TA IDEX J.P. Morgan Mid Cap Value
STATEMENT OF ASSETS AND LIABILITIES
At April 30, 2006
(all amounts except per share amounts in thousands)
(unaudited)
Assets: |
|
|
| |
Investment securities, at value (cost: $235,654) |
|
|
| |
(including securities loaned of $29,716) |
| $ | 252,536 |
|
Cash |
| 12,129 |
| |
Receivables: |
|
|
| |
Investment securities sold |
| 4,468 |
| |
Interest |
| 36 |
| |
Dividends |
| 193 |
| |
|
| 269,362 |
| |
Liabilities: |
|
|
| |
Investment securities purchased |
| 5,422 |
| |
Accounts payable and accrued liabilities: |
|
|
| |
Management and advisory fees |
| 157 |
| |
Administration fees |
| 4 |
| |
Payable for collateral for securities on loan |
| 30,679 |
| |
Other |
| 22 |
| |
|
| 36,284 |
| |
Net Assets |
| $ | 233,078 |
|
Net Assets Consist of: |
|
|
| |
|
|
|
| |
Shares of beneficial interest, unlimited shares authorized, no par value |
| 208,958 |
| |
Distributable net investment income (loss) |
| 1,229 |
| |
|
|
|
| |
Accumulated net realized gain (loss) from investment securities |
| 6,009 |
| |
Net unrealized appreciation (depreciation) on investment securities |
| 16,882 |
| |
Net Assets |
| $ | 233,078 |
|
|
|
|
| |
Shares Outstanding |
| 21,104 |
| |
|
|
|
| |
Net Asset Value and Offering Price Per Share |
| $ | 11.04 |
|
The notes to the financial statements are an integral part of this report.
133
TA IDEX J.P. Morgan Mid Cap Value
STATEMENT OF OPERATIONS
For the period ended April 30, 2006 (a)
(all amounts in thousands)
(unaudited)
Investment Income: |
|
|
| |
Dividends (net of withholding taxes on foreign dividends of $4) |
| 2,617 |
| |
Interest |
| $ | 146 |
|
Income from loaned securities-net |
| 22 |
| |
|
| 2,785 |
| |
Expenses: |
|
|
| |
Management and advisory fees |
| 909 |
| |
Distribution and service fees: |
|
|
| |
Class A |
| 29 |
| |
Custody fees |
| 20 |
| |
Administration fees |
| 22 |
| |
Legal fees |
| 5 |
| |
Audit fees |
| 9 |
| |
Trustees fees |
| 4 |
| |
Registration fees |
| 1 |
| |
Other |
| 1 |
| |
|
|
|
| |
Total expenses |
| 1,000 |
| |
Net Investment Income (Loss) |
| 1,785 |
| |
Net Realized and Unrealized Gain (Loss) |
|
|
| |
Realized gain (loss) from investment securities |
| 6,817 |
| |
|
|
|
| |
Increase (decrease) in unrealized appreciation (depreciation) on investment securities |
| 16,307 |
| |
|
|
|
| |
Net Realized and Unrealized Gain (Loss) on Investment Securities |
| 23,124 |
| |
|
|
|
| |
Net Increase (Decrease) in Net Assets Resulting from Operations |
| $ | 24,909 |
|
(a) Class I was offered for investment on November 15, 2005.
The notes to the financial statements are an integral part of this report.
134
TA IDEX J.P. Morgan Mid Cap Value
STATEMENTS OF CHANGES IN NET ASSETS
For the periods ended
(all amounts in thousands)
|
| April 30, |
|
|
| ||
|
| 2006 |
| October 31, |
| ||
|
| (unaudited) (b) |
| 2005 (a) |
| ||
Increase (Decrease) in Net Assets From: |
|
|
|
|
| ||
Operations: |
|
|
|
|
| ||
Net investment income (loss) |
| $ | 1,785 |
| $ | 356 |
|
|
|
|
|
|
| ||
Net realized gain (loss) from investment securities |
| 6,817 |
| 173 |
| ||
|
|
|
|
|
| ||
Change in unrealized appreciation (depreciation) on investment securities |
| 16,307 |
| 575 |
| ||
|
| 24,909 |
| 1,104 |
| ||
Distributions to Shareholders: |
|
|
|
|
| ||
From net investment income: |
|
|
|
|
| ||
Class I |
| (961 | ) | — |
| ||
|
| (961 | ) | — |
| ||
From net realized gains: |
|
|
|
|
| ||
Class I |
| (1,029 | ) | — |
| ||
|
| (1,029 | ) | — |
| ||
Capital Share Transactions: |
|
|
|
|
| ||
Proceeds from shares sold: |
|
|
|
|
| ||
Class A |
| 4,599 |
| 197,152 |
| ||
Class I |
| 215,611 |
| — |
| ||
|
| 220,210 |
| 197,152 |
| ||
Dividends and distributions reinvested: |
|
|
|
|
| ||
Class I |
| 1,990 |
| — |
| ||
|
| 1,990 |
| — |
| ||
Cost of shares redeemed: |
|
|
|
|
| ||
Class A |
| (205,876 | ) | — |
| ||
Class I |
| (4,421 | ) | — |
| ||
|
| (210,297 | ) | — |
| ||
|
| 11,903 |
| 197,152 |
| ||
Net increase (decrease) in net assets |
| 34,822 |
| 198,256 |
| ||
Net Assets: |
|
|
|
|
| ||
Beginning of period |
| 198,256 |
| — |
| ||
End of period |
| $ | 233,078 |
| $ | 198,256 |
|
Distributable Net Investment Income (Loss) |
| $ | 1,229 |
| $ | 405 |
|
|
|
|
|
|
| ||
Share Activity: |
|
|
|
|
| ||
Shares issued: |
|
|
|
|
| ||
Class A |
| 456 |
| 19,940 |
| ||
Class I |
| 21,338 |
| — |
| ||
|
| 21,794 |
| 19,940 |
| ||
Shares issued-reinvested from distributions: |
|
|
|
|
| ||
Class I |
| 191 |
| — |
| ||
|
| 191 |
| — |
| ||
Shares redeemed: |
|
|
|
|
| ||
Class A |
| (20,396 | ) | — |
| ||
Class I |
| (425 | ) | — |
| ||
|
| (20,821 | ) | — |
| ||
Net increase (decrease) in shares outstanding: |
|
|
|
|
| ||
Class A |
| (19,940 | ) | 19,940 |
| ||
Class I |
| 21,104 |
| — |
| ||
|
| 1,164 |
| 19,940 |
| ||
(a) Commenced operations on March 1, 2005
(b) Class I was offered for investment on November 15, 2005.
The notes to the financial statements are an integral part of this report.
135
TA IDEX J.P. Morgan Mid Cap Value
FINANCIAL HIGHLIGHTS(e)
(unaudited)
|
| For a share of beneficial interest outstanding throughout each period |
| ||||||||||||||
|
| Net Asset |
| Investment Operations |
| Distributions |
| Net Asset |
| ||||||||
|
| Value, |
| Net |
| Net Realized |
|
|
| From Net |
| From Net |
|
|
| Value, |
|
|
| Beginning |
| Investment |
| and Unrealized |
| Total |
| Investment |
| Realized |
| Total |
| End |
|
For the Period Ended(d) |
| of Period |
| Income (Loss) |
| Gain (Loss) |
| Operations |
| Income |
| Gains |
| Distributions |
| of Period |
|
4/30/2006 |
| 10.09 |
| 0.08 |
| 0.97 |
| 1.05 |
| (0.05 | ) | (0.05 | ) | (0.10 | ) | 11.04 |
|
|
|
|
| Ratios/Supplemental Data |
| ||||||
|
|
|
| Net Assets, |
|
|
| Net Investment |
|
|
|
|
|
|
| End of |
| Ratio of Expenses |
| Income (Loss) |
| Portfolio |
|
|
| Total |
| Period |
| to Average |
| to Average |
| Turnover |
|
For the Period Ended |
| Return(c) |
| (000’s) |
| Net Assets(a) |
| Net Assets(a) |
| Rate(b) |
|
4/30/2006 |
| 10.41 | % | 233,078 |
| 0.88 | % | 1.68 | % | 28 | % |
NOTES TO FINANCIAL HIGHLIGHTS
(a) Annualized.
(b) Not annualized.
(c) Total Return has been calculated for the applicable period without deduction of a sales load, if any, on an initial purchase. Not annualized.
(d) Per share information is calculated based on average number of shares outstanding.
(e) Class A commenced operations on March 1, 2005. Class I commenced operations on November 15, 2005. Class A assets converted to Class I assets on November 15, 2005.
The notes to the financial statements are an integral part of this report.
136
TA IDEX Marsico International Growth
STATEMENT OF ASSETS AND LIABILITIES
At April 30, 2006
(all amounts except per share amounts in thousands)
(unaudited)
Assets: |
|
|
| |
Investment securities, at value (cost: $346,031) |
| $ | 418,494 |
|
Cash |
| 13,808 |
| |
Receivables: |
|
|
| |
Investment securities sold |
| 7,367 |
| |
Shares of beneficial interest sold |
| 716 |
| |
Interest |
| 27 |
| |
Dividends |
| 640 |
| |
Dividend reclaims receivable |
| 284 |
| |
Unrealized appreciation on forward foreign currency contracts |
| 82 |
| |
|
| 441,418 |
| |
Liabilities: |
|
|
| |
Foreign currency at value (identified cost $567) |
| 573 |
| |
Investment securities purchased |
| 12,015 |
| |
Accounts payable and accrued liabilities: |
|
|
| |
Management and advisory fees |
| 342 |
| |
Administration fees |
| 7 |
| |
Payable for collateral for securities on loan |
| 17,913 |
| |
Other |
| 43 |
| |
|
| 30,893 |
| |
Net Assets |
| $ | 410,525 |
|
Net Assets Consist of: |
|
|
| |
Shares of beneficial interest, unlimited shares authorized, no par value |
| 287,369 |
| |
Distributable net investment income (loss) |
| 214 |
| |
Accumulated net realized gain (loss) from investment securities and foreign currency transactions |
| 50,478 |
| |
Net unrealized appreciation (depreciation) on: |
|
|
| |
Investment securities |
| 72,463 |
| |
Translation of assets and liabilites denominated in foreign currencies |
| 1 |
| |
Net Assets |
| $ | 410,525 |
|
|
|
|
| |
Shares Outstanding |
| 29,129 |
| |
|
|
|
| |
Net Asset Value and Offering Price Per Share |
| $ | 14.09 |
|
The notes to the financial statements are an integral part of this report.
137
TA IDEX Marsico International Growth
STATEMENT OF OPERATIONS
For the period ended April 30, 2006
(all amounts in thousands)
(unaudited)
Investment Income: |
|
|
| |
Dividends (net of withholding taxes on foreign dividends of $241) |
| 2,211 |
| |
Interest |
| $ | 121 |
|
Income from loaned securities-net |
| 66 |
| |
|
| 2,398 |
| |
Expenses: |
|
|
| |
Management and advisory fees |
| 1,965 |
| |
Distribution and service fees: |
|
|
| |
Class A |
| 17 |
| |
Custody fees |
| 134 |
| |
Administration fees |
| 37 |
| |
Legal fees |
| 9 |
| |
Audit fees |
| 9 |
| |
Trustees fees |
| 8 |
| |
Registration fees |
| 1 |
| |
Other |
| 4 |
| |
|
|
|
| |
Total expenses |
| 2,184 |
| |
Net Investment Income (Loss) |
| 214 |
| |
Net Realized Gain (Loss) from: |
|
|
| |
Investment securities |
| 52,351 |
| |
Foreign currency transactions |
| (49 | ) | |
|
| 52,302 |
| |
Net Increase (Decrease) in Unrealized Appreciation (Depreciation) on: |
|
|
| |
Investment securities |
| 45,183 |
| |
Translation of assets and liabilities denominated in foreign currencies |
| 8 |
| |
|
| 45,191 |
| |
|
|
|
| |
Net Realized and Unrealized Gain (Loss) on Investment Securities and Foreign Currency Transactions |
| 97,493 |
| |
|
|
|
| |
Net Increase (Decrease) in Net Assets Resulting from Operations |
| $ | 97,707 |
|
The notes to the financial statements are an integral part of this report.
138
TA IDEX Marsico International Growth
STATEMENTS OF CHANGES IN NET ASSETS
For the periods ended
(all amounts in thousands)
|
| April 30, |
| October 31, |
| ||
|
| (unaudited) |
| 2005 (a) |
| ||
Increase (Decrease) in Net Assets From: |
|
|
|
|
| ||
Operations: |
|
|
|
|
| ||
Net investment income (loss) |
| $ | 214 |
| $ | 4,330 |
|
|
|
|
|
|
| ||
Net realized gain (loss) from investment securities and foreign currency transactions |
| 52,302 |
| 200 |
| ||
|
|
|
|
|
| ||
Change in unrealized appreciation (depreciation) on investment securities and foreign currency translation |
| 45,191 |
| 27,273 |
| ||
|
| 97,707 |
| 31,803 |
| ||
Distributions to Shareholders: |
|
|
|
|
| ||
From net investment income: |
|
|
|
|
| ||
Class I |
| (3,283 | ) | (573 | ) | ||
|
| (3,283 | ) | (573 | ) | ||
From net realized gains: |
|
|
|
|
| ||
Class I |
| (2,500 | ) | — |
| ||
|
| (2,500 | ) | — |
| ||
Capital Share Transactions: |
|
|
|
|
| ||
Proceeds from shares sold: |
|
|
|
|
| ||
Class A |
| — |
| 105,209 |
| ||
Class I |
| 152,587 |
| 257,482 |
| ||
|
| 152,587 |
| 362,691 |
| ||
Dividends and distributions reinvested: |
|
|
|
|
| ||
Class I |
| 5,783 |
| 573 |
| ||
|
| 5,783 |
| 573 |
| ||
Cost of shares redeemed: |
|
|
|
|
| ||
Class A |
| (115,115 | ) | — |
| ||
Class I |
| (119,148 | ) | — |
| ||
|
| (234,263 | ) | — |
| ||
|
| (75,893 | ) | 363,264 |
| ||
Net increase (decrease) in net assets |
| 16,031 |
| 394,494 |
| ||
Net Assets: |
|
|
|
|
| ||
Beginning of period |
| 394,494 |
| — |
| ||
End of period |
| $ | 410,525 |
| $ | 394,494 |
|
Distributable Net Investment Income (Loss) |
| $ | 214 |
| $ | 3,283 |
|
|
|
|
|
|
| ||
Share Activity: |
|
|
|
|
| ||
Shares issued: |
|
|
|
|
| ||
Class A |
| — |
| 10,171 |
| ||
Class I |
| 13,118 |
| 25,305 |
| ||
|
| 13,118 |
| 35,476 |
| ||
Shares issued-reinvested from distributions: |
|
|
|
|
| ||
Class I |
| 479 |
| 56 |
| ||
|
| 479 |
| 56 |
| ||
Shares redeemed: |
|
|
|
|
| ||
Class A |
| (10,171 | ) | — |
| ||
Class I |
| (9,829 | ) | — |
| ||
|
| (20,000 | ) | — |
| ||
Net increase (decrease) in shares outstanding: |
|
|
|
|
| ||
Class A |
| (10,171 | ) | 10,171 |
| ||
Class I |
| 3,768 |
| 25,361 |
| ||
|
| (6,403 | ) | 35,532 |
| ||
(a) Commenced operations on November 8, 2004. The inception date for the offering of share Class A was March 1, 2005.
The notes to the financial statements are an integral part of this report.
139
TA IDEX Marsico International Growth
FINANCIAL HIGHLIGHTS
(unaudited for the period ended April 30, 2006)
|
| For a share of beneficial interest outstanding throughout each period |
| ||||||||||||||
|
| Net Asset |
| Investment Operations |
| Distributions |
| Net Asset |
| ||||||||
|
| Value, |
| Net |
| Net Realized |
|
|
| From Net |
| From Net |
|
|
| Value, |
|
|
| Beginning |
| Investment |
| and Unrealized |
| Total |
| Investment |
| Realized |
| Total |
| End |
|
For the Period Ended(d)(e) |
| of Period |
| Income (Loss) |
| Gain (Loss) |
| Operations |
| Income |
| Gains |
| Distributions |
| of Period |
|
4/30/2006 |
| 11.11 |
| 0.01 |
| 3.18 |
| 3.19 |
| (0.12 | ) | (0.09 | ) | (0.21 | ) | 14.09 |
|
10/31/2005 |
| 10.00 |
| 0.16 |
| 0.99 |
| 1.15 |
| (0.04 | ) | — |
| (0.04 | ) | 11.11 |
|
|
|
|
| Ratios/Supplemental Data |
| ||||||
|
|
|
| Net Assets, |
|
|
| Net Investment |
|
|
|
|
|
|
| End of |
| Ratio of Expenses |
| Income (Loss) |
| Portfolio |
|
|
| Total |
| Period |
| to Average |
| to Average |
| Turnover |
|
For the Period Ended(e) |
| Return(c) |
| (000’s) |
| Net Assets(a) |
| Net Assets(a) |
| Rate(b) |
|
4/30/2006 |
| 29.17 | % | 410,525 |
| 1.16 | % | 0.15 | % | 65 | % |
10/31/2005 |
| 11.49 |
| 281,692 |
| 1.18 |
| 1.52 |
| 145 |
|
NOTES TO FINANCIAL HIGHLIGHTS
(a) Annualized.
(b) Not annualized.
(c) Total Return has been calculated for the applicable period without deduction of a sales load, if any, on an initial purchase. Not annualized.
(d) Per share information is calculated based on average number of shares outstanding.
(e) TA IDEX Marsico International Growth (“the Fund”) commenced operations on November 8, 2004.
The notes to the financial statements are an integral part of this report.
140
TA IDEX Mercury Global Allocation
STATEMENT OF ASSETS AND LIABILITIES
At April 30, 2006
(all amounts except per share amounts in thousands)
(unaudited)
Assets: |
|
|
| |
Investment securities, at value (cost: $274,892) (including securities loaned of $12,191) |
| $ | 297,508 |
|
Cash (including cash on deposit with brokers of $900) |
| 16,761 |
| |
Foreign currency (cost: $7,818) |
| 7,966 |
| |
Receivables: |
|
|
| |
Investment securities sold |
| 756 |
| |
Shares of beneficial interest sold |
| 344 |
| |
Interest |
| 686 |
| |
Dividends |
| 446 |
| |
Dividend reclaims receivable |
| 7 |
| |
|
| 324,474 |
| |
Liabilities: |
|
|
| |
Investment securities purchased |
| 2,669 |
| |
Accounts payable and accrued liabilities: |
|
|
| |
Management and advisory fees |
| 181 |
| |
Deferred foreign taxes |
| 323 |
| |
Administration fees |
| 5 |
| |
Payable for collateral for securities on loan |
| 12,582 |
| |
Variation margin |
| 1,821 |
| |
Written options (premiums $767) |
| 1,009 |
| |
Other |
| 41 |
| |
|
| 18,631 |
| |
Net Assets |
| $ | 305,843 |
|
Net Assets Consist of: |
|
|
| |
|
|
|
| |
Shares of beneficial interest, unlimited shares authorized, no par value |
| 279,511 |
| |
Distributable net investment income (loss) |
| 1,028 |
| |
|
|
|
| |
Accumulated net realized gain (loss) from investment securities, futures contracts, written options and foreign currency transactions |
| 2,965 |
| |
Net unrealized appreciation (depreciation) on: |
|
|
| |
Investment securities |
| 22,372 |
| |
Futures contracts |
| 31 |
| |
Written option contracts |
| (242 | ) | |
Translation of assets and liabilites denominated in foreign currencies |
| 178 |
| |
Net Assets |
| $ | 305,843 |
|
|
|
|
| |
Shares Outstanding |
| 27,824 |
| |
|
|
|
| |
Net Asset Value and Offering Price Per Share |
| $ | 10.99 |
|
The notes to the financial statements are an integral part of this report.
141
TA IDEX Mercury Global Allocation
STATEMENT OF OPERATIONS
For the period ended April 30, 2006 (a)
(all amounts in thousands)
(unaudited)
Investment Income: |
|
|
| |
Dividends (net of withholding taxes on foreign dividends of $91) |
| 1,408 |
| |
Interest |
| $ | 984 |
|
Income from loaned securities-net |
| 7 |
| |
|
| 2,399 |
| |
Expenses: |
|
|
| |
Management and advisory fees |
| 795 |
| |
Custody fees |
| 161 |
| |
Administration fees |
| 21 |
| |
Legal fees |
| 5 |
| |
Audit fees |
| 8 |
| |
Trustees fees |
| 3 |
| |
Registration fees |
| 4 |
| |
Other |
| 2 |
| |
Total expenses |
| 999 |
| |
Net Investment Income (Loss) |
| 1,400 |
| |
Net Realized Gain (Loss) from: |
|
|
| |
Investment securities |
| 1,707 |
| |
Futures contracts |
| 836 |
| |
Foreign currency transactions |
| 422 |
| |
|
| 2,965 |
| |
Net Increase (Decrease) in Unrealized Appreciation (Depreciation) on: |
|
|
| |
Investment securities (net of foreign capital gains tax accrual of $244) |
| 22,372 |
| |
Futures contracts |
| 31 |
| |
Written option contracts |
| (242 | ) | |
Translation of assets and liabilities denominated in foreign currencies |
| 178 |
| |
|
| 22,339 |
| |
Net Realized and Unrealized Gain (Loss) on Investment Securities, Futures Contracts, Written Options and Foreign Currency Transactions |
| 25,304 |
| |
Net Increase (Decrease) in Net Assets Resulting from Operations |
| $ | 26,704 |
|
(a) Commenced operations on December 6, 2005.
The notes to the financial statements are an integral part of this report.
142
TA IDEX Mercury Global Allocation
STATEMENT OF CHANGES IN NET ASSETS
For the period ended
(all amounts in thousands)
|
| April 30, |
| |
|
| 2006 |
| |
|
| (unaudited) (a) |
| |
Increase (Decrease) in Net Assets From: |
|
|
| |
Operations: |
|
|
| |
Net investment income (loss) |
| $ | 1,400 |
|
|
|
|
| |
Net realized gain (loss) from investment securities, futures contracts and foreign currency transactions |
| 2,965 |
| |
Change in unrealized appreciation (depreciation) on investment securities, futures contracts, written options and foreign currency translation |
| 22,339 |
| |
|
| 26,704 |
| |
Distributions to Shareholders: |
|
|
| |
From net investment income: |
|
|
| |
|
| (372) |
| |
Capital Share Transactions: |
|
|
| |
Proceeds from shares sold: |
|
|
| |
|
| 279,139 |
| |
Dividends and distributions reinvested: |
| 372 |
| |
|
| 279,511 |
| |
|
| 305,843 |
| |
Net increase (decrease) in net assets |
|
|
| |
Net Assets: |
|
|
| |
Beginning of period |
| — |
| |
End of period |
| $ | 305,843 |
|
Distributable Net Investment Income (Loss) |
| $ | 1,028 |
|
|
|
|
| |
|
|
| ||
Shares issued: |
|
|
| |
|
| 27,787 |
| |
|
|
| ||
|
| 37 |
| |
Net increase (decrease) in shares outstanding: |
|
|
| |
|
| 27,824 |
| |
(a) Commenced operations on December 6, 2005.
The notes to the financial statements are an integral part of this report.
143
TA IDEX Mercury Global Allocation
FINANCIAL HIGHLIGHTS
(unaudited)
|
| For a share of beneficial interest outstanding throughout each period |
| |||||||||||||||||||||
|
| Net Asset |
| Investment Operations |
| Distributions |
| Net Asset |
| |||||||||||||||
|
| Value, |
| Net |
| Net Realized |
|
|
| From Net |
| From Net |
|
|
| Value, |
| |||||||
|
| Beginning |
| Investment |
| and Unrealized |
| Total |
| Investment |
| Realized |
| Total |
| End |
| |||||||
For the Period Ended(d)(e) |
| of Period |
| Income (Loss) |
| Gain (Loss) |
| Operations |
| Income |
| Gains |
| Distributions |
| of Period |
| |||||||
4/30/2006 |
| $ | 10.00 |
| $ | 0.05 |
| $ | 0.96 |
| $ | 1.01 |
| $ | (0.02 | ) | — |
| $ | (0.02 | ) | $ | 10.99 |
|
|
|
|
| Ratios/Supplemental Data |
| |||||||
|
|
|
| Net Assets, |
|
|
| Net Investment |
|
|
| |
|
|
|
| End of |
| Ratio of Expenses |
| Income (Loss) |
| Portfolio |
| |
|
| Total |
| Period |
| to Average |
| to Average |
| Turnover |
| |
For the Period Ended(e) |
| Return(c) |
| (000’s) |
| Net Assets(a) |
| Net Assets(a) |
| Rate(b) |
| |
4/30/2006 |
| 10.14 | % | $ | 305,843 |
| 0.94 | % | 1.32 | % | 18 | % |
NOTES TO FINANCIAL HIGHLIGHTS
(a) Annualized.
(b) Not annualized.
(c) Total Return has been calculated for the applicable period without deduction of a sales load, if any, on an initial purchase. Not annualized.
(d) Per share information is calculated based on average number of shares outstanding.
(e) TA IDEX Mercury Global Allocation (“the Fund”) commenced operations on December 6, 2005.
The notes to the financial statements are an integral part of this report.
144
TA IDEX Mercury Large Cap Value
STATEMENT OF ASSETS AND LIABILITIES
At April 30, 2006
(all amounts except per share amounts in thousands)
(unaudited)
The notes to the financial statements are an integral part of this report.
145
TA IDEX Mercury Large Cap Value
STATEMENT OF OPERATIONS
For the period ended April 30, 2006 (a)
(all amounts in thousands)
(unaudited)
Investment Income: |
|
|
| |
Dividends |
| 3,194 |
| |
Interest |
| $ | 66 |
|
Income from loaned securities-net |
| 13 |
| |
|
| 3,273 |
| |
Expenses: |
|
|
| |
Management and advisory fees |
| 1,628 |
| |
Distribution and service fees: |
|
|
| |
Class A |
| 51 |
| |
Custody fees |
| 22 |
| |
Administration fees |
| 41 |
| |
Legal fees |
| 9 |
| |
Audit fees |
| 9 |
| |
Trustees fees |
| 8 |
| |
Registration fees |
| 1 |
| |
Other |
| 4 |
| |
|
|
|
| |
Total expenses |
| 1,773 |
| |
Net Investment Income (Loss) |
| 1,500 |
| |
Net Realized and Unrealized Gain (Loss) |
|
|
| |
Realized gain (loss) from investment securities |
| 7,881 |
| |
|
|
|
| |
Increase (decrease) in unrealized appreciation (depreciation) on investment securities |
| 44,461 |
| |
|
|
|
| |
Net Realized and Unrealized Gain (Loss) on Investment Securities |
| 52,342 |
| |
|
|
|
| |
Net Increase (Decrease) in Net Assets Resulting from Operations |
| $ | 53,842 |
|
(a) Class I was offered for investment on November 15, 2005.
The notes to the financial statements are an integral part of this report.
146
TA IDEX Mercury Large Cap Value
STATEMENTS OF CHANGES IN NET ASSETS
For the periods ended
(all amounts in thousands)
|
| April 30, |
|
|
| ||
|
| 2006 |
| October 31, |
| ||
|
| (unaudited) (b) |
| 2005 (a) |
| ||
Increase (Decrease) in Net Assets From: |
|
|
|
|
| ||
Operations: |
|
|
|
|
| ||
Net investment income (loss) |
| $ | 1,500 |
| $ | 26 |
|
|
|
|
|
|
| ||
Net realized gain (loss) from investment securities |
| 7,881 |
| (2,138 | ) | ||
|
|
|
|
|
| ||
Change in unrealized appreciation (depreciation) on investment securities |
| 44,461 |
| 19,812 |
| ||
|
| 53,842 |
| 17,700 |
| ||
Distributions to Shareholders: |
|
|
|
|
| ||
From net investment income: |
|
|
|
|
| ||
Class I |
| (1,026 | ) | — |
| ||
|
| (1,026 | ) | — |
| ||
Capital Share Transactions: |
|
|
|
|
| ||
Proceeds from shares sold: |
|
|
|
|
| ||
Class A |
| 2,001 |
| 330,882 |
| ||
Class I |
| 445,738 |
| — |
| ||
|
| 447,739 |
| 330,882 |
| ||
Dividends and distributions reinvested: |
|
|
|
|
| ||
Class I |
| 1,026 |
| — |
| ||
|
| 1,026 |
| — |
| ||
Cost of shares redeemed: |
|
|
|
|
| ||
Class A |
| (356,774 | ) | — |
| ||
Class I |
| (4,062 | ) | — |
| ||
|
| (360,836 | ) | — |
| ||
|
| 87,929 |
| 330,882 |
| ||
Net increase (decrease) in net assets |
| 140,745 |
| 348,582 |
| ||
Net Assets: |
|
|
|
|
| ||
Beginning of period |
| 348,582 |
| — |
| ||
End of period |
| $ | 489,327 |
| $ | 348,582 |
|
Distributable Net Investment Income (Loss) |
| $ | 695 |
| $ | 221 |
|
|
|
|
|
|
| ||
Share Activity: |
|
|
|
|
| ||
Shares issued: |
|
|
|
|
| ||
Class A |
| 191 |
| 33,898 |
| ||
Class I |
| 42,006 |
| — |
| ||
|
| 42,197 |
| 33,898 |
| ||
Shares issued-reinvested from distributions: |
|
|
|
|
| ||
Class I |
| 94 |
| — |
| ||
|
| 94 |
| — |
| ||
Shares redeemed: |
|
|
|
|
| ||
Class A |
| (34,089 | ) | — |
| ||
Class I |
| (372 | ) | — |
| ||
|
| (34,461 | ) | — |
| ||
Net increase (decrease) in shares outstanding: |
|
|
|
|
| ||
Class A |
| (33,898 | ) | 33,898 |
| ||
Class I |
| 41,728 |
| — |
| ||
|
| 7,830 |
| 33,898 |
| ||
(a) Commenced operations on March 1, 2005.
(b) Class I was offered for investment on November 15, 2005.
The notes to the financial statements are an integral part of this report.
147
TA IDEX Mercury Large Cap Value
FINANCIAL HIGHLIGHTS(e)
(unaudited)
|
| For a share of beneficial interest outstanding throughout each period |
| ||||||||||||||
|
| Net Asset |
| Investment Operations |
| Distributions |
| Net Asset |
| ||||||||
|
| Value, |
| Net |
| Net Realized |
|
|
| From Net |
| From Net |
|
|
| Value, |
|
|
| Beginning |
| Investment |
| and Unrealized |
| Total |
| Investment |
| Realized |
| Total |
| End |
|
For the Period Ended(d) |
| of Period |
| Income (Loss) |
| Gain (Loss) |
| Operations |
| Income |
| Gains |
| Distributions |
| of Period |
|
4/30/2006 |
| 10.47 |
| 0.03 |
| 1.26 |
| 1.29 |
| (0.03 | ) | — |
| (0.03 | ) | 11.73 |
|
|
|
|
| Ratios/Supplemental Data |
| ||||||
|
|
|
| Net Assets, |
|
|
| Net Investment |
|
|
|
|
|
|
| End of |
| Ratio of Expenses |
| Income (Loss) |
| Portfolio |
|
|
| Total |
| Period |
| to Average |
| to Average |
| Turnover |
|
For the Period Ended |
| Return(c) |
| (000’s) |
| Net Assets(a) |
| Net Assets(a) |
| Rate(b) |
|
4/30/2006 |
| 12.34 | % | 489,327 |
| 0.84 | % | 0.50 | % | 27 | % |
NOTES TO FINANCIAL HIGHLIGHTS
(a) Annualized.
(b) Not annualized.
(c) Total Return has been calculated for the applicable period without deduction of a sales load, if any, on an initial purchase. Not annualized.
(d) Per share information is calculated based on average number of shares outstanding.
(e) Class A commenced operations on March 1, 2005. Class I commenced operations on November 15, 2005. Class A assets converted to Class I assets on November 15, 2005.
The notes to the financial statements are an integral part of this report.
148
TA IDEX Neuberger Berman International
STATEMENT OF ASSETS AND LIABILITIES
At April 30, 2006
(all amounts except per share amounts in thousands)
(unaudited)
Assets: |
|
|
| |
Investment securities, at value (cost: $388,785) |
| $ | 455,066 |
|
Cash |
| 17,795 |
| |
Receivables: |
|
|
| |
Investment securities sold |
| 1,871 |
| |
Shares of beneficial interest sold |
| 416 |
| |
Interest |
| 36 |
| |
Dividends |
| 1,528 |
| |
Dividend reclaims receivable |
| 88 |
| |
|
| 476,800 |
| |
Liabilities: |
|
|
| |
Foreign currency at value (identified cost $756) |
| 756 |
| |
Investment securities purchased |
| 417 |
| |
Accounts payable and accrued liabilities: |
|
|
| |
Shares of beneficial interest redeemed |
| 14 |
| |
Management and advisory fees |
| 351 |
| |
Administration fees |
| 7 |
| |
Payable for collateral for securities on loan |
| 12,160 |
| |
Other |
| 13 |
| |
|
| 13,718 |
| |
Net Assets |
| $ | 463,082 |
|
Net Assets Consist of: |
|
|
| |
|
|
|
| |
Shares of beneficial interest, unlimited shares authorized, no par value |
| 385,705 |
| |
Distributable net investment income (loss) |
| 1,125 |
| |
Accumulated net realized gain (loss) from investment securities and foreign currency transactions |
| 9,926 |
| |
Net unrealized appreciation (depreciation) on: |
|
|
| |
Investment securities |
| 66,281 |
| |
Translation of assets and liabilites denominated in foreign currencies |
| 45 |
| |
Net Assets |
| $ | 463,082 |
|
|
|
|
| |
Shares Outstanding |
| 38,331 |
| |
|
|
|
| |
Net Asset Value and Offering Price Per Share |
| $ | 12.08 |
|
The notes to the financial statements are an integral part of this report.
149
TA IDEX Neuberger Berman International
STATEMENT OF OPERATIONS
For the period ended April 30, 2006 (a)
(all amounts in thousands)
(unaudited)
Investment Income: |
|
|
| |
Dividends (net of withholding taxes on foreign dividends of $273) |
| 3,011 |
| |
Interest |
| $ | 266 |
|
Income from loaned securities-net |
| 31 |
| |
|
| 3,308 |
| |
Expenses: |
|
|
| |
Management and advisory fees |
| 1,522 |
| |
Custody fees |
| 87 |
| |
Administration fees |
| 32 |
| |
Legal fees |
| 8 |
| |
Audit fees |
| 8 |
| |
Trustees fees |
| 4 |
| |
Registration fees |
| 5 |
| |
Other |
| 2 |
| |
|
|
|
| |
Total expenses |
| 1,668 |
| |
Net Investment Income (Loss) |
| 1,640 |
| |
Net Realized Gain (Loss) from: |
|
|
| |
Investment securities |
| 10,773 |
| |
Foreign currency transactions |
| (847 | ) | |
|
| 9,926 |
| |
Net Increase (Decrease) in Unrealized Appreciation (Depreciation) on: |
|
|
| |
Investment securities |
| 66,281 |
| |
Translation of assets and liabilities denominated in foreign currencies |
| 45 |
| |
|
| 66,326 |
| |
Net Realized and Unrealized Gain (Loss) on Investment Securities and Foreign Currency Transactions |
| 76,252 |
| |
|
|
|
| |
Net Increase (Decrease) in Net Assets Resulting from Operations |
| $ | 77,892 |
|
(a) Commenced operations on December 6, 2005.
The notes to the financial statements are an integral part of this report.
150
TA IDEX Neuberger Berman International
STATEMENT OF CHANGES IN NET ASSETS
For the period ended
(all amounts in thousands)
|
| April 30, |
| |
|
| 2006 |
| |
|
| (unaudited) (a) |
| |
Increase (Decrease) in Net Assets From: |
|
|
| |
Operations: |
|
|
| |
Net investment income (loss) |
| $ | 1,640 |
|
Net realized gain (loss) from investment securities and foreign currency transactions |
| 9,926 |
| |
Change in unrealized appreciation (depreciation) on investment securities and foreign currency translation |
| 66,326 |
| |
|
| 77,892 |
| |
Distributions to Shareholders: |
|
|
| |
From net investment income: |
|
|
| |
|
| (515 | ) | |
Capital Share Transactions: |
|
|
| |
Proceeds from shares sold: |
|
|
| |
|
| 385,285 |
| |
Dividends and distributions reinvested: |
|
|
| |
|
| 515 |
| |
Cost of shares redeemed: |
|
|
| |
|
| (95 | ) | |
|
| 385,705 |
| |
Net increase (decrease) in net assets |
| 463,082 |
| |
Net Assets: |
|
|
| |
Beginning of period |
| — |
| |
End of period |
| $ | 463,082 |
|
Distributable Net Investment Income (Loss) |
| $ | 1,125 |
|
|
|
|
| |
Share Activity: |
|
|
| |
Shares issued: |
|
|
| |
|
| 38,288 |
| |
Shares issued-reinvested from distributions: |
|
|
| |
|
| 51 |
| |
Shares redeemed: |
|
|
| |
|
| (8 | ) | |
Net increase (decrease) in shares outstanding: |
|
|
| |
|
| 38,331 |
| |
(a) Commenced operations on December 6, 2005.
The notes to the financial statements are an integral part of this report.
151
TA IDEX Neuberger Berman International
FINANCIAL HIGHLIGHTS
(unaudited)
|
| For a share of beneficial interest outstanding throughout each period |
| ||||||||||||||||||||||
|
| Net Asset |
| Investment Operations |
| Distributions |
| Net Asset |
| ||||||||||||||||
|
| Value, |
| Net |
| Net Realized |
|
|
| From Net |
| From Net |
|
|
| Value, |
| ||||||||
|
| Beginning |
| Investment |
| and Unrealized |
| Total |
| Investment |
| Realized |
| Total |
| End |
| ||||||||
For the Period Ended(d)(e) |
| of Period |
| Income (Loss) |
| Gain (Loss) |
| Operations |
| Income |
| Gains |
| Distributions |
| of Period |
| ||||||||
4/30/2006 |
| $ | 10.00 |
| $ | 0.05 |
| $ | 2.05 |
| $ | 2.10 |
| $ | (0.02 | ) | $ | — |
| $ | (0.02 | ) | $ | 12.08 |
|
|
|
|
| Ratios/Supplemental Data |
| |||||||
|
|
|
| Net Assets, |
|
|
| Net Investment |
|
|
| |
|
|
|
| End of |
| Ratio of Expenses |
| Income (Loss) |
| Portfolio |
| |
|
| Total |
| Period |
| to Average |
| to Average |
| Turnover |
| |
For the Period Ended(e) |
| Return(c) |
| (000’s) |
| Net Assets(a) |
| Net Assets(a) |
| Rate(b) |
| |
4/30/2006 |
| 21.02 | % | $ | 463,082 |
| 1.05 | % | 1.04 | % | 23 | % |
NOTES TO FINANCIAL HIGHLIGHTS
(a) Annualized.
(b) Not annualized.
(c) Total Return has been calculated for the applicable period without deduction of a sales load, if any, on an initial purchase. Not annualized.
(d) Per share information is calculated based on average number of shares outstanding.
(e) TA IDEX Neuberger Berman International (“the Fund”) commenced operations on December 6, 2005.
The notes to the financial statements are an integral part of this report.
152
TA IDEX Oppenheimer Developing Markets
STATEMENT OF ASSETS AND LIABILITIES
At April 30, 2006
(all amounts except per share amounts in thousands)
(unaudited)
Assets: |
|
|
| |
Investment securities, at value (cost: $298,065) |
| $ | 336,560 |
|
Foreign currency (cost: $17,040) |
| 16,906 |
| |
Receivables: |
|
|
| |
Investment securities sold |
| 8,262 |
| |
Shares of beneficial interest sold |
| 438 |
| |
Interest |
| 1 |
| |
Dividends |
| 500 |
| |
|
| 362,667 |
| |
Liabilities: |
|
|
| |
Investment securities purchased |
| 4,962 |
| |
Accounts payable and accrued liabilities: |
|
|
| |
Management and advisory fees |
| 300 |
| |
Deferred foreign taxes |
| 1,264 |
| |
Administration fees |
| 5 |
| |
Due to custodian |
| 10,541 |
| |
Other |
| 73 |
| |
|
| 17,145 |
| |
Net Assets |
| $ | 345,522 |
|
Net Assets Consist of: |
|
|
| |
Shares of beneficial interest, unlimited shares authorized, no par value |
| 295,102 |
| |
Distributable net investment income (loss) |
| 171 |
| |
Accumulated net realized gain (loss) from investment securities and foreign currency transactions |
| 12,717 |
| |
Net unrealized appreciation (depreciation) on: |
|
|
| |
Investment securities |
| 37,672 |
| |
Translation of assets and liabilites denominated in foreign currencies |
| (140 | ) | |
Net Assets |
| $ | 345,522 |
|
|
|
|
| |
Shares Outstanding |
| 29,328 |
| |
|
|
|
| |
Net Asset Value and Offering Price Per Share |
| $ | 11.78 |
|
The notes to the financial statements are an integral part of this report.
153
TA IDEX Oppenheimer Developing Markets
STATEMENT OF OPERATIONS
For the period ended April 30, 2006 (a)
(all amounts in thousands)
(unaudited)
Investment Income: |
|
|
| |
Dividends (net of withholding taxes on foreign dividends of $232) |
| 2,620 |
| |
Interest |
| $ | 163 |
|
|
| 2,783 |
| |
Expenses: |
|
|
| |
Management and advisory fees |
| 1,350 |
| |
Custody fees |
| 580 |
| |
Administration fees |
| 24 |
| |
Legal fees |
| 6 |
| |
Audit fees |
| 8 |
| |
Trustees fees |
| 4 |
| |
Registration fees |
| 4 |
| |
Other |
| 1 |
| |
|
|
|
| |
Total expenses |
| 1,977 |
| |
Waiver of management and advisory fees |
| (261 | ) | |
Net expenses |
| 1,716 |
| |
Net Investment Income (Loss) |
| 1,067 |
| |
Net Realized Gain (Loss) from: |
|
|
| |
Investment securities |
| 13,644 |
| |
Foreign currency transactions |
| (927 | ) | |
|
| 12,717 |
| |
Net Increase (Decrease) in Unrealized Appreciation (Depreciation) on: |
|
|
| |
Investment securities (net of foreign capital gains tax accrual of $823) |
| 37,672 |
| |
Translation of assets and liabilities denominated in foreign currencies |
| (140 | ) | |
|
| 37,532 |
| |
Net Realized and Unrealized Gain (Loss) on Investment Securities and Foreign Currency Transactions |
| 50,249 |
| |
|
|
|
| |
Net Increase (Decrease) in Net Assets Resulting from Operations |
| $ | 51,316 |
|
(a) Commenced operations on December 6, 2005.
The notes to the financial statements are an integral part of this report.
154
TA IDEX Oppenheimer Developing Markets
STATEMENT OF CHANGES IN NET ASSETS
For the period ended
(all amounts in thousands)
|
| April 30, 2006 |
| |
|
| (unaudited) (a) |
| |
Increase (Decrease) in Net Assets From: |
|
|
| |
Operations: |
|
|
| |
Net investment income (loss) |
| $ | 1,067 |
|
|
|
|
| |
Net realized gain (loss) from investment securities and foreign currency transactions |
| 12,717 |
| |
|
|
|
| |
Change in unrealized appreciation (depreciation) on investment securities and foreign currency translation |
| 37,532 |
| |
|
| 51,316 |
| |
Distributions to Shareholders: |
|
|
| |
From net investment income: |
|
|
| |
|
| (896 | ) | |
Capital Share Transactions: |
|
|
| |
Proceeds from shares sold: |
|
|
| |
|
| 294,206 |
| |
Dividends and distributions reinvested: |
|
|
| |
|
| 896 |
| |
|
| 295,102 |
| |
Net increase (decrease) in net assets |
| 345,522 |
| |
Net Assets: |
|
|
| |
Beginning of period |
| — |
| |
End of period |
| $ | 345,522 |
|
Distributable Net Investment Income (Loss) |
| $ | 171 |
|
|
|
|
| |
Share Activity: |
|
|
| |
Shares issued: |
|
|
| |
|
| 29,239 |
| |
Shares issued-reinvested from distributions: |
|
|
| |
|
| 89 |
| |
Net increase (decrease) in shares outstanding: |
|
|
| |
|
| 29,328 |
| |
(a) Commenced operations on December 6, 2005.
The notes to the financial statements are an integral part of this report.
155
TA IDEX Oppenheimer Developing Markets
FINANCIAL HIGHLIGHTS
(unaudited)
|
| For a share of beneficial interest outstanding throughout each period |
| ||||||||||||||||||||||
|
| Net Asset |
| Investment Operations |
| Distributions |
| Net Asset |
| ||||||||||||||||
For the Period Ended(d)(g) |
| Value, |
| Net |
| Net Realized |
| Total |
| From Net |
| From Net |
| Total |
| Value, |
| ||||||||
4/30/2006 |
| $ | 10.00 |
| $ | 0.04 |
| $ | 1.79 |
| $ | 1.83 |
| $ | (0.05 | ) | $ | - |
| $ | (0.05 | ) | $ | 11.78 |
|
|
|
|
| Ratios/Supplemental Data |
| |||||||||
|
|
|
| Net Assets, |
| Ratio of Expenses |
| Net Investment |
|
|
| |||
|
|
|
| End of |
| to Average |
| Income (Loss) |
| Portfolio |
| |||
|
| Total |
| Period |
| Net Assets(a) |
| to Average |
| Turnover |
| |||
For the Period Ended(g) |
| Return(c) |
| (000’s) |
| Net(e) |
| Total(f) |
| Net Assets(a) |
| Rate(b) |
| |
4/30/2006 |
| 18.36 | % | $ | 345,522 |
| 1.45 | % | 1.67 | % | 0.90 | % | 41 | % |
(a) Annualized.
(b) Not annualized.
(c) Total Return has been calculated for the applicable period without deduction of a sales load, if any, on an initial purchase. Not annualized.
(d) Per share information is calculated based on average number of shares outstanding.
(e) Ratio of Net Expenses to Average Net Assets is net of fee waivers and reimbursements by the investment adviser, if any (see note 2).
(f) Ratio of Total Expenses to Average Net Assets includes all expenses before fee waivers and reimbursements by the investment adviser.
(g) TA IDEX Oppenheimer Developing Markets (“the Fund”) commenced operations on December 6, 2005.
The notes to the financial statements are an integral part of this report.
156
TA IDEX Transamerica Short-Term Bond
STATEMENT OF ASSETS AND LIABILITIES
At April 30, 2006
(all amounts except per share amounts in thousands)
(unaudited)
Assets: |
|
|
| |
Investment securities, at value (cost: $293,869) |
| $ | 290,707 |
|
Cash |
| 643 |
| |
Receivables: |
|
|
| |
Shares of beneficial interest sold |
| 1 |
| |
Interest |
| 4,481 |
| |
Other |
| 4 |
| |
|
| 295,836 |
| |
Liabilities: |
|
|
| |
Accounts payable and accrued liabilities: |
|
|
| |
Management and advisory fees |
| 155 |
| |
Administration fees |
| 5 |
| |
Dividends to shareholders |
| 440 |
| |
Payable for collateral for securities on loan |
| 158 |
| |
Other |
| 20 |
| |
|
| 778 |
| |
Net Assets |
| $ | 295,058 |
|
Net Assets Consist of: |
|
|
| |
|
|
|
| |
Shares of beneficial interest, unlimited shares authorized, no par value |
| 299,574 |
| |
Distributable net investment income (loss) |
| — |
| |
Accumulated net realized gain (loss) from investment securities |
| (1,354 | ) | |
Net unrealized appreciation (depreciation) on investment securities |
| (3,162 | ) | |
Net Assets |
| $ | 295,058 |
|
|
|
|
| |
Shares Outstanding |
| 30,239 |
| |
|
|
|
| |
Net Asset Value and Offering Price Per Share |
| $ | 9.76 |
|
The notes to the financial statements are an integral part of this report.
157
TA IDEX Transamerica Short-Term Bond
STATEMENT OF OPERATIONS
For the period ended April 30, 2006
(all amounts in thousands)
(unaudited)
Investment Income: |
|
|
| |
Interest |
| $ | 6,493 |
|
Income from loaned securities-net |
| 5 |
| |
|
| 6,498 |
| |
Expenses: |
|
|
| |
Management and advisory fees |
| 929 |
| |
Distribution and service fees: |
|
|
| |
Class A |
| 16 |
| |
Custody fees |
| 16 |
| |
Administration fees |
| 29 |
| |
Legal fees |
| 7 |
| |
Audit fees |
| 9 |
| |
Trustees fees |
| 6 |
| |
Registration fees |
| 1 |
| |
Other |
| 2 |
| |
Total expenses |
| 1,015 |
| |
Net Investment Income (Loss) |
| 5,483 |
| |
Net Realized and Unrealized Gain (Loss) |
|
|
| |
Realized gain (loss) from investment securities |
| (696 | ) | |
Increase (decrease) in unrealized appreciation (depreciation) on investment securities |
| (359 | ) | |
Net Realized and Unrealized Gain (Loss) on Investment Securities |
| (1,055 | ) | |
Net Increase (Decrease) in Net Assets Resulting from Operations |
| $ | 4,428 |
|
The notes to the financial statements are an integral part of this report.
158
TA IDEX Transamerica Short-Term Bond
STATEMENTS OF CHANGES IN NET ASSETS
For the periods ended
(all amounts in thousands)
|
| April 30, |
| October 31, |
| ||
Increase (Decrease) in Net Assets From: |
|
|
|
|
| ||
Operations: |
|
|
|
|
| ||
Net investment income (loss) |
| $ | 5,483 |
| $ | 5,617 |
|
Net realized gain (loss) from investment securities |
| (696 | ) | (658 | ) | ||
Change in unrealized appreciation (depreciation) on investment securities |
| (359 | ) | (2,803 | ) | ||
|
| 4,428 |
| 2,156 |
| ||
Distributions to Shareholders: |
|
|
|
|
| ||
From net investment income: |
|
|
|
|
| ||
Class A |
| (146 | ) | (1,688 | ) | ||
Class I |
| (5,337 | ) | (3,929 | ) | ||
|
| (5,483) |
| (5,617 | ) | ||
Capital Share Transactions: |
|
|
|
|
| ||
Proceeds from shares sold: |
|
|
|
|
| ||
Class A |
| 682 |
| 107,851 |
| ||
Class I |
| 119,851 |
| 173,243 |
| ||
|
| 120,533 |
| 281,094 |
| ||
Dividends and distributions reinvested: |
|
|
|
|
| ||
Class A |
| 256 |
| 1,564 |
| ||
Class I |
| 5,121 |
| 3,706 |
| ||
|
| 5,377 |
| 5,270 |
| ||
Cost of shares redeemed: |
|
|
|
|
| ||
Class A |
| (109,421 | ) | — |
| ||
Class I |
| (3,279 | ) | — |
| ||
|
| (112,700 | ) | — |
| ||
|
| 13,210 |
| 286,364 |
| ||
Net increase (decrease) in net assets |
| 12,155 |
| 282,903 |
| ||
Net Assets: |
|
|
|
|
| ||
Beginning of period |
| 282,903 |
| — |
| ||
End of period |
| $ | 295,058 |
| $ | 282,903 |
|
Distributable Net Investment Income (Loss) |
| $ | — |
| $ | — |
|
Share Activity: |
|
|
|
|
| ||
Shares issued: |
|
|
|
|
| ||
Class A |
| 70 |
| 10,930 |
| ||
Class I |
| 12,253 |
| 17,421 |
| ||
|
| 12,323 |
| 28,351 |
| ||
Shares issued-reinvested from distributions: |
|
|
|
|
| ||
Class A |
| 26 |
| 159 |
| ||
Class I |
| 524 |
| 376 |
| ||
|
| 550 |
| 535 |
| ||
Shares redeemed: |
|
|
|
|
| ||
Class A |
| (11,185 | ) | — |
| ||
Class I |
| (335 | ) | — |
| ||
|
| (11,520) |
| — |
| ||
Net increase (decrease) in shares outstanding: |
|
|
|
|
| ||
Class A |
| (11,089 | ) | 11,089 |
| ||
Class I |
| 12,442 |
| 17,797 |
| ||
|
| 1,353 |
| 28,886 |
| ||
(a) Commenced operations on November 8, 2004. The inception date for the offering of share Class A was March 1, 2005.
The notes to the financial statements are an integral part of this report.
159
TA IDEX Transamerica Short-Term Bond
FINANCIAL HIGHLIGHTS
(unaudited for the period ended April 30, 2006)
|
| For a share of beneficial interest outstanding throughout each period |
| ||||||||||||||
|
| Net Asset |
| Investment Operations |
| Distributions |
| Net Asset |
| ||||||||
|
| Value, |
| Net |
| Net Realized |
|
|
| From Net |
| From Net |
|
|
| Value, |
|
|
| Beginning |
| Investment |
| and Unrealized |
| Total |
| Investment |
| Realized |
| Total |
| End |
|
For the Period Ended(d)(g) |
| of Period |
| Income (Loss) |
| Gain (Loss) |
| Operations |
| Income |
| Gains |
| Distributions |
| of Period |
|
4/30/2006 |
| 9.79 |
| 0.18 |
| (0.03 | ) | 0.15 |
| (0.18 | ) | — |
| (0.18 | ) | 9.76 |
|
10/31/2005 |
| 10.00 |
| 0.28 |
| (0.22 | ) | 0.06 |
| (0.27 | ) | — |
| (0.27 | ) | 9.79 |
|
|
|
|
| Ratios/Supplemental Data |
| ||||||
|
|
|
| Net Assets, |
|
|
| Net Investment |
|
|
|
|
|
|
| End of |
| Ratio of Expenses |
| Income (Loss) |
| Portfolio |
|
|
| Total |
| Period |
| to Average |
| to Average |
| Turnover |
|
For the Period Ended(e) |
| Return(c) |
| (000’s) |
| Net Assets(a) |
| Net Assets(a) |
| Rate(b) |
|
4/30/2006 |
| 1.55 |
| 295,058 |
| 0.69 |
| 3.81 |
| 30 |
|
10/31/2005 |
| 0.49 |
| 174,302 |
| 0.71 |
| 2.92 |
| 153 |
|
(a) Annualized.
(b) Not annualized.
(c) Total return has been calculated for the applicable period without deduction of a sales load, if any, on an initial purchase. Not annualized.
(d) Per share information is calculated based on average number of shares outstanding.
(e) TA IDEX Transamerica Short-Term Bond (“the Fund”) commenced operations on November 8, 2004.
The notes to the financial statements are an integral part of this report.
160
TA IDEX UBS Large Cap Value
STATEMENT OF ASSETS AND LIABILITIES
At April 30, 2006
(all amounts except per share amounts in thousands)
(unaudited)
Assets: |
|
|
|
| |
Investment securities, at value (cost: $184,956) |
| $ | 209,157 |
|
|
Cash |
| 3,244 |
|
| |
Receivables: |
|
|
|
| |
Interest |
| 10 |
|
| |
Dividends |
| 325 |
|
| |
|
| 212,736 |
|
| |
Liabilities: |
|
|
|
| |
Investment securities purchased |
| 99 |
|
| |
Accounts payable and accrued liabilities: |
|
|
|
| |
Management and advisory fees |
| 131 |
|
| |
Administration fees |
| 3 |
|
| |
Payable for collateral for securities on loan |
| 15,071 |
|
| |
Other |
| 16 |
|
| |
|
| 15,320 |
|
| |
Net Assets |
| $ | 197,416 |
|
|
Net Assets Consist of: |
|
|
|
| |
|
|
|
|
| |
Shares of beneficial interest, unlimited shares authorized, no par value |
| 170,213 |
|
| |
Distributable net investment income (loss) |
| 853 |
|
| |
|
|
|
|
| |
Accumulated net realized gain (loss) from investment securities |
| 2,149 |
|
| |
Net unrealized appreciation (depreciation) on investment securities |
| 24,201 |
|
| |
Net Assets |
| $ | 197,416 |
|
|
|
|
|
|
| |
Shares Outstanding |
| 16,490 |
|
| |
|
|
|
|
| |
Net Asset Value and Offering Price Per Share |
| $ | 11.97 |
|
|
The notes to the financial statements are an integral part of this report.
161
TA IDEX UBS Large Cap Value
STATEMENT OF OPERATIONS
For the period ended April 30, 2006
(all amounts in thousands)
(unaudited)
Investment Income: |
|
|
| |
Dividends |
| 1,979 |
| |
Interest |
| $ | 67 |
|
Income from loaned securities-net |
| 7 |
| |
|
| 2,053 |
| |
Expenses: |
|
|
| |
Management and advisory fees |
| 763 |
| |
Distribution and service fees: |
|
|
| |
Class A |
| 10 |
| |
Custody fees |
| 11 |
| |
Administration fees |
| 18 |
| |
Legal fees |
| 4 |
| |
Audit fees |
| 9 |
| |
Trustees fees |
| 4 |
| |
Registration fees |
| 1 |
| |
Other |
| 2 |
| |
Total expenses |
| 822 |
| |
Net Investment Income (Loss) |
| 1,231 |
| |
Net Realized and Unrealized Gain (Loss) |
|
|
| |
Realized gain (loss) from investment securities |
| 2,150 |
| |
|
|
|
| |
Increase (decrease) in unrealized appreciation (depreciation) on investment securities |
| 17,360 |
| |
|
|
|
| |
Net Realized and Unrealized Gain (Loss) on Investment Securities |
| 19,510 |
| |
|
|
|
| |
Net Increase (Decrease) in Net Assets Resulting from Operations |
| $ | 20,741 |
|
The notes to the financial statements are an integral part of this report.
162
TA IDEX UBS Large Cap Value
STATEMENTS OF CHANGES IN NET ASSETS
For the periods ended
(all amounts in thousands)
|
| April 30, |
| October 31, |
| ||
|
|
|
|
|
| ||
Increase (Decrease) in Net Assets From: |
|
|
|
|
| ||
Operations: |
|
|
|
|
| ||
Net investment income (loss) |
| $ | 1,231 |
| $ | 1,290 |
|
Net realized gain (loss) from investment securities |
| 2,150 |
| 2,898 |
| ||
Change in unrealized appreciation (depreciation) on investment securities |
| 17,360 |
| 6,841 |
| ||
|
| 20,741 |
| 11,029 |
| ||
Distributions to Shareholders: |
|
|
|
|
| ||
From net investment income: |
|
|
|
|
| ||
Class I |
| (1,596 | ) | (72 | ) | ||
|
| (1,596 | ) | (72 | ) | ||
From net realized gains: |
|
|
|
|
| ||
Class I |
| (2,899 | ) | — |
| ||
|
| (2,899 | ) | — |
| ||
Capital Share Transactions: |
|
|
|
|
| ||
Proceeds from shares sold: |
|
|
|
|
| ||
Class A |
| — |
| 67,684 |
| ||
Class I |
| 103,688 |
| 86,786 |
| ||
|
| 103,688 |
| 154,470 |
| ||
Dividends and distributions reinvested: |
|
|
|
|
| ||
Class I |
| 4,495 |
| 72 |
| ||
|
| 4,495 |
| 72 |
| ||
Cost of shares redeemed: |
|
|
|
|
| ||
Class A |
| (72,383 | ) | — |
| ||
Class I |
| (20,129 | ) | — |
| ||
|
| (92,512 | ) | — |
| ||
|
| 15,671 |
| 154,542 |
| ||
Net increase (decrease) in net assets |
| 31,917 |
| 165,499 |
| ||
Net Assets: |
|
|
|
|
| ||
Beginning of period |
| 165,499 |
| — |
| ||
End of period |
| $ | 197,416 |
| $ | 165,499 |
|
Distributable Net Investment Income (Loss) |
| $ | 853 |
| $ | 1,218 |
|
|
|
|
|
|
| ||
Share Activity: |
|
|
|
|
| ||
Shares issued: |
|
|
|
|
| ||
Class A |
| — |
| 6,529 |
| ||
Class I |
| 9,270 |
| 8,586 |
| ||
|
| 9,270 |
| 15,115 |
| ||
Shares issued-reinvested from distributions: |
|
|
|
|
| ||
Class I |
| 399 |
| 7 |
| ||
|
| 399 |
| 7 |
| ||
Shares redeemed: |
|
|
|
|
| ||
Class A |
| (6,529 | ) | — |
| ||
Class I |
| (1,772 | ) | — |
| ||
|
| (8,301 | ) | — |
| ||
Net increase (decrease) in shares outstanding: |
|
|
|
|
| ||
Class A |
| (6,529 | ) | 6,529 |
| ||
Class I |
| 7,897 |
| 8,593 |
| ||
|
| 1,368 |
| 15,122 |
| ||
(a) Commenced operations on Novermber 8, 2004. The inception date for the offering of share Class A was March 1, 2005.
The notes to the financial statements are an integral part of this report.
163
TA IDEX UBS Large Cap Value
FINANCIAL HIGHLIGHTS
(unaudited for the period ended April 30, 2006)
|
| For a share of beneficial interest outstanding throughout each period |
| ||||||||||||||
|
| Net Asset |
| Investment Operations |
| Distributions |
| Net Asset |
| ||||||||
|
| Value, |
| Net |
| Net Realized |
|
|
| From Net |
| From Net |
|
|
| Value, |
|
|
| Beginning |
| Investment |
| and Unrealized |
| Total |
| Investment |
| Realized |
| Total |
| End |
|
For the Period Ended(d)(e) |
| of Period |
| Income (Loss) |
| Gain (Loss) |
| Operations |
| Income |
| Gains |
| Distributions |
| of Period |
|
4/30/2006 |
| 10.95 |
| 0.07 |
| 1.23 |
| 1.30 |
| (0.10 | ) | (0.18 | ) | (0.28 | ) | 11.97 |
|
10/31/2005 |
| 10.00 |
| 0.12 |
| 0.84 |
| 0.96 |
| (0.01 | ) | — |
| (0.01 | ) | 10.95 |
|
|
|
|
| Ratios/Supplemental Data |
| ||||||
|
|
|
| Net Assets, |
|
|
| Net Investment |
|
|
|
|
|
|
| End of |
| Ratio of Expenses |
| Income (Loss) |
| Portfolio |
|
|
| Total |
| Period |
| to Average |
| to Average |
| Turnover |
|
For the Period Ended (e) |
| Return (c) |
| (000’s) |
| Net Assets (a) |
| Net Assets (a) |
| Rate (b) |
|
4/30/2006 |
| 12.07 |
| 197,416 |
| 0.88 |
| 1.27 |
| 15 |
|
10/31/2005 |
| 9.60 |
| 94,135 |
| 0.92 |
| 1.14 |
| 43 |
|
(a) Annualized.
(b) Not annualized.
(c) Total Return has been calculated for the applicable period without deduction of a sales load, if any, on a initial purchase. Not annualized.
(d) Per share information is caluclated based on average number of shares outstanding.
(e) TA IDEX UBS Large Cap Value (“the Fund”) commenced operations on November 8, 2004.
The notes to the financial statements are an integral part of this report.
164
TA IDEX Van Kampen Emerging Markets Debt
STATEMENT OF ASSETS AND LIABILITIES
At April 30, 2006
(all amounts except per share amounts in thousands)
(unaudited)
Assets: |
|
|
| |
Investment securities, at value (cost: $373,520) |
| $ | 378,714 |
|
Cash |
| 27,649 |
| |
Cash on deposit with brokers |
| 160 |
| |
Receivables: |
|
|
| |
Investment securities sold |
| 6,143 |
| |
Shares of beneficial interest sold |
| 457 |
| |
Interest |
| 6,174 |
| |
Variation margin |
| 133 |
| |
|
| 419,430 |
| |
Liabilities: |
|
|
| |
Investment securities purchased |
| 10,627 |
| |
Accounts payable and accrued liabilities: |
|
|
| |
Management and advisory fees |
| 303 |
| |
Administration fees |
| 7 |
| |
Dividends to shareholders |
| 623 |
| |
Written options (premiums $96) |
| 4 |
| |
Other |
| 7 |
| |
|
| 11,571 |
| |
Net Assets |
| $ | 407,859 |
|
Net Assets Consist of: |
|
|
| |
Shares of beneficial interest, unlimited shares authorized, no par value |
| 398,737 |
| |
Distributable net investment income (loss) |
| 388 |
| |
Accumulated net realized gain (loss) from investment securities , futures contracts and foreign currency transactions |
| 3,416 |
| |
Net unrealized appreciation (depreciation) on: |
|
|
| |
Investment securities |
| 5,194 |
| |
Futures contracts |
| 31 |
| |
Written option contracts |
| 93 |
| |
Net Assets |
| $ | 407,859 |
|
Shares Outstanding |
| 38,411 |
| |
Net Asset Value and Offering Price Per Share |
| $ | 10.62 |
|
The notes to the financial statements are an integral part of this report.
165
TA IDEX Van Kampen Emerging Markets Debt
STATEMENT OF OPERATIONS
For the period ended April 30, 2006
(all amounts in thousands)
(unaudited)
Investment Income: |
|
|
| |
Interest |
| $ | 9,378 |
|
Expenses: |
|
|
| |
Management and advisory fees |
| 1,429 |
| |
Distribution and service fees: |
|
|
| |
Class A |
| 18 |
| |
Transfer agent fees |
| 1 |
| |
Custody fees |
| 61 |
| |
Administration fees |
| 30 |
| |
Legal fees |
| 6 |
| |
Audit fees |
| 9 |
| |
Trustees fees |
| 5 |
| |
Registration fees |
| 1 |
| |
Other |
| 1 |
| |
Total expenses |
| 1,561 |
| |
Net Investment Income (Loss) |
| 7,817 |
| |
Net Realized Gain (Loss) from: |
|
|
| |
Investment securities |
| 3,472 |
| |
Futures contracts |
| 521 |
| |
Foreign currency transactions |
| (5 | ) | |
|
| 3,988 |
| |
Net Increase (Decrease) in Unrealized Appreciation (Depreciation) on: |
|
|
| |
Investment securities |
| 385 |
| |
Futures contracts |
| (436 | ) | |
Written option contracts |
| 93 |
| |
|
| 42 |
| |
Net Realized and Unrealized Gain (Loss) on Investment Securities, Futures Contracts, Written Options and Foreign Currency Transactions |
| 4,030 |
| |
Net Increase (Decrease) in Net Assets Resulting from Operations |
| $ | 11,847 |
|
The notes to the financial statements are an integral part of this report.
166
TA IDEX Van Kampen Emerging Markets Debt
STATEMENTS OF CHANGES IN NET ASSETS
For the periods ended
(all amounts in thousands)
|
| April 30, |
| October 31, |
| ||
|
|
|
|
|
| ||
Increase (Decrease) in Net Assets From: |
|
|
|
|
| ||
Operations: |
|
|
|
|
| ||
Net investment income (loss) |
| $ | 7,817 |
| $ | 6,211 |
|
Net realized gain (loss) from investment securities, futures contracts and foreign currency transactions |
| 3,988 |
| 1,096 |
| ||
Change in unrealized appreciation (depreciation) on investment securities, futures contracts and written options |
| 42 |
| 5,276 |
| ||
|
| 11,847 |
| 12,583 |
| ||
Distributions to Shareholders: |
|
|
|
|
| ||
From net investment income: |
|
|
|
|
| ||
Class A |
| (246 | ) | (2,621 | ) | ||
Class I |
| (7,158 | ) | (3,615 | ) | ||
|
| (7,404 | ) | (6,236 | ) | ||
From net realized gains: |
|
|
|
|
| ||
Class I |
| (1,668 | ) | — |
| ||
|
| (1,668 | ) | — |
| ||
Capital Share Transactions: |
|
|
|
|
| ||
Proceeds from shares sold: |
|
|
|
|
| ||
Class A |
| 4,012 |
| 119,971 |
| ||
Class I |
| 405,095 |
| 129,575 |
| ||
|
| 409,107 |
| 249,546 |
| ||
Dividends and distributions reinvested: |
|
|
|
|
| ||
Class A |
| 460 |
| 2,378 |
| ||
Class I |
| 8,287 |
| 3,333 |
| ||
|
| 8,747 |
| 5,711 |
| ||
Cost of shares redeemed: |
|
|
|
|
| ||
Class A |
| (130,675 | ) | — |
| ||
Class I |
| (143,699 | ) | — |
| ||
|
| (274,374 | ) | — |
| ||
|
| 143,480 |
| 255,257 |
| ||
Net increase (decrease) in net assets |
| 146,255 |
| 261,604 |
| ||
Net Assets: |
|
|
|
|
| ||
Beginning of period |
| 261,604 |
| — |
| ||
End of period |
| $ | 407,859 |
| $ | 261,604 |
|
Distributable Net Investment Income (Loss) |
| $ | 388 |
| $ | (25 | ) |
|
|
|
|
|
| ||
Share Activity: |
|
|
|
|
| ||
Shares issued: |
|
|
|
|
| ||
Class A |
| 384 |
| 11,788 |
| ||
Class I |
| 38,204 |
| 12,685 |
| ||
|
| 38,588 |
| 24,473 |
| ||
Shares issued-reinvested from distributions: |
|
|
|
|
| ||
Class A |
| 44 |
| 232 |
| ||
Class I |
| 781 |
| 325 |
| ||
|
| 825 |
| 557 |
| ||
Shares redeemed: |
|
|
|
|
| ||
Class A |
| (12,448 | ) | — |
| ||
Class I |
| (13,584 | ) | — |
| ||
|
| (26,032 | ) | — |
| ||
Net increase (decrease) in shares outstanding: |
|
|
|
|
| ||
Class A |
| (12,020 | ) | 12,020 |
| ||
Class I |
| 25,401 |
| 13,010 |
| ||
|
| 13,381 |
| 25,030 |
| ||
(a) Commenced operations on November 8, 2004. The inception date for the offering of share Class A was March 1, 2005.
The notes to the financial statements are an integral part of this report.
167
TA IDEX Van Kampen Emerging Markets Debt
FINANCIAL HIGHLIGHTS
(unaudited for the period ended April 30, 2006)
|
| For a share of beneficial interest outstanding throughout each period |
| ||||||||||||||
|
| Net Asset |
| Investment Operations |
| Distributions |
| Net Asset |
| ||||||||
|
| Value, |
| Net |
| Net Realized |
|
|
| From Net |
| From Net |
|
|
| Value, |
|
|
| Beginning |
| Investment |
| and Unrealized |
| Total |
| Investment |
| Realized |
| Total |
| End |
|
For the Period Ended (d)(e) |
| of Period |
| Income (Loss) |
| Gain (Loss) |
| Operations |
| Income |
| Gains |
| Distributions |
| of Period |
|
4/30/2006 |
| 10.45 |
| 0.27 |
| 0.23 |
| 0.50 |
| (0.26 | ) | (0.07 | ) | (0.33 | ) | 10.62 |
|
10/31/2005 |
| 10.00 |
| 0.49 |
| 0.45 |
| 0.94 |
| (0.49 | ) | — |
| (0.49 | ) | 10.45 |
|
|
|
|
| Ratios/Supplemental Data |
| ||||||
|
|
|
| Net Assets, |
|
|
| Net Investment |
|
|
|
|
|
|
| End of |
| Ratio of Expenses |
| Income (Loss) |
| Portfolio |
|
|
| Total |
| Period |
| to Average |
| to Average |
| Turnover |
|
For the Period Ended (e) |
| Return (c) |
| (000’s) |
| Net Assets |
| Net Assets (a) |
| Rate (b) |
|
4/30/2006 |
| 4.84 |
| 407,859 |
| 1.02 |
| 5.17 |
| 49 |
|
10/31/2005 |
| 9.36 |
| 136,022 |
| 1.07 |
| 4.91 |
| 67 |
|
(a) Annualized.
(b) Not annualized.
(c) Total Return has been calculated for the applicable period without deduction of a sales load, if any, on an initial purchase. Not annualized.
(d) Per share information is calculated based on average number of shares outstanding.
(e) TA IDEX Van Kampen Emerging Markets Debt (“the Fund”) commenced operations on November 8, 2004.
The notes to the financial statements are an integral part of this report.
168
TA IDEX Van Kampen Mid-Cap Growth
STATEMENT OF ASSETS AND LIABILITIES
At April 30, 2006
(all amounts except per share amounts in thousands)
(unaudited)
Assets: |
|
|
| |
Investment securities, at value (cost: $52,200) |
| $ | 54,611 |
|
Cash |
| 3,487 |
| |
Receivables: |
|
|
| |
Investment securities sold |
| 111 |
| |
Shares of beneficial interest sold |
| 562 |
| |
Interest |
| 9 |
| |
Dividends |
| 4 |
| |
|
| 58,784 |
| |
Liabilities: |
|
|
| |
Investment securities purchased |
| 2,515 |
| |
Accounts payable and accrued liabilities: |
|
|
| |
Management and advisory fees |
| 33 |
| |
Administration fees |
| 1 |
| |
Other |
| 13 |
| |
|
| 2,562 |
| |
Net Assets |
| $ | 56,222 |
|
Net Assets Consist of: |
|
|
| |
Shares of beneficial interest, unlimited shares authorized, no par value |
| 53,696 |
| |
Distributable net investment income (loss) |
| 53 |
| |
Accumulated net realized gain (loss) from investment securities |
| 62 |
| |
Net unrealized appreciation (depreciation) on investment securities |
| 2,411 |
| |
Net Assets |
| $ | 56,222 |
|
Shares Outstanding |
| 5,209 |
| |
Net Asset Value and Offering Price Per Share |
| $ | 10.79 |
|
The notes to the financial statements are an integral part of this report.
169
TA IDEX Van Kampen Mid-Cap Growth
STATEMENT OF OPERATIONS
For the period ended April 30, 2006 (a)
(all amounts in thousands)
(unaudited)
Investment Income: |
|
|
| |
Dividends |
| 142 |
| |
Interest |
| $ | 26 |
|
|
| 168 |
| |
Expenses: |
|
|
| |
Management and advisory fees |
| 94 |
| |
Custody fees |
| 10 |
| |
Administration fees |
| 2 |
| |
Audit fees |
| 7 |
| |
Registration fees |
| 1 |
| |
Other |
| 1 |
| |
Total expenses |
| 115 |
| |
Net Investment Income (Loss) |
| 53 |
| |
Net Realized and Unrealized Gain (Loss) |
|
|
| |
Realized gain (loss) from investment securities |
| 62 |
| |
Increase (decrease) in unrealized appreciation (depreciation) on investment securities |
| 2,411 |
| |
Net Realized and Unrealized Gain (Loss) on Investment Securities |
| 2,473 |
| |
Net Increase (Decrease) in Net Assets Resulting from Operations |
| $ | 2,526 |
|
(a) Commenced operations on January 3, 2006.
The notes to the financial statements are an integral part of this report.
170
TA IDEX Van Kampen Mid-Cap Growth
STATEMENT OF CHANGES IN NET ASSETS
For the period ended
(all amounts in thousands)
|
| April 30, |
| |
Increase (Decrease) in Net Assets From: |
|
|
| |
Operations: |
|
|
| |
Net investment income (loss) |
| $ | 53 |
|
Net realized gain (loss) from investment securities |
| 62 |
| |
Change in unrealized appreciation (depreciation) on investment securities |
| 2,411 |
| |
|
| 2,526 |
| |
Capital Share Transactions: |
|
|
| |
Proceeds from shares sold: |
|
|
| |
|
| 53,696 |
| |
|
| 53,696 |
| |
Net increase (decrease) in net assets |
| 56,222 |
| |
Net Assets: |
|
|
| |
Beginning of period |
| — |
| |
End of period |
| $ | 56,222 |
|
Distributable Net Investment Income (Loss) |
| $ | 53 |
|
Share Activity: |
|
|
| |
Shares issued: |
|
|
| |
|
| 5,209 |
| |
Net increase (decrease) in shares outstanding: |
| 5,209 |
| |
(a) Commenced operations on January 3, 2006.
The notes to the financial statements are an integral part of this report.
171
TA IDEX Van Kampen Mid-Cap Growth
FINANCIAL HIGHLIGHTS
(unaudited)
|
| For a share of beneficial interest outstanding throughout each period |
| ||||||||||||||||||||||
|
| Net Asset |
| Investment Operations |
| Distributions |
| Net Asset |
| ||||||||||||||||
|
| Value, |
| Net |
| Net Realized |
|
|
| From Net |
| From Net |
|
|
| Value, |
| ||||||||
|
| Beginning |
| Investment |
| and Unrealized |
| Total |
| Investment |
| Realized |
| Total |
| End |
| ||||||||
For the Period Ended (d)(e) |
| of Period |
| Income (Loss) |
| Gain (Loss) |
| Operations |
| Income |
| Gains |
| Distributions |
| of Period |
| ||||||||
4/30/2006 |
| $ | 10.00 |
| $ | 0.02 |
| $ | 0.77 |
| $ | 0.79 |
| $ | — |
| $ | — |
| $ | — |
| $ | 10.79 |
|
|
|
|
| Ratios/Supplemental Data |
| |||||||
|
|
|
| Net Assets, |
|
|
| Net Investment |
|
|
| |
|
|
|
| End of |
| Ratio of Expenses |
| Income (Loss) |
| Portfolio |
| |
|
| Total |
| Period |
| to Average |
| to Average |
| Turnover |
| |
For the Period Ended (e) |
| Return (c) |
| (000’s) |
| Net Assets (a) |
| Net Assets (a) |
| Rate (b) |
| |
4/30/2006 |
| 7.90 | % | $ | 56,222 |
| 0.98 | % | 0.45 | % | 21 | % |
(a) Annualized.
(b) Not annualized.
(c) Total Return has been calculated for the applicable period without deduction of a sales load, if any, on an initial purchase. Not annualized.
(d) Per share information is calculated based on average number of shares outstanding.
(e) TA IDEX Van Kampen Mid-Cap Growth (“the Fund”) commenced operations on January 3, 2006.
The notes to the financial statements are an integral part of this report.
172
TA IDEX Van Kampen Small Company Growth
STATEMENT OF ASSETS AND LIABILITIES
At April 30, 2006
(all amounts except per share amounts in thousands)
(unaudited)
Assets: |
|
|
|
| |
Investment securities, at value (cost: $334,184) |
| $ | 369,998 |
|
|
Cash |
| 17,688 |
|
| |
Receivables: |
|
|
|
| |
Investment securities sold |
| 6,481 |
|
| |
Shares of beneficial interest sold |
| 416 |
|
| |
Interest |
| 69 |
|
| |
Income from loaned securities |
| 27 |
|
| |
Dividends |
| 22 |
|
| |
|
| 394,701 |
|
| |
Liabilities: |
|
|
|
| |
Investment securities purchased |
| 10,470 |
|
| |
Accounts payable and accrued liabilities: |
|
|
|
| |
Management and advisory fees |
| 234 |
|
| |
Administration fees |
| 5 |
|
| |
Payable for collateral for securities on loan |
| 78,150 |
|
| |
Other |
| 18 |
|
| |
|
| 88,877 |
|
| |
Net Assets |
| $ | 305,824 |
|
|
Net Assets Consist of: |
|
|
|
| |
Shares of beneficial interest, unlimited shares authorized, no par value |
| 260,193 |
|
| |
Distributable net investment income (loss) |
| (303 | ) |
| |
|
|
|
|
| |
Accumulated net realized gain (loss) from investment securities |
| 10,120 |
|
| |
Net unrealized appreciation (depreciation) on investment securities |
| 35,814 |
|
| |
Net Assets |
| $ | 305,824 |
|
|
|
|
|
|
| |
Shares Outstanding |
| 23,034 |
|
| |
|
|
|
|
| |
Net Asset Value and Offering Price Per Share |
| $ | 13.28 |
|
|
The notes to the financial statements are an integral part of this report.
173
TA IDEX Van Kampen Small Company Growth
STATEMENT OF OPERATIONS
For the period ended April 30, 2006
(all amounts in thousands)
(unaudited)
Investment Income: |
|
|
| |
Interest |
| $ | 198 |
|
Dividends |
| 386 |
| |
Income from loaned securities-net |
| 433 |
| |
|
| 1,017 |
| |
Expenses: |
|
|
| |
Management and advisory fees |
| 1,205 |
| |
Distribution and service fees: |
|
|
| |
Class A |
| 11 |
| |
Custody fees |
| 20 |
| |
Administration fees |
| 25 |
| |
Legal fees |
| 5 |
| |
Audit fees |
| 9 |
| |
Trustees fees |
| 4 |
| |
Registration fees |
| 2 |
| |
Other |
| 2 |
| |
Total expenses |
| 1,283 |
| |
Net Investment Income (Loss) |
| (266 | ) | |
Net Realized and Unrealized Gain (Loss) |
|
|
| |
Realized gain (loss) from investment securities |
| 10,167 |
| |
|
|
|
| |
Increase (decrease) in unrealized appreciation (depreciation) on investment securities |
| 32,204 |
| |
|
|
|
| |
Net Realized and Unrealized Gain (Loss) on Investment Securities |
| 42,371 |
| |
|
|
|
| |
Net Increase (Decrease) in Net Assets Resulting from Operations |
| $ | 42,105 |
|
The notes to the financial statements are an integral part of this report.
174
TA IDEX Van Kampen Small Company Growth
STATEMENTS OF CHANGES IN NET ASSETS
For the periods ended
(all amounts in thousands)
|
| April 30, |
| October 31, |
| ||
Increase (Decrease) in Net Assets From: |
|
|
|
|
| ||
Operations: |
|
|
|
|
| ||
Net investment income (loss) |
| $ | (266 | ) | $ | 99 |
|
|
|
|
|
|
| ||
Net realized gain (loss) from investment securities |
| 10,167 |
| 3,119 |
| ||
|
|
|
|
|
| ||
Change in unrealized appreciation (depreciation) on investment securities |
| 32,204 |
| 3,610 |
| ||
|
| 42,105 |
| 6,828 |
| ||
Distributions to Shareholders: |
|
|
|
|
| ||
From net investment income: |
|
|
|
|
| ||
Class I |
| (136 | ) | — |
| ||
|
| (136 | ) | — |
| ||
From net realized gains: |
|
|
|
|
| ||
Class I |
| (3,166 | ) | — |
| ||
|
| (3,166 | ) | — |
| ||
Capital Share Transactions: |
|
|
|
|
| ||
Proceeds from shares sold: |
|
|
|
|
| ||
Class A |
| 2,856 |
| 71,534 |
| ||
Class I |
| 179,175 |
| 82,745 |
| ||
|
| 182,031 |
| 154,279 |
| ||
Dividends and distributions reinvested: |
|
|
|
|
| ||
Class I |
| 3,302 |
| — |
| ||
|
| 3,302 |
| — |
| ||
Cost of shares redeemed: |
|
|
|
|
| ||
Class A |
| (79,117 | ) | — |
| ||
Class I |
| (302 | ) | — |
| ||
|
| (79,419) |
| — |
| ||
|
| 105,914 |
| 154,279 |
| ||
Net increase (decrease) in net assets |
| 144,717 |
| 161,107 |
| ||
Net Assets: |
|
|
|
|
| ||
Beginning of period |
| 161,107 |
| — |
| ||
End of period |
| $ | 305,824 |
| $ | 161,107 |
|
Distributable Net Investment Income (Loss) |
| $ | (303 | ) | $ | 99 |
|
|
|
|
|
|
| ||
Share Activity: |
|
|
|
|
| ||
Shares issued: |
|
|
|
|
| ||
Class A |
| 248 |
| 6,633 |
| ||
Class I |
| 15,127 |
| 7,658 |
| ||
|
| 15,375 |
| 14,291 |
| ||
Shares issued-reinvested from distributions: |
|
|
|
|
| ||
Class I |
| 274 |
| — |
| ||
|
| 274 |
| — |
| ||
Shares redeemed: |
|
|
|
|
| ||
Class A |
| (6,881 | ) | — |
| ||
Class I |
| (25 | ) | — |
| ||
|
| (6,906) |
| — |
| ||
Net increase (decrease) in shares outstanding: |
|
|
|
|
| ||
Class A |
| (6,633 | ) | 6,633 |
| ||
Class I |
| 15,376 |
| 7,658 |
| ||
|
| 8,743 |
| 14,291 |
| ||
(a) Commenced operations on November 8, 2004. The inception date for the offering of Share Class A was March 1, 2005.
The notes to the financial statements are an integral part of this report.
175
TA IDEX Van Kampen Small Company Growth
FINANCIAL HIGHLIGHTS
(unaudited for the period ended April 30, 2006)
|
| For a share of beneficial interest outstanding throughout each period |
| ||||||||||||||
|
| Net Asset |
| Investment Operations |
| Distributions |
| Net Asset |
| ||||||||
|
| Value, |
| Net |
| Net Realized |
|
|
| From Net |
| From Net |
|
|
| Value, |
|
|
| Beginning |
| Investment |
| and Unrealized |
| Total |
| Investment |
| Realized |
| Total |
| End |
|
For the Period Ended(d)(e) |
| of Period |
| Income (Loss) |
| Gain (Loss) |
| Operations |
| Income |
| Gains |
| Distributions |
| of Period |
|
4/30/2006 |
| 11.29 |
| (0.01 | ) | 2.18 |
| 2.17 |
| (0.01 | ) | (0.17 | ) | (0.18 | ) | 13.28 |
|
10/31/2005 |
| 10.00 |
| 0.01 |
| 1.28 |
| 1.29 |
| — |
| — |
| — |
| 11.29 |
|
|
|
|
| Ratios/Supplemental Data |
| ||||||
|
|
|
| Net Assets, |
|
|
| Net Investment |
|
|
|
|
|
|
| End of |
| Ratio of Expenses |
| Income (Loss) |
| Portfolio |
|
|
| Total |
| Period |
| to Average |
| to Average |
| Turnover |
|
For the Period Ended (e) |
| Return (c) |
| (000’s) |
| Net Assets (a) |
| Net Assets (a) |
| Rate (b) |
|
4/30/2006 |
| 19.42 |
| 305,824 |
| 1.00 |
| (0.20 | ) | 42 |
|
10/31/2005 |
| 12.80 |
| 86,432 |
| 1.07 |
| 0.06 |
| 75 |
|
(a) Annualized.
(b) Not annualized.
(c) Total Return has been calculated for the applicable period without deduction of a sales load, if any, on an initial purchase. Not annualized.
(d) Per share information is calculated based on average number of shares outstanding.
(e) TA IDEX Van Kampen Small Company Growth (“the Fund”) commenced operations on November 8, 2004.
The notes to the financial statements are an integral part of this report.
176
TA IDEX Class I Funds
NOTES TO FINANCIAL STATEMENTS
At April 30, 2006
(all amounts in thousands)
(unaudited)
NOTE 1. ORGANIZATION AND SIGNIFICANT ACCOUNTING POLICIES
Transamerica IDEX Mutual Funds is an open-end management investment company registered under the Investment Company Act of 1940, as amended (the “1940 Act”). TA IDEX AllianceBernstein International Value (“AllianceBernstein International Value”), TA IDEX Evergreen International Small Cap (“Evergreen International Small Cap”), TA IDEX Federated Market Opportunity (“Federated Market Opportunity”), TA IDEX JPMorgan International Bond (“JPMorgan International Bond”), TA IDEX J.P. Morgan Mid Cap Value (“J.P. Morgan Mid Cap Value”), TA IDEX Marsico International Growth (“Marsico International Growth”), TA IDEX Mercury Global Allocation (“Mercury Global Allocation”), TA IDEX Mercury Large Cap Value (“Mercury Large Cap Value”), TA IDEX Neuberger Berman International (“Neuberger Berman International”), TA IDEX Oppenheimer Developing Markets (“Oppenheimer Developing Markets”), TA IDEX Transamerica Short-Term Bond (“Transamerica Short-Term Bond”), TA IDEX UBS Large Cap Value (“UBS Large Cap Value”), TA IDEX Van Kampen Emerging Markets Debt (“Van Kampen Emerging Markets Debt”), TA IDEX Van Kampen Mid-Cap Growth (“Van Kampen Mid-Cap Growth”), and TA IDEX Van Kampen Small Company Growth (“Van Kampen Small Company Growth”), (each a “Fund” and collectively “the Funds”), are part of Transamerica IDEX Mutual Funds.
Evergreen International Small Cap, Marsico International Growth, Transamerica Short-Term Bond, UBS Large Cap Value, Van Kampen Emerging Markets Debt andVan Kampen Small Company Growth commenced operations on November 8, 2004.
J.P. Morgan Mid Cap Value and Mercury Large Cap Value commenced operations on March 1, 2005 with Class A shares. J.P. Morgan Mid Cap Value and Mercury Large Cap Value commenced operations on Class I shares and converted Class A assets to Class I assets on November 15, 2005.
AllianceBernstein International Value, Federated Market Opportunity, JPMorgan International Bond, Mercury Global Allocation, Neuberger Berman International and Oppenheimer Developing Markets commenced operations on December 6, 2005.
Van Kampen Mid-Cap Growth commenced operations on January 3, 2006.
In the normal course of business, the Funds enter into contracts that contain a variety of representations that provide general indemnifications. The Funds’ maximum exposure under these arrangements is unknown, as this would involve future claims that may be made against the Funds and/or their affiliates that have not yet occurred. However, based on experience, the Funds expect the risk of loss to be remote.
This report should be read in conjunction with the Funds’ current prospectuses, which contain more complete information about the Funds.
In preparing the Funds’ financial statements in accordance with accounting principles generally accepted in the United States of America (“GAAP”), estimates or assumptions (which could differ from actual results) may be used that affect reported amounts and disclosures. The following is a summary of significant accounting policies followed by the Funds.
Multiple class operations, income and expenses: The Funds currently offer one class of shares, Class I shares, which are currently being offered for sale only to certain affiliated asset allocation funds. Effective November 16, 2005, Evergreen International Small Cap, J.P.Morgan Mid Cap Value, Marsico International
177
Growth, Mercury Large Cap Value, Transamerica Short-Term Bond, UBS Large Cap Value, Van Kampen Emerging Markets Debt and Van Kampen Small Company Growth ceased offering Class A shares. Income, non-class specific expenses and realized and unrealized gains and losses, were allocated daily to each class, based upon the value of shares outstanding method as permitted under Rule 18f-3 of the 1940 Act. Each class bore its own specific expenses as well as a portion of general, common expenses.
Security valuations: The Funds value their investments at the close of the New York Stock Exchange (“NYSE”), normally 4 p.m. ET, each day the NYSE is open for business. Fund investments are valued at the last sale price or closing price on the day of valuation taken from the primary exchange where the security is principally traded.
Securities traded in the over-the-counter market and listed securities for which no sale was reported on that date are valued at the last quoted bid price.
Debt securities are valued based on a price quotation or other equivalent indication of value supplied by an exchange, a pricing service or a major market maker; however, those that mature in sixty days or less are valued at amortized cost, which approximates market.
Investment company securities are valued at the net asset value of the underlying portfolio.
Foreign securities generally are valued based on quotations from the primary market in which they are traded. Because many foreign securities markets and exchanges close prior to the close of the NYSE, closing prices for foreign securities in those markets or on those exchanges do not reflect the events that occur after that close. If a significant market event impacting the value of a portfolio security (e.g., natural disaster, company announcement, market volatility) occurs subsequent to the close of trading in the security, but prior to the calculation of the Funds’ net asset value per share, market quotations for that security may be determined to be unreliable and, accordingly, not “readily available.” As a result, foreign equity securities held by the Funds may be valued at fair market value as determined in good faith by the Funds’ Administrative Valuation Committee, under the supervision of the Board’s Valuation Committee, using guidelines adopted by the Board of Trustees.
Other securities for which quotations are not readily available or whose values have been determined to be unreliable are valued at fair market value as determined in good faith by the Funds’ Administrative Valuation Committee, under the supervision of the Board’s Valuation Committee, using guidelines adopted by the Board of Trustees.
Cash: The Funds may leave cash overnight in its cash account with the custodian, Investors Bank & Trust Company (“IBT”). IBT has been contracted on behalf of the Funds to invest the excess cash into a savings account, which at April 30, 2006, was paying an interest rate of 3.24%.
Throughout the year, the Fund may have a cash overdraft balance. A fee is incurred on this overdraft, calculated by multiplying the overdraft by a rate based on the federal funds rate.
Repurchase agreements: The Funds are authorized to enter into repurchase agreements. The Funds, through their custodian, IBT, receive delivery of the underlying securities, the value of which at the time of purchase is required to be an amount equal to at least 100% of the resale price. The Funds will bear the risk of value fluctuations until the security can be sold and may encounter delays and incur costs in liquidating the security. In the event of bankruptcy or insolvency of the seller, delays and costs may be incurred.
Commission recapture: The sub-advisers of certain Funds, to the extent consistent with the best execution and usual commission rate policies and practices, have elected to place security transactions of the Funds with broker/dealers with which Transamerica IDEX Mutual Funds has established a Commission Recapture Program. A Commission Recapture Program is any arrangement under which a broker/dealer applies a portion of the commissions received by such broker/dealer on the security transactions to the Funds. In no event will commissions paid by the Funds be used to pay expenses that would otherwise be borne by any other funds within Transamerica IDEX Mutual Funds, or by any other party.
178
Recaptured commissions during the six months ended April 30, 2006 are included in net realized gains in the Statement of Operations and are summarized as follows:
Fund |
|
|
| Commissions |
|
AllianceBernstein International Value |
| $13 |
| ||
Evergreen International Small Cap |
| 13 |
| ||
Federated Market Opportunity |
| Less than $1 |
| ||
Neuberger Berman International |
| 41 |
| ||
UBS Large Cap Value |
| 12 |
| ||
Van Kampen Small Company Growth |
| 59 |
| ||
Securities lending: The Funds may lend securities to qualified borrowers, with IBT acting as the Funds’ lending agent. The Funds earn negotiated lenders’ fees. The Funds receive cash and/or securities as collateral against the loaned securities. Cash collateral received is invested in short term, interest bearing securities. The Funds monitor the market value of securities loaned on a daily basis and requires collateral in an amount at least equal to the value of the securities loaned. Income from loaned securities on the Statement of Operations is net of fees earned by IBT for its services, in the following amounts:
Fund |
|
|
| Fees |
| |
AllianceBernstein International Value |
| $ | 1 |
| ||
Evergreen International Small Cap |
| 35 |
| |||
J.P. Morgan Mid Cap Value |
| 9 |
| |||
Marsico International Growth |
| 28 |
| |||
Mercury Global Allocation |
| 3 |
| |||
Mercury Large Cap Value |
| 6 |
| |||
Neuberger Berman International |
| 13 |
| |||
Transamerica Short-Term Bond |
| 2 |
| |||
UBS Large Cap Value |
| 3 |
| |||
Van Kampen Small Company Growth |
| 185 |
| |||
Real Estate Investment Trusts (“REITs”): There are certain additional risks involved in investing in REITs. These include, but are not limited to, economic conditions, changes in zoning laws, real estate values, property taxes and interest rates.
Dividend income is recorded at management’s estimate of the income included in distributions from the REIT investments. Distributions received in excess of the estimated amount are recorded as a reduction of the cost of investments. The actual amounts of income, return of capital and capital gains are only determined by each REIT after the fiscal year end and may differ from the estimated amounts.
Security transactions and investment income: Security transactions are recorded on the trade date. Security gains and losses are calculated on the specific identification basis. Dividend income, if any, is recorded on the ex-dividend date or, in the case of foreign securities, as soon as the Funds are informed of the ex-dividend date. Interest income, including accretion of discounts and amortization of premiums, is recorded on the accrual basis commencing on the settlement date.
Foreign currency denominated investments: The accounting records of the Funds are maintained in U.S. dollars. Securities and other assets and liabilities denominated in foreign currencies are translated into U.S. dollars at the closing exchange rate each day. The cost of foreign securities is translated at the exchange rate in effect when the investment was acquired. Each Fund combines fluctuations from currency exchange rates and fluctuations in value when computing net realized and unrealized gains or losses from investments.
Net foreign currency gains and losses resulting from changes in exchange rates include: 1) foreign currency fluctuations between trade date and settlement date of investment security transactions; 2) gains and losses
179
on forward foreign currency contracts; and 3) the difference between the receivable amounts of interest and dividends recorded in the accounting records in U.S. dollars and the amounts actually received.
Foreign currency denominated assets may involve risks not typically associated with domestic transactions. These risks include revaluation of currencies, adverse fluctuations in foreign currency values and possible adverse political, social and economic developments, including those particular to a specific industry, country or region.
Foreign capital gains taxes: The Funds may be subject to taxes imposed by countries in which they invest, with respect to their investments in issuers existing or operating in such countries. Such taxes are generally based on income earned or repatriated and capital gains realized on the sale of such investments. The Funds accrue such taxes when the related income or capital gains are earned. Some countries require governmental approval for the repatriation of investment income, capital or the proceeds of sales earned by foreign investors. In addition, if there is deterioration in a country’s balance of payments or for other reasons, a country may impose temporary restrictions on foreign capital remittances abroad.
Forward foreign currency contracts: The Funds may enter into forward foreign currency contracts to hedge against exchange rate risk arising from investments in securities denominated in foreign currencies. Contracts are valued at the contractual forward rate and are marked to market daily, with the change in value recorded as an unrealized gain or loss. When the contracts are settled a realized gain or loss is incurred. Risks may arise from changes in market value of the underlying currencies and from the possible inability of counterparties to meet the terms of their contracts.
Open forward currency contracts at April 30, 2006 are listed in the Schedules of Investments.
Futures contracts: The Funds may enter into futures contracts to manage exposure to market, interest rate or currency fluctuations. Futures contracts are valued at the settlement price established each day by the board of trade or exchange on which they are traded. The primary risks associated with futures contracts are imperfect correlation between the change in market value of the securities held and the prices of futures contracts; the possibility of an illiquid market and inability of the counterparty to meet the contract terms.
Open futures contracts at April 30, 2006 are listed in the Schedules of Investments.
Option contracts: The Funds may enter into options contracts to manage exposure to market fluctuations. Options are valued at the average of the bid and ask (“Mean Quote”) established each day at the close of the board of trade or exchange on which they are traded. The primary risks associated with options are imperfect correlation between the change in value of the securities held and the prices of the options contracts; the possibility of an illiquid market and inability of the counterparty to meet the contracts terms. When a Fund writes a covered call or put option, an amount equal to the premium received by a Fund is included in the Fund’s Statement of Assets and Liabilities as an asset and as an equivalent liability. Options are marked-to-market daily to reflect the current value of the option written.
The underlying face amounts of open option contracts at April 30, 2006 are listed in the Schedule of Investments.
Transactions in written call and put options were as follows:
Van Kampen Emerging Markets Debt |
|
|
| Premium |
| Contracts* |
| |
Beginning Balance October 31, 2005 |
| $ | — |
| — |
| ||
Sales |
| 96 |
| 8,773,450 |
| |||
Closing Buys |
| — |
| — |
| |||
Expirations |
| — |
| — |
| |||
Exercised |
| — |
| — |
| |||
Balance at April 30, 2006 |
| $ | 96 |
| 8,773,450 |
| ||
* Contracts not in thousands
180
Mercury Global Allocation |
|
|
| Premium |
| Contracts* |
| |
Beginning Balance December 6, 2005 |
| $ | — |
| — |
| ||
Sales |
| 767 |
| 2,875 |
| |||
Closing Buys |
| — |
| — |
| |||
Expirations |
| — |
| — |
| |||
Exercised |
| — |
| — |
| |||
Balance at April 30, 2006 |
| $ | 767 |
| 2,875 |
| ||
* Contracts not in thousands
Dividend distributions: Distributions to shareholders are recorded on the ex-dividend date and are determined in accordance with Federal income tax regulations which may differ from GAAP.
NOTE 2. RELATED PARTY TRANSACTIONS
Transamerica Fund Advisors, Inc. (“TFAI”) is the Funds’ investment adviser. Transamerica Fund Services, Inc. (“TFS”) is the Funds’ administrator and transfer agent. AFSG Securities Corp. (“AFSG”) is the Funds’ distributor/principal underwriter. TFAI, TFS, and AFSG are affiliates of AEGON, NV, a Netherlands corporation.
100% of Fund assets are owned by affiliated investment companies.
Investment advisory fees: The Funds pay management fees to TFAI based on average daily net assets (“ANA”) at the following breakpoints:
Fund |
|
|
| Breakpoints |
AllianceBernstein International Value |
| 0.88% of the first $200 million of ANA | ||
Evergreen International Small Cap |
| 1.07% of the first $250 million of ANA | ||
Federated Market Opportunity |
| 0.85% of the first $30 million of ANA | ||
JPMorgan International Bond |
| 0.55% of the first $100 million of ANA | ||
J.P. Morgan Mid Cap Value |
| 0.85% of the first $100 million of ANA | ||
Marsico International Growth |
| 1.06% of the first $300 million of ANA | ||
Mercury Global Allocation |
| 0.80% of the first $100 million of ANA | ||
Mercury Large Cap Value |
| 0.80% of the first $250 million of ANA | ||
Neuberger Berman International |
| 1.00% of the first $100 million of ANA | ||
181
Oppenheimer Developing Markets |
| 1.20% of the first $50 million of ANA |
Transamerica Short-Term Bond |
| 0.65% of the first $250 million of ANA |
UBS Large Cap Value |
| From November 1, 2005 through December 31, 2005: |
Van Kampen Emerging Markets Debt |
| 0.95% of the first $250 million of ANA |
Van Kampen Mid-Cap Growth |
| 0.80% of ANA |
Van Kampen Small Company Growth |
| 0.95% of the first $500 million of ANA |
TFAI has contractually agreed to waive its advisory fee and will reimburse each Fund to the extent that operating expenses, excluding 12b-1 fees, exceed the following stated annual limit:
Fund |
|
|
| Expense Limit |
AllianceBernstein International Value |
| 1.13% | ||
Evergreen International Small Cap* |
| 1.32% | ||
Federated Market Opportunity |
| 1.05% | ||
JPMorgan International Bond |
| 0.75% | ||
J.P. Morgan Mid Cap Value* |
| 1.05% | ||
Marsico International Growth* |
| 1.31% | ||
Mercury Global Allocation |
| 1.00% | ||
Mercury Large Cap Value* |
| 1.00% | ||
Neuberger Berman International |
| 1.25% | ||
Oppenheimer Developing Markets |
| 1.45% | ||
Transamerica Short-Term Bond* |
| 0.85% | ||
UBS Large Cap Value* |
| 1.05% (from November 1, 2005 through | ||
Van Kampen Emerging Markets Debt* |
| 1.15% | ||
Van Kampen Mid-Cap Growth |
| 1.00% | ||
Van Kampen Small Company Growth* |
| 1.15% | ||
* If total Fund expenses fall below the annual expense limitation agreement agreed to by the adviser within the succeeding three years, the Funds may be required to pay the adviser a portion or all of the reimbursed class expenses.
There are no amounts available for recapture at April 30, 2006.
182
Administrative services: The Funds have entered into an agreement with TFS for financial and legal fund administration services. Each Fund pays TFS an annual fee of 0.02% of ANA. The Legal fees on the Statements of Operations are fees paid to external legal counsel.
Transfer agent fees: Each Fund pays TFS an annual per-account charge for each open and closed account. The Funds paid TFS the following amounts for the period from inception through April 30, 2006:
Fund |
|
|
| Fees |
|
Evergreen International Small Cap |
| Less than $1 |
| ||
JPMorgan International Bond |
| Less than $1 |
| ||
Marsico International Growth |
| Less than $1 |
| ||
UBS Large Cap Value |
| Less than $1 |
| ||
Van Kampen Emerging Markets Debt |
| Less than $1 |
| ||
Van Kampen Small Company Growth |
| Less than $1 |
| ||
Brokerage commissions: Brokerage commissions incurred on security transactions placed with an affiliate of the advisor for the six months ended April 30, 2006 were $13 and $7 for Mercury Global Allocation and Van Kampen Small Company Growth, respectively.
NOTE 3. INVESTMENT TRANSACTIONS
The cost of securities purchased and proceeds from securities sold (excluding short-term securities) for the period from inception through April 30, 2006 were as follows:
|
| Purchase of Securities |
| Proceeds of Sales |
| ||||||||||
Fund |
|
|
| Long Term |
| U.S. |
| Long Term |
| U.S. |
| ||||
AllianceBernstein International Value |
| $ | 198,983 |
| $ | — |
| $ | 19,491 |
| $ | — |
| ||
Evergreen International Small Cap |
| 178,498 |
| — |
| 168,835 |
| — |
| ||||||
Federated Market Opportunity |
| 23,476 |
| 39,258 |
| 3,595 |
| — |
| ||||||
JPMorgan International Bond |
| 527,041 |
| — |
| 203,574 |
| — |
| ||||||
J.P. Morgan Mid Cap Value |
| 68,391 |
| — |
| 58,068 |
|
|
| ||||||
Marsico International Growth |
| 245,099 |
| — |
| 324806 |
| — |
| ||||||
Mercury Global Allocation |
| 217,891 |
| 58,172 |
| 22,293 |
| 11,824 |
| ||||||
Mercury Large Cap Value |
| 198,140 |
| — |
| 110,765 |
| — |
| ||||||
Neuberger Berman International |
| 448,385 |
| — |
| 82,302 |
| — |
| ||||||
Oppenheimer Developing Markets |
| 393,663 |
| — |
| 108,982 |
| — |
| ||||||
Transamerica Short-Term Bond |
| 101,579 |
| 7,808 |
| 70,583 |
| 7,791 |
| ||||||
UBS Large Cap Value |
| 37,273 |
| — |
| 26,415 |
| — |
| ||||||
Van Kampen Emerging Markets Debt |
| 274,574 |
| — |
| 142,468 |
| — |
| ||||||
Van Kampen Mid-Cap Growth |
| 59,407 |
| — |
| 7,269 |
| — |
| ||||||
Van Kampen Small Company Growth |
| 198,729 |
| — |
| 101,065 |
| — |
| ||||||
183
NOTE 4. FEDERAL INCOME TAX MATTERS
The Funds have not made any provision for federal income or excise taxes due to their policy to distribute all of their taxable income and capital gains to their shareholders and otherwise qualify as regulated investment companies under Subchapter M of the Internal Revenue Code. Income and capital gain distributions are determined in accordance with income tax regulations, which may differ from GAAP. These differences are primarily due to differing treatment for items including, but not limited to, wash sales and foreign currency transactions.
NOTE 5. REGULATORY PROCEEDINGS
There continues to be significant federal and state regulatory activity relating to financial services companies, particularly mutual fund companies and their investment advisers. As part of an ongoing investigation regarding potential market timing, recordkeeping and trading compliance issues and matters affecting the Funds’ investment adviser, TFAI, and certain affiliates and former employees of TFAI, the SEC staff has indicated that it is likely to take some action against TFAI and certain of its affiliates at the conclusion of the investigation. The potential timing and the scope of any such action is difficult to predict. Although the impact of any action brought against TFAI and/or its affiliates is difficult to assess at the present time, the Funds currently believe that the likelihood that any such action will have a material adverse impact on them is remote. It is important to note that the Funds are not aware of any allegation of wrongdoing against them and their Board at the time this semi-annual report is printed. Although it is not anticipated that these developments will have an adverse impact on the Funds, there can be no assurance at this time. TFAI and its affiliates are actively working with the SEC in regard to this matter; however, the exact resolution cannot be determined at this time. TFAI will take such actions that it deems necessary or appropriate to continue providing management services to the Funds and to bring all matters to an appropriate conclusion.
TFAI and/or its affiliates, and not the Funds, will bear the costs regarding these regulatory matters.
184
TA IDEX ALLIANCEBERNSTEIN INTERNATIONAL VALUE
INVESTMENT ADVISORY AND SUB-ADVISORY AGREEMENTS - REVIEW AND APPROVAL (unaudited)
At a meeting of the Board of Trustees of Transamerica IDEX Mutual Funds (“TA IDEX”) held on July 26, 2005, the Board reviewed and considered the proposed Investment Advisory Agreement between TA IDEX AllianceBernstein International Value (the “Fund”) and Transamerica Fund Advisors, Inc. (“TFAI”), as well as the proposed Investment Sub-Advisory Agreement of the Fund between TFAI and Alliance Capital Management, L.P. (the “Sub-Adviser”), to determine whether the agreements should be approved for an initial two-year period. Following their review and consideration, the Trustees determined that the proposed Investment Advisory Agreement and the proposed Investment Sub-Advisory Agreement will enable shareholders of the Fund to obtain high quality services at a cost that is appropriate, reasonable, and in the best interests of its shareholders. The Board, including the independent members of the Board, unanimously approved the proposed Investment Advisory Agreement and Investment Sub-Advisory Agreement. In reaching their decision, the Trustees requested and obtained from TFAI and the Sub-Adviser such information as they deemed reasonably necessary to evaluate the proposed agreements. The Trustees also carefully considered the comparative fee, expense and performance information of another fund managed by the Sub-Adviser that is managed in accordance with an investment program that closely resembles the proposed investment program of the Fund (the “Sub-Adviser’s Similar Fund”) prepared by Lipper Inc. (“Lipper”), independent providers of mutual fund performance, fee and expense information, and anticipated profitability data. In considering the proposed Investment Advisory Agreement and Investment Sub-Advisory Agreement, the Trustees evaluated a number of considerations that they believe, in light of the legal advice furnished to them by TA IDEX counsel and independent legal counsel and their own business judgment, to be relevant. They based their decisions on the following considerations, among others, although they did not identify any consideration or particular information that was controlling of their decisions:
The nature, extent and quality of the advisory service to be provided. The Board considered the nature, extent and quality of the services proposed to be provided by TFAI and the Sub-Adviser to the Fund. The Board concluded that TFAI and the Sub-Adviser are capable of providing high quality services to the Fund, as indicated by TFAI’s and the Sub-Adviser’s management capabilities demonstrated with respect to the funds they manage, and the experience, capability and integrity of TFAI’s senior management, the financial resources of TFAI and the Sub-Adviser, TFAI’s management oversight process and the professional qualifications and experience of the Sub-Adviser’s portfolio management team. The Board also determined that TFAI and the Sub-Adviser can provide investment and related services that are appropriate in scope and extent in light of the proposed operations of the Fund, the competitive landscape of the investment company business, and investor needs.
The investment performance of the Fund. The Board noted that no performance information is available for the Fund, but considered the performance of the Sub-Adviser’s Similar Fund as compared to its Lipper peers. The Board noted that the Sub-Adviser’s Similar Fund has outperformed its Lipper peers for the year-to-date, one- and three-year trailing periods ended May 31, 2005. On the basis of the Trustees’ assessment of the nature, extent and quality of advisory services expected to be provided or procured by TFAI and the Sub-Adviser, as well as the performance of the Sub-Adviser’s Similar Fund, the Trustees concluded that TFAI and the Sub-Adviser are capable of generating a level of investment performance that is appropriate in light of the Fund’s proposed investment objective, policies and strategies and competitive with many other investment companies, and also determined that TFAI’s and the Sub-Adviser’s management is likely to benefit the Fund and its shareholders.
The cost of advisory services provided and the level of profitability. The Board reviewed estimated profitability information regarding TFAI’s costs of procuring portfolio management services, as well as the anticipated costs of provision of administration, transfer agency, fund accounting and other services, to the Fund and to TA IDEX as a whole by TFAI and its affiliates. The Board noted that the anticipated asset weighted investment management fee for the Fund is lower than the category median investment management fee. Based on such information, the Trustees determined that the level of anticipated
185
investment management fees and estimated overall expense ratio of the Fund generally are consistent with industry averages. The Board also took note of the costs involved in establishing a new fund. In addition, on the basis of the Board’s review of the management fees to be charged by TFAI for investment advisory and related services, the anticipated TFAI profitability information (based on estimates derived from a TFAI profitability analysis provided at the meeting), TFAI’s estimated management income resulting from its management of the Fund, as well as the entirety of TFAI’s and its affiliates’ service relationship with TA IDEX, the Board concluded that the anticipated investment management fees and other service fees, as well as TFAI’s estimated profitability, are appropriate in light of the nature and quality of services proposed to be provided, the management fees and overall expense ratios of comparable investment companies and the anticipated profitability of the relationship between the Fund, TFAI and its affiliates, and the Sub-Adviser.
Whether fee levels reflect economies of scale and the extent to which economies of scale would be realized as the Fund grows. In evaluating the extent to which the management fees payable under the proposed Investment Advisory Agreement reflect economies of scale or will permit economies of scale to be realized in the future, the Board took note of the proposed advisory fee breakpoints as detailed in the materials provided, and noted each fee breakpoint with respect to the various asset levels achieved by the Fund. The Board concluded that the inclusion of the asset-based breakpoints in the Fund’s advisory fee schedule appropriately benefits investors by realizing economies of scale in the form of lower management fees as the level of assets grows. In addition, the Board determined that the Fund’s proposed management fees appropriately reflect the Fund’s anticipated size, the current economic environment for TFAI, the competitive nature of the investment company market, and the TFAI’s pricing strategy. The Trustees also concluded that they will have the opportunity to periodically re-examine whether the Fund has achieved economies of scale, and the appropriateness of management fees payable to TFAI and fees payable by TFAI to the Sub-Adviser, in the future.
Benefits (such as soft dollars) to TFAI, its affiliates, or the Sub-Adviser from their relationship with the Fund. The Board concluded that other benefits anticipated to be derived by TFAI and the Sub-Adviser from their relationship with the Fund, including “soft-dollar” benefits (if any) in connection with brokerage transactions should be reasonable and fair, and consistent with industry practice and the best interests of the Fund and its shareholders. In this regard, the Board noted that TFAI does not realize “soft dollar” benefits from its relationship with the Fund, and that the Sub-Adviser is participating in a brokerage program pursuant to which a portion of brokerage commissions paid by the Fund is recaptured for the benefit of the Fund and its shareholders, thus limiting the amount of “soft dollar” arrangements the Sub-Adviser may engage in with respect to the Fund’s brokerage transactions. In addition, the Trustees determined that the administration, transfer agency, fund accounting and other fees to be paid by the Fund to affiliates of TFAI should be reasonable, fair and in the best interests of shareholders in light of the nature and quality of the services anticipated to be provided, the associated costs to these affiliates of providing the services, the impact of the costs of such services on the Fund’s overall operating expenses, and the necessity of the services for the Fund’s operations.
Other considerations. In approving the Fund, the Board considered the high quality of the Sub-Adviser’s portfolio management personnel who will manage the Fund under the Sub-Advisory Agreement, and the Sub-Adviser’s overall portfolio management capabilities. The Board also considered the proposed investment objective of the Fund and the proposed strategy for the Fund, and determined that it would enhance the investment options for the asset allocation funds. The Board determined that TFAI and the Sub-Adviser have made a substantial commitment to the recruitment and retention of high quality personnel, and maintains the financial, compliance and operational resources reasonably necessary to manage the Fund in a professional manner that is consistent with the best interests of the Fund and its shareholders. In this regard, the Trustees favorably considered the procedures and policies in place by TFAI to enforce compliance with applicable laws and regulations and oversee the portfolio management activities of the Sub-Adviser. The Trustees also determined that TFAI had made a significant entrepreneurial commitment to the management and success of the TA IDEX funds, reflected by TFAI’s expense limitation and fee waiver arrangements with the TA IDEX funds, which may result in TFAI waiving advisory fees for the benefit of shareholders.
186
TA IDEX EVERGREEN INTERNATIONAL SMALL CAP
INVESTMENT ADVISORY AND SUB-ADVISORY AGREEMENTS - REVIEW AND RENEWAL (unaudited)
At a meeting of the Board of Trustees of Transamerica IDEX Mutual Funds (“TA IDEX”) held on November 2, 2005, the Board reviewed and considered the Investment Advisory Agreement between TA IDEX Evergreen International Small Cap (the “Fund”) and Transamerica Fund Advisors, Inc. (“TFAI”) as well as the Investment Sub-Advisory Agreement of the Fund between TFAI and Evergreen Investment Management Company, LLC (the “Sub-Adviser”), to determine whether the agreements should be renewed for a one-year period. Following their review and consideration, the Trustees determined that the Investment Advisory Agreement and the Investment Sub-Advisory Agreement will enable shareholders of the Fund to obtain high quality services at a cost that is appropriate, reasonable, and in the best interests of its shareholders. The Board, including the independent members of the Board, unanimously approved the renewal of the Investment Advisory Agreement and the Investment Sub-Advisory Agreement. In reaching their decision, the Trustees requested and obtained from TFAI and the Sub-Adviser such information as they deemed reasonably necessary to evaluate the proposed agreements. The Trustees also carefully considered the information that they had received throughout the year from TFAI and the Sub-Adviser (such as in-person presentations by the Sub-Adviser) as part of their regular oversight of the Fund, as well as: comparative fee, expense and performance information prepared by Lipper Inc. (“Lipper”), independent providers of mutual fund performance, fee and expense information, and profitability data. In considering the proposed continuation of the Investment Advisory Agreement and the Investment Sub-Advisory Agreement, the Trustees evaluated a number of considerations that they believe, in light of the legal advice furnished to them by TA IDEX counsel and independent legal counsel and their own business judgment, to be relevant. They based their decisions on the following considerations, among others, although they did not identify any consideration or particular information that was controlling of their decisions:
The nature, extent and quality of the advisory service to be provided. The Board considered the nature and quality of the services provided by TFAI and the Sub-Adviser to the Fund in the past, as well as the services anticipated to be provided in the future. The Board concluded that TFAI and the Sub-Adviser are capable of providing high quality services to the Fund, as indicated by the nature and quality of services provided in the past, TFAI’s and the Sub-Adviser’s management capabilities demonstrated with respect to the funds they manage, including the Fund, and the experience, capability and integrity of TFAI’s senior management, the financial resources of TFAI and the Sub-Adviser, TFAI’s management oversight process, the professional qualifications and experience of the Sub-Adviser’s portfolio management team, and the Fund’s investment performance. The Trustees also concluded that TFAI and the Sub-Adviser proposed to provide investment and related services that were of the same quality and quantity as services provided to the Fund in the past, and that these services are appropriate in scope and extent in light of the Fund’s operations, the competitive landscape of the investment company business and investor needs, and that TFAI’s and the Sub-Adviser’s obligations will remain substantially the same.
The investment performance of the Fund. The Board examined the year-to-date (the Fund commenced operations on November 8, 2004) performance of the Fund, including relative performance against a benchmark securities index and a peer group of comparable mutual funds as prepared by Lipper, ended June 30, 2005. The Trustees concluded that TFAI and the Sub-Adviser generally had achieved superior investment performance, noting that the performance of the Fund has been above median relative to its peers and superior to the benchmark index over this period. On the basis of the Trustees’ assessment of the nature, extent and quality of advisory services to be provided or procured by TFAI and the Sub-Adviser, the Trustees concluded that TFAI and the Sub-Adviser are capable of generating a level of investment performance that is appropriate in light of the Fund’s investment objective, policies and strategies and competitive with many other investment companies, and also determined that TFAI’s and the Sub-Adviser’s performance records indicate that their continued management is likely to benefit the Fund and its shareholders.
The cost of advisory services provided and the level of profitability. The Board reviewed profitability information regarding TFAI’s costs of procuring portfolio management services, as well as the costs of
187
provision of administration, transfer agency, fund accounting and other services, to the Fund and to TA IDEX as a whole by TFAI and its affiliates. The Trustees reviewed data from Lipper that compared the Fund’s management fees (including management fees at various asset levels), other fees and expenses (including total expenses including and excluding 12b-1 distribution and service fees) and portfolio turnover rate against a peer group of comparable mutual funds. Based on such information, the Trustees determined that the management fees and overall expense ratio of the Fund generally are consistent with industry averages. In addition, on the basis of the Board’s review of the management fees to be charged by TFAI for investment advisory and related services, TFAI profitability information (derived from TFAI’s audited financial statements), TFAI’s estimated management income resulting from its management of the Fund, the estimated margin of the Sub-Adviser, as well as the entirety of TFAI’s and its affiliates’ service relationship with TA IDEX, the Board concluded that the level of investment management fees and other service fees, as well as TFAI’s and the Sub-Adviser’s profitability, are appropriate in light of the services provided, the management fees and overall expense ratios of comparable investment companies and the anticipated profitability of the relationship between the Fund, TFAI and its affiliates, and the Sub-Adviser.
Whether fee levels reflect economies of scale and the extent to which economies of scale would be realized as the Fund grows. The Board concluded that the inclusion of asset-based breakpoints in the Fund’s advisory fee schedule appropriately benefits investors by realizing economies of scale in the form of lower management fees as the level of assets grows. In addition, the Board concluded that the Fund’s management fees appropriately reflect the Fund’s current size, the current economic environment for TFAI, the competitive nature of the investment company market, and TFAI’s pricing strategy. The Trustees also concluded that they will have the opportunity to periodically reexamine whether the Fund has achieved economies of scale, and the appropriateness of management fees payable to TFAI and fees payable by TFAI to the Sub-Adviser, in the future.
Benefits (such as soft dollars) to TFAI, its affiliates, or the Sub-Adviser from their relationship with the Fund. The Board concluded that other benefits derived by TFAI, its affiliates, and the Sub-Adviser from their relationship with the Fund are reasonable and fair, and are consistent with industry practice and the best interests of the Fund and its shareholders. In this regard, the Board noted that TFAI does not realize “soft dollar” benefits from its relationship with the Fund. In addition, the Trustees determined that the administration, transfer agency, fund accounting and other fees paid by the Fund to affiliates of TFAI are reasonable, fair and in the best interests of shareholders in light of the nature and quality of the services provided, the associated costs to these affiliates of providing the services, the impact of the costs of such services on the Fund’s overall operating expenses, and the necessity of the services for the Fund’s operations.
Other considerations. The Board determined that TFAI had made a substantial commitment to the recruitment and retention of high quality personnel, and maintained the financial, compliance and operational resources reasonably necessary to manage the Fund in a professional manner that is consistent with the best interests of the Fund and its shareholders. In this regard, the Trustees favorably considered the procedures and policies in place by TFAI to enforce compliance with applicable laws and regulations and oversee the portfolio management activities of the Sub-Adviser. The Trustees also determined that TFAI had made a significant entrepreneurial commitment to the management and success of the Fund, reflected by TFAI’s expense limitation and fee waiver arrangement with the Fund, which may result in TFAI waiving advisory fees for the benefit of shareholders.
188
TA IDEX FEDERATED MARKET OPPORTUNITY
INVESTMENT ADVISORY AND SUB-ADVISORY AGREEMENTS - REVIEW AND APPROVAL (unaudited)
At a meeting of the Board of Trustees of Transamerica IDEX Mutual Funds (“TA IDEX”) held on July 26, 2005, the Board reviewed and considered the proposed Investment Advisory Agreement between TA IDEX Federated Market Opportunity (the “Fund”) and Transamerica Fund Advisors, Inc. (“TFAI”), as well as the proposed Investment Sub-Advisory Agreement of the Fund between TFAI and Federated Equity Management Company of Pennsylvania (the “Sub-Adviser”), to determine whether the agreements should be approved for an initial two-year period. Following their review and consideration, the Trustees determined that the proposed Investment Advisory Agreement and the proposed Investment Sub-Advisory Agreement will enable shareholders of the Fund to obtain high quality services at a cost that is appropriate, reasonable, and in the best interests of its shareholders. The Board, including the independent members of the Board, unanimously approved the proposed Investment Advisory Agreement and Investment Sub-Advisory Agreement. In reaching their decision, the Trustees requested and obtained from TFAI and the Sub-Adviser such information as they deemed reasonably necessary to evaluate the proposed agreements. The Trustees also carefully considered the comparative fee, expense and performance information of another fund managed by the Sub-Adviser that is managed in accordance with an investment program that closely resembles the proposed investment program of the Fund (the “Sub-Adviser’s Similar Fund”) prepared by Lipper Inc. (“Lipper”), independent providers of mutual fund performance, fee and expense information, and anticipated profitability data. In considering the proposed Investment Advisory Agreement and Investment Sub-Advisory Agreement, the Trustees evaluated a number of considerations that they believe, in light of the legal advice furnished to them by TA IDEX counsel and independent legal counsel and their own business judgment, to be relevant. They based their decisions on the following considerations, among others, although they did not identify any consideration or particular information that was controlling of their decisions:
The nature, extent and quality of the advisory service to be provided. The Board considered the nature, extent and quality of the services proposed to be provided by TFAI and the Sub-Adviser to the Fund. The Board concluded that TFAI and the Sub-Adviser are capable of providing high quality services to the Fund, as indicated by TFAI’s and the Sub-Adviser’s management capabilities demonstrated with respect to the funds they manage, and the experience, capability and integrity of TFAI’s senior management, the financial resources of TFAI and the Sub-Adviser, TFAI’s management oversight process and the professional qualifications and experience of the Sub-Adviser’s portfolio management team. The Board also determined that TFAI and the Sub-Adviser can provide investment and related services that are appropriate in scope and extent in light of the proposed operations of the Fund, the competitive landscape of the investment company business, and investor needs.
The investment performance of the Fund. The Board noted that no performance information is available for the Fund, but considered the performance of the Sub-Adviser’s Similar Fund as compared to its Lipper peers. The Board noted that the Sub-Adviser’s Similar Fund has outperformed its Lipper peers for the year-to-date, one- and three-year trailing periods ended May 31, 2005. On the basis of the Trustees’ assessment of the nature, extent and quality of advisory services expected to be provided or procured by TFAI and the Sub-Adviser, as well as the performance of the Sub-Adviser’s Similar Fund, the Trustees concluded that TFAI and the Sub-Adviser are capable of generating a level of investment performance that is appropriate in light of the Fund’s proposed investment objective, policies and strategies and competitive with many other investment companies, and also determined that TFAI’s and the Sub-Adviser’s management is likely to benefit the Fund and its shareholders.
The cost of advisory services provided and the level of profitability. The Board reviewed estimated profitability information regarding TFAI’s costs of procuring portfolio management services, as well as the anticipated costs of provision of administration, transfer agency, fund accounting and other services, to the Fund and to TA IDEX as a whole by TFAI and its affiliates. The Board noted that the anticipated asset weighted investment management fee for the Fund is lower than the category median investment management fee. Based on such information, the Trustees determined that the level of anticipated
189
investment management fees and estimated overall expense ratio of the Fund generally are consistent with industry averages. The Board also took note of the costs involved in establishing a new fund. In addition, on the basis of the Board’s review of the management fees to be charged by TFAI for investment advisory and related services, the anticipated TFAI profitability information (based on estimates derived from a TFAI profitability analysis provided at the meeting), TFAI’s estimated management income resulting from its management of the Fund, as well as the entirety of TFAI’s and its affiliates’ service relationship with TA IDEX, the Board concluded that the anticipated investment management fees and other service fees, as well as TFAI’s estimated profitability, are appropriate in light of the nature and quality of services proposed to be provided, the management fees and overall expense ratios of comparable investment companies and the anticipated profitability of the relationship between the Fund, TFAI and its affiliates, and the Sub-Adviser.
Whether fee levels reflect economies of scale and the extent to which economies of scale would be realized as the Fund grows. In evaluating the extent to which the management fees payable under the proposed Investment Advisory Agreement reflect economies of scale or will permit economies of scale to be realized in the future, the Board took note of the proposed advisory fee breakpoints as detailed in the materials provided, and noted each fee breakpoint with respect to the various asset levels achieved by the Fund. The Board concluded that the inclusion of the asset-based breakpoints in the Fund’s advisory fee schedule appropriately benefits investors by realizing economies of scale in the form of lower management fees as the level of assets grows. In addition, the Board determined that the Fund’s proposed management fees appropriately reflect the Fund’s anticipated size, the current economic environment for TFAI, the competitive nature of the investment company market, and the TFAI’s pricing strategy. The Trustees also concluded that they will have the opportunity to periodically re-examine whether the Fund has achieved economies of scale, and the appropriateness of management fees payable to TFAI and fees payable by TFAI to the Sub-Adviser, in the future.
Benefits (such as soft dollars) to TFAI, its affiliates, or the Sub-Adviser from their relationship with the Fund. The Board concluded that other benefits anticipated to be derived by TFAI and the Sub-Adviser from their relationship with the Fund, including “soft-dollar” benefits (if any) in connection with brokerage transactions should be reasonable and fair, and consistent with industry practice and the best interests of the Fund and its shareholders. In this regard, the Board noted that TFAI does not realize “soft dollar” benefits from its relationship with the Fund, and that the Sub-Adviser is participating in a brokerage program pursuant to which a portion of brokerage commissions paid by the Fund is recaptured for the benefit of the Fund and its shareholders, thus limiting the amount of “soft dollar” arrangements the Sub-Adviser may engage in with respect to the Fund’s brokerage transactions. In addition, the Trustees determined that the administration, transfer agency, fund accounting and other fees to be paid by the Fund to affiliates of TFAI should be reasonable, fair and in the best interests of shareholders in light of the nature and quality of the services anticipated to be provided, the associated costs to these affiliates of providing the services, the impact of the costs of such services on the Fund’s overall operating expenses, and the necessity of the services for the Fund’s operations.
Other considerations. In approving the Fund, the Board considered the high quality of the Sub-Adviser’s portfolio management personnel who will manage the Fund under the Sub-Advisory Agreement, and the Sub-Adviser’s overall portfolio management capabilities. The Board also considered the proposed investment objective of the Fund and the proposed strategy for the Fund, and determined that it would enhance the investment options for the asset allocation funds. The Board determined that TFAI and the Sub-Adviser have made a substantial commitment to the recruitment and retention of high quality personnel, and maintains the financial, compliance and operational resources reasonably necessary to manage the Fund in a professional manner that is consistent with the best interests of the Fund and its shareholders. In this regard, the Trustees favorably considered the procedures and policies in place by TFAI to enforce compliance with applicable laws and regulations and oversee the portfolio management activities of the Sub-Adviser. The Trustees also determined that TFAI had made a significant entrepreneurial commitment to the management and success of the TA IDEX funds, reflected by TFAI’s expense limitation and fee waiver arrangements with the TA IDEX funds, which may result in TFAI waiving advisory fees for the benefit of shareholders.
190
TA IDEX JPMORGAN INTERNATIONAL BOND
INVESTMENT ADVISORY AND SUB-ADVISORY AGREEMENTS - REVIEW AND APPROVAL (unaudited)
At a meeting of the Board of Trustees of Transamerica IDEX Mutual Funds (“TA IDEX”) held on July 26, 2005, the Board reviewed and considered the proposed Investment Advisory Agreement between TA IDEX JPMorgan International Bond (the “Fund”) and Transamerica Fund Advisors, Inc. (“TFAI”), as well as the proposed Investment Sub-Advisory Agreement of the Fund between TFAI and J. P. Morgan Investment Management Inc. (the “Sub-Adviser”), to determine whether the agreements should be approved for an initial two-year period. Following their review and consideration, the Trustees determined that the proposed Investment Advisory Agreement and the proposed Investment Sub-Advisory Agreement will enable shareholders of the Fund to obtain high quality services at a cost that is appropriate, reasonable, and in the best interests of its shareholders. The Board, including the independent members of the Board, unanimously approved the proposed Investment Advisory Agreement and Investment Sub-Advisory Agreement. In reaching their decision, the Trustees requested and obtained from TFAI and the Sub-Adviser such information as they deemed reasonably necessary to evaluate the proposed agreements. The Trustees also carefully considered the comparative fee, expense and performance information of another fund managed by the Sub-Adviser that is managed in accordance with an investment program that closely resembles the proposed investment program of the Fund (the “Sub-Adviser’s Similar Fund”) prepared by Lipper Inc. (“Lipper”), independent providers of mutual fund performance, fee and expense information, and anticipated profitability data. In considering the proposed Investment Advisory Agreement and Investment Sub-Advisory Agreement, the Trustees evaluated a number of considerations that they believe, in light of the legal advice furnished to them by TA IDEX counsel and independent legal counsel and their own business judgment, to be relevant. They based their decisions on the following considerations, among others, although they did not identify any consideration or particular information that was controlling of their decisions:
The nature, extent and quality of the advisory service to be provided. The Board considered the nature, extent and quality of the services proposed to be provided by TFAI and the Sub-Adviser to the Fund. The Board concluded that TFAI and the Sub-Adviser are capable of providing high quality services to the Fund, as indicated by TFAI’s and the Sub-Adviser’s management capabilities demonstrated with respect to the funds they manage, and the experience, capability and integrity of TFAI’s senior management, the financial resources of TFAI and the Sub-Adviser, TFAI’s management oversight process and the professional qualifications and experience of the Sub-Adviser’s portfolio management team. The Board also determined that TFAI and the Sub-Adviser can provide investment and related services that are appropriate in scope and extent in light of the proposed operations of the Fund, the competitive landscape of the investment company business, and investor needs.
The investment performance of the Fund. The Board considered the performance of the Sub-Adviser’s Similar Fund as compared to its Lipper peers. The Board noted that although the performance of the Sub-Adviser’s Similar Fund slightly trails its Lipper peers for the year-to-date trailing period, it has outperformed its Lipper peers for the past one- and three-year trailing periods ended May 31, 2005. On the basis of the Trustees’ assessment of the nature, extent and quality of advisory services expected to be provided or procured by TFAI and the Sub-Adviser, as well as the performance of the Sub-Adviser’s Similar Fund, the Trustees concluded that TFAI and the Sub-Adviser are capable of generating a level of investment performance that is appropriate in light of the Fund’s proposed investment objective, policies and strategies and competitive with many other investment companies, and also determined that TFAI’s and the Sub-Adviser’s management is likely to benefit the Fund and its shareholders.
The cost of advisory services provided and the level of profitability. The Board reviewed estimated profitability information regarding TFAI’s costs of procuring portfolio management services, as well as the anticipated costs of provision of administration, transfer agency, fund accounting and other services, to the Fund and to TA IDEX as a whole by TFAI and its affiliates. The Board noted that the anticipated asset weighted investment management fee for the Fund is lower than the category median investment management fee. Based on such information, the Trustees determined that the level of anticipated
191
investment management fees and estimated overall expense ratio of the Fund generally are consistent with industry averages. The Board also took note of the costs involved in establishing a new fund. In addition, on the basis of the Board’s review of the management fees to be charged by TFAI for investment advisory and related services, the anticipated TFAI profitability information (based on estimates derived from a TFAI profitability analysis provided at the meeting), TFAI’s estimated management income resulting from its management of the Fund, as well as the entirety of TFAI’s and its affiliates’ service relationship with TA IDEX, the Board concluded that the anticipated investment management fees and other service fees, as well as TFAI’s estimated profitability, are appropriate in light of the nature and quality of services proposed to be provided, the management fees and overall expense ratios of comparable investment companies and the anticipated profitability of the relationship between the Fund, TFAI and its affiliates, and the Sub-Adviser.
Whether fee levels reflect economies of scale and the extent to which economies of scale would be realized as the Fund grows. In evaluating the extent to which the management fees payable under the proposed Investment Advisory Agreement reflect economies of scale or will permit economies of scale to be realized in the future, the Board took note of the proposed advisory fee breakpoints as detailed in the materials provided, and noted each fee breakpoint with respect to the various asset levels achieved by the Fund. The Board concluded that the inclusion of the asset-based breakpoints in the Fund’s advisory fee schedule appropriately benefits investors by realizing economies of scale in the form of lower management fees as the level of assets grows. In addition, the Board determined that the Fund’s proposed management fees appropriately reflect the Fund’s anticipated size, the current economic environment for TFAI, the competitive nature of the investment company market, and the TFAI’s pricing strategy. The Trustees also concluded that they will have the opportunity to periodically re-examine whether the Fund has achieved economies of scale, and the appropriateness of management fees payable to TFAI and fees payable by TFAI to the Sub-Adviser, in the future.
Benefits (such as soft dollars) to TFAI, its affiliates, or the Sub-Adviser from their relationship with the Fund. The Board concluded that other benefits anticipated to be derived by TFAI and the Sub-Adviser from their relationship with the Fund, including “soft-dollar” benefits (if any) in connection with brokerage transactions should be reasonable and fair, and consistent with industry practice and the best interests of the Fund and its shareholders. In this regard, the Board noted that TFAI does not realize “soft dollar” benefits from its relationship with the Fund, and that the Sub-Adviser’s “soft-dollar” arrangements will be consistent with applicable law and “best execution” requirements. In addition, the Trustees determined that the administration, transfer agency, fund accounting and other fees to be paid by the Fund to affiliates of TFAI should be reasonable, fair and in the best interests of shareholders in light of the nature and quality of the services anticipated to be provided, the associated costs to these affiliates of providing the services, the impact of the costs of such services on the Fund’s overall operating expenses, and the necessity of the services for the Fund’s operations.
Other considerations. In approving the Fund, the Board considered the high quality of the Sub-Adviser’s portfolio management personnel who will manage the Fund under the Sub-Advisory Agreement, and the Sub-Adviser’s overall portfolio management capabilities. The Board also considered the proposed investment objective of the Fund and the proposed strategy for the Fund, and determined that it would enhance the investment options for the asset allocation funds. The Board determined that TFAI and the Sub-Adviser have made a substantial commitment to the recruitment and retention of high quality personnel, and maintains the financial, compliance and operational resources reasonably necessary to manage the Fund in a professional manner that is consistent with the best interests of the Fund and its shareholders. In this regard, the Trustees favorably considered the procedures and policies in place by TFAI to enforce compliance with applicable laws and regulations and oversee the portfolio management activities of the Sub-Adviser. The Trustees also determined that TFAI had made a significant entrepreneurial commitment to the management and success of the TA IDEX funds, reflected by TFAI’s expense limitation and fee waiver arrangements with the TA IDEX funds, which may result in TFAI waiving advisory fees for the benefit of shareholders.
192
TA IDEX J.P. MORGAN MID CAP VALUE
INVESTMENT ADVISORY AND SUB-ADVISORY AGREEMENTS - REVIEW AND RENEWAL (unaudited)
At a meeting of the Board of Trustees of Transamerica IDEX Mutual Funds (“TA IDEX”) held on November 2, 2005, the Board reviewed and considered the Investment Advisory Agreement between TA IDEX J.P. Morgan Mid Cap Value (the “Fund”) and Transamerica Fund Advisors, Inc. (“TFAI”), as well as the Investment Sub-Advisory Agreement of the Fund between TFAI and J.P. Morgan Investment Management, Inc. (the “Sub-Adviser”), to determine whether the agreements should be renewed for a one-year period. Following their review and consideration, the Trustees determined that the Investment Advisory Agreement and the Investment Sub-Advisory Agreement will enable shareholders of the Fund to obtain high quality services at a cost that is appropriate, reasonable, and in the best interests of its shareholders. The Board, including the independent members of the Board, unanimously approved the renewal of the Investment Advisory Agreement and the Investment Sub-Advisory Agreement. In reaching their decision, the Trustees requested and obtained from TFAI and the Sub-Adviser such information as they deemed reasonably necessary to evaluate the proposed agreements. The Trustees also carefully considered the information that they had received throughout the year from TFAI and the Sub-Adviser (such as in-person presentations by the Sub-Adviser) as part of their regular oversight of the Fund, as well as: comparative fee, expense and performance information prepared by Lipper Inc. (“Lipper”), independent providers of mutual fund performance, fee and expense information, and profitability data. In considering the proposed continuation of the Investment Advisory Agreement and Investment Sub-Advisory Agreement, the Trustees evaluated a number of considerations that they believed, in light of the legal advice furnished to them by TA IDEX counsel and independent legal counsel and their own business judgment, to be relevant. They based their decisions on the following considerations, among others, although they did not identify any consideration or particular information that was controlling of their decisions:
The nature, extent and quality of the advisory service to be provided. The Board considered the nature and quality of the services provided by TFAI and the Sub-Adviser to the Fund in the past, as well as the services anticipated to be provided in the future. The Board concluded that TFAI and the Sub-Adviser are capable of providing high quality services to the Fund, as indicated by the nature and quality of services provided in the past, TFAI’s and the Sub-Adviser’s management capabilities demonstrated with respect to the funds they manage, including the Fund, and the experience, capability and integrity of TFAI’s senior management, the financial resources of TFAI and the Sub-Adviser, TFAI’s management oversight process, and the professional qualifications and experience of the Sub-Adviser’s portfolio management team. The Trustees also concluded that TFAI and the Sub-Adviser proposed to provide investment and related services that were of the same quality and quantity as services provided to the Fund in the past, and that these services are appropriate in scope and extent in light of the Fund’s operations, the competitive landscape of the investment company business and investor needs, and that TFAI’s and the Sub-Adviser’s obligations will remain substantially the same.
The investment performance of the Fund. The Board examined the year-to-date (the Fund commenced operations on March 1, 2005) performance of the Fund, including relative performance against a benchmark securities index and a peer group of comparable mutual funds as prepared by Lipper, ended June 30, 2005. The Trustees concluded that TFAI and the Sub-Adviser had achieved acceptable performance, noting that although the Fund performance was below-median relative to its peers over this period, it was competitive with the benchmark index. On the basis of the Trustees’ assessment of the nature, extent and quality of advisory services to be provided or procured by TFAI and the Sub-Adviser, the Trustees concluded that TFAI and the Sub-Adviser are capable of generating a level of investment performance that is appropriate in light of the Fund’s investment objective, policies and strategies and competitive with many other investment companies, and also determined that TFAI’s and the Sub-Adviser’s performance records indicate that their continued management is likely to benefit the Fund and its shareholders.
193
The cost of advisory services provided and the level of profitability. The Board reviewed profitability information regarding TFAI’s costs of procuring portfolio management services, as well as the costs of provision of administration, fund accounting and other services, to the Fund and to TA IDEX as a whole by TFAI and its affiliates. The Trustees reviewed data from Lipper that compared the Fund’s management fees (including management fees at various asset levels), other fees and expenses (including total expenses including and excluding 12b-1 distribution and service fees) and portfolio turnover rate against peer groups of comparable mutual funds. Based on such information, the Trustees determined that the management fees and overall expense ratio of the Fund generally are consistent with industry averages. In addition, on the basis of the Board’s review of the management fees to be charged by TFAI for investment advisory and related services, TFAI profitability information (derived from TFAI’s audited financial statements), TFAI’s estimated management income resulting from its management of the Fund, the estimated margin of the Sub-Adviser, as well as the entirety of TFAI’s and its affiliates’ service relationship with TA IDEX, the Board concluded that the level of investment management fees and other service fees, as well as TFAI’s and the Sub-Adviser’s profitability, are appropriate in light of the services provided, the management fees and overall expense ratios of comparable investment companies and the anticipated profitability of the relationship between the Fund, TFAI and its affiliates, and the Sub-Adviser.
Whether fee levels reflect economies of scale and the extent to which economies of scale would be realized as the Fund grows. The Board concluded that the inclusion of asset-based breakpoints in the Fund’s advisory fee schedule appropriately benefits investors by realizing economies of scale in the form of lower management fees as the level of assets grows. In addition, the Board concluded that the Fund’s management fees appropriately reflect the Fund’s current size, the current economic environment for TFAI, the competitive nature of the investment company market, and TFAI’s pricing strategy. The Trustees also concluded that they will have the opportunity to periodically reexamine whether the Fund has achieved economies of scale, and the appropriateness of management fees payable to TFAI and fees payable by TFAI to the Sub-Adviser, in the future.
Benefits (such as soft dollars) to TFAI, its affiliates, or the Sub-Adviser from their relationship with the Fund. The Board concluded that other benefits derived by TFAI, its affiliates, and the Sub-Adviser from their relationship with the Fund are reasonable and fair, and are consistent with industry practice and the best interests of the Fund and its shareholders. In this regard, the Board noted that TFAI does not realize “soft dollar” benefits from its relationship with the Fund. In addition, the Trustees determined that the administration, transfer agency, fund accounting and other fees paid by the Fund to affiliates of TFAI are reasonable, fair and in the best interests of shareholders in light of the nature and quality of the services provided, the associated costs to these affiliates of providing the services, the impact of the costs of such services on the Fund’s overall operating expenses, and the necessity of the services for the Fund’s operations.
Other considerations. The Board also determined that TFAI had made a substantial commitment to the recruitment and retention of high quality personnel, and maintained the financial, compliance and operational resources reasonably necessary to manage the Fund in a professional manner that is consistent with the best interests of the Fund and its shareholders. In this regard, the Trustees favorably considered the procedures and policies in place by TFAI to enforce compliance with applicable laws and regulations and oversee the portfolio management activities of the Sub-Adviser. The Trustees also determined that TFAI had made a significant entrepreneurial commitment to the management and success of the Fund, reflected by TFAI’s expense limitation and fee waiver arrangement with the Fund, which may result in TFAI waiving advisory fees for the benefit of shareholders.
194
TA IDEX MARSICO INTERNATIONAL GROWTH
INVESTMENT ADVISORY AND SUB-ADVISORY AGREEMENTS - REVIEW AND RENEWAL (unaudited)
At a meeting of the Board of Trustees of Transamerica IDEX Mutual Funds (“TA IDEX”) held on November 2, 2005, the Board reviewed and considered the Investment Advisory Agreement between TA IDEX Marsico International Growth (the “Fund”) and Transamerica Fund Advisors, Inc. (“TFAI”), as well as the Investment Sub-Advisory Agreement of the Fund between TFAI and Columbia Management Advisors, LLC (the “Sub-Adviser”), to determine whether the agreements should be renewed for a one-year period. Following their review and consideration, the Trustees determined that the Investment Advisory Agreement and the Investment Sub-Advisory Agreement will enable shareholders of the Fund to obtain high quality services at a cost that is appropriate, reasonable, and in the best interests of its shareholders. The Board, including the independent members of the Board, approved the renewal of the Investment Advisory Agreement and the Investment Sub-Advisory Agreement. In reaching their decision, the Trustees requested and obtained from TFAI and the Sub-Adviser such information as they deemed reasonably necessary to evaluate the proposed agreements. The Trustees also carefully considered the information that they had received throughout the year from TFAI and the Sub-Adviser (such as in-person presentations by the Sub-Adviser) as part of their regular oversight of the Fund, as well as: comparative fee, expense and performance information prepared by Lipper Inc. (“Lipper”), independent providers of mutual fund performance, fee and expense information, and profitability data. In considering the proposed continuation of the Investment Advisory Agreement and Investment Sub-Advisory Agreement, the Trustees evaluated a number of considerations that they believed, in light of the legal advice furnished to them by TA IDEX counsel and independent legal counsel and their own business judgment, to be relevant. They based their decisions on the following considerations, among others, although they did not identify any consideration or particular information that was controlling of their decisions:
The nature, extent and quality of the advisory service to be provided. The Board considered the nature and quality of the services provided by TFAI and the Sub-Adviser to the Fund in the past, as well as the services anticipated to be provided in the future. The Board concluded that TFAI and the Sub-Adviser are capable of providing high quality services to the Fund, as indicated by the nature and quality of services provided in the past, TFAI’s and the Sub-Adviser’s management capabilities demonstrated with respect to the funds they manage, and the experience, capability and integrity of TFAI’s senior management, the financial resources of TFAI and the Sub-Adviser, TFAI’s management oversight process and the professional qualifications and experience of the Sub-Adviser’s portfolio management team. The Trustees also concluded that TFAI and the Sub-Adviser proposed to provide investment and related services that were of the same quality and quantity as services provided to the Fund in the past, and that these services are appropriate in scope and extent in light of the Fund’s operations, the competitive landscape of the investment company business and investor needs, and that TFAI’s and the Sub-Adviser’s obligations will remain substantially the same.
The investment performance of the Fund. The Board examined the year-to-date (the Fund commenced operations on November 8, 2004) performance of the Fund, including relative performance against a benchmark securities index and a peer group of comparable mutual funds as prepared by Lipper, ended June 30, 2005. The Board reviewed the Fund’s below-median performance during the brief period since its inception, but noted that the Sub-Adviser’s proprietary fund, which has comparable investment objectives and strategies, has a competitive longer-term performance record. On the basis of the Trustees’ assessment of the nature, extent and quality of advisory services to be provided or procured by TFAI and the Sub-Adviser, the Trustees concluded that TFAI and the Sub-Adviser are capable of generating a level of investment performance that is appropriate in light of the Fund’s investment objective, policies and strategies and competitive with many other investment companies, and also determined that TFAI’s and the Sub-Adviser’s performance records indicate that their continued management is likely to benefit the Fund and its shareholders.
The cost of advisory services provided and the level of profitability. The Board reviewed profitability information regarding TFAI’s costs of procuring portfolio management services, as well as the costs of
195
provision of administration, transfer agency, fund accounting and other services, to the Fund and to TA IDEX as a whole by TFAI and its affiliates. The Board instructed TFAI to attempt to lower the Fund’s management fees in the future, which currently are relatively high, although the Board also noted that the Fund’s total expense ratios are competitive. The Trustees reviewed data from Lipper that compared the Fund’s management fees (including management fees at various asset levels), other fees and expenses (including total expenses including and excluding 12b-1 distribution and service fees) and portfolio turnover rate against peer groups of comparable mutual funds. Based on such information, the Trustees determined that the management fees and overall expense ratio of the Fund generally are consistent with industry averages. In addition, on the basis of the Board’s review of the management fees to be charged by TFAI for investment advisory and related services, TFAI profitability information (derived from TFAI’s audited financial statements), TFAI’s estimated management income resulting from its management of the Fund, the estimated margin of the Sub-Adviser, as well as the entirety of TFAI’s and its affiliates’ service relationship with TA IDEX, the Board concluded that the level of investment management fees and other service fees, as well as TFAI’s and the Sub-Adviser’s profitability, are appropriate in light of the services provided, the management fees and overall expense ratios of comparable investment companies and the anticipated profitability of the relationship between the Fund, TFAI and its affiliates, and the Sub-Adviser.
Whether fee levels reflect economies of scale and the extent to which economies of scale would be realized as the Fund grows. The Board concluded that the inclusion of asset-based breakpoints in the Fund’s advisory fee schedule appropriately benefits investors by realizing economies of scale in the form of lower management fees as the level of assets grows. In addition, the Board concluded that the Fund’s management fees appropriately reflect the Fund’s current size, the current economic environment for TFAI, the competitive nature of the investment company market, and TFAI’s pricing strategy. The Trustees also concluded that they will have the opportunity to periodically reexamine whether the Fund has achieved economies of scale, and the appropriateness of management fees payable to TFAI and fees payable by TFAI to the Sub-Adviser, in the future.
Benefits (such as soft dollars) to TFAI, its affiliates, or the Sub-Adviser from their relationship with the Fund. The Board concluded that other benefits derived by TFAI, its affiliates, and the Sub-Adviser from their relationship with the Fund are reasonable and fair, and are consistent with industry practice and the best interests of the Fund and its shareholders. In this regard, the Board noted that TFAI does not realize “soft dollar” benefits from its relationship with the Fund. In addition, the Trustees determined that the administration, transfer agency, fund accounting and other fees paid by the Fund to affiliates of TFAI are reasonable, fair and in the best interests of shareholders in light of the nature and quality of the services provided, the associated costs to these affiliates of providing the services, the impact of the costs of such services on the Fund’s overall operating expenses, and the necessity of the services for the Fund’s operations.
Other considerations. The Board also determined that TFAI had made a substantial commitment to the recruitment and retention of high quality personnel, and maintained the financial, compliance and operational resources reasonably necessary to manage the Fund in a professional manner that is consistent with the best interests of the Fund and its shareholders. In this regard, the Trustees favorably considered the procedures and policies in place by TFAI to enforce compliance with applicable laws and regulations and oversee the portfolio management activities of the Sub-Adviser. The Trustees also determined that TFAI had made a significant entrepreneurial commitment to the management and success of the Fund, reflected by TFAI’s expense limitation and fee waiver arrangement with the Fund, which may result in TFAI waiving advisory fees for the benefit of shareholders.
196
TA IDEX MERCURY GLOBAL ALLOCATION
INVESTMENT ADVISORY AND SUB-ADVISORY AGREEMENTS - REVIEW AND APPROVAL (unaudited)
At a meeting of the Board of Trustees of Transamerica IDEX Mutual Funds (“TA IDEX”) held on July 26, 2005, the Board reviewed and considered the proposed Investment Advisory Agreement between TA IDEX Mercury Global Allocation (the “Fund”) and Transamerica Fund Advisors, Inc. (“TFAI”), as well as the proposed Investment Sub-Advisory Agreement of the Fund between TFAI and Fund Asset Management, L.P., doing business as Mercury Advisors (the “Sub-Adviser”), to determine whether the agreements should be approved for an initial two-year period. Following their review and consideration, the Trustees determined that the proposed Investment Advisory Agreement and the proposed Investment Sub-Advisory Agreement will enable shareholders of the Fund to obtain high quality services at a cost that is appropriate, reasonable, and in the best interests of its shareholders. The Board, including the independent members of the Board, unanimously approved the proposed Investment Advisory Agreement and Investment Sub-Advisory Agreement. In reaching their decision, the Trustees requested and obtained from TFAI and the Sub-Adviser such information as they deemed reasonably necessary to evaluate the proposed agreements. The Trustees also carefully considered the comparative fee, expense and performance information of another fund managed by the Sub-Adviser that is managed in accordance with an investment program that closely resembles the proposed investment program of the Fund (the “Sub-Adviser’s Similar Fund”) prepared by Lipper Inc. (“Lipper”), independent providers of mutual fund performance, fee and expense information, and anticipated profitability data. In considering the proposed Investment Advisory Agreement and Investment Sub-Advisory Agreement, the Trustees evaluated a number of considerations that they believe, in light of the legal advice furnished to them by TA IDEX counsel and independent legal counsel and their own business judgment, to be relevant. They based their decisions on the following considerations, among others, although they did not identify any consideration or particular information that was controlling of their decisions:
The nature, extent and quality of the advisory service to be provided. The Board considered the nature, extent and quality of the services proposed to be provided by TFAI and the Sub-Adviser to the Fund. The Board concluded that TFAI and the Sub-Adviser are capable of providing high quality services to the Fund, as indicated by TFAI’s and the Sub-Adviser’s management capabilities demonstrated with respect to the funds they manage, and the experience, capability and integrity of TFAI’s senior management, the financial resources of TFAI and the Sub-Adviser, TFAI’s management oversight process and the professional qualifications and experience of the Sub-Adviser’s portfolio management team. The Board also determined that TFAI and the Sub-Adviser can provide investment and related services that are appropriate in scope and extent in light of the proposed operations of the Fund, the competitive landscape of the investment company business, and investor needs.
The investment performance of the Fund. The Board considered the performance of the Sub-Adviser’s Similar Fund as compared to its Lipper peers. The Board noted that the Sub-Adviser’s Similar Fund has outperformed its Lipper peers for the year-to-date, one-, and three-year trailing periods ended May 31, 2005. On the basis of the Trustees’ assessment of the nature, extent and quality of advisory services expected to be provided or procured by TFAI and the Sub-Adviser, as well as the performance of the Sub-Adviser’s Similar Fund, the Trustees concluded that TFAI and the Sub-Adviser are capable of generating a level of investment performance that is appropriate in light of the Fund’s proposed investment objective, policies and strategies and competitive with many other investment companies, and also determined that TFAI’s and the Sub-Adviser’s management is likely to benefit the Fund and its shareholders.
The cost of advisory services provided and the level of profitability. The Board reviewed estimated profitability information regarding TFAI’s costs of procuring portfolio management services, as well as the anticipated costs of provision of administration, transfer agency, fund accounting and other services, to the Fund and to TA IDEX as a whole by TFAI and its affiliates. Based on such information, the Trustees determined that the level of anticipated investment management fees and estimated overall expense ratio of the Fund generally are consistent with industry averages. The Board also took note of the costs involved in establishing a new fund. In addition, on the basis of the Board’s review of the management fees to be
197
charged by TFAI for investment advisory and related services, the anticipated TFAI profitability information (based on estimates derived from a TFAI profitability analysis provided at the meeting), TFAI’s estimated management income resulting from its management of the Fund, as well as the entirety of TFAI’s and its affiliates’ service relationship with TA IDEX, the Board concluded that the anticipated investment management fees and other service fees, as well as TFAI’s estimated profitability, are appropriate in light of the nature and quality of services proposed to be provided, the management fees and overall expense ratios of comparable investment companies and the anticipated profitability of the relationship between the Fund, TFAI and its affiliates, and the Sub-Adviser.
Whether fee levels reflect economies of scale and the extent to which economies of scale would be realized as the Fund grows. In evaluating the extent to which the management fees payable under the proposed Investment Advisory Agreement reflect economies of scale or will permit economies of scale to be realized in the future, the Board took note of the proposed advisory fee breakpoints as detailed in the materials provided, and noted each fee breakpoint with respect to the various asset levels achieved by the Fund. The Board concluded that the inclusion of the asset-based breakpoints in the Fund’s advisory fee schedule appropriately benefits investors by realizing economies of scale in the form of lower management fees as the level of assets grows. In addition, the Board determined that the Fund’s proposed management fees appropriately reflect the Fund’s anticipated size, the current economic environment for TFAI, the competitive nature of the investment company market, and the TFAI’s pricing strategy. The Trustees also concluded that they will have the opportunity to periodically re-examine whether the Fund has achieved economies of scale, and the appropriateness of management fees payable to TFAI and fees payable by TFAI to the Sub-Adviser, in the future.
Benefits (such as soft dollars) to TFAI, its affiliates, or the Sub-Adviser from their relationship with the Fund. The Board concluded that other benefits anticipated to be derived by TFAI and the Sub-Adviser from their relationship with the Fund, including “soft-dollar” benefits (if any) in connection with brokerage transactions should be reasonable and fair, and consistent with industry practice and the best interests of the Fund and its shareholders. In this regard, the Board noted that TFAI does not realize “soft dollar” benefits from its relationship with the Fund, and that the Sub-Adviser’s “soft-dollar” arrangements will be consistent with applicable law and “best execution” requirements. In addition, the Trustees determined that the administration, transfer agency, fund accounting and other fees to be paid by the Fund to affiliates of TFAI should be reasonable, fair and in the best interests of shareholders in light of the nature and quality of the services anticipated to be provided, the associated costs to these affiliates of providing the services, the impact of the costs of such services on the Fund’s overall operating expenses, and the necessity of the services for the Fund’s operations.
Other considerations. In approving the Fund, the Board considered the high quality of the Sub-Adviser’s portfolio management personnel who will manage the Fund under the Sub-Advisory Agreement, and the Sub-Adviser’s overall portfolio management capabilities. The Board also considered the proposed investment objective of the Fund and the proposed strategy for the Fund, and determined that it would enhance the investment options for the asset allocation funds. The Board determined that TFAI and the Sub-Adviser have made a substantial commitment to the recruitment and retention of high quality personnel, and maintains the financial, compliance and operational resources reasonably necessary to manage the Fund in a professional manner that is consistent with the best interests of the Fund and its shareholders. In this regard, the Trustees favorably considered the procedures and policies in place by TFAI to enforce compliance with applicable laws and regulations and oversee the portfolio management activities of the Sub-Adviser. The Trustees also determined that TFAI had made a significant entrepreneurial commitment to the management and success of the TA IDEX funds, reflected by TFAI’s expense limitation and fee waiver arrangements with the TA IDEX funds, which may result in TFAI waiving advisory fees for the benefit of shareholders.
198
TA IDEX MERCURY LARGE CAP VALUE
INVESTMENT ADVISORY AND SUB-ADVISORY AGREEMENTS - REVIEW AND RENEWAL (unaudited)
At a meeting of the Board of Trustees of Transamerica IDEX Mutual Funds (“TA IDEX”) held on November 2, 2005, the Board reviewed and considered the Investment Advisory Agreement between TA IDEX Mercury Large Cap Value (the “Fund”) and Transamerica Fund Advisors, Inc. (“TFAI”), as well as the Investment Sub-Advisory Agreement of the Fund between TFAI and Fund Asset Management, L.P., doing business as Mercury Advisors (the “Sub-Adviser”), to determine whether the agreements should be renewed for a one-year period. Following their review and consideration, the Trustees determined that the Investment Advisory Agreement and the Investment Sub-Advisory Agreement will enable shareholders of the Fund to obtain high quality services at a cost that is appropriate, reasonable, and in the best interests of its shareholders. The Board, including the independent members of the Board, unanimously approved the renewal of the Investment Advisory Agreement and the Investment Sub-Advisory Agreement. In reaching their decision, the Trustees requested and obtained from TFAI and the Sub-Adviser such information as they deemed reasonably necessary to evaluate the proposed agreements. The Trustees also carefully considered the information that they had received throughout the year from TFAI and the Sub-Adviser (such as in-person presentations by the Sub-Adviser) as part of their regular oversight of the Fund, as well as: comparative fee, expense and performance information prepared by Lipper Inc. (“Lipper”), independent providers of mutual fund performance, fee and expense information, and profitability data. In considering the proposed continuation of the Investment Advisory Agreement and Investment Sub-Advisory Agreement, the Trustees evaluated a number of considerations that they believed, in light of the legal advice furnished to them by TA IDEX counsel and independent legal counsel and their own business judgment, to be relevant. They based their decisions on the following considerations, among others, although they did not identify any consideration or particular information that was controlling of their decisions:
The nature, extent and quality of the advisory service to be provided. The Board considered the nature and quality of the services provided by TFAI and the Sub-Adviser to the Fund in the past, as well as the services anticipated to be provided in the future. The Board concluded that TFAI and the Sub-Adviser are capable of providing high quality services to the Fund, as indicated by the nature and quality of services provided in the past, TFAI’s and the Sub-Adviser’s management capabilities demonstrated with respect to the funds they manage, including the Fund, and the experience, capability and integrity of TFAI’s senior management, the financial resources of TFAI and the Sub-Adviser, TFAI’s management oversight process, the professional qualifications and experience of the Sub-Adviser’s portfolio management team, and the Fund’s investment performance. The Trustees also concluded that TFAI and the Sub-Adviser proposed to provide investment and related services that were of the same quality and quantity as services provided to the Fund in the past, and that these services are appropriate in scope and extent in light of the Fund’s operations, the competitive landscape of the investment company business and investor needs, and that TFAI’s and the Sub-Adviser’s obligations will remain substantially the same.
The investment performance of the Fund. The Board examined the year-to-date performance (the Fund commenced operations on March 1, 2005) of the Fund, including relative performance against a benchmark securities index and a peer group of comparable mutual funds as prepared by Lipper, ended June 30, 2005. The Board favorably noted the competitive performance of the Fund since its creation and the Trustees concluded that TFAI and the Sub-Adviser had achieved superior performance, noting that the Fund’s performance has been above median relative to its peers and superior to the benchmark index over this period. On the basis of the Trustees’ assessment of the nature, extent and quality of advisory services to be provided or procured by TFAI and the Sub-Adviser, the Trustees concluded that TFAI and the Sub-Adviser are capable of generating a level of investment performance that is appropriate in light of the Fund’s investment objective, policies and strategies and competitive with many other investment companies, and also determined that TFAI’s and the Sub-Adviser’s performance records indicate that their continued management is likely to benefit the Fund and its shareholders.
199
The cost of advisory services provided and the level of profitability. The Board reviewed profitability information regarding TFAI’s costs of procuring portfolio management services, as well as the costs of provision of administration, transfer agency, fund accounting and other services, to the Fund and to TA IDEX as a whole by TFAI and its affiliates. The Trustees reviewed data from Lipper that compared the Fund’s management fees (including management fees at various asset levels), other fees and expenses (including total expenses including and excluding 12b-1 distribution and service fees) and portfolio turnover rate against peer groups of comparable mutual funds. Based on such information, the Trustees determined that the management fees and overall expense ratio of the Fund generally are consistent with industry averages. In addition, on the basis of the Board’s review of the management fees to be charged by TFAI for investment advisory and related services, TFAI profitability information (derived from TFAI’s audited financial statements), TFAI’s estimated management income resulting from its management of the Fund, the estimated margin of the Sub-Adviser, as well as the entirety of TFAI’s and its affiliates’ service relationship with TA IDEX, the Board concluded that the level of investment management fees and other service fees, as well as TFAI’s and the Sub-Adviser’s profitability, are appropriate in light of the services provided, the management fees and overall expense ratios of comparable investment companies and the anticipated profitability of the relationship between the Fund, TFAI and its affiliates, and the Sub-Adviser.
Whether fee levels reflect economies of scale and the extent to which economies of scale would be realized as the Fund grows. The Board concluded that the inclusion of asset-based breakpoints in the Fund’s advisory fee schedule appropriately benefits investors by realizing economies of scale in the form of lower management fees as the level of assets grows. In addition, the Board concluded that the Fund’s management fees appropriately reflect the Fund’s current size, the current economic environment for TFAI, the competitive nature of the investment company market, and TFAI’s pricing strategy. The Trustees also concluded that they will have the opportunity to periodically reexamine whether the Fund has achieved economies of scale, and the appropriateness of management fees payable to TFAI and fees payable by TFAI to the Sub-Adviser, in the future.
Benefits (such as soft dollars) to TFAI, its affiliates, or the Sub-Adviser from their relationship with the Fund. The Board concluded that other benefits derived by TFAI, its affiliates, and the Sub-Adviser from their relationship with the Fund are reasonable and fair, and are consistent with industry practice and the best interests of the Fund and its shareholders. In this regard, the Board noted that neither TFAI nor the Sub-Adviser realizes “soft dollar” benefits from its relationship with the Fund. In addition, the Trustees determined that the administration, transfer agency, fund accounting and other fees paid by the Fund to affiliates of TFAI are reasonable, fair and in the best interests of shareholders in light of the nature and quality of the services provided, the associated costs to these affiliates of providing the services, the impact of the costs of such services on the Fund’s overall operating expenses, and the necessity of the services for the Fund’s operations.
Other considerations. The Board also determined that TFAI had made a substantial commitment to the recruitment and retention of high quality personnel, and maintained the financial, compliance and operational resources reasonably necessary to manage the Fund in a professional manner that is consistent with the best interests of the Fund and its shareholders. In this regard, the Trustees favorably considered the procedures and policies in place by TFAI to enforce compliance with applicable laws and regulations and oversee the portfolio management activities of the Sub-Adviser. The Trustees also determined that TFAI had made a significant entrepreneurial commitment to the management and success of the Fund, reflected by TFAI’s expense limitation and fee waiver arrangement with the Fund, which may result in TFAI waiving advisory fees for the benefit of shareholders.
200
TA IDEX NEUBERGER BERMAN INTERNATIONAL
INVESTMENT ADVISORY AND SUB-ADVISORY AGREEMENTS - REVIEW AND APPROVAL (unaudited)
At a meeting of the Board of Trustees of Transamerica IDEX Mutual Funds (“TA IDEX”) held on July 26, 2005, the Board reviewed and considered the proposed Investment Advisory Agreement between TA IDEX Neuberger Berman International (the “Fund”) and Transamerica Fund Advisors, Inc. (“TFAI”), as well as the proposed Investment Sub-Advisory Agreement of the Fund between TFAI and Neuberger Berman Management, Inc. (the “Sub-Adviser”), to determine whether the agreements should be approved for an initial two-year period. Following their review and consideration, the Trustees determined that the proposed Investment Advisory Agreement and the proposed Investment Sub-Advisory Agreement will enable shareholders of the Fund to obtain high quality services at a cost that is appropriate, reasonable, and in the best interests of its shareholders. The Board, including the independent members of the Board, unanimously approved the proposed Investment Advisory Agreement and Investment Sub-Advisory Agreement. In reaching their decision, the Trustees requested and obtained from TFAI and the Sub-Adviser such information as they deemed reasonably necessary to evaluate the proposed agreements. The Trustees also carefully considered the comparative fee, expense and performance information of another fund managed by the Sub-Adviser that is managed in accordance with an investment program that closely resembles the proposed investment program of the Fund (the “Sub-Adviser’s Similar Fund”) prepared by Lipper Inc. (“Lipper”), independent providers of mutual fund performance, fee and expense information, and anticipated profitability data. In considering the proposed Investment Advisory Agreement and Investment Sub-Advisory Agreement, the Trustees evaluated a number of considerations that they believe, in light of the legal advice furnished to them by TA IDEX counsel and independent legal counsel and their own business judgment, to be relevant. They based their decisions on the following considerations, among others, although they did not identify any consideration or particular information that was controlling of their decisions:
The nature, extent and quality of the advisory service to be provided. The Board considered the nature, extent and quality of the services proposed to be provided by TFAI and the Sub-Adviser to the Fund. The Board concluded that TFAI and the Sub-Adviser are capable of providing high quality services to the Fund, as indicated by TFAI’s and the Sub-Adviser’s management capabilities demonstrated with respect to the funds they manage, and the experience, capability and integrity of TFAI’s senior management, the financial resources of TFAI and the Sub-Adviser, TFAI’s management oversight process and the professional qualifications and experience of the Sub-Adviser’s portfolio management team. The Board also determined that TFAI and the Sub-Adviser can provide investment and related services that are appropriate in scope and extent in light of the proposed operations of the Fund, the competitive landscape of the investment company business, and investor needs.
The investment performance of the Fund. The Board considered the performance of the Sub-Adviser’s Similar Fund as compared to its Lipper peers. The Board noted that the Sub-Adviser’s Similar Fund has outperformed its Lipper peers for the year-to-date, one- and three-year trailing periods ended May 31, 2005. On the basis of the Trustees’ assessment of the nature, extent and quality of advisory services expected to be provided or procured by TFAI and the Sub-Adviser, as well as the performance of the Sub-Adviser’s Similar Fund, the Trustees concluded that TFAI and the Sub-Adviser are capable of generating a level of investment performance that is appropriate in light of the Fund’s proposed investment objective, policies and strategies and competitive with many other investment companies, and also determined that TFAI’s and the Sub-Adviser’s management is likely to benefit the Fund and its shareholders.
The cost of advisory services provided and the level of profitability. The Board reviewed estimated profitability information regarding TFAI’s costs of procuring portfolio management services, as well as the anticipated costs of provision of administration, transfer agency, fund accounting and other services, to the Fund and to TA IDEX as a whole by TFAI and its affiliates. The Board noted that the anticipated asset weighted investment management fee for the Fund is lower than the category median investment management fee. Based on such information, the Trustees determined that the level of anticipated investment management fees and estimated overall expense ratio of the Fund generally are consistent with industry averages. The Board also took note of the costs involved in establishing a new fund. In addition,
201
on the basis of the Board’s review of the management fees to be charged by TFAI for investment advisory and related services, the anticipated TFAI profitability information (based on estimates derived from a TFAI profitability analysis provided at the meeting), TFAI’s estimated management income resulting from its management of the Fund, as well as the entirety of TFAI’s and its affiliates’ service relationship with TA IDEX, the Board concluded that the anticipated investment management fees and other service fees, as well as TFAI’s estimated profitability, are appropriate in light of the nature and quality of services proposed to be provided, the management fees and overall expense ratios of comparable investment companies and the anticipated profitability of the relationship between the Fund, TFAI and its affiliates, and the Sub-Adviser.
Whether fee levels reflect economies of scale and the extent to which economies of scale would be realized as the Fund grows. In evaluating the extent to which the management fees payable under the proposed Investment Advisory Agreement reflect economies of scale or will permit economies of scale to be realized in the future, the Board took note of the proposed advisory fee breakpoints as detailed in the materials provided, and noted each fee breakpoint with respect to the various asset levels achieved by the Fund. The Board concluded that the inclusion of the asset-based breakpoints in the Fund’s advisory fee schedule appropriately benefits investors by realizing economies of scale in the form of lower management fees as the level of assets grows. In addition, the Board determined that the Fund’s proposed management fees appropriately reflect the Fund’s anticipated size, the current economic environment for TFAI, the competitive nature of the investment company market, and the TFAI’s pricing strategy. The Trustees also concluded that they will have the opportunity to periodically re-examine whether the Fund has achieved economies of scale, and the appropriateness of management fees payable to TFAI and fees payable by TFAI to the Sub-Adviser, in the future.
Benefits (such as soft dollars) to TFAI, its affiliates, or the Sub-Adviser from their relationship with the Fund. The Board concluded that other benefits anticipated to be derived by TFAI and the Sub-Adviser from their relationship with the Fund, including “soft-dollar” benefits (if any) in connection with brokerage transactions should be reasonable and fair, and consistent with industry practice and the best interests of the Fund and its shareholders. In this regard, the Board noted that TFAI does not realize “soft dollar” benefits from its relationship with the Fund, and that the Sub-Adviser is participating in a brokerage program pursuant to which a portion of brokerage commissions paid by the Fund is recaptured for the benefit of the Fund and its shareholders, thus limiting the amount of “soft dollar” arrangements the Sub-Adviser may engage in with respect to the Fund’s brokerage transactions. In addition, the Trustees determined that the administration, transfer agency, fund accounting and other fees to be paid by the Fund to affiliates of TFAI should be reasonable, fair and in the best interests of shareholders in light of the nature and quality of the services anticipated to be provided, the associated costs to these affiliates of providing the services, the impact of the costs of such services on the Fund’s overall operating expenses, and the necessity of the services for the Fund’s operations.
Other considerations. In approving the Fund, the Board considered the high quality of the Sub-Adviser’s portfolio management personnel who will manage the Fund under the Sub-Advisory Agreement, and the Sub-Adviser’s overall portfolio management capabilities. The Board also considered the proposed investment objective of the Fund and the proposed strategy for the Fund, and determined that it would enhance the investment options for the asset allocation funds. The Board determined that TFAI and the Sub-Adviser have made a substantial commitment to the recruitment and retention of high quality personnel, and maintains the financial, compliance and operational resources reasonably necessary to manage the Fund in a professional manner that is consistent with the best interests of the Fund and its shareholders. In this regard, the Trustees favorably considered the procedures and policies in place by TFAI to enforce compliance with applicable laws and regulations and oversee the portfolio management activities of the Sub-Adviser. The Trustees also determined that TFAI had made a significant entrepreneurial commitment to the management and success of the TA IDEX funds, reflected by TFAI’s expense limitation and fee waiver arrangements with the TA IDEX funds, which may result in TFAI waiving advisory fees for the benefit of shareholders.
202
TA IDEX OPPENHEIMER DEVELOPING MARKETS
INVESTMENT ADVISORY AND SUB-ADVISORY AGREEMENTS - REVIEW AND APPROVAL (unaudited)
At a meeting of the Board of Trustees of Transamerica IDEX Mutual Funds (“TA IDEX”) held on July 26, 2005, the Board reviewed and considered the proposed Investment Advisory Agreement between TA IDEX Oppenheimer Developing Markets (the “Fund”) and Transamerica Fund Advisors, Inc. (“TFAI”), as well as the proposed Investment Sub-Advisory Agreement of the Fund between TFAI and OppenheimerFunds, Inc. (the “Sub-Adviser”), to determine whether the agreements should be approved for an initial two-year period. Following their review and consideration, the Trustees determined that the proposed Investment Advisory Agreement and the proposed Investment Sub-Advisory Agreement will enable shareholders of the Fund to obtain high quality services at a cost that is appropriate, reasonable, and in the best interests of its shareholders. The Board, including the independent members of the Board, unanimously approved the proposed Investment Advisory Agreement and Investment Sub-Advisory Agreement. The Trustees also carefully considered the comparative fee, expense and performance information of another fund managed by the Sub-Adviser that is managed in accordance with an investment program that closely resembles the proposed investment program of the Fund (the “Sub-Adviser’s Similar Fund”) prepared by Lipper Inc. (“Lipper”), independent providers of mutual fund performance, fee and expense information, and anticipated profitability data. In considering the proposed Investment Advisory Agreement and Investment Sub-Advisory Agreement, the Trustees evaluated a number of considerations that they believe, in light of the legal advice furnished to them by TA IDEX counsel and independent legal counsel and their own business judgment, to be relevant. They based their decisions on the following considerations, among others, although they did not identify any consideration or particular information that was controlling of their decisions:
The nature, extent and quality of the advisory service to be provided. The Board considered the nature, extent and quality of the services proposed to be provided by TFAI and the Sub-Adviser to the Fund. The Board concluded that TFAI and the Sub-Adviser are capable of providing high quality services to the Fund, as indicated by TFAI’s and the Sub-Adviser’s management capabilities demonstrated with respect to the funds they manage, and the experience, capability and integrity of TFAI’s senior management, the financial resources of TFAI and the Sub-Adviser, TFAI’s management oversight process and the professional qualifications and experience of the Sub-Adviser’s portfolio management team. The Board also determined that TFAI and the Sub-Adviser can provide investment and related services that are appropriate in scope and extent in light of the proposed operations of the Fund, the competitive landscape of the investment company business, and investor needs.
The investment performance of the Fund. The Board considered the performance of the Sub-Adviser’s Similar Fund as compared to its Lipper peers. The Board noted that the Sub-Adviser’s Similar Fund has outperformed its Lipper peers for the year-to-date, one- and three-year trailing periods ended May 31, 2005. On the basis of the Trustees’ assessment of the nature, extent and quality of advisory services expected to be provided or procured by TFAI and the Sub-Adviser, as well as the performance of the Sub-Adviser’s Similar Fund, the Trustees concluded that TFAI and the Sub-Adviser are capable of generating a level of investment performance that is appropriate in light of the Fund’s proposed investment objective, policies and strategies and competitive with many other investment companies, and also determined that TFAI’s and the Sub-Adviser’s management is likely to benefit the Fund and its shareholders.
The cost of advisory services provided and the level of profitability. The Board reviewed estimated profitability information regarding TFAI’s costs of procuring portfolio management services, as well as the anticipated costs of provision of administration, transfer agency, fund accounting and other services, to the Fund and to TA IDEX as a whole by TFAI and its affiliates. The Board noted that the anticipated asset weighted investment management fee for the Fund is lower than the category median investment management fee. Based on such information, the Trustees determined that the level of anticipated investment management fees and estimated overall expense ratio of the Fund generally are consistent with industry averages. The Board also took note of the costs involved in establishing a new fund. In addition, on the basis of the Board’s review of the management fees to be charged by TFAI for investment advisory
203
and related services, the anticipated TFAI profitability information (based on estimates derived from a TFAI profitability analysis provided at the meeting), TFAI’s estimated management income resulting from its management of the Fund, as well as the entirety of TFAI’s and its affiliates’ service relationship with TA IDEX, the Board concluded that the anticipated investment management fees and other service fees, as well as TFAI’s estimated profitability, are appropriate in light of the nature and quality of services proposed to be provided, the management fees and overall expense ratios of comparable investment companies and the anticipated profitability of the relationship between the Fund, TFAI and its affiliates, and the Sub-Adviser.
Whether fee levels reflect economies of scale and the extent to which economies of scale would be realized as the Fund grows. In evaluating the extent to which the management fees payable under the proposed Investment Advisory Agreement reflect economies of scale or will permit economies of scale to be realized in the future, the Board took note of the proposed advisory fee breakpoints as detailed in the materials provided, and noted each fee breakpoint with respect to the various asset levels achieved by the Fund. The Board concluded that the inclusion of the asset-based breakpoints in the Fund’s advisory fee schedule appropriately benefits investors by realizing economies of scale in the form of lower management fees as the level of assets grows. In addition, the Board determined that the Fund’s proposed management fees appropriately reflect the Fund’s anticipated size, the current economic environment for TFAI, the competitive nature of the investment company market, and the TFAI’s pricing strategy. The Trustees also concluded that they will have the opportunity to periodically re-examine whether the Fund has achieved economies of scale, and the appropriateness of management fees payable to TFAI and fees payable by TFAI to the Sub-Adviser, in the future.
Benefits (such as soft dollars) to TFAI, its affiliates, or the Sub-Adviser from their relationship with the Fund. The Board concluded that other benefits anticipated to be derived by TFAI and the Sub-Adviser from their relationship with the Fund, including “soft-dollar” benefits (if any) in connection with brokerage transactions should be reasonable and fair, and consistent with industry practice and the best interests of the Fund and its shareholders. In this regard, the Board noted that TFAI does not realize “soft dollar” benefits from its relationship with the Fund, and that the Sub-Adviser’s “soft-dollar” arrangements will be consistent with applicable law and “best execution” requirements. In addition, the Trustees determined that the administration, transfer agency, fund accounting and other fees to be paid by the Fund to affiliates of TFAI should be reasonable, fair and in the best interests of shareholders in light of the nature and quality of the services anticipated to be provided, the associated costs to these affiliates of providing the services, the impact of the costs of such services on the Fund’s overall operating expenses, and the necessity of the services for the Fund’s operations.
Other considerations. In approving the Fund, the Board considered the high quality of the Sub-Adviser’s portfolio management personnel who will manage the Fund under the Sub-Advisory Agreement, and the Sub-Adviser’s overall portfolio management capabilities. The Board also considered the proposed investment objective of the Fund and the proposed strategy for the Fund, and determined that it would enhance the investment options for the asset allocation funds. The Board determined that TFAI and the Sub-Adviser have made a substantial commitment to the recruitment and retention of high quality personnel, and maintains the financial, compliance and operational resources reasonably necessary to manage the Fund in a professional manner that is consistent with the best interests of the Fund and its shareholders. In this regard, the Trustees favorably considered the procedures and policies in place by TFAI to enforce compliance with applicable laws and regulations and oversee the portfolio management activities of the Sub-Adviser. The Trustees also determined that TFAI had made a significant entrepreneurial commitment to the management and success of the TA IDEX funds, reflected by TFAI’s expense limitation and fee waiver arrangements with the TA IDEX funds, which may result in TFAI waiving advisory fees for the benefit of shareholders.
204
TA IDEX TRANSAMERICA SHORT-TERM BOND
INVESTMENT ADVISORY AND SUB-ADVISORY AGREEMENTS - REVIEW AND RENEWAL (unaudited)
At a meeting of the Board of Trustees of Transamerica IDEX Mutual Funds (“TA IDEX”) held on November 2, 2005, the Board reviewed and considered the Investment Advisory Agreement between TA IDEX Short-Term Bond (the “Fund”) and Transamerica Fund Advisors, Inc. (“TFAI”), as well as the Investment Sub-Advisory Agreement of the Fund between TFAI and Transamerica Investment Management, LLC (the “Sub-Adviser”), to determine whether the agreements should be renewed for a one-year period. Following their review and consideration, the Trustees determined that the Investment Advisory Agreement and the Investment Sub-Advisory Agreement will enable shareholders of the Fund to obtain high quality services at a cost that is appropriate, reasonable, and in the best interests of its shareholders. The Board, including the independent members of the Board, unanimously approved the renewal of the Investment Advisory Agreement and the Investment Sub-Advisory Agreement. In reaching their decision, the Trustees requested and obtained from TFAI and the Sub-Adviser such information as they deemed reasonably necessary to evaluate the proposed agreements. The Trustees also carefully considered the information that they had received throughout the year from TFAI and the Sub-Adviser (such as in-person presentations by the Sub-Adviser) as part of their regular oversight of the Fund, as well as: comparative fee, expense and performance information prepared by Lipper Inc. (“Lipper”), independent providers of mutual fund performance, fee and expense information, and profitability data. In considering the proposed continuation of the Investment Advisory Agreement and the Investment Sub-Advisory Agreement, the Trustees evaluated a number of considerations that they believe, in light of the legal advice furnished to them by TA IDEX counsel and independent legal counsel and their own business judgment, to be relevant. They based their decisions on the following considerations, among others, although they did not identify any consideration or particular information that was controlling of their decisions:
The nature, extent and quality of the advisory service to be provided. The Board considered the nature and quality of the services provided by TFAI and the Sub-Adviser to the Fund in the past, as well as the services anticipated to be provided in the future. The Board concluded that TFAI and the Sub-Adviser are capable of providing high quality services to the Fund, as indicated by the nature and quality of services provided in the past, TFAI’s and the Sub-Adviser’s management capabilities demonstrated with respect to the funds they manage, including the Fund, and the experience, capability and integrity of TFAI’s senior management, the financial resources of TFAI and the Sub-Adviser, TFAI’s management oversight process, the professional qualifications and experience of the Sub-Adviser’s portfolio management team, and the Fund’s investment performance. The Trustees also concluded that TFAI and the Sub-Adviser proposed to provide investment and related services that were of the same quality and quantity as services provided to the Fund in the past, and that these services are appropriate in scope and extent in light of the Fund’s operations, the competitive landscape of the investment company business and investor needs, and that TFAI’s and the Sub-Adviser’s obligations will remain substantially the same.
The investment performance of the Fund. The Board examined the year-to-date performance of the Fund, including relative performance against a benchmark securities index and a peer group of comparable mutual funds as prepared by Lipper, for the period ended June 30, 2005. The Board noted that the Fund had under-performed during the period under review, but noted that the Fund had a very limited performance record as it was recently created, which also had generated a high level of portfolio turnover. The Board decided to monitor the performance of the Fund going forward, and determined that the Fund’s performance was acceptable under the circumstances. On the basis of the Trustees’ assessment of the nature, extent and quality of advisory services to be provided or procured by TFAI and the Sub-Adviser, the Trustees concluded that TFAI and the Sub-Adviser are capable of generating a level of investment performance that is appropriate in light of the Fund’s investment objective, policies and strategies and competitive with many other investment companies, and also determined that TFAI’s and the Sub-Adviser’s performance records indicate that their continued management is likely to benefit the Fund and its shareholders.
205
The cost of advisory services provided and the level of profitability. The Board reviewed profitability information regarding TFAI’s costs of procuring portfolio management services, as well as the costs of provision of administration, transfer agency, fund accounting and other services, to the Fund and to TA IDEX as a whole by TFAI and its affiliates. The Trustees reviewed data from Lipper that compared the Fund’s management fees (including management fees at various asset levels), other fees and expenses (including total expenses including and excluding 12b-1 distribution and service fees) and portfolio turnover rate against a peer group of comparable mutual funds. Based on such information, the Trustees determined that the management fees and overall expense ratio of the Fund generally are consistent with industry averages. In addition, on the basis of the Board’s review of the management fees to be charged by TFAI for investment advisory and related services, TFAI profitability information (derived from TFAI’s audited financial statements), TFAI’s estimated management income resulting from its management of the Fund, the estimated margin of the Sub-Adviser, as well as the entirety of TFAI’s and its affiliates’ service relationship with TA IDEX, the Board concluded that the level of investment management fees and other service fees, as well as TFAI’s and the Sub-Adviser’s profitability, are appropriate in light of the services provided, the management fees and overall expense ratios of comparable investment companies and the anticipated profitability of the relationship between the Fund, TFAI and its affiliates, and the Sub-Adviser.
Whether fee levels reflect economies of scale and the extent to which economies of scale would be realized as the Fund grows. The Board concluded that the inclusion of asset-based breakpoints in the Fund’s advisory fee schedule appropriately benefits investors by realizing economies of scale in the form of lower management fees as the level of assets grows. In addition, the Board concluded that the Fund’s management fees appropriately reflect the Fund’s current size, the current economic environment for TFAI, the competitive nature of the investment company market, and TFAI’s pricing strategy. The Trustees also concluded that they will have the opportunity to periodically reexamine whether the Fund has achieved economies of scale, and the appropriateness of management fees payable to TFAI and fees payable by TFAI to the Sub-Adviser, in the future.
Benefits (such as soft dollars) to TFAI, its affiliates, or the Sub-Adviser from their relationship with the Fund. The Board concluded that other benefits derived by TFAI, its affiliates, and the Sub-Adviser from their relationship with the Fund are reasonable and fair, and are consistent with industry practice and the best interests of the Fund and its shareholders. In this regard, the Board noted that neither TFAI nor the Sub-Adviser realizes “soft dollar” benefits from its relationship with the Fund. In addition, the Trustees determined that the administration, transfer agency, fund accounting and other fees paid by the Fund to affiliates of TFAI are reasonable, fair and in the best interests of shareholders in light of the nature and quality of the services provided, the associated costs to these affiliates of providing the services, the impact of the costs of such services on the Fund’s overall operating expenses, and the necessity of the services for the Fund’s operations.
Other considerations. The Board determined that TFAI had made a substantial commitment to the recruitment and retention of high quality personnel, and maintained the financial, compliance and operational resources reasonably necessary to manage the Fund in a professional manner that is consistent with the best interests of the Fund and its shareholders. In this regard, the Trustees favorably considered the procedures and policies in place by TFAI to enforce compliance with applicable laws and regulations and oversee the portfolio management activities of the Sub-Adviser. The Trustees also determined that TFAI had made a significant entrepreneurial commitment to the management and success of the Fund, reflected by TFAI’s expense limitation and fee waiver arrangement with the Fund, which may result in TFAI waiving advisory fees for the benefit of shareholders.
206
TA IDEX UBS LARGE CAP VALUE
INVESTMENT ADVISORY AND SUB-ADVISORY AGREEMENTS - REVIEW AND RENEWAL (unaudited)
At a meeting of the Board of Trustees of Transamerica IDEX Mutual Funds (“TA IDEX”) held on November 2, 2005, the Board reviewed and considered the Investment Advisory Agreement between TA IDEX UBS Large Cap Value (the “Fund”) and Transamerica Fund Advisors, Inc. (“TFAI”), as well as the Investment Sub-Advisory Agreement of the Fund between TFAI and UBS Global Asset Management (Americas) Inc. (the “Sub-Adviser”), to determine whether the agreements should be renewed for a one-year period. Following their review and consideration, the Trustees determined that the Investment Advisory Agreement and the Investment Sub-Advisory Agreement will enable shareholders of the Fund to obtain high quality services at a cost that is appropriate, reasonable, and in the best interests of its shareholders. The Board, including the independent members of the Board, unanimously approved the renewal of the Investment Advisory Agreement and the Investment Sub-Advisory Agreement. In reaching their decision, the Trustees requested and obtained from TFAI and the Sub-Adviser such information as they deemed reasonably necessary to evaluate the proposed agreements. The Trustees also carefully considered the information that they had received throughout the year from TFAI and the Sub-Adviser (such as in-person presentations by the Sub-Adviser) as part of their regular oversight of the Fund, as well as: comparative fee, expense and performance information prepared by Lipper Inc. (“Lipper”), independent providers of mutual fund performance, fee and expense information, and profitability data. In considering the proposed continuation of the Investment Advisory Agreement and Investment Sub-Advisory Agreement, the Trustees evaluated a number of considerations that they believed, in light of the legal advice furnished to them by TA IDEX counsel and independent legal counsel and their own business judgment, to be relevant. They based their decisions on the following considerations, among others, although they did not identify any consideration or particular information that was controlling of their decisions:
The nature, extent and quality of the advisory service to be provided. The Board considered the nature and quality of the services provided by TFAI and the Sub-Adviser to the Fund in the past, as well as the services anticipated to be provided in the future. The Board concluded that TFAI and the Sub-Adviser are capable of providing high quality services to the Fund, as indicated by the nature and quality of services provided in the past, TFAI’s and the Sub-Adviser’s management capabilities demonstrated with respect to the funds they manage, including the Fund, and the experience, capability and integrity of TFAI’s senior management, the financial resources of TFAI and the Sub-Adviser, TFAI’s management oversight process, the professional qualifications and experience of the Sub-Adviser’s portfolio management team, and the Fund’s investment performance. The Trustees also concluded that TFAI and the Sub-Adviser proposed to provide investment and related services that were of the same quality and quantity as services provided to the Fund in the past, and that these services are appropriate in scope and extent in light of the Fund’s operations, the competitive landscape of the investment company business and investor needs, and that TFAI’s and the Sub-Adviser’s obligations will remain substantially the same.
The investment performance of the Fund. The Board examined the year-to-date (the Fund commenced operations on November 8, 2004) performance of the Fund, including relative performance against a benchmark securities index and a peer group of comparable mutual funds as prepared by Lipper, ended June 30, 2005. The Trustees concluded that TFAI and the Sub-Adviser generally had achieved superior investment performance, noting that the Fund’s performance has been above median relative to its peers and superior to the benchmark index over this period. On the basis of the Trustees’ assessment of the nature, extent and quality of advisory services to be provided or procured by TFAI and the Sub-Adviser, the Trustees concluded that TFAI and the Sub-Adviser are capable of generating a level of investment performance that is appropriate in light of the Fund’s investment objective, policies and strategies and competitive with many other investment companies, and also determined that TFAI’s and the Sub-Adviser’s performance records indicate that their continued management is likely to benefit the Fund and its shareholders.
207
The cost of advisory services provided and the level of profitability. The Board reviewed profitability information regarding TFAI’s costs of procuring portfolio management services, as well as the costs of provision of administration, transfer agency, fund accounting and other services, to the Fund and to TA IDEX as a whole by TFAI and its affiliates. The Board favorably noted the Fund’s new pricing schedule, which results in lower management and sub-advisory fees to the benefit of the Fund and its shareholders, and also reviewed data from Lipper that compared the Fund’s new pricing schedule (including management fees at various asset levels), other fees and expenses (including total expenses including and excluding 12b-1 distribution and service fees) and portfolio turnover rate against peer groups of comparable mutual funds. Based on such information, the Trustees determined that the Fund’s new management fee schedule and overall expense ratio of the Fund generally are consistent with industry averages. In addition, on the basis of the Board’s review of the management fees to be charged by TFAI for investment advisory and related services, TFAI profitability information (derived from TFAI’s audited financial statements), TFAI’s estimated management income resulting from its management of the Fund, the estimated margin of the Sub-Adviser, as well as the entirety of TFAI’s and its affiliates’ service relationship with TA IDEX, the Board concluded that the level of investment management fees and other service fees, as well as TFAI’s and the Sub-Adviser’s profitability, are appropriate in light of the services provided, the management fees and overall expense ratios of comparable investment companies and the anticipated profitability of the relationship between the Fund, TFAI and its affiliates, and the Sub-Adviser.
Whether fee levels reflect economies of scale and the extent to which economies of scale would be realized as the Fund grows. The Board concluded that the inclusion of asset-based breakpoints in the Fund’s advisory fee schedule appropriately benefits investors by realizing economies of scale in the form of lower management fees as the level of assets grows. In addition, the Board concluded that the Fund’s management fees appropriately reflect the Fund’s current size, the current economic environment for TFAI, the competitive nature of the investment company market, and TFAI’s pricing strategy. The Trustees also concluded that they will have the opportunity to periodically reexamine whether the Fund has achieved economies of scale, and the appropriateness of management fees payable to TFAI and fees payable by TFAI to the Sub-Adviser, in the future.
Benefits (such as soft dollars) to TFAI, its affiliates, or the Sub-Adviser from their relationship with the Fund. The Board concluded that other benefits derived by TFAI, its affiliates, and the Sub-Adviser from their relationship with the Fund, including “soft dollar” benefits (if any) in connection with brokerage transactions, sales charges and distribution/service fees (to the extent applicable) are reasonable and fair, and are consistent with industry practice and the best interests of the Fund and its shareholders. In this regard, the Board noted that TFAI does not realize “soft dollar” benefits from its relationship with the Fund, and that the Sub-Adviser is participating in a brokerage program pursuant to which a portion of brokerage commissions paid by the Fund is recaptured for the benefit of the Fund and its shareholders, thus limiting the amount of “soft-dollar” arrangements the Sub-Adviser may engage in with respect to the Fund’s brokerage transactions. In addition, the Trustees determined that the administration, transfer agency, fund accounting, and other fees paid by the Fund to affiliates of TFAI are reasonable, fair and in the best interests of shareholders in light of the nature and quality of the services provided, the associated costs to these affiliates of providing the services, the impact of the costs of such services on the Fund’s overall operating expenses, and the necessity of the services for the Fund’s operations.
Other considerations. The Board also determined that TFAI had made a substantial commitment to the recruitment and retention of high quality personnel, and maintained the financial, compliance and operational resources reasonably necessary to manage the Fund in a professional manner that is consistent with the best interests of the Fund and its shareholders. In this regard, the Trustees favorably considered the procedures and policies in place by TFAI to enforce compliance with applicable laws and regulations and oversee the portfolio management activities of the Sub-Adviser. The Trustees also determined that TFAI had made a significant entrepreneurial commitment to the management and success of the Fund, reflected by TFAI’s expense limitation and fee waiver arrangement with the Fund, which may result in TFAI waiving advisory fees for the benefit of shareholders.
208
TA IDEX VAN KAMPEN EMERGING MARKETS DEBT
INVESTMENT ADVISORY AND SUB-ADVISORY AGREEMENTS - REVIEW AND RENEWAL (unaudited)
At a meeting of the Board of Trustees of Transamerica IDEX Mutual Funds (“TA IDEX”) held on November 2, 2005, the Board reviewed and considered the Investment Advisory Agreement between TA IDEX Van Kampen Emerging Markets Debt (the “Fund”) and Transamerica Fund Advisors, Inc. (“TFAI”), as well as the Investment Sub-Advisory Agreement of the Fund between TFAI and Morgan Stanley Investment Management, Inc. (the “Sub-Adviser”), to determine whether the agreements should be renewed for a one-year period. Following their review and consideration, the Trustees determined that the Investment Advisory Agreement and the Investment Sub-Advisory Agreement will enable shareholders of the Fund to obtain high quality services at a cost that is appropriate, reasonable, and in the best interests of its shareholders. The Board, including the independent members of the Board, unanimously approved the renewal of the Investment Advisory Agreement and the Investment Sub-Advisory Agreement. In reaching their decision, the Trustees requested and obtained from TFAI and the Sub-Adviser such information as they deemed reasonably necessary to evaluate the proposed agreements. The Trustees also carefully considered the information that they had received throughout the year from TFAI and the Sub-Adviser (such as in-person presentations by the Sub-Adviser) as part of their regular oversight of the Fund, as well as: comparative fee, expense and performance information prepared by Lipper Inc. (“Lipper”), independent providers of mutual fund performance, fee and expense information, and profitability data. In considering the proposed continuation of the Investment Advisory Agreement and the Investment Sub-Advisory Agreement, the Trustees evaluated a number of considerations that they believe, in light of the legal advice furnished to them by TA IDEX counsel and independent legal counsel and their own business judgment, to be relevant. They based their decisions on the following considerations, among others, although they did not identify any consideration or particular information that was controlling of their decisions:
The nature, extent and quality of the advisory service to be provided. The Board considered the nature and quality of the services provided by TFAI and the Sub-Adviser to the Fund in the past, as well as the services anticipated to be provided in the future. The Board concluded that TFAI and the Sub-Adviser are capable of providing high quality services to the Fund, as indicated by the nature and quality of services provided in the past, TFAI’s and the Sub-Adviser’s management capabilities demonstrated with respect to the funds they manage, including the Fund, and the experience, capability and integrity of TFAI’s senior management, the financial resources of TFAI and the Sub-Adviser, TFAI’s management oversight process and the professional qualifications and experience of the Sub-Adviser’s portfolio management team. The Trustees also concluded that TFAI and the Sub-Adviser proposed to provide investment and related services that were of the same quality and quantity as services provided to the Fund in the past, and that these services are appropriate in scope and extent in light of the Fund’s operations, the competitive landscape of the investment company business and investor needs, and that TFAI’s and the Sub-Adviser’s obligations will remain substantially the same.
The investment performance of the Fund. The Board examined the year-to-date (the Fund commenced operations on November 8, 2004) performance of the Fund, including relative performance against a benchmark securities index and a peer group of comparable mutual funds as prepared by Lipper, ended June 30, 2005. The Trustees concluded that TFAI and the Sub-Adviser had achieved investment performance below median relative to its peers and below the performance of the benchmark index over this period, but noted that the Fund had a very limited operating history. On the basis of the Trustees’ assessment of the nature, extent and quality of advisory services to be provided or procured by TFAI and the Sub-Adviser, the Trustees concluded that TFAI and the Sub-Adviser are capable of generating a level of investment performance that is appropriate in light of the Fund’s investment objective, policies and strategies and competitive with many other investment companies, and also determined that TFAI’s and the Sub-Adviser’s continued management is likely to benefit the Fund and its shareholders.
The cost of advisory services provided and the level of profitability. The Board reviewed profitability information regarding TFAI’s costs of procuring portfolio management services, as well as the costs of provision of administration, transfer agency, fund accounting and other services, to the Fund and to TA
209
IDEX as a whole by TFAI and its affiliates. The Trustees reviewed data from Lipper that compared the Fund’s management fees (including management fees at various asset levels), other fees and expenses (including total expenses including and excluding 12b-1 distribution and service fees) and portfolio turnover rate against a peer group of comparable mutual funds. Based on such information, the Trustees determined that the management fees and overall expense ratio of the Fund generally are consistent with industry averages. In addition, on the basis of the Board’s review of the management fees to be charged by TFAI for investment advisory and related services, TFAI profitability information (derived from TFAI’s audited financial statements), TFAI’s estimated management income resulting from its management of the Fund, the estimated margin of the Sub-Adviser, as well as the entirety of TFAI’s and its affiliates’ service relationship with TA IDEX, the Board concluded that the level of investment management fees and other service fees, as well as TFAI’s and the Sub-Adviser’s profitability, are appropriate in light of the services provided, the management fees and overall expense ratios of comparable investment companies and the anticipated profitability of the relationship between the Fund, TFAI and its affiliates, and the Sub-Adviser.
Whether fee levels reflect economies of scale and the extent to which economies of scale would be realized as the Fund grows. The Board concluded that the inclusion of asset-based breakpoints in the Fund’s advisory fee schedule appropriately benefits investors by realizing economies of scale in the form of lower management fees as the level of assets grows. In addition, the Board concluded that the Fund’s management fees appropriately reflect the Fund’s current size, the current economic environment for TFAI, the competitive nature of the investment company market, and TFAI’s pricing strategy. The Trustees also concluded that they will have the opportunity to periodically reexamine whether the Fund has achieved economies of scale, and the appropriateness of management fees payable to TFAI and fees payable by TFAI to the Sub-Adviser, in the future.
Benefits (such as soft dollars) to TFAI, its affiliates, or the Sub-Adviser from their relationship with the Fund. The Board concluded that other benefits derived by TFAI, its affiliates, and the Sub-Adviser from their relationship with the Fund are reasonable and fair, and are consistent with industry practice and the best interests of the Fund and its shareholders. In this regard, the Board noted that neither TFAI nor the Sub-Adviser realizes “soft dollar” benefits from its relationship with the Fund. In addition, the Trustees determined that the administration, transfer agency, fund accounting and other fees paid by the Fund to affiliates of TFAI are reasonable, fair and in the best interests of shareholders in light of the nature and quality of the services provided, the associated costs to these affiliates of providing the services, the impact of the costs of such services on the Fund’s overall operating expenses, and the necessity of the services for the Fund’s operations.
Other considerations. The Board determined that TFAI had made a substantial commitment to the recruitment and retention of high quality personnel, and maintained the financial, compliance and operational resources reasonably necessary to manage the Fund in a professional manner that is consistent with the best interests of the Fund and its shareholders. In this regard, the Trustees favorably considered the procedures and policies in place by TFAI to enforce compliance with applicable laws and regulations and oversee the portfolio management activities of the Sub-Adviser. The Trustees also determined that TFAI had made a significant entrepreneurial commitment to the management and success of the Fund, reflected by TFAI’s expense limitation and fee waiver arrangement with the Fund, which may result in TFAI waiving advisory fees for the benefit of shareholders.
210
TA IDEX VAN KAMPEN MID-CAP GROWTH
INVESTMENT ADVISORY AND SUB-ADVISORY AGREEMENTS - REVIEW AND APPROVAL (unaudited)
At a meeting of the Board of Trustees of Transamerica IDEX Mutual Funds (“TA IDEX”) held on November 2, 2005, the Board reviewed and considered the proposed Investment Advisory Agreement between TA IDEX Van Kampen Mid-Cap Growth (the “Fund”) and Transamerica Fund Advisors, Inc. (“TFAI”), as well as the proposed Investment Sub-Advisory Agreement of the Fund between TFAI and Morgan Stanley Investment Management, Inc. (the “Sub-Adviser”), to determine whether the agreements should be approved for an initial two-year period. Following their review and consideration, the Trustees determined that the proposed Investment Advisory Agreement and the Investment Sub-Advisory Agreement will enable shareholders of the Fund to obtain high quality services at a cost that is appropriate, reasonable, and in the best interests of its shareholders. The Board, including the independent members of the Board, unanimously approved the proposed Investment Advisory Agreement and the Investment Sub-Advisory Agreement. In reaching their decision, the Trustees requested and obtained from TFAI and the Sub-Adviser such information as they deemed reasonably necessary to evaluate the proposed agreements. The Trustees also carefully considered the anticipated fee and expense information and profitability data prepared by TFAI. In considering the approval of the proposed Investment Advisory Agreement and the Investment Sub-Advisory Agreement, the Board considered its prior discussion of the Fund during the September meeting, during which the Board reached a number of conclusions about the management program proposed by TFAI and the Sub-Adviser. In addition, the Trustees evaluated a number of considerations that they believe, in light of the legal advice furnished to them by TA IDEX counsel and independent legal counsel and their own business judgment, to be relevant. They based their decisions on the following considerations, among others, although they did not identify any consideration or particular information that was controlling of their decisions:
The nature, extent and quality of the advisory service to be provided. The Board considered the nature and quality of the services expected to be provided by TFAI and the Sub-Adviser to the Fund. The Board concluded that TFAI and the Sub-Adviser are capable of providing high quality services to the Fund, as indicated by the nature and quality of services provided in the past, TFAI’s and the Sub-Adviser’s management capabilities demonstrated with respect to the funds they manage, and the experience, capability and integrity of TFAI’s senior management, the financial resources of TFAI and the Sub-Adviser, TFAI’s management oversight process and the professional qualifications and experience of the Sub-Adviser’s portfolio management team. The Trustees also concluded that TFAI and the Sub-Adviser proposed to provide investment and related services that are appropriate in scope and extent in light of the Fund’s operations and the competitive landscape of the investment company business and investor needs.
The investment performance of the Fund. The Board noted that no performance information is available for the Fund, but determined that most other funds managed by the Sub-Adviser have generally performed well. On the basis of the Trustees’ assessment of the nature, extent and quality of advisory services expected to be provided or procured by TFAI and the Sub-Adviser, the Trustees concluded that TFAI and the Sub-Adviser are capable of generating a level of investment performance that is appropriate in light of the Fund’s investment objective, policies and strategies and competitive with many other investment companies, and also determined that TFAI’s and the Sub-Adviser’s performance records indicate that their management is likely to benefit the Fund and its shareholders.
The cost of advisory services provided and the level of profitability. The Board reviewed estimated profitability information regarding TFAI’s costs of procuring portfolio management services, as well as the costs of provision of administration, transfer agency, fund accounting and other services, to the Fund and to TA IDEX as a whole by TFAI and its affiliates. Based on such information, the Trustees determined that the proposed management fees and estimated overall expense ratio of the Fund generally are consistent with industry averages. In addition, on the basis of the Board’s review of the management fees to be charged by TFAI for investment advisory and related services, TFAI profitability information (derived from TFAI’s audited financial statements), TFAI’s estimated management income resulting from its management of the Fund, the estimated margin of the Sub-Adviser, as well as the entirety of TFAI’s and its
211
affiliates’ service relationship with TA IDEX, the Board concluded that the anticipated investment management fees and other service fees, as well as TFAI’s and the Sub-Adviser’s estimated profitability, are appropriate in light of the nature and quality of services proposed to be provided, the management fees and overall expense ratios of comparable investment companies and the anticipated profitability of the relationship between the Fund, TFAI and its affiliates, and the Sub-Adviser.
Whether fee levels reflect economies of scale and the extent to which economies of scale would be realized as the Fund grows. The Board noted the absence of asset-based breakpoints in the Fund’s management fee schedule, which is explained in part by the relatively high costs of pursuing the Fund’s investment mandate, which may not necessarily diminish as assets grow. Accordingly, the Board concluded that the Fund’s management fees appropriately reflect the Fund’s anticipated size, the current economic environment for TFAI, the competitive nature of the investment company market, and TFAI’s pricing strategy. The Board nevertheless asked TFAI to work with the Sub-Adviser to attempt to propose such breakpoints in the future. The Trustees also concluded that they will have the opportunity to periodically reexamine whether the Fund has achieved economies of scale, and the appropriateness of management fees payable to TFAI and fees payable by TFAI to the Sub-Adviser, in the future.
Benefits (such as soft dollars) to TFAI, its affiliates, or the Sub-Adviser from their relationship with the Fund. The Board concluded that other benefits expected to be derived by TFAI, its affiliates, and the Sub-Adviser from their relationship with the Fund are reasonable and fair, and are consistent with industry practice and the best interests of the Fund and its shareholders. In this regard, the Board noted that neither TFAI nor the Sub-Adviser realizes “soft dollar” benefits from its relationship with the Fund. In addition, the Trustees determined that the administration, transfer agency, fund accounting and other fees to be paid by the Fund to affiliates of TFAI will be reasonable, fair and in the best interests of shareholders in light of the nature and quality of the services provided, the associated costs to these affiliates of providing the services, the impact of the costs of such services on the Fund’s overall operating expenses, and the necessity of the services for the Fund’s operations.
Other considerations. The Board determined that TFAI had made a substantial commitment to the recruitment and retention of high quality personnel, and maintained the financial, compliance and operational resources reasonably necessary to manage the Fund in a professional manner that is consistent with the best interests of the Fund and its shareholders. In this regard, the Trustees favorably considered the procedures and policies in place by TFAI to enforce compliance with applicable laws and regulations and oversee the portfolio management activities of the Sub-Adviser. The Trustees also determined that TFAI had made a significant entrepreneurial commitment to the management and success of the TA IDEX funds, reflected by TFAI’s expense limitation and fee waiver arrangements with the TA IDEX funds, including the Fund, which may result in TFAI waiving advisory fees for the benefit of shareholders.
212
TA IDEX VAN KAMPEN SMALL COMPANY GROWTH
INVESTMENT ADVISORY AND SUB-ADVISORY AGREEMENTS - REVIEW AND RENEWAL (unaudited)
At a meeting of the Board of Trustees of Transamerica IDEX Mutual Funds (“TA IDEX”) held on November 2, 2005, the Board reviewed and considered the Investment Advisory Agreement between TA IDEX Van Kampen Small Company Growth (the “Fund”) and Transamerica Fund Advisors, Inc. (“TFAI”), as well as the Investment Sub-Advisory Agreement of the Fund between TFAI and Morgan Stanley Investment Management, Inc. (the “Sub-Adviser”), to determine whether the agreements should be renewed for a one-year period. Following their review and consideration, the Trustees determined that the Investment Advisory Agreement and the Investment Sub-Advisory Agreement will enable shareholders of the Fund to obtain high quality services at a cost that is appropriate, reasonable, and in the best interests of its shareholders. The Board, including the independent members of the Board, unanimously approved the renewal of the Investment Advisory Agreement and the Investment Sub-Advisory Agreement. In reaching their decision, the Trustees requested and obtained from TFAI and the Sub-Adviser such information as they deemed reasonably necessary to evaluate the proposed agreements. The Trustees also carefully considered the information that they had received throughout the year from TFAI and the Sub-Adviser (such as in-person presentations by the Sub-Adviser) as part of their regular oversight of the Fund, as well as: comparative fee, expense and performance information prepared by Lipper Inc. (“Lipper”), independent providers of mutual fund performance, fee and expense information, and profitability data. In considering the proposed continuation of the Investment Advisory Agreement and the Investment Sub-Advisory Agreement, the Trustees evaluated a number of considerations that they believe, in light of the legal advice furnished to them by TA IDEX counsel and independent legal counsel and their own business judgment, to be relevant. They based their decisions on the following considerations, among others, although they did not identify any consideration or particular information that was controlling of their decisions:
The nature, extent and quality of the advisory service to be provided. The Board considered the nature and quality of the services provided by TFAI and the Sub-Adviser to the Fund in the past, as well as the services anticipated to be provided in the future. The Board concluded that TFAI and the Sub-Adviser are capable of providing high quality services to the Fund, as indicated by the nature and quality of services provided in the past, TFAI’s and the Sub-Adviser’s management capabilities demonstrated with respect to the funds they manage, including the Fund, and the experience, capability and integrity of TFAI’s senior management, the financial resources of TFAI and the Sub-Adviser, TFAI’s management oversight process, the professional qualifications and experience of the Sub-Adviser’s portfolio management team, and the Fund’s investment performance. The Trustees also concluded that TFAI and the Sub-Adviser proposed to provide investment and related services that were of the same quality and quantity as services provided to the Fund in the past, and that these services are appropriate in scope and extent in light of the Fund’s operations, the competitive landscape of the investment company business and investor needs, and that TFAI’s and the Sub-Adviser’s obligations will remain substantially the same.
The investment performance of the Fund. The Board examined the year-to-date (the Fund commenced operations on November 8, 2004) performance of the Fund, including relative performance against a benchmark securities index and a peer group of comparable mutual funds as prepared by Lipper, ended June 30, 2005. The Board favorably noted the competitive performance of the Fund and the Trustees concluded that TFAI and the Sub-Adviser generally had achieved superior investment performance, noting that the performance of the Fund has been above median relative to its peers and exceeded the benchmark index over this period. On the basis of the Trustees’ assessment of the nature, extent and quality of advisory services to be provided or procured by TFAI and the Sub-Adviser, the Trustees concluded that TFAI and the Sub-Adviser are capable of generating a level of investment performance that is appropriate in light of the Fund’s investment objective, policies and strategies and competitive with many other investment companies, and also determined that TFAI’s and the Sub-Adviser’s performance records indicate that their continued management is likely to benefit the Fund and its shareholders.
The cost of advisory services provided and the level of profitability. The Board reviewed profitability information regarding TFAI’s costs of procuring portfolio management services, as well as the costs of
213
provision of administration, transfer agency, fund accounting and other services, to the Fund and to TA IDEX as a whole by TFAI and its affiliates. The Trustees reviewed data from Lipper that compared the Fund’s management fees (including management fees at various asset levels), other fees and expenses (including total expenses including and excluding 12b-1 distribution and service fees) and portfolio turnover rate against a peer group of comparable mutual funds. Based on such information, the Trustees determined that the management fees and overall expense ratio of the Fund generally are consistent with industry averages. In addition, on the basis of the Board’s review of the management fees to be charged by TFAI for investment advisory and related services, TFAI profitability information (derived from TFAI’s audited financial statements), TFAI’s estimated management income resulting from its management of the Fund, the estimated margin of the Sub-Adviser, as well as the entirety of TFAI’s and its affiliates’ service relationship with TA IDEX, the Board concluded that the level of investment management fees and other service fees, as well as TFAI’s and the Sub-Adviser’s profitability, are appropriate in light of the services provided, the management fees and overall expense ratios of comparable investment companies and the anticipated profitability of the relationship between the Fund, TFAI and its affiliates, and the Sub-Adviser.
Whether fee levels reflect economies of scale and the extent to which economies of scale would be realized as the Fund grows. The Board concluded that the inclusion of asset-based breakpoints in the Fund’s advisory fee schedule appropriately benefits investors by realizing economies of scale in the form of lower management fees as the level of assets grows. In addition, the Board concluded that the Fund’s management fees appropriately reflect the Fund’s current size, the current economic environment for TFAI, the competitive nature of the investment company market, and TFAI’s pricing strategy. The Trustees also concluded that they will have the opportunity to periodically reexamine whether the Fund has achieved economies of scale, and the appropriateness of management fees payable to TFAI and fees payable by TFAI to the Sub-Adviser, in the future.
Benefits (such as soft dollars) to TFAI, its affiliates, or the Sub-Adviser from their relationship with the Fund. The Board concluded that other benefits derived by TFAI, its affiliates, and the Sub-Adviser from their relationship with the Fund, including “soft dollar” benefits (if any) in connection with brokerage transactions, sales charges and distribution/service fees (to the extent applicable) are reasonable and fair, and are consistent with industry practice and the best interests of the Fund and its shareholders. In this regard, the Board noted that TFAI does not realize “soft dollar” benefits from its relationship with the Fund, and that the Sub-Adviser is participating in a brokerage program pursuant to which a portion of brokerage commissions paid by the Fund is recaptured for the benefit of the Fund and its shareholders, thus limiting the amount of “soft-dollar” arrangements the Sub-Adviser may engage in with respect to the Fund’s brokerage transactions. In addition, the Trustees determined that the administration, transfer agency, fund accounting and other fees paid by the Fund to affiliates of TFAI are reasonable, fair and in the best interests of shareholders in light of the nature and quality of the services provided, the associated costs to these affiliates of providing the services, the impact of the costs of such services on the Fund’s overall operating expenses, and the necessity of the services for the Fund’s operations.
Other considerations. The Board determined that TFAI had made a substantial commitment to the recruitment and retention of high quality personnel, and maintained the financial, compliance and operational resources reasonably necessary to manage the Fund in a professional manner that is consistent with the best interests of the Fund and its shareholders. In this regard, the Trustees favorably considered the procedures and policies in place by TFAI to enforce compliance with applicable laws and regulations and oversee the portfolio management activities of the Sub-Adviser. The Trustees also determined that TFAI had made a significant entrepreneurial commitment to the management and success of the Fund, reflected by TFAI’s expense limitation and fee waiver arrangement with the Fund, which may result in TFAI waiving advisory fees for the benefit of shareholders.
214
PROXY VOTING POLICIES AND PROCEDURES AND QUARTERLY PORTFOLIO HOLDINGS
A description of the Transamerica IDEX Mutual Funds' proxy voting policies and procedures is available in the Statement of Additional Information of the Funds, available without charge upon request by calling 1-888-233-4339 (toll free) or on the Securities and Exchange Commission website (http://www.sec.gov).
In addition, the Funds are required to file Form N-PX, with their complete proxy voting records for the 12 months ended June 30th, no later than August 31st of each year. Once filed, the Form will be available without charge: (1) from the Funds, upon request by calling 1-888-233-4339; and (2) on the SEC's website at www.sec.gov.
The Funds file their complete schedule of portfolio holdings with the Securities and Exchange Commission for the first and third quarter of each fiscal year on Form N-Q which is available on the Commission's website at www.sec.gov. The Funds' Form N-Q may be reviewed and copied at the Commission's Public Reference Room in Washington, D.C. Information on the operation of the Public Reference Room may be obtained by calling 1-800-SEC-0330.
P.O. Box 9012
Clearwater, FL 33758-9012

www.transamericaidex.com
Customer Service 1-888-233-IDEX (4339)
P.O. Box 9012 • Clearwater, FL 33758-9012
Distributor: AFSG Securities Corporation, Member NASD
Item 2: Code of Ethics.
Not applicable for semi-annual reports.
Item 3: Audit Committee Financial Expert.
Not applicable for semi-annual reports.
Item 4: Principal Accountant Fees and Services.
Not applicable for semi-annual reports.
Item 5: Audit Committee of Listed Registrants.
Not applicable for semi-annual reports.
Item 6: Schedule of Investments.
The schedules of investments are included in the Semi-Annual report to shareholders filed under Item 1 of this Form N-CSR.
Item 7: Disclosure of Proxy Voting Policies and Procedures for Closed-End Management Investment Companies.
Not applicable.
Item 8: Portfolio Managers of Closed-End Management Investment Companies.
Not applicable.
Item 9: Purchases of Equity Securities by Closed-End Management Investment Company and Affiliated Purchasers.
Not Applicable.
Item 10: Submission of Matters to a Vote of Security Holders
There has been no material change to the procedures by which shareholders may recommend nominees to the Registrant’s Board of Trustees since the Registrant’s last response to Item 10 of Form N-CSR.
11: Controls and Procedures.
(a) Based on their evaluation of Registrant’s disclosure controls and procedures (as defined in Rule 30a-3(c) under the Investment Company Act of 1940, as of April 30, 2006, Registrant’s principal executive officer and principal financial officer found Registrant’s disclosure controls and procedures to be appropriately designed to ensure that information required to be disclosed by Registrant in the reports that it files on Form N-CSR (a) is accumulated and communicated to Registrant’s management, including its principal executive officer and principal financial officer, to allow timely decisions regarding required disclosure, and (b) is recorded, processed, summarized and reported, within the time periods specified in the rules and forms adopted by the U.S. Securities and Exchange Commission.
(b) There have been no significant changes in Registrant’s internal controls over financial reporting that occurred during the Registrant’s last fiscal half year that has materially affected, or is reasonable likely to materially affect, the Registrant’s internal control over financial reporting.
Item 12: Exhibits.
(a) (1) Not Applicable
(2) Separate certifications for Registrant’s principal executive officer and principal financial officer, as required by Rule 30a-2(a) under the 1940 Act, are attached.
(3) N/A
(b) A certification for Registrant’s principal executive officer and principal financial officer, as required by Rule 30a-2(b) under the 1940 Act, is attached. The certification furnished pursuant to this paragraph is not deemed to be “filed” for purposes of Section 18 of the Securities Act of 1934, or otherwise subject to liability of that section. Such certification is not deemed to be incorporated by reference into any filing under the Securities Act of 1933 or the Securities Exchange Act of 1934, except to the extent that the Registrant specifically incorporates it by reference.
SIGNATURES
Pursuant to the requirements of the Securities Exchange Act of 1934 and the Investment Company Act of 1940, the Registrant has duly caused this report to be signed on its behalf by the undersigned, thereunto duly authorized.
| Transamerica IDEX Mutual Funds | ||
| (Registrant) | ||
|
| ||
| By: |
| /s/ Brian C. Scott |
|
|
| Brian C. Scott |
|
|
| Chief Executive Officer |
|
|
| Date: June 28, 2006 |
Pursuant to the requirements of the Securities Exchange Act of 1934 and the Investment Company Act of 1940, this report has been signed below by the following persons on behalf of the Registrant and in the capacities and on the dates indicated.
By: |
| /s/ Brian C. Scott |
|
|
|
|
| Brian C. Scott |
|
|
|
|
| Chief Executive Officer |
|
|
|
Date: |
| Date: June 28, 2006 |
|
|
|
|
|
|
|
|
|
By: |
| /s/ Glenn E. Brightman |
|
|
|
|
| Glenn E. Brightman |
|
|
|
|
| Principal Financial Officer |
|
|
|
Date: |
| Date: June 28, 2006 |
|
|
|
EXHIBIT INDEX
Exhibit No. |
| Description of Exhibit |
12(a)(2)(i) |
| Section 302 N-CSR Certification of Principal Executive Officer |
12(a)(2)(ii) |
| Section 302 N-CSR Certification of Principal Financial Officer |
12(b) |
| Section 906 N-CSR Certification of Principal Executive Officer and Principal Financial Officer |