(17)(2)(i) Prospectus dated March 1, 2011, as supplemented March 22, 2011, as supplemented through October 14, 2011
TRANSAMERICA FUNDS
Supplement to the Currently Effective Prospectuses
* * *
Transamerica AEGON High Yield Bond
The following replaces the information in the Prospectuses under the section entitled “Management – Portfolio Managers” relating to Transamerica AEGON High Yield Bond:
Portfolio Managers:
Bradley J. Beman, CFA, Lead Portfolio Manager since 1997
Kevin Bakker, CFA, Portfolio Manager since 2007
Benjamin D. Miller, CFA, Portfolio Manager since 2006
Jim Schaeffer, Portfolio Manager since 2011
The following replaces the information in the Prospectuses under the section entitled “Shareholder Information – Portfolio Manager(s)” relating to Transamerica AEGON High Yield Bond:
| | | | | | | | |
Name/Year Joined Fund | | Role | | Employer | | Positions Over Past Five Years | | |
| Bradley J. Beman, CFA/1997 | | Portfolio Manager (Lead) | | AUIM | | Chief Investment Officer, Senior Vice President, Director of High Yield | | |
| Kevin Bakker, CFA/2007 | | Portfolio Manager | | AUIM | | High Yield Portfolio Manager | | |
| Benjamin D. Miller, CFA/2006 | | Portfolio Manager | | AUIM | | High Yield Portfolio Manager | | |
| Jim Schaeffer/2011 | | Portfolio Manager | | AUIM | | Senior Vice President, Director of Distressed Debt | | |
* * *
Investors Should Retain this Supplement for Future Reference
October 14, 2011
Transamerica Funds
Supplement to the Currently Effective Prospectus, Summary Prospectus
and Statement of Additional Information, as supplemented
* * *
Transamerica Morgan Stanley Mid-Cap Growth
Transamerica WMC Diversified Growth (each a “Fund”)
The Board of Trustees has approved reorganizations pursuant to which each Fund’s assets would be acquired, and its liabilities would be assumed, by the Destination Fund listed opposite the Fund in the chart below in exchange for shares of the Destination Fund. The Fund would then be liquidated, and shares of the Destination Fund would be distributed to Fund shareholders.
| | |
Fund | | Destination Fund |
Transamerica Morgan Stanley Mid-Cap Growth | | Transamerica Morgan Stanley Growth
Opportunities |
Transamerica WMC Diversified Growth | | Transamerica WMC Diversified Equity |
Under each reorganization, Fund shareholders would receive shares of the Destination Fund with the same aggregate net asset value as their shares of the Fund. It is anticipated that no gain or loss for Federal income tax purposes would be recognized by Fund shareholders as a result of the reorganization.
Each reorganization does not require shareholder approval but is subject to the satisfaction of certain conditions. An information statement describing the reorganizations will be mailed to shareholders of the Funds in advance of the closing of the reorganizations, which is expected to occur in the first quarter of 2012. Prior to the reorganizations, shareholders can continue to purchase, redeem and exchange shares subject to the limitations described in the Prospectus.
* * *
Investors Should Retain this Supplement for Future Reference
October 13, 2011
TRANSAMERICA FUNDS
Supplement to the Currently Effective Retail Prospectus
* * *
The ninth bullet point under the section of the Prospectus entitled “Waivers and/or Reductions of Charges – Waiver of Class A and Class T Initial Sales Charges” is deleted in its entirety and replaced with the following:
| | • | | Other retirement plans, non-qualified brokerage accounts, and other accounts that are opened through an arrangement with Diversified Investment Advisors, Transamerica Retirement Services, Clark Consulting or Transamerica Retirement Management; and | |
* * *
Investors Should Retain this Supplement for Future Reference
August 10, 2011
TRANSAMERICA FUNDS
Supplement to the Currently Effective Prospectuses
* * *
Transamerica AEGON Flexible Income
The following replaces the information in the Retail and Class I2 Prospectuses under the section entitled “Management – Portfolio Managers” relating to Transamerica AEGON Flexible Income:
Portfolio Managers:
Brian W. Westhoff, CFA, Portfolio Manager (Lead) since 2005
Greg Haendel, CFA, Portfolio Manager since 2005
Bradley J. Beman, CFA, CPA, Portfolio Manager since 2011
David Halfpap, Portfolio Manager since 2011
Rick Perry, Portfolio Manager since 2011
Jim Schaeffer, Portfolio Manager since 2011
The following replaces the information in the Retail and Class I2 Prospectuses under the section entitled “Shareholder Information – Portfolio Manager(s)” relating to Transamerica AEGON Flexible Income:
| | | | | | | | |
| Name/Year Joined Fund | | Role | | Employer | | Positions Over Past Five Years | | |
| Brian W. Westhoff, CFA/2005 | | Portfolio Manager (Lead) | | AUIM | | Portfolio Manager | | |
| Greg Haendel, CFA/2005 | | Portfolio Manager | | AUIM | | Portfolio Manager | | |
| Bradley J. Beman, CFA, CPA/2011 | | Portfolio Manager | | AUIM | | Senior Vice President, Director – High Yield | | |
| David Halfpap/2011 | | Portfolio Manager | | AUIM | | Executive Vice President, Portfolio Manager | | |
| Rick Perry/2011 | | Portfolio Manager | | AUIM | | Senior Vice President, Director of Investment Grade Credit | | |
| Jim Schaeffer/2011 | | Portfolio Manager | | AUIM | | Senior Vice President, Director of Distressed Debt | | |
* * *
Transamerica Asset Allocation – Conservative Portfolio
Transamerica Asset Allocation – Growth Portfolio
Transamerica Asset Allocation – Moderate Growth Portfolio
Transamerica Asset Allocation – Moderate Portfolio
Transamerica Multi-Manager Alternative Strategies Portfolio
Transamerica Multi-Manager International Portfolio
Effective April 1, 2011, the information under the section entitled “Shareholder Information – Advisory Fees – Portfolio Construction Manager Compensation” on page 106 of the Retail Prospectus is deleted and replaced with the following:
Portfolio Construction Manager Compensation†
For the fiscal year ended October 31, 2010, the portfolio construction manager received the following fees as a percentage of a fund’s average daily net assets:
| | |
Transamerica Asset Allocation – Conservative Portfolio | | 0.10% |
Transamerica Asset Allocation – Growth Portfolio | | 0.10% |
Transamerica Asset Allocation – Moderate Growth Portfolio | | 0.10% |
Transamerica Asset Allocation – Moderate Portfolio | | 0.10% |
Transamerica Multi-Manager Alternative Strategies Portfolio | | 0.20% |
Transamerica Multi-Manager International Portfolio | | 0.10% |
| | † | Effective April 1, 2011, the portfolio construction manager’s fee for each of the funds is 0.10% of the first $20 billion of average daily net assets; 0.09% of average daily net assets over $20 billion up to $30 billion; and 0.08% over $30 billion. The average daily net assets for the purpose of calculating fees will be determined on a combined basis with all series of Transamerica Series Trust for which Morningstar serves as the portfolio construction manager; and with all series of Transamerica Funds for which Morningstar serves as the portfolio construction manager except Transamerica Multi-Manager Alternative Strategies Portfolio. |
* * *
Transamerica AQR Managed Futures Strategy
The following replaces the information in the Class I2 Prospectus under the section entitled “Management – Portfolio Managers” relating to Transamerica AQR Managed Futures Strategy:
Portfolio Managers:
Clifford S. Asness, Portfolio Manager since 2010
John M. Liew, Portfolio Manager since 2010
Brian K. Hurst, Portfolio Manager since 2010
Yao Hua Ooi, Portfolio Manager since 2010
The following replaces the information in the Class I2 Prospectus under the section entitled “Shareholder Information – Portfolio Manager(s)” relating to Transamerica AQR Managed Futures Strategy:
| | | | | | | | |
| Name/Year Joined Fund | | Role | | Employer | | Positions Over Past Five Years | | |
| Clifford S. Asness/2010 | | Portfolio Manager | | AQR | | Portfolio Manager, Managing and Founding Principal | | |
| John M. Liew/2010 | | Portfolio Manager | | AQR | | Portfolio Manager, Founding Principal | | |
| Brian K. Hurst/2010 | | Portfolio Manager | | AQR | | Portfolio Manager, Principal | | |
| Yao Hua Ooi/2010 | | Portfolio Manager | | AQR | | Portfolio Manager, Vice President | | |
* * *
Transamerica Federated Market Opportunity
The following information supplements and amends information in the Retail and Class I2 Prospectuses:
Transamerica Federated Market Opportunity is deleted in its entirety from the Class I2 Prospectus.
References to Transamerica Federated Market Opportunity are deleted from the section entitled “List and Description of Certain Underlying Funds” in the Retail Prospectus.
* * *
Transamerica Multi-Manager Alternative Strategies Portfolio
The following information replaces information in the Fee Table portion of the section entitled “Fees and Expenses” relating to Transamerica Multi-Manager Alternative Strategies Portfolio in the Retail Prospectus:
| | | | | | |
| Shareholder Fees (fees paid directly from your investment) |
| | | Class of Shares |
| | | A | | C | | I |
| Maximum sales charge (load) imposed on purchases (as a % of offering price) | | 5.50% | | None | | None |
| Maximum deferred sales charge (load) (as a percentage of purchase price or redemption proceeds, whichever is lower) | | None | | 1.00% | | None |
| Annual Fund Operating Expenses (expenses that you pay each year as a percentage of the value of your investment) |
| | | Class of Shares |
| | | A | | C | | I |
Management fees | | 0.20% | | 0.20% | | 0.20% |
Distribution and service (12b-1) fees | | 0.35% | | 1.00% | | None |
Other expenses | | 0.25% | | 0.24% | | 0.30% |
Acquired Fund Fees and Expenses (fees and expenses of underlying funds) | | 1.15% | | 1.15% | | 1.15% |
Total annual fund operating expensesa | | 1.95% | | 2.59% | | 1.65% |
| | a | Fund operating expenses do not correlate to the ratios of expenses to average net assets in the financial highlights table, which do not include acquired (i.e., underlying) funds’ fees and expenses. |
2
The following information supplements and amends information in the section entitled “Example” relating to Transamerica Multi-Manager Alternative Strategies Portfolio in the Retail Prospectus:
Example: This Example is intended to help you compare the cost of investing in the fund with the cost of investing in other mutual funds. The Example assumes that you invest $10,000. The Example also assumes that your investment has a 5% return each year and that the fund’s operating expenses remain the same. Although your actual costs may be higher or lower, based on these assumptions your costs would be:
| | | | | | | | |
| |
If the shares are redeemed at the end of each period: |
Share Class | | 1 year | | 3 years | | 5 years | | 10 years |
A | | $737 | | $1,129 | | $1,544 | | $2,700 |
C | | $362 | | $ 805 | | $1,375 | | $2,925 |
I | | $168 | | $ 520 | | $ 897 | | $1,955 |
If the shares are not redeemed: |
Share Class | | 1 year | | 3 years | | 5 years | | 10 years |
A | | $737 | | $1,129 | | $1,544 | | $2,700 |
C | | $262 | | $ 805 | | $1,375 | | $2,925 |
I | | $168 | | $ 520 | | $ 897 | | $1,955 |
The Example does not reflect sales charges (loads) on reinvested dividends (and other distributions). If these sales charges (loads) were included, your costs would be higher.
* * *
Transamerica Water Island Arbitrage Strategy
The following information supplements and amends information in the section entitled “List and Description of Certain Underlying Funds” beginning on page 133 of the Retail Prospectus:
Effective May 1, 2011, Transamerica Water Island Arbitrage Strategy will be an underlying fund option for Transamerica Asset Allocation – Conservative Portfolio, Transamerica Asset Allocation – Growth Portfolio, Transamerica Asset Allocation – Moderate Growth Portfolio, Transamerica Asset Allocation – Moderate Portfolio and Transamerica Multi-Manager Alternative Strategies Portfolio.
The description of Transamerica Water Island Arbitrage Strategy is added as follows:
| | • | | Transamerica Water Island Arbitrage Strategy seeks to achieve capital growth by engaging in merger arbitrage. The fund invests, under normal circumstances, at least 80% of its net assets in equity securities and other investments with similar economic characteristics of companies (both domestic and foreign) that are involved in publicly announced mergers, takeovers, tender offers, leveraged buyouts, spin-offs, liquidations and other corporate reorganizations. Equity securities include common and preferred stock and options. The fund’s sub-adviser uses investment strategies designed to minimize market exposure including short selling and purchasing and selling options. The most common arbitrage activity, and the approach the fund generally will use, involves purchasing the shares of an announced acquisition target company at a discount to their expected value upon completion of the acquisition. The principal risks of investing in this underlying fund are: active trading; arbitrage; cash management and defensive investing; currency; currency hedging; derivatives; foreign securities; increase in expenses; leveraging; liquidity; market; merger arbitrage; portfolio selection; portfolio turnover; preferred stock; sector concentration; short sales; and stocks. |
* * *
All Funds
(except Transamerica AEGON Money Market)
The following paragraph replaces the risk disclosure labeled “Interest Rate” in the section of the Prospectuses entitled “Principal Risks” of each applicable fund:
| | n | Interest Rate – Debt securities have varying levels of sensitivity to changes in interest rates. In general, the price of a debt security tends to fall when interest rates rise and can rise when interest rates fall. Securities with longer maturities and mortgage securities can be more sensitive to interest rate changes. |
* * *
Investors Should Retain this Supplement for Future Reference
June 16, 2011
3
Transamerica Funds
Prospectus March 1, 2011, supplemented as of March 22, 2011

| | | | | | | | | | | | |
| Fund | | Class A
Ticker | | Class B
Ticker | | Class C
Ticker | | Class I
Ticker | | Class R
Ticker | | Class T
Ticker |
| | | | | | |
Transamerica AEGON Flexible Income | | IDITX | | IFLBX | | IFLLX | | TFXIX | | None | | None |
Transamerica AEGON High Yield Bond | | IHIYX | | INCBX | | INCLX | | TDHIX | | None | | None |
Transamerica AEGON Money Market | | IATXX | | IBTXX | | IMLXX | | TAMXX | | None | | None |
Transamerica AEGON Short-Term Bond | | ITAAX | | None | | ITACX | | TSTIX | | None | | None |
Transamerica Asset Allocation-Conservative Portfolio | | ICLAX | | ICLBX | | ICLLX | | TACIX | | ICVRX | | None |
Transamerica Asset Allocation-Growth Portfolio | | IAAAX | | IAABX | | IAALX | | TAGIX | | IGWRX | | None |
Transamerica Asset Allocation-Moderate Growth Portfolio | | IMLAX | | IMLBX | | IMLLX | | TMGIX | | IMGRX | | None |
Transamerica Asset Allocation-Moderate Portfolio | | IMOAX | | IMOBX | | IMOLX | | TMMIX | | IMDRX | | None |
Transamerica Morgan Stanley Capital Growth | | IALAX | | IACBX | | ILLLX | | TFOIX | | None | | None |
Transamerica Morgan Stanley Growth Opportunities | | ITSAX | | ITCBX | | ITSLX | | TGPIX | | None | | None |
Transamerica Multi-Managed Balanced | | IBALX | | IBABX | | IBLLX | | TBLIX | | None | | None |
Transamerica Multi-Manager Alternative Strategies Portfolio | | IMUAX | | None | | IMUCX | | TASIX | | None | | None |
Transamerica Multi-Manager International Portfolio | | IMNAX | | IMNBX | | IMNCX | | TMUIX | | None | | None |
Transamerica Systematic Small/Mid Cap Value | | IIVAX | | IIVBX | | IIVLX | | TSVIX | | None | | None |
Transamerica TS&W International Equity | | TRWAX | | None | | TRWCX | | TSWIX | | None | | None |
Transamerica WMC Diversified Equity | | TADAX | | TADBX | | TADCX | | TDEIX | | None | | None |
Transamerica WMC Diversified Growth | | ITQAX | | ITQBX | | ITQLX | | TETYX | | None | | IEQTX |
Transamerica WMC Quality Value | | TWQAX | | None | | TWQCX | | TWQIX | | None | | None |
| | |
 | | Neither the U.S. Securities and Exchange Commission nor any state securities commission has approved or disapproved these securities or passed upon the adequacy or accuracy of this prospectus. Any representation to the contrary is a criminal offense. |
| | | | |
Not insured by FDIC or any federal government agency. | | May lose value. | | Not a deposit of or guaranteed by any bank, bank affiliate, or credit union. |
MPCA0311-A
TABLE OF CONTENTS
|
| TRANSAMERICA AEGON FLEXIBLE INCOME |
Investment Objective: Seeks to provide high total return through a combination of current income and capital appreciation.
Fees and Expenses: This table describes the fees and expenses that you may pay if you buy and hold shares of the fund. You may qualify for sales charge discounts if you and your family invest, or agree to invest in the future, at least $50,000 in Transamerica Funds. More information about these and other discounts is available from your financial professional and in the “Waivers and/or Reductions of Charges” section on page 120 of the fund’s prospectus and in the fund’s statement of additional information (SAI) under the heading “Purchase of Shares.”
| | | | | | | | |
| Shareholder Fees (fees paid directly from your investment) |
| | | Class of Shares |
| | | A | | B* | | C | | I |
Maximum sales charge (load) imposed on purchases (as a % of offering price) | | 4.75% | | None | | None | | None |
| Maximum deferred sales charge (load) (as a percentage of purchase price or redemption proceeds, whichever is lower) | | None | | 5.00% | | 1.00% | | None |
| Annual Fund Operating Expenses (expenses that you pay each year as a percentage of the value of your investment)a |
| | | Class of Shares |
| | | A | | B* | | C | | I |
| Management fees | | 0.48% | | 0.48% | | 0.48% | | 0.48% |
| Distribution and service (12b-1) fees | | 0.35% | | 1.00% | | 1.00% | | None |
| Other expensesb | | 0.26% | | 0.34% | | 0.20% | | 0.26% |
| Total annual fund operating expenses | | 1.09% | | 1.82% | | 1.68% | | 0.74% |
| Expense reductionc | | 0.10% | | 0.00% | | 0.00% | | 0.00% |
| Total annual fund operating expenses after expense reduction | | 0.99% | | 1.82% | | 1.68% | | 0.74% |
| * | Not available to new investors. |
| a | Annual fund operating expenses have been restated to reflect current contractual advisory fees. |
| b | Other expenses do not include extraordinary expenses. If extraordinary expenses were included, other expenses would be 0.27%, 0.35%, 0.21%, and 0.27% for Class A, Class B, Class C and Class I, respectively. |
| c | Contractual arrangements have been made with the fund’s investment adviser, Transamerica Asset Management, Inc. (“TAM”), through March 1, 2012, to waive fees and/or reimburse fund expenses to the extent that the fund’s total operating expenses exceed 1.00%, excluding 12b-1 fees and extraordinary expenses. TAM is entitled to reimbursement by the fund of fees waived or expenses reduced during any of the previous 36 months if on any day the estimated annualized fund operating expenses are less than the cap, excluding 12b-1 fees and extraordinary expenses. In addition, TAM has contractually agreed, through March 1, 2012, to waive 0.10% of the 0.35% 12b-1 fee on Class A shares. |
Example: This Example is intended to help you compare the cost of investing in the fund with the cost of investing in other mutual funds. The Example assumes that you invest $10,000. The Example also assumes that your investment has a 5% return each year and that the fund’s operating expenses remain the same. Although your actual costs may be higher or lower, based on these assumptions your costs would be:
| | | | | | | | |
| |
| If the shares are redeemed at the end of each period: |
| Share Class | | 1 year | | 3 years | | 5 years | | 10 years |
A | | $571 | | $796 | | $1,038 | | $1,732 |
B+ | | $685 | | $873 | | $1,085 | | $1,946 |
C | | $271 | | $530 | | $ 913 | | $1,987 |
I | | $ 76 | | $237 | | $ 411 | | $ 918 |
| If the shares are not redeemed: |
| Share Class | | 1 year | | 3 years | | 5 years | | 10 years |
A | | $571 | | $796 | | $1,038 | | $1,732 |
B+ | | $185 | | $573 | | $ 985 | | $1,946 |
C | | $171 | | $530 | | $ 913 | | $1,987 |
I | | $ 76 | | $237 | | $ 411 | | $ 918 |
| + | Examples for Class B shares assume conversion into Class A shares eight years after purchase. Class B shares are not available to new investors. |
The Example does not reflect sales charges (loads) on reinvested dividends (and other distributions). If these sales charges (loads) were included, your costs would be higher.
Portfolio Turnover: The fund pays transaction costs, such as commissions, when it buys and sells securities (or “turns over” its portfolio). A higher portfolio turnover rate may indicate higher transaction costs and may result in higher taxes when fund shares are held in a taxable account. These costs, which are not reflected in annual fund operating expenses or in the Example,
1
affect the fund’s performance. During the most recent fiscal year, the portfolio turnover rate was 120% of the average value of the fund’s portfolio.
Principal Investment Strategies: AEGON USA Investment Management, LLC (“AUIM”), the fund’s sub-adviser, invests, under normal circumstances, at least 80% of the fund’s net assets in fixed-income securities, including U.S. Government and foreign government bonds and notes (including emerging markets); mortgage-backed, commercial mortgage-backed, and asset-backed securities (including collateralized mortgage obligations); corporate bonds of issuers in the U.S. and foreign countries (including emerging markets); convertible bonds and other convertible securities; bank loans and loan participations; structured notes; and preferred securities.
Under normal circumstances, at least 50% of the value of the fund’s assets will be invested in (a) debt securities which have a rating within the four highest grades as determined by Moody’s Investors Services, Inc. (“Moody’s”) (“Aaa, Aa, A or Baa”) or Standard & Poor’s Corporation (“S&P”) (“AAA, AA, A or BBB”); (b) securities issued or guaranteed by the U.S. Government or its agencies or instrumentalities; (c) commercial paper rated Prime, Prime-1 or Prime-2 by NCO/Moody’s Commercial Paper Division, Moody’s or A-1 or A-2 by S&P; or (d) cash or cash equivalents. Up to 50% of the value of the fund’s assets may be invested in other debt securities which are not rated by Moody’s or S&P or, if so rated, are not within the grades or ratings referred to above. The fund may engage in options and futures transactions, foreign currency transactions, and swap transactions. The fund may invest up to 20% of its total assets in equity securities, such as common stocks, rights, warrants or preferred stock. The fund may invest in securities of any maturity and does not have a target average duration.
The fund may use short-term trading as a means of managing its portfolio to achieve its investment objectives.
By virtue of short-term trading, the fund may engage in greater buying and selling activity than investment companies which are not permitted to employ such a policy in seeking their investment objectives. Such activity can result in greater costs of operation than is the case with other investment companies, and risks of loss in portfolio value could be greater. Accordingly, an investment in fund shares may be more speculative than an investment in shares of an investment company which cannot engage in short-term trading.
The fund may invest its assets in cash, cash equivalent securities or short-term debt securities, repurchase agreements and money market instruments. Under adverse or unstable market, economic or political conditions, the fund may take temporary defensive positions in cash and short-term debt securities without limit.
Principal Risks: Many factors affect the fund’s performance. There is no assurance the fund will meet its investment objective. The value of your investment in the fund, as well as the amount of return you receive on your investment, may fluctuate significantly from day to day and over time. You may lose part or all of your investment in the fund or your investment may not perform as well as other similar investments. The following is a summary of certain risks (in alphabetical order) of investing in the fund. You may lose money if you invest in this fund.
| • | | Active Trading – Certain funds are actively managed and, under appropriate circumstances, may purchase and sell securities without regard to the length of time held. A high portfolio turnover rate may have a negative impact on performance by increasing transaction costs and may generate greater tax liabilities for shareholders holding shares in taxable accounts. |
| • | | Cash Management and Defensive Investing – Money market instruments or short-term debt securities held by the fund for cash management or defensive investing purposes can fluctuate in value. Like other fixed income securities, they are subject to risk, including market, interest rate and credit risk. If the fund holds cash uninvested, the fund will not earn income on the cash and the fund’s yield will go down. If a significant amount of the fund’s assets are used for cash management or defensive investing purposes, it will be more difficult for the fund to achieve its objective. |
| • | | Convertible Securities – The market value of convertible securities tends to decline as interest rates increase. Convertible securities generally offer lower interest or dividend yields than non-convertible securities of similar quality. The fund could lose money if the issuer of a convertible security is unable to meet its financial obligations or goes bankrupt. |
| • | | Credit – If an issuer or guarantor of a security held by the fund or a counterparty to a financial contract with the fund defaults or is downgraded, or if the value of the assets underlying a security declines, the value of your investment will decline. Junk bonds have a higher risk of default and are considered speculative. A default or downgrade will have a greater impact on subordinated securities. |
| • | | Currency – When the fund invests in securities denominated in foreign currencies, the fund may incur currency conversion costs and may be affected favorably or unfavorably by changes in the rates of exchange between those currencies and the U.S. dollar. Currency exchange rates can be volatile and are affected by, among other factors, the general economics of a country, the actions of the U.S. and foreign governments or control banks, the imposition of currency controls, and speculation. |
2
| • | | Derivatives – Using derivatives can increase fund losses and reduce opportunities for gains when market prices, interest rates or the derivative instruments themselves behave in a way not anticipated by the fund. Using derivatives also can have a leveraging effect and increase fund volatility. Derivatives may be difficult to sell, unwind or value, and the counterparty may default on its obligations to the fund. The fund’s investments in derivative instruments may involve a small investment relative to the amount of investment exposure assumed and may result in losses exceeding the amounts invested in those instruments. Recent legislation calls for new regulation of the derivatives markets. The extent and impact of the regulation are not yet fully known and may not be for some time. New regulation of derivatives may make them more costly, may limit their availability, or may otherwise adversely affect their value or performance. |
| • | | Emerging Markets – Investing in the securities of issuers located in or principally doing business in emerging markets are subject to foreign securities risks. These risks are greater for investments in emerging markets. Emerging market countries tend to have economic, political and legal systems that are less fully developed and are less stable than those of more advanced countries. Low trading volumes may result in a lack of liquidity and in extreme price volatility. |
| • | | Fixed-Income Securities – The market prices of fixed-income securities may go up or down, sometimes rapidly or unpredictably due to general market conditions, such as real or perceived adverse economic or political conditions, inflation, changes in interest rates, lack of liquidity in the bond markets or adverse investor sentiment. When market prices fall, the value of your investment will go down. A rise in rates tends to have a greater impact on the prices of longer term or duration securities. |
If interest rates rise, repayments of fixed-income securities may occur more slowly than anticipated by the market. This may drive the prices of these securities down because their interest rates are lower than the current interest rate and they remain outstanding longer. This is sometimes referred to as extension risk.
Many issuers have a right to prepay their securities. If interest rates fall, an issuer may exercise this right. If this happens, the fund will be forced to reinvest prepayment proceeds at a time when yields on securities available in the market are lower than the yield on the prepaid security. This is sometimes referred to as prepayment or call risk.
| • | | Foreign Securities – Foreign securities are subject to a number of additional risks, including nationalization or expropriation of assets, imposition of currency controls or restrictions, confiscatory taxation, political or financial instability and other adverse economic or political developments. Lack of information and less market regulation also may affect the value of these securities. |
| • | | High-Yield Debt Securities – High-yield debt securities, or junk bonds, are securities that are rated below “investment grade” (that is, securities rated below Baa/BBB) or, if unrated, are considered by the sub-adviser to be of equivalent quality. Changes in interest rates, the market’s perception of the issuers and the creditworthiness of the issuers may significantly affect the value of these bonds. Junk bonds have a higher risk of default, tend to be less liquid and may be more difficult to value. |
| • | | Increase in Expenses – Your actual costs of investing in the fund may be higher than the expenses shown in “Annual Fund Operating Expenses” for a variety of reasons. For example, expense ratios may be higher than those shown if average net assets decrease. Net assets are more likely to decrease and fund expense ratios are more likely to increase when markets are volatile. |
| • | | Interest Rate – Fixed-income securities have varying levels of sensitivity to changes in interest rates. In general, the price of a fixed-income security tends to fall when interest rates rise and can rise when interest rates fall. A change in interest rates will not have the same impact on all fixed-income securities. Generally, the longer the maturity or duration of a fixed-income security, the greater the impact of a rise in interest rates on the security’s value. In addition, different interest rate measures (such as short- and long-term interest rates and U.S. and foreign interest rates), or interest rates on different types of securities or securities of different issuers, may not necessarily change in the same amount or in the same direction. When interest rates go down, the income received by the fund, and the fund’s yield, may decline. |
| • | | Liquidity – Some securities held by the fund may be difficult to sell, or illiquid, particularly during times of market turmoil. Illiquid securities may also be difficult to value. If the fund is forced to sell an illiquid asset to meet redemption requests or other cash needs, the fund may be forced to sell at a loss. |
| • | | Loans – Loans are subject to the credit risk of nonpayment of principal or interest. Economic downturns or increases in interest rates may cause an increase in defaults, interest rate risk and liquidity risk. Loans may or may not be collateralized at the time of acquisition, and any collateral may be relatively illiquid or lose all or substantially all of its value subsequent to investment. In the event of bankruptcy of a borrower, the fund could experience delays or limitations with respect to its ability to realize the benefits of any collateral securing a loan. The fund’s investments in loans are also subject to prepayment or call risk. |
3
| • | | Market – The market prices of the fund’s securities may go up or down, sometimes rapidly or unpredictably, due to general market conditions, such as real or perceived adverse economic or political conditions, inflation, changes in interest rates or currency rates, lack of liquidity in the markets or adverse investor sentiment. Market prices of securities also may go down due to events or conditions that affect particular sectors or issuers. When market prices fall, the value of your investment will go down. The fund may experience a substantial or complete loss on any individual security. The recent financial crisis has caused a significant decline in the value and liquidity of many securities. In response to the financial crisis, the U.S. and other governments and the Federal Reserve and certain foreign central banks have taken steps to support financial markets. The withdrawal of this support could negatively affect the value and liquidity of certain securities. In addition, legislation recently enacted in the U.S. calls for changes in many aspects of financial regulation. The impact of the legislation on the markets, and the practical implications for market participants, may not be fully known for some time. |
| • | | Mortgage-Related and Asset-Backed Securities – Mortgage-backed securities may be issued by private issuers, by government-sponsored entities such as Fannie Mae or Freddie Mac or by agencies of the U.S. government, such as Ginnie Mae. Mortgage-backed securities represent direct or indirect participations in, or are collateralized by and payable from, mortgage loans secured by real property. Unlike mortgage-related securities issued or guaranteed by agencies of the U.S. government or government-sponsored entities, mortgage-related securities issued by private issuers do not have a government or government-sponsored entity guarantee (but may have other credit enhancement), and may, and frequently do, have less favorable collateral, credit risk or other underwriting characteristics. Mortgage-backed securities are also particularly susceptible to prepayment and extension risks. Asset-backed securities represent participations in, or are secured by and payable from, assets such as installment sales or loan contracts, leases, credit card receivables and other categories of receivables. Certain asset-backed securities present a heightened level of risk because, in the event of default, the liquidation value of the underlying assets may be inadequate to pay any unpaid principal or interest. The value of mortgage-backed and asset-backed securities may be affected by changes in credit quality or value of the mortgage loans or other assets that support the securities. |
| • | | Portfolio Selection – The sub-adviser’s judgment about a particular security or issuer, or about the economy or a particular sector, region or market segment, or about an investment strategy, may prove to be incorrect. |
| • | | Preferred Stock – Preferred stock’s right to dividends and liquidation proceeds is junior to the rights of a company’s debt securities. The value of preferred stock may be subject to factors that affect fixed income and equity securities, including changes in interest rates and in a company’s creditworthiness. Shareholders of preferred stock may suffer a loss of value if dividends are not paid and have limited voting rights. |
| • | | Stocks – Stocks may be volatile – their prices may go up and down dramatically over the shorter term. These price movements may result from factors affecting individual companies, industries, the securities market as a whole or the overall economy. |
| • | | Structured Instruments – The fund may invest in various types of structured instruments, including securities that have demand, tender or put features, or interest rate reset features. Structured instruments are a type of derivative instrument and the payment and credit qualities of these instruments derive from the assets embedded in the structure from which they are issued. Structured instruments may behave in ways not anticipated by the fund, or they may not receive tax, accounting or regulatory treatment anticipated by the fund. |
| • | | Valuation – The sales price the fund could receive for any particular portfolio investment may differ from the fund’s valuation of the investment, particularly for securities that trade in thin or volatile markets or that are valued using a fair value methodology. |
| • | | Warrants and Rights – Warrants and rights may be considered more speculative than certain other types of investments because they do not entitle a holder to the dividends or voting rights for the securities that may be purchased. They do not represent any rights in the assets of the issuing company, and cease to have value if not exercised prior to the expiration date. |
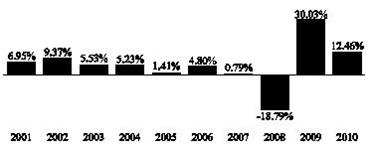
Performance: The bar chart and the table below provide some indication of the risks of investing in the fund by showing you how the fund’s performance has varied from year to year, and how the fund’s average annual total returns for different periods compare to the returns of a broad measure of market performance. The bar chart does not reflect the impact of sales charges, which, if reflected, would lower the returns. The table, which shows average annual total returns for each class of shares of the fund, includes deduction of applicable sales charges. Absent any limitation of the fund’s expenses, total returns would be lower. As with all mutual funds, past performance (before and after taxes) is not a prediction of future results. Updated performance information is available on our website at www.transamericafunds.com or by calling 1-888-233-4339.
4
Prior to March 22, 2011, the fund was named Transamerica Flexible Income and had a different sub-adviser. The performance set forth prior to that date is attributable to the previous sub-adviser.
Annual Total Returns (calendar years ended December 31) – Class A
| | | | |
| | | Quarter Ended | | Return |
Best Quarter: | | 6/30/2009 | | 12.36% |
Worst Quarter: | | 12/31/2008 | | -12.66% |
Average Annual Total Returns (periods ended December 31, 2010)1
| | | | | | |
| | | 1 Year | | 5 Years | | 10 Years or
Inception* |
| Class A (commenced operations on June 29, 1987) |
Return before taxes | | 7.14% | | 3.62% | | 4.64% |
Return after taxes on distributions2 | | 4.89% | | 1.66% | | 2.69% |
Return after taxes on distributions and sale of fund shares2 | | 4.58% | | 1.89% | | 2.81% |
| Class B (Return before taxes only) (commenced operations on October 1, 1995) | | 6.60% | | 3.79% | | 4.57% |
| Class C (Return before taxes only) (commenced operations on November 11, 2002) | | 10.61% | | 4.01% | | 3.84% |
| Class I (Return before taxes only) (commenced operations on November 30, 2009) | | 12.88% | | N/A | | 12.79% |
| Barclays Capital U.S. Aggregate Bond Index (reflects no deduction for fees, expenses, or taxes) | | 6.54% | | 5.80% | | 5.84% |
| 1 | Actual returns may depend on the investor’s individual tax situation. After-tax returns may not be relevant if the investment is made through a tax-exempt or tax-deferred account, such as a 401(k) plan. After-tax returns are presented for only one class and returns for other classes will vary. |
| 2 | The after-tax returns are calculated using the historic highest individual federal marginal income tax rates and do not reflect the impact of state and local taxes. |
| * | Fund returns are for past 10 years or since inception, whichever is less. Index returns are for 10 years or since inception of oldest share class, whichever is less. |
Management:
| | |
| Investment Adviser: | | Sub-Adviser: |
| |
| Transamerica Asset Management, Inc. | | AEGON USA Investment Management, LLC |
| |
| | Portfolio Managers: |
| |
| | Brian W. Westhoff, CFA, Portfolio Manager (Lead) since 2005 |
| |
| | Bradley J. Beman, CFA, CPA, Portfolio Manager since 2011 |
| |
| | Jim Schaeffer, Portfolio Manager since 2011 |
| |
| | David Halfpap, Portfolio Manager since 2011 |
| |
| | Rick Perry, Portfolio Manager since 2011 |
Purchase and Sale of Fund Shares: You may purchase, exchange or redeem shares of the fund on any day the New York Stock Exchange is open for business, online or through our website at www.transamericafunds.com, by mail to Transamerica Fund Services, Inc., P.O. Box 219945, Kansas City, MO 64121-9945, by telephone at 1-888-233-4339, or overnight mail to Transamerica Fund Services, Inc., 330 W. 9th Street, Kansas City, MO 64105. Shares may also be purchased through a financial intermediary. The minimum initial purchase for Class A and C shares is $1,000; the minimum subsequent investment is $50. The minimum initial purchase for payroll deduction and automatic investment plan is $500; the minimum subsequent
5
investment is $50 per monthly fund account investment. The minimum investment for Class I shares is $1,000,000. Class B shares are not available for purchase, including to existing Class B shareholders, except in the limited circumstances described in this prospectus under the section entitled “Shareholder Information – Buying Shares”.
Tax Information: Fund distributions may be taxable as ordinary income or capital gains, except when your investment is in an IRA, 401(k) or other tax-advantaged investment plan.
Payments to Broker-Dealers and Other Financial Intermediaries: If you purchase the fund through a broker-dealer or other financial intermediary, the fund and/or its affiliates may pay the intermediary for the sale of fund shares and related services. These payments may create a conflict of interest by influencing the broker-dealer or other intermediary and your salesperson to recommend the fund over another investment. Ask your salesperson or visit your financial intermediary’s website for more information.
6
|
| TRANSAMERICA AEGON HIGH YIELD BOND |
Investment Objective: Seeks a high level of current income by investing in high-yield debt securities.
Fees and Expenses: This table describes the fees and expenses that you may pay if you buy and hold shares of the fund. You may qualify for sales charge discounts if you and your family invest, or agree to invest in the future, at least $50,000 in Transamerica Funds. More information about these and other discounts is available from your financial professional and in the “Waivers and/or Reductions of Charges” section on page 120 of the fund’s prospectus and in the fund’s statement of additional information (SAI) under the heading “Purchase of Shares.”
| | | | | | | | |
Shareholder Fees (fees paid directly from your investment) |
| | | | | Class of Shares | | |
| | | A | | B* | | C | | I |
Maximum sales charge (load) imposed on purchases (as a % of offering price) | | 4.75% | | None | | None | | None |
| Maximum deferred sales charge (load) (as a percentage of purchase price or redemption proceeds, whichever is lower) | | None | | 5.00% | | 1.00% | | None |
| Annual Fund Operating Expenses (expenses that you pay each year as a percentage of the value of your investment) |
| | | | | Class of Shares | | |
| | | A | | B* | | C | | I |
| Management fees | | 0.58% | | 0.58% | | 0.58% | | 0.58% |
| Distribution and service (12b-1) fees | | 0.35% | | 1.00% | | 1.00% | | None |
| Other expenses | | 0.22% | | 0.25% | | 0.19% | | 0.25% |
Total annual fund operating expenses | | 1.15% | | 1.83% | | 1.77% | | 0.83% |
| * | Not available to new investors. |
Example: This Example is intended to help you compare the cost of investing in the fund with the cost of investing in other mutual funds. The Example assumes that you invest $10,000. The Example also assumes that your investment has a 5% return each year and that the fund’s operating expenses remain the same. Although your actual costs may be higher or lower, based on these assumptions your costs would be:
| | | | | | | | |
If the shares are redeemed at the end of each period: |
Share Class | | 1 year | | 3 years | | 5 years | | 10 years |
A | | $587 | | $823 | | $1,078 | | $1,806 |
B+ | | $686 | | $876 | | $1,090 | | $1,970 |
C | | $280 | | $557 | | $ 959 | | $2,084 |
I | | $ 85 | | $265 | | $ 460 | | $1,025 |
If the shares are not redeemed: |
Share Class | | 1 year | | 3 years | | 5 years | | 10 years |
A | | $587 | | $823 | | $1,078 | | $1,806 |
B+ | | $186 | | $576 | | $ 990 | | $1,970 |
C | | $180 | | $557 | | $ 959 | | $2,084 |
I | | $ 85 | | $265 | | $ 460 | | $1,025 |
| + | Examples for Class B shares assume conversion into Class A shares eight years after purchase. Class B shares are not available to new investors. |
The Example does not reflect sales charges (loads) on reinvested dividends (and other distributions). If these sales charges (loads) were included, your costs would be higher.
Portfolio Turnover: The fund pays transaction costs, such as commissions, when it buys and sells securities (or “turns over” its portfolio). A higher portfolio turnover rate may indicate higher transaction costs and may result in higher taxes when fund shares are held in a taxable account. These costs, which are not reflected in annual fund operating expenses or in the Example, affect the fund’s performance. During the most recent fiscal year, the portfolio turnover rate was 91% of the average value of the fund’s portfolio.
Principal Investment Strategies: AEGON USA Investment Management, LLC (“AUIM”), the fund’s sub-adviser, seeks to achieve the fund’s objective by investing, under normal circumstances, at least 80% of the fund’s net assets in high-yield/high-risk bonds (commonly known as “junk bonds”).
Junk bonds are high risk debt securities rated in medium or lower rating categories or determined by AUIM to be of comparable quality. AUIM’s strategy is to seek to achieve yields as high as possible while seeking to manage risk. AUIM uses a “top-
7
down/bottom-up” approach in managing the fund’s assets. The “top-down” approach is to adjust the risk profile of the fund. AUIM analyzes four factors that affect the movement of the fixed-income bond prices which include: economic indicators; technical indicators that are specific to the high-yield market; investor sentiment and valuation. Analysis of these factors assists AUIM in its decision regarding the fund’s portfolio allocations. In a “top-down” approach, the sub-adviser looks at broad market factors and chooses certain sectors or industries within the market, based on those factors. It then looks at individual companies within those sectors or industries.
AUIM has developed a proprietary credit model that is the foundation of its “bottom-up” analysis. The model tracks historical cash flow numbers and calculates credit financial ratios. Because high-yield companies are of higher financial risk, AUIM does a thorough credit analysis of all companies in the fund’s portfolio, as well as all potential acquisitions. A “bottom-up” approach is looking at individual companies against the context of broader market factors.
AUIM may sell fund securities when it determines there are changes in economic indicators, technical indicators or valuation.
The fund may invest its assets in cash, cash equivalent securities or short-term debt securities, repurchase agreements and money market instruments. Under adverse or unstable market, economic or political conditions, the fund may take temporary defensive positions in cash and short-term debt securities without limit.
Principal Risks: Many factors affect the fund’s performance. There is no assurance the fund will meet its investment objective. The value of your investment in the fund, as well as the amount of return you receive on your investment, may fluctuate significantly from day to day and over time. You may lose part or all of your investment in the fund or your investment may not perform as well as other similar investments. The following is a summary of certain risks (in alphabetical order) of investing in the fund. You may lose money if you invest in this fund.
| • | | Cash Management and Defensive Investing – Money market instruments or short-term debt securities held by the fund for cash management or defensive investing purposes can fluctuate in value. Like other fixed income securities, they are subject to risk, including market, interest rate and credit risk. If the fund holds cash uninvested, the fund will not earn income on the cash and the fund’s yield will go down. If a significant amount of the fund’s assets are used for cash management or defensive investing purposes, it will be more difficult for the fund to achieve its objective. |
| • | | Credit – If an issuer or guarantor of a security held by the fund or a counterparty to a financial contract with the fund defaults or is downgraded, or if the value of the assets underlying a security declines, the value of your investment will decline. Junk bonds have a higher risk of default and are considered speculative. A default or downgrade will have a greater impact on subordinated securities. |
| • | | Fixed-Income Securities – The market prices of fixed-income securities may go up or down, sometimes rapidly or unpredictably due to general market conditions, such as real or perceived adverse economic or political conditions, inflation, changes in interest rates, lack of liquidity in the bond markets or adverse investor sentiment. When market prices fall, the value of your investment will go down. A rise in rates tends to have a greater impact on the prices of longer term or duration securities. |
If interest rates rise, repayments of fixed-income securities may occur more slowly than anticipated by the market. This may drive the prices of these securities down because their interest rates are lower than the current interest rate and they remain outstanding longer. This is sometimes referred to as extension risk.
Many issuers have a right to prepay their securities. If interest rates fall, an issuer may exercise this right. If this happens, the fund will be forced to reinvest prepayment proceeds at a time when yields on securities available in the market are lower than the yield on the prepaid security. This is sometimes referred to as prepayment or call risk.
| • | | Foreign Securities – Foreign securities are subject to a number of additional risks, including nationalization or expropriation of assets, imposition of currency controls or restrictions, confiscatory taxation, political or financial instability and other adverse economic or political developments. Lack of information and less market regulation also may affect the value of these securities. |
| • | | High-Yield Debt Securities – High-yield debt securities, or junk bonds, are securities that are rated below “investment grade” (that is, securities rated below Baa/BBB) or, if unrated, are considered by the sub-adviser to be of equivalent quality. Changes in interest rates, the market’s perception of the issuers and the creditworthiness of the issuers may significantly affect the value of these bonds. Junk bonds have a higher risk of default, tend to be less liquid and may be more difficult to value. |
| • | | Increase in Expenses – Your actual costs of investing in the fund may be higher than the expenses shown in “Annual Fund Operating Expenses” for a variety of reasons. For example, expense ratios may be higher than those shown if average net assets decrease. Net assets are more likely to decrease and fund expense ratios are more likely to increase when markets are volatile. |
8
| • | | Interest Rate – Fixed-income securities have varying levels of sensitivity to changes in interest rates. In general, the price of a fixed-income security tends to fall when interest rates rise and can rise when interest rates fall. A change in interest rates will not have the same impact on all fixed-income securities. Generally, the longer the maturity or duration of a fixed-income security, the greater the impact of a rise in interest rates on the security’s value. In addition, different interest rate measures (such as short- and long-term interest rates and U.S. and foreign interest rates), or interest rates on different types of securities or securities of different issuers, may not necessarily change in the same amount or in the same direction. When interest rates go down, the income received by the fund, and the fund’s yield, may decline. |
| • | | Liquidity – Some securities held by the fund may be difficult to sell, or illiquid, particularly during times of market turmoil. Illiquid securities may also be difficult to value. If the fund is forced to sell an illiquid asset to meet redemption requests or other cash needs, the fund may be forced to sell at a loss. |
| • | | Market – The market prices of the fund’s securities may go up or down, sometimes rapidly or unpredictably, due to general market conditions, such as real or perceived adverse economic or political conditions, inflation, changes in interest rates or currency rates, lack of liquidity in the markets or adverse investor sentiment. Market prices of securities also may go down due to events or conditions that affect particular sectors or issuers. When market prices fall, the value of your investment will go down. The fund may experience a substantial or complete loss on any individual security. The recent financial crisis has caused a significant decline in the value and liquidity of many securities. In response to the financial crisis, the U.S. and other governments and the Federal Reserve and certain foreign central banks have taken steps to support financial markets. The withdrawal of this support could negatively affect the value and liquidity of certain securities. In addition, legislation recently enacted in the U.S. calls for changes in many aspects of financial regulation. The impact of the legislation on the markets, and the practical implications for market participants, may not be fully known for some time. |
| • | | Portfolio Selection – The sub-adviser’s judgment about a particular security or issuer, or about the economy or a particular sector, region or market segment, or about an investment strategy, may prove to be incorrect. |
| • | | Valuation – The sales price the fund could receive for any particular portfolio investment may differ from the fund’s valuation of the investment, particularly for securities that trade in thin or volatile markets or that are valued using a fair value methodology. |
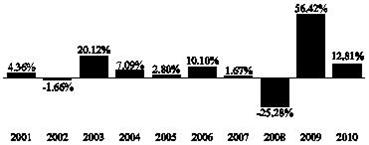
Performance: The bar chart and the table below provide some indication of the risks of investing in the fund by showing you how the fund’s performance has varied from year to year, and how the fund’s average annual total returns for different periods compare to the returns of a broad measure of market performance. The bar chart does not reflect the impact of sales charges, which, if reflected, would lower the returns. The table, which shows average annual total returns for each class of shares of the fund, includes deduction of applicable sales charges. Absent any limitation of the fund’s expenses, total returns would be lower. As with all mutual funds, past performance (before and after taxes) is not a prediction of future results. Updated performance information is available on our website at www.transamericafunds.com or by calling 1-888-233-4339.
Annual Total Returns (calendar years ended December 31) – Class A
| | | | |
| | | Quarter Ended | | Return |
| Best Quarter: | | 6/30/2009 | | 22.80% |
| Worst Quarter: | | 12/31/2008 | | -16.73% |
9
Average Annual Total Returns (periods ended December 31, 2010)1
| | | | | | |
| | | 1 Year | | 5 Years | | 10 Years or Inception* |
Class A (commenced operations on June 14, 1985) | | | | | | |
Return before taxes | | 7.47% | | 7.05% | | 6.68% |
Return after taxes on distributions2 | | 4.77% | | 4.22% | | 4.01% |
Return after taxes on distributions and sale of fund shares2 | | 4.76% | | 4.26% | | 4.04% |
| Class B (Return before taxes only) (commenced operations on October 1, 1995) | | 7.01% | | 7.18% | | 6.60% |
| Class C (Return before taxes only) (commenced operations on November 11, 2002) | | 11.04% | | 7.38% | | 8.23% |
| Class I (Return before taxes only) (commenced operations on November 30, 2009) | | 13.25% | | N/A | | 15.28% |
| Barclays Capital U.S. Corporate High Yield 2% Issuer Capped Index (reflects no deduction for fees, expenses, or taxes) | | 14.94% | | 8.90% | | 9.01% |
| Bank of America Merrill Lynch U.S. High-Yield, Cash Pay Index (reflects no deduction for fees, expenses, or taxes)3 | | 15.24% | | 8.67% | | 8.71% |
| 1 | Actual returns may depend on the investor’s individual tax situation. After-tax returns may not be relevant if the investment is made through a tax-exempt or tax-deferred account, such as a 401(k) plan. After-tax returns are presented for only one class and returns for other classes will vary. |
| 2 | The after-tax returns are calculated using the historic highest individual federal marginal income tax rates and do not reflect the impact of state and local taxes. |
| 3 | This index served as the benchmark for the fund prior to January 15, 2011, at which time it was replaced with the Barclays Capital U.S. Corporate High Yield 2% Issuer Capped Index. This benchmark change was made to more accurately reflect the principal strategies of the fund. |
| * | Fund returns are for past 10 years or since inception, whichever is less. Index returns are for 10 years or since inception of oldest share class, whichever is less. |
Management:
| | |
| Investment Adviser: | | Sub-Adviser: |
| |
| Transamerica Asset Management, Inc. | | AEGON USA Investment Management, LLC |
| |
| | Portfolio Managers: |
| |
| | Kevin Bakker, CFA, Portfolio Manager since 2007 |
| |
| | Bradley J. Beman, CFA, CPA, Portfolio Manager since 1997 |
| |
| | Benjamin D. Miller, CFA, Portfolio Manager since 2006 |
Purchase and Sale of Fund Shares: You may purchase, exchange or redeem shares of the fund on any day the New York Stock Exchange is open for business, online or through our website at www.transamericafunds.com, by mail to Transamerica Fund Services, Inc., P.O. Box 219945, Kansas City, MO 64121-9945, by telephone at 1-888-233-4339, or overnight mail to Transamerica Fund Services, Inc., 330 W. 9th Street, Kansas City, MO 64105. Shares may also be purchased through a financial intermediary. The minimum initial purchase for Class A and C shares is $1,000; the minimum subsequent investment is $50. The minimum initial purchase for payroll deduction and automatic investment plan is $500; the minimum subsequent investment is $50 per monthly fund account investment. The minimum investment for Class I shares is $1,000,000. Class B shares are not available for purchase, including to existing Class B shareholders, except in the limited circumstances described in this prospectus under the section entitled “Shareholder Information – Buying Shares”.
Tax Information: Fund distributions may be taxable as ordinary income or capital gains, except when your investment is in an IRA, 401(k) or other tax-advantaged investment plan.
Payments to Broker-Dealers and Other Financial Intermediaries: If you purchase the fund through a broker-dealer or other financial intermediary, the fund and/or its affiliates may pay the intermediary for the sale of fund shares and related services. These payments may create a conflict of interest by influencing the broker-dealer or other intermediary and your salesperson to recommend the fund over another investment. Ask your salesperson or visit your financial intermediary’s website for more information.
10
|
| TRANSAMERICA AEGON MONEY MARKET |
Investment Objective: Seeks maximum current income from money market securities consistent with liquidity and preservation of principal.
Fees and Expenses: This table describes the fees and expenses that you may pay if you buy and hold shares of the fund. You may qualify for sales charge discounts if you and your family invest, or agree to invest in the future, at least $50,000 in Transamerica Funds. More information about these and other discounts is available from your financial professional and in the “Waivers and/or Reductions of Charges” section on page 120 of the fund’s prospectus and in the fund’s statement of additional information (SAI) under the heading “Purchase of Shares.”
| | | | | | | | |
Shareholder Fees (fees paid directly from your investment) |
| | | | | Class of Shares | | |
| | | A | | B* | | C | | I |
Maximum sales charge (load) imposed on purchases (as a % of offering price) | | None | | None | | None | | None |
| Maximum deferred sales charge (load) (as a percentage of purchase price or redemption proceeds, whichever is lower) | | None | | 5.00% | | 1.00% | | None |
| Annual Fund Operating Expenses (expenses that you pay each year as a percentage of the value of your investment) |
| | | | | Class of Shares | | |
| | | A | | B* | | C | | I |
| Management fees | | 0.40% | | 0.40% | | 0.40% | | 0.40% |
| Distribution and service (12b-1) fees | | 0.35% | | 1.00% | | 1.00% | | None |
| Other expenses | | 0.44% | | 0.41% | | 0.26% | | 2.76% |
| Total annual fund operating expenses | | 1.19% | | 1.81% | | 1.66% | | 3.16% |
| Expense reductiona,b | | 0.36% | | 0.33% | | 0.18% | | 2.68% |
| Total annual fund operating expenses after expense reduction | | 0.83% | | 1.48% | | 1.48% | | 0.48% |
| * | Not available to new investors. |
| a | Contractual arrangements have been made with the fund’s investment adviser, Transamerica Asset Management, Inc. (“TAM”), through March 1, 2012, to waive fees and/or reimburse fund expenses to the extent that the fund’s total operating expenses exceed 0.48%, excluding 12b-1 fees and extraordinary expenses. TAM is entitled to reimbursement by the fund of fees waived or expenses reduced during any of the previous 36 months if on any day the estimated annualized fund operating expenses are less than the cap, excluding 12b-1 fees and extraordinary expenses. |
| b | In addition to the contractual fee waiver, TAM or any of its affiliates may waive fees or reimburse expenses of one or more classes of the fund in order to avoid a negative yield. Any such waiver or expense reimbursement would be voluntary, could be discontinued at any time, and is subject in certain circumstances to reimbursement by the fund to TAM or its affiliates. There is no guarantee that the fund will be able to avoid a negative yield. |
Example: This Example is intended to help you compare the cost of investing in the fund with the cost of investing in other mutual funds. The Example assumes that you invest $10,000. The Example also assumes that your investment has a 5% return each year and that the fund’s operating expenses remain the same. Although your actual costs may be higher or lower, based on these assumptions your costs would be:
| | | | | | | | |
If the shares are redeemed at the end of each period: |
Share Class | | 1 year | | 3 years | | 5 years | | 10 years |
| A | | $ 85 | | $342 | | $ 620 | | $1,411 |
| B+ | | $651 | | $837 | | $1,049 | | $1,936 |
| C | | $251 | | $506 | | $ 885 | | $1,950 |
| I | | $ 49 | | $722 | | $1,420 | | $3,280 |
If the shares are not redeemed: |
Share Class | | 1 year | | 3 years | | 5 years | | 10 years |
| A | | $ 85 | | $342 | | $ 620 | | $1,411 |
| B+ | | $151 | | $537 | | $ 949 | | $1,936 |
| C | | $151 | | $506 | | $ 885 | | $1,950 |
| I | | $ 49 | | $722 | | $1,420 | | $3,280 |
| + | Examples for Class B shares assume conversion into Class A shares eight years after purchase. Class B shares are not available to new investors. |
The Example does not reflect sales charges (loads) on reinvested dividends (and other distributions). If these sales charges (loads) were included, your costs would be higher.
Principal Investment Strategies: The fund’s sub-adviser, AEGON USA Investment Management, LLC (“AUIM”), invests the fund’s assets in the following high quality, short-term U.S. dollar-denominated money market instruments:
| • | | short-term corporate obligations, including commercial paper, notes and bonds |
11
| • | | obligations issued or guaranteed by the U.S. and foreign governments and their agencies and instrumentalities |
| • | | obligations of U.S. and foreign banks, or their foreign branches, and U.S. savings banks |
| • | | repurchase agreements involving any of the securities mentioned above |
Bank obligations purchased for the fund are limited to U.S. or foreign banks with total assets of $1.5 billion or more. Similarly, savings association obligations purchased for the fund are limited to U.S. savings association obligations issued by U.S. savings banks with total assets of $1.5 billion or more. Foreign securities purchased for the fund must be U.S. dollar-denominated and issued by foreign governments, agencies or instrumentalities, or banks that meet the minimum $1.5 billion capital requirement. These foreign obligations must also meet the same quality requirements as U.S. obligations. Each security, at the time of purchase by the fund, has been determined by the sub-adviser to present minimal credit risk.
As a money market fund, the fund tries to maintain a share price of $1.00, and must follow strict rules as to the credit quality, diversification, liquidity and maturity of its investments. If, after purchase, the credit rating on a security held by the fund is downgraded or the credit quality deteriorates, or if the maturity on a security is extended, the fund’s sub-adviser or Board of Trustees (where required by applicable regulations) will decide whether the security should be held or sold.
Principal Risks: An investment in the fund is not a bank deposit and is not insured or guaranteed by the Federal Deposit Insurance Corporation (“FDIC”) or any other government agency. Although the fund seeks to preserve the value of your investment at $1 per share, it is possible to lose money by investing in the fund.
There is no assurance that the fund will meet its investment objectives. The fund could underperform other short-term debt instruments or money market funds, or you could lose money.
In addition, you should be aware that there have been money market funds in other fund complexes that, in the past, have failed to pay investors $1.00 per share for their investment in those funds (this is referred to as “breaking the buck”), and any money market fund may do so in the future. You should also be aware that TAM and its affiliates are under no obligation to provide financial support to the fund or take other measures to ensure that you receive $1.00 per share for your investment in the fund. You should not invest in the fund with the expectation that any such action will be taken.
The following is a summary of certain risks (in alphabetical order) of investing in the fund:
| • | | Bank Obligations – To the extent the fund invests in U.S. bank obligations, the fund will be more susceptible to adverse events affecting the U.S. banking industry. Banks are sensitive to changes in money market and general economic conditions, as well as decisions by regulators that can affect banks’ profitability. |
| • | | Credit – An issuer or obligor of a security held by the fund or a counterparty to a financial contract with the fund may default or its credit may be downgraded, or the value of assets underlying a security may decline. Subordinated securities will be disproportionately affected by a default or downgrade. |
| • | | Fixed-Income Securities – The market prices of fixed-income securities may go up or down, sometimes rapidly or unpredictably due to general market conditions, such as real or perceived adverse economic or political conditions, inflation, changes in interest rates, lack of liquidity in the bond markets or adverse investor sentiment. When market prices fall, the value of your investment will go down. A rise in rates tends to have a greater impact on the prices of longer term or duration securities. |
If interest rates rise, repayments of fixed-income securities may occur more slowly than anticipated by the market. This may drive the prices of these securities down because their interest rates are lower than the current interest rate and they remain outstanding longer. This is sometimes referred to as extension risk.
Many issuers have a right to prepay their securities. If interest rates fall, an issuer may exercise this right. If this happens, the fund will be forced to reinvest prepayment proceeds at a time when yields on securities available in the market are lower than the yield on the prepaid security. This is sometimes referred to as prepayment or call risk.
| • | | Foreign Securities – Foreign securities are subject to a number of additional risks, including nationalization or expropriation of assets, imposition of currency controls or restrictions, confiscatory taxation, political or financial instability and other adverse economic or political developments. Lack of information and less market regulation also may affect the value of these securities. |
| • | | Increase in Expenses – Your actual costs of investing in the fund may be higher than the expenses shown in “Annual Fund Operating Expenses” for a variety of reasons. For example, expense ratios may be higher than those shown if average net assets decrease. Net assets are more likely to decrease and fund expense ratios are more likely to increase when markets are volatile. |
12
| • | | Interest Rate – The interest rates on short-term obligations held in the fund will vary, rising or falling with short-term interest rates generally. The fund’s yield will tend to lag behind general changes in interest rates. The ability of the fund’s yield to reflect current market rates will depend on how quickly the obligations in its portfolio mature and how much money is available for investment at current market rates. |
| • | | Market – The market prices of the fund’s securities may go up or down, sometimes rapidly or unpredictably, due to general market conditions, such as real or perceived adverse economic or political conditions, inflation, changes in interest rates or currency rates, lack of liquidity in the markets or adverse investor sentiment. Market prices of securities also may go down due to events or conditions that affect particular sectors or issuers. When market prices fall, the value of your investment will go down. The fund may experience a substantial or complete loss on any individual security. The recent financial crisis has caused a significant decline in the value and liquidity of many securities. In response to the financial crisis, the U.S. and other governments and the Federal Reserve and certain foreign central banks have taken steps to support financial markets. The withdrawal of this support could negatively affect the value and liquidity of certain securities. In addition, legislation recently enacted in the U.S. calls for changes in many aspects of financial regulation. The impact of the legislation on the markets, and the practical implications for market participants, may not be fully known for some time. |
| • | | Redemption – The fund may experience periods of heavy redemptions that could cause the fund to liquidate its assets at inopportune times or at a loss or depressed value particularly during periods of declining or illiquid markets. Redemption risk is greater to the extent that the fund has investors with large shareholdings, short investment horizons, or unpredictable cash flow needs. The redemption by one or more large shareholders of their holdings in the fund could have an adverse impact on the remaining shareholders in the fund. In addition, the fund may suspend redemptions when permitted by applicable regulations. |
| • | | Repurchase Agreements – If the other party to a repurchase agreement defaults on its obligation, the fund may suffer delays and incur costs or lose money in exercising its rights under the agreement. If the seller fails to repurchase the security and the market value declines, the fund could lose money. If the seller becomes insolvent and subject to liquidation or reorganization under applicable bankruptcy or other laws, the fund’s ability to dispose of the underlying securities may be restricted. |
| • | | U.S. Government Agency Obligations – Government agency obligations have different levels of credit support and, therefore, different degrees of credit risk. Securities issued by agencies and instrumentalities of the U.S. government that are supported by the full faith and credit of the United States generally present a lesser degree of credit risk than securities issued by agencies and instrumentalities sponsored by the U.S. government that are supported only by the issuer’s right to borrow from the U.S. Treasury and securities issued by agencies and instrumentalities sponsored by the U.S. government that are supported only by the credit of the issuing agencies. |
| • | | Yield – The amount of income you receive from the fund will go up or down depending on day-to-day variations in short-term interest rates, and when interest rates are very low the fund’s expenses could absorb all or a significant portion of the fund’s income. If interest rates increase, the fund’s yield may not increase proportionately. For example, TAM or its affiliates may discontinue any temporary voluntary fee limitation or recoup expenses previously foregone or reimbursed. In addition, the recent adoption of more stringent regulations governing the management of money market funds could have a negative effect on yields. |
Performance: The bar chart and the table below provide some indication of the risks of investing in the fund by showing you how the fund’s performance and average annual total returns have varied from year to year. The table shows average annual total returns for each class of shares of the fund. Performance reflects any fee waivers or expense reimbursements in effect during the relevant periods. Absent any limitation of the fund’s expenses, total returns would be lower. As with all mutual funds, past performance (before and after taxes) is not a prediction of future results. Updated performance information is available on our website at www.transamericafunds.com or by calling 1-888-233-4339.
Prior to March 22, 2011, the fund was named Transamerica Money Market and had a different sub-adviser. The performance set forth prior to that date is attributable to the previous sub-adviser.
13
Annual Total Returns (calendar years ended December 31) – Class A
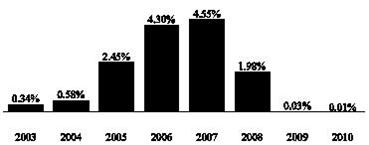
7-DAY YIELD1
(as of December 31, 2010)
Class A = 0.01%
| | | | |
| | | Quarter Ended | | Return |
Best Quarter: | | 9/30/2006 | | 1.15% |
Worst Quarter: | | 6/30/2009 | | 0.00% |
Average Annual Total Returns (periods ended December 31, 2010)2
| | | | | | |
| Return before taxes | | 1 Year | | 5 Years | | 10 Years or
Inception* |
Class A (commenced operations on March 1, 2002) | | 0.01% | | 2.16% | | 1.67% |
Class B (commenced operations on March 1, 2002) | | -4.99% | | 1.56% | | 1.28% |
Class C (commenced operations on November 11, 2002) | | -1.00% | | 1.70% | | 1.36% |
Class I (commenced operations on November 30, 2009) | | 0.01% | | N/A | | 0.01% |
| 1 | Call Customer Service (1-888-233-4339) for the current 7-day yield. |
| 2 | Actual returns may depend on the investor’s individual tax situation. |
| * | Fund returns are for past 10 years or since inception, whichever is less. Index returns are for 10 years or since inception of oldest share class, whichever is less. |
Management:
| | |
| Investment Adviser: | | Sub-Adviser: |
| |
| Transamerica Asset Management, Inc. | | AEGON USA Investment Management, LLC |
Purchase and Sale of Fund Shares: You may purchase, exchange or redeem shares of the fund on any day the New York Stock Exchange is open for business, online or through our website at www.transamericafunds.com, by mail to Transamerica Fund Services, Inc., P.O. Box 219945, Kansas City, MO 64121-9945, by telephone at 1-888-233-4339, or overnight mail to Transamerica Fund Services, Inc., 330 W. 9th Street, Kansas City, MO 64105. Shares may also be purchased through a financial intermediary. The minimum initial purchase for Class A and C shares is $1,000; the minimum subsequent investment is $50. The minimum initial purchase for payroll deduction and automatic investment plan is $500; the minimum subsequent investment is $50 per monthly fund account investment. The minimum investment for Class I shares is $1,000,000. Class B shares are not available for purchase, including to existing Class B shareholders, except in the limited circumstances described in this prospectus under the section entitled “Shareholder Information – Buying Shares”.
Tax Information: Fund distributions may be taxable as ordinary income or capital gains, except when your investment is in an IRA, 401(k) or other tax-advantaged investment plan.
Payments to Broker-Dealers and Other Financial Intermediaries: If you purchase the fund through a broker-dealer or other financial intermediary, the fund and/or its affiliates may pay the intermediary for the sale of fund shares and related services. These payments may create a conflict of interest by influencing the broker-dealer or other intermediary and your salesperson to recommend the fund over another investment. Ask your salesperson or visit your financial intermediary’s website for more information.
14
|
| TRANSAMERICA AEGON SHORT-TERM BOND |
Investment Objective: Seeks a high level of income consistent with minimal fluctuation in principal value and liquidity.
Fees and Expenses: This table describes the fees and expenses that you may pay if you buy and hold shares of the fund. You may qualify for sales charge discounts if you and your family invest, or agree to invest in the future, at least $50,000 in Transamerica Funds. More information about these and other discounts is available from your financial professional and in the “Waivers and/or Reductions of Charges” section on page 120 of the fund’s prospectus and in the fund’s statement of additional information (SAI) under the heading “Purchase of Shares.”
| | | | | | |
| Shareholder Fees (fees paid directly from your investment) |
| | | Class of Shares |
| | | A | | C | | I |
Maximum sales charge (load) imposed on purchases (as a % of offering price) | | 2.50% | | None | | None |
| Maximum deferred sales charge (load) (as a percentage of purchase price or redemption proceeds, whichever is lower) | | Nonea | | 1.00% | | None |
| Annual Fund Operating Expenses (expenses that you pay each year as a percentage of the value of your investment)b |
| | | Class of Shares |
| | | A | | C | | I |
| Management fees | | 0.47% | | 0.47% | | 0.47% |
| Distribution and service (12b-1) fees | | 0.35% | | 1.00% | | None |
| Other expenses | | 0.11% | | 0.12% | | 0.18% |
| Total annual fund operating expenses | | 0.93% | | 1.59% | | 0.65% |
| Expense reductionc | | 0.10% | | 0.00% | | 0.00% |
| Total annual fund operating expenses after expense reduction | | 0.83% | | 1.59% | | 0.65% |
| a | Certain purchases of Class A shares in amounts of $250,000 or more are subject to a 0.75% contingent deferred sales charge (“CDSC”) for 12 months after purchase. |
| b | Annual fund operating expenses have been restated to reflect current contractual advisory fees. |
| c | Contractual arrangements have been made with the fund’s investment adviser, Transamerica Asset Management, Inc. (“TAM”), through March 1, 2012, to waive fees and/or reimburse fund expenses to the extent that the fund’s total operating expenses exceed 0.85%, excluding 12b-1 fees and extraordinary expenses. TAM is entitled to reimbursement by the fund of fees waived or expenses reduced during any of the previous 36 months if on any day the estimated annualized fund operating expenses are less than the cap, excluding 12b-1 fees and extraordinary expenses. In addition, TAM has contractually agreed, through March 1, 2012, to waive 0.10% of the 0.35% 12b-1 fee on Class A shares. |
Example: This Example is intended to help you compare the cost of investing in the fund with the cost of investing in other mutual funds. The Example assumes that you invest $10,000. The Example also assumes that your investment has a 5% return each year and that the fund’s operating expenses remain the same. Although your actual costs may be higher or lower, based on these assumptions your costs would be:
| | | | | | | | |
| |
| If the shares are redeemed at the end of each period: |
| Share Class | | 1 year | | 3 years | | 5 years | | 10 years |
| A | | $333 | | $529 | | $742 | | $1,355 |
| C | | $262 | | $502 | | $866 | | $1,889 |
| I | | $ 66 | | $208 | | $362 | | $ 810 |
| If the shares are not redeemed: |
Share Class | | 1 year | | 3 years | | 5 years | | 10 years |
| A | | $333 | | $529 | | $742 | | $1,355 |
| C | | $162 | | $502 | | $866 | | $1,889 |
| I | | $ 66 | | $208 | | $362 | | $ 810 |
The Example does not reflect sales charges (loads) on reinvested dividends (and other distributions). If these sales charges (loads) were included, your costs would be higher.
Portfolio Turnover: The fund pays transaction costs, such as commissions, when it buys and sells securities (or “turns over” its portfolio). A higher portfolio turnover rate may indicate higher transaction costs and may result in higher taxes when fund shares are held in a taxable account. These costs, which are not reflected in annual fund operating expenses or in the Example, affect the fund’s performance. During the most recent fiscal year, the portfolio turnover rate was 54% of the average value of the fund’s portfolio.
15
Principal Investment Strategies: AEGON USA Investment Management, LLC (“AUIM”), the fund’s sub-adviser, seeks to achieve the fund’s objective by investing, under normal circumstances, at least 80% of the fund’s net assets in fixed-income securities. Securities in which the fund may invest include:
| • | | short-term and intermediate-term, investment-grade corporate obligations |
| • | | obligations issued or guaranteed by the U.S. and foreign governments and their agencies and instrumentalities |
| • | | mortgage-backed securities |
| • | | asset-backed securities |
AUIM may also invest in bank obligations, collateralized mortgage obligations, foreign securities and hybrids.
Bank obligations purchased for the fund are limited to U.S. or foreign banks with total assets of $1.5 billion or more. Similarly, savings association obligations purchased for the fund are limited to U.S. savings association obligations issued by U.S. savings banks with total assets of $1.5 billion or more. Foreign government securities purchased for the fund must be U.S. dollar-denominated and issued by foreign governments, agencies or instrumentalities. These foreign obligations must also meet the same quality requirements as U.S. obligations. The commercial paper and other short-term corporate obligations AUIM buys for the fund are determined by the fund manager to present minimal credit risks.
The fund may invest its assets in cash, cash equivalent securities or short-term debt securities, repurchase agreements and money market instruments. Under adverse or unstable market, economic or political conditions, the fund may take temporary defensive positions in cash and short-term debt securities without limit.
Principal Risks: Many factors affect the fund’s performance. There is no assurance the fund will meet its investment objective. The value of your investment in the fund, as well as the amount of return you receive on your investment, may fluctuate significantly from day to day and over time. You may lose part or all of your investment in the fund or your investment may not perform as well as other similar investments. The following is a summary of certain risks (in alphabetical order) of investing in the fund. You may lose money if you invest in this fund.
| • | | Bank Obligations – To the extent the fund invests in U.S. bank obligations, the fund will be more susceptible to adverse events affecting the U.S. banking industry. Banks are sensitive to changes in money market and general economic conditions, as well as decisions by regulators that can affect banks’ profitability. |
| • | | Cash Management and Defensive Investing – Money market instruments or short-term debt securities held by the fund for cash management or defensive investing purposes can fluctuate in value. Like other fixed income securities, they are subject to risk, including market, interest rate and credit risk. If the fund holds cash uninvested, the fund will not earn income on the cash and the fund’s yield will go down. If a significant amount of the fund’s assets are used for cash management or defensive investing purposes, it will be more difficult for the fund to achieve its objective. |
| • | | Credit – If an issuer or guarantor of a security held by the fund or a counterparty to a financial contract with the fund defaults or is downgraded, or if the value of the assets underlying a security declines, the value of your investment will decline. Junk bonds have a higher risk of default and are considered speculative. A default or downgrade will have a greater impact on subordinated securities. |
| • | | Derivatives – Using derivatives can increase fund losses and reduce opportunities for gains when market prices, interest rates or the derivative instruments themselves behave in a way not anticipated by the fund. Using derivatives also can have a leveraging effect and increase fund volatility. Derivatives may be difficult to sell, unwind or value, and the counterparty may default on its obligations to the fund. The fund’s investments in derivative instruments may involve a small investment relative to the amount of investment exposure assumed and may result in losses exceeding the amounts invested in those instruments. Recent legislation calls for new regulation of the derivatives markets. The extent and impact of the regulation are not yet fully known and may not be for some time. New regulation of derivatives may make them more costly, may limit their availability, or may otherwise adversely affect their value or performance. |
| • | | Fixed-Income Securities – The market prices of fixed-income securities may go up or down, sometimes rapidly or unpredictably due to general market conditions, such as real or perceived adverse economic or political conditions, inflation, changes in interest rates, lack of liquidity in the bond markets or adverse investor sentiment. When market prices fall, the value of your investment will go down. A rise in rates tends to have a greater impact on the prices of longer term or duration securities. |
If interest rates rise, repayments of fixed-income securities may occur more slowly than anticipated by the market. This may drive the prices of these securities down because their interest rates are lower than the current interest rate and they remain outstanding longer. This is sometimes referred to as extension risk.
16
Many issuers have a right to prepay their securities. If interest rates fall, an issuer may exercise this right. If this happens, the fund will be forced to reinvest prepayment proceeds at a time when yields on securities available in the market are lower than the yield on the prepaid security. This is sometimes referred to as prepayment or call risk.
| • | | Foreign Securities – Foreign securities are subject to a number of additional risks, including nationalization or expropriation of assets, imposition of currency controls or restrictions, confiscatory taxation, political or financial instability and other adverse economic or political developments. Lack of information and less market regulation also may affect the value of these securities. |
| • | | Increase in Expenses – Your actual costs of investing in the fund may be higher than the expenses shown in “Annual Fund Operating Expenses” for a variety of reasons. For example, expense ratios may be higher than those shown if average net assets decrease. Net assets are more likely to decrease and fund expense ratios are more likely to increase when markets are volatile. |
| • | | Interest Rate – Fixed-income securities have varying levels of sensitivity to changes in interest rates. In general, the price of a fixed-income security tends to fall when interest rates rise and can rise when interest rates fall. A change in interest rates will not have the same impact on all fixed-income securities. Generally, the longer the maturity or duration of a fixed-income security, the greater the impact of a rise in interest rates on the security’s value. In addition, different interest rate measures (such as short- and long-term interest rates and U.S. and foreign interest rates), or interest rates on different types of securities or securities of different issuers, may not necessarily change in the same amount or in the same direction. When interest rates go down, the income received by the fund, and the fund’s yield, may decline. |
| • | | Liquidity – Some securities held by the fund may be difficult to sell, or illiquid, particularly during times of market turmoil. Illiquid securities may also be difficult to value. If the fund is forced to sell an illiquid asset to meet redemption requests or other cash needs, the fund may be forced to sell at a loss. |
| • | | Market – The market prices of the fund’s securities may go up or down, sometimes rapidly or unpredictably, due to general market conditions, such as real or perceived adverse economic or political conditions, inflation, changes in interest rates or currency rates, lack of liquidity in the markets or adverse investor sentiment. Market prices of securities also may go down due to events or conditions that affect particular sectors or issuers. When market prices fall, the value of your investment will go down. The fund may experience a substantial or complete loss on any individual security. The recent financial crisis has caused a significant decline in the value and liquidity of many securities. In response to the financial crisis, the U.S. and other governments and the Federal Reserve and certain foreign central banks have taken steps to support financial markets. The withdrawal of this support could negatively affect the value and liquidity of certain securities. In addition, legislation recently enacted in the U.S. calls for changes in many aspects of financial regulation. The impact of the legislation on the markets, and the practical implications for market participants, may not be fully known for some time. |
| • | | Mortgage-Related and Asset-Backed Securities – Mortgage-backed securities may be issued by private issuers, by government-sponsored entities such as Fannie Mae or Freddie Mac or by agencies of the U.S. government, such as Ginnie Mae. Mortgage-backed securities represent direct or indirect participations in, or are collateralized by and payable from, mortgage loans secured by real property. Unlike mortgage-related securities issued or guaranteed by agencies of the U.S. government or government-sponsored entities, mortgage-related securities issued by private issuers do not have a government or government-sponsored entity guarantee (but may have other credit enhancement), and may, and frequently do, have less favorable collateral, credit risk or other underwriting characteristics. Mortgage-backed securities are also particularly susceptible to prepayment and extension risks. Asset-backed securities represent participations in, or are secured by and payable from, assets such as installment sales or loan contracts, leases, credit card receivables and other categories of receivables. Certain asset-backed securities present a heightened level of risk because, in the event of default, the liquidation value of the underlying assets may be inadequate to pay any unpaid principal or interest. The value of mortgage-backed and asset-backed securities may be affected by changes in credit quality or value of the mortgage loans or other assets that support the securities. |
| • | | Portfolio Selection – The sub-adviser’s judgment about a particular security or issuer, or about the economy or a particular sector, region or market segment, or about an investment strategy, may prove to be incorrect. |
| • | | REITs – When the fund invests in Real Estate Investment Trusts (“REITs”), it is subject to risks generally associated with investing in real estate. A REIT’s performance depends on the types and locations of the properties it owns and how well it manages those properties or loan financings. REITs are subject to a highly technical tax structure; and the failure to qualify as a REIT could result in corporate-level taxation, significantly reducing the return on an investment to the fund. |
| • | | U.S. Government Agency Obligations – Government agency obligations have different levels of credit support and, therefore, different degrees of credit risk. Securities issued by agencies and instrumentalities of the U.S. government that |
17
| | are supported by the full faith and credit of the United States generally present a lesser degree of credit risk than securities issued by agencies and instrumentalities sponsored by the U.S. government that are supported only by the issuer’s right to borrow from the U.S. Treasury and securities issued by agencies and instrumentalities sponsored by the U.S. government that are supported only by the credit of the issuing agencies. |
| • | | Valuation – The sales price the fund could receive for any particular portfolio investment may differ from the fund’s valuation of the investment, particularly for securities that trade in thin or volatile markets or that are valued using a fair value methodology. |
| • | | Yield – The amount of income received by the fund will go up or down depending on day-to-day variations in short-term interest rates, and when interest rates are very low the fund’s expenses could absorb all or a significant portion of the fund’s income. |
Performance: The bar chart and the table below provide some indication of the risks of investing in the fund by showing you how the fund’s performance has varied from year to year, and how the fund’s average annual total returns for different periods compare to the returns of a broad measure of market performance. The bar chart does not reflect the impact of sales charges, which, if reflected, would lower the returns. The table, which shows average annual total returns for each class of shares of the fund, includes deduction of applicable sales charges. Absent any limitation of the fund’s expenses, total returns would be lower. As with all mutual funds, past performance (before and after taxes) is not a prediction of future results. Updated performance information is available on our website at www.transamericafunds.com or by calling 1-888-233-4339.
Prior to March 22, 2011, the fund was named Transamerica Short-Term Bond and had a different sub-adviser. The performance set forth prior to that date is attributable to the previous sub-adviser.
Annual Total Returns (calendar years ended December 31) – Class A
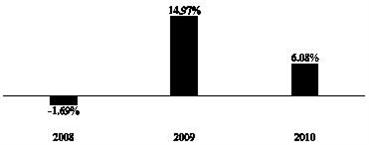
| | | | |
| | | Quarter Ended | | Return |
Best Quarter: | | 6/30/2009 | | 4.77% |
Worst Quarter: | | 12/31/2008 | | -2.36% |
Average Annual Total Returns (periods ended December 31, 2010)1
| | | | |
| | | 1 Year | | 10 Years or Inception* |
| Class A (commenced operations on November 1, 2007) | | | | |
Return before taxes | | 3.49% | | 5.14% |
Return after taxes on distributions2 | | 1.98% | | 3.53% |
Return after taxes on distributions and sale of fund shares2 | | 2.30% | | 3.43% |
| Class C (Return before taxes only) (commenced operations on November 1, 2007) | | 3.82% | | 5.08% |
| Class I (Return before taxes only) (commenced operations on November 30, 2009) | | 6.35% | | 5.93% |
| Bank of America Merrill Lynch U.S. Corporate & Government 1-3 Years Index (reflects no deduction for fees, expenses or taxes) | | 2.82% | | 4.14% |
| 1 | Actual returns may depend on the investor’s individual tax situation. After-tax returns may not be relevant if the investment is made through a tax-exempt or tax-deferred account, such as a 401(k) plan. After-tax returns are presented for only one class and returns for other classes will vary. |
| 2 | The after-tax returns are calculated using the historic highest individual federal marginal income tax rates and do not reflect the impact of state and local taxes. |
| * | Fund returns are for past 10 years or since inception, whichever is less. Index returns are for 10 years or since inception of oldest share class, whichever is less. |
18
Management:
| | |
| Investment Adviser: | | Sub-Adviser: |
Transamerica Asset Management, Inc. | | AEGON USA Investment Management, LLC |
| | Portfolio Managers: |
| | Greg Haendel, CFA, Portfolio Manager (Lead) since 2007 |
| | Doug Weih, Portfolio Manager since 2011 |
| | Garry Creed, Portfolio Manager since 2011 |
Purchase and Sale of Fund Shares: You may purchase, exchange or redeem shares of the fund on any day the New York Stock Exchange is open for business, online or through our website at www.transamericafunds.com, by mail to Transamerica Fund Services, Inc., P.O. Box 219945, Kansas City, MO 64121-9945, by telephone at 1-888-233-4339, or overnight mail to Transamerica Fund Services, Inc., 330 W. 9th Street, Kansas City, MO 64105. Shares may also be purchased through a financial intermediary. The minimum initial purchase for Class A and C shares is $1,000; the minimum subsequent investment is $50. The minimum initial purchase for payroll deduction and automatic investment plan is $500; the minimum subsequent investment is $50 per monthly fund account investment. The minimum investment for Class I shares is $1,000,000.
Tax Information: Fund distributions may be taxable as ordinary income or capital gains, except when your investment is in an IRA, 401(k) or other tax-advantaged investment plan.
Payments to Broker-Dealers and Other Financial Intermediaries: If you purchase the fund through a broker-dealer or other financial intermediary, the fund and/or its affiliates may pay the intermediary for the sale of fund shares and related services. These payments may create a conflict of interest by influencing the broker-dealer or other intermediary and your salesperson to recommend the fund over another investment. Ask your salesperson or visit your financial intermediary’s website for more information.
19
|
| TRANSAMERICA ASSET ALLOCATION - CONSERVATIVE PORTFOLIO |
Investment Objective: Seeks current income and preservation of capital.
Fees and Expenses: This table describes the fees and expenses that you may pay if you buy and hold shares of the fund. You may qualify for sales charge discounts if you and your family invest, or agree to invest in the future, at least $50,000 in Transamerica Funds. More information about these and other discounts is available from your financial professional and in the “Waivers and/or Reductions of Charges” section on page 120 of the fund’s prospectus and in the fund’s statement of additional information (SAI) under the heading “Purchase of Shares.”
| | | | | | | | | | |
| Shareholder Fees (fees paid directly from your investment) |
| | | Class of Shares |
| | | A | | B* | | C | | I | | R |
Maximum sales charge (load) imposed on purchases (as a % of offering price) | | 5.50% | | None | | None | | None | | None |
Maximum deferred sales charge (load) (as a percentage of purchase price or redemption proceeds, whichever is lower) | | None | | 5.00% | | 1.00% | | None | | None |
| Annual Fund Operating Expenses (expenses that you pay each year as a percentage of the value of your investment) |
| | | Class of Shares |
| | | A | | B* | | C | | I | | R |
Management fees | | 0.10% | | 0.10% | | 0.10% | | 0.10% | | 0.10% |
Distribution and service (12b-1) fees | | 0.35% | | 1.00% | | 1.00% | | None | | 0.50% |
Other expenses | | 0.18% | | 0.16% | | 0.12% | | 0.18% | | 0.28% |
Acquired Fund Fees and Expenses (fees and expenses of underlying funds) | | 0.78% | | 0.78% | | 0.78% | | 0.78% | | 0.78% |
Total annual fund operating expensesa | | 1.41% | | 2.04% | | 2.00% | | 1.06% | | 1.66% |
| * | Not available to new investors. |
| a | Fund operating expenses do not correlate to the ratios of expenses to average net assets in the financial highlights table, which do not include acquired (i.e., underlying) funds’ fees and expenses. |
Example: This Example is intended to help you compare the cost of investing in the fund with the cost of investing in other mutual funds. The Example assumes that you invest $10,000. The Example also assumes that your investment has a 5% return each year and that the fund’s operating expenses remain the same. Although your actual costs may be higher or lower, based on these assumptions your costs would be:
| | | | | | | | |
| |
| If the shares are redeemed at the end of each period: |
| Share Class | | 1 year | | 3 years | | 5 years | | 10 years |
A | | $686 | | $972 | | $1,279 | | $2,148 |
B+ | | $707 | | $940 | | $1,198 | | $2,207 |
C | | $303 | | $627 | | $1,078 | | $2,327 |
I | | $108 | | $337 | | $ 585 | | $1,294 |
R | | $169 | | $523 | | $ 902 | | $1,965 |
| If the shares are not redeemed: |
| Share Class | | 1 year | | 3 years | | 5 years | | 10 years |
A | | $686 | | $972 | | $1,279 | | $2,148 |
B+ | | $207 | | $640 | | $1,098 | | $2,207 |
C | | $203 | | $627 | | $1,078 | | $2,327 |
I | | $108 | | $337 | | $ 585 | | $1,294 |
R | | $169 | | $523 | | $ 902 | | $1,965 |
| + | Examples for Class B shares assume conversion into Class A shares eight years after purchase. Class B shares are not available to new investors. |
The Example does not reflect sales charges (loads) on reinvested dividends (and other distributions). If these sales charges (loads) were included, your costs would be higher.
Portfolio Turnover: The fund pays transaction costs, such as commissions, when it buys and sells securities (or “turns over” its portfolio). A higher portfolio turnover rate may indicate higher transaction costs and may result in higher taxes when fund shares are held in a taxable account. These costs, which are not reflected in annual fund operating expenses or in the Example, affect the fund’s performance. During the most recent fiscal year, the portfolio turnover rate was 16% of the average value of the fund’s portfolio.
20
Principal Investment Strategies: The fund seeks to achieve its investment objective by investing its assets in a broad mix of underlying Transamerica Funds (“underlying funds”).
| • | | Under normal circumstances, investments in underlying funds are expected to achieve a mix over time of approximately 35% of assets in equities, which may include both stocks and commodity-related securities, and 65% of assets in fixed-income, which may include bonds, cash, cash equivalents, and other money market instruments. These percentages may vary. |
| • | | Allocation of assets among the underlying funds is based on such things as diversification, general market outlooks, volatility in the equity markets, historical performance, current valuations, and other global economic factors. |
| • | | The fund may also invest directly in U.S. government securities and/or short-term commercial paper. |
Each underlying fund has its own investment objective, principal investment strategies and investment risks. The “Underlying Funds” section of the prospectus lists the underlying funds currently available for investment by the fund, provides a summary of their respective investment objectives and principal investment strategies, and identifies certain risks of the underlying funds.
It is not possible to predict the extent to which the fund will be invested in a particular underlying fund at any time. The fund may be a significant shareholder in certain underlying funds.
The portfolio construction manager, Morningstar Associates, LLC, may change the fund’s asset allocations and underlying funds at any time without notice to shareholders and without shareholder approval.
Under adverse or unstable market, economic or political conditions, the fund may take temporary defensive positions in cash and short-term debt securities without limit.
Principal Risks: Many factors affect the fund’s performance. There is no assurance the fund will meet its investment objective. The value of your investment in the fund, as well as the amount of return you receive on your investment, may fluctuate significantly from day to day and over time. You may lose part or all of your investment in the fund or your investment may not perform as well as other similar investments. The following is a summary of certain risks (in alphabetical order) of investing in the fund. You may lose money if you invest in this fund.
| • | | Asset Allocation – The Portfolio Construction Manager allocates the fund’s assets among various underlying funds. These allocations may be unsuccessful in maximizing the fund’s return and/or avoiding investment losses, and may cause the fund to underperform other funds with a similar strategy. |
| • | | Cash Management and Defensive Investing – Money market instruments or short-term debt securities held by the fund for cash management or defensive investing purposes can fluctuate in value. Like other fixed income securities, they are subject to risk, including market, interest rate and credit risk. If the fund holds cash uninvested, the fund will not earn income on the cash and the fund’s yield will go down. If a significant amount of the fund’s assets are used for cash management or defensive investing purposes, it will be more difficult for the fund to achieve its objective. |
| • | | Commodities – To the extent the fund invests in instruments whose performance is linked to the price of an underlying commodity or commodity index, the fund will be subject to the risks of investing in physical commodities, including regulatory, economic and political developments, weather events and natural disasters and market disruptions. The fund’s investment exposure to the commodities markets may subject the fund to greater volatility than investments in more traditional securities, such as stocks and bonds. |
| • | | Convertible Securities – The market value of convertible securities tends to decline as interest rates increase. Convertible securities generally offer lower interest or dividend yields than non-convertible securities of similar quality. The fund could lose money if the issuer of a convertible security is unable to meet its financial obligations or goes bankrupt. |
| • | | Credit – If an issuer or guarantor of a security held by the fund or a counterparty to a financial contract with the fund defaults or is downgraded, or if the value of the assets underlying a security declines, the value of your investment will decline. Junk bonds have a higher risk of default and are considered speculative. A default or downgrade will have a greater impact on subordinated securities. |
| • | | Currency – When the fund invests in securities denominated in foreign currencies, the fund may incur currency conversion costs and may be affected favorably or unfavorably by changes in the rates of exchange between those currencies and the U.S. dollar. Currency exchange rates can be volatile and are affected by, among other factors, the general economics of a country, the actions of the U.S. and foreign governments or control banks, the imposition of currency controls, and speculation. |
21
| • | | Fixed-Income Securities – The market prices of fixed-income securities may go up or down, sometimes rapidly or unpredictably due to general market conditions, such as real or perceived adverse economic or political conditions, inflation, changes in interest rates, lack of liquidity in the bond markets or adverse investor sentiment. When market prices fall, the value of your investment will go down. A rise in rates tends to have a greater impact on the prices of longer term or duration securities. |
If interest rates rise, repayments of fixed-income securities may occur more slowly than anticipated by the market. This may drive the prices of these securities down because their interest rates are lower than the current interest rate and they remain outstanding longer. This is sometimes referred to as extension risk.
Many issuers have a right to prepay their securities. If interest rates fall, an issuer may exercise this right. If this happens, the fund will be forced to reinvest prepayment proceeds at a time when yields on securities available in the market are lower than the yield on the prepaid security. This is sometimes referred to as prepayment or call risk.
| • | | Foreign Securities – Foreign securities are subject to a number of additional risks, including nationalization or expropriation of assets, imposition of currency controls or restrictions, confiscatory taxation, political or financial instability and other adverse economic or political developments. Lack of information and less market regulation also may affect the value of these securities. |
| • | | Increase in Expenses – Your actual costs of investing in the fund may be higher than the expenses shown in “Annual Fund Operating Expenses” for a variety of reasons. For example, expense ratios may be higher than those shown if average net assets decrease. Net assets are more likely to decrease and fund expense ratios are more likely to increase when markets are volatile. |
| • | | Liquidity – Some securities held by the fund may be difficult to sell, or illiquid, particularly during times of market turmoil. Illiquid securities may also be difficult to value. If the fund is forced to sell an illiquid asset to meet redemption requests or other cash needs, the fund may be forced to sell at a loss. |
| • | | Market – The market prices of the fund’s securities may go up or down, sometimes rapidly or unpredictably, due to general market conditions, such as real or perceived adverse economic or political conditions, inflation, changes in interest rates or currency rates, lack of liquidity in the markets or adverse investor sentiment. Market prices of securities also may go down due to events or conditions that affect particular sectors or issuers. When market prices fall, the value of your investment will go down. The fund may experience a substantial or complete loss on any individual security. The recent financial crisis has caused a significant decline in the value and liquidity of many securities. In response to the financial crisis, the U.S. and other governments and the Federal Reserve and certain foreign central banks have taken steps to support financial markets. The withdrawal of this support could negatively affect the value and liquidity of certain securities. In addition, legislation recently enacted in the U.S. calls for changes in many aspects of financial regulation. The impact of the legislation on the markets, and the practical implications for market participants, may not be fully known for some time. |
| • | | Stocks – Stocks may be volatile – their prices may go up and down dramatically over the shorter term. These price movements may result from factors affecting individual companies, industries, the securities market as a whole or the overall economy. |
| • | | Underlying Funds – Because the fund invests its assets in various underlying funds, its ability to achieve its investment objective depends largely on the performance of the underlying funds in which it invests. Each of the underlying funds in which the fund may invest has its own investment risks, and those risks can affect the value of the underlying funds’ shares and therefore the value of the fund’s investments. There can be no assurance that the investment objective of any underlying fund will be achieved. To the extent that the fund invests more of its assets in one underlying fund than in another, the fund will have greater exposure to the risks of that underlying fund. In addition, the fund will bear a pro rata portion of the operating expenses of the underlying funds in which it invests. The “Underlying Funds” section of the fund’s prospectus identifies certain risks of each underlying fund. |
Performance: The bar chart and the table below provide some indication of the risks of investing in the fund by showing you how the fund’s performance has varied from year to year, and how the fund’s average annual total returns for different periods compare to the returns of a broad measure of market performance, as well as comparison to a secondary index which has characteristics relevant to the fund’s investment strategies. The bar chart does not reflect the impact of sales charges, which, if reflected, would lower the returns. The table, which shows average annual total returns for each class of shares of the fund, includes deduction of applicable sales charges. Absent any limitation of the fund’s expenses, total returns would be lower. As with all mutual funds, past performance (before and after taxes) is not a prediction of future results. Updated performance information is available on our website at www.transamericafunds.com or by calling 1-888-233-4339.
22
Annual Total Returns (calendar years ended December 31) – Class A
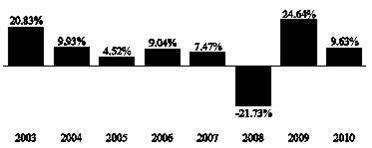
| | | | |
| | | Quarter Ended | | Return |
| Best Quarter: | | 6/30/2009 | | 12.20% |
| Worst Quarter: | | 12/31/2008 | | -10.98% |
Average Annual Total Returns (periods ended December 31, 2010)1
| | | | | | |
| | 1 Year | | 5 Years | | 10 Years or
Inception* |
| Class A (commenced operations on March 1, 2002) | | | | | | |
Return before taxes | | 3.60% | | 3.45% | | 5.02% |
Return after taxes on distributions2 | | 2.81% | | 2.12% | | 3.74% |
Return after taxes on distributions and sale of fund shares2 | | 2.39% | | 2.24% | | 3.64% |
| Class B (Return before taxes only) (commenced operations on March 1, 2002) | | 3.95% | | 3.79% | | 5.07% |
| Class C (Return before taxes only) (commenced operations on November 11, 2002) | | 7.95% | | 4.00% | | 6.58% |
| Class I (Return before taxes only) (commenced operations on November 30, 2009) | | 10.02% | | N/A | | 10.08% |
| Class R (Return before taxes only) (commenced operations on June 15, 2006) | | 9.33% | | N/A | | 4.63% |
| Barclays Capital U.S. Aggregate Bond Index (reflects no deduction for fees, expenses, or taxes) | | 6.54% | | 5.80% | | 5.44% |
| Wilshire 5000 Total Market Index (reflects no deduction for fees, expenses or taxes) | | 17.87% | | 3.21% | | 4.78% |
| 1 | Actual returns may depend on the investor’s individual tax situation. After-tax returns may not be relevant if the investment is made through a tax-exempt or tax-deferred account, such as a 401(k) plan. After-tax returns are presented for only one class and returns for other classes will vary. |
| 2 | The after-tax returns are calculated using the historic highest individual federal marginal income tax rates and do not reflect the impact of state and local taxes. |
| * | Fund returns are for past 10 years or since inception, whichever is less. Index returns are for 10 years or since inception of oldest share class, whichever is less. |
Management:
| | |
| Investment Adviser: | | Portfolio Construction Manager: |
| |
| Transamerica Asset Management, Inc. | | Morningstar Associates, LLC |
| |
| | Portfolio Construction Team: |
| |
| | Jon Hale, CFA, Co-Portfolio Manager since 2006 |
| |
| | Dan McNeela, CFA, Co-Portfolio Manager since 2010 |
| |
| | Hal Ratner, Co-Portfolio Manager since 2010 |
| |
| | Michael Stout, CFA, Co-Portfolio Manager since 2006 |
23
Purchase and Sale of Fund Shares: You may purchase, exchange or redeem shares of the fund on any day the New York Stock Exchange is open for business, online or through our website at www.transamericafunds.com, by mail to Transamerica Fund Services, Inc., P.O. Box 219945, Kansas City, MO 64121-9945, by telephone at 1-888-233-4339, or overnight mail to Transamerica Fund Services, Inc., 330 W. 9th Street, Kansas City, MO 64105. Shares may also be purchased through a financial intermediary. The minimum initial purchase for Class A and C shares is $1,000; the minimum subsequent investment is $50. The minimum initial purchase for payroll deduction and automatic investment plan is $500; the minimum subsequent investment is $50 per monthly fund account investment. The minimum investment for Class I shares is $1,000,000. Class B shares are not available for purchase, including to existing Class B shareholders, except in the limited circumstances described in this prospectus under the section entitled “Shareholder Information – Buying Shares”.
Class R shares are intended for purchase by participants in certain retirement plans such as 401(k) plans, 457 plans, employer-sponsored 403(b) plans, profit sharing and money purchase plans, defined-benefit plans and non-qualified deferred compensation plans (eligible retirement plans), and under the following conditions: Class R shares are available only when a plan’s recordkeeper or financial service firm serving as an intermediary has an agreement with Transamerica Funds, and in such eligible retirement plans where Class R shares are held on the books of the funds through omnibus or Network Level 3 accounts (either at the plan level or at the level of the financial service firm serving as an intermediary). There is no minimum investment for Class R shares.
Tax Information: Fund distributions may be taxable as ordinary income or capital gains, except when your investment is in an IRA, 401(k) or other tax-advantaged investment plan.
Payments to Broker-Dealers and Other Financial Intermediaries: If you purchase the fund through a broker-dealer or other financial intermediary, the fund and/or its affiliates may pay the intermediary for the sale of fund shares and related services. These payments may create a conflict of interest by influencing the broker-dealer or other intermediary and your salesperson to recommend the fund over another investment. Ask your salesperson or visit your financial intermediary’s website for more information.
24
|
| TRANSAMERICA ASSET ALLOCATION - GROWTH PORTFOLIO |
Investment Objective: Seeks long-term capital appreciation.
Fees and Expenses: This table describes the fees and expenses that you may pay if you buy and hold shares of the fund. You may qualify for sales charge discounts if you and your family invest, or agree to invest in the future, at least $50,000 in Transamerica Funds. More information about these and other discounts is available from your financial professional and in the “Waivers and/or Reductions of Charges” section on page 120 of the fund’s prospectus and in the fund’s statement of additional information (SAI) under the heading “Purchase of Shares.”
| | | | | | | | | | |
Shareholder Fees (fees paid directly from your investment) |
| | | Class of Shares |
| | | A | | B* | | C | | I | | R |
Maximum sales charge (load) imposed on purchases (as a % of offering price) | | 5.50% | | None | | None | | None | | None |
| Maximum deferred sales charge (load) (as a percentage of purchase price or redemption proceeds, whichever is lower) | | None | | 5.00% | | 1.00% | | None | | None |
| Annual Fund Operating Expenses (expenses that you pay each year as a percentage of the value of your investment) |
| | | Class of Shares |
| | | A | | B* | | C | | I | | R |
| Management fees | | 0.10% | | 0.10% | | 0.10% | | 0.10% | | 0.10% |
| Distribution and service (12b-1) fees | | 0.35% | | 1.00% | | 1.00% | | None | | 0.50% |
| Other expenses | | 0.23% | | 0.25% | | 0.19% | | 0.20% | | 0.24% |
Acquired Fund Fees and Expenses (fees and expenses of underlying funds) | | 0.91% | | 0.91% | | 0.91% | | 0.91% | | 0.91% |
| Total annual fund operating expensesa | | 1.59% | | 2.26% | | 2.20% | | 1.21% | | 1.75% |
| * | Not available to new investors. |
| a | Fund operating expenses do not correlate to the ratios of expenses to average net assets in the financial highlights table, which do not include acquired (i.e., underlying) funds’ fees and expenses. |
Example: This Example is intended to help you compare the cost of investing in the fund with the cost of investing in other mutual funds. The Example assumes that you invest $10,000. The Example also assumes that your investment has a 5% return each year and that the fund’s operating expenses remain the same. Although your actual costs may be higher or lower, based on these assumptions your costs would be:
| | | | | | | | |
If the shares are redeemed at the end of each period: |
Share Class | | 1 year | | 3 years | | 5 years | | 10 years |
A | | $703 | | $1,024 | | $1,368 | | $2,335 |
B+ | | $729 | | $1,006 | | $1,310 | | $2,427 |
C | | $323 | | $ 688 | | $1,180 | | $2,534 |
I | | $123 | | $ 384 | | $ 665 | | $1,466 |
R | | $178 | | $ 551 | | $ 949 | | $2,062 |
| If the shares are not redeemed: |
Share Class | | 1 year | | 3 years | | 5 years | | 10 years |
A | | $703 | | $1,024 | | $1,368 | | $2,335 |
B+ | | $229 | | $ 706 | | $1,210 | | $2,427 |
C | | $223 | | $ 688 | | $1,180 | | $2,534 |
I | | $123 | | $ 384 | | $ 665 | | $1,466 |
R | | $178 | | $ 551 | | $ 949 | | $2,062 |
| + | Examples for Class B shares assume conversion into Class A shares eight years after purchase. Class B shares are not available to new investors. |
The Example does not reflect sales charges (loads) on reinvested dividends (and other distributions). If these sales charges (loads) were included, your costs would be higher.
Portfolio Turnover: The fund pays transaction costs, such as commissions, when it buys and sells securities (or “turns over” its portfolio). A higher portfolio turnover rate may indicate higher transaction costs and may result in higher taxes when fund shares are held in a taxable account. These costs, which are not reflected in annual fund operating expenses or in the Example, affect the fund’s performance. During the most recent fiscal year, the portfolio turnover rate was 10% of the average value of the fund’s portfolio.
25
Principal Investment Strategies: The fund seeks to achieve its investment objective by investing its assets in a broad mix of underlying Transamerica Funds (“underlying funds”).
| • | | Under normal circumstances, the fund expects to invest primarily in underlying funds that invest in equities, which may include stocks, commodity-related securities and alternative investments. |
| • | | Allocation of assets among the underlying funds is based on such things as diversification, general market outlooks, historical performance, current valuations, and other global economic factors. |
| • | | The fund may also invest directly in U.S. government securities and/or short-term commercial paper. |
Each underlying fund has its own investment objective, principal investment strategies and investment risks. The “Underlying Funds” section of the prospectus lists the underlying funds currently available for investment by the fund, provides a summary of their respective investment objectives and principal investment strategies and identifies certain risks of the underlying funds.
It is not possible to predict the extent to which the fund will be invested in a particular underlying fund at any time. The fund may be a significant shareholder in certain underlying funds.
The portfolio construction manager, Morningstar Associates, LLC, may change the fund’s asset allocations and underlying funds at any time without notice to shareholders and without shareholder approval.
Under adverse or unstable market, economic or political conditions, the fund may take temporary defensive positions in cash and short-term debt securities without limit.
Principal Risks: Many factors affect the fund’s performance. There is no assurance the fund will meet its investment objective. The value of your investment in the fund, as well as the amount of return you receive on your investment, may fluctuate significantly from day to day and over time. You may lose part or all of your investment in the fund or your investment may not perform as well as other similar investments. The following is a summary of certain risks (in alphabetical order) of investing in the fund. You may lose money if you invest in this fund.
| • | | Asset Allocation – The Portfolio Construction Manager allocates the fund’s assets among various underlying funds. These allocations may be unsuccessful in maximizing the fund’s return and/or avoiding investment losses, and may cause the fund to underperform other funds with a similar strategy. |
| • | | Cash Management and Defensive Investing – Money market instruments or short-term debt securities held by the fund for cash management or defensive investing purposes can fluctuate in value. Like other fixed income securities, they are subject to risk, including market, interest rate and credit risk. If the fund holds cash uninvested, the fund will not earn income on the cash and the fund’s yield will go down. If a significant amount of the fund’s assets are used for cash management or defensive investing purposes, it will be more difficult for the fund to achieve its objective. |
| • | | Commodities – To the extent the fund invests in instruments whose performance is linked to the price of an underlying commodity or commodity index, the fund will be subject to the risks of investing in physical commodities, including regulatory, economic and political developments, weather events and natural disasters and market disruptions. The fund’s investment exposure to the commodities markets may subject the fund to greater volatility than investments in more traditional securities, such as stocks and bonds. |
| • | | Currency – When the fund invests in securities denominated in foreign currencies, the fund may incur currency conversion costs and may be affected favorably or unfavorably by changes in the rates of exchange between those currencies and the U.S. dollar. Currency exchange rates can be volatile and are affected by, among other factors, the general economics of a country, the actions of the U.S. and foreign governments or control banks, the imposition of currency controls, and speculation. |
| • | | Fixed-Income Securities – The market prices of fixed-income securities may go up or down, sometimes rapidly or unpredictably due to general market conditions, such as real or perceived adverse economic or political conditions, inflation, changes in interest rates, lack of liquidity in the bond markets or adverse investor sentiment. When market prices fall, the value of your investment will go down. A rise in rates tends to have a greater impact on the prices of longer term or duration securities. |
If interest rates rise, repayments of fixed-income securities may occur more slowly than anticipated by the market. This may drive the prices of these securities down because their interest rates are lower than the current interest rate and they remain outstanding longer. This is sometimes referred to as extension risk.
26
Many issuers have a right to prepay their securities. If interest rates fall, an issuer may exercise this right. If this happens, the fund will be forced to reinvest prepayment proceeds at a time when yields on securities available in the market are lower than the yield on the prepaid security. This is sometimes referred to as prepayment or call risk.
| • | | Foreign Securities – Foreign securities are subject to a number of additional risks, including nationalization or expropriation of assets, imposition of currency controls or restrictions, confiscatory taxation, political or financial instability and other adverse economic or political developments. Lack of information and less market regulation also may affect the value of these securities. |
| • | | Increase in Expenses – Your actual costs of investing in the fund may be higher than the expenses shown in “Annual Fund Operating Expenses” for a variety of reasons. For example, expense ratios may be higher than those shown if average net assets decrease. Net assets are more likely to decrease and fund expense ratios are more likely to increase when markets are volatile. |
| • | | Market – The market prices of the fund’s securities may go up or down, sometimes rapidly or unpredictably, due to general market conditions, such as real or perceived adverse economic or political conditions, inflation, changes in interest rates or currency rates, lack of liquidity in the markets or adverse investor sentiment. Market prices of securities also may go down due to events or conditions that affect particular sectors or issuers. When market prices fall, the value of your investment will go down. The fund may experience a substantial or complete loss on any individual security. The recent financial crisis has caused a significant decline in the value and liquidity of many securities. In response to the financial crisis, the U.S. and other governments and the Federal Reserve and certain foreign central banks have taken steps to support financial markets. The withdrawal of this support could negatively affect the value and liquidity of certain securities. In addition, legislation recently enacted in the U.S. calls for changes in many aspects of financial regulation. The impact of the legislation on the markets, and the practical implications for market participants, may not be fully known for some time. |
| • | | Stocks – Stocks may be volatile – their prices may go up and down dramatically over the shorter term. These price movements may result from factors affecting individual companies, industries, the securities market as a whole or the overall economy. |
| • | | Underlying Funds – Because the fund invests its assets in various underlying funds, its ability to achieve its investment objective depends largely on the performance of the underlying funds in which it invests. Each of the underlying funds in which the fund may invest has its own investment risks, and those risks can affect the value of the underlying funds’ shares and therefore the value of the fund’s investments. There can be no assurance that the investment objective of any underlying fund will be achieved. To the extent that the fund invests more of its assets in one underlying fund than in another, the fund will have greater exposure to the risks of that underlying fund. In addition, the fund will bear a pro rata portion of the operating expenses of the underlying funds in which it invests. The “Underlying Funds” section of the fund’s prospectus identifies certain risks of each underlying fund. |
Performance: The bar chart and the table below provide some indication of the risks of investing in the fund by showing you how the fund’s performance has varied from year to year, and how the fund’s average annual total returns for different periods compare to the returns of a broad measure of market performance. The bar chart does not reflect the impact of sales charges, which, if reflected, would lower the returns. The table, which shows average annual total returns for each class of shares of the fund, includes deduction of applicable sales charges. Absent any limitation of the fund’s expenses, total returns would be lower. As with all mutual funds, past performance (before and after taxes) is not a prediction of future results. Updated performance information is available on our website at www.transamericafunds.com or by calling 1-888-233-4339.
Annual Total Returns (calendar years ended December 31) – Class A

| | | | |
| | | Quarter Ended | | Return |
Best Quarter: | | 6/30/2009 | | 18.83% |
Worst Quarter: | | 12/31/2008 | | -22.63% |
27
Average Annual Total Returns (periods ended December 31, 2010)1
| | | | | | |
| | | 1 Year | | 5 Years | | 10 Years or Inception* |
Class A (commenced operations on March 1, 2002) | | | | | | |
Return before taxes | | 8.01% | | 1.02% | | 3.47% |
Return after taxes on distributions2 | | 7.94% | | 0.61% | | 3.11% |
Return after taxes on distributions and sale of fund shares2 | | 5.30% | | 0.82% | | 2.93% |
Class B (Return before taxes only) (commenced operations on March 1, 2002) | | 8.42% | | 1.29% | | 3.51% |
Class C (Return before taxes only) (commenced operations on November 11, 2002) | | 12.43% | | 1.54% | | 6.92% |
Class I (Return before taxes only) (commenced operations on November 30, 2009) | | 14.64% | | N/A | | 16.76% |
Class R (Return before taxes only) (commenced operations on June 15, 2006) | | 13.98% | | N/A | | 1.91% |
Wilshire 5000 Total Market Index (reflects no deduction for fees, expenses, or taxes) | | 17.87% | | 3.21% | | 4.78% |
| 1 | Actual returns may depend on the investor’s individual tax situation. After-tax returns may not be relevant if the investment is made through a tax-exempt or tax-deferred account, such as a 401(k) plan. After-tax returns are presented for only one class and returns for other classes will vary. |
| 2 | The after-tax returns are calculated using the historic highest individual federal marginal income tax rates and do not reflect the impact of state and local taxes. |
| * | Fund returns are for past 10 years or since inception, whichever is less. Index returns are for 10 years or since inception of oldest share class, whichever is less. |
Management:
| | |
| Investment Adviser: | | Portfolio Construction Manager: |
| |
| Transamerica Asset Management, Inc. | | Morningstar Associates, LLC |
| |
| | Portfolio Construction Team: |
| |
| | Jon Hale, CFA, Co-Portfolio Manager since 2006 |
| |
| | Dan McNeela, CFA, Co-Portfolio Manager since 2010 |
| |
| | Hal Ratner, Co-Portfolio Manager since 2010 |
| |
| | Michael Stout, CFA, Co-Portfolio Manager since 2006 |
Purchase and Sale of Fund Shares: You may purchase, exchange or redeem shares of the fund on any day the New York Stock Exchange is open for business, online or through our website at www.transamericafunds.com, by mail to Transamerica Fund Services, Inc., P.O. Box 219945, Kansas City, MO 64121-9945, by telephone at 1-888-233-4339, or overnight mail to Transamerica Fund Services, Inc., 330 W. 9th Street, Kansas City, MO 64105. Shares may also be purchased through a financial intermediary. The minimum initial purchase for Class A and C shares is $1,000; the minimum subsequent investment is $50. The minimum initial purchase for payroll deduction and automatic investment plan is $500; the minimum subsequent investment is $50 per monthly fund account investment. The minimum investment for Class I shares is $1,000,000. Class B shares are not available for purchase, including to existing Class B shareholders, except in the limited circumstances described in this prospectus under the section entitled “Shareholder Information – Buying Shares”.
Class R shares are intended for purchase by participants in certain retirement plans such as 401(k) plans, 457 plans, employer-sponsored 403(b) plans, profit sharing and money purchase plans, defined-benefit plans and non-qualified deferred compensation plans (eligible retirement plans), and under the following conditions: Class R shares are available only when a plan’s recordkeeper or financial service firm serving as an intermediary has an agreement with Transamerica Funds, and in such eligible retirement plans where Class R shares are held on the books of the funds through omnibus or Network Level 3 accounts (either at the plan level or at the level of the financial service firm serving as an intermediary). There is no minimum investment for Class R shares.
Tax Information: Fund distributions may be taxable as ordinary income or capital gains, except when your investment is in an IRA, 401(k) or other tax-advantaged investment plan.
Payments to Broker-Dealers and Other Financial Intermediaries: If you purchase the fund through a broker-dealer or other financial intermediary, the fund and/or its affiliates may pay the intermediary for the sale of fund shares and related services. These payments may create a conflict of interest by influencing the broker-dealer or other intermediary and your salesperson to recommend the fund over another investment. Ask your salesperson or visit your financial intermediary’s website for more information.
28
|
| TRANSAMERICA ASSET ALLOCATION - MODERATE GROWTH PORTFOLIO |
Investment Objective: Seeks capital appreciation with current income as a secondary objective.
Fees and Expenses: This table describes the fees and expenses that you may pay if you buy and hold shares of the fund. You may qualify for sales charge discounts if you and your family invest, or agree to invest in the future, at least $50,000 in Transamerica Funds. More information about these and other discounts is available from your financial professional and in the “Waivers and/or Reductions of Charges” section on page 120 of the fund’s prospectus and in the fund’s statement of additional information (SAI) under the heading “Purchase of Shares.”
| | | | | | | | | | |
| Shareholder Fees (fees paid directly from your investment) |
| | | Class of Shares |
| | | A | | B* | | C | | I | | R |
| Maximum sales charge (load) imposed on purchases (as a % of offering price) | | 5.50% | | None | | None | | None | | None |
| Maximum deferred sales charge (load) (as a percentage of purchase price or redemption proceeds, whichever is lower) | | None | | 5.00% | | 1.00% | | None | | None |
| Annual Fund Operating Expenses (expenses that you pay each year as a percentage of the value of your investment) |
| | | Class of Shares |
| | | A | | B* | | C | | I | | R |
| Management fees | | 0.10% | | 0.10% | | 0.10% | | 0.10% | | 0.10% |
| Distribution and service (12b-1) fees | | 0.35% | | 1.00% | | 1.00% | | None | | 0.50% |
| Other expenses | | 0.17% | | 0.20% | | 0.15% | | 0.19% | | 0.19% |
| Acquired Fund Fees and Expenses (fees and expenses of underlying funds) | | 0.86% | | 0.86% | | 0.86% | | 0.86% | | 0.86% |
| Total annual fund operating expensesa | | 1.48% | | 2.16% | | 2.11% | | 1.15% | | 1.65% |
| * | Not available to new investors. |
| a | Fund operating expenses do not correlate to the ratios of expenses to average net assets in the financial highlights table, which do not include acquired (i.e., underlying) funds’ fees and expenses. |
Example: This Example is intended to help you compare the cost of investing in the fund with the cost of investing in other mutual funds. The Example assumes that you invest $10,000. The Example also assumes that your investment has a 5% return each year and that the fund’s operating expenses remain the same. Although your actual costs may be higher or lower, based on these assumptions your costs would be:
| | | | | | | | |
| |
| If the shares are redeemed at the end of each period: |
| Share Class | | 1 year | | 3 years | | 5 years | | 10 years |
A | | $692 | | $992 | | $1,314 | | $2,221 |
B+ | | $719 | | $976 | | $1,259 | | $2,320 |
C | | $314 | | $661 | | $1,134 | | $2,441 |
I | | $117 | | $365 | | $ 633 | | $1,398 |
R | | $168 | | $520 | | $ 897 | | $1,955 |
| If the shares are not redeemed: |
| Share Class | | 1 year | | 3 years | | 5 years | | 10 years |
A | | $692 | | $992 | | $1,314 | | $2,221 |
B+ | | $219 | | $676 | | $1,159 | | $2,320 |
C | | $214 | | $661 | | $1,134 | | $2,441 |
I | | $117 | | $365 | | $ 633 | | $1,398 |
R | | $168 | | $520 | | $ 897 | | $1,955 |
| + | Examples for Class B shares assume conversion into Class A shares eight years after purchase. Class B shares are not available to new investors. |
The Example does not reflect sales charges (loads) on reinvested dividends (and other distributions). If these sales charges (loads) were included, your costs would be higher.
Portfolio Turnover: The fund pays transaction costs, such as commissions, when it buys and sells securities (or “turns over” its portfolio). A higher portfolio turnover rate may indicate higher transaction costs and may result in higher taxes when fund shares are held in a taxable account. These costs, which are not reflected in annual fund operating expenses or in the Example, affect the fund’s performance. During the most recent fiscal year, the portfolio turnover rate was 17% of the average value of the fund’s portfolio.
29
Principal Investment Strategies: The fund seeks to achieve its investment objective by investing its assets in a broad mix of underlying Transamerica Funds (“underlying funds”).
| • | | Under normal circumstances, investments in underlying funds are expected to achieve a mix over time of approximately 70% of assets in equities, which may include both stocks and commodity-related securities, and 30% of assets in fixed-income, which may include bonds, cash, cash equivalents, and other money market instruments. These percentages may vary. |
| • | | Allocation of assets among the underlying funds is based on such things as diversification, general market outlooks, volatility in the equity markets, historical performance, current valuations, and other global economic factors. |
| • | | The fund may also invest directly in U.S. government securities and/or short-term commercial paper. |
Each underlying fund has its own investment objective, principal investment strategies and investment risks. The “Underlying Funds” section of the prospectus lists the underlying funds currently available for investment by the fund, provides a summary of their respective investment objectives and principal investment strategies, and identifies certain risks of the underlying funds.
It is not possible to predict the extent to which the fund will be invested in a particular underlying fund at any time. The fund may be a significant shareholder in certain underlying funds.
The portfolio construction manager, Morningstar Associates, LLC, may change the fund’s asset allocations and underlying funds at any time without notice to shareholders and without shareholder approval.
Under adverse or unstable market, economic or political conditions, the fund may take temporary defensive positions in cash and short-term debt securities without limit.
Principal Risks: Many factors affect the fund’s performance. There is no assurance the fund will meet its investment objective. The value of your investment in the fund, as well as the amount of return you receive on your investment, may fluctuate significantly from day to day and over time. You may lose part or all of your investment in the fund or your investment may not perform as well as other similar investments. The following is a summary of certain risks (in alphabetical order) of investing in the fund. You may lose money if you invest in this fund.
| • | | Asset Allocation – The Portfolio Construction Manager allocates the fund’s assets among various underlying funds. These allocations may be unsuccessful in maximizing the fund’s return and/or avoiding investment losses, and may cause the fund to underperform other funds with a similar strategy. |
| • | | Cash Management and Defensive Investing – Money market instruments or short-term debt securities held by the fund for cash management or defensive investing purposes can fluctuate in value. Like other fixed income securities, they are subject to risk, including market, interest rate and credit risk. If the fund holds cash uninvested, the fund will not earn income on the cash and the fund’s yield will go down. If a significant amount of the fund’s assets are used for cash management or defensive investing purposes, it will be more difficult for the fund to achieve its objective. |
| • | | Commodities – To the extent the fund invests in instruments whose performance is linked to the price of an underlying commodity or commodity index, the fund will be subject to the risks of investing in physical commodities, including regulatory, economic and political developments, weather events and natural disasters and market disruptions. The fund’s investment exposure to the commodities markets may subject the fund to greater volatility than investments in more traditional securities, such as stocks and bonds. |
| • | | Credit – If an issuer or guarantor of a security held by the fund or a counterparty to a financial contract with the fund defaults or is downgraded, or if the value of the assets underlying a security declines, the value of your investment will decline. Junk bonds have a higher risk of default and are considered speculative. A default or downgrade will have a greater impact on subordinated securities. |
| • | | Currency – When the fund invests in securities denominated in foreign currencies, the fund may incur currency conversion costs and may be affected favorably or unfavorably by changes in the rates of exchange between those currencies and the U.S. dollar. Currency exchange rates can be volatile and are affected by, among other factors, the general economics of a country, the actions of the U.S. and foreign governments or control banks, the imposition of currency controls, and speculation. |
| • | | Fixed-Income Securities – The market prices of fixed-income securities may go up or down, sometimes rapidly or unpredictably due to general market conditions, such as real or perceived adverse economic or political conditions, inflation, changes in interest rates, lack of liquidity in the bond markets or adverse investor sentiment. When market prices fall, the value of your investment will go down. A rise in rates tends to have a greater impact on the prices of longer term or duration securities. |
30
If interest rates rise, repayments of fixed-income securities may occur more slowly than anticipated by the market. This may drive the prices of these securities down because their interest rates are lower than the current interest rate and they remain outstanding longer. This is sometimes referred to as extension risk.
Many issuers have a right to prepay their securities. If interest rates fall, an issuer may exercise this right. If this happens, the fund will be forced to reinvest prepayment proceeds at a time when yields on securities available in the market are lower than the yield on the prepaid security. This is sometimes referred to as prepayment or call risk.
| • | | Foreign Securities – Foreign securities are subject to a number of additional risks, including nationalization or expropriation of assets, imposition of currency controls or restrictions, confiscatory taxation, political or financial instability and other adverse economic or political developments. Lack of information and less market regulation also may affect the value of these securities. |
| • | | Increase in Expenses – Your actual costs of investing in the fund may be higher than the expenses shown in “Annual Fund Operating Expenses” for a variety of reasons. For example, expense ratios may be higher than those shown if average net assets decrease. Net assets are more likely to decrease and fund expense ratios are more likely to increase when markets are volatile. |
| • | | Liquidity – Some securities held by the fund may be difficult to sell, or illiquid, particularly during times of market turmoil. Illiquid securities may also be difficult to value. If the fund is forced to sell an illiquid asset to meet redemption requests or other cash needs, the fund may be forced to sell at a loss. |
| • | | Market – The market prices of the fund’s securities may go up or down, sometimes rapidly or unpredictably, due to general market conditions, such as real or perceived adverse economic or political conditions, inflation, changes in interest rates or currency rates, lack of liquidity in the markets or adverse investor sentiment. Market prices of securities also may go down due to events or conditions that affect particular sectors or issuers. When market prices fall, the value of your investment will go down. The fund may experience a substantial or complete loss on any individual security. The recent financial crisis has caused a significant decline in the value and liquidity of many securities. In response to the financial crisis, the U.S. and other governments and the Federal Reserve and certain foreign central banks have taken steps to support financial markets. The withdrawal of this support could negatively affect the value and liquidity of certain securities. In addition, legislation recently enacted in the U.S. calls for changes in many aspects of financial regulation. The impact of the legislation on the markets, and the practical implications for market participants, may not be fully known for some time. |
| • | | Stocks – Stocks may be volatile – their prices may go up and down dramatically over the shorter term. These price movements may result from factors affecting individual companies, industries, the securities market as a whole or the overall economy. |
| • | | Underlying Funds – Because the fund invests its assets in various underlying funds, its ability to achieve its investment objective depends largely on the performance of the underlying funds in which it invests. Each of the underlying funds in which the fund may invest has its own investment risks, and those risks can affect the value of the underlying funds’ shares and therefore the value of the fund’s investments. There can be no assurance that the investment objective of any underlying fund will be achieved. To the extent that the fund invests more of its assets in one underlying fund than in another, the fund will have greater exposure to the risks of that underlying fund. In addition, the fund will bear a pro rata portion of the operating expenses of the underlying funds in which it invests. The “Underlying Funds” section of the fund’s prospectus identifies certain risks of each underlying fund. |
Performance: The bar chart and the table below provide some indication of the risks of investing in the fund by showing you how the fund’s performance has varied from year to year, and how the fund’s average annual total returns for different periods compare to the returns of a broad measure of market performance, as well as comparison to a secondary index which has characteristics relevant to the fund’s investment strategies. The bar chart does not reflect the impact of sales charges, which, if reflected, would lower the returns. The table, which shows average annual total returns for each class of shares of the fund, includes deduction of applicable sales charges. Absent any limitation of the fund’s expenses, total returns would be lower. As with all mutual funds, past performance (before and after taxes) is not a prediction of future results. Updated performance information is available on our website at www.transamericafunds.com or by calling 1-888-233-4339.
31
Annual Total Returns (calendar years ended December 31) – Class A
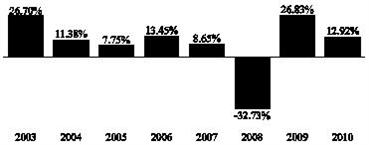
| | | | |
| | | Quarter Ended | | Return |
Best Quarter: | | 6/30/2009 | | 15.57% |
Worst Quarter: | | 12/31/2008 | | -17.63% |
Average Annual Total Returns (periods ended December 31, 2010)1
| | | | | | |
| | | 1 Year | | 5 Years | | 10 Years or Inception* |
| Class A (commenced operations on March 1, 2002) | | | | | | |
Return before taxes | | 6.73% | | 2.34% | | 4.26% |
Return after taxes on distributions2 | | 6.34% | | 1.53% | | 3.56% |
Return after taxes on distributions and sale of fund shares2 | | 4.51% | | 1.67% | | 3.38% |
| Class B (Return before taxes only) (commenced operations on March 1, 2002) | | 7.08% | | 2.61% | | 4.29% |
| Class C (Return before taxes only) (commenced operations on November 11, 2002) | | 11.16% | | 2.84% | | 7.05% |
| Class I (Return before taxes only) (commenced operations on November 30, 2009) | | 13.34% | | N/A | | 14.44% |
| Class R (Return before taxes only) (commenced operations on June 15, 2006) | | 12.75% | | N/A | | 3.30% |
| Wilshire 5000 Total Market Index (reflects no deduction for fees, expenses or taxes) | | 17.87% | | 3.21% | | 4.78% |
| Barclays Capital U.S. Aggregate Bond Index (reflects no deduction for fees, expenses or taxes) | | 6.54% | | 5.80% | | 5.44% |
| 1 | Actual returns may depend on the investor’s individual tax situation. After-tax returns may not be relevant if the investment is made through a tax-exempt or tax-deferred account, such as a 401(k) plan. After-tax returns are presented for only one class and returns for other classes will vary. |
| 2 | The after-tax returns are calculated using the historic highest individual federal marginal income tax rates and do not reflect the impact of state and local taxes. |
| * | Fund returns are for past 10 years or since inception, whichever is less. Index returns are for 10 years or since inception of oldest share class, whichever is less. |
Management:
| | |
| Investment Adviser: | | Portfolio Construction Manager: |
| |
| Transamerica Asset Management, Inc. | | Morningstar Associates, LLC |
| |
| | Portfolio Construction Team: |
| |
| | Jon Hale, CFA, Co-Portfolio Manager since 2006 |
| |
| | Dan McNeela, CFA, Co-Portfolio Manager since 2010 |
| |
| | Hal Ratner, Co-Portfolio Manager since 2010 |
| |
| | Michael Stout, CFA, Co-Portfolio Manager since 2006 |
Purchase and Sale of Fund Shares: You may purchase, exchange or redeem shares of the fund on any day the New York Stock Exchange is open for business, online or through our website at www.transamericafunds.com, by mail to Transamerica Fund Services, Inc., P.O. Box 219945, Kansas City, MO 64121-9945, by telephone at 1-888-233-4339, or overnight mail to Transamerica Fund Services, Inc., 330 W. 9th Street, Kansas City, MO 64105. Shares may also be purchased through a financial intermediary. The minimum initial purchase for Class A and C shares is $1,000; the minimum subsequent investment is $50. The minimum initial purchase for payroll deduction and automatic investment plan is $500; the minimum subsequent investment is $50 per monthly fund account investment. The minimum investment for Class I shares is $1,000,000. Class B shares are not available for purchase, including to existing Class B shareholders, except in the limited circumstances described in this prospectus under the section entitled “Shareholder Information – Buying Shares”.
32
Class R shares are intended for purchase by participants in certain retirement plans such as 401(k) plans, 457 plans, employer-sponsored 403(b) plans, profit sharing and money purchase plans, defined-benefit plans and non-qualified deferred compensation plans (eligible retirement plans), and under the following conditions: Class R shares are available only when a plan’s recordkeeper or financial service firm serving as an intermediary has an agreement with Transamerica Funds, and in such eligible retirement plans where Class R shares are held on the books of the funds through omnibus or Network Level 3 accounts (either at the plan level or at the level of the financial service firm serving as an intermediary). There is no minimum investment for Class R shares.
Tax Information: Fund distributions may be taxable as ordinary income or capital gains, except when your investment is in an IRA, 401(k) or other tax-advantaged investment plan.
Payments to Broker-Dealers and Other Financial Intermediaries: If you purchase the fund through a broker-dealer or other financial intermediary, the fund and/or its affiliates may pay the intermediary for the sale of fund shares and related services. These payments may create a conflict of interest by influencing the broker-dealer or other intermediary and your salesperson to recommend the fund over another investment. Ask your salesperson or visit your financial intermediary’s website for more information.
33
|
| TRANSAMERICA ASSET ALLOCATION - MODERATE PORTFOLIO |
Investment Objective: Seeks capital appreciation and current income.
Fees and Expenses: This table describes the fees and expenses that you may pay if you buy and hold shares of the fund. You may qualify for sales charge discounts if you and your family invest, or agree to invest in the future, at least $50,000 in Transamerica Funds. More information about these and other discounts is available from your financial professional and in the “Waivers and/or Reductions of Charges” section on page 120 of the fund’s prospectus and in the fund’s statement of additional information (SAI) under the heading “Purchase of Shares.”
| | | | | | | | | | |
Shareholder Fees (fees paid directly from your investment) |
| | | | | Class of Shares | | |
| | | A | | B* | | C | | I | | R |
| Maximum sales charge (load) imposed on purchases (as a % of offering price) | | 5.50% | | None | | None | | None | | None |
| Maximum deferred sales charge (load) (as a percentage of purchase price or redemption proceeds, whichever is lower) | | None | | 5.00% | | 1.00% | | None | | None |
Annual Fund Operating Expenses (expenses that you pay each year as a percentage of the value of your investment) |
| | | | | Class of Shares | | |
| | | A | | B* | | C | | I | | R |
Management fees | | 0.10% | | 0.10% | | 0.10% | | 0.10% | | 0.10% |
Distribution and service (12b-1) fees | | 0.35% | | 1.00% | | 1.00% | | None | | 0.50% |
Other expenses | | 0.16% | | 0.18% | | 0.12% | | 0.18% | | 0.23% |
| Acquired Fund Fees and Expenses (fees and expenses of underlying funds) | | 0.82% | | 0.82% | | 0.82% | | 0.82% | | 0.82% |
Total annual fund operating expensesa | | 1.43% | | 2.10% | | 2.04% | | 1.10% | | 1.65% |
| * | Not available to new investors. |
| a | Fund operating expenses do not correlate to the ratios of expenses to average net assets in the financial highlights table, which do not include acquired (i.e., underlying) funds’ fees and expenses. |
Example: This Example is intended to help you compare the cost of investing in the fund with the cost of investing in other mutual funds. The Example assumes that you invest $10,000. The Example also assumes that your investment has a 5% return each year and that the fund’s operating expenses remain the same. Although your actual costs may be higher or lower, based on these assumptions your costs would be:
| | | | | | | | |
If the shares are redeemed at the end of each period: |
Share Class | | 1 year | | 3 years | | 5 years | | 10 years |
A | | $688 | | $978 | | $1,289 | | $2,169 |
B+ | | $713 | | $958 | | $1,229 | | $2,260 |
C | | $307 | | $640 | | $1,098 | | $2,369 |
I | | $112 | | $350 | | $ 606 | | $1,340 |
R | | $168 | | $520 | | $ 897 | | $1,955 |
If the shares are not redeemed: | | | | |
Share Class | | 1 year | | 3 years | | 5 years | | 10 years |
A | | $688 | | $978 | | $1,289 | | $2,169 |
B+ | | $213 | | $658 | | $1,129 | | $2,260 |
C | | $207 | | $640 | | $1,098 | | $2,369 |
I | | $112 | | $350 | | $ 606 | | $1,340 |
R | | $168 | | $520 | | $ 897 | | $1,955 |
| + | Examples for Class B shares assume conversion into Class A shares eight years after purchase. Class B shares are not available to new investors. |
The Example does not reflect sales charges (loads) on reinvested dividends (and other distributions). If these sales charges (loads) were included, your costs would be higher.
Portfolio Turnover: The fund pays transaction costs, such as commissions, when it buys and sells securities (or “turns over” its portfolio). A higher portfolio turnover rate may indicate higher transaction costs and may result in higher taxes when fund shares are held in a taxable account. These costs, which are not reflected in annual fund operating expenses or in the Example, affect the fund’s performance. During the most recent fiscal year, the portfolio turnover rate was 16% of the average value of the fund’s portfolio.
34
Principal Investment Strategies: The fund seeks to achieve its investment objective by investing its assets in a broad mix of underlying Transamerica Funds (“underlying funds”).
| • | | Under normal circumstances, investments in underlying funds are expected to achieve a mix over time of approximately 50% of assets in equities, which may include both stocks and commodity-related securities, and 50% of assets in fixed-income, which may include bonds, cash, cash equivalents, and other money market instruments. These percentages may vary. |
| • | | Allocation of assets among the underlying funds is based on such things as diversification, general market outlooks, historical performance, current valuations, and other global economic factors. |
| • | | The fund may also invest directly in U.S. government securities and/or short-term commercial paper. |
Each underlying fund has its own investment objective, principal investment strategies and investment risks. The “Underlying Funds” section of the prospectus lists the underlying funds currently available for investment by the fund, provides a summary of their respective investment objectives and principal investment strategies, and identifies certain risks of the underlying funds.
It is not possible to predict the extent to which the fund will be invested in a particular underlying fund at any time. The fund may be a significant shareholder in certain underlying funds.
The portfolio construction manager, Morningstar Associates, LLC, may change the fund’s asset allocations and underlying funds at any time without notice to shareholders and without shareholder approval.
Under adverse or unstable market, economic or political conditions, the fund may take temporary defensive positions in cash and short-term debt securities without limit.
Principal Risks: Many factors affect the fund’s performance. There is no assurance the fund will meet its investment objective. The value of your investment in the fund, as well as the amount of return you receive on your investment, may fluctuate significantly from day to day and over time. You may lose part or all of your investment in the fund or your investment may not perform as well as other similar investments. The following is a summary of certain risks (in alphabetical order) of investing in the fund. You may lose money if you invest in this fund.
| • | | Asset Allocation – The Portfolio Construction Manager allocates the fund’s assets among various underlying funds. These allocations may be unsuccessful in maximizing the fund’s return and/or avoiding investment losses, and may cause the fund to underperform other funds with a similar strategy. |
| • | | Cash Management and Defensive Investing – Money market instruments or short-term debt securities held by the fund for cash management or defensive investing purposes can fluctuate in value. Like other fixed income securities, they are subject to risk, including market, interest rate and credit risk. If the fund holds cash uninvested, the fund will not earn income on the cash and the fund’s yield will go down. If a significant amount of the fund’s assets are used for cash management or defensive investing purposes, it will be more difficult for the fund to achieve its objective. |
| • | | Commodities – To the extent the fund invests in instruments whose performance is linked to the price of an underlying commodity or commodity index, the fund will be subject to the risks of investing in physical commodities, including regulatory, economic and political developments, weather events and natural disasters and market disruptions. The fund’s investment exposure to the commodities markets may subject the fund to greater volatility than investments in more traditional securities, such as stocks and bonds. |
| • | | Credit – If an issuer or guarantor of a security held by the fund or a counterparty to a financial contract with the fund defaults or is downgraded, or if the value of the assets underlying a security declines, the value of your investment will decline. Junk bonds have a higher risk of default and are considered speculative. A default or downgrade will have a greater impact on subordinated securities. |
| • | | Currency – When the fund invests in securities denominated in foreign currencies, the fund may incur currency conversion costs and may be affected favorably or unfavorably by changes in the rates of exchange between those currencies and the U.S. dollar. Currency exchange rates can be volatile and are affected by, among other factors, the general economics of a country, the actions of the U.S. and foreign governments or control banks, the imposition of currency controls, and speculation. |
| • | | Fixed-Income Securities – The market prices of fixed-income securities may go up or down, sometimes rapidly or unpredictably due to general market conditions, such as real or perceived adverse economic or political conditions, inflation, changes in interest rates, lack of liquidity in the bond markets or adverse investor sentiment. When market prices fall, the value of your investment will go down. A rise in rates tends to have a greater impact on the prices of longer term or duration securities. |
35
If interest rates rise, repayments of fixed-income securities may occur more slowly than anticipated by the market. This may drive the prices of these securities down because their interest rates are lower than the current interest rate and they remain outstanding longer. This is sometimes referred to as extension risk.
Many issuers have a right to prepay their securities. If interest rates fall, an issuer may exercise this right. If this happens, the fund will be forced to reinvest prepayment proceeds at a time when yields on securities available in the market are lower than the yield on the prepaid security. This is sometimes referred to as prepayment or call risk.
| • | | Foreign Securities – Foreign securities are subject to a number of additional risks, including nationalization or expropriation of assets, imposition of currency controls or restrictions, confiscatory taxation, political or financial instability and other adverse economic or political developments. Lack of information and less market regulation also may affect the value of these securities. |
| • | | Increase in Expenses – Your actual costs of investing in the fund may be higher than the expenses shown in “Annual Fund Operating Expenses” for a variety of reasons. For example, expense ratios may be higher than those shown if average net assets decrease. Net assets are more likely to decrease and fund expense ratios are more likely to increase when markets are volatile. |
| • | | Liquidity – Some securities held by the fund may be difficult to sell, or illiquid, particularly during times of market turmoil. Illiquid securities may also be difficult to value. If the fund is forced to sell an illiquid asset to meet redemption requests or other cash needs, the fund may be forced to sell at a loss. |
| • | | Market – The market prices of the fund’s securities may go up or down, sometimes rapidly or unpredictably, due to general market conditions, such as real or perceived adverse economic or political conditions, inflation, changes in interest rates or currency rates, lack of liquidity in the markets or adverse investor sentiment. Market prices of securities also may go down due to events or conditions that affect particular sectors or issuers. When market prices fall, the value of your investment will go down. The fund may experience a substantial or complete loss on any individual security. The recent financial crisis has caused a significant decline in the value and liquidity of many securities. In response to the financial crisis, the U.S. and other governments and the Federal Reserve and certain foreign central banks have taken steps to support financial markets. The withdrawal of this support could negatively affect the value and liquidity of certain securities. In addition, legislation recently enacted in the U.S. calls for changes in many aspects of financial regulation. The impact of the legislation on the markets, and the practical implications for market participants, may not be fully known for some time. |
| • | | Stocks – Stocks may be volatile – their prices may go up and down dramatically over the shorter term. These price movements may result from factors affecting individual companies, industries, the securities market as a whole or the overall economy. |
| • | | Underlying Funds – Because the fund invests its assets in various underlying funds, its ability to achieve its investment objective depends largely on the performance of the underlying funds in which it invests. Each of the underlying funds in which the fund may invest has its own investment risks, and those risks can affect the value of the underlying funds’ shares and therefore the value of the fund’s investments. There can be no assurance that the investment objective of any underlying fund will be achieved. To the extent that the fund invests more of its assets in one underlying fund than in another, the fund will have greater exposure to the risks of that underlying fund. In addition, the fund will bear a pro rata portion of the operating expenses of the underlying funds in which it invests. The “Underlying Funds” section of the fund’s prospectus identifies certain risks of each underlying fund. |
Performance: The bar chart and the table below provide some indication of the risks of investing in the fund by showing you how the fund’s performance has varied from year to year, and how the fund’s average annual total returns for different periods compare to the returns of a broad measure of market performance, as well as comparison to a secondary index which has characteristics relevant to the fund’s investment strategies. The bar chart does not reflect the impact of sales charges, which, if reflected, would lower the returns. The table, which shows average annual total returns for each class of shares of the fund, includes deduction of applicable sales charges. Absent any limitation of the fund’s expenses, total returns would be lower. As with all mutual funds, past performance (before and after taxes) is not a prediction of future results. Updated performance information is available on our website at www.transamericafunds.com or by calling 1-888-233-4339.
36
Annual Total Returns (calendar years ended December 31) – Class A
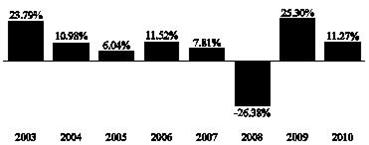
| | | | |
| | | Quarter Ended | | Return |
| Best Quarter: | | 6/30/2009 | | 13.29% |
| Worst Quarter: | | 12/31/2008 | | -13.46% |
Average Annual Total Returns (periods ended December 31, 2010)1
| | | | | | |
| | | 1 Year | | 5 Years | | 10 Years or
Inception* |
| Class A (commenced operations on March 1, 2002) |
Return before taxes | | 5.17% | | 3.12% | | 4.76% |
Return after taxes on distributions2 | | 4.52% | | 1.99% | | 3.76% |
Return after taxes on distributions and sale of fund shares2 | | 3.43% | | 2.13% | | 3.62% |
| Class B (Return before taxes only) (commenced operations on March 1, 2002) | | 5.58% | | 3.42% | | 4.81% |
| Class C (Return before taxes only) (commenced operations on November 11, 2002) | | 9.54% | | 3.65% | | 6.99% |
| Class I (Return before taxes only) (commenced operations on November 30, 2009) | | 11.65% | | N/A | | 12.12% |
| Class R (Return before taxes only) (commenced operations on June 15, 2006) | | 11.00% | | N/A | | 4.18% |
| Wilshire 5000 Total Market Index (reflects no deduction for fees, expenses or taxes) | | 17.87% | | 3.21% | | 4.78% |
| Barclays Capital U.S. Aggregate Bond Index (reflects no deduction for fees, expenses or taxes) | | 6.54% | | 5.80% | | 5.44% |
| 1 | Actual returns may depend on the investor’s individual tax situation. After-tax returns may not be relevant if the investment is made through a tax-exempt or tax-deferred account, such as a 401(k) plan. After-tax returns are presented for only one class and returns for other classes will vary. |
| 2 | The after-tax returns are calculated using the historic highest individual federal marginal income tax rates and do not reflect the impact of state and local taxes. |
| * | Fund returns are for past 10 years or since inception, whichever is less. Index returns are for 10 years or since inception of oldest share class, whichever is less. |
Management:
| | |
| Investment Adviser: | | Portfolio Construction Manager: |
| |
| Transamerica Asset Management, Inc. | | Morningstar Associates, LLC |
| |
| | Portfolio Construction Team: |
| |
| | Jon Hale, CFA, Co-Portfolio Manager since 2006 |
| |
| | Dan McNeela, CFA, Co-Portfolio Manager since 2010 |
| |
| | Hal Ratner, Co-Portfolio Manager since 2010 |
| |
| | Michael Stout, CFA, Co-Portfolio Manager since 2006 |
Purchase and Sale of Fund Shares: You may purchase, exchange or redeem shares of the fund on any day the New York Stock Exchange is open for business, online or through our website at www.transamericafunds.com, by mail to Transamerica Fund Services, Inc., P.O. Box 219945, Kansas City, MO 64121-9945, by telephone at 1-888-233-4339, or overnight mail to Transamerica Fund Services, Inc., 330 W. 9th Street, Kansas City, MO 64105. Shares may also be purchased through a financial intermediary. The minimum initial purchase for Class A and C shares is $1,000; the minimum subsequent investment is $50. The minimum initial purchase for payroll deduction and automatic investment plan is $500; the minimum subsequent investment is $50 per monthly fund account investment. The minimum investment for Class I shares is $1,000,000. Class B
37
shares are not available for purchase, including to existing Class B shareholders, except in the limited circumstances described in this prospectus under the section entitled “Shareholder Information – Buying Shares”.
Class R shares are intended for purchase by participants in certain retirement plans such as 401(k) plans, 457 plans, employer-sponsored 403(b) plans, profit sharing and money purchase plans, defined-benefit plans and non-qualified deferred compensation plans (eligible retirement plans), and under the following conditions: Class R shares are available only when a plan’s recordkeeper or financial service firm serving as an intermediary has an agreement with Transamerica Funds, and in such eligible retirement plans where Class R shares are held on the books of the funds through omnibus or Network Level 3 accounts (either at the plan level or at the level of the financial service firm serving as an intermediary). There is no minimum investment for Class R shares.
Tax Information: Fund distributions may be taxable as ordinary income or capital gains, except when your investment is in an IRA, 401(k) or other tax-advantaged investment plan.
Payments to Broker-Dealers and Other Financial Intermediaries: If you purchase the fund through a broker-dealer or other financial intermediary, the fund and/or its affiliates may pay the intermediary for the sale of fund shares and related services. These payments may create a conflict of interest by influencing the broker-dealer or other intermediary and your salesperson to recommend the fund over another investment. Ask your salesperson or visit your financial intermediary’s website for more information.
38
|
| TRANSAMERICA MORGAN STANLEY CAPITAL GROWTH |
Investment Objective: Seeks to maximize long-term growth.
Fees and Expenses: This table describes the fees and expenses that you may pay if you buy and hold shares of the fund. You may qualify for sales charge discounts if you and your family invest, or agree to invest in the future, at least $50,000 in Transamerica Funds. More information about these and other discounts is available from your financial professional and in the “Waivers and/or Reductions of Charges” section on page 120 of the fund’s prospectus and in the fund’s statement of additional information (SAI) under the heading “Purchase of Shares.”
| | | | | | | | |
| Shareholder Fees (fees paid directly from your investment) |
| | | Class of Shares |
| | | A | | B* | | C | | I |
Maximum sales charge (load) imposed on purchases (as a % of offering price) | | 5.50% | | None | | None | | None |
| Maximum deferred sales charge (load) (as a percentage of purchase price or redemption proceeds, whichever is lower) | | None | | 5.00% | | 1.00% | | None |
| Annual Fund Operating Expenses (expenses that you pay each year as a percentage of the value of your investment) |
| | | Class of Shares |
| | | A | | B* | | C | | I |
Management fees | | 0.80% | | 0.80% | | 0.80% | | 0.80% |
Distribution and service (12b-1) fees | | 0.35% | | 1.00% | | 1.00% | | None |
Other expenses | | 0.63% | | 0.71% | | 0.46% | | 1.05% |
Total annual fund operating expenses | | 1.78% | | 2.51% | | 2.26% | | 1.85% |
Expense reductiona | | 0.23% | | 0.31% | | 0.06% | | 0.65% |
Total annual fund operating expenses after expense reduction | | 1.55% | | 2.20% | | 2.20% | | 1.20% |
| * | Not available to new investors. |
| a | Contractual arrangements have been made with the fund’s investment adviser, Transamerica Asset Management, Inc. (“TAM”), through March 1, 2012, to waive fees and/or reimburse fund expenses to the extent that the fund’s total operating expenses exceed 1.20%, excluding 12b-1 fees and extraordinary expenses. TAM is entitled to reimbursement by the fund of fees waived or expenses reduced during any of the previous 36 months if on any day the estimated annualized fund operating expenses are less than the cap, excluding 12b-1 fees and extraordinary expenses. The fund may not recapture any fees waived and/or reimbursed prior to March 1, 2008. |
Example: This Example is intended to help you compare the cost of investing in the fund with the cost of investing in other mutual funds. The Example assumes that you invest $10,000. The Example also assumes that your investment has a 5% return each year and that the fund’s operating expenses remain the same. Although your actual costs may be higher or lower, based on these assumptions your costs would be:
| | | | | | | | |
If the shares are redeemed at the end of each period: |
| Share Class | | 1 year | | 3 years | | 5 years | | 10 years |
A | | $699 | | $1,058 | | $1,441 | | $2,511 |
B+ | | $723 | | $1,052 | | $1,408 | | $2,643 |
C | | $323 | | $ 701 | | $1,205 | | $2,590 |
I | | $122 | | $ 519 | | $ 940 | | $2,116 |
| If the shares are not redeemed: | | | | | | |
| Share Class | | 1 year | | 3 years | | 5 years | | 10 years |
A | | $699 | | $1,058 | | $1,441 | | $2,511 |
B+ | | $223 | | $ 752 | | $1,308 | | $2,643 |
C | | $223 | | $ 701 | | $1,205 | | $2,590 |
I | | $122 | | $ 519 | | $ 940 | | $2,116 |
| + | Examples for Class B shares assume conversion into Class A shares eight years after purchase. Class B shares are not available to new investors. |
The Example does not reflect sales charges (loads) on reinvested dividends (and other distributions). If these sales charges (loads) were included, your costs would be higher.
Portfolio Turnover: The fund pays transaction costs, such as commissions, when it buys and sells securities (or “turns over” its portfolio). A higher portfolio turnover rate may indicate higher transaction costs and may result in higher taxes when fund shares are held in a taxable account. These costs, which are not reflected in annual fund operating expenses or in the Example, affect the fund performance. During the most recent fiscal year, the portfolio turnover rate was 57% of the average value of the predecessor fund’s portfolio.
39
Principal Investment Strategies: The fund’s sub-adviser, Morgan Stanley Investment Management Inc. (“MSIM”), under normal circumstances, seeks long-term capital growth by investing primarily in established and emerging companies with capitalizations within the range of companies included in the Russell 1000® Growth Index. The median market capitalization of companies represented in the index was $5.9 billion as of December 31, 2010. Under normal market conditions, MSIM generally intends to focus on companies with market capitalization of $10 billion or more.
The fund may purchase and sell certain derivative instruments, such as options, futures contracts and options on futures contracts, for various portfolio management purposes, including to earn income, facilitate portfolio management and mitigate risks. In determining compliance with any percentage limitation or requirement regarding the use or investment of fund assets, the fund will take into account derivative or synthetic instruments or other positions that, in the judgment of MSIM, have economic characteristics similar to the applicable category of investments.
The fund may invest up to 10% of its total assets in real estate investment trusts (“REITs”).
The fund may invest up to 25% of its total assets in securities of foreign issuers, including issuers located in emerging market or developing countries. MSIM considers an issuer to be from a particular country if (i) its principal securities trading market is in that country; (ii) alone or on a consolidated basis it derives 50% or more of its annual revenue from goods produced, sales made or services performed in that country; or (iii) it is organized under the laws of, or has a principal office in that country. By applying these tests, it is possible that a particular company could be deemed to be from more than one country. The securities in which the fund may invest may be denominated in U.S. dollars or in currencies other than U.S. dollars. The fund may invest in privately placed securities.
The sub-adviser seeks to invest in high quality companies it believes have sustainable competitive advantages and the ability to redeploy capital at high rates of return. The sub-adviser typically favors companies with rising returns on invested capital, above average business visibility, strong free cash flow generation and an attractive risk/reward profile. The sub-adviser generally considers selling an investment when it determines the company no longer satisfies its investment criteria.
The fund may invest in cash, cash equivalent securities or short-term debt securities, repurchase agreements and money market instruments. Under adverse or unstable market, economic or political conditions, the fund may take temporary defensive positions in cash and short-term debt securities without limit.
Principal Risks: Many factors affect the fund’s performance. There is no assurance the fund will meet its investment objective. The value of your investment in the fund, as well as the amount of return you receive on your investment, may fluctuate significantly from day to day and over time. You may lose part or all of your investment in the fund or your investment may not perform as well as other similar investments. The following is a summary of certain risks (in alphabetical order) of investing in the fund. You may lose money if you invest in this fund.
| • | | Cash Management and Defensive Investing – Money market instruments or short-term debt securities held by the fund for cash management or defensive investing purposes can fluctuate in value. Like other fixed income securities, they are subject to risk, including market, interest rate and credit risk. If the fund holds cash uninvested, the fund will not earn income on the cash and the fund’s yield will go down. If a significant amount of the fund’s assets are used for cash management or defensive investing purposes, it will be more difficult for the fund to achieve its objective. |
| • | | Currency – When the fund invests in securities denominated in foreign currencies, the fund may incur currency conversion costs and may be affected favorably or unfavorably by changes in the rates of exchange between those currencies and the U.S. dollar. Currency exchange rates can be volatile and are affected by, among other factors, the general economics of a country, the actions of the U.S. and foreign governments or control banks, the imposition of currency controls, and speculation. |
| • | | Derivatives – Using derivatives can increase fund losses and reduce opportunities for gains when market prices, interest rates or the derivative instruments themselves behave in a way not anticipated by the fund. Using derivatives also can have a leveraging effect and increase fund volatility. Derivatives may be difficult to sell, unwind or value, and the counterparty may default on its obligations to the fund. The fund’s investments in derivative instruments may involve a small investment relative to the amount of investment exposure assumed and may result in losses exceeding the amounts invested in those instruments. Recent legislation calls for new regulation of the derivatives markets. The extent and impact of the regulation are not yet fully known and may not be for some time. New regulation of derivatives may make them more costly, may limit their availability, or may otherwise adversely affect their value or performance. |
| • | | Emerging Markets – Investing in the securities of issuers located in or principally doing business in emerging markets are subject to foreign securities risks. These risks are greater for investments in emerging markets. Emerging market countries tend to have economic, political and legal systems that are less fully developed and are less stable than those of more advanced countries. Low trading volumes may result in a lack of liquidity and in extreme price volatility. |
40
| • | | Foreign Securities – Foreign securities are subject to a number of additional risks, including nationalization or expropriation of assets, imposition of currency controls or restrictions, confiscatory taxation, political or financial instability and other adverse economic or political developments. Lack of information and less market regulation also may affect the value of these securities. |
| • | | Growth Stocks – Returns on growth stocks may not move in tandem with returns on other categories of stocks or the market as a whole. Growth stocks may be particularly susceptible to rapid price swings or to adverse developments. Growth stocks as a group may be out of favor and underperform the overall equity market for a long period of time, for example, while the market favors “value” stocks. |
| • | | Increase in Expenses – Your actual costs of investing in the fund may be higher than the expenses shown in “Annual Fund Operating Expenses” for a variety of reasons. For example, expense ratios may be higher than those shown if average net assets decrease. Net assets are more likely to decrease and fund expense ratios are more likely to increase when markets are volatile. |
| • | | Market – The market prices of the fund’s securities may go up or down, sometimes rapidly or unpredictably, due to general market conditions, such as real or perceived adverse economic or political conditions, inflation, changes in interest rates or currency rates, lack of liquidity in the markets or adverse investor sentiment. Market prices of securities also may go down due to events or conditions that affect particular sectors or issuers. When market prices fall, the value of your investment will go down. The fund may experience a substantial or complete loss on any individual security. The recent financial crisis has caused a significant decline in the value and liquidity of many securities. In response to the financial crisis, the U.S. and other governments and the Federal Reserve and certain foreign central banks have taken steps to support financial markets. The withdrawal of this support could negatively affect the value and liquidity of certain securities. In addition, legislation recently enacted in the U.S. calls for changes in many aspects of financial regulation. The impact of the legislation on the markets, and the practical implications for market participants, may not be fully known for some time. |
| • | | Portfolio Selection – The sub-adviser’s judgment about a particular security or issuer, or about the economy or a particular sector, region or market segment, or about an investment strategy, may prove to be incorrect. |
| • | | REITs – When the fund invests in Real Estate Investment Trusts (“REITs”), it is subject to risks generally associated with investing in real estate. A REIT’s performance depends on the types and locations of the properties it owns and how well it manages those properties or loan financings. REITs are subject to a highly technical tax structure; and the failure to qualify as a REIT could result in corporate-level taxation, significantly reducing the return on an investment to the fund. |
| • | | Rule 144A and Privately Placed Securities – Rule 144A permits certain qualified institutional buyers, such as the fund, to trade in privately placed securities that have not been registered for sale to the public. Rule 144A and other privately placed securities may be deemed illiquid, and the fund might be unable to dispose of such securities promptly or at reasonable prices. |
| • | | Stocks – Stocks may be volatile – their prices may go up and down dramatically over the shorter term. These price movements may result from factors affecting individual companies, industries, the securities market as a whole or the overall economy. |
Performance: The bar chart and the table below provide some indication of the risks of investing in the fund by showing you how the fund’s performance has varied from year to year, and how the fund’s average annual total returns for different periods compare to the returns of a broad measure of market performance. The bar chart does not reflect the impact of sales charges, which, if reflected, would lower the returns. The table, which shows average annual total returns for each class of shares of the fund, includes deduction of applicable sales charges. Absent any limitation of the fund’s expenses, total returns would be lower. As with all mutual funds, past performance (before and after taxes) is not a prediction of future results. Updated performance information is available on our website at www.transamericafunds.com or by calling 1-888-233-4339.
The fund acquired the assets and assumed the liabilities of Transamerica Premier Focus Fund (the “predecessor fund”) on November 13, 2009, and the predecessor fund was the accounting and performance survivor of the reorganization. This means that the predecessor fund’s performance and financial history were adopted by the fund. The performance shown in the bar chart for Class A shares prior to the reorganization is the performance of the predecessor fund restated to reflect the current expenses of Class A shares of the fund.
Prior to March 22, 2011, the fund was named Transamerica Focus, had a different sub-adviser and used different investment strategies. The performance set forth prior to that date is attributable to the previous sub-adviser.
41
Annual Total Returns (calendar years ended December 31) – Class A
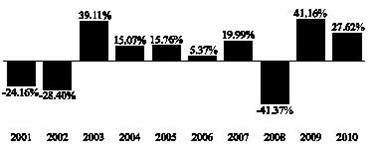
| | | | |
| | | Quarter Ended | | Return |
| Best Quarter: | | 9/30/2010 | | 20.04% |
| Worst Quarter: | | 9/30/2001 | | -24.36% |
Average Annual Total Returns (periods ended December 31, 2010)1
| | | | |
| | 1 Year | | 10 Years or
Inception** |
| Class A (commenced operations on March 1, 1999)* | | | | |
Return before taxes | | 20.60% | | 20.26% |
Return after taxes on distributions2 | | 20.60% | | 20.24% |
Return after taxes on distributions and sale of fund shares2 | | 13.39% | | 17.25% |
| Class B (Return before taxes only) (commenced operations on March 1, 1999)* | | 21.83% | | 22.23% |
| Class C (Return before taxes only) (commenced operations on November 11, 2002)* | | 25.77% | | 25.61% |
| Class I (Return before taxes only) (commenced operations on November 30, 2009) | | 28.06% | | 30.14% |
| Russell 1000® Growth Index (reflects no deduction for fees, expenses, or taxes) | | 16.71% | | 18.46% |
| Standard & Poor’s 500® Index (reflects no deduction for fees, expenses, or taxes)3 | | 15.06% | | 16.00% |
| 1 | Actual returns may depend on the investor’s individual tax situation. After-tax returns may not be relevant if the investment is made through a tax-exempt or tax-deferred account, such as a 401(k) plan. After-tax returns are presented for only one class and returns for other classes will vary. |
| 2 | The after-tax returns are calculated using the historic highest individual federal marginal income tax rates and do not reflect the impact of state and local taxes. |
| 3 | This index served as the benchmark for the fund prior to March 22, 2011, at which time it was replaced with the Russell 1000® Growth Index. This benchmark index change was made to more accurately reflect the principal strategies of the fund. |
| * | Performance information is shown for one year and from the date of the reorganization (November 13, 2009). The predecessor fund, whose accounting and performance history were adopted in the reorganization, did not issue Class A, Class B or Class C shares. |
| ** | Fund returns are for past 10 years or since inception, whichever is less. Index returns are for 10 years or since inception of oldest share class, whichever is less. |
Management:
| | |
| Investment Adviser: | | Sub-Adviser: |
| |
| Transamerica Asset Management, Inc. | | Morgan Stanley Investment Management Inc. |
| |
| | Portfolio Managers: |
| |
| | Dennis P. Lynch, Lead Portfolio Manager since 2011 |
| |
| | David S. Cohen, Portfolio Manager since 2011 |
| |
| | Sam G. Chainani, Portfolio Manager since 2011 |
| |
| | Alexander T. Norton, Portfolio Manager since 2011 |
| |
| | Jason C. Yeung, Portfolio Manager since 2011 |
| |
| | Armistead B. Nash, Portfolio Manager since 2011 |
Purchase and Sale of Fund Shares: You may purchase, exchange or redeem shares of the fund on any day the New York Stock Exchange is open for business, online or through our website at www.transamericafunds.com, by mail to Transamerica Fund Services, Inc., P.O. Box 219945, Kansas City, MO 64121-9945, by telephone at 1-888-233-4339, or overnight mail to Transamerica Fund Services, Inc., 330 W. 9th Street, Kansas City, MO 64105. Shares may also be purchased through a financial intermediary. The minimum initial purchase for Class A and C shares is $1,000; the minimum subsequent investment is $50. The minimum initial purchase for payroll deduction and automatic investment plan is $500; the minimum subsequent
42
investment is $50 per monthly fund account investment. The minimum investment for Class I shares is $1,000,000. Class B shares are not available for purchase, including to existing Class B shareholders, except in the limited circumstances described in this prospectus under the section entitled “Shareholder Information – Buying Shares”.
Tax Information: Fund distributions may be taxable as ordinary income or capital gains, except when your investment is in an IRA, 401(k) or other tax-advantaged investment plan.
Payments to Broker-Dealers and Other Financial Intermediaries: If you purchase the fund through a broker-dealer or other financial intermediary, the fund and/or its affiliates may pay the intermediary for the sale of fund shares and related services. These payments may create a conflict of interest by influencing the broker-dealer or other intermediary and your salesperson to recommend the fund over another investment. Ask your salesperson or visit your financial intermediary’s website for more information.
43
|
| TRANSAMERICA MORGAN STANLEY GROWTH OPPORTUNITIES |
Investment Objective: Seeks capital appreciation.
Fees and Expenses: This table describes the fees and expenses that you may pay if you buy and hold shares of the fund. You may qualify for sales charge discounts if you and your family invest, or agree to invest in the future, at least $50,000 in Transamerica Funds. More information about these and other discounts is available from your financial professional and in the “Waivers and/or Reductions of Charges” section on page 120 of the fund’s prospectus and in the fund’s statement of additional information (SAI) under the heading “Purchase of Shares.”
| | | | | | | | |
Shareholder Fees (fees paid directly from your investment) |
| | | Class of Shares |
| | | A | | B* | | C | | I |
Maximum sales charge (load) imposed on purchases (as a % of offering price) | | 5.50% | | None | | None | | None |
Maximum deferred sales charge (load) (as a percentage of purchase price or redemption proceeds, whichever is lower) | | None | | 5.00% | | 1.00% | | None |
| Annual Fund Operating Expenses (expenses that you pay each year as a percentage of the value of your investment) |
| | | Class of Shares |
| | | A | | B* | | C | | I |
Management fees | | 0.79% | | 0.79% | | 0.79% | | 0.79% |
Distribution and service (12b-1) fees | | 0.35% | | 1.00% | | 1.00% | | None |
Other expenses | | 0.84% | | 0.62% | | 0.62% | | 0.69% |
Total annual fund operating expenses | | 1.98% | | 2.41% | | 2.41% | | 1.48% |
Expense reductiona | | 0.23% | | 0.01% | | 0.01% | | 0.08% |
Total annual fund operating expenses after expense reduction | | 1.75% | | 2.40% | | 2.40% | | 1.40% |
| * | Not available to new investors. |
| a | Contractual arrangements have been made with the fund’s investment adviser, Transamerica Asset Management, Inc. (“TAM”), through March 1, 2012, to waive fees and/or reimburse fund expenses to the extent that the fund’s total operating expenses exceed 1.40%, excluding 12b-1 fees and extraordinary expenses. TAM is entitled to reimbursement by the fund of fees waived or expenses reduced during any of the previous 36 months if on any day the estimated annualized fund operating expenses are less than the cap, excluding 12b-1 fees and extraordinary expenses. The fund may not recapture any fees waived and/or reimbursed prior to March 1, 2008. |
Example: This Example is intended to help you compare the cost of investing in the fund with the cost of investing in other mutual funds. The Example assumes that you invest $10,000. The Example also assumes that your investment has a 5% return each year and that the fund’s operating expenses remain the same. Although your actual costs may be higher or lower, based on these assumptions your costs would be:
| | | | | | | | |
If the shares are redeemed at the end of each period: |
Share Class | | 1 year | | 3 years | | 5 years | | 10 years |
A | | $718 | | $1,116 | | $1,539 | | $2,712 |
B+ | | $743 | | $1,051 | | $1,385 | | $2,639 |
C | | $343 | | $ 751 | | $1,285 | | $2,746 |
I | | $143 | | $ 460 | | $ 800 | | $1,762 |
If the shares are not redeemed: |
Share Class | | 1 year | | 3 years | | 5 years | | 10 years |
A | | $718 | | $1,116 | | $1,539 | | $2,712 |
B+ | | $243 | | $ 751 | | $1,285 | | $2,639 |
C | | $243 | | $ 751 | | $1,285 | | $2,746 |
I | | $143 | | $ 460 | | $ 800 | | $1,762 |
| + | Examples for Class B shares assume conversion into Class A shares eight years after purchase. Class B shares are not available to new investors. |
The Example does not reflect sales charges (loads) on reinvested dividends (and other distributions). If these sales charges (loads) were included, your costs would be higher.
Portfolio Turnover: The fund pays transaction costs, such as commissions, when it buys and sells securities (or “turns over” its portfolio). A higher portfolio turnover rate may indicate higher transaction costs and may result in higher taxes when fund shares are held in a taxable account. These costs, which are not reflected in annual fund operating expenses or in the Example, affect the fund’s performance. During the most recent fiscal year, the portfolio turnover rate was 63% of the average value of the fund’s portfolio.
44
Principal Investment Strategies: The fund’s sub-adviser, Morgan Stanley Investment Management, Inc. (“MSIM”), under normal circumstances, invests at least 80% of the fund’s assets in common stocks of mid cap companies. MSIM seeks long-term capital growth by investing primarily in established and emerging companies with capitalizations within the range of companies included in the Russell Midcap® Growth Index, which as of December 31, 2010 was between $752 million and $22.1 billion.
MSIM seeks to invest in high quality companies it believes have sustainable competitive advantages and the ability to redeploy capital at high rates of return. MSIM typically favors companies with rising returns on invested capital, above average business visibility, strong free cash flow generation and attractive risk/reward profile. MSIM generally considers selling an investment when it determines the company no longer satisfies its investment criteria.
The fund may also invest in common stocks and other equity securities of small- and large-sized companies, as well as preferred stocks, rights and warrants, and debt securities. The fund may purchase and sell certain derivative instruments, such as options, futures contracts and options on futures contracts, for various portfolio management purposes, including to earn income, facilitate portfolio management and mitigate risks. Derivative instruments used by the fund will be counted toward the 80% policy discussed above to the extent they have economic characteristics similar to the securities included within that policy.
MSIM may invest up to 25% of the fund’s assets in securities of foreign companies, including emerging market securities. MSIM considers an issuer to be from a particular country if (i) its principal securities trading market is in that country; (ii) alone or on a consolidated basis it derives 50% or more of its annual revenue from goods produced, sales made or services performed in that country; or (iii) it is organized under the laws of, or has a principal office in, that country. By applying these tests, it is possible that a particular company could be deemed to be from more than one country. The securities in which the fund may invest may be denominated in U.S. dollars or in currencies other than U.S. dollars. The fund may invest in privately placed securities and initial public offerings.
The fund may also invest up to 10% of its assets in real estate investment trusts (“REITs”).
The fund may invest its assets in cash, cash equivalent securities or short-term debt securities, repurchase agreements and money market instruments. Under adverse or unstable market, economic or political conditions, the fund may take temporary defensive positions in cash and short-term debt securities without limit.
Principal Risks: Many factors affect the fund’s performance. There is no assurance the fund will meet its investment objective. The value of your investment in the fund, as well as the amount of return you receive on your investment, may fluctuate significantly from day to day and over time. You may lose part or all of your investment in the fund or your investment may not perform as well as other similar investments. The following is a summary of certain risks (in alphabetical order) of investing in the fund. You may lose money if you invest in this fund.
| • | | Cash Management and Defensive Investing – Money market instruments or short-term debt securities held by the fund for cash management or defensive investing purposes can fluctuate in value. Like other fixed income securities, they are subject to risk, including market, interest rate and credit risk. If the fund holds cash uninvested, the fund will not earn income on the cash and the fund’s yield will go down. If a significant amount of the fund’s assets are used for cash management or defensive investing purposes, it will be more difficult for the fund to achieve its objective. |
| • | | Convertible Securities – The market value of convertible securities tends to decline as interest rates increase. Convertible securities generally offer lower interest or dividend yields than non-convertible securities of similar quality. The fund could lose money if the issuer of a convertible security is unable to meet its financial obligations or goes bankrupt. |
| • | | Currency – When the fund invests in securities denominated in foreign currencies, the fund may incur currency conversion costs and may be affected favorably or unfavorably by changes in the rates of exchange between those currencies and the U.S. dollar. Currency exchange rates can be volatile and are affected by, among other factors, the general economics of a country, the actions of the U.S. and foreign governments or control banks, the imposition of currency controls, and speculation. |
| • | | Derivatives – Using derivatives can increase fund losses and reduce opportunities for gains when market prices, interest rates or the derivative instruments themselves behave in a way not anticipated by the fund. Using derivatives also can have a leveraging effect and increase fund volatility. Derivatives may be difficult to sell, unwind or value, and the counterparty may default on its obligations to the fund. The fund’s investments in derivative instruments may involve a small investment relative to the amount of investment exposure assumed and may result in losses exceeding the amounts invested in those instruments. Recent legislation calls for new regulation of the derivatives markets. The extent and impact of the regulation are not yet fully known and may not be for some time. New regulation of derivatives may make them more costly, may limit their availability, or may otherwise adversely affect their value or performance. |
45
| • | | Emerging Markets – Investing in the securities of issuers located in or principally doing business in emerging markets are subject to foreign securities risks. These risks are greater for investments in emerging markets. Emerging market countries tend to have economic, political and legal systems that are less fully developed and are less stable than those of more advanced countries. Low trading volumes may result in a lack of liquidity and in extreme price volatility. |
| • | | Fixed-Income Securities – The market prices of fixed-income securities may go up or down, sometimes rapidly or unpredictably due to general market conditions, such as real or perceived adverse economic or political conditions, inflation, changes in interest rates, lack of liquidity in the bond markets or adverse investor sentiment. When market prices fall, the value of your investment will go down. A rise in rates tends to have a greater impact on the prices of longer term or duration securities. |
If interest rates rise, repayments of fixed-income securities may occur more slowly than anticipated by the market. This may drive the prices of these securities down because their interest rates are lower than the current interest rate and they remain outstanding longer. This is sometimes referred to as extension risk.
Many issuers have a right to prepay their securities. If interest rates fall, an issuer may exercise this right. If this happens, the fund will be forced to reinvest prepayment proceeds at a time when yields on securities available in the market are lower than the yield on the prepaid security. This is sometimes referred to as prepayment or call risk.
| • | | Foreign Securities – Foreign securities are subject to a number of additional risks, including nationalization or expropriation of assets, imposition of currency controls or restrictions, confiscatory taxation, political or financial instability and other adverse economic or political developments. Lack of information and less market regulation also may affect the value of these securities. |
| • | | Growth Stocks – Returns on growth stocks may not move in tandem with returns on other categories of stocks or the market as a whole. Growth stocks may be particularly susceptible to rapid price swings or to adverse developments. Growth stocks as a group may be out of favor and underperform the overall equity market for a long period of time, for example, while the market favors “value” stocks. |
| • | | Increase in Expenses – Your actual costs of investing in the fund may be higher than the expenses shown in “Annual Fund Operating Expenses” for a variety of reasons. For example, expense ratios may be higher than those shown if average net assets decrease. Net assets are more likely to decrease and fund expense ratios are more likely to increase when markets are volatile. |
| • | | Investing Aggressively – The value of developing company stocks may be volatile, and can drop significantly in a short period of time. Rights, options and futures contracts may not be exercised and may expire worthless. Warrants and rights may be less liquid than stocks. Use of futures and other derivatives may make the fund more volatile. |
| • | | IPOs – Initial public offerings (“IPOs”) are subject to specific risks which include, among others: |
| | • | | no track record for consideration; |
| | • | | securities may be illiquid; and |
| | • | | earnings are less predictable. |
| • | | Market – The market prices of the fund’s securities may go up or down, sometimes rapidly or unpredictably, due to general market conditions, such as real or perceived adverse economic or political conditions, inflation, changes in interest rates or currency rates, lack of liquidity in the markets or adverse investor sentiment. Market prices of securities also may go down due to events or conditions that affect particular sectors or issuers. When market prices fall, the value of your investment will go down. The fund may experience a substantial or complete loss on any individual security. The recent financial crisis has caused a significant decline in the value and liquidity of many securities. In response to the financial crisis, the U.S. and other governments and the Federal Reserve and certain foreign central banks have taken steps to support financial markets. The withdrawal of this support could negatively affect the value and liquidity of certain securities. In addition, legislation recently enacted in the U.S. calls for changes in many aspects of financial regulation. The impact of the legislation on the markets, and the practical implications for market participants, may not be fully known for some time. |
| • | | Portfolio Selection – The sub-adviser’s judgment about a particular security or issuer, or about the economy or a particular sector, region or market segment, or about an investment strategy, may prove to be incorrect. |
| • | | Preferred Stock – Preferred stock’s right to dividends and liquidation proceeds is junior to the rights of a company’s debt securities. The value of preferred stock may be subject to factors that affect fixed income and equity securities, including changes in interest rates and in a company’s creditworthiness. Shareholders of preferred stock may suffer a loss of value if dividends are not paid and have limited voting rights. |
46
| • | | REITs – When the fund invests in Real Estate Investment Trusts (“REITs”), it is subject to risks generally associated with investing in real estate. A REIT’s performance depends on the types and locations of the properties it owns and how well it manages those properties or loan financings. REITs are subject to a highly technical tax structure; and the failure to qualify as a REIT could result in corporate-level taxation, significantly reducing the return on an investment to the fund. |
| • | | Rule 144A and Privately Placed Securities – Rule 144A permits certain qualified institutional buyers, such as the fund, to trade in privately placed securities that have not been registered for sale to the public. Rule 144A and other privately placed securities may be deemed illiquid, and the fund might be unable to dispose of such securities promptly or at reasonable prices. |
| • | | Small- or Medium-Sized Companies – Small- or medium-sized companies may be more at risk than larger companies because, among other things, they may have limited product lines, operating history, market or financial resources, or because they may depend on a limited management group. |
| • | | Stocks – Stocks may be volatile – their prices may go up and down dramatically over the shorter term. These price movements may result from factors affecting individual companies, industries, the securities market as a whole or the overall economy. |
| • | | Value Investing – The prices of securities the sub-adviser believes are undervalued may not appreciate as anticipated or may go down. Value stocks as a group may be out of favor and underperform the overall equity market for a long period of time, for example, while the market favors “growth” stocks. |
| • | | Warrants and Rights – Warrants and rights may be considered more speculative than certain other types of investments because they do not entitle a holder to the dividends or voting rights for the securities that may be purchased. They do not represent any rights in the assets of the issuing company, and cease to have value if not exercised prior to the expiration date. |
Performance: The bar chart and the table below provide some indication of the risks of investing in the fund by showing you how the fund’s performance has varied from year to year, and how the fund’s average annual total returns for different periods compare to the returns of a broad measure of market performance. The bar chart does not reflect the impact of sales charges, which, if reflected, would lower the returns. The table, which shows average annual total returns for each class of shares of the fund, includes deduction of applicable sales charges. Absent any limitation of the fund’s expenses, total returns would be lower. As with all mutual funds, past performance (before and after taxes) is not a prediction of future results. Updated performance information is available on our website at www.transamericafunds.com or by calling 1-888-233-4339.
Prior to March 22, 2011, the fund was named Transamerica Growth Opportunities, had a different sub-adviser, a different investment objective and used different investment strategies. The performance set forth prior to that date is attributable to the previous sub-adviser.
47
Annual Total Returns (calendar years ended December 31) – Class A
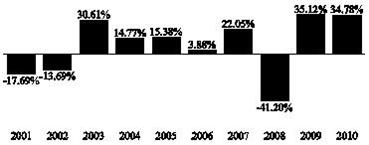
| | | | |
| | | Quarter Ended | | Return |
Best Quarter: | | 12/31/2001 | | 23.35% |
Worst Quarter: | | 3/31/2001 | | -34.23% |
Average Annual Total Returns (periods ended December 31, 2010)1
| | | | | | |
| | | 1 Year | | 5 Years | | 10 Years or Inception* |
Class A (commenced operations on March 1, 2000) |
Return before taxes | | 27.42% | | 5.11% | | 4.66% |
Return after taxes on distributions2 | | 27.42% | | 5.11% | | 4.66% |
Return after taxes on distributions and sale of fund shares2 | | 17.82% | | 4.40% | | 4.07% |
| Class B (Return before taxes only) (commenced operations on March 1, 2000) | | 28.90% | | 5.44% | | 4.61% |
| Class C (Return before taxes only) (commenced operations on November 11, 2002) | | 32.89% | | 5.63% | | 10.42% |
| Class I (Return before taxes only) (commenced operations on November 30, 2009) | | 35.29% | | N/A | | 40.47% |
| Russell Midcap® Growth Index (reflects no deduction for fees, expenses, or taxes) | | 26.38% | | 4.88% | | 3.12% |
| 1 | Actual returns may depend on the investor’s individual tax situation. After-tax returns may not be relevant if the investment is made through a tax-exempt or tax-deferred account, such as a 401(k) plan. After-tax returns are presented for only one class and returns for other classes will vary. |
| 2 | The after-tax returns are calculated using the historic highest individual federal marginal income tax rates and do not reflect the impact of state and local taxes. |
| * | Fund returns are for past 10 years or since inception, whichever is less. Index returns are for 10 years or since inception of oldest share class, whichever is less. |
Management:
| | |
| Investment Adviser: | | Sub-Adviser: |
| |
| Transamerica Asset Management, Inc. | | Morgan Stanley Investment Management Inc. |
| |
| | Portfolio Managers: |
| |
| | Dennis P. Lynch, Lead Portfolio Manager since 2011 |
| |
| | David S. Cohen, Portfolio Manager since 2011 |
| |
| | Sam G. Chainai, Portfolio Manager since 2011 |
| |
| | Armistead B. Nash, Portfolio Manager since 2011 |
| |
| | Alexander T. Norton, Portfolio Manager since 2011 |
| |
| | Jason C. Yeung, Portfolio Manager since 2011 |
Purchase and Sale of Fund Shares: You may purchase, exchange or redeem shares of the fund on any day the New York Stock Exchange is open for business, online or through our website at www.transamericafunds.com, by mail to Transamerica Fund Services, Inc., P.O. Box 219945, Kansas City, MO 64121-9945, by telephone at 1-888-233-4339, or overnight mail to Transamerica Fund Services, Inc., 330 W. 9th Street, Kansas City, MO 64105. Shares may also be purchased through a financial intermediary. The minimum initial purchase for Class A and C shares is $1,000; the minimum subsequent investment is $50. The minimum initial purchase for payroll deduction and automatic investment plan is $500; the minimum subsequent investment is $50 per monthly fund account investment. The minimum investment for Class I shares is $1,000,000. Class B
48
shares are not available for purchase, including to existing Class B shareholders, except in the limited circumstances described in this prospectus under the section entitled “Shareholder Information – Buying Shares”.
Tax Information: Fund distributions may be taxable as ordinary income or capital gains, except when your investment is in an IRA, 401(k) or other tax-advantaged investment plan.
Payments to Broker-Dealers and Other Financial Intermediaries: If you purchase the fund through a broker-dealer or other financial intermediary, the fund and/or its affiliates may pay the intermediary for the sale of fund shares and related services. These payments may create a conflict of interest by influencing the broker-dealer or other intermediary and your salesperson to recommend the fund over another investment. Ask your salesperson or visit your financial intermediary’s website for more information.
49
|
| TRANSAMERICA MULTI-MANAGED BALANCED |
Investment Objective: Seeks to provide a high total investment return through investments in a broadly diversified portfolio of stocks, bonds and money market instruments.
Fees and Expenses: This table describes the fees and expenses that you may pay if you buy and hold shares of the fund. You may qualify for sales charge discounts if you and your family invest, or agree to invest in the future, at least $50,000 in Transamerica Funds. More information about these and other discounts is available from your financial professional and in the “Waivers and/or Reductions of Charges” section on page 120 of the fund’s prospectus and in the fund’s statement of additional information (SAI) under the heading “Purchase of Shares.”
| | | | | | | | |
| Shareholder Fees (fees paid directly from your investment) |
| | | Class of Shares |
| | | A | | B* | | C | | I |
Maximum sales charge (load) imposed on purchases (as a % of offering price) | | 5.50% | | None | | None | | None |
| Maximum deferred sales charge (load) (as a percentage of purchase price or redemption proceeds, whichever is lower) | | None | | 5.00% | | 1.00% | | None |
| Annual Fund Operating Expenses (expenses that you pay each year as a percentage of the value of your investment) |
| | | Class of Shares |
| | | A | | B* | | C | | I |
| Management fees | | 0.75% | | 0.75% | | 0.75% | | 0.75% |
| Distribution and service (12b-1) fees | | 0.35% | | 1.00% | | 1.00% | | None |
| Other expensesa | | 0.45% | | 0.58% | | 0.35% | | 1.25% |
| Total annual fund operating expenses | | 1.55% | | 2.33% | | 2.10% | | 2.00% |
| Expense reductionb | | 0.00% | | 0.00% | | 0.00% | | 0.55% |
| Total annual fund operating expenses after expense reduction | | 1.55% | | 2.33% | | 2.10% | | 1.45% |
| * | Not available to new investors. |
| a | Other expenses do not include extraordinary expenses. If extraordinary expenses were included, other expenses would be 0.46%, 0.59%, 0.36% and 1.26% for Class A, Class B, Class C and Class I, respectively. |
| b | Contractual arrangements have been made with the fund’s investment adviser, Transamerica Asset Management, Inc. (“TAM”), through March 1, 2012, to waive fees and/or reimburse fund expenses to the extent that the fund’s total operating expenses exceed 1.45%, excluding 12b-1 fees and extraordinary expenses. TAM is entitled to reimbursement by the fund of fees waived or expenses reduced during any of the previous 36 months if on any day the estimated annualized fund operating expenses are less than the cap, excluding 12b-1 fees and extraordinary expenses. |
Example: This Example is intended to help you compare the cost of investing in the fund with the cost of investing in other mutual funds. The Example assumes that you invest $10,000. The Example also assumes that your investment has a 5% return each year and that the fund’s operating expenses remain the same. Although your actual costs may be higher or lower, based on these assumptions your costs would be:
| | | | | | | | |
If the shares are redeemed at the end of each period: |
| Share Class | | 1 year | | 3 years | | 5 years | | 10 years |
| A | | $699 | | $1,013 | | $1,348 | | $2,294 |
| B+ | | $736 | | $1,027 | | $1,345 | | $2,471 |
| C | | $313 | | $ 658 | | $1,129 | | $2,431 |
| I | | $148 | | $ 574 | | $1,027 | | $2,283 |
| If the shares are not redeemed: |
| Share Class | | 1 year | | 3 years | | 5 years | | 10 years |
| A | | $699 | | $1,013 | | $1,348 | | $2,294 |
| B+ | | $236 | | $ 727 | | $1,245 | | $2,471 |
| C | | $213 | | $ 658 | | $1,129 | | $2,431 |
| I | | $148 | | $ 574 | | $1,027 | | $2,283 |
| + | Examples for Class B shares assume conversion into Class A shares eight years after purchase. Class B shares are not available to new investors. |
The Example does not reflect sales charges (loads) on reinvested dividends (and other distributions). If these sales charges (loads) were included, your costs would be higher.
Portfolio Turnover: The fund pays transaction costs, such as commissions, when it buys and sells securities (or “turns over” its portfolio). A higher portfolio turnover rate may indicate higher transaction costs and may result in higher taxes when fund shares are held in a taxable account. These costs, which are not reflected in annual fund operating expenses or in the Example,
50
affect the fund’s performance. During the most recent fiscal year, the portfolio turnover rate was 99% of the average value of the fund’s portfolio.
Principal Investment Strategies:
The fund has two sub-advisers. J.P. Morgan Investment Management Inc. (“JPMorgan”) manages the equity component of the fund and BlackRock Financial Management, Inc. (“BlackRock”) manages the fixed-income component of the fund.
The fund varies the percentage of assets invested in any one type of security in accordance with its sub-advisers’ interpretation of economic and market conditions, fiscal and monetary policy, and underlying securities values. Generally, the fund invests approximately 60% of its assets in equity securities and 40% of its assets in fixed-income and money market securities (investing at least 25% of its assets in fixed-income senior securities, including debt securities and preferred stocks).
Equity component - JPMorgan seeks to achieve the fund’s objective by investing, under normal circumstances, at least 80% of the equity component’s net assets in equity securities of large- and medium-capitalization U.S. companies. The fund may invest in foreign companies. JPMorgan will normally keep the equity component as fully invested in equity securities as practicable. Industry by industry, the fund’s weightings are generally similar to those of the Standard & Poor’s 500® Index (“S&P 500 Index”). JPMorgan normally does not look to overweight or underweight industries. Holdings by industry sector will normally approximate those of the S&P 500 Index.
Fixed income component - The fixed income component of the fund is normally invested primarily in investment grade debt securities and U.S. government obligations, mortgage-backed securities guaranteed by U.S. government agencies and instrumentalities and mortgage-backed securities without government guarantees. Its dollar-weighted average effective maturity generally is between five and fifteen years (and does not exceed thirty years). The fund may also invest in U.S. Treasury and agency securities, municipal bonds, corporate bonds, asset-backed securities (including collateralized loan obligations, collateralized bond obligations and collateralized debt obligations), high quality, short-term obligations and repurchase agreements, and in securities of foreign issuers. The fund may invest in securities that are denominated in U.S. dollars and in foreign currencies. Up to 20% of the fixed income component may be invested in any or all of non-dollar securities, high yield debt securities and emerging market securities.
The fund may, but is not required to, engage in certain investment strategies involving derivatives, such as options, futures, swaps, and forward currency contracts. These investment strategies may be employed to attempt to alter investment characteristics of the fund’s portfolio.
The fund may invest its assets in cash, cash equivalent securities or short-term debt securities, repurchase agreements and money market securities. Under adverse or unstable market, economic or political conditions, the fund may take temporary defensive positions in cash and short-term debt securities without limit.
Principal Risks: Many factors affect the fund’s performance. There is no assurance the fund will meet its investment objective. The value of your investment in the fund, as well as the amount of return you receive on your investment, may fluctuate significantly from day to day and over time. You may lose part or all of your investment in the fund or your investment may not perform as well as other similar investments. The following is a summary of certain risks (in alphabetical order) of investing in the fund. You may lose money if you invest in this fund.
| • | | Active Trading – Certain funds are actively managed and, under appropriate circumstances, may purchase and sell securities without regard to the length of time held. A high portfolio turnover rate may have a negative impact on performance by increasing transaction costs and may generate greater tax liabilities for shareholders holding shares in taxable accounts. |
| • | | Cash Management and Defensive Investing – Money market instruments or short-term debt securities held by the fund for cash management or defensive investing purposes can fluctuate in value. Like other fixed income securities, they are subject to risk, including market, interest rate and credit risk. If the fund holds cash uninvested, the fund will not earn income on the cash and the fund’s yield will go down. If a significant amount of the fund’s assets are used for cash management or defensive investing purposes, it will be more difficult for the fund to achieve its objective. |
| • | | Credit – If an issuer or guarantor of a security held by the fund or a counterparty to a financial contract with the fund defaults or is downgraded, or if the value of the assets underlying a security declines, the value of your investment will decline. Junk bonds have a higher risk of default and are considered speculative. A default or downgrade will have a greater impact on subordinated securities. |
| • | | Currency – When the fund invests in securities denominated in foreign currencies, the fund may incur currency conversion costs and may be affected favorably or unfavorably by changes in the rates of exchange between those currencies and the U.S. dollar. Currency exchange rates can be volatile and are affected by, among other factors, the general economics of a |
51
| | country, the actions of the U.S. and foreign governments or control banks, the imposition of currency controls, and speculation. |
| • | | Derivatives – Using derivatives can increase fund losses and reduce opportunities for gains when market prices, interest rates or the derivative instruments themselves behave in a way not anticipated by the fund. Using derivatives also can have a leveraging effect and increase fund volatility. Derivatives may be difficult to sell, unwind or value, and the counterparty may default on its obligations to the fund. The fund’s investments in derivative instruments may involve a small investment relative to the amount of investment exposure assumed and may result in losses exceeding the amounts invested in those instruments. Recent legislation calls for new regulation of the derivatives markets. The extent and impact of the regulation are not yet fully known and may not be for some time. New regulation of derivatives may make them more costly, may limit their availability, or may otherwise adversely affect their value or performance. |
| • | | Emerging Markets – Investing in the securities of issuers located in or principally doing business in emerging markets are subject to foreign securities risks. These risks are greater for investments in emerging markets. Emerging market countries tend to have economic, political and legal systems that are less fully developed and are less stable than those of more advanced countries. Low trading volumes may result in a lack of liquidity and in extreme price volatility. |
| • | | Fixed-Income Securities – The market prices of fixed-income securities may go up or down, sometimes rapidly or unpredictably due to general market conditions, such as real or perceived adverse economic or political conditions, inflation, changes in interest rates, lack of liquidity in the bond markets or adverse investor sentiment. When market prices fall, the value of your investment will go down. A rise in rates tends to have a greater impact on the prices of longer term or duration securities. |
If interest rates rise, repayments of fixed-income securities may occur more slowly than anticipated by the market. This may drive the prices of these securities down because their interest rates are lower than the current interest rate and they remain outstanding longer. This is sometimes referred to as extension risk.
Many issuers have a right to prepay their securities. If interest rates fall, an issuer may exercise this right. If this happens, the fund will be forced to reinvest prepayment proceeds at a time when yields on securities available in the market are lower than the yield on the prepaid security. This is sometimes referred to as prepayment or call risk.
| • | | Foreign Securities – Foreign securities are subject to a number of additional risks, including nationalization or expropriation of assets, imposition of currency controls or restrictions, confiscatory taxation, political or financial instability and other adverse economic or political developments. Lack of information and less market regulation also may affect the value of these securities. |
| • | | Growth Stocks – Returns on growth stocks may not move in tandem with returns on other categories of stocks or the market as a whole. Growth stocks may be particularly susceptible to rapid price swings or to adverse developments. Growth stocks as a group may be out of favor and underperform the overall equity market for a long period of time, for example, while the market favors “value” stocks. |
| • | | High-Yield Debt Securities – High-yield debt securities, or junk bonds, are securities that are rated below “investment grade” (that is, securities rated below Baa/BBB) or, if unrated, are considered by the sub-adviser to be of equivalent quality. Changes in interest rates, the market’s perception of the issuers and the creditworthiness of the issuers may significantly affect the value of these bonds. Junk bonds have a higher risk of default, tend to be less liquid and may be more difficult to value. |
| • | | Increase in Expenses – Your actual costs of investing in the fund may be higher than the expenses shown in “Annual Fund Operating Expenses” for a variety of reasons. For example, expense ratios may be higher than those shown if average net assets decrease. Net assets are more likely to decrease and fund expense ratios are more likely to increase when markets are volatile. |
| • | | Inflation-Protected Securities – Inflation-protected debt securities may react differently from other types of debt securities and tend to react to changes in “real” interest rates. Real interest rates represent nominal (stated) interest rates reduced by the expected impact of inflation. In general, the price of an inflation-protected debt security can fall when real interest rates rise, and can rise when real interest rates fall. Interest payments on inflation-protected debt securities can be unpredictable and will vary as the principal and/or interest is adjusted for inflation. Also, the inflation index utilized by a particular inflation-protected security may not accurately reflect the true rate of inflation, in which case the market value of the security could be adversely affected. |
| • | | Interest Rate – Fixed-income securities have varying levels of sensitivity to changes in interest rates. In general, the price of a fixed-income security tends to fall when interest rates rise and can rise when interest rates fall. A change in interest |
52
| | rates will not have the same impact on all fixed-income securities. Generally, the longer the maturity or duration of a fixed-income security, the greater the impact of a rise in interest rates on the security’s value. In addition, different interest rate measures (such as short- and long-term interest rates and U.S. and foreign interest rates), or interest rates on different types of securities or securities of different issuers, may not necessarily change in the same amount or in the same direction. When interest rates go down, the income received by the fund, and the fund’s yield, may decline. |
| • | | Liquidity – Some securities held by the fund may be difficult to sell, or illiquid, particularly during times of market turmoil. Illiquid securities may also be difficult to value. If the fund is forced to sell an illiquid asset to meet redemption requests or other cash needs, the fund may be forced to sell at a loss. |
| • | | Loans – Loans are subject to the credit risk of nonpayment of principal or interest. Economic downturns or increases in interest rates may cause an increase in defaults, interest rate risk and liquidity risk. Loans may or may not be collateralized at the time of acquisition, and any collateral may be relatively illiquid or lose all or substantially all of its value subsequent to investment. In the event of bankruptcy of a borrower, the fund could experience delays or limitations with respect to its ability to realize the benefits of any collateral securing a loan. The fund’s investments in loans are also subject to prepayment or call risk. |
| • | | Market – The market prices of the fund’s securities may go up or down, sometimes rapidly or unpredictably, due to general market conditions, such as real or perceived adverse economic or political conditions, inflation, changes in interest rates or currency rates, lack of liquidity in the markets or adverse investor sentiment. Market prices of securities also may go down due to events or conditions that affect particular sectors or issuers. When market prices fall, the value of your investment will go down. The fund may experience a substantial or complete loss on any individual security. The recent financial crisis has caused a significant decline in the value and liquidity of many securities. In response to the financial crisis, the U.S. and other governments and the Federal Reserve and certain foreign central banks have taken steps to support financial markets. The withdrawal of this support could negatively affect the value and liquidity of certain securities. In addition, legislation recently enacted in the U.S. calls for changes in many aspects of financial regulation. The impact of the legislation on the markets, and the practical implications for market participants, may not be fully known for some time. |
| • | | Mortgage-Related and Asset-Backed Securities – Mortgage-backed securities may be issued by private issuers, by government-sponsored entities such as Fannie Mae or Freddie Mac or by agencies of the U.S. government, such as Ginnie Mae. Mortgage-backed securities represent direct or indirect participations in, or are collateralized by and payable from, mortgage loans secured by real property. Unlike mortgage-related securities issued or guaranteed by agencies of the U.S. government or government-sponsored entities, mortgage-related securities issued by private issuers do not have a government or government-sponsored entity guarantee (but may have other credit enhancement), and may, and frequently do, have less favorable collateral, credit risk or other underwriting characteristics. Mortgage-backed securities are also particularly susceptible to prepayment and extension risks. Asset-backed securities represent participations in, or are secured by and payable from, assets such as installment sales or loan contracts, leases, credit card receivables and other categories of receivables. Certain asset-backed securities present a heightened level of risk because, in the event of default, the liquidation value of the underlying assets may be inadequate to pay any unpaid principal or interest. The value of mortgage-backed and asset-backed securities may be affected by changes in credit quality or value of the mortgage loans or other assets that support the securities. |
| • | | Portfolio Selection – The sub-adviser’s judgment about a particular security or issuer, or about the economy or a particular sector, region or market segment, or about an investment strategy, may prove to be incorrect. |
| • | | Preferred Stock – Preferred stock’s right to dividends and liquidation proceeds is junior to the rights of a company’s debt securities. The value of preferred stock may be subject to factors that affect fixed income and equity securities, including changes in interest rates and in a company’s creditworthiness. Shareholders of preferred stock may suffer a loss of value if dividends are not paid and have limited voting rights. |
| • | | Repurchase Agreements – If the other party to a repurchase agreement defaults on its obligation, the fund may suffer delays and incur costs or lose money in exercising its rights under the agreement. If the seller fails to repurchase the security and the market value declines, the fund could lose money. If the seller becomes insolvent and subject to liquidation or reorganization under applicable bankruptcy or other laws, the fund’s ability to dispose of the underlying securities may be restricted. |
| • | | Small- or Medium-Sized Companies – Small- or medium-sized companies may be more at risk than larger companies because, among other things, they may have limited product lines, operating history, market or financial resources, or because they may depend on a limited management group. |
53
| • | | Stocks – Stocks may be volatile – their prices may go up and down dramatically over the shorter term. These price movements may result from factors affecting individual companies, industries, the securities market as a whole or the overall economy. |
| • | | U.S. Government Agency Obligations – Government agency obligations have different levels of credit support and, therefore, different degrees of credit risk. Securities issued by agencies and instrumentalities of the U.S. government that are supported by the full faith and credit of the United States generally present a lesser degree of credit risk than securities issued by agencies and instrumentalities sponsored by the U.S. government that are supported only by the issuer’s right to borrow from the U.S. Treasury and securities issued by agencies and instrumentalities sponsored by the U.S. government that are supported only by the credit of the issuing agencies. |
| • | | Valuation – The sales price the fund could receive for any particular portfolio investment may differ from the fund’s valuation of the investment, particularly for securities that trade in thin or volatile markets or that are valued using a fair value methodology. |
| • | | Value Investing – The prices of securities the sub-adviser believes are undervalued may not appreciate as anticipated or may go down. Value stocks as a group may be out of favor and underperform the overall equity market for a long period of time, for example, while the market favors “growth” stocks. |
Performance: The bar chart and the table below provide some indication of the risks of investing in the fund by showing you how the fund’s performance has varied from year to year, and how the fund’s average annual total returns for different periods compare to the returns of a broad measure of market performance, as well as comparison to a secondary index which has characteristics relevant to the fund’s investment strategies. The bar chart does not reflect the impact of sales charges, which, if reflected, would lower the returns. The table, which shows average annual total returns for each class of shares of the fund, includes deduction of applicable sales charges. Absent any limitation of the fund’s expenses, total returns would be lower. As with all mutual funds, past performance (before and after taxes) is not a prediction of future results. Updated performance information is available on our website at www.transamericafunds.com or by calling 1-888-233-4339.
Prior to May 28, 2004, the fund had a different sub-adviser, a different investment objective and used different investment strategies. The performance set forth prior to that date is attributable to the previous sub-adviser.
Prior to March 22, 2011, the fund was named Transamerica Balanced, had a different sub-adviser, a different investment objective and used different investment strategies. The performance set forth prior to that date is attributable to the previous sub-adviser.
Annual Total Returns (calendar years ended December 31) – Class A
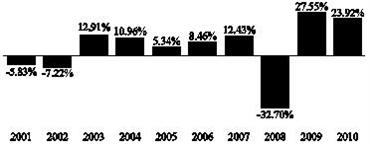
| | | | |
| | | Quarter Ended | | Return |
Best Quarter: | | 6/30/2009 | | 13.89% |
Worst Quarter: | | 12/31/2008 | | -16.46% |
54
Average Annual Total Returns (periods ended December 31, 2010)1
| | | | | | |
| | | 1 Year | | 5 Years | | 10 Years or Inception* |
| Class A (commenced operations on December 2, 1994) | | | | | | |
Return before taxes | | 17.11% | | 4.15% | | 3.52% |
Return after taxes on distributions2 | | 16.42% | | 3.52% | | 2.98% |
Return after taxes on distributions and sale of fund shares2 | | 11.39% | | 3.33% | | 2.77% |
| Class B (Return before taxes only) (commenced operations on October 1, 1995) | | 17.93% | | 4.48% | | 3.58% |
| Class C (Return before taxes only) (commenced operations on November 11, 2002) | | 22.19% | | 4.75% | | 6.14% |
| Class I (Return before taxes only) (commenced operations on November 30, 2009) | | 24.12% | | N/A | | 25.32% |
| Standard & Poor’s 500® Index (reflects no deduction for fees, expenses, or taxes) | | 15.06% | | 2.29% | | 1.41% |
| Barclays Capital U.S. Aggregate Bond Index (reflects no deduction for fees, expenses, or taxes) | | 6.54% | | 5.80% | | 5.84% |
| 1 | Actual returns may depend on the investor’s individual tax situation. After-tax returns may not be relevant if the investment is made through a tax-exempt or tax-deferred account, such as a 401(k) plan. After-tax returns are presented for only one class and returns for other classes will vary. |
| 2 | The after-tax returns are calculated using the historic highest individual federal marginal income tax rates and do not reflect the impact of state and local taxes. |
| * | Fund returns are for past 10 years or since inception, whichever is less. Index returns are for 10 years or since inception of oldest share class, whichever is less. |
Management:
| | |
| Investment Adviser: | | Sub-Adviser: |
| |
| Transamerica Asset Management, Inc. | | BlackRock Financial Management, Inc. |
| |
| | Portfolio Managers: |
| |
| | Matthew Marra, Portfolio Manager since 2011 |
| |
| | Eric Pellicciaro, Portfolio Manager since 2011 |
| |
| | Rick Rieder, Portfolio Manager since 2011 |
| |
| | Sub-Adviser: |
| |
| | J.P. Morgan Investment Management Inc. |
| |
| | Portfolio Managers: |
| |
| | Scott Blasdell, CFA, Portfolio Manager since 2011 |
| |
| | Terance Chen, CFA, Portfolio Manager since 2011 |
| |
| | Raffaele Zingone, CFA, Portfolio Manager since 2011 |
Purchase and Sale of Fund Shares: You may purchase, exchange or redeem shares of the fund on any day the New York Stock Exchange is open for business, online or through our website at www.transamericafunds.com, by mail to Transamerica Fund Services, Inc., P.O. Box 219945, Kansas City, MO 64121-9945, by telephone at 1-888-233-4339, or overnight mail to Transamerica Fund Services, Inc., 330 W. 9th Street, Kansas City, MO 64105. Shares may also be purchased through a financial intermediary. The minimum initial purchase for Class A and C shares is $1,000; the minimum subsequent investment is $50. The minimum initial purchase for payroll deduction and automatic investment plan is $500; the minimum subsequent investment is $50 per monthly fund account investment. The minimum investment for Class I shares is $1,000,000. Class B shares are not available for purchase, including to existing Class B shareholders, except in the limited circumstances described in this prospectus under the section entitled “Shareholder Information – Buying Shares”.
Tax Information: Fund distributions may be taxable as ordinary income or capital gains, except when your investment is in an IRA, 401(k) or other tax-advantaged investment plan.
Payments to Broker-Dealers and Other Financial Intermediaries: If you purchase the fund through a broker-dealer or other financial intermediary, the fund and/or its affiliates may pay the intermediary for the sale of fund shares and related services. These payments may create a conflict of interest by influencing the broker-dealer or other intermediary and your salesperson to recommend the fund over another investment. Ask your salesperson or visit your financial intermediary’s website for more information.
55
|
| TRANSAMERICA MULTI-MANAGER ALTERNATIVE STRATEGIES PORTFOLIO |
Investment Objective: Seeks long-term capital appreciation.
Fees and Expenses: This table describes the fees and expenses that you may pay if you buy and hold shares of the fund. You may qualify for sales charge discounts if you and your family invest, or agree to invest in the future, at least $50,000 in Transamerica Funds. More information about these and other discounts is available from your financial professional and in the “Waivers and/or Reductions of Charges” section on page 120 of the fund’s prospectus and in the fund’s statement of additional information (SAI) under the heading “Purchase of Shares.”
| | | | | | |
Shareholder Fees (fees paid directly from your investment) |
| | | Class of Shares |
| | | A | | C | | I |
Maximum sales charge (load) imposed on purchases (as a % of offering price) | | 5.50% | | None | | None |
| Maximum deferred sales charge (load) (as a percentage of purchase price or redemption proceeds, whichever is lower) | | None | | 1.00% | | None |
| Annual Fund Operating Expenses (expenses that you pay each year as a percentage of the value of your investment) |
| | | Class of Shares |
| | | A | | C | | I |
| Management fees | | 0.20% | | 0.20% | | 0.20% |
| Distribution and service (12b-1) fees | | 0.35% | | 1.00% | | None |
| Other expenses | | 0.25% | | 0.24% | | 0.30% |
Acquired Fund Fees and Expenses (fees and expenses of underlying funds) | | 1.05% | | 1.05% | | 1.05% |
| Total annual fund operating expensesa | | 1.85% | | 2.49% | | 1.55% |
| a | Fund operating expenses do not correlate to the ratios of expenses to average net assets in the financial highlights table, which do not include acquired (i.e., underlying) funds’ fees and expenses. |
Example: This Example is intended to help you compare the cost of investing in the fund with the cost of investing in other mutual funds. The Example assumes that you invest $10,000. The Example also assumes that your investment has a 5% return each year and that the fund’s operating expenses remain the same. Although your actual costs may be higher or lower, based on these assumptions your costs would be:
| | | | | | | | |
If the shares are redeemed at the end of each period: |
Share Class | | 1 year | | 3 years | | 5 years | | 10 years |
A | | $728 | | $1,100 | | $1,496 | | $2,600 |
C | | $352 | | $ 776 | | $1,326 | | $2,826 |
I | | $158 | | $ 490 | | $ 845 | | $1,845 |
If the shares are not redeemed: | | | | | | | | |
Share Class | | 1 year | | 3 years | | 5 years | | 10 years |
A | | $728 | | $1,100 | | $1,496 | | $2,600 |
C | | $252 | | $ 776 | | $1,326 | | $2,826 |
I | | $158 | | $ 490 | | $ 845 | | $1,845 |
The Example does not reflect sales charges (loads) on reinvested dividends (and other distributions). If these sales charges (loads) were included, your costs would be higher.
Portfolio Turnover: The fund pays transaction costs, such as commissions, when it buys and sells securities (or “turns over” its portfolio). A higher portfolio turnover rate may indicate higher transaction costs and may result in higher taxes when fund shares are held in a taxable account. These costs, which are not reflected in annual fund operating expenses or in the Example, affect the fund’s performance. During the most recent fiscal year, the portfolio turnover rate was 35% of the average value of the fund’s portfolio.
Principal Investment Strategies: The fund seeks to achieve its investment objective by investing its assets in a combination of underlying Transamerica Funds (“underlying funds”).
| • | | Under normal circumstances, the fund expects to invest primarily in underlying funds that use alternative investment strategies or invest in alternative asset classes, including but not limited to: |
56
| | • | | Long-short and market-neutral strategies; |
| | • | | Bear-market strategies; |
| | • | | Tactical investment strategies (bond and/or equity); |
| | • | | Foreign currency trading strategies; |
| | • | | Real estate strategies; |
| | • | | Managed futures strategies; |
| | • | | Commodities and/or natural resources and/or precious metals; and |
| | • | | Non-core investments (such as micro-cap stocks, emerging markets equities, TIPS and foreign bonds). |
| • | | Allocation of assets among the underlying funds is intended to achieve moderate capital appreciation with limited volatility and correlation with the mainstream equity and bond markets. |
| • | | The fund may also invest directly in U.S. government securities and/or short-term commercial paper. |
Each underlying fund has its own investment objective, principal investment strategies and investment risks. The “Underlying Funds” section of the prospectus lists the underlying funds currently available for investment by the fund, provides a summary of their respective investment objectives and principal investment strategies, and identifies certain risks of the underlying funds.
It is not possible to predict the extent to which the fund will be invested in a particular underlying fund at any time. The fund may be a significant shareholder in certain underlying funds.
The portfolio construction manager, Morningstar Associates, LLC, may change the fund’s asset allocations and underlying funds at any time without notice to shareholders and without shareholder approval.
Under adverse or unstable market, economic or political conditions, the fund may take temporary defensive positions in cash and short-term debt securities without limit.
Principal Risks: Many factors affect the fund’s performance. There is no assurance the fund will meet its investment objective. The value of your investment in the fund, as well as the amount of return you receive on your investment, may fluctuate significantly from day to day and over time. You may lose part or all of your investment in the fund or your investment may not perform as well as other similar investments. The following is a summary of certain risks (in alphabetical order) of investing in the fund. You may lose money if you invest in this fund.
| • | | Asset Allocation – The Portfolio Construction Manager allocates the fund’s assets among various underlying funds. These allocations may be unsuccessful in maximizing the fund’s return and/or avoiding investment losses, and may cause the fund to underperform other funds with a similar strategy. |
| • | | Cash Management and Defensive Investing – Money market instruments or short-term debt securities held by the fund for cash management or defensive investing purposes can fluctuate in value. Like other fixed income securities, they are subject to risk, including market, interest rate and credit risk. If the fund holds cash uninvested, the fund will not earn income on the cash and the fund’s yield will go down. If a significant amount of the fund’s assets are used for cash management or defensive investing purposes, it will be more difficult for the fund to achieve its objective. |
| • | | Commodities – To the extent the fund invests in instruments whose performance is linked to the price of an underlying commodity or commodity index, the fund will be subject to the risks of investing in physical commodities, including regulatory, economic and political developments, weather events and natural disasters and market disruptions. The fund’s investment exposure to the commodities markets may subject the fund to greater volatility than investments in more traditional securities, such as stocks and bonds. |
| • | | Currency – When the fund invests in securities denominated in foreign currencies, the fund may incur currency conversion costs and may be affected favorably or unfavorably by changes in the rates of exchange between those currencies and the U.S. dollar. Currency exchange rates can be volatile and are affected by, among other factors, the general economics of a country, the actions of the U.S. and foreign governments or control banks, the imposition of currency controls, and speculation. |
| • | | Derivatives – Using derivatives can increase fund losses and reduce opportunities for gains when market prices, interest rates or the derivative instruments themselves behave in a way not anticipated by the fund. Using derivatives also can have a leveraging effect and increase fund volatility. Derivatives may be difficult to sell, unwind or value, and the counterparty may default on its obligations to the fund. The fund’s investments in derivative instruments may involve a small investment relative to the amount of investment exposure assumed and may result in losses exceeding the amounts invested in those instruments. Recent legislation calls for new regulation of the derivatives markets. The extent and impact of the regulation are not yet fully known and may not be for some time. New regulation of derivatives may make them more costly, may limit their availability, or may otherwise adversely affect their value or performance. |
57
| • | | Emerging Markets – Investing in the securities of issuers located in or principally doing business in emerging markets are subject to foreign securities risks. These risks are greater for investments in emerging markets. Emerging market countries tend to have economic, political and legal systems that are less fully developed and are less stable than those of more advanced countries. Low trading volumes may result in a lack of liquidity and in extreme price volatility. |
| • | | Fixed-Income Securities – The market prices of fixed-income securities may go up or down, sometimes rapidly or unpredictably due to general market conditions, such as real or perceived adverse economic or political conditions, inflation, changes in interest rates, lack of liquidity in the bond markets or adverse investor sentiment. When market prices fall, the value of your investment will go down. A rise in rates tends to have a greater impact on the prices of longer term or duration securities. |
If interest rates rise, repayments of fixed-income securities may occur more slowly than anticipated by the market. This may drive the prices of these securities down because their interest rates are lower than the current interest rate and they remain outstanding longer. This is sometimes referred to as extension risk.
Many issuers have a right to prepay their securities. If interest rates fall, an issuer may exercise this right. If this happens, the fund will be forced to reinvest prepayment proceeds at a time when yields on securities available in the market are lower than the yield on the prepaid security. This is sometimes referred to as prepayment or call risk.
| • | | Foreign Securities – Foreign securities are subject to a number of additional risks, including nationalization or expropriation of assets, imposition of currency controls or restrictions, confiscatory taxation, political or financial instability and other adverse economic or political developments. Lack of information and less market regulation also may affect the value of these securities. |
| • | | High-Yield Debt Securities – High-yield debt securities, or junk bonds, are securities that are rated below “investment grade” (that is, securities rated below Baa/BBB) or, if unrated, are considered by the sub-adviser to be of equivalent quality. Changes in interest rates, the market’s perception of the issuers and the creditworthiness of the issuers may significantly affect the value of these bonds. Junk bonds have a higher risk of default, tend to be less liquid and may be more difficult to value. |
| • | | Increase in Expenses – Your actual costs of investing in the fund may be higher than the expenses shown in “Annual Fund Operating Expenses” for a variety of reasons. For example, expense ratios may be higher than those shown if average net assets decrease. Net assets are more likely to decrease and fund expense ratios are more likely to increase when markets are volatile. |
| • | | Market – The market prices of the fund’s securities may go up or down, sometimes rapidly or unpredictably, due to general market conditions, such as real or perceived adverse economic or political conditions, inflation, changes in interest rates or currency rates, lack of liquidity in the markets or adverse investor sentiment. Market prices of securities also may go down due to events or conditions that affect particular sectors or issuers. When market prices fall, the value of your investment will go down. The fund may experience a substantial or complete loss on any individual security. The recent financial crisis has caused a significant decline in the value and liquidity of many securities. In response to the financial crisis, the U.S. and other governments and the Federal Reserve and certain foreign central banks have taken steps to support financial markets. The withdrawal of this support could negatively affect the value and liquidity of certain securities. In addition, legislation recently enacted in the U.S. calls for changes in many aspects of financial regulation. The impact of the legislation on the markets, and the practical implications for market participants, may not be fully known for some time. |
| • | | Natural Resource-Related Securities – Because the fund concentrates its investments in natural resource related securities, the fund is subject to the risks associated with natural resource investments in addition to the general risk of the stock market. This means the fund is more vulnerable to the price movements of natural resources and factors that particularly affect the oil, gas, mining, energy, chemicals, paper, steel or agriculture sectors than a more broadly diversified fund. Because the fund invests primarily in companies with natural resource assets, there is the risk that the fund will perform poorly during a downturn in natural resource prices. |
| • | | Precious Metals-Related Securities – Prices of precious metals and of precious metals-related securities historically have been very volatile. The high volatility of precious metals prices may adversely affect the financial condition of companies involved with precious metals. The production and sale of precious metals by governments or central banks or other larger holders can be affected by various economic, financial social and political factors, which may be unpredictable and may have a significant impact on the prices of precious metals. Other factors that may affect the prices of precious metals and securities related to them include changes in inflation, the outlook for inflation and changes in industrial and commercial demand for precious metals. |
58
| • | | Real Estate Securities – Investments in the real estate industry are subject to risks associated with direct investment in real estate. These risks include declines in the value of real estate, adverse general and local economic conditions, increased competition, overbuilding and changes in operating expenses, property taxes or interest rates. REITs are one type of real estate security. A REIT’s performance depends on the types and locations of the properties it owns and how well it manages those properties or loan financings. REITs are subject to a highly technical tax structure, and the failure to qualify as a REIT could result in corporate-level taxation, significantly reducing the return on an investment to the fund. |
| • | | Smaller Companies – Small companies may be more at risk than larger companies because, among other things, they may have limited product lines, operating history, market or financial resources, or because they may depend on limited management groups. |
| • | | Stocks – Stocks may be volatile – their prices may go up and down dramatically over the shorter term. These price movements may result from factors affecting individual companies, industries, the securities market as a whole or the overall economy. |
| • | | Underlying Funds – Because the fund invests its assets in various underlying funds, its ability to achieve its investment objective depends largely on the performance of the underlying funds in which it invests. Each of the underlying funds in which the fund may invest has its own investment risks, and those risks can affect the value of the underlying funds’ shares and therefore the value of the fund’s investments. There can be no assurance that the investment objective of any underlying fund will be achieved. To the extent that the fund invests more of its assets in one underlying fund than in another, the fund will have greater exposure to the risks of that underlying fund. In addition, the fund will bear a pro rata portion of the operating expenses of the underlying funds in which it invests. The “Underlying Funds” section of the fund’s prospectus identifies certain risks of each underlying fund. |
Performance: The bar chart and the table below provide some indication of the risks of investing in the fund by showing you how the fund’s performance has varied from year to year, and how the fund’s average annual total returns for different periods compare to the returns of a broad measure of market performance. The bar chart does not reflect the impact of sales charges, which, if reflected, would lower the returns. The table, which shows average annual total returns for each class of shares of the fund, includes deduction of applicable sales charges. Absent any limitation of the fund’s expenses, total returns would be lower. As with all mutual funds, past performance (before and after taxes) is not a prediction of future results. Updated performance information is available on our website at www.transamericafunds.com or by calling 1-888-233-4339.
Annual Total Returns (calendar years ended December 31) – Class A
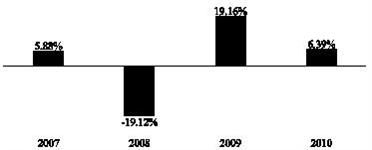
| | | | |
| | | Quarter Ended | | Return |
Best Quarter: | | 6/30/2009 | | 12.16% |
Worst Quarter: | | 12/31/2008 | | -10.35% |
59
Average Annual Total Returns (periods ended December 31, 2010)1
| | | | |
| | | 1 Year | | 10 Years or
Inception* |
Class A (commenced operations on December 28, 2006) | | | | |
Return before taxes | | 0.56% | | 0.65% |
Return after taxes on distributions2 | | 0.35% | | -0.05% |
Return after taxes on distributions and sale of fund shares2 | | 0.39% | | 0.18% |
Class C (Return before taxes only) (commenced operations on December 28, 2006) | | 4.69% | | 1.42% |
Class I (Return before taxes only) (commenced operations on November 30, 2009) | | 6.93% | | 7.47% |
| Bank of America Merrill Lynch 3-Month Treasury Bill + 3% Wrap Index (reflects no deduction for fees, expenses or taxes) | | 3.17% | | 4.93% |
| 1 | Actual returns may depend on the investor’s individual tax situation. After-tax returns may not be relevant if the investment is made through a tax-exempt or tax-deferred account, such as a 401(k) plan. After-tax returns are presented for only one class and returns for other classes will vary. |
| 2 | The after-tax returns are calculated using the historic highest individual federal marginal income tax rates and do not reflect the impact of state and local taxes. |
| * | Fund returns are for past 10 years or since inception, whichever is less. Index returns are for 10 years or since inception of oldest share class, whichever is less. |
Management:
| | |
Investment Adviser: | | Portfolio Construction Manager: |
| |
Transamerica Asset Management, Inc. | | Morningstar Associates, LLC |
| |
| | Portfolio Construction Team: |
| |
| | Jon Hale, CFA, Co-Portfolio Manager since 2006 |
| |
| | Dan McNeela, CFA, Co-Portfolio Manager since 2010 |
| |
| | Hal Ratner, Co-Portfolio Manager since 2010 |
| |
| | Michael Stout, CFA, Co-Portfolio Manager since 2006 |
Purchase and Sale of Fund Shares: You may purchase, exchange or redeem shares of the fund on any day the New York Stock Exchange is open for business, online or through our website at www.transamericafunds.com, by mail to Transamerica Fund Services, Inc., P.O. Box 219945, Kansas City, MO 64121-9945, by telephone at 1-888-233-4339, or overnight mail to Transamerica Fund Services, Inc., 330 W. 9th Street, Kansas City, MO 64105. Shares may also be purchased through a financial intermediary. The minimum initial purchase for Class A and C shares is $1,000; the minimum subsequent investment is $50. The minimum initial purchase for payroll deduction and automatic investment plan is $500; the minimum subsequent investment is $50 per monthly fund account investment. The minimum investment for Class I shares is $1,000,000.
Tax Information: Fund distributions may be taxable as ordinary income or capital gains, except when your investment is in an IRA, 401(k) or other tax-advantaged investment plan.
Payments to Broker-Dealers and Other Financial Intermediaries: If you purchase the fund through a broker-dealer or other financial intermediary, the fund and/or its affiliates may pay the intermediary for the sale of fund shares and related services. These payments may create a conflict of interest by influencing the broker-dealer or other intermediary and your salesperson to recommend the fund over another investment. Ask your salesperson or visit your financial intermediary’s website for more information.
60
|
| TRANSAMERICA MULTI-MANAGER INTERNATIONAL PORTFOLIO |
Investment Objective: Seeks long-term capital appreciation.
Fees and Expenses: This table describes the fees and expenses that you may pay if you buy and hold shares of the fund. You may qualify for sales charge discounts if you and your family invest, or agree to invest in the future, at least $50,000 in Transamerica Funds. More information about these and other discounts is available from your financial professional and in the “Waivers and/or Reductions of Charges” section on page 120 of the fund’s prospectus and in the fund’s statement of additional information (SAI) under the heading “Purchase of Shares.”
| | | | | | | | |
Shareholder Fees (fees paid directly from your investment) |
| | | Class of Shares |
| | | A | | B* | | C | | I |
Maximum sales charge (load) imposed on purchases (as a % of offering price) | | 5.50% | | None | | None | | None |
| Maximum deferred sales charge (load) (as a percentage of purchase price or redemption proceeds, whichever is lower) | | None | | 5.00% | | 1.00% | | None |
Annual Fund Operating Expenses (expenses that you pay each year as a percentage of the value of your investment) |
| | | Class of Shares |
| | | A | | B* | | C | | I |
Management fees | | 0.10% | | 0.10% | | 0.10% | | 0.10% |
Distribution and service (12b-1) fees | | 0.35% | | 1.00% | | 1.00% | | None |
Other expenses | | 0.25% | | 0.39% | | 0.26% | | 0.24% |
Acquired Fund Fees and Expenses
(fees and expenses of underlying funds) | | 1.09% | | 1.09% | | 1.09% | | 1.09% |
| Total annual fund operating expensesa | | 1.79% | | 2.58% | | 2.45% | | 1.43% |
| Expense reductionb | | 0.00% | | 0.04% | | 0.00% | | 0.00% |
| Total annual fund operating expenses after expense reductiona | | 1.79% | | 2.54% | | 2.45% | | 1.43% |
| * | Not available to new investors. |
| a | Fund operating expenses do not correlate to the ratios of expenses to average net assets in the financial highlights table, which do not include acquired (i.e., underlying) funds’ fees and expenses. |
| b | Contractual arrangements have been made with the fund’s investment adviser, Transamerica Asset Management, Inc. (“TAM”), through March 1, 2012, to waive fees and/or reimburse fund expenses to the extent that the fund’s total operating expenses exceed 0.45%, excluding 12b-1 fees and extraordinary expenses and acquired (i.e. underlying) fund’s fees and expenses. TAM is entitled to reimbursement by the fund of fees waived or expenses reduced during any of the previous 36 months if on any day the estimated annualized fund operating expenses are less than the cap, excluding 12b-1 fees and extraordinary expenses and acquired (i.e. underlying) funds’ fees and expenses. The fund may not recapture any fees waived and/or reimbursed prior to March 1, 2008. |
Example: This Example is intended to help you compare the cost of investing in the fund with the cost of investing in other mutual funds. The Example assumes that you invest $10,000. The Example also assumes that your investment has a 5% return each year and that the fund’s operating expenses remain the same. Although your actual costs may be higher or lower, based on these assumptions your costs would be:
| | | | | | | | |
If the shares are redeemed at the end of each period: |
Share Class | | 1 year | | 3 years | | 5 years | | 10 years |
A | | $722 | | $1,082 | | $1,466 | | $2,539 |
B+ | | $757 | | $1,099 | | $1,467 | | $2,719 |
C | | $348 | | $ 764 | | $1,306 | | $2,786 |
I | | $146 | | $ 452 | | $ 782 | | $1,713 |
If the shares are not redeemed: | | | | |
Share Class | | 1 year | | 3 years | | 5 years | | 10 years |
A | | $722 | | $1,082 | | $1,466 | | $2,539 |
B+ | | $257 | | $ 799 | | $1,367 | | $2,719 |
C | | $248 | | $ 764 | | $1,306 | | $2,786 |
I | | $146 | | $ 452 | | $ 782 | | $1,713 |
| + | Examples for Class B shares assume conversion into Class A shares eight years after purchase. Class B shares are not available to new investors. |
The Example does not reflect sales charges (loads) on reinvested dividends (and other distributions). If these sales charges (loads) were included, your costs would be higher.
Portfolio Turnover: The fund pays transaction costs, such as commissions, when it buys and sells securities (or “turns over” its portfolio). A higher portfolio turnover rate may indicate higher transaction costs and may result in higher taxes when fund
61
shares are held in a taxable account. These costs, which are not reflected in annual fund operating expenses or in the Example, affect the fund’s performance. During the most recent fiscal year, the portfolio turnover rate was 11% of the average value of the fund’s portfolio.
Principal Investment Strategies: The fund seeks to achieve its investment objective by investing its assets in a combination of underlying Transamerica Funds (“underlying funds”).
| • | | Under normal circumstances, the fund expects to invest primarily in underlying funds that invest in international (developed and emerging markets) equities. These underlying funds generally expect to be invested in more than three different countries. |
| • | | Allocation of assets among the underlying funds is based on such things as diversification, general market outlooks (both domestic and global), historical performance, current valuations, and other global economic factors. |
| • | | The fund may also invest directly in U.S. government securities and/or short-term commercial paper. |
Each underlying fund has its own investment objective, principal investment strategies and investment risks. The “Underlying Funds” section of the prospectus lists the underlying funds currently available for investment by the fund, provides a summary of their respective investment objectives and principal investment strategies, and identifies certain risks of the underlying funds.
It is not possible to predict the extent to which the fund will be invested in a particular underlying fund at any time. The fund may be a significant shareholder in certain underlying funds.
The portfolio construction manager, Morningstar Associates, LLC, may change the fund’s asset allocations and underlying funds at any time without notice to shareholders and without shareholder approval.
Under adverse or unstable market, economic or political conditions, the fund may take temporary defensive positions in cash and short-term debt securities without limit.
Principal Risks: Many factors affect the fund’s performance. There is no assurance the fund will meet its investment objective. The value of your investment in the fund, as well as the amount of return you receive on your investment, may fluctuate significantly from day to day and over time. You may lose part or all of your investment in the fund or your investment may not perform as well as other similar investments. The following is a summary of certain risks (in alphabetical order) of investing in the fund. You may lose money if you invest in this fund.
| • | | Asset Allocation – The Portfolio Construction Manager allocates the fund’s assets among various underlying funds. These allocations may be unsuccessful in maximizing the fund’s return and/or avoiding investment losses, and may cause the fund to underperform other funds with a similar strategy. |
| • | | Cash Management and Defensive Investing – Money market instruments or short-term debt securities held by the fund for cash management or defensive investing purposes can fluctuate in value. Like other fixed income securities, they are subject to risk, including market, interest rate and credit risk. If the fund holds cash uninvested, the fund will not earn income on the cash and the fund’s yield will go down. If a significant amount of the fund’s assets are used for cash management or defensive investing purposes, it will be more difficult for the fund to achieve its objective. |
| • | | Currency – When the fund invests in securities denominated in foreign currencies, the fund may incur currency conversion costs and may be affected favorably or unfavorably by changes in the rates of exchange between those currencies and the U.S. dollar. Currency exchange rates can be volatile and are affected by, among other factors, the general economics of a country, the actions of the U.S. and foreign governments or control banks, the imposition of currency controls, and speculation. |
| • | | Emerging Markets – Investing in the securities of issuers located in or principally doing business in emerging markets are subject to foreign securities risks. These risks are greater for investments in emerging markets. Emerging market countries tend to have economic, political and legal systems that are less fully developed and are less stable than those of more advanced countries. Low trading volumes may result in a lack of liquidity and in extreme price volatility. |
| • | | Fixed-Income Securities – The market prices of fixed-income securities may go up or down, sometimes rapidly or unpredictably due to general market conditions, such as real or perceived adverse economic or political conditions, inflation, changes in interest rates, lack of liquidity in the bond markets or adverse investor sentiment. When market prices fall, the value of your investment will go down. A rise in rates tends to have a greater impact on the prices of longer term or duration securities. |
If interest rates rise, repayments of fixed-income securities may occur more slowly than anticipated by the market. This may drive the prices of these securities down because their interest rates are lower than the current interest rate and they remain outstanding longer. This is sometimes referred to as extension risk.
62
Many issuers have a right to prepay their securities. If interest rates fall, an issuer may exercise this right. If this happens, the fund will be forced to reinvest prepayment proceeds at a time when yields on securities available in the market are lower than the yield on the prepaid security. This is sometimes referred to as prepayment or call risk.
| • | | Foreign Securities – Foreign securities are subject to a number of additional risks, including nationalization or expropriation of assets, imposition of currency controls or restrictions, confiscatory taxation, political or financial instability and other adverse economic or political developments. Lack of information and less market regulation also may affect the value of these securities. |
| • | | Increase in Expenses – Your actual costs of investing in the fund may be higher than the expenses shown in “Annual Fund Operating Expenses” for a variety of reasons. For example, expense ratios may be higher than those shown if average net assets decrease. Net assets are more likely to decrease and fund expense ratios are more likely to increase when markets are volatile. |
| • | | Market – The market prices of the fund’s securities may go up or down, sometimes rapidly or unpredictably, due to general market conditions, such as real or perceived adverse economic or political conditions, inflation, changes in interest rates or currency rates, lack of liquidity in the markets or adverse investor sentiment. Market prices of securities also may go down due to events or conditions that affect particular sectors or issuers. When market prices fall, the value of your investment will go down. The fund may experience a substantial or complete loss on any individual security. The recent financial crisis has caused a significant decline in the value and liquidity of many securities. In response to the financial crisis, the U.S. and other governments and the Federal Reserve and certain foreign central banks have taken steps to support financial markets. The withdrawal of this support could negatively affect the value and liquidity of certain securities. In addition, legislation recently enacted in the U.S. calls for changes in many aspects of financial regulation. The impact of the legislation on the markets, and the practical implications for market participants, may not be fully known for some time. |
| • | | Stocks – Stocks may be volatile – their prices may go up and down dramatically over the shorter term. These price movements may result from factors affecting individual companies, industries, the securities market as a whole or the overall economy. |
| • | | Underlying Funds – Because the fund invests its assets in various underlying funds, its ability to achieve its investment objective depends largely on the performance of the underlying funds in which it invests. Each of the underlying funds in which the fund may invest has its own investment risks, and those risks can affect the value of the underlying funds’ shares and therefore the value of the fund’s investments. There can be no assurance that the investment objective of any underlying fund will be achieved. To the extent that the fund invests more of its assets in one underlying fund than in another, the fund will have greater exposure to the risks of that underlying fund. In addition, the fund will bear a pro rata portion of the operating expenses of the underlying funds in which it invests. The “Underlying Funds” section of the fund’s prospectus identifies certain risks of each underlying fund. |
Performance: The bar chart and the table below provide some indication of the risks of investing in the fund by showing you how the fund’s performance has varied from year to year, and how the fund’s average annual total returns for different periods compare to the returns of a broad measure of market performance. The bar chart does not reflect the impact of sales charges, which, if reflected, would lower the returns. The table, which shows average annual total returns for each class of shares of the fund, includes deduction of applicable sales charges. Absent any limitation of the fund’s expenses, total returns would be lower. As with all mutual funds, past performance (before and after taxes) is not a prediction of future results. Updated performance information is available on our website at www.transamericafunds.com or by calling 1-888-233-4339.
63
Annual Total Returns (calendar years ended December 31) – Class A
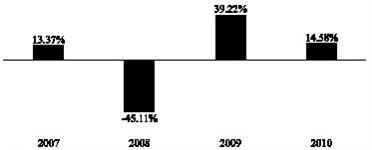
| | | | |
| | | Quarter Ended | | Return |
Best Quarter: | | 6/30/2009 | | 25.56% |
Worst Quarter: | | 12/31/2008 | | -22.43% |
Average Annual Total Returns (periods ended December 31, 2010)1
| | | | |
| | | 1 Year | | 10 Years or
Inception* |
Class A (commenced operations on March 1, 2006) | | | | |
Return before taxes | | 8.26% | | 1.51% |
Return after taxes on distributions2 | | 8.09% | | 1.01% |
Return after taxes on distributions and sale of fund shares2 | | 5.49% | | 1.15% |
Class B (Return before taxes only) (commenced operations on March 1, 2006) | | 8.76% | | 1.78% |
Class C (Return before taxes only) (commenced operations on March 1, 2006) | | 12.83% | | 2.03% |
Class I (Return before taxes only) (commenced operations on November 30, 2009) | | 15.08% | | 16.26% |
| Morgan Stanley Capital International World ex-U.S. Index (reflects no deduction for fees, expenses or taxes) | | 9.43% | | 2.42% |
| 1 | Actual returns may depend on the investor’s individual tax situation. After-tax returns may not be relevant if the investment is made through a tax-exempt or tax-deferred account, such as a 401(k) plan. After-tax returns are presented for only one class and returns for other classes will vary. |
| 2 | The after-tax returns are calculated using the historic highest individual federal marginal income tax rates and do not reflect the impact of state and local taxes. |
| * | Fund returns are for past 10 years or since inception, whichever is less. Index returns are for 10 years or since inception of oldest share class, whichever is less. |
Management:
| | |
| Investment Adviser: | | Portfolio Construction Manager: |
| |
| Transamerica Asset Management, Inc. | | Morningstar Associates, LLC |
| |
| | Portfolio Construction Team: |
| |
| | Jon Hale, CFA, Co-Portfolio Manager since 2006 |
| |
| | Dan McNeela, CFA, Co-Portfolio Manager since 2010 |
| |
| | Hal Ratner, Co-Portfolio Manager since 2010 |
| |
| | Michael Stout, CFA, Co-Portfolio Manager since 2006 |
Purchase and Sale of Fund Shares: You may purchase, exchange or redeem shares of the fund on any day the New York Stock Exchange is open for business, online or through our website at www.transamericafunds.com, by mail to Transamerica Fund Services, Inc., P.O. Box 219945, Kansas City, MO 64121-9945, by telephone at 1-888-233-4339, or overnight mail to Transamerica Fund Services, Inc., 330 W. 9th Street, Kansas City, MO 64105. Shares may also be purchased through a financial intermediary. The minimum initial purchase for Class A and C shares is $1,000; the minimum subsequent investment is $50. The minimum initial purchase for payroll deduction and automatic investment plan is $500; the minimum subsequent investment is $50 per monthly fund account investment. The minimum investment for Class I shares is $1,000,000. Class B shares are not available for purchase, including to existing Class B shareholders, except in the limited circumstances described in this prospectus under the section entitled “Shareholder Information – Buying Shares”.
64
Tax Information: Fund distributions may be taxable as ordinary income or capital gains, except when your investment is in an IRA, 401(k) or other tax-advantaged investment plan.
Payments to Broker-Dealers and Other Financial Intermediaries: If you purchase the fund through a broker-dealer or other financial intermediary, the fund and/or its affiliates may pay the intermediary for the sale of fund shares and related services. These payments may create a conflict of interest by influencing the broker-dealer or other intermediary and your salesperson to recommend the fund over another investment. Ask your salesperson or visit your financial intermediary’s website for more information.
65
|
| TRANSAMERICA SYSTEMATIC SMALL/MID CAP VALUE |
Investment Objective: Seeks to maximize total return.
Fees and Expenses: This table describes the fees and expenses that you may pay if you buy and hold shares of the fund. You may qualify for sales charge discounts if you and your family invest, or agree to invest in the future, at least $50,000 in Transamerica Funds. More information about these and other discounts is available from your financial professional and in the “Waivers and/or Reductions of Charges” section on page 120 of the fund’s prospectus and in the fund’s statement of additional information (SAI) under the heading “Purchase of Shares.”
| | | | | | | | |
| Shareholder Fees (fees paid directly from your investment) |
| | | Class of Shares |
| | | A | | B* | | C | | I |
Maximum sales charge (load) imposed on purchases (as a % of offering price) | | 5.50% | | None | | None | | None |
| Maximum deferred sales charge (load) (as a percentage of purchase price or redemption proceeds, whichever is lower) | | None | | 5.00% | | 1.00% | | None |
| Annual Fund Operating Expenses (expenses that you pay each year as a percentage of the value of your investment) |
| | | Class of Shares |
| | | A | | B* | | C | | I |
| Management fees | | 0.80% | | 0.80% | | 0.80% | | 0.80% |
| Distribution and service (12b-1) fees | | 0.35% | | 1.00% | | 1.00% | | None |
| Other expenses | | 0.32% | | 0.32% | | 0.27% | | 0.24% |
| Total annual fund operating expenses | | 1.47% | | 2.12% | | 2.07% | | 1.04% |
* Not available to new investors.
Example: This Example is intended to help you compare the cost of investing in the fund with the cost of investing in other mutual funds. The Example assumes that you invest $10,000. The Example also assumes that your investment has a 5% return each year and that the fund’s operating expenses remain the same. Although your actual costs may be higher or lower, based on these assumptions your costs would be:
| | | | | | | | |
If the shares are redeemed at the end of each period: |
| Share Class | | 1 year | | 3 years | | 5 years | | 10 years |
A | | $691 | | $989 | | $1,309 | | $2,211 |
B+ | | $715 | | $964 | | $1,239 | | $2,286 |
C | | $310 | | $649 | | $1,114 | | $2,400 |
I | | $106 | | $331 | | $ 574 | | $1,271 |
| If the shares are not redeemed: |
| Share Class | | 1 year | | 3 years | | 5 years | | 10 years |
A | | $691 | | $989 | | $1,309 | | $2,211 |
B+ | | $215 | | $664 | | $1,139 | | $2,286 |
C | | $210 | | $649 | | $1,114 | | $2,400 |
I | | $106 | | $331 | | $ 574 | | $1,271 |
| + | Examples for Class B shares assume conversion into Class A shares eight years after purchase. Class B shares are not available to new investors. |
The Example does not reflect sales charges (loads) on reinvested dividends (and other distributions). If these sales charges (loads) were included, your costs would be higher.
Portfolio Turnover: The fund pays transaction costs, such as commissions, when it buys and sells securities (or “turns over” its portfolio). A higher portfolio turnover rate may indicate higher transaction costs and may result in higher taxes when fund shares are held in a taxable account. These costs, which are not reflected in annual fund operating expenses or in the Example, affect the fund’s performance. During the most recent fiscal year, the portfolio turnover rate was 57% of the average value of the fund’s portfolio.
Principal Investment Strategies: The fund’s sub-adviser, Systematic Financial Management L.P. (“Systematic”), seeks to achieve the fund’s objective by investing, under normal circumstances, at least 80% of the fund’s net assets in small- and mid-cap equity securities (U.S. equity securities, ADRs and foreign securities trading on U.S. markets). The fund defines small- and mid-cap equities as companies whose market capitalization falls within the range of $100 million to $20 billion or within the range of the Russell 2500® Index, whichever is broader at the time of purchase.
66
The fund generally will invest in small- and mid-cap equities with valuation characteristics including low price/earnings and price/cash flow ratios. Systematic’s security selection process generally favors companies with positive earnings dynamics, manageable debt levels and good cash flows. Trends in balance sheet items including inventories, accounts receivable, and payables are scrutinized as well. Systematic also reviews the company’s products/services, market position, industry condition, financial and accounting policies and quality of management. Securities of issuers that possess the greatest combination of the aforementioned attributes are then prioritized as candidates for purchase.
The fund may invest up to 10% of its total assets in the securities of foreign issuers, including ADRs and foreign securities trading on U.S. markets.
Systematic employs a fully invested strategy. Therefore, under normal market conditions, cash and cash equivalents are generally less than 5% of the portfolio value.
The fund may invest in cash, cash equivalent securities or short-term debt securities, repurchase agreements and money market instruments. Under adverse or unstable market, economic or political conditions, the fund may take temporary defensive positions in cash and short-term debt securities without limit.
Principal Risks: Many factors affect the fund’s performance. There is no assurance the fund will meet its investment objective. The value of your investment in the fund, as well as the amount of return you receive on your investment, may fluctuate significantly from day to day and over time. You may lose part or all of your investment in the fund or your investment may not perform as well as other similar investments. The following is a summary of certain risks (in alphabetical order) of investing in the fund. You may lose money if you invest in this fund.
| • | | Cash Management and Defensive Investing – Money market instruments or short-term debt securities held by the fund for cash management or defensive investing purposes can fluctuate in value. Like other fixed income securities, they are subject to risk, including market, interest rate and credit risk. If the fund holds cash uninvested, the fund will not earn income on the cash and the fund’s yield will go down. If a significant amount of the fund’s assets are used for cash management or defensive investing purposes, it will be more difficult for the fund to achieve its objective. |
| • | | Currency – When the fund invests in securities denominated in foreign currencies, the fund may incur currency conversion costs and may be affected favorably or unfavorably by changes in the rates of exchange between those currencies and the U.S. dollar. Currency exchange rates can be volatile and are affected by, among other factors, the general economics of a country, the actions of the U.S. and foreign governments or control banks, the imposition of currency controls, and speculation. |
| • | | Emerging Markets – Investing in the securities of issuers located in or principally doing business in emerging markets are subject to foreign securities risks. These risks are greater for investments in emerging markets. Emerging market countries tend to have economic, political and legal systems that are less fully developed and are less stable than those of more advanced countries. Low trading volumes may result in a lack of liquidity and in extreme price volatility. |
| • | | Foreign Securities – Foreign securities are subject to a number of additional risks, including nationalization or expropriation of assets, imposition of currency controls or restrictions, confiscatory taxation, political or financial instability and other adverse economic or political developments. Lack of information and less market regulation also may affect the value of these securities. |
| • | | Increase in Expenses – Your actual costs of investing in the fund may be higher than the expenses shown in “Annual Fund Operating Expenses” for a variety of reasons. For example, expense ratios may be higher than those shown if average net assets decrease. Net assets are more likely to decrease and fund expense ratios are more likely to increase when markets are volatile. |
| • | | Market – The market prices of the fund’s securities may go up or down, sometimes rapidly or unpredictably, due to general market conditions, such as real or perceived adverse economic or political conditions, inflation, changes in interest rates or currency rates, lack of liquidity in the markets or adverse investor sentiment. Market prices of securities also may go down due to events or conditions that affect particular sectors or issuers. When market prices fall, the value of your investment will go down. The fund may experience a substantial or complete loss on any individual security. The recent financial crisis has caused a significant decline in the value and liquidity of many securities. In response to the financial crisis, the U.S. and other governments and the Federal Reserve and certain foreign central banks have taken steps to support financial markets. The withdrawal of this support could negatively affect the value and liquidity of certain securities. In addition, legislation recently enacted in the U.S. calls for changes in many aspects of financial regulation. The impact of the legislation on the markets, and the practical implications for market participants, may not be fully known for some time. |
| • | | Portfolio Selection – The sub-adviser’s judgment about a particular security or issuer, or about the economy or a particular sector, region or market segment, or about an investment strategy, may prove to be incorrect. |
67
| • | | Small- or Medium-Sized Companies – Small- or medium-sized companies may be more at risk than larger companies because, among other things, they may have limited product lines, operating history, market or financial resources, or because they may depend on a limited management group. |
| • | | Stocks – Stocks may be volatile – their prices may go up and down dramatically over the shorter term. These price movements may result from factors affecting individual companies, industries, the securities market as a whole or the overall economy. |
| • | | Value Investing – The prices of securities the sub-adviser believes are undervalued may not appreciate as anticipated or may go down. Value stocks as a group may be out of favor and underperform the overall equity market for a long period of time, for example, while the market favors “growth” stocks. |
Performance: The bar chart and the table below provide some indication of the risks of investing in the fund by showing you how the fund’s performance has varied from year to year, and how the fund’s average annual total returns for different periods compare to the returns of a broad measure of market performance. The bar chart does not reflect the impact of sales charges, which, if reflected, would lower the returns. The table, which shows average annual total returns for each class of shares of the fund, includes deduction of applicable sales charges. Absent any limitation of the fund’s expenses, total returns would be lower. As with all mutual funds, past performance (before and after taxes) is not a prediction of future results. Updated performance information is available on our website at www.transamericafunds.com or by calling 1-888-233-4339.
Prior to March 1, 2004, the fund had a different sub-adviser, a different investment objective and used different investment strategies. The performance set forth prior to that date is attributable to the previous sub-adviser.
Prior to March 22, 2011, the fund was named Transamerica Small/Mid Cap Value, had a different sub-adviser and used different investment strategies. The performance set forth prior to that date is attributable to the previous sub-adviser.
Annual Total Returns (calendar years ended December 31) – Class A
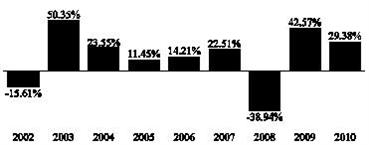
| | | | |
| | | Quarter Ended | | Return |
| Best Quarter: | | 6/30/2003 | | 30.88% |
| Worst Quarter: | | 9/30/2002 | | -26.15% |
Average Annual Total Returns (periods ended December 31, 2010)1
| | | | | | |
| | | 1 Year | | 5 Years | | 10 Years or Inception* |
Class A (commenced operations on April 2, 2001) |
Return before taxes | | 22.27% | | 8.29% | | 11.54% |
Return after taxes on distributions2 | | 22.27% | | 7.73% | | 10.77% |
Return after taxes on distributions and sale of fund shares2 | | 14.47% | | 7.11% | | 10.02% |
| Class B (Return before taxes only) (commenced operations on April 2, 2001) | | 23.56% | | 8.67% | | 11.57% |
Class C (Return before taxes only) (commenced operations on November 11, 2002) | | 27.55% | | 8.86% | | 15.33% |
Class I (Return before taxes only) (commenced operations on November 30, 2009) | | 29.99% | | N/A | | 36.57% |
Russell 2500® Value Index (reflects no deduction for fees, expenses or taxes) | | 24.82% | | 3.85% | | 8.98% |
| 1 | Actual returns may depend on the investor’s individual tax situation. After-tax returns may not be relevant if the investment is made through a tax-exempt or tax-deferred account, such as a 401(k) plan. After-tax returns are presented for only one class and returns for other classes will vary. |
| 2 | The after-tax returns are calculated using the historic highest individual federal marginal income tax rates and do not reflect the impact of state and local taxes. |
| * | Fund returns are for past 10 years or since inception, whichever is less. Index returns are for 10 years or since inception of oldest share class, whichever is less. |
68
Management:
| | |
| Investment Adviser: | | Sub-Adviser: |
| |
| Transamerica Asset Management, Inc. | | Systematic Financial Management L.P. |
| |
| | Portfolio Managers: |
| |
| | Kenneth Burgess, CFA, Portfolio Manager since 2011 |
| |
| | Ron Mushock, CFA, Portfolio Manager since 2011 |
Purchase and Sale of Fund Shares: You may purchase, exchange or redeem shares of the fund on any day the New York Stock Exchange is open for business, online or through our website at www.transamericafunds.com, by mail to Transamerica Fund Services, Inc., P.O. Box 219945, Kansas City, MO 64121-9945, by telephone at 1-888-233-4339, or overnight mail to Transamerica Fund Services, Inc., 330 W. 9th Street, Kansas City, MO 64105. Shares may also be purchased through a financial intermediary. The minimum initial purchase for Class A and C shares is $1,000; the minimum subsequent investment is $50. The minimum initial purchase for payroll deduction and automatic investment plan is $500; the minimum subsequent investment is $50 per monthly fund account investment. The minimum investment for Class I shares is $1,000,000. Class B shares are not available for purchase, including to existing Class B shareholders, except in the limited circumstances described in this prospectus under the section entitled “Shareholder Information – Buying Shares”.
Tax Information: Fund distributions may be taxable as ordinary income or capital gains, except when your investment is in an IRA, 401(k) or other tax-advantaged investment plan.
Payments to Broker-Dealers and Other Financial Intermediaries: If you purchase the fund through a broker-dealer or other financial intermediary, the fund and/or its affiliates may pay the intermediary for the sale of fund shares and related services. These payments may create a conflict of interest by influencing the broker-dealer or other intermediary and your salesperson to recommend the fund over another investment. Ask your salesperson or visit your financial intermediary’s website for more information.
69
|
| TRANSAMERICA TS&W INTERNATIONAL EQUITY |
Investment Objective: Seeks maximum long-term total return, consistent with reasonable risk to principal, by investing in a diversified portfolio of common stocks of primarily non-U.S. issuers.
Fees and Expenses: This table describes the fees and expenses that you may pay if you buy and hold shares of the fund. You may qualify for sales charge discounts if you and your family invest, or agree to invest in the future, at least $50,000 in Transamerica Funds. More information about these and other discounts is available from your financial professional and in the “Waivers and/or Reductions of Charges” section on page 120 of the fund’s prospectus and in the fund’s statement of additional information (SAI) under the heading “Purchase of Shares.”
| | | | | | |
| Shareholder Fees (fees paid directly from your investment) |
| | | Class of Shares |
| | | A | | C | | I |
Maximum sales charge (load) imposed on purchases (as a % of offering price) | | 5.50% | | None | | None |
| Maximum deferred sales charge (load) (as a percentage of purchase price or redemption proceeds, whichever is lower) | | None | | 1.00% | | None |
| Annual Fund Operating Expenses (expenses that you pay each year as a percentage of the value of your investment)a |
| | | Class of Shares |
| | | A | | C | | I |
| Management fees | | 0.80% | | 0.80% | | 0.80% |
| Distribution and service (12b-1) fees | | 0.35% | | 1.00% | | None |
| Other expenses | | 0.30% | | 0.27% | | 0.30% |
| Total annual fund operating expenses | | 1.45% | | 2.07% | | 1.10% |
| a | Annual fund operating expenses are based on estimates for the current fiscal year. |
Example: This Example is intended to help you compare the cost of investing in the fund with the cost of investing in other mutual funds. The Example assumes that you invest $10,000. The Example also assumes that your investment has a 5% return each year and that the fund’s operating expenses remain the same. Although your actual costs may be higher or lower, based on these assumptions your costs would be:
| | | | |
| |
| If the shares are redeemed at the end of each period: |
| Share Class | | 1 year | | 3 years |
A | | $689 | | $983 |
C | | $310 | | $649 |
I | | $112 | | $350 |
| |
| If the shares are not redeemed: |
| Share Class | | | | |
A | | $689 | | $983 |
C | | $210 | | $649 |
I | | $112 | | $350 |
The Example does not reflect sales charges (loads) on reinvested dividends (and other distributions). If these sales charges (loads) were included, your costs would be higher.
Portfolio Turnover: The fund pays transaction costs, such as commissions, when it buys and sells securities (or “turns over” its portfolio). A higher portfolio turnover rate may indicate higher transaction costs and may result in higher taxes when fund shares are held in a taxable account. These costs, which are not reflected in annual fund operating expenses or in the Example, affect the fund performance. Portfolio turnover rate is not included because the fund did not commence operations until the date of this prospectus.
Principal Investment Strategies: Under normal circumstances, the fund seeks to achieve its investment objective by investing at least 80% of its net assets in equity securities of foreign companies representing at least three countries other than the United States. Thompson, Siegel & Walmsley LLC (“TS&W”), the fund’s sub-adviser, currently anticipates investing in at least 12 countries other than the United States. TS&W will emphasize established companies in individual foreign markets and will attempt to stress companies and markets that it believes are undervalued. The fund expects capital growth to be the predominant component of its total return.
70
Generally, the fund will invest primarily in common stocks of established companies listed on foreign securities exchanges, but it may also invest in securities traded over-the-counter. Although the fund will emphasize larger, more seasoned or established companies, it may invest in companies of varying size as measured by assets, sales or market capitalization. The fund will invest primarily in securities of companies domiciled in developed countries, but may invest up to 10% of its assets in securities of companies in developing countries. It is expected that investments will be diversified throughout the world and within markets in an effort to minimize specific country and currency risks.
TS&W employs a relative value process utilizing a combination of quantitative and qualitative methods based on a four-factor valuation screen designed to outperform the Morgan Stanley Capital International EAFE Index. TS&W’s analysts also perform rigorous fundamental analysis. A portfolio composed of 80-100 stocks is selected as a result of this process. TS&W generally limits its investment universe to those companies with a minimum of three years of operating history. TS&W employs a consistent sell discipline which includes a significant negative earnings revision, a stock being sold when the catalyst is no longer valid or another stock presents a more attractive opportunity.
The fund may invest its assets in cash, cash equivalent securities or short-term debt securities, repurchase agreements and money market instruments. Under adverse or unstable market, economic or political conditions, the fund may take temporary defensive positions in cash and short-term debt securities without limit.
Principal Risks: Many factors affect the fund’s performance. There is no assurance the fund will meet its investment objective. The value of your investment in the fund, as well as the amount of return you receive on your investment, may fluctuate significantly from day to day and over time. You may lose part or all of your investment in the fund or your investment may not perform as well as other similar investments. The following is a summary of certain risks (in alphabetical order) of investing in the fund. You may lose money if you invest in this fund.
| • | | Cash Management and Defensive Investing – Money market instruments or short-term debt securities held by the fund for cash management or defensive investing purposes can fluctuate in value. Like other fixed income securities, they are subject to risk, including market, interest rate and credit risk. If the fund holds cash uninvested, the fund will not earn income on the cash and the fund’s yield will go down. If a significant amount of the fund’s assets are used for cash management or defensive investing purposes, it will be more difficult for the fund to achieve its objective. |
| • | | Currency – When the fund invests in securities denominated in foreign currencies, the fund may incur currency conversion costs and may be affected favorably or unfavorably by changes in the rates of exchange between those currencies and the U.S. dollar. Currency exchange rates can be volatile and are affected by, among other factors, the general economics of a country, the actions of the U.S. and foreign governments or control banks, the imposition of currency controls, and speculation. |
| • | | Derivatives – Using derivatives can increase fund losses and reduce opportunities for gains when market prices, interest rates or the derivative instruments themselves behave in a way not anticipated by the fund. Using derivatives also can have a leveraging effect and increase fund volatility. Derivatives may be difficult to sell, unwind or value, and the counterparty may default on its obligations to the fund. The fund’s investments in derivative instruments may involve a small investment relative to the amount of investment exposure assumed and may result in losses exceeding the amounts invested in those instruments. Recent legislation calls for new regulation of the derivatives markets. The extent and impact of the regulation are not yet fully known and may not be for some time. New regulation of derivatives may make them more costly, may limit their availability, or may otherwise adversely affect their value or performance. |
| • | | Emerging Markets – Investing in the securities of issuers located in or principally doing business in emerging markets are subject to foreign securities risks. These risks are greater for investments in emerging markets. Emerging market countries tend to have economic, political and legal systems that are less fully developed and are less stable than those of more advanced countries. Low trading volumes may result in a lack of liquidity and in extreme price volatility. |
| • | | Foreign Securities – Foreign securities are subject to a number of additional risks, including nationalization or expropriation of assets, imposition of currency controls or restrictions, confiscatory taxation, political or financial instability and other adverse economic or political developments. Lack of information and less market regulation also may affect the value of these securities. |
| • | | Geographic – To the extent the fund invests a significant portion of its assets in issuers located in a single country, a small number of countries, or a particular geographic region, the fund will be more susceptible to negative events affecting those countries or that region, and could be more volatile than a more geographically diverse fund. Geographic risk is especially high in emerging markets. |
| • | | Increase in Expenses – Your actual costs of investing in the fund may be higher than the expenses shown in “Annual Fund Operating Expenses” for a variety of reasons. For example, expense ratios may be higher than those shown if average net |
71
| | assets decrease. Net assets are more likely to decrease and fund expense ratios are more likely to increase when markets are volatile. |
| • | | Liquidity – Some securities held by the fund may be difficult to sell, or illiquid, particularly during times of market turmoil. Illiquid securities may also be difficult to value. If the fund is forced to sell an illiquid asset to meet redemption requests or other cash needs, the fund may be forced to sell at a loss. |
| • | | Market – The market prices of the fund’s securities may go up or down, sometimes rapidly or unpredictably, due to general market conditions, such as real or perceived adverse economic or political conditions, inflation, changes in interest rates or currency rates, lack of liquidity in the markets or adverse investor sentiment. Market prices of securities also may go down due to events or conditions that affect particular sectors or issuers. When market prices fall, the value of your investment will go down. The fund may experience a substantial or complete loss on any individual security. The recent financial crisis has caused a significant decline in the value and liquidity of many securities. In response to the financial crisis, the U.S. and other governments and the Federal Reserve and certain foreign central banks have taken steps to support financial markets. The withdrawal of this support could negatively affect the value and liquidity of certain securities. In addition, legislation recently enacted in the U.S. calls for changes in many aspects of financial regulation. The impact of the legislation on the markets, and the practical implications for market participants, may not be fully known for some time. |
| • | | Portfolio Selection – The sub-adviser’s judgment about a particular security or issuer, or about the economy or a particular sector, region or market segment, or about an investment strategy, may prove to be incorrect. |
| • | | Small- or Medium-Sized Companies – Small- or medium-sized companies may be more at risk than larger companies because, among other things, they may have limited product lines, operating history, market or financial resources, or because they may depend on a limited management group. |
| • | | Stocks – Stocks may be volatile – their prices may go up and down dramatically over the shorter term. These price movements may result from factors affecting individual companies, industries, the securities market as a whole or the overall economy. |
| • | | Value Investing – The prices of securities the sub-adviser believes are undervalued may not appreciate as anticipated or may go down. Value stocks as a group may be out of favor and underperform the overall equity market for a long period of time, for example, while the market favors “growth” stocks. |
Performance: The bar chart and the table below provide some indication of the risks of investing in the fund by showing you how the fund’s performance has varied from year to year, and how the fund’s Class I average annual total returns for different periods compare to the returns of a broad measure of market performance. The table shows average annual total returns for Class I shares of the fund. Absent any limitation of the fund’s expenses, total returns would be lower. As with all mutual funds, past performance (before and after taxes) is not a prediction of future results. Updated performance information is available on our website at www.transamericafunds.com or by calling 1-888-233-4339.
The fund is newly organized. The fund acquired the assets and assumed the liabilities of TS&W International Equity Portfolio (the “predecessor fund”) on February 28, 2011, and the predecessor fund is the accounting and performance survivor of the reorganization. This means that the predecessor fund’s performance and financial history have been adopted by the fund and will be used going forward from the date of the reorganization. (The predecessor fund acquired the assets and assumed the historical performance of another fund on June 24, 2002. The performance shown prior to that date represents the performance of that fund.) In connection with the predecessor fund reorganization, former shareholders of the predecessor fund received Class I shares of the fund. Accordingly, the performance of Class I shares of the fund reflects the performance of the predecessor fund. Performance has not been restated to reflect the estimated annual operating expenses of Class I shares.
Although Class A and Class C shares would have similar annual returns to Class I shares because the classes are invested in the same portfolio of securities, the returns for Class A and Class C shares would be lower than Class I shares because of the lower expenses paid by Class I shares. Performance information for Class A and Class C shares will be included after the share classes have been in operation for one complete calendar year.
72
Annual Total Returns (calendar years ended December 31) – Class I
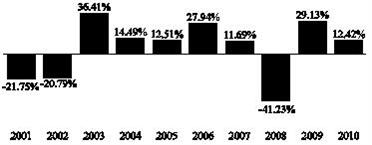
| | | | |
| Class I Shares | | Quarter Ended | | Return |
Best Quarter: | | 6/30/2009 | | 24.59% |
Worst Quarter: | | 9/30/2002 | | -21.31% |
Average Annual Total Returns (periods ended December 31, 2010)1
| | | | | | |
| | | 1 Year | | 5 Years | | 10 Years or
Inception* |
Class I (predecessor fund commenced operations on December 18, 1992) | | | | | | |
Return before taxes | | 12.42% | | 4.04% | | 2.88% |
Return after taxes on distributions2 | | 11.89% | | 3.23% | | 2.55% |
Return after taxes on distributions and sale of fund shares2 | | 8.07% | | 3.64% | | 2.67% |
Morgan Stanley Capital International Europe, Australasia, Far East Index (reflects no deduction for fees, expenses, or taxes) | | 7.75% | | 2.46% | | 3.50% |
| 1 | Actual returns may depend on the investor’s individual tax situation. After-tax returns may not be relevant if the investment is made through a tax-exempt or tax-deferred account, such as a 401(k) plan. After-tax returns are presented for only one class and returns for other classes will vary. |
| 2 | The after-tax returns are calculated using the historic highest individual federal marginal income tax rates and do not reflect the impact of state and local taxes. |
| * | Fund returns are for past 10 years or since inception, whichever is less. Index returns are for 10 years or since inception of oldest share class, whichever is less. |
Management:
| | |
Investment Adviser: | | Sub-Adviser: |
| |
Transamerica Asset Management, Inc. | | Thompson, Siegel & Walmsley LLC |
| |
| | Portfolio Manager: |
| |
| | Brandon H. Harrell, CFA, Portfolio Manager since 2011 |
Purchase and Sale of Fund Shares: You may purchase, exchange or redeem shares of the fund on any day the New York Stock Exchange is open for business, online or through our website at www.transamericafunds.com, by mail to Transamerica Fund Services, Inc., P.O. Box 219945, Kansas City, MO 64121-9945, by telephone at 1-888-233-4339, or overnight mail to Transamerica Fund Services, Inc., 330 W. 9th Street, Kansas City, MO 64105. Shares may also be purchased through a financial intermediary. The minimum initial purchase for Class A and C shares is $1,000; the minimum subsequent investment is $50. The minimum initial purchase for payroll deduction and automatic investment plan is $500; the minimum subsequent investment is $50 per monthly fund account investment. The minimum investment for Class I shares is $1,000,000.
Tax Information: Fund distributions may be taxable as ordinary income or capital gains, except when your investment is in an IRA, 401(k) or other tax-advantaged investment plan.
Payments to Broker-Dealers and Other Financial Intermediaries: If you purchase the fund through a broker-dealer or other financial intermediary, the fund and/or its affiliates may pay the intermediary for the sale of fund shares and related services. These payments may create a conflict of interest by influencing the broker-dealer or other intermediary and your salesperson to recommend the fund over another investment. Ask your salesperson or visit your financial intermediary’s website for more information.
73
|
| TRANSAMERICA WMC DIVERSIFIED EQUITY |
Investment Objective: Seeks to maximize long-term growth.
Fees and Expenses: This table describes the fees and expenses that you may pay if you buy and hold shares of the fund. You may qualify for sales charge discounts if you and your family invest, or agree to invest in the future, at least $50,000 in Transamerica Funds. More information about these and other discounts is available from your financial professional and in the “Waivers and/or Reductions of Charges” section on page 120 of the fund’s prospectus and in the fund’s statement of additional information (SAI) under the heading “Purchase of Shares.”
| | | | | | | | |
| Shareholder Fees (fees paid directly from your investment) |
| | | Class of Shares |
| | | A | | B* | | C | | I |
Maximum sales charge (load) imposed on purchases (as a % of offering price) | | 5.50% | | None | | None | | None |
| Maximum deferred sales charge (load) (as a percentage of purchase price or redemption proceeds, whichever is lower) | | None | | 5.00% | | 1.00% | | None |
| Annual Fund Operating Expenses (expenses that you pay each year as a percentage of the value of your investment) |
| | | Class of Shares |
| | | A | | B* | | C | | I |
| Management fees | | 0.72% | | 0.72% | | 0.72% | | 0.72% |
| Distribution and service (12b-1) fees | | 0.35% | | 1.00% | | 1.00% | | None |
| Other expenses | | 0.65% | | 0.72% | | 0.59% | | 1.09% |
| Total annual fund operating expenses | | 1.72% | | 2.44% | | 2.31% | | 1.81% |
| Expense reductiona | | 0.20% | | 0.27% | | 0.14% | | 0.64% |
| Total annual fund operating expenses after expense reduction | | 1.52% | | 2.17% | | 2.17% | | 1.17% |
| * | Not available to new investors. |
| a | Contractual arrangements have been made with the fund’s investment adviser, Transamerica Asset Management, Inc. (“TAM”), through March 1, 2012, to waive fees and/or reimburse fund expenses to the extent that the fund’s total operating expenses exceed 1.17%, excluding 12b-1 fees and extraordinary expenses. TAM is entitled to reimbursement by the fund of fees waived or expenses reduced during any of the previous 36 months if on any day the estimated annualized fund operating expenses are less than the cap, excluding 12b-1 fees and extraordinary expenses. |
Example: This Example is intended to help you compare the cost of investing in the fund with the cost of investing in other mutual funds. The Example assumes that you invest $10,000. The Example also assumes that your investment has a 5% return each year and that the fund’s operating expenses remain the same. Although your actual costs may be higher or lower, based on these assumptions your costs would be:
| | | | | | | | |
If the shares are redeemed at the end of each period: |
| Share Class | | 1 year | | 3 years | | 5 years | | 10 years |
A | | $696 | | $1,044 | | $1,414 | | $2,453 |
B+ | | $720 | | $1,035 | | $1,376 | | $2,578 |
C | | $320 | | $ 708 | | $1,223 | | $2,635 |
I | | $119 | | $ 507 | | $ 920 | | $2,074 |
| If the shares are not redeemed: | | | | |
| Share Class | | 1 year | | 3 years | | 5 years | | 10 years |
A | | $696 | | $1,044 | | $1,414 | | $2,453 |
B+ | | $220 | | $ 735 | | $1,276 | | $2,578 |
C | | $220 | | $ 708 | | $1,223 | | $2,635 |
I | | $119 | | $ 507 | | $ 920 | | $2,074 |
| + | Examples for Class B shares assume conversion into Class A shares eight years after purchase. Class B shares are not available to new investors. |
The Example does not reflect sales charges (loads) on reinvested dividends (and other distributions). If these sales charges (loads) were included, your costs would be higher.
Portfolio Turnover: The fund pays transaction costs, such as commissions, when it buys and sells securities (or “turns over” its portfolio). A higher portfolio turnover rate may indicate higher transaction costs and may result in higher taxes when fund shares are held in a taxable account. These costs, which are not reflected in annual fund operating expenses or in the Example, affect the fund’s performance. During the most recent fiscal year, the portfolio turnover rate was 79% of the average value of the fund’s portfolio.
74
Principal Investment Strategies: The fund invests, under normal circumstances, at least 80% of its net assets in domestic equity securities. The fund invests primarily in common stocks of growth-oriented companies. Each stock is evaluated and ranked on a consistent set of growth, valuation, and quality criteria and the fund will seek diversified sources of return from these criteria.
The fund’s sub-adviser, Wellington Management Company, LLP (“Wellington Management”), uses what is sometimes referred to as a “bottom-up” approach, which is the use of fundamental analysis to identify specific securities within industries or sectors for purchase or sale. A “bottom-up” approach is looking at individual companies against the context of broader market factors.
Wellington Management continually monitors every company in the fund’s portfolio for fundamental attractiveness. The fund typically sells an investment when the investment achieves its anticipated potential, the company begins to show deteriorating relative fundamentals or alternative investments become sufficiently more attractive.
Consistent with the fund’s objective and other policies, the fund may invest to a lesser extent in derivatives, including futures, forwards, options and swaps. The fund may invest up to 20% of its total assets in foreign securities (not including American Depositary Receipts, American Depositary Shares or U.S. dollar denominated securities of foreign issuers).
The fund may invest in cash, cash equivalent securities or short-term debt securities, repurchase agreements and money market instruments. Under adverse or unstable market, economic or political conditions, the fund may take temporary defensive positions in cash and short-term debt securities without limit.
Principal Risks: Many factors affect the fund’s performance. There is no assurance the fund will meet its investment objective. The value of your investment in the fund, as well as the amount of return you receive on your investment, may fluctuate significantly from day to day and over time. You may lose part or all of your investment in the fund or your investment may not perform as well as other similar investments. The following is a summary of certain risks (in alphabetical order) of investing in the fund. You may lose money if you invest in this fund.
| • | | Cash Management and Defensive Investing – Money market instruments or short-term debt securities held by the fund for cash management or defensive investing purposes can fluctuate in value. Like other fixed income securities, they are subject to risk, including market, interest rate and credit risk. If the fund holds cash uninvested, the fund will not earn income on the cash and the fund’s yield will go down. If a significant amount of the fund’s assets are used for cash management or defensive investing purposes, it will be more difficult for the fund to achieve its objective. |
| • | | Currency – When the fund invests in securities denominated in foreign currencies, the fund may incur currency conversion costs and may be affected favorably or unfavorably by changes in the rates of exchange between those currencies and the U.S. dollar. Currency exchange rates can be volatile and are affected by, among other factors, the general economics of a country, the actions of the U.S. and foreign governments or control banks, the imposition of currency controls, and speculation. |
| • | | Derivatives – Using derivatives can increase fund losses and reduce opportunities for gains when market prices, interest rates or the derivative instruments themselves behave in a way not anticipated by the fund. Using derivatives also can have a leveraging effect and increase fund volatility. Derivatives may be difficult to sell, unwind or value, and the counterparty may default on its obligations to the fund. The fund’s investments in derivative instruments may involve a small investment relative to the amount of investment exposure assumed and may result in losses exceeding the amounts invested in those instruments. Recent legislation calls for new regulation of the derivatives markets. The extent and impact of the regulation are not yet fully known and may not be for some time. New regulation of derivatives may make them more costly, may limit their availability, or may otherwise adversely affect their value or performance. |
| • | | Fixed-Income Securities – The market prices of fixed-income securities may go up or down, sometimes rapidly or unpredictably due to general market conditions, such as real or perceived adverse economic or political conditions, inflation, changes in interest rates, lack of liquidity in the bond markets or adverse investor sentiment. When market prices fall, the value of your investment will go down. A rise in rates tends to have a greater impact on the prices of longer term or duration securities. |
If interest rates rise, repayments of fixed-income securities may occur more slowly than anticipated by the market. This may drive the prices of these securities down because their interest rates are lower than the current interest rate and they remain outstanding longer. This is sometimes referred to as extension risk.
Many issuers have a right to prepay their securities. If interest rates fall, an issuer may exercise this right. If this happens, the fund will be forced to reinvest prepayment proceeds at a time when yields on securities available in the market are lower than the yield on the prepaid security. This is sometimes referred to as prepayment or call risk.
75
| • | | Focused Investing – To the extent the fund invests in a limited number of issuers, changes in the value of individual securities may have a significant impact on your investment. |
| • | | Foreign Securities – Foreign securities are subject to a number of additional risks, including nationalization or expropriation of assets, imposition of currency controls or restrictions, confiscatory taxation, political or financial instability and other adverse economic or political developments. Lack of information and less market regulation also may affect the value of these securities. |
| • | | Growth Stocks – Returns on growth stocks may not move in tandem with returns on other categories of stocks or the market as a whole. Growth stocks may be particularly susceptible to rapid price swings or to adverse developments. Growth stocks as a group may be out of favor and underperform the overall equity market for a long period of time, for example, while the market favors “value” stocks. |
| • | | Increase in Expenses – Your actual costs of investing in the fund may be higher than the expenses shown in “Annual Fund Operating Expenses” for a variety of reasons. For example, expense ratios may be higher than those shown if average net assets decrease. Net assets are more likely to decrease and fund expense ratios are more likely to increase when markets are volatile. |
| • | | Market – The market prices of the fund’s securities may go up or down, sometimes rapidly or unpredictably, due to general market conditions, such as real or perceived adverse economic or political conditions, inflation, changes in interest rates or currency rates, lack of liquidity in the markets or adverse investor sentiment. Market prices of securities also may go down due to events or conditions that affect particular sectors or issuers. When market prices fall, the value of your investment will go down. The fund may experience a substantial or complete loss on any individual security. The recent financial crisis has caused a significant decline in the value and liquidity of many securities. In response to the financial crisis, the U.S. and other governments and the Federal Reserve and certain foreign central banks have taken steps to support financial markets. The withdrawal of this support could negatively affect the value and liquidity of certain securities. In addition, legislation recently enacted in the U.S. calls for changes in many aspects of financial regulation. The impact of the legislation on the markets, and the practical implications for market participants, may not be fully known for some time. |
| • | | Portfolio Selection – The sub-adviser’s judgment about a particular security or issuer, or about the economy or a particular sector, region or market segment, or about an investment strategy, may prove to be incorrect. |
| • | | Small- or Medium-Sized Companies – Small- or medium-sized companies may be more at risk than larger companies because, among other things, they may have limited product lines, operating history, market or financial resources, or because they may depend on a limited management group. |
| • | | Stocks – Stocks may be volatile – their prices may go up and down dramatically over the shorter term. These price movements may result from factors affecting individual companies, industries, the securities market as a whole or the overall economy. |
| • | | Value Investing – The prices of securities the sub-adviser believes are undervalued may not appreciate as anticipated or may go down. Value stocks as a group may be out of favor and underperform the overall equity market for a long period of time, for example, while the market favors “growth” stocks. |
Performance: The bar chart and the table below provide some indication of the risks of investing in the fund by showing you how the fund’s performance has varied from year to year, and how the fund’s average annual total returns for different periods compare to the returns of a broad measure of market performance. The bar chart does not reflect the impact of sales charges, which, if reflected, would lower the returns. The table, which shows average annual total returns for each class of shares of the fund, includes deduction of applicable sales charges. Absent any limitation of the fund’s expenses, total returns would be lower. As with all mutual funds, past performance (before and after taxes) is not a prediction of future results. Updated performance information is available on our website at www.transamericafunds.com or by calling 1-888-233-4339.
On November 13, 2009, the fund acquired the assets and assumed the liabilities of two Transamerica Funds and two Transamerica Premier Funds, including Transamerica Premier Diversified Equity Fund (the “predecessor fund”), and the predecessor fund was the accounting and performance survivor of the reorganizations. This means that the predecessor fund’s performance and financial history were adopted by the fund. Class A shares were first issued after the reorganization. The performance shown in the bar chart for Class A shares prior to the reorganization is the performance of the predecessor fund restated to reflect the current expenses of Class A shares of the fund.
Prior to March 22, 2011, the fund was named Transamerica Diversified Equity, had a different sub-adviser, a different investment objective and used different investment strategies. The performance set forth prior to that date is attributable to the previous sub-adviser.
76
Annual Total Returns (calendar years ended December 31) – Class A
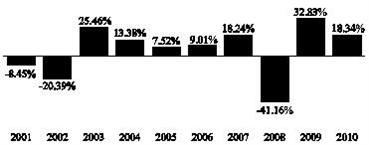
| | | | |
| | | Quarter Ended | | Return |
Best Quarter: | | 6/30/2009 | | 20.58% |
Worst Quarter: | | 12/31/2008 | | -24.48% |
Average Annual Total Returns (periods ended December 31, 2010)1
| | | | |
| | | 1 Year | | 10 Years or
Inception* |
Class A (commenced operations on November 13, 2009) | | | | |
Return before taxes | | 11.87% | | 12.67% |
Return after taxes on distributions2 | | 11.70% | | 12.50% |
Return after taxes on distributions and sale of fund shares2 | | 7.94% | | 10.78% |
Class B (Return before taxes only) (commenced operations on November 13, 2009) | | 12.56% | | 14.22% |
Class C (Return before taxes only) (commenced operations on November 13, 2009) | | 16.51% | | 17.63% |
Class I (Return before taxes only) (commenced operations on November 30, 2009) | | 18.70% | | 22.07% |
Russell 1000® Growth Index (reflects no deduction for fees, expenses, or taxes) | | 16.71% | | 18.46% |
Standard & Poor’s 500® Index (reflects no deduction for fees, expenses, or taxes)3 | | 15.06% | | 16.00% |
| 1 | Actual returns may depend on the investor’s individual tax situation. After-tax returns may not be relevant if the investment is made through a tax-exempt or tax-deferred account, such as a 401(k) plan. After-tax returns are presented for only one class and returns for other classes will vary. |
| 2 | The after-tax returns are calculated using the historic highest individual federal marginal income tax rates and do not reflect the impact of state and local taxes. |
| 3 | This index served as the benchmark for the fund prior to March 22, 2011, at which time it was replaced with the Russell 1000® Growth Index. This benchmark index change was made to more accurately reflect the principal strategies of the fund. |
| * | Fund returns are for past 10 years or since inception, whichever is less. Index returns are for 10 years or since inception of oldest share class, whichever is less. |
Management:
| | |
| Investment Adviser: | | Sub-Adviser: |
| |
| Transamerica Asset Management, Inc. | | Wellington Management Company, LLP |
| |
| | Portfolio Manager: |
| |
| | Paul E. Marrkand, CFA, Portfolio Manager since 2011 |
Purchase and Sale of Fund Shares: You may purchase, exchange or redeem shares of the fund on any day the New York Stock Exchange is open for business, online or through our website at www.transamericafunds.com, by mail to Transamerica Fund Services, Inc., P.O. Box 219945, Kansas City, MO 64121-9945, by telephone at 1-888-233-4339, or overnight mail to Transamerica Fund Services, Inc., 330 W. 9th Street, Kansas City, MO 64105. Shares may also be purchased through a financial intermediary. The minimum initial purchase for Class A and C shares is $1,000; the minimum subsequent investment is $50. The minimum initial purchase for payroll deduction and automatic investment plan is $500; the minimum subsequent investment is $50 per monthly fund account investment. The minimum investment for Class I shares is $1,000,000. Class B shares are not available for purchase, including to existing Class B shareholders, except in the limited circumstances described in this prospectus under the section entitled “Shareholder Information – Buying Shares”.
77
Tax Information: Fund distributions may be taxable as ordinary income or capital gains, except when your investment is in an IRA, 401(k) or other tax-advantaged investment plan.
Payments to Broker-Dealers and Other Financial Intermediaries: If you purchase the fund through a broker-dealer or other financial intermediary, the fund and/or its affiliates may pay the intermediary for the sale of fund shares and related services. These payments may create a conflict of interest by influencing the broker-dealer or other intermediary and your salesperson to recommend the fund over another investment. Ask your salesperson or visit your financial intermediary’s website for more information.
78
|
| TRANSAMERICA WMC DIVERSIFIED GROWTH |
Investment Objective: Seeks to maximize long-term growth.
Fees and Expenses: This table describes the fees and expenses that you may pay if you buy and hold shares of the fund. You may qualify for sales charge discounts if you and your family invest, or agree to invest in the future, at least $50,000 in Transamerica Funds. More information about these and other discounts is available from your financial professional and in the “Waivers and/or Reductions of Charges” section on page 120 of the fund’s prospectus and in the fund’s statement of additional information (SAI) under the heading “Purchase of Shares.”
| | | | | | | | | | |
| Shareholder Fees (fees paid directly from your investment) |
| | | Class of Shares |
| | | A | | B* | | C | | I | | T* |
Maximum sales charge (load) imposed on purchases (as a % of offering price) | | 5.50% | | None | | None | | None | | 8.50% |
Maximum deferred sales charge (load) (as a percentage of purchase price or redemption proceeds, whichever is lower) | | None | | 5.00% | | 1.00% | | None | | None |
| Annual Fund Operating Expenses (expenses that you pay each year as a percentage of the value of your investment) |
| | | Class of Shares |
| | | A | | B* | | C | | I | | T* |
| Management fees | | 0.71% | | 0.71% | | 0.71% | | 0.71% | | 0.71% |
| Distribution and service (12b-1) fees | | 0.35% | | 1.00% | | 1.00% | | None | | None |
| Other expenses | | 0.50% | | 0.59% | | 0.51% | | 0.30% | | 0.25% |
| Total annual fund operating expenses | | 1.56% | | 2.30% | | 2.22% | | 1.01% | | 0.96% |
| Expense reductiona | | 0.04% | | 0.13% | | 0.05% | | 0.00% | | 0.00% |
| Total annual fund operating expenses after expense reduction | | 1.52% | | 2.17% | | 2.17% | | 1.01% | | 0.96% |
| * | Not available to new investors. |
| a | Contractual arrangements have been made with the fund’s investment adviser, Transamerica Asset Management, Inc. (“TAM”), through March 1, 2012, to waive fees and/or reimburse fund expenses to the extent that the fund’s total operating expenses exceed 1.17%, excluding 12b-1 fees and extraordinary expenses. TAM is entitled to reimbursement by the fund of fees waived or expenses reduced during any of the previous 36 months if on any day the estimated annualized fund operating expenses are less than the cap, excluding 12b-1 fees and extraordinary expenses. The fund may not recapture any fees waived and/or reimbursed prior to March 1, 2008. |
Example: This Example is intended to help you compare the cost of investing in the fund with the cost of investing in other mutual funds. The Example assumes that you invest $10,000. The Example also assumes that your investment has a 5% return each year and that the fund’s operating expenses remain the same. Although your actual costs may be higher or lower, based on these assumptions your costs would be:
| | | | | | | | |
| If the shares are redeemed at the end of each period: |
| Share Class | | 1 year | | 3 years | | 5 years | | 10 years |
| A | | $696 | | $1,012 | | $1,350 | | $2,301 |
| B+ | | $720 | | $1,006 | | $1,318 | | $2,440 |
| C | | $320 | | $ 689 | | $1,185 | | $2,550 |
| I | | $103 | | $ 322 | | $ 558 | | $1,236 |
| T | | $940 | | $1,130 | | $1,336 | | $1,928 |
| If the shares are not redeemed: |
| Share Class | | 1 year | | 3 years | | 5 years | | 10 years |
| A | | $696 | | $1,012 | | $1,350 | | $2,301 |
| B+ | | $220 | | $ 706 | | $1,218 | | $2,440 |
| C | | $220 | | $ 689 | | $1,185 | | $2,550 |
| I | | $103 | | $ 322 | | $ 558 | | $1,236 |
| T | | $940 | | $1,130 | | $1,336 | | $1,928 |
| + | Examples for Class B shares assume conversion into Class A shares eight years after purchase. Class B shares are not available to new investors. |
The Example does not reflect sales charges (loads) on reinvested dividends (and other distributions). If these sales charges (loads) were included, your costs would be higher.
Portfolio Turnover: The fund pays transaction costs, such as commissions, when it buys and sells securities (or “turns over” its portfolio). A higher portfolio turnover rate may indicate higher transaction costs and may result in higher taxes when fund shares are held in a taxable account. These costs, which are not reflected in annual fund operating expenses or in the Example, affect the fund’s performance. During the most recent fiscal year, the portfolio turnover rate was 167% of the average value of the fund’s portfolio.
79
Principal Investment Strategies: The fund invests, under normal circumstances, at least 80% of its net assets in domestic common stocks. The fund invests primarily in common stocks of growth-oriented companies. Each stock is evaluated and ranked on a consistent set of growth, valuation, and quality criteria and the fund will seek diversified sources of return from these criteria.
The fund’s sub-adviser, Wellington Management Company, LLP (“Wellington Management”), uses what is sometimes referred to as a “bottom up” approach, which is the use of fundamental analysis to identify specific securities within industries or sectors for purchase or sale. A “bottom-up” approach is looking at individual companies against the context of broader market factors.
Wellington Management continually monitors every company in the fund’s portfolio for fundamental attractiveness. The fund typically sells an investment when the investment achieves its anticipated potential, the company begins to show deteriorating relative fundamentals or alternative investments become sufficiently more attractive.
Consistent with the fund’s objective and other policies, the fund may invest to a lesser extent in derivatives, including futures, forwards, options and swaps. The fund may invest up to 20% of its total assets in foreign securities (not including American Depositary Receipts, American Depositary Shares or U.S. dollar denominated securities of foreign issuers).
The fund may invest in cash, cash equivalent securities or short-term debt securities, repurchase agreements and money market instruments. Under adverse or unstable market, economic or political conditions, the fund may take temporary defensive positions in cash and short-term debt securities without limit.
Principal Risks: Many factors affect the fund’s performance. There is no assurance the fund will meet its investment objective. The value of your investment in the fund, as well as the amount of return you receive on your investment, may fluctuate significantly from day to day and over time. You may lose part or all of your investment in the fund or your investment may not perform as well as other similar investments. The following is a summary of certain risks (in alphabetical order) of investing in the fund. You may lose money if you invest in this fund.
| • | | Cash Management and Defensive Investing – Money market instruments or short-term debt securities held by the fund for cash management or defensive investing purposes can fluctuate in value. Like other fixed income securities, they are subject to risk, including market, interest rate and credit risk. If the fund holds cash uninvested, the fund will not earn income on the cash and the fund’s yield will go down. If a significant amount of the fund’s assets are used for cash management or defensive investing purposes, it will be more difficult for the fund to achieve its objective. |
| • | | Currency – When the fund invests in securities denominated in foreign currencies, the fund may incur currency conversion costs and may be affected favorably or unfavorably by changes in the rates of exchange between those currencies and the U.S. dollar. Currency exchange rates can be volatile and are affected by, among other factors, the general economics of a country, the actions of the U.S. and foreign governments or control banks, the imposition of currency controls, and speculation. |
| • | | Derivatives – Using derivatives can increase fund losses and reduce opportunities for gains when market prices, interest rates or the derivative instruments themselves behave in a way not anticipated by the fund. Using derivatives also can have a leveraging effect and increase fund volatility. Derivatives may be difficult to sell, unwind or value, and the counterparty may default on its obligations to the fund. The fund’s investments in derivative instruments may involve a small investment relative to the amount of investment exposure assumed and may result in losses exceeding the amounts invested in those instruments. Recent legislation calls for new regulation of the derivatives markets. The extent and impact of the regulation are not yet fully known and may not be for some time. New regulation of derivatives may make them more costly, may limit their availability, or may otherwise adversely affect their value or performance. |
| • | | Fixed-Income Securities – The market prices of fixed-income securities may go up or down, sometimes rapidly or unpredictably due to general market conditions, such as real or perceived adverse economic or political conditions, inflation, changes in interest rates, lack of liquidity in the bond markets or adverse investor sentiment. When market prices fall, the value of your investment will go down. A rise in rates tends to have a greater impact on the prices of longer term or duration securities. |
If interest rates rise, repayments of fixed-income securities may occur more slowly than anticipated by the market. This may drive the prices of these securities down because their interest rates are lower than the current interest rate and they remain outstanding longer. This is sometimes referred to as extension risk.
Many issuers have a right to prepay their securities. If interest rates fall, an issuer may exercise this right. If this happens, the fund will be forced to reinvest prepayment proceeds at a time when yields on securities available in the market are lower than the yield on the prepaid security. This is sometimes referred to as prepayment or call risk.
| • | | Focused Investing – To the extent the fund invests in a limited number of issuers, changes in the value of individual securities may have a significant impact on your investment. |
80
| | • | | Foreign Securities – Foreign securities are subject to a number of additional risks, including nationalization or expropriation of assets, imposition of currency controls or restrictions, confiscatory taxation, political or financial instability and other adverse economic or political developments. Lack of information and less market regulation also may affect the value of these securities. |
| | • | | Growth Stocks – Returns on growth stocks may not move in tandem with returns on other categories of stocks or the market as a whole. Growth stocks may be particularly susceptible to rapid price swings or to adverse developments. Growth stocks as a group may be out of favor and underperform the overall equity market for a long period of time, for example, while the market favors “value” stocks. |
| | • | | Increase in Expenses – Your actual costs of investing in the fund may be higher than the expenses shown in “Annual Fund Operating Expenses” for a variety of reasons. For example, expense ratios may be higher than those shown if average net assets decrease. Net assets are more likely to decrease and fund expense ratios are more likely to increase when markets are volatile. |
| | • | | Market – The market prices of the fund’s securities may go up or down, sometimes rapidly or unpredictably, due to general market conditions, such as real or perceived adverse economic or political conditions, inflation, changes in interest rates or currency rates, lack of liquidity in the markets or adverse investor sentiment. Market prices of securities also may go down due to events or conditions that affect particular sectors or issuers. When market prices fall, the value of your investment will go down. The fund may experience a substantial or complete loss on any individual security. The recent financial crisis has caused a significant decline in the value and liquidity of many securities. In response to the financial crisis, the U.S. and other governments and the Federal Reserve and certain foreign central banks have taken steps to support financial markets. The withdrawal of this support could negatively affect the value and liquidity of certain securities. In addition, legislation recently enacted in the U.S. calls for changes in many aspects of financial regulation. The impact of the legislation on the markets, and the practical implications for market participants, may not be fully known for some time. |
| | • | | Portfolio Selection – The sub-adviser’s judgment about a particular security or issuer, or about the economy or a particular sector, region or market segment, or about an investment strategy, may prove to be incorrect. |
| | • | | Small- or Medium-Sized Companies – Small- or medium-sized companies may be more at risk than larger companies because, among other things, they may have limited product lines, operating history, market or financial resources, or because they may depend on a limited management group. |
| | • | | Stocks – Stocks may be volatile – their prices may go up and down dramatically over the shorter term. These price movements may result from factors affecting individual companies, industries, the securities market as a whole or the overall economy. |
Performance: The bar chart and the table below provide some indication of the risks of investing in the fund by showing you how the fund’s performance has varied from year to year, and how the fund’s average annual total returns for different periods compare to the returns of a broad measure of market performance. The bar chart does not reflect the impact of sales charges, which, if reflected, would lower the returns. The table, which shows average annual total returns for each class of shares of the fund, includes deduction of applicable sales charges. Absent any limitation of the fund’s expenses, total returns would be lower. As with all mutual funds, past performance (before and after taxes) is not a prediction of future results. Updated performance information is available on our website at www.transamericafunds.com or by calling 1-888-233-4339.
Prior to April 9, 2010, the fund was named Transamerica Equity, had a different sub-adviser and used different investment strategies. The performance set forth prior to that date is attributable to the previous sub-adviser.
81
Annual Total Returns (calendar years ended December 31) – Class A
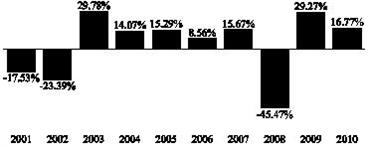
| | | | |
| | | Quarter Ended | | Return |
| Best Quarter: | | 6/30/2009 | | 19.06% |
| Worst Quarter: | | 12/31/2008 | | -24.04% |
Average Annual Total Returns (periods ended December 31, 2010)1
| | | | | | |
| | | 1 Year | | 5 Years | | 10 Years or Inception* |
| Class A (commenced operations on March 1, 2000) | | | | | | |
Return before taxes | | 10.29% | | -0.48% | | 0.52% |
Return after taxes on distributions2 | | 10.29% | | -0.48% | | 0.48% |
Return after taxes on distributions and sale of fund shares2 | | 6.69% | | -0.40% | | 0.44% |
| Class B (Return before taxes only) (commenced operations on March 1, 2000) | | 10.94% | | -0.27% | | 0.49% |
| Class C (Return before taxes only) (commenced operations on November 11, 2002) | | 14.86% | | 0.00% | | 6.82% |
| Class I (Return before taxes only) (commenced operations on November 30, 2009) | | 17.20% | | N/A | | 19.54% |
| Class T (Return before taxes only) (commenced operations on October 27, 2006) | | 7.37% | | N/A | | -2.24% |
| Russell 1000® Growth Index (reflects no deduction for fees, expenses or taxes) | | 16.71% | | 3.75% | | 0.02% |
| 1 | Actual returns may depend on the investor’s individual tax situation. After-tax returns may not be relevant if the investment is made through a tax-exempt or tax-deferred account, such as a 401(k) plan. After-tax returns are presented for only one class and returns for other classes will vary. |
| 2 | The after-tax returns are calculated using the historic highest individual federal marginal income tax rates and do not reflect the impact of state and local taxes. |
| * | Fund returns are for past 10 years or since inception, whichever is less. Index returns are for 10 years or since inception of oldest share class, whichever is less. |
Management:
| | |
| Investment Adviser: | | Sub-Adviser: |
| |
| Transamerica Asset Management, Inc. | | Wellington Management Company, LLP |
| |
| | Portfolio Manager: |
| |
| | Paul E. Marrkand, CFA, Portfolio Manager since 2010 |
Purchase and Sale of Fund Shares: You may purchase, exchange or redeem shares of the fund on any day the New York Stock Exchange is open for business, online or through our website at www.transamericafunds.com, by mail to Transamerica Fund Services, Inc., P.O. Box 219945, Kansas City, MO 64121-9945, by telephone at 1-888-233-4339, or overnight mail to Transamerica Fund Services, Inc., 330 W. 9th Street, Kansas City, MO 64105. Shares may also be purchased through a financial intermediary. The minimum initial purchase for Class A and C shares is $1,000; the minimum subsequent investment is $50. The minimum initial purchase for payroll deduction and automatic investment plan is $500; the minimum subsequent investment is $50 per monthly fund account investment. The minimum investment for Class I shares is $1,000,000. Class B shares are not available for purchase, including to existing Class B shareholders, except in the limited circumstances described in this prospectus under the section entitled “Shareholder Information – Buying Shares”. Class T shares are not available to new investors; only existing Class T shareholders may purchase additional Class T shares.
82
Tax Information: Fund distributions may be taxable as ordinary income or capital gains, except when your investment is in an IRA, 401(k) or other tax-advantaged investment plan.
Payments to Broker-Dealers and Other Financial Intermediaries: If you purchase the fund through a broker-dealer or other financial intermediary, the fund and/or its affiliates may pay the intermediary for the sale of fund shares and related services. These payments may create a conflict of interest by influencing the broker-dealer or other intermediary and your salesperson to recommend the fund over another investment. Ask your salesperson or visit your financial intermediary’s website for more information.
83
|
| TRANSAMERICA WMC QUALITY VALUE |
Investment Objective: Seeks to maximize long-term total return.
Fees and Expenses: This table describes the fees and expenses that you may pay if you buy and hold shares of the fund. You may qualify for sales charge discounts if you and your family invest, or agree to invest in the future, at least $50,000 in Transamerica Funds. More information about these and other discounts is available from your financial professional and in the “Waivers and/or Reductions of Charges” section on page 120 of the fund’s prospectus and in the fund’s statement of additional information (SAI) under the heading “Purchase of Shares.”
| | | | | | |
| Shareholder Fees (fees paid directly from your investment) |
| | | Class of Shares |
| | | A | | C | | I |
Maximum sales charge (load) imposed on purchases (as a % of offering price) | | 5.50% | | None | | None |
| Maximum deferred sales charge (load) (as a percentage of purchase price or redemption proceeds, whichever is lower) | | None | | 1.00% | | None |
| Annual Fund Operating Expenses (expenses that you pay each year as a percentage of the value of your investment)a |
| | | Class of Shares |
| | | A | | C | | I |
| Management fees | | 0.70% | | 0.70% | | 0.70% |
| Distribution and service (12b-1) fees | | 0.35% | | 1.00% | | None |
| Other expenses | | 0.19% | | 0.17% | | 0.19% |
| Total annual fund operating expenses | | 1.24% | | 1.87% | | 0.89% |
| a | Annual fund operating expenses are based on estimates for the current fiscal year. |
Example: This Example is intended to help you compare the cost of investing in the fund with the cost of investing in other mutual funds. The Example assumes that you invest $10,000. The Example also assumes that your investment has a 5% return each year and that the fund’s operating expenses remain the same. Although your actual costs may be higher or lower, based on these assumptions your costs would be:
| | | | |
| |
| If the shares are redeemed at the end of each period: |
| Share Class | | 1 year | | 3 years |
A | | $669 | | $922 |
C | | $290 | | $588 |
I | | $ 91 | | $284 |
| |
| If the shares are not redeemed: |
| Share Class | | | | |
A | | $669 | | $922 |
C | | $190 | | $588 |
I | | $ 91 | | $284 |
The Example does not reflect sales charges (loads) on reinvested dividends (and other distributions). If these sales charges (loads) were included, your costs would be higher.
Portfolio Turnover: The fund pays transaction costs, such as commissions, when it buys and sells securities (or “turns over” its portfolio). A higher portfolio turnover rate may indicate higher transaction costs and may result in higher taxes when fund shares are held in a taxable account. These costs, which are not reflected in annual fund operating expenses or in the Example, affect the fund performance. Portfolio turnover rate is not included because the fund did not commence operations until November 15, 2010.
Principal Investment Strategies: Wellington Management Company, LLP (“Wellington Management”), the fund’s sub-adviser, invests the fund’s assets, under normal circumstances, primarily in common stock and depositary receipts. Generally, less than 5% of fund assets will be invested in cash and cash equivalents subject to a maximum of 10% of fund assets. The fund will normally invest at least 90% of its assets in U.S. securities. Generally, the fund invests primarily in companies with market capitalizations greater than $10 billion, but may invest in companies with capitalizations between $2 and $10 billion at the time of purchase. The fund will generally hold 65 to 85 stocks. The largest weightings are given to companies Wellington Management believes have the most upside return potential relative to downside risk.
84
Wellington Management employs a bottom-up stock selection process that utilizes Wellington Management’s proprietary, fundamental research in an effort to identify undervalued stocks that have the potential for significant longer-term rewards. The fund’s investment philosophy is based on the premise that high-quality companies in out-of-favor industries can generate strong returns on invested capital.
The fund may invest up to 10% of its assets in non-U.S. securities.
The fund may invest in cash, cash equivalent securities or short-term debt securities, repurchase agreements and money market instruments. Under adverse or unstable market, economic or political conditions, the fund may take temporary defensive positions in cash and short-term debt securities without limit.
Principal Risks: Many factors affect the fund’s performance. There is no assurance the fund will meet its investment objective. The value of your investment in the fund, as well as the amount of return you receive on your investment, may fluctuate significantly from day to day and over time. You may lose part or all of your investment in the fund or your investment may not perform as well as other similar investments. The following is a summary of certain risks (in alphabetical order) of investing in the fund. You may lose money if you invest in this fund.
| • | | Cash Management and Defensive Investing – Money market instruments or short-term debt securities held by the fund for cash management or defensive investing purposes can fluctuate in value. Like other fixed income securities, they are subject to risk, including market, interest rate and credit risk. If the fund holds cash uninvested, the fund will not earn income on the cash and the fund’s yield will go down. If a significant amount of the fund’s assets are used for cash management or defensive investing purposes, it will be more difficult for the fund to achieve its objective. |
| • | | Depositary Receipts – Depositary receipts may be less liquid than the underlying shares in their primary trading market. Any distributions paid to the holders of depositary receipts are usually subject to a fee charged by the depositary. Holders of depositary receipts may have limited voting rights, and investment restrictions in certain countries may adversely impact the value of depositary receipts because such restrictions may limit the ability to convert equity shares into depositary receipts and vice versa. Such restrictions may cause equity shares of the underlying issuer to trade at a discount or premium to the market price of the depositary receipts |
| • | | Foreign Securities – Foreign securities are subject to a number of additional risks, including nationalization or expropriation of assets, imposition of currency controls or restrictions, confiscatory taxation, political or financial instability and other adverse economic or political developments. Lack of information and less market regulation also may affect the value of these securities. |
| • | | Increase in Expenses – Your actual costs of investing in the fund may be higher than the expenses shown in “Annual Fund Operating Expenses” for a variety of reasons. For example, expense ratios may be higher than those shown if average net assets decrease. Net assets are more likely to decrease and fund expense ratios are more likely to increase when markets are volatile. |
| • | | Liquidity – Some securities held by the fund may be difficult to sell, or illiquid, particularly during times of market turmoil. Illiquid securities may also be difficult to value. If the fund is forced to sell an illiquid asset to meet redemption requests or other cash needs, the fund may be forced to sell at a loss. |
| • | | Market – The market prices of the fund’s securities may go up or down, sometimes rapidly or unpredictably, due to general market conditions, such as real or perceived adverse economic or political conditions, inflation, changes in interest rates or currency rates, lack of liquidity in the markets or adverse investor sentiment. Market prices of securities also may go down due to events or conditions that affect particular sectors or issuers. When market prices fall, the value of your investment will go down. The fund may experience a substantial or complete loss on any individual security. The recent financial crisis has caused a significant decline in the value and liquidity of many securities. In response to the financial crisis, the U.S. and other governments and the Federal Reserve and certain foreign central banks have taken steps to support financial markets. The withdrawal of this support could negatively affect the value and liquidity of certain securities. In addition, legislation recently enacted in the U.S. calls for changes in many aspects of financial regulation. The impact of the legislation on the markets, and the practical implications for market participants, may not be fully known for some time. |
| • | | Portfolio Selection – The sub-adviser’s judgment about a particular security or issuer, or about the economy or a particular sector, region or market segment, or about an investment strategy, may prove to be incorrect. |
| • | | Stocks – Stocks may be volatile – their prices may go up and down dramatically over the shorter term. These price movements may result from factors affecting individual companies, industries, the securities market as a whole or the overall economy. |
85
| • | | Valuation – The sales price the fund could receive for any particular portfolio investment may differ from the fund’s valuation of the investment, particularly for securities that trade in thin or volatile markets or that are valued using a fair value methodology. |
| • | | Value Investing – The prices of securities the sub-adviser believes are undervalued may not appreciate as anticipated or may go down. Value stocks as a group may be out of favor and underperform the overall equity market for a long period of time, for example, while the market favors “growth” stocks. |
Performance: No performance is shown for the fund. Performance information will appear in a future version of this prospectus once the fund has a full calendar year of performance information to report to investors.
Management:
| | |
Investment Adviser: | | Sub-Adviser: |
| |
Transamerica Asset Management, Inc. | | Wellington Management Company, LLP |
| |
| | Portfolio Managers: |
| |
| | Matthew G. Baker, Portfolio Manager since 2010 |
| |
| | Edward P. Bousa, CFA, Portfolio Management and Securities Analysis since 2010 |
Purchase and Sale of Fund Shares: You may purchase, exchange or redeem shares of the fund on any day the New York Stock Exchange is open for business, online or through our website at www.transamericafunds.com, by mail to Transamerica Fund Services, Inc., P.O. Box 219945, Kansas City, MO 64121-9945, by telephone at 1-888-233-4339, or overnight mail to Transamerica Fund Services, Inc., 330 W. 9th Street, Kansas City, MO 64105. Shares may also be purchased through a financial intermediary. The minimum initial purchase for Class A and C shares is $1,000; the minimum subsequent investment is $50. The minimum initial purchase for payroll deduction and automatic investment plan is $500; the minimum subsequent investment is $50 per monthly fund account investment. The minimum investment for Class I shares is $1,000,000.
Tax Information: Fund distributions may be taxable as ordinary income or capital gains, except when your investment is in an IRA, 401(k) or other tax-advantaged investment plan.
Payments to Broker-Dealers and Other Financial Intermediaries: If you purchase the fund through a broker-dealer or other financial intermediary, the fund and/or its affiliates may pay the intermediary for the sale of fund shares and related services. These payments may create a conflict of interest by influencing the broker-dealer or other intermediary and your salesperson to recommend the fund over another investment. Ask your salesperson or visit your financial intermediary’s website for more information.
86
|
| MORE ON THE FUNDS’ STRATEGIES AND INVESTMENTS |
The following provides additional information regarding the funds’ strategies and investments described at the front of the prospectus. Except as otherwise expressly stated for a particular fund in this prospectus or in the statement of additional information or as required by law, there is no limit on the amount of a fund’s assets that may be invested in a particular type of security or investment.
Transamerica AEGON Flexible Income: The fund’s sub-adviser, AEGON USA Investment Management, LLC (“AUIM”), uses a “bottom up” approach to investing and builds the fund’s portfolio one company at a time.
The fund will invest, under normal circumstances, at least 80% of net assets in fixed-income securities, including:
| • | | U.S. Government and foreign government bonds and notes (including emerging market countries); |
| • | | Mortgage-backed, commercial mortgage-backed, and asset-backed securities (including collateralized mortgage obligations); |
| • | | Corporate bonds of issuers in the U.S. and foreign countries (including emerging market countries); |
| • | | Convertible bonds and other convertible securities; |
| • | | Bank loans and loan participations: |
With respect to these investments:
| | 1. | Under normal circumstances, at least 50% of the value of the fund’s assets will be invested in (a) debt securities which have a rating within the four highest grades as determined by Moody’s Investors Service, Inc. (“Moody’s”) (“Aaa, Aa, A or Baa”) or Standard & Poor’s Corporation (“S&P”) (“AAA, AA, A or BBB”); (b) securities issued or guaranteed by the United States Government or its agencies or instrumentalities; (c) commercial paper rated Prime, Prime-1 or Prime-2 by NCO/Moody’s Commercial Paper Division, Moody’s, or A-1 or A-2 by S&P; or (d) cash or cash equivalents; |
| | 2. | Up to 50% of the value of the fund’s assets may be invested in other debt securities which are not rated by Moody’s or S&P or, if so rated, are not within the grades or ratings referred to above; and |
| | 3. | The fund may engage in options and futures transactions, foreign currency transactions, and swap transactions. |
The fund may invest up to 20% of its total assets in equity securities, such as common stocks, rights, warrants or preferred stock.
Ordinarily, the fund will purchase debt securities having call or refunding protection or securities which are not considered by the fund likely to be called or refunded in the near term, in order to preserve initial annual yields to the fund.
The fund may invest in securities of any maturity and does not have a target average duration.
Short-Term Trading
The fund may use short-term trading as a means of managing its portfolio to achieve its investment objectives. As used herein, “short-term trading” means selling securities held for a relatively brief period of time, usually less than three months. Short-term trading will be used by the fund primarily in two situations:
(a) Market Developments. A security may be sold to avoid depreciation in what the fund anticipates will be a market decline (a rise in interest rates), or a security may be purchased in anticipation of a market rise (a decline in interest rates) and later sold; and
(b) Yield Disparities. A security may be sold and another of comparable quality purchased at approximately the same time in order to take advantage of what the fund believes is a temporary disparity in the normal yield relationship between the two securities (a “yield disparity”).
Short-term trading to take advantage of a yield disparity may be undertaken even if levels of interest rates remain unchanged. Yield disparities occur frequently for reasons not directly related to the investment quality of the respective issues or the general movement of interest rates, but may result from changes in the overall demand for or supply of various types of bonds, changes in the investment objectives or the cash requirements of investors, and the requirements of dealers to correct long or short inventory positions.
Short-term trading techniques will be used principally in connection with higher quality, non-convertible debt securities, which are often better suited for short-term trading because the market in such securities is generally of greater depth and offers
87
greater liquidity than the market in debt securities of lower quality. It is anticipated that short-term trading will be less applicable to any convertible securities which the fund may own, since such securities will usually be purchased when the fund believes that the market value of the underlying equity security is likely to appreciate over a period of time.
The fund will engage in short-term trading if it believes the transactions, net of costs (including commission, if any), will result in improving the appreciation potential or income of its portfolio. Whether any improvement will be realized by short-term trading will depend upon the ability of the fund to evaluate particular securities and anticipate relevant market factors, including interest rate trends and variations from such trends. Short-term trading such as that contemplated by the fund places a premium upon the ability of the fund to obtain relevant information, evaluate it promptly, and take advantage of its evaluations by completing transactions on a favorable basis. By virtue of short-term trading, the fund may engage in greater buying and selling activity than investment companies which are not permitted to employ such a policy in seeking their investment objectives. Such activity can result in greater costs of operation than is the case with other investment companies, and risks of loss in portfolio value could be greater. Accordingly, an investment in fund shares may be more speculative than an investment in shares of an investment company which cannot engage in short-term trading.
The sub-adviser may sell the fund’s securities when its expectations regarding market interest rates change or the quality or return changes on investment.
The fund may invest its assets in cash, cash equivalent securities or short-term debt securities, repurchase agreements and money market instruments. Under adverse or unstable market, economic or political conditions, the fund may do so without limit. Although the fund would do this only in seeking to avoid losses, the fund may be unable to pursue its investment objective during that time, and it could reduce the benefit from any upswing in the market. To the extent that the fund has any uninvested cash, the fund would also be subject to risk with respect to the depository institution holding the cash.
Transamerica AEGON High Yield Bond: The fund’s sub-adviser, AEGON USA Investment Management, LLC (“AUIM”), seeks to achieve the fund’s objective by investing, under normal circumstances, at least 80% of the fund’s net assets in high-yield/high-risk bonds (commonly known as “junk bonds”).
Junk bonds are high risk debt securities rated in medium or lower rating categories or determined by AUIM to be of comparable quality.
AUIM’s strategy is to seek to achieve yields as high as possible while seeking to manage risk. AUIM uses a “top-down/bottom-up” approach in managing the fund’s assets. The “top-down” approach is to adjust the risk profile of the fund. AUIM analyzes four factors that affect the movement of fixed-income bond prices which include: economic indicators; technical indicators that are specific to the high-yield market; investor sentiment and valuation. Analysis of these factors assists AUIM in its decision regarding the fund’s portfolio allocations.
AUIM has developed a proprietary credit model that is the foundation of its “bottom-up” analysis. The model tracks historical cash flow numbers and calculates credit financial ratios. Because high-yield companies are of higher financial risk, AUIM does a thorough credit analysis of all companies in the fund’s portfolio, as well as all potential acquisitions.
Each potential buy and sell candidate is analyzed by AUIM from both the “top-down” and “bottom-up” strategies. An industry may look attractive in one area, but not the other. They can review the results of their analysis and decide whether or not to proceed with a transaction.
AUIM may sell fund securities when it determines there are changes in economic indicators, technical indicators or valuation.
The fund may invest its assets in cash, cash equivalent securities or short-term debt securities, repurchase agreements and money market instruments. Under adverse or unstable market, economic or political conditions, the fund may do so without limit. Although the fund would do this only in seeking to avoid losses, the fund may be unable to pursue its investment objective during that time, and it could reduce the benefit from any upswing in the market. To the extent that the fund has any uninvested cash, the fund would also be subject to risk with respect to the depository institution holding the cash.
Transamerica AEGON Money Market: The fund’s sub-adviser, AEGON USA Investment Management, LLC (“AUIM”), seeks to achieve the fund’s objective by investing the fund’s assets in the following high quality, short-term U.S. dollar-denominated money market instruments:
| • | | short-term corporate obligations, including commercial paper, notes and bonds |
| • | | obligations issued or guaranteed by the U.S. and foreign governments and their agencies and instrumentalities |
| • | | obligations of U.S. and foreign banks, or their foreign branches, and U.S. savings banks |
| • | | repurchase agreements involving any of the securities mentioned above |
Bank obligations purchased for the fund are limited to U.S. or foreign banks with total assets of $1.5 billion or more. Similarly, savings association obligations purchased for the fund are limited to U.S. savings association obligations issued by U.S. savings
88
banks with total assets of $1.5 billion or more. Foreign securities purchased for the fund must be U.S. dollar-denominated and issued by foreign governments, agencies or instrumentalities, or banks that meet the minimum $1.5 billion capital requirement. These foreign obligations must also meet the same quality requirements as U.S. obligations. Each security, at the time of purchase by the fund, has been determined by the sub-adviser to present minimal credit risk.
As a money market fund, the fund tries to maintain a share price of $1.00, and must follow strict rules as to the credit quality, diversification and maturity of its investments. The fund invests in securities that, at the time of purchase, have remaining maturities of 397 days or less. The fund maintains a dollar-weighted average portfolio maturity of 60 days or less. If, after purchase, the credit rating on a security held by the fund is downgraded or the credit quality deteriorates, or if the maturity on a security is extended, the fund’s sub-adviser or Board (where required by applicable regulations) will decide whether the security should be held or sold. To the extent that the fund has any uninvested cash, the fund would also be subject to risk with respect to the depository institution holding the cash.
Transamerica AEGON Short-Term Bond: The fund’s sub-adviser, AEGON USA Investment Management, LLC (“AUIM”), seeks to achieve the fund’s objective by investing, under normal circumstances, at least 80% of the fund’s net assets in fixed-income securities. Securities in which the fund may invest include:
| • | | short-term and intermediate-term investment-grade corporate obligations |
| • | | obligations issued or guaranteed by the U.S. and foreign governments and their agencies and instrumentalities |
| • | | mortgage-backed securities |
| • | | asset-backed securities |
AUIM may also invest in bank obligations, collateralized mortgage obligations, foreign securities and hybrids.
Bank obligations purchased for the fund are limited to U.S. or foreign banks with total assets of $1.5 billion or more. Similarly, savings association obligations purchased for the fund are limited to U.S. savings association obligations issued by U.S. savings banks with total assets of $1.5 billion or more. Foreign government securities purchased for the fund must be U.S. dollar-denominated and issued by foreign governments, agencies or instrumentalities. These foreign obligations must also meet the same quality requirements as U.S. obligations. The commercial paper and other short-term corporate obligations AUIM buys for the fund are determined by the fund manager to present minimal credit risks.
The fund may invest its assets in cash, cash equivalent securities or short-term debt securities, repurchase agreements and money market instruments. Under adverse or unstable market, economic or political conditions, the fund may do so without limit. Although the fund would do this only in seeking to avoid losses, the fund may be unable to pursue its investment objective during that time, and it could reduce the benefit from any upswing in the market. To the extent that the fund has any uninvested cash, the fund would also be subject to risk with respect to the depository institution holding the cash.
Transamerica Asset Allocation – Conservative: The fund seeks to achieve its investment objective by investing its assets in a broad mix of underlying Transamerica Funds (“underlying funds”).
| • | | Under normal circumstances, investments in underlying funds are expected to achieve a mix over time of approximately 35% of assets in equities, which may include both stocks and commodity-related securities, and 65% of assets in fixed-income, which may include bonds, cash, cash equivalents, and other money market instruments. These percentages may vary. |
| • | | Allocation of assets among the underlying funds is based on such things as diversification, general market outlooks (both domestic and global), volatility in the equity markets, historical performance, global markets’ current valuations, and other global economic factors. |
| • | | The fund may periodically adjust its allocations to favor investments in those underlying funds that it believes will provide the most favorable outlook for achieving its investment objective. |
| • | | The fund may also invest directly in U.S. government securities and/or short-term commercial paper. |
Each underlying fund has its own investment objective, principal investment strategies and investment risks. The sub-adviser for each underlying fund decides which securities to purchase and sell for that underlying fund. The fund’s ability to achieve its investment objective depends largely on the performance of the underlying funds in which it invests. The “Underlying Funds” section of the prospectus lists the underlying funds currently available for investment by the funds, provides a summary of their respective investment objectives and principal investment strategies, and identifies certain risks of the underlying funds.
It is not possible to predict the extent to which the fund will be invested in a particular underlying fund at any time.
As a consequence of its investment strategies and policies, the fund may be a significant shareholder in certain underlying funds.
89
The fund’s portfolio construction manager, Morningstar Associates, LLC (the “Portfolio Construction Manager”), determines the fund’s asset allocations and periodic changes thereto, and other fund investments. The Portfolio Construction Manager may change the fund’s asset allocations and underlying funds at any time without notice to shareholders and without shareholder approval.
Transamerica Asset Allocation – Growth: The fund seeks to achieve its investment objective by investing its assets in a broad mix of underlying Transamerica Funds (“underlying funds”).
| • | | Under normal circumstances, it expects to invest primarily in underlying funds that invest in equities, which may include stocks, commodity-related securities and alternative investments. |
| • | | Allocation of assets among the underlying funds is based on such things as diversification, general market outlooks (both domestic and global), historical performance, global markets’ current valuations, and other global economic factors. |
| • | | The fund may periodically adjust its allocations to favor investments in those underlying funds that it believes will provide the most favorable outlook for achieving its investment objective. |
| • | | The fund may also invest directly in U.S. government securities and/or short-term commercial paper. |
Each underlying fund has its own investment objective, principal investment strategies and investment risks. The sub-adviser for each underlying fund decides which securities to purchase and sell for that underlying fund. The fund’s ability to achieve its investment objective depends largely on the performance of the underlying funds in which it invests. The “Underlying Funds” section of the prospectus lists the underlying funds currently available for investment by the fund, provides a summary of their respective investment objectives and principal investment strategies, and identifies certain risks of the underlying funds.
It is not possible to predict the extent to which the fund will be invested in a particular underlying fund at any time.
As a consequence of its investment strategies and policies, the fund may be a significant shareholder in certain underlying funds.
The fund’s portfolio construction manager, Morningstar Associates, LLC (the “Portfolio Construction Manager”), determines the fund’s asset allocations and periodic changes thereto, and other fund investments. The Portfolio Construction Manager may change the fund’s asset allocations and underlying funds at any time without notice to shareholders and without shareholder approval.
Transamerica Asset Allocation – Moderate Growth: The fund seeks to achieve its investment objective by investing its assets in a broad mix of underlying Transamerica Funds (“underlying funds”).
| • | | Under normal circumstances, investments in underlying funds are expected to achieve a mix over time of approximately 70% of assets in equities, which may include both stocks and commodity-related securities, and 30% of assets in fixed-income, which may include bonds, cash, cash equivalents, and other money market instruments. These percentages may vary. |
| • | | Allocation of assets among the underlying funds is based on such things as diversification, general market outlooks (both domestic and global), volatility in the equity markets, historical performance, global markets’ current valuations, and other global economic factors. |
| • | | The fund may periodically adjust its allocations to favor investments in those underlying funds that it believes will provide the most favorable outlook for achieving its investment objective. |
| • | | The fund may also invest directly in U.S. government securities and/or short-term commercial paper. |
Each underlying fund has its own investment objective, principal investment strategies and investment risks. The sub-adviser for each underlying fund decides which securities to purchase and sell for that underlying fund. The fund’s ability to achieve its investment objective depends largely on the performance of the underlying funds in which it invests. The “Underlying Funds” section of the prospectus lists the underlying funds currently available for investment by the funds, provides a summary of their respective investment objectives and principal investment strategies, and identifies certain risks of the underlying funds.
It is not possible to predict the extent to which the fund will be invested in a particular underlying fund at any time.
As a consequence of its investment strategies and policies, the fund may be a significant shareholder in certain underlying funds.
The fund’s portfolio construction manager, Morningstar Associates, LLC (the “Portfolio Construction Manager”), determines the fund’s asset allocations and periodic changes thereto, and other fund investments. The Portfolio Construction Manager may
90
change the fund’s asset allocations and underlying funds at any time without notice to shareholders and without shareholder approval.
Transamerica Asset Allocation – Moderate: The fund seeks to achieve its investment objective by investing its assets in a broad mix of underlying Transamerica Funds (“underlying funds”).
| • | | Under normal circumstances, investments in underlying funds are expected to achieve a mix over time of approximately 50% of assets in equities, which may include both stocks and commodity-related securities, and 50% of assets in fixed-income, which may include bonds, cash, cash equivalents, and other money market instruments. These percentages may vary. |
| • | | Allocation of assets among the underlying funds is based on such things as diversification, general market outlooks (both domestic and global), volatility in the equity markets, historical performance, global markets’ current valuations, and other global economic factors. |
| • | | The fund may periodically adjust its allocations to favor investments in those underlying funds that it believes will provide the most favorable outlook for achieving its investment objective. |
| • | | The fund may also invest directly in U.S. government securities and/or short-term commercial paper. |
Each underlying fund has its own investment objective, principal investment strategies and investment risks. The sub-adviser for each underlying fund decides which securities to purchase and sell for that underlying fund. The fund’s ability to achieve its investment objective depends largely on the performance of the underlying funds in which it invests. The “Underlying Funds” section of the prospectus lists the underlying funds currently available for investment by the funds, provides a summary of their respective investment objectives and principal investment strategies, and identifies certain risks of the underlying funds.
It is not possible to predict the extent to which the fund will be invested in a particular underlying fund at any time.
As a consequence of its investment strategies and policies, the fund may be a significant shareholder in certain underlying funds.
The fund’s portfolio construction manager, Morningstar Associates, LLC (the “Portfolio Construction Manager”), determines the fund’s asset allocations and periodic changes thereto, and other fund investments. The Portfolio Construction Manager may change the fund’s asset allocations and underlying funds at any time without notice to shareholders and without shareholder approval.
Transamerica Morgan Stanley Capital Growth: The fund’s sub-adviser, Morgan Stanley Investment Management Inc. (“MSIM”), under normal circumstances, seeks long-term capital growth by investing primarily in established and emerging companies with capitalizations within the range of companies included in the Russell 1000® Growth Index. The median market capitalization of companies represented in the index was $5.9 billion as of December 31, 2010. Under normal market conditions, MSIM generally intends to focus on companies with market capitalization of $10 billion or more.
The fund may purchase and sell certain derivative instruments, such as options, futures contracts and options on futures contracts, for various portfolio management purposes, including to earn income, facilitate portfolio management and mitigate risks. In determining compliance with any percentage limitation or requirement regarding the use or investment of fund assets, the fund will take into account derivative or synthetic instruments or other positions that, in the judgment of MSIM, have economic characteristics similar to the applicable category of investments.
The fund may invest up to 10% of its total assets in real estate investment trusts (“REITs”).
The fund may invest up to 25% of its total assets in securities of foreign issuers, including issuers located in emerging market or developing countries. MSIM considers an issuer to be from a particular country if (i) its principal securities trading market is in that country; (ii) alone or on a consolidated basis it derives 50% or more of its annual revenue from goods produced, sales made or services performed in that country; or (iii) it is organized under the laws of, or has a principal office in that country. By applying these tests, it is possible that a particular company could be deemed to be from more than one country. The securities in which the fund may invest may be denominated in U.S. dollars or in currencies other than U.S. dollars. The fund may invest in privately placed securities.
The sub-adviser seeks to invest in high quality companies it believes have sustainable competitive advantages and the ability to redeploy capital at high rates of return. The sub-adviser typically favors companies with rising returns on invested capital, above average business visibility, strong free cash flow generation and an attractive risk/reward profile. The sub-adviser generally considers selling an investment when it determines the company no longer satisfies its investment criteria.
The fund may invest its assets in cash, cash equivalent securities or short-term debt securities, repurchase agreements and money market instruments. Under adverse or unstable market, economic or political conditions, the fund may do so without limit. Although the fund would do this only in seeking to avoid losses, the fund may be unable to pursue its investment
91
objective during that time, and it could reduce the benefit from any upswing in the market. To the extent that the fund has any uninvested cash, the fund would also be subject to risk with respect to the depository institution holding the cash.
Transamerica Morgan Stanley Growth Opportunities: The fund’s sub-adviser, Morgan Stanley Investment Management Inc. (“MSIM”), under normal circumstances, invests at least 80% of the fund’s assets in common stocks of mid cap companies. MSIM seeks long-term capital growth by investing primarily in established and emerging companies with capitalizations within the range of companies included in the Russell Midcap® Growth Index, which as of December 31, 2010 was between $752 million and $22.1 billion.
MSIM seeks to invest in high quality companies it believes have sustainable competitive advantages and the ability to redeploy capital at high rates of return. MSIM typically favors companies with rising returns on invested capital, above average business visibility, strong free cash flow generation and attractive risk/reward profile. MSIM generally considers selling an investment when it determines the company no longer satisfies its investment criteria.
The fund may also invest in common stocks and other equity securities of small-and large-sized companies, as well as preferred stocks, rights and warrants, and debt securities. The fund may purchase and sell certain derivative instruments, such as options, futures contracts and options on futures contracts, for various portfolio management purposes, including to earn income, facilitate portfolio management and mitigate risks. Derivative instruments used by the fund will be counted toward the 80% policy discussed above to the extent they have economic characteristics similar to the securities included within that policy.
MSIM may invest up to 25% of the fund’s assets in securities of foreign companies, including issuers located in emerging market or developing countries. MSIM considers an issuer to be from a particular country if (i) its principal securities trading market is in that country; (ii) alone or on a consolidated basis it derives 50% or more of its annual revenue from goods produced, sales made or services performed in that country; or (iii) it is organized under the laws of, or has a principal office in that country. By applying these tests, it is possible that a particular company could be deemed to be from more than one country. The securities in which the fund may invest may be denominated by U.S. dollars or in currencies other than U.S. dollars.
The fund may invest in privately placed securities and initial public offerings.
The fund may also invest up to 10% of its assets in real estate investment trusts (“REITs”).
In times of stable or rising stock prices, the fund generally seeks to be fully invested in the instruments described above except that at least a small portion of fund assets generally will be held as cash, repurchase agreements, or cash equivalents to honor redemption requests and for other short-term needs. To the extent that fund assets are invested in cash equivalents, in times of rising market prices, the fund may underperform the market in proportion to the amount of cash equivalents in its portfolio. By purchasing stock index futures contracts, stock index call options, or call options on stock index futures contracts, however, the fund can seek to “equitize” the cash portion of its assets and obtain performance that is equivalent to investing directly in equity securities.
The fund may invest its assets in cash, cash equivalent securities or short-term debt securities, repurchase agreements and money market instruments. Under adverse or unstable market, economic or political conditions, the fund may do so without limit. Although the fund would do this only in seeking to avoid losses, the fund may be unable to pursue its investment objective during that time, and it could reduce the benefit from any upswing in the market. To the extent that the fund has any uninvested cash, the fund would also be subject to risk with respect to the depository institution holding the cash.
Transamerica Multi-Managed Balanced: The fund’s sub-advisers, BlackRock Financial Management, Inc. (“BlackRock”) and J.P. Morgan Investment Management Inc. (“JPMorgan”), seek to achieve the fund’s objective by investing approximately 60% of its assets in equity securities and 40% of its assets in fixed-income and money market securities (investing at least 25% of its assets in fixed-income senior securities, including debt securities and preferred stocks).
Equity component - JPMorgan seeks to achieve the fund’s objective by investing, under normal circumstances, at least 80% of the equity component’s net assets in equity securities of large- and medium-capitalization U.S. companies. The fund may invest in foreign companies. JPMorgan will normally keep the equity component as fully invested in equity securities as practicable. Industry by industry, the fund’s weightings are generally similar to those of the Standard & Poor’s 500® Index (“S&P 500 Index”). JPMorgan normally does not look to overweight or underweight industries. Holdings by industry sector will normally approximate those of the S&P 500 Index.
Fixed income component - The fixed income component of the fund is normally invested primarily in investment grade debt securities and U.S. government obligations, mortgage-backed securities guaranteed by U.S. government agencies and instrumentalities and mortgage-backed securities without government guarantees. Its dollar-weighted average effective maturity generally is between five and fifteen years (and does not exceed thirty years). The fund may also invest in U.S. Treasury and agency securities, municipal bonds, corporate bonds, asset-backed securities (including collateralized loan obligations, collateralized bond obligations and collateralized debt obligations), high quality, short-term obligations and repurchase
92
agreements, and in securities of foreign issuers. The fund may invest in securities that are denominated in U.S. dollars and in foreign currencies. Up to 20% of the fixed income component may be invested in any or all of non-dollar securities, high yield debt securities and emerging market securities.
The fund may, but is not required to, engage in certain investment strategies involving derivatives, such as options, futures, swaps, and forward currency contracts. These investment strategies may be employed to attempt to alter investment characteristics of the fund’s portfolio.
The fund may invest its assets in cash, cash equivalent securities or short-term debt securities, repurchase agreements and money market instruments. Under adverse or unstable market, economic or political conditions, the fund may do so without limit. Although the fund would do this only in seeking to avoid losses, the fund may be unable to pursue its investment objective during that time, and it could reduce the benefit from any upswing in the market. To the extent that the fund has any uninvested cash, the fund would also be subject to risk with respect to the depository institution holding the cash.
Transamerica Multi-Manager Alternative Strategies Portfolio: The fund seeks to achieve its investment objective by investing its assets in a combination of underlying Transamerica Funds (“underlying funds”).
| • | | Under normal circumstances, the fund expects to invest primarily in underlying funds that use alternative investment strategies and invest in alternative asset classes, including but not limited to: |
| | • | | Long-short and market neutral strategies; |
| | • | | Bear-market strategies; |
| | • | | Tactical investment strategies (bond and/or equity); |
| | • | | Foreign currency trading strategies; |
| | • | | Real estate securities; |
| | • | | Managed futures strategies; |
| | • | | Commodities and/or natural resources and/or precious metals; and |
| | • | | Non-core investments (such as micro-cap stocks, emerging market equities, TIPS and foreign bonds). |
| • | | Allocation of assets among the underlying funds is intended to achieve moderate capital appreciation with limited volatility and correlation with the mainstream equity and bond markets. |
| • | | The fund seeks to periodically and gradually adjust its allocations to favor investments in those underlying funds that are expected to provide the most favorable outlook for achieving its investment objective. |
| • | | The fund may also invest directly in U.S. government securities and/or short-term commercial paper. |
Each underlying fund has its own investment objective, principal investment strategies and investment risks. The sub-adviser for each underlying fund decides which securities to purchase and sell for that underlying fund. The fund’s ability to achieve its investment objective depends largely on the performance of the underlying funds in which it invests. The “Underlying Funds” section of the prospectus lists the underlying funds currently available for investment by the fund, provides a summary of their respective investment objectives and principal investment strategies, and identifies certain risks of the underlying funds.
It is not possible to predict the extent to which the fund will be invested in a particular underlying fund at any time.
As a consequence of its investment strategies and policies, the fund may be a significant shareholder in certain underlying funds.
The fund’s portfolio construction manager, Morningstar Associates, LLC (the “Portfolio Construction Manager”), determines the fund’s asset allocations and periodic changes thereto, and other fund investments. The Portfolio Construction Manager may change the fund’s asset allocations and underlying funds at any time without notice to shareholders, and without shareholder approval.
The fund may invest its assets in cash, cash equivalent securities or short-term debt securities, repurchase agreements and money market instruments. Under adverse or unstable market, economic or political conditions, the fund may do so without limit. Although the fund would do this only in seeking to avoid losses, the fund may be unable to pursue its investment objective during that time, and it could reduce the benefit from any upswing in the market. To the extent that the fund has any uninvested cash, the fund would also be subject to risk with respect to the depository institution holding the cash.
Transamerica Multi-Manager International Portfolio: The fund seeks to achieve its investment objective by investing its assets in a combination of underlying Transamerica Funds (“underlying funds”).
In seeking to achieve its investment objective, the fund follows the following investment strategies:
93
| • | | Under normal circumstances, the fund expects to invest primarily in underlying funds that invest in international (developed and emerging markets) equities. The underlying funds generally expect to be invested in more than three different countries. |
| • | | Allocation of assets among the underlying funds is based on such things as diversification principles, general market outlooks (both domestic and global), historical performance, global markets’ current valuations, and other global economic factors. |
| • | | The fund may also invest directly in U.S. government securities and/or short-term commercial paper. |
Each underlying fund has its own investment objective, principal investment strategies and investment risks. The sub-adviser for each underlying fund decides which securities to purchase and sell for that underlying fund. The fund’s ability to achieve its investment objective depends largely on the performance of the underlying funds in which it invests. The “Underlying Funds” section of the prospectus lists the underlying funds currently available for investment by the fund, provides a summary of their respective investment objectives and principal investment strategies, and identifies certain risks of the underlying funds.
It is not possible to predict the extent to which the fund will be invested in a particular underlying fund at any time.
As a consequence of its investment strategies and policies, the fund may be a significant shareholder in certain underlying funds.
The fund’s portfolio construction manager, Morningstar Associates, LLC (the “Portfolio Construction Manager”), determines the fund’s asset allocations and periodic changes thereto, and other fund investments. The Portfolio Construction Manager may change the fund’s asset allocations and underlying funds at any time without notice to shareholders and without shareholder approval.
The fund may invest its assets in cash, cash equivalent securities or short-term debt securities, repurchase agreements and money market instruments. Under adverse or unstable market, economic or political conditions, the fund may do so without limit. Although the fund would do this only in seeking to avoid losses, the fund may be unable to pursue its investment objective during that time, and it could reduce the benefit from any upswing in the market. To the extent that the fund has any uninvested cash, the fund would also be subject to risk with respect to the depository institution holding the cash.
Transamerica Systematic Small/Mid Cap Value: The fund’s sub-adviser, Systematic Financial Management L.P. (“Systematic”), seeks to achieve the fund’s objective by investing, under normal circumstances, at least 80% of the fund’s net assets in small- and mid-cap equity securities (U.S. Equity securities, ADRs and foreign securities trading on U.S. markets). The fund defines small- and mid-cap equities as companies whose market capitalization falls within the range of $100 million to $20 billion or within the range of the Russell 2500® Index, whichever is broader at the time of purchase.
The fund generally will invest in small- and mid-cap equities with valuation characteristics including low price/earnings and price/cash flow ratios. Systematic’s security selection process generally favors companies with positive earnings dynamics, manageable debt levels and good cash flows. Trends in balance sheet items including inventories, accounts receivable, and payables are scrutinized as well. Systematic also reviews the company’s products/services, market position, industry condition, financial and accounting policies and quality of management. Securities of issuers that possess the greatest combination of the aforementioned attributes are then prioritized as candidates for purchase.
The fund may invest up to 10% of its total assets in the securities of foreign issuers, including ADRs and foreign securities trading on U.S. markets.
Systematic employs a fully invested strategy. Therefore, under normal market conditions, cash and cash equivalents are generally less than 5% of the portfolio value.
The fund may invest its assets in cash, cash equivalent securities or short-term debt securities, repurchase agreements and money market instruments. Under adverse or unstable market, economic or political conditions, the fund may do so without limit. Although the fund would do this only in seeking to avoid losses, the fund may be unable to pursue its investment objective during that time, and it could reduce the benefit from any upswing in the market. To the extent that the fund has any uninvested cash, the fund would also be subject to risk with respect to the depository institution holding the cash.
Transamerica TS&W International Equity: Under normal circumstances, the fund seeks to achieve its investment objective by investing at least 80% of its net assets in equity securities of foreign companies representing at least three countries other than the United States. Thompson, Siegel & Walmsley LLC (“TS&W”), the fund’s sub-adviser, currently anticipates investing in at least 12 countries other than the United States. TS&W will emphasize established companies in individual foreign markets and will attempt to stress companies and markets that it believes are undervalued. The fund expects capital growth to be the predominant component of its total return.
94
Generally, the fund will invest primarily in common stocks of established companies listed on foreign securities exchanges, but it may also invest in securities traded over-the-counter. Although the fund will emphasize larger, more seasoned or established companies, it may invest in companies of varying size as measured by assets, sales or market capitalization. The fund will invest primarily in securities of companies domiciled in developed countries, but may also invest in developing countries. The fund may invest up to 10% of its assets in securities of companies in developing countries. It is expected that investments will be diversified throughout the world and within markets in an effort to minimize specific country and currency risks.
TS&W employs a relative value process utilizing a combination of quantitative and qualitative methods based on a four-factor valuation screen designed to outperform the Morgan Stanley Capital International EAFE Index. The initial universe consists of approximately 3,000 actively traded non-U.S. stocks. Parts one and two of the screen attempt to assess a company’s attractiveness based on cash flows relative to other international stocks and as compared to their industry or sector peers. The third factor considers the relative earnings prospects of the company. The fourth factor involves looking at the company’s recent price action. From the model, approximately 300 stocks are identified for further research. These are the stocks that rank the highest on the basis of these four factors combined. TS&W generally limits its investment universe to those companies with a minimum of three years of operating history.
TS&W’s analysts also perform rigorous fundamental analysis, exploring numerous factors that may affect the outlook for a company. They evaluate publicly available information including sell-side research, company filings, and trade periodicals. The analysts may speak with company management to hear their perspectives and outlook on pertinent business issues. They apply a consistent and disciplined review in a team environment that encourages critical thinking and analysis for each company considered for investment. A portfolio composed of 80-100 stocks is selected as a result of this process.
Established positions in the fund are ranked daily and are reviewed regularly in the same manner to re-examine their fundamental and valuation characteristics. The product team meets periodically to discuss each stock’s place in the fund. TS&W employs a consistent sell discipline which includes a significant negative earnings revision, a stock being sold when the catalyst is no longer valid or another stock presents a more attractive opportunity.
TS&W may use derivatives for a variety of purposes, including to earn income and enhance returns, to increase or decrease exposure to a particular market, to manage or adjust the risk profile of the fund, or as alternatives to direct investments.
The fund may invest its assets in cash, cash equivalent securities or short-term debt securities, repurchase agreements and money market instruments. Under adverse or unstable market, economic or political conditions, the fund may do so without limit. Although the fund would do this only in seeking to avoid losses, the fund may be unable to pursue its investment objective during that time, and it could reduce the benefit from any upswing in the market. To the extent that the fund has any uninvested cash, the fund would also be subject to risk with respect to the depository institution holding the cash.
Transamerica WMC Diversified Equity: The fund invests, under normal circumstances, at least 80% of its net assets in domestic equity securities. The fund invests primarily in common stocks of growth-oriented companies. Each stock is evaluated and ranked on a consistent set of growth, valuation, and quality criteria and the fund will seek diversified sources of return from these criteria.
The fund’s sub-adviser, Wellington Management Company, LLP (“Wellington Management”), uses what is sometimes referred to as a “bottom up” approach, which is the use of fundamental analysis to identify specific securities within industries or sectors for purchase or sale. Fundamental analysis involves the assessment of a company’s business environment, market share, management, global expansion plans, balance sheet, income statement, anticipated earnings, revenues, and other related measures of value.
Wellington Management continually monitors every company in the fund’s portfolio for fundamental attractiveness. The fund typically sells an investment when the investment achieves its anticipated potential, the company begins to show deteriorating relative fundamentals or alternative investments become sufficiently more attractive.
Consistent with the fund’s objective and other policies, the fund may invest to a lesser extent in derivatives, including futures, forwards, options and swaps. The fund may invest up to 20% of its total assets in foreign securities (not including American Depositary Receipts, American Depositary Shares or U.S. dollar denominated securities of foreign issuers).
The fund may invest its assets in cash, cash equivalent securities or short-term debt securities, repurchase agreements and money market instruments. Under adverse or unstable market, economic or political conditions, the fund may do so without limit. Although the fund would do this only in seeking to avoid losses, the fund may be unable to pursue its investment objective during that time, and it could reduce the benefit from any upswing in the market. To the extent that the fund has any uninvested cash, the fund would also be subject to risk with respect to the depository institution holding the cash.
Transamerica WMC Diversified Growth: The fund invests, under normal circumstances, at least 80% of its net assets in domestic common stocks. The fund invests primarily in common stocks of growth-oriented companies. Each stock is evaluated
95
and ranked on a consistent set of growth, valuation, and quality criteria and the fund will seek diversified sources of return from these criteria.
The fund’s sub-adviser, Wellington Management Company, LLP (“Wellington Management”), uses what is sometimes referred to as a “bottom up” approach, which is the use of fundamental analysis to identify specific securities within industries or sectors for purchase or sale. A “bottom-up” approach is looking at individual companies against the context of broader market factors. Fundamental analysis involves the assessment of a company’s business environment, market share, management, global expansion plans, balance sheet, income statement, anticipated earnings, revenues, and other related measures of value.
Wellington Management continually monitors every company in the fund’s portfolio for fundamental attractiveness. The fund typically sells an investment when the investment achieves its anticipated potential, the company begins to show deteriorating relative fundamentals or alternative investments become sufficiently more attractive.
Consistent with the fund’s objective and other policies, the fund may invest to a lesser extent in derivatives, including futures, forwards, options and swaps. The fund may invest up to 20% of its total assets in foreign securities (not including American Depositary Receipts, American Depositary Shares or U.S. dollar denominated securities of foreign issuers).
The fund may invest its assets in cash, cash equivalent securities or short-term debt securities, repurchase agreements and money market instruments. Under adverse or unstable market, economic or political conditions, the fund may do so without limit. Although the fund would do this only in seeking to avoid losses, the fund may be unable to pursue its investment objective during that time, and it could reduce the benefit from any upswing in the market. To the extent that the fund has any uninvested cash, the fund would also be subject to risk with respect to the depository institution holding the cash.
Transamerica WMC Quality Value: The fund’s sub-adviser, Wellington Management Company, LLP (“Wellington Management”), invests the fund’s assets, under normal circumstances, primarily in common stock and depositary receipts. Generally, less than 5% of fund assets will be invested in cash and cash equivalents subject to a maximum of 10% of fund assets. The fund will normally invest at least 90% of its assets in U.S. securities. Generally, the fund invests primarily in companies with market capitalizations greater than $10 billion, but may invest in companies with capitalizations between $2 and $10 billion at the time of purchase. The fund will generally hold 65 to 85 stocks. The largest weightings are given to companies Wellington Management believes have the most upside return potential relative to downside risk.
Wellington Management employs a bottom-up stock selection process that utilizes Wellington Management’s proprietary, fundamental research in an effort to identify undervalued stocks that have the potential for significant longer-term rewards. The fund’s investment philosophy is based on the premise that high-quality companies in out-of-favor industries can generate strong returns on invested capital. Over the long term, these companies may drive strong performance with lower downside risk than the overall market. Wellington Management believes that capital will typically leave out-of-favor industries. Over time, high-quality companies in out-of-favor industries can increase their market share at the expense of their weaker competitors and consolidate their industry. This may enable such companies to generate above-average return on capital and earnings growth with much less variability than other areas of the market. Since these companies are in out-of-favor industries, the market share leaders typically can be purchased at a discount to the market.
The investment process begins with an evaluation of capital spending relative to sales growth in the different industries in the market. Wellington Management’s approach focuses on those industries where capital spending in the industry is below the growth rate in sales. The approach then intensively evaluates all the large cap companies (greater than $2 billion in market capitalization) in the industry. Wellington Management focuses on the industry market share leaders and consolidators. From a financial perspective, the approach seeks to identify companies with a below-average debt/capital ratio relative to their industry, higher-than-average and improving return on capital, and market share leadership and trends. From a qualitative perspective, the approach emphasizes the strength and depth of management and a strong sustainable advantage in the form of a cost, customer, or competitive advantage. All companies that meet Wellington Management’s valuation criteria (including, but not limited to, dividend yield and the potential for dividend increases, price/earnings ratio, price/sales ratio, book value, free cash flow, return on invested capital, and potential for improving return on invested capital) are ranked on a similar basis. In order to evaluate each company, all stocks are rated on the basis of upside return potential relative to downside risk over a 12- to 24- month period based on the fundamental and qualitative analysis of each company. Stocks are purchased when the upside return potential is estimated to be at least twice the downside risk. Stocks are generally sold when the upside return potential is estimated to be less than the downside risk.
The fund may invest up to 10% of its assets in non-U.S. securities.
The fund may invest its assets in cash, cash equivalent securities or short-term debt securities, repurchase agreements and money market instruments. Under adverse or unstable market, economic or political conditions, the fund may do so without limit. Although the fund would do this only in seeking to avoid losses, the fund may be unable to pursue its investment objective during that time, and it could reduce the benefit from any upswing in the market. To the extent that the fund has any uninvested cash, the fund would also be subject to risk with respect to the depository institution holding the cash.
96
|
| MORE ON RISKS OF INVESTING IN THE FUNDS |
Principal Investment Risks: The following provides additional information regarding the risks of investing in the funds as described at the front of the prospectus.
Active Trading: Certain funds are actively managed and, under appropriate circumstances, may purchase and sell securities without regard to the length of time held. A high portfolio turnover rate may have a negative impact on performance by increasing transaction costs and may generate greater tax liabilities for shareholders holding shares in taxable accounts.
Asset Allocation: The Portfolio Construction Manager allocates a fund’s assets among various underlying funds. These allocations may be unsuccessful in maximizing a fund’s return and/or avoiding investment losses.
Bank Obligations: If a fund concentrates in U.S. bank obligations, a fund will be particularly sensitive to adverse events affecting U.S. banks. Banks are sensitive to changes in money market and general economic conditions, as well as decisions by regulators that can affect banks’ profitability.
Cash Management and Defensive Investing: Money market instruments or short-term debt securities held by the fund for cash management or defensive investing purposes can fluctuate in value. Like other fixed income securities, they are subject to risk, including market, interest rate and credit risk. If the fund holds cash uninvested, the fund will not earn income on the cash and the fund’s yield will go down. If a significant amount of the fund’s assets are used for cash management or defensive investing purposes, it will be more difficult for the fund to achieve its objective.
Commodities: Because a fund may invest in instruments whose performance is linked to the price of an underlying commodity or commodity index, a fund may be subject to the risks of investing in physical commodities. These types of risks include regulatory, economic and political developments, weather events and natural disasters, pestilence, market disruptions and the fact that commodity prices may have greater volatility than investments in traditional securities.
Convertible Securities: Convertible securities may include corporate notes or preferred stock, but ordinarily are a long-term debt obligation of the issuer convertible at a stated exchange rate into common stock of the issuer. As with most debt securities, the market value of convertible securities tends to decline as interest rates increase and, conversely, to increase as interest rates decline. Convertible securities generally offer lower interest or dividend yields than non-convertible securities of similar quality. However, when the market price of the common stock underlying a convertible security exceeds the conversion price, the price of the convertible security tends to reflect the value of the underlying common stock.
Credit: If an obligor (such as the issuer itself or a party offering credit enhancement) for a security held by the fund fails to pay, otherwise defaults, becomes insolvent or files for bankruptcy or is perceived to be less creditworthy, or a security’s credit rating is downgraded or the credit quality or value of any underlying assets declines, the value of your investment in the fund could decline. The fund may incur expenses to protect the fund’s interest in securities experiencing these events. If the fund enters into financial contracts (such as certain derivatives, repurchase agreements, reverse repurchase agreements, and when-issued, delayed delivery and forward commitment transactions), the fund will be subject to the credit risk presented by the counterparty. Credit risk is broadly gauged by the credit ratings of the securities in which the fund invests. However, ratings are only the opinions of the companies issuing them and are not guarantees as to quality. The fund is subject to greater levels of credit risk to the extent it invests in junk bonds. These securities have a higher risk of issuer default, are considered speculative and may involve significant risk of exposure to adverse conditions. These securities may be in default or in danger of default as to principal and interest. Unrated securities of comparable quality share these risks. The fund may invest in securities which are subordinated to more senior securities of the issuer, or which represent interests in pools of such subordinated securities. Subordinated securities are more likely to suffer a credit loss than non-subordinated securities of the same issuer, any loss incurred by the subordinated securities is likely to be proportionately greater, and any recovery of interest or principal may take more time. As a result, even a perceived decline in creditworthiness of the issuer is likely to have a greater impact on them.
Currency: When a fund invests in securities denominated in foreign currencies, it is subject to the risk that those currencies will decline in value relative to the U.S. dollar, or, in the case of hedging positions, that the U.S. dollar will decline in value relative to the currency being hedged. Currency rates in foreign countries may fluctuate significantly over short periods of time for reasons such as changes in interest rates, government intervention or political developments. As a result, a fund’s investments in foreign currency denominated securities may reduce the returns of a fund.
Depositary Receipts: Depositary receipts may be less liquid than the underlying shares in their primary trading market. Any distributions paid to the holders of depositary receipts are usually subject to a fee charged by the depositary. Holders of depositary receipts may have limited voting rights, and investment restrictions in certain countries may adversely impact the value of depositary receipts because such restrictions may limit the ability to convert equity shares into depositary receipts and vice versa. Such restrictions may cause equity shares of the underlying issuer to trade at a discount or premium to the market price of the depositary receipts.
97
Derivatives: Derivatives involve special risks and costs and may result in losses to the fund. Using derivatives can have a leveraging effect which may increase investment losses and may increase fund volatility. Even a small investment in derivatives can have a disproportionate impact on a fund. Using derivatives can increase losses and reduce opportunities for gains when market prices, interest rates or currencies, or the derivative instruments themselves, behave in a way not anticipated by a fund, especially in abnormal market conditions. The other parties to certain derivative contracts present the same types of credit risk as issuers of fixed-income securities. Derivatives also tend to involve greater liquidity risk. The fund may be unable to terminate or sell its derivative positions. In fact, many over-the-counter derivative instruments will not have liquidity beyond the counterparty to the instrument. The fund’s use of derivatives may also increase the amount of taxes payable by shareholders. Recent legislation calls for new regulation of the derivatives markets. The extent and impact of the regulation are not yet fully known and may not be for some time. New regulation of derivatives may make them more costly, may limit their availability, or may otherwise adversely affect their value or performance.
Using derivatives, especially for non-hedging purposes, may involve greater risks to the fund than investing directly in securities, particularly as these instruments may be very complex and may not behave in the manner anticipated by the fund. Risks associated with the use of derivatives are magnified to the extent that a large portion of the fund’s assets are committed to derivatives in general or are invested in just one or a few types of derivatives.
When the fund enters into derivative transactions, it may be required to segregate assets, or enter into offsetting positions, in accordance with applicable regulations. Such segregation will not limit the fund’s exposure to loss, however, and the fund will have investment risk with respect to both the derivative itself and the assets that have been segregated to cover the fund’s derivative exposure. If the segregated assets represent a large portion of the fund’s portfolio, this may impede portfolio management or the fund’s ability to meet redemption requests or other current obligations.
Some derivatives may be difficult to value, or may be subject to the risk that changes in the value of the instrument may not correlate well with the underlying asset, rate or index. In addition, derivatives may be subject to market risk, interest rate risk and credit risk. A fund could lose the entire amount of its investment in a derivative and, in some cases, could lose more than the principal amount invested. Also, suitable derivative instruments may not be available in all circumstances or at reasonable prices. A fund’s sub-adviser may not make use of derivatives for a variety of reasons.
Emerging Markets: Investing in the securities of issuers located in or principally doing business in emerging markets bear foreign risks. In addition, the risks associated with investing in emerging markets are often greater than investing in developed foreign markets. Specifically, the economic structures in emerging markets countries are less diverse and mature than those in developed countries, and their political systems are less stable. Investments in emerging markets countries may be affected by national policies that restrict foreign investments. Emerging markets countries tend to have economic, political and legal systems that are less fully developed and are less stable than those of more advanced countries. Low trading volumes may result in a lack of liquidity and in extreme price volatility. As a result, a fund investing in emerging markets countries may be required to establish special custody or other arrangements before investing.
Fixed-Income Securities: The value of fixed-income securities may change daily based on changes in interest rates, and other market conditions and factors. Risks include, without limitation:
| • | | market risk: fluctuations in market value |
| • | | interest rate risk: the value of a fixed-income security generally decreases as interest rates rise. This may also be the case for dividend paying stocks. Increases in interest rates may cause the value of your investment to go down. The longer the maturity or duration, the more sensitive the value of a fixed-income security is to fluctuations in interest rates |
| • | | prepayment or call risk: declining interest rates may cause issuers of securities held by the fund to pay principal earlier than scheduled or to exercise a right to call the securities, forcing a fund to reinvest in lower yielding securities |
| • | | extension risk: rising interest rates may result in slower than expected principal prepayments, which effectively lengthens the maturity of affected securities, making them more sensitive to interest rate changes |
| • | | credit risk: issuers (or guarantors) defaulting on their obligations to pay interest or return principal, becoming insolvent or filing for bankruptcy, being perceived as being less creditworthy or having a credit rating downgraded, or the credit quality or value of any underlying asset declines. A fund may incur expenses to protect the fund’s interest in securities experiencing these events. A fund is subject to more credit risk to the extent it invests in junk bonds. These securities have a higher risk of issuer default, are considered speculative and may involve significant risk of exposure to adverse conditions. These securities may be in default or in danger of default as to principal and interest. If a fund invests in securities that are subordinated to other securities, or which represent interests in pools of such subordinated securities, those investments may be more greatly affected by a default or even a perceived decline in creditworthiness of the issuer. |
98
If, after purchase, the credit rating on a security is downgraded or the credit quality deteriorates, or if the maturity is extended, a fund’s sub-adviser will decide whether the security should be held or sold. Upon the occurrence of certain triggering events or defaults on a security held by a fund, or if an issuer of such a security has difficulty meeting its obligations, a fund may become the holder of a restructured security or of underlying assets. In that case, a fund may become the holder of securities or other assets that it could not otherwise purchase at a time when those assets may be difficult to sell or can be sold only at a loss.
Focused Investing: To the extent a fund invests in a limited number of issuers, its performance may be more volatile than funds that hold a greater variety of securities.
Foreign Securities: Investments in foreign securities, including foreign securities represented by American Depositary Receipts (“ADRs”), Global Depositary Receipts (“GDRs”), and European Depositary Receipts (“EDRs”), involve risks relating to political, social and economic developments abroad, as well as risks resulting from the differences between the regulations to which U.S. and foreign issuer markets are subject. These risks include, without limitation:
| • | | different accounting and reporting practices |
| • | | less information available to the public |
| • | | less (or different) regulation of securities markets |
| • | | more complex business negotiations |
| • | | more fluctuations in prices |
| • | | delays in settling foreign securities transactions |
| • | | higher costs for holding shares (custodial fees) |
| • | | higher transaction costs |
| • | | vulnerability to seizure and taxes |
| • | | political or financial instability and small markets |
| • | | different market trading days |
Geographic: Because a fund may invest a relatively large percentage of its assets in issuers located in a single country, a small number of countries, or a particular geographic region, a fund’s performance could be closely tied to the market, currency, economic, political, or regulatory conditions and developments in those countries or that region, and could be more volatile than the performance of more geographically-diversified funds.
Growth Stocks: Growth stocks can be volatile for several reasons. Since growth companies usually reinvest a high proportion of their earnings in their own businesses, they may lack the dividends often associated with the value stocks that could cushion their decline in a falling market. Also, since investors buy growth stocks because of their expected superior earnings growth, earnings disappointments often result in sharp price declines. Certain types of growth stocks, particularly technology stocks, can be extremely volatile and subject to greater price swings than the broader market.
High-Yield Debt Securities: High-yield debt securities, or junk bonds, are securities that are rated below “investment grade” (that is, securities rated below Baa/BBB) or, if unrated, are considered by the sub-adviser to be of equivalent quality. High-yield debt securities range from those for which the prospect for repayment of principal and interest is predominantly speculative to those which are currently in default on principal or interest payments or in bankruptcy. A fund with high-yield debt securities may be more susceptible to credit risk and market risk than a fund that invests only in higher quality debt securities because these lower-rated debt securities are less secure financially and more sensitive to downturns in the economy. In addition, the secondary market for such securities may not be as liquid as that for more highly rated debt securities. As a result, a fund’s sub-adviser may find it more difficult to sell these securities or may have to sell them at lower prices. High-yield securities are not generally meant for short-term investing.
Increase in Expenses: Your actual costs of investing in the fund may be higher than the expenses shown in “Annual Fund Operating Expenses” for a variety of reasons. For example, expense ratios may be higher than those shown if average net assets decrease. Net assets are more likely to decrease and fund expense ratios are more likely to increase when markets are volatile.
Inflation-Protected Securities: Inflation-protected debt securities may react differently from other types of debt securities and tend to react to changes in “real” interest rates. Real interest rates represent nominal (stated) interest rates reduced by the expected impact of inflation. In general, the price of an inflation-protected debt security can fall when real interest rates rise, and can rise when real interest rates fall. Interest payments on inflation-protected debt securities can be unpredictable and will vary as the principal and/or interest is adjusted for inflation. Also, the inflation index utilized by a particular inflation-protected
99
security may not accurately reflect the true rate of inflation, in which case the market value of the security could be adversely affected.
IPOs: Initial public offerings (“IPOs”) are subject to specific risks which include, among others:
| | • | | no track record for consideration; |
| | • | | securities may be illiquid; and |
| | • | | earnings are less predictable. |
Interest Rate (Transamerica AEGON Money Market): The interest rates on short-term obligations held in a fund’s portfolio will vary, rising or falling with short-term interest rates generally. A fund’s yield will tend to lag behind general changes in interest rates.
The ability of a fund’s yield to reflect current market rates will depend on how quickly the obligations in its portfolio mature and how much money is available for investment at current market rates.
Interest Rate: Fixed-income securities have varying levels of sensitivity to changes in interest rates. In general, the price of a fixed-income security tends to fall when interest rates rise and can rise when interest rates fall. A change in interest rates will not have the same impact on all fixed-income securities. Generally, the longer the maturity or duration of a fixed-income security, the greater the impact of a rise in interest rates on the security’s value. In addition, different interest rate measures (such as short- and long-term interest rates and U.S. and foreign interest rates), or interest rates on different types of securities or securities of different issuers, may not necessarily change in the same amount or in the same direction. When interest rates go down, the income received by the fund, and the fund’s yield, may decline.
Certain fixed-income securities pay interest at variable or floating rates. Variable rate securities tend to reset at specified intervals, while floating rate securities may reset whenever there is a change in a specified index rate. In most cases, these reset provisions reduce the impact of changes in market interest rates on the value of the security. However, some securities do not track the underlying index directly, but reset based on formulas that may produce a leveraging effect; others may also provide for interest payments that vary inversely with market rates. The market prices of these securities may fluctuate significantly when interest rates change. The fund’s yield may decline due to a decrease in market interest rates.
Inflation protected debt securities may react differently from other types of debt securities and tend to react to changes in “real” interest rates. Real interest rates represent nominal (stated) interest rates reduced by the expected impact of inflation. In general, the price of an inflation protected debt security can fall when real interest rates rise, and can rise when real interest rates fall. Interest payments on inflation protected debt securities can be unpredictable and will vary as the principal and/or interest is adjusted for inflation.
Investing Aggressively: The value of developing-company stocks may be very volatile, and can drop significantly in a short period of time. Rights, options and futures contracts may not be exercised and may expire worthless. Warrants and rights may be less liquid than stocks. Use of futures and other derivatives may make a fund more volatile.
Liquidity: Liquidity risk exists when particular investments are difficult to sell. Although most of a fund’s securities must be liquid at the time of investment, securities may become illiquid after purchase by a fund, particularly during periods of market turmoil. When a fund holds illiquid investments, a fund may be harder to value, especially in changing markets, and if a fund is forced to sell these investments to meet redemptions or for other cash needs, a fund may suffer a loss. In addition, when there is illiquidity in the market for certain securities, a fund, due to limitations on investments in illiquid securities, may be unable to achieve its desired level of exposure to a certain sector.
Loans: A fund may invest in certain commercial loans, including loans generally known as “syndicated bank loans,” by acquiring participations or assignments in such loans. The lack of a liquid secondary market for such securities may have an adverse impact on the value of the securities and a fund’s ability to dispose of particular assignments or participations when necessary to meet redemptions of shares or to meet a fund’s liquidity needs. When purchasing a participation, a fund may be subject to the credit risks of both the borrower and the lender that is selling the participation. When purchasing a loan assignment, a fund acquires direct rights against the borrowers, but only to the extent of those held by the assigning lender. Investment in loans through a direct assignment from the financial institution’s interests with respect to a loan may involve additional risks to a fund. It is also unclear whether loans and other forms of direct indebtedness offer securities law protections against fraud and misrepresentation. In the absence of definitive regulatory guidance, a fund relies on its sub-adviser’s research in an attempt to avoid situations where fraud or misrepresentation could adversely affect a fund.
Market: The market prices of the fund’s securities may go up or down, sometimes rapidly or unpredictably. If the market prices of the securities owned by the fund fall, the value of your investment in the fund will decline. The value of a security may fall due to general market conditions, such as real or perceived adverse economic or political conditions, inflation, changes in interest rates or currency rates, lack of liquidity in the markets or adverse investor sentiment. Market prices of securities also
100
may go down due to events or conditions that affect particular sectors or issuers. The fund may experience a substantial or complete loss on any individual security. The equity and debt capital markets in the U.S. and internationally have experienced unprecedented volatility. The financial crisis has caused a significant decline in the value and liquidity of many securities. In response to the crisis, the U.S. and other governments and the Federal Reserve and certain foreign central banks have taken various steps to support financial markets. The withdrawal of this support could negatively affect the value and liquidity of certain securities. In addition, legislation recently enacted in the U.S. calls for changes in many aspects of financial regulation. The impact of the legislation on the markets, and the practical implications for market participants, may not be fully known for some time.
Changes in market conditions will not have the same impact on all types of securities. The value of a security may also fall due to specific conditions that affect a particular sector of the securities market or a particular issuer.
Mortgage-Related and Asset-Backed Securities: Mortgage-backed securities may be issued by private issuers, by government-sponsored entities such as Fannie Mae (formally known as Federal National Mortgage Association) or Freddie Mac (formally known as Federal Home Loan Mortgage Corporation) or by agencies of the U.S. government, such as the Government National Mortgage Association (“Ginnie Mae”). Mortgage-backed securities represent direct or indirect participations in, or are collateralized by and payable from, mortgage loans secured by real property. Unlike mortgage-related securities issued or guaranteed by agencies of the U.S. government or government-sponsored entities, mortgage-related securities issued by private issuers do not have a government or government-sponsored entity guarantee (but may have other credit enhancement), and may, and frequently do, have less favorable collateral, credit risk or other underwriting characteristics. Mortgage-backed securities are also particularly susceptible to prepayment and extension risks, because prepayments on the underlying mortgages tend to increase when interest rates fall and decrease when interest rates rise.
Asset-backed securities represent participations in, or are secured by and payable from, assets such as installment sales or loan contracts, leases, credit card receivables and other categories of receivables. Certain asset-backed securities present a heightened level of risk because, in the event of default, the liquidation value of the underlying assets may be inadequate to pay any unpaid principal or interest.
The value of mortgage-backed and asset-backed securities may be affected by changes in credit quality or value of the mortgage loans or other assets that support the securities. In addition, for mortgage-backed securities, when market conditions result in an increase in the default rates on the underlying mortgages and the foreclosure values of the underlying real estate are below the outstanding amount of the underlying mortgages, collection of the full amount of accrued interest and principal on these investments may be doubtful.
Natural Resource-Related Securities: Securities of companies involved with natural resources may be subject to significant price fluctuations, reflecting volatility of energy and basic materials’ prices, possible instability of supply and changes in demand or inflation. In addition, some companies may be subject to the risks generally associated with extraction of natural resources and the risks of the hazards associated with natural resources.
Non-Diversification: Focusing investments in a small number of issuers, industries or foreign currencies increases risk. Because a fund is non-diversified, it may be more susceptible to risks associated with a single economic, political or regulatory occurrence than a more diversified fund might be.
Portfolio Selection: The value of your investment may decrease if the sub-adviser’s judgment about the attractiveness, quality, relative yield, value or market trends affecting a particular security, industry or sector, or about interest rates, is incorrect.
Precious Metals-Related Securities: Prices of precious metals and of precious metals-related securities historically have been very volatile. The high volatility of precious metals prices may adversely affect the financial condition of companies involved with precious metals. The production and sale of precious metals by governments or central banks or other larger holders can be affected by various economic, financial social and political factors, which may be unpredictable and may have a significant impact on the prices of precious metals. Other factors that may affect the prices of precious metals and securities related to them include changes in inflation, the outlook for inflation and changes in industrial and commercial demand for precious metals.
Preferred Stock: Preferred stock represents an interest in a company that generally entitles the holder to receive, in preference to the holders of the company’s common stock, dividends and a fixed share of the proceeds resulting from any liquidation of the company. Preferred stock’s right to dividends and liquidation proceeds is junior to the rights of a company’s debt securities. Preferred stocks may pay fixed or adjustable rates of return. The value of preferred stock may be subject to factors that affect fixed income and equity securities, including changes in interest rates and in a company’s creditworthiness. Shareholders of preferred stock may suffer a loss of value if dividends are not paid. Preferred stock does not generally carry voting rights.
101
Real Estate Investment Trusts (“REITS”): Equity REITs can be affected by any changes in the value of the properties owned. A REIT’s performance depends on the types and locations of the properties it owns and on how well it manages those properties or loan financings. A decline in rental income could occur because of extended vacancies, increased competition from other properties, tenants’ failure to pay rent or poor management. A REIT’s performance also depends on the company’s ability to finance property purchases and renovations and manage its cash flows. Because REITs are typically invested in a limited number of projects or in a particular market segment, they are more susceptible to adverse developments affecting a single project or market segment than more broadly diversified investments. Loss of status as a qualified REIT or changes in the treatment of REITs under the federal tax law, could adversely affect the value of a particular REIT or the market for REITs as a whole.
Real Estate Securities: Investments in the real estate industry are subject to risks associated with direct investment in real estate. These risks may include, without limitation:
| • | | declining real estate value |
| • | | risks relating to general and local economic conditions |
| • | | increased competition for assets in local and regional markets |
| • | | increases in property taxes |
| • | | increases in operating expenses or interest rates |
| • | | change in neighborhood value or the appeal of properties to tenants |
| • | | insufficient levels of occupancy |
| • | | inadequate rents to cover operating expenses |
The performance of securities issued by companies in the real estate industry also may be affected by prudent management of insurance risks, adequacy of financing available in capital markets, competent management, changes in applicable laws and government regulations (including taxes) and social and economic trends.
Redemption (Transamerica AEGON Money Market ): The fund may experience periods of heavy redemptions that could cause the fund to liquidate its assets at inopportune times or at a loss or depressed value particularly during periods of declining or illiquid markets. Redemption risk is greater to the extent that the fund has investors with large shareholdings, short investment horizons, or unpredictable cash flow needs. The redemption by one or more large shareholders of their holdings in the fund could have an adverse impact on the remaining shareholders in the fund. If the fund is forced to liquidate its assets under unfavorable conditions or at inopportune times, the fund’s ability to maintain a stable $1.00 share price may be affected. In addition, the fund may suspend redemptions when permitted by applicable regulations.
Repurchase Agreements: Under a repurchase agreement, the seller agrees to repurchase a security at a mutually agreed-upon time and price. If the other party to a repurchase agreement defaults on its obligation, a fund may suffer delays and incur costs or lose money in exercising its rights under the agreement. If the seller fails to repurchase the security and the market value declines, a fund could lose money.
Rule 144A and Privately Placed Securities: “Rule 144A” and other privately placed securities are securities that are not registered for sale to the public and thus are considered “restricted.” They may only be resold to certain qualified institutional buyers. An insufficient number of qualified institutional buyers interested in purchasing a Rule 144A security held by a fund could adversely affect the marketability of such security and a fund might be unable to dispose of such security promptly or at reasonable prices.
Securities Lending: Each fund, except Transamerica AEGON Money Market and each of the asset allocation funds, may lend securities to other financial institutions that provide cash or other securities as collateral. Securities lending involves the risk that the borrower may fail to return the securities in a timely manner or at all. As a result, a fund may lose money and there may be a delay in recovering the loaned securities. A fund could also lose money if it does not recover the securities and/or the value of the collateral falls, including the value of investments made with cash collateral. These events could trigger adverse tax consequences for a fund.
Short Sales: A short sale may be effected by selling a security that a fund does not own. In order to deliver the security to the purchaser, a fund borrows the security, typically from a broker-dealer or an institutional investor. A fund later closes out the position by returning the security to the lender. If the price of the security sold short increases, a fund would incur a loss; conversely, if the price declines, a fund will realize a gain. Although the gain is limited by the price at which the security was sold short, the loss is potentially unlimited. A fund’s use of short sales in an attempt to improve performance or to reduce
102
overall portfolio risk may not be successful and may result in greater losses or lower positive returns than if a fund held only long positions. A fund may be unable to close out a short position at an acceptable price, and may have to sell related long positions at disadvantageous times to produce cash to unwind a short position. Short selling involves higher transaction costs than typical long-only investing.
A short sale may also be effected “against the box” if, at all times when the short position is open, a fund contemporaneously owns or has the right to obtain at no additional cost securities identical to those sold short. In the event that a fund were to sell securities short “against the box” and the price of such securities were to then increase rather than decrease, a fund would forego the potential realization of the increased value of the shares sold short.
Small- or Medium-Sized Companies: Investing in small- and medium-sized companies involves greater risk than is customarily associated with more established companies. Stocks of such companies, particularly developing companies, generally are subject to more volatility in price than larger company securities. Among the reasons for the greater price volatility are the less certain growth prospects of smaller companies, the lower degree of liquidity in the markets for such securities, and the greater sensitivity of smaller companies to changing economic conditions. Smaller companies often have limited product lines, markets, or financial resources and their management may lack depth and experience. Such companies usually do not pay significant dividends that could cushion returns in a falling market.
Smaller Companies: Investing in smaller companies involves greater risk than is customarily associated with more established companies. Stocks of such companies, particularly developing companies, generally are subject to more volatility in price than larger company securities. Among the reasons for the greater price volatility are the less certain growth prospects of smaller companies, the lower degree of liquidity in the markets for such securities, and the greater sensitivity of smaller companies to changing economic conditions. Smaller companies often have limited product lines, markets, or financial resources and their management may lack depth and experience. Such companies usually do not pay significant dividends that could cushion returns in a falling market.
Stocks: Stocks may be volatile – their prices may go up and down dramatically over the shorter term. These price movements may result from factors affecting individual companies, industries, the securities market as a whole or the overall economy. Because the stocks a fund holds fluctuate in price, the value of your investment in a fund will go up and down.
Structured Instruments: A fund may invest in various types of structured instruments, including securities that have demand, tender or put features, or interest rate reset features. These may include instruments issued by structured investment or special purpose vehicles or conduits, and may be asset-backed or mortgage-backed securities. Structured instruments may take the form of participation interests or receipts in underlying securities or other assets, and in some cases are backed by a financial institution serving as a liquidity provider. Some of these instruments may have an interest rate swap feature which substitutes a floating or variable interest rate for the fixed interest rate on an underlying security, and some may be asset-backed or mortgage-backed securities. Structured instruments are a type of derivative instrument and the payment and credit qualities of these instruments derive from the assets embedded in the structure from which they are issued. For structured securities that have embedded leverage features, small changes in interest or prepayment rates may cause large and sudden price movements. Structured instruments are often subject to heightened liquidity risk.
Underlying Funds: Because the fund invests its assets in various underlying funds, its ability to achieve its investment objective depends largely on the performance of the underlying funds in which it invests. Each of the underlying funds in which the fund may invest has its own investment risks, and those risks can affect the value of the underlying funds’ shares and therefore the value of the fund’s investments. There can be no assurance that the investment objective of any underlying fund will be achieved. To the extent that the fund invests more of its assets in one underlying fund than in another, the fund will have greater exposure to the risks of that underlying fund. In addition, the fund will bear a pro rata portion of the operating expenses of the underlying funds in which it invests. The “Underlying Funds” section of the fund’s prospectus identifies certain risks of each underlying fund.
U.S. Government Agency Obligations: Government agency obligations have different levels of credit support and, therefore, different degrees of credit risk. Securities issued by agencies and instrumentalities of the U.S. government that are supported by the full faith and credit of the United States, such as the Federal Housing Administration and Ginnie Mae, present little credit risk. Other securities issued by agencies and instrumentalities sponsored by the U.S. government that are supported only by the issuer’s right to borrow from the U.S. Treasury, subject to certain limitations, such as securities issued by Federal Home Loan Banks and securities issued by agencies and instrumentalities sponsored by the U.S. government that are supported only by the credit of the issuing agencies, such as Freddie Mac and Fannie Mae, are subject to a greater degree of credit risk.
Valuation: Many factors may influence the price at which the fund could sell any particular portfolio investment. The sales price may well differ--higher or lower--from the fund’s last valuation, and such differences could be significant, particularly for illiquid securities, securities that trade in relatively thin markets and/or markets that experience extreme volatility. If market conditions make it difficult to value some investments, the fund may value these investments using more subjective methods,
103
such as fair value methodologies. Investors who purchase or redeem fund shares on days when the fund is holding fair-valued securities may receive a greater or lesser number of shares, or greater or lower redemption proceeds, than they would have received if the fund had not fair-valued the security or had used a different valuation methodology.
Value Investing: The value approach carries the risk that the market will not recognize a security’s intrinsic value for a long time, or that a stock considered to be undervalued may actually be appropriately priced. A fund may underperform other equity funds that use different investing styles. A fund may also underperform other equity funds using the value style.
Warrants and Rights: Warrants and rights may be considered more speculative than certain other types of investments because they do not entitle a holder to the dividends or voting rights for the securities that may be purchased. They do not represent any rights in the assets of the issuing company. Also, the value of a warrant or right does not necessarily change with the value of the underlying securities. A warrant or right ceases to have value if it is not exercised prior to the expiration date.
Yield (Transamerica AEGON Money Market): The fund invests in short-term money market instruments. As a result, the amount of income received by the fund will go up or down depending on day-to-day variations in short-term interest rates. Investing in high quality, short-term instruments may result in a lower yield (the income on your investment) than investing in lower quality or longer-term instruments. When interest rates are very low, the fund’s expenses could absorb all or a significant portion of the fund’s income, and, if a fund’s expenses exceed the fund’s income, a fund may be unable to maintain its $1.00 share price. If interest rates increase, a fund’s yield may not increase proportionately. For example, TAM may discontinue any temporary voluntary fee limitation or recoup expenses previously forgone or reimbursed. The recent adoption of more stringent regulations governing the management of money market funds could have a negative effect on a fund’s yield. Under these new regulations, the fund may be required to maintain greater liquidity based on characteristics and anticipated liquidity needs of its shareholders and may have a lower yield than money market funds with a different shareholder base.
Please note that there are other factors that could adversely affect your investment in a fund and that could prevent the fund from achieving its investment objective. More information about risks appears in the Statement of Additional Information. Before investing, you should carefully consider the risks that you will assume.
104
Investment Adviser
Transamerica Funds’ Board of Trustees is responsible for overseeing the management and business affairs of Transamerica Funds. It oversees the operation of Transamerica Funds by its officers. It also reviews the management of the funds’ assets by the investment adviser and sub-advisers. Information about the Trustees and executive officers of Transamerica Funds is contained in the Statement of Additional Information (“SAI”).
Transamerica Asset Management, Inc. (“TAM”), located at 570 Carillon Parkway, St. Petersburg, FL 33716, serves as investment adviser for Transamerica Funds. The investment adviser hires investment sub-advisers to furnish investment advice and recommendations and has entered into sub-advisory agreements with each fund’s sub-adviser. The investment adviser also monitors the sub-advisers’ buying and selling of portfolio securities and administration of the funds. For these services, TAM is paid investment advisory fees. These fees are calculated on the average daily net assets of each fund.
TAM is directly owned by Western Reserve Life Assurance Co. of Ohio (77%) (“Western Reserve”) and AUSA Holding Company (23%) (“AUSA”), both of which are indirect, wholly owned subsidiaries of AEGON NV. AUSA is wholly owned by AEGON USA, LLC (“AEGON USA”), a financial services holding company whose primary emphasis is on life and health insurance, and annuity and investment products. AEGON USA is owned by AEGON US Holding Corporation, which is owned by Transamerica Corporation (DE). Transamerica Corporation (DE) is owned by The AEGON Trust, which is owned by AEGON International B.V., which is owned by AEGON NV, a Netherlands corporation, and a publicly traded international insurance group.
AEGON USA Investment Management, LLC is an affiliate of TAM and Transamerica Funds.
The funds may rely on an Order from the SEC (Release IC- 23379 dated August 5, 1998) that permits Transamerica Funds and its investment adviser, TAM, subject to certain conditions, and without the approval of shareholders to:
(1) employ a new unaffiliated sub-adviser for a fund pursuant to the terms of a new investment sub-advisory agreement, either as a replacement for an existing sub-adviser or as an additional sub-adviser;
(2) materially change the terms of any sub-advisory agreement; and
(3) continue the employment of an existing sub-adviser on sub-advisory contract terms where a contract has been assigned because of a change of control of the sub-adviser.
Pursuant to the Order, the funds have agreed to provide certain information about new sub-advisers and new sub-advisory agreements to their shareholders.
Advisory Fees
TAM receives compensation from each fund, calculated daily and paid monthly, based on an annual percentage of each fund’s average daily net assets.
Advisory Fees Paid in 2010
For the fiscal year ended October 31, 2010, each fund paid the following advisory fee as a percentage of the fund’s average daily net assets:
| | |
| Name of Fund | | Advisory Fee |
Transamerica AEGON Flexible Income1 | | 0.54% |
Transamerica AEGON High Yield Bond | | 0.58% |
Transamerica AEGON Money Market | | 0.40% |
Transamerica AEGON Short-Term Bond2 | | 0.51% |
Transamerica Asset Allocation – Conservative Portfolio | | 0.10% |
Transamerica Asset Allocation – Growth Portfolio | | 0.10% |
Transamerica Asset Allocation – Moderate Growth Portfolio | | 0.10% |
Transamerica Asset Allocation – Moderate Portfolio | | 0.10% |
Transamerica Morgan Stanley Capital Growth | | 0.80% |
Transamerica Morgan Stanley Growth Opportunities | | 0.79% |
Transamerica Multi-Managed Balanced3 | | 0.75% |
Transamerica Multi-Manager Alternative Strategies Portfolio | | 0.20% |
Transamerica Multi-Manager International Portfolio | | 0.10% |
Transamerica Systematic Small/Mid Cap Value | | 0.80% |
105
| | |
| Name of Fund | | Advisory Fee |
Transamerica TS&W International Equity4 | | N/A |
Transamerica WMC Diversified Equity | | 0.72% |
Transamerica WMC Diversified Growth5 | | 0.71% |
Transamerica WMC Quality Value6 | | N/A |
| 1 | Effective February 1, 2010, the advisory fee is 0.475% of the first $250 million of average daily net assets; 0.425% of average daily net assets over $250 million up to $350 million; and 0.40% of average daily net assets in excess of $350 million. Prior to February 1, 2010, the advisory fee was 0.725% of the first $250 million of average daily net assets; 0.675% of average daily net assets over $250 million up to $350 million; and 0.625% of average daily net assets in excess of $350 million. |
| 2 | Effective May 1, 2010, the advisory fee is 0.55% of the first $250 million of average daily net assets; 0.50% of average daily net assets over $250 million up to $500 million; 0.475% of average daily net assets over $500 million up to $1 billion; and 0.45% of average daily net assets in excess of $1 billion. Prior to May 1, 2010, the advisory fee was 0.65% of the first $250 million of average daily net assets; 0.60% of average daily net assets over $250 million up to $500 million; 0.575% of average daily net assets over $500 million up to $1 billion; and 0.55% of average daily net assets in excess of $1 billion. |
| 3 | Effective November 13, 2009, the advisory fee is 0.75% of the first $500 million of average daily net assets; 0.65% of average daily net assets over $500 million up to $1 billion; and 0.60% of average daily net assets in excess of $1 billion. Prior to November 13, 2009, the advisory fee was 0.80% of the first $250 million of average daily net assets; 0.75% of average daily net assets over $250 million up to $500 million; 0.70% of average daily net assets over $500 million up to $1.5 billion; and 0.625% of average daily net assets in excess of $1.5 billion. |
| 4 | The fund commenced operations on March 1, 2011, and as such, there were no advisory fees paid as of October 31, 2010. The advisory fee is 0.80% for the first $250 million of average daily net assets; 0.75% of average daily net assets over $250 million up to $500 million; 0.725% of average daily net assets over $500 million up to $1 billion; and 0.70% of average daily net assets in excess of $1 billion. |
| 5 | Effective November 13, 2009, the advisory fee is 0.73% of the first $500 million of average daily net assets; 0.70% of average daily net assets over $500 million up to $2.5 billion; and 0.65% of average daily net assets in excess of $2.5 billion. Prior to November 13, 2009, the advisory fee was 0.75% of the first $500 million of average daily net assets; 0.70% of average daily net assets over $500 million up to $2.5 billion; and 0.65% of average daily net assets in excess of $2.5 billion. |
| 6 | The fund commenced operations on November 15, 2010, and as such, there were no advisory fees paid as of October 31, 2010. The advisory fee is 0.70% for the first $1 billion of average daily net assets; and 0.68% of average daily net assets in excess of $1 billion. |
A discussion regarding the Board of Trustees’ approval of each fund’s advisory arrangements is available in each fund’s annual report for the fiscal year ended October 31, 2010, except Transamerica TS&W International Equity, Transamerica WMC Diversified Equity and Transamerica WMC Quality Value. A discussion regarding the Board of Trustees’ approval for Transamerica WMC Diversified Equity is available in the fund’s semi-annual report for the fiscal period ended April 30, 2010. A discussion regarding the Board of Trustees’ approval for Transamerica WMC Quality Value and Transamerica TS&W International Equity will be available in each fund’s semi-annual report for the fiscal period ending April 30, 2011.
Portfolio Construction Manager
Morningstar Associates, LLC (“Morningstar”), 22 West Washington Street, Chicago, IL 60602, is the portfolio construction manager for the funds listed below.
Transamerica Asset Allocation – Conservative Portfolio
Transamerica Asset Allocation – Growth Portfolio
Transamerica Asset Allocation – Moderate Growth Portfolio
Transamerica Asset Allocation – Moderate Portfolio
Transamerica Multi-Manager Alternative Strategies Portfolio
Transamerica Multi-Manager International Portfolio
Pursuant to an Asset Allocation Management Agreement between TAM and Morningstar, the portfolio construction manager will make the funds’ investment decisions, determine what portion of each asset allocation fund’s portfolio should be in the underlying funds and what portion, if any, should be held in U.S. Government securities, short-term commercial paper or other assets such as cash.
Portfolio Construction Manager Compensation
For the fiscal year ended October 31, 2010, the portfolio construction manager received the following fees as a percentage of a fund’s average daily net assets:
| | |
Transamerica Asset Allocation – Conservative Portfolio | | 0.10% |
Transamerica Asset Allocation – Growth Portfolio | | 0.10% |
Transamerica Asset Allocation – Moderate Growth Portfolio | | 0.10% |
Transamerica Asset Allocation – Moderate Portfolio | | 0.10% |
Transamerica Multi-Manager Alternative Strategies Portfolio | | 0.20% |
Transamerica Multi-Manager International Portfolio | | 0.10% |
Portfolio Construction Team*
Each of the above listed funds is managed by a portfolio construction team. In addition to this team, Morningstar utilizes a number of other internal asset allocation consultants that serve as an investment resource to the team. The SAI provides
106
additional information about the portfolio construction team’s compensation, other accounts managed by the portfolio construction team, and the portfolio construction team’s ownership in each fund.
| | | | | | |
| Name/Year Joined Fund | | Role | | Employer | | Positions Over Past Five Years |
| Jon Hale, CFA/2006 | | Co-Portfolio Manager | | Morningstar | | Managing Investment Consultant |
| Dan McNeela, CFA/2010 | | Co-Portfolio Manager | | Morningstar | | Senior Consultant |
| Hal Ratner/2010 | | Co-Portfolio Manager | | Morningstar | | Senior Consultant |
| Michael Stout, CFA/2006 | | Co-Portfolio Manager | | Morningstar | | Senior Consultant |
| * | Prior to joining the Portfolio Construction Team, Mr. Hale and Mr. Stout served as asset allocation consultants since each fund’s inception; Mr. Ratner served as an asset allocation consultant since 2003; and Mr. McNeela served as an asset allocation consultant since 2009. |
Sub-Advisers
The name and address of the sub-advisers are listed below. Pursuant to Investment Sub-advisory Agreements between TAM and each sub-adviser on behalf of the respective funds, each sub-adviser shall make investment decisions, buy and sell securities for the funds, conduct research that leads to these purchase and sale decisions, and pay broker-dealers a commission for these trades (which can include payments for research and brokerage services).
The sub-advisers listed below receive compensation, calculated daily and paid monthly, from TAM. For the fiscal year ended October 31, 2010, the sub-advisers received the following sub-advisory fees as a percentage of a fund’s average daily net assets:
| | | | |
| Fund | | Sub-Advisory Fee | | Name and Address of Sub-Adviser |
| Transamerica AEGON Flexible Income1 | | 0.21% | | AEGON USA Investment |
| Transamerica AEGON High Yield Bond | | 0.26% | | Management, LLC (“AUIM”) |
| Transamerica AEGON Money Market1 | | 0.09% | | 4333 Edgewood Road NE |
| Transamerica AEGON Short-Term Bond2 | | 0.16% | | Cedar Rapids, IA 52499 |
| | | | | |
| Transamerica Multi-Managed Balanced3 | | 0.27% | | BlackRock Financial Management, Inc. (“BlackRock”) 55 East 52nd Street New York, NY 10055 |
| Transamerica Multi-Managed Balanced3 | | 0.27% | | J.P. Morgan Investment Management Inc. (“JPMorgan”) 245 Park Avenue New York, NY 10167 |
| Transamerica Morgan Stanley Capital Growth4 Transamerica Morgan Stanley Growth Opportunities5 | | 0.41% 0.35% | | Morgan Stanley Investment Management Inc. (“MSIM”) 522 Fifth Avenue New York, NY 10036 |
| Transamerica Systematic Small/Mid Cap Value6 | | 0.37% | | Systematic Financial Management L.P. 300 Frank W. Burr Blvd. Glenpointe East 7th Floor Teaneck, NJ 07666 |
| Transamerica TS&W International Equity7 | | N/A | | Thompson, Siegel & Walmsley LLC 6806 Paragon Place Suite 300 Richmond, VA 23230 |
| Transamerica WMC Diversified Equity8 | | 0.26% | | Wellington Management Company, |
| Transamerica WMC Diversified Growth | | 0.25% | | LLP (“Wellington Management”) |
| Transamerica WMC Quality Value9 | | N/A | | 280 Congress Street |
| | | | | Boston, MA 02210 |
| 1 | Fees shown were paid to the previous sub-adviser. |
| 2 | Fees shown were paid to the previous sub-adviser. Effective September 7, 2010, the sub-advisory fee is 0.20% of the first $250 million of average daily net assets; 0.15% of average daily net assets over $250 million up to $500 million; 0.125% of average daily net assets over $500 million up to $1 billion; and 0.10% of average daily net assets in excess of $1 billion. Prior to September 7, 2010, the sub-advisory fee was 0.25% of the first $250 million of average daily net assets; 0.20% of average daily net assets over $250 million up to $500 million; 0.175% of average daily net assets over $500 million up to $1 billion; and 0.15% of average daily net assets in excess of $1 billion. |
| 3 | Fees shown were paid to the previous sub-adviser. Effective March 22, 2011, the sub-advisory fee is 0.25% of average daily net assets (JPMorgan) and 0.12% of the first $1 billion of average daily net assets; and 0.05% of average daily net assets in excess of $1 billion (BlackRock). For the JPMorgan portion of fees, the average daily net assets |
107
| | for the purpose of calculating sub-advisory fees will be determined on a combined basis with similar mandates of Transamerica Series Trust and Transamerica Partners funds managed by JPMorgan. |
| 4 | Fees shown were paid to the previous sub-adviser. Effective March 22, 2011, the sub-advisory fee is 0.40% of the first $1 billion of average daily net assets; and 0.375% of average daily net assets in excess of $1 billion. The average daily net assets for the purpose of calculating sub-advisory fees will be aggregated with similar mandates of Transamerica Series Trust managed by MSIM. Prior to March 22, 2010, the sub-advisory fee was 0.425% of the first $100 million of average daily net assets; 0.40% of average daily net assets over $100 million up to $500 million; and 0.35% of average daily net assets in excess of $5 million. |
| 5 | Fees shown were paid to the previous sub-adviser. Effective March 22, 2011, the sub-advisory fee is 0.40% of the first $1 billion of average daily net assets; and 0.375% of average daily net assets in excess of $1 billion. The average daily net assets for the purpose of calculating sub-advisory fees will be aggregated with similar mandates of Transamerica Funds and Transamerica Series Trust managed by MSIM. Prior to March 22, 2010, the sub-advisory fee was 0.40% of the first $100 million of average daily net assets; and 0.35% of average daily net assets in excess of $100 million. |
| 6 | Fees shown were paid to the previous sub-adviser. Effective March 22, 2011, the sub-advisory fee is 0.45% of the first $100 million of average daily net assets; 0.40% over $100 million up to $350 million of average daily net assets; 0.35% over $350 million up to $1 billion of average daily net assets; and 0.30% of average daily net assets in excess of $1 billion. The average daily net assets for the purpose of calculating sub-advisory fees will be aggregated with a similar mandate of Transamerica Series Trust managed by Systematic. Prior to March 22, 2010, the sub-advisory fee was 0.375% of the first $500 million of average daily net assets; and 0.325% of average daily net assets in excess of $500 million. |
| 7 | The fund commenced operations on March 1, 2011, and as such, there were no sub-advisory fees paid as of October 31, 2010. The sub-advisory fee is 0.40% of the first $250 million of average daily net assets; 0.35% of average daily net assets over $250 million up to $500 million; 0.325% of average daily net assets over $500 million up to $1 billion; and 0.30% of average daily net assets in excess of $1 billion. |
| 8 | Fees shown were paid to the previous sub-adviser. Effective March 22, 2011, the sub-advisory fee is 0.28% of the first $2 billion of average daily net assets; 0.25% over $2 billion up to $5 billion of average daily net assets; and 0.225% of average daily net assets in excess of $5 billion. The average daily net assets for the purpose of calculating sub-advisory fees will be aggregated with similar mandates of Transamerica Funds, Transamerica Series Trust and Transamerica Partners funds managed by Wellington Management. Prior to March 22, 2010, the sub-advisory fee was 0.35% of the first $500 million of average daily net assets; 0.30% over $500 million up to $2.5 billion of average daily net assets; and 0.25% of average daily net assets in excess of $2.5 billion. |
| 9 | The fund commenced operations on November 15, 2010, and as such, there were no sub-advisory fees paid as of October 31, 2010. The sub-advisory fee is 0.25% of the first $1 billion of average daily net assets; and 0.225% of average daily net assets in excess of $1 billion. |
Portfolio Manager(s)
The following funds are managed by the portfolio manager(s) listed below. The SAI provides additional information about the portfolio manager(s)’ compensation, other accounts managed by the portfolio manager(s), and the portfolio manager(s)’ ownership in each fund they manage.
Transamerica AEGON Flexible Income
| | | | | | |
| Name/Year Joined Fund | | Role | | Employer | | Positions Over Past Five Years |
| Brian W. Westhoff, CFA/2005 | | Portfolio Manager (Lead) | | AUIM | | Portfolio Manager |
| Bradley J. Beman, CFA/2011 | | Portfolio Manager | | AUIM | | Senior Vice President, Director – High Yield |
| David Halfpap/2011 | | Portfolio Manager | | AUIM | | Executive Vice President, Portfolio Manager |
| Rick Perry/2011 | | Portfolio Manager | | AUIM | | Senior Vice President, Director of Investment Grade Credit |
| Jim Schaeffer/2011 | | Portfolio Manager | | AUIM | | Senior Vice President, Director of Distressed Debt |
Transamerica AEGON High Yield Bond
| | | | | | |
| Name/Year Joined Fund | | Role | | Employer | | Positions Over Past Five Years |
| Bradley J. Beman, CFA/1997 | | Portfolio Manager | | AUIM | | Senior Vice President, Director – High Yield |
| Kevin Bakker, CFA/2007 | | Portfolio Manager | | AUIM | | High Yield Portfolio Manager |
| Benjamin D. Miller, CFA/2006 | | Portfolio Manager | | AUIM | | High Yield Portfolio Manager |
Transamerica AEGON Short-Term Bond
| | | | | | |
| Name/Year Joined Fund | | Role | | Employer | | Positions Over Past Five Years |
| Greg D. Haendel, CFA/2007 | | Portfolio Manager (Lead) | | AUIM | | Portfolio Manager |
| Garry Creed/2011 | | Portfolio Manager | | AUIM | | Senior Vice President, Director of Credit Research |
108
| | | | | | |
| Name/Year Joined Fund | | Role | | Employer | | Positions Over Past Five Years |
| Doug Weih/2011 | | Portfolio Manager | | AUIM | | Senior Vice President, Director of Public Securitized |
Transamerica Morgan Stanley Capital Growth
| | | | | | |
| Name/Year Joined Fund | | Role | | Employer | | Positions Over Past Five Years |
| Dennis P. Lynch/2011 | | Lead Portfolio Manager | | MSIM | | Managing Director |
| David S. Cohen/2011 | | Portfolio Manager | | MSIM | | Managing Director |
| Sam G. Chainani/2011 | | Portfolio Manager | | MSIM | | Managing Director |
| Alexander T. Norton/2011 | | Portfolio Manager | | MSIM | | Executive Director |
| Jason C. Yeung/2011 | | Portfolio Manager | | MSIM | | Managing Director |
| Armistead B. Nash/2011 | | Portfolio Manager | | MSIM | | Executive Director |
Transamerica Morgan Stanley Growth Opportunities
| | | | | | |
| Name/Year Joined Fund | | Role | | Employer | | Positions Over Past Five Years |
| Dennis P. Lynch/2011 | | Lead Portfolio Manager | | MSIM | | Managing Director |
| David S. Cohen/2011 | | Portfolio Manager | | MSIM | | Managing Director |
| Sam G. Chainani/2011 | | Portfolio Manager | | MSIM | | Managing Director |
| Alexander T. Norton/2011 | | Portfolio Manager | | MSIM | | Executive Director |
| Jason C. Yeung/2011 | | Portfolio Manager | | MSIM | | Managing Director |
| Armistead B. Nash/2011 | | Portfolio Manager | | MSIM | | Executive Director |
Transamerica Multi-Managed Balanced
| | | | | | |
| Name/Year Joined Fund | | Role | | Employer | | Positions Over Past Five Years |
| Matthew Marra/2011 | | Portfolio Manager | | BlackRock | | Managing Director |
| Eric Pellicciaro/2011 | | Portfolio Manager | | BlackRock | | Managing Director |
| Rick Rieder/2011 | | Portfolio Manager | | BlackRock | | Chief Investment Officer of Fixed Income, Fundamental Portfolios, and head of Corporate Credit and Multi- Sector and Mortgage Groups; President and Chief Executive Officer of R3 Capital Partners from 2008 to 2009; Head of Global Principal Strategies team and Credit Businesses at Lehman Brothers from 1987 to 2008 |
| Scott Blasdell, CFA/2011 | | Portfolio Manager | | JPMorgan | | Portfolio Manager |
| Terance Chen, CFA/2011 | | Portfolio Manager | | JPMorgan | | Vice President and Portfolio Manager |
| Raffaele Zingone, CFA/2011 | | Portfolio Manager | | JPMorgan | | Portfolio Manager |
Transamerica Systematic Small/Mid Cap Value
| | | | | | |
| Name/Year Joined Fund | | Role | | Employer | | Positions Over Past Five Years |
| Kenneth Burgess, CFA/2011 | | Portfolio Manager | | Systematic | | Portfolio Manager, Partner |
| Ron Mushock, CFA/2011 | | Portfolio Manager | | Systematic | | Portfolio Manager, Partner |
109
Transamerica TS&W International Equity
| | | | | | |
| Name/Year Joined Fund | | Role | | Employer | | Positions Over Past Five Years |
| Brandon H. Harrell, CFA/2011 | | Portfolio Manager | | TS&W | | Officer and International Portfolio Manager |
Transamerica WMC Diversified Equity
| | | | | | |
| Name/Year Joined Fund | | Role | | Employer | | Positions Over Past Five Years |
| Paul E. Marrkand, CFA/2011 | | Portfolio Manager | | Wellington Management | | Senior Vice President and Equity Portfolio Manager |
Transamerica WMC Diversified Growth
| | | | | | |
| Name/Year Joined Fund | | Role | | Employer | | Positions Over Past Five Years |
| Paul E. Marrkand, CFA/2010 | | Portfolio Manager | | Wellington Management | | Senior Vice President and Equity Portfolio Manager |
Transamerica WMC Quality Value
| | | | | | |
| Name/Year Joined Fund | | Role | | Employer | | Positions Over Past Five Years |
| Matthew G. Baker/2010 | | Portfolio Manager | | Wellington Management | | Equity Portfolio Manager, Vice President |
| Edward P. Bousa, CFA/2010 | | Portfolio Management and Securities Analysis | | Wellington Management | | Equity Portfolio Manager, Senior Vice President |
Disclosure of Portfolio Holdings: A detailed description of the funds’ policies and procedures with respect to the disclosure of the funds’ portfolio holdings is available in the SAI. The funds publish their top ten holdings on the Transamerica Funds website at www.transamericafunds.com within two weeks after the end of each month. In addition, the funds publish all holdings on the website approximately 25 days after the end of each calendar quarter. Such information will generally remain online for six months or as otherwise consistent with applicable regulations.
Prior Performance for Similar Accounts
Transamerica WMC Diversified Equity, Transamerica WMC Diversified Growth and Transamerica WMC Quality Value. The performance information shown below represents composites of the prior performance of certain discretionary accounts (the “Other Accounts”) managed by Wellington Management. The Wellington Management Diversified Growth Composite reflects other accounts having investment objectives, policies and strategies substantially similar to Transamerica WMC Diversified Equity and Transamerica WMC Diversified Growth while the Wellington Management Quality Value Composite reflects other accounts having investment objectives, policies and strategies substantially similar to Transamerica WMC Quality Value. Wellington Management has prepared the historical performance shown for each composite in compliance with the Global Investment Performance Standards. This methodology differs from the guidelines of the Securities and Exchange Commission for calculating performance of mutual funds.
The past performance of the Other Accounts is not indicative of future rates of return, nor is that past performance an indication of future performance of the funds. Each fund’s actual performance may vary significantly from the past performance of the relevant composite. Differences in asset size and cash flows may result in different security selections, differences in relative weightings of securities or differences in prices paid for particular portfolio holdings. In addition, the Other Accounts were not subject to certain investment limitations and other restrictions imposed by the Investment Company Act of 1940 and the Internal Revenue Code, which, if applicable, may have adversely affected the performance results of the composites.
The composite performance presented below is shown on both a gross and net basis. The gross performance results do not reflect the deduction of management fees and other charges applicable to the accounts that make up the composites. The net performance results have been adjusted to reflect the operating expenses of Class A shares of the funds. The composite net performance results do not reflect Class A sales charges. If they did, returns would be lower. The net performance for other share classes will vary due to differences in sales charge structure and class expenses. The bar charts illustrate the variability of
110
the returns of the respective composite. The tables compare the investment results for the respective composite to that of an index measuring the broad market over different periods of time.
The composite performance is not that of the funds, should not be interpreted as indicative of the funds’ future performance, and should not be considered a substitute for the funds’ performance.
Year-by-Year Total Return as of 12/31 each year (%)
Wellington Management Diversified Growth Composite
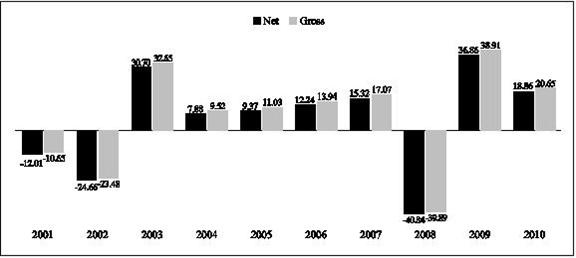
Wellington Management Quality Value Composite
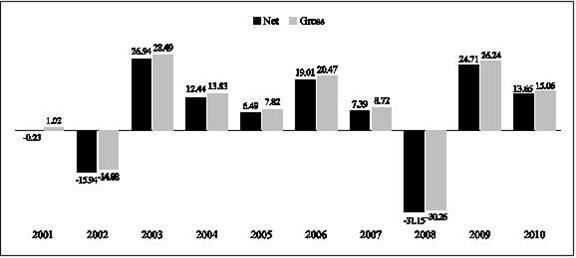
111
Average Annual Total Returns (for periods ended December 31, 2010)
| | | | | | |
| | | 1 Year | | 5 Years | | 10 Years |
| Wellington Management Diversified Growth Composite (gross of expenses) | | 20.65% | | 6.09% | | 4.01% |
| Wellington Management Diversified Growth Composite (net of expenses) | | 18.86% | | 4.49% | | 2.45% |
| Russell 1000® Growth Index | | 16.71% | | 3.75% | | 0.02% |
Average Annual Total Returns (for periods ended December 31, 2010)
| | | | | | |
| | | 1 Year | | 5 Years | | 10 Years |
Wellington Management Quality Value Composite (gross of expenses) | | 15.06% | | 5.82% | | 6.05% |
Wellington Management Quality Value Composite (net of expenses) | | 13.65% | | 4.52% | | 4.75% |
| Russell 1000® Value Index | | 15.51% | | 1.28% | | 3.26% |
Prior Performance for Similar Accounts
Transamerica Morgan Stanley Growth Opportunities. The performance information shown below represents the prior performance of Transamerica Morgan Stanley Mid-Cap Growth, a mutual fund also sub-advised by Morgan Stanley Investment Management Inc. (“MSIM”). Transamerica Morgan Stanley Mid-Cap Growth has an investment objective, policies and strategies that are substantially similar to Transamerica Morgan Stanley Growth Opportunities (the “Fund”). MSIM has served as the sub-adviser to Transamerica Morgan Stanley Mid-Cap Growth since the fund’s inception on January 3, 2006.
The past performance of Transamerica Morgan Stanley Mid-Cap Growth is not indicative of future rates of return, nor is that past performance an indication of future performance of the Fund. The Fund’s actual performance may vary significantly from the past performance of Transamerica Morgan Stanley Mid-Cap Growth. Differences in asset size and cash flows may result in different security selections, differences in relative weightings of securities or differences in prices paid for particular portfolio holdings. The Fund’s performance may differ due to other factors, such as differences in fees and expenses.
The performance results of Class I2 shares of Transamerica Morgan Stanley Mid-Cap Growth have been adjusted to reflect the operating expenses of Class A shares of the Fund. The performance results do not reflect Class A sales charges. If they did, returns would be lower. The performance for other share classes will vary due to differences in sales charge structure and class expenses. The bar chart illustrates the variability of the returns of Transamerica Morgan Stanley Mid-Cap Growth. The table compares the investment results for Transamerica Morgan Stanley Mid-Cap Growth to that of an index measuring the broad market over different periods of time.
The performance of Transamerica Morgan Stanley Mid-Cap Growth is not that of the Fund, should not be interpreted as indicative of the Fund’s future performance, and should not be considered a substitute for the Fund’s performance.
Year-by-Year Total Return as of 12/31 each year (%) – Class I2
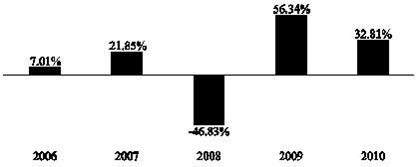
112
Average Annual Total Returns (periods ended December 31,2010)
| | | | |
| | | 1 Year | | Inception |
| Transamerica Morgan Stanley Mid-Cap Growth - Class I2 (commenced operations on January 3, 2006) | | 32.81% | | 7.57% |
| Russell Midcap® Growth Index | | 26.38% | | 4.89% |
TO CONTACT TRANSAMERICA FUNDS
| | |
| Customer Service: | | 1-888-233-4339 |
| |
| Internet: | | www.transamericafunds.com |
| |
| Fax: | | 1-888-329-4339 |
| |
| Mailing Address: | | Transamerica Fund Services, Inc. |
| |
| | P.O. Box 219945 |
| |
| | Kansas City, MO 64121-9945 |
| |
| Overnight Address: | | Transamerica Fund Services, Inc. |
| |
| | 330 W. 9th Street |
| |
| | Kansas City, MO 64105 |
The Following Information Applies to Class A, Class B, Class C, Class I and Class T Shares (Class B and Class T Shares are Closed to New Investors).
Opening an Account
Fill out the New Account Application which is available on our website. Transamerica Funds requires all applications to include an investment representative or an approved broker-dealer of record. An approved broker-dealer is one that is providing services under a valid dealer sales agreement with the funds’ distributor.
IRAs and other retirement plan accounts require different applications, which you can request by calling Customer Service or by visiting our website at www.transamericafunds.com.
Note: To help the U.S. Government fight the funding of terrorism and money laundering activities, the USA PATRIOT Act requires all financial institutions to obtain, verify, and record information that identifies each person or entity that opens an account. On your application, be sure to include your name, date of birth (if an individual), residential address and Social Security Number or taxpayer identification number. If there are authorized traders on your account, please provide this information for each trader. If you do not provide this information, your account will not be established. If Transamerica Funds cannot verify your identity within 30 days from the date your account is established, your account may be closed based on the next calculated net asset value (“NAV”) per share.
Minimum Investment
Class A, Class B, Class C and Class T Shares:
| | | | |
| Type of Account | | Minimum Initial Investment (per fund account) | | Minimum Subsequent Investment (per fund account) |
| Regular Accounts | | $1,000 | | $50 |
| IRA, Roth IRA or Coverdell ESA | | $1,000 | | $50 |
| Employer-sponsored Retirement Plans (includes 403(b), SEP and SIMPLE IRA plans) | | $1,000 | | $50 |
| Uniform Gift to Minors (“UGMA”) or Transfer to Minors (“UTMA”) | | $1,000 | | $50 |
| Payroll Deduction and Automatic Investment Plans | | $500 | | $50* |
113
Class I Shares**:
| | | | |
| Type of Account | | Minimum Initial Investment (per fund account) | | Minimum Subsequent Investment (per fund account) |
| Regular Accounts | | $1,000,000 | | N/A |
| IRA, Roth IRA or Coverdell ESA | | $1,000,000 | | N/A |
| Employer-sponsored Retirement Plans | | Waived | | N/A |
| Uniform Gift to Minors (“UGMA”) or Transfer to Minors (“UTMA”) | | $1,000,000 | | N/A |
| Payroll Deduction and Automatic Investment Plans | | $1,000,000 | | $50* |
| * | Minimum monthly per fund account investment. |
| Note: | Transamerica Funds reserves the right to change the amount of these minimums from time to time or to waive them in whole or in part. Omnibus accounts maintained on behalf of certain 401(k) and other retirement plans are not subject to these account minimum requirements. The minimums may be waived for certain employer- sponsored retirement plans under which the employee limits his or her salary deferral purchase to one fund account. There are no minimums for “wrap” accounts for the benefit of clients of certain broker-dealers, financial institutions, or financial planners who have entered into arrangements with Transamerica Funds or Transamerica Capital, Inc. (“TCI”), and for investments made by a retirement plan described in Section 401(a), 401(k), 401(m), 403(b) or 457 of the Internal Revenue Code. |
| ** | Class I shares of the Transamerica Funds listed in this prospectus are currently primarily offered for investment to institutional investors including, but not limited to, fee-based programs, qualified retirement plans, certain endowment plans and foundations and Directors, Trustees and employees of the fund’s affiliates. The minimum investment for Class I shares is $1,000,000 per fund account, but will be waived for certain investors, including fee-based programs, qualified retirement plans, and financial intermediaries that submit trades on behalf of underlying investors. |
By Mail
| • | | Send your completed application and check made payable to Transamerica Fund Services, Inc. |
Through an Authorized Dealer
| • | | The dealer is responsible for opening your account and providing Transamerica Funds with your taxpayer identification number. |
Buying Shares
Investors may purchase shares of the funds at the “offering price” of the shares, which is the net asset value per share plus any applicable initial sales charge. Please note that purchase requests initiated through an automated service that exceeds $50,000 per day may be rejected and must be submitted by check or via bank wire.
Shareholders who have purchased Class B shares of a fund before 4:00 p.m. on July 14, 2010 (such shareholders, “Existing Class B Shareholders” and such time, the “Close Time”) may continue to hold those shares until they automatically convert to Class A shares as provided in the existing conversion schedule set forth under “Shareholder Information – Choosing a Share Class.”
Effective as of the Close Time, Class B shares of each fund will no longer be offered for purchase – including to Existing Class B Shareholders – except in the following circumstances:
| • | | Existing Class B Shareholders that have established 403(b) or SIMPLE IRA accounts directly with Transamerica Funds before the Close Time may make additional purchases of Class B shares of the funds in those accounts after the Close Time. |
| • | | Existing Class B Shareholders that have established automatic investment and/or payroll deduction accounts directly with the Trust before the Close Time may continue to make additional purchases of Class B shares of the funds pursuant to those programs after the Close Time. |
| • | | Existing Class B Shareholders may also continue to exchange their Class B shares for Class B shares of other funds, subject to the requirements described in the prospectus under “Shareholder Information – Exchanging Shares.” |
| • | | Existing Class B Shareholders may continue to add to their accounts through dividend and capital gains reinvestments. |
Except in the circumstances set forth above, any purchase order for a fund’s Class B shares received after the Close Time will not be processed in Class B shares. All other features of Class B shares described in the prospectus – including contingent deferred sales charges, Rule 12b-1 distribution and service fees, and conversion and redemption features – will remain unchanged and will continue in effect after the Close Time.
Class T shares are not available to new investors; only existing Class T shareholders may purchase additional Class T shares.
Each fund reserves the right to make additional exceptions or otherwise to modify the foregoing policies at any time.
114
By Check
| • | | Make your check payable and send to Transamerica Fund Services, Inc. |
| • | | If you are opening a new account, send your completed application along with your check. |
| • | | If you are purchasing shares in an existing account(s), please reference your account number(s) and the Transamerica fund(s) in which you wish to invest. If you do not specify the fund(s) in which you wish to invest, and your referenced account is invested in one fund, your check will be deposited into such fund. |
| • | | Redemption proceeds will be withheld for 15 calendar days from the date of purchase for funds to clear. Certain exceptions may apply. |
| • | | Transamerica Funds does not accept money orders, traveler’s checks, starter checks, credit card convenience checks or cash. Cashier’s checks and third-party checks may be accepted, subject to approval by Transamerica Funds. |
By Automatic Investment Plan
| • | | With an Automatic Investment Plan (“AIP”), a level dollar amount is invested monthly and payment is deducted electronically from your bank account. Due to your bank’s requirements, please allow up to 30 days for your AIP to begin. Investments may be made between the 3rd and 28th of each month only, and will occur on the 15th if no selection is made. Call Customer Service for information on how to establish an AIP or visit our website to obtain an AIP request form. |
By Telephone
| • | | You may request an electronic transfer of funds from your bank account to your Transamerica Funds account. The electronic bank link option must be established in advance before Automated Clearing House (“ACH”) purchases will be accepted. Call Customer Service or visit our website at www. transamericafunds.com for information on how to establish an electronic bank link. Due to your bank’s requirements, please allow up to 30 days to establish this option. |
Through an Authorized Dealer
| • | | If your dealer has already established your account for you, no additional documentation is needed. Call your dealer to place your order. Transamerica Funds must receive your payment within three business days after your order is accepted. |
By the Internet
| • | | You may request an electronic transfer of funds from your bank account to your Transamerica Funds account. The electronic bank link option must be established in advance before ACH purchases will be accepted. Call Customer Service or visit our website at www.transamericafunds.com for information on how to establish an electronic bank link. |
By Payroll Deduction
| • | | You may have money transferred regularly from your payroll to your Transamerica Funds account. Call Customer Service to establish this option. |
By Wire Transfer
| • | | You may request that your bank wire funds to your Transamerica Funds account (note that your bank may charge a fee for such service). You must have an existing account to make a payment by wire transfer. Ask your bank to send your payment to: |
Bank of America, NA, Charlotte, NC, ABA#026009593
Credit: Transamerica Funds Acct #3600622064
Ref: Shareholder name, Transamerica fund and account numbers.
| • | | Shares will be purchased at the next determined NAV after receipt of your wire if you have supplied all other required information. |
Other Information
If your check, draft or electronic transfer is returned unpaid by your bank, you will be charged a fee of $20 for each item that has been returned.
Transamerica Funds reserves the right to terminate your electronic draft privileges if the drafts are returned unpaid by your bank.
Transamerica Funds or its agents may reject a request for purchase of shares at any time, in whole or in part, including any purchase under the exchange privilege and any purchase request that does not include an investment representative or an
115
approved broker-dealer. To the extent authorized by law, Transamerica Funds and each of the funds reserve the right to discontinue offering shares at any time, to merge or liquidate a class of shares or to cease operations entirely.
Selling Shares
Selling shares is also referred to as “redeeming” shares. You can redeem your shares at any time.
Proceeds from the redemption of your shares will usually be sent within three business days after receipt in good order of your request for redemption (unless you request to receive payment by wire or another option described below). However, Transamerica Funds has the right to take up to seven days to pay your redemption proceeds, and may postpone payment under certain circumstances, as authorized by law. In cases where shares have recently been purchased and the purchase money is not yet available, redemption proceeds will be withheld for 15 calendar days from the date of purchase for funds to clear. Certain exceptions may apply. Shares purchased by wire are immediately available and are not subject to the 15 day holding period.
Please note that redemption requests greater than $50,000 per day must be submitted in writing. In addition, amounts greater than $50,000 cannot be sent via ACH (check or federal funds wire only). Additionally, requests totaling more than $100,000 must be in writing with an original signature guarantee for all shareholders.
The electronic bank link option must be established in advance for payments made electronically to your bank such as ACH or expedited wire redemptions. Call Customer Service to verify this feature is in place on your account or to obtain information on how to establish the electronic bank link.
To request your redemption and receive payment by:
Direct Deposit – ACH
| • | | You may request an “ACH redemption” in writing, by phone or by internet access to your account. Payment should usually be received by your bank account 2-4 banking days after your request is received in good order. Transamerica Funds does not charge for this payment option. Certain IRAs and qualified retirement plans may not be eligible via the internet. |
Direct Deposit – Wire
| • | | You may request an expedited wire redemption in writing or by phone. The electronic bank link must be established in advance. Otherwise, an original signature guarantee will be required. Wire redemptions have a minimum of $1,000 per wire. Payment should be received by your bank account the next banking day after your request is received in good order. Transamerica Funds charges $10 for this service. Your bank may charge a fee as well. |
Check to Address of Record
| • | | Written Request: Send a letter requesting a withdrawal to Transamerica Funds. Specify the fund, account number, and dollar amount or number of shares you wish to redeem. Be sure to include all shareholders’ signatures and any additional documents, as well as an original signature guarantee(s) if required. If you are requesting a distribution from an IRA, federal tax withholding of 10% will apply unless you elect otherwise. If you elect to withhold, the minimum tax withholding rate is 10%. |
| • | | Telephone or Internet Request: You may request your redemption by phone or internet. Certain IRAs and qualified retirement plans may not be eligible. |
Check to Another Party/Address
| • | | This request must be in writing, regardless of amount, signed by all account owners with an original signature guarantee. |
Systematic Withdrawal Plan (by Direct Deposit – ACH or Check)
| • | | You can establish a Systematic Withdrawal Plan (“SWP”) either at the time you open your account or at a later date. Call Customer Service for information on how to establish a SWP, or visit our website to obtain the appropriate form to complete. |
Through an Authorized Dealer
| • | | You may redeem your shares through an authorized dealer (they may impose a service charge). Contact your Registered Representative or call Customer Service for assistance. |
Your Request to Sell Your Shares and Receive Payment May Be Subject to:
| • | | The type of account you have and if there is more than one shareholder. |
| • | | The dollar amount you are requesting; redemptions over $50,000 must be in writing and those redemptions totaling more than $100,000 require a written request with an original signature guarantee for all shareholders on the account. |
116
| • | | A written request and original signature guarantee may be required if there have been recent changes made to your account (such as an address change) or other such circumstances. For your protection, if an address change was made in the last 10 days, Transamerica Funds requires a redemption request in writing, signed by all account owners with an original signature guarantee. |
| • | | When redeeming all shares from an account with an active AIP, your AIP will automatically be stopped. Please contact Customer Service if you wish to re-activate your AIP. |
| • | | Each fund reserves the right to refuse a telephone redemption request if it is believed it is advisable to do so. The telephone redemption option may be suspended or terminated at any time without advance notice. |
| • | | Redemption proceeds will be withheld for 15 calendar days from the date of purchase for funds to clear. Certain exceptions may apply. |
| • | | Shares will normally be redeemed for cash, although each fund retains the right to redeem its shares in kind. Please see the SAI for more details. |
| • | | If you request that a withdrawal check be delivered overnight, a $20 overnight fee will be charged; for Saturday delivery, a $30 overnight fee will be charged. |
Please see additional information relating to original signature guarantee later in this prospectus.
Involuntary Redemptions
The fund reserves the right, to the fullest extent permitted by law, to close your account if the account value falls below the fund’s minimum account balance, or you are deemed to engage in activities that are illegal (such as late trading) or otherwise believed to be detrimental to the fund (such as market timing or frequent small redemptions).
Exchanging Shares
| • | | You may request an exchange in writing, by phone, or by accessing your account through the internet. |
| • | | You can exchange shares in one fund for shares in the same class of another fund offered in this prospectus. |
| • | | Class A, B, C and T shares minimum exchange to a new fund account is $1,000. This minimum is reduced to $500 per fund account if you elect to establish an AIP and invest a minimum of $50 per month, per fund account. If you want to exchange between existing fund accounts, the required minimum will be $50 per fund account. |
| • | | Class I shares exchange to a new fund account is $1,000,000 per fund account but will be waived for certain investors as outlined within the Minimum Investment Section. |
| • | | An exchange is treated as a redemption of a fund’s shares, followed by a purchase of the shares of the fund into which you exchanged. Prior to making exchanges into a fund that you do not own, please read the prospectus for that fund carefully. |
| • | | If you exchange all your shares to a new fund, any active systematic plan that you maintain with Transamerica Funds will also carry over to this new fund unless otherwise instructed. |
| • | | Class T shares of Transamerica WMC Diversified Growth may be exchanged for only Class A shares of any Transamerica fund offered in this prospectus, other than Transamerica WMC Diversified Growth. |
| • | | You may not exchange other classes of shares of the Transamerica Funds for Class T shares of Transamerica WMC Diversified Growth. |
| • | | In certain circumstances, shares of one class of a fund may also be exchanged directly for shares of another class of the same fund, as described in the Statement of Additional Information. |
| • | | Transamerica Funds reserves the right to modify or terminate the exchange privilege at any time upon 60 days’ written notice. |
| • | | Transamerica Funds reserves the right to deny any exchange request involving transactions between classes of shares. Please review your individual circumstances with your financial professional. |
| • | | The minimum exchange amount may be waived with respect to transactions in omnibus accounts maintained on behalf of certain 401(k) and other retirement plans. |
Converting Shares
If you hold Class A, C, I2, P or T shares and are eligible to purchase Class I shares as described under the Minimum Investment section, you may be eligible to convert your class A, C, I2, P or T shares to Class I shares of the same fund, subject to the
117
discretion of Transamerica Fund Services, Inc., to permit or reject such a conversion. Please contact your financial adviser or Customer Service for conversion instructions.
A conversion between share classes of the same fund is a nontaxable event.
If you convert from one class of shares to another, the transaction will be based on the respective NAVs per share of the two classes on the trade date for the conversion. Consequently, a conversion may provide you with fewer shares or more shares than you originally owned, depending on that day’s NAV per share. At the time of conversion, the total dollar value of your “old” shares will equal the total dollar value of your “new” shares. However, subsequent share price fluctuations may decrease or increase the total dollar value of your “new” shares compared with that of your “old” shares.
Choosing a Share Class
Individual investors can generally invest in Class A and Class C shares. The amount of your investment and the amount of time that you plan to hold your shares will determine which class of shares you should choose. You should make this decision carefully because all of your future investments in your account will be in the same share class that you designate when you open your account. Your financial professional can help you choose the share class that makes the best sense for you.
If you are investing a large amount and/or plan to hold your shares for a long period, Class A shares may make the most sense for you. If you are investing a lesser amount, you may want to consider Class C shares if you plan to invest for a period of less than 5 years.
Transamerica Funds may, at any time and in its sole discretion, add, delete, or change the sales charges for any share class.
Class A Shares – Front Load
With Class A shares, you pay an initial sales charge only when you buy shares. (The offering price includes the sales charge.) NOTE: You do not pay an initial sales charge on Class A Transamerica AEGON Money Market purchases. There are 12b-1 distribution and service fees of up to 0.35% per year.
If you are investing $1 million or more in a Transamerica Fund (other than Transamerica AEGON Short-Term Bond), you can purchase Class A shares without any sales charge. However, if you redeem any of those shares within the first 24 months after buying them, you will pay a 1.00% contingent deferred sales charge (“CDSC”), unless they were purchased through a retirement plan described in Section 401(a), 401(k), 401(m), or 457 of the Internal Revenue Code, or through a “wrap” account for the benefit of clients of certain broker-dealers, financial institutions, or financial planners who have entered into arrangements with Transamerica Funds or TCI. In the event that you exchange Class A shares purchased in an amount of $1 million or more for shares of another fund, you will be charged the CDSC imposed by the fund into which you exchange your shares. The term of this CDSC will commence on the date that you initially purchase Class A shares of a Transamerica fund in an amount of $1 million or more.
If you invest $250,000 or more in Transamerica AEGON Short-Term Bond, you can purchase Class A shares without any sales charge. However, if you redeem any of these shares within the first 12 months after buying them, you will pay a 0.75% CDSC, unless they were purchased in a retirement plan or “wrap” account as described above. In the event that you exchange any of these shares for shares of another fund, you will be charged the CDSC imposed by the fund into which you exchange your shares. The term of this CDSC will commence on the date that you initially purchase Class A shares of Transamerica AEGON Short-Term Bond without any sales charge as described in this paragraph.
Class B Shares – Back Load
Class B shares are not available for purchase, except as provided below:
| | 1) | Through a previously established Simple IRA or 403(b)7 fund account held directly with the fund where State Street Bank is the custodian. |
| | 2) | Through a previously established automated purchase plan, such as an AIP or payroll deduction, held directly with the fund. |
Existing Class B shareholders may continue to hold their shares until they automatically convert to Class A shares after 8 years, as provided in the existing conversion schedule.
Existing Class B shareholders will be charged a CDSC upon redemption according to the table below:
118
| | |
Contingent Deferred Sales Charge – Class B Shares |
| Year after Purchasing | | As a % of Dollar Amount (Subject to Change) |
| First | | 5% |
| Second | | 4% |
| Third | | 3% |
| Fourth | | 2% |
| Fifth | | 1% |
| Sixth and Later | | 0% |
Class B shares purchased prior to March 1, 2004 are subject to a CDSC if redeemed during the first 6 years of purchase (5%-1st year; 4%-2nd year; 3%-3rd year; 2%-4th year; and 1%-5th and 6th years). There are 12b-1 distribution and service fees of up to 1.00% per year.
Class B shares automatically convert to Class A shares after eight years, lowering annual expenses after conversion.
Class C Shares – Level Load
With Class C shares, you pay no initial sales charge. You will pay a 1.00% CDSC if shares are redeemed during the first 12 months. There are 12b-1 distribution and service fees of up to 1.00% per year. Class C shares (formerly Class L shares) purchased prior to March 1, 2004 are subject to the prior CDSC fee structure which was a 2% CDSC if shares are redeemed during the first 12 months, and a 1% CDSC if redeemed during the second 12 months. Prior to March 1, 2004, Class C shares were named Class L shares. On June 15, 2004, Class C2 shares were merged into Class C shares; on September 24, 2004, Class M shares were merged into Class C shares.
Investors who invested in Class C2 shares prior to the merger of Class C2 shares into Class C shares can make additional investments in Class C shares through their Class C2 shares accounts that converted into Class C share accounts without being subject to a CDSC. If you exchange your shares from such accounts, future purchases of Class C will be subject to the CDSC. For shareholders who also own Class C shares which converted from Class C2 shares, their Class C shares that converted from Class M shares also will not be subject to a CDSC and will be subject to the same 12b-1 commission structure applicable to their former Class C2 shares.
Currently, investors who purchase Class C shares of a Transamerica Fund established prior to March 1, 2006 through Merrill Lynch, Pierce, Fenner & Smith Incorporated will not be subject to any CDSC otherwise payable with respect to redemptions of such Class C shares of the funds. Exchanges of Class C shares into a Transamerica fund established on or after March 1, 2006 through Merrill Lynch, Pierce, Fenner & Smith Incorporated that previously were not subject to a CDSC will continue to not be subject to such fee. This CDSC waiver may be terminated at any time. New and/or subsequent purchases into Transamerica Funds established on or after March 1, 2006 will be subject to a 1.00% CDSC if shares are redeemed within 12 months of purchase.
The maximum purchase order in Class C shares is $999,999.99.
Class T Shares – Front Load (Transamerica WMC Diversified Growth Only)
(Closed to new investors)
When you buy Class T shares of Transamerica WMC Diversified Growth, you pay an initial sales charge (the offering price includes the sales charge). You can reduce the sales charge percentage in the same ways that are described under Class A shares. Class T shares are not subject to annual 12b-1 distribution and service fees.
You pay no sales charge when you redeem Class T shares. As with Class A shares, if you pay no up-front sales charge because you are purchasing $1 million or more of Class T shares, you will pay a deferred sales charge of 1.00% if you redeem any of those shares within the first 24 months after buying them, unless they were purchased through a retirement plan described in Section 401(a), 401(k), 401(m), 403(b) or 457 of the Internal Revenue Code. The charge is assessed on an amount equal to the lesser of the then current market value or the original cost of the shares being redeemed. No sales charge is imposed on net asset value above the initial purchase.
Waivers of the sales charges are granted under certain conditions. Persons eligible to buy Class T shares at NAV may not impose a sales charge when they re-sell those shares.
Contingent Deferred Sales Charge
Your shares may be subject to a CDSC. Dividends and capital gains are not subject to the sales charge. There is no charge on any increase in the value of your shares. Transamerica Funds will always use the first in, first out method
119
to fulfill your redemption requests. If your shares are worth less than when you bought them, the charge will be assessed on their current, lower value. In some cases, the sales charge may be waived.
Waivers and/or Reductions of Charges
Class A and Class T Sales Charge Reductions
You can lower the sales charge percentage in the following ways:
| • | | Substantial investments receive lower sales charge rates (see tables below). |
| • | | The “rights of accumulation” allows you, your spouse and children under age 21 to include the value of your existing holdings in any class of shares of the Transamerica Funds to determine your Class A or Class T sales charge. Breakpoints are derived from the daily NAV at the market close, the current combined NAV value at the time of the purchase and the gross amount of the new purchase. |
| • | | A Letter of Intent (“LOI”) allows you, your spouse and children under age 21 to count all share investments, up to a maximum of $1 million, in a Transamerica fund (except as noted below for Transamerica AEGON Short-Term Bond) over the next 13 months, as if you were making them all at once, to qualify for reduced sales charges on your Class A or Class T investments. The 13 month period will begin on the date of your first purchase following the execution of your LOI. The market value of your existing holdings eligible to be aggregated as of the trading day immediately before the start of your LOI period will be credited toward satisfying your LOI. Purchases made at NAV after the establishment of your LOI (as a result of another waiver or sales charge reduction) shall not count toward meeting the amount stated in your LOI. Transamerica Funds will reserve a portion of your shares to cover any additional sales charge that may apply if your LOI amount is not met. |
| • | | You may purchase shares of Transamerica AEGON Short-Term Bond pursuant to the LOI terms described above. However, an LOI for such purchases of Transamerica AEGON Short-Term Bond may be used only to aggregate investments in Transamerica AEGON Short-Term Bond up to a maximum of $250,000. Purchases of other Transamerica funds may not be aggregated with purchases of Transamerica AEGON Short-Term Bond for purposes of reaching the $250,000 threshold described in this paragraph. Additionally, purchases of Transamerica AEGON Short-Term Bond will not count towards satisfying the amount stated in your LOI for any other Transamerica fund. |
| • | | By investing as part of a qualified group. An individual who is a member of a qualified group may purchase Class A or Class T shares at the reduced sales charge applicable to that group as a whole. A “qualified group” is one which has at least ten members; has been in existence for at least six months; has some purpose in addition to the purchase of mutual fund shares at a discount; has agreed to include fund sales publications in mailings to members; has arrangements made for access to the group which are satisfactory to Transamerica Funds’ transfer agent; has arrangements satisfactory to Transamerica Funds’ transfer agent established for verification that the group meets these requirements; and the group’s sole organizational nexus or connection is not that the members are credit card holders of a company, policy holders of an insurance company, customers of a bank or a broker-dealer, clients of an investment adviser or security holders of a company. Transamerica Funds reserves the right to waive the requirement that the group continue to meet the minimum membership requirement or the requirement that an investor continues to belong to the group in order to qualify for lower sales charges (but not to waive either of these requirements initially). To establish a group purchase program, both the group itself and each participant must complete an application. Please contact Customer Service (1-888-233-4339) for further information and assistance. Qualified group accounts are not eligible to be counted under a rights of accumulation or LOI sales charge reduction or waiver with accounts other than accounts in the qualified group. |
| • | | By investing in a SIMPLE IRA plan, you and all plan participants will receive a reduced sales charge on all plan contributions that exceed quantity discount amounts. SIMPLE IRA plan accounts are not eligible to be counted under a rights of accumulation or LOI sales charge reduction or waiver with accounts other than accounts in the SIMPLE IRA plan. |
| • | | Your Class I share investments may count toward a reduction of sales charge paid on Class A and T shares. You may be able to lower the sales charge percentage on Class A and T by requesting “rights of accumulation” or a “letter of intent”. If you would like to add one of these features to your Class A and/or Class T share account, please contact Customer Service. |
120
| | | | |
Class A Share Quantity Discounts (all funds except Transamerica bond funds2 and Transamerica AEGON Money Market1) |
| Amount of Purchase* | | Sales Charge as % of Offering Price | | Sales Charge as % of Amount Invested |
| Under $50,000 | | 5.50% | | 5.82% |
| $50,000 to under $100,000 | | 4.75% | | 4.99% |
| $100,000 to under $250,000 | | 3.50% | | 3.63% |
| $250,000 to under $500,000 | | 2.75% | | 2.83% |
| $500,000 to under $1,000,000 | | 2.00% | | 2.04% |
| $1,000,000 and over | | 0.00% | | 0.00% |
| | | | |
Class A Share Quantity Discounts (Transamerica bond funds2 except Transamerica AEGON Short-Term Bond) |
| Amount of Purchase* | | Sales Charge as % of Offering Price | | Sales Charge as % of Amount Invested |
| Under $50,000 | | 4.75% | | 4.99% |
| $50,000 to under $100,000 | | 4.00% | | 4.17% |
| $100,000 to under $250,000 | | 3.50% | | 3.63% |
| $250,000 to under $500,000 | | 2.25% | | 2.30% |
| $500,000 to under $1,000,000 | | 1.25% | | 1.27% |
| $1,000,000 and over | | 0.00% | | 0.00% |
| | | |
| | | | | |
Class T Share Quantity Discounts (Transamerica WMC Diversified Growth) |
| Amount of Purchase* | | Sales Charge as % of Offering Price | | Sales Charge as % of Amount Invested |
| Under $10,000 | | 8.50% | | 9.29% |
| $10,000 to under $25,000 | | 7.75% | | 8.40% |
| $25,000 to under $50,000 | | 6.25% | | 6.67% |
| $50,000 to under $75,000 | | 5.75% | | 6.10% |
| $75,000 to under $100,000 | | 5.00% | | 5.26% |
| $100,000 to under $250,000 | | 4.25% | | 4.44% |
| $250,000 to under $500,000 | | 3.00% | | 3.09% |
| $500,000 to under $1,000,000 | | 1.25% | | 1.27% |
| $1,000,000 and over | | 0.00% | | 0.00% |
| | | |
| | | | | |
Class A Share Quantity Discounts (Transamerica AEGON Short-Term Bond) |
| Amount of Purchase* | | Sales Charge as % of Offering Price | | Sales Charge as % of Amount Invested |
| Under $250,000 | | 2.50% | | 2.56% |
| $250,000 and over | | 0.00% | | 0.00% |
| 1 | There is no sales charge on Class A Shares of Transamerica AEGON Money Market. |
| 2 | Transamerica bond funds include Transamerica AEGON Flexible Income, Transamerica AEGON High Yield Bond and Transamerica AEGON Short-Term Bond. |
| * | The transfer agent, TFS, must be notified when a purchase is made that qualifies under any of the above provisions. Consequently, when a purchaser acquires shares directly from Transamerica Funds, he/she must indicate in his/her purchase order that such purchase qualifies under any of the above provisions, and must provide enough information to substantiate that claim. When a purchaser acquires shares through a dealer or other financial intermediary, he/she must inform his/her dealer or other financial intermediary of any facts that may qualify a purchase for any of the above provisions, such as, for example, information about other holdings of Class A or Class T shares of the funds that the purchaser has, directly with Transamerica Funds, or through other accounts with dealers or financial intermediaries. To substantiate a claim, it may be necessary for a purchaser to provide TFS or his/her dealer or other financial intermediary information or records regarding shares of Transamerica Funds held in all accounts (e.g., retirement plan accounts) of the purchaser directly with Transamerica Funds or with one or several dealers or other financial intermediaries, including to substantiate “rights of accumulation” accounts held by a spouse and children under age 21. |
121
Waiver of Class A and Class T Initial Sales Charges
Class A and Class T shares may be purchased without a sales charge by:
| • | | Current and former trustees, directors, officers, and employees of Transamerica Funds and its affiliates; employees of Transamerica Funds sub-advisers; sales representatives and employees of dealers having a sales agreement with Transamerica Funds’ distributor, TCI; and any family members thereof; |
| • | | Any trust, pension, profit-sharing or other benefit plan for any of the foregoing persons; |
| • | | “Wrap” accounts for the benefit of clients of certain broker-dealers, financial institutions, or financial planners who have entered into arrangements with Transamerica Funds or TCI; |
| • | | Employer-sponsored retirement plans described in Section 401(a), 401(k), 401(m), or 457 of the Internal Revenue Code with assets of $1 million or more and whose accounts are held through an Omnibus or Network Level 3 account arrangement; |
| • | | Retirement plans described in Section 401(a), 401(k), 401(m), or 457 of the Internal Revenue Code whose accounts are held through an Omnibus or Network Level 3 account arrangement that purchased Class A shares without a sales charge prior to August 31, 2007; |
| • | | Other retirement plans that purchased Class A shares without a sales charge prior to April 28, 2006; |
| • | | Other retirement plans whose accounts are held through an arrangement with Morgan Stanley & Co. Incorporated; |
| • | | Other retirement plans whose accounts are held through an arrangement with Ascensus (formerly BISYS Retirement); |
| • | | Other retirement plans, non-qualified brokerage accounts, and other accounts that are opened through an arrangement with Diversified Investment Advisors, Transamerica Retirement Services or Clark Consulting and are held through an arrangement with Transamerica Retirement Management; and |
| • | | Other individual retirement accounts held in the Merrill Lynch Investor Choice Annuity (IRA Series) with Transamerica Advisors Life Insurance Company and Transamerica Advisors Life Insurance Company of New York. |
Investments by the retirement plan accounts mentioned above are not eligible to be counted under a rights of accumulation or letter of intent sales charge reduction or waiver with accounts other than accounts in the retirement plan.
Any person listed above (including retirement plan accounts and retirement plans) who requests a waiver of sales charges must provide adequate information to his/her broker-dealer or other financial intermediary or the funds’ distributor to substantiate such request.
Persons eligible to buy Class A and Class T shares at NAV may not impose a sales charge when they re-sell those shares.
Waiver of Class A, Class B, Class C, and Class T Contingent Deferred Sales Charges
You will not be assessed a sales charge in the following situations:
| • | | Following the death of the shareholder on redemptions from the deceased person’s account only. If this deceased person’s account is re-registered to another name, sales charges would continue to apply to this new account. The transfer agent will require satisfactory proof of death before it determines to waive the CDSC fee. |
| • | | Following the total disability of the shareholder (as determined by the Social Security Administration —applies only to shares held at the time the disability is determined). The transfer agent will require satisfactory proof of disability before it determines to waive the CDSC fee. |
| • | | On redemptions made under Transamerica Funds’ systematic withdrawal plan (may not exceed 12% of the account value per fund on the day the systematic withdrawal plan was established). |
| • | | If you redeem your shares and reinvest the proceeds in the same class of any fund within 90 days of redeeming, the sales charge on the first redemption is waived. |
| • | | For clients of broker-dealers that redeem Class C shares for which the selling broker-dealer was not paid an up-front commission by TCI. |
Information on sales charge reductions and/or waivers can also be found (free of charge) on the Transamerica Funds website at www.transamericafunds.com.
122
The Following Information Applies to Class R Shares
Transamerica Asset Allocation – Conservative Portfolio, Transamerica Asset Allocation – Growth Portfolio, Transamerica Asset Allocation – Moderate Growth Portfolio and Transamerica Asset Allocation – Moderate Portfolio each offer Class R shares.
Class R Availability
Class R shares of the funds are intended for purchase by participants in certain retirement plans described below and under the following conditions:
| • | | 401(k) plans, 457 plans, employer-sponsored 403(b) plans, profit sharing and money purchase plans, defined-benefit plans and non-qualified deferred compensation plans (eligible retirement plans). |
| • | | Class R shares are available only to eligible retirement plans where Class R shares are held on the books of the funds through omnibus or Network Level 3 accounts (either at the plan level or at the level of the financial service firm serving as an intermediary). |
| • | | The plan’s record-keeper or financial service firm serving as an intermediary must have an agreement with Transamerica Funds or its agents to utilize Class R shares in certain investment products or programs. |
The financial service firm serving as an intermediary can provide participants with detailed information on how to participate in the plan, elect a fund as an investment option, elect different investment options, alter the amounts contributed to the plan or change allocations among investment options. For questions about participant accounts or to obtain an application to participate in a plan, participants should contact their financial service firm serving as an intermediary, employee benefits office, the plan administrator, or the organization that provides recordkeeping services for the plan.
Financial service firms may provide some of the shareholder servicing and account maintenance services required by retirement plan accounts and their plan participants, including transfers of registration, dividend payee charges and generation of confirmation statements, and may arrange for plan administrators to provide other investment or administrative services. Financial service firms may charge retirement plans and plan participants transaction fees and/or other additional amounts for such services. Similarly, retirement plans may charge plan participants for certain expenses. These fees and additional amounts could reduce the return of investments in Class R shares of the funds.
Opening an Account and Purchasing Shares
Eligible retirement plans generally may open an account and purchase Class R shares by contacting any broker, dealer or other financial service firm authorized to sell Class R shares of the funds. Additional shares may be purchased through a retirement plan’s administrator, record-keeper or financial service firm serving as an intermediary. There is no minimum initial investment for Class R shares.
Please refer to the retirement plan documents for information on how to purchase Class R shares of the funds and any fees that may apply.
Transamerica Funds must receive your payment within three business days after your order is accepted.
Transamerica Funds or its agents may reject a request for purchase of shares at any time, in whole or in part, including any purchase under the exchange privilege. Each fund reserves the right to discontinue offering Class R shares at any time, to liquidate Class R shares or merge Class R shares into another class of shares, or to cease investment operations entirely.
Selling Shares
If you own Class R shares, please refer to the retirement plan documents for information on how to redeem Class R shares of the funds.
Shares will normally be redeemed for cash, although each fund retains the right to redeem its shares in kind, under unusual circumstances, in order to protect the interests of shareholders by the delivery of securities selected from its assets at its discretion. Please see the SAI for more details.
Exchanging Shares
For Class R shares, if authorized by your plan, you can request an exchange of your shares in one fund for Class R shares of another fund offered in this prospectus. Please refer to your plan’s documents for additional information. An exchange is treated as a redemption of a fund’s shares followed by a purchase of the shares of the fund into which you exchanged. Prior to making exchanges into a fund you do not own, please read the prospectus of that fund.
123
Features and Policies
Checkwriting Service (For Class A shares of Transamerica AEGON Money Market only)
If you would like to use the checkwriting service, mark the appropriate box on the application or authorization form. Your Transamerica AEGON Money Market fund account must have a minimum balance of $1,000 to establish check writing privileges. The fund will send you checks when it receives these properly completed documents and your check has cleared the 15 day holding period. Checks must be written for at least $250, and investments made by check or ACH must have been in your account for at least 15 calendar days before you can write checks against them. A service fee of $10 applies for those checks written under $250. When the check is presented for payment, the fund will redeem a sufficient number of full and fractional shares in your account at that day’s net asset value to cover the amount of the check. Checks presented against your account in an amount that exceeds your available balance will be returned for “insufficient funds” and your account will incur a $20 service fee. Due to dividends accruing on your account, it is not possible to determine your account’s value in advance so you should not write a check for the entire value or try to close your account by writing a check. A stop payment on a check may be requested for a $20 service fee. The payment of funds is authorized by the signature(s) appearing on the Transamerica Funds application or authorization form. Each signatory guarantees the genuineness of the other signatures.
The use of checks is subject to the rules of the Transamerica Funds designated bank for its checkwriting service. Transamerica Funds has chosen UMB Bank, N.A. as its designated bank for this service. UMB Bank, N.A., or its bank affiliate (the Bank), is appointed agent by the person(s) signing the Transamerica Funds application or authorization form (the Investor(s)) and, as agent, is authorized and directed upon presentment of checks to the Bank to transmit such checks to Transamerica Funds as requests to redeem shares registered in the name of the Investor(s) in the amounts of such checks.
This checkwriting service is subject to the applicable terms and restrictions, including charges, set forth in this prospectus. The Investor(s) agrees that he/she is subject to the rules, regulations, and laws governing check collection including the Uniform Commercial Code as enacted in the state of Missouri, pertaining to this checkwriting service, as amended from time to time. The Bank and/or Transamerica Funds has the right not to honor checks presented to it and the right to change, modify or terminate this checkwriting service at any time.
The checkwriting service is not available for IRAs, Coverdell ESAs, qualified retirement plans or Class B, Class C, Class I or Class R shares of Transamerica AEGON Money Market.
Customer Service
Occasionally, Transamerica Funds experiences high call volume due to unusual market activity or other events that may make it difficult for you to reach a Customer Service Representative by telephone. If you are unable to reach Transamerica Funds by telephone, please consider visiting our website at www.transamericafunds.com. You may also send instructions by mail, by fax, or by using our automated phone system at 1-888-233-4339.
Uncashed Checks Issued on Your Account
If any check Transamerica Funds issues is returned by the Post Office as undeliverable, or remains outstanding (uncashed) for six months, we reserve the right to reinvest check proceeds back into your account at the net asset value next calculated after reinvestment. If applicable, we will also change your account distribution option from cash to reinvest. Interest does not accrue on amounts represented by uncashed checks. In case we are unable to reinvest check proceeds in the original funds that you held, for example, if a fund has been liquidated or is closed to new investments, we reserve the right to reinvest the proceeds in Transamerica AEGON Money Market.
Minimum Dividend Check Amounts
To control costs associated with issuing and administering dividend checks, we reserve the right not to issue checks under a specified amount. For accounts with the cash by check dividend distribution option, if the dividend payment total is less than $10, the distribution will be reinvested into the account and no check will be issued.
Minimum Account Balance
Due to the proportionately higher cost of maintaining customer fund accounts with balances below the stated minimums for each class of shares, Transamerica Funds reserves the right to close such accounts or assess an annual fee on such fund accounts to help offset the costs associated with maintaining the account. Transamerica Funds generally provides a 60-day notification to the address of record prior to assessing a minimum fund account fee, or closing any fund account. The following describes the fees assessed against fund accounts with balances below the stated minimum:
| | |
| Account Balance (per fund account) | | Fee Assessment (per fund account) |
| If your balance is below $1,000 per fund account, including solely due to declines in NAV | | $25 annual fee assessed, until balance reaches $1,000 |
124
No fees will be charged on:
| • | | accounts opened within the preceding 12 months |
| • | | accounts with an active monthly Automatic Investment Plan or payroll deduction ($50 minimum per fund account) |
| • | | accounts owned by an individual which, when combined by Social Security Number, have a balance of $5,000 or more |
| • | | accounts owned by individuals in the same household (by address) that have a combined balance of $5,000 or more |
| • | | accounts for which Transamerica Funds in its discretion has waived the minimum account balance requirements |
| • | | UTMA/UGMA accounts (held at Transamerica Funds) |
| • | | State Street Custodial Accounts (held at Transamerica Funds) |
| • | | Coverdell ESA accounts (held at Transamerica Funds) |
| • | | Omnibus and Network Level 3 accounts |
| • | | B share accounts whose shares have started to convert to A share accounts (as long as combined value of both accounts is at least $1,000) |
While there is currently no minimum account size for maintaining a Class I share account, the funds reserve the right, without prior notice, to establish a minimum amount required to maintain an account.
Telephone Transactions
Transamerica Funds and its transfer agent, Transamerica Fund Services, Inc. (“TFS”) are not liable for complying with telephone instructions that are deemed by them to be genuine. Transamerica Funds and TFS will employ reasonable procedures to help ensure telephone instructions are genuine. These procedures may include requiring personal identification, providing written confirmation of transactions, and tape recording conversations. In situations where Transamerica Funds or TFS reasonably believe they were acting on genuine telephone instructions, you bear the risk of loss. Transamerica Funds reserves the right to modify the telephone redemption privilege at any time.
Retirement and ESA State Street Account Maintenance Fees
Retirement plan and Coverdell ESA State Street accounts are subject to an annual custodial fee of $15 per fund account, with a maximum fee of $30 per Social Security Number. For example, an IRA in two fund accounts would normally be subject to a $30 annual custodial fee. An A share account which holds shares converted from a B-share account shall be considered as part of the original B share account for purposes of this fee. The fee is waived if the total of the retirement plan and ESA account(s)’ value per Social Security Number is more than $50,000.
Professional Fees
Your financial professional may charge a fee for his or her services. This fee will be in addition to any fees charged by Transamerica Funds. Your financial professional will answer any questions that you may have regarding such fees.
Signature Guarantee
An original signature guarantee assures that a signature is genuine so that you are protected from unauthorized account transactions. Notarization is not an acceptable substitute. Acceptable guarantors only include participants in the Securities Transfer Agents Medallion Program (“STAMP2000”). Participants in STAMP2000 may include financial institutions such as banks, savings and loan associations, trust companies, credit unions, broker-dealers, and member firms of a national securities exchange.
An original signature guarantee is required if any of the following is applicable:
| • | | You request a redemption or distribution transaction totaling more than $100,000 or, in the case of an IRA with a market value in excess of $100,000, you request a custodian to custodian transfer. |
| • | | You would like a check made payable to anyone other than the shareholder(s) of record. |
| • | | You would like a check mailed to an address which has been changed within 10 days of the redemption request. |
| • | | You would like a check mailed to an address other than the address of record. |
| • | | You would like your redemption proceeds wired to a bank account other than a bank account of record. |
| • | | You are adding or removing a shareholder from an account. |
| • | | You are changing ownership of an account. |
125
| • | | When establishing an electronic bank link, if the Transamerica Funds’ account holder’s name does not appear on the check. |
The funds reserve the right to require an original signature guarantee under other circumstances or to reject or delay a redemption on certain legal grounds.
An original signature guarantee may be refused if any of the following is applicable:
| • | | It does not appear valid or in good form. |
| • | | The transaction amount exceeds the surety bond limit of the signature guarantee. |
| • | | The guarantee stamp has been reported as stolen, missing or counterfeit. |
Employer Sponsored Accounts
If you participate in an employer sponsored retirement plan and wish to make an allocation change to your current fund selection, you or your financial professional must notify Transamerica Funds by phone or in writing. Please also remember to inform your employer of the change(s) to your fund allocation. Documentation for allocations submitted online or in writing from your employer will be used to allocate your contributions. This documentation will supersede all other prior instructions received from you or your financial professional. (Note: If you perform a partial or complete exchange to a new fund selection, your current fund allocation will remain unchanged for future contributions unless specified otherwise.)
E-Mail Communication
As e-mail communications may not be secure, and because we are unable to take reasonable precautions to verify your shareholder and transaction information, we cannot respond to account-specific requests received via e-mail. For your protection, we ask that all account specific requests be submitted only via telephone, mail or through the secure link on our website.
Reinvestment Privilege (Does not apply to Class I shares)
Within a 90-day period after you sell your shares, you have the right to “reinvest” your money in any fund of the same class. You will not incur a new sales charge if you use this privilege within the allotted time frame. Any contingent deferred sales charge (“CDSC”) you paid on your shares will be credited to your account. You may reinvest the proceeds of a Class B share sale (less the CDSC) in Class A shares without paying the up-front sales charge. To take advantage of the 90-day reinvestment privilege, a written request must accompany your investment check.
Statements and Reports
Transamerica Funds will send you a confirmation statement after every transaction that affects your account balance or registration, with the exception of systematic transactions or transactions necessary to assess account fees. Systematic transactions and fees will be shown on your next regularly scheduled quarterly statement. Information regarding these fees is disclosed in this prospectus. Please review the confirmation statement carefully and promptly notify Transamerica Funds of any error. Information about the tax status of the prior year’s income dividends and capital gains distributions will be mailed to shareholders early each year.
Please retain your statements. If you require historical statements, Transamerica Funds may charge $10 per statement year up to a maximum of $50 per Social Security Number. Financial reports for the funds, which include a list of the holdings, will be mailed twice a year to all shareholders.
e-Delivery
Transamerica Funds offers e-Delivery, a fast and secure way of receiving statements and other shareholder documents electronically. Subscribers to e-Delivery are notified by e-mail when shareholder materials, such as prospectuses, financial transaction confirmations and financial reports, become available on the Transamerica Funds website.
Once your account is established, visit our website at www.transamericafunds.com. Click on the Our Funds tab, select Transamerica Funds, then select Individual, and click on Manage My Account for more information and to subscribe. Then, once you have logged in to your account, select the “Electronic Delivery” option and follow the simple enrollment steps provided.
Market Timing/Excessive Trading
Some investors try to profit from various short-term or frequent trading strategies known as market timing. Examples of market timing include switching money into funds when their share prices are expected to rise and taking money out when their share prices are expected to fall, and switching from one fund to another and then back again after a short period of time. As money is shifted in and out, a fund may incur expenses for buying and selling securities. Excessive purchases, redemptions or exchanges of fund shares may disrupt portfolio management, hurt fund performance and drive fund expenses higher. For example, a fund
126
may be forced to liquidate investments as a result of short-term trading and incur increased brokerage costs or realize taxable capital gains without attaining any investment advantage. These costs are generally borne by all shareholders, including long-term investors who do not generate these costs.
Transamerica Funds’ Board of Trustees has approved policies and procedures that are designed to discourage market timing or excessive trading which include limitations on the number of transactions in fund shares, as described in this prospectus. If you intend to engage in such practices, we request that you do not purchase shares of any of the funds. Each fund reserves the right to reject any request to purchase shares, including purchases in connection with an exchange transaction, which the fund reasonably believes to be in connection with market timing or excessive trading. The funds generally will consider four or more exchanges between funds, or frequent purchases and redemptions having a similar effect, during any rolling 90-day period to be evidence of market timing or excessive trading by a shareholder or by accounts under common control (for example, related shareholders, or a financial adviser with discretionary trading authority over multiple accounts). However, the funds reserve the right to determine less active trading to be “excessive” or related to market timing.
While the funds discourage market timing and excessive short-term trading, the funds cannot always recognize or detect such trading, particularly if it is facilitated by financial intermediaries or done through Omnibus Account arrangements. Transamerica Funds’ distributor has entered into agreements with intermediaries requiring the intermediaries to provide certain information to help identify harmful trading activity and to prohibit further purchases or exchanges by a shareholder identified as having engaged in excessive trading. There is no guarantee that the procedures used by financial intermediaries will be able to curtail frequent, short-term trading activity. For example, shareholders who seek to engage in frequent, short-term trading activity may use a variety of strategies to avoid detection, and the financial intermediaries’ ability to deter such activity may be limited by operational and information systems capabilities. Due to the risk that the funds and financial intermediaries may not detect all harmful trading activity, it is possible that shareholders may bear the risks associated with such activity.
Orders to purchase, redeem or exchange shares forwarded by certain omnibus accounts with Transamerica Funds will not be considered to be market timing or excessive trading for purposes of Transamerica Funds’ policies. However, the market timing and excessive trading policies of these omnibus firms or plans may apply to transactions by the underlying shareholders.
Reallocations in underlying series of Transamerica Funds by a Transamerica asset allocation fund which invests in other series of Transamerica in furtherance of a fund’s objective are not considered to be market timing or excessive trading.
Pricing of Shares
How Share Price is Determined
The price at which shares are purchased or redeemed is the NAV that is next calculated following receipt and acceptance of a purchase order in good order or receipt of a redemption order in good order by the fund, an authorized intermediary, or the mail processing center located in Kansas City, Missouri.
When Share Price Is Determined
The NAV of each fund (or class thereof) is determined on each day the New York Stock Exchange (“NYSE”) is open for business. The NAV is not determined on days when the NYSE is closed (generally New Year’s Day, Martin Luther King Jr. Day, Presidents’ Day, Good Friday, Memorial Day, Independence Day, Labor Day, Thanksgiving and Christmas). Foreign securities may trade in their primary markets on weekends or other days when a fund does not price its shares (therefore, the NAV of a fund holding foreign securities may change on days when shareholders will not be able to buy or sell shares of the funds).
Purchase orders received in good order and accepted, and redemption orders received in good order, before the close of business on the NYSE, usually 4:00 p.m. Eastern Time, receive the NAV determined as of the close of the NYSE that day (plus or minus applicable sales charges). Purchase and redemption requests received after the NYSE is closed receive the NAV at the close of the NYSE the next day the NYSE is open.
Purchase orders for shares of the Transamerica asset allocation funds that are received in good order and accepted before the close of business on the NYSE receive the NAV determined as of the close of the NYSE that day. For direct purchases, corresponding orders for shares of the underlying constituent funds are priced on the same day that orders for shares of the asset allocation funds are received and accepted. For purchases of shares of the Transamerica asset allocation funds through the National Securities Clearing Corporation (“NSCC”), orders for shares of the underlying constituent funds will be placed after the receipt and acceptance of the settled purchase order for shares of the asset allocation funds.
How NAV Is Calculated
The NAV of each fund (or class thereof) is calculated by taking the value of its net assets and dividing by the number of shares of the fund (or class) that are then outstanding.
127
The Board of Trustees has approved procedures to be used to value the funds’ securities for the purposes of determining the funds’ NAV. The valuation of the securities of the funds is determined in good faith by or under the direction of the Board. The Board has delegated certain valuation functions for the funds to TAM.
In general, securities and other investments (including shares of ETFs) are valued based on market prices at the close of regular trading on the NYSE. Fund securities (including shares of ETFs) listed or traded on domestic securities exchanges or the NASDAQ/NMS, including dollar-dominated foreign securities or ADRs, are valued at the closing price on the exchange or system where the security is principally traded. With respect to securities traded on the NASDAQ/NMS, such closing price may be the last reported sale price or the NASDAQ Official Closing Price (“NOCP”). If there have been no sales for that day on the exchange or system where the security is principally traded, then the value should be determined with reference to the last sale price, or the NOCP, if applicable, on any other exchange or system. If there have been no sales for that day on any exchange or system, a security is valued at the closing bid quotes on the exchange or system where the security is principally traded, or at the NOCP, if applicable. Foreign securities traded on U.S. exchanges are generally priced using last sale price regardless of trading activity. Securities traded over-the-counter are valued at the mean of the last bid and asked prices. The market price for debt obligations is generally the price supplied by an independent third party pricing service, which may use market prices or quotations or a variety of fair value techniques and methodologies. Short-term debt obligations that will mature in 60 days or less are valued at amortized cost, unless it is determined that using this method would not reflect an investment’s fair value. The prices that the fund uses may differ from the amounts that would be realized if the investments were sold and the differences could be significant, particularly for securities that trade in relatively thin markets and/or markets that experience extreme volatility. Foreign securities generally are valued based on quotations from the primary market in which they are traded, and are converted from the local currency into U.S. dollars using current exchange rates. Market quotations for securities prices may be obtained from automated pricing services. Shares of open-end funds (other than ETF shares) are generally valued at the net asset value per share reported by that investment company. ETF shares are valued at the most recent sale price or official closing price on the exchange on which they are traded.
When a market quotation for a security is not readily available (which may include closing prices deemed to be unreliable because of the occurrence of a subsequent event), a valuation committee appointed by the Board of Trustees may, in good faith, establish a value for the security in accordance with fair valuation procedures adopted by the Board. The types of securities for which such fair value pricing may be required include, but are not limited to: foreign securities, where a significant event occurs after the close of the foreign market on which such security principally trades that is likely to have changed the value of such security, or the closing value is otherwise deemed unreliable; securities of an issuer that has entered into a restructuring; securities whose trading has been halted or suspended; fixed-income securities that have gone into default and for which there is no current market value quotation; and securities that are restricted as to transfer or resale. The funds use a fair value model developed by an independent third party pricing service to price foreign equity securities on days when there is a certain percentage change in the value of a domestic equity security index, as such percentage may be determined by TAM from time to time.
Valuing securities in accordance with fair value procedures involves greater reliance on judgment than valuing securities based on readily available market quotations. The valuation committee makes fair value determinations in good faith in accordance with the funds’ valuation procedures. Fair value determinations can also involve reliance on quantitative models employed by a fair value pricing service. There can be no assurance that a fund could obtain the fair value assigned to a security if it were to sell the security at approximately the time at which the fund determines its NAV per share.
Distribution of Shares
Distribution Plans
The Board of Trustees of Transamerica Funds has adopted a 12b-1 Plan for each class of shares of each fund (except Class I and Class T shares). The Plan provides for payments of distribution and service fees, based on annualized percentages of daily net assets, to TCI, broker-dealers, financial intermediaries and others.
Distribution of Class A Shares. Under the Plan, the funds pay distribution and service fees of up to 0.35% for Class A shares. As applicable to Transamerica AEGON Short-Term Bond and Transamerica AEGON Flexible Income, 0.10% of the 0.35% 12b-1 fee on Class A shares will be waived through March 1, 2012.
Distribution of Class B Shares. Under the Plan, the funds pay distribution and service fees of up to 1.00% for Class B shares.
Distribution of Class C Shares. Under the Plan, the funds pay distribution and service fees of up to 1.00% for Class C shares.
Distribution of Class R Shares. Under the Plan, the funds pay distribution and service fees of up to 0.50% for Class R shares.
The Effect of Rule 12b-1 Plans. Because the funds have 12b-1 Plans, even though Class B and C shares do not carry up-front sales loads, the higher distribution and service fees payable by those shares may, over time, be higher than the total fees paid by owners of Class A shares. In general, because 12b-1 Plan fees are paid on an ongoing basis, these fees will increase the cost of
128
your investment and may cost more than other types of sales charges. For a complete description of the funds’ 12b-1 Plans, see the SAI.
Underwriting Agreement
Transamerica Funds has an Underwriting Agreement with Transamerica Capital, Inc. (“TCI”), located at 4600 South Syracuse Street, Suite 1100, Denver, CO 80237. TCI is an affiliate of TAM and Transamerica Funds. Under this agreement, TCI underwrites and distributes all classes of fund shares and bears the expenses of offering these shares to the public. The funds may pay TCI, or its agent, fees for its services. Of the distribution and service fees it usually receives for Class A and B shares, TCI, or its agent, may reallow or pay to brokers or dealers who sold them 0.25% of the average daily net assets of those shares. In the case of Class C and R shares, TCI, or its agent, reallows or pays to brokers, dealers or intermediaries its entire fee to those entities who sold them.
Other Distribution or Service Arrangements
TCI, TAM and their affiliates may enter into arrangements with affiliated entities that provide administrative, recordkeeping and other services with respect to one or more of the funds. Payment for these services is made by TCI, TAM and their affiliates out of past profits and other available sources and may take the form of internal credit, recognition or cash payments. TCI, TAM and their affiliates may also enter into similar arrangements with unaffiliated entities.
TCI engages in wholesaling activities designed to support, maintain, and increase the number of financial intermediaries who sell shares of Transamerica Funds. Wholesaling activities include, but are not limited to, recommending and promoting, directly or through intermediaries, Transamerica Funds to financial intermediaries and providing sales training, retail broker support and other services. Payment for these activities is made by TCI, TAM and their affiliates out of past profits and other available sources, including revenue sharing payments from others.
TCI (in connection with, or in addition to, wholesaling services), TAM and fund sub-advisers, directly or through TCI, out of their past profits and other available sources, provide cash payments or non-cash compensation to some, but not all, brokers and other financial intermediaries who have sold shares of the funds, promote the distribution of the funds or render investor services to fund shareholders. Such payments and compensation are in addition to the sales charges, Rule 12b-1 Plan fees, service fees and other fees that may be paid, directly or indirectly, to such brokers and other financial intermediaries. These arrangements are sometimes referred to as “revenue sharing” arrangements. The amount of revenue sharing payments is substantial and may be substantial to any given recipient. The presence of these payments and the basis on which an intermediary compensates its registered representatives or salespersons may create an incentive for a particular intermediary, registered representative or salesperson to highlight, feature or recommend the funds, at least in part, based on the level of compensation paid. Revenue sharing arrangements are separately negotiated. Revenue sharing is not an expense of the funds, is not reflected in the fees and expenses sections of this prospectus and does not change the price paid by investors for the purchase of a fund’s shares or the amount received by a shareholder as proceeds from the redemption of fund shares.
Such additional cash payments may be made to brokers and other financial intermediaries that provide services to Transamerica Funds and/or shareholders in Transamerica Funds, including (without limitation) shareholder servicing, marketing support and/or access to meetings and/or events, sales representatives and management representatives of the broker or other financial intermediaries. Cash compensation may also be paid to brokers and other financial intermediaries for inclusion of a Transamerica fund on a sales list, including a preferred or select sales list, in other sales programs, or as an expense reimbursement or compensation in cases where the broker or other financial intermediary provides services to fund shareholders. To the extent permitted by applicable law, TCI and other parties may pay or allow other incentives and compensation to brokers and other financial intermediaries. TCI and the other parties making these payments generally assess the advisability of continuing making these payments periodically.
These cash payments may take a variety of forms, including (without limitation) reimbursement of ticket charges, additional compensation for sales, on-going fees for shareholder servicing and maintenance of investor accounts, and finder’s fees that vary depending on the fund or share class and the dollar amount of shares sold. Revenue sharing payments can be calculated: (i) as a percentage of gross or net sales; (ii) as a percentage of gross or net assets under management; and/or (iii) as a fixed or negotiated flat fee dollar amount. As of December 31, 2010, TCI may make periodic revenue sharing payments to brokers and other financial intermediaries, such as monthly or quarterly. These periodic payments are equal to a percentage of periodic sales, ranging from 5 basis points (0.05%) to 45 basis points (0.45%) or equal to a percentage of assets under management ranging from 2.5 basis points (0.025%) to 20 basis points (0.20%). In 2010, TCI paid flat annual fees ranging from $0 to $100,000, which included at times a series of meetings and/or events of other broker-dealers and banks.
As of December 31, 2010, TCI had such revenue sharing arrangements with at least 16 brokers and other financial intermediaries, of which some of the more significant include: Compass Brokerage, Inc.; Hantz Financial Services, Inc.; US Bancorp Investments, Inc.; Suntrust Investments Services; CCO Investments Services Corp.; LPL Financial; Raymond James
129
Financial Services; Ameriprise Financial Services, Inc.; Bank of America – Merrill Lynch; Citigroup-Morgan Stanley Smith Barney; PNC Investments; Raymond James and Associates; Raymond James Financial Services; UBS Financial Services; Wells Fargo Advisors, LLC); and Prudential Financial. For the calendar year ended December 31, 2010, TCI paid or expects to pay approximately $5,303,000 to various brokers and other financial intermediaries in connection with revenue sharing arrangements.
For the same period, TCI received revenue sharing payments totaling $1,502,560 from the following financial services firms to participate in functions, events and meetings, among other things: Alliance Bernstein, BlackRock, Clarion, Federated, Jennison Associates, JP Morgan, Neuberger Berman Management LLC, MFS Investment Management, NATIXIS, Oppenheimer Funds, PIMCO, Schroders, Transamerica Investment Management and Wellington Management Capital. TAM also serves as investment adviser to certain funds of funds that are underlying investment options for Transamerica insurance products. TCI and its affiliates receive revenue sharing payments from affiliates of certain underlying unaffiliated funds for the provision of services to investors and distribution activities.
In addition, while TCI typically pays most of the sales charge applicable to the sale of fund shares to brokers and other financial intermediaries through which purchases are made, TCI may, on occasion, pay the entire sales charge. (Additional information about payments of sales charges to brokers is available in the section titled “Dealer Reallowances” of the SAI.)
Also, TAM pays, out of its own assets, financial intermediaries a “trail” fee for servicing and maintenance of accounts of Class T shareholders in Transamerica WMC Diversified Growth in an amount equal, on an annual basis, up to 0.10% of average daily net assets held by such Class T shareholders.
From time to time, TCI, its affiliates and/or TAM and/or fund sub-advisers may also pay non-cash compensation to brokers and other financial intermediaries and their sales representatives in the form of, for example: (i) occasional gifts; (ii) occasional meals, tickets or other entertainment; and/or (iii) sponsorship support of broker marketing events or activities. For example, such non-cash compensation may include in part, assistance with the costs and expenses associated with travel, lodging, educational meetings, seminars, meetings and conferences, entertainment and meals to the extent permitted by law. The costs and expenses associated with these efforts may include travel, lodging, sponsorship at educational seminars, meetings and conferences, entertainment and meals to the extent permitted by law.
The non-cash compensation to sales representatives and compensation or reimbursement received by brokers and other financial intermediaries through sales charges, other fees payable from the funds, and/or revenue sharing arrangements for selling shares of the funds may be more or less than the overall compensation or reimbursement on similar or other products and may influence your broker or other financial intermediary to present and recommend the funds over other investment options available in the marketplace. In addition, depending on the arrangements in place at any particular time, your broker or other financial intermediary may have a financial incentive for recommending a particular class of fund shares over other share classes.
Shareholders may obtain more information about these arrangements, including the conflicts of interests that such arrangements may create, from their brokers and other financial intermediaries, and should so inquire if they would like additional information. A shareholder may ask his/her broker or financial intermediary how he/she will be compensated for investments made in the funds. Revenue sharing payments, as well as payments under the shareholder services and distribution plan (where applicable), also benefit TAM, TCI and their affiliates to the extent the payments result in more assets being invested in the funds on which fees are being charged.
Although a fund may use financial firms that sell fund shares to effect transactions for the fund’s portfolio, the fund and its investment adviser or sub-adviser will not consider the sale of fund shares as a factor when choosing financial firms to effect those transactions.
Class I shares of the funds may be offered through certain brokers and financial intermediaries (“service agents”) that have established a shareholder servicing relationship with Transamerica Funds on behalf of their customers. Service agents may impose additional or different conditions than Transamerica Funds on purchases, redemptions or exchanges of fund shares by their customers. Service agents may also independently establish and charge their customers transaction fees, account fees or other amounts in connection with purchases, sales and redemptions of fund shares in addition to any fees charged by Transamerica Funds. These additional fees may vary over time and would increase the cost of the customer’s investment and lower investment returns. Each service agent is responsible for transmitting to its customers a schedule of any such fees and information regarding any additional or different conditions regarding purchases, redemptions and exchanges. Shareholders who are customers of service agents should consult their service agents for information regarding these fees and conditions. Among the service agents with whom Transamerica Funds may enter into a shareholder servicing relationship are firms whose business involves or includes investment consulting, or whose parent or affiliated companies are in the investment consulting business, that may recommend that their clients utilize TAM’s investment advisory services or invest in the funds or in other products sponsored by TAM and its affiliates.
130
Distributions and Taxes
Taxes on Distributions in General
Each fund will distribute all or substantially all of its net investment income and net capital gains to its shareholders each year. Although a fund will not have to pay income tax on amounts it distributes to shareholders, shareholders will generally be taxed on amounts they receive, whether the distributions are paid in cash or are reinvested in additional shares. If a fund declares a dividend in October, November, or December, payable to shareholders of record in such a month, and pays it in the following January, shareholders will be taxed on the dividend as if they received it in the year in which it was declared.
Each fund generally pays any dividends and other distributions annually, except the following: Transamerica Asset Allocation— Conservative Portfolio, Transamerica Multi-Managed Balanced and Transamerica WMC Quality Value pay quarterly; Transamerica AEGON Flexible Income and Transamerica AEGON High Yield Bond pay monthly; Transamerica AEGON Short-Term Bond and Transamerica AEGON Money Market declare dividends daily and pay monthly. If necessary, each fund may make distributions at other times as well.
The following are guidelines for how certain distributions by a fund are generally taxed to non-corporate shareholders under current federal income tax law:
| • | | Distributions of net capital gain (i.e., the excess of net long-term capital gain over net short-term capital loss) will be taxed as long-term capital gains at a maximum rate of 15% (0% for individuals in the 10% and 15% federal tax brackets). |
| • | | Distributions reported by a fund as “qualified dividend income” will also be taxed at a maximum rate of 15% (0% for individuals in the 10% and 15% federal tax brackets). Qualified dividend income generally is income derived from certain dividends from U.S. corporations or certain foreign corporations that are either incorporated in a U.S. possession or eligible for tax benefits under certain U.S. income tax treaties. In addition, dividends that a fund receives in respect of stock of certain foreign corporations will be qualified dividend income if that stock is readily tradable on an established U.S. securities market. Note that a shareholder (and the fund in which the shareholder invests) will have to satisfy certain holding period requirements in order to obtain the benefit of the lower tax rate applicable to qualified dividend income. |
| • | | Other distributions generally will be taxed at the ordinary income tax rate applicable to the shareholder. |
The tax rates in the first two bullets above do not apply to corporate shareholders. For taxable years beginning on or after January 1, 2013, distributions of net capital gain will be taxable to non-corporate shareholders at a maximum rate of 20%, and distributions of a fund’s dividend income will be taxable to shareholders at ordinary income tax rates.
The funds will send you a tax report annually summarizing the amount and tax aspects of your distributions. If you buy shares of a fund shortly before it makes a distribution (other than regular monthly distributions paid by Transamerica AEGON Money Market and Transamerica AEGON Short-Term Bond), the distribution will be taxable to you even though it may actually be a return of a portion of your investment. This is known as “buying a dividend.”
Investors who invest through tax-deferred accounts, such as IRAs, 403(b) accounts, and qualified retirement plans, will ordinarily not be subject to tax until a distribution is made from the account, at which time such distribution is generally taxed as ordinary income. These accounts are subject to complex tax rules, and tax-deferred account investors should therefore consult their tax advisers regarding their investments in a tax-deferred account.
Funds that invest in other funds (“asset allocation funds”) may recognize income on distributions from underlying funds in which they invest and may also recognize gains and losses if they redeem shares in underlying funds. Distributions of net capital gains or, for taxable years beginning before January 1, 2013, qualified dividend income of either the asset allocation funds or underlying funds will generally be taxed at long-term capital gain rates when distributed to shareholders of the asset allocation funds. Other distributions, including short-term capital gains, generally will be taxed as ordinary income. The structure of the asset allocation funds and the reallocation of investments among underlying funds could affect the amount, timing and character of distributions.
Taxes on the Sale or Exchange of Shares
If you sell shares of a fund or exchange them for shares of another fund, you generally will have a capital gain or loss, which will generally be a long-term capital gain or loss if you held the shares for more than one year; otherwise it will generally be a short-term capital gain or loss. Any loss recognized on shares held for six months or less is treated as a long-term capital loss to the extent of any amounts treated as distributions of long-term capital gain that were received with respect to the shares.
Any gain or loss on the sale or exchange of shares is computed by subtracting your tax basis in the shares from the redemption proceeds in the case of a sale or the value of the shares received in the case of an exchange. Because your tax basis depends on the original purchase price and on the price at which any dividends may have been reinvested, you should be sure to keep
131
account statements so that you or your tax return preparer will be able to determine whether a sale will result in a taxable gain or loss.
Note that money market funds typically maintain a stable net asset value of $1.00 per share. Assuming Transamerica AEGON Money Market maintains a stable net asset value, you will typically not recognize gain or loss upon the sale, redemption, or exchange of shares of this fund.
Withholding Taxes
A fund in which you invest may be required to apply backup withholding of U.S. federal income tax on all distributions payable to you if you fail to provide the funds with your correct taxpayer identification number or to make required certifications, or if you have been notified by the IRS that you are subject to backup withholding. The backup withholding rate is currently 28% and is scheduled to increase to 31% in 2013. Backup withholding is not an additional tax, but is a method by which the IRS ensures that it will collect taxes otherwise due. Any amounts withheld may be credited against your U.S. federal income tax liability.
Non-Resident Alien Withholding
If you are a non-U.S. investor, you must provide a U.S. mailing address to establish an account unless your broker-dealer firm submits your account through the National Securities Clearing Corporation. Your broker-dealer will be required to submit a foreign certification form. Investors changing a mailing address to a non- U.S. address will be required to have a foreign certification form completed by their broker-dealer and returned to us before future purchases can be accepted. Shareholders that are not U.S. persons under the federal tax laws may be subject to U.S. withholding taxes on certain distributions and are generally subject to U.S. tax certification requirements. Additionally, those shareholders will need to provide an appropriate tax form (generally, Form W-8BEN) and documentary evidence and letter of explanation.
Other Tax Information
This tax discussion is for general information only. In addition to federal income taxes, you may be subject to state, local or foreign taxes on payments received from, and investments made in shares of, a Transamerica fund. More information is provided in the SAI of the funds. You should also consult your own tax adviser for information regarding all tax consequences applicable to your investments in Transamerica Funds.
Investment Policy Changes
A fund that has a policy of investing, under normal circumstances, at least 80% of its assets (defined as net assets plus the amount of any borrowings for investment purposes) in the particular type of securities implied by its name will provide its shareholders with at least 60 days’ prior written notice before making changes to such policy. Such notice will comply with the conditions set forth in any applicable SEC rules then in effect.
Unless expressly designated as fundamental, all policies and procedures of the funds, including their investment objectives, may be changed at any time by the Board of Trustees without shareholder approval. The investment strategies employed by a fund may also be changed without shareholder approval.
To the extent authorized by law, Transamerica Funds and each of the funds reserve the right to discontinue offering shares at any time, to merge or liquidate a class of shares or to cease operations entirely.
Asset Allocation Funds
The asset allocation funds, Transamerica Asset Allocation – Conservative Portfolio, Transamerica Asset Allocation – Growth Portfolio, Transamerica Asset Allocation – Moderate Growth Portfolio, Transamerica Asset Allocation – Moderate Portfolio, Transamerica Multi-Manager Alternative Strategies Portfolio and Transamerica Multi-Manager International Portfolio, as well as Transamerica Asset Allocation – Conservative VP, Transamerica Asset Allocation – Growth VP, Transamerica Asset Allocation – Moderate Growth VP, Transamerica Asset Allocation – Moderate VP and Transamerica International Moderate Growth VP, each separate series of Transamerica Series Trust, may own a significant portion of the shares of a Transamerica fund. Transactions by the asset allocation funds may be disruptive to the management of an underlying Transamerica fund.
132
|
| LIST AND DESCRIPTION OF CERTAIN UNDERLYING FUNDS |
This section lists and describes the underlying funds in which some or all of the asset allocation series may invest and that are not otherwise discussed in this prospectus. This section summarizes their respective investment objectives and principal investment strategies and risks. Further information about certain underlying funds is contained in these underlying funds’ prospectuses, available at www.transamericafunds.com.
| | | | | | | | | | | | |
| Fund Name | | Transamerica Asset Allocation – Conservative Portfolio | | Transamerica Asset Allocation – Growth Portfolio | | Transamerica Asset Allocation – Moderate Growth Portfolio | | Transamerica Asset Allocation – Moderate Portfolio | | Transamerica Multi- Manager Alternative Strategies Portfolio | | Transamerica Multi- Manager International Portfolio |
| Transamerica AEGON Flexible Income | | X | | | | X | | X | | | | |
| Transamerica AEGON High Yield Bond | | X | | | | X | | X | | | | |
| Transamerica AEGON Money Market | | X | | X | | X | | X | | X | | X |
| Transamerica AEGON Short-Term Bond | | X | | | | X | | X | | | | |
| Transamerica AQR Managed Futures Strategy | | X | | X | | X | | X | | X | | |
| Transamerica BlackRock Global Allocation | | X | | X | | X | | X | | X | | X |
| Transamerica BlackRock Large Cap Value | | X | | X | | X | | X | | | | |
| Transamerica Clarion Global Real Estate Securities | | X | | X | | X | | X | | X | | X |
| Transamerica Federated Market Opportunity | | X | | X | | X | | X | | X | | X |
| Transamerica First Quadrant Global Macro | | X | | X | | X | | X | | X | | X |
| Transamerica Goldman Sachs Commodity Strategy | | X | | X | | X | | X | | X | | |
| Transamerica Hansberger International Value | | X | | X | | X | | X | | | | X |
| Transamerica Jennison Growth | | X | | X | | X | | X | | | | |
133
| | | | | | | | | | | | |
| Fund Name | | Transamerica Asset Allocation – Conservative Portfolio | | Transamerica Asset Allocation – Growth Portfolio | | Transamerica Asset Allocation – Moderate Growth Portfolio | | Transamerica Asset Allocation – Moderate Portfolio | | Transamerica Multi- Manager Alternative Strategies Portfolio | | Transamerica Multi- Manager International Portfolio |
Transamerica
JPMorgan Core Bond | | X | | | | X | | X | | X | | |
Transamerica
JPMorgan International Bond | | X | | | | X | | X | | X | | |
Transamerica
JPMorgan Long/Short Strategy | | X | | X | | X | | X | | X | | |
Transamerica
JPMorgan Mid Cap Value | | X | | X | | X | | X | | | | |
Transamerica
Loomis Sayles Bond | | X | | | | X | | X | | X | | |
Transamerica
MFS International Equity | | X | | X | | X | | X | | | | X |
Transamerica
Morgan Stanley Capital Growth | | X | | X | | X | | X | | | | |
Transamerica
Morgan Stanley Emerging Markets Debt | | X | | | | X | | X | | X | | |
Transamerica
Morgan Stanley Growth Opportunities | | X | | X | | X | | X | | | | |
Transamerica
Morgan Stanley Mid-Cap Growth | | X | | X | | X | | X | | | | |
Transamerica
Morgan Stanley Small Company Growth | | X | | X | | X | | X | | | | |
Transamerica
Multi-Managed Balanced | | X | | X | | X | | X | | | | |
Transamerica
Neuberger Berman International | | X | | X | | X | | X | | | | X |
Transamerica
Oppenheimer Developing Markets | | X | | X | | X | | X | | X | | X |
Transamerica
Oppenheimer Small- & Mid-Cap Value | | X | | X | | X | | X | | | | |
Transamerica
PIMCO Real Return TIPS | | X | | | | X | | X | | X | | |
Transamerica
PIMCO Total Return | | X | | | | X | | X | | | | |
134
| | | | | | | | | | | | |
| Fund Name | | Transamerica Asset Allocation – Conservative Portfolio | | Transamerica Asset Allocation – Growth Portfolio | | Transamerica Asset Allocation – Moderate Growth Portfolio | | Transamerica Asset Allocation – Moderate Portfolio | | Transamerica Multi- Manager Alternative Strategies Portfolio | | Transamerica Multi- Manager International Portfolio |
| Transamerica Schroders International Small Cap | | X | | X | | X | | X | | X | | X |
| Transamerica Systematic Small/Mid Cap Value | | X | | X | | X | | X | | | | |
| Transamerica Third Avenue Value | | X | | X | | X | | X | | X | | X |
| Transamerica Thornburg International Value | | X | | X | | X | | X | | X | | X |
| Transamerica TS&W International Equity | | X | | X | | X | | X | | | | X |
| Transamerica UBS Large Cap Value | | X | | X | | X | | X | | | | |
| Transamerica WMC Diversified Equity | | X | | X | | X | | X | | | | |
| Transamerica WMC Diversified Growth | | X | | X | | X | | X | | | | |
| Transamerica WMC Emerging Markets | | X | | X | | X | | X | | X | | X |
| Transamerica WMC Quality Value | | X | | X | | X | | X | | | | |
| • | | Transamerica AQR Managed Futures Strategy seeks to generate positive absolute returns by investing, under normal circumstances, primarily in a portfolio of futures contracts and futures-related instruments, which may include more than 100 global developed and emerging market exchange-traded futures, futures-related instruments and forward contracts across four major asset classes (commodities, currencies, fixed-income and equities). Generally, the fund invests in futures contracts and futures-related instruments including, but not limited to, global developed and emerging market equity index futures, global developed and emerging market currency forwards, commodity futures, swaps on commodity futures, global developed fixed-income futures, bond futures and swaps on bond futures. The fund may also gain exposure to the commodities markets by investing up to 25% of its total assets in a wholly-owned subsidiary of the fund organized as a company under the laws of the Cayman Islands (the “Subsidiary”). The Subsidiary has the same investment objective as the fund, but unlike the fund, may invest without limitation in commodities and other commodity-linked securities and derivative instruments, such as swaps and futures that provide exposure to the performance of the commodities markets. The fund’s strategy will result in frequent portfolio trading and high portfolio turnover (typically greater than 300%). The principal risks of investing in this underlying fund are: cash management and defensive investing; commodities; counterparty; credit; currency; currency hedging; derivatives; emerging markets; foreign securities; increase in expenses; interest rate; investment companies; leveraging; liquidity; market; non-diversification; portfolio selection; portfolio turnover; short sales; structured instruments; subsidiary; tax; U.S. government agency obligations; and valuation. |
| • | | Transamerica BlackRock Global Allocation seeks to provide high total investment return through a fully managed investment policy utilizing U.S. and foreign equity securities, debt, and money market securities, the combination of which may be varied from time to time both with respect to types of securities and markets. The fund will invest in issuers located in a number of countries throughout the world, and it generally seeks diversification across markets, industries and issuers as one of its strategies to reduce volatility. The fund may also gain exposure to the commodities markets by investing up to 25% of its total assets in a wholly-owned subsidiary of the fund organized as a company under the laws of the Cayman |
135
| | Islands (the “Subsidiary”). The Subsidiary has the same investment objective as the fund, but unlike the fund, may invest without limitation in commodities, commodity index-linked securities (including leveraged and unleveraged structured notes) and other commodity-linked securities and derivative instruments, such as swaps and futures that provide exposure to the performance of the commodities markets. The principal risks of investing in this underlying fund are: cash management and defensive investing, commodities; convertible securities; credit; currency; currency hedging; derivatives; distressed securities; emerging markets; fixed-income securities; foreign securities; high-yield debt securities; increase in expenses; liquidity; loans; market; portfolio selection; precious metals-related securities; preferred stock; prepayment or call; real estate securities; short sales; small- or medium-sized companies; sovereign debt; stocks; subsidiary; tax; and warrants and rights. |
| • | | Transamerica BlackRock Large Cap Value seeks long-term capital growth by investing primarily in equity securities of large cap companies. Under normal circumstances, the fund invests at least 80% of its net assets in equity securities of large cap companies that, at the time of purchase, have a market capitalization equal to or greater than the top 80% of the companies that comprise the Russell 1000® Value Index. The principal risks of investing in this underlying fund are: cash management and defensive investing; convertible securities, fixed-income securities, foreign securities; increase in expenses; liquidity; market; portfolio selection; preferred stock; stocks; value investing; and U.S. government agency obligations. |
| • | | Transamerica Clarion Global Real Estate Securities seeks long-term total return from investments primarily in equity securities of real estate companies. The fund’s portfolio will be composed of investments in issuers that are economically tied to at least three different countries, including the United States. The principal risks of investing in this underlying fund are: cash management and defensive investing; convertible securities; currency; emerging markets; fixed-income securities; foreign securities; increase in expenses; market; mortgage-related and asset-backed securities; non-diversification; portfolio selection; portfolio turnover; real estate securities; REITs; small- or medium-sized companies; and stocks. |
| • | | Transamerica Federated Market Opportunity seeks absolute (positive) returns with low correlation to the U.S. equity market by investing, under normal conditions, in domestic and foreign securities that the fund’s sub-adviser deems to be undervalued or out-of-favor. The fund may invest in exchange-traded funds (“ETFs”), derivative contracts (such as options, swaps and futures contracts) and hybrid investments (such as notes linked to underlying securities, indices or commodities), or sell securities short in order to implement its investment strategy. The fund may buy or sell foreign currencies or enter into foreign currency forwards in lieu of or in addition to non-dollar denominated fixed-income securities in order to increase or decrease its exposure to foreign interest rate and/or currency markets. When investing the fixed-income portion of the fund, the fund’s sub-adviser is not constrained by any duration or maturity range or credit quality. The principal risks of investing in this underlying fund are: cash management and defensive investing; commodities; convertible securities; country, sector or industry focus; currency; currency hedging; derivatives; emerging markets; exchange-traded funds; fixed-income securities; foreign securities; high-yield debt securities; hybrid instruments; increase in expenses; investment companies; leveraging; liquidity; market; portfolio selection; portfolio turnover; REITs; repurchase agreements; short sales; small- or medium-sized companies; stocks; tax; and value investing. |
| • | | Transamerica First Quadrant Global Macro seeks to achieve total return from investments in the global equity, fixed-income, and currency markets, independent of market direction. The fund seeks to generate returns through risk-controlled exposure, long and short, to global equity, fixed-income, and currency markets through a wide range of derivative instruments and direct investments. The fund typically will make extensive use of derivative instruments, including futures contracts on global equity and fixed-income securities and security indices, options on futures contracts and equity indices, securities and security indices, swap contracts and forward contracts. The fund may also invest directly in global equity securities (including exchange traded funds (“ETFs”) and common and preferred stock of U.S. and non-U.S. companies) and fixed-income securities (including U.S. and non-U.S. corporate bonds and debt securities guaranteed by U.S. and non-U.S. governments, their agencies or instrumentalities or supranational organizations). The principal risks of investing in this underlying fund are: active trading; cash management and defensive investing; convertible securities; country, sector or industry focus; currency; derivatives; emerging markets; fixed-income securities; foreign securities; growth stocks; high-yield debt securities; increase in expenses; leveraging; liquidity; market; non-diversification; portfolio selection; preferred stock; prepayment or call; short sales; small- or medium-sized companies; stocks; U.S. government agency obligations; and value investing. |
| • | | Transamerica Goldman Sachs Commodity Strategy seeks long-term total return by maintaining substantial economic exposure to the performance of the commodities markets. The fund invests its assets in a portfolio of commodity index-linked securities (including leveraged and unleveraged structured notes), other commodity-linked securities and derivative instruments and in other fixed-income and debt instruments. The fund may also gain exposure to the commodities markets |
136
| | by investing up to 25% of its total assets in a wholly-owned subsidiary of the fund organized as a company under the laws of the Cayman Islands (the “Subsidiary”). The Subsidiary has the same investment objective as the fund, but unlike the fund, may invest without limitation in commodities, commodity index-linked securities (including leveraged and unleveraged structured notes) and other commodity-linked securities and derivative instruments, such as swaps and futures that provide exposure to the performance of the commodities markets. It is expected that certain of the fund’s investments will produce leveraged exposure to the commodities markets. The fund will not invest 25% or more of its total assets in instruments issued by companies in one industry. The fund, directly and/or through the Subsidiary, may gain commodities exposure through the use of swaps and other derivative instruments. The fund investments in investment grade fixed-income securities, and may up to 10% of its assets in non-investment grade fixed-income securities. The fund may invest in corporate securities, U.S. government securities, mortgage-backed securities, asset-backed securities, and municipal securities. The average duration will vary. The fund may invest up to 35% of its net assets in foreign securities. The principal risks of investing in this underlying fund are: absence of regulation; cash management and defensive investing; commodities; counterparty; credit; derivatives; emerging markets; foreign securities; high-yield debt securities; increase in expenses; industry concentration; interest rate; leveraging; liquidity; market; mortgage-related and asset-backed securities; non-diversification; portfolio selection; prepayment or call; sector; structured instruments; subsidiary; tax; and U.S. government agency obligations. |
| • | | Transamerica Hansberger International Value seeks long-term growth of capital by investing primarily in a diversified portfolio of stocks (including common stock, preferred stock and convertible securities) and debt obligations of companies and governments domiciled outside the U.S. which the sub-adviser believes are undervalued. Under normal market conditions, the fund will invest more than 80% of its assets (not including the cash position of the fund) in issuers located in at least three countries other than the U.S. In selecting investments for the fund, the sub-adviser seeks to identify securities of companies that have a market value which it believes is less than the company’s intrinsic value based on its long-term potential. The sub-adviser’s portfolio investment decisions rely heavily on a fundamental analysis of securities with a long-term investment perspective. The principal risks of investing in this underlying fund are: cash management and defensive investing; convertible securities; currency; emerging markets; equity securities; fixed-income securities; foreign securities; increase in expenses; liquidity; market; portfolio selection; preferred stock; prepayment or call; small- or medium-sized companies; stocks; valuation; and value investing. |
| • | | Transamerica Jennison Growth seeks long-term growth of capital by investing at least 65% of its total assets in equity securities, principally common stocks, preferred stocks, warrants, rights and depositary receipts of U.S. companies with market capitalizations of at least $1 billion that the sub-adviser believes have above-average prospects for growth. The principal risks of investing in this underlying fund are: cash management and defensive investing; currency; foreign securities; growth stocks; increase in expenses; market; medium-sized companies; portfolio selection; preferred stock; stocks; and warrants and rights. |
| • | | Transamerica JPMorgan Core Bond seeks total return, consisting of current income and capital appreciation by investing at least 80% of its assets in U.S. government securities, medium- to high-quality corporate bonds, mortgage-backed and asset-backed securities, and commercial mortgage-backed securities. The principal risks of investing in this underlying fund are: cash management and defensive investing; credit; currency; derivatives; fixed-income securities; foreign securities; increase in expenses; interest rate; liquidity; market; mortgage-related and asset-backed securities; portfolio selection; and valuation. |
| • | | Transamerica JPMorgan International Bond seeks high total return by investing in high-quality, non-dollar denominated government and corporate debt securities of foreign issuers. The sub-adviser seeks to achieve this objective by investing at least 80% of the fund’s net assets in high-quality bonds with outstanding maturities of at least one year. The sub-adviser determines whether to buy and sell securities using a combination of fundamental research and bond currency valuation models. The principal risks of investing in this underlying fund are: cash management and defensive investing; country, sector or industry focus; currency; currency hedging; derivatives; emerging markets; fixed-income securities; foreign securities; increase in expenses; interest rate; liquidity; market; non-diversification; and portfolio selection. |
| • | | Transamerica JPMorgan Long/Short Strategy seeks to provide long-term capital appreciation by investing in long and short positions in equity securities selected from a universe of mid- to large capitalization stocks. The equity securities will have market characteristics and capitalizations similar to those included in the Russell 1000® Index and/or the Standard & Poor’s 500® Index at the time of purchase. In implementing its strategy, the fund invests primarily in common stocks, real estate investment trusts (REITs) and depositary receipts. The fund purchases securities that the sub-adviser believes are undervalued and sells short securities that the sub-adviser believes are overvalued. Selling stocks short also allows the fund to more fully exploit insights into stocks that the fund’s sub-adviser expects to underperform. The principal risks of investing in this underlying fund are: cash management and defensive investing; derivatives; foreign securities; growth |
137
| | stocks; increase in expenses; interest rate; leveraging; liquidity; market; real estate securities; REITs; short sales; stocks; structured instruments; and valuation. |
| • | | Transamerica JPMorgan Mid Cap Value seeks growth from capital appreciation by investing at least 80% of net assets, under normal circumstances, in common stocks of companies with market capitalizations of $1 billion to $20 billion at the time of purchase that the fund’s sub-adviser believes to be undervalued. The fund may also invest up to 15% of its net assets in real estate investment trusts (“REITs”). The principal risks of investing in this underlying fund are: cash management and defensive investing; convertible securities; currency; derivatives; foreign securities; increase in expenses; market; medium-sized companies; portfolio selection; preferred stock; REITs, stocks; and value investing. |
| • | | Transamerica Loomis Sayles Bond seeks high total investment return through a combination of current income and capital appreciation by investing fund assets principally in fixed-income securities. The fund normally invests at least 80% of its net assets primarily in investment-grade, fixed-income securities, although it may invest up to 35% of its assets in lower-rated fixed-income securities (“junk bonds”) and up to 20% of its assets in preferred stocks. The principal risks of investing in this underlying fund are: bank obligations; cash management and defensive investing; convertible securities; credit; currency; currency hedging; derivatives; emerging markets; fixed-income securities; foreign securities; high-yield debt securities; increase in expenses; interest rate; leveraging; liquidity; market; mortgage-related and asset-backed securities; portfolio selection; preferred stock; REITs; repurchase agreements; Rule 144A and privately placed securities; stocks; structured instruments; and valuation. |
| • | | Transamerica MFS International Equity seeks capital growth by investing primarily in common stocks and related equity securities, such as preferred stock, convertible securities and depositary receipts of issuers economically tied to a number of countries throughout the world, including emerging markets. The fund may invest a relatively large percentage of its assets in a single country, a small number of countries, or a particular geographic region. The fund may invest its assets in the stocks of companies its sub-adviser believes to have above-average earnings growth potential compared to other companies (growth companies), in the stocks of companies it believes are undervalued compared to their perceived worth (value companies), or in a combination of both. The principal risks of investing in this underlying fund are: active trading; cash management and defensive investing; convertible securities; currency; derivatives; emerging markets; foreign securities; geographic; growth stocks; increase in expenses; leveraging; liquidity; market; portfolio selection; preferred stock; small- or medium-sized companies; stocks; and value investing. |
| • | | Transamerica Morgan Stanley Emerging Markets Debt seeks high total return by investing primarily in fixed-income securities of government and government-related issuers and, to a lesser extent, of corporate issuers in emerging markets countries. Under normal circumstances, at least 80% of the fund’s net assets will be invested in debt securities of issuers located in emerging markets countries. The principal risks of investing in this underlying fund are: cash management and defensive investing; credit; currency; currency hedging; derivatives; emerging markets; fixed-income securities; foreign securities; increase in expenses; interest rate; liquidity; market; non-diversification; portfolio selection; sovereign debt; and valuation. |
| • | | Transamerica Morgan Stanley Mid-Cap Growth seeks capital appreciation by investing, under normal circumstances, at least 80% of its assets in common stocks of mid-cap companies. The fund may also invest in common stocks and other equity securities of small- and large-sized companies, as well as preferred stocks, rights and warrants and debt securities. The fund may invest up to 25% of its assets in securities of foreign companies, including emerging market securities and up to 10% of its assets in REITs. The principal risks of investing in this underlying fund are: cash management and defensive investing; convertible securities; currency; derivatives; emerging markets; fixed-income securities; foreign securities; growth stocks; increase in expenses; investing aggressively; IPOs; market; portfolio selection; preferred stock; REITs; Rule 144A and privately placed securities; small- or medium-sized companies; stocks; value investing; and warrants and rights. |
| • | | Transamerica Morgan Stanley Small Company Growth seeks long-term capital appreciation by investing primarily in growth-oriented equity securities of small capitalization companies. Under normal circumstances, at least 80% of the fund’s net assets will be invested in such securities. The fund may invest up to 25% of its assets in securities of foreign companies, including emerging market securities. The principal risks of investing in this underlying fund are: cash management and defensive investing; convertible securities; currency; derivatives; emerging markets; fixed-income securities; foreign securities; growth stocks; increase in expenses; IPOs; market; portfolio selection; REITs; Rule 144A and privately placed securities; smaller companies; and stocks. |
| • | | Transamerica Neuberger Berman International seeks long-term growth of capital by investing primarily in common stocks of foreign companies of any size, including companies in developed and emerging industrialized markets. The fund’s sub-adviser looks for well-managed and profitable companies that show growth potential and whose stock prices are undervalued. The principal risks of investing in this underlying fund are: cash management and defensive investing; |
138
| | country, sector or industry focus; currency; currency hedging; derivatives; emerging markets; foreign securities; growth stocks; increase in expenses; leveraging; liquidity; market; portfolio selection; small- or medium-sized companies; stocks; and value investing. |
| • | | Transamerica Oppenheimer Developing Markets aggressively seeks capital appreciation by investing, under normal circumstances, at least 80% of its net assets in equity securities of issuers that are economically tied to one or more emerging markets countries. In selecting securities, the fund’s sub-adviser looks primarily for foreign companies in developing markets with high growth potential. The principal risks of investing in this underlying fund are: cash management and defensive investing; convertible securities; country, sector or industry focus; currency; currency hedging; derivatives; emerging markets; fixed-income securities; foreign securities; growth stocks; increase in expenses; liquidity; market; portfolio selection; portfolio turnover; preferred stock; small- or medium-sized companies; stocks; and warrants and rights. |
| • | | Transamerica Oppenheimer Small- & Mid-Cap Value seeks capital appreciation by investing, under normal circumstances, 80% of its net assets in equity securities of small-cap and mid-cap domestic and foreign issuers. The fund’s sub-adviser uses a value approach to investing by searching for securities it believes to be undervalued in the marketplace. The principal risks of investing in this underlying fund are: cash management and defensive investing; convertible securities; currency; currency hedging; derivatives; fixed-income securities; foreign securities; increase in expenses; liquidity; market; portfolio selection; portfolio turnover; preferred stock; small- or medium-sized companies; stocks; and value investing. |
| • | | Transamerica PIMCO Real Return TIPS seeks maximum real return, consistent with preservation of real capital and prudent investment management by investing principally in Treasury Inflation-Protected Securities (or “TIPS”). The fund’s sub-adviser invests, under normal circumstances, at least 80% of the fund’s net assets in TIPS of varying maturities. The principal risks of investing in this underlying fund are: cash management and defensive investing; CPIU measurement; credit; currency; currency hedging; derivatives; emerging markets; fixed-income securities; foreign securities; high-yield debt securities; increase in expenses; interest rate; leveraging; liquidity; market; mortgage-related and asset-backed securities; non-diversification; portfolio selection; portfolio turnover; preferred stock; prepayment or call; repurchase agreements; Rule 144A and privately placed securities; sovereign debt; stocks; U.S. government agency obligations; and valuation. |
| • | | Transamerica PIMCO Total Return seeks maximum total return consistent with preservation of capital and prudent investment management by investing principally in fixed-income securities of varying maturities. The fund may invest all of its assets in derivative instruments, such as options, futures contracts or swap agreements, or in mortgage- or asset-backed securities. The fund may engage in short sales. The principal risks of investing in this underlying fund are: cash management and defensive investing; credit; currency; currency hedging; derivatives, emerging markets; fixed-income securities; foreign securities; high-yield debt securities; increase in expenses; interest rate; leveraging; liquidity; market; mortgage-related and asset-backed securities; portfolio selection; preferred stock; prepayment or call; repurchase agreements; Rule 144A securities and privately placed; short sales; sovereign debt; stocks; U.S. government agency obligations; and valuation. |
| • | | Transamerica Schroders International Small Cap seeks to provide long-term capital appreciation by investing primarily in small-capitalization companies (generally those with market capitalizations, based on the number of shares readily available in the market, of $4 billion or less at the time of investment) that it believes offer the potential for capital appreciation. The fund primarily invests in equity securities of small-cap companies located outside the United States. The fund’s sub-adviser employs a fundamental investment approach that considers macroeconomic factors while focusing primarily on company-specific factors. The sub-adviser generally sells a security when its market price approaches the sub-adviser’s estimate of fair value or when the sub-adviser identifies a significantly more attractive investment candidate. The fund generally emphasizes developed markets in Europe and the Pacific, with a limited allocation to emerging markets. The fund may invest in preferred stocks and closed-end investment companies that invest primarily in foreign securities. The fund may also invest in convertible securities and warrants. The fund may invest, to a limited extent, in derivatives. The principal risks of investing in this underlying fund are: cash management and defensive investing; convertible securities; country/regional; currency; derivatives; emerging markets; foreign securities; growth stocks; increase in expenses; investment companies; investment style; liquidity; market; portfolio selection; preferred stock; smaller companies; stocks; and warrants and rights. |
| • | | Transamerica Third Avenue Value seeks long-term capital appreciation by investing, under normal circumstances, at least 80% of its assets in common stocks of U.S. and non-U.S. issuers. The fund invests in companies regardless of market capitalization, with the mix of its investments at any time depending on the industries and types of securities its sub-adviser believes represent the best values consistent with the fund’s strategies and restrictions. The principal risks of investing in |
139
| | this underlying fund are: cash management and defensive investing; currency; emerging markets; fixed-income securities; foreign securities; high-yield debt securities; increase in expenses; market; non-diversification; portfolio selection; small- or medium-sized companies; stocks; and value investing. |
| • | | Transamerica Thornburg International Value seeks to provide long-term capital appreciation by investing, under normal circumstances, at least 75% of its assets in foreign securities or depositary receipts of issuers that are located in a number of countries throughout the world. The fund may invest in emerging markets. The fund may invest in companies of any size, but invests primarily in the large and middle range of public company market capitalizations. The principal risks of investing in this underlying fund are: cash management and defensive investing; currency; currency hedging; derivatives; emerging markets; fixed-income securities; foreign securities; high-yield debt securities; increase in expenses; market; portfolio selection; small- or medium-sized companies; stocks; and value investing. |
| • | | Transamerica UBS Large Cap Value seeks to maximize total return, consisting of capital appreciation and current income by investing, under normal circumstances, at least 80% of its net assets in equity securities of U.S. large capitalization companies. In selecting securities, the fund’s sub-adviser focuses on, among other things, identifying discrepancies between a security’s fundamental value and its market price. The principal risks of investing in this underlying fund are: cash management and defensive investing; convertible securities; derivatives; foreign securities; increase in expenses; investment companies; market; portfolio selection; preferred stock; stocks; value investing; and warrants and rights. |
| • | | Transamerica WMC Emerging Markets seeks long-term capital appreciation by investing, under normal circumstances, at least 80% of its assets in equity securities of companies that conduct their principal business activities in emerging markets, are organized under the laws of or maintain their principal place of business in emerging markets, or whose securities are traded principally on exchanges in emerging markets. The fund’s sub-adviser considers emerging markets to be markets with rapidly growing economies. The principal risks of investing in this underlying fund are: cash management and defensive investing; convertible securities; country, sector or industry focus; currency; currency hedging; derivatives; emerging markets; fixed-income securities; foreign securities; growth stocks; increase in expenses; IPOs; liquidity; market; portfolio selection; portfolio turnover; preferred stock; small- or medium-sized companies; stocks; and warrants and rights. |
The funds may invest their assets in cash, cash equivalent securities or short-term debt securities, repurchase agreements and money market instruments. Under adverse or unstable market, economic or political conditions, the funds may do so without limit. Although the underlying funds will do this only in seeking to avoid losses, the underlying funds may be unable to pursue their investment objective during that time, and it could reduce the benefit from any upswing in the market. To the extent that the funds have any uninvested cash, the funds would also be subject to risk with respect to the depository institution holding the cash.
140
FINANCIAL HIGHLIGHTS
The Financial Highlights table is intended to help you understand a fund’s performance for the past five years or since its inception if less than five years. Certain information reflects financial results for a single fund share. The total returns in the table represent the rate an investor would have earned (or lost) on an investment in the fund for the period shown, assuming reinvestment of all dividends and distributions. Information subsequent to October 31, 2009 has been derived from financial statements audited by Ernst & Young LLP, an Independent Registered Public Accounting firm, whose report, along with the fund’s financial statements, is included in the October 31, 2010 Annual Report, which is available to you upon request.
The Financial Highlights information on and prior to October 31, 2009 has been derived from financial statements audited by PricewaterhouseCoopers, LLP, an Independent Registered Certified Public Accounting firm, whose report, along with the fund’s financial statements, is included in the previous October 31st ended Annual Reports, which are available upon request.
Information is not shown for Transamerica WMC Quality Value as that fund had not commenced operations as of October 31, 2010.
| | | | | | | | | | | | | | | | | | | | |
| For a share outstanding throughout each period | | Transamerica AEGON High Yield Bond(a) | |
| | | Class A | |
| | | October 31, 2010 | | | October 31, 2009 | | | October 31, 2008 | | | October 31, 2007 | | | October 31, 2006 | |
Net asset value | | | | | | | | | | | | | | | | | | | | |
Beginning of period/year | | | $8.45 | | | | $6.31 | | | | $9.12 | | | | $9.19 | | | | $8.97 | |
Investment operations | | | | | | | | | | | | | | | | | | | | |
Net investment income(b) | | | 0.66 | | | | 0.65 | | | | 0.64 | | | | 0.60 | | | | 0.61 | |
Net realized and unrealized gain (loss) on investments | | | 0.73 | | | | 2.14 | | | | (2.83) | | | | (0.07) | | | | 0.19 | |
Total from investment operations | | | 1.39 | | | | 2.79 | | | | (2.19) | | | | 0.53 | | | | 0.80 | |
Distributions | | | | | | | | | | | | | | | | | | | | |
Net investment income | | | (0.68) | | | | (0.66) | | | | (0.62) | | | | (0.60) | | | | (0.58) | |
Total distributions | | | (0.68) | | | | (0.66) | | | | (0.62) | | | | (0.60) | | | | (0.58) | |
Net asset value | | | | | | | | | | | | | | | | | | | | |
End of year | | | $9.16 | | | | $8.45 | | | | $6.31 | | | | $9.12 | | | | $9.19 | |
Total return(c) | | | 17.21% | | | | 47.58% | | | | (25.46% | ) | | | 5.90% | | | | 9.27% | |
Net assets end of year (000’s) | | $ | 193,332 | | | $ | 67,290 | | | $ | 24,506 | | | $ | 35,147 | | | $ | 43,514 | |
Ratio and supplemental data | | | | | | | | | | | | | | | | | | | | |
Expenses to average net assets | | | | | | | | | | | | | | | | | | | | |
After reimbursement/fee waiver | | | 1.15% | | | | 1.19% | | | | 1.16% | | | | 1.15% | | | | 1.16% | |
Before reimbursement/fee waiver | | | 1.15% | | | | 1.19% | | | | 1.16% | | | | 1.15% | | | | 1.16% | |
Net investment income, to average net assets(d) | | | 7.52% | | | | 9.08% | | | | 7.65% | | | | 6.45% | | | | 6.77% | |
Portfolio turnover rate | | | 91% | | | | 58% | | | | 38% | | | | 80% | | | | 73% | |
141
| | | | | | | | | | | | | | | | | | | | |
| For a share outstanding throughout each period | | Transamerica AEGON High Yield Bond(a) | |
| | | Class B | |
| | | October 31, 2010 | | | October 31, 2009 | | | October 31, 2008 | | | October 31, 2007 | | | October 31, 2006 | |
Net asset value | | | | | | | | | | | | | | | | | | | | |
Beginning of period/year | | | $8.44 | | | | $6.30 | | | | $9.11 | | | | $9.18 | | | | $8.97 | |
Investment operations | | | | | | | | | | | | | | | | | | | | |
Net investment income(b) | | | 0.61 | | | | 0.60 | | | | 0.58 | | | | 0.53 | | | | 0.55 | |
Net realized and unrealized gain (loss) on investments | | | 0.72 | | | | 2.15 | | | | (2.83) | | | | (0.06) | | | | 0.19 | |
Total from investment operations | | | 1.33 | | | | 2.75 | | | | (2.25) | | | | 0.47 | | | | 0.74 | |
Distributions | | | | | | | | | | | | | | | | | | | | |
Net investment income | | | (0.62) | | | | (0.61) | | | | (0.56) | | | | (0.54) | | | | (0.53) | |
Total distributions | | | (0.62) | | | | (0.61) | | | | (0.56) | | | | (0.54) | | | | (0.53) | |
Net asset value | | | | | | | | | | | | | | | | | | | | |
End of year | | | $9.15 | | | | $8.44 | | | | $6.30 | | | | $9.11 | | | | $9.18 | |
Total return(c) | | | 16.38% | | | | 46.69% | | | | (26.04%) | | | | 5.19% | | | | 8.53% | |
Net assets end of year (000’s) | | $ | 13,887 | | | $ | 11,898 | | | $ | 9,091 | | | $ | 21,370 | | | $ | 27,753 | |
Ratio and supplemental data | | | | | | | | | | | | | | | | | | | | |
Expenses to average net assets | | | | | | | | | | | | | | | | | | | | |
After reimbursement/fee waiver | | | 1.83% | | | | 1.91% | | | | 1.85% | | | | 1.83% | | | | 1.83% | |
Before reimbursement/fee waiver | | | 1.83% | | | | 1.91% | | | | 1.85% | | | | 1.83% | | | | 1.83% | |
Net investment income, to average net assets(d) | | | 6.93% | | | | 8.56% | | | | 6.83% | | | | 5.77% | | | | 6.12% | |
Portfolio turnover rate | | | 91% | | | | 58% | | | | 38% | | | | 80% | | | | 73% | |
| | | | | | | | | | | | | | | | | | | | | | | | |
| For a share outstanding throughout each period | | | | | Transamerica AEGON High Yield Bond(a) | | | | |
| | | Class C | | | Class I | |
| | | October 31, 2010 | | | October 31, 2009 | | | October 31, 2008 | | | October 31, 2007 | | | October 31, 2006 | | | October 31, 2010 (e) | |
Net asset value | | | | | | | | | | | | | | | | | | | | | | | | |
Beginning of period/year | | | $8.42 | | | | $6.30 | | | | $9.10 | | | | $9.17 | | | | $8.96 | | | | $8.55 | |
Investment operations | | | | | | | | | | | | | | | | | | | | | | | | |
Net investment income(b) | | | 0.61 | | | | 0.60 | | | | 0.58 | | | | 0.53 | | | | 0.55 | | | | 0.63 | |
Net realized and unrealized gain (loss) on investments | | | 0.73 | | | | 2.14 | | | | (2.82) | | | | (0.06) | | | | 0.19 | | | | 0.68 | |
Total from investment operations | | | 1.34 | | | | 2.74 | | | | (2.24) | | | | 0.47 | | | | 0.74 | | | | 1.31 | |
Distributions | | | | | | | | | | | | | | | | | | | | | | | | |
Net investment income | | | (0.63) | | | | (0.62) | | | | (0.56) | | | | (0.54) | | | | (0.53) | | | | (0.66) | |
Total distributions | | | (0.63) | | | | (0.62) | | | | (0.56) | | | | (0.54) | | | | (0.53) | | | | (0.66) | |
Net asset value | | | | | | | | | | | | | | | | | | | | | | | | |
End of year | | | $9.13 | | | | $8.42 | | | | $6.30 | | | | $9.10 | | | | $9.17 | | | | $9.20 | |
Total return(c) | | | 16.54% | | | | 46.63% | | | | (25.89%) | | | | 5.21% | | | | 8.54% | | | | 15.92% | (f) |
Net assets end of year (000’s) | | $ | 41,810 | | | $ | 19,548 | | | $ | 5,429 | | | $ | 10,160 | | | $ | 11,317 | | | $ | 27,057 | |
Ratio and supplemental data | | | | | | | | | | | | | | | | | | | | | | | | |
Expenses to average net assets | | | | | | | | | | | | | | | | | | | | | | | | |
After reimbursement/fee waiver | | | 1.77% | | | | 1.81% | | | | 1.80% | | | | 1.83% | | | | 1.83% | | | | 0.83% | (g) |
Before reimbursement/fee waiver | | | 1.77% | | | | 1.81% | | | | 1.80% | | | | 1.83% | | | | 1.83% | | | | 0.83% | (g) |
Net investment income, to average net assets(d) | | | 6.96% | | | | 8.23% | | | | 6.93% | | | | 5.77% | | | | 6.12% | | | | 7.71% | (g) |
Portfolio turnover rate | | | 91% | | | | 58% | | | | 38% | | | | 80% | | | | 73% | | | | 91% | (f) |
142
| | | | | | | | | | | | | | | | | | | | |
| For a share outstanding throughout each period | | Transamerica Asset Allocation - Conservative Portfolio | |
| | | Class A | |
| | | October 31, 2010 | | | October 31, 2009 | | | October 31, 2008 | | | October 31, 2007 | | | October 31, 2006 | |
Net asset value | | | | | | | | | | | | | | | | | | | | |
Beginning of year | | | $10.42 | | | | $8.99 | | | | $12.40 | | | | $11.76 | | | | $11.35 | |
Investment operations | | | | | | | | | | | | | | | | | | | | |
From net investment income (b),(h) | | | 0.35 | | | | 0.40 | | | | 0.36 | | | | 0.38 | | | | 0.28 | |
From net realized and unrealized gain (loss) on affiliated investments | | | 0.83 | | | | 1.46 | | | | (3.21) | | | | 0.82 | | | | 0.80 | |
Total from investment operations | | | 1.18 | | | | 1.86 | | | | (2.85) | | | | 1.20 | | | | 1.08 | |
Distributions | | | | | | | | | | | | | | | | | | | | |
Net investment income | | | (0.38) | | | | (0.43) | | | | (0.32) | | | | (0.24) | | | | (0.35) | |
Net realized gains on affiliated investments | | | – | | | | – | | | | (0.24) | | | | (0.32) | | | | (0.32) | |
Total distributions | | | (0.38) | | | | (0.43) | | | | (0.56) | | | | (0.56) | | | | (0.67) | |
Net asset value | | | | | | | | | | | | | | | | | | | | |
End of year | | | $11.22 | | | | $10.42 | | | | $8.99 | | | | $12.40 | | | | $11.76 | |
Total return(c) | | | 11.59% | | | | 21.76% | | | | (23.86%) | | | | 12.06% | | | | 9.90% | |
Net assets end of year (000’s) | | | $ 485,473 | | | $ | 360,558 | | | $ | 268,516 | | | $ | 242,342 | | | | $ 165,071 | |
Ratio and supplemental data | | | | | | | | | | | | | | | | | | | | |
Expenses to average net assets:(i) | | | | | | | | | | | | | | | | | | | | |
After reimbursement/fee waiver | | | 0.63% | | | | 0.65% | | | | 0.62% | | | | 0.62% | | | | 0.60% | |
Before reimbursement/fee waiver | | | 0.63% | | | | 0.65% | | | | 0.62% | | | | 0.62% | | | | 0.60% | |
Net investment income, to average net assets(h),(n) | | | 3.28% | | | | 4.27% | | | | 3.22% | | | | 3.18% | | | | 2.44% | |
Portfolio turnover rate(o) | | | 16% | | | | 27% | | | | 10% | | | | 32% | | | | 29% | |
| | | | | | | | | | | | | | | | | | | | |
| For a share outstanding throughout each period | | Transamerica Asset Allocation - Conservative Portfolio | |
| | | Class B | |
| | | October 31,
2010 | | | October 31,
2009 | | | October 31,
2008 | | | October 31,
2007 | | | October 31,
2006 | |
Net asset value | | | | | | | | | | | | | | | | | | | | |
Beginning of year | | | $10.38 | | | | $8.97 | | | | $12.36 | | | | $11.73 | | | | $11.32 | |
Investment operations | | | | | | | | | | | | | | | | | | | | |
From net investment income(b),(h) | | | 0.30 | | | | 0.35 | | | | 0.31 | | | | 0.30 | | | | 0.20 | |
From net realized and unrealized gain (loss) on affiliated investments | | | 0.80 | | | | 1.45 | | | | (3.22) | | | | 0.86 | | | | 0.81 | |
Total from investment operations | | | 1.10 | | | | 1.80 | | | | (2.91) | | | | 1.16 | | | | 1.01 | |
Distributions | | | | | | | | | | | | | | | | | | | | |
Net investment income | | | (0.31) | | | | (0.39) | | | | (0.24) | | | | (0.21) | | | | (0.28) | |
Net realized gains on affiliated investments | | | – | | | | – | | | | (0.24) | | | | (0.32) | | | | (0.32) | |
Total distributions | | | (0.31) | | | | (0.39) | | | | (0.48) | | | | (0.53) | | | | (0.60) | |
Net asset value | | | | | | | | | | | | | | | | | | | | |
End of year | | | $11.17 | | | | $10.38 | | | | $8.97 | | | | $12.36 | | | | $11.73 | |
Total return(c) | | | 10.82% | | | | 21.01% | | | | (24.36%) | | | | 11.34% | | | | 9.19% | |
Net assets end of year (000’s) | | $ | 114,303 | | | $ | 111,706 | | | $ | 93,268 | | | $ | 116,569 | | | $ | 110,701 | |
Ratio and supplemental data | | | | | | | | | | | | | | | | | | | | |
Expenses to average net assets:(i) | | | | | | | | | | | | | | | | | | | | |
After reimbursement/fee waiver | | | 1.26% | | | | 1.28% | | | | 1.24% | | | | 1.25% | | | | 1.26% | |
Before reimbursement/fee waiver | | | 1.26% | | | | 1.28% | | | | 1.24% | | | | 1.25% | | | | 1.26% | |
Net investment income, to average net assets(h),(n) | | | 2.81% | | | | 3.71% | | | | 2.72% | | | | 2.59% | | | | 1.78% | |
Portfolio turnover rate(o) | | | 16% | | | | 27% | | | | 10% | | | | 32% | | | | 29% | |
143
| | | | | | | | | | | | | | | | | | | | |
| For a share outstanding throughout each period | | Transamerica Asset Allocation - Conservative Portfolio | |
| | | Class C | |
| | | October 31, 2010 | | | October 31, 2009 | | | October 31, 2008 | | | October 31, 2007 | | | October 31, 2006 | |
Net asset value | | | | | | | | | | | | | | | | | | | | |
Beginning of year | | | $10.37 | | | | $8.96 | | | | $12.35 | | | | $11.73 | | | | $11.32 | |
Investment operations | | | | | | | | | | | | | | | | | | | | |
From net investment income(b),(h) | | | 0.29 | | | | 0.34 | | | | 0.29 | | | | 0.30 | | | | 0.21 | |
From net realized and unrealized gain (loss) on affiliated investments | | | 0.82 | | | | 1.46 | | | | (3.19) | | | | 0.86 | | | | 0.80 | |
Total from investment operations | | | 1.11 | | | | 1.80 | | | | (2.90) | | | | 1.16 | | | | 1.01 | |
Distributions | | | | | | | | | | | | | | | | | | | | |
Net investment income | | | (0.32) | | | | (0.39) | | | | (0.25) | | | | (0.22) | | | | (0.28) | |
Net realized gains on affiliated investments | | | – | | | | – | | | | (0.24) | | | | (0.32) | | | | (0.32) | |
Total distributions | | | (0.32) | | | | (0.39) | | | | (0.49) | | | | (0.54) | | | | (0.60) | |
Net asset value | | | | | | | | | | | | | | | | | | | | |
End of year | | | $11.16 | | | | $10.37 | | | | $8.96 | | | | $12.35 | | | | $11.73 | |
Total return(c) | | | 10.92% | | | | 21.09% | | | | (24.30%) | | | | 11.31% | | | | 9.25% | |
Net assets end of year (000’s) | | $ | 601,625 | | | $ | 488,315 | | | $ | 364,153 | | | $ | 336,981 | | | $ | 257,675 | |
Ratio and supplemental data | | | | | | | | | | | | | | | | | | | | |
Expenses to average net assets:(i) | | | | | | | | | | | | | | | | | | | | |
After reimbursement/fee waiver | | | 1.22% | | | | 1.23% | | | | 1.22% | | | | 1.22% | | | | 1.23% | |
Before reimbursement/fee waiver | | | 1.22% | | | | 1.23% | | | | 1.22% | | | | 1.22% | | | | 1.23% | |
Net investment income, to average net assets(h),(n) | | | 2.75% | | | | 3.69% | | | | 2.61% | | | | 2.60% | | | | 1.82% | |
Portfolio turnover rate(o) | | | 16% | | | | 27% | | | | 10% | | | | 32% | | | | 29% | |
| | | | | | | | | | | | | | | | | | | | |
| | | | | | |
| | |
| For a share outstanding throughout each period | | | | Transamerica Asset Allocation - Conservative Portfolio | |
| | | | Class I | |
| | | | October 31, 2010 (e) | |
| | |
Net asset value | | | | | | |
Beginning of period | | | | | $10.69 | |
Investment operations | | | | | | |
From net investment income(b),(h) | | | | | 0.22 | |
From net realized and unrealized gain on affiliated investments | | | | | 0.75 | |
Total from investment operations | | | | | 0.97 | |
Distributions | | | | | | |
Net investment income | | | | | (0.42) | |
Net asset value | | | | | | |
End of year | | | | | $11.24 | |
Total return(c) | | | | | 9.39% | (f) |
Net assets end of year (000’s) | | | | $ | 10,813 | |
Ratio and supplemental data | | | | | | |
Expenses to average net assets:(i) | | | | | | |
After reimbursement/fee waiver | | | | | 0.28% | (g) |
Before reimbursement/fee waiver | | | | | 0.28% | (g) |
Net investment income, to average net assets(h) | | | | | 2.24% | (g) |
Portfolio turnover rate(o) | | | | | 16% | (f) |
144
| | | | | | | | | | | | | | | | | | | | |
| For a share outstanding throughout each period | | Transamerica Asset Allocation - Conservative Portfolio | |
| | | Class R | |
| | | October 31,
2010 | | | October 31,
2009 | | | October 31,
2008 | | | October 31,
2007 | | | October 31,
2006 (v) | |
Net asset value | | | | | | | | | | | | | | | | | | | | |
Beginning of period/year | | | $10.49 | | | | $9.05 | | | | $12.47 | | | | $11.84 | | | | $11.30 | |
Investment operations | | | | | | | | | | | | | | | | | | | | |
From net investment income(b),(h) | | | 0.27 | | | | 0.37 | | | | 0.35 | | | | 0.33 | | | | 0.13 | |
From net realized and unrealized gain (loss) on affiliated investments | | | 0.88 | | | | 1.49 | | | | (3.23) | | | | 0.85 | | | | 0.47 | |
Total from investment operations | | | 1.15 | | | | 1.86 | | | | (2.88) | | | | 1.18 | | | | 0.60 | |
Distributions | | | | | | | | | | | | | | | | | | | | |
Net investment income | | | (0.35) | | | | (0.42) | | | | (0.30) | | | | (0.23) | | | | (0.06) | |
Net realized gains on affiliated investments | | | – | | | | – | | | | (0.24) | | | | (0.32) | | | | – | |
Total distributions | | | (0.35) | | | | (0.42) | | | | (0.54) | | | | (0.55) | | | | (0.06) | |
Net asset value | | | | | | | | | | | | | | | | | | | | |
End of year | | | $11.29 | | | | $10.49 | | | | $9.05 | | | | $12.47 | | | | $11.84 | |
Total return(c) | | | 11.23% | | | | 21.59% | | | | (23.98%) | | | | 11.89% | | | | 5.35% | (f) |
Net assets end of year (000’s) | | $ | 3,061 | | | $ | 1,509 | | | $ | 1,089 | | | $ | 645 | | | $ | 53 | |
Ratio and supplemental data | | | | | | | | | | | | | | | | | | | | |
Expenses to average net assets:(i) | | | | | | | | | | | | | | | | | | | | |
After reimbursement/fee waiver | | | 0.88% | | | | 0.89% | | | | 0.82% | | | | 0.86% | | | | 0.66% | (g) |
Before reimbursement/fee waiver | | | 0.88% | | | | 0.89% | | | | 0.82% | | | | 0.86% | | | | 0.66% | (g) |
Net investment income, to average net assets(h),(n) | | | 2.56% | | | | 3.97% | | | | 3.14% | | | | 2.71% | | | | 3.03% | (g) |
Portfolio turnover rate(o) | | | 16% | | | | 27% | | | | 10% | | | | 32% | | | | 29% | (f) |
| | | | | |
| | | | | | | | | | | | | | | | | | | | |
| For a share outstanding throughout each period | | Transamerica Asset Allocation - Growth Portfolio | |
| | | Class A | |
| | | October 31,
2010 | | | October 31,
2009 | | | October 31,
2008 | | | October 31,
2007 | | | October 31,
2006 | |
Net asset value | | | | | | | | | | | | | | | | | | | | |
Beginning of year | | | $9.92 | | | | $8.87 | | | | $15.46 | | | | $13.44 | | | | $11.99 | |
Investment operations | | | | | | | | | | | | | | | | | | | | |
From net investment income(b),(h) | | | 0.05 | | | | 0.12 | | | | 0.15 | | | | 0.23 | | | | 0.03 | |
From net realized and unrealized gain (loss) on affiliated investments | | | 1.48 | | | | 1.12 | | | | (6.29) | | | | 2.53 | | | | 1.89 | |
Total from investment operations | | | 1.53 | | | | 1.24 | | | | (6.14) | | | | 2.76 | | | | 1.92 | |
Distributions | | | | | | | | | | | | | | | | | | | | |
Net investment income | | | (0.09) | | | | (0.19) | | | | (0.02) | | | | (0.29) | | | | (0.11) | |
Net realized gains on affiliated investments | | | – | | | | – | | | | (0.43) | | | | (0.45) | | | | (0.36) | |
Total distributions | | | (0.09) | | | | (0.19) | | | | (0.45) | | | | (0.74) | | | | (0.47) | |
Net asset value | | | | | | | | | | | | | | | | | | | | |
End of year | | | $11.36 | | | | $9.92 | | | | $8.87 | | | | $15.46 | | | | $13.44 | |
Total return(c) | | | 15.55% | | | | 14.46% | | | | (40.75%) | | | | 21.35% | | | | 16.38% | |
Net assets end of year (000’s) | | $ | 645,459 | | | $ | 574,500 | | | $ | 495,257 | | | $ | 781,872 | | | $ | 502,488 | |
Ratio and supplemental data | | | | | | | | | | | | | | | | | | | | |
Expenses to average net assets:(i) | | | | | | | | | | | | | | | | | | | | |
After reimbursement/fee waiver | | | 0.68% | | | | 0.73% | | | | 0.65% | | | | 0.64% | | | | 0.65% | |
Before reimbursement/fee waiver | | | 0.68% | | | | 0.73% | | | | 0.65% | | | | 0.64% | | | | 0.65% | |
Net investment income, to average net assets(h),(n) | | | 0.45% | | | | 1.41% | | | | 1.20% | | | | 1.62% | | | | 0.22% | |
Portfolio turnover rate(o) | | | 10% | | | | 47% | | | | 12% | | | | 18% | | | | 22% | |
145
| | | | | | | | | | | | | | | | | | | | |
| For a share outstanding throughout each period | | Transamerica Asset Allocation - Growth Portfolio | |
| | | Class B | |
| | | October 31, 2010 | | | October 31, 2009 | | | October 31, 2008 | | | October 31, 2007 | | | October 31, 2006 | |
Net asset value | | | | | | | | | | | | | | | | | | | | |
Beginning of year | | | $9.70 | | | | $8.63 | | | | $15.13 | | | | $13.17 | | | | $11.77 | |
Investment operations | | | | | | | | | | | | | | | | | | | | |
From net investment income (loss)(b),(h) | | | (0.02) | | | | 0.07 | | | | 0.08 | | | | 0.14 | | | | (0.05) | |
From net realized and unrealized gain (loss) on affiliated investments | | | 1.44 | | | | 1.10 | | | | (6.15) | | | | 2.47 | | | | 1.85 | |
Total from investment operations | | | 1.42 | | | | 1.17 | | | | (6.07) | | | | 2.61 | | | | 1.80 | |
Distributions | | | | | | | | | | | | | | | | | | | | |
Net investment income | | | (0.03) | | | | (0.10) | | | | – | | | | (0.20) | | | | (0.04) | |
Net realized gains on affiliated investments | | | – | | | | – | | | | (0.43) | | | | (0.45) | | | | (0.36) | |
Total distributions | | | (0.03) | | | | (0.10) | | | | (0.43) | | | | (0.65) | | | | (0.40) | |
Net asset value | | | | | | | | | | | | | | | | | | | | |
End of year | | | $11.09 | | | | $9.70 | | | | $8.63 | | | | $15.13 | | | | $13.17 | |
Total return(c) | | | 14.65% | | | | 13.78% | | | | (41.15%) | | | | 20.54% | | | | 15.57% | |
Net assets end of year (000’s) | | $ | 184,263 | | | $ | 192,054 | | | $ | 196,817 | | | $ | 368,186 | | | $ | 288,719 | |
Ratio and supplemental data | | | | | | | | | | | | | | | | | | | | |
Expenses to average net assets:(i) | | | | | | | | | | | | | | | | | | | | |
After reimbursement/fee waiver | | | 1.35% | | | | 1.40% | | | | 1.30% | | | | 1.29% | | | | 1.31% | |
Before reimbursement/fee waiver | | | 1.35% | | | | 1.40% | | | | 1.30% | | | | 1.29% | | | | 1.31% | |
Net investment income (loss), to average net assets(h),(n) | | | (0.18%) | | | | 0.84% | | | | 0.67% | | | | 1.02% | | | | (0.42%) | |
Portfolio turnover rate(o) | | | 10% | | | | 47% | | | | 12% | | | | 18% | | | | 22% | |
| | | | | | | | | | | | | | | | | | | | |
| For a share outstanding throughout each period | | Transamerica Asset Allocation - Growth Portfolio | |
| | | Class C | |
| | | October 31,
2010 | | | October 31, 2009 | | | October 31, 2008 | | | October 31, 2007 | | | October 31, 2006 | |
Net asset value | | | | | | | | | | | | | | | | | | | | |
Beginning of year | | | $9.69 | | | | $8.64 | | | | $15.13 | | | | $13.18 | | | | $11.78 | |
Investment operations | | | | | | | | | | | | | | | | | | | | |
From net investment income (loss)(b),(h) | | | (0.01) | | | | 0.08 | | | | 0.08 | | | | 0.14 | | | | (0.05) | |
From net realized and unrealized gain (loss) on affiliated investments | | | 1.45 | | | | 1.08 | | | | (6.14) | | | | 2.48 | | | | 1.85 | |
Total from investment operations | | | 1.44 | | | | 1.16 | | | | (6.06) | | | | 2.62 | | | | 1.80 | |
Distributions | | | | | | | | | | | | | | | | | | | | |
Net investment income | | | (0.04) | | | | (0.11) | | | | – | | | | (0.22) | | | | (0.04) | |
Net realized gains on affiliated investments | | | – | | | | – | | | | (0.43) | | | | (0.45) | | | | (0.36) | |
Total distributions | | | (0.04) | | | | (0.11) | | | | (0.43) | | | | (0.67) | | | | (0.40) | |
Net asset value | | | | | | | | | | | | | | | | | | | | |
End of year | | | $11.09 | | | | $9.69 | | | | $8.64 | | | | $15.13 | | | | $13.18 | |
Total return(c) | | | 14.86% | | | | 13.72% | | | | (41.08%) | | | | 20.60% | | | | 15.61% | |
Net assets end of year (000’s) | | $ | 774,914 | | | $ | 763,086 | | | $ | 751,881 | | | $ | 1,270,635 | | | $ | 876,768 | |
Ratio and supplemental data | | | | | | | | | | | | | | | | | | | | |
Expenses to average net assets:(i) | | | | | | | | | | | | | | | | | | | | |
After reimbursement/fee waiver | | | 1.29% | | | | 1.33% | | | | 1.26% | | | | 1.25% | | | | 1.26% | |
Before reimbursement/fee waiver | | | 1.29% | | | | 1.33% | | | | 1.26% | | | | 1.25% | | | | 1.26% | |
Net investment income (loss), to average net assets(h),(n) | | | (0.12%) | | | | 0.90% | | | | 0.62% | | | | 1.03% | | | | (0.38%) | |
Portfolio turnover rate(o) | | | 10% | | | | 47% | | | | 12% | | | | 18% | | | | 22% | |
146
| | | | |
| For a share outstanding throughout each period | | Transamerica
Asset
Allocation -
Growth
Portfolio | |
| | Class I | |
| | October 31,
2010 (e) | |
| |
Net asset value | | | | |
Beginning of period | | | $10.35 | |
Investment operations | | | | |
From net investment loss(b),(h) | | | (0.02) | |
From net realized and unrealized gain on affiliated investments | | | 1.20 | |
Total from investment operations | | | 1.18 | |
| |
Distributions | | | | |
Net investment income | | | (0.14) | |
| |
Net asset value | | | | |
End of year | | | $11.39 | |
| |
Total return(c) | | | 11.57% | (f) |
| |
Net assets end of year (000’s) | | $ | 13,112 | |
| |
Ratio and supplemental data | | | | |
| |
Expenses to average net assets:(i) | | | | |
After reimbursement/fee waiver | | | 0.30% | (g) |
Before reimbursement/fee waiver | | | 0.30% | (g) |
Net investment loss, to average net assets(h) | | | (0.15%) | (g) |
Portfolio turnover rate(o) | | | 10% | (f) |
| | | | | | | | | | | | | | | | | | | | |
| For a share outstanding throughout each period | | Transamerica Asset Allocation - Growth Portfolio | |
| | | Class R | |
| | | October 31,
2010 | | | October 31,
2009 | | | October 31,
2008 | | | October 31,
2007 | | | October 31,
2006 (v) | |
| | | | | |
Net asset value | | | | | | | | | | | | | | | | | | | | |
Beginning of period/year | | | $9.85 | | | | $8.84 | | | | $15.40 | | | | $13.43 | | | | $12.36 | |
| | | | | |
Investment operations | | | | | | | | | | | | | | | | | | | | |
From net investment income(b),(h) | | | 0.01 | | | | 0.10 | | | | 0.07 | | | | 0.13 | | | | 0.05 | |
From net realized and unrealized gain (loss) on affiliated investments | | | 1.49 | | | | 1.12 | | | | (6.20) | | | | 2.60 | | | | 1.02 | |
Total from investment operations | | | 1.50 | | | | 1.22 | | | | (6.13) | | | | 2.73 | | | | 1.07 | |
| | | | | |
Distributions | | | | | | | | | | | | | | | | | | | | |
Net investment income | | | (0.08) | | | | (0.21) | | | | – | | | | (0.31) | | | | – | |
Net realized gains on affiliated investments | | | – | | | | – | | | | (0.43) | | | | (0.45) | | | | – | |
Total distributions | | | (0.08) | | | | (0.21) | | | | (0.43) | | | | (0.76) | | | | – | |
| | | | | |
Net asset value | | | | | | | | | | | | | | | | | | | | |
End of year | | | $11.27 | | | | $9.85 | | | | $8.84 | | | | $15.40 | | | | $13.43 | |
| | | | | |
Total return(c) | | | 15.35% | | | | 14.35% | | | | (40.81%) | | | | 21.20% | | | | 8.66% | (f) |
| | | | | |
Net assets end of year (000’s) | | $ | 3,762 | | | $ | 2,704 | | | $ | 1,570 | | | $ | 884 | | | $ | 85 | |
| | | | | |
Ratio and supplemental data | | | | | | | | | | | | | | | | | | | | |
Expenses to average net assets:(i) | | | | | | | | | | | | | | | | | | | | |
After reimbursement/fee waiver | | | 0.84% | | | | 0.85% | | | | 0.83% | | | | 0.68% | | | | 0.67% | (g) |
Before reimbursement/fee waiver | | | 0.84% | | | | 0.85% | | | | 0.83% | | | | 0.68% | | | | 0.67% | (g) |
Net investment income, to average net assets(h),(n) | | | 0.15% | | | | 1.09% | | | | 0.57% | | | | 0.94% | | | | 1.08% | (g) |
Portfolio turnover rate(o) | | | 10% | | | | 47% | | | | 12% | | | | 18% | | | | 22% | (f) |
147
| | | | | | | | | | | | | | | | | | | | |
| For a share outstanding throughout each period | | Transamerica Asset Allocation - Moderate Growth Portfolio | |
| | | Class A | |
| | | October 31,
2010 | | | October 31,
2009 | | | October 31,
2008 | | | October 31,
2007 | | | October 31,
2006 | |
Net asset value | | | | | | | | | | | | | | | | | | | | |
Beginning of year | | | $10.39 | | | | $9.20 | | | | $14.58 | | | | $13.05 | | | | $11.88 | |
Investment operations | | | | | | | | | | | | | | | | | | | | |
From net investment income(b),(h) | | | 0.19 | | | | 0.28 | | | | 0.26 | | | | 0.33 | | | | 0.15 | |
From net realized and unrealized gain (loss) on affiliated investments | | | 1.27 | | | | 1.25 | | | | (5.04) | | | | 1.86 | | | | 1.53 | |
Total from investment operations | | | 1.46 | | | | 1.53 | | | | (4.78) | | | | 2.19 | | | | 1.68 | |
Distributions | | | | | | | | | | | | | | | | | | | | |
Net investment income | | | (0.23) | | | | (0.34) | | | | (0.19) | | | | (0.34) | | | | (0.20) | |
Net realized gains on affiliated investments | | | – | | | | – | | | | (0.41) | | | | (0.32) | | | | (0.31) | |
From return of capital | | | (0.03) | | | | – | | | | – | | | | – | | | | – | |
Total distributions | | | (0.26) | | | | (0.34) | | | | (0.60) | | | | (0.66) | | | | (0.51) | |
Net asset value | | | | | | | | | | | | | | | | | | | | |
End of year | | | $11.59 | | | | $10.39 | | | | $9.20 | | | | $14.58 | | | | $13.05 | |
Total return(c) | | | 14.35% | | | | 17.47% | | | | (34.01%) | | | | 17.48% | | | | 14.59% | |
Net assets end of year (000’s) | | $ | 1,202,885 | | | $ | 1,044,810 | | | $ | 901,766 | | | $ | 1,295,568 | | | $ | 914,835 | |
Ratio and supplemental data | | | | | | | | | | | | | | | | | | | | |
Expenses to average net assets:(i) | | | | | | | | | | | | | | | | | | | | |
After reimbursement/fee waiver | | | 0.62% | | | | 0.66% | | | | 0.60% | | | | 0.60% | | | | 0.61% | |
Before reimbursement/fee waiver | | | 0.62% | | | | 0.66% | | | | 0.60% | | | | 0.60% | | | | 0.61% | |
Net investment income, to average net assets(h),(n) | | | 1.80% | | | | 2.99% | | | | 2.12% | | | | 2.42% | | | | 1.17% | |
Portfolio turnover rate(o) | | | 17% | | | | 37% | | | | 13% | | | | 19% | | | | 21% | |
| | | | | |
| | | | | | | | | | | | | | | | | | | | |
| For a share outstanding throughout each period | | Transamerica Asset Allocation - Moderate Growth Portfolio | |
| | | Class B | |
| | | October 31,
2010 | | | October 31,
2009 | | | October 31,
2008 | | | October 31,
2007 | | | October 31,
2006 | |
Net asset value | | | | | | | | | | | | | | | | | | | | |
Beginning of year | | | $10.34 | | | | $9.12 | | | | $14.45 | | | | $12.94 | | | | $11.80 | |
Investment operations | | | | | | | | | | | | | | | | | | | | |
From net investment income(b),(h) | | | 0.13 | | | | 0.22 | | | | 0.19 | | | | 0.24 | | | | 0.06 | |
From net realized and unrealized gain (loss) on affiliated investments | | | 1.25 | | | | 1.24 | | | | (5.01) | | | | 1.85 | | | | 1.52 | |
Total from investment operations | | | 1.38 | | | | 1.46 | | | | (4.82) | | | | 2.09 | | | | 1.58 | |
Distributions | | | | | | | | | | | | | | | | | | | | |
Net investment income | | | (0.16) | | | | (0.24) | | | | (0.10) | | | | (0.26) | | | | (0.13) | |
Net realized gains on affiliated investments | | | – | | | | – | | | | (0.41) | | | | (0.32) | | | | (0.31) | |
From return of capital | | | (0.03) | | | | – | | | | – | | | | – | | | | – | |
Total distributions | | | (0.19) | | | | (0.24) | | | | (0.51) | | | | (0.58) | | | | (0.44) | |
Net asset value | | | | | | | | | | | | | | | | | | | | |
End of year | | | $11.53 | | | | $10.34 | | | | $9.12 | | | | $14.45 | | | | $12.94 | |
Total return(c) | | | 13.57% | | | | 16.69% | | | | (34.44%) | | | | 16.69% | | | | 13.74% | |
Net assets end of year (000’s) | | $ | 383,062 | | | $ | 394,275 | | | $ | 389,429 | | | $ | 651,359 | | | $ | 549,040 | |
Ratio and supplemental data | | | | | | | | | | | | | | | | | | | | |
Expenses to average net assets:(i) | | | | | | | | | | | | | | | | | | | | |
After reimbursement/fee waiver | | | 1.30% | | | | 1.33% | | | | 1.27% | | | | 1.27% | | | | 1.28% | |
Before reimbursement/fee waiver | | | 1.30% | | | | 1.33% | | | | 1.27% | | | | 1.27% | | | | 1.28% | |
Net investment income, to average net assets(h),(n) | | | 1.19% | | | | 2.39% | | | | 1.54% | | | | 1.78% | | | | 0.51% | |
Portfolio turnover rate(o) | | | 17% | | | | 37% | | | | 13% | | | | 19% | | | | 21% | |
148
| | | | | | | | | | | | | | | | | | | | |
| For a share outstanding throughout each period | | Transamerica Asset Allocation - Moderate Growth Portfolio | |
| | | Class C | |
| | | October 31,
2010 | | | October 31,
2009 | | | October 31,
2008 | | | October 31,
2007 | | | October 31,
2006 | |
| | | | | |
Net asset value | | | | | | | | | | | | | | | | | | | | |
Beginning of year | | | $10.32 | | | | $9.11 | | | | $14.45 | | | | $12.95 | | | | $11.80 | |
| | | | | |
Investment operations | | | | | | | | | | | | | | | | | | | | |
From net investment income(b),(h) | | | 0.13 | | | | 0.22 | | | | 0.18 | | | | 0.24 | | | | 0.07 | |
From net realized and unrealized gain (loss) on affiliated investments | | | 1.25 | | | | 1.25 | | | | (5.00) | | | | 1.85 | | | | 1.52 | |
Total from investment operations | | | 1.38 | | | | 1.47 | | | | (4.82) | | | | 2.09 | | | | 1.59 | |
| | | | | |
Distributions | | | | | | | | | | | | | | | | | | | | |
Net investment income | | | (0.17) | | | | (0.26) | | | | (0.11) | | | | (0.27) | | | | (0.13) | |
Net realized gains on affiliated investments | | | – | | | | – | | | | (0.41) | | | | (0.32) | | | | (0.31) | |
From return of capital | | | (0.03) | | | | – | | | | – | | | | – | | | | – | |
Total distributions | | | (0.20) | | | | (0.26) | | | | (0.52) | | | | (0.59) | | | | (0.44) | |
| | | | | |
Net asset value | | | | | | | | | | | | | | | | | | | | |
End of year | | | $11.50 | | | | $10.32 | | | | $9.11 | | | | $14.45 | | | | $12.95 | |
| | | | | |
Total return(c) | | | 13.58% | | | | 16.77% | | | | (34.44%) | | | | 16.74% | | | | 13.87% | |
| | | | | |
Net assets end of year (000’s) | | $ | 1,606,227 | | | $ | 1,513,954 | | | $ | 1,455,012 | | | $ | 2,098,087 | | | $ | 1,520,489 | |
| | | | | |
Ratio and supplemental data | | | | | | | | | | | | | | | | | | | | |
| | | | | |
Expenses to average net assets:(i) | | | | | | | | | | | | | | | | | | | | |
After reimbursement/fee waiver | | | 1.25% | | | | 1.28% | | | | 1.23% | | | | 1.23% | | | | 1.24% | |
Before reimbursement/fee waiver | | | 1.25% | | | | 1.28% | | | | 1.23% | | | | 1.23% | | | | 1.24% | |
Net investment income, to average net assets(h),(n) | | | 1.20% | | | | 2.43% | | | | 1.49% | | | | 1.79% | | | | 0.55% | |
Portfolio turnover rate(o) | | | 17% | | | | 37% | | | | 13% | | | | 19% | | | | 21% | |
| | | | |
| For a share outstanding throughout each period | | Transamerica Asset Allocation - Moderate Growth Portfolio | |
| | | Class I | |
| | | October 31,
2010 (e) | |
| |
Net asset value | | | | |
Beginning of period | | | $10.76 | |
| |
Investment operations | | | | |
From net investment income(b),(h) | | | 0.09 | |
From net realized and unrealized gain on affiliated investments | | | 1.07 | |
Total from investment operations | | | 1.16 | |
| |
Distributions | | | | |
Net investment income | | | (0.28) | |
From Return of capital | | | (0.03) | |
Total distributions | | | (0.31) | |
| |
Net asset value | | | | |
End of year | | | $11.61 | |
| |
Total return(c) | | | 11.07% | (f) |
| |
Net assets end of year (000’s) | | $ | 16,293 | |
| |
Ratio and supplemental data | | | | |
| |
Expenses to average net assets:(i) | | | | |
After reimbursement/fee waiver | | | 0.29% | (g) |
Before reimbursement/fee waiver | | | 0.29% | (g) |
Net investment income, to average net assets(h) | | | 0.89% | (g) |
Portfolio turnover rate(o) | | | 17% | (f) |
149
| | | | | | | | | | | | | | | | | | | | |
| For a share outstanding throughout each period | | Transamerica Asset Allocation - Moderate Growth Portfolio | |
| | | Class R | |
| | | October 31,
2010 | | | October 31,
2009 | | | October 31,
2008 | | | October 31,
2007 | | | October 31,
2006 (v) | |
Net asset value | | | | | | | | | | | | | | | | | | | | |
Beginning of period/year | | | $10.36 | | | | $9.18 | | | | $14.54 | | | | $13.05 | | | | $12.13 | |
Investment operations | | | | | | | | | | | | | | | | | | | | |
From net investment income(b),(h) | | | 0.15 | | | | 0.25 | | | | 0.22 | | | | 0.24 | | | | 0.10 | |
From net realized and unrealized gain (loss) on affiliated investments | | | 1.28 | | | | 1.26 | | | | (5.00) | | | | 1.93 | | | | 0.82 | |
Total from investment operations | | | 1.43 | | | | 1.51 | | | | (4.78) | | | | 2.17 | | | | 0.92 | |
Distributions | | | | | | | | | | | | | | | | | | | | |
Net investment income | | | (0.23) | | | | (0.33) | | | | (0.17) | | | | (0.36) | | | | – | |
Net realized gains on affiliated investments | | | – | | | | – | | | | (0.41) | | | | (0.32) | | | | – | |
From return of capital | | | (0.03) | | | | – | | | | – | | | | – | | | | – | |
Total distributions | | | (0.26) | | | | (0.33) | | | | (0.58) | | | | (0.68) | | | | – | |
Net asset value | | | | | | | | | | | | | | | | | | | | |
End of year | | | $11.53 | | | | $10.36 | | | | $9.18 | | | | $14.54 | | | | $13.05 | |
Total return(c) | | | 14.08% | | | | 17.29% | | | | (34.08%) | | | | 17.31% | | | | 7.58% | (f) |
Net assets end of year (000’s) | | $ | 5,413 | | | $ | 2,873 | | | $ | 1,969 | | | $ | 1,983 | | | $ | 54 | |
Ratio and supplemental data | | | | | | | | | | | | | | | | | | | | |
Expenses to average net assets:(i) | | | | | | | | | | | | | | | | | | | | |
After reimbursement/fee waiver | | | 0.79% | | | | 0.82% | | | | 0.76% | | | | 0.67% | | | | 0.66% | (g) |
Before reimbursement/fee waiver | | | 0.79% | | | | 0.82% | | | | 0.76% | | | | 0.67% | | | | 0.66% | (g) |
Net investment income, to average net assets(h),(n) | | | 1.43% | | | | 2.68% | | | | 1.74% | | | | 1.80% | | | | 2.08% | (g) |
Portfolio turnover rate(o) | | | 17% | | | | 37% | | | | 13% | | | | 19% | | | | 21% | (f) |
| | | | | |
| | | | | | | | | | | | | | | | | | | | |
| For a share outstanding throughout each period | | Transamerica Asset Allocation - Moderate Portfolio | |
| | | Class A | |
| | | October 31,
2010 | | | October 31,
2009 | | | October 31,
2008 | | | October 31,
2007 | | | October 31,
2006 | |
Net asset value | | | | | | | | | | | | | | | | | | | | |
Beginning of year | | | $10.62 | | | | $9.29 | | | | $13.69 | | | | $12.64 | | | | $11.78 | |
Investment operations | | | | | | | | | | | | | | | | | | | | |
From net investment income(b),(h) | | | 0.30 | | | | 0.36 | | | | 0.33 | | | | 0.36 | | | | 0.24 | |
From net realized and unrealized gain (loss) on affiliated investments | | | 1.04 | | | | 1.40 | | | | (4.05) | | | | 1.40 | | | | 1.15 | |
Total from investment operations | | | 1.34 | | | | 1.76 | | | | (3.72) | | | | 1.76 | | | | 1.39 | |
Distributions | | | | | | | | | | | | | | | | | | | | |
Net investment income | | | (0.37) | | | | (0.43) | | | | (0.28) | | | | (0.37) | | | | (0.28) | |
Net realized gains on affiliated investments | | | – | | | | – | | | | (0.40) | | | | (0.34) | | | | (0.25) | |
Total distributions | | | (0.37) | | | | (0.43) | | | | (0.68) | | | | (0.71) | | | | (0.53) | |
Net asset value | | | | | | | | | | | | | | | | | | | | |
End of year | | | $11.59 | | | | $10.62 | | | | $9.29 | | | | $13.69 | | | | $12.64 | |
Total return(c) | | | 12.95% | | | | 19.99% | | | | (28.41%) | | | | 14.51% | | | | 12.22% | |
Net assets end of year (000’s) | | $ | 857,469 | | | $ | 694,532 | | | $ | 545,646 | | | $ | 665,013 | | | $ | 471,902 | |
Ratio and supplemental data | | | | | | | | | | | | | | | | | | | | |
Expenses to average net assets:(i) | | | | | | | | | | | | | | | | | | | | |
After reimbursement/fee waiver | | | 0.61% | | | | 0.63% | | | | 0.59% | | | | 0.59% | | | | 0.58% | |
Before reimbursement/fee waiver | | | 0.61% | | | | 0.63% | | | | 0.59% | | | | 0.59% | | | | 0.58% | |
Net investment income, to average net assets(h),(n) | | | 2.78% | | | | 3.76% | | | | 2.79% | | | | 2.83% | | | | 1.98% | |
Portfolio turnover rate(o) | | | 16% | | | | 30% | | | | 12% | | | | 23% | | | | 22% | |
150
| | | | | | | | | | | | | | | | | | | | |
| For a share outstanding throughout each period | | Transamerica Asset Allocation - Moderate Portfolio | |
| | | Class B | |
| | | October 31,
2010 | | | October 31,
2009 | | | October 31,
2008 | | | October 31,
2007 | | | October 31,
2006 | |
Net asset value | | | | | | | | | | | | | | | | | | | | |
Beginning of year | | | $10.59 | | | | $9.23 | | | | $13.59 | | | | $12.55 | | | | $11.70 | |
Investment operations | | | | | | | | | | | | | | | | | | | | |
From net investment income(b),(h) | | | 0.24 | | | | 0.30 | | | | 0.27 | | | | 0.28 | | | | 0.16 | |
From net realized and unrealized gain (loss) on affiliated investments | | | 1.02 | | | | 1.39 | | | | (4.05) | | | | 1.39 | | | | 1.15 | |
Total from investment operations | | | 1.26 | | | | 1.69 | | | | (3.78) | | | | 1.67 | | | | 1.31 | |
Distributions | | | | | | | | | | | | | | | | | | | | |
Net investment income | | | (0.30) | | | | (0.33) | | | | (0.18) | | | | (0.28) | | | | (0.21) | |
Net realized gains on affiliated investments | | | – | | | | – | | | | (0.40) | | | | (0.34) | | | | (0.25) | |
Total distributions | | | (0.30) | | | | (0.33) | | | | (0.58) | | | | (0.62) | | | | (0.46) | |
Net asset value | | | | | | | | | | | | | | | | | | | | |
End of year | | | $11.55 | | | | $10.59 | | | | $9.23 | | | | $13.59 | | | | $12.55 | |
Total return(c) | | | 12.13% | | | | 19.16% | | | | (28.87%) | | | | 13.73% | | | | 11.50% | |
Net assets end of year (000’s) | | $ | 220,658 | | | $ | 228,151 | | | $ | 223,209 | | | $ | 357,175 | | | $ | 336,385 | |
Ratio and supplemental data | | | | | | | | | | | | | | | | | | | | |
Expenses to average net assets:(i) | | | | | | | | | | | | | | | | | | | | |
After reimbursement/fee waiver | | | 1.28% | | | | 1.30% | | | | 1.25% | | | | 1.25% | | | | 1.25% | |
Before reimbursement/fee waiver | | | 1.28% | | | | 1.30% | | | | 1.25% | | | | 1.25% | | | | 1.25% | |
Net investment income, to average net assets(h),(n) | | | 2.24% | | | | 3.23% | | | | 2.26% | | | | 2.21% | | | | 1.31% | |
Portfolio turnover rate(o) | | | 16% | | | | 30% | | | | 12% | | | | 23% | | | | 22% | |
| | | | | |
| | | | | | | | | | | | | | | | | | | | |
| For a share outstanding throughout each period | | Transamerica Asset Allocation - Moderate Portfolio | |
| | | Class C | |
| | | October 31,
2010 | | | October 31,
2009 | | | October 31,
2008 | | | October 31,
2007 | | | October 31,
2006 | |
Net asset value | | | | | | | | | | | | | | | | | | | | |
Beginning of year | | | $10.55 | | | | $9.21 | | | | $13.58 | | | | $12.55 | | | | $11.70 | |
Investment operations | | | | | | | | | | | | | | | | | | | | |
From net investment income(b),(h) | | | 0.24 | | | | 0.30 | | | | 0.26 | | | | 0.28 | | | | 0.16 | |
From net realized and unrealized gain (loss) on affiliated investments | | | 1.02 | | | | 1.39 | | | | (4.03) | | | | 1.39 | | | | 1.14 | |
Total from investment operations | | | 1.26 | | | | 1.69 | | | | (3.77) | | | | 1.67 | | | | 1.30 | |
Distributions | | | | | | | | | | | | | | | | | | | | |
Net investment income | | | (0.31) | | | | (0.35) | | | | (0.20) | | | | (0.30) | | | | (0.21) | |
Net realized gains on affiliated investments | | | – | | | | – | | | | (0.40) | | | | (0.34) | | | | (0.25) | |
Total distributions | | | (0.31) | | | | (0.35) | | | | (0.60) | | | | (0.64) | | | | (0.46) | |
Net asset value | | | | | | | | | | | | | | | | | | | | |
End of year | | | $11.50 | | | | $10.55 | | | | $9.21 | | | | $13.58 | | | | $12.55 | |
Total return(c) | | | 12.22% | | | | 19.24% | | | | (28.87%) | | | | 13.86% | | | | 11.46% | |
Net assets end of year (000’s) | | $ | 1,142,029 | | | $ | 997,766 | | | $ | 876,977 | | | $ | 1,159,220 | | | $ | 905,061 | |
Ratio and supplemental data | | | | | | | | | | | | | | | | | | | | |
Expenses to average net assets:(i) | | | | | | | | | | | | | | | | | | | | |
After reimbursement/fee waiver | | | 1.22% | | | | 1.24% | | | | 1.21% | | | | 1.21% | | | | 1.22% | |
Before reimbursement/fee waiver | | | 1.22% | | | | 1.24% | | | | 1.21% | | | | 1.21% | | | | 1.22% | |
Net investment income, to average net assets(h),(n) | | | 2.21% | | | | 3.25% | | | | 2.21% | | | | 2.22% | | | | 1.35% | |
Portfolio turnover rate(o) | | | 16% | | | | 30% | | | | 12% | | | | 23% | | | | 22% | |
151
| | | | |
| For a share outstanding throughout each period | | Transamerica
Asset
Allocation -
Moderate
Portfolio | |
| | | Class I | |
| | | October 31,
2010 (e) | |
Net asset value | | | | |
Beginning of period | | | $10.94 | |
Investment operations | | | | |
From net investment income(b),(h) | | | 0.17 | |
From net realized and unrealized gain on affiliated investments | | | 0.91 | |
Total from investment operations | | | 1.08 | |
Distributions | | | | |
Net investment income | | | (0.41) | |
Net asset value | | | | |
End of year | | | $11.61 | |
Total return(c) | | | 10.27% | (f) |
Net assets end of year (000’s) | | $ | 17,853 | |
Ratio and supplemental data | | | | |
Expenses to average net assets:(i) | | | | |
After reimbursement/fee waiver | | | 0.28% | (g) |
Before reimbursement/fee waiver | | | 0.28% | (g) |
Net investment income, to average net assets(h) | | | 1.73% | (g) |
Portfolio turnover rate(o) | | | 16% | (f) |
| | | | | | | | | | | | | | | | | | | | |
| For a share outstanding throughout each period | | Transamerica Asset Allocation - Moderate Portfolio | |
| | | Class R | |
| | | October 31,
2010 | | | October 31,
2009 | | | October 31,
2008 | | | October 31,
2007 | | | October 31,
2006 (v) | |
Net asset value | | | | | | | | | | | | | | | | | | | | |
Beginning of period/year | | | $10.58 | | | | $9.28 | | | | $13.65 | | | | $12.64 | | | | $11.86 | |
Investment operations | | | | | | | | | | | | | | | | | | | | |
From net investment income(b),(h) | | | 0.24 | | | | 0.32 | | | | 0.28 | | | | 0.31 | | | | 0.13 | |
From net realized and unrealized gain (loss) on affiliated investments | | | 1.06 | | | | 1.42 | | | | (4.02) | | | | 1.42 | | | | 0.65 | |
Total from investment operations | | | 1.30 | | | | 1.74 | | | | (3.74) | | | | 1.73 | | | | 0.78 | |
Distributions | | | | | | | | | | | | | | | | | | | | |
Net investment income | | | (0.35) | | | | (0.44) | | | | (0.23) | | | | (0.38) | | | | – | |
Net realized gains on affiliated investments | | | – | | | | – | | | | (0.40) | | | | (0.34) | | | | – | |
Total distributions | | | (0.35) | | | | (0.44) | | | | (0.63) | | | | (0.72) | | | | – | |
Net asset value | | | | | | | | | | | | | | | | | | | | |
End of year | | | $11.53 | | | | $10.58 | | | | $9.28 | | | | $13.65 | | | | $12.64 | |
Total return(c) | | | 12.60% | | | | 19.81% | | | | (28.57%) | | | | 14.31% | | | | 6.58% | (f) |
Net assets end of year (000’s) | | $ | 4,278 | | | $ | 2,211 | | | $ | 959 | | | $ | 610 | | | $ | 53 | |
Ratio and supplemental data | | | | | | | | | | | | | | | | | | | | |
Expenses to average net assets:(i) | | | | | | | | | | | | | | | | | | | | |
After reimbursement/fee waiver | | | 0.83% | | | | 0.86% | | | | 0.87% | | | | 0.72% | | | | 0.66% | (g) |
Before reimbursement/fee waiver | | | 0.83% | | | | 0.86% | | | | 0.87% | | | | 0.72% | | | | 0.66% | (g) |
Net investment income, to average net assets(h),(n) | | | 2.23% | | | | 3.38% | | | | 2.37% | | | | 2.44% | | | | 2.73% | (g) |
Portfolio turnover rate(o) | | | 16% | | | | 30% | | | | 12% | | | | 23% | | | | 22% | (f) |
152
| | | | | | | | | | | | | | | | | | | | |
| For a share outstanding throughout each period | | Transamerica Balanced | |
| | | Class A | |
| | | October 31,
2010 | | | October 31,
2009 | | | October 31,
2008 | | | October 31,
2007 | | | October 31,
2006 | |
Net asset value | | | | | | | | | | | | | | | | | | | | |
Beginning of year | | | $17.85 | | | | $16.44 | | | | $25.70 | | | | $22.05 | | | | $19.90 | |
Investment operations | | | | | | | | | | | | | | | | | | | | |
Net investment income(b) | | | 0.52 | | | | 0.28 | | | | 0.28 | | | | 0.17 | | | | 0.12 | |
Net realized and unrealized gain (loss) on investments | | | 3.55 | | | | 2.47 | | | | (8.64) | | | | 3.62 | | | | 2.12 | |
Total from investment operations | | | 4.07 | | | | 2.75 | | | | (8.36) | | | | 3.79 | | | | 2.24 | |
Distributions | | | | | | | | | | | | | | | | | | | | |
Net investment income | | | (0.52) | | | | (0.31) | | | | (0.24) | | | | (0.14) | | | | (0.09) | |
Net realized gains on investments | | | – | | | | (1.03) | | | | (0.66) | | | | – | | | | – | |
Total distributions | | | (0.52) | | | | (1.34) | | | | (0.90) | | | | (0.14) | | | | (0.09) | |
Net asset value | | | | | | | | | | | | | | | | | | | | |
End of year | | | $21.40 | | | | $17.85 | | | | $16.44 | | | | $25.70 | | | | $22.05 | |
Total return(c) | | | 23.08 | % | | | 18.43 | % | | | (33.55%) | | | | 17.28 | % | | | 11.27% | |
Net assets end of year (000’s) | | $ | 95,258 | | | $ | 60,279 | | | $ | 49,917 | | | $ | 61,565 | | | $ | 55,547 | |
Ratio and supplemental data | | | | | | | | | | | | | | | | | | | | |
Expenses to average net assets | | | | | | | | | | | | | | | | | | | | |
After reimbursement/fee waiver | | | 1.56 | %(j) | | | 1.73 | %(j) | | | 1.52% | | | | 1.56 | % | | | 1.58% | |
Before reimbursement/fee waiver | | | 1.56 | %(j) | | | 1.73 | %(j) | | | 1.52% | | | | 1.56 | % | | | 1.58% | |
Net investment income, to average net assets(d) | | | 2.67 | % | | | 1.72 | % | | | 1.27% | | | | 0.73 | % | | | 0.57% | |
Portfolio turnover rate | | | 99 | % | | | 100 | % | | | 52% | | | | 52 | % | | | 51% | |
| | | | | | | | | | | | | | | | | | | | |
| For a share outstanding throughout each period | | Transamerica Balanced | |
| | | Class B | |
| | | October 31,
2010 | | | October 31,
2009 | | | October 31,
2008 | | | October 31,
2007 | | | October 31,
2006 | |
Net asset value | | | | | | | | | | | | | | | | | | | | |
Beginning of year | | | $17.79 | | | | $16.37 | | | | $25.58 | | | | $21.98 | | | | $19.88 | |
Investment operations | | | | | | | | | | | | | | | | | | | | |
Net investment income(b) | | | 0.33 | | | | 0.16 | | | | 0.13 | | | | 0.04 | | | | – | (k) |
Net realized and unrealized gain (loss) on investments | | | 3.58 | | | | 2.45 | | | | (8.58) | | | | 3.60 | | | | 2.12 | |
Total from investment operations | | | 3.91 | | | | 2.61 | | | | (8.45) | | | | 3.64 | | | | 2.12 | |
Distributions | | | | | | | | | | | | | | | | | | | | |
Net investment income | | | (0.36) | | | | (0.17) | | | | (0.10) | | | | (0.04) | | | | (0.02) | |
Net realized gains on investments | | | – | | | | (1.03) | | | | (0.66) | | | | – | | | | – | |
Total distributions | | | (0.36) | | | | (1.20) | | | | (0.76) | | | | (0.04) | | | | (0.02) | |
Net asset value | | | | | | | | | | | | | | | | | | | | |
End of year | | | $21.34 | | | | $17.79 | | | | $16.37 | | | | $25.58 | | | | $21.98 | |
Total return(c) | | | 22.15% | | | | 17.50% | | | | (33.95%) | | | | 16.57% | | | | 10.65% | |
Net assets end of year (000’s) | | $ | 14,658 | | | $ | 17,787 | | | $ | 32,469 | | | $ | 96,573 | | | $ | 118,286 | |
Ratio and supplemental data | | | | | | | | | | | | | | | | | | | | |
Expenses to average net assets | | | | | | | | | | | | | | | | | | | | |
After reimbursement/fee waiver | | | 2.34% | (j) | | | 2.46% | (j) | | | 2.15% | | | | 2.14% | | | | 2.15% | |
Before reimbursement/fee waiver | | | 2.34% | (j) | | | 2.46% | (j) | | | 2.15% | | | | 2.14% | | | | 2.15% | |
Net investment income, to average net assets(d) | | | 1.73% | | | | 1.02% | | | | 0.59% | | | | 0.15% | | | | 0.01% | |
Portfolio turnover rate | | | 99% | | | | 100% | | | | 52% | | | | 52% | | | | 51% | |
153
| | | | | | | | | | | | | | | | | | | | | | | | |
| For a share outstanding throughout each period | | Transamerica Balanced | |
| | | Class C | | | Class I | |
| | | October 31,
2010 | | | October 31,
2009 | | | October 31,
2008 | | | October 31,
2007 | | | October 31,
2006 | | | October 31,
2010 (e) | |
Net asset value | | | | | | | | | | | | | | | | | | | | | | | | |
Beginning of period/year | | | $17.69 | | | | $16.30 | | | | $25.50 | | | | $21.91 | | | | $19.82 | | | | $18.49 | |
Investment operations | | | | | | | | | | | | | | | | | | | | | | | | |
Net investment income(b) | | | 0.40 | | | | 0.18 | | | | 0.15 | | | | 0.04 | | | | 0.01 | | | | 0.57 | |
Net realized and unrealized gain (loss) on investments | | | 3.53 | | | | 2.46 | | | | (8.56) | | | | 3.59 | | | | 2.10 | | | | 2.98 | |
Total from investment operations | | | 3.93 | | | | 2.64 | | | | (8.41) | | | | 3.63 | | | | 2.11 | | | | 3.55 | |
Distributions | | | | | | | | | | | | | | | | | | | | | | | | |
Net investment income | | | (0.42) | | | | (0.22) | | | | (0.13) | | | | (0.04) | | | | (0.02) | | | | (0.58) | |
Net realized gains on investments | | | – | | | | (1.03) | | | | (0.66) | | | | – | | | | – | | | | – | |
Total distributions | | | (0.42) | | | | (1.25) | | | | (0.79) | | | | (0.04) | | | | (0.02) | | | | (0.58) | |
Net asset value | | | | | | | | | | | | | | | | | | | | | | | | |
End of year | | | $21.20 | | | | $17.69 | | | | $16.30 | | | | $25.50 | | | | $21.91 | | | | $21.46 | |
Total return(c) | | | 22.43% | | | | 17.80% | | | | (33.92%) | | | | 16.61% | | | | 10.64% | | | | 19.52% | (f) |
Net assets end of year (000’s) | | $ | 24,194 | | | $ | 16,933 | | | $ | 17,719 | | | $ | 32,569 | | | $ | 36,750 | | | $ | 265 | |
Ratio and supplemental data | | | | | | | | | | | | | | | | | | | | | | | | |
Expenses to average net assets | | | | | | | | | | | | | | | | | | | | | | | | |
After reimbursement/fee waiver | | | 2.11% | (j) | | | 2.27% | (j) | | | 2.08% | | | | 2.11% | | | | 2.12% | | | | 1.46% | (g)(u) |
Before reimbursement/fee waiver | | | 2.11% | (j) | | | 2.27% | (j) | | | 2.08% | | | | 2.11% | | | | 2.12% | | | | 2.01% | (g)(u) |
Net investment income, to average net assets(d) | | | 2.09% | | | | 1.15% | | | | 0.69% | | | | 0.18% | | | | 0.03% | | | | 3.15% | (g) |
Portfolio turnover rate | | | 99% | | | | 100% | | | | 52% | | | | 52% | | | | 51% | | | | 99% | (f) |
| | | | | | | | | | | | | | | | |
| For a share outstanding throughout each period | | Transamerica Diversified Equity | |
| | | Class A | | | Class B | | | Class C | | | Class I | |
| | | October 31,
2010 (l) | | | October 31,
2010 (l) | | | October 31,
2010 (l) | | | October 31,
2010 (e) | |
Net asset value | | | | | | | | | | | | | | | | |
Beginning of period/year | | | $12.85 | | | | $12.85 | | | | $12.85 | | | | $12.65 | |
Investment operations | | | | | | | | | | | | | | | | |
Net investment income(b) | | | 0.15 | | | | 0.06 | | | | 0.06 | | | | 0.26 | |
Net realized and unrealized gain on investments | | | 1.31 | | | | 1.32 | | | | 1.32 | | | | 1.53 | |
Total from investment operations | | | 1.46 | | | | 1.38 | | | | 1.38 | | | | 1.79 | |
Distributions | | | | | | | | | | | | | | | | |
Net investment income | | | (0.02) | | | | (0.01) | | | | (0.01) | | | | (0.03) | |
Total distributions | | | (0.02) | | | | (0.01) | | | | (0.01) | | | | (0.03) | |
Net asset value | | | | | | | | | | | | | | | | |
End of year | | | $14.29 | | | | $14.22 | | | | $14.22 | | | | $14.41 | |
Total return(c) | | | 11.32% | (f) | | | 10.68% | (f) | | | 10.68% | (f) | | | 14.16% | (f) |
Net assets end of year (000’s) | | $ | 83,766 | | | $ | 7,735 | | | $ | 15,013 | | | $ | 421 | |
Ratio and supplemental data | | | | | | | | | | | | | | | | |
Expenses to average net assets | | | | | | | | | | | | | | | | |
After reimbursement/fee waiver | | | 1.52% | (g) | | | 2.17% | (g) | | | 2.17% | (g) | | | 1.17% | (g) |
Before reimbursement/fee waiver | | | 1.72% | (g) | | | 2.44% | (g) | | | 2.31% | (g) | | | 1.81% | (g) |
Net investment income, to average net assets(d) | | | 1.14% | (g) | | | 0.40% | (g) | | | 0.48% | (g) | | | 2.14% | (g) |
Portfolio turnover rate | | | 79% | (f) | | | 79% | (f) | | | 79% | (f) | | | 79% | (f) |
154
| | | | | | | | | | | | | | | | | | |
| For a share outstanding throughout each period | | Transamerica Flexible Income |
| | | Class A |
| | | October 31,
2010 | | | October 31,
2009 | | | October 31,
2008 | | | October 31,
2007 | | | October 31,
2006 |
Net asset value | | | | | | | | | | | | | | | | | | |
Beginning of year | | | $8.33 | | | | $7.22 | | | | $9.14 | | | | $9.38 | | | $9.31 |
Investment operations | | | | | | | | | | | | | | | | | | |
Net investment income(b) | | | 0.50 | | | | 0.46 | | | | 0.44 | | | | 0.48 | | | 0.43 |
Net realized and unrealized gain (loss) on investments | | | 0.70 | | | | 1.08 | | | | (1.89) | | | | (0.25) | | | 0.05 |
Total from investment operations | | | 1.20 | | | | 1.54 | | | | (1.45) | | | | 0.23 | | | 0.48 |
Distributions | | | | | | | | | | | | | | | | | | |
Net investment income | | | (0.54) | | | | (0.43) | | | | (0.47) | | | | (0.47) | | | (0.41) |
Total distributions | | | (0.54) | | | | (0.43) | | | | (0.47) | | | | (0.47) | | | (0.41) |
Net asset value | | | | | | | | | | | | | | | | | | |
End of year | | | $8.99 | | | | $8.33 | | | | $7.22 | | | | $9.14 | | | $9.38 |
Total return(c) | | | 14.89% | | | | 22.30% | | | | (16.57%) | | | | 2.42% | | | 5.34% |
Net assets end of year (000’s) | | $ | 55,103 | | | $ | 24,173 | | | $ | 13,360 | | | $ | 15,409 | | | $ 17,005 |
Ratio and supplemental data | | | | | | | | | | | | | | | | | | |
Expenses to average net assets | | | | | | | | | | | | | | | | | | |
After reimbursement/fee waiver | | | 1.07% | (u) | | | 1.47% | | | | 1.39% | | | | 1.40% | | | 1.47% |
Before reimbursement/fee waiver | | | 1.15% | (u) | | | 1.47% | | | | 1.39% | | | | 1.40% | | | 1.47% |
Net investment income, to average net assets(d) | | | 5.79% | | | | 6.03% | | | | 5.12% | | | | 5.12% | | | 4.64% |
Portfolio turnover rate | | | 120% | | | | 169% | | | | 98% | | | | 108% | | | 110% |
| | | | | | | | | | | | |
| For a share outstanding throughout each period | | Transamerica Flexible Income |
| | | Class B |
| | | October 31,
2010 | | | October 31,
2009 | | October 31,
2008 | | October 31,
2007 | | October 31,
2006 |
Net asset value | | | | | | | | | | | | |
Beginning of year | | | $8.34 | | | $7.23 | | $9.14 | | $9.39 | | $9.32 |
Investment operations | | | | | | | | | | | | |
Net investment income(b) | | | 0.43 | | | 0.40 | | 0.38 | | 0.42 | | 0.38 |
Net realized and unrealized gain (loss) on investments | | | 0.71 | | | 1.09 | | (1.88) | | (0.26) | | 0.06 |
Total from investment operations | | | 1.14 | | | 1.49 | | (1.50) | | 0.16 | | 0.44 |
Distributions | | | | | | | | | | | | |
Net investment income | | | (0.48) | | | (0.38) | | (0.41) | | (0.41) | | (0.37) |
Total distributions | | | (0.48) | | | (0.38) | | (0.41) | | (0.41) | | (0.37) |
Net asset value | | | | | | | | | | | | |
End of year | | | $9.00 | | | $8.34 | | $7.23 | | $9.14 | | $9.39 |
Total return(c) | | | 14.02% | | | 21.39% | | (17.03%) | | 1.66% | | 4.81% |
Net assets end of year (000’s) | | $ | 10,614 | | | $ 8,161 | | $ 8,628 | | $ 17,007 | | $ 23,501 |
Ratio and supplemental data | | | | | | | | | | | | |
Expenses to average net assets | | | | | | | | | | | | |
After reimbursement/fee waiver | | | 1.88% | (u) | | 2.16% | | 2.05% | | 2.04% | | 2.08% |
Before reimbursement/fee waiver | | | 1.88% | (u) | | 2.16% | | 2.05% | | 2.04% | | 2.08% |
Net investment income, to average net assets(d) | | | 4.97% | | | 5.36% | | 4.42% | | 4.48% | | 4.08% |
Portfolio turnover rate | | | 120% | | | 169% | | 98% | | 108% | | 110% |
155
| | | | | | | | | | | | | | | | | | | | | | | | |
| For a share outstanding throughout each period | | Transamerica Flexible Income | |
| | | Class C | | | Class I | |
| | | October 31,
2010 | | | October 31,
2009 | | | October 31,
2008 | | | October 31,
2007 | | | October 31,
2006 | | | October 31, 2010 (e) | |
Net asset value | | | | | | | | | | | | | | | | | | | | | | | | |
Beginning of period/year | | | $8.31 | | | | $7.21 | | | | $9.12 | | | | $9.36 | | | | $9.30 | | | | $8.48 | |
Investment operations | | | | | | | | | | | | | | | | | | | | | | | | |
Net investment income(b) | | | 0.44 | | | | 0.41 | | | | 0.39 | | | | 0.42 | | | | 0.39 | | | | 0.50 | |
Net realized and unrealized gain (loss) on investments | | | 0.70 | | | | 1.08 | | | | (1.88) | | | | (0.25) | | | | 0.04 | | | | 0.57 | |
Total from investment operations | | | 1.14 | | | | 1.49 | | | | (1.49) | | | | 0.17 | | | | 0.43 | | | | 1.07 | |
Distributions | | | | | | | | | | | | | | | | | | | | | | | | |
Net investment income | | | (0.49) | | | | (0.39) | | | | (0.42) | | | | (0.41) | | | | (0.37) | | | | (0.53) | |
Total distributions | | | (0.49) | | | | (0.39) | | | | (0.42) | | | | (0.41) | | | | (0.37) | | | | (0.53) | |
Net asset value | | | | | | | | | | | | | | | | | | | | | | | | |
End of year | | | $8.96 | | | | $8.31 | | | | $7.21 | | | | $9.12 | | | | $9.36 | | | | $9.02 | |
Total return(c) | | | 14.15% | | | | 21.50% | | | | (16.98%) | | | | 1.81% | | | | 4.74% | | | | 13.10% | (f) |
Net assets end of year (000’s) | | $ | 36,264 | | | $ | 12,978 | | | $ | 5,981 | | | $ | 8,982 | | | $ | 12,519 | | | $ | 9,787 | |
Ratio and supplemental data | | | | | | | | | | | | | | | | | | | | | | | | |
Expenses to average net assets | | | | | | | | | | | | | | | | | | | | | | | | |
After reimbursement/fee waiver | | | 1.74% | (u) | | | 2.06% | | | | 1.97% | | | | 2.00% | | | | 2.07% | | | | 0.76% | (g)(u) |
Before reimbursement/fee waiver | | | 1.74% | (u) | | | 2.06% | | | | 1.97% | | | | 2.00% | | | | 2.07% | | | | 0.76% | (g)(u) |
Net investment income, to average net assets(d) | | | 5.14% | | | | 5.43% | | | | 4.52% | | | | 4.51% | | | | 4.15% | | | | 6.25% | (g) |
Portfolio turnover rate | | | 120% | | | | 169% | | | | 98% | | | | 108% | | | | 110% | | | | 120% | (f) |
| | | | | | | | | | | | | | | | | | | | | | | | |
| | | | | | | | | | | | | | | | |
| For a share outstanding throughout each period | | Transamerica Focus(m) | |
| | | Class A | | | Class B | | | Class C | | | Class I | |
| | | October 31,
2010 (l) | | | October 31,
2010 (l) | | | October 31,
2010 (l) | | | October 31, 2010 (e) | |
| | | | |
Net asset value | | | | | | | | | | | | | | | | |
Beginning of period/year | | | $11.77 | | | | $10.95 | | | | $10.94 | | | | $11.64 | |
Investment operations | | | | | | | | | | | | | | | | |
Net investment loss(b) | | | (0.09) | | | | (0.15) | | | | (0.15) | | | | (0.06) | |
Net realized and unrealized gain on investments | | | 2.12 | | | | 1.96 | | | | 1.96 | | | | 2.33 | |
Total from investment operations | | | 2.03 | | | | 1.81 | | | | 1.81 | | | | 2.27 | |
Distributions | | | | | | | | | | | | | | | | |
Net investment income | | | (0.02) | | | | (0.01) | | | | (0.01) | | | | (0.02) | |
Total distributions | | | (0.02) | | | | (0.01) | | | | (0.01) | | | | (0.02) | |
Net asset value | | | | | | | | | | | | | | | | |
End of year | | | $13.78 | | | | $12.75 | | | | $12.74 | | | | $13.89 | |
Total return(c) | | | 17.24% | (f) | | | 16.51% | (f) | | | 16.53% | (f) | | | 19.58% | (f) |
Net assets end of year (000’s) | | $ | 48,547 | | | $ | 9,916 | | | $ | 12,814 | | | $ | 434 | |
Ratio and supplemental data | | | | | | | | | | | | | | | | |
Expenses to average net assets | | | | | | | | | | | | | | | | |
After reimbursement/fee waiver | | | 1.55% | (g) | | | 2.20% | (g) | | | 2.20% | (g) | | | 1.20% | (g) |
Before reimbursement/fee waiver | | | 1.78% | (g) | | | 2.51% | (g) | | | 2.26% | (g) | | | 1.85% | (g) |
Net investment loss, to average net assets(d) | | | (0.75%) | (g) | | | (1.36%) | (g) | | | (1.39%) | (g) | | | (0.51%) | (g) |
Portfolio turnover rate | | | 57% | (f) | | | 57% | (f) | | | 57% | (f) | | | 57% | (f) |
156
| | | | | | | | | | | | | | | | | | | | |
| For a share outstanding throughout each period | | Transamerica Growth Opportunities | |
| | | Class A | |
| | | October 31,
2010 | | | October 31,
2009 | | | October 31,
2008 | | | October 31,
2007 | | | October 31,
2006 | |
Net asset value | | | | | | | | | | | | | | | | | | | | |
Beginning of year | | | $7.54 | | | | $6.57 | | | | $11.40 | | | | $8.36 | | | | $7.85 | |
Investment operations | | | | | | | | | | | | | | | | | | | | |
Net investment loss(b) | | | (0.05) | | | | (0.05) | | | | (0.06) | | | | (0.09) | | | | (0.07) | |
Net realized and unrealized gain (loss) on investments | | | 2.33 | | | | 1.02 | | | | (4.77) | | | | 3.13 | | | | 0.58 | |
Total from investment operations | | | 2.28 | | | | 0.97 | | | | (4.83) | | | | 3.04 | | | | 0.51 | |
Net asset value | | | | | | | | | | | | | | | | | | | | |
End of year | | | $9.82 | | | | $7.54 | | | | $6.57 | | | | $11.40 | | | | $8.36 | |
Total return(c) | | | 30.41% | | | | 14.76% | | | | (42.37%) | | | | 36.20% | | | | 6.62% | |
Net assets end of year (000’s) | | | $ 59,685 | | | | $ 48,788 | | | | $ 41,005 | | | | $ 64,825 | | | | $ 56,588 | |
Ratio and supplemental data | | | | | | | | | | | | | | | | | | | | |
Expenses to average net assets | | | | | | | | | | | | | | | | | | | | |
After reimbursement/fee waiver | | | 1.75% | | | | 1.75% | | | | 1.75% | | | | 1.75% | | | | 1.72% | |
Before reimbursement/fee waiver | | | 1.98% | | | | 2.23% | | | | 1.81% | | | | 1.77% | | | | 1.72% | |
Net investment loss, to average net assets(d) | | | (0.56%) | | | | (0.68%) | | | | (0.69%) | | | | (1.00%) | | | | (0.89%) | |
Portfolio turnover rate | | | 63% | | | | 71% | | | | 45% | | | | 85% | | | | 59% | |
| |
| | | | |
| For a share outstanding throughout each period | | Transamerica Growth Opportunities | |
| | | Class B | |
| | | October 31,
2010 | | | October 31,
2009 | | | October 31,
2008 | | | October 31,
2007 | | | October 31,
2006 | |
Net asset value | | | | | | | | | | | | | | | | | | | | |
Beginning of year | | | $6.99 | | | | $6.13 | | | | $10.72 | | | | $7.92 | | | | $7.48 | |
Investment operations | | | | | | | | | | | | | | | | | | | | |
Net investment loss(b) | | | (0.10) | | | | (0.08) | | | | (0.12) | | | | (0.14) | | | | (0.13) | |
Net realized and unrealized gain (loss) on investments | | | 2.16 | | | | 0.94 | | | | (4.47) | | | | 2.94 | | | | 0.57 | |
Total from investment operations | | | 2.06 | | | | 0.86 | | | | (4.59) | | | | 2.80 | | | | 0.44 | |
Net asset value | | | | | | | | | | | | | | | | | | | | |
End of year | | | $9.05 | | | | $6.99 | | | | $6.13 | | | | $10.72 | | | | $7.92 | |
Total return(c) | | | 29.47% | | | | 14.03% | | | | (42.82%) | | | | 35.35% | | | | 5.88% | |
Net assets end of year (000’s) | | | $ 12,406 | | | | $ 14,067 | | | | $ 20,823 | | | | $ 65,123 | | | | $ 66,098 | |
Ratio and supplemental data | | | | | | | | | | | | | | | | | | | | |
Expenses to average net assets | | | | | | | | | | | | | | | | | | | | |
After reimbursement/fee waiver | | | 2.40% | | | | 2.40% | | | | 2.40% | | | | 2.40% | | | | 2.40% | |
Before reimbursement/fee waiver | | | 2.41% | | | | 2.71% | | | | 2.46% | | | | 2.45% | | | | 2.46% | |
Net investment loss, to average net assets(d) | | | (1.21%) | | | | (1.25%) | | | | (1.39%) | | | | (1.66%) | | | | (1.57%) | |
Portfolio turnover rate | | | 63% | | | | 71% | | | | 45% | | | | 85% | | | | 59% | |
157
| | | | | | | | | | | | | | | | | | | | | | | | |
| For a share outstanding throughout each period | | Transamerica Growth Opportunities | |
| | | Class C | | | Class I | |
| | | October 31,
2010 | | | October 31,
2009 | | | October 31,
2008 | | | October 31,
2007 | | | October 31,
2006 | | | October 31,
2010 (e) | |
Net asset value | | | | | | | | | | | | | | | | | | | | | | | | |
Beginning of period/year | | | $7.01 | | | | $6.16 | | | | $10.74 | | | | $7.94 | | | | $7.49 | | | | $8.04 | |
Investment operations | | | | | | | | | | | | | | | | | | | | | | | | |
Net investment loss(b) | | | (0.10) | | | | (0.08) | | | | (0.11) | | | | (0.14) | | | | (0.12) | | | | (0.02) | |
Net realized and unrealized gain (loss) on investments | | | 2.17 | | | | 0.93 | | | | (4.47) | | | | 2.94 | | | | 0.57 | | | | 2.17 | |
Total from investment operations | | | 2.07 | | | | 0.85 | | | | (4.58) | | | | 2.80 | | | | 0.45 | | | | 2.15 | |
Net asset value | | | | | | | | | | | | | | | | | | | | | | | | |
End of year | | | $9.08 | | | | $7.01 | | | | $6.16 | | | | $10.74 | | | | $7.94 | | | | $10.19 | |
Total return(c) | | | 29.53% | | | | 13.80% | | | | (42.64%) | | | | 35.26% | | | | 6.01% | | | | 26.74% | (f) |
Net assets end of year (000’s) | | | $ 12,781 | | | | $ 10,774 | | | | $ 10,619 | | | | $ 22,656 | | | | $ 21,688 | | | | $ 815 | |
Ratio and supplemental data | | | | | | | | | | | | | | | | | | | | | | | | |
Expenses to average net assets | | | | | | | | | | | | | | | | | | | | | | | | |
After reimbursement/fee waiver | | | 2.40% | | | | 2.40% | | | | 2.34% | | | | 2.36% | | | | 2.38% | | | | 1.40% | (g) |
Before reimbursement/fee waiver | | | 2.41% | | | | 2.62% | | | | 2.34% | | | | 2.36% | | | | 2.38% | | | | 1.48% | (g) |
Net investment loss, to average net assets(d) | | | (1.21%) | | | | (1.31%) | | | | (1.29%) | | | | (1.61%) | | | | (1.54%) | | | | (0.23%) | (g) |
Portfolio turnover rate | | | 63% | | | | 71% | | | | 45% | | | | 85% | | | | 59% | | | | 63% | (f) |
| | | | | | | | | | | | | | | | | | | | |
| | | Transamerica Money Market | |
| For a share outstanding throughout each period | | Class A | |
| | | October 31,
2010 | | | October 31,
2009 | | | October 31,
2008 | | | October 31,
2007 | | | October 31,
2006 | |
Net asset value | | | | | | | | | | | | | | | | | | | | |
Beginning of year | | | $1.00 | | | | $1.00 | | | | $1.00 | | | | $1.00 | | | | $1.00 | |
Investment operations | | | | | | | | | | | | | | | | | | | | |
Net investment income(b) | | | – | (k) | | | – | (k) | | | 0.02 | | | | 0.05 | | | | 0.04 | |
Net realized and unrealized gain on investments | | | – | (k) | | | – | (k) | | | – | (k) | | | – | | | | – | |
Total from investment operations | | | – | (k) | | | – | (k) | | | 0.02 | | | | 0.05 | | | | 0.04 | |
| | | | | | | | | | | | | | | | | | | | |
Net equalization and credits | | | – | (k) | | | – | | | | – | | | | – | | | | – | |
Distributions | | | | | | | | | | | | | | | | | | | | |
Net investment income | | | – | (k) | | | – | (k) | | | (0.02) | | | | (0.05) | | | | (0.04) | |
Net realized gains on investments | | | – | | | | – | | | | – | | | | – | (k) | | | – | |
Total distributions | | | – | (k) | | | – | (k) | | | (0.02) | | | | (0.05) | | | | (0.04) | |
Net asset value | | | | | | | | | | | | | | | | | | | | |
End of year | | | $1.00 | | | | $1.00 | | | | $1.00 | | | | $1.00 | | | | $1.00 | |
Total return(c) | | | 0.01% | | | | 0.21% | | | | 2.52% | | | | 4.61% | | | | 4.09% | |
Net assets end of year (000’s) | | | $ 119,744 | | | | $ 146,598 | | | | $ 142,456 | | | | $ 95,766 | | | | $ 78,716 | |
Ratio and supplemental data | | | | | | | | | | | | | | | | | | | | |
Expenses to average net assets | | | | | | | | | | | | | | | | | | | | |
After reimbursement/fee waiver | | | 0.22% | (p) | | | 0.60% | (p) | | | 0.83% | | | | 0.83% | | | | 0.83% | |
Before reimbursement/fee waiver | | | 1.19% | | | | 1.11% | | | | 1.08% | | | | 1.20% | | | | 1.23% | |
Net investment income, to average net assets(d) | | | –% | (q) | | | 0.20% | | | | 2.40% | | | | 4.54% | | | | 3.98% | |
158
| | | | | | | | | | | | | | | | | | | | |
| For a share outstanding throughout each period | | Transamerica Money Market | |
| | | Class B | |
| | | October 31,
2010 | | | October 31,
2009 | | | October 31,
2008 | | | October 31,
2007 | | | October 31,
2006 | |
Net asset value | | | | | | | | | | | | | | | | | | | | |
Beginning of year | | | $1.00 | | | | $1.00 | | | | $1.00 | | | | $1.00 | | | | $1.00 | |
Investment operations | | | | | | | | | | | | | | | | | | | | |
Net investment income(b) | | | – | (k) | | | – | (k) | | | 0.02 | | | | 0.04 | | | | 0.03 | |
Net realized and unrealized gain on investments | | | – | (k) | | | – | (k) | | | – | (k) | | | – | | | | – | |
Total from investment operations | | | – | (k) | | | – | (k) | | | 0.02 | | | | 0.04 | | | | 0.03 | |
| | | | | | | | | | | | | | | | | | | | |
Net equalization and credits | | | – | (k) | | | – | | | | – | | | | – | | | | – | |
Distributions | | | | | | | | | | | | | | | | | | | | |
Net investment income | | | – | (k) | | | – | (k) | | | (0.02 | ) | | | (0.04 | ) | | | (0.03 | ) |
Net realized gains on investments | | | – | | | | – | | | | – | | | | – | (k) | | | – | |
Total distributions | | | – | (k) | | | – | (k) | | | (0.02 | ) | | | (0.04 | ) | | | (0.03 | ) |
Net asset value | | | | | | | | | | | | | | | | | | | | |
End of year | | | $1.00 | | | | $1.00 | | | | $1.00 | | | | $1.00 | | | | $1.00 | |
Total return(c) | | | 0.01% | | | | 0.08% | | | | 1.83% | | | | 3.92% | | | | 3.41% | |
Net assets end of year (000’s) | | | $ 19,442 | | | | $ 35,612 | | | | $ 40,110 | | | | $ 23,324 | | | | $ 25,727 | |
Ratio and supplemental data | | | | | | | | | | | | | | | | | | | | |
Expenses to average net assets | | | | | | | | | | | | | | | | | | | | |
After reimbursement/fee waiver | | | 0.21% | (p) | | | 0.73% | (p) | | | 1.48% | | | | 1.48% | | | | 1.48% | |
Before reimbursement/fee waiver | | | 1.81% | | | | 1.75% | | | | 1.75% | | | | 1.83% | | | | 1.80% | |
Net investment income, to average net assets(d) | | | –% | (q) | | | 0.08% | | | | 1.75% | | | | 3.87% | | | | 3.50% | |
| | | | | | | | | | | | | | | | | | | | | | | | |
| For a share outstanding throughout each period | | Transamerica Money Market | |
| | | Class C | | | Class I | |
| | | October 31,
2010 | | | October 31,
2009 | | | October 31,
2008 | | | October 31,
2007 | | | October 31,
2006 | | | October 31,
2010 (e) | |
Net asset value | | | | | | | | | | | | | | | | | | | | | | | | |
Beginning of year | | | $1.00 | | | | $1.00 | | | | $1.00 | | | | $1.00 | | | | $1.00 | | | | $1.00 | |
Investment operations | | | | | | | | | | | | | | | | | | | | | | | | |
Net investment income(b) | | | – | (k) | | | – | (k) | | | 0.02 | | | | 0.04 | | | | 0.03 | | | | – | (k) |
Net realized and unrealized gain on investments | | | – | (k) | | | – | (k) | | | – | (k) | | | – | | | | – | | | | – | (k) |
Total from investment operations | | | – | (k) | | | – | (k) | | | 0.02 | | | | 0.04 | | | | 0.03 | | | | – | (k) |
| | | | | | | | | | | | | | | | | | | | | | | | |
Net equalization and credits | | | – | (k) | | | – | | | | – | | | | – | | | | – | | | | – | (k) |
Distributions | | | | | | | | | | | | | | | | | | | | | | | | |
Net investment income | | | – | (k) | | | – | (k) | | | (0.02) | | | | (0.04) | | | | (0.03) | | | | – | (k) |
Net realized gains on investments | | | – | | | | – | | | | – | | | | – | (k) | | | – | | | | – | |
Total distributions | | | – | (k) | | | – | (k) | | | (0.02) | | | | (0.04) | | | | (0.03) | | | | – | (k) |
Net asset value | | | | | | | | | | | | | | | | | | | | | | | | |
End of year | | | $1.00 | | | | $1.00 | | | | $1.00 | | | | $1.00 | | | | $1.00 | | | | $1.00 | |
Total return(c) | | | 0.01% | | | | 0.07% | | | | 1.86% | | | | 3.92% | | | | 3.16% | | | | 0.01% | (f) |
Net assets end of year (000’s) | | | $ 33,800 | | | | $ 46,177 | | | | $ 59,991 | | | | $ 19,638 | | | | $ 17,286 | | | | $ 55 | |
Ratio and supplemental data | | | | | | | | | | | | | | | | | | | | | | | | |
Expenses to average net assets | | | | | | | | | | | | | | | | | | | | | | | | |
After reimbursement/fee waiver | | | 0.22% | (p) | | | 0.76% | (p) | | | 1.48% | | | | 1.48% | | | | 1.48% | | | | 0.22% | (g)(p) |
Before reimbursement/fee waiver | | | 1.66% | | | | 1.64% | | | | 1.67% | | | | 1.73% | | | | 1.82% | | | | 3.16% | (g) |
Net investment income, to average net assets(d) | | | –% | (q) | | | 0.07% | | | | 1.65% | | | | 3.88% | | | | 3.40% | | | | 0.01% | (g) |
159
| | | | | | | | | | | | | | | | | | |
| For a share outstanding throughout each period | | | | Transamerica Multi-Manager Alternative Strategies Portfolio | |
| | | | | Class A | |
| | | | | October 31, 2010 | | | October 31, 2009 | | | October 31, 2008 | | | October 31,
2007 (w) | |
| | | | | |
Net asset value | | | | | | | | | | | | | | | | | | |
Beginning of period/year | | | | | $9.35 | | | | $8.30 | | | | $10.78 | | | | $10.00 | |
Investment operations | | | | | | | | | | | | | | | | | | |
From net investment income(b),(h) | | | | | 0.14 | | | | 0.29 | | | | 0.20 | | | | 0.05 | |
From net realized and unrealized gain (loss) on affiliated investments | | | | | 0.58 | | | | 1.08 | | | | (2.43) | | | | 0.73 | |
Total from investment operations | | | | | 0.72 | | | | 1.37 | | | | (2.23) | | | | 0.78 | |
Distributions | | | | | | | | | | | | | | | | | | |
Net investment income | | | | | (0.15) | | | | (0.32) | | | | (0.25) | | | | – | |
From return of capital | | | | | (0.10) | | | | – | | | | – | | | | – | |
Total distributions | | | | | (0.25) | | | | (0.32) | | | | (0.25) | | | | – | |
Net asset value | | | | | | | | | | | | | | | | | | |
End of year | | | | | $9.82 | | | | $9.35 | | | | $8.30 | | | | $10.78 | |
Total return(c) | | | | | 7.83% | | | | 17.21% | | | | (21.08%) | | | | 7.80% | (f) |
Net assets end of year (000’s) | | | | $ | 128,041 | | | $ | 119,693 | | | $ | 97,482 | | | $ | 38,870 | |
Ratio and supplemental data | | | | | | | | | | | | | | | | | | |
Expenses to average net assets:(i) | | | | | | | | | | | | | | | | | | |
After reimbursement/fee waiver | | | | | 0.80% | | | | 0.81% | | | | 0.84% | (x) | | | 0.90% | (g) |
Before reimbursement/fee waiver | | | | | 0.80% | | | | 0.81% | | | | 0.77% | (x) | | | 1.29% | (g) |
Net investment income, to average net assets(h),(d) | | | | | 1.51% | | | | 3.43% | | | | 1.98% | | | | 0.58% | (g) |
Portfolio turnover rate(o) | | | | | 35% | | | | 18% | | | | 5% | | | | –% | (f),(y) |
| | | | | | | | | | | | | | | | | | |
| For a share outstanding throughout each period | | | | Transamerica Multi-Manager Alternative Strategies Portfolio | |
| | | | | Class C | |
| | | | | October 31, 2010 | | | October 31, 2009 | | | October 31, 2008 | | | October 31, 2007 (w) | |
Net asset value | | | | | | | | | | | | | | | | | | |
Beginning of period/year | | | | | $9.27 | | | | $8.23 | | | | $10.72 | | | | $10.00 | |
Investment operations | | | | | | | | | | | | | | | | | | |
From net investment income (loss)(b),(h) | | | | | 0.08 | | | | 0.24 | | | | 0.15 | | | | (0.01) | |
From net realized and unrealized gain (loss) on affiliated investments | | | | | 0.57 | | | | 1.06 | | | | (2.42) | | | | 0.73 | |
Total from investment operations | | | | | 0.65 | | | | 1.30 | | | | (2.27) | | | | 0.72 | |
Distributions | | | | | | | | | | | | | | | | | | |
Net investment income | | | | | (0.09) | | | | (0.26) | | | | (0.22) | | | | – | |
From return of capital | | | | | (0.10) | | | | – | | | | – | | | | – | |
Total distributions | | | | | (0.19) | | | | (0.26) | | | | (0.22) | | | | – | |
Net asset value | | | | | | | | | | | | | | | | | | |
End of year | | | | | $9.73 | | | | $9.27 | | | | $8.23 | | | | $10.72 | |
Total return(c) | | | | | 7.12% | | | | 16.37% | | | | (21.52%) | | | | 7.20% | (f) |
Net assets end of year (000’s) | | | | $ | 114,662 | | | $ | 96,376 | | | $ | 89,701 | | | $ | 49,306 | |
Ratio and supplemental data | | | | | | | | | | | | | | | | | | |
Expenses to average net assets:(i) | | | | | | | | | | | | | | | | | | |
After reimbursement/fee waiver | | | | | 1.44% | | | | 1.45% | | | | 1.52% | (x) | | | 1.55% | (g) |
Before reimbursement/fee waiver | | | | | 1.44% | | | | 1.45% | | | | 1.43% | (x) | | | 1.99% | (g) |
Net investment income (loss), to average net assets(h),(d) | | | | | 0.82% | | | | 2.92% | | | | 1.53% | | | | (0.07%) | (g) |
Portfolio turnover rate(o) | | | | | 35% | | | | 18% | | | | 5% | | | | –% | (f),(y) |
160
| | | | |
| For a share outstanding throughout each period | | Transamerica
Multi-Manager
Alternative
Strategies
Portfolio | |
| | | Class I | |
| | | October 31, 2010 (e) | |
Net asset value | | | | |
Beginning of period | | | $9.49 | |
Investment operations | | | | |
From net investment income(b),(h) | | | 0.07 | |
From net realized and unrealized gain on affiliated
investments | | | 0.57 | |
Total from investment operations | | | 0.64 | |
Distributions | | | | |
Net investment income | | | (0.19) | |
From return of capital | | | (0.10) | |
Total distributions | | | (0.29) | |
Net asset value | | | | |
End of year | | | $9.84 | |
Total return(c) | | | 6.90% | (f) |
Net assets end of year (000’s) | | $ | 34,131 | |
Ratio and supplemental data | | | | |
Expenses to average net assets:(i) | | | | |
After reimbursement/fee waiver | | | 0.50% | (g) |
Before reimbursement/fee waiver | | | 0.50% | (g) |
Net investment income, to average net assets(h) | | | 0.82% | (g) |
Portfolio turnover rate(o) | | | 35% | (f) |
| | | | | | | | | | | | | | | | | | | | |
| For a share outstanding throughout each period | | Transamerica Multi-Manager International Portfolio | |
| | | Class A | |
| | | October 31,
2010 | | | October 31,
2009 | | | October 31,
2008 | | | October 31,
2007 | | | October 31,
2006 (z) | |
Net asset value | | | | | | | | | | | | | | | | | | | | |
Beginning of period/year | | | $8.53 | | | | $6.57 | | | | $13.24 | | | | $10.63 | | | | $10.00 | |
Investment operations | | | | | | | | | | | | | | | | | | | | |
From net investment income (loss)(b),(h) | | | 0.09 | | | | 0.17 | | | | 0.27 | | | | 0.32 | | | | (0.04) | |
From net realized and unrealized gain (loss) on
affiliated investments | | | 1.33 | | | | 1.84 | | | | (6.53) | | | | 2.87 | | | | 0.67 | |
Total from investment operations | | | 1.42 | | | | 2.01 | | | | (6.26) | | | | 3.19 | | | | 0.63 | |
Distributions | | | | | | | | | | | | | | | | | | | | |
Net investment income | | | (0.11) | | | | (0.05) | | | | (0.32) | | | | (0.58) | | | | – | |
Net realized gains on affiliated investments | | | – | | | | – | | | | (0.09) | | | | – | | | | – | |
Total distributions | | | (0.11) | | | | (0.05) | | | | (0.41) | | | | (0.58) | | | | – | |
Net asset value | | | | | | | | | | | | | | | | | | | | |
End of year | | | $9.84 | | | | $8.53 | | | | $6.57 | | | | $13.24 | | | | $10.63 | |
Total return(c) | | | 16.80% | | | | 30.86% | | | | (48.61%) | | | | 31.30% | | | | 6.30% | (f) |
Net assets end of year (000’s) | | $ | 135,479 | | | $ | 134,751 | | | $ | 103,077 | | | $ | 178,422 | | | $ | 58,142 | |
Ratio and supplemental data | | | | | | | | | | | | | | | | | | | | |
Expenses to average net assets:(i) | | | | | | | | | | | | | | | | | | | | |
After reimbursement/fee waiver | | | 0.70% | | | | 0.74% | | | | 0.65% | | | | 0.65% | | | | 0.80% | (g) |
Before reimbursement/fee waiver | | | 0.70% | | | | 0.74% | | | | 0.65% | | | | 0.65% | | | | 0.88% | (g) |
Net investment income (loss), to average net assets(h),(d) | | | 1.04% | | | | 2.35% | | | | 2.59% | | | | 2.78% | | | | (0.67%) | (g) |
Portfolio turnover rate(o) | | | 11% | | | | 32% | | | | 38% | | | | 1% | | | | 1% | (f) |
161
| | | | | | | | | | | | | | | | | | | | |
| For a share outstanding throughout each period | | Transamerica Multi-Manager International Portfolio | |
| | | Class B | |
| | | October 31,
2010 | | | October 31,
2009 | | | October 31,
2008 | | | October 31,
2007 | | | October 31,
2006 (z) | |
Net asset value | | | | | | | | | | | | | | | | | | | | |
Beginning of period/year | | | $8.45 | | | | $6.50 | | | | $13.13 | | | | $10.59 | | | | $10.00 | |
Investment operations | | | | | | | | | | | | | | | | | | | | |
From net investment income (loss)(b),(h) | | | 0.02 | | | | 0.01 | | | | 0.21 | | | | 0.23 | | | | (0.09) | |
From net realized and unrealized gain (loss) on affiliated investments | | | 1.32 | | | | 1.94 | | | | (6.50) | | | | 2.86 | | | | 0.68 | |
Total from investment operations | | | 1.34 | | | | 1.95 | | | | (6.29) | | | | 3.09 | | | | 0.59 | |
Distributions | | | | | | | | | | | | | | | | | | | | |
Net investment income | | | (0.05) | | | | – | | | | (0.25) | | | | (0.55) | | | | – | |
Net realized gains on affiliated investments | | | – | | | | – | | | | (0.09) | | | | – | | | | – | |
Total distributions | | | (0.05) | | | | – | | | | (0.34) | | | | (0.55) | | �� | | – | |
Net asset value | | | | | | | | | | | | | | | | | | | | |
End of year | | | $9.74 | | | | $8.45 | | | | $6.50 | | | | $13.13 | | | | $10.59 | |
Total return(c) | | | 15.95% | | | | 30.00% | | | | (49.04%) | | | | 30.32% | | | | 5.90% | (f) |
Net assets end of year (000’s) | | $ | 18,432 | | | $ | 18,010 | | | $ | 15,781 | | | $ | 30,060 | | | $ | 9,849 | |
Ratio and supplemental data | | | | | | | | | | | | | | | | | | | | |
Expenses to average net assets:(i) | | | | | | | | | | | | | | | | | | | | |
After reimbursement/fee waiver | | | 1.45% | | | | 1.45% | | | | 1.42% | | | | 1.43% | | | | 1.45% | (g) |
Before reimbursement/fee waiver | | | 1.49% | | | | 1.57% | | | | 1.42% | | | | 1.43% | | | | 1.69% | (g) |
Net investment income (loss), to average net assets(h),(d) | | | 0.19% | | | | 0.08% | | | | 1.95% | | | | 1.98% | | | | (1.32%) | (g) |
Portfolio turnover rate(o) | | | 11% | | | | 32% | | | | 38% | | | | 1% | | | | 1% | (f) |
| | | | | | | | | | | | | | | | | | | | |
| For a share outstanding throughout each period | | Transamerica Multi-Manager International Portfolio | |
| | | Class C | |
| | | October 31,
2010 | | | October 31,
2009 | | | October 31,
2008 | | | October 31,
2007 | | | October 31,
2006 (z) | |
Net asset value | | | | | | | | | | | | | | | | | | | | |
Beginning of period/year | | | $8.45 | | | | $6.50 | | | | $13.13 | | | | $10.58 | | | | $10.00 | |
Investment operations | | | | | | | | | | | | | | | | | | | | |
From net investment income (loss)(b),(h) | | | 0.02 | | | | 0.03 | | | | 0.21 | | | | 0.24 | | | | (0.09) | |
From net realized and unrealized gain (loss) on
affiliated investments | | | 1.33 | | | | 1.92 | | | | (6.49) | | | | 2.86 | | | | 0.67 | |
Total from investment operations | | | 1.35 | | | | 1.95 | | | | (6.28) | | | | 3.10 | | | | 0.58 | |
Distributions | | | | | | | | | | | | | | | | | | | | |
Net investment income | | | (0.05) | | | | – | | | | (0.26) | | | | (0.55) | | | | – | |
Net realized gains on affiliated investments | | | – | | | | – | | | | (0.09) | | | | – | | | | – | |
Total distributions | | | (0.05) | | | | – | | | | (0.35) | | | | (0.55) | | | | – | |
Net asset value | | | | | | | | | | | | | | | | | | | | |
End of year | | | $9.75 | | | | $8.45 | | | | $6.50 | | | | $13.13 | | | | $10.58 | |
Total return(c) | | | 16.10% | | | | 30.00% | | | | (48.98%) | | | | 30.45% | | | | 5.80% | (f) |
Net assets end of year (000’s) | | $ | 144,849 | | | $ | 132,777 | | | $ | 128,742 | | | $ | 250,419 | | | $ | 76,650 | |
Ratio and supplemental data | | | | | | | | | | | | | | | | | | | | |
Expenses to average net assets:(i) | | | | | | | | | | | | | | | | | | | | |
After reimbursement/fee waiver | | | 1.36% | | | | 1.43% | | | | 1.31% | | | | 1.31% | | | | 1.45% | (g) |
Before reimbursement/fee waiver | | | 1.36% | | | | 1.43% | | | | 1.31% | | | | 1.31% | | | | 1.53% | (g) |
Net investment income (loss), to average net assets(h),(d) | | | 0.27% | | | | 0.50% | | | | 2.01% | | | | 2.08% | | | | (1.32%) | (g) |
Portfolio turnover rate(o) | | | 11% | | | | 32% | | | | 38% | | | | 1% | | | | 1% | (f) |
162
| | | | |
| For a share outstanding throughout each period | | Transamerica
Multi-Manager
International
Portfolio | |
| | | Class I | |
| | | October 31,
2010 (e) | |
| |
Net asset value | | | | |
Beginning of period | | | $8.84 | |
| |
Investment operations | | | | |
From net investment loss(b),(h) | | | (0.02) | |
From net realized and unrealized gain on affiliated investments | | | 1.19 | |
Total from investment operations | | | 1.17 | |
| |
Distributions | | | | |
Net investment income | | | (0.15) | |
| |
Net asset value | | | | |
End of year | | | $9.86 | |
| |
Total return(c) | | | 13.41% | (f) |
| |
Net assets end of year (000’s) | | $ | 28,047 | |
| |
Ratio and supplemental data | | | | |
| |
Expenses to average net assets:(i) | | | | |
After reimbursement/fee waiver | | | 0.34% | (g) |
Before reimbursement/fee waiver | | | 0.34% | (g) |
Net investment loss, to average net assets(h) | | | (0.21%) | (g) |
Portfolio turnover rate(o) | | | 11% | (f) |
| | | | | | | | | | | | | | | | | | | | | | | | |
| For a share outstanding throughout each period | | Transamerica Short-Term Bond | |
| | | Class A | | | Class C | |
| | | October 31,
2010 | | | October 31,
2009 | | | October 31,
2008(r) | | | October 31,
2010 | | | October 31,
2009 | | | October 31,
2008(r) | |
| | | | | | |
Net asset value | | | | | | | | | | | | | | | | | | | | | | | | |
Beginning of period/year | | | $10.26 | | | | $9.44 | | | | $10.00 | | | | $10.24 | | | | $9.42 | | | | $10.00 | |
| | | | | | |
Investment operations | | | | | | | | | | | | | | | | | | | | | | | | |
Net investment income(b) | | | 0.43 | | | | 0.51 | | | | 0.38 | | | | 0.36 | | | | 0.43 | | | | 0.32 | |
Net realized and unrealized gain (loss) on
investments | | | 0.29 | | | | 0.78 | | | | (0.54) | | | | 0.28 | | | | 0.80 | | | | (0.55) | |
Total from investment operations | | | 0.72 | | | | 1.29 | | | | (0.16) | | | | 0.64 | | | | 1.23 | | | | (0.23) | |
| | | | | | |
Distributions | | | | | | | | | | | | | | | | | | | | | | | | |
Net investment income | | | (0.45) | | | | (0.47) | | | | (0.40) | | | | (0.37) | | | | (0.41) | | | | (0.35) | |
Total distributions | | | (0.45) | | | | (0.47) | | | | (0.40) | | | | (0.37) | | | | (0.41) | | | | (0.35) | |
| | | | | | |
Net asset value | | | | | | | | | | | | | | | | | | | | | | | | |
End of year | | | $10.53 | | | | $10.26 | | | | $9.44 | | | | $10.51 | | | | $10.24 | | | | $9.42 | |
| | | | | | |
Total return(c) | | | 7.15% | | | | 13.40% | | | | (1.70%) | (f) | | | 6.32% | | | | 12.74% | | | | (2.43%) | (f) |
| | | | | | |
Net assets end of year (000’s) | | $ | 856,959 | | | $ | 289,879 | | | $ | 5,663 | | | $ | 834,859 | | | $ | 317,130 | | | $ | 7,263 | |
| | | | | | |
Ratio and supplemental data | | | | | | | | | | | | | | | | | | | | | | | | |
Expenses to average net assets | | | | | | | | | | | | | | | | | | | | | | | | |
After reimbursement/fee waiver | | | 0.83% | | | | 0.91% | | | | 1.11% | (g) | | | 1.59% | | | | 1.65% | | | | 1.76% | (g) |
Before reimbursement/fee waiver | | | 0.97% | | | | 1.09% | | | | 1.11% | (g) | | | 1.63% | | | | 1.74% | | | | 1.76% | (g) |
Net investment income, to average net assets(d) | | | 4.16% | | | | 5.14% | | | | 3.92% | (g) | | | 3.40% | | | | 4.38% | | | | 3.28% | (g) |
Portfolio turnover rate | | | 54% | | | | 77% | | | | 67% | (f) | | | 54% | | | | 77% | | | | 67% | (f) |
163
| | | | |
| For a share outstanding throughout each period | | Transamerica
Short-Term
Bond | |
| | | Class I | |
| | | October 31,
2010 (e) | |
Net asset value | | | | |
Beginning of period/year | | | $10.14 | |
Investment operations | | | | |
Net investment income(b) | | | 0.39 | |
Net realized and unrealized gain (loss) on investments | | | 0.24 | |
Total from investment operations | | | 0.63 | |
Distributions | | | | |
Net investment income | | | (0.42) | |
Total distributions | | | (0.42) | |
Net asset value | | | | |
End of year | | | $10.35 | |
Total return(c) | | | 6.34% | (f) |
Net assets end of year (000’s) | | $ | 198,461 | |
Ratio and supplemental data | | | | |
Expenses to average net assets | | | | |
After reimbursement/fee waiver | | | 0.65% | (g) |
Before reimbursement/fee waiver | | | 0.67% | (g) |
Net investment income, to average net assets(d) | | | 4.17% | (g) |
Portfolio turnover rate | | | 54% | (f) |
| | | | | | | | | | | | | | | | | | | | |
| For a share outstanding throughout each period | | Transamerica Small/Mid Cap Value | |
| | | Class A | |
| | | October 31,
2010 | | | October 31,
2009 | | | October 31,
2008 | | | October 31,
2007 | | | October 31,
2006 | |
Net asset value | | | | | | | | | | | | | | | | | | | | |
Beginning of year | | | $14.72 | | | | $12.70 | | | | $23.78 | | | | $17.78 | | | | $16.69 | |
Investment operations | | | | | | | | | | | | | | | | | | | | |
Net investment income (loss)(b) | | | (0.02) | | | | – | (k) | | | 0.21 | | | | 0.14 | | | | 0.28 | |
Net realized and unrealized gain (loss) on investments | | | 4.19 | | | | 2.33 | | | | (8.64) | | | | 6.30 | | | | 1.96 | |
Total from investment operations | | | 4.17 | | | | 2.33 | | | | (8.43) | | | | 6.44 | | | | 2.24 | |
Distributions | | | | | | | | | | | | | | | | | | | | |
Net investment income | | | – | | | | (0.31) | | | | (0.16) | | | | (0.13) | | | | (0.03) | |
Net realized gains on investments | | | – | | | | – | | | | (2.49) | | | | (0.31) | | | | (1.12) | |
Total distributions | | | – | | | | (0.31) | | | | (2.65) | | | | (0.44) | | | | (1.15) | |
Net asset value | | | | | | | | | | | | | | | | | | | | |
End of year | | | $18.89 | | | | $14.72 | | | | $12.70 | | | | $23.78 | | | | $17.78 | |
Total return(c) | | | 28.33% | | | | 19.12% | | | | (39.47%) | | | | 36.99% | | | | 13.97% | |
Net assets end of year (000’s) | | $ | 283,240 | | | $ | 201,569 | | | $ | 199,210 | | | $ | 96,667 | | | $ | 47,014 | |
Ratio and supplemental data | | | | | | | | | | | | | | | | | | | | |
Expenses to average net assets | | | | | | | | | | | | | | | | | | | | |
After reimbursement/fee waiver | | | 1.47% | | | | 1.59% | | | | 1.41% | | | | 1.41% | | | | 1.39% | |
Before reimbursement/fee waiver | | | 1.47% | | | | 1.59% | | | | 1.41% | | | | 1.41% | | | | 1.39% | |
Net investment income (loss), to average net assets(d) | | | (0.12%) | | | | –% | (q) | | | 1.18% | | | | 0.71% | | | | 1.61% | |
Portfolio turnover rate | | | 57% | | | | 101% | | | | 48% | | | | 22% | | | | 21% | |
164
| | | | | | | | | | | | | | | | | | | | |
| For a share outstanding throughout each period | | Transamerica Small/Mid Cap Value | |
| | | Class B | |
| | | October 31,
2010 | | | October 31,
2009 | | | October 31,
2008 | | | October 31,
2007 | | | October 31,
2006 | |
Net asset value | | | | | | | | | | | | | | | | | | | | |
Beginning of year | | | $14.16 | | | | $12.19 | | | | $22.89 | | | | $17.12 | | | | $16.21 | |
Investment operations | | | | | | | | | | | | | | | | | | | | |
Net investment income (loss)(b) | | | (0.12) | | | | (0.08) | | | | 0.06 | | | | 0.02 | | | | (0.01) | |
Net realized and unrealized gain (loss) on investments | | | 4.01 | | | | 2.26 | | | | (8.27) | | | | 6.06 | | | | 2.07 | |
Total from investment operations | | | 3.89 | | | | 2.18 | | | | (8.21) | | | | 6.08 | | | | 2.06 | |
Distributions | | | | | | | | | | | | | | | | | | | | |
Net investment income | | | – | | | | (0.21) | | | | – | | | | – | | | | (0.03) | |
Net realized gains on investments | | | – | | | | – | | | | (2.49) | | | | (0.31) | | | | (1.12) | |
Total distributions | | | – | | | | (0.21) | | | | (2.49) | | | | (0.31) | | | | (1.15) | |
Net asset value | | | | | | | | | | | | | | | | | | | | |
End of year | | | $18.05 | | | | $14.16 | | | | $12.19 | | | | $22.89 | | | | $17.12 | |
Total return(c) | | | 27.47% | | | | 18.37% | | | | (39.85%) | | | | 36.09% | | | | 13.21% | |
Net assets end of year (000’s) | | | $ 38,355 | | | | $ 34,573 | | | | $ 31,716 | | | | $ 53,285 | | | | $ 47,007 | |
Ratio and supplemental data | | | | | | | | | | | | | | | | | | | | |
Expenses to average net assets | | | | | | | | | | | | | | | | | | | | |
After reimbursement/fee waiver | | | 2.12% | | | | 2.24% | | | | 2.07% | | | | 2.07% | | | | 2.10% | |
Before reimbursement/fee waiver | | | 2.12% | | | | 2.24% | | | | 2.07% | | | | 2.07% | | | | 2.10% | |
Net investment income (loss), to average net assets(d) | | | (0.74%) | | | | (0.66%) | | | | 0.34% | | | | 0.12% | | | | (0.06%) | |
Portfolio turnover rate | | | 57% | | | | 101% | | | | 48% | | | | 22% | | | | 21% | |
| | | | | | | | | | | | | | | | | | | | | | | | |
| For a share outstanding throughout each period | | Transamerica Small/Mid Cap Value | |
| | | Class C | | | Class I | |
| | | October 31,
2010 | | | October 31,
2009 | | | October 31,
2008 | | | October 31,
2007 | | | October 31,
2006 | | | October 31,
2010 (e) | |
Net asset value | | | | | | | | | | | | | | | | | | | | | | | | |
Beginning of period/year | | | $14.00 | | | | $12.10 | | | | $22.81 | | | | $17.09 | | | | $16.18 | | | | $15.44 | |
Investment operations | | | | | | | | | | | | | | | | | | | | | | | | |
Net investment income (loss)(b) | | | (0.12) | | | | (0.08) | | | | 0.09 | | | | 0.02 | | | | – | (k) | | | (0.02) | |
Net realized and unrealized gain (loss) on investments | | | 3.98 | | | | 2.23 | | | | (8.24) | | | | 6.05 | | | | 2.06 | | | | 3.73 | |
Total from investment operations | | | 3.86 | | | | 2.15 | | | | (8.15) | | | | 6.07 | | | | 2.06 | | | | 3.71 | |
Distributions | | | | | | | | | | | | | | | | | | | | | | | | |
Net investment income | | | – | | | | (0.25) | | | | (0.07) | | | | (0.04) | | | | (0.03) | | | | – | |
Net realized gains on investments | | | – | | | | – | | | | (2.49) | | | | (0.31) | | | | (1.12) | | | | – | |
Total distributions | | | – | | | | (0.25) | | | | (2.56) | | | | (0.35) | | | | (1.15) | | | | – | |
Net asset value | | | | | | | | | | | | | | | | | | | | | | | | |
End of year | | | $17.86 | | | | $14.00 | | | | $12.10 | | | | $22.81 | | | | $17.09 | | | | $19.15 | |
Total return(c) | | | 27.57% | | | | 18.42% | | | | (39.84%) | | | | 36.16% | | | | 13.23% | | | | 24.03% | (f) |
Net assets end of year (000’s) | | | $ 169,903 | | | | $ 115,960 | | | | $ 95,729 | | | | $ 63,856 | | | | $ 29,105 | | | | $ 40,346 | |
Ratio and supplemental data | | | | | | | | | | | | | | | | | | | | | | | | |
Expenses to average net assets | | | | | | | | | | | | | | | | | | | | | | | | |
After reimbursement/fee waiver | | | 2.07% | | | | 2.20% | | | | 2.04% | | | | 2.04% | | | | 2.08% | | | | 1.04% | (g) |
Before reimbursement/fee waiver | | | 2.07% | | | | 2.20% | | | | 2.04% | | | | 2.04% | | | | 2.08% | | | | 1.04% | (g) |
Net investment income (loss), to average net assets(d) | | | (0.73%) | | | | (0.63%) | | | | 0.52% | | | | 0.10% | | | | (0.03%) | | | | (0.11%) | (g) |
Portfolio turnover rate | | | 57% | | | | 101% | | | | 48% | | | | 22% | | | | 21% | | | | 57% | (f) |
165
| | | | | | | | | | | | | | | | | | | | |
| For a share outstanding throughout each period | | Transamerica WMC Diversified Growth(s) | |
| | | Class A | |
| | | October 31,
2010 | | | October 31, 2009 | | | October 31, 2008 | | | October 31, 2007 | | | October 31, 2006 | |
Net asset value | | | | | | | | | | | | | | | | | | | | |
Beginning of year | | | $7.54 | | | | $6.85 | | | | $12.07 | | | | $9.83 | | | | $8.87 | |
Investment operations | | | | | | | | | | | | | | | | | | | | |
Net investment loss(b) | | | (0.02) | | | | – | (k) | | | (0.01) | | | | (0.05) | | | | (0.07) | |
Net realized and unrealized gain (loss) on investments | | | 1.38 | | | | 0.69 | | | | (5.21) | | | | 2.29 | | | | 1.11 | |
Total from investment operations | | | 1.36 | | | | 0.69 | | | | (5.22) | | | | 2.24 | | | | 1.04 | |
Distributions | | | | | | | | | | | | | | | | | | | | |
Net realized gains on investments | | | – | | | | – | | | | – | | | | – | | | | (0.08) | |
Total distributions | | | – | | | | – | | | | – | | | | – | | | | (0.08) | |
Net asset value | | | | | | | | | | | | | | | | | | | | |
End of year | | | $8.90 | | | | $7.54 | | | | $6.85 | | | | $12.07 | | | | $9.83 | |
Total return(c) | | | 18.04% | | | | 10.07% | | | | (43.25%) | | | | 22.79% | | | | 11.71% | |
Net assets end of year (000’s) | | | $ 303,912 | | | | $ 292,838 | | | | $ 300,140 | | | | $ 532,251 | | | | $ 500,483 | |
Ratio and supplemental data | | | | | | | | | | | | | | | | | | | | |
Expenses to average net assets | | | | | | | | | | | | | | | | | | | | |
After reimbursement/fee waiver | | | 1.52% | | | | 1.52% | | | | 1.39% | | | | 1.40% | | | | 1.51% | |
Before reimbursement/fee waiver | | | 1.56% | | | | 1.67% | | | | 1.39% | | | | 1.40% | | | | 1.51% | |
Net investment income (loss), to average net assets(d) | | | (0.28%) | | | | 0.06% | | | | (0.07%) | | | | (0.48%) | | | | (0.70%) | |
Portfolio turnover rate | | | 167% | | | | 53% | | | | 33% | | | | 62% | | | | 19% | |
| | | | | |
| | | | | | | | | | | | | | | | | | | | |
| For a share outstanding throughout each period | | Transamerica WMC Diversified Growth(s) | |
| | | Class B | |
| | | October 31, 2010 | | | October 31, 2009 | | | October 31, 2008 | | | October 31, 2007 | | | October 31, 2006 | |
Net asset value | | | | | | | | | | | | | | | | | | | | |
Beginning of year | | | $7.01 | | | | $6.42 | | | | $11.39 | | | | $9.35 | | | | $8.49 | |
Investment operations | | | | | | | | | | | | | | | | | | | | |
Net investment loss(b) | | | (0.07) | | | | (0.03) | | | | (0.08) | | �� | | (0.12) | | | | (0.12) | |
Net realized and unrealized gain (loss) on investments | | | 1.28 | | | | 0.62 | | | | (4.89) | | | | 2.16 | | | | 1.06 | |
Total from investment operations | | | 1.21 | | | | 0.59 | | | | (4.97) | | | | 2.04 | | | | 0.94 | |
Distributions | | | | | | | | | | | | | | | | | | | | |
Net realized gains on investments | | | – | | | | – | | | | – | | | | – | | | | (0.08) | |
Total distributions | | | – | | | | – | | | | – | | | | – | | | | (0.08) | |
Net asset value | | | | | | | | | | | | | | | | | | | | |
End of year | | | $8.22 | | | | $7.01 | | | | $6.42 | | | | $11.39 | | | | $9.35 | |
Total return(c) | | | 17.26% | | | | 9.19% | | | | (43.63%) | | | | 21.82% | | | | 11.06% | |
Net assets end of year (000’s) | | | $ 29,958 | | | | $ 39,699 | | | | $ 59,479 | | | | $ 191,007 | | | | $ 222,144 | |
Ratio and supplemental data | | | | | | | | | | | | | | | | | | | | |
Expenses to average net assets | | | | | | | | | | | | | | | | | | | | |
After reimbursement/fee waiver | | | 2.17% | | | | 2.17% | | | | 2.17% | | | | 2.17% | | | | 2.17% | |
Before reimbursement/fee waiver | | | 2.30% | | | | 2.50% | | | | 2.21% | | | | 2.21% | | | | 2.34% | |
Net investment loss, to average net assets(d) | | | (0.92%) | | | | (0.53%) | | | | (0.87%) | | | | (1.25%) | | | | (1.34%) | |
Portfolio turnover rate | | | 167% | | | | 53% | | | | 33% | | | | 62% | | | | 19% | |
166
| | | | | | | | | | | | | | | | | | | | | | | | |
| For a share outstanding throughout each period | | Transamerica WMC Diversified Growth(s) | |
| | | Class C | | | Class I | |
| | | October 31,
2010 | | | October 31,
2009 | | | October 31,
2008 | | | October 31,
2007 | | | October 31,
2006 | | | October 31,
2010 (e) | |
Net asset value | | | | | | | | | | | | | | | | | | | | | | | | |
Beginning of period/year | | | $7.04 | | | | $6.44 | | | | $11.42 | | | | $9.37 | | | | $8.50 | | | | $8.12 | |
Investment operations | | | | | | | | | | | | | | | | | | | | | | | | |
Net investment loss(b) | | | (0.07) | | | | (0.03) | | | | (0.07) | | | | (0.11) | | | | (0.12) | | | | – | (k) |
Net realized and unrealized gain (loss) on investments | | | 1.29 | | | | 0.63 | | | | (4.91) | | | | 2.16 | | | | 1.07 | | | | 1.06 | |
Total from investment operations | | | 1.22 | | | | 0.60 | | | | (4.98) | | | | 2.05 | | | | 0.95 | | | | 1.06 | |
Distributions | | | | | | | | | | | | | | | | | | | | | | | | |
Net investment income | | | – | | | | – | | | | – | | | | – | | | | – | | | | (0.04) | |
Net realized gains on investments | | | – | | | | – | | | | – | | | | – | | | | (0.08) | | | | – | |
Total distributions | | | – | | | | – | | | | – | | | | – | | | | (0.08) | | | | (0.04) | |
Net asset value | | | | | | | | | | | | | | | | | | | | | | | | |
End of year | | | $8.26 | | | | $7.04 | | | | $6.44 | | | | $11.42 | | | | $9.37 | | | | $9.14 | |
Total return(c) | | | 17.33% | | | | 9.32% | | | | (43.61%) | | | | 21.88% | | | | 11.16% | | | | 13.14% | (f) |
Net assets end of year (000’s) | | $ | 36,135 | | | $ | 37,225 | | | $ | 46,676 | | | $ | 101,226 | | | $ | 97,047 | | | $ | 2,903 | |
Ratio and supplemental data | | | | | | | | | | | | | | | | | | | | | | | | |
Expenses to average net assets | | | | | | | | | | | | | | | | | | | | | | | | |
After reimbursement/fee waiver | | | 2.17% | | | | 2.17% | | | | 2.04% | | | | 2.07% | | | | 2.10% | | | | 1.01% | (g) |
Before reimbursement/fee waiver | | | 2.22% | | | | 2.32% | | | | 2.04% | | | | 2.07% | | | | 2.10% | | | | 1.01% | (g) |
Net investment loss, to average net assets(d) | | | (0.93%) | | | | (0.56%) | | | | (0.72%) | | | | (1.15%) | | | | (1.27%) | | | | (0.02%) | (g) |
Portfolio turnover rate | | | 167% | | | | 53% | | | | 33% | | | | 62% | | | | 19% | | | | 167% | (f) |
| | | | | | | | | | | | | | | | | | | | | | | | |
| For a share outstanding throughout each period | | | Transamerica WMC Diversified Growth(s) | | |
| | | Class T | | |
| | | October 31,
2010 | | | October 31,
2009 | | | October 31,
2008 | | | October 31,
2007 | | | October 31,
2006 (t) | | |
Net asset value | | | | | | | | | | | | | | | | | | | | | |
Beginning of year | | | $21.14 | | | | $19.14 | | | | $33.53 | | | | $27.18 | | | | $27.10 | | |
Investment operations | | | | | | | | | | | | | | | | | | | | | |
Net investment income(b) | | | 0.06 | | | | 0.10 | | | | 0.12 | | | | – | | | | – | (k) | |
Net realized and unrealized gain (loss) on investments | | | 3.92 | | | | 1.90 | | | | (14.51) | | | | 6.35 | | | | 0.08 | | |
Total from investment operations | | | 3.98 | | | | 2.00 | | | | (14.39) | | | | 6.35 | | | | 0.08 | | |
Distributions | | | | | | | | | | | | | | | | | | | | | |
Net investment income | | | – | | | | – | (k) | | | – | | | | – | | | | – | | |
Total distributions | | | – | | | | – | (k) | | | – | | | | – | | | | – | | |
Net asset value | | | | | | | | | | | | | | | | | | | | | |
End of year | | | $25.12 | | | | $21.14 | | | | $19.14 | | | | $33.53 | | | | $27.18 | | |
Total return(c) | | | 18.83% | | | | 10.46% | | | | (42.92%) | | | | 23.36% | | | | 0.30% | (f) | |
Net assets end of year (000’s) | | $ | 93,290 | | | $ | 87,469 | | | $ | 90,881 | | | $ | 183,495 | | | $ | 195,420 | | |
Ratio and supplemental data | | | | | | | | | | | | | | | | | | | | | |
Expenses to average net assets | | | | | | | | | | | | | | | | | | | | | |
After reimbursement/fee waiver | | | 0.96% | | | | 1.03% | | | | 0.89% | | | | 0.91% | | | | 0.84% | (g) | |
Before reimbursement/fee waiver | | | 0.96% | | | | 1.03% | | | | 0.89% | | | | 0.91% | | | | 0.84% | (g) | |
Net investment income (loss), to average net assets(d) | | | 0.28% | | | | 0.54% | | | | 0.42% | | | | 0.01% | | | | (0.21%) | (g) | |
Portfolio turnover rate | | | 167% | | | | 53% | | | | 33% | | | | 62% | | | | 19% | (f) | |
| (a) | Formerly, Transamerica High Yield Bond. |
| (b) | Calculated based on average number of shares outstanding. |
| (c) | Total return has been calculated for the applicable period without deduction of a sales load, if any, on an initial purchase. |
| (d) | Includes Redemption Fees, if any. The impact of Redemption Fees is less than 0.01% for Class A, Class B, and Class C, respectively. |
| (e) | Commenced operations November 30, 2009. |
167
| (h) | Recognition of net investment income by the portfolio is affected by the timing of the declaration of dividends by the underlying affiliated investment companies in which the portfolio invests. |
| (i) | Does not include expenses of the investment companies in which the portfolio invests. |
| (j) | Includes extraordinary expenses. The impact of the expenses were 0.01% and 0.02% for 2010 and 2009, respectively. |
| (k) | Rounds to less than $(0.01) or $0.01. |
| (l) | Commenced operations November 13, 2009. |
| (m) | Formerly, Transamerica Legg Mason Partners All Cap. |
| (n) | Includes redemption fees, if any. The impact of redemption fees is less than 0.01% for Class A, Class B, Class C, and Class R, respectively. The Portfolio, effective March 1, 2009 no longer charges redemption fees. |
| (o) | Does not include the portfolio activity of the underlying affiliated funds. |
| (p) | Transamerica Asset Management, Inc. or any of its affiliates waive fees or reimburse expenses in order to avoid a negative yield. |
| (q) | Rounds to less than (0.01%) or 0.01%. |
| (r) | Commenced operations November 1, 2007. |
| (s) | Formerly, Transamerica Equity. |
| (t) | Commenced operations October 27, 2006. |
| (u) | Includes extraordinary expenses. The impact of the expenses was 0.01%. |
| (v) | Commenced operations on June 15, 2006. |
| (w) | Commenced operations on December 28, 2006. |
| (x) | Includes recaptured expenses by the investment adviser. |
| (y) | Amount rounds to less than 1%. |
| (z) | Commenced operations on March 1, 2006. |
168
Financial highlights for Transamerica TS&W International Equity through October 31, 2010 are based on the historical financial highlights of TS&W International Equity Portfolio, a separate series of The Advisors’ Inner Circle Fund (the “predecessor fund”). For the periods shown below, the information is that of the predecessor fund. The information has been derived from financial statements, audited by PricewaterhouseCoopers LLP, an Independent Registered Certified Public Accounting firm, whose report, along with the predecessor fund’s financial statements, is included in the predecessor fund’s Annual Report for the fiscal year ended October 31, 2010, which is available to you upon request.
| | | | | | | | | | | | | | | | | | | | |
| For a share outstanding throughout each period | | | | | | | TS&W International Equity Portfolio | |
| | |
| | | | | |
| | | October 31,
2010 | | | October 31,
2009 | | | October 31,
2008 | | | October 31,
2007 | | | October 31,
2006 | |
Net Asset Value, | | | | | | | | | | | | | | | | | | | | |
Beginning of Year | | $ | 12.55 | | | $ | 9.94 | | | $ | 21.16 | | | $ | 19.08 | | | $ | 14.83 | |
Income from Operations: | | | | | | | | | | | | | | | | | | | | |
Net Investment Income(1) | | | 0.22 | | | | 0.19 | | | | 0.26 | | | | 0.28 | | | | 0.16 | |
Net Realized and Unrealized Gain (Loss) | | | 1.36 | | | | 2.61 | | | | (8.99 | ) | | | 4.37 | | | | 4.17 | |
Total from Operations | | | 1.58 | | | | 2.80 | | | | (8.73 | ) | | | 4.65 | | | | 4.33 | |
Redemption Fees | | | — | † | | | — | | | | — | † | | | — | † | | | — | |
Dividends and Distributions: | | | | | | | | | | | | | | | | | | | | |
Net Investment Income | | | (0.16 | ) | | | (0.19 | ) | | | (0.20 | ) | | | (0.09 | ) | | | (0.08 | ) |
Net Realized Gain | | | — | | | | — | | | | (2.29 | ) | | | (2.48 | ) | | | — | |
Total Dividends and Distributions | | | (0.16 | ) | | | (0.19 | ) | | | (2.49 | ) | | | (2.57 | ) | | | (0.08 | ) |
Net Asset Value, End of Year | | $ | 13.97 | | | $ | 12.55 | | | $ | 9.94 | | | $ | 21.16 | | | $ | 19.08 | |
Total Return†† | | | 12.73 | % | | | 28.58 | % | | | (46.36 | )% | | | 26.86 | % | | | 29.33 | % |
Ratios and Supplemental Data: | | | | | | | | | | | | | | | | | | | | |
Net Assets, End of Year (Thousands) | | $ | 75,271 | | | $ | 64,600 | | | $ | 51,529 | | | $ | 91,838 | | | $ | 70,503 | |
Ratio of Expenses to Average Net Assets(2) | | | 1.43 | % | | | 1.67 | % | | | 1.53 | % | | | 1.55 | % | | | 1.61 | % |
Ratio of Net Investment Income to Average Net Assets | | | 1.76 | % | | | 1.87 | % | | | 1.67 | % | | | 1.47 | % | | | 0.96 | % |
Portfolio Turnover Rate | | | 43 | % | | | 42 | % | | | 40 | % | | | 41 | % | | | 74 | % |
| † | Amount was less than $0.01 per share. |
| †† | Returns shown do not reflect the deduction of taxes that a shareholder would pay on portfolio distributions or the redemption of portfolio shares. |
| (1) | Per share calculations were performed using average shares for the year. |
| (2) | The Ratio of Expenses to Average Net Assets excludes the effect of fees paid indirectly. If these expense offsets were included, the ratio would have been 1.43%, 1.67%, 1.52%, 1.55% and 1.61% for the fiscal years ended 2010, 2009, 2008, 2007 and 2006, respectively. |
Amounts designated as “—” are either $0 or round to $0.
169
Notice of Privacy Policy
Protecting your privacy is very important to us. We want you to understand what information we collect and how we use it. We collect and use “nonpublic personal information” in connection with providing our customers with a broad range of financial products and services as effectively and conveniently as possible. We treat nonpublic personal information in accordance with our Privacy Policy.
What Information We Collect and From Whom We Collect It
We may collect nonpublic personal information about you from the following sources:
| • | | Information we receive from you on applications or other forms, such as your name, address, and account number; |
| • | | Information about your transactions with us, our affiliates, or others, such as your account balance and purchase/redemption history; and |
| • | | Information we receive from non-affiliated third parties, including consumer reporting agencies. |
What Information We Disclose and To Whom We Disclose It
We do not disclose any nonpublic personal information about current or former customers to anyone without their express consent, except as permitted by law. We may disclose the nonpublic personal information we collect, as described above, to persons or companies that perform services on our behalf and to other financial institutions with which we have joint marketing agreements. We will require these companies to protect the confidentiality of your nonpublic personal information and to use it only to perform the services for which we have hired them.
Our Security Procedures
We restrict access to your nonpublic personal information and only allow disclosures to persons and companies as permitted by law to assist in providing products or services to you. We maintain physical, electronic, and procedural safeguards to protect your nonpublic personal information and to safeguard the disposal of certain consumer information.
If you have any questions about our Privacy Policy, please call 1-888-233-4339 on any business day between 8 a.m. and 7 p.m. Eastern Time.
Note: This Privacy Policy applies only to customers that have a direct relationship with us or our affiliates. If you own shares of our funds in the name of a third party such as a bank or broker-dealer, its privacy policy may apply to you instead of ours.
170
|
Both the investment returns and principal value of mutual funds will fluctuate over time so that shares, when redeemed, may be worth more or less than their original cost. Transamerica Funds P.O. Box 9012 Clearwater, FL 33758-9012 Customer Service: 1-888-233-4339 Shareholder inquiries and transaction requests should be mailed to: Transamerica Fund Services, Inc. P.O. Box 219945 Kansas City, MO 64121-9945 ADDITIONAL INFORMATION about these funds is contained in the Statement of Additional Information, dated March 1, 2011, as supplemented from time to time, and in the annual and semi-annual reports to shareholders. The Statement of Additional Information is incorporated by reference into this prospectus. Other information about these funds has been filed with and is available from the U.S. Securities and Exchange Commission (“SEC”). Information about the funds (including the Statement of Additional Information) can be reviewed and copied at the SEC’s Public Reference Room in Washington, DC. Information on the operation of the public reference room may be obtained by calling the SEC at 1-202-551-8090. Copies of this information may be obtained upon payment of a duplication fee, by electronic request at the following e-mail address, publicinfo@sec.gov, or by writing to the Public Reference Section of the SEC, Washington, DC 20549-1520. Reports and other information about the funds are also available on the SEC’s Internet site at http://www.sec.gov. To obtain a copy of the Statement of Additional Information or the annual and semi-annual reports, without charge, or to request other information or make other inquiries about these funds, call or write to Transamerica Funds at the phone number or address above or visit Transamerica Funds’ website at www.transamericafunds.com. In the Transamerica Funds’ annual report, you will find a discussion of the market conditions and investment strategies that significantly affected the funds’ performance during the last fiscal year. The Investment Company Act File Number for Transamerica Funds is 811-04556. |
| | |
www.transamericafunds.com Sales Support: 1-800-851-7555 Distributor: Transamerica Capital, Inc. | |  |